Nassau County, NY Map & Demographics
Nassau County Map
Nassau County Overview
$60,456
PER CAPITA INCOME
$159,334
AVG FAMILY INCOME
$137,709
AVG HOUSEHOLD INCOME
30.9%
WAGE / INCOME GAP [ % ]
69.1¢/ $1
WAGE / INCOME GAP [ $ ]
$11,315
FAMILY INCOME DEFICIT
0.45
INEQUALITY / GINI INDEX
1,389,160
TOTAL POPULATION
683,660
MALE POPULATION
705,500
FEMALE POPULATION
96.90
MALES / 100 FEMALES
103.19
FEMALES / 100 MALES
41.7
MEDIAN AGE
3.5
AVG FAMILY SIZE
3.0
AVG HOUSEHOLD SIZE
739,959
LABOR FORCE [ PEOPLE ]
65.6%
PERCENT IN LABOR FORCE
4.6%
UNEMPLOYMENT RATE
Income in Nassau County
Income Overview in Nassau County
Per Capita Income in Nassau County is $60,456, while median incomes of families and households are $159,334 and $137,709 respectively.
| Characteristic | Number | Measure |
| Per Capita Income | 1,389,160 | $60,456 |
| Median Family Income | 350,456 | $159,334 |
| Mean Family Income | 350,456 | $204,055 |
| Median Household Income | 454,771 | $137,709 |
| Mean Household Income | 454,771 | $180,825 |
| Income Deficit | 350,456 | $11,315 |
| Wage / Income Gap (%) | 1,389,160 | 30.93% |
| Wage / Income Gap ($) | 1,389,160 | 69.07¢ per $1 |
| Gini / Inequality Index | 1,389,160 | 0.45 |
Earnings by Sex in Nassau County
Average Earnings in Nassau County are $59,763, $72,128 for men and $49,817 for women, a difference of 30.9%.
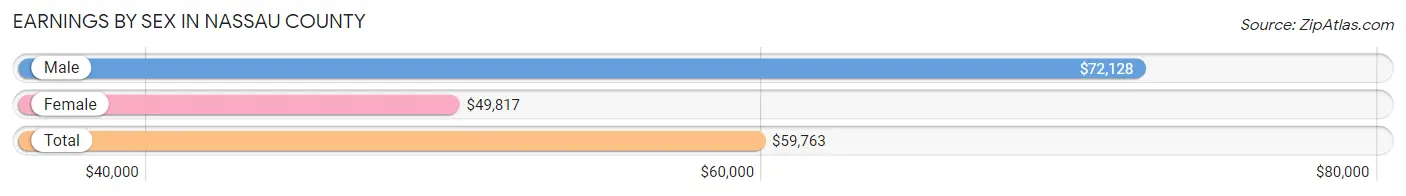
| Sex | Number | Average Earnings |
| Male | 401,553 (52.6%) | $72,128 |
| Female | 361,934 (47.4%) | $49,817 |
| Total | 763,487 (100.0%) | $59,763 |
Earnings by Sex by Income Bracket in Nassau County
The most common earnings brackets in Nassau County are $100,000+ for men (145,294 | 36.2%) and $100,000+ for women (84,035 | 23.2%).
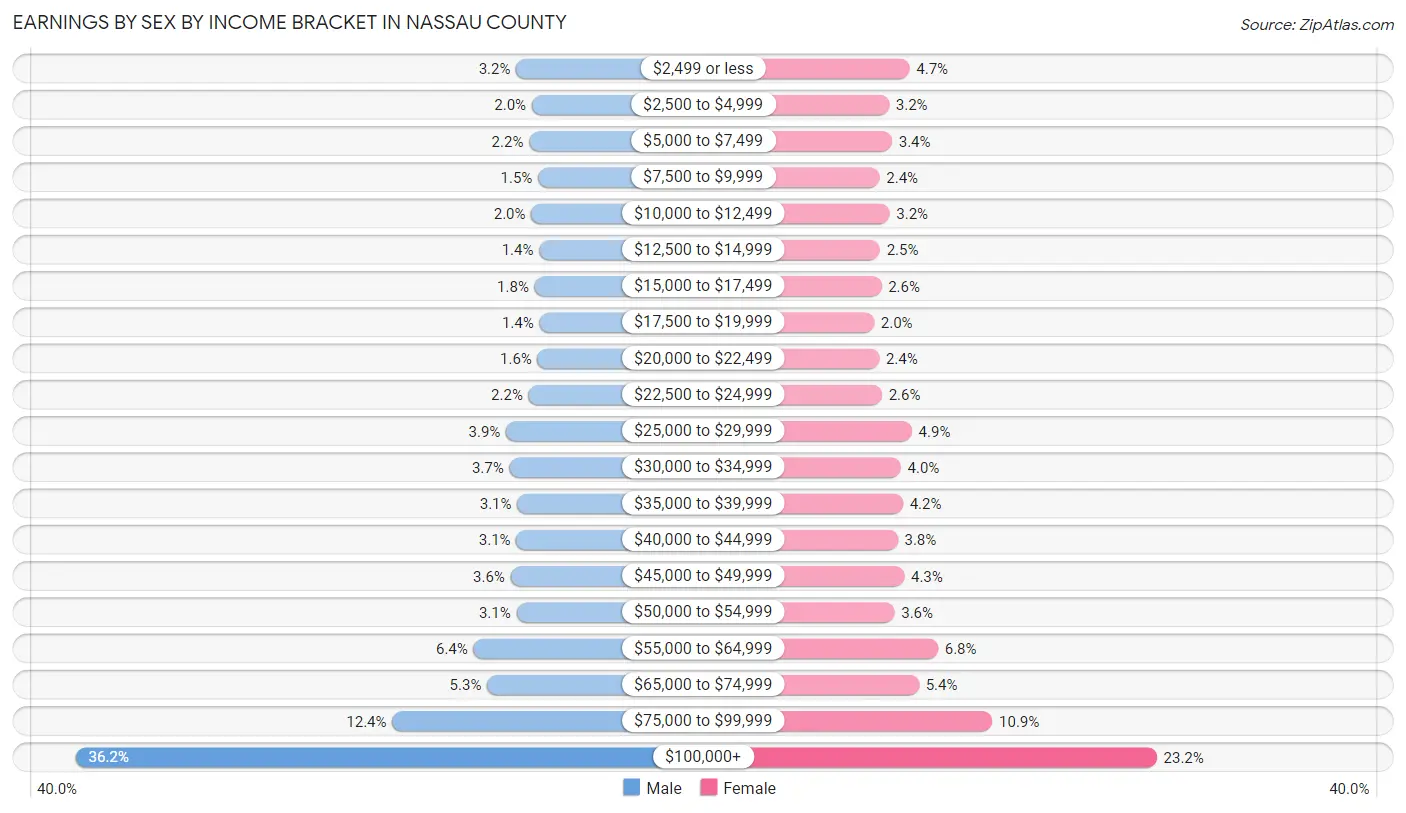
| Income | Male | Female |
| $2,499 or less | 12,657 (3.2%) | 16,958 (4.7%) |
| $2,500 to $4,999 | 7,965 (2.0%) | 11,384 (3.2%) |
| $5,000 to $7,499 | 8,763 (2.2%) | 12,195 (3.4%) |
| $7,500 to $9,999 | 6,051 (1.5%) | 8,845 (2.4%) |
| $10,000 to $12,499 | 8,120 (2.0%) | 11,562 (3.2%) |
| $12,500 to $14,999 | 5,736 (1.4%) | 8,932 (2.5%) |
| $15,000 to $17,499 | 7,100 (1.8%) | 9,351 (2.6%) |
| $17,500 to $19,999 | 5,681 (1.4%) | 7,349 (2.0%) |
| $20,000 to $22,499 | 6,226 (1.5%) | 8,733 (2.4%) |
| $22,500 to $24,999 | 8,919 (2.2%) | 9,471 (2.6%) |
| $25,000 to $29,999 | 15,703 (3.9%) | 17,573 (4.9%) |
| $30,000 to $34,999 | 14,687 (3.7%) | 14,587 (4.0%) |
| $35,000 to $39,999 | 12,325 (3.1%) | 15,149 (4.2%) |
| $40,000 to $44,999 | 12,622 (3.1%) | 13,744 (3.8%) |
| $45,000 to $49,999 | 14,326 (3.6%) | 15,543 (4.3%) |
| $50,000 to $54,999 | 12,553 (3.1%) | 12,901 (3.6%) |
| $55,000 to $64,999 | 25,483 (6.4%) | 24,684 (6.8%) |
| $65,000 to $74,999 | 21,402 (5.3%) | 19,517 (5.4%) |
| $75,000 to $99,999 | 49,940 (12.4%) | 39,421 (10.9%) |
| $100,000+ | 145,294 (36.2%) | 84,035 (23.2%) |
| Total | 401,553 (100.0%) | 361,934 (100.0%) |
Earnings by Sex by Educational Attainment in Nassau County
Average earnings in Nassau County are $82,620 for men and $57,843 for women, a difference of 30.0%. Men with an educational attainment of graduate degree enjoy the highest average annual earnings of $121,313, while those with less than high school education earn the least with $37,933. Women with an educational attainment of graduate degree earn the most with the average annual earnings of $94,872, while those with less than high school education have the smallest earnings of $26,038.
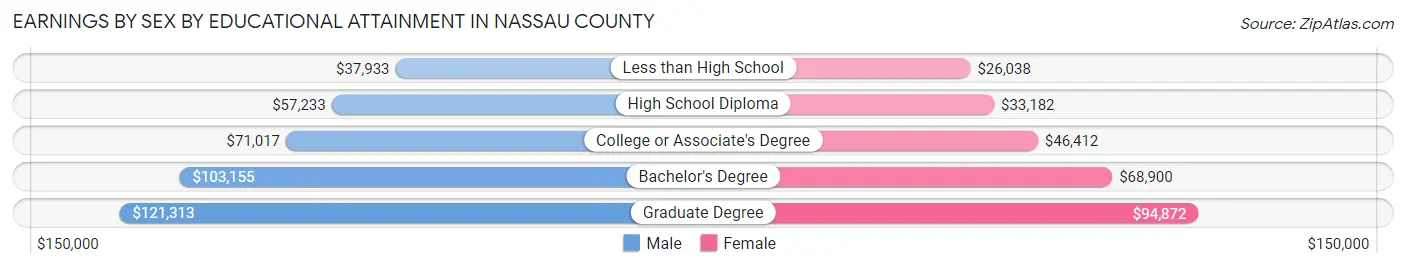
| Educational Attainment | Male Income | Female Income |
| Less than High School | $37,933 | $26,038 |
| High School Diploma | $57,233 | $33,182 |
| College or Associate's Degree | $71,017 | $46,412 |
| Bachelor's Degree | $103,155 | $68,900 |
| Graduate Degree | $121,313 | $94,872 |
| Total | $82,620 | $57,843 |
Family Income in Nassau County
Family Income Brackets in Nassau County
According to the Nassau County family income data, there are 130,019 families falling into the $200,000+ income range, which is the most common income bracket and makes up 37.1% of all families. Conversely, the $10,000 to $14,999 income bracket is the least frequent group with only 2,453 families (0.7%) belonging to this category.
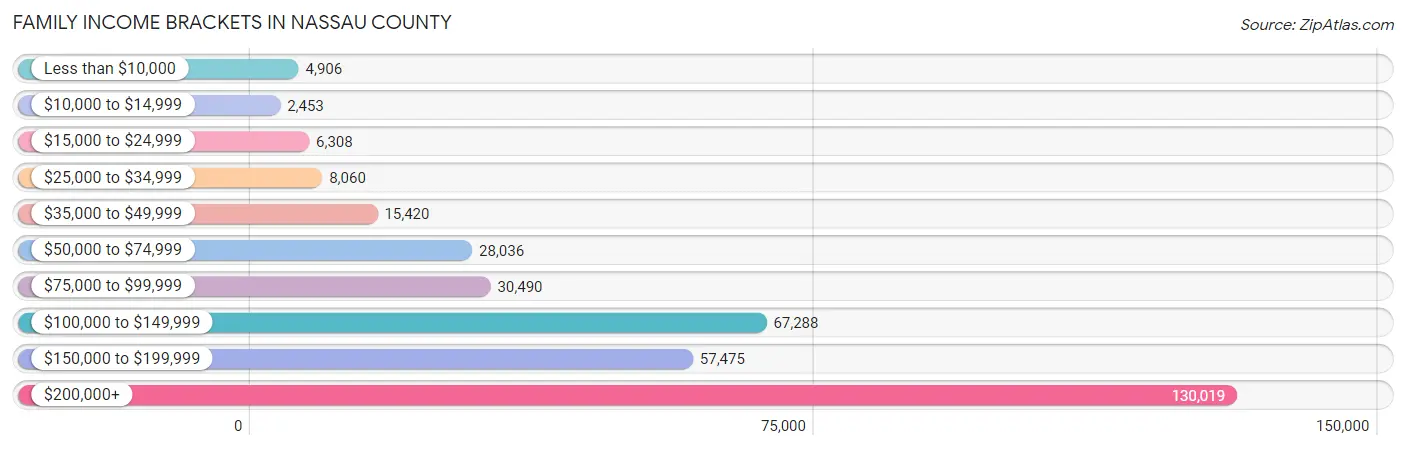
| Income Bracket | # Families | % Families |
| Less than $10,000 | 4,906 | 1.4% |
| $10,000 to $14,999 | 2,453 | 0.7% |
| $15,000 to $24,999 | 6,308 | 1.8% |
| $25,000 to $34,999 | 8,060 | 2.3% |
| $35,000 to $49,999 | 15,420 | 4.4% |
| $50,000 to $74,999 | 28,036 | 8.0% |
| $75,000 to $99,999 | 30,490 | 8.7% |
| $100,000 to $149,999 | 67,288 | 19.2% |
| $150,000 to $199,999 | 57,475 | 16.4% |
| $200,000+ | 130,019 | 37.1% |
Family Income by Famaliy Size in Nassau County
5-person families (37,766 | 10.8%) account for the highest median family income in Nassau County with $192,841 per family, while 2-person families (121,521 | 34.7%) have the highest median income of $62,570 per family member.
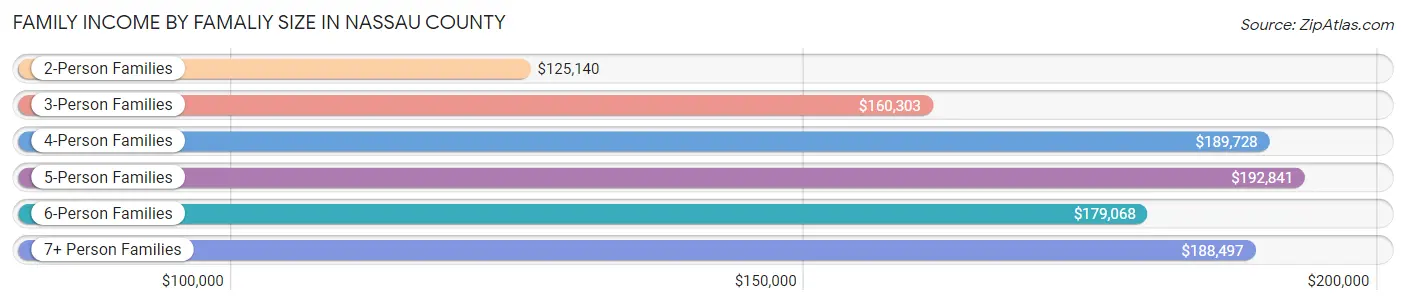
| Income Bracket | # Families | Median Income |
| 2-Person Families | 121,521 (34.7%) | $125,140 |
| 3-Person Families | 80,532 (23.0%) | $160,303 |
| 4-Person Families | 86,401 (24.6%) | $189,728 |
| 5-Person Families | 37,766 (10.8%) | $192,841 |
| 6-Person Families | 14,398 (4.1%) | $179,068 |
| 7+ Person Families | 9,838 (2.8%) | $188,497 |
| Total | 350,456 (100.0%) | $159,334 |
Family Income by Number of Earners in Nassau County
The median family income in Nassau County is $159,334, with families comprising 3+ earners (72,296) having the highest median family income of $216,004, while families with no earners (37,629) have the lowest median family income of $74,376, accounting for 20.6% and 10.7% of families, respectively.
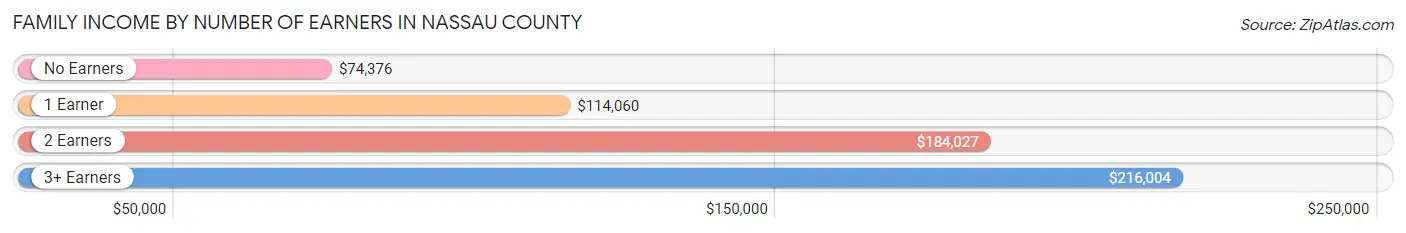
| Number of Earners | # Families | Median Income |
| No Earners | 37,629 (10.7%) | $74,376 |
| 1 Earner | 89,382 (25.5%) | $114,060 |
| 2 Earners | 151,149 (43.1%) | $184,027 |
| 3+ Earners | 72,296 (20.6%) | $216,004 |
| Total | 350,456 (100.0%) | $159,334 |
Household Income in Nassau County
Household Income Brackets in Nassau County
With 142,798 households falling in the category, the $200,000+ income range is the most frequent in Nassau County, accounting for 31.4% of all households. In contrast, only 6,822 households (1.5%) fall into the $10,000 to $14,999 income bracket, making it the least populous group.
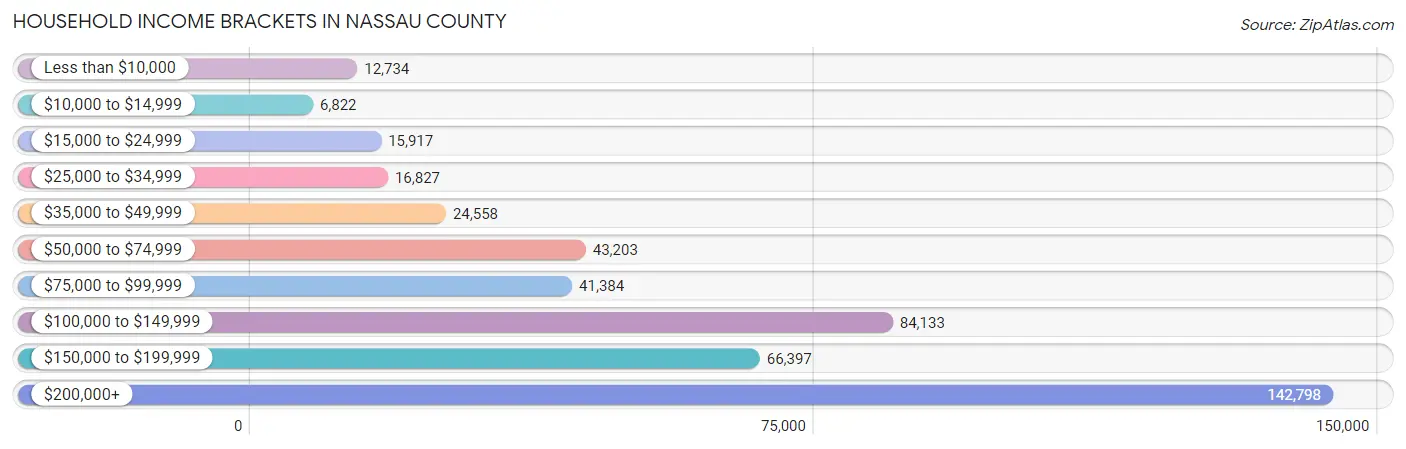
| Income Bracket | # Households | % Households |
| Less than $10,000 | 12,734 | 2.8% |
| $10,000 to $14,999 | 6,822 | 1.5% |
| $15,000 to $24,999 | 15,917 | 3.5% |
| $25,000 to $34,999 | 16,827 | 3.7% |
| $35,000 to $49,999 | 24,558 | 5.4% |
| $50,000 to $74,999 | 43,203 | 9.5% |
| $75,000 to $99,999 | 41,384 | 9.1% |
| $100,000 to $149,999 | 84,133 | 18.5% |
| $150,000 to $199,999 | 66,397 | 14.6% |
| $200,000+ | 142,798 | 31.4% |
Household Income by Householder Age in Nassau County
The median household income in Nassau County is $137,709, with the highest median household income of $164,214 found in the 45 to 64 years age bracket for the primary householder. A total of 196,076 households (43.1%) fall into this category. Meanwhile, the 15 to 24 years age bracket for the primary householder has the lowest median household income of $61,990, with 3,643 households (0.8%) in this group.
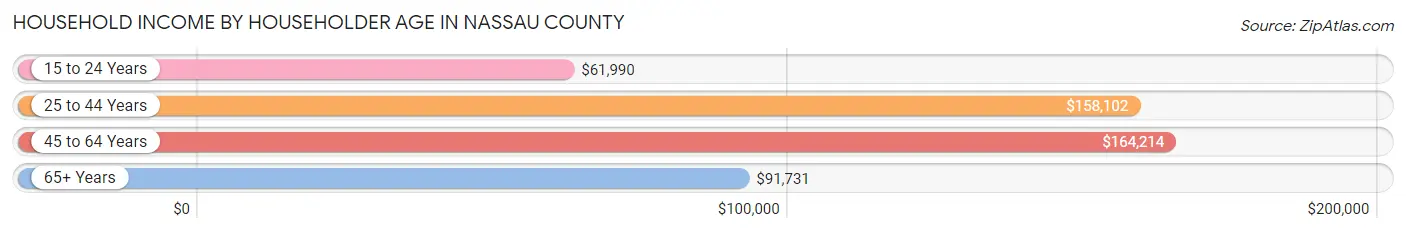
| Income Bracket | # Households | Median Income |
| 15 to 24 Years | 3,643 (0.8%) | $61,990 |
| 25 to 44 Years | 112,331 (24.7%) | $158,102 |
| 45 to 64 Years | 196,076 (43.1%) | $164,214 |
| 65+ Years | 142,721 (31.4%) | $91,731 |
| Total | 454,771 (100.0%) | $137,709 |
Poverty in Nassau County
Income Below Poverty by Sex and Age in Nassau County
With 4.7% poverty level for males and 6.0% for females among the residents of Nassau County, 18 to 24 year old males and 75 year old and over females are the most vulnerable to poverty, with 4,253 males (7.2%) and 5,391 females (8.6%) in their respective age groups living below the poverty level.
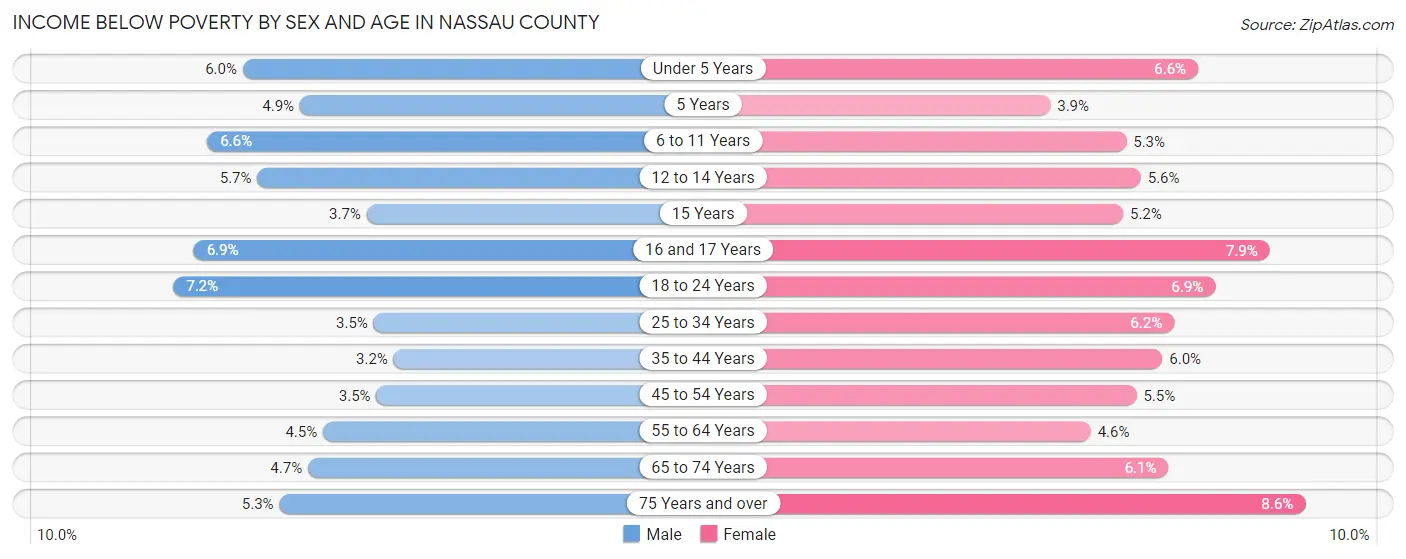
| Age Bracket | Male | Female |
| Under 5 Years | 2,186 (5.9%) | 2,287 (6.6%) |
| 5 Years | 386 (4.9%) | 309 (3.9%) |
| 6 to 11 Years | 3,359 (6.6%) | 2,535 (5.3%) |
| 12 to 14 Years | 1,539 (5.7%) | 1,396 (5.6%) |
| 15 Years | 344 (3.6%) | 468 (5.2%) |
| 16 and 17 Years | 1,277 (6.9%) | 1,400 (7.9%) |
| 18 to 24 Years | 4,253 (7.2%) | 3,860 (6.9%) |
| 25 to 34 Years | 2,892 (3.5%) | 4,919 (6.2%) |
| 35 to 44 Years | 2,690 (3.2%) | 5,064 (5.9%) |
| 45 to 54 Years | 3,198 (3.5%) | 5,146 (5.5%) |
| 55 to 64 Years | 4,325 (4.5%) | 4,706 (4.6%) |
| 65 to 74 Years | 3,155 (4.7%) | 4,480 (6.1%) |
| 75 Years and over | 2,200 (5.3%) | 5,391 (8.6%) |
| Total | 31,804 (4.7%) | 41,961 (6.0%) |
Income Above Poverty by Sex and Age in Nassau County
According to the poverty statistics in Nassau County, males aged 35 to 44 years and females aged 5 years are the age groups that are most secure financially, with 96.9% of males and 96.1% of females in these age groups living above the poverty line.
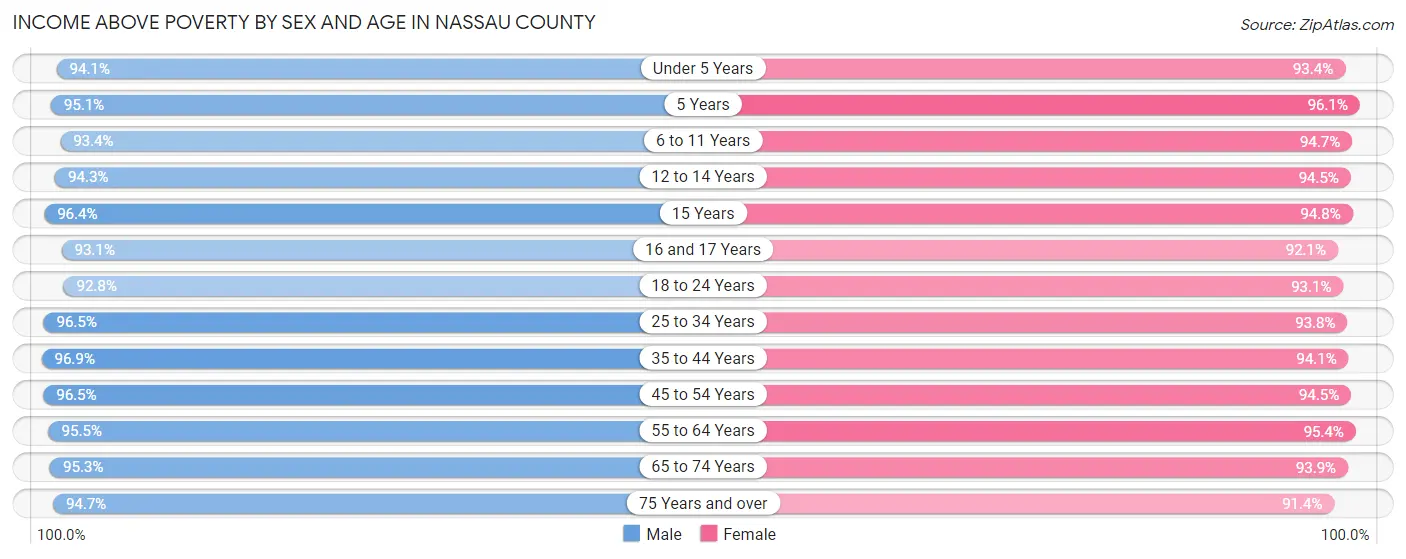
| Age Bracket | Male | Female |
| Under 5 Years | 34,526 (94.1%) | 32,297 (93.4%) |
| 5 Years | 7,500 (95.1%) | 7,678 (96.1%) |
| 6 to 11 Years | 47,432 (93.4%) | 45,510 (94.7%) |
| 12 to 14 Years | 25,555 (94.3%) | 23,743 (94.5%) |
| 15 Years | 9,076 (96.4%) | 8,504 (94.8%) |
| 16 and 17 Years | 17,350 (93.1%) | 16,239 (92.1%) |
| 18 to 24 Years | 54,518 (92.8%) | 51,811 (93.1%) |
| 25 to 34 Years | 79,295 (96.5%) | 74,852 (93.8%) |
| 35 to 44 Years | 82,721 (96.9%) | 80,050 (94.1%) |
| 45 to 54 Years | 89,095 (96.5%) | 88,918 (94.5%) |
| 55 to 64 Years | 92,551 (95.5%) | 97,107 (95.4%) |
| 65 to 74 Years | 63,474 (95.3%) | 69,437 (93.9%) |
| 75 Years and over | 39,555 (94.7%) | 57,316 (91.4%) |
| Total | 642,648 (95.3%) | 653,462 (94.0%) |
Income Below Poverty Among Married-Couple Families in Nassau County
The poverty statistics for married-couple families in Nassau County show that 2.1% or 5,851 of the total 276,807 families live below the poverty line. Families with 5 or more children have the highest poverty rate of 3.5%, comprising of 50 families. On the other hand, families with 1 or 2 children have the lowest poverty rate of 1.9%, which includes 1,940 families.
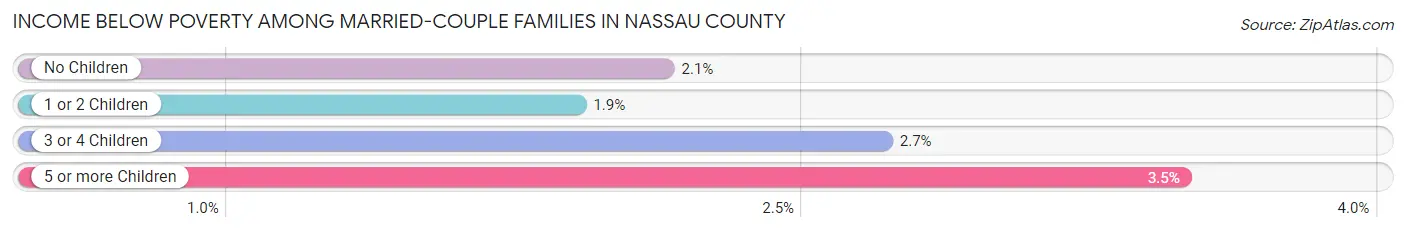
| Children | Above Poverty | Below Poverty |
| No Children | 147,725 (97.9%) | 3,236 (2.1%) |
| 1 or 2 Children | 99,441 (98.1%) | 1,940 (1.9%) |
| 3 or 4 Children | 22,408 (97.3%) | 625 (2.7%) |
| 5 or more Children | 1,382 (96.5%) | 50 (3.5%) |
| Total | 270,956 (97.9%) | 5,851 (2.1%) |
Income Below Poverty Among Single-Parent Households in Nassau County
According to the poverty data in Nassau County, 6.2% or 1,356 single-father households and 10.5% or 5,435 single-mother households are living below the poverty line. Among single-father households, those with 3 or 4 children have the highest poverty rate, with 397 households (20.7%) experiencing poverty. Likewise, among single-mother households, those with 5 or more children have the highest poverty rate, with 172 households (39.5%) falling below the poverty line.
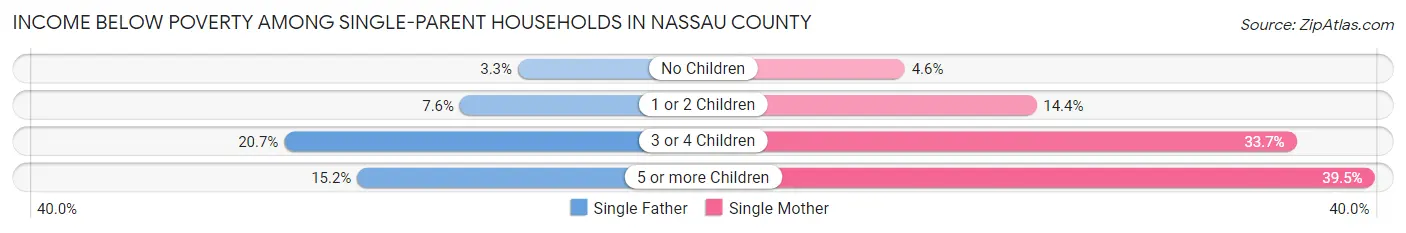
| Children | Single Father | Single Mother |
| No Children | 417 (3.3%) | 1,282 (4.5%) |
| 1 or 2 Children | 514 (7.6%) | 2,873 (14.3%) |
| 3 or 4 Children | 397 (20.7%) | 1,108 (33.7%) |
| 5 or more Children | 28 (15.2%) | 172 (39.5%) |
| Total | 1,356 (6.2%) | 5,435 (10.5%) |
Income Below Poverty Among Married-Couple vs Single-Parent Households in Nassau County
The poverty data for Nassau County shows that 5,851 of the married-couple family households (2.1%) and 6,791 of the single-parent households (9.2%) are living below the poverty level. Within the married-couple family households, those with 5 or more children have the highest poverty rate, with 50 households (3.5%) falling below the poverty line. Among the single-parent households, those with 5 or more children have the highest poverty rate, with 200 household (32.3%) living below poverty.
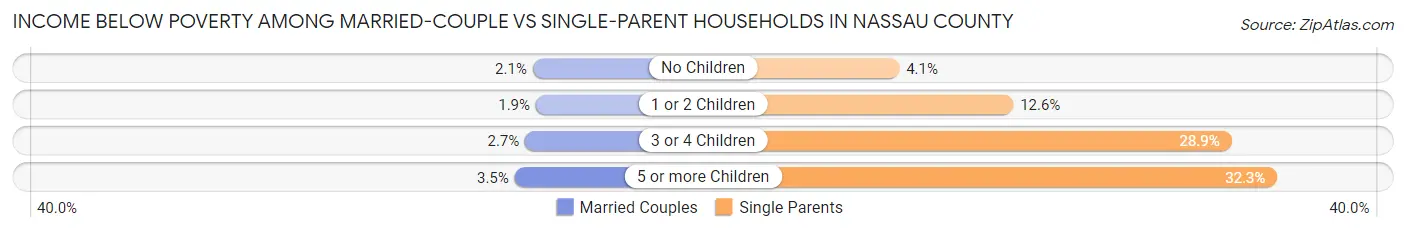
| Children | Married-Couple Families | Single-Parent Households |
| No Children | 3,236 (2.1%) | 1,699 (4.1%) |
| 1 or 2 Children | 1,940 (1.9%) | 3,387 (12.6%) |
| 3 or 4 Children | 625 (2.7%) | 1,505 (28.9%) |
| 5 or more Children | 50 (3.5%) | 200 (32.3%) |
| Total | 5,851 (2.1%) | 6,791 (9.2%) |
Race in Nassau County
The most populous races in Nassau County are White / Caucasian (861,432 | 62.0%), Hispanic or Latino (243,684 | 17.5%), and Black / African American (160,936 | 11.6%).
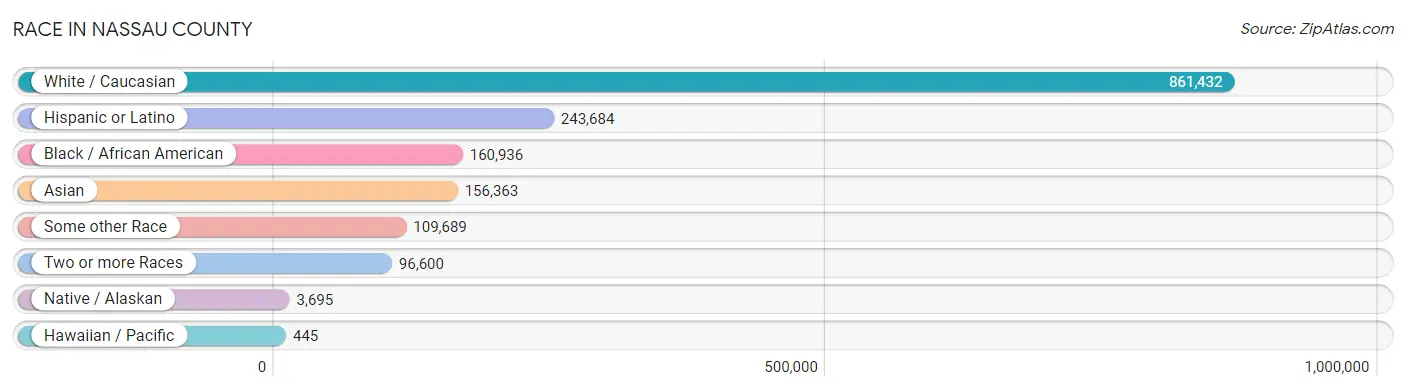
| Race | # Population | % Population |
| Asian | 156,363 | 11.3% |
| Black / African American | 160,936 | 11.6% |
| Hawaiian / Pacific | 445 | 0.0% |
| Hispanic or Latino | 243,684 | 17.5% |
| Native / Alaskan | 3,695 | 0.3% |
| White / Caucasian | 861,432 | 62.0% |
| Two or more Races | 96,600 | 7.0% |
| Some other Race | 109,689 | 7.9% |
| Total | 1,389,160 | 100.0% |
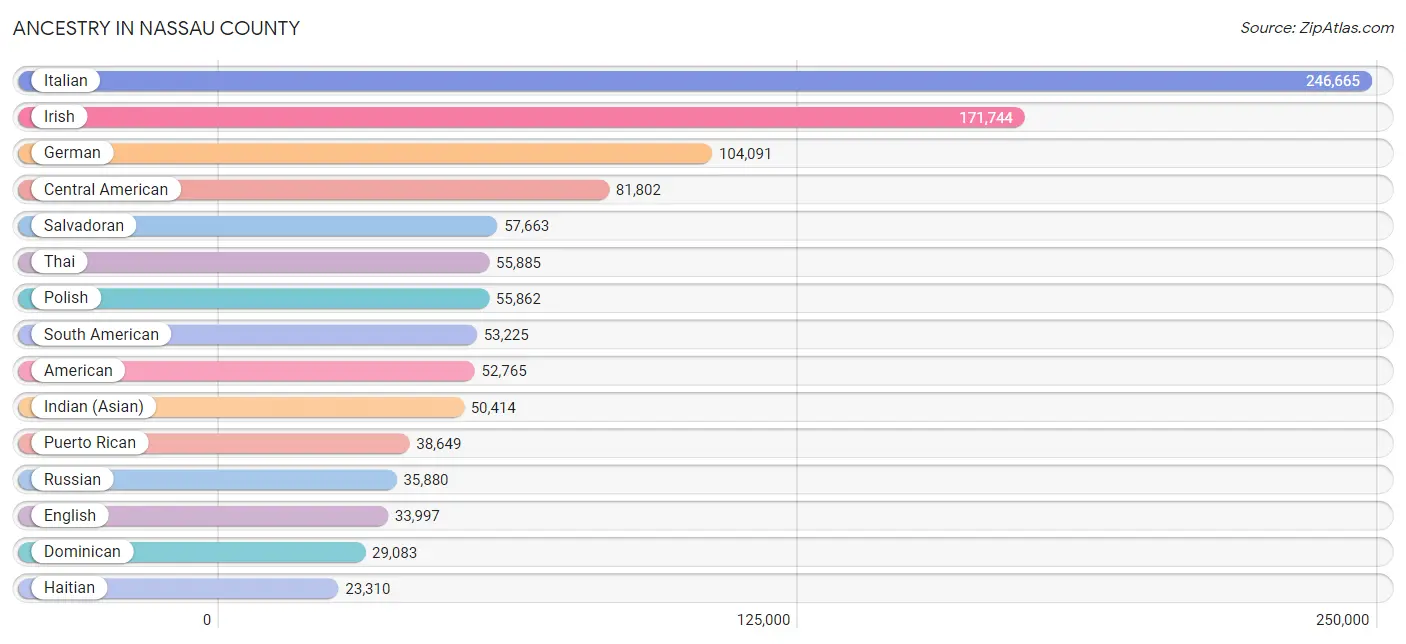
Ancestry in Nassau County
The most populous ancestries reported in Nassau County are Italian (246,665 | 17.8%), Irish (171,744 | 12.4%), German (104,091 | 7.5%), Central American (81,802 | 5.9%), and Salvadoran (57,663 | 4.2%), together accounting for 47.6% of all Nassau County residents.
| Ancestry | # Population | % Population |
| Afghan | 1,804 | 0.1% |
| African | 3,880 | 0.3% |
| Albanian | 1,846 | 0.1% |
| Alsatian | 56 | 0.0% |
| American | 52,765 | 3.8% |
| Apache | 21 | 0.0% |
| Arab | 8,170 | 0.6% |
| Argentinean | 3,595 | 0.3% |
| Armenian | 2,539 | 0.2% |
| Assyrian / Chaldean / Syriac | 48 | 0.0% |
| Australian | 401 | 0.0% |
| Austrian | 6,890 | 0.5% |
| Bahamian | 68 | 0.0% |
| Barbadian | 1,545 | 0.1% |
| Basque | 71 | 0.0% |
| Belgian | 605 | 0.0% |
| Belizean | 348 | 0.0% |
| Bermudan | 42 | 0.0% |
| Bhutanese | 3,247 | 0.2% |
| Blackfeet | 361 | 0.0% |
| Bolivian | 995 | 0.1% |
| Brazilian | 2,294 | 0.2% |
| British | 2,353 | 0.2% |
| British West Indian | 1,623 | 0.1% |
| Bulgarian | 156 | 0.0% |
| Burmese | 16,449 | 1.2% |
| Cajun | 14 | 0.0% |
| Cambodian | 36 | 0.0% |
| Canadian | 1,512 | 0.1% |
| Cape Verdean | 27 | 0.0% |
| Carpatho Rusyn | 11 | 0.0% |
| Celtic | 183 | 0.0% |
| Central American | 81,802 | 5.9% |
| Central American Indian | 2,976 | 0.2% |
| Cherokee | 835 | 0.1% |
| Chilean | 3,369 | 0.2% |
| Choctaw | 82 | 0.0% |
| Colombian | 18,751 | 1.3% |
| Comanche | 18 | 0.0% |
| Costa Rican | 1,093 | 0.1% |
| Cree | 35 | 0.0% |
| Croatian | 2,963 | 0.2% |
| Crow | 26 | 0.0% |
| Cuban | 7,577 | 0.5% |
| Cypriot | 489 | 0.0% |
| Czech | 3,502 | 0.3% |
| Czechoslovakian | 1,150 | 0.1% |
| Danish | 1,740 | 0.1% |
| Delaware | 30 | 0.0% |
| Dominican | 29,083 | 2.1% |
| Dutch | 4,205 | 0.3% |
| Dutch West Indian | 73 | 0.0% |
| Eastern European | 20,312 | 1.5% |
| Ecuadorian | 11,859 | 0.9% |
| Egyptian | 2,238 | 0.2% |
| English | 33,997 | 2.5% |
| Estonian | 82 | 0.0% |
| Ethiopian | 125 | 0.0% |
| European | 14,047 | 1.0% |
| Filipino | 1,898 | 0.1% |
| Finnish | 1,473 | 0.1% |
| French | 9,450 | 0.7% |
| French American Indian | 32 | 0.0% |
| French Canadian | 2,241 | 0.2% |
| German | 104,091 | 7.5% |
| German Russian | 5 | 0.0% |
| Ghanaian | 537 | 0.0% |
| Greek | 19,282 | 1.4% |
| Guamanian / Chamorro | 111 | 0.0% |
| Guatemalan | 8,267 | 0.6% |
| Guyanese | 10,120 | 0.7% |
| Haitian | 23,310 | 1.7% |
| Hmong | 53 | 0.0% |
| Honduran | 11,805 | 0.9% |
| Hungarian | 9,555 | 0.7% |
| Icelander | 73 | 0.0% |
| Indian (Asian) | 50,414 | 3.6% |
| Indonesian | 233 | 0.0% |
| Inupiat | 19 | 0.0% |
| Iranian | 9,502 | 0.7% |
| Iraqi | 648 | 0.1% |
| Irish | 171,744 | 12.4% |
| Iroquois | 520 | 0.0% |
| Israeli | 3,918 | 0.3% |
| Italian | 246,665 | 17.8% |
| Jamaican | 22,181 | 1.6% |
| Japanese | 51 | 0.0% |
| Jordanian | 259 | 0.0% |
| Kenyan | 143 | 0.0% |
| Korean | 16,591 | 1.2% |
| Laotian | 468 | 0.0% |
| Latvian | 514 | 0.0% |
| Lebanese | 1,271 | 0.1% |
| Liberian | 45 | 0.0% |
| Lithuanian | 3,506 | 0.3% |
| Lumbee | 27 | 0.0% |
| Luxembourger | 39 | 0.0% |
| Macedonian | 372 | 0.0% |
| Malaysian | 178 | 0.0% |
| Maltese | 989 | 0.1% |
| Mexican | 12,065 | 0.9% |
| Mexican American Indian | 350 | 0.0% |
| Mongolian | 362 | 0.0% |
| Moroccan | 1,013 | 0.1% |
| Native Hawaiian | 339 | 0.0% |
| Navajo | 60 | 0.0% |
| New Zealander | 9 | 0.0% |
| Nicaraguan | 1,181 | 0.1% |
| Nigerian | 2,669 | 0.2% |
| Northern European | 558 | 0.0% |
| Norwegian | 4,588 | 0.3% |
| Okinawan | 116 | 0.0% |
| Pakistani | 896 | 0.1% |
| Palestinian | 444 | 0.0% |
| Panamanian | 1,706 | 0.1% |
| Paraguayan | 377 | 0.0% |
| Pennsylvania German | 40 | 0.0% |
| Peruvian | 10,902 | 0.8% |
| Pima | 8 | 0.0% |
| Polish | 55,862 | 4.0% |
| Portuguese | 6,619 | 0.5% |
| Potawatomi | 73 | 0.0% |
| Puerto Rican | 38,649 | 2.8% |
| Romanian | 4,751 | 0.3% |
| Russian | 35,880 | 2.6% |
| Salvadoran | 57,663 | 4.2% |
| Samoan | 161 | 0.0% |
| Scandinavian | 831 | 0.1% |
| Scotch-Irish | 2,755 | 0.2% |
| Scottish | 6,687 | 0.5% |
| Seminole | 33 | 0.0% |
| Senegalese | 41 | 0.0% |
| Serbian | 754 | 0.1% |
| Shoshone | 31 | 0.0% |
| Sierra Leonean | 120 | 0.0% |
| Sioux | 39 | 0.0% |
| Slavic | 661 | 0.1% |
| Slovak | 1,079 | 0.1% |
| Slovene | 254 | 0.0% |
| Somali | 33 | 0.0% |
| South African | 419 | 0.0% |
| South American | 53,225 | 3.8% |
| South American Indian | 841 | 0.1% |
| Soviet Union | 12 | 0.0% |
| Spaniard | 4,414 | 0.3% |
| Spanish | 2,709 | 0.2% |
| Spanish American | 111 | 0.0% |
| Spanish American Indian | 119 | 0.0% |
| Sri Lankan | 1,095 | 0.1% |
| Subsaharan African | 8,226 | 0.6% |
| Sudanese | 6 | 0.0% |
| Swedish | 4,657 | 0.3% |
| Swiss | 1,094 | 0.1% |
| Syrian | 629 | 0.1% |
| Thai | 55,885 | 4.0% |
| Trinidadian and Tobagonian | 4,632 | 0.3% |
| Turkish | 3,739 | 0.3% |
| U.S. Virgin Islander | 136 | 0.0% |
| Ugandan | 28 | 0.0% |
| Ukrainian | 6,465 | 0.5% |
| Uruguayan | 1,500 | 0.1% |
| Ute | 17 | 0.0% |
| Venezuelan | 1,318 | 0.1% |
| Vietnamese | 3,249 | 0.2% |
| Welsh | 1,611 | 0.1% |
| West Indian | 4,747 | 0.3% |
| Yugoslavian | 1,359 | 0.1% |
| Zimbabwean | 32 | 0.0% | View All 168 Rows |
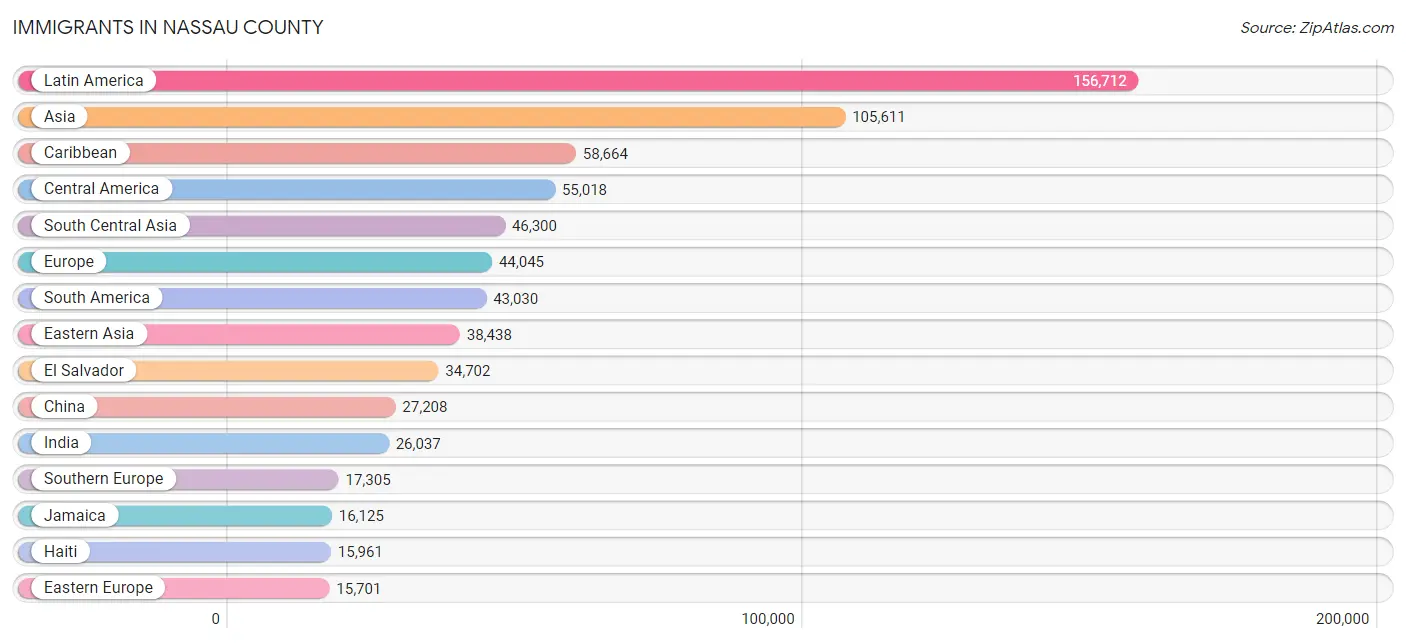
Immigrants in Nassau County
The most numerous immigrant groups reported in Nassau County came from Latin America (156,712 | 11.3%), Asia (105,611 | 7.6%), Caribbean (58,664 | 4.2%), Central America (55,018 | 4.0%), and South Central Asia (46,300 | 3.3%), together accounting for 30.4% of all Nassau County residents.
| Immigration Origin | # Population | % Population |
| Afghanistan | 1,492 | 0.1% |
| Africa | 7,439 | 0.5% |
| Albania | 506 | 0.0% |
| Argentina | 2,441 | 0.2% |
| Armenia | 67 | 0.0% |
| Asia | 105,611 | 7.6% |
| Australia | 488 | 0.0% |
| Austria | 288 | 0.0% |
| Bahamas | 215 | 0.0% |
| Bangladesh | 3,173 | 0.2% |
| Barbados | 1,469 | 0.1% |
| Belarus | 597 | 0.0% |
| Belgium | 502 | 0.0% |
| Belize | 250 | 0.0% |
| Bolivia | 753 | 0.1% |
| Bosnia and Herzegovina | 531 | 0.0% |
| Brazil | 2,679 | 0.2% |
| Bulgaria | 161 | 0.0% |
| Canada | 2,051 | 0.2% |
| Caribbean | 58,664 | 4.2% |
| Central America | 55,018 | 4.0% |
| Chile | 1,960 | 0.1% |
| China | 27,208 | 2.0% |
| Colombia | 9,410 | 0.7% |
| Costa Rica | 577 | 0.0% |
| Croatia | 625 | 0.0% |
| Cuba | 1,488 | 0.1% |
| Czechoslovakia | 726 | 0.1% |
| Denmark | 196 | 0.0% |
| Dominica | 734 | 0.1% |
| Dominican Republic | 14,294 | 1.0% |
| Eastern Africa | 742 | 0.1% |
| Eastern Asia | 38,438 | 2.8% |
| Eastern Europe | 15,701 | 1.1% |
| Ecuador | 6,825 | 0.5% |
| Egypt | 1,654 | 0.1% |
| El Salvador | 34,702 | 2.5% |
| England | 1,371 | 0.1% |
| Eritrea | 7 | 0.0% |
| Ethiopia | 139 | 0.0% |
| Europe | 44,045 | 3.2% |
| France | 588 | 0.0% |
| Germany | 2,796 | 0.2% |
| Ghana | 657 | 0.1% |
| Greece | 3,508 | 0.3% |
| Grenada | 723 | 0.1% |
| Guatemala | 5,337 | 0.4% |
| Guyana | 9,819 | 0.7% |
| Haiti | 15,961 | 1.1% |
| Honduras | 8,011 | 0.6% |
| Hong Kong | 3,647 | 0.3% |
| Hungary | 742 | 0.1% |
| India | 26,037 | 1.9% |
| Indonesia | 376 | 0.0% |
| Iran | 6,228 | 0.4% |
| Iraq | 293 | 0.0% |
| Ireland | 2,733 | 0.2% |
| Israel | 3,305 | 0.2% |
| Italy | 10,638 | 0.8% |
| Jamaica | 16,125 | 1.2% |
| Japan | 1,576 | 0.1% |
| Jordan | 276 | 0.0% |
| Kazakhstan | 77 | 0.0% |
| Kenya | 31 | 0.0% |
| Korea | 9,654 | 0.7% |
| Kuwait | 292 | 0.0% |
| Laos | 9 | 0.0% |
| Latin America | 156,712 | 11.3% |
| Latvia | 159 | 0.0% |
| Lebanon | 467 | 0.0% |
| Liberia | 76 | 0.0% |
| Lithuania | 306 | 0.0% |
| Malaysia | 423 | 0.0% |
| Mexico | 4,755 | 0.3% |
| Middle Africa | 88 | 0.0% |
| Moldova | 258 | 0.0% |
| Morocco | 458 | 0.0% |
| Nepal | 196 | 0.0% |
| Netherlands | 127 | 0.0% |
| Nicaragua | 512 | 0.0% |
| Nigeria | 2,466 | 0.2% |
| North Macedonia | 156 | 0.0% |
| Northern Africa | 2,240 | 0.2% |
| Northern Europe | 6,531 | 0.5% |
| Norway | 74 | 0.0% |
| Oceania | 654 | 0.1% |
| Pakistan | 8,095 | 0.6% |
| Panama | 874 | 0.1% |
| Peru | 6,697 | 0.5% |
| Philippines | 9,603 | 0.7% |
| Poland | 3,818 | 0.3% |
| Portugal | 2,124 | 0.2% |
| Romania | 1,386 | 0.1% |
| Russia | 2,124 | 0.2% |
| Saudi Arabia | 238 | 0.0% |
| Scotland | 307 | 0.0% |
| Senegal | 96 | 0.0% |
| Serbia | 314 | 0.0% |
| Sierra Leone | 241 | 0.0% |
| Singapore | 177 | 0.0% |
| South Africa | 500 | 0.0% |
| South America | 43,030 | 3.1% |
| South Central Asia | 46,300 | 3.3% |
| South Eastern Asia | 12,435 | 0.9% |
| Southern Europe | 17,305 | 1.3% |
| Spain | 751 | 0.1% |
| Sri Lanka | 377 | 0.0% |
| St. Vincent and the Grenadines | 384 | 0.0% |
| Sweden | 101 | 0.0% |
| Switzerland | 126 | 0.0% |
| Syria | 121 | 0.0% |
| Taiwan | 3,370 | 0.2% |
| Thailand | 553 | 0.0% |
| Trinidad and Tobago | 5,622 | 0.4% |
| Turkey | 1,892 | 0.1% |
| Uganda | 28 | 0.0% |
| Ukraine | 2,421 | 0.2% |
| Uruguay | 866 | 0.1% |
| Uzbekistan | 573 | 0.0% |
| Venezuela | 1,120 | 0.1% |
| Vietnam | 792 | 0.1% |
| West Indies | 675 | 0.1% |
| Western Africa | 3,614 | 0.3% |
| Western Asia | 8,288 | 0.6% |
| Western Europe | 4,433 | 0.3% |
| Yemen | 90 | 0.0% |
| Zaire | 38 | 0.0% |
| Zimbabwe | 379 | 0.0% | View All 128 Rows |
Sex and Age in Nassau County
Sex and Age in Nassau County
The most populous age groups in Nassau County are 55 to 59 Years (50,369 | 7.4%) for men and 55 to 59 Years (51,950 | 7.4%) for women.
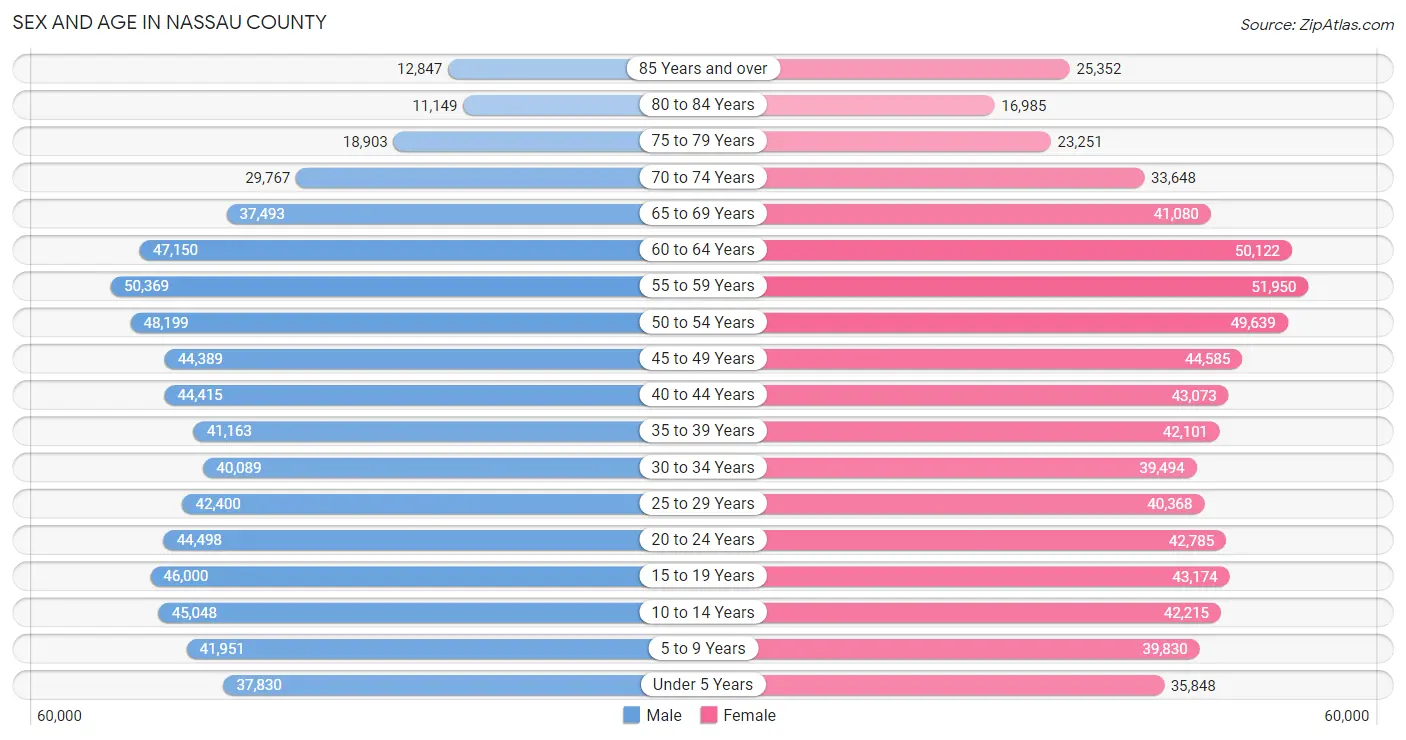
| Age Bracket | Male | Female |
| Under 5 Years | 37,830 (5.5%) | 35,848 (5.1%) |
| 5 to 9 Years | 41,951 (6.1%) | 39,830 (5.7%) |
| 10 to 14 Years | 45,048 (6.6%) | 42,215 (6.0%) |
| 15 to 19 Years | 46,000 (6.7%) | 43,174 (6.1%) |
| 20 to 24 Years | 44,498 (6.5%) | 42,785 (6.1%) |
| 25 to 29 Years | 42,400 (6.2%) | 40,368 (5.7%) |
| 30 to 34 Years | 40,089 (5.9%) | 39,494 (5.6%) |
| 35 to 39 Years | 41,163 (6.0%) | 42,101 (6.0%) |
| 40 to 44 Years | 44,415 (6.5%) | 43,073 (6.1%) |
| 45 to 49 Years | 44,389 (6.5%) | 44,585 (6.3%) |
| 50 to 54 Years | 48,199 (7.0%) | 49,639 (7.0%) |
| 55 to 59 Years | 50,369 (7.4%) | 51,950 (7.4%) |
| 60 to 64 Years | 47,150 (6.9%) | 50,122 (7.1%) |
| 65 to 69 Years | 37,493 (5.5%) | 41,080 (5.8%) |
| 70 to 74 Years | 29,767 (4.3%) | 33,648 (4.8%) |
| 75 to 79 Years | 18,903 (2.8%) | 23,251 (3.3%) |
| 80 to 84 Years | 11,149 (1.6%) | 16,985 (2.4%) |
| 85 Years and over | 12,847 (1.9%) | 25,352 (3.6%) |
| Total | 683,660 (100.0%) | 705,500 (100.0%) |
Families and Households in Nassau County
Median Family Size in Nassau County
The median family size in Nassau County is 3.45 persons per family, with married-couple families (276,807 | 79.0%) accounting for the largest median family size of 3.51 persons per family. On the other hand, single male/father families (21,732 | 6.2%) represent the smallest median family size with 3.09 persons per family.
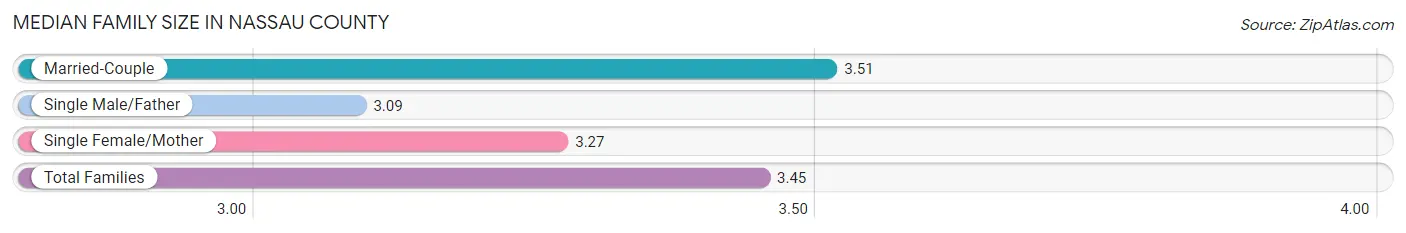
| Family Type | # Families | Family Size |
| Married-Couple | 276,807 (79.0%) | 3.51 |
| Single Male/Father | 21,732 (6.2%) | 3.09 |
| Single Female/Mother | 51,917 (14.8%) | 3.27 |
| Total Families | 350,456 (100.0%) | 3.45 |
Median Household Size in Nassau County
The median household size in Nassau County is 3.01 persons per household, with married-couple households (276,807 | 60.9%) accounting for the largest median household size of 3.55 persons per household. non-family households (104,315 | 22.9%) represent the smallest median household size with 1.24 persons per household.
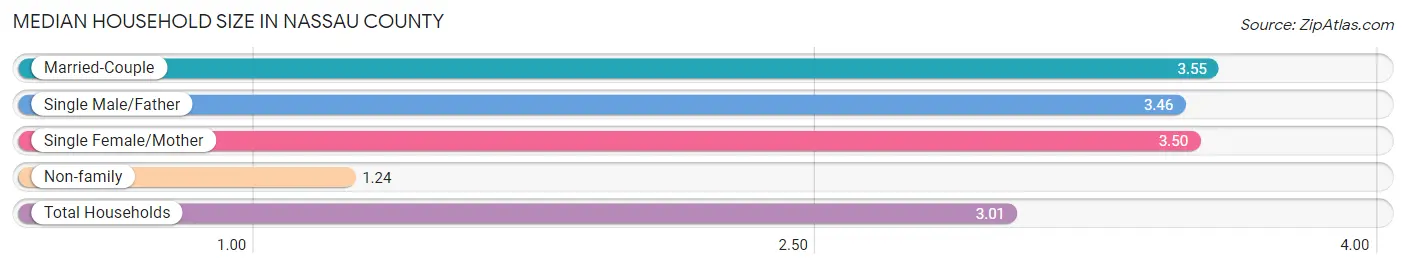
| Household Type | # Households | Household Size |
| Married-Couple | 276,807 (60.9%) | 3.55 |
| Single Male/Father | 21,732 (4.8%) | 3.46 |
| Single Female/Mother | 51,917 (11.4%) | 3.50 |
| Non-family | 104,315 (22.9%) | 1.24 |
| Total Households | 454,771 (100.0%) | 3.01 |
Household Size by Marriage Status in Nassau County
Out of a total of 454,771 households in Nassau County, 350,456 (77.1%) are family households, while 104,315 (22.9%) are nonfamily households. The most numerous type of family households are 2-person households, comprising 114,248, and the most common type of nonfamily households are 1-person households, comprising 87,687.
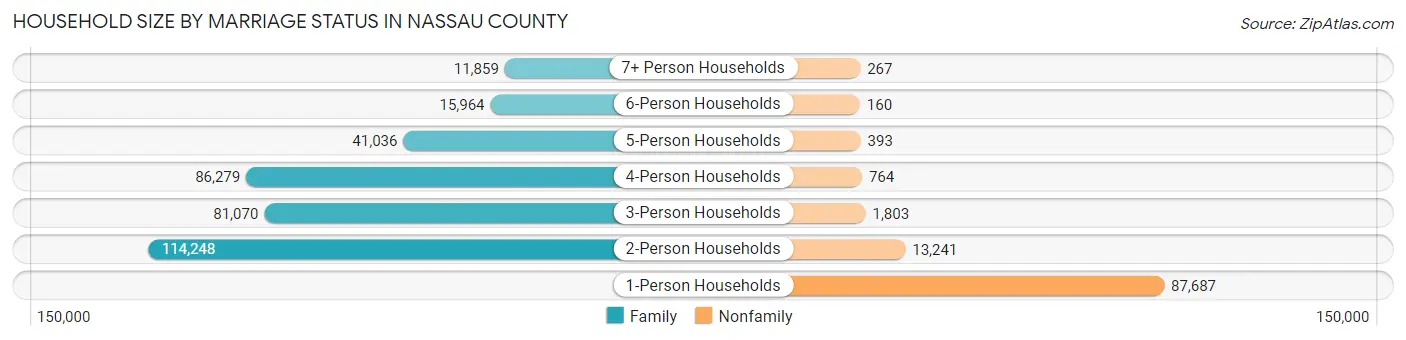
| Household Size | Family Households | Nonfamily Households |
| 1-Person Households | - | 87,687 (19.3%) |
| 2-Person Households | 114,248 (25.1%) | 13,241 (2.9%) |
| 3-Person Households | 81,070 (17.8%) | 1,803 (0.4%) |
| 4-Person Households | 86,279 (19.0%) | 764 (0.2%) |
| 5-Person Households | 41,036 (9.0%) | 393 (0.1%) |
| 6-Person Households | 15,964 (3.5%) | 160 (0.0%) |
| 7+ Person Households | 11,859 (2.6%) | 267 (0.1%) |
| Total | 350,456 (77.1%) | 104,315 (22.9%) |
Female Fertility in Nassau County
Fertility by Age in Nassau County
Average fertility rate in Nassau County is 52.0 births per 1,000 women. Women in the age bracket of 20 to 34 years have the highest fertility rate with 72.0 births per 1,000 women. Women in the age bracket of 20 to 34 years acount for 55.3% of all women with births.
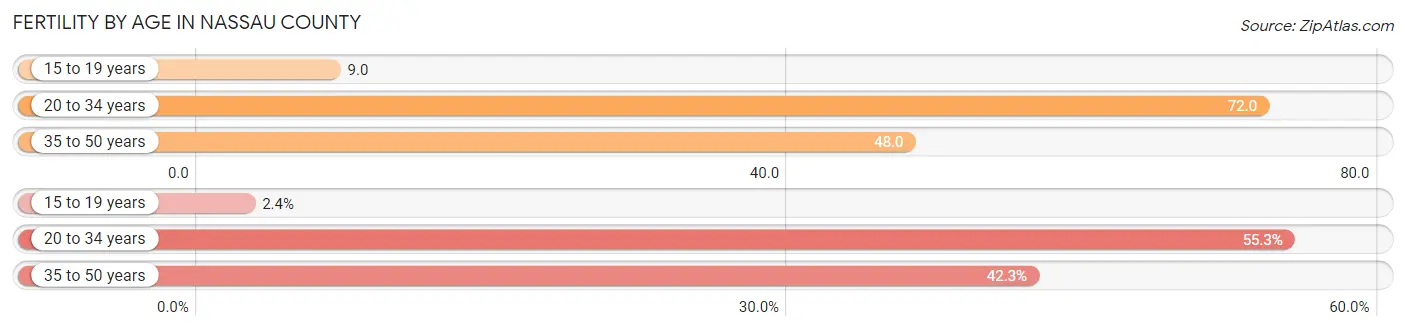
| Age Bracket | Women with Births | Births / 1,000 Women |
| 15 to 19 years | 382 (2.4%) | 9.0 |
| 20 to 34 years | 8,811 (55.3%) | 72.0 |
| 35 to 50 years | 6,737 (42.3%) | 48.0 |
| Total | 15,930 (100.0%) | 52.0 |
Fertility by Age by Marriage Status in Nassau County
82.4% of women with births (15,930) in Nassau County are married. The highest percentage of unmarried women with births falls into 15 to 19 years age bracket with 92.1% of them unmarried at the time of birth, while the lowest percentage of unmarried women with births belong to 35 to 50 years age bracket with 10.4% of them unmarried.
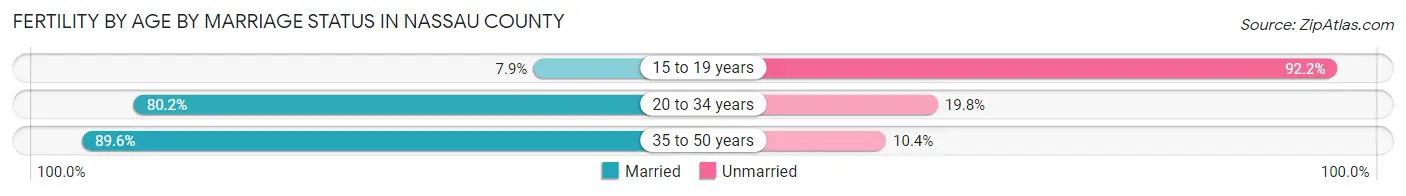
| Age Bracket | Married | Unmarried |
| 15 to 19 years | 30 (7.9%) | 352 (92.1%) |
| 20 to 34 years | 7,066 (80.2%) | 1,745 (19.8%) |
| 35 to 50 years | 6,036 (89.6%) | 701 (10.4%) |
| Total | 13,126 (82.4%) | 2,804 (17.6%) |
Fertility by Education in Nassau County
Average fertility rate in Nassau County is 52.0 births per 1,000 women. Women with the education attainment of graduate degree have the highest fertility rate of 78.0 births per 1,000 women, while women with the education attainment of less than high school have the lowest fertility at 25.0 births per 1,000 women. Women with the education attainment of graduate degree represent 33.2% of all women with births.
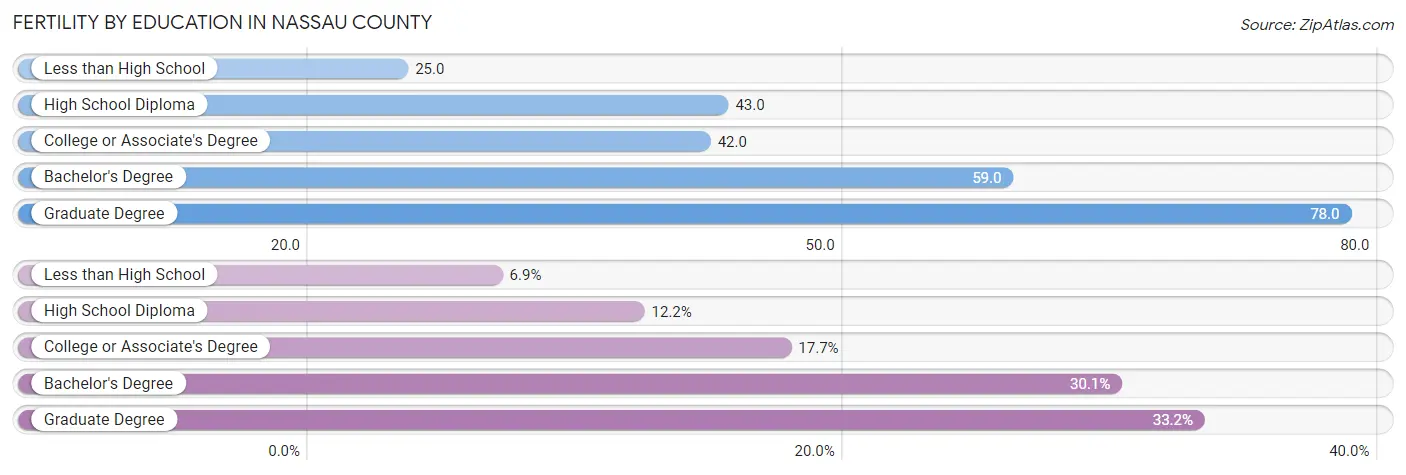
| Educational Attainment | Women with Births | Births / 1,000 Women |
| Less than High School | 1,094 (6.9%) | 25.0 |
| High School Diploma | 1,942 (12.2%) | 43.0 |
| College or Associate's Degree | 2,818 (17.7%) | 42.0 |
| Bachelor's Degree | 4,791 (30.1%) | 59.0 |
| Graduate Degree | 5,285 (33.2%) | 78.0 |
| Total | 15,930 (100.0%) | 52.0 |
Fertility by Education by Marriage Status in Nassau County
17.6% of women with births in Nassau County are unmarried. Women with the educational attainment of graduate degree are most likely to be married with 96.4% of them married at childbirth, while women with the educational attainment of high school diploma are least likely to be married with 52.3% of them unmarried at childbirth.
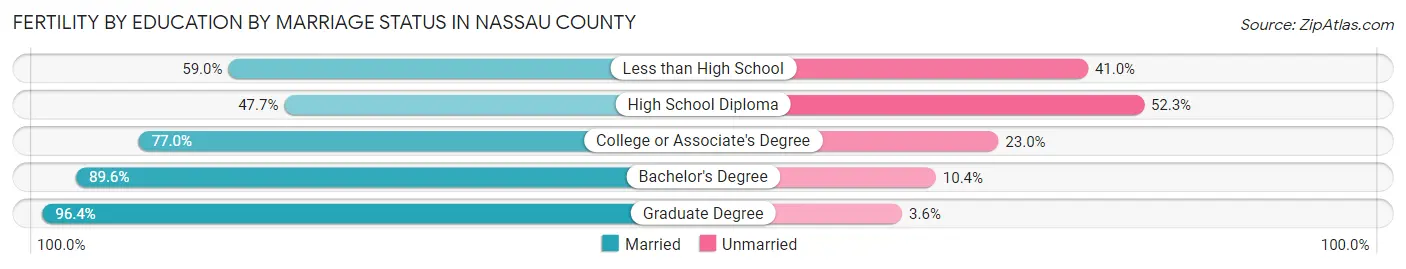
| Educational Attainment | Married | Unmarried |
| Less than High School | 645 (59.0%) | 449 (41.0%) |
| High School Diploma | 926 (47.7%) | 1,016 (52.3%) |
| College or Associate's Degree | 2,170 (77.0%) | 648 (23.0%) |
| Bachelor's Degree | 4,293 (89.6%) | 498 (10.4%) |
| Graduate Degree | 5,095 (96.4%) | 190 (3.6%) |
| Total | 13,126 (82.4%) | 2,804 (17.6%) |
Employment Characteristics in Nassau County
Employment by Class of Employer in Nassau County
Among the 689,613 employed individuals in Nassau County, private company employees (432,214 | 62.7%), local government employees (85,173 | 12.3%), and not-for-profit organizations (64,026 | 9.3%) make up the most common classes of employment.
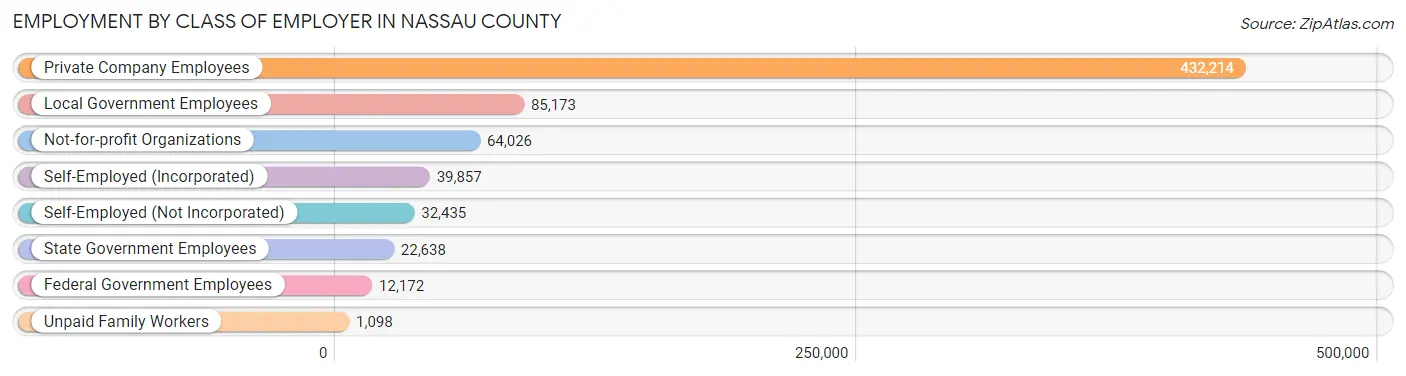
| Employer Class | # Employees | % Employees |
| Private Company Employees | 432,214 | 62.7% |
| Self-Employed (Incorporated) | 39,857 | 5.8% |
| Self-Employed (Not Incorporated) | 32,435 | 4.7% |
| Not-for-profit Organizations | 64,026 | 9.3% |
| Local Government Employees | 85,173 | 12.3% |
| State Government Employees | 22,638 | 3.3% |
| Federal Government Employees | 12,172 | 1.8% |
| Unpaid Family Workers | 1,098 | 0.2% |
| Total | 689,613 | 100.0% |
Employment Status by Age in Nassau County
According to the labor force statistics for Nassau County, out of the total population over 16 years of age (1,127,987), 65.6% or 739,959 individuals are in the labor force, with 4.6% or 34,038 of them unemployed. The age group with the highest labor force participation rate is 30 to 34 years, with 87.2% or 69,396 individuals in the labor force. Within the labor force, the 16 to 19 years age range has the highest percentage of unemployed individuals, with 14.4% or 2,882 of them being unemployed.
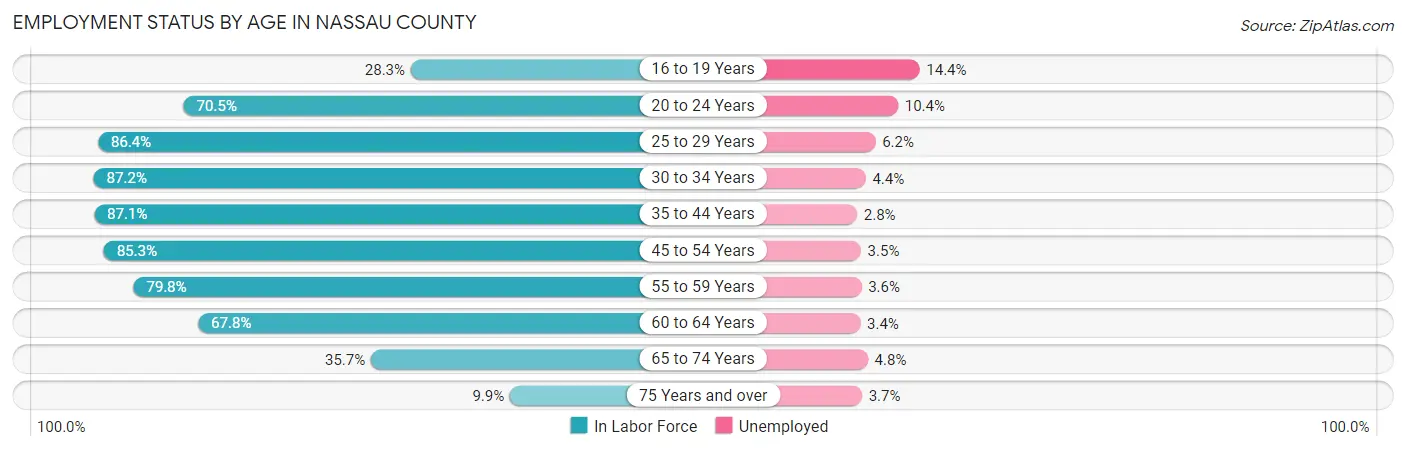
| Age Bracket | In Labor Force | Unemployed |
| 16 to 19 Years | 20,015 (28.3%) | 2,882 (14.4%) |
| 20 to 24 Years | 61,535 (70.5%) | 6,400 (10.4%) |
| 25 to 29 Years | 71,512 (86.4%) | 4,434 (6.2%) |
| 30 to 34 Years | 69,396 (87.2%) | 3,053 (4.4%) |
| 35 to 44 Years | 148,725 (87.1%) | 4,164 (2.8%) |
| 45 to 54 Years | 159,351 (85.3%) | 5,577 (3.5%) |
| 55 to 59 Years | 81,651 (79.8%) | 2,939 (3.6%) |
| 60 to 64 Years | 65,950 (67.8%) | 2,242 (3.4%) |
| 65 to 74 Years | 50,690 (35.7%) | 2,433 (4.8%) |
| 75 Years and over | 10,740 (9.9%) | 397 (3.7%) |
| Total | 739,959 (65.6%) | 34,038 (4.6%) |
Employment Status by Educational Attainment in Nassau County
According to labor force statistics for Nassau County, 82.9% of individuals (596,470) out of the total population between 25 and 64 years of age (719,506) are in the labor force, with 3.7% or 22,069 of them being unemployed. The group with the highest labor force participation rate are those with the educational attainment of bachelor's degree or higher, with 88.0% or 327,100 individuals in the labor force. Within the labor force, individuals with high school diploma education have the highest percentage of unemployment, with 5.0% or 5,069 of them being unemployed.
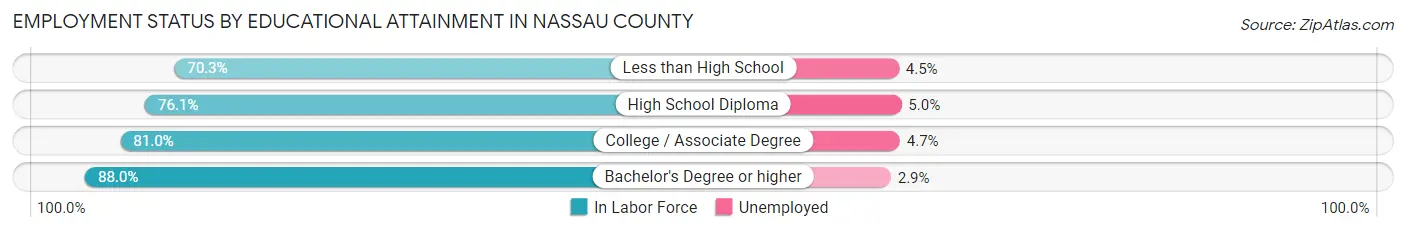
| Educational Attainment | In Labor Force | Unemployed |
| Less than High School | 36,565 (70.3%) | 2,341 (4.5%) |
| High School Diploma | 101,378 (76.1%) | 6,661 (5.0%) |
| College / Associate Degree | 131,683 (81.0%) | 7,641 (4.7%) |
| Bachelor's Degree or higher | 327,100 (88.0%) | 10,779 (2.9%) |
| Total | 596,470 (82.9%) | 26,622 (3.7%) |
Employment Occupations by Sex in Nassau County
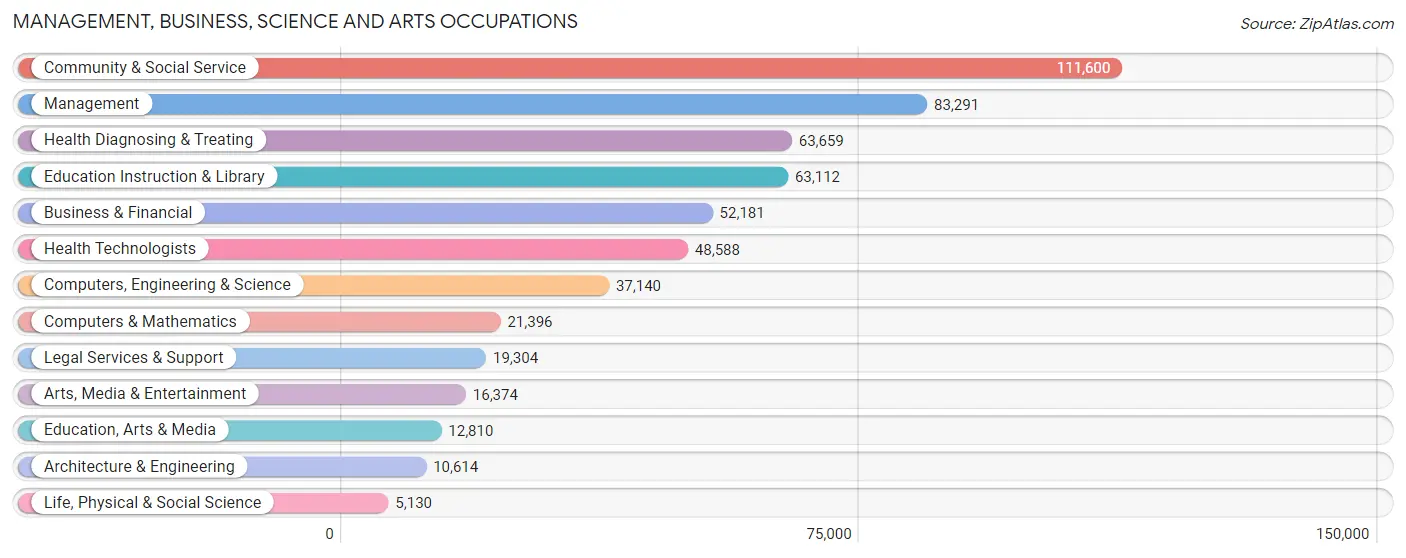
Management, Business, Science and Arts Occupations
The most common Management, Business, Science and Arts occupations in Nassau County are Community & Social Service (111,600 | 15.8%), Management (83,291 | 11.8%), Health Diagnosing & Treating (63,659 | 9.0%), Education Instruction & Library (63,112 | 9.0%), and Business & Financial (52,181 | 7.4%).
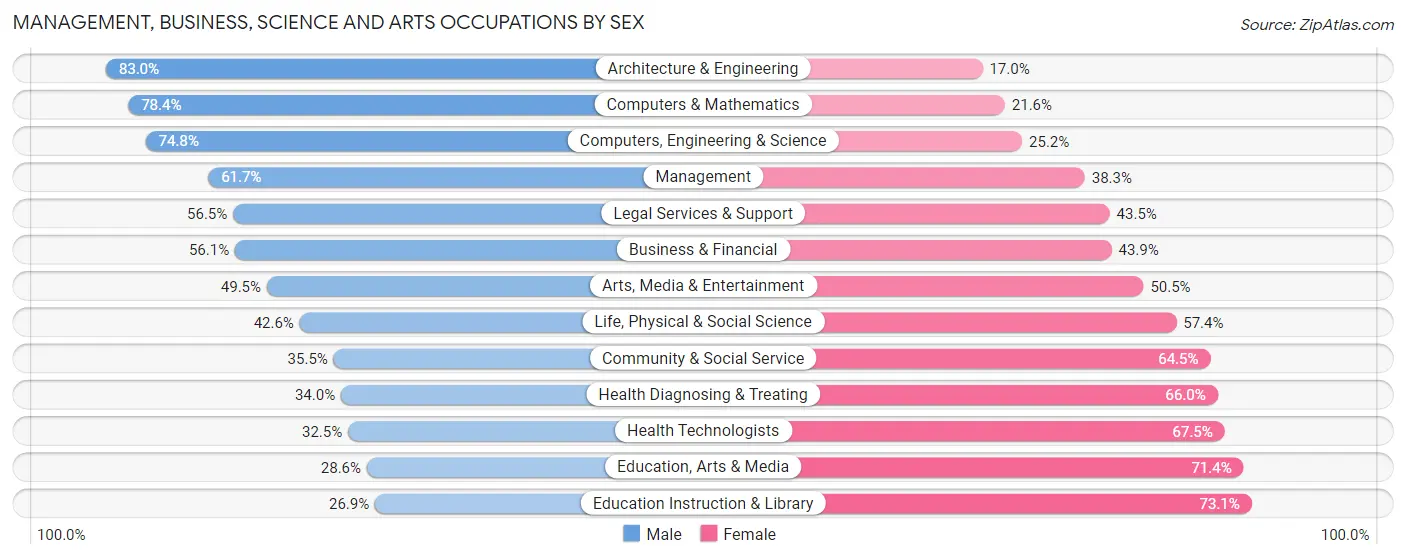
Management, Business, Science and Arts Occupations by Sex
Within the Management, Business, Science and Arts occupations in Nassau County, the most male-oriented occupations are Architecture & Engineering (83.0%), Computers & Mathematics (78.4%), and Computers, Engineering & Science (74.8%), while the most female-oriented occupations are Education Instruction & Library (73.1%), Education, Arts & Media (71.4%), and Health Technologists (67.5%).
| Occupation | Male | Female |
| Management | 51,380 (61.7%) | 31,911 (38.3%) |
| Business & Financial | 29,278 (56.1%) | 22,903 (43.9%) |
| Computers, Engineering & Science | 27,769 (74.8%) | 9,371 (25.2%) |
| Computers & Mathematics | 16,769 (78.4%) | 4,627 (21.6%) |
| Architecture & Engineering | 8,814 (83.0%) | 1,800 (17.0%) |
| Life, Physical & Social Science | 2,186 (42.6%) | 2,944 (57.4%) |
| Community & Social Service | 39,647 (35.5%) | 71,953 (64.5%) |
| Education, Arts & Media | 3,664 (28.6%) | 9,146 (71.4%) |
| Legal Services & Support | 10,908 (56.5%) | 8,396 (43.5%) |
| Education Instruction & Library | 16,976 (26.9%) | 46,136 (73.1%) |
| Arts, Media & Entertainment | 8,099 (49.5%) | 8,275 (50.5%) |
| Health Diagnosing & Treating | 21,643 (34.0%) | 42,016 (66.0%) |
| Health Technologists | 15,808 (32.5%) | 32,780 (67.5%) |
| Total (Category) | 169,717 (48.8%) | 178,154 (51.2%) |
| Total (Overall) | 373,548 (53.0%) | 331,192 (47.0%) |
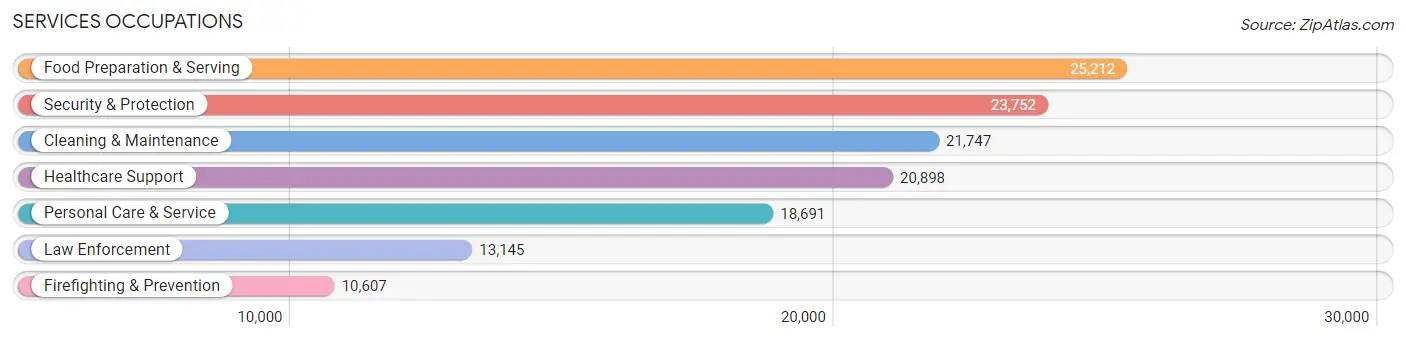
Services Occupations
The most common Services occupations in Nassau County are Food Preparation & Serving (25,212 | 3.6%), Security & Protection (23,752 | 3.4%), Cleaning & Maintenance (21,747 | 3.1%), Healthcare Support (20,898 | 3.0%), and Personal Care & Service (18,691 | 2.6%).
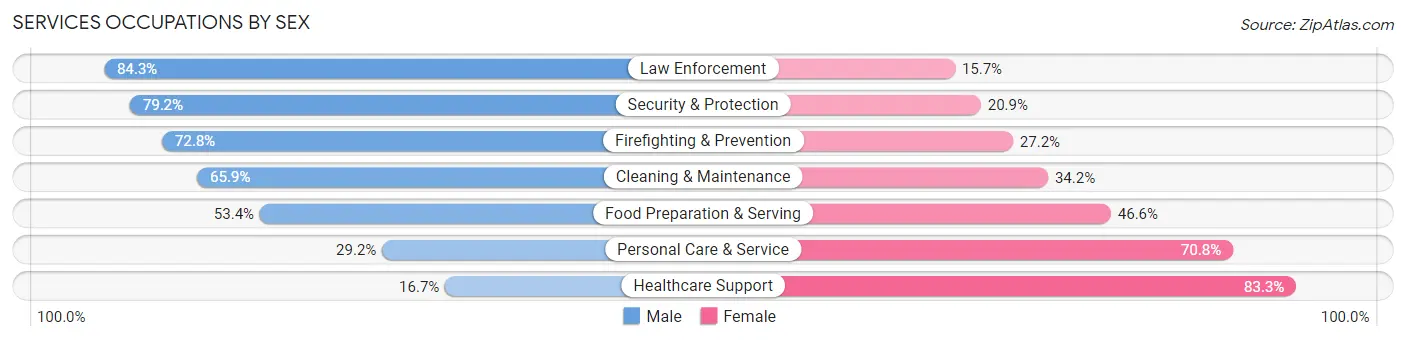
Services Occupations by Sex
Within the Services occupations in Nassau County, the most male-oriented occupations are Law Enforcement (84.3%), Security & Protection (79.1%), and Firefighting & Prevention (72.8%), while the most female-oriented occupations are Healthcare Support (83.3%), Personal Care & Service (70.8%), and Food Preparation & Serving (46.6%).
| Occupation | Male | Female |
| Healthcare Support | 3,494 (16.7%) | 17,404 (83.3%) |
| Security & Protection | 18,800 (79.1%) | 4,952 (20.8%) |
| Firefighting & Prevention | 7,722 (72.8%) | 2,885 (27.2%) |
| Law Enforcement | 11,078 (84.3%) | 2,067 (15.7%) |
| Food Preparation & Serving | 13,464 (53.4%) | 11,748 (46.6%) |
| Cleaning & Maintenance | 14,320 (65.8%) | 7,427 (34.2%) |
| Personal Care & Service | 5,457 (29.2%) | 13,234 (70.8%) |
| Total (Category) | 55,535 (50.3%) | 54,765 (49.6%) |
| Total (Overall) | 373,548 (53.0%) | 331,192 (47.0%) |
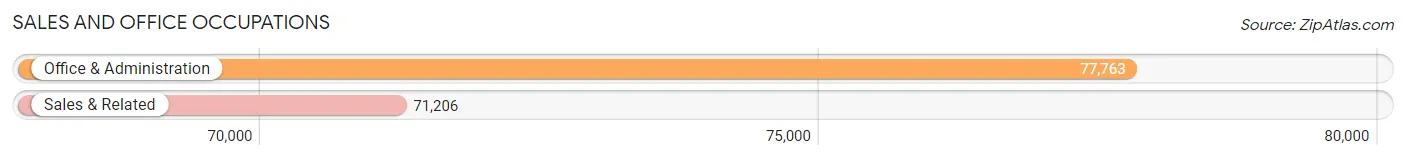
Sales and Office Occupations
The most common Sales and Office occupations in Nassau County are Office & Administration (77,763 | 11.0%), and Sales & Related (71,206 | 10.1%).
Sales and Office Occupations by Sex
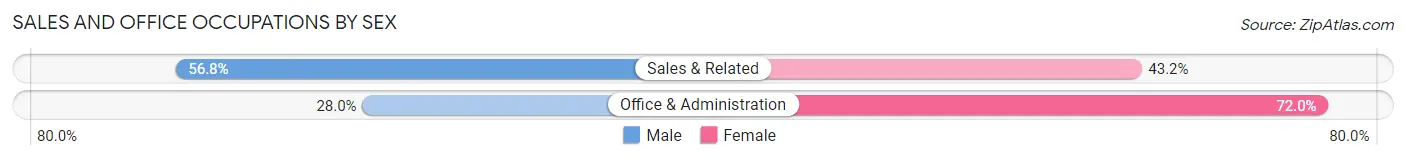
| Occupation | Male | Female |
| Sales & Related | 40,443 (56.8%) | 30,763 (43.2%) |
| Office & Administration | 21,792 (28.0%) | 55,971 (72.0%) |
| Total (Category) | 62,235 (41.8%) | 86,734 (58.2%) |
| Total (Overall) | 373,548 (53.0%) | 331,192 (47.0%) |
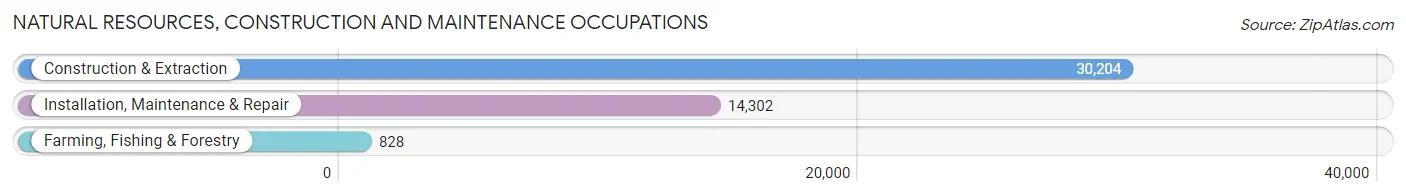
Natural Resources, Construction and Maintenance Occupations
The most common Natural Resources, Construction and Maintenance occupations in Nassau County are Construction & Extraction (30,204 | 4.3%), Installation, Maintenance & Repair (14,302 | 2.0%), and Farming, Fishing & Forestry (828 | 0.1%).
Natural Resources, Construction and Maintenance Occupations by Sex

| Occupation | Male | Female |
| Farming, Fishing & Forestry | 698 (84.3%) | 130 (15.7%) |
| Construction & Extraction | 29,618 (98.1%) | 586 (1.9%) |
| Installation, Maintenance & Repair | 13,987 (97.8%) | 315 (2.2%) |
| Total (Category) | 44,303 (97.7%) | 1,031 (2.3%) |
| Total (Overall) | 373,548 (53.0%) | 331,192 (47.0%) |
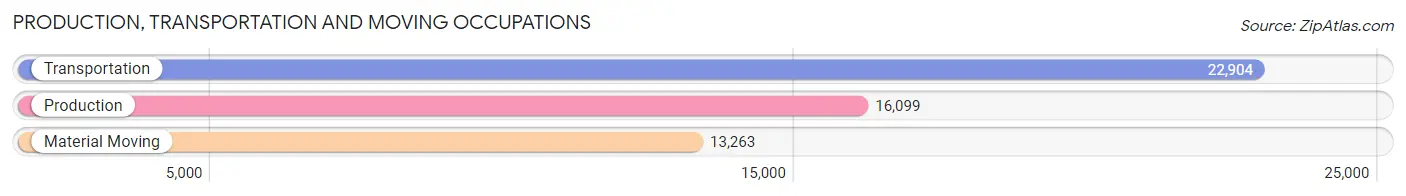
Production, Transportation and Moving Occupations
The most common Production, Transportation and Moving occupations in Nassau County are Transportation (22,904 | 3.3%), Production (16,099 | 2.3%), and Material Moving (13,263 | 1.9%).
Production, Transportation and Moving Occupations by Sex
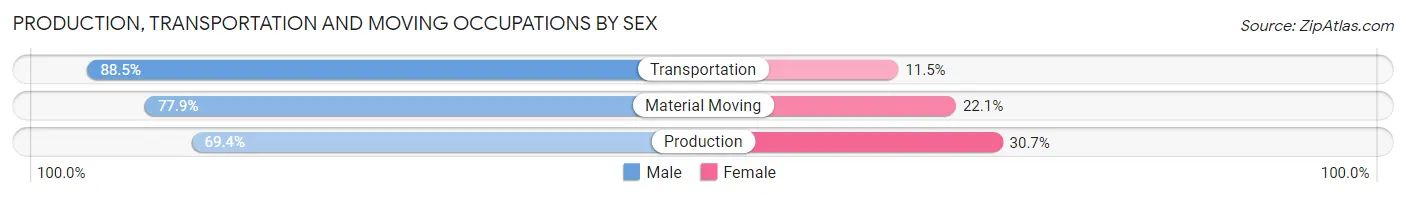
| Occupation | Male | Female |
| Production | 11,164 (69.4%) | 4,935 (30.6%) |
| Transportation | 20,262 (88.5%) | 2,642 (11.5%) |
| Material Moving | 10,332 (77.9%) | 2,931 (22.1%) |
| Total (Category) | 41,758 (79.9%) | 10,508 (20.1%) |
| Total (Overall) | 373,548 (53.0%) | 331,192 (47.0%) |
Employment Industries by Sex in Nassau County
Employment Industries in Nassau County
The major employment industries in Nassau County include Health Care & Social Assistance (124,042 | 17.6%), Educational Services (93,955 | 13.3%), Professional & Scientific (68,152 | 9.7%), Retail Trade (63,684 | 9.0%), and Finance & Insurance (54,499 | 7.7%).
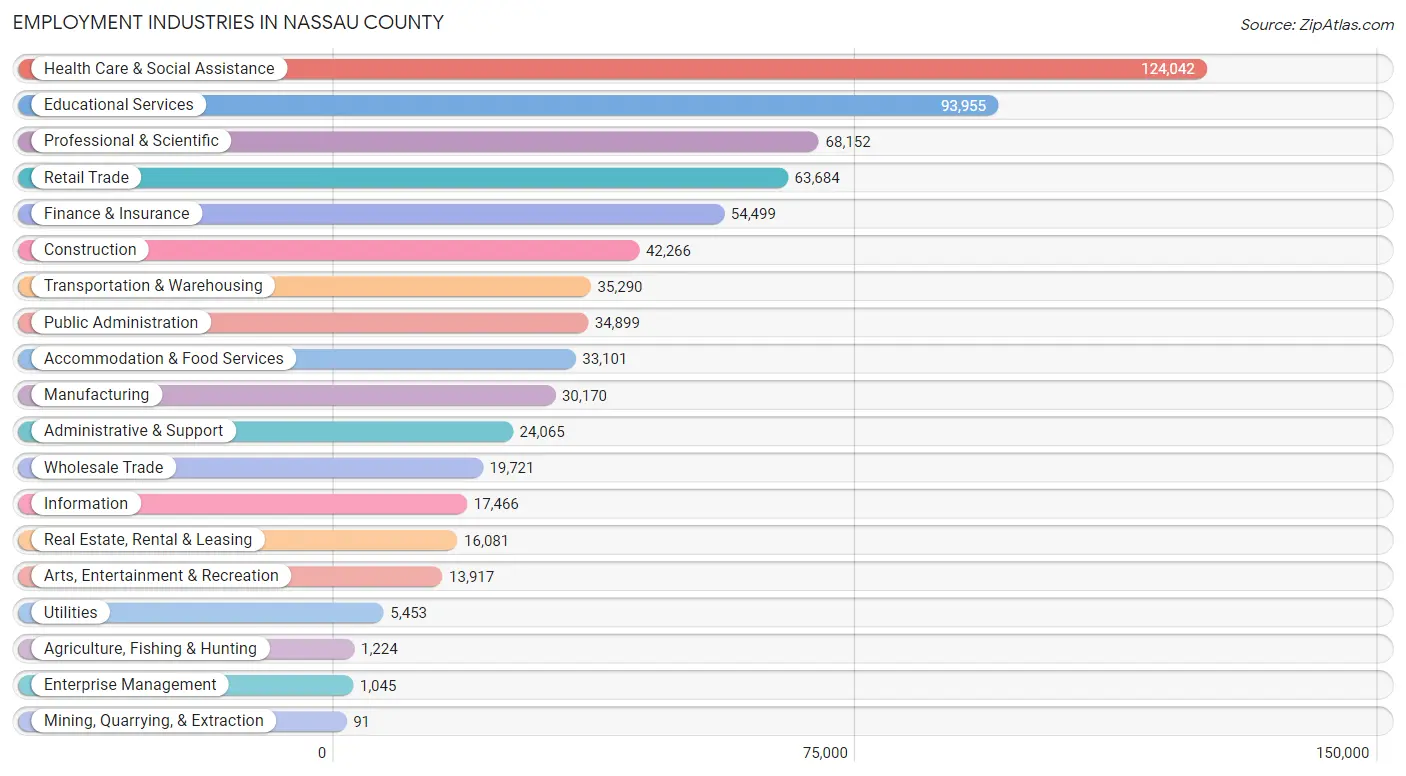
Employment Industries by Sex in Nassau County
The Nassau County industries that see more men than women are Construction (90.5%), Mining, Quarrying, & Extraction (89.0%), and Utilities (82.1%), whereas the industries that tend to have a higher number of women are Health Care & Social Assistance (70.2%), Educational Services (69.7%), and Retail Trade (45.5%).
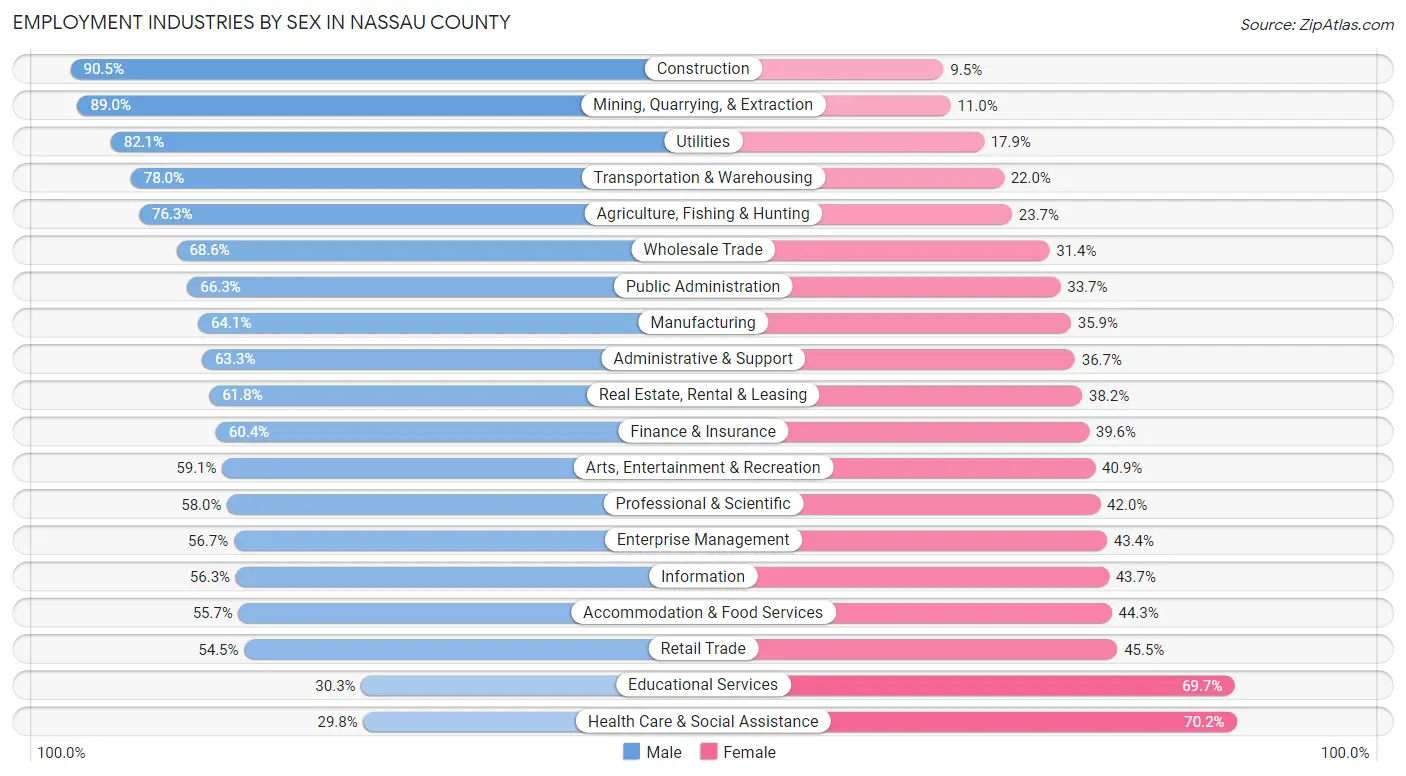
| Industry | Male | Female |
| Agriculture, Fishing & Hunting | 934 (76.3%) | 290 (23.7%) |
| Mining, Quarrying, & Extraction | 81 (89.0%) | 10 (11.0%) |
| Construction | 38,243 (90.5%) | 4,023 (9.5%) |
| Manufacturing | 19,339 (64.1%) | 10,831 (35.9%) |
| Wholesale Trade | 13,520 (68.6%) | 6,201 (31.4%) |
| Retail Trade | 34,713 (54.5%) | 28,971 (45.5%) |
| Transportation & Warehousing | 27,525 (78.0%) | 7,765 (22.0%) |
| Utilities | 4,479 (82.1%) | 974 (17.9%) |
| Information | 9,826 (56.3%) | 7,640 (43.7%) |
| Finance & Insurance | 32,910 (60.4%) | 21,589 (39.6%) |
| Real Estate, Rental & Leasing | 9,935 (61.8%) | 6,146 (38.2%) |
| Professional & Scientific | 39,553 (58.0%) | 28,599 (42.0%) |
| Enterprise Management | 592 (56.7%) | 453 (43.3%) |
| Administrative & Support | 15,229 (63.3%) | 8,836 (36.7%) |
| Educational Services | 28,459 (30.3%) | 65,496 (69.7%) |
| Health Care & Social Assistance | 37,015 (29.8%) | 87,027 (70.2%) |
| Arts, Entertainment & Recreation | 8,221 (59.1%) | 5,696 (40.9%) |
| Accommodation & Food Services | 18,429 (55.7%) | 14,672 (44.3%) |
| Public Administration | 23,133 (66.3%) | 11,766 (33.7%) |
| Total | 373,548 (53.0%) | 331,192 (47.0%) |
Education in Nassau County
School Enrollment in Nassau County
The most common levels of schooling among the 341,782 students in Nassau County are high school (74,915 | 21.9%), college / undergraduate (72,347 | 21.2%), and middle school (67,912 | 19.9%).
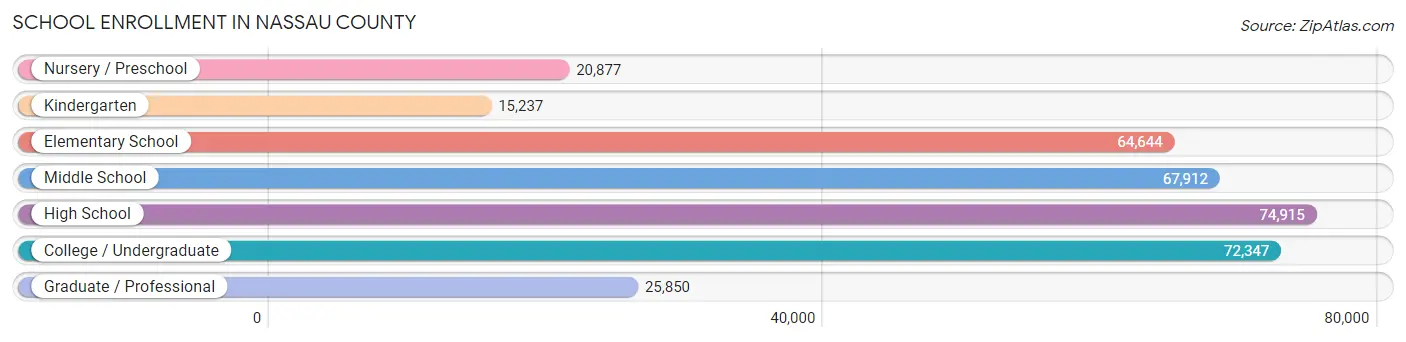
| School Level | # Students | % Students |
| Nursery / Preschool | 20,877 | 6.1% |
| Kindergarten | 15,237 | 4.5% |
| Elementary School | 64,644 | 18.9% |
| Middle School | 67,912 | 19.9% |
| High School | 74,915 | 21.9% |
| College / Undergraduate | 72,347 | 21.2% |
| Graduate / Professional | 25,850 | 7.6% |
| Total | 341,782 | 100.0% |
School Enrollment by Age by Funding Source in Nassau County
Out of a total of 341,782 students who are enrolled in schools in Nassau County, 91,256 (26.7%) attend a private institution, while the remaining 250,526 (73.3%) are enrolled in public schools. The age group of 3 to 4 year olds has the highest likelihood of being enrolled in private schools, with 9,964 (54.9% in the age bracket) enrolled. Conversely, the age group of 10 to 14 year olds has the lowest likelihood of being enrolled in a private school, with 73,016 (86.0% in the age bracket) attending a public institution.
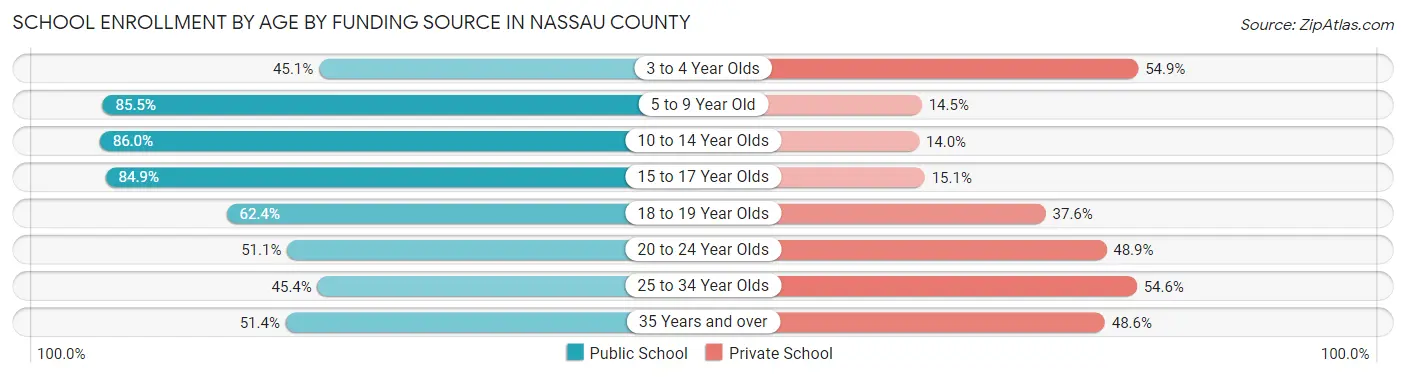
| Age Bracket | Public School | Private School |
| 3 to 4 Year Olds | 8,199 (45.1%) | 9,964 (54.9%) |
| 5 to 9 Year Old | 67,209 (85.5%) | 11,433 (14.5%) |
| 10 to 14 Year Olds | 73,016 (86.0%) | 11,904 (14.0%) |
| 15 to 17 Year Olds | 45,440 (84.9%) | 8,079 (15.1%) |
| 18 to 19 Year Olds | 17,890 (62.4%) | 10,789 (37.6%) |
| 20 to 24 Year Olds | 22,401 (51.1%) | 21,454 (48.9%) |
| 25 to 34 Year Olds | 8,049 (45.4%) | 9,674 (54.6%) |
| 35 Years and over | 8,362 (51.4%) | 7,919 (48.6%) |
| Total | 250,526 (73.3%) | 91,256 (26.7%) |
Educational Attainment by Field of Study in Nassau County
Business (114,814 | 22.9%), education (58,315 | 11.6%), science & technology (54,183 | 10.8%), social sciences (45,339 | 9.0%), and psychology (30,945 | 6.2%) are the most common fields of study among 501,010 individuals in Nassau County who have obtained a bachelor's degree or higher.
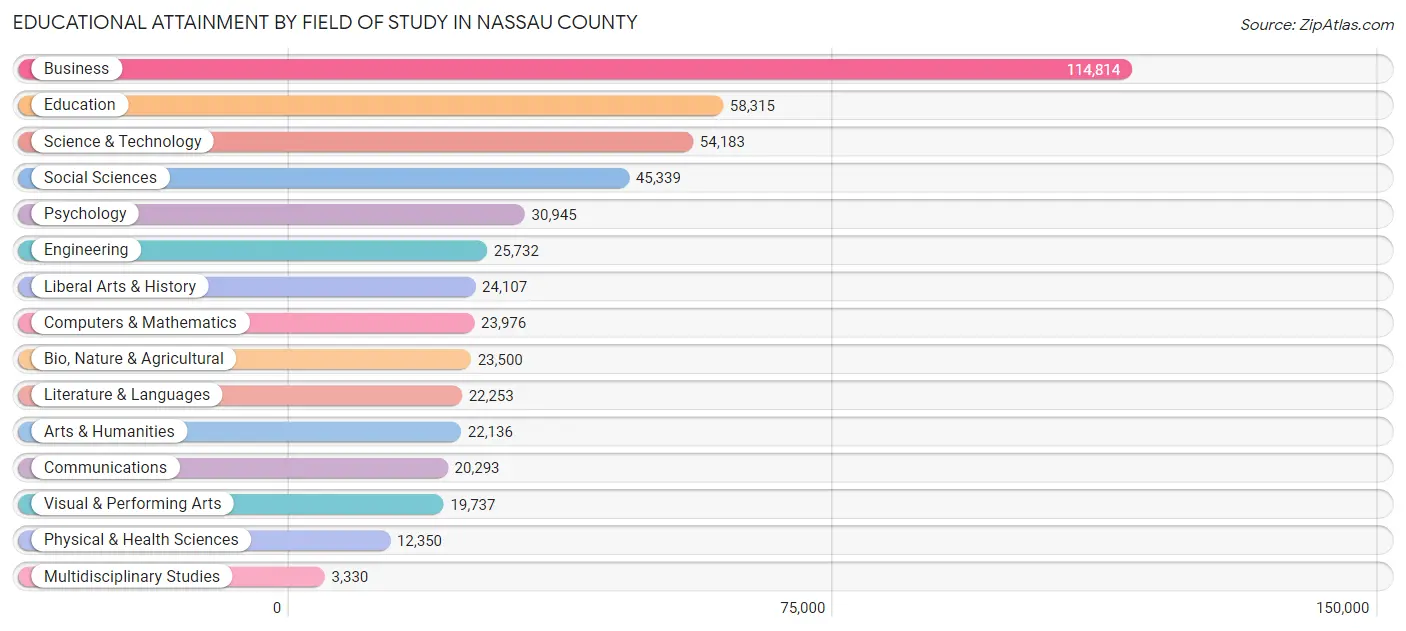
| Field of Study | # Graduates | % Graduates |
| Computers & Mathematics | 23,976 | 4.8% |
| Bio, Nature & Agricultural | 23,500 | 4.7% |
| Physical & Health Sciences | 12,350 | 2.5% |
| Psychology | 30,945 | 6.2% |
| Social Sciences | 45,339 | 9.0% |
| Engineering | 25,732 | 5.1% |
| Multidisciplinary Studies | 3,330 | 0.7% |
| Science & Technology | 54,183 | 10.8% |
| Business | 114,814 | 22.9% |
| Education | 58,315 | 11.6% |
| Literature & Languages | 22,253 | 4.4% |
| Liberal Arts & History | 24,107 | 4.8% |
| Visual & Performing Arts | 19,737 | 3.9% |
| Communications | 20,293 | 4.1% |
| Arts & Humanities | 22,136 | 4.4% |
| Total | 501,010 | 100.0% |
Transportation & Commute in Nassau County
Vehicle Availability by Sex in Nassau County
The most prevalent vehicle ownership categories in Nassau County are males with 2 vehicles (157,091, accounting for 42.9%) and females with 2 vehicles (131,691, making up 49.0%).
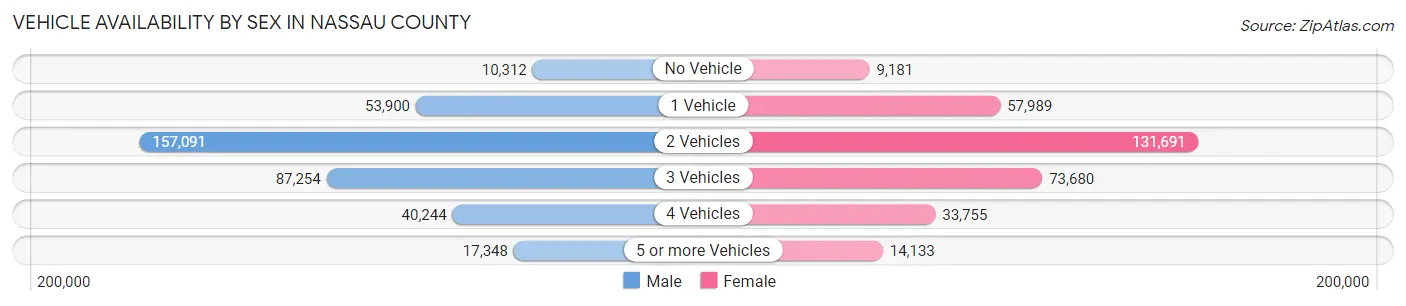
| Vehicles Available | Male | Female |
| No Vehicle | 10,312 (2.8%) | 9,181 (2.9%) |
| 1 Vehicle | 53,900 (14.7%) | 57,989 (18.1%) |
| 2 Vehicles | 157,091 (42.9%) | 131,691 (41.1%) |
| 3 Vehicles | 87,254 (23.8%) | 73,680 (23.0%) |
| 4 Vehicles | 40,244 (11.0%) | 33,755 (10.5%) |
| 5 or more Vehicles | 17,348 (4.7%) | 14,133 (4.4%) |
| Total | 366,149 (100.0%) | 320,429 (100.0%) |
Commute Time in Nassau County
The most frequently occuring commute durations in Nassau County are 60 to 89 minutes (89,961 commuters, 14.8%), 30 to 34 minutes (85,288 commuters, 14.1%), and 20 to 24 minutes (69,646 commuters, 11.5%).
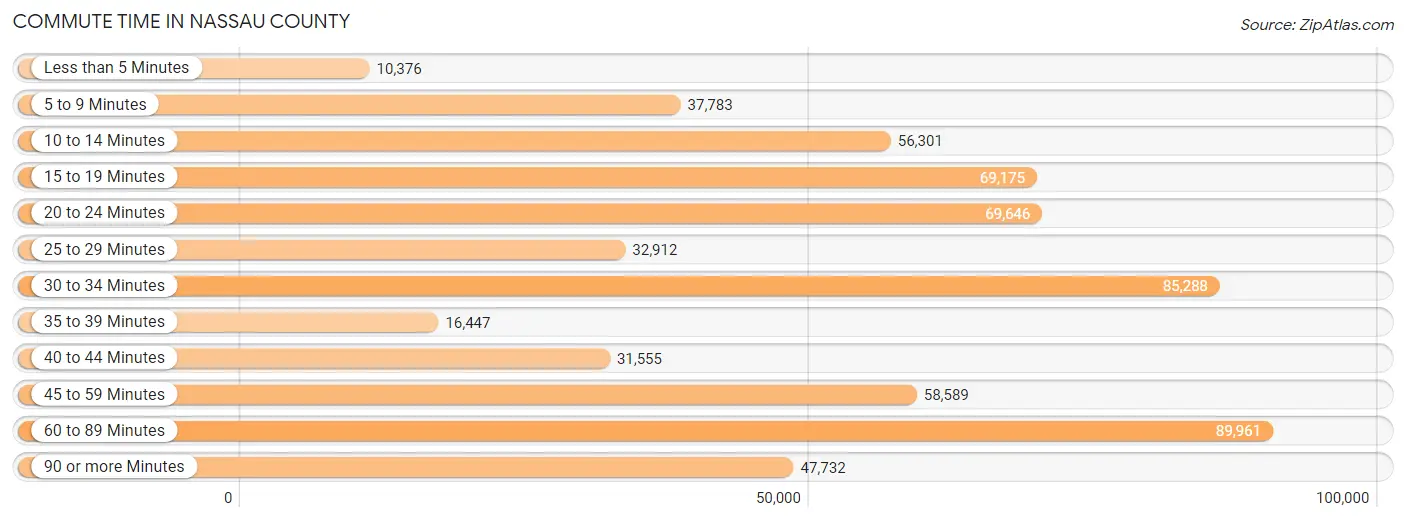
| Commute Time | # Commuters | % Commuters |
| Less than 5 Minutes | 10,376 | 1.7% |
| 5 to 9 Minutes | 37,783 | 6.2% |
| 10 to 14 Minutes | 56,301 | 9.3% |
| 15 to 19 Minutes | 69,175 | 11.4% |
| 20 to 24 Minutes | 69,646 | 11.5% |
| 25 to 29 Minutes | 32,912 | 5.4% |
| 30 to 34 Minutes | 85,288 | 14.1% |
| 35 to 39 Minutes | 16,447 | 2.7% |
| 40 to 44 Minutes | 31,555 | 5.2% |
| 45 to 59 Minutes | 58,589 | 9.7% |
| 60 to 89 Minutes | 89,961 | 14.8% |
| 90 or more Minutes | 47,732 | 7.9% |
Commute Time by Sex in Nassau County
The most common commute times in Nassau County are 60 to 89 minutes (56,791 commuters, 17.5%) for males and 30 to 34 minutes (38,735 commuters, 13.8%) for females.
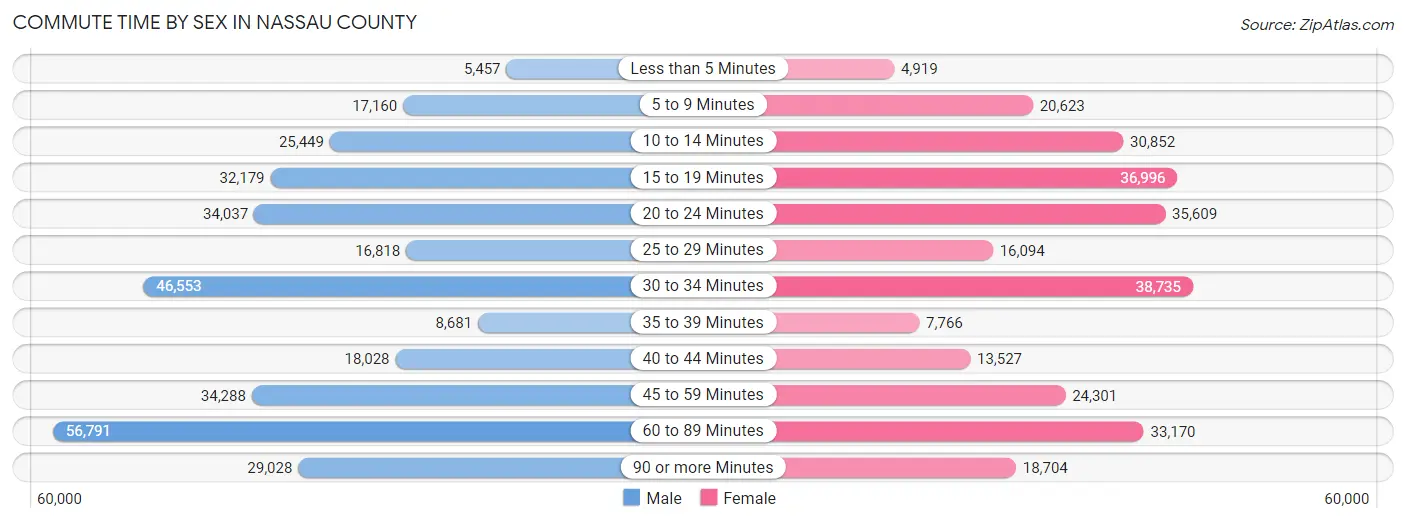
| Commute Time | Male | Female |
| Less than 5 Minutes | 5,457 (1.7%) | 4,919 (1.8%) |
| 5 to 9 Minutes | 17,160 (5.3%) | 20,623 (7.3%) |
| 10 to 14 Minutes | 25,449 (7.8%) | 30,852 (11.0%) |
| 15 to 19 Minutes | 32,179 (9.9%) | 36,996 (13.2%) |
| 20 to 24 Minutes | 34,037 (10.5%) | 35,609 (12.7%) |
| 25 to 29 Minutes | 16,818 (5.2%) | 16,094 (5.7%) |
| 30 to 34 Minutes | 46,553 (14.3%) | 38,735 (13.8%) |
| 35 to 39 Minutes | 8,681 (2.7%) | 7,766 (2.8%) |
| 40 to 44 Minutes | 18,028 (5.6%) | 13,527 (4.8%) |
| 45 to 59 Minutes | 34,288 (10.6%) | 24,301 (8.6%) |
| 60 to 89 Minutes | 56,791 (17.5%) | 33,170 (11.8%) |
| 90 or more Minutes | 29,028 (8.9%) | 18,704 (6.7%) |
Time of Departure to Work by Sex in Nassau County
The most frequent times of departure to work in Nassau County are 7:00 AM to 7:29 AM (48,689, 15.0%) for males and 8:00 AM to 8:29 AM (48,947, 17.4%) for females.
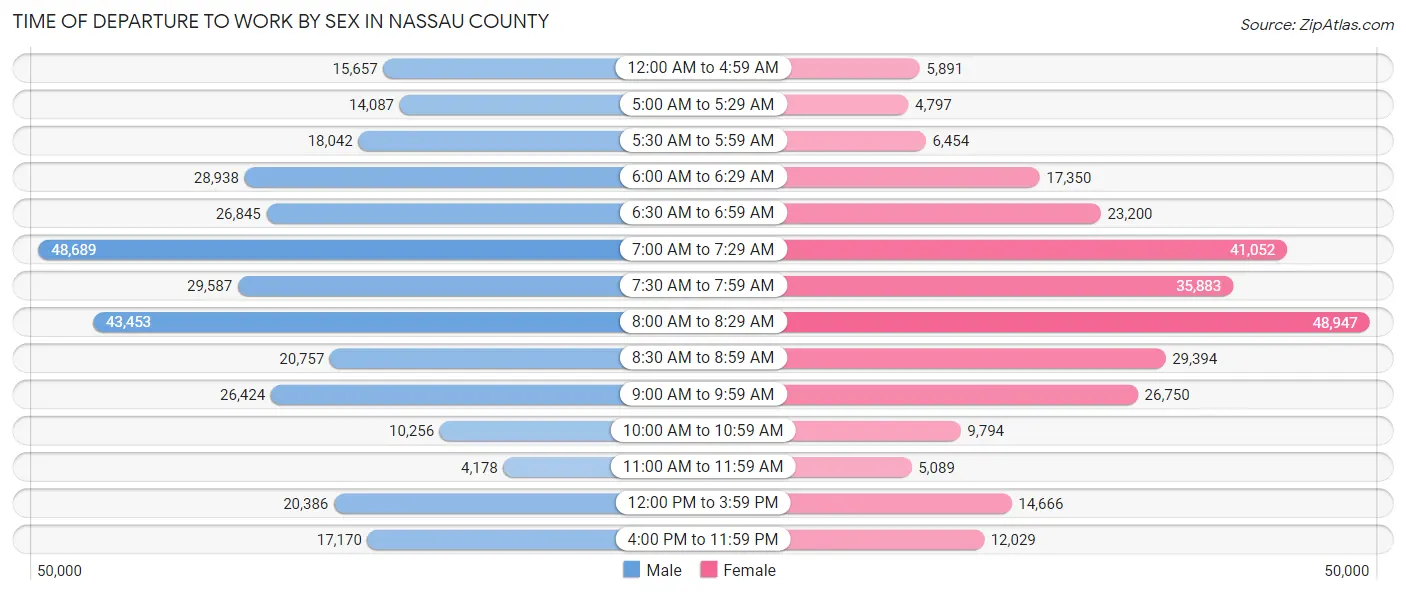
| Time of Departure | Male | Female |
| 12:00 AM to 4:59 AM | 15,657 (4.8%) | 5,891 (2.1%) |
| 5:00 AM to 5:29 AM | 14,087 (4.3%) | 4,797 (1.7%) |
| 5:30 AM to 5:59 AM | 18,042 (5.6%) | 6,454 (2.3%) |
| 6:00 AM to 6:29 AM | 28,938 (8.9%) | 17,350 (6.2%) |
| 6:30 AM to 6:59 AM | 26,845 (8.3%) | 23,200 (8.3%) |
| 7:00 AM to 7:29 AM | 48,689 (15.0%) | 41,052 (14.6%) |
| 7:30 AM to 7:59 AM | 29,587 (9.1%) | 35,883 (12.8%) |
| 8:00 AM to 8:29 AM | 43,453 (13.4%) | 48,947 (17.4%) |
| 8:30 AM to 8:59 AM | 20,757 (6.4%) | 29,394 (10.4%) |
| 9:00 AM to 9:59 AM | 26,424 (8.1%) | 26,750 (9.5%) |
| 10:00 AM to 10:59 AM | 10,256 (3.2%) | 9,794 (3.5%) |
| 11:00 AM to 11:59 AM | 4,178 (1.3%) | 5,089 (1.8%) |
| 12:00 PM to 3:59 PM | 20,386 (6.3%) | 14,666 (5.2%) |
| 4:00 PM to 11:59 PM | 17,170 (5.3%) | 12,029 (4.3%) |
| Total | 324,469 (100.0%) | 281,296 (100.0%) |
Housing Occupancy in Nassau County
Occupancy by Ownership in Nassau County
Of the total 454,771 dwellings in Nassau County, owner-occupied units account for 372,021 (81.8%), while renter-occupied units make up 82,750 (18.2%).
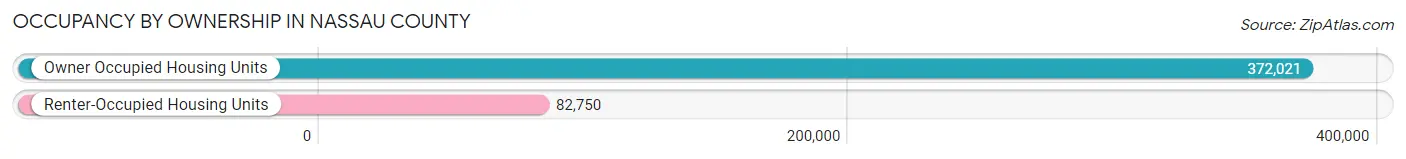
| Occupancy | # Housing Units | % Housing Units |
| Owner Occupied Housing Units | 372,021 | 81.8% |
| Renter-Occupied Housing Units | 82,750 | 18.2% |
| Total Occupied Housing Units | 454,771 | 100.0% |
Occupancy by Household Size in Nassau County
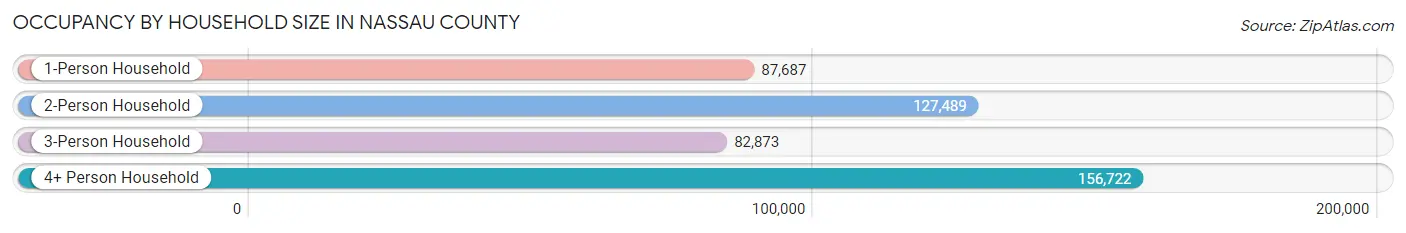
| Household Size | # Housing Units | % Housing Units |
| 1-Person Household | 87,687 | 19.3% |
| 2-Person Household | 127,489 | 28.0% |
| 3-Person Household | 82,873 | 18.2% |
| 4+ Person Household | 156,722 | 34.5% |
| Total Housing Units | 454,771 | 100.0% |
Occupancy by Ownership by Household Size in Nassau County
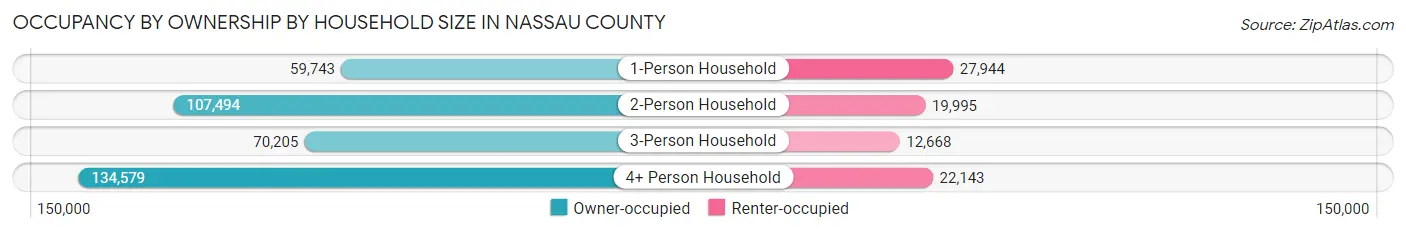
| Household Size | Owner-occupied | Renter-occupied |
| 1-Person Household | 59,743 (68.1%) | 27,944 (31.9%) |
| 2-Person Household | 107,494 (84.3%) | 19,995 (15.7%) |
| 3-Person Household | 70,205 (84.7%) | 12,668 (15.3%) |
| 4+ Person Household | 134,579 (85.9%) | 22,143 (14.1%) |
| Total Housing Units | 372,021 (81.8%) | 82,750 (18.2%) |
Occupancy by Educational Attainment in Nassau County
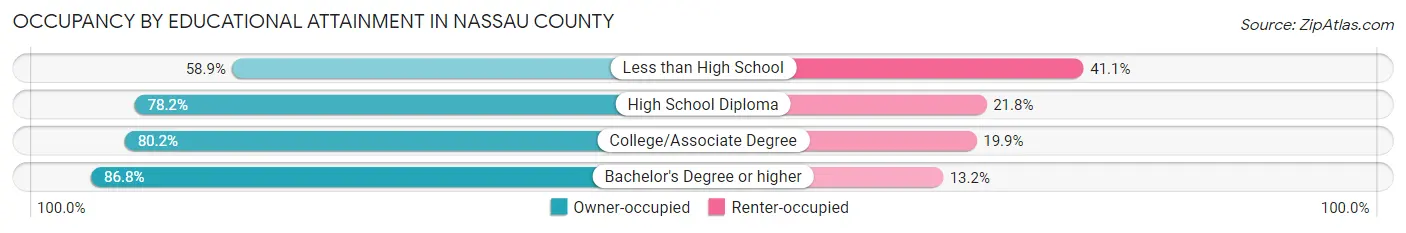
| Household Size | Owner-occupied | Renter-occupied |
| Less than High School | 17,587 (58.9%) | 12,257 (41.1%) |
| High School Diploma | 68,022 (78.2%) | 18,988 (21.8%) |
| College/Associate Degree | 83,192 (80.1%) | 20,599 (19.9%) |
| Bachelor's Degree or higher | 203,220 (86.8%) | 30,906 (13.2%) |
Occupancy by Age of Householder in Nassau County
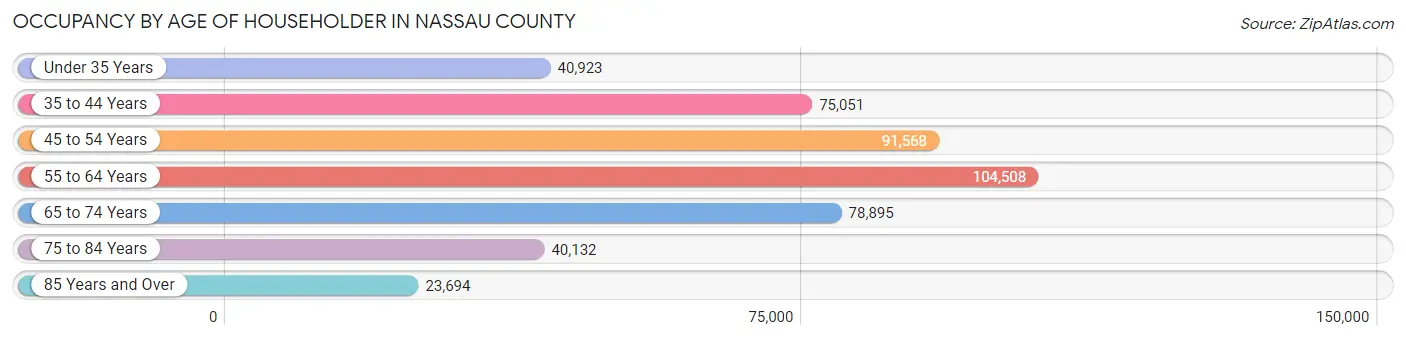
| Age Bracket | # Households | % Households |
| Under 35 Years | 40,923 | 9.0% |
| 35 to 44 Years | 75,051 | 16.5% |
| 45 to 54 Years | 91,568 | 20.1% |
| 55 to 64 Years | 104,508 | 23.0% |
| 65 to 74 Years | 78,895 | 17.3% |
| 75 to 84 Years | 40,132 | 8.8% |
| 85 Years and Over | 23,694 | 5.2% |
| Total | 454,771 | 100.0% |
Housing Finances in Nassau County
Median Income by Occupancy in Nassau County
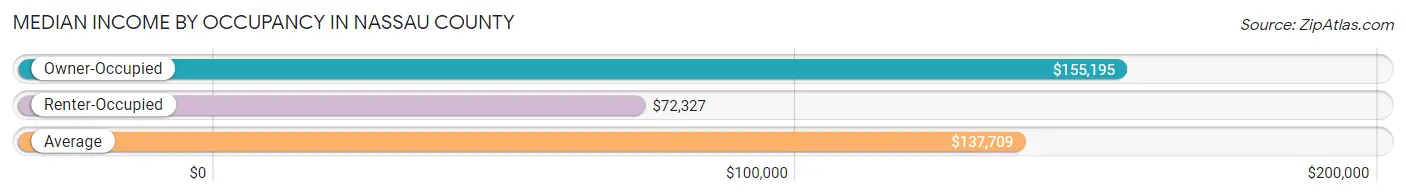
| Occupancy Type | # Households | Median Income |
| Owner-Occupied | 372,021 (81.8%) | $155,195 |
| Renter-Occupied | 82,750 (18.2%) | $72,327 |
| Average | 454,771 (100.0%) | $137,709 |
Occupancy by Householder Income Bracket in Nassau County
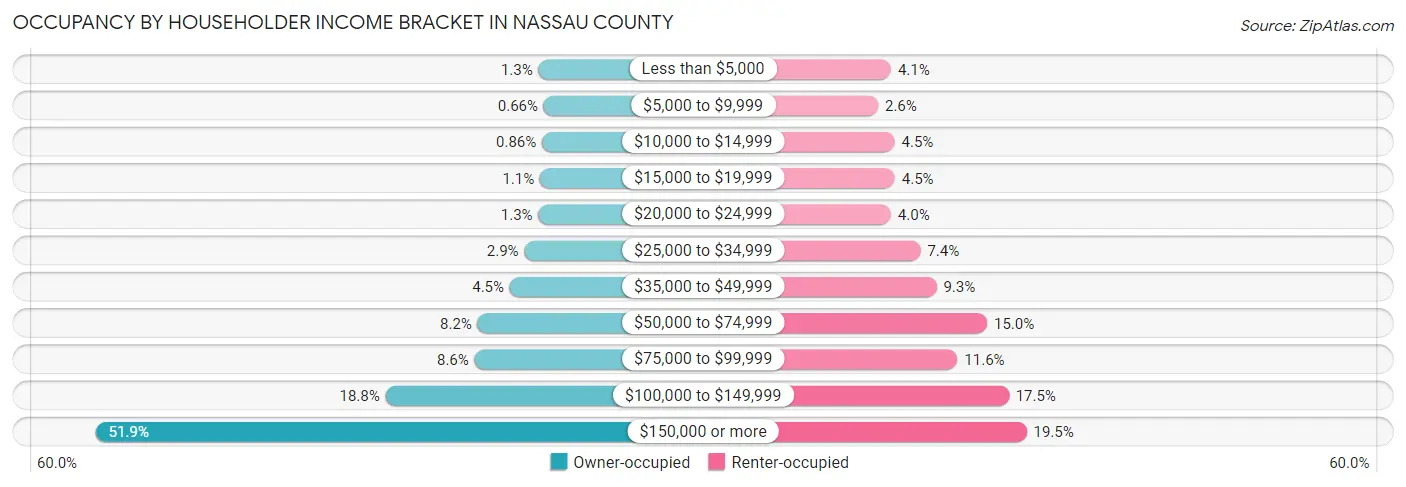
| Income Bracket | Owner-occupied | Renter-occupied |
| Less than $5,000 | 4,701 (1.3%) | 3,355 (4.1%) |
| $5,000 to $9,999 | 2,451 (0.7%) | 2,128 (2.6%) |
| $10,000 to $14,999 | 3,207 (0.9%) | 3,687 (4.5%) |
| $15,000 to $19,999 | 4,039 (1.1%) | 3,714 (4.5%) |
| $20,000 to $24,999 | 4,768 (1.3%) | 3,345 (4.0%) |
| $25,000 to $34,999 | 10,712 (2.9%) | 6,144 (7.4%) |
| $35,000 to $49,999 | 16,892 (4.5%) | 7,656 (9.2%) |
| $50,000 to $74,999 | 30,577 (8.2%) | 12,440 (15.0%) |
| $75,000 to $99,999 | 31,868 (8.6%) | 9,629 (11.6%) |
| $100,000 to $149,999 | 69,767 (18.8%) | 14,481 (17.5%) |
| $150,000 or more | 193,039 (51.9%) | 16,171 (19.5%) |
| Total | 372,021 (100.0%) | 82,750 (100.0%) |
Monthly Housing Cost Tiers in Nassau County
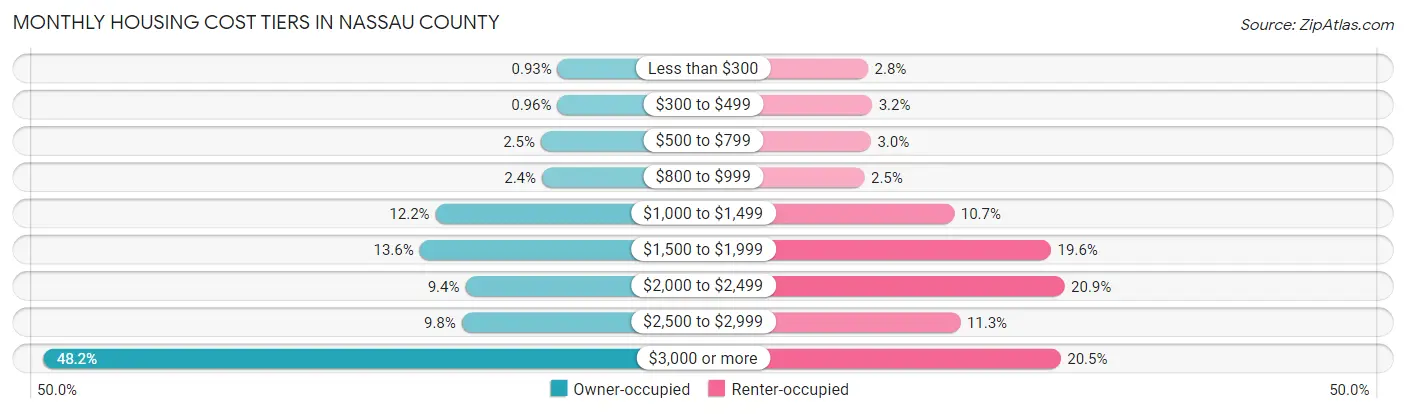
| Monthly Cost | Owner-occupied | Renter-occupied |
| Less than $300 | 3,447 (0.9%) | 2,297 (2.8%) |
| $300 to $499 | 3,580 (1.0%) | 2,615 (3.2%) |
| $500 to $799 | 9,239 (2.5%) | 2,516 (3.0%) |
| $800 to $999 | 8,864 (2.4%) | 2,026 (2.5%) |
| $1,000 to $1,499 | 45,313 (12.2%) | 8,863 (10.7%) |
| $1,500 to $1,999 | 50,746 (13.6%) | 16,246 (19.6%) |
| $2,000 to $2,499 | 35,066 (9.4%) | 17,272 (20.9%) |
| $2,500 to $2,999 | 36,353 (9.8%) | 9,333 (11.3%) |
| $3,000 or more | 179,413 (48.2%) | 16,981 (20.5%) |
| Total | 372,021 (100.0%) | 82,750 (100.0%) |
Physical Housing Characteristics in Nassau County
Housing Structures in Nassau County
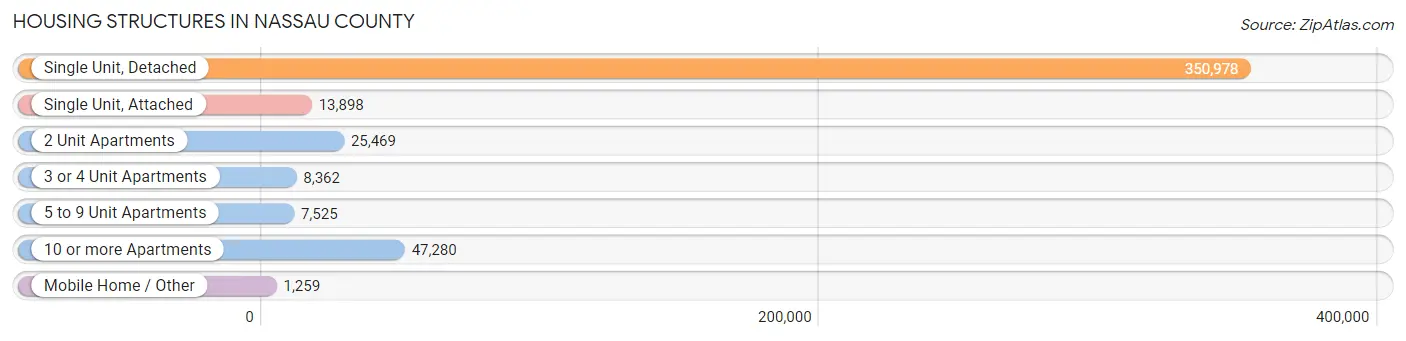
| Structure Type | # Housing Units | % Housing Units |
| Single Unit, Detached | 350,978 | 77.2% |
| Single Unit, Attached | 13,898 | 3.1% |
| 2 Unit Apartments | 25,469 | 5.6% |
| 3 or 4 Unit Apartments | 8,362 | 1.8% |
| 5 to 9 Unit Apartments | 7,525 | 1.7% |
| 10 or more Apartments | 47,280 | 10.4% |
| Mobile Home / Other | 1,259 | 0.3% |
| Total | 454,771 | 100.0% |
Housing Structures by Occupancy in Nassau County
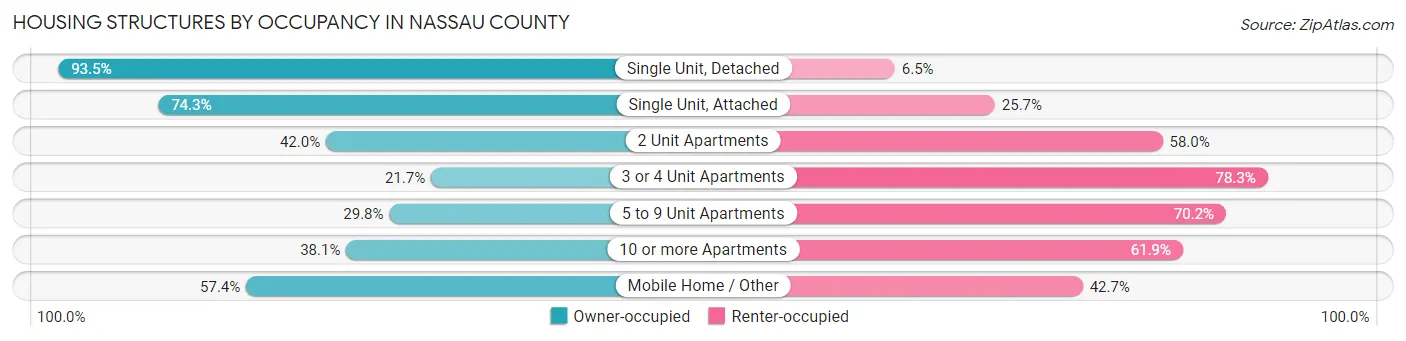
| Structure Type | Owner-occupied | Renter-occupied |
| Single Unit, Detached | 328,233 (93.5%) | 22,745 (6.5%) |
| Single Unit, Attached | 10,320 (74.3%) | 3,578 (25.7%) |
| 2 Unit Apartments | 10,690 (42.0%) | 14,779 (58.0%) |
| 3 or 4 Unit Apartments | 1,818 (21.7%) | 6,544 (78.3%) |
| 5 to 9 Unit Apartments | 2,240 (29.8%) | 5,285 (70.2%) |
| 10 or more Apartments | 17,998 (38.1%) | 29,282 (61.9%) |
| Mobile Home / Other | 722 (57.4%) | 537 (42.6%) |
| Total | 372,021 (81.8%) | 82,750 (18.2%) |
Housing Structures by Number of Rooms in Nassau County
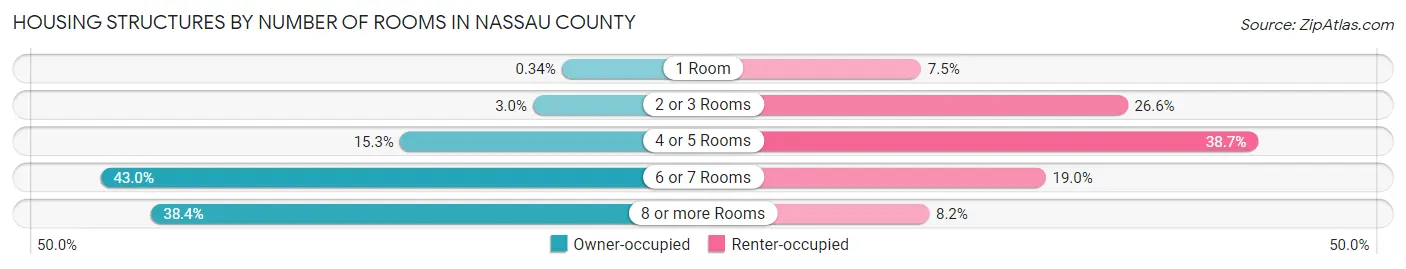
| Number of Rooms | Owner-occupied | Renter-occupied |
| 1 Room | 1,278 (0.3%) | 6,195 (7.5%) |
| 2 or 3 Rooms | 11,164 (3.0%) | 22,006 (26.6%) |
| 4 or 5 Rooms | 56,947 (15.3%) | 31,989 (38.7%) |
| 6 or 7 Rooms | 159,899 (43.0%) | 15,739 (19.0%) |
| 8 or more Rooms | 142,733 (38.4%) | 6,821 (8.2%) |
| Total | 372,021 (100.0%) | 82,750 (100.0%) |
Housing Structure by Heating Type in Nassau County
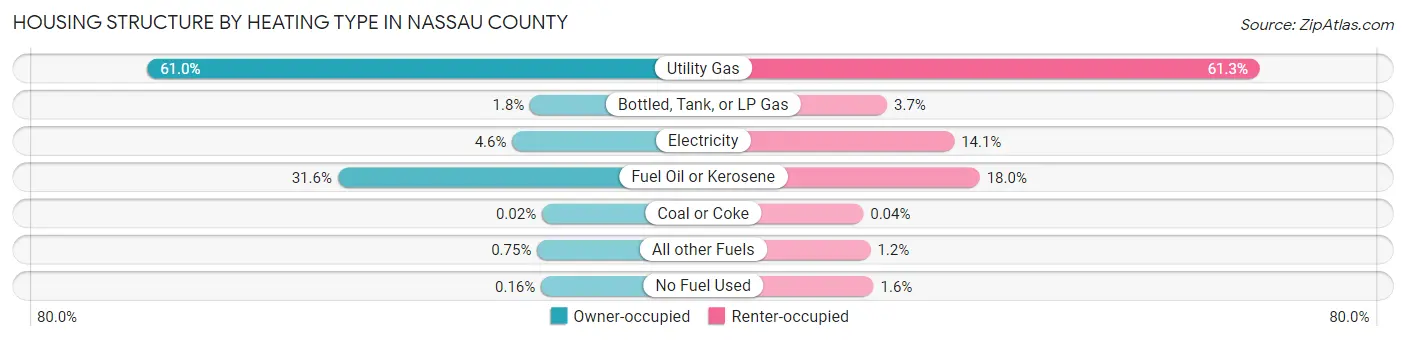
| Heating Type | Owner-occupied | Renter-occupied |
| Utility Gas | 227,097 (61.0%) | 50,746 (61.3%) |
| Bottled, Tank, or LP Gas | 6,829 (1.8%) | 3,082 (3.7%) |
| Electricity | 17,139 (4.6%) | 11,657 (14.1%) |
| Fuel Oil or Kerosene | 117,508 (31.6%) | 14,930 (18.0%) |
| Coal or Coke | 77 (0.0%) | 31 (0.0%) |
| All other Fuels | 2,776 (0.7%) | 955 (1.1%) |
| No Fuel Used | 595 (0.2%) | 1,349 (1.6%) |
| Total | 372,021 (100.0%) | 82,750 (100.0%) |
Household Vehicle Usage in Nassau County
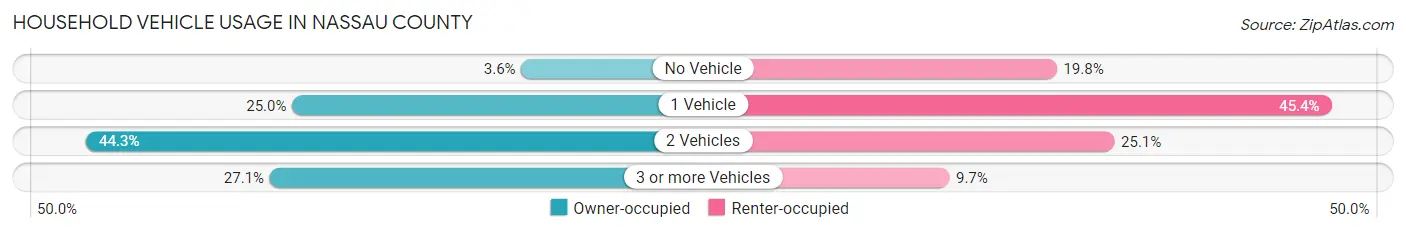
| Vehicles per Household | Owner-occupied | Renter-occupied |
| No Vehicle | 13,466 (3.6%) | 16,341 (19.8%) |
| 1 Vehicle | 93,060 (25.0%) | 37,578 (45.4%) |
| 2 Vehicles | 164,666 (44.3%) | 20,791 (25.1%) |
| 3 or more Vehicles | 100,829 (27.1%) | 8,040 (9.7%) |
| Total | 372,021 (100.0%) | 82,750 (100.0%) |
Real Estate & Mortgages in Nassau County
Real Estate and Mortgage Overview in Nassau County
| Characteristic | Without Mortgage | With Mortgage |
| Housing Units | 137,135 | 234,886 |
| Median Property Value | $617,600 | $642,300 |
| Median Household Income | $116,038 | $140,254 |
| Monthly Housing Costs | $1,501 | $170,097 |
| Real Estate Taxes | $10,001 | $4,648 |
Property Value by Mortgage Status in Nassau County
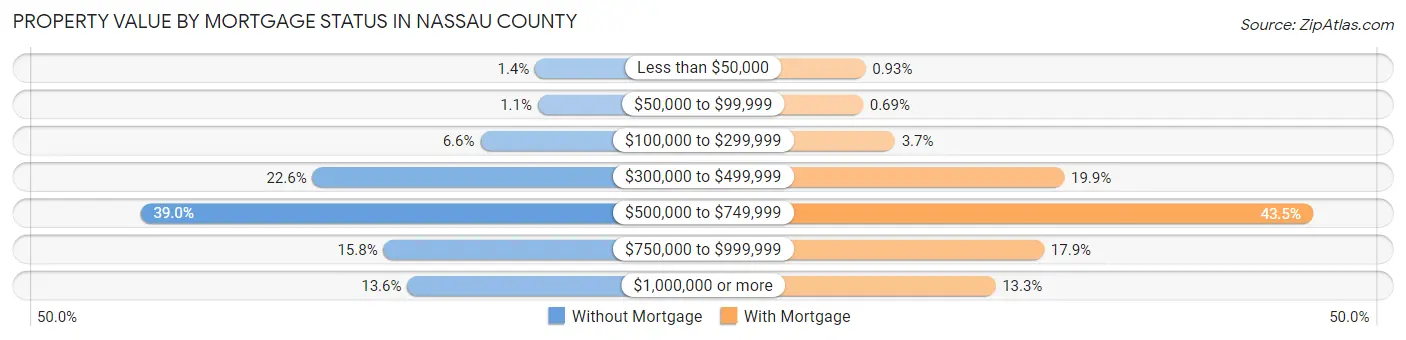
| Property Value | Without Mortgage | With Mortgage |
| Less than $50,000 | 1,887 (1.4%) | 2,195 (0.9%) |
| $50,000 to $99,999 | 1,531 (1.1%) | 1,611 (0.7%) |
| $100,000 to $299,999 | 9,054 (6.6%) | 8,762 (3.7%) |
| $300,000 to $499,999 | 30,962 (22.6%) | 46,652 (19.9%) |
| $500,000 to $749,999 | 53,426 (39.0%) | 102,274 (43.5%) |
| $750,000 to $999,999 | 21,695 (15.8%) | 42,143 (17.9%) |
| $1,000,000 or more | 18,580 (13.6%) | 31,249 (13.3%) |
| Total | 137,135 (100.0%) | 234,886 (100.0%) |
Household Income by Mortgage Status in Nassau County
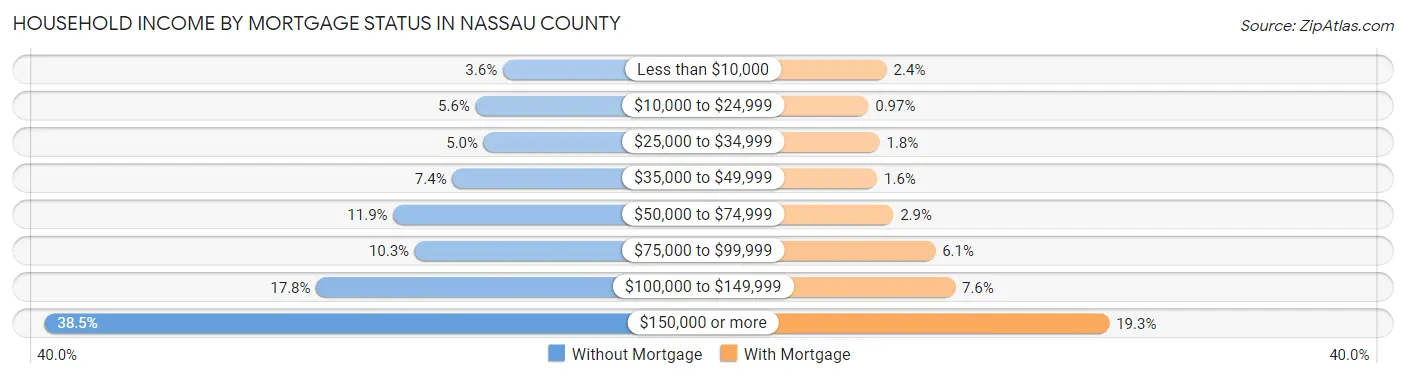
| Household Income | Without Mortgage | With Mortgage |
| Less than $10,000 | 4,870 (3.5%) | 5,577 (2.4%) |
| $10,000 to $24,999 | 7,716 (5.6%) | 2,282 (1.0%) |
| $25,000 to $34,999 | 6,866 (5.0%) | 4,298 (1.8%) |
| $35,000 to $49,999 | 10,146 (7.4%) | 3,846 (1.6%) |
| $50,000 to $74,999 | 16,317 (11.9%) | 6,746 (2.9%) |
| $75,000 to $99,999 | 14,067 (10.3%) | 14,260 (6.1%) |
| $100,000 to $149,999 | 24,368 (17.8%) | 17,801 (7.6%) |
| $150,000 or more | 52,785 (38.5%) | 45,399 (19.3%) |
| Total | 137,135 (100.0%) | 234,886 (100.0%) |
Property Value to Household Income Ratio in Nassau County
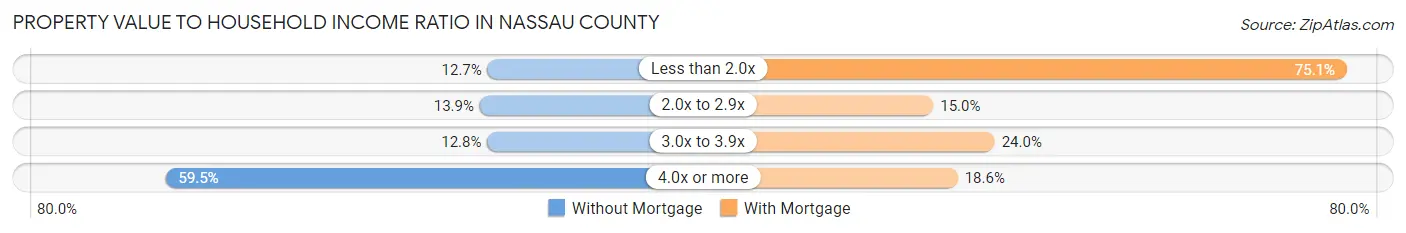
| Value-to-Income Ratio | Without Mortgage | With Mortgage |
| Less than 2.0x | 17,452 (12.7%) | 176,417 (75.1%) |
| 2.0x to 2.9x | 19,016 (13.9%) | 35,281 (15.0%) |
| 3.0x to 3.9x | 17,527 (12.8%) | 56,260 (23.9%) |
| 4.0x or more | 81,656 (59.5%) | 43,621 (18.6%) |
| Total | 137,135 (100.0%) | 234,886 (100.0%) |
Real Estate Taxes by Mortgage Status in Nassau County
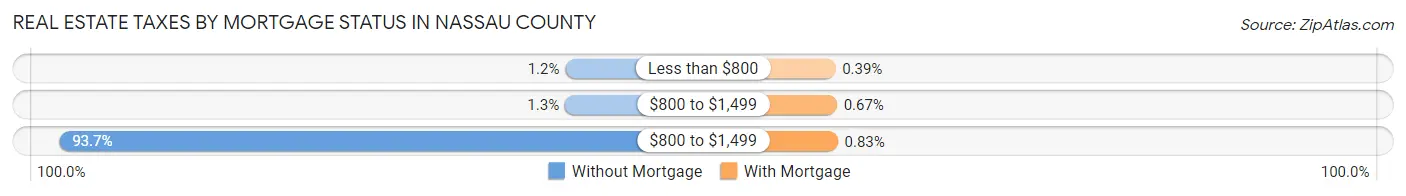
| Property Taxes | Without Mortgage | With Mortgage |
| Less than $800 | 1,702 (1.2%) | 912 (0.4%) |
| $800 to $1,499 | 1,783 (1.3%) | 1,566 (0.7%) |
| $800 to $1,499 | 128,460 (93.7%) | 1,947 (0.8%) |
| Total | 137,135 (100.0%) | 234,886 (100.0%) |
Health & Disability in Nassau County
Health Insurance Coverage by Age in Nassau County
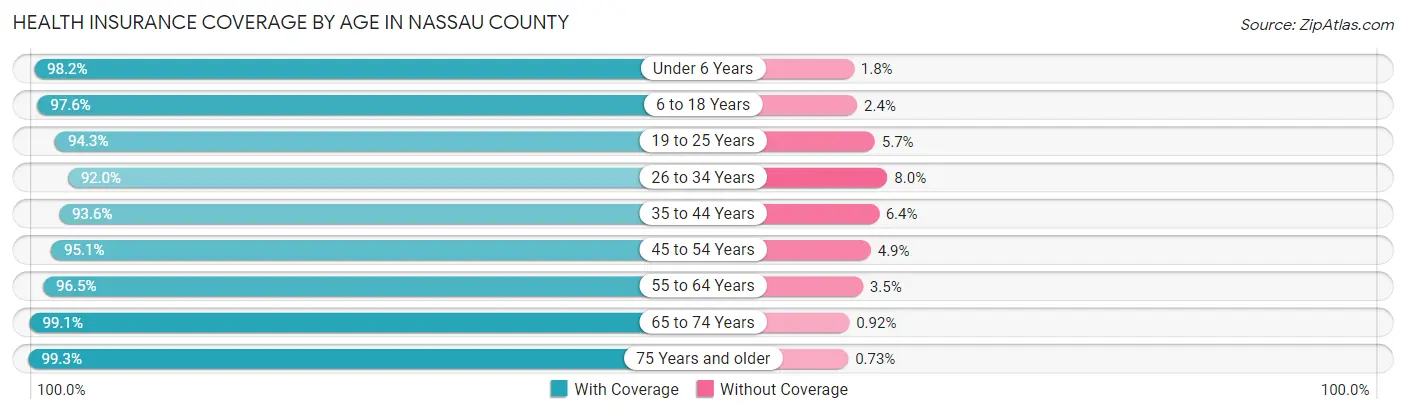
| Age Bracket | With Coverage | Without Coverage |
| Under 6 Years | 88,081 (98.2%) | 1,593 (1.8%) |
| 6 to 18 Years | 219,347 (97.6%) | 5,385 (2.4%) |
| 19 to 25 Years | 112,783 (94.3%) | 6,801 (5.7%) |
| 26 to 34 Years | 134,609 (92.0%) | 11,768 (8.0%) |
| 35 to 44 Years | 159,356 (93.6%) | 10,938 (6.4%) |
| 45 to 54 Years | 177,145 (95.1%) | 9,212 (4.9%) |
| 55 to 64 Years | 191,765 (96.5%) | 6,896 (3.5%) |
| 65 to 74 Years | 139,252 (99.1%) | 1,294 (0.9%) |
| 75 Years and older | 103,701 (99.3%) | 761 (0.7%) |
| Total | 1,326,039 (96.0%) | 54,648 (4.0%) |
Health Insurance Coverage by Citizenship Status in Nassau County
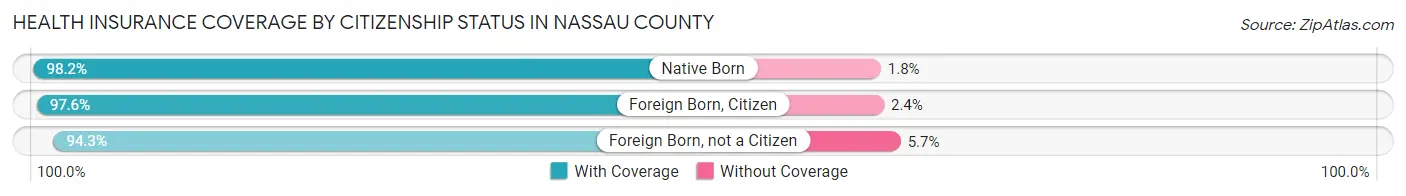
| Citizenship Status | With Coverage | Without Coverage |
| Native Born | 88,081 (98.2%) | 1,593 (1.8%) |
| Foreign Born, Citizen | 219,347 (97.6%) | 5,385 (2.4%) |
| Foreign Born, not a Citizen | 112,783 (94.3%) | 6,801 (5.7%) |
Health Insurance Coverage by Household Income in Nassau County
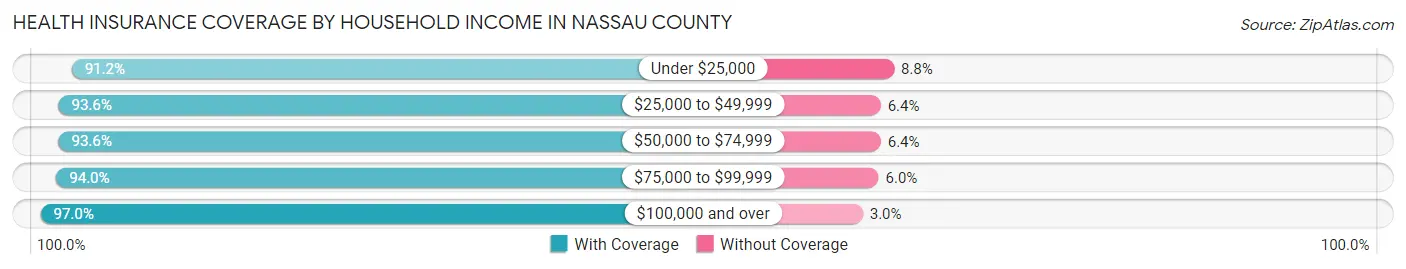
| Household Income | With Coverage | Without Coverage |
| Under $25,000 | 55,642 (91.2%) | 5,393 (8.8%) |
| $25,000 to $49,999 | 81,301 (93.6%) | 5,526 (6.4%) |
| $50,000 to $74,999 | 95,903 (93.6%) | 6,521 (6.4%) |
| $75,000 to $99,999 | 103,660 (94.0%) | 6,568 (6.0%) |
| $100,000 and over | 978,540 (97.0%) | 30,142 (3.0%) |
Public vs Private Health Insurance Coverage by Age in Nassau County
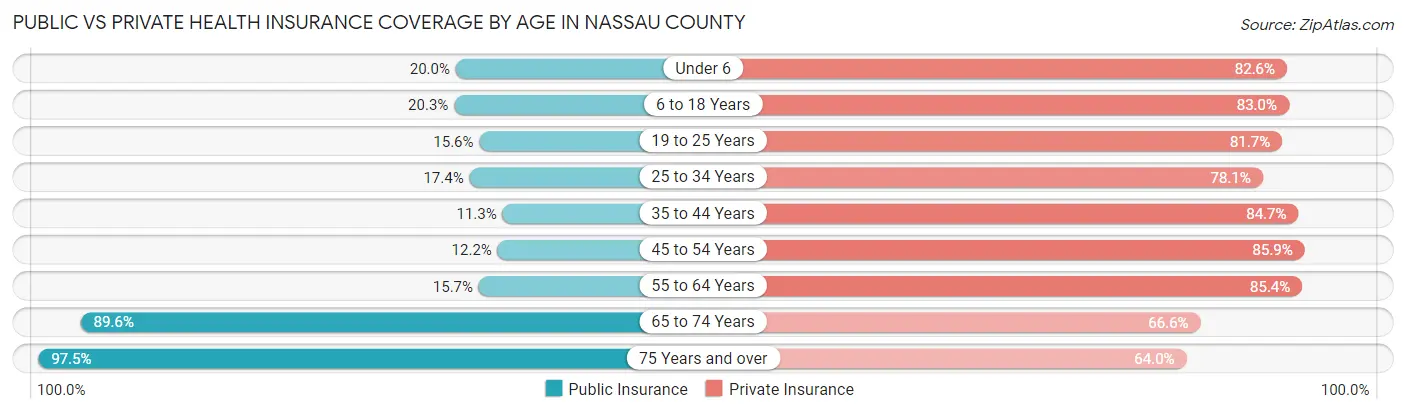
| Age Bracket | Public Insurance | Private Insurance |
| Under 6 | 17,908 (20.0%) | 74,072 (82.6%) |
| 6 to 18 Years | 45,554 (20.3%) | 186,442 (83.0%) |
| 19 to 25 Years | 18,646 (15.6%) | 97,697 (81.7%) |
| 25 to 34 Years | 25,504 (17.4%) | 114,340 (78.1%) |
| 35 to 44 Years | 19,227 (11.3%) | 144,272 (84.7%) |
| 45 to 54 Years | 22,722 (12.2%) | 160,081 (85.9%) |
| 55 to 64 Years | 31,157 (15.7%) | 169,718 (85.4%) |
| 65 to 74 Years | 125,949 (89.6%) | 93,551 (66.6%) |
| 75 Years and over | 101,820 (97.5%) | 66,813 (64.0%) |
| Total | 408,487 (29.6%) | 1,106,986 (80.2%) |
Disability Status by Sex by Age in Nassau County
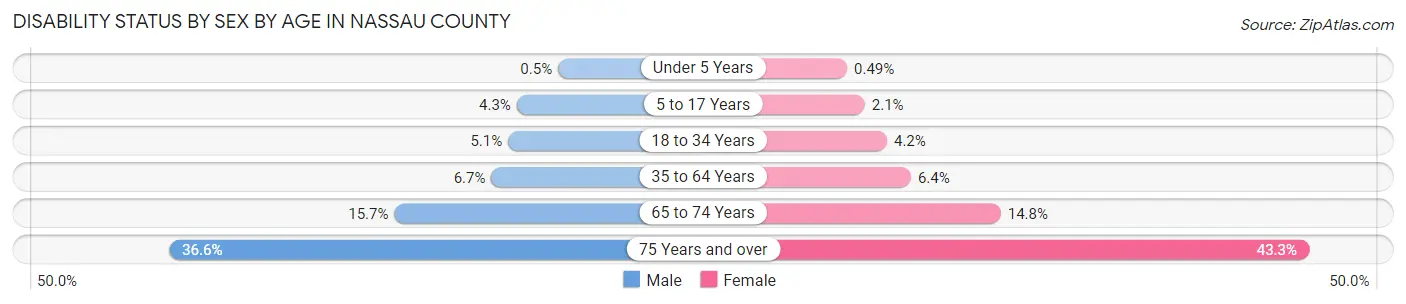
| Age Bracket | Male | Female |
| Under 5 Years | 188 (0.5%) | 176 (0.5%) |
| 5 to 17 Years | 4,989 (4.3%) | 2,325 (2.1%) |
| 18 to 34 Years | 7,377 (5.1%) | 5,841 (4.2%) |
| 35 to 64 Years | 18,357 (6.7%) | 18,031 (6.4%) |
| 65 to 74 Years | 10,456 (15.7%) | 10,907 (14.8%) |
| 75 Years and over | 15,275 (36.6%) | 27,180 (43.3%) |
Disability Class by Sex by Age in Nassau County
Disability Class: Hearing Difficulty
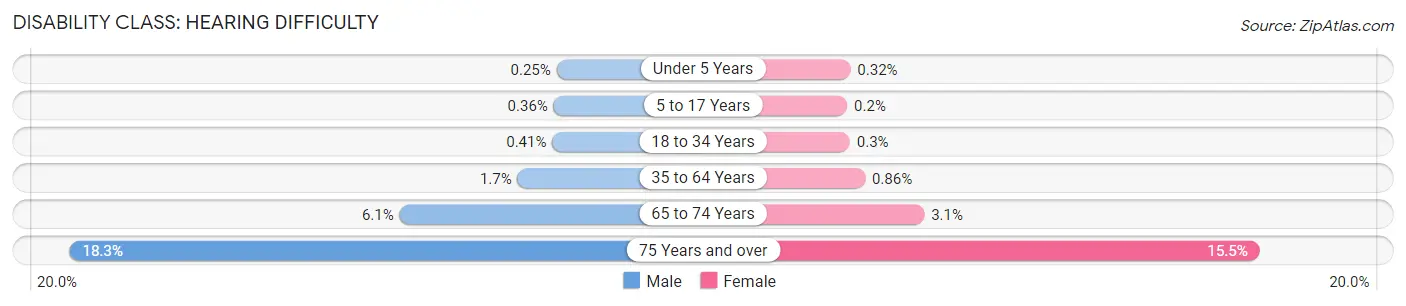
| Age Bracket | Male | Female |
| Under 5 Years | 93 (0.3%) | 116 (0.3%) |
| 5 to 17 Years | 413 (0.4%) | 215 (0.2%) |
| 18 to 34 Years | 585 (0.4%) | 413 (0.3%) |
| 35 to 64 Years | 4,665 (1.7%) | 2,415 (0.9%) |
| 65 to 74 Years | 4,049 (6.1%) | 2,259 (3.1%) |
| 75 Years and over | 7,655 (18.3%) | 9,726 (15.5%) |
Disability Class: Vision Difficulty
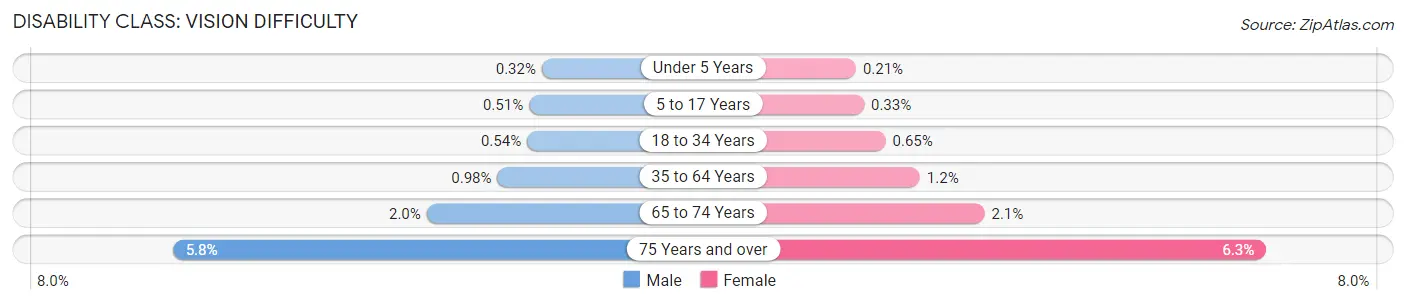
| Age Bracket | Male | Female |
| Under 5 Years | 121 (0.3%) | 77 (0.2%) |
| 5 to 17 Years | 589 (0.5%) | 354 (0.3%) |
| 18 to 34 Years | 772 (0.5%) | 908 (0.6%) |
| 35 to 64 Years | 2,696 (1.0%) | 3,258 (1.2%) |
| 65 to 74 Years | 1,351 (2.0%) | 1,569 (2.1%) |
| 75 Years and over | 2,421 (5.8%) | 3,948 (6.3%) |
Disability Class: Cognitive Difficulty
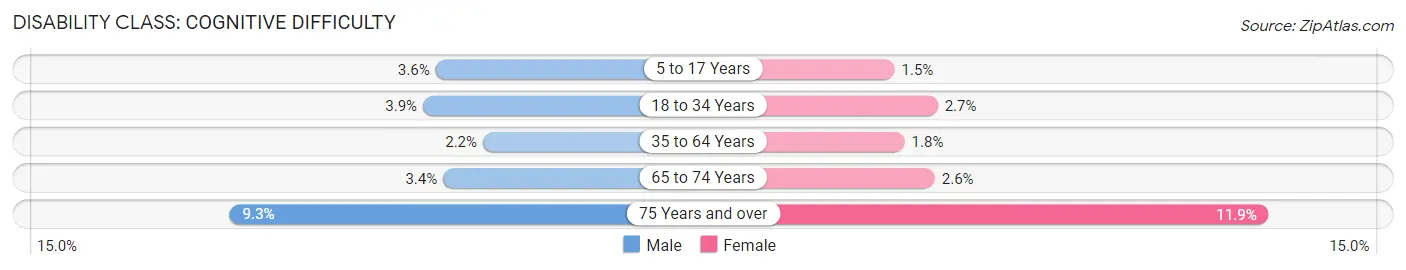
| Age Bracket | Male | Female |
| 5 to 17 Years | 4,096 (3.6%) | 1,600 (1.5%) |
| 18 to 34 Years | 5,617 (3.9%) | 3,716 (2.7%) |
| 35 to 64 Years | 6,132 (2.2%) | 4,912 (1.8%) |
| 65 to 74 Years | 2,235 (3.4%) | 1,916 (2.6%) |
| 75 Years and over | 3,880 (9.3%) | 7,449 (11.9%) |
Disability Class: Ambulatory Difficulty
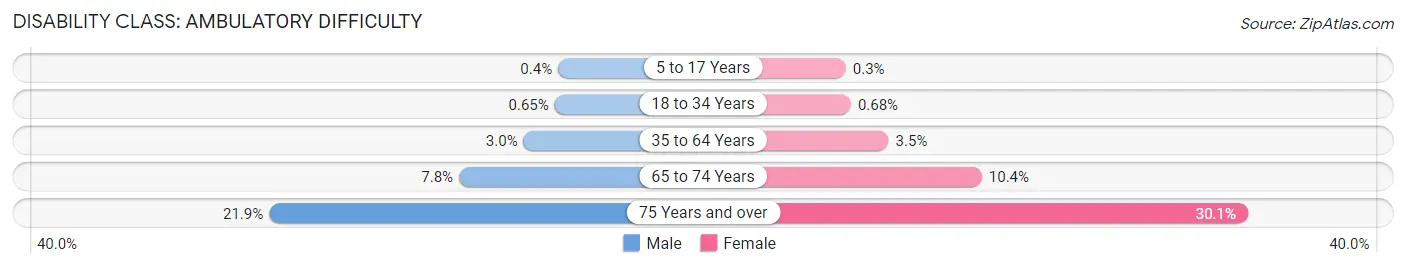
| Age Bracket | Male | Female |
| 5 to 17 Years | 459 (0.4%) | 321 (0.3%) |
| 18 to 34 Years | 930 (0.6%) | 949 (0.7%) |
| 35 to 64 Years | 8,116 (3.0%) | 9,780 (3.5%) |
| 65 to 74 Years | 5,166 (7.7%) | 7,685 (10.4%) |
| 75 Years and over | 9,122 (21.8%) | 18,897 (30.1%) |
Disability Class: Self-Care Difficulty
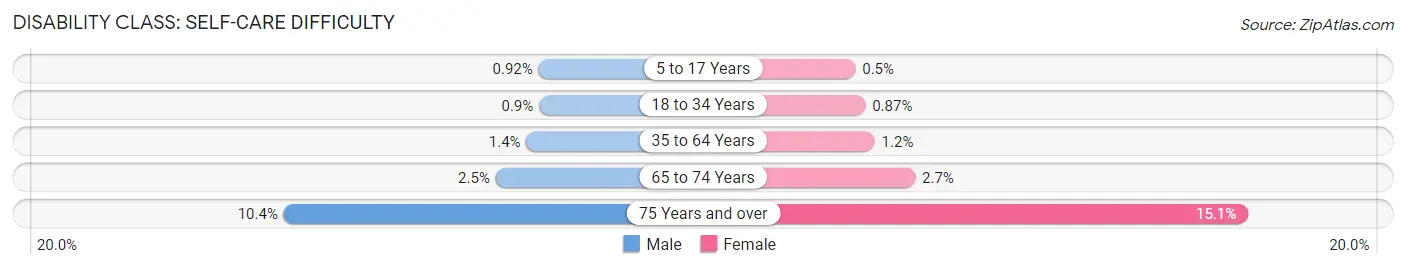
| Age Bracket | Male | Female |
| 5 to 17 Years | 1,063 (0.9%) | 544 (0.5%) |
| 18 to 34 Years | 1,301 (0.9%) | 1,212 (0.9%) |
| 35 to 64 Years | 3,762 (1.4%) | 3,439 (1.2%) |
| 65 to 74 Years | 1,674 (2.5%) | 2,011 (2.7%) |
| 75 Years and over | 4,335 (10.4%) | 9,456 (15.1%) |
Technology Access in Nassau County
Computing Device Access in Nassau County
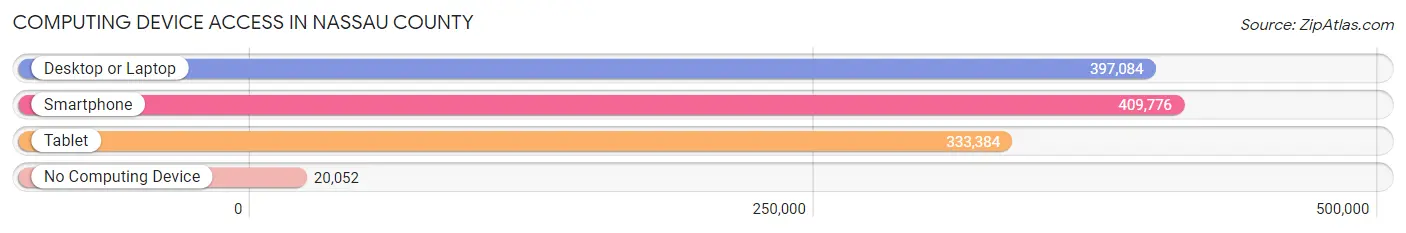
| Device Type | # Households | % Households |
| Desktop or Laptop | 397,084 | 87.3% |
| Smartphone | 409,776 | 90.1% |
| Tablet | 333,384 | 73.3% |
| No Computing Device | 20,052 | 4.4% |
| Total | 454,771 | 100.0% |
Internet Access in Nassau County
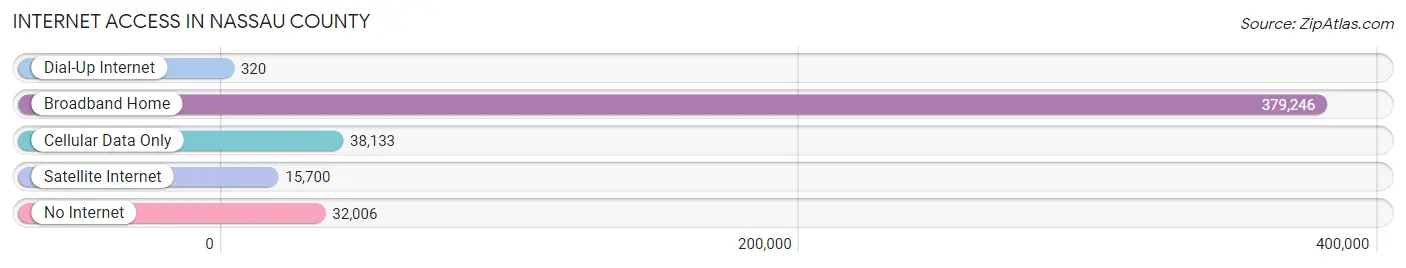
| Internet Type | # Households | % Households |
| Dial-Up Internet | 320 | 0.1% |
| Broadband Home | 379,246 | 83.4% |
| Cellular Data Only | 38,133 | 8.4% |
| Satellite Internet | 15,700 | 3.5% |
| No Internet | 32,006 | 7.0% |
| Total | 454,771 | 100.0% |
Nassau County Summary
Nassau County is a county located in the U.S. state of New York. It is located on the western end of Long Island, just east of New York City. Nassau County is the most populous county in the state of New York, with an estimated population of 1,358,924 in 2019. The county seat is Mineola.
History
Nassau County was established in 1899, when the New York State Legislature divided Queens County into two counties: Queens and Nassau. The name Nassau is derived from the Dutch city of Nassau, which was once the capital of the Dutch colony of New Netherland.
Nassau County was originally part of Queens County, which was established in 1683. The area that is now Nassau County was originally inhabited by the Matinecock Native American tribe. The first European settlers arrived in the area in the 1640s.
In the late 19th century, Nassau County was a popular destination for wealthy New Yorkers looking to escape the hustle and bustle of the city. The county was home to many grand estates and mansions, and was known as the "Gold Coast" of Long Island.
Geography
Nassau County covers an area of 437 square miles, making it the second-largest county in New York State. The county is located on the western end of Long Island, just east of New York City. It is bordered by Suffolk County to the east, Queens County to the west, and the Atlantic Ocean to the south.
The county is divided into three towns: Hempstead, North Hempstead, and Oyster Bay. The county also includes two cities: Long Beach and Glen Cove.
The county is home to several parks and nature preserves, including Jones Beach State Park, Hempstead Lake State Park, and the Nassau County Nature Preserve.
Economy
Nassau County has a diverse economy, with a mix of industries including manufacturing, finance, healthcare, retail, and tourism. The county is home to several major employers, including Northwell Health, Cablevision, and the Nassau County government.
The county is also home to several major shopping centers, including Roosevelt Field Mall, The Source Mall, and the Americana Manhasset.
Demographics
As of the 2019 census, Nassau County had an estimated population of 1,358,924. The population is racially and ethnically diverse, with the largest racial/ethnic groups being White (62.2%), Hispanic or Latino (17.3%), and Black or African American (13.2%).
The median household income in Nassau County is $105,845, and the median home value is $521,400. The county has a high rate of homeownership, with 73.3% of households owning their own homes.
Conclusion
Nassau County is a vibrant and diverse county located on the western end of Long Island, just east of New York City. The county has a rich history, and is home to a diverse economy and population. With its many parks and nature preserves, shopping centers, and major employers, Nassau County is an attractive place to live and work.
Common Questions
What is Per Capita Income in Nassau County?
Per Capita income in Nassau County is $60,456.
What is the Median Family Income in Nassau County?
Median Family Income in Nassau County is $159,334.
What is the Median Household income in Nassau County?
Median Household Income in Nassau County is $137,709.
What is Income or Wage Gap in Nassau County?
Income or Wage Gap in Nassau County is 30.9%.
Women in Nassau County earn 69.1 cents for every dollar earned by a man.
What is Family Income Deficit in Nassau County?
Family Income Deficit in Nassau County is $11,315.
Families that are below poverty line in Nassau County earn $11,315 less on average than the poverty threshold level.
What is Inequality or Gini Index in Nassau County?
Inequality or Gini Index in Nassau County is 0.45.
What is the Total Population of Nassau County?
Total Population of Nassau County is 1,389,160.
What is the Total Male Population of Nassau County?
Total Male Population of Nassau County is 683,660.
What is the Total Female Population of Nassau County?
Total Female Population of Nassau County is 705,500.
What is the Ratio of Males per 100 Females in Nassau County?
There are 96.90 Males per 100 Females in Nassau County.
What is the Ratio of Females per 100 Males in Nassau County?
There are 103.19 Females per 100 Males in Nassau County.
What is the Median Population Age in Nassau County?
Median Population Age in Nassau County is 41.7 Years.
What is the Average Family Size in Nassau County
Average Family Size in Nassau County is 3.5 People.
What is the Average Household Size in Nassau County
Average Household Size in Nassau County is 3.0 People.
How Large is the Labor Force in Nassau County?
There are 739,959 People in the Labor Forcein in Nassau County.
What is the Percentage of People in the Labor Force in Nassau County?
65.6% of People are in the Labor Force in Nassau County.
What is the Unemployment Rate in Nassau County?
Unemployment Rate in Nassau County is 4.6%.