Area Code 631 Map & Demographics
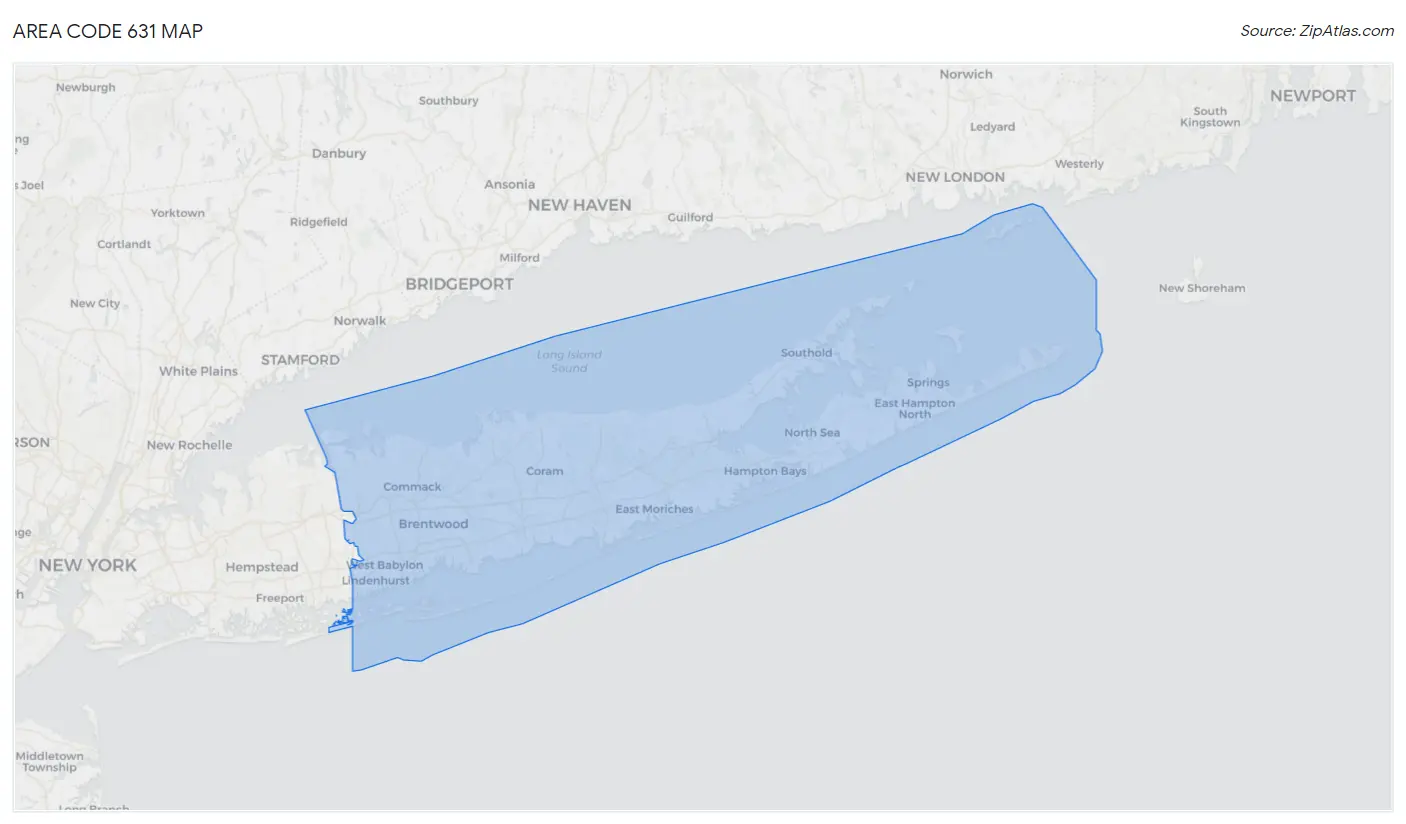
Area Code 631 Map
Area Code 631 Overview
$62,618
PER CAPITA INCOME
$153,497
AVG FAMILY INCOME
$130,604
AVG HOUSEHOLD INCOME
31.9%
WAGE / INCOME GAP [ % ]
68.1¢/ $1
WAGE / INCOME GAP [ $ ]
$9,864
FAMILY INCOME DEFICIT
50.29
INEQUALITY / GINI INDEX
1,886,912
TOTAL POPULATION
936,075
MALE POPULATION
950,837
FEMALE POPULATION
98.45
MALES / 100 FEMALES
101.58
FEMALES / 100 MALES
44.5
MEDIAN AGE
3.2
AVG FAMILY SIZE
2.7
AVG HOUSEHOLD SIZE
981,649
LABOR FORCE [ PEOPLE ]
63.5%
PERCENT IN LABOR FORCE
4.9%
UNEMPLOYMENT RATE
Income in Area Code 631
Income Overview in Area Code 631
Per Capita Income in Area Code 631 is $62,618, while median incomes of families and households are $153,497 and $130,604 respectively.
| Characteristic | Number | Measure |
| Per Capita Income | 1,886,912 | $62,618 |
| Median Family Income | 464,590 | $153,497 |
| Mean Family Income | 464,590 | $22,527,567 |
| Median Household Income | 629,905 | $130,604 |
| Mean Household Income | 629,905 | $19,834,671 |
| Income Deficit | 464,590 | $9,864 |
| Wage / Income Gap (%) | 1,886,912 | 31.93% |
| Wage / Income Gap ($) | 1,886,912 | 68.07¢ per $1 |
| Gini / Inequality Index | 1,886,912 | 50.29 |
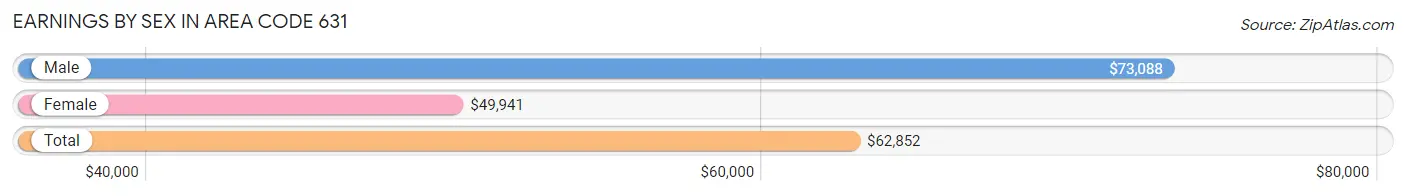
Earnings by Sex in Area Code 631
Average Earnings in Area Code 631 are $62,852, $73,088 for men and $49,941 for women, a difference of 31.7%.
| Sex | Number | Average Earnings |
| Male | 555,761 (52.9%) | $73,088 |
| Female | 494,764 (47.1%) | $49,941 |
| Total | 1,050,525 (100.0%) | $62,852 |
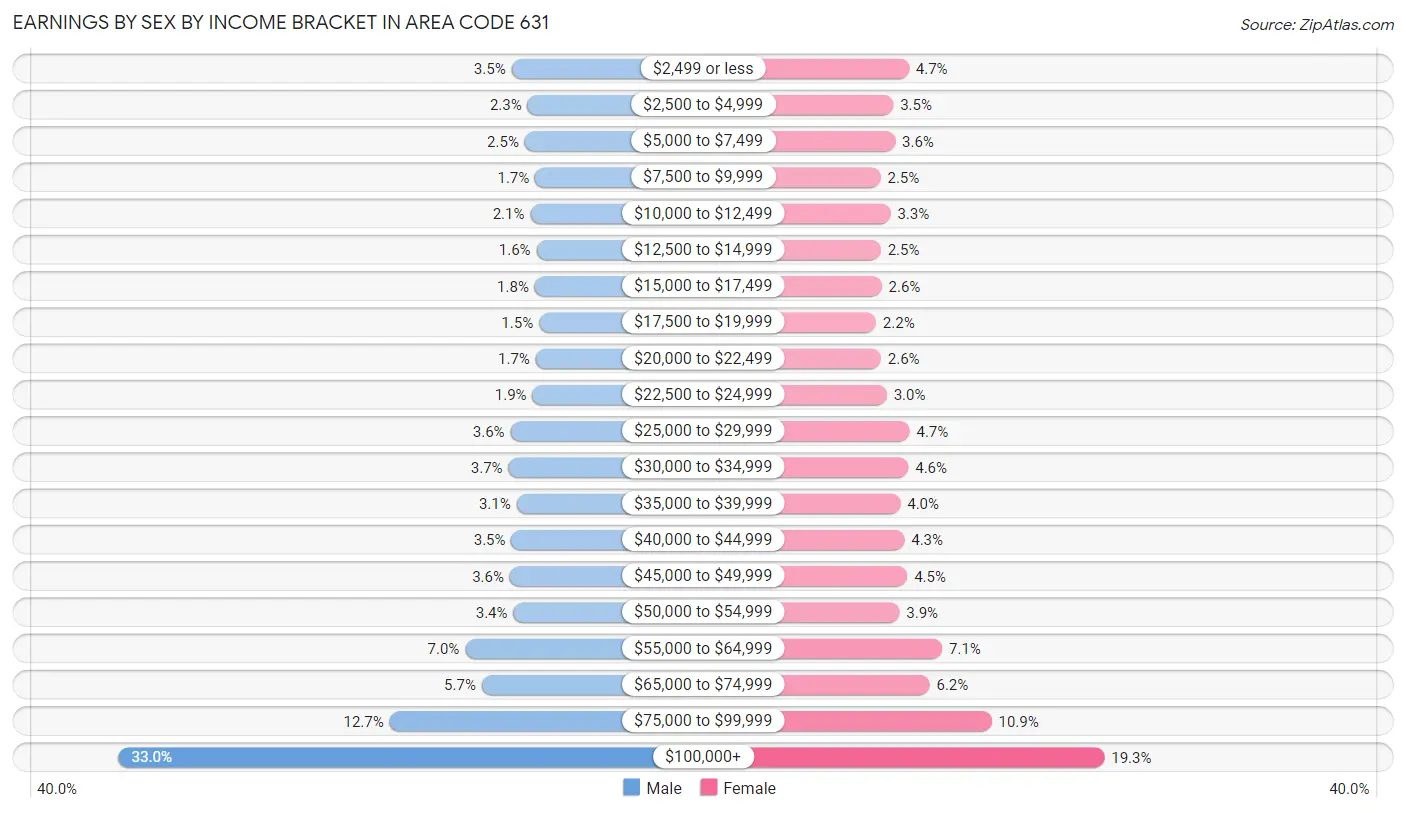
Earnings by Sex by Income Bracket in Area Code 631
The most common earnings brackets in Area Code 631 are $100,000+ for men (183,116 | 33.0%) and $100,000+ for women (95,466 | 19.3%).
| Income | Male | Female |
| $2,499 or less | 19,512 (3.5%) | 22,996 (4.6%) |
| $2,500 to $4,999 | 12,818 (2.3%) | 17,233 (3.5%) |
| $5,000 to $7,499 | 14,007 (2.5%) | 17,922 (3.6%) |
| $7,500 to $9,999 | 9,693 (1.7%) | 12,495 (2.5%) |
| $10,000 to $12,499 | 11,675 (2.1%) | 16,167 (3.3%) |
| $12,500 to $14,999 | 9,137 (1.6%) | 12,557 (2.5%) |
| $15,000 to $17,499 | 9,852 (1.8%) | 12,889 (2.6%) |
| $17,500 to $19,999 | 8,049 (1.5%) | 10,791 (2.2%) |
| $20,000 to $22,499 | 9,447 (1.7%) | 12,622 (2.5%) |
| $22,500 to $24,999 | 10,772 (1.9%) | 14,806 (3.0%) |
| $25,000 to $29,999 | 19,976 (3.6%) | 23,231 (4.7%) |
| $30,000 to $34,999 | 20,772 (3.7%) | 22,810 (4.6%) |
| $35,000 to $39,999 | 17,385 (3.1%) | 19,816 (4.0%) |
| $40,000 to $44,999 | 19,543 (3.5%) | 21,329 (4.3%) |
| $45,000 to $49,999 | 20,249 (3.6%) | 22,423 (4.5%) |
| $50,000 to $54,999 | 18,716 (3.4%) | 19,490 (3.9%) |
| $55,000 to $64,999 | 38,815 (7.0%) | 35,338 (7.1%) |
| $65,000 to $74,999 | 31,915 (5.7%) | 30,689 (6.2%) |
| $75,000 to $99,999 | 70,312 (12.7%) | 53,694 (10.8%) |
| $100,000+ | 183,116 (33.0%) | 95,466 (19.3%) |
| Total | 555,761 (100.0%) | 494,764 (100.0%) |
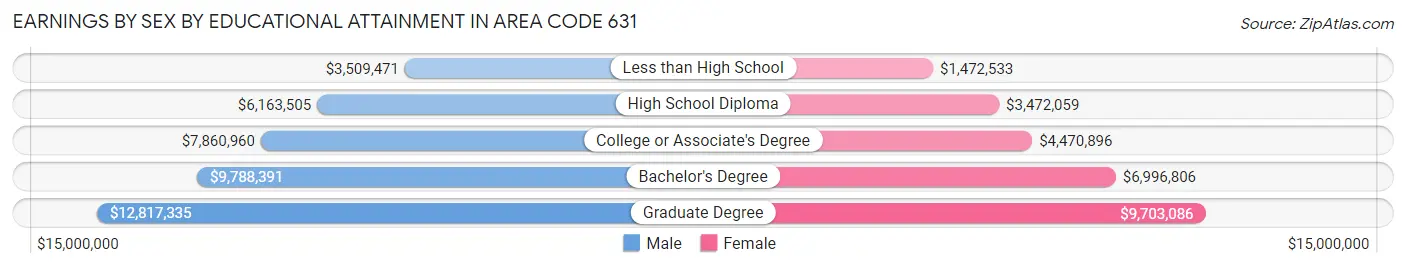
Earnings by Sex by Educational Attainment in Area Code 631
Average earnings in Area Code 631 are $9,458,756 for men and $6,620,604 for women, a difference of 30.0%. Men with an educational attainment of graduate degree enjoy the highest average annual earnings of $12,817,335, while those with less than high school education earn the least with $3,509,471. Women with an educational attainment of graduate degree earn the most with the average annual earnings of $9,703,086, while those with less than high school education have the smallest earnings of $1,472,533.
| Educational Attainment | Male Income | Female Income |
| Less than High School | $3,509,471 | $1,472,533 |
| High School Diploma | $6,163,505 | $3,472,059 |
| College or Associate's Degree | $7,860,960 | $4,470,896 |
| Bachelor's Degree | $9,788,391 | $6,996,806 |
| Graduate Degree | $12,817,335 | $9,703,086 |
| Total | $9,458,756 | $6,620,604 |
Family Income in Area Code 631
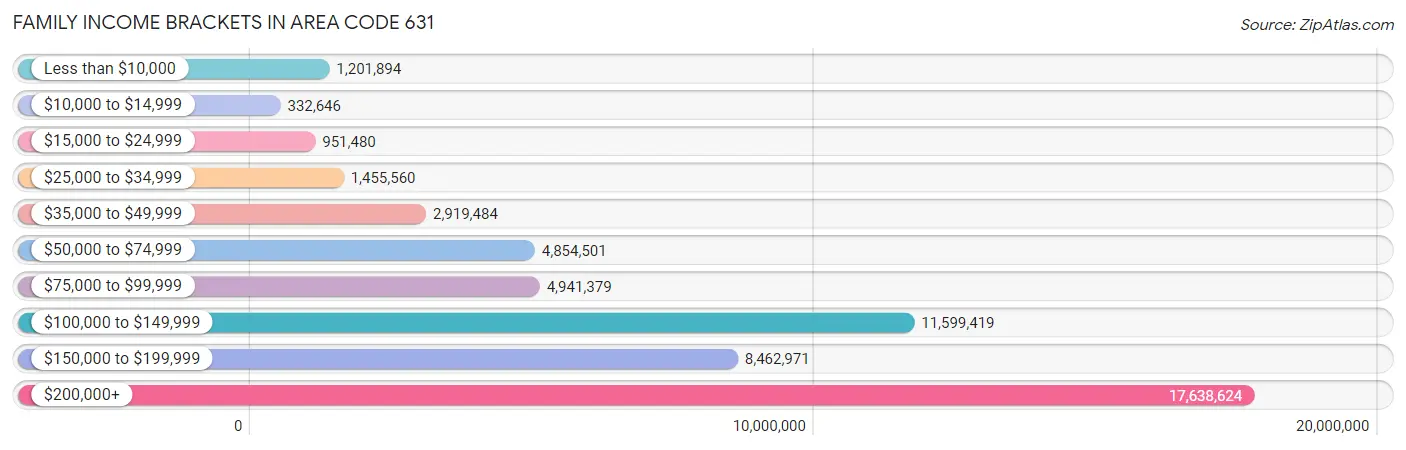
Family Income Brackets in Area Code 631
According to the Area Code 631 family income data, there are 17,638,624 families falling into the $200,000+ income range, which is the most common income bracket and makes up 3,796.6% of all families. Conversely, the $10,000 to $14,999 income bracket is the least frequent group with only 332,646 families (71.6%) belonging to this category.
| Income Bracket | # Families | % Families |
| Less than $10,000 | 1,201,894 | 258.7% |
| $10,000 to $14,999 | 332,646 | 71.6% |
| $15,000 to $24,999 | 951,480 | 204.8% |
| $25,000 to $34,999 | 1,455,560 | 313.3% |
| $35,000 to $49,999 | 2,919,484 | 628.4% |
| $50,000 to $74,999 | 4,854,501 | 1,044.9% |
| $75,000 to $99,999 | 4,941,379 | 1,063.6% |
| $100,000 to $149,999 | 11,599,419 | 2,496.7% |
| $150,000 to $199,999 | 8,462,971 | 1,821.6% |
| $200,000+ | 17,638,624 | 3,796.6% |
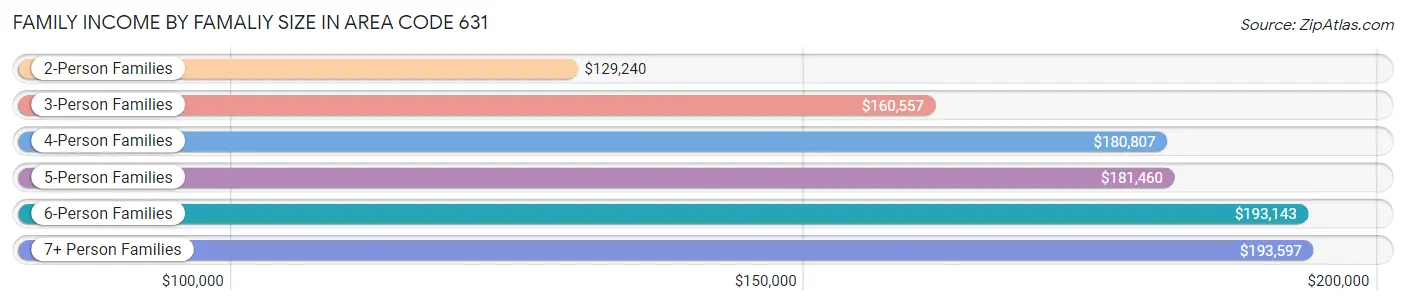
Family Income by Famaliy Size in Area Code 631
7+ person families (10,753 | 2.3%) account for the highest median family income in Area Code 631 with $193,597 per family, while 2-person families (176,975 | 38.1%) have the highest median income of $64,620 per family member.
| Income Bracket | # Families | Median Income |
| 2-Person Families | 176,975 (38.1%) | $129,240 |
| 3-Person Families | 110,492 (23.8%) | $160,557 |
| 4-Person Families | 105,388 (22.7%) | $180,807 |
| 5-Person Families | 45,533 (9.8%) | $181,460 |
| 6-Person Families | 15,449 (3.3%) | $193,143 |
| 7+ Person Families | 10,753 (2.3%) | $193,597 |
| Total | 464,590 (100.0%) | $153,497 |
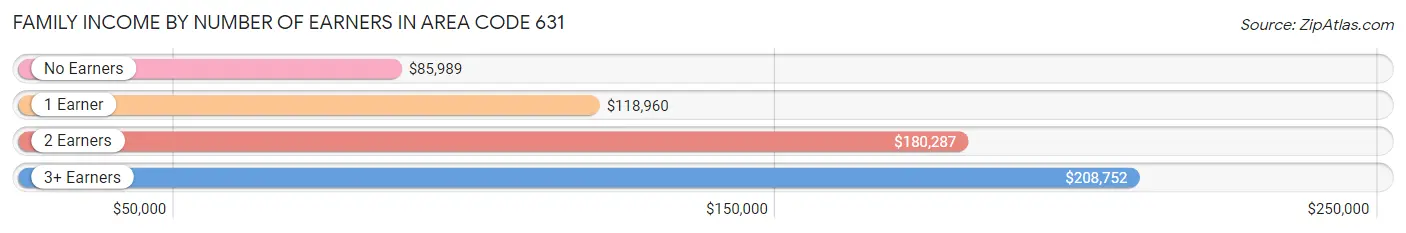
Family Income by Number of Earners in Area Code 631
The median family income in Area Code 631 is $153,497, with families comprising 3+ earners (93,213) having the highest median family income of $208,752, while families with no earners (56,715) have the lowest median family income of $85,989, accounting for 20.1% and 12.2% of families, respectively.
| Number of Earners | # Families | Median Income |
| No Earners | 56,715 (12.2%) | $85,989 |
| 1 Earner | 115,214 (24.8%) | $118,960 |
| 2 Earners | 199,448 (42.9%) | $180,287 |
| 3+ Earners | 93,213 (20.1%) | $208,752 |
| Total | 464,590 (100.0%) | $153,497 |
Household Income in Area Code 631
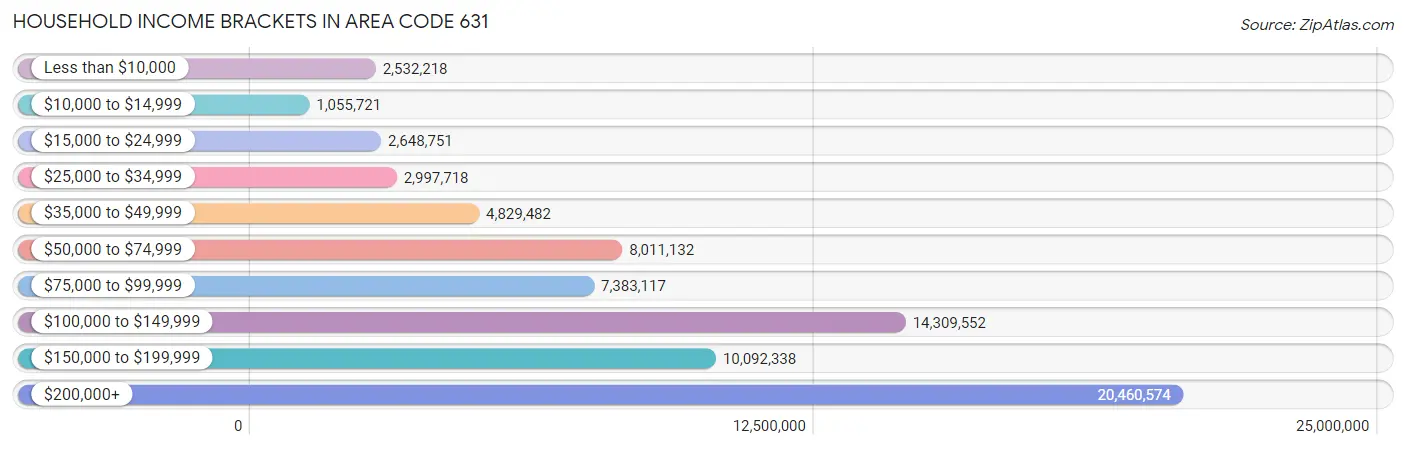
Household Income Brackets in Area Code 631
With 20,460,574 households falling in the category, the $200,000+ income range is the most frequent in Area Code 631, accounting for 3,248.2% of all households. In contrast, only 1,055,721 households (167.6%) fall into the $10,000 to $14,999 income bracket, making it the least populous group.
| Income Bracket | # Households | % Households |
| Less than $10,000 | 2,532,218 | 402.0% |
| $10,000 to $14,999 | 1,055,721 | 167.6% |
| $15,000 to $24,999 | 2,648,751 | 420.5% |
| $25,000 to $34,999 | 2,997,718 | 475.9% |
| $35,000 to $49,999 | 4,829,482 | 766.7% |
| $50,000 to $74,999 | 8,011,132 | 1,271.8% |
| $75,000 to $99,999 | 7,383,117 | 1,172.1% |
| $100,000 to $149,999 | 14,309,552 | 2,271.7% |
| $150,000 to $199,999 | 10,092,338 | 1,602.2% |
| $200,000+ | 20,460,574 | 3,248.2% |
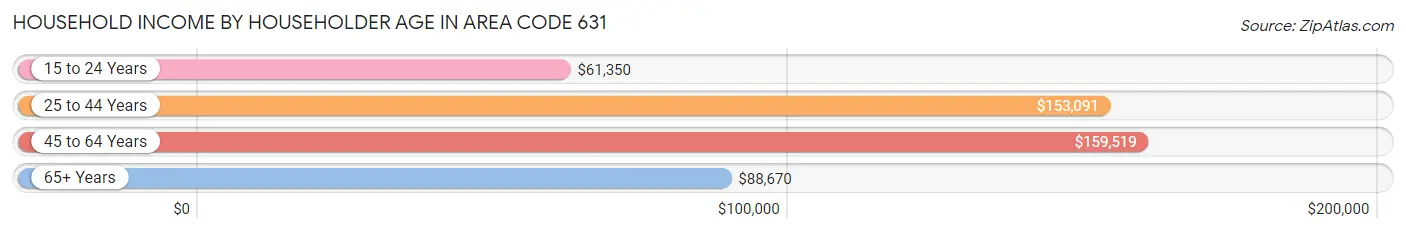
Household Income by Householder Age in Area Code 631
The median household income in Area Code 631 is $130,604, with the highest median household income of $159,519 found in the 45 to 64 years age bracket for the primary householder. A total of 279,657 households (44.4%) fall into this category. Meanwhile, the 15 to 24 years age bracket for the primary householder has the lowest median household income of $61,350, with 6,098 households (1.0%) in this group.
| Income Bracket | # Households | Median Income |
| 15 to 24 Years | 6,098 (1.0%) | $61,350 |
| 25 to 44 Years | 150,199 (23.8%) | $153,091 |
| 45 to 64 Years | 279,657 (44.4%) | $159,519 |
| 65+ Years | 193,951 (30.8%) | $88,670 |
| Total | 629,905 (100.0%) | $130,604 |
Poverty in Area Code 631
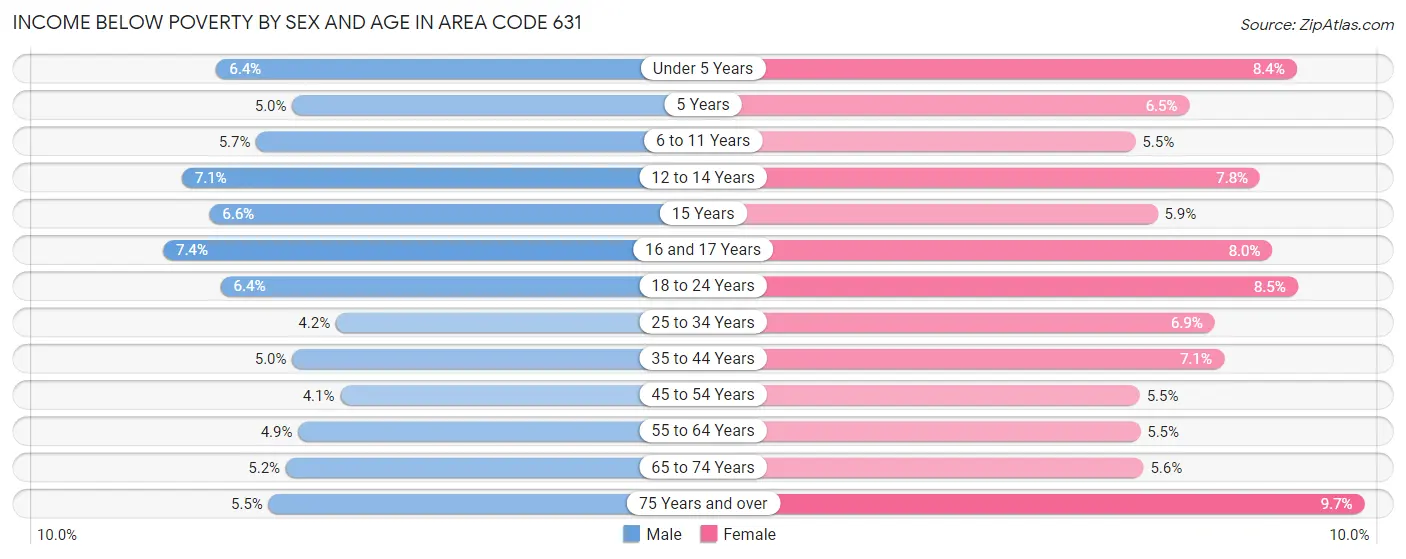
Income Below Poverty by Sex and Age in Area Code 631
With 5.2% poverty level for males and 6.8% for females among the residents of Area Code 631, 16 and 17 year old males and 75 year old and over females are the most vulnerable to poverty, with 1,917 males (7.4%) and 7,934 females (9.7%) in their respective age groups living below the poverty level.
| Age Bracket | Male | Female |
| Under 5 Years | 3,118 (6.4%) | 3,904 (8.4%) |
| 5 Years | 469 (5.0%) | 606 (6.5%) |
| 6 to 11 Years | 3,679 (5.7%) | 3,324 (5.4%) |
| 12 to 14 Years | 2,517 (7.1%) | 2,675 (7.8%) |
| 15 Years | 809 (6.6%) | 652 (5.9%) |
| 16 and 17 Years | 1,917 (7.4%) | 1,993 (8.0%) |
| 18 to 24 Years | 5,269 (6.4%) | 6,639 (8.5%) |
| 25 to 34 Years | 4,808 (4.2%) | 7,461 (6.9%) |
| 35 to 44 Years | 5,757 (5.0%) | 7,772 (7.1%) |
| 45 to 54 Years | 5,407 (4.1%) | 7,182 (5.5%) |
| 55 to 64 Years | 6,882 (4.9%) | 7,842 (5.5%) |
| 65 to 74 Years | 4,551 (5.1%) | 5,489 (5.6%) |
| 75 Years and over | 3,062 (5.5%) | 7,934 (9.7%) |
| Total | 48,245 (5.2%) | 63,473 (6.8%) |
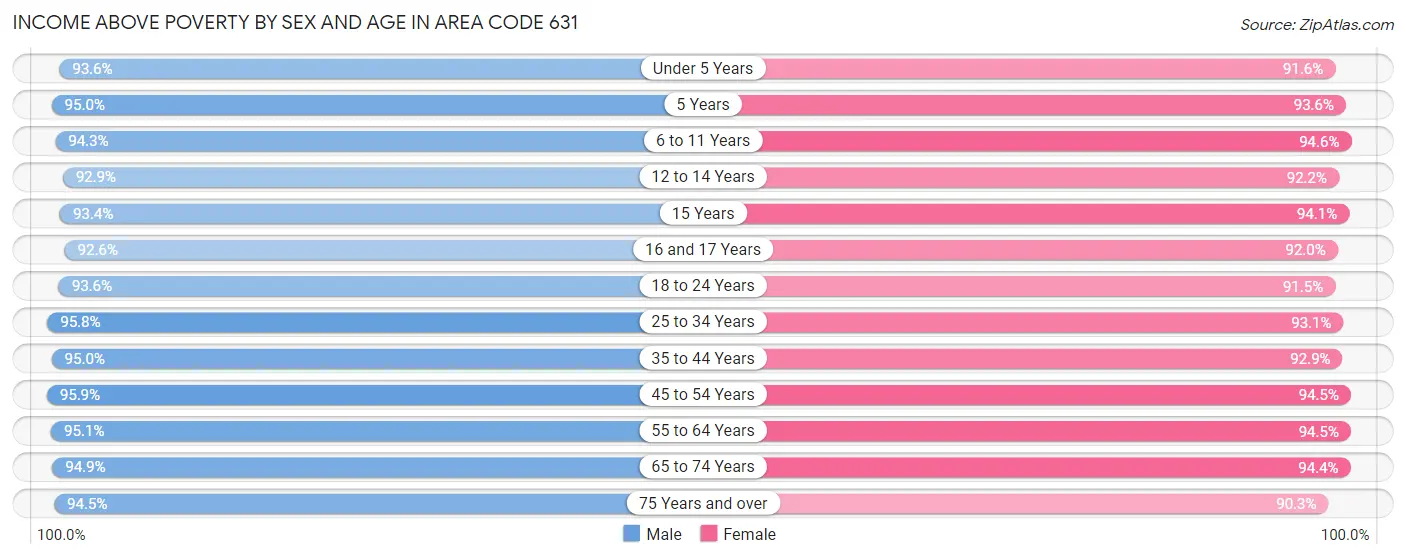
Income Above Poverty by Sex and Age in Area Code 631
According to the poverty statistics in Area Code 631, males aged 45 to 54 years and females aged 6 to 11 years are the age groups that are most secure financially, with 95.9% of males and 94.6% of females in these age groups living above the poverty line.
| Age Bracket | Male | Female |
| Under 5 Years | 45,325 (93.6%) | 42,378 (91.6%) |
| 5 Years | 8,847 (95.0%) | 8,792 (93.5%) |
| 6 to 11 Years | 60,899 (94.3%) | 57,671 (94.6%) |
| 12 to 14 Years | 33,041 (92.9%) | 31,804 (92.2%) |
| 15 Years | 11,500 (93.4%) | 10,474 (94.1%) |
| 16 and 17 Years | 23,899 (92.6%) | 22,965 (92.0%) |
| 18 to 24 Years | 77,563 (93.6%) | 71,879 (91.5%) |
| 25 to 34 Years | 109,067 (95.8%) | 100,390 (93.1%) |
| 35 to 44 Years | 108,672 (95.0%) | 101,783 (92.9%) |
| 45 to 54 Years | 125,316 (95.9%) | 122,801 (94.5%) |
| 55 to 64 Years | 132,868 (95.1%) | 133,720 (94.5%) |
| 65 to 74 Years | 83,882 (94.9%) | 92,482 (94.4%) |
| 75 Years and over | 52,943 (94.5%) | 73,822 (90.3%) |
| Total | 873,822 (94.8%) | 870,961 (93.2%) |
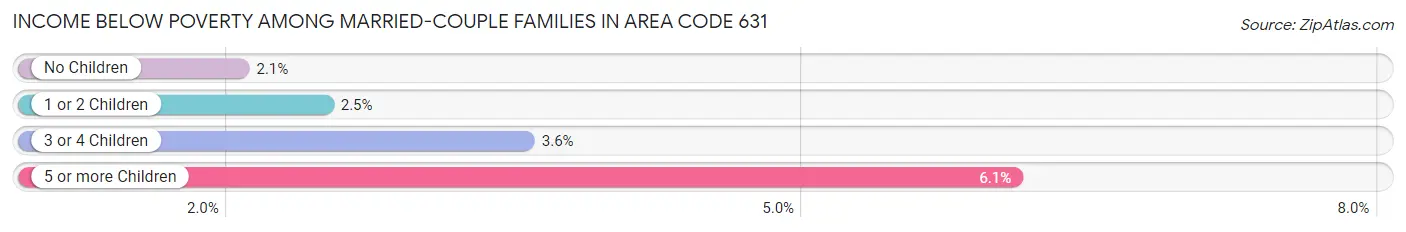
Income Below Poverty Among Married-Couple Families in Area Code 631
The poverty statistics for married-couple families in Area Code 631 show that 2.3% or 8,577 of the total 366,962 families live below the poverty line. Families with 5 or more children have the highest poverty rate of 6.1%, comprising of 81 families. On the other hand, families with no children have the lowest poverty rate of 2.1%, which includes 4,342 families.
| Children | Above Poverty | Below Poverty |
| No Children | 206,446 (97.9%) | 4,342 (2.1%) |
| 1 or 2 Children | 124,913 (97.5%) | 3,204 (2.5%) |
| 3 or 4 Children | 25,779 (96.5%) | 950 (3.5%) |
| 5 or more Children | 1,247 (93.9%) | 81 (6.1%) |
| Total | 358,385 (97.7%) | 8,577 (2.3%) |
Income Below Poverty Among Single-Parent Households in Area Code 631
According to the poverty data in Area Code 631, 6.0% or 1,880 single-father households and 11.3% or 7,494 single-mother households are living below the poverty line. Among single-father households, those with 1 or 2 children have the highest poverty rate, with 1,171 households (10.7%) experiencing poverty. Likewise, among single-mother households, those with 5 or more children have the highest poverty rate, with 125 households (33.7%) falling below the poverty line.
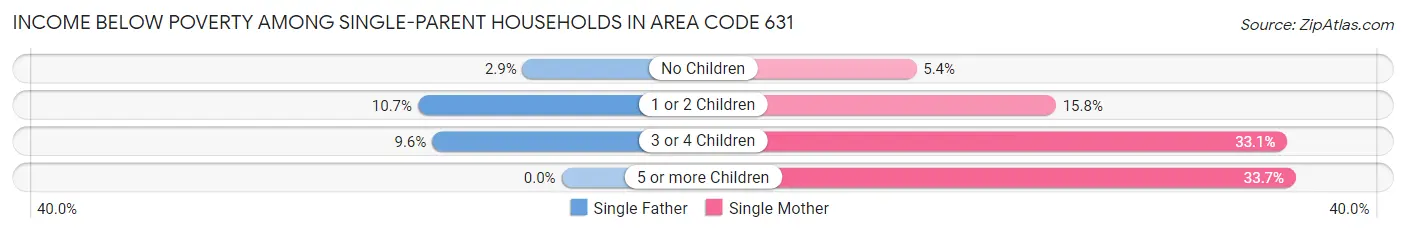
| Children | Single Father | Single Mother |
| No Children | 534 (2.9%) | 1,980 (5.4%) |
| 1 or 2 Children | 1,171 (10.7%) | 3,968 (15.8%) |
| 3 or 4 Children | 175 (9.6%) | 1,421 (33.1%) |
| 5 or more Children | 0 (0.0%) | 125 (33.7%) |
| Total | 1,880 (6.0%) | 7,494 (11.3%) |
Income Below Poverty Among Married-Couple vs Single-Parent Households in Area Code 631
The poverty data for Area Code 631 shows that 8,577 of the married-couple family households (2.3%) and 9,374 of the single-parent households (9.6%) are living below the poverty level. Within the married-couple family households, those with 5 or more children have the highest poverty rate, with 81 households (6.1%) falling below the poverty line. Among the single-parent households, those with 5 or more children have the highest poverty rate, with 125 household (29.0%) living below poverty.
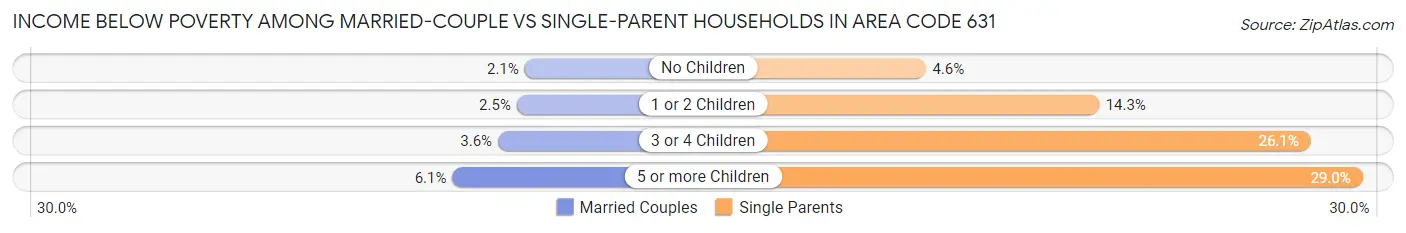
| Children | Married-Couple Families | Single-Parent Households |
| No Children | 4,342 (2.1%) | 2,514 (4.6%) |
| 1 or 2 Children | 3,204 (2.5%) | 5,139 (14.2%) |
| 3 or 4 Children | 950 (3.5%) | 1,596 (26.1%) |
| 5 or more Children | 81 (6.1%) | 125 (29.0%) |
| Total | 8,577 (2.3%) | 9,374 (9.6%) |
Race in Area Code 631
The most populous races in Area Code 631 are White / Caucasian (1,379,938 | 73.1%), Hispanic or Latino (360,512 | 19.1%), and Two or more Races (144,212 | 7.6%).
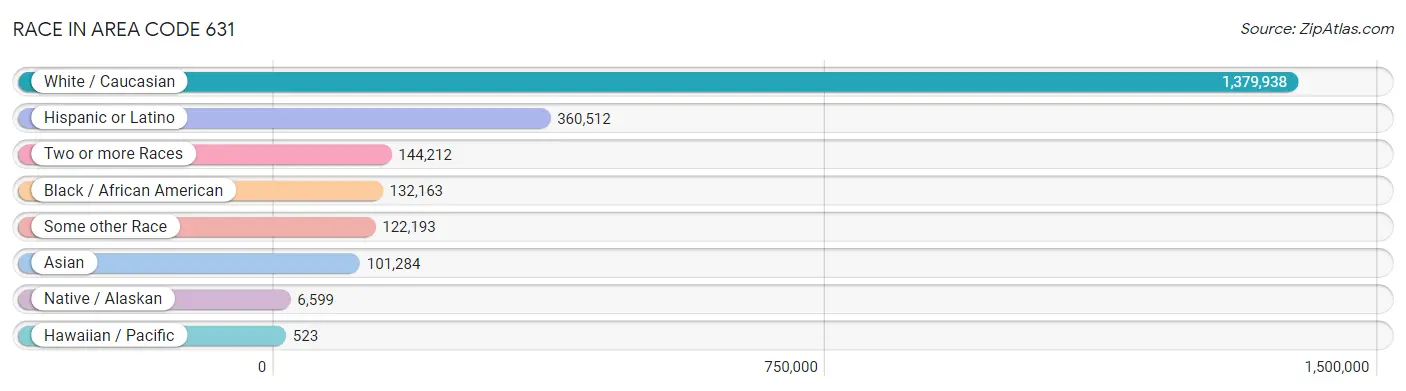
| Race | # Population | % Population |
| Asian | 101,284 | 5.4% |
| Black / African American | 132,163 | 7.0% |
| Hawaiian / Pacific | 523 | 0.0% |
| Hispanic or Latino | 360,512 | 19.1% |
| Native / Alaskan | 6,599 | 0.4% |
| White / Caucasian | 1,379,938 | 73.1% |
| Two or more Races | 144,212 | 7.6% |
| Some other Race | 122,193 | 6.5% |
| Total | 1,886,912 | 100.0% |
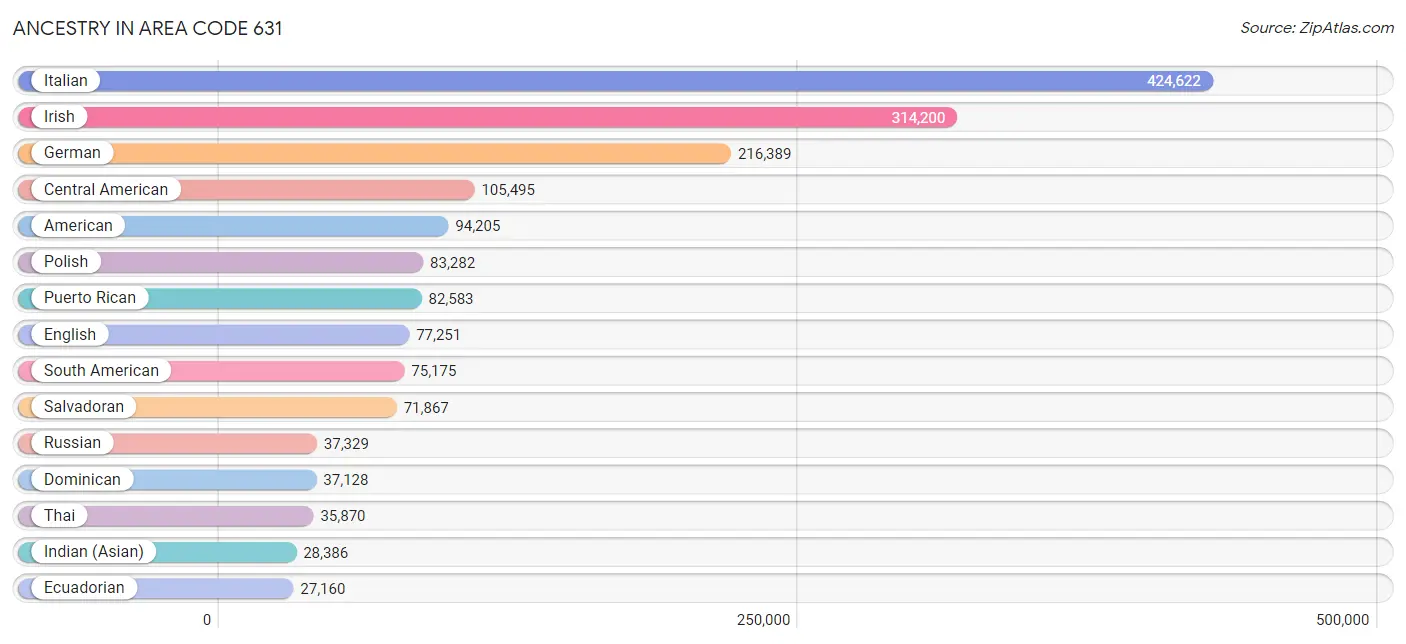
Ancestry in Area Code 631
The most populous ancestries reported in Area Code 631 are Italian (424,622 | 22.5%), Irish (314,200 | 16.7%), German (216,389 | 11.5%), Central American (105,495 | 5.6%), and American (94,205 | 5.0%), together accounting for 61.2% of all Area Code 631 residents.
| Ancestry | # Population | % Population |
| Afghan | 1,829 | 0.1% |
| African | 4,443 | 0.2% |
| Albanian | 2,298 | 0.1% |
| Aleut | 13 | 0.0% |
| Alsatian | 68 | 0.0% |
| American | 94,205 | 5.0% |
| Apache | 54 | 0.0% |
| Arab | 8,344 | 0.4% |
| Argentinean | 3,266 | 0.2% |
| Armenian | 3,341 | 0.2% |
| Assyrian / Chaldean / Syriac | 45 | 0.0% |
| Australian | 430 | 0.0% |
| Austrian | 8,649 | 0.5% |
| Bahamian | 139 | 0.0% |
| Bangladeshi | 10 | 0.0% |
| Barbadian | 683 | 0.0% |
| Basque | 112 | 0.0% |
| Belgian | 985 | 0.1% |
| Belizean | 651 | 0.0% |
| Bermudan | 78 | 0.0% |
| Bhutanese | 2,461 | 0.1% |
| Blackfeet | 342 | 0.0% |
| Bolivian | 775 | 0.0% |
| Brazilian | 2,852 | 0.2% |
| British | 4,388 | 0.2% |
| British West Indian | 1,152 | 0.1% |
| Bulgarian | 129 | 0.0% |
| Burmese | 10,381 | 0.5% |
| Cajun | 10 | 0.0% |
| Cambodian | 25 | 0.0% |
| Canadian | 2,081 | 0.1% |
| Cape Verdean | 37 | 0.0% |
| Carpatho Rusyn | 9 | 0.0% |
| Celtic | 423 | 0.0% |
| Central American | 105,495 | 5.6% |
| Central American Indian | 3,071 | 0.2% |
| Cherokee | 1,070 | 0.1% |
| Chickasaw | 18 | 0.0% |
| Chilean | 3,069 | 0.2% |
| Chinese | 2 | 0.0% |
| Chippewa | 35 | 0.0% |
| Choctaw | 104 | 0.0% |
| Colombian | 26,600 | 1.4% |
| Costa Rican | 2,889 | 0.2% |
| Cree | 27 | 0.0% |
| Creek | 17 | 0.0% |
| Croatian | 3,807 | 0.2% |
| Crow | 26 | 0.0% |
| Cuban | 7,335 | 0.4% |
| Cypriot | 373 | 0.0% |
| Czech | 6,322 | 0.3% |
| Czechoslovakian | 2,078 | 0.1% |
| Danish | 4,005 | 0.2% |
| Delaware | 240 | 0.0% |
| Dominican | 37,128 | 2.0% |
| Dutch | 9,066 | 0.5% |
| Dutch West Indian | 25 | 0.0% |
| Eastern European | 15,322 | 0.8% |
| Ecuadorian | 27,160 | 1.4% |
| Egyptian | 2,736 | 0.1% |
| English | 77,251 | 4.1% |
| Estonian | 155 | 0.0% |
| Ethiopian | 123 | 0.0% |
| European | 18,216 | 1.0% |
| Filipino | 1,004 | 0.1% |
| Finnish | 1,889 | 0.1% |
| French | 20,029 | 1.1% |
| French American Indian | 160 | 0.0% |
| French Canadian | 4,941 | 0.3% |
| German | 216,389 | 11.5% |
| German Russian | 20 | 0.0% |
| Ghanaian | 1,508 | 0.1% |
| Greek | 26,669 | 1.4% |
| Guamanian / Chamorro | 233 | 0.0% |
| Guatemalan | 12,286 | 0.6% |
| Guyanese | 5,026 | 0.3% |
| Haitian | 15,531 | 0.8% |
| Hmong | 53 | 0.0% |
| Honduran | 14,670 | 0.8% |
| Houma | 11 | 0.0% |
| Hungarian | 9,317 | 0.5% |
| Icelander | 123 | 0.0% |
| Indian (Asian) | 28,386 | 1.5% |
| Indonesian | 240 | 0.0% |
| Inupiat | 46 | 0.0% |
| Iranian | 1,587 | 0.1% |
| Iraqi | 224 | 0.0% |
| Irish | 314,200 | 16.7% |
| Iroquois | 524 | 0.0% |
| Israeli | 1,433 | 0.1% |
| Italian | 424,622 | 22.5% |
| Jamaican | 12,654 | 0.7% |
| Japanese | 36 | 0.0% |
| Jordanian | 828 | 0.0% |
| Kenyan | 30 | 0.0% |
| Korean | 12,211 | 0.6% |
| Laotian | 655 | 0.0% |
| Latvian | 754 | 0.0% |
| Lebanese | 1,825 | 0.1% |
| Lithuanian | 6,009 | 0.3% |
| Lumbee | 32 | 0.0% |
| Luxembourger | 40 | 0.0% |
| Macedonian | 175 | 0.0% |
| Malaysian | 302 | 0.0% |
| Maltese | 2,144 | 0.1% |
| Marshallese | 4 | 0.0% |
| Mexican | 23,090 | 1.2% |
| Mexican American Indian | 1,751 | 0.1% |
| Mongolian | 205 | 0.0% |
| Moroccan | 560 | 0.0% |
| Native Hawaiian | 410 | 0.0% |
| Navajo | 407 | 0.0% |
| New Zealander | 18 | 0.0% |
| Nicaraguan | 1,201 | 0.1% |
| Nigerian | 2,461 | 0.1% |
| Northern European | 1,477 | 0.1% |
| Norwegian | 12,597 | 0.7% |
| Okinawan | 150 | 0.0% |
| Osage | 2 | 0.0% |
| Pakistani | 883 | 0.1% |
| Palestinian | 404 | 0.0% |
| Panamanian | 1,590 | 0.1% |
| Paraguayan | 547 | 0.0% |
| Pennsylvania German | 60 | 0.0% |
| Peruvian | 11,263 | 0.6% |
| Pima | 8 | 0.0% |
| Polish | 83,282 | 4.4% |
| Portuguese | 6,869 | 0.4% |
| Potawatomi | 20 | 0.0% |
| Pueblo | 19 | 0.0% |
| Puerto Rican | 82,583 | 4.4% |
| Puget Sound Salish | 5 | 0.0% |
| Romanian | 3,689 | 0.2% |
| Russian | 37,329 | 2.0% |
| Salvadoran | 71,867 | 3.8% |
| Samoan | 167 | 0.0% |
| Scandinavian | 2,191 | 0.1% |
| Scotch-Irish | 4,585 | 0.2% |
| Scottish | 13,271 | 0.7% |
| Seminole | 198 | 0.0% |
| Senegalese | 9 | 0.0% |
| Serbian | 679 | 0.0% |
| Sierra Leonean | 7 | 0.0% |
| Sioux | 123 | 0.0% |
| Slavic | 507 | 0.0% |
| Slovak | 1,483 | 0.1% |
| Slovene | 279 | 0.0% |
| Somali | 7 | 0.0% |
| South African | 209 | 0.0% |
| South American | 75,175 | 4.0% |
| South American Indian | 647 | 0.0% |
| Soviet Union | 37 | 0.0% |
| Spaniard | 8,575 | 0.4% |
| Spanish | 4,159 | 0.2% |
| Spanish American | 212 | 0.0% |
| Spanish American Indian | 17 | 0.0% |
| Sri Lankan | 1,939 | 0.1% |
| Subsaharan African | 9,254 | 0.5% |
| Sudanese | 18 | 0.0% |
| Swedish | 9,343 | 0.5% |
| Swiss | 2,435 | 0.1% |
| Syrian | 945 | 0.1% |
| Taiwanese | 10 | 0.0% |
| Thai | 35,870 | 1.9% |
| Tlingit-Haida | 13 | 0.0% |
| Tongan | 20 | 0.0% |
| Trinidadian and Tobagonian | 4,591 | 0.2% |
| Turkish | 7,145 | 0.4% |
| U.S. Virgin Islander | 61 | 0.0% |
| Ugandan | 90 | 0.0% |
| Ukrainian | 9,808 | 0.5% |
| Uruguayan | 737 | 0.0% |
| Venezuelan | 1,276 | 0.1% |
| Vietnamese | 3,699 | 0.2% |
| Welsh | 3,502 | 0.2% |
| West Indian | 3,137 | 0.2% |
| Yaqui | 25 | 0.0% |
| Yugoslavian | 993 | 0.1% |
| Zimbabwean | 27 | 0.0% | View All 179 Rows |
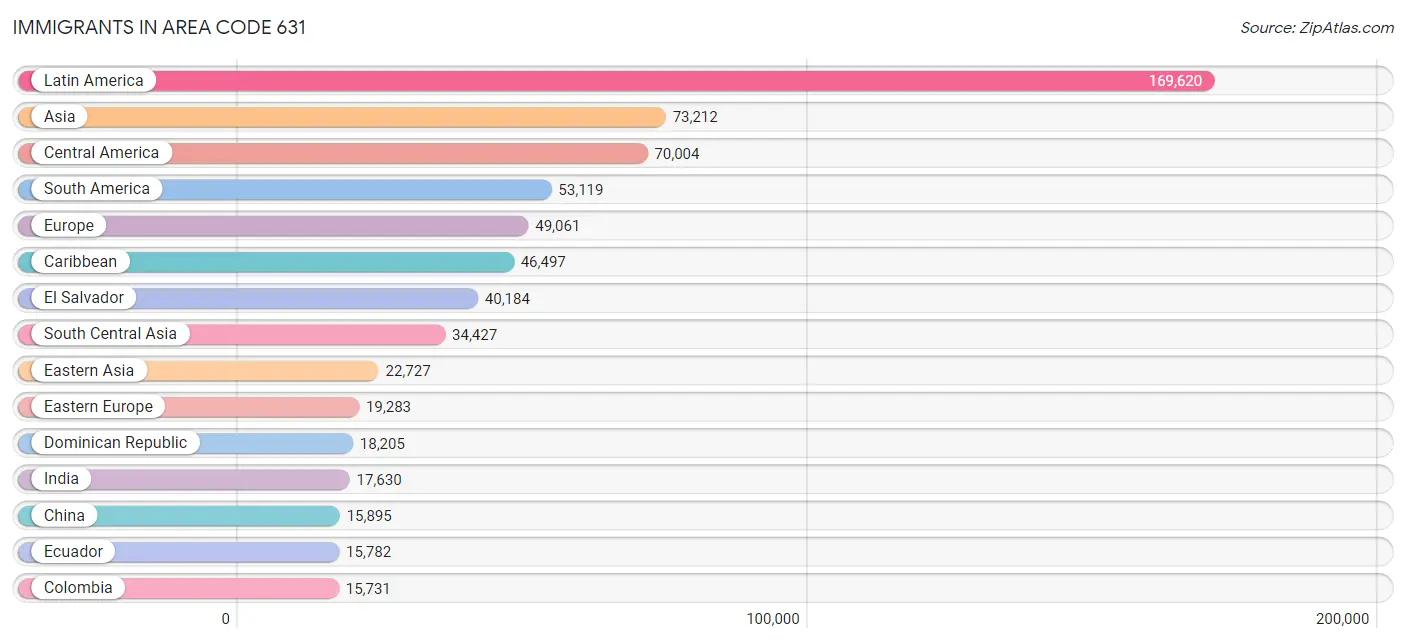
Immigrants in Area Code 631
The most numerous immigrant groups reported in Area Code 631 came from Latin America (169,620 | 9.0%), Asia (73,212 | 3.9%), Central America (70,004 | 3.7%), South America (53,119 | 2.8%), and Europe (49,061 | 2.6%), together accounting for 22.0% of all Area Code 631 residents.
| Immigration Origin | # Population | % Population |
| Afghanistan | 1,311 | 0.1% |
| Africa | 8,066 | 0.4% |
| Albania | 515 | 0.0% |
| Argentina | 2,477 | 0.1% |
| Armenia | 104 | 0.0% |
| Asia | 73,212 | 3.9% |
| Australia | 329 | 0.0% |
| Austria | 308 | 0.0% |
| Bahamas | 45 | 0.0% |
| Bangladesh | 3,832 | 0.2% |
| Barbados | 447 | 0.0% |
| Belarus | 445 | 0.0% |
| Belgium | 209 | 0.0% |
| Belize | 333 | 0.0% |
| Bolivia | 640 | 0.0% |
| Bosnia and Herzegovina | 97 | 0.0% |
| Brazil | 2,523 | 0.1% |
| Bulgaria | 205 | 0.0% |
| Cambodia | 17 | 0.0% |
| Cameroon | 79 | 0.0% |
| Canada | 2,527 | 0.1% |
| Caribbean | 46,497 | 2.5% |
| Central America | 70,004 | 3.7% |
| Chile | 1,459 | 0.1% |
| China | 15,895 | 0.8% |
| Colombia | 15,731 | 0.8% |
| Congo | 10 | 0.0% |
| Costa Rica | 1,447 | 0.1% |
| Croatia | 590 | 0.0% |
| Cuba | 2,097 | 0.1% |
| Czechoslovakia | 650 | 0.0% |
| Denmark | 142 | 0.0% |
| Dominica | 96 | 0.0% |
| Dominican Republic | 18,205 | 1.0% |
| Eastern Africa | 899 | 0.1% |
| Eastern Asia | 22,727 | 1.2% |
| Eastern Europe | 19,283 | 1.0% |
| Ecuador | 15,782 | 0.8% |
| Egypt | 1,829 | 0.1% |
| El Salvador | 40,184 | 2.1% |
| England | 1,805 | 0.1% |
| Ethiopia | 75 | 0.0% |
| Europe | 49,061 | 2.6% |
| Fiji | 15 | 0.0% |
| France | 1,249 | 0.1% |
| Germany | 4,056 | 0.2% |
| Ghana | 1,340 | 0.1% |
| Greece | 3,351 | 0.2% |
| Grenada | 407 | 0.0% |
| Guatemala | 7,536 | 0.4% |
| Guyana | 4,571 | 0.2% |
| Haiti | 10,906 | 0.6% |
| Honduras | 9,886 | 0.5% |
| Hong Kong | 1,816 | 0.1% |
| Hungary | 281 | 0.0% |
| India | 17,630 | 0.9% |
| Indonesia | 493 | 0.0% |
| Iran | 1,293 | 0.1% |
| Iraq | 117 | 0.0% |
| Ireland | 2,640 | 0.1% |
| Israel | 1,151 | 0.1% |
| Italy | 8,488 | 0.4% |
| Jamaica | 9,031 | 0.5% |
| Japan | 825 | 0.0% |
| Jordan | 266 | 0.0% |
| Kazakhstan | 130 | 0.0% |
| Kenya | 66 | 0.0% |
| Korea | 6,007 | 0.3% |
| Kuwait | 120 | 0.0% |
| Laos | 51 | 0.0% |
| Latin America | 169,620 | 9.0% |
| Latvia | 171 | 0.0% |
| Lebanon | 520 | 0.0% |
| Liberia | 76 | 0.0% |
| Lithuania | 320 | 0.0% |
| Malaysia | 242 | 0.0% |
| Mexico | 9,393 | 0.5% |
| Middle Africa | 314 | 0.0% |
| Moldova | 193 | 0.0% |
| Morocco | 454 | 0.0% |
| Nepal | 497 | 0.0% |
| Netherlands | 312 | 0.0% |
| Nicaragua | 547 | 0.0% |
| Nigeria | 1,649 | 0.1% |
| North Macedonia | 225 | 0.0% |
| Northern Africa | 2,592 | 0.1% |
| Northern Europe | 7,762 | 0.4% |
| Norway | 140 | 0.0% |
| Oceania | 396 | 0.0% |
| Pakistan | 9,154 | 0.5% |
| Panama | 601 | 0.0% |
| Peru | 7,866 | 0.4% |
| Philippines | 5,372 | 0.3% |
| Poland | 8,296 | 0.4% |
| Portugal | 2,101 | 0.1% |
| Romania | 1,207 | 0.1% |
| Russia | 2,495 | 0.1% |
| Saudi Arabia | 266 | 0.0% |
| Scotland | 761 | 0.0% |
| Senegal | 165 | 0.0% |
| Serbia | 375 | 0.0% |
| Sierra Leone | 28 | 0.0% |
| Singapore | 186 | 0.0% |
| South Africa | 553 | 0.0% |
| South America | 53,119 | 2.8% |
| South Central Asia | 34,427 | 1.8% |
| South Eastern Asia | 8,119 | 0.4% |
| Southern Europe | 15,492 | 0.8% |
| Spain | 1,218 | 0.1% |
| Sri Lanka | 302 | 0.0% |
| St. Vincent and the Grenadines | 234 | 0.0% |
| Sudan | 46 | 0.0% |
| Sweden | 192 | 0.0% |
| Switzerland | 244 | 0.0% |
| Syria | 94 | 0.0% |
| Taiwan | 1,469 | 0.1% |
| Thailand | 299 | 0.0% |
| Trinidad and Tobago | 4,048 | 0.2% |
| Turkey | 4,265 | 0.2% |
| Uganda | 97 | 0.0% |
| Ukraine | 2,437 | 0.1% |
| Uruguay | 541 | 0.0% |
| Uzbekistan | 232 | 0.0% |
| Venezuela | 906 | 0.1% |
| Vietnam | 1,180 | 0.1% |
| West Indies | 372 | 0.0% |
| Western Africa | 3,436 | 0.2% |
| Western Asia | 7,804 | 0.4% |
| Western Europe | 6,401 | 0.3% |
| Yemen | 41 | 0.0% |
| Zaire | 139 | 0.0% |
| Zimbabwe | 31 | 0.0% | View All 132 Rows |
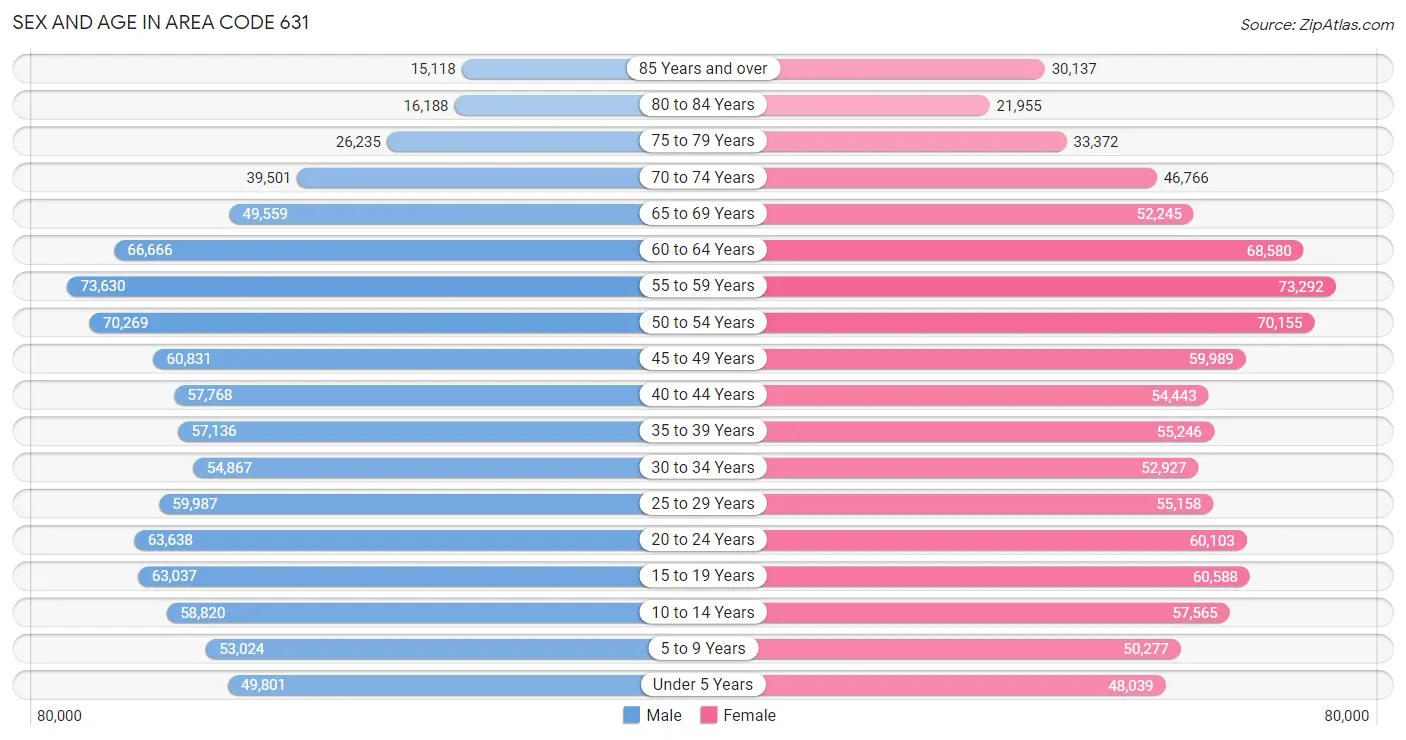
Sex and Age in Area Code 631
Sex and Age in Area Code 631
The most populous age groups in Area Code 631 are 55 to 59 Years (73,630 | 7.9%) for men and 55 to 59 Years (73,292 | 7.7%) for women.
| Age Bracket | Male | Female |
| Under 5 Years | 49,801 (5.3%) | 48,039 (5.1%) |
| 5 to 9 Years | 53,024 (5.7%) | 50,277 (5.3%) |
| 10 to 14 Years | 58,820 (6.3%) | 57,565 (6.0%) |
| 15 to 19 Years | 63,037 (6.7%) | 60,588 (6.4%) |
| 20 to 24 Years | 63,638 (6.8%) | 60,103 (6.3%) |
| 25 to 29 Years | 59,987 (6.4%) | 55,158 (5.8%) |
| 30 to 34 Years | 54,867 (5.9%) | 52,927 (5.6%) |
| 35 to 39 Years | 57,136 (6.1%) | 55,246 (5.8%) |
| 40 to 44 Years | 57,768 (6.2%) | 54,443 (5.7%) |
| 45 to 49 Years | 60,831 (6.5%) | 59,989 (6.3%) |
| 50 to 54 Years | 70,269 (7.5%) | 70,155 (7.4%) |
| 55 to 59 Years | 73,630 (7.9%) | 73,292 (7.7%) |
| 60 to 64 Years | 66,666 (7.1%) | 68,580 (7.2%) |
| 65 to 69 Years | 49,559 (5.3%) | 52,245 (5.5%) |
| 70 to 74 Years | 39,501 (4.2%) | 46,766 (4.9%) |
| 75 to 79 Years | 26,235 (2.8%) | 33,372 (3.5%) |
| 80 to 84 Years | 16,188 (1.7%) | 21,955 (2.3%) |
| 85 Years and over | 15,118 (1.6%) | 30,137 (3.2%) |
| Total | 936,075 (100.0%) | 950,837 (100.0%) |
Families and Households in Area Code 631
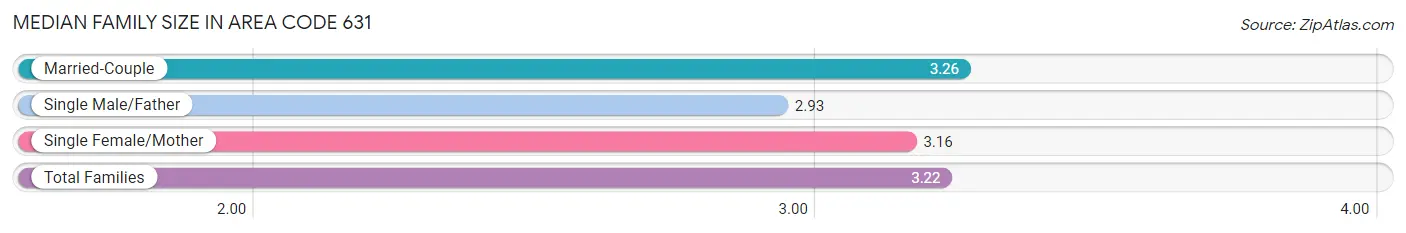
Median Family Size in Area Code 631
The median family size in Area Code 631 is 3.22 persons per family, with married-couple families (366,962 | 79.0%) accounting for the largest median family size of 3.25786 persons per family. On the other hand, single male/father families (31,228 | 6.7%) represent the smallest median family size with 2.93 persons per family.
| Family Type | # Families | Family Size |
| Married-Couple | 366,962 (79.0%) | 3.26 |
| Single Male/Father | 31,228 (6.7%) | 2.93 |
| Single Female/Mother | 66,400 (14.3%) | 3.16 |
| Total Families | 464,590 (100.0%) | 3.22 |
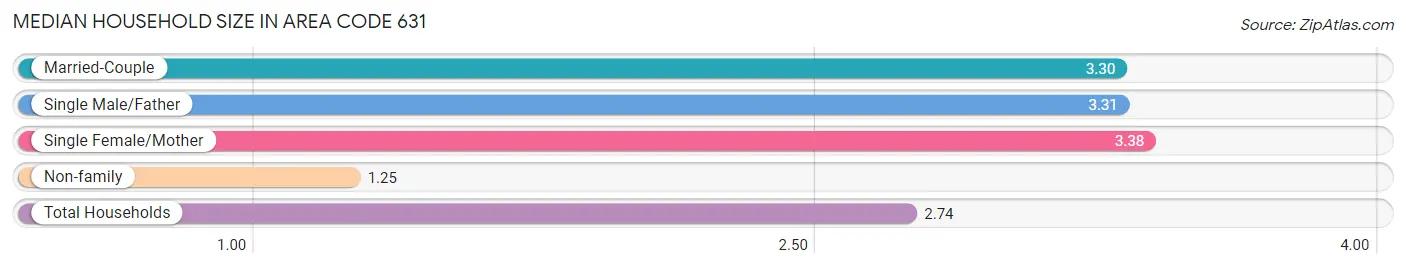
Median Household Size in Area Code 631
The median household size in Area Code 631 is 2.74 persons per household, with single female/mother households (66,400 | 10.5%) accounting for the largest median household size of 3.38258 persons per household. non-family households (165,315 | 26.2%) represent the smallest median household size with 1.25 persons per household.
| Household Type | # Households | Household Size |
| Married-Couple | 366,962 (58.3%) | 3.30 |
| Single Male/Father | 31,228 (5.0%) | 3.31 |
| Single Female/Mother | 66,400 (10.5%) | 3.38 |
| Non-family | 165,315 (26.2%) | 1.25 |
| Total Households | 629,905 (100.0%) | 2.74 |
Household Size by Marriage Status in Area Code 631
Out of a total of 629,905 households in Area Code 631, 464,590 (73.8%) are family households, while 165,315 (26.2%) are nonfamily households. The most numerous type of family households are 2-person households, comprising 165,235, and the most common type of nonfamily households are 1-person households, comprising 135,043.
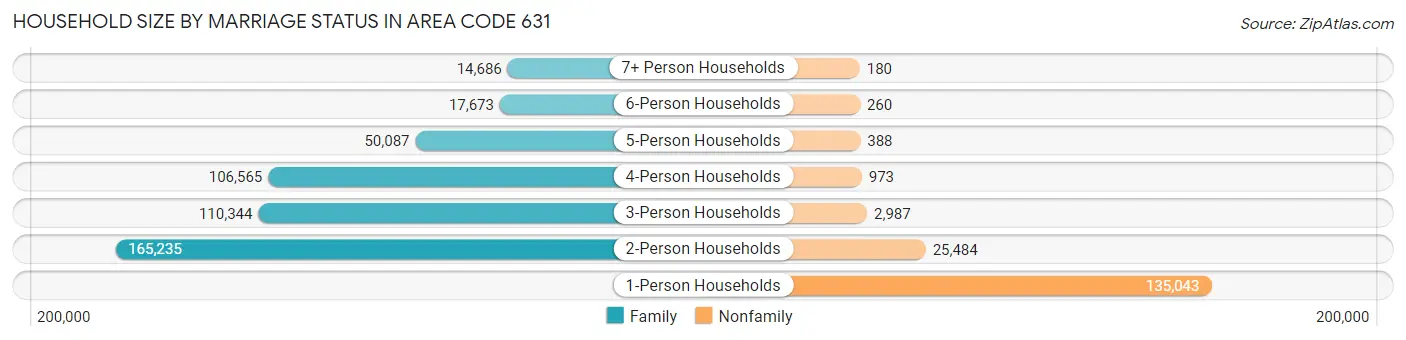
| Household Size | Family Households | Nonfamily Households |
| 1-Person Households | - | 135,043 (21.4%) |
| 2-Person Households | 165,235 (26.2%) | 25,484 (4.1%) |
| 3-Person Households | 110,344 (17.5%) | 2,987 (0.5%) |
| 4-Person Households | 106,565 (16.9%) | 973 (0.2%) |
| 5-Person Households | 50,087 (8.0%) | 388 (0.1%) |
| 6-Person Households | 17,673 (2.8%) | 260 (0.0%) |
| 7+ Person Households | 14,686 (2.3%) | 180 (0.0%) |
| Total | 464,590 (73.8%) | 165,315 (26.2%) |
Female Fertility in Area Code 631
Fertility by Age in Area Code 631
Average fertility rate in Area Code 631 is 55.7 births per 1,000 women. Women in the age bracket of 20 to 34 years have the highest fertility rate with 103.4 births per 1,000 women. Women in the age bracket of 20 to 34 years acount for 61.2% of all women with births.
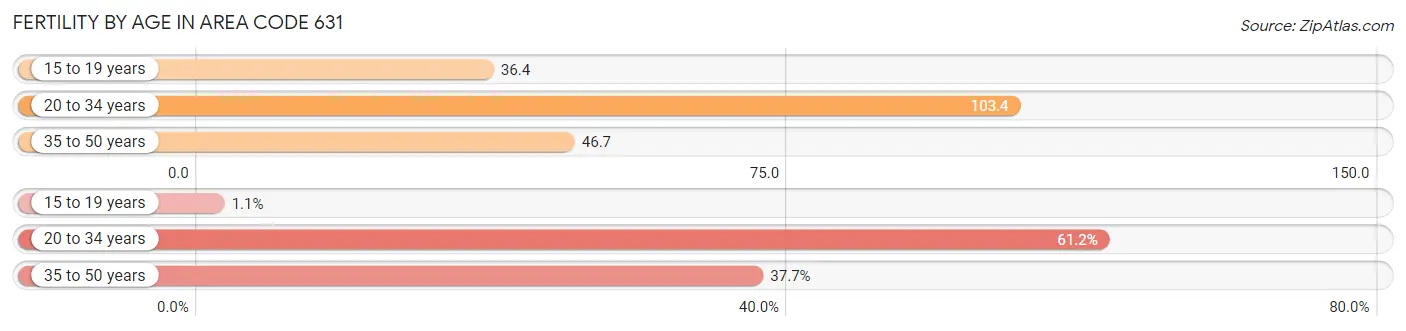
| Age Bracket | Women with Births | Births / 1,000 Women |
| 15 to 19 years | 233 (1.1%) | 36.4 |
| 20 to 34 years | 12,652 (61.2%) | 103.4 |
| 35 to 50 years | 7,795 (37.7%) | 46.7 |
| Total | 20,680 (100.0%) | 55.7 |
Fertility by Age by Marriage Status in Area Code 631
67.7% of women with births (20,680) in Area Code 631 are married. The highest percentage of unmarried women with births falls into 15 to 19 years age bracket with 100.0% of them unmarried at the time of birth, while the lowest percentage of unmarried women with births belong to 35 to 50 years age bracket with 32.7% of them unmarried.
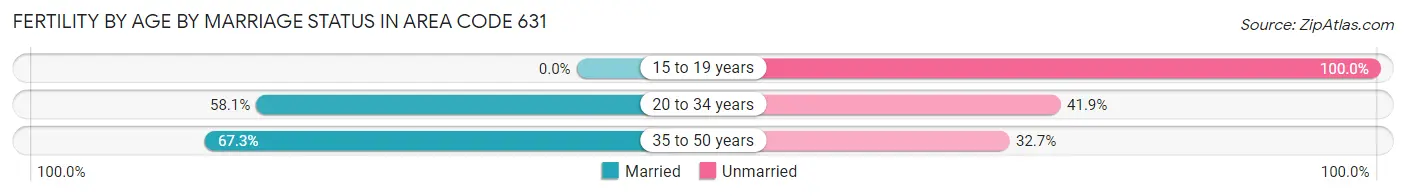
| Age Bracket | Married | Unmarried |
| 15 to 19 years | 0 (0.0%) | 233 (100.0%) |
| 20 to 34 years | 7,346 (58.1%) | 5,306 (41.9%) |
| 35 to 50 years | 5,247 (67.3%) | 2,548 (32.7%) |
| Total | 13,993 (67.7%) | 6,687 (32.3%) |
Fertility by Education in Area Code 631
Average fertility rate in Area Code 631 is 55.7 births per 1,000 women. Women with the education attainment of graduate degree have the highest fertility rate of 89.9 births per 1,000 women, while women with the education attainment of less than high school have the lowest fertility at 38.3 births per 1,000 women. Women with the education attainment of graduate degree represent 29.6% of all women with births.
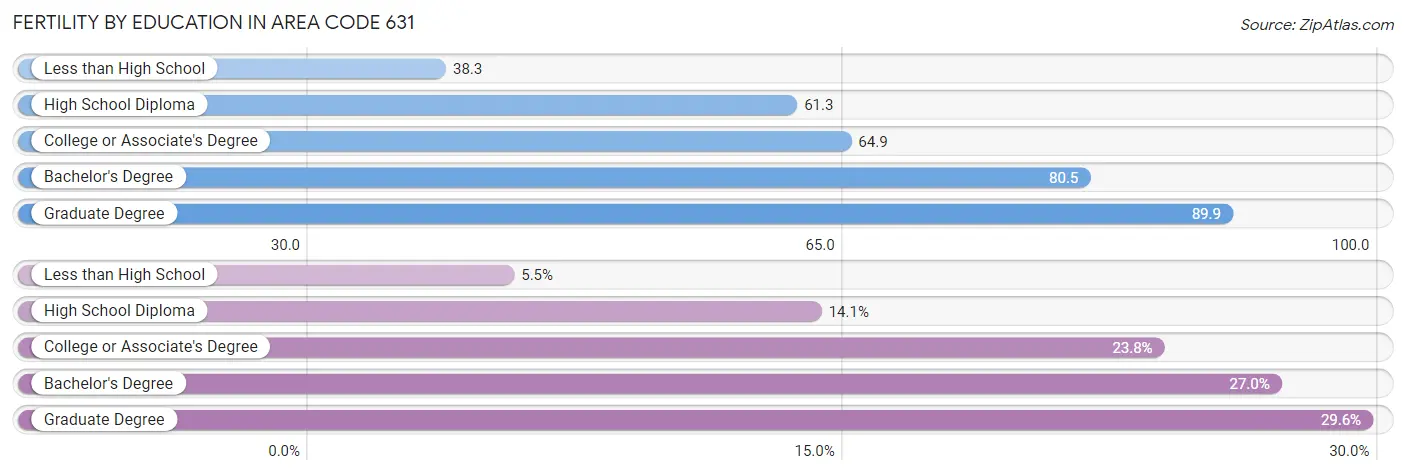
| Educational Attainment | Women with Births | Births / 1,000 Women |
| Less than High School | 1,134 (5.5%) | 38.3 |
| High School Diploma | 2,919 (14.1%) | 61.3 |
| College or Associate's Degree | 4,912 (23.7%) | 64.9 |
| Bachelor's Degree | 5,592 (27.0%) | 80.5 |
| Graduate Degree | 6,123 (29.6%) | 89.9 |
| Total | 20,680 (100.0%) | 55.7 |
Fertility by Education by Marriage Status in Area Code 631
32.3% of women with births in Area Code 631 are unmarried. Women with the educational attainment of graduate degree are most likely to be married with 67.7% of them married at childbirth, while women with the educational attainment of less than high school are least likely to be married with 79.0% of them unmarried at childbirth.
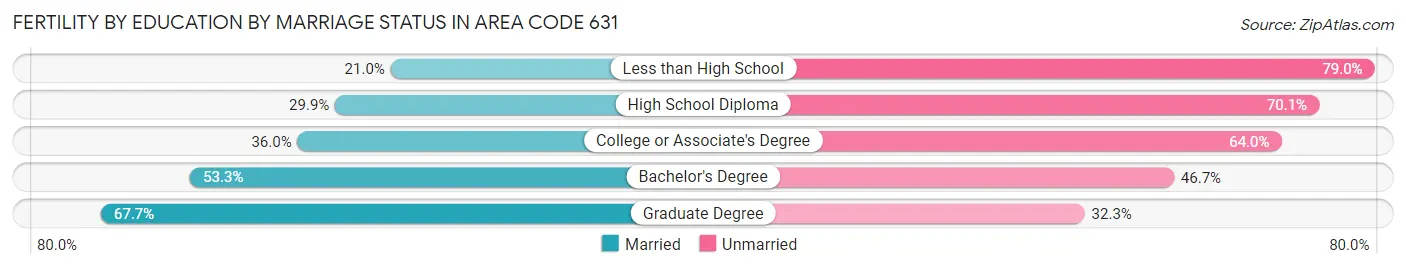
| Educational Attainment | Married | Unmarried |
| Less than High School | 238 (21.0%) | 896 (79.0%) |
| High School Diploma | 874 (29.9%) | 2,045 (70.1%) |
| College or Associate's Degree | 1,769 (36.0%) | 3,143 (64.0%) |
| Bachelor's Degree | 2,981 (53.3%) | 2,611 (46.7%) |
| Graduate Degree | 4,145 (67.7%) | 1,978 (32.3%) |
| Total | 13,993 (67.7%) | 6,687 (32.3%) |
Employment Characteristics in Area Code 631
Employment by Class of Employer in Area Code 631
Among the 950,344 employed individuals in Area Code 631, private company employees (600,769 | 63.2%), local government employees (108,206 | 11.4%), and not-for-profit organizations (77,633 | 8.2%) make up the most common classes of employment.
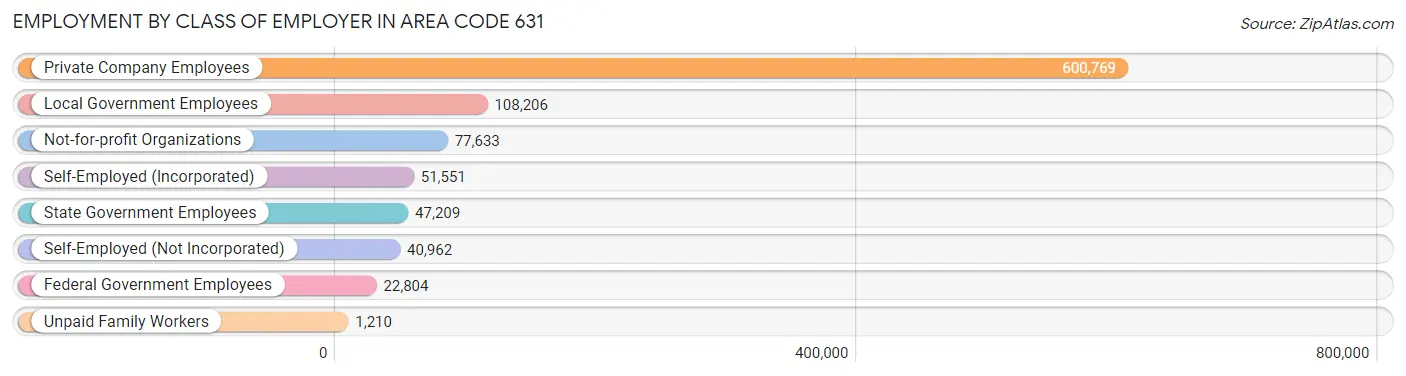
| Employer Class | # Employees | % Employees |
| Private Company Employees | 600,769 | 63.2% |
| Self-Employed (Incorporated) | 51,551 | 5.4% |
| Self-Employed (Not Incorporated) | 40,962 | 4.3% |
| Not-for-profit Organizations | 77,633 | 8.2% |
| Local Government Employees | 108,206 | 11.4% |
| State Government Employees | 47,209 | 5.0% |
| Federal Government Employees | 22,804 | 2.4% |
| Unpaid Family Workers | 1,210 | 0.1% |
| Total | 950,344 | 100.0% |
Employment Status by Age in Area Code 631
According to the labor force statistics for Area Code 631, out of the total population over 16 years of age (1,545,883), 63.5% or 981,636 individuals are in the labor force, with 4.9% or 47,708 of them unemployed. The age group with the highest labor force participation rate is 30 to 34 years, with 88.0% or 94,902 individuals in the labor force. Within the labor force, the 16 to 19 years age range has the highest percentage of unemployed individuals, with 1,217.8% or 429,676 of them being unemployed.
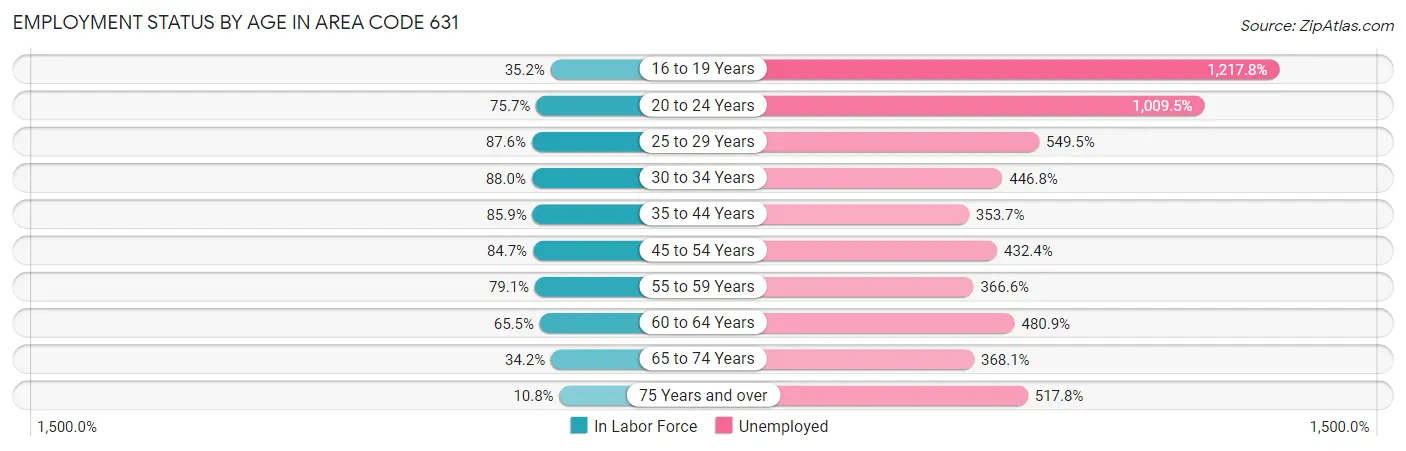
| Age Bracket | In Labor Force | Unemployed |
| 16 to 19 Years | 35,281 (35.2%) | 429,676 (1,217.8%) |
| 20 to 24 Years | 93,610 (75.6%) | 944,993 (1,009.5%) |
| 25 to 29 Years | 100,881 (87.6%) | 554,330 (549.5%) |
| 30 to 34 Years | 94,898 (88.0%) | 424,022 (446.8%) |
| 35 to 44 Years | 193,019 (85.9%) | 682,694 (353.7%) |
| 45 to 54 Years | 221,285 (84.7%) | 956,789 (432.4%) |
| 55 to 59 Years | 116,187 (79.1%) | 425,938 (366.6%) |
| 60 to 64 Years | 88,587 (65.5%) | 426,010 (480.9%) |
| 65 to 74 Years | 64,345 (34.2%) | 236,832 (368.1%) |
| 75 Years and over | 15,507 (10.8%) | 80,269 (517.8%) |
| Total | 981,649 (63.5%) | 47,739 (4.9%) |
Employment Status by Educational Attainment in Area Code 631
According to labor force statistics for Area Code 631, 81.6% of individuals (808,115) out of the total population between 25 and 64 years of age (990,944) are in the labor force, with 419.2% or 3,387,618 of them being unemployed. The group with the highest labor force participation rate are those with the educational attainment of bachelor's degree or higher, with 87.2% or 379,396 individuals in the labor force. Within the labor force, individuals with high school diploma education have the highest percentage of unemployment, with 630.0% or 1,022,610 of them being unemployed.
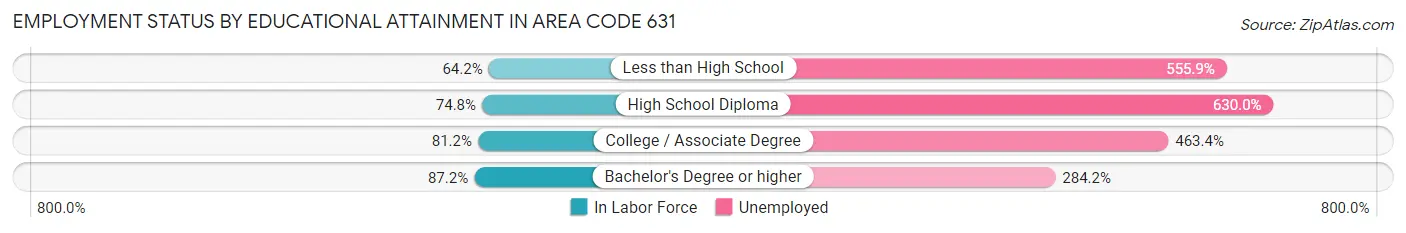
| Educational Attainment | In Labor Force | Unemployed |
| Less than High School | 53,141 (64.2%) | 460,202 (555.9%) |
| High School Diploma | 162,309 (74.8%) | 1,367,491 (630.0%) |
| College / Associate Degree | 207,893 (81.2%) | 1,186,814 (463.4%) |
| Bachelor's Degree or higher | 379,393 (87.2%) | 1,236,233 (284.2%) |
| Total | 808,090 (81.6%) | 4,154,037 (419.2%) |
Employment Occupations by Sex in Area Code 631
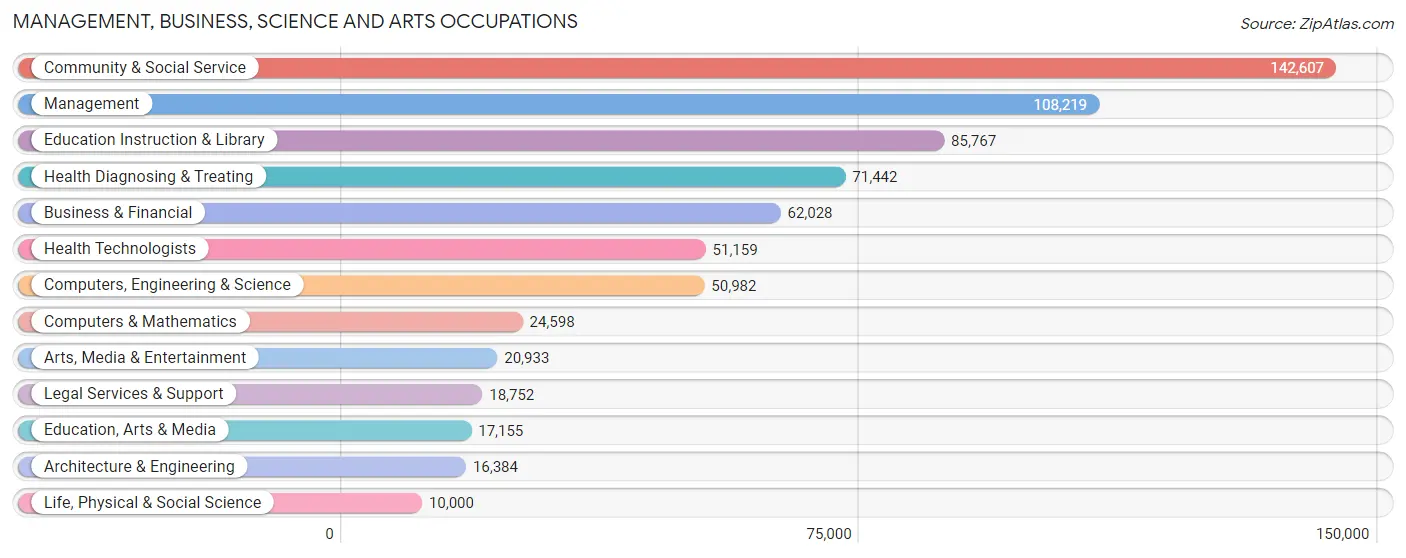
Management, Business, Science and Arts Occupations
The most common Management, Business, Science and Arts occupations in Area Code 631 are Community & Social Service (142,607 | 14.7%), Management (108,219 | 11.2%), Education Instruction & Library (85,767 | 8.8%), Health Diagnosing & Treating (71,442 | 7.4%), and Business & Financial (62,028 | 6.4%).
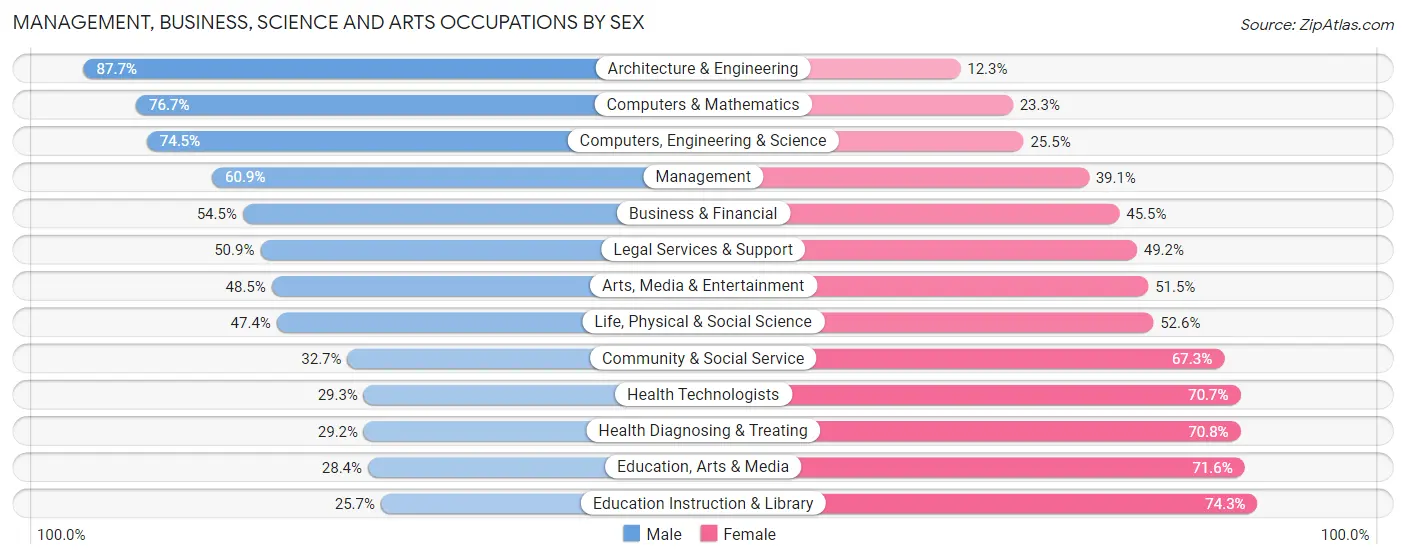
Management, Business, Science and Arts Occupations by Sex
Within the Management, Business, Science and Arts occupations in Area Code 631, the most male-oriented occupations are Architecture & Engineering (87.7%), Computers & Mathematics (76.7%), and Computers, Engineering & Science (74.5%), while the most female-oriented occupations are Education Instruction & Library (74.3%), Education, Arts & Media (71.6%), and Health Diagnosing & Treating (70.8%).
| Occupation | Male | Female |
| Management | 65,889 (60.9%) | 42,330 (39.1%) |
| Business & Financial | 33,806 (54.5%) | 28,222 (45.5%) |
| Computers, Engineering & Science | 37,979 (74.5%) | 13,003 (25.5%) |
| Computers & Mathematics | 18,873 (76.7%) | 5,725 (23.3%) |
| Architecture & Engineering | 14,364 (87.7%) | 2,020 (12.3%) |
| Life, Physical & Social Science | 4,742 (47.4%) | 5,258 (52.6%) |
| Community & Social Service | 46,586 (32.7%) | 96,021 (67.3%) |
| Education, Arts & Media | 4,871 (28.4%) | 12,284 (71.6%) |
| Legal Services & Support | 9,535 (50.8%) | 9,217 (49.1%) |
| Education Instruction & Library | 22,033 (25.7%) | 63,734 (74.3%) |
| Arts, Media & Entertainment | 10,147 (48.5%) | 10,786 (51.5%) |
| Health Diagnosing & Treating | 20,886 (29.2%) | 50,556 (70.8%) |
| Health Technologists | 14,968 (29.3%) | 36,191 (70.7%) |
| Total (Category) | 205,146 (47.1%) | 230,132 (52.9%) |
| Total (Overall) | 515,606 (53.2%) | 453,706 (46.8%) |
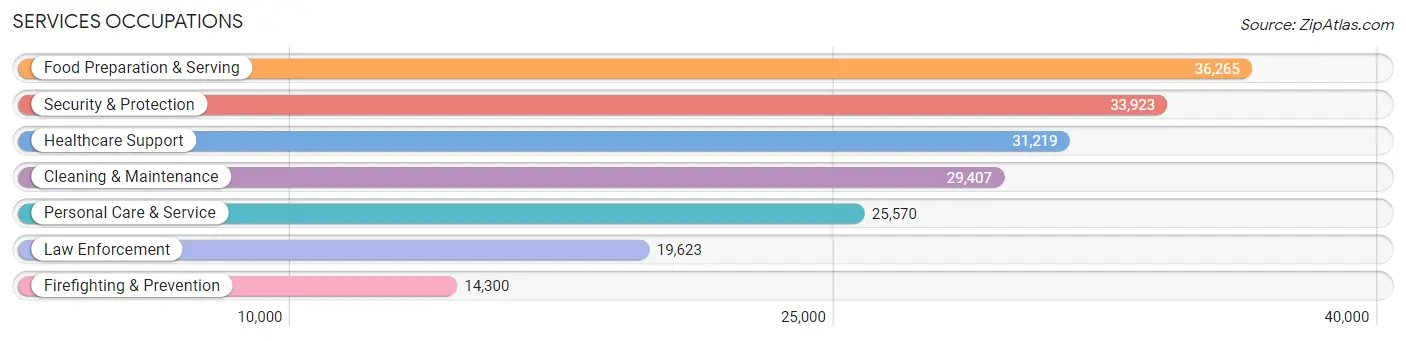
Services Occupations
The most common Services occupations in Area Code 631 are Food Preparation & Serving (36,265 | 3.7%), Security & Protection (33,923 | 3.5%), Healthcare Support (31,219 | 3.2%), Cleaning & Maintenance (29,407 | 3.0%), and Personal Care & Service (25,570 | 2.6%).
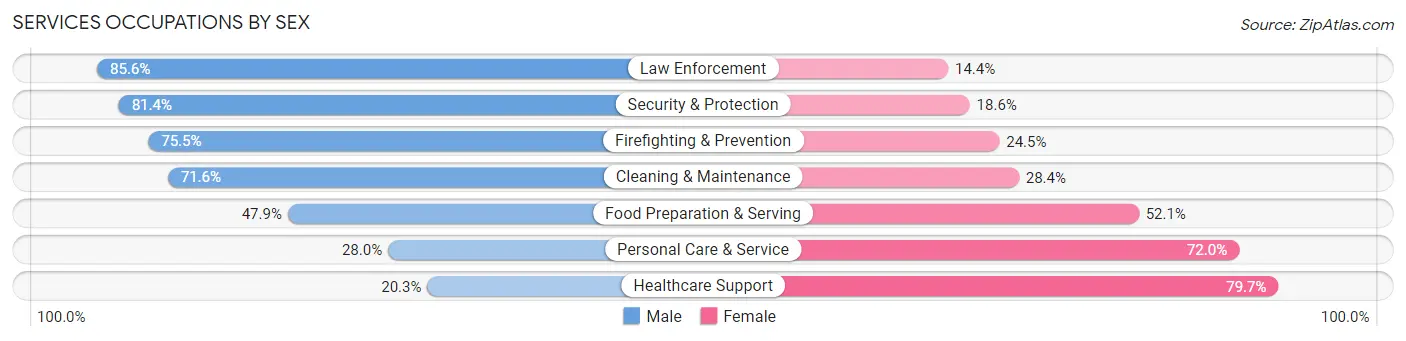
Services Occupations by Sex
Within the Services occupations in Area Code 631, the most male-oriented occupations are Law Enforcement (85.6%), Security & Protection (81.4%), and Firefighting & Prevention (75.5%), while the most female-oriented occupations are Healthcare Support (79.7%), Personal Care & Service (72.0%), and Food Preparation & Serving (52.1%).
| Occupation | Male | Female |
| Healthcare Support | 6,326 (20.3%) | 24,893 (79.7%) |
| Security & Protection | 27,601 (81.4%) | 6,322 (18.6%) |
| Firefighting & Prevention | 10,796 (75.5%) | 3,504 (24.5%) |
| Law Enforcement | 16,805 (85.6%) | 2,818 (14.4%) |
| Food Preparation & Serving | 17,367 (47.9%) | 18,898 (52.1%) |
| Cleaning & Maintenance | 21,067 (71.6%) | 8,340 (28.4%) |
| Personal Care & Service | 7,171 (28.0%) | 18,399 (72.0%) |
| Total (Category) | 79,532 (50.9%) | 76,852 (49.1%) |
| Total (Overall) | 515,606 (53.2%) | 453,706 (46.8%) |
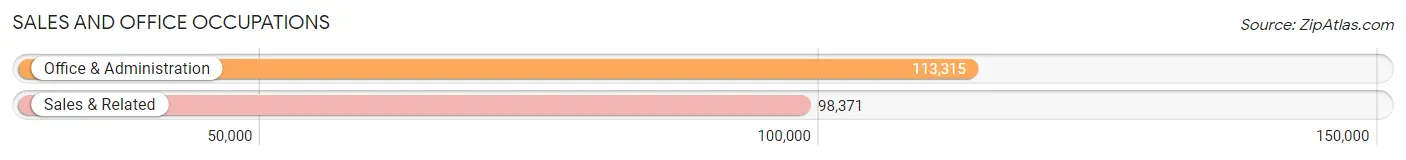
Sales and Office Occupations
The most common Sales and Office occupations in Area Code 631 are Office & Administration (113,315 | 11.7%), and Sales & Related (98,371 | 10.2%).
Sales and Office Occupations by Sex
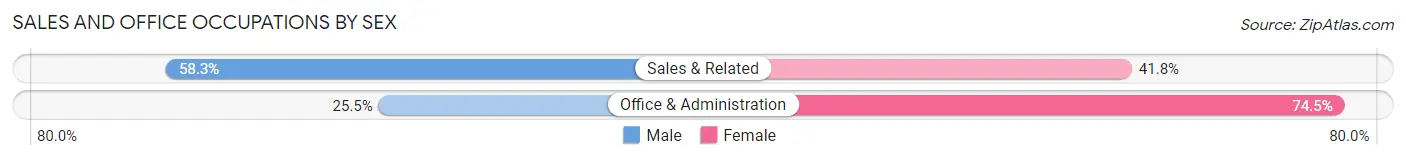
| Occupation | Male | Female |
| Sales & Related | 57,299 (58.3%) | 41,072 (41.7%) |
| Office & Administration | 28,942 (25.5%) | 84,373 (74.5%) |
| Total (Category) | 86,241 (40.7%) | 125,445 (59.3%) |
| Total (Overall) | 515,606 (53.2%) | 453,706 (46.8%) |
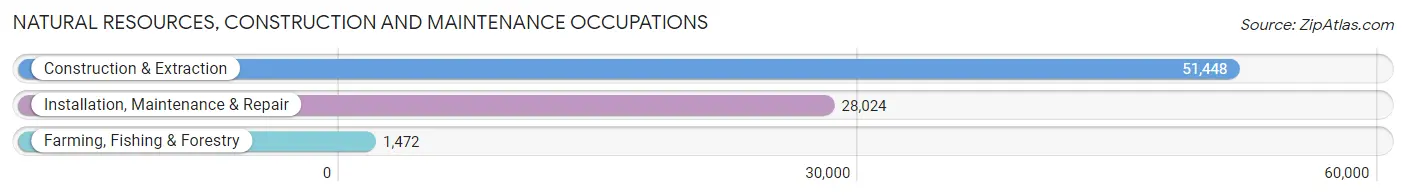
Natural Resources, Construction and Maintenance Occupations
The most common Natural Resources, Construction and Maintenance occupations in Area Code 631 are Construction & Extraction (51,448 | 5.3%), Installation, Maintenance & Repair (28,024 | 2.9%), and Farming, Fishing & Forestry (1,472 | 0.2%).
Natural Resources, Construction and Maintenance Occupations by Sex
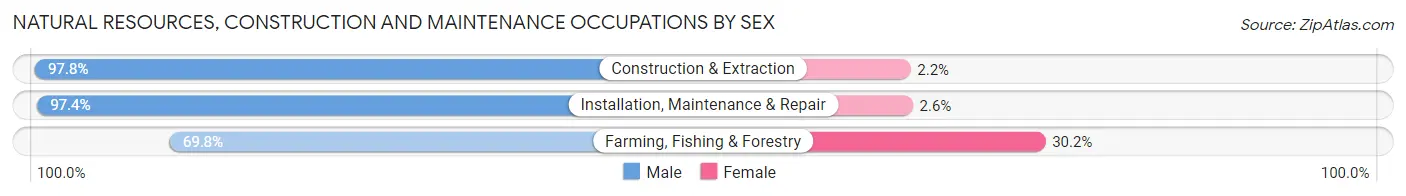
| Occupation | Male | Female |
| Farming, Fishing & Forestry | 1,027 (69.8%) | 445 (30.2%) |
| Construction & Extraction | 50,333 (97.8%) | 1,115 (2.2%) |
| Installation, Maintenance & Repair | 27,285 (97.4%) | 739 (2.6%) |
| Total (Category) | 78,645 (97.2%) | 2,299 (2.8%) |
| Total (Overall) | 515,606 (53.2%) | 453,706 (46.8%) |
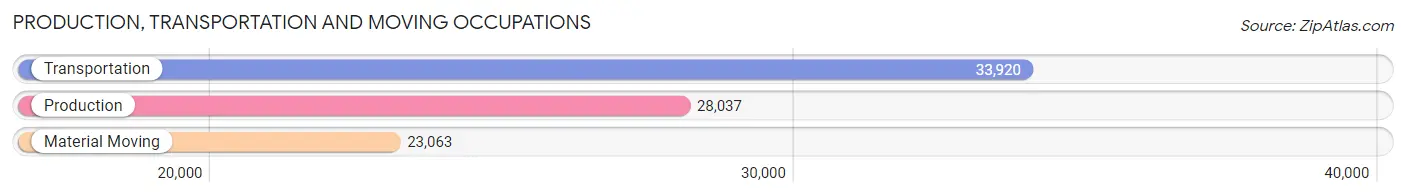
Production, Transportation and Moving Occupations
The most common Production, Transportation and Moving occupations in Area Code 631 are Transportation (33,920 | 3.5%), Production (28,037 | 2.9%), and Material Moving (23,063 | 2.4%).
Production, Transportation and Moving Occupations by Sex
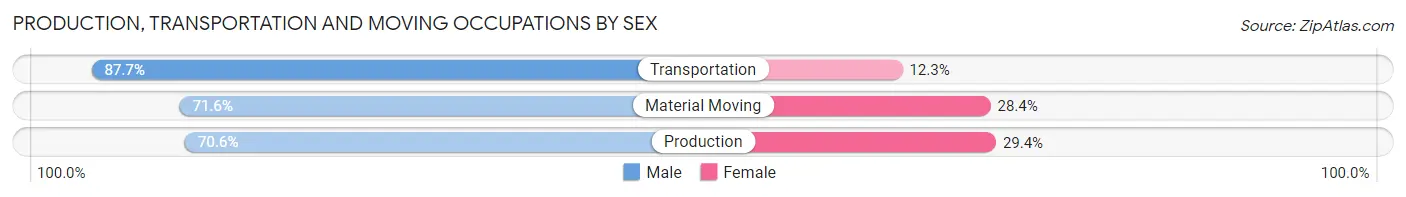
| Occupation | Male | Female |
| Production | 19,785 (70.6%) | 8,252 (29.4%) |
| Transportation | 29,754 (87.7%) | 4,166 (12.3%) |
| Material Moving | 16,503 (71.6%) | 6,560 (28.4%) |
| Total (Category) | 66,042 (77.7%) | 18,978 (22.3%) |
| Total (Overall) | 515,606 (53.2%) | 453,706 (46.8%) |
Employment Industries by Sex in Area Code 631
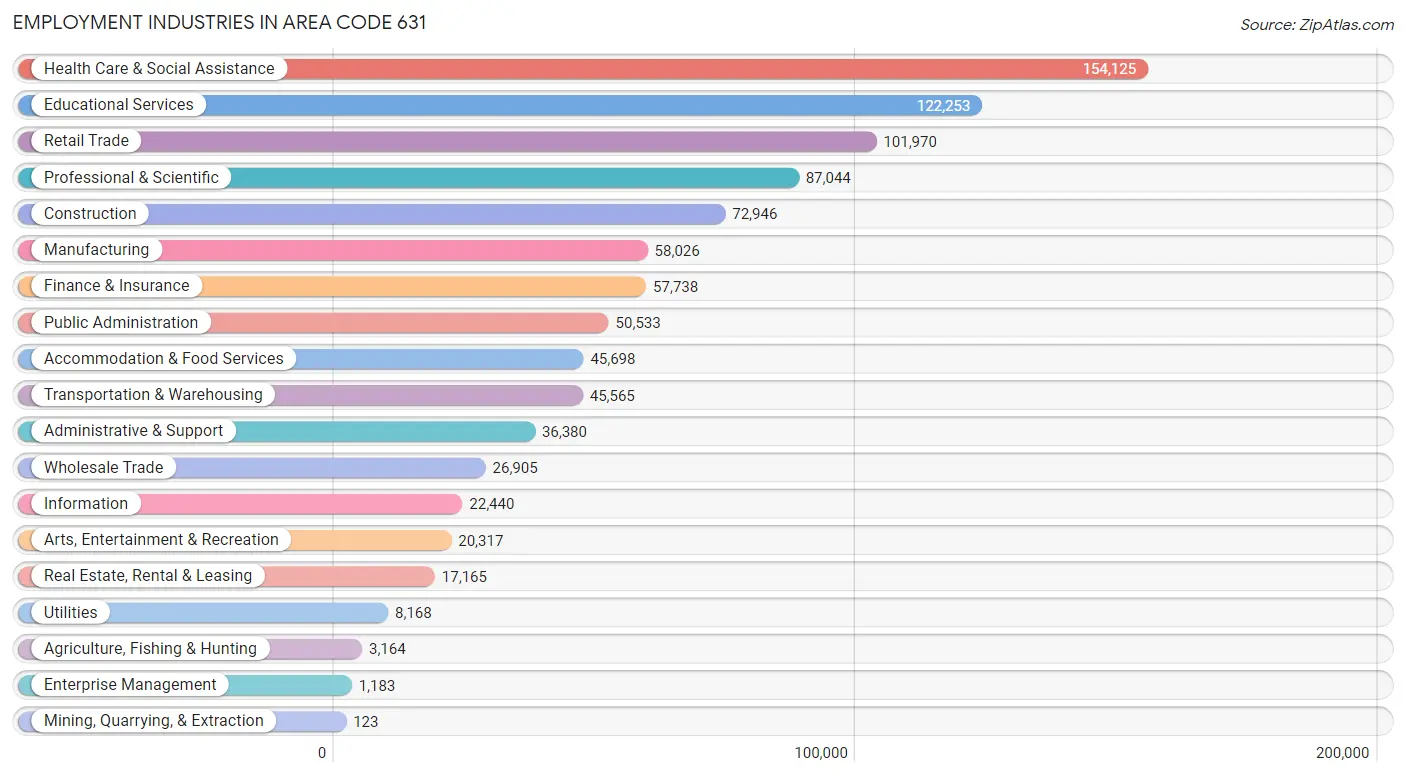
Employment Industries in Area Code 631
The major employment industries in Area Code 631 include Health Care & Social Assistance (154,125 | 15.9%), Educational Services (122,253 | 12.6%), Retail Trade (101,970 | 10.5%), Professional & Scientific (87,044 | 9.0%), and Construction (72,946 | 7.5%).
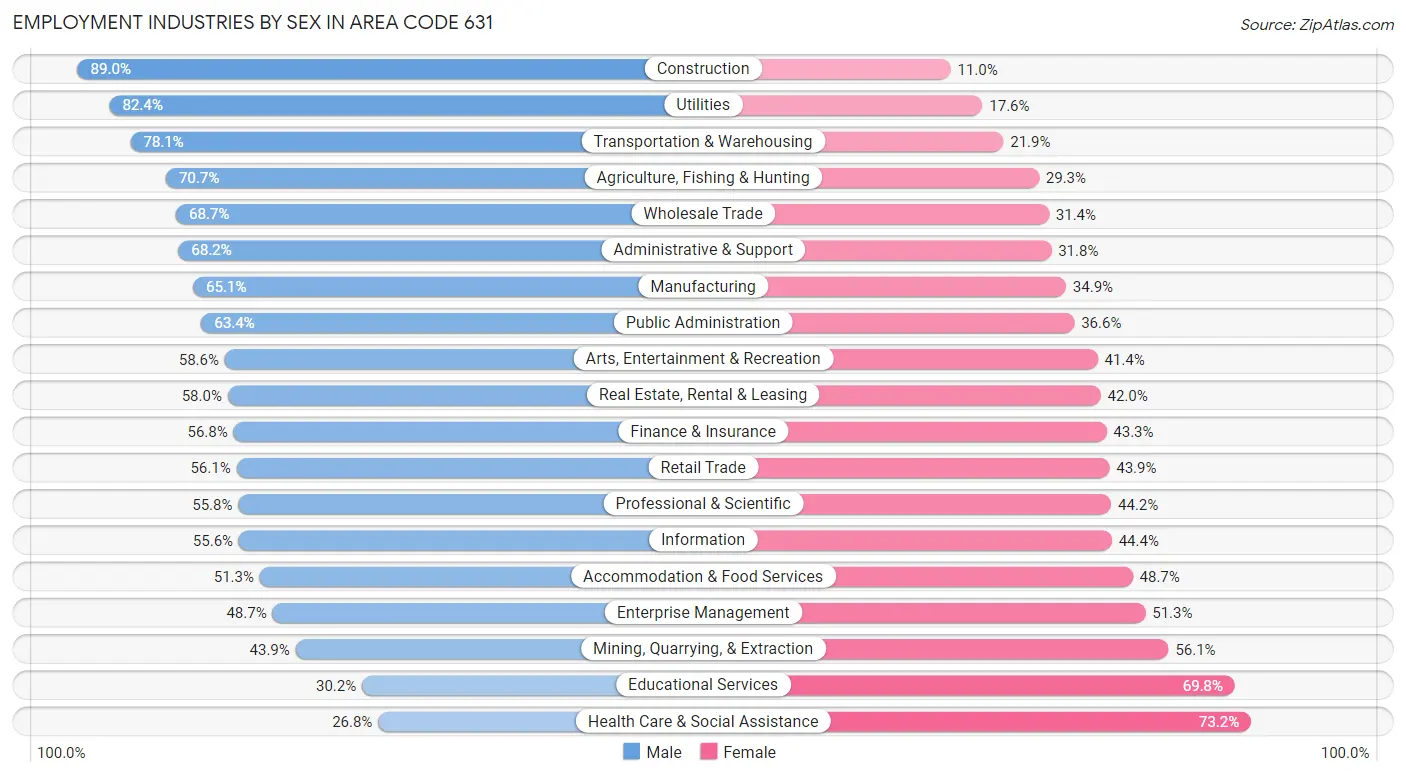
Employment Industries by Sex in Area Code 631
The Area Code 631 industries that see more men than women are Construction (89.0%), Utilities (82.4%), and Transportation & Warehousing (78.1%), whereas the industries that tend to have a higher number of women are Health Care & Social Assistance (73.2%), Educational Services (69.8%), and Mining, Quarrying, & Extraction (56.1%).
| Industry | Male | Female |
| Agriculture, Fishing & Hunting | 2,238 (70.7%) | 926 (29.3%) |
| Mining, Quarrying, & Extraction | 54 (43.9%) | 69 (56.1%) |
| Construction | 64,926 (89.0%) | 8,020 (11.0%) |
| Manufacturing | 37,791 (65.1%) | 20,235 (34.9%) |
| Wholesale Trade | 18,470 (68.6%) | 8,435 (31.4%) |
| Retail Trade | 57,247 (56.1%) | 44,723 (43.9%) |
| Transportation & Warehousing | 35,580 (78.1%) | 9,985 (21.9%) |
| Utilities | 6,732 (82.4%) | 1,436 (17.6%) |
| Information | 12,486 (55.6%) | 9,954 (44.4%) |
| Finance & Insurance | 32,764 (56.8%) | 24,974 (43.2%) |
| Real Estate, Rental & Leasing | 9,948 (58.0%) | 7,217 (42.0%) |
| Professional & Scientific | 48,541 (55.8%) | 38,503 (44.2%) |
| Enterprise Management | 576 (48.7%) | 607 (51.3%) |
| Administrative & Support | 24,798 (68.2%) | 11,582 (31.8%) |
| Educational Services | 36,869 (30.2%) | 85,384 (69.8%) |
| Health Care & Social Assistance | 41,323 (26.8%) | 112,802 (73.2%) |
| Arts, Entertainment & Recreation | 11,899 (58.6%) | 8,418 (41.4%) |
| Accommodation & Food Services | 23,453 (51.3%) | 22,245 (48.7%) |
| Public Administration | 32,038 (63.4%) | 18,495 (36.6%) |
| Total | 515,606 (53.2%) | 453,706 (46.8%) |
Education in Area Code 631
School Enrollment in Area Code 631
The most common levels of schooling among the 451,450 students in Area Code 631 are high school (101,241 | 22.4%), college / undergraduate (100,375 | 22.2%), and middle school (90,744 | 20.1%).
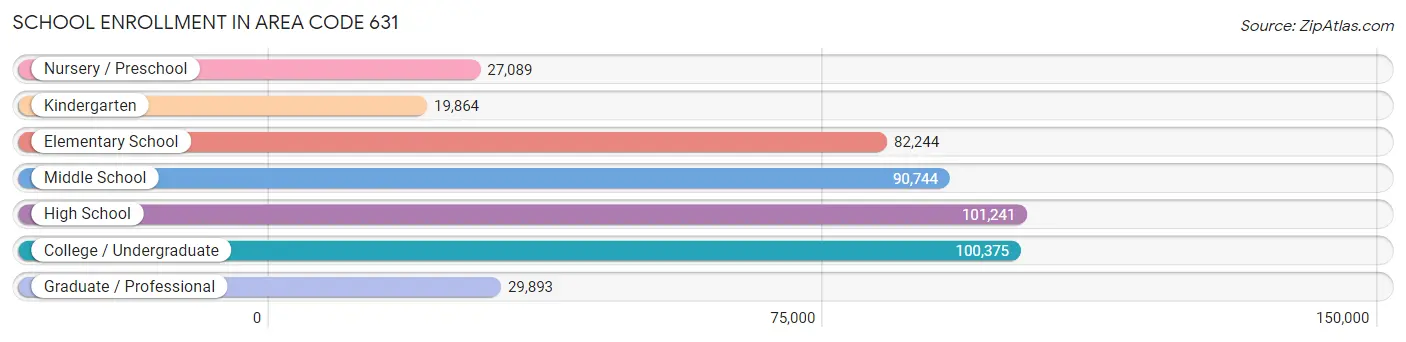
| School Level | # Students | % Students |
| Nursery / Preschool | 27,089 | 6.0% |
| Kindergarten | 19,864 | 4.4% |
| Elementary School | 82,244 | 18.2% |
| Middle School | 90,744 | 20.1% |
| High School | 101,241 | 22.4% |
| College / Undergraduate | 100,375 | 22.2% |
| Graduate / Professional | 29,893 | 6.6% |
| Total | 451,450 | 100.0% |
School Enrollment by Age by Funding Source in Area Code 631
Out of a total of 451,450 students who are enrolled in schools in Area Code 631, 76,483 (16.9%) attend a private institution, while the remaining 374,967 (83.1%) are enrolled in public schools. The age group of 3 to 4 year olds has the highest likelihood of being enrolled in private schools, with 10,587 (44.7% in the age bracket) enrolled. Conversely, the age group of 10 to 14 year olds has the lowest likelihood of being enrolled in a private school, with 107,019 (94.2% in the age bracket) attending a public institution.
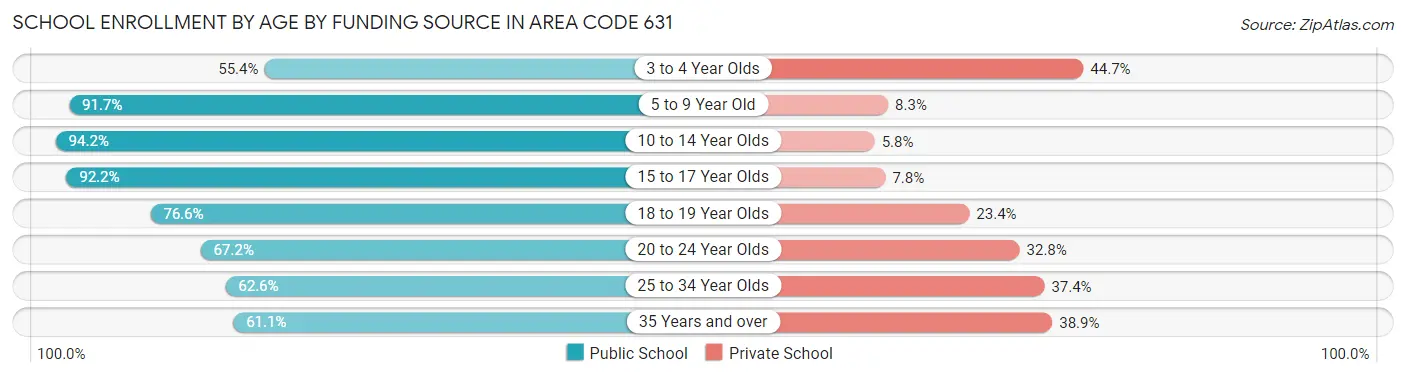
| Age Bracket | Public School | Private School |
| 3 to 4 Year Olds | 13,123 (55.3%) | 10,587 (44.7%) |
| 5 to 9 Year Old | 91,358 (91.7%) | 8,262 (8.3%) |
| 10 to 14 Year Olds | 107,019 (94.2%) | 6,576 (5.8%) |
| 15 to 17 Year Olds | 66,391 (92.2%) | 5,599 (7.8%) |
| 18 to 19 Year Olds | 30,518 (76.6%) | 9,333 (23.4%) |
| 20 to 24 Year Olds | 38,167 (67.2%) | 18,604 (32.8%) |
| 25 to 34 Year Olds | 15,159 (62.6%) | 9,058 (37.4%) |
| 35 Years and over | 13,266 (61.1%) | 8,430 (38.9%) |
| Total | 374,967 (83.1%) | 76,483 (16.9%) |
Educational Attainment by Field of Study in Area Code 631
Business (124,074 | 21.3%), education (80,980 | 13.9%), science & technology (61,200 | 10.5%), social sciences (48,608 | 8.3%), and psychology (33,976 | 5.8%) are the most common fields of study among 583,106 individuals in Area Code 631 who have obtained a bachelor's degree or higher.
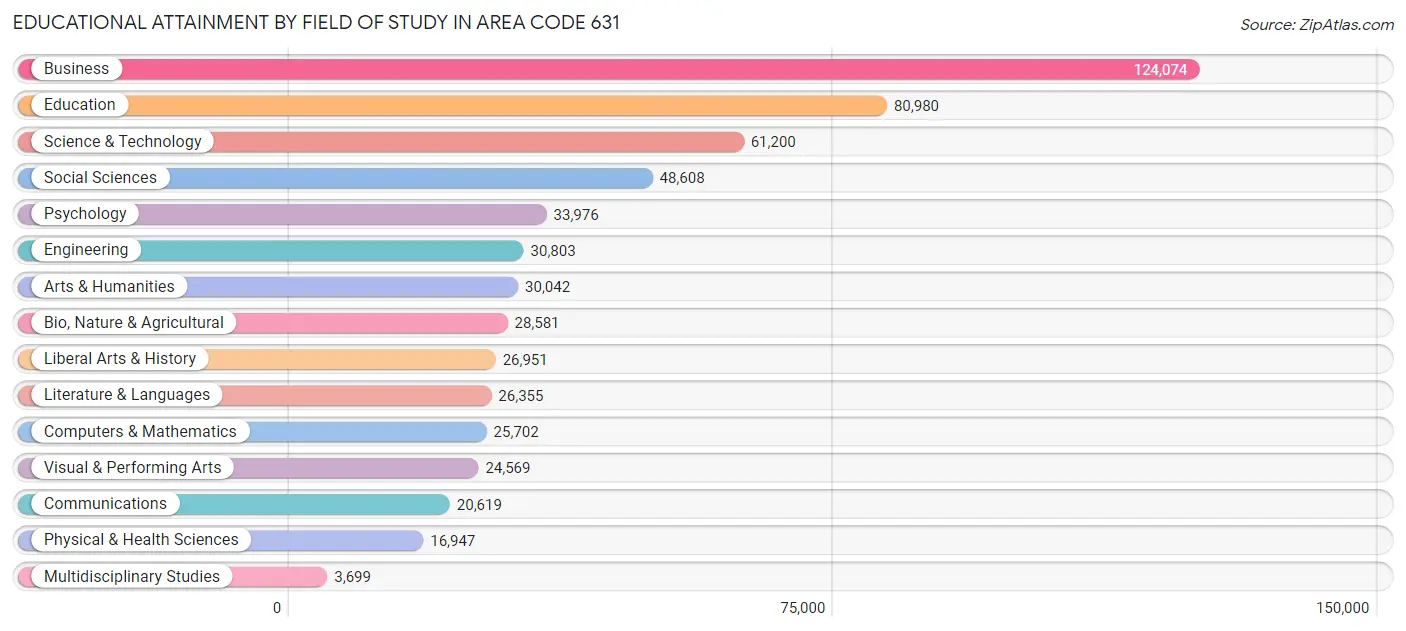
| Field of Study | # Graduates | % Graduates |
| Computers & Mathematics | 25,702 | 4.4% |
| Bio, Nature & Agricultural | 28,581 | 4.9% |
| Physical & Health Sciences | 16,947 | 2.9% |
| Psychology | 33,976 | 5.8% |
| Social Sciences | 48,608 | 8.3% |
| Engineering | 30,803 | 5.3% |
| Multidisciplinary Studies | 3,699 | 0.6% |
| Science & Technology | 61,200 | 10.5% |
| Business | 124,074 | 21.3% |
| Education | 80,980 | 13.9% |
| Literature & Languages | 26,355 | 4.5% |
| Liberal Arts & History | 26,951 | 4.6% |
| Visual & Performing Arts | 24,569 | 4.2% |
| Communications | 20,619 | 3.5% |
| Arts & Humanities | 30,042 | 5.1% |
| Total | 583,106 | 100.0% |
Transportation & Commute in Area Code 631
Vehicle Availability by Sex in Area Code 631
The most prevalent vehicle ownership categories in Area Code 631 are males with 2 vehicles (197,104, accounting for 39.0%) and females with 2 vehicles (167,374, making up 44.8%).
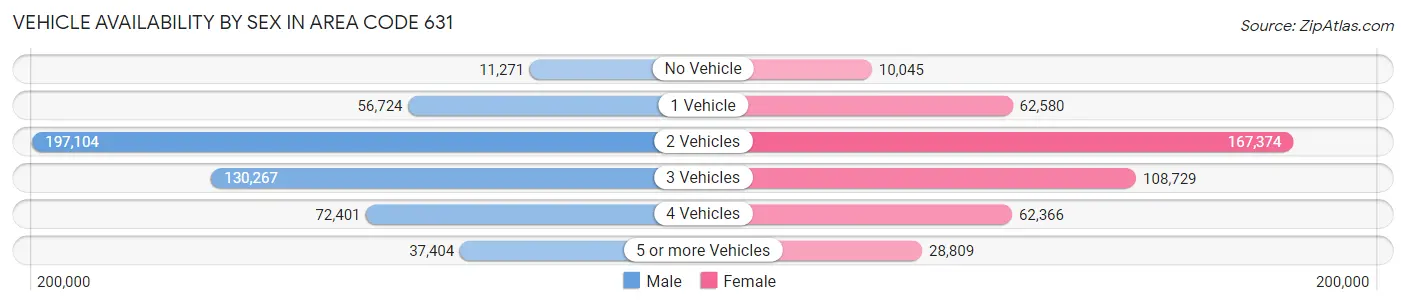
| Vehicles Available | Male | Female |
| No Vehicle | 11,271 (2.2%) | 10,045 (2.3%) |
| 1 Vehicle | 56,724 (11.2%) | 62,580 (14.2%) |
| 2 Vehicles | 197,104 (39.0%) | 167,374 (38.1%) |
| 3 Vehicles | 130,267 (25.8%) | 108,729 (24.7%) |
| 4 Vehicles | 72,401 (14.3%) | 62,366 (14.2%) |
| 5 or more Vehicles | 37,404 (7.4%) | 28,809 (6.6%) |
| Total | 505,171 (100.0%) | 439,903 (100.0%) |
Commute Time in Area Code 631
The most frequently occuring commute durations in Area Code 631 are 30 to 34 minutes (125,833 commuters, 14.7%), 20 to 24 minutes (112,838 commuters, 13.2%), and 15 to 19 minutes (112,018 commuters, 13.1%).
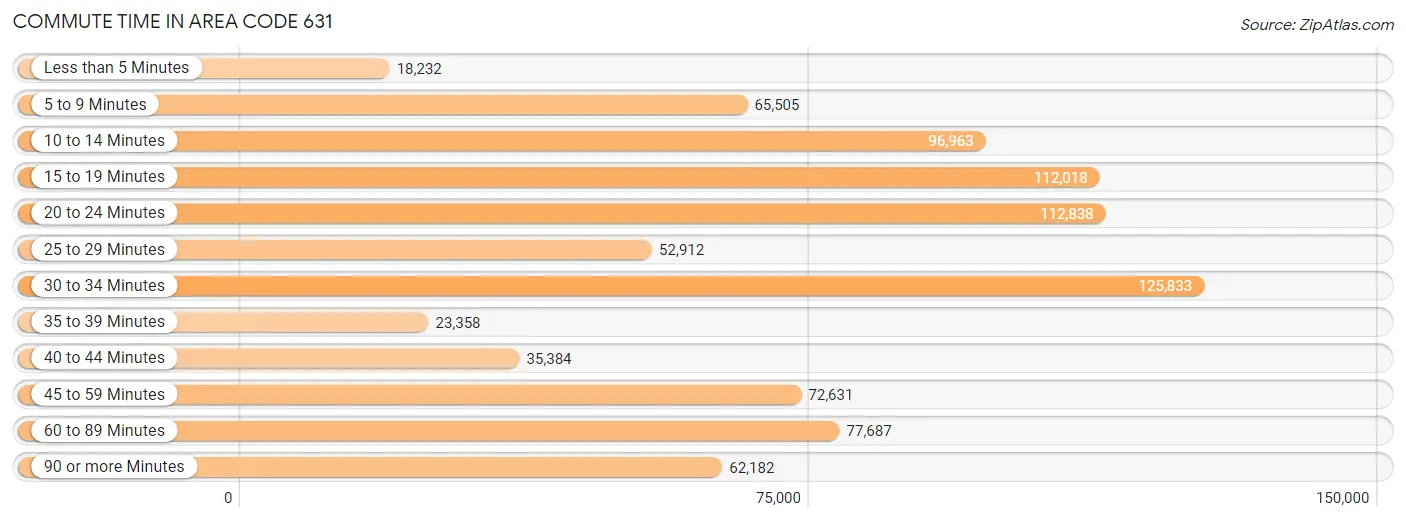
| Commute Time | # Commuters | % Commuters |
| Less than 5 Minutes | 18,232 | 2.1% |
| 5 to 9 Minutes | 65,505 | 7.7% |
| 10 to 14 Minutes | 96,963 | 11.3% |
| 15 to 19 Minutes | 112,018 | 13.1% |
| 20 to 24 Minutes | 112,838 | 13.2% |
| 25 to 29 Minutes | 52,912 | 6.2% |
| 30 to 34 Minutes | 125,833 | 14.7% |
| 35 to 39 Minutes | 23,358 | 2.7% |
| 40 to 44 Minutes | 35,384 | 4.1% |
| 45 to 59 Minutes | 72,631 | 8.5% |
| 60 to 89 Minutes | 77,687 | 9.1% |
| 90 or more Minutes | 62,182 | 7.3% |
Commute Time by Sex in Area Code 631
The most common commute times in Area Code 631 are 30 to 34 minutes (68,931 commuters, 15.0%) for males and 15 to 19 minutes (57,688 commuters, 14.6%) for females.
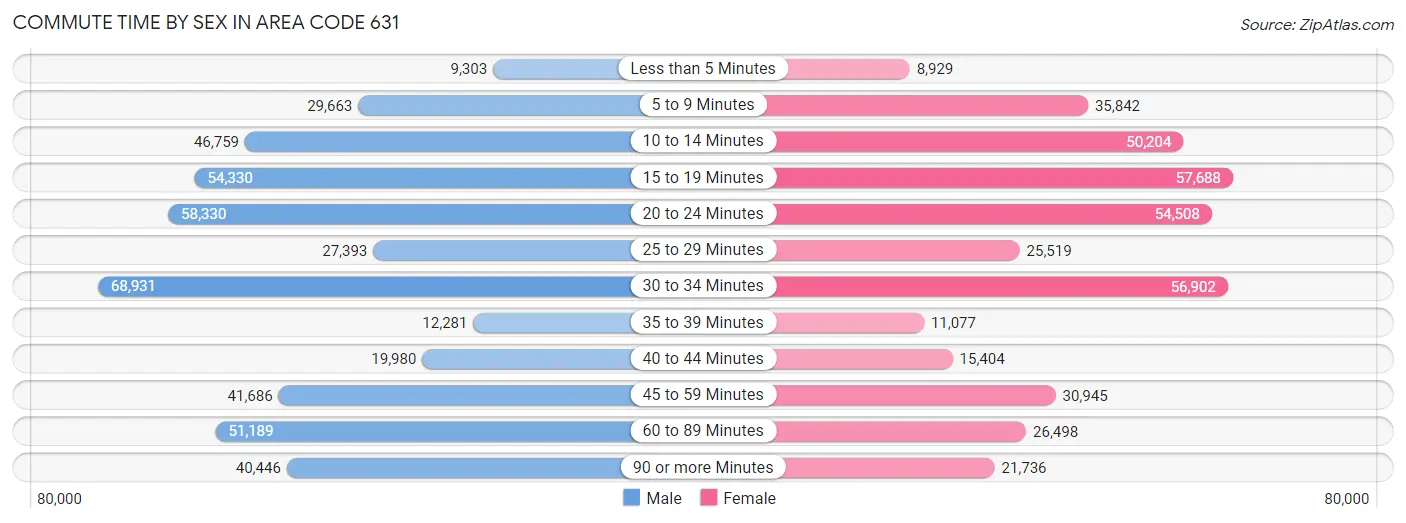
| Commute Time | Male | Female |
| Less than 5 Minutes | 9,303 (2.0%) | 8,929 (2.3%) |
| 5 to 9 Minutes | 29,663 (6.4%) | 35,842 (9.1%) |
| 10 to 14 Minutes | 46,759 (10.2%) | 50,204 (12.7%) |
| 15 to 19 Minutes | 54,330 (11.8%) | 57,688 (14.6%) |
| 20 to 24 Minutes | 58,330 (12.7%) | 54,508 (13.8%) |
| 25 to 29 Minutes | 27,393 (5.9%) | 25,519 (6.5%) |
| 30 to 34 Minutes | 68,931 (15.0%) | 56,902 (14.4%) |
| 35 to 39 Minutes | 12,281 (2.7%) | 11,077 (2.8%) |
| 40 to 44 Minutes | 19,980 (4.3%) | 15,404 (3.9%) |
| 45 to 59 Minutes | 41,686 (9.1%) | 30,945 (7.8%) |
| 60 to 89 Minutes | 51,189 (11.1%) | 26,498 (6.7%) |
| 90 or more Minutes | 40,446 (8.8%) | 21,736 (5.5%) |
Time of Departure to Work by Sex in Area Code 631
The most frequent times of departure to work in Area Code 631 are 7:00 AM to 7:29 AM (67,028, 14.6%) for males and 8:00 AM to 8:29 AM (69,251, 17.5%) for females.
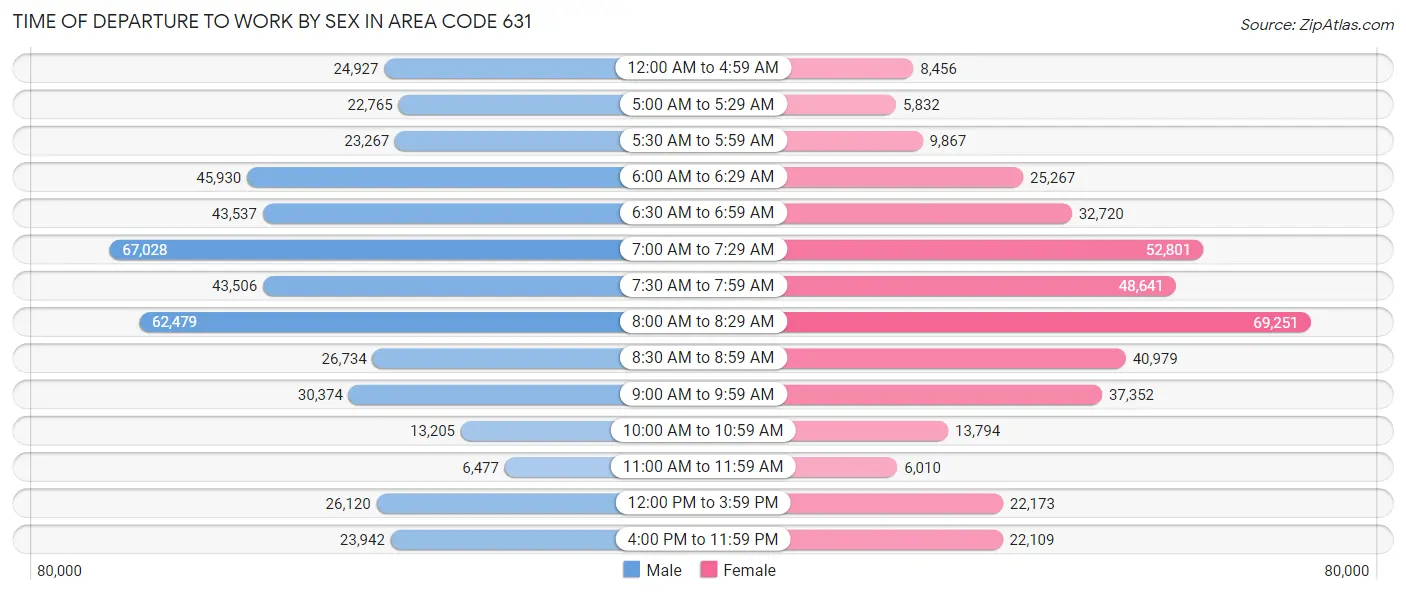
| Time of Departure | Male | Female |
| 12:00 AM to 4:59 AM | 24,927 (5.4%) | 8,456 (2.1%) |
| 5:00 AM to 5:29 AM | 22,765 (5.0%) | 5,832 (1.5%) |
| 5:30 AM to 5:59 AM | 23,267 (5.1%) | 9,867 (2.5%) |
| 6:00 AM to 6:29 AM | 45,930 (10.0%) | 25,267 (6.4%) |
| 6:30 AM to 6:59 AM | 43,537 (9.5%) | 32,720 (8.3%) |
| 7:00 AM to 7:29 AM | 67,028 (14.6%) | 52,801 (13.4%) |
| 7:30 AM to 7:59 AM | 43,506 (9.5%) | 48,641 (12.3%) |
| 8:00 AM to 8:29 AM | 62,479 (13.6%) | 69,251 (17.5%) |
| 8:30 AM to 8:59 AM | 26,734 (5.8%) | 40,979 (10.4%) |
| 9:00 AM to 9:59 AM | 30,374 (6.6%) | 37,352 (9.5%) |
| 10:00 AM to 10:59 AM | 13,205 (2.9%) | 13,794 (3.5%) |
| 11:00 AM to 11:59 AM | 6,477 (1.4%) | 6,010 (1.5%) |
| 12:00 PM to 3:59 PM | 26,120 (5.7%) | 22,173 (5.6%) |
| 4:00 PM to 11:59 PM | 23,942 (5.2%) | 22,109 (5.6%) |
| Total | 460,291 (100.0%) | 395,252 (100.0%) |
Housing Occupancy in Area Code 631
Occupancy by Ownership in Area Code 631
Of the total 629,905 dwellings in Area Code 631, owner-occupied units account for 524,637 (83.3%), while renter-occupied units make up 105,268 (16.7%).
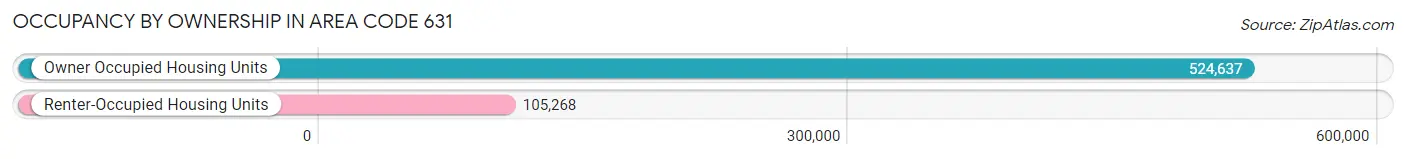
| Occupancy | # Housing Units | % Housing Units |
| Owner Occupied Housing Units | 524,637 | 83.3% |
| Renter-Occupied Housing Units | 105,268 | 16.7% |
| Total Occupied Housing Units | 629,905 | 100.0% |
Occupancy by Household Size in Area Code 631
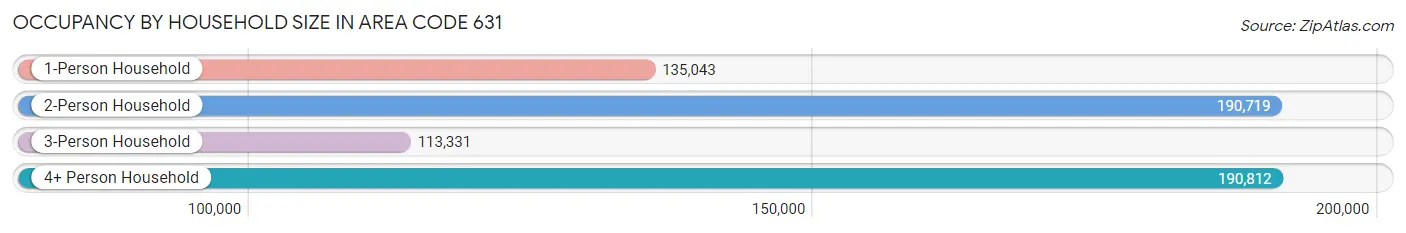
| Household Size | # Housing Units | % Housing Units |
| 1-Person Household | 135,043 | 21.4% |
| 2-Person Household | 190,719 | 30.3% |
| 3-Person Household | 113,331 | 18.0% |
| 4+ Person Household | 190,812 | 30.3% |
| Total Housing Units | 629,905 | 100.0% |
Occupancy by Ownership by Household Size in Area Code 631
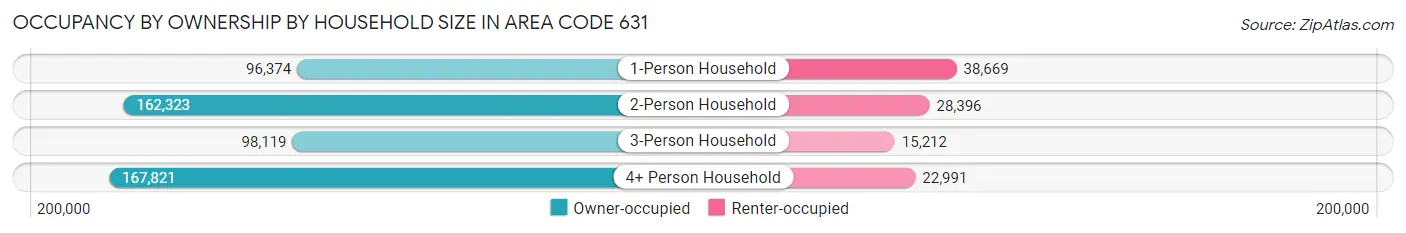
| Household Size | Owner-occupied | Renter-occupied |
| 1-Person Household | 96,374 (71.4%) | 38,669 (28.6%) |
| 2-Person Household | 162,323 (85.1%) | 28,396 (14.9%) |
| 3-Person Household | 98,119 (86.6%) | 15,212 (13.4%) |
| 4+ Person Household | 167,821 (87.9%) | 22,991 (12.0%) |
| Total Housing Units | 524,637 (83.3%) | 105,268 (16.7%) |
Occupancy by Educational Attainment in Area Code 631
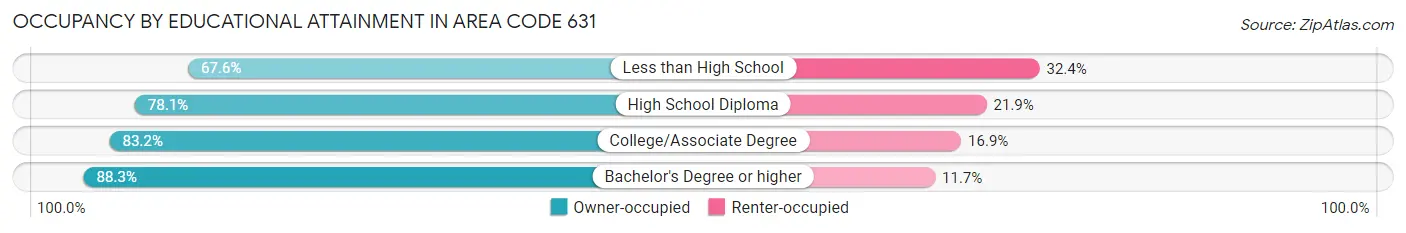
| Household Size | Owner-occupied | Renter-occupied |
| Less than High School | 28,576 (67.6%) | 13,697 (32.4%) |
| High School Diploma | 108,867 (78.1%) | 30,499 (21.9%) |
| College/Associate Degree | 140,164 (83.2%) | 28,410 (16.9%) |
| Bachelor's Degree or higher | 247,030 (88.3%) | 32,662 (11.7%) |
Occupancy by Age of Householder in Area Code 631
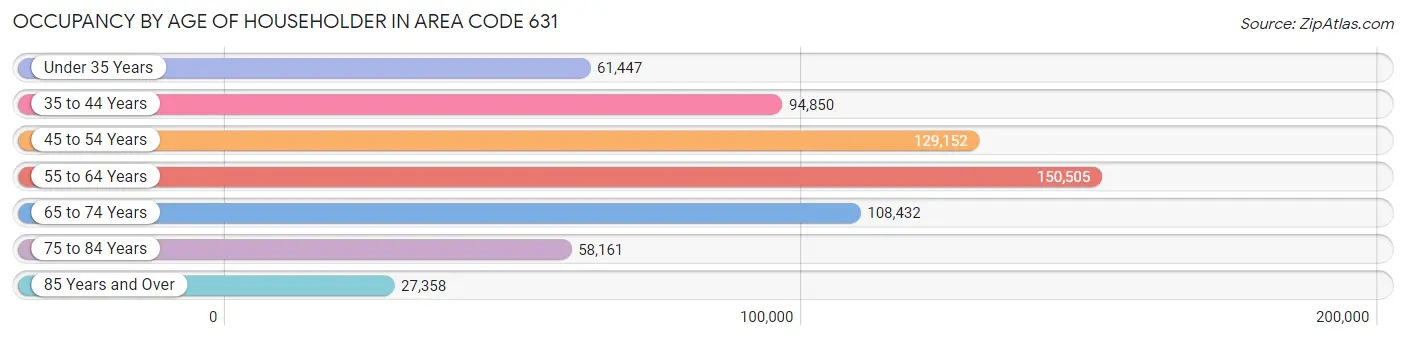
| Age Bracket | # Households | % Households |
| Under 35 Years | 61,447 | 9.8% |
| 35 to 44 Years | 94,850 | 15.1% |
| 45 to 54 Years | 129,152 | 20.5% |
| 55 to 64 Years | 150,505 | 23.9% |
| 65 to 74 Years | 108,432 | 17.2% |
| 75 to 84 Years | 58,161 | 9.2% |
| 85 Years and Over | 27,358 | 4.3% |
| Total | 629,905 | 100.0% |
Housing Finances in Area Code 631
Median Income by Occupancy in Area Code 631
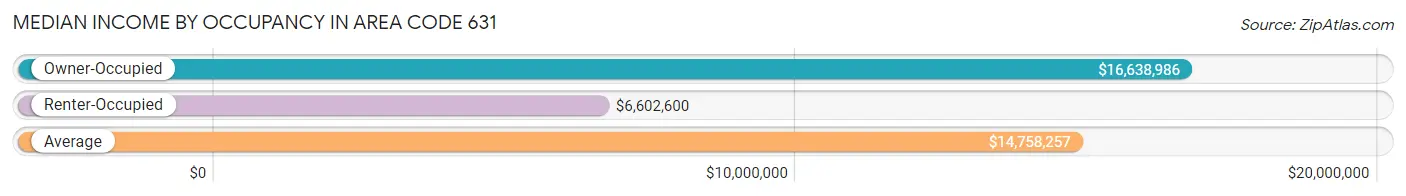
| Occupancy Type | # Households | Median Income |
| Owner-Occupied | 524,637 (83.3%) | $16,638,986 |
| Renter-Occupied | 105,268 (16.7%) | $6,602,600 |
| Average | 629,905 (100.0%) | $14,758,257 |
Occupancy by Householder Income Bracket in Area Code 631
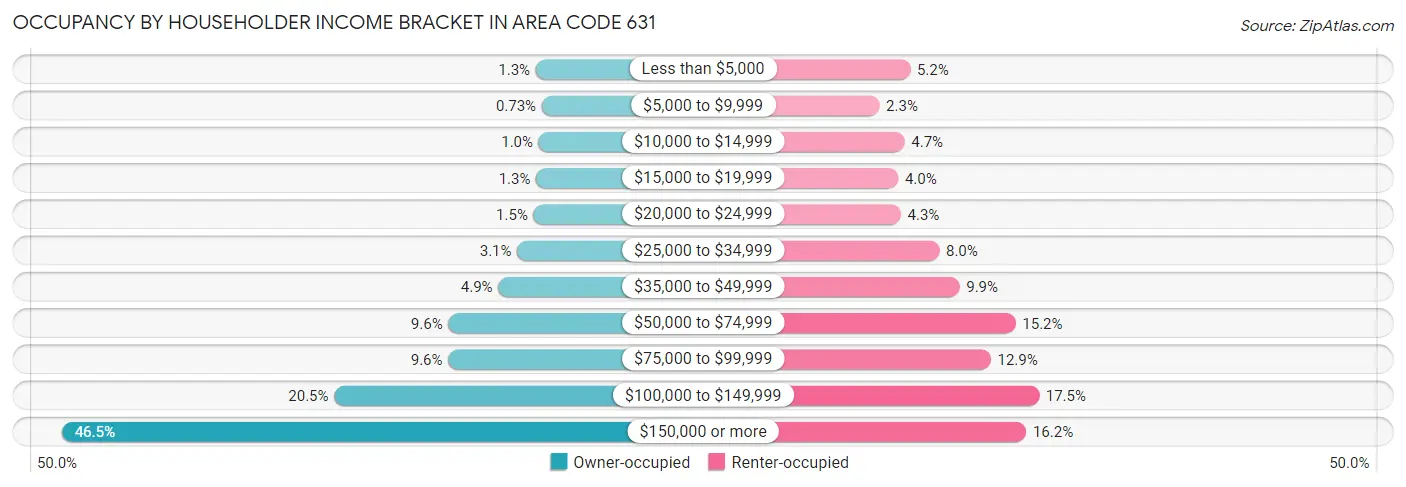
| Income Bracket | Owner-occupied | Renter-occupied |
| Less than $5,000 | 6,832 (1.3%) | 5,453 (5.2%) |
| $5,000 to $9,999 | 3,816 (0.7%) | 2,367 (2.2%) |
| $10,000 to $14,999 | 5,344 (1.0%) | 4,894 (4.6%) |
| $15,000 to $19,999 | 6,683 (1.3%) | 4,253 (4.0%) |
| $20,000 to $24,999 | 7,928 (1.5%) | 4,518 (4.3%) |
| $25,000 to $34,999 | 16,098 (3.1%) | 8,364 (8.0%) |
| $35,000 to $49,999 | 25,532 (4.9%) | 10,402 (9.9%) |
| $50,000 to $74,999 | 50,529 (9.6%) | 16,027 (15.2%) |
| $75,000 to $99,999 | 50,596 (9.6%) | 13,538 (12.9%) |
| $100,000 to $149,999 | 107,527 (20.5%) | 18,369 (17.4%) |
| $150,000 or more | 243,752 (46.5%) | 17,083 (16.2%) |
| Total | 524,637 (100.0%) | 105,268 (100.0%) |
Monthly Housing Cost Tiers in Area Code 631
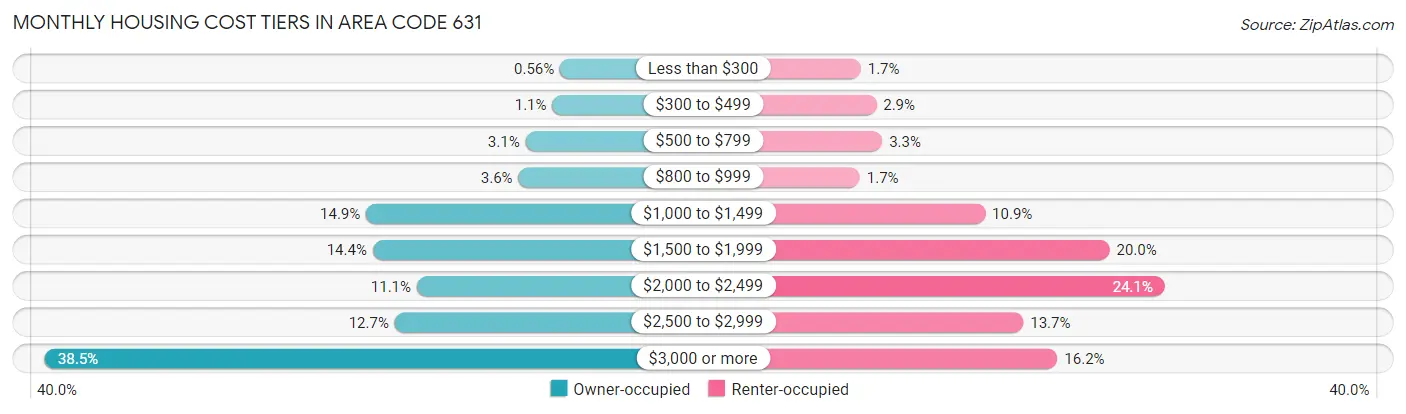
| Monthly Cost | Owner-occupied | Renter-occupied |
| Less than $300 | 2,937 (0.6%) | 1,806 (1.7%) |
| $300 to $499 | 5,936 (1.1%) | 3,008 (2.9%) |
| $500 to $799 | 16,307 (3.1%) | 3,474 (3.3%) |
| $800 to $999 | 19,057 (3.6%) | 1,737 (1.7%) |
| $1,000 to $1,499 | 77,912 (14.8%) | 11,451 (10.9%) |
| $1,500 to $1,999 | 75,351 (14.4%) | 21,092 (20.0%) |
| $2,000 to $2,499 | 58,292 (11.1%) | 25,379 (24.1%) |
| $2,500 to $2,999 | 66,837 (12.7%) | 14,409 (13.7%) |
| $3,000 or more | 202,008 (38.5%) | 17,057 (16.2%) |
| Total | 524,637 (100.0%) | 105,268 (100.0%) |
Physical Housing Characteristics in Area Code 631
Housing Structures in Area Code 631
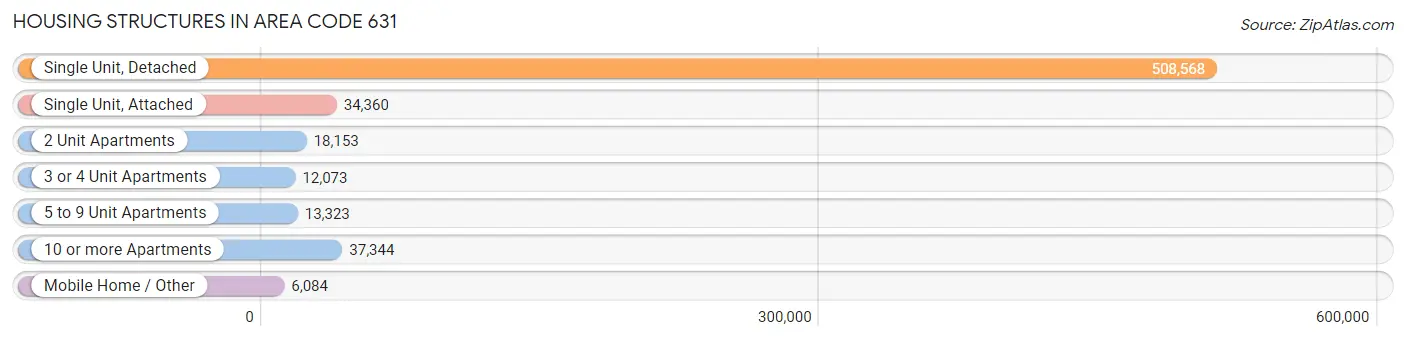
| Structure Type | # Housing Units | % Housing Units |
| Single Unit, Detached | 508,568 | 80.7% |
| Single Unit, Attached | 34,360 | 5.4% |
| 2 Unit Apartments | 18,153 | 2.9% |
| 3 or 4 Unit Apartments | 12,073 | 1.9% |
| 5 to 9 Unit Apartments | 13,323 | 2.1% |
| 10 or more Apartments | 37,344 | 5.9% |
| Mobile Home / Other | 6,084 | 1.0% |
| Total | 629,905 | 100.0% |
Housing Structures by Occupancy in Area Code 631
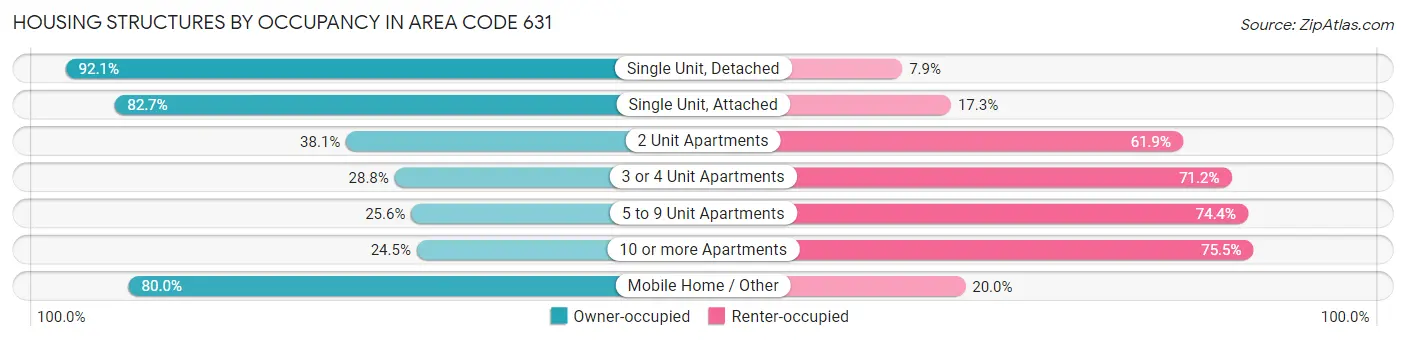
| Structure Type | Owner-occupied | Renter-occupied |
| Single Unit, Detached | 468,413 (92.1%) | 40,155 (7.9%) |
| Single Unit, Attached | 28,418 (82.7%) | 5,942 (17.3%) |
| 2 Unit Apartments | 6,914 (38.1%) | 11,239 (61.9%) |
| 3 or 4 Unit Apartments | 3,472 (28.8%) | 8,601 (71.2%) |
| 5 to 9 Unit Apartments | 3,406 (25.6%) | 9,917 (74.4%) |
| 10 or more Apartments | 9,149 (24.5%) | 28,195 (75.5%) |
| Mobile Home / Other | 4,865 (80.0%) | 1,219 (20.0%) |
| Total | 524,637 (83.3%) | 105,268 (16.7%) |
Housing Structures by Number of Rooms in Area Code 631
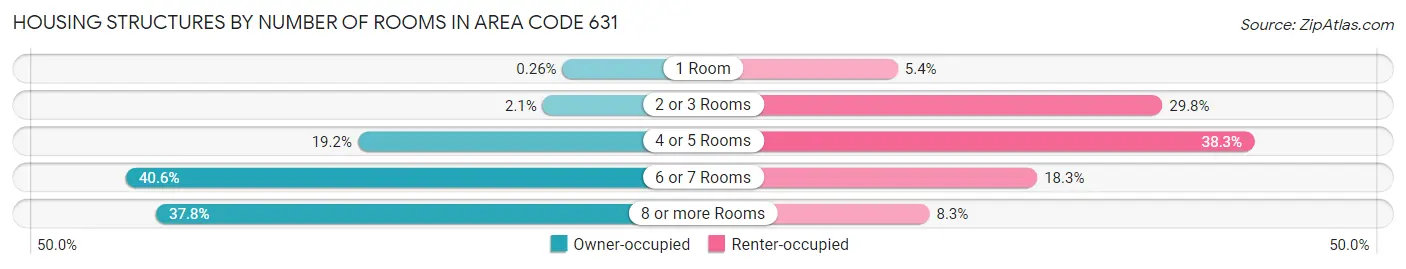
| Number of Rooms | Owner-occupied | Renter-occupied |
| 1 Room | 1,339 (0.3%) | 5,643 (5.4%) |
| 2 or 3 Rooms | 10,979 (2.1%) | 31,390 (29.8%) |
| 4 or 5 Rooms | 100,659 (19.2%) | 40,294 (38.3%) |
| 6 or 7 Rooms | 213,133 (40.6%) | 19,214 (18.2%) |
| 8 or more Rooms | 198,527 (37.8%) | 8,727 (8.3%) |
| Total | 524,637 (100.0%) | 105,268 (100.0%) |
Housing Structure by Heating Type in Area Code 631
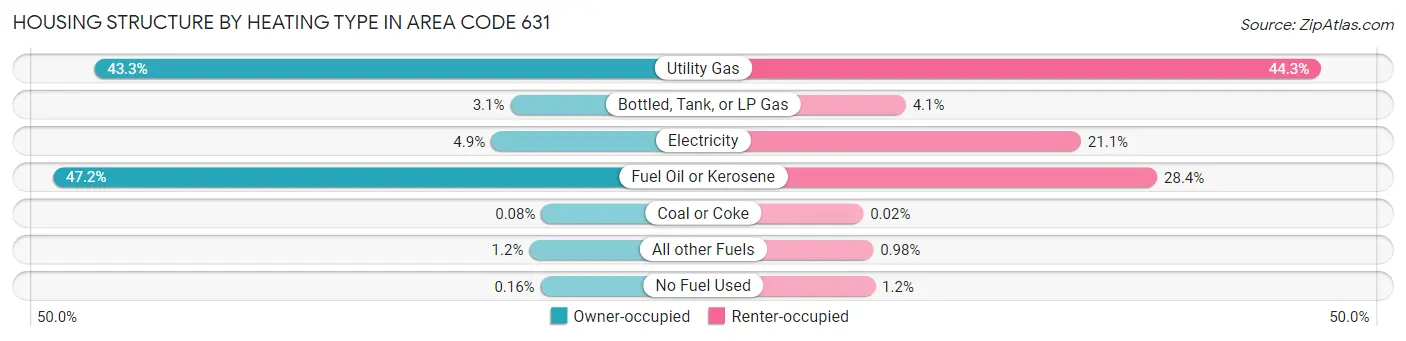
| Heating Type | Owner-occupied | Renter-occupied |
| Utility Gas | 226,977 (43.3%) | 46,578 (44.3%) |
| Bottled, Tank, or LP Gas | 16,128 (3.1%) | 4,338 (4.1%) |
| Electricity | 25,919 (4.9%) | 22,161 (21.0%) |
| Fuel Oil or Kerosene | 247,852 (47.2%) | 29,903 (28.4%) |
| Coal or Coke | 419 (0.1%) | 20 (0.0%) |
| All other Fuels | 6,486 (1.2%) | 1,033 (1.0%) |
| No Fuel Used | 856 (0.2%) | 1,235 (1.2%) |
| Total | 524,637 (100.0%) | 105,268 (100.0%) |
Household Vehicle Usage in Area Code 631
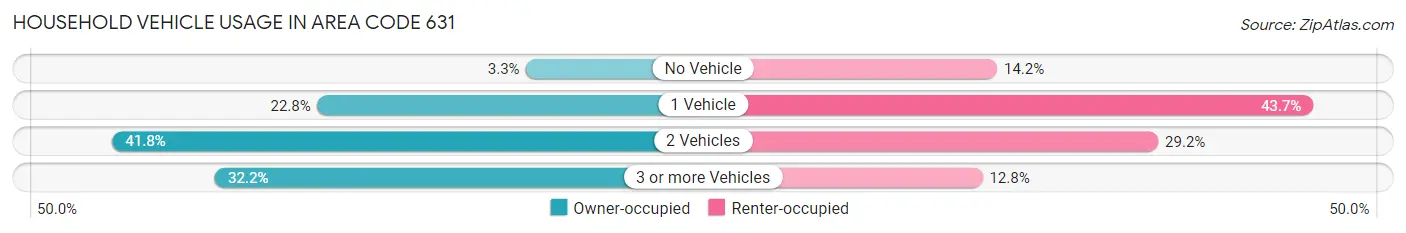
| Vehicles per Household | Owner-occupied | Renter-occupied |
| No Vehicle | 17,034 (3.3%) | 14,953 (14.2%) |
| 1 Vehicle | 119,346 (22.8%) | 46,016 (43.7%) |
| 2 Vehicles | 219,295 (41.8%) | 30,784 (29.2%) |
| 3 or more Vehicles | 168,962 (32.2%) | 13,515 (12.8%) |
| Total | 524,637 (100.0%) | 105,268 (100.0%) |
Real Estate & Mortgages in Area Code 631
Real Estate and Mortgage Overview in Area Code 631
| Characteristic | Without Mortgage | With Mortgage |
| Housing Units | 195,007 | 329,630 |
| Median Property Value | $75,461,604 | $77,682,105 |
| Median Household Income | $11,539,734 | $177,610 |
| Monthly Housing Costs | $155,979 | $195,041 |
| Real Estate Taxes | $1,022,687 | $4,386 |
Property Value by Mortgage Status in Area Code 631
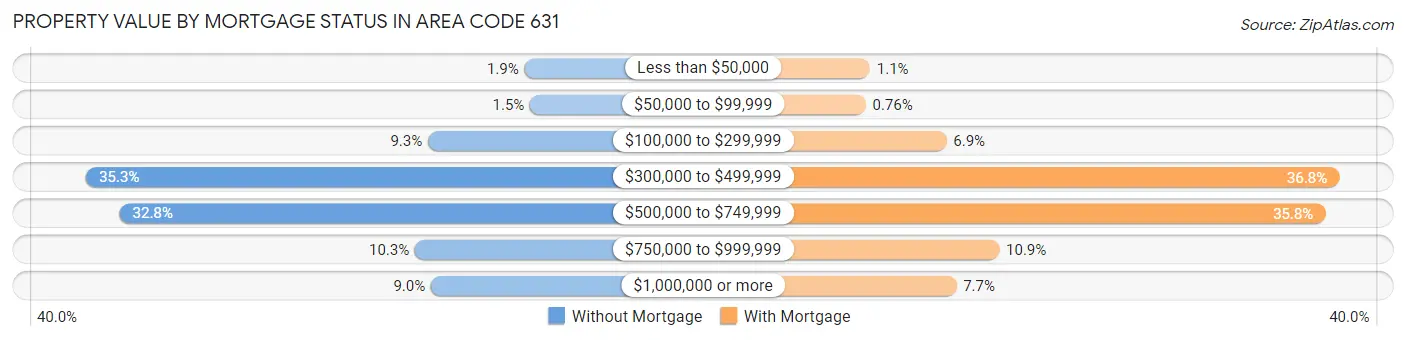
| Property Value | Without Mortgage | With Mortgage |
| Less than $50,000 | 3,720 (1.9%) | 3,597 (1.1%) |
| $50,000 to $99,999 | 2,890 (1.5%) | 2,515 (0.8%) |
| $100,000 to $299,999 | 18,053 (9.3%) | 22,805 (6.9%) |
| $300,000 to $499,999 | 68,871 (35.3%) | 121,441 (36.8%) |
| $500,000 to $749,999 | 63,885 (32.8%) | 117,952 (35.8%) |
| $750,000 to $999,999 | 19,987 (10.2%) | 36,051 (10.9%) |
| $1,000,000 or more | 17,601 (9.0%) | 25,269 (7.7%) |
| Total | 195,007 (100.0%) | 329,630 (100.0%) |
Household Income by Mortgage Status in Area Code 631
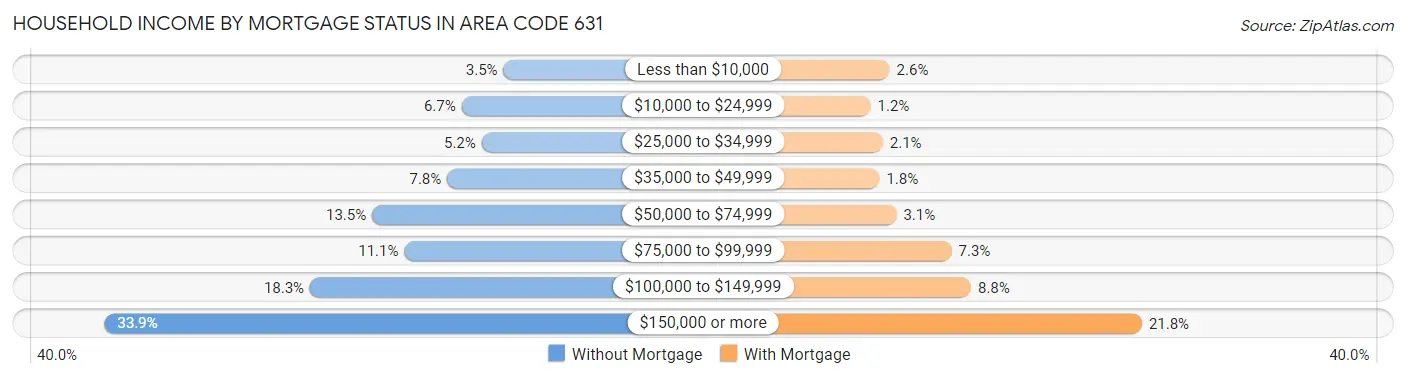
| Household Income | Without Mortgage | With Mortgage |
| Less than $10,000 | 6,856 (3.5%) | 8,567 (2.6%) |
| $10,000 to $24,999 | 13,094 (6.7%) | 3,792 (1.1%) |
| $25,000 to $34,999 | 10,108 (5.2%) | 6,861 (2.1%) |
| $35,000 to $49,999 | 15,236 (7.8%) | 5,990 (1.8%) |
| $50,000 to $74,999 | 26,384 (13.5%) | 10,296 (3.1%) |
| $75,000 to $99,999 | 21,585 (11.1%) | 24,145 (7.3%) |
| $100,000 to $149,999 | 35,602 (18.3%) | 29,011 (8.8%) |
| $150,000 or more | 66,142 (33.9%) | 71,925 (21.8%) |
| Total | 195,007 (100.0%) | 329,630 (100.0%) |
Property Value to Household Income Ratio in Area Code 631
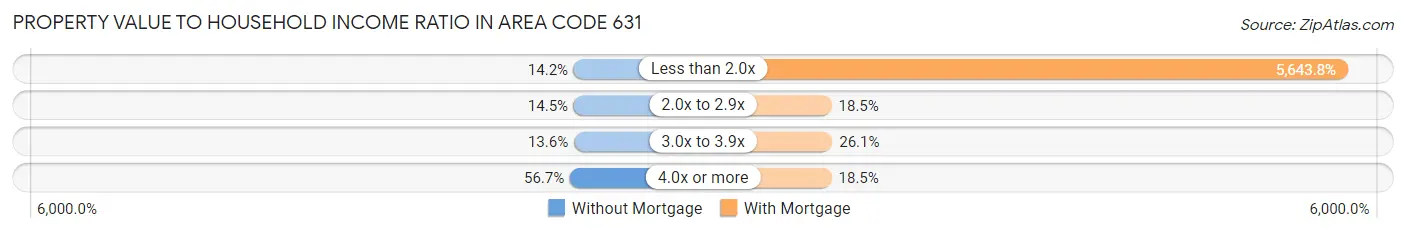
| Value-to-Income Ratio | Without Mortgage | With Mortgage |
| Less than 2.0x | 27,592 (14.1%) | 18,603,485 (5,643.8%) |
| 2.0x to 2.9x | 28,275 (14.5%) | 60,929 (18.5%) |
| 3.0x to 3.9x | 26,602 (13.6%) | 86,067 (26.1%) |
| 4.0x or more | 110,588 (56.7%) | 60,951 (18.5%) |
| Total | 195,007 (100.0%) | 329,630 (100.0%) |
Real Estate Taxes by Mortgage Status in Area Code 631
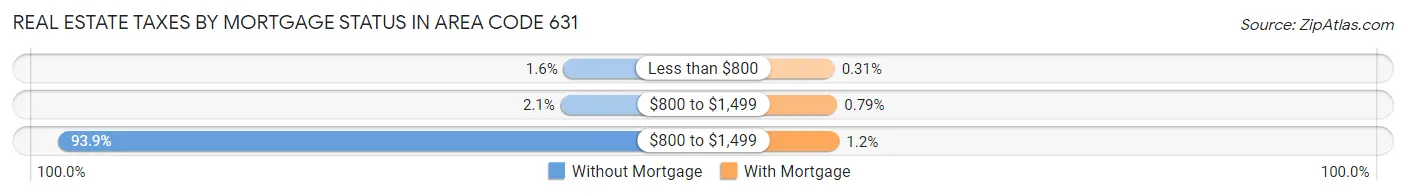
| Property Taxes | Without Mortgage | With Mortgage |
| Less than $800 | 3,055 (1.6%) | 1,035 (0.3%) |
| $800 to $1,499 | 4,092 (2.1%) | 2,593 (0.8%) |
| $800 to $1,499 | 183,060 (93.9%) | 3,823 (1.2%) |
| Total | 195,007 (100.0%) | 329,630 (100.0%) |
Health & Disability in Area Code 631
Health Insurance Coverage by Age in Area Code 631
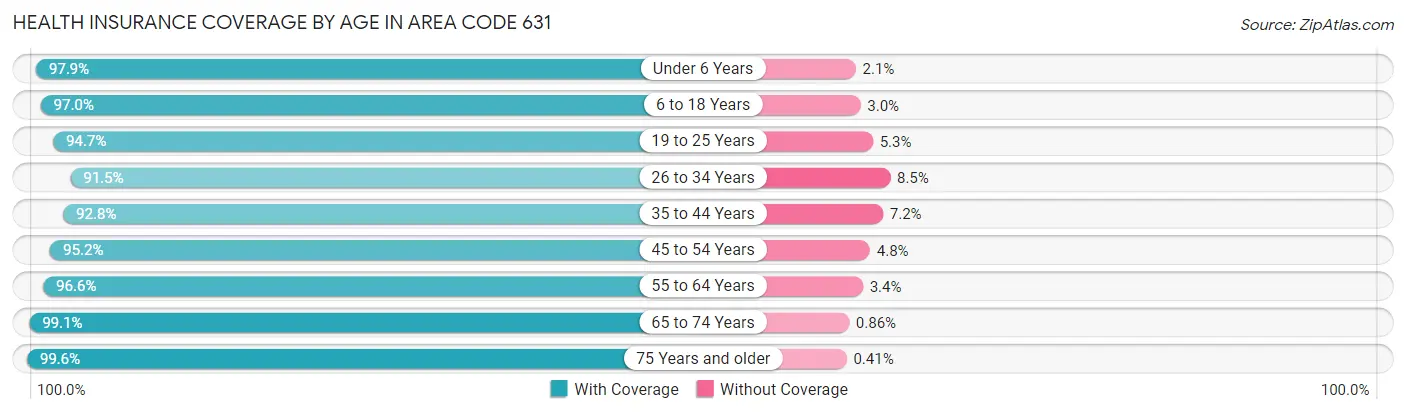
| Age Bracket | With Coverage | Without Coverage |
| Under 6 Years | 114,610 (97.9%) | 2,473 (2.1%) |
| 6 to 18 Years | 291,049 (97.0%) | 8,968 (3.0%) |
| 19 to 25 Years | 161,681 (94.7%) | 9,054 (5.3%) |
| 26 to 34 Years | 181,033 (91.5%) | 16,887 (8.5%) |
| 35 to 44 Years | 207,692 (92.8%) | 16,078 (7.2%) |
| 45 to 54 Years | 248,194 (95.2%) | 12,441 (4.8%) |
| 55 to 64 Years | 271,546 (96.6%) | 9,677 (3.4%) |
| 65 to 74 Years | 184,808 (99.1%) | 1,596 (0.9%) |
| 75 Years and older | 137,201 (99.6%) | 560 (0.4%) |
| Total | 1,797,814 (95.9%) | 77,734 (4.1%) |
Health Insurance Coverage by Citizenship Status in Area Code 631
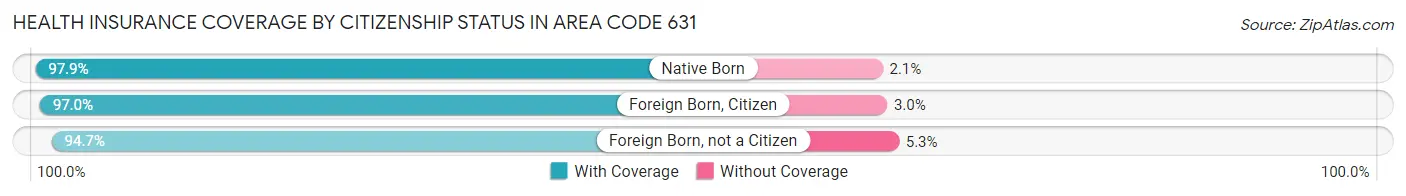
| Citizenship Status | With Coverage | Without Coverage |
| Native Born | 114,610 (97.9%) | 2,473 (2.1%) |
| Foreign Born, Citizen | 291,049 (97.0%) | 8,968 (3.0%) |
| Foreign Born, not a Citizen | 161,681 (94.7%) | 9,054 (5.3%) |
Health Insurance Coverage by Household Income in Area Code 631
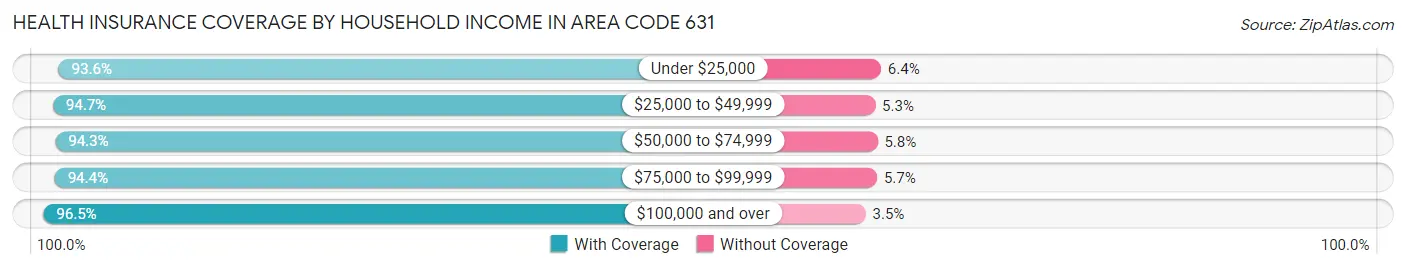
| Household Income | With Coverage | Without Coverage |
| Under $25,000 | 83,389 (93.6%) | 5,694 (6.4%) |
| $25,000 to $49,999 | 112,187 (94.7%) | 6,291 (5.3%) |
| $50,000 to $74,999 | 143,976 (94.3%) | 8,789 (5.8%) |
| $75,000 to $99,999 | 157,274 (94.4%) | 9,411 (5.7%) |
| $100,000 and over | 1,278,899 (96.5%) | 46,795 (3.5%) |
Public vs Private Health Insurance Coverage by Age in Area Code 631
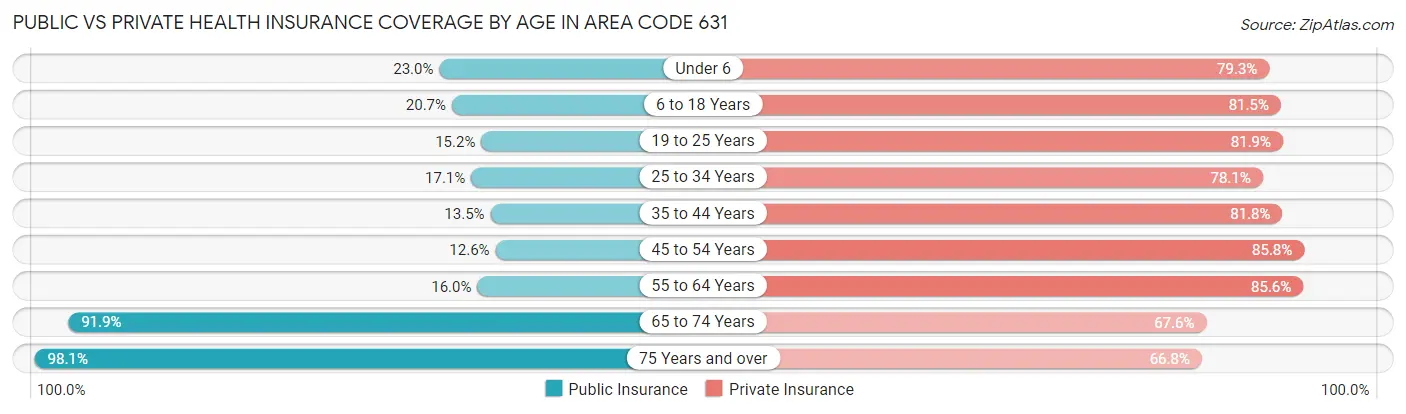
| Age Bracket | Public Insurance | Private Insurance |
| Under 6 | 26,962 (23.0%) | 92,865 (79.3%) |
| 6 to 18 Years | 62,112 (20.7%) | 244,422 (81.5%) |
| 19 to 25 Years | 26,027 (15.2%) | 139,772 (81.9%) |
| 25 to 34 Years | 33,875 (17.1%) | 154,590 (78.1%) |
| 35 to 44 Years | 30,298 (13.5%) | 182,968 (81.8%) |
| 45 to 54 Years | 32,876 (12.6%) | 223,623 (85.8%) |
| 55 to 64 Years | 44,900 (16.0%) | 240,797 (85.6%) |
| 65 to 74 Years | 171,305 (91.9%) | 126,089 (67.6%) |
| 75 Years and over | 135,181 (98.1%) | 92,023 (66.8%) |
| Total | 563,536 (30.0%) | 1,497,149 (79.8%) |
Disability Status by Sex by Age in Area Code 631
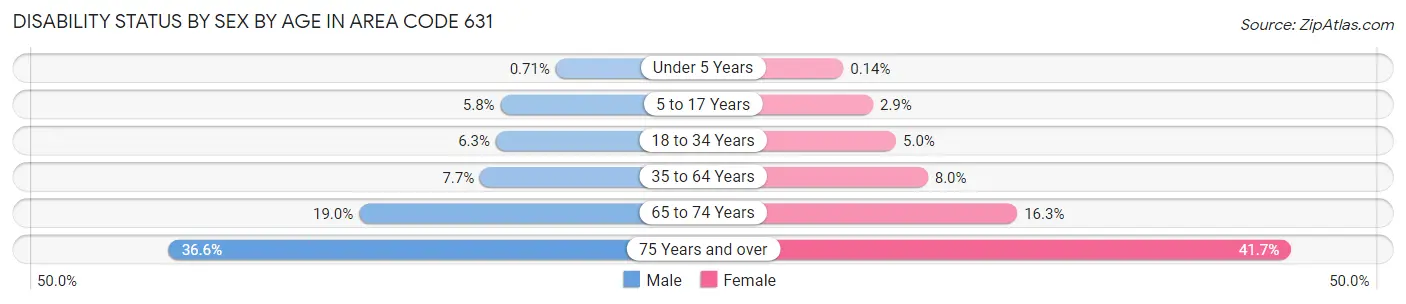
| Age Bracket | Male | Female |
| Under 5 Years | 353 (0.7%) | 68 (0.1%) |
| 5 to 17 Years | 8,768 (5.8%) | 4,182 (2.9%) |
| 18 to 34 Years | 12,656 (6.3%) | 9,689 (5.0%) |
| 35 to 64 Years | 29,735 (7.7%) | 30,400 (8.0%) |
| 65 to 74 Years | 16,768 (19.0%) | 15,951 (16.3%) |
| 75 Years and over | 20,511 (36.6%) | 34,080 (41.7%) |
Disability Class by Sex by Age in Area Code 631
Disability Class: Hearing Difficulty
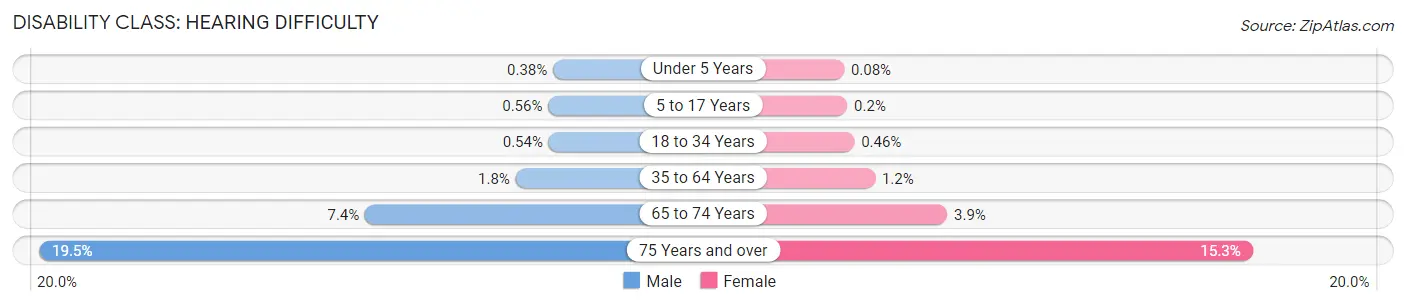
| Age Bracket | Male | Female |
| Under 5 Years | 191 (0.4%) | 38 (0.1%) |
| 5 to 17 Years | 833 (0.6%) | 286 (0.2%) |
| 18 to 34 Years | 1,096 (0.5%) | 893 (0.5%) |
| 35 to 64 Years | 6,791 (1.8%) | 4,683 (1.2%) |
| 65 to 74 Years | 6,506 (7.4%) | 3,829 (3.9%) |
| 75 Years and over | 10,896 (19.5%) | 12,467 (15.2%) |
Disability Class: Vision Difficulty
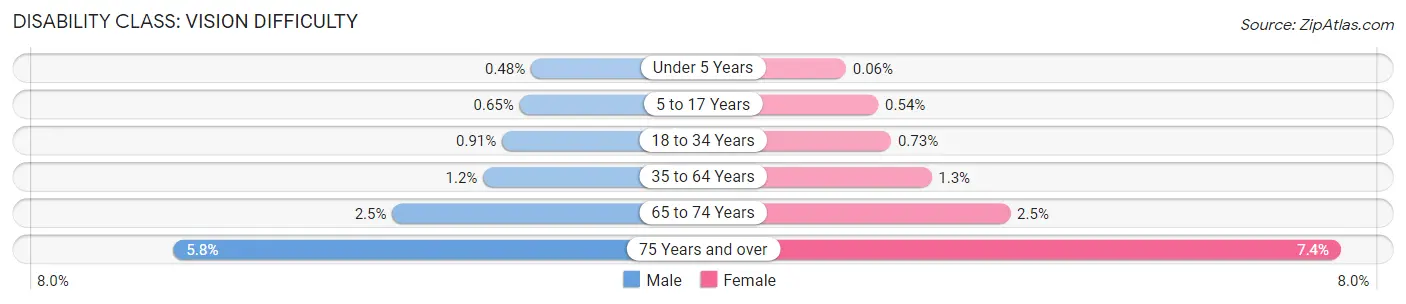
| Age Bracket | Male | Female |
| Under 5 Years | 241 (0.5%) | 30 (0.1%) |
| 5 to 17 Years | 981 (0.6%) | 771 (0.5%) |
| 18 to 34 Years | 1,841 (0.9%) | 1,393 (0.7%) |
| 35 to 64 Years | 4,572 (1.2%) | 5,052 (1.3%) |
| 65 to 74 Years | 2,249 (2.5%) | 2,450 (2.5%) |
| 75 Years and over | 3,244 (5.8%) | 6,059 (7.4%) |
Disability Class: Cognitive Difficulty
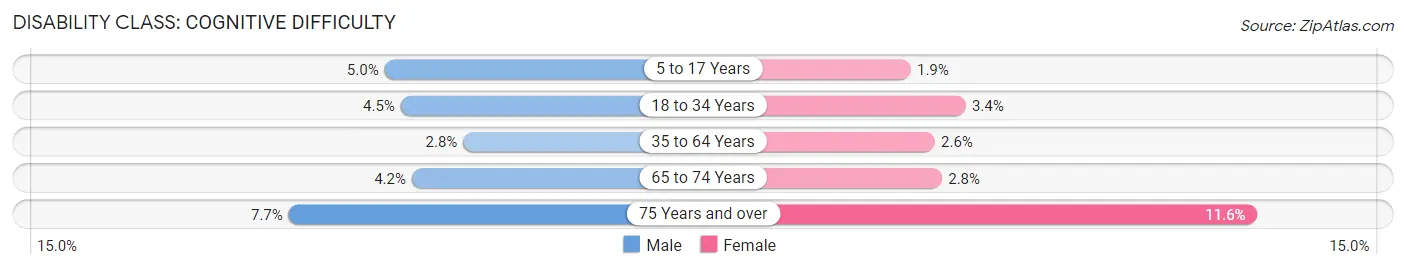
| Age Bracket | Male | Female |
| 5 to 17 Years | 7,467 (5.0%) | 2,736 (1.9%) |
| 18 to 34 Years | 9,131 (4.5%) | 6,593 (3.4%) |
| 35 to 64 Years | 10,749 (2.8%) | 9,807 (2.6%) |
| 65 to 74 Years | 3,735 (4.2%) | 2,715 (2.8%) |
| 75 Years and over | 4,282 (7.6%) | 9,460 (11.6%) |
Disability Class: Ambulatory Difficulty
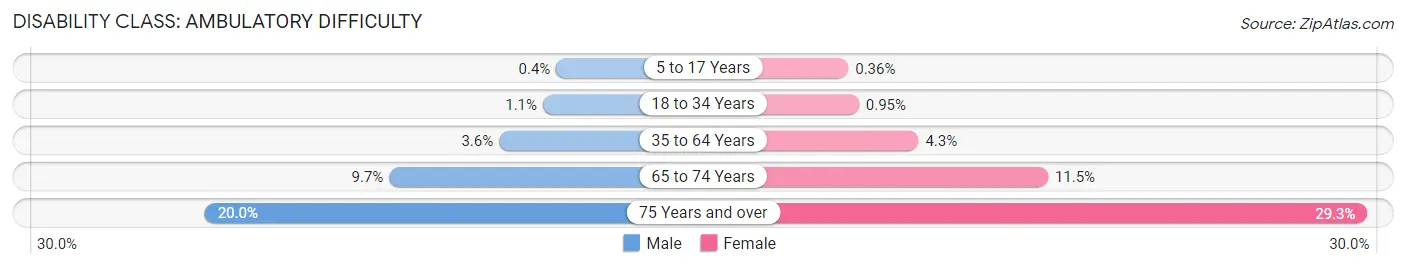
| Age Bracket | Male | Female |
| 5 to 17 Years | 600 (0.4%) | 521 (0.4%) |
| 18 to 34 Years | 2,296 (1.1%) | 1,820 (0.9%) |
| 35 to 64 Years | 13,762 (3.6%) | 16,281 (4.3%) |
| 65 to 74 Years | 8,577 (9.7%) | 11,248 (11.5%) |
| 75 Years and over | 11,182 (20.0%) | 23,925 (29.3%) |
Disability Class: Self-Care Difficulty
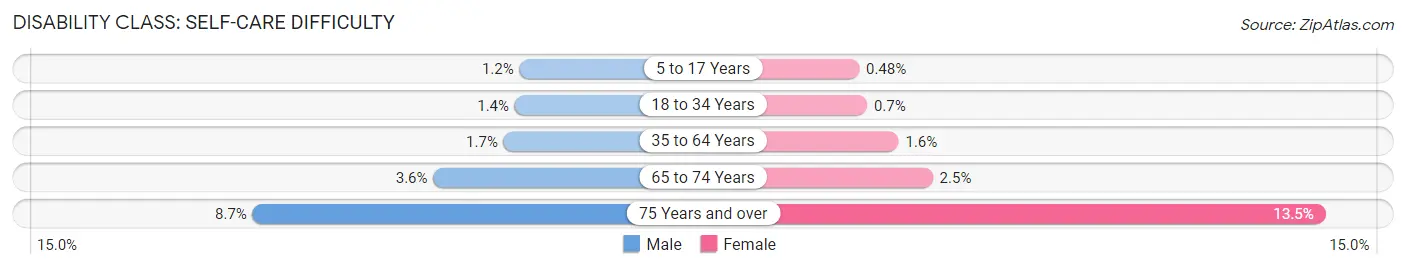
| Age Bracket | Male | Female |
| 5 to 17 Years | 1,827 (1.2%) | 686 (0.5%) |
| 18 to 34 Years | 2,716 (1.3%) | 1,339 (0.7%) |
| 35 to 64 Years | 6,383 (1.7%) | 6,022 (1.6%) |
| 65 to 74 Years | 3,203 (3.6%) | 2,477 (2.5%) |
| 75 Years and over | 4,842 (8.6%) | 11,012 (13.5%) |
Technology Access in Area Code 631
Computing Device Access in Area Code 631
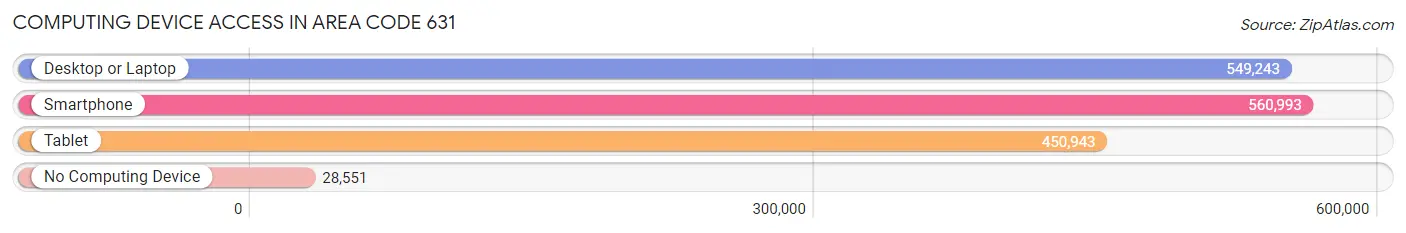
| Device Type | # Households | % Households |
| Desktop or Laptop | 549,243 | 87.2% |
| Smartphone | 560,993 | 89.1% |
| Tablet | 450,943 | 71.6% |
| No Computing Device | 28,551 | 4.5% |
| Total | 629,905 | 100.0% |
Internet Access in Area Code 631
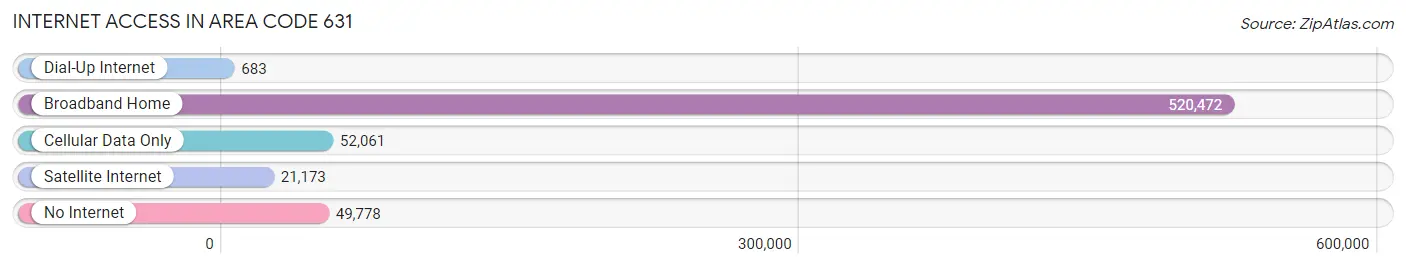
| Internet Type | # Households | % Households |
| Dial-Up Internet | 683 | 0.1% |
| Broadband Home | 520,472 | 82.6% |
| Cellular Data Only | 52,061 | 8.3% |
| Satellite Internet | 21,173 | 3.4% |
| No Internet | 49,778 | 7.9% |
| Total | 629,905 | 100.0% |
Area Code 631 Summary
Area code 631 is a telephone area code that serves the Suffolk County region of New York State, which is located on Long Island. The area code encompasses a diverse range of geographic, social, economic, and demographic characteristics.
Geographically, Suffolk County is located on the eastern end of Long Island, which is a narrow strip of land that stretches approximately 120 miles from New York City to Montauk Point. The region is known for its picturesque beaches, historic lighthouses, and rural landscapes. Suffolk County is also home to several state parks, including Robert Moses State Park, Montauk Point State Park, and Orient Beach State Park.
Socially, Suffolk County is a diverse region with a mix of urban, suburban, and rural communities. The county has a population of over 1.4 million people and is the second-largest county in New York State. The region is home to a variety of cultural and recreational amenities, including museums, theaters, restaurants, and shopping centers. The county has a strong sense of community and is known for its friendly and welcoming residents.
Economically, Suffolk County is an economically diverse region with a mix of industries, including healthcare, education, government, and manufacturing. The region is also home to a thriving tourism industry, with millions of visitors each year coming to enjoy the beaches, parks, and cultural attractions. The county has a strong and growing economy with a median household income of approximately $98,000, which is higher than the national average.
Demographically, Suffolk County has a diverse population, with a mix of racial and ethnic groups. The largest racial group in the region is White, followed by Hispanic/Latino, Black/African American, and Asian/Pacific Islander. The region also has a growing senior population, with a large number of retirees and active adult communities. Additionally, Suffolk County has a significant immigrant population, with immigrants making up approximately 22% of the total population. The region is known for its welcoming attitude towards immigrants and has a vibrant and diverse cultural scene.
Common Questions
What is Per Capita Income in Area Code 631?
Per Capita income in Area Code 631 is $62,618.
What is the Median Family Income in Area Code 631?
Median Family Income in Area Code 631 is $153,497.
What is the Median Household income in Area Code 631?
Median Household Income in Area Code 631 is $130,604.
What is Income or Wage Gap in Area Code 631?
Income or Wage Gap in Area Code 631 is 31.9%.
Women in Area Code 631 earn 68.1 cents for every dollar earned by a man.
What is Family Income Deficit in Area Code 631?
Family Income Deficit in Area Code 631 is $9,864.
Families that are below poverty line in Area Code 631 earn $9,864 less on average than the poverty threshold level.
What is Inequality or Gini Index in Area Code 631?
Inequality or Gini Index in Area Code 631 is 50.29.
What is the Total Population of Area Code 631?
Total Population of Area Code 631 is 1,886,912.
What is the Total Male Population of Area Code 631?
Total Male Population of Area Code 631 is 936,075.
What is the Total Female Population of Area Code 631?
Total Female Population of Area Code 631 is 950,837.
What is the Ratio of Males per 100 Females in Area Code 631?
There are 98.45 Males per 100 Females in Area Code 631.
What is the Ratio of Females per 100 Males in Area Code 631?
There are 101.58 Females per 100 Males in Area Code 631.
What is the Median Population Age in Area Code 631?
Median Population Age in Area Code 631 is 44.5 Years.
What is the Average Family Size in Area Code 631
Average Family Size in Area Code 631 is 3.2 People.
What is the Average Household Size in Area Code 631
Average Household Size in Area Code 631 is 2.7 People.
How Large is the Labor Force in Area Code 631?
There are 981,649 People in the Labor Forcein in Area Code 631.
What is the Percentage of People in the Labor Force in Area Code 631?
63.5% of People are in the Labor Force in Area Code 631.
What is the Unemployment Rate in Area Code 631?
Unemployment Rate in Area Code 631 is 4.9%.