Kings County, NY Map & Demographics
Kings County Map
Kings County Overview
$43,165
PER CAPITA INCOME
$84,136
AVG FAMILY INCOME
$74,692
AVG HOUSEHOLD INCOME
14.4%
WAGE / INCOME GAP [ % ]
85.6¢/ $1
WAGE / INCOME GAP [ $ ]
$11,083
FAMILY INCOME DEFICIT
0.53
INEQUALITY / GINI INDEX
2,679,620
TOTAL POPULATION
1,279,425
MALE POPULATION
1,400,195
FEMALE POPULATION
91.37
MALES / 100 FEMALES
109.44
FEMALES / 100 MALES
35.9
MEDIAN AGE
3.4
AVG FAMILY SIZE
2.6
AVG HOUSEHOLD SIZE
1,360,215
LABOR FORCE [ PEOPLE ]
63.7%
PERCENT IN LABOR FORCE
7.3%
UNEMPLOYMENT RATE
Income in Kings County
Income Overview in Kings County
Per Capita Income in Kings County is $43,165, while median incomes of families and households are $84,136 and $74,692 respectively.
| Characteristic | Number | Measure |
| Per Capita Income | 2,679,620 | $43,165 |
| Median Family Income | 600,177 | $84,136 |
| Mean Family Income | 600,177 | $127,040 |
| Median Household Income | 997,957 | $74,692 |
| Mean Household Income | 997,957 | $114,302 |
| Income Deficit | 600,177 | $11,083 |
| Wage / Income Gap (%) | 2,679,620 | 14.37% |
| Wage / Income Gap ($) | 2,679,620 | 85.63¢ per $1 |
| Gini / Inequality Index | 2,679,620 | 0.53 |
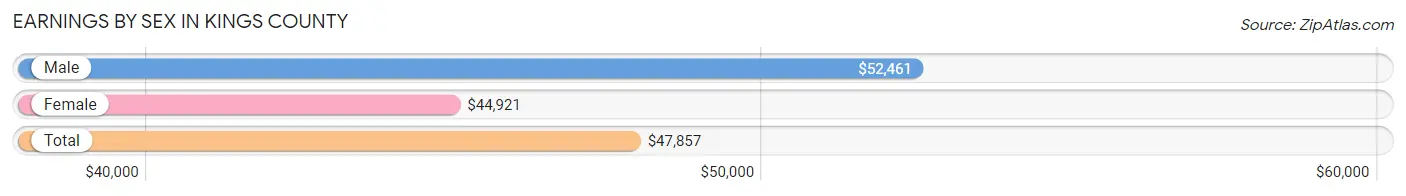
Earnings by Sex in Kings County
Average Earnings in Kings County are $47,857, $52,461 for men and $44,921 for women, a difference of 14.4%.
| Sex | Number | Average Earnings |
| Male | 680,341 (49.5%) | $52,461 |
| Female | 695,075 (50.5%) | $44,921 |
| Total | 1,375,416 (100.0%) | $47,857 |
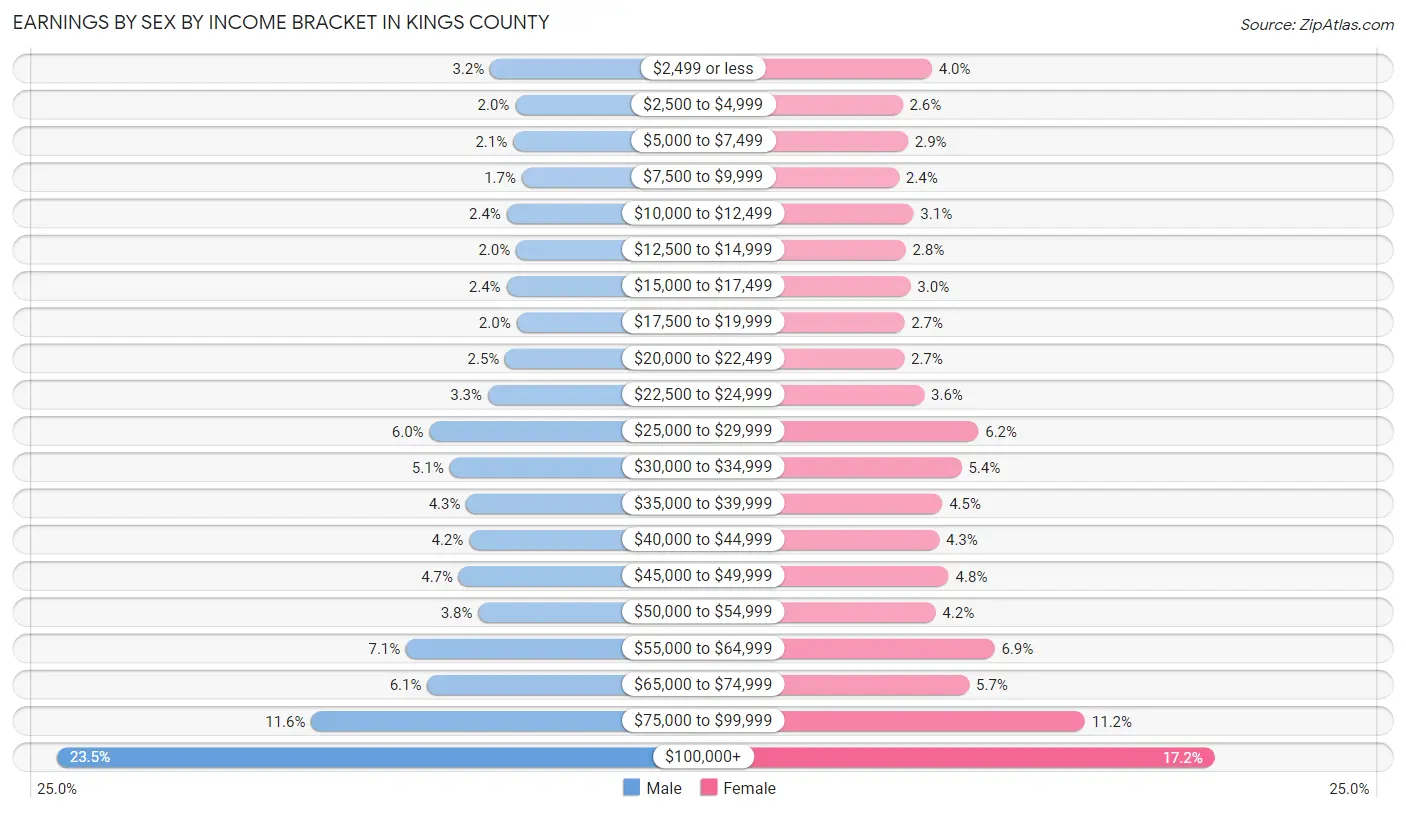
Earnings by Sex by Income Bracket in Kings County
The most common earnings brackets in Kings County are $100,000+ for men (159,817 | 23.5%) and $100,000+ for women (119,759 | 17.2%).
| Income | Male | Female |
| $2,499 or less | 21,792 (3.2%) | 27,695 (4.0%) |
| $2,500 to $4,999 | 13,748 (2.0%) | 18,126 (2.6%) |
| $5,000 to $7,499 | 14,454 (2.1%) | 19,885 (2.9%) |
| $7,500 to $9,999 | 11,644 (1.7%) | 16,969 (2.4%) |
| $10,000 to $12,499 | 16,471 (2.4%) | 21,700 (3.1%) |
| $12,500 to $14,999 | 13,486 (2.0%) | 19,128 (2.8%) |
| $15,000 to $17,499 | 16,515 (2.4%) | 20,698 (3.0%) |
| $17,500 to $19,999 | 13,305 (2.0%) | 18,700 (2.7%) |
| $20,000 to $22,499 | 16,936 (2.5%) | 18,661 (2.7%) |
| $22,500 to $24,999 | 22,454 (3.3%) | 25,136 (3.6%) |
| $25,000 to $29,999 | 41,119 (6.0%) | 42,832 (6.2%) |
| $30,000 to $34,999 | 34,672 (5.1%) | 37,314 (5.4%) |
| $35,000 to $39,999 | 29,332 (4.3%) | 31,092 (4.5%) |
| $40,000 to $44,999 | 28,453 (4.2%) | 30,001 (4.3%) |
| $45,000 to $49,999 | 31,713 (4.7%) | 33,132 (4.8%) |
| $50,000 to $54,999 | 25,480 (3.7%) | 28,854 (4.2%) |
| $55,000 to $64,999 | 48,524 (7.1%) | 48,082 (6.9%) |
| $65,000 to $74,999 | 41,741 (6.1%) | 39,828 (5.7%) |
| $75,000 to $99,999 | 78,685 (11.6%) | 77,483 (11.2%) |
| $100,000+ | 159,817 (23.5%) | 119,759 (17.2%) |
| Total | 680,341 (100.0%) | 695,075 (100.0%) |
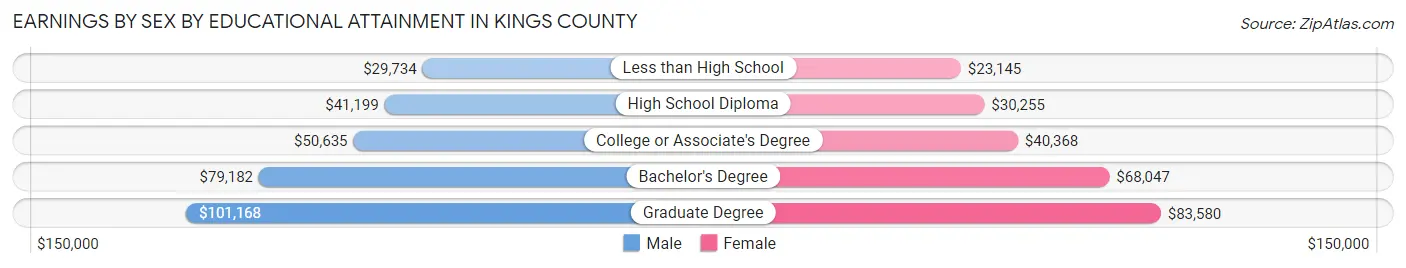
Earnings by Sex by Educational Attainment in Kings County
Average earnings in Kings County are $57,119 for men and $49,011 for women, a difference of 14.2%. Men with an educational attainment of graduate degree enjoy the highest average annual earnings of $101,168, while those with less than high school education earn the least with $29,734. Women with an educational attainment of graduate degree earn the most with the average annual earnings of $83,580, while those with less than high school education have the smallest earnings of $23,145.
| Educational Attainment | Male Income | Female Income |
| Less than High School | $29,734 | $23,145 |
| High School Diploma | $41,199 | $30,255 |
| College or Associate's Degree | $50,635 | $40,368 |
| Bachelor's Degree | $79,182 | $68,047 |
| Graduate Degree | $101,168 | $83,580 |
| Total | $57,119 | $49,011 |
Family Income in Kings County
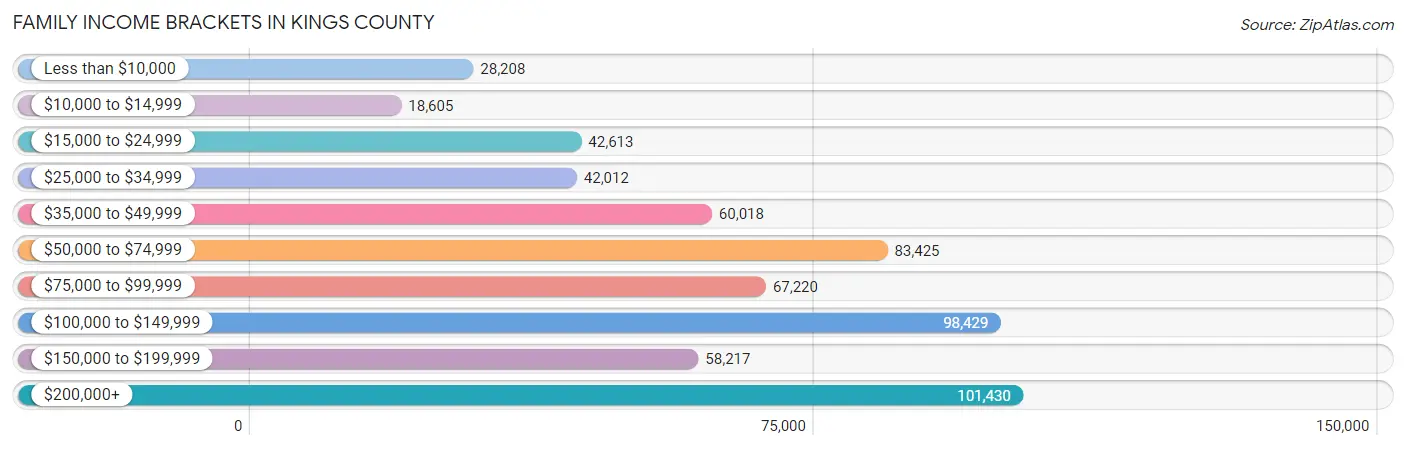
Family Income Brackets in Kings County
According to the Kings County family income data, there are 101,430 families falling into the $200,000+ income range, which is the most common income bracket and makes up 16.9% of all families. Conversely, the $10,000 to $14,999 income bracket is the least frequent group with only 18,605 families (3.1%) belonging to this category.
| Income Bracket | # Families | % Families |
| Less than $10,000 | 28,208 | 4.7% |
| $10,000 to $14,999 | 18,605 | 3.1% |
| $15,000 to $24,999 | 42,613 | 7.1% |
| $25,000 to $34,999 | 42,012 | 7.0% |
| $35,000 to $49,999 | 60,018 | 10.0% |
| $50,000 to $74,999 | 83,425 | 13.9% |
| $75,000 to $99,999 | 67,220 | 11.2% |
| $100,000 to $149,999 | 98,429 | 16.4% |
| $150,000 to $199,999 | 58,217 | 9.7% |
| $200,000+ | 101,430 | 16.9% |
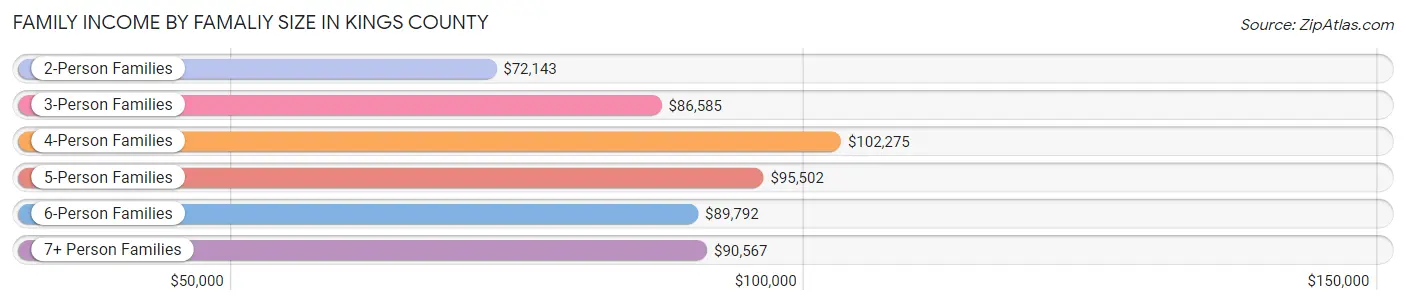
Family Income by Famaliy Size in Kings County
4-person families (110,254 | 18.4%) account for the highest median family income in Kings County with $102,275 per family, while 2-person families (241,806 | 40.3%) have the highest median income of $36,072 per family member.
| Income Bracket | # Families | Median Income |
| 2-Person Families | 241,806 (40.3%) | $72,143 |
| 3-Person Families | 149,868 (25.0%) | $86,585 |
| 4-Person Families | 110,254 (18.4%) | $102,275 |
| 5-Person Families | 50,942 (8.5%) | $95,502 |
| 6-Person Families | 24,273 (4.0%) | $89,792 |
| 7+ Person Families | 23,034 (3.8%) | $90,567 |
| Total | 600,177 (100.0%) | $84,136 |
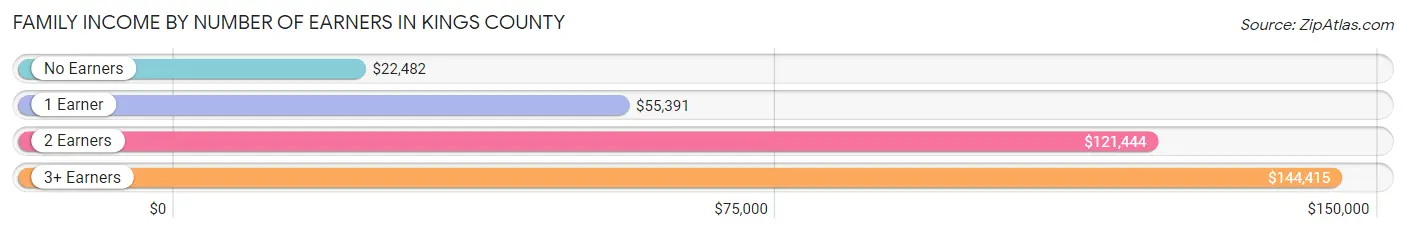
Family Income by Number of Earners in Kings County
The median family income in Kings County is $84,136, with families comprising 3+ earners (73,790) having the highest median family income of $144,415, while families with no earners (78,819) have the lowest median family income of $22,482, accounting for 12.3% and 13.1% of families, respectively.
| Number of Earners | # Families | Median Income |
| No Earners | 78,819 (13.1%) | $22,482 |
| 1 Earner | 200,770 (33.5%) | $55,391 |
| 2 Earners | 246,798 (41.1%) | $121,444 |
| 3+ Earners | 73,790 (12.3%) | $144,415 |
| Total | 600,177 (100.0%) | $84,136 |
Household Income in Kings County
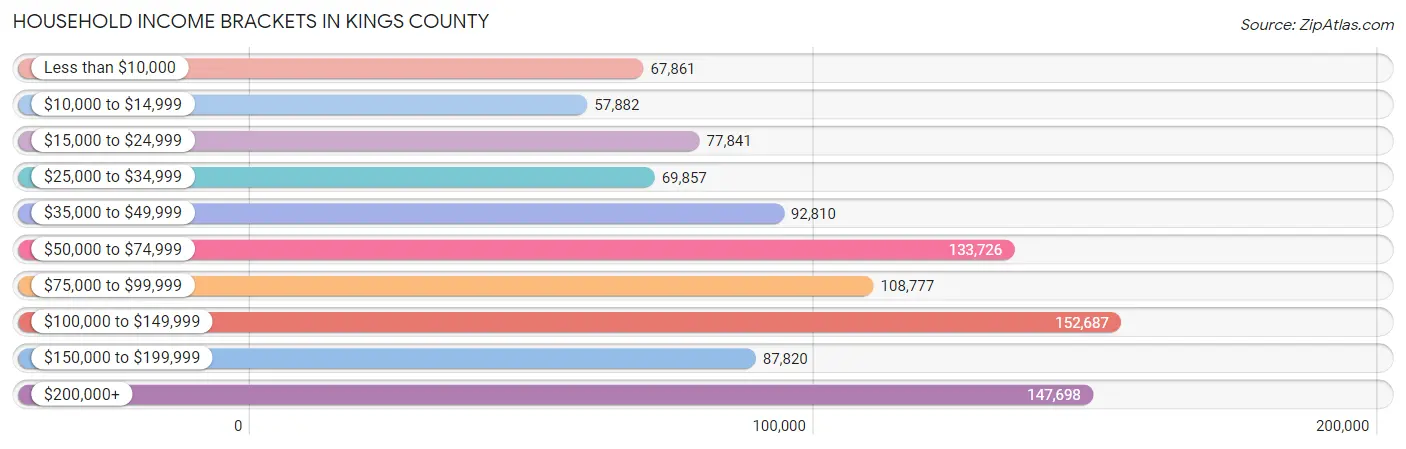
Household Income Brackets in Kings County
With 152,687 households falling in the category, the $100,000 to $149,999 income range is the most frequent in Kings County, accounting for 15.3% of all households. In contrast, only 57,882 households (5.8%) fall into the $10,000 to $14,999 income bracket, making it the least populous group.
| Income Bracket | # Households | % Households |
| Less than $10,000 | 67,861 | 6.8% |
| $10,000 to $14,999 | 57,882 | 5.8% |
| $15,000 to $24,999 | 77,841 | 7.8% |
| $25,000 to $34,999 | 69,857 | 7.0% |
| $35,000 to $49,999 | 92,810 | 9.3% |
| $50,000 to $74,999 | 133,726 | 13.4% |
| $75,000 to $99,999 | 108,777 | 10.9% |
| $100,000 to $149,999 | 152,687 | 15.3% |
| $150,000 to $199,999 | 87,820 | 8.8% |
| $200,000+ | 147,698 | 14.8% |
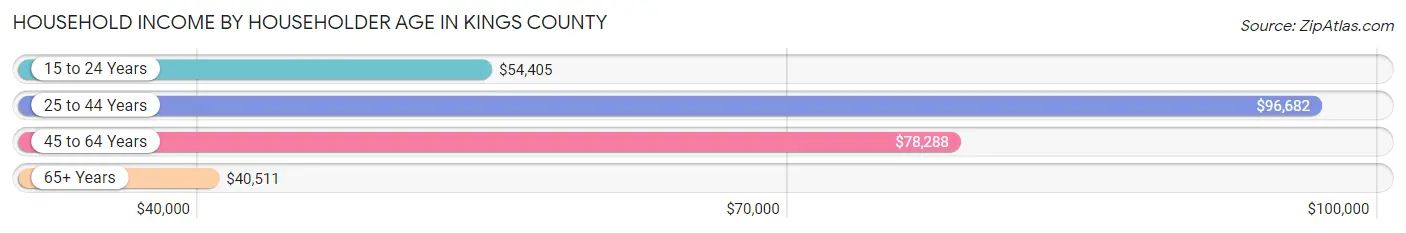
Household Income by Householder Age in Kings County
The median household income in Kings County is $74,692, with the highest median household income of $96,682 found in the 25 to 44 years age bracket for the primary householder. A total of 385,326 households (38.6%) fall into this category. Meanwhile, the 65+ years age bracket for the primary householder has the lowest median household income of $40,511, with 237,960 households (23.8%) in this group.
| Income Bracket | # Households | Median Income |
| 15 to 24 Years | 28,442 (2.9%) | $54,405 |
| 25 to 44 Years | 385,326 (38.6%) | $96,682 |
| 45 to 64 Years | 346,229 (34.7%) | $78,288 |
| 65+ Years | 237,960 (23.8%) | $40,511 |
| Total | 997,957 (100.0%) | $74,692 |
Poverty in Kings County
Income Below Poverty by Sex and Age in Kings County
With 17.7% poverty level for males and 20.1% for females among the residents of Kings County, 5 year old males and 5 year old females are the most vulnerable to poverty, with 4,790 males (28.7%) and 4,512 females (28.4%) in their respective age groups living below the poverty level.
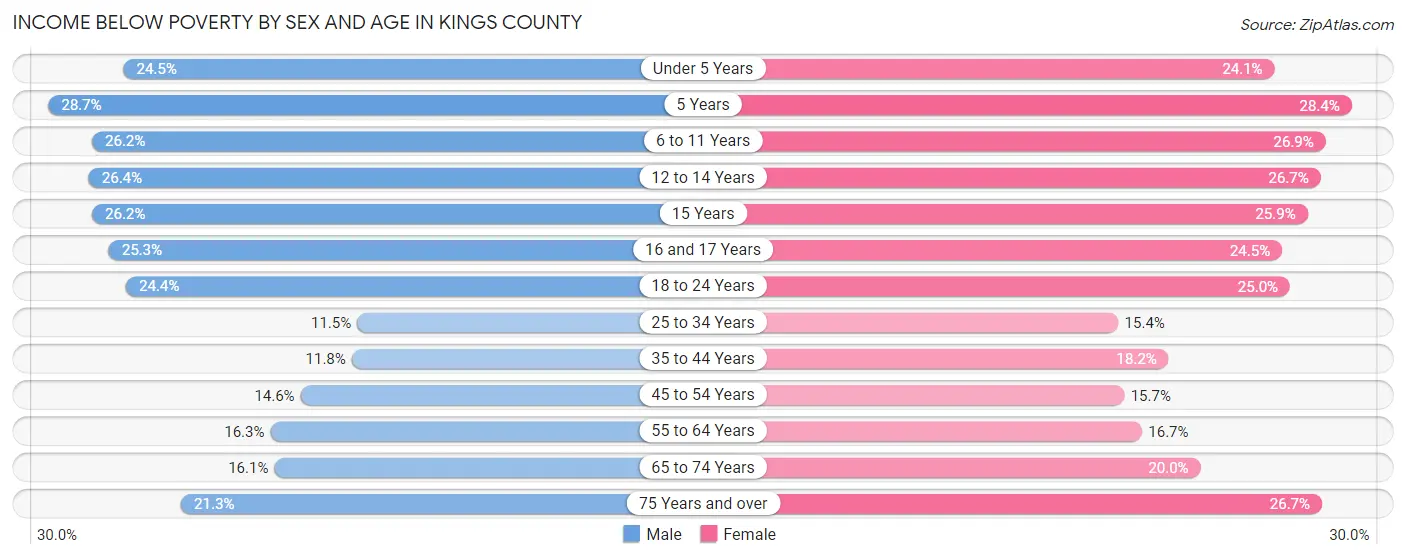
| Age Bracket | Male | Female |
| Under 5 Years | 22,588 (24.5%) | 21,157 (24.1%) |
| 5 Years | 4,790 (28.7%) | 4,512 (28.4%) |
| 6 to 11 Years | 26,053 (26.2%) | 25,521 (26.9%) |
| 12 to 14 Years | 13,289 (26.4%) | 12,673 (26.7%) |
| 15 Years | 4,234 (26.2%) | 4,138 (25.9%) |
| 16 and 17 Years | 7,792 (25.3%) | 7,131 (24.5%) |
| 18 to 24 Years | 25,037 (24.3%) | 26,601 (24.9%) |
| 25 to 34 Years | 26,503 (11.5%) | 37,691 (15.4%) |
| 35 to 44 Years | 21,870 (11.8%) | 35,465 (18.2%) |
| 45 to 54 Years | 21,597 (14.6%) | 25,872 (15.7%) |
| 55 to 64 Years | 22,445 (16.3%) | 26,922 (16.7%) |
| 65 to 74 Years | 15,752 (16.1%) | 24,953 (20.0%) |
| 75 Years and over | 12,465 (21.3%) | 26,473 (26.7%) |
| Total | 224,415 (17.7%) | 279,109 (20.1%) |
Income Above Poverty by Sex and Age in Kings County
According to the poverty statistics in Kings County, males aged 25 to 34 years and females aged 25 to 34 years are the age groups that are most secure financially, with 88.5% of males and 84.6% of females in these age groups living above the poverty line.
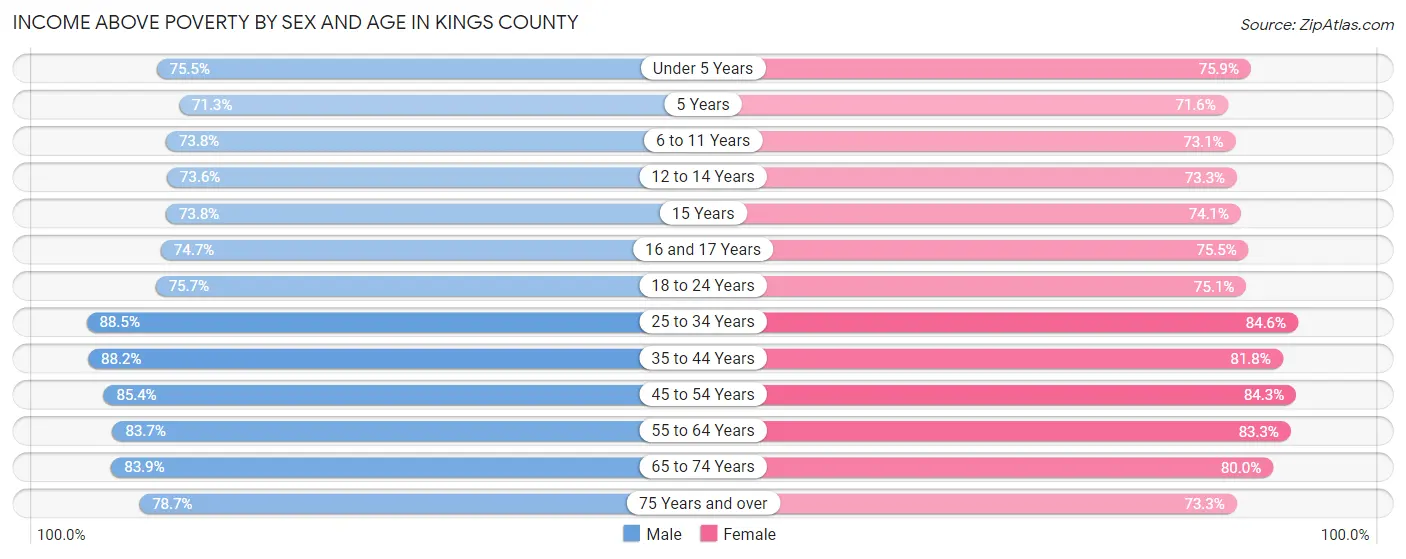
| Age Bracket | Male | Female |
| Under 5 Years | 69,631 (75.5%) | 66,670 (75.9%) |
| 5 Years | 11,911 (71.3%) | 11,379 (71.6%) |
| 6 to 11 Years | 73,247 (73.8%) | 69,201 (73.1%) |
| 12 to 14 Years | 37,009 (73.6%) | 34,858 (73.3%) |
| 15 Years | 11,901 (73.8%) | 11,819 (74.1%) |
| 16 and 17 Years | 22,989 (74.7%) | 21,965 (75.5%) |
| 18 to 24 Years | 77,773 (75.6%) | 79,999 (75.0%) |
| 25 to 34 Years | 204,070 (88.5%) | 207,717 (84.6%) |
| 35 to 44 Years | 163,557 (88.2%) | 159,427 (81.8%) |
| 45 to 54 Years | 125,955 (85.4%) | 138,944 (84.3%) |
| 55 to 64 Years | 115,075 (83.7%) | 134,442 (83.3%) |
| 65 to 74 Years | 82,064 (83.9%) | 99,986 (80.0%) |
| 75 Years and over | 46,118 (78.7%) | 72,566 (73.3%) |
| Total | 1,041,300 (82.3%) | 1,108,973 (79.9%) |
Income Below Poverty Among Married-Couple Families in Kings County
The poverty statistics for married-couple families in Kings County show that 11.1% or 41,314 of the total 371,884 families live below the poverty line. Families with 5 or more children have the highest poverty rate of 42.5%, comprising of 4,297 families. On the other hand, families with no children have the lowest poverty rate of 8.4%, which includes 16,739 families.
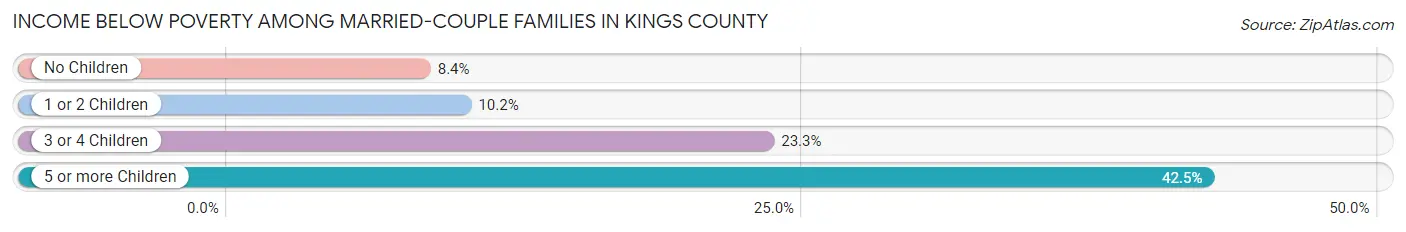
| Children | Above Poverty | Below Poverty |
| No Children | 182,805 (91.6%) | 16,739 (8.4%) |
| 1 or 2 Children | 119,832 (89.8%) | 13,546 (10.2%) |
| 3 or 4 Children | 22,114 (76.7%) | 6,732 (23.3%) |
| 5 or more Children | 5,819 (57.5%) | 4,297 (42.5%) |
| Total | 330,570 (88.9%) | 41,314 (11.1%) |
Income Below Poverty Among Single-Parent Households in Kings County
According to the poverty data in Kings County, 12.9% or 7,066 single-father households and 23.9% or 41,557 single-mother households are living below the poverty line. Among single-father households, those with 5 or more children have the highest poverty rate, with 73 households (35.4%) experiencing poverty. Likewise, among single-mother households, those with 5 or more children have the highest poverty rate, with 748 households (67.4%) falling below the poverty line.
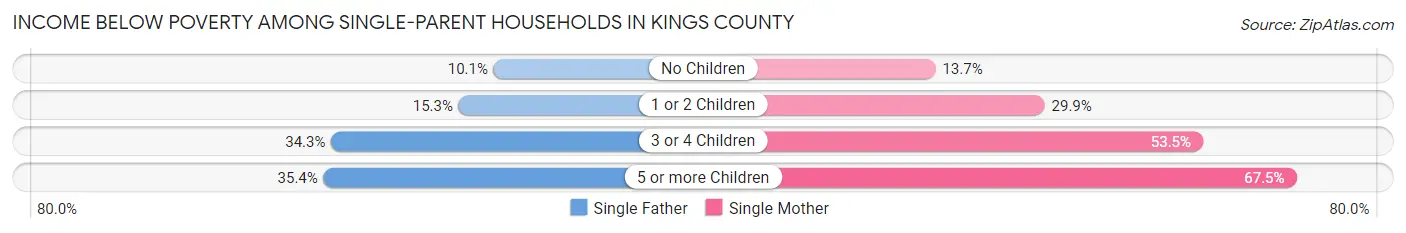
| Children | Single Father | Single Mother |
| No Children | 3,440 (10.1%) | 11,422 (13.7%) |
| 1 or 2 Children | 2,757 (15.3%) | 23,190 (29.9%) |
| 3 or 4 Children | 796 (34.3%) | 6,197 (53.5%) |
| 5 or more Children | 73 (35.4%) | 748 (67.4%) |
| Total | 7,066 (12.9%) | 41,557 (23.9%) |
Income Below Poverty Among Married-Couple vs Single-Parent Households in Kings County
The poverty data for Kings County shows that 41,314 of the married-couple family households (11.1%) and 48,623 of the single-parent households (21.3%) are living below the poverty level. Within the married-couple family households, those with 5 or more children have the highest poverty rate, with 4,297 households (42.5%) falling below the poverty line. Among the single-parent households, those with 5 or more children have the highest poverty rate, with 821 household (62.4%) living below poverty.
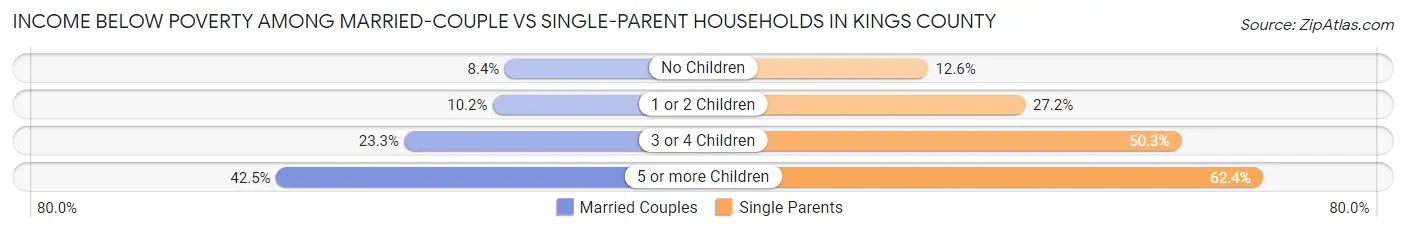
| Children | Married-Couple Families | Single-Parent Households |
| No Children | 16,739 (8.4%) | 14,862 (12.6%) |
| 1 or 2 Children | 13,546 (10.2%) | 25,947 (27.2%) |
| 3 or 4 Children | 6,732 (23.3%) | 6,993 (50.3%) |
| 5 or more Children | 4,297 (42.5%) | 821 (62.4%) |
| Total | 41,314 (11.1%) | 48,623 (21.3%) |
Race in Kings County
The most populous races in Kings County are White / Caucasian (1,082,004 | 40.4%), Black / African American (803,621 | 30.0%), and Hispanic or Latino (506,473 | 18.9%).
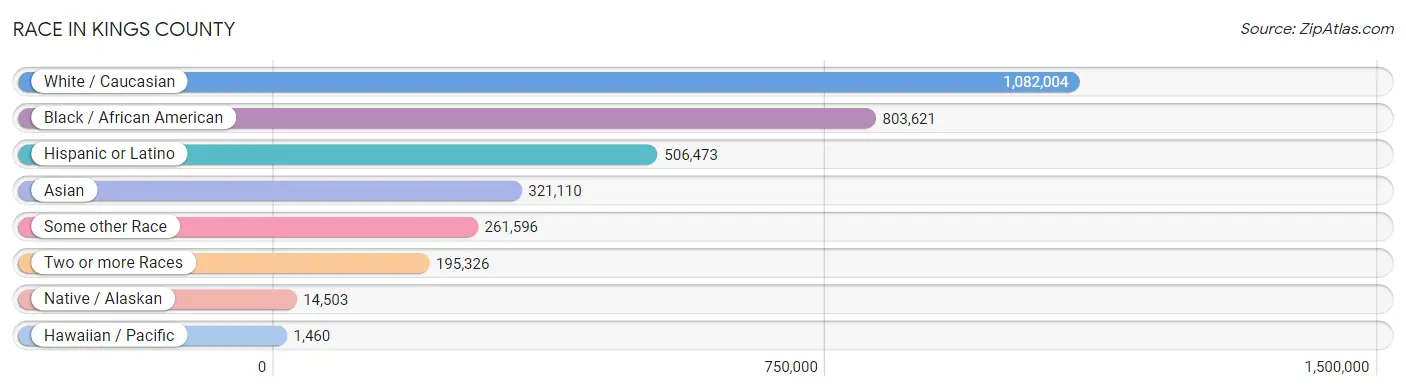
| Race | # Population | % Population |
| Asian | 321,110 | 12.0% |
| Black / African American | 803,621 | 30.0% |
| Hawaiian / Pacific | 1,460 | 0.1% |
| Hispanic or Latino | 506,473 | 18.9% |
| Native / Alaskan | 14,503 | 0.5% |
| White / Caucasian | 1,082,004 | 40.4% |
| Two or more Races | 195,326 | 7.3% |
| Some other Race | 261,596 | 9.8% |
| Total | 2,679,620 | 100.0% |
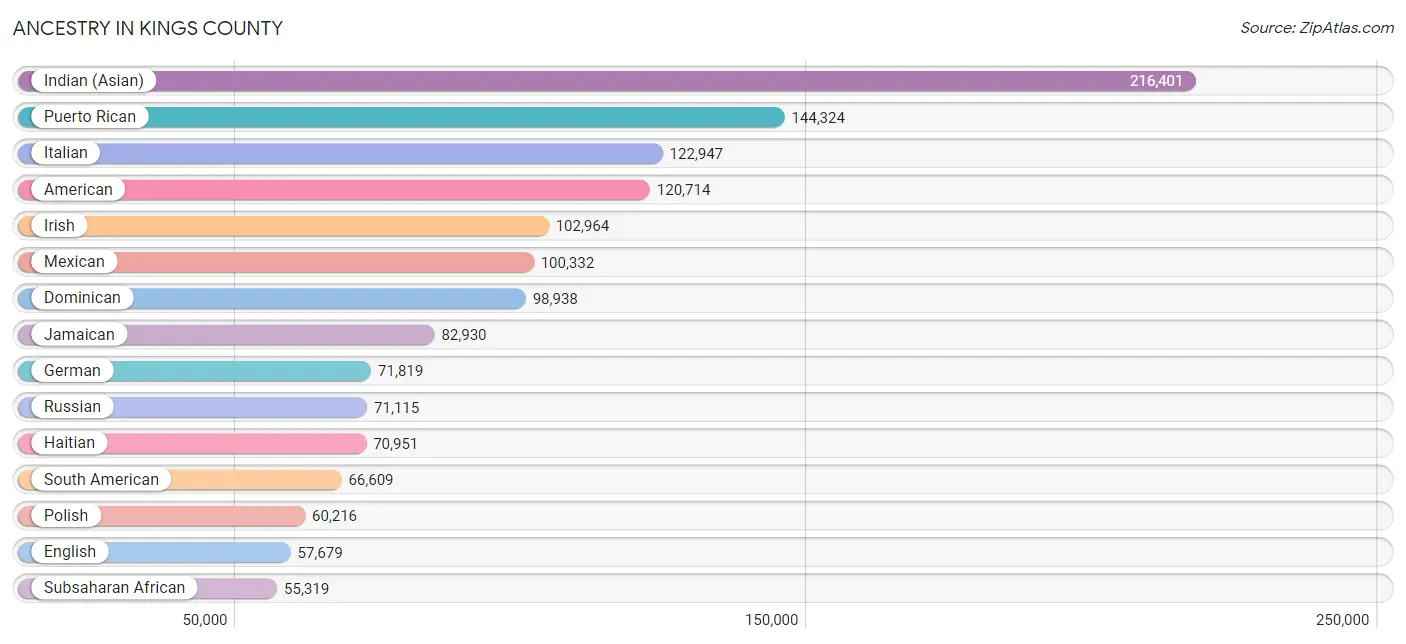
Ancestry in Kings County
The most populous ancestries reported in Kings County are Indian (Asian) (216,401 | 8.1%), Puerto Rican (144,324 | 5.4%), Italian (122,947 | 4.6%), American (120,714 | 4.5%), and Irish (102,964 | 3.8%), together accounting for 26.4% of all Kings County residents.
| Ancestry | # Population | % Population |
| Afghan | 289 | 0.0% |
| African | 32,307 | 1.2% |
| Alaska Native | 11 | 0.0% |
| Albanian | 7,195 | 0.3% |
| Alsatian | 25 | 0.0% |
| American | 120,714 | 4.5% |
| Apache | 238 | 0.0% |
| Arab | 44,268 | 1.7% |
| Argentinean | 4,137 | 0.2% |
| Armenian | 3,508 | 0.1% |
| Assyrian / Chaldean / Syriac | 42 | 0.0% |
| Australian | 1,960 | 0.1% |
| Austrian | 5,184 | 0.2% |
| Bahamian | 617 | 0.0% |
| Bangladeshi | 31 | 0.0% |
| Barbadian | 14,798 | 0.5% |
| Basque | 281 | 0.0% |
| Belgian | 1,242 | 0.1% |
| Belizean | 2,634 | 0.1% |
| Bermudan | 50 | 0.0% |
| Bhutanese | 9,514 | 0.4% |
| Blackfeet | 628 | 0.0% |
| Bolivian | 323 | 0.0% |
| Brazilian | 2,881 | 0.1% |
| British | 9,028 | 0.3% |
| British West Indian | 32,219 | 1.2% |
| Bulgarian | 753 | 0.0% |
| Burmese | 14,872 | 0.6% |
| Cajun | 271 | 0.0% |
| Cambodian | 222 | 0.0% |
| Canadian | 3,134 | 0.1% |
| Cape Verdean | 245 | 0.0% |
| Carpatho Rusyn | 75 | 0.0% |
| Celtic | 56 | 0.0% |
| Central American | 52,414 | 2.0% |
| Central American Indian | 6,837 | 0.3% |
| Cherokee | 2,301 | 0.1% |
| Cheyenne | 24 | 0.0% |
| Chickasaw | 89 | 0.0% |
| Chilean | 2,216 | 0.1% |
| Chippewa | 168 | 0.0% |
| Choctaw | 301 | 0.0% |
| Colombian | 15,056 | 0.6% |
| Costa Rican | 2,546 | 0.1% |
| Cree | 20 | 0.0% |
| Creek | 281 | 0.0% |
| Croatian | 1,772 | 0.1% |
| Crow | 71 | 0.0% |
| Cuban | 8,829 | 0.3% |
| Cypriot | 329 | 0.0% |
| Czech | 3,107 | 0.1% |
| Czechoslovakian | 994 | 0.0% |
| Danish | 2,872 | 0.1% |
| Dominican | 98,938 | 3.7% |
| Dutch | 8,098 | 0.3% |
| Dutch West Indian | 344 | 0.0% |
| Eastern European | 25,199 | 0.9% |
| Ecuadorian | 31,517 | 1.2% |
| Egyptian | 9,951 | 0.4% |
| English | 57,679 | 2.1% |
| Estonian | 354 | 0.0% |
| Ethiopian | 650 | 0.0% |
| European | 30,207 | 1.1% |
| Fijian | 16 | 0.0% |
| Filipino | 2,938 | 0.1% |
| Finnish | 1,478 | 0.1% |
| French | 21,618 | 0.8% |
| French American Indian | 39 | 0.0% |
| French Canadian | 3,854 | 0.1% |
| German | 71,819 | 2.7% |
| German Russian | 48 | 0.0% |
| Ghanaian | 3,201 | 0.1% |
| Greek | 12,856 | 0.5% |
| Guamanian / Chamorro | 375 | 0.0% |
| Guatemalan | 14,657 | 0.5% |
| Guyanese | 42,273 | 1.6% |
| Haitian | 70,951 | 2.6% |
| Hmong | 26 | 0.0% |
| Honduran | 9,250 | 0.4% |
| Hopi | 2 | 0.0% |
| Houma | 4 | 0.0% |
| Hungarian | 30,859 | 1.1% |
| Icelander | 210 | 0.0% |
| Indian (Asian) | 216,401 | 8.1% |
| Indonesian | 1,488 | 0.1% |
| Inupiat | 133 | 0.0% |
| Iranian | 3,503 | 0.1% |
| Iraqi | 520 | 0.0% |
| Irish | 102,964 | 3.8% |
| Iroquois | 1,302 | 0.1% |
| Israeli | 6,753 | 0.3% |
| Italian | 122,947 | 4.6% |
| Jamaican | 82,930 | 3.1% |
| Japanese | 745 | 0.0% |
| Jordanian | 740 | 0.0% |
| Kenyan | 248 | 0.0% |
| Korean | 15,735 | 0.6% |
| Laotian | 1,236 | 0.1% |
| Latvian | 1,079 | 0.0% |
| Lebanese | 5,647 | 0.2% |
| Liberian | 847 | 0.0% |
| Lithuanian | 4,190 | 0.2% |
| Lumbee | 209 | 0.0% |
| Luxembourger | 243 | 0.0% |
| Macedonian | 1,489 | 0.1% |
| Malaysian | 214 | 0.0% |
| Maltese | 371 | 0.0% |
| Menominee | 20 | 0.0% |
| Mexican | 100,332 | 3.7% |
| Mexican American Indian | 5,052 | 0.2% |
| Mongolian | 769 | 0.0% |
| Moroccan | 4,492 | 0.2% |
| Native Hawaiian | 1,436 | 0.1% |
| Navajo | 180 | 0.0% |
| New Zealander | 333 | 0.0% |
| Nicaraguan | 2,406 | 0.1% |
| Nigerian | 10,985 | 0.4% |
| Northern European | 2,039 | 0.1% |
| Norwegian | 7,053 | 0.3% |
| Okinawan | 331 | 0.0% |
| Paiute | 57 | 0.0% |
| Pakistani | 1,165 | 0.0% |
| Palestinian | 1,617 | 0.1% |
| Panamanian | 11,996 | 0.4% |
| Paraguayan | 75 | 0.0% |
| Pennsylvania German | 220 | 0.0% |
| Peruvian | 6,974 | 0.3% |
| Polish | 60,216 | 2.2% |
| Portuguese | 4,068 | 0.2% |
| Potawatomi | 18 | 0.0% |
| Pueblo | 152 | 0.0% |
| Puerto Rican | 144,324 | 5.4% |
| Romanian | 8,805 | 0.3% |
| Russian | 71,115 | 2.6% |
| Salvadoran | 10,917 | 0.4% |
| Samoan | 202 | 0.0% |
| Scandinavian | 1,689 | 0.1% |
| Scotch-Irish | 5,032 | 0.2% |
| Scottish | 13,697 | 0.5% |
| Seminole | 50 | 0.0% |
| Senegalese | 642 | 0.0% |
| Serbian | 1,006 | 0.0% |
| Sierra Leonean | 566 | 0.0% |
| Sioux | 247 | 0.0% |
| Slavic | 2,841 | 0.1% |
| Slovak | 2,774 | 0.1% |
| Slovene | 425 | 0.0% |
| Somali | 328 | 0.0% |
| South African | 621 | 0.0% |
| South American | 66,609 | 2.5% |
| South American Indian | 1,733 | 0.1% |
| Soviet Union | 551 | 0.0% |
| Spaniard | 6,533 | 0.2% |
| Spanish | 4,407 | 0.2% |
| Spanish American | 167 | 0.0% |
| Spanish American Indian | 102 | 0.0% |
| Sri Lankan | 6,594 | 0.3% |
| Subsaharan African | 55,319 | 2.1% |
| Sudanese | 1,365 | 0.1% |
| Swedish | 8,687 | 0.3% |
| Swiss | 2,431 | 0.1% |
| Syrian | 6,961 | 0.3% |
| Taiwanese | 23 | 0.0% |
| Thai | 37,078 | 1.4% |
| Trinidadian and Tobagonian | 39,104 | 1.5% |
| Turkish | 6,693 | 0.3% |
| U.S. Virgin Islander | 594 | 0.0% |
| Ugandan | 36 | 0.0% |
| Ukrainian | 40,513 | 1.5% |
| Uruguayan | 507 | 0.0% |
| Venezuelan | 4,680 | 0.2% |
| Vietnamese | 14,165 | 0.5% |
| Welsh | 3,700 | 0.1% |
| West Indian | 42,598 | 1.6% |
| Yugoslavian | 892 | 0.0% | View All 175 Rows |
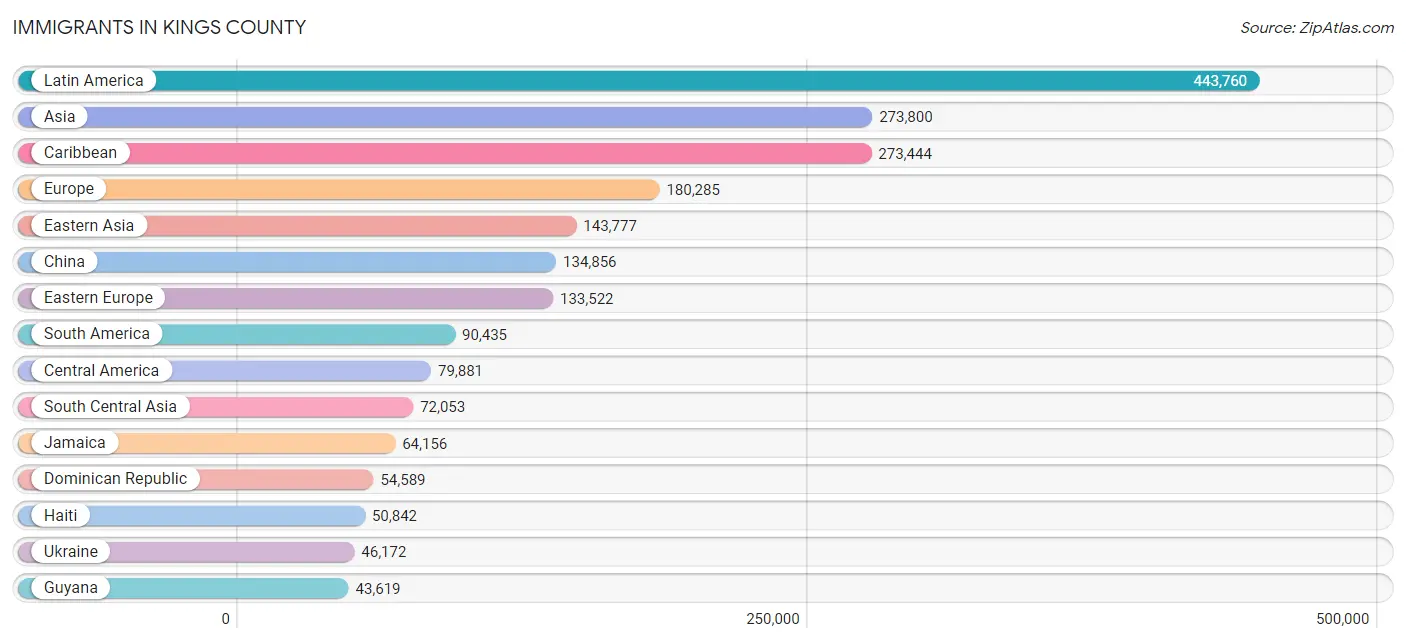
Immigrants in Kings County
The most numerous immigrant groups reported in Kings County came from Latin America (443,760 | 16.6%), Asia (273,800 | 10.2%), Caribbean (273,444 | 10.2%), Europe (180,285 | 6.7%), and Eastern Asia (143,777 | 5.4%), together accounting for 49.1% of all Kings County residents.
| Immigration Origin | # Population | % Population |
| Afghanistan | 278 | 0.0% |
| Africa | 35,797 | 1.3% |
| Albania | 4,611 | 0.2% |
| Argentina | 2,498 | 0.1% |
| Armenia | 1,094 | 0.0% |
| Asia | 273,800 | 10.2% |
| Australia | 2,975 | 0.1% |
| Austria | 776 | 0.0% |
| Bahamas | 608 | 0.0% |
| Bangladesh | 18,586 | 0.7% |
| Barbados | 15,101 | 0.6% |
| Belarus | 10,963 | 0.4% |
| Belgium | 861 | 0.0% |
| Belize | 2,461 | 0.1% |
| Bolivia | 166 | 0.0% |
| Bosnia and Herzegovina | 493 | 0.0% |
| Brazil | 3,302 | 0.1% |
| Bulgaria | 638 | 0.0% |
| Cabo Verde | 4 | 0.0% |
| Cambodia | 450 | 0.0% |
| Cameroon | 144 | 0.0% |
| Canada | 8,153 | 0.3% |
| Caribbean | 273,444 | 10.2% |
| Central America | 79,881 | 3.0% |
| Chile | 978 | 0.0% |
| China | 134,856 | 5.0% |
| Colombia | 8,859 | 0.3% |
| Congo | 99 | 0.0% |
| Costa Rica | 1,974 | 0.1% |
| Croatia | 366 | 0.0% |
| Cuba | 2,354 | 0.1% |
| Czechoslovakia | 2,015 | 0.1% |
| Denmark | 570 | 0.0% |
| Dominica | 1,370 | 0.1% |
| Dominican Republic | 54,589 | 2.0% |
| Eastern Africa | 2,367 | 0.1% |
| Eastern Asia | 143,777 | 5.4% |
| Eastern Europe | 133,522 | 5.0% |
| Ecuador | 21,351 | 0.8% |
| Egypt | 6,924 | 0.3% |
| El Salvador | 6,937 | 0.3% |
| England | 4,385 | 0.2% |
| Eritrea | 67 | 0.0% |
| Ethiopia | 515 | 0.0% |
| Europe | 180,285 | 6.7% |
| France | 6,350 | 0.2% |
| Germany | 4,617 | 0.2% |
| Ghana | 3,571 | 0.1% |
| Greece | 2,438 | 0.1% |
| Grenada | 17,191 | 0.6% |
| Guatemala | 10,246 | 0.4% |
| Guyana | 43,619 | 1.6% |
| Haiti | 50,842 | 1.9% |
| Honduras | 6,355 | 0.2% |
| Hong Kong | 11,297 | 0.4% |
| Hungary | 2,594 | 0.1% |
| India | 8,241 | 0.3% |
| Indonesia | 535 | 0.0% |
| Iran | 1,552 | 0.1% |
| Iraq | 157 | 0.0% |
| Ireland | 1,734 | 0.1% |
| Israel | 9,230 | 0.3% |
| Italy | 11,657 | 0.4% |
| Jamaica | 64,156 | 2.4% |
| Japan | 3,426 | 0.1% |
| Jordan | 846 | 0.0% |
| Kazakhstan | 3,201 | 0.1% |
| Kenya | 607 | 0.0% |
| Korea | 5,433 | 0.2% |
| Kuwait | 415 | 0.0% |
| Laos | 86 | 0.0% |
| Latin America | 443,760 | 16.6% |
| Latvia | 1,136 | 0.0% |
| Lebanon | 2,018 | 0.1% |
| Liberia | 737 | 0.0% |
| Lithuania | 734 | 0.0% |
| Malaysia | 2,350 | 0.1% |
| Mexico | 42,460 | 1.6% |
| Micronesia | 76 | 0.0% |
| Middle Africa | 816 | 0.0% |
| Moldova | 3,918 | 0.2% |
| Morocco | 2,904 | 0.1% |
| Nepal | 667 | 0.0% |
| Netherlands | 1,067 | 0.0% |
| Nicaragua | 1,525 | 0.1% |
| Nigeria | 7,353 | 0.3% |
| North Macedonia | 604 | 0.0% |
| Northern Africa | 12,981 | 0.5% |
| Northern Europe | 15,353 | 0.6% |
| Norway | 372 | 0.0% |
| Oceania | 3,582 | 0.1% |
| Pakistan | 16,057 | 0.6% |
| Panama | 7,796 | 0.3% |
| Peru | 3,870 | 0.1% |
| Philippines | 6,121 | 0.2% |
| Poland | 12,792 | 0.5% |
| Portugal | 301 | 0.0% |
| Romania | 2,456 | 0.1% |
| Russia | 35,509 | 1.3% |
| Saudi Arabia | 463 | 0.0% |
| Scotland | 309 | 0.0% |
| Senegal | 935 | 0.0% |
| Serbia | 519 | 0.0% |
| Sierra Leone | 749 | 0.0% |
| Singapore | 564 | 0.0% |
| Somalia | 133 | 0.0% |
| South Africa | 1,280 | 0.1% |
| South America | 90,435 | 3.4% |
| South Central Asia | 72,053 | 2.7% |
| South Eastern Asia | 16,562 | 0.6% |
| Southern Europe | 16,608 | 0.6% |
| Spain | 2,103 | 0.1% |
| Sri Lanka | 351 | 0.0% |
| St. Vincent and the Grenadines | 10,301 | 0.4% |
| Sudan | 1,423 | 0.1% |
| Sweden | 992 | 0.0% |
| Switzerland | 745 | 0.0% |
| Syria | 3,959 | 0.2% |
| Taiwan | 3,342 | 0.1% |
| Thailand | 569 | 0.0% |
| Trinidad and Tobago | 42,089 | 1.6% |
| Turkey | 4,625 | 0.2% |
| Uganda | 60 | 0.0% |
| Ukraine | 46,172 | 1.7% |
| Uruguay | 719 | 0.0% |
| Uzbekistan | 19,182 | 0.7% |
| Venezuela | 3,791 | 0.1% |
| Vietnam | 3,903 | 0.2% |
| West Indies | 4,082 | 0.2% |
| Western Africa | 16,401 | 0.6% |
| Western Asia | 40,250 | 1.5% |
| Western Europe | 14,478 | 0.5% |
| Yemen | 4,927 | 0.2% |
| Zaire | 71 | 0.0% |
| Zimbabwe | 276 | 0.0% | View All 135 Rows |
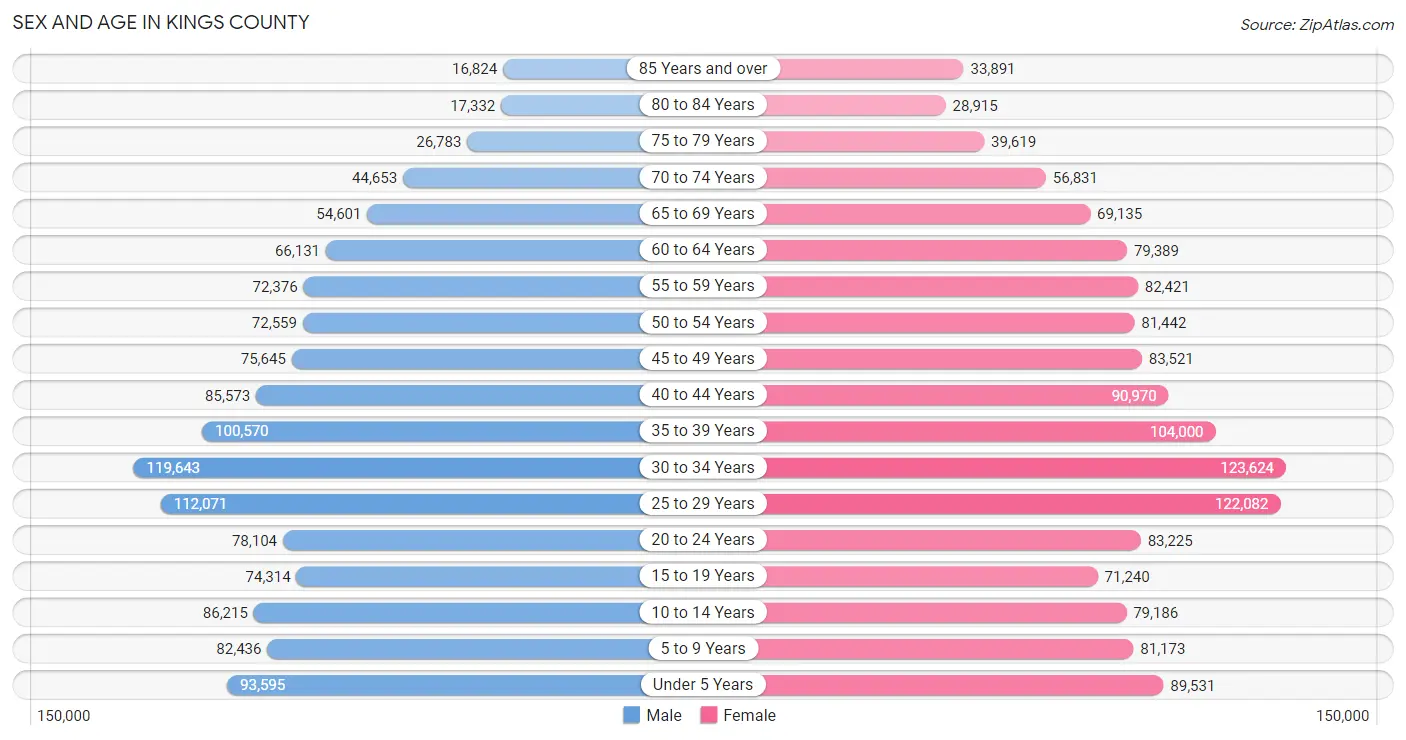
Sex and Age in Kings County
Sex and Age in Kings County
The most populous age groups in Kings County are 30 to 34 Years (119,643 | 9.3%) for men and 30 to 34 Years (123,624 | 8.8%) for women.
| Age Bracket | Male | Female |
| Under 5 Years | 93,595 (7.3%) | 89,531 (6.4%) |
| 5 to 9 Years | 82,436 (6.4%) | 81,173 (5.8%) |
| 10 to 14 Years | 86,215 (6.7%) | 79,186 (5.7%) |
| 15 to 19 Years | 74,314 (5.8%) | 71,240 (5.1%) |
| 20 to 24 Years | 78,104 (6.1%) | 83,225 (5.9%) |
| 25 to 29 Years | 112,071 (8.8%) | 122,082 (8.7%) |
| 30 to 34 Years | 119,643 (9.3%) | 123,624 (8.8%) |
| 35 to 39 Years | 100,570 (7.9%) | 104,000 (7.4%) |
| 40 to 44 Years | 85,573 (6.7%) | 90,970 (6.5%) |
| 45 to 49 Years | 75,645 (5.9%) | 83,521 (6.0%) |
| 50 to 54 Years | 72,559 (5.7%) | 81,442 (5.8%) |
| 55 to 59 Years | 72,376 (5.7%) | 82,421 (5.9%) |
| 60 to 64 Years | 66,131 (5.2%) | 79,389 (5.7%) |
| 65 to 69 Years | 54,601 (4.3%) | 69,135 (4.9%) |
| 70 to 74 Years | 44,653 (3.5%) | 56,831 (4.1%) |
| 75 to 79 Years | 26,783 (2.1%) | 39,619 (2.8%) |
| 80 to 84 Years | 17,332 (1.3%) | 28,915 (2.1%) |
| 85 Years and over | 16,824 (1.3%) | 33,891 (2.4%) |
| Total | 1,279,425 (100.0%) | 1,400,195 (100.0%) |
Families and Households in Kings County
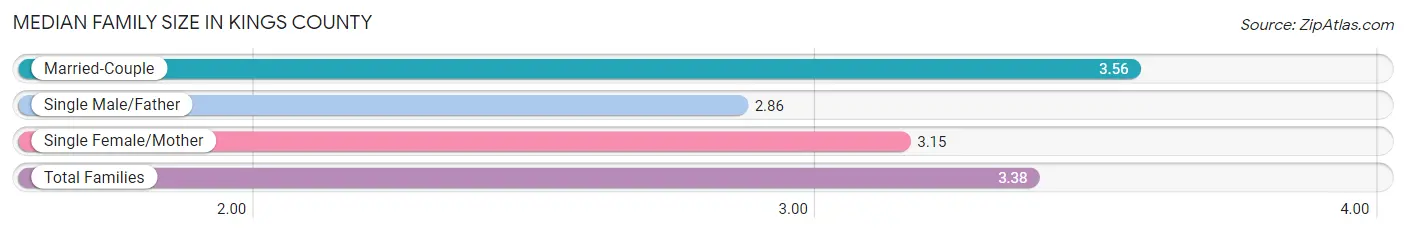
Median Family Size in Kings County
The median family size in Kings County is 3.38 persons per family, with married-couple families (371,884 | 62.0%) accounting for the largest median family size of 3.56 persons per family. On the other hand, single male/father families (54,646 | 9.1%) represent the smallest median family size with 2.86 persons per family.
| Family Type | # Families | Family Size |
| Married-Couple | 371,884 (62.0%) | 3.56 |
| Single Male/Father | 54,646 (9.1%) | 2.86 |
| Single Female/Mother | 173,647 (28.9%) | 3.15 |
| Total Families | 600,177 (100.0%) | 3.38 |
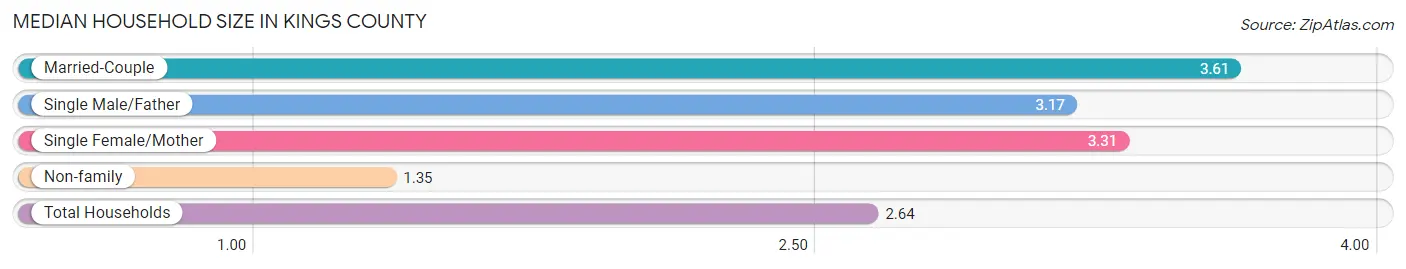
Median Household Size in Kings County
The median household size in Kings County is 2.64 persons per household, with married-couple households (371,884 | 37.3%) accounting for the largest median household size of 3.61 persons per household. non-family households (397,780 | 39.9%) represent the smallest median household size with 1.35 persons per household.
| Household Type | # Households | Household Size |
| Married-Couple | 371,884 (37.3%) | 3.61 |
| Single Male/Father | 54,646 (5.5%) | 3.17 |
| Single Female/Mother | 173,647 (17.4%) | 3.31 |
| Non-family | 397,780 (39.9%) | 1.35 |
| Total Households | 997,957 (100.0%) | 2.64 |
Household Size by Marriage Status in Kings County
Out of a total of 997,957 households in Kings County, 600,177 (60.1%) are family households, while 397,780 (39.9%) are nonfamily households. The most numerous type of family households are 2-person households, comprising 221,957, and the most common type of nonfamily households are 1-person households, comprising 295,537.
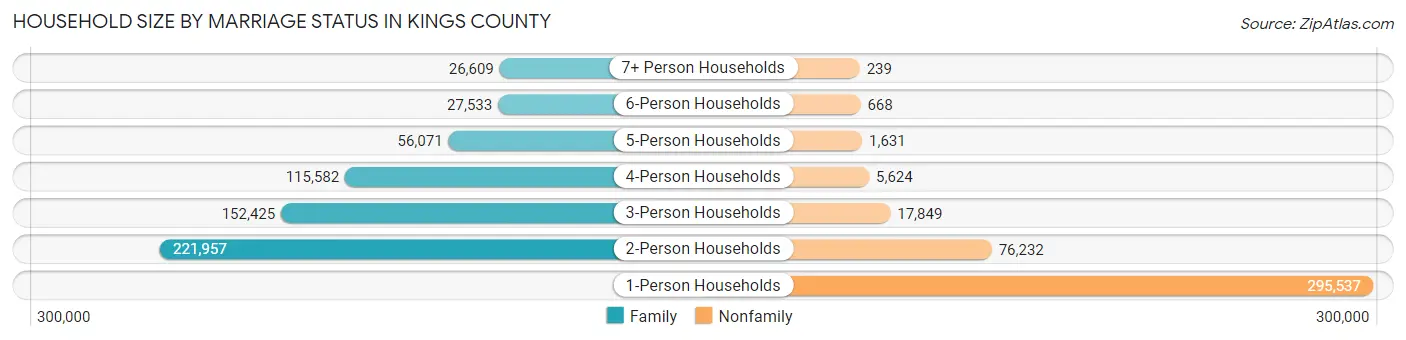
| Household Size | Family Households | Nonfamily Households |
| 1-Person Households | - | 295,537 (29.6%) |
| 2-Person Households | 221,957 (22.2%) | 76,232 (7.6%) |
| 3-Person Households | 152,425 (15.3%) | 17,849 (1.8%) |
| 4-Person Households | 115,582 (11.6%) | 5,624 (0.6%) |
| 5-Person Households | 56,071 (5.6%) | 1,631 (0.2%) |
| 6-Person Households | 27,533 (2.8%) | 668 (0.1%) |
| 7+ Person Households | 26,609 (2.7%) | 239 (0.0%) |
| Total | 600,177 (60.1%) | 397,780 (39.9%) |
Female Fertility in Kings County
Fertility by Age in Kings County
Average fertility rate in Kings County is 46.0 births per 1,000 women. Women in the age bracket of 20 to 34 years have the highest fertility rate with 59.0 births per 1,000 women. Women in the age bracket of 20 to 34 years acount for 60.7% of all women with births.
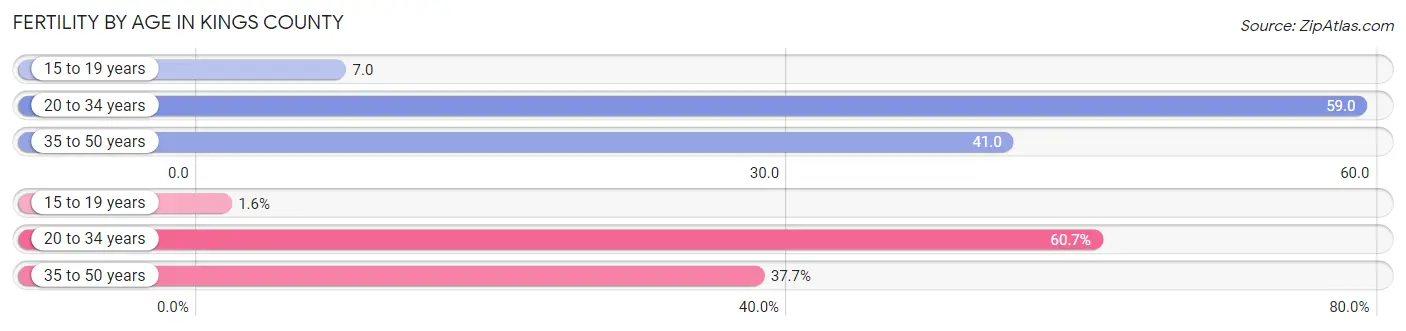
| Age Bracket | Women with Births | Births / 1,000 Women |
| 15 to 19 years | 506 (1.6%) | 7.0 |
| 20 to 34 years | 19,543 (60.7%) | 59.0 |
| 35 to 50 years | 12,141 (37.7%) | 41.0 |
| Total | 32,190 (100.0%) | 46.0 |
Fertility by Age by Marriage Status in Kings County
73.8% of women with births (32,190) in Kings County are married. The highest percentage of unmarried women with births falls into 15 to 19 years age bracket with 69.2% of them unmarried at the time of birth, while the lowest percentage of unmarried women with births belong to 35 to 50 years age bracket with 19.9% of them unmarried.
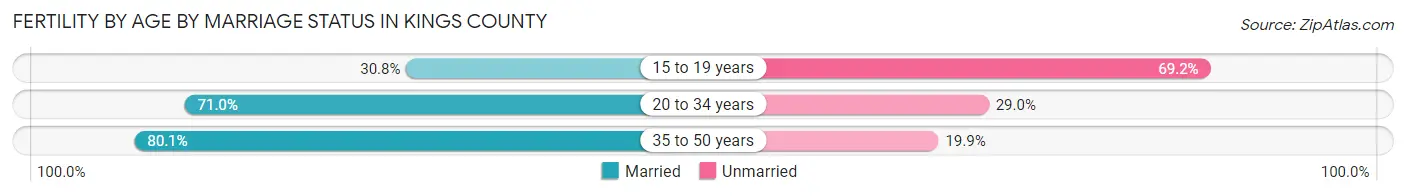
| Age Bracket | Married | Unmarried |
| 15 to 19 years | 156 (30.8%) | 350 (69.2%) |
| 20 to 34 years | 13,876 (71.0%) | 5,667 (29.0%) |
| 35 to 50 years | 9,725 (80.1%) | 2,416 (19.9%) |
| Total | 23,756 (73.8%) | 8,434 (26.2%) |
Fertility by Education in Kings County
Average fertility rate in Kings County is 46.0 births per 1,000 women. Women with the education attainment of graduate degree have the highest fertility rate of 61.0 births per 1,000 women, while women with the education attainment of bachelor's degree have the lowest fertility at 37.0 births per 1,000 women. Women with the education attainment of high school diploma represent 24.9% of all women with births.
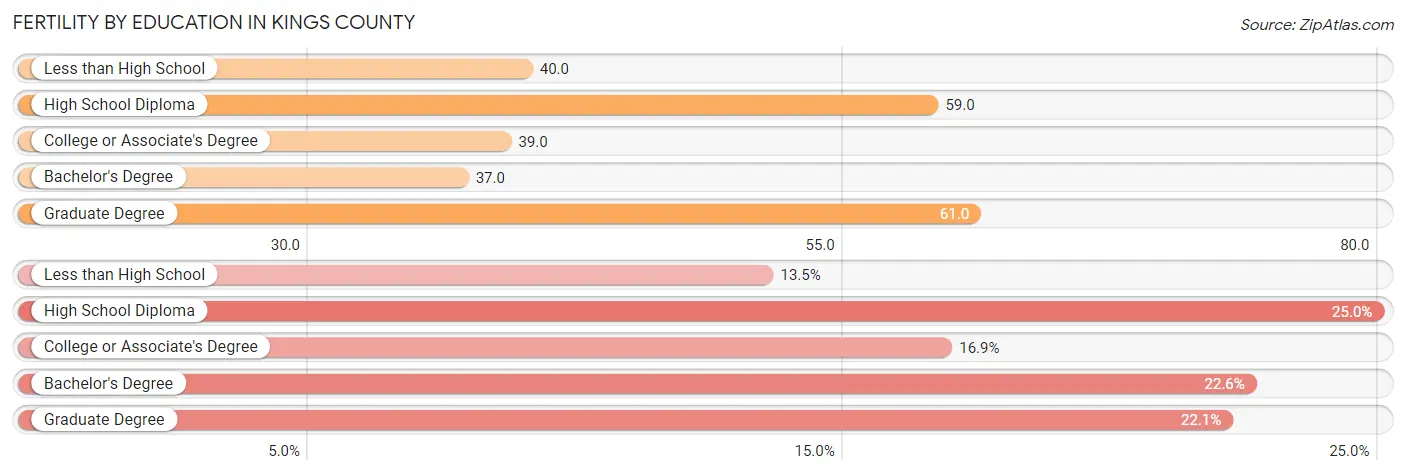
| Educational Attainment | Women with Births | Births / 1,000 Women |
| Less than High School | 4,348 (13.5%) | 40.0 |
| High School Diploma | 8,031 (24.9%) | 59.0 |
| College or Associate's Degree | 5,428 (16.9%) | 39.0 |
| Bachelor's Degree | 7,263 (22.6%) | 37.0 |
| Graduate Degree | 7,120 (22.1%) | 61.0 |
| Total | 32,190 (100.0%) | 46.0 |
Fertility by Education by Marriage Status in Kings County
26.2% of women with births in Kings County are unmarried. Women with the educational attainment of graduate degree are most likely to be married with 90.3% of them married at childbirth, while women with the educational attainment of college or associate's degree are least likely to be married with 40.7% of them unmarried at childbirth.
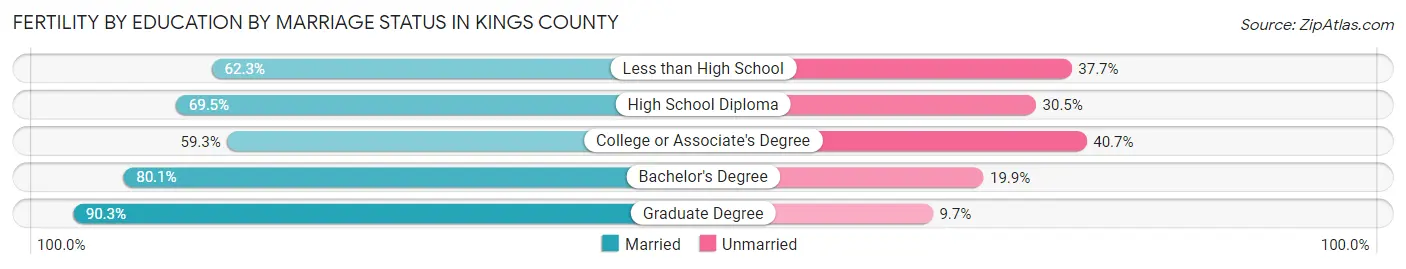
| Educational Attainment | Married | Unmarried |
| Less than High School | 2,709 (62.3%) | 1,639 (37.7%) |
| High School Diploma | 5,582 (69.5%) | 2,449 (30.5%) |
| College or Associate's Degree | 3,219 (59.3%) | 2,209 (40.7%) |
| Bachelor's Degree | 5,818 (80.1%) | 1,445 (19.9%) |
| Graduate Degree | 6,429 (90.3%) | 691 (9.7%) |
| Total | 23,756 (73.8%) | 8,434 (26.2%) |
Employment Characteristics in Kings County
Employment by Class of Employer in Kings County
Among the 1,222,797 employed individuals in Kings County, private company employees (781,711 | 63.9%), not-for-profit organizations (142,772 | 11.7%), and local government employees (122,742 | 10.0%) make up the most common classes of employment.
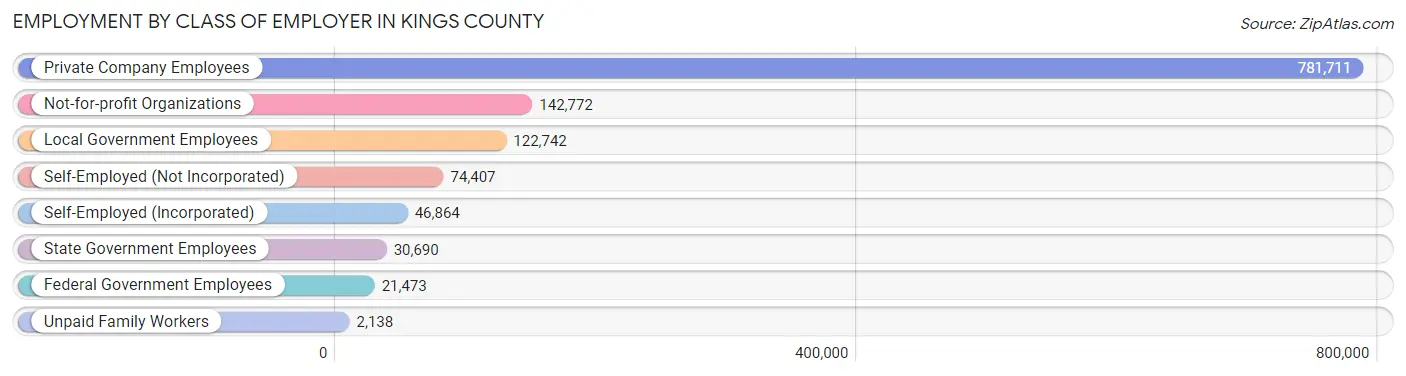
| Employer Class | # Employees | % Employees |
| Private Company Employees | 781,711 | 63.9% |
| Self-Employed (Incorporated) | 46,864 | 3.8% |
| Self-Employed (Not Incorporated) | 74,407 | 6.1% |
| Not-for-profit Organizations | 142,772 | 11.7% |
| Local Government Employees | 122,742 | 10.0% |
| State Government Employees | 30,690 | 2.5% |
| Federal Government Employees | 21,473 | 1.8% |
| Unpaid Family Workers | 2,138 | 0.2% |
| Total | 1,222,797 | 100.0% |
Employment Status by Age in Kings County
According to the labor force statistics for Kings County, out of the total population over 16 years of age (2,135,345), 63.7% or 1,360,215 individuals are in the labor force, with 7.3% or 99,296 of them unemployed. The age group with the highest labor force participation rate is 30 to 34 years, with 84.7% or 206,047 individuals in the labor force. Within the labor force, the 16 to 19 years age range has the highest percentage of unemployed individuals, with 28.4% or 5,894 of them being unemployed.
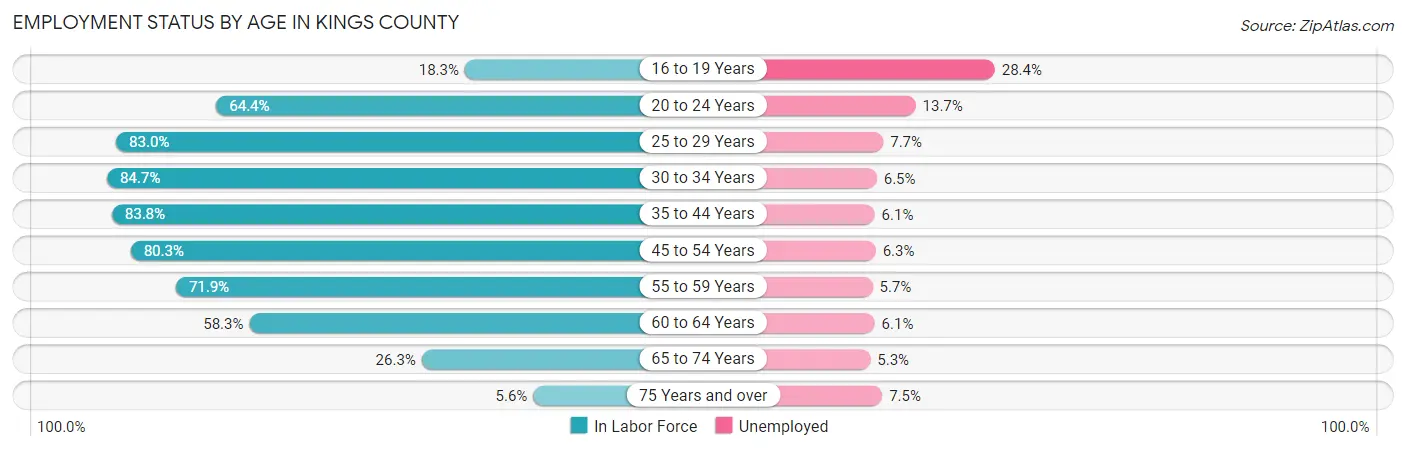
| Age Bracket | In Labor Force | Unemployed |
| 16 to 19 Years | 20,755 (18.3%) | 5,894 (28.4%) |
| 20 to 24 Years | 103,896 (64.4%) | 14,234 (13.7%) |
| 25 to 29 Years | 194,347 (83.0%) | 14,965 (7.7%) |
| 30 to 34 Years | 206,047 (84.7%) | 13,393 (6.5%) |
| 35 to 44 Years | 319,373 (83.8%) | 19,482 (6.1%) |
| 45 to 54 Years | 251,473 (80.3%) | 15,843 (6.3%) |
| 55 to 59 Years | 111,299 (71.9%) | 6,344 (5.7%) |
| 60 to 64 Years | 84,838 (58.3%) | 5,175 (6.1%) |
| 65 to 74 Years | 59,233 (26.3%) | 3,139 (5.3%) |
| 75 Years and over | 9,148 (5.6%) | 686 (7.5%) |
| Total | 1,360,215 (63.7%) | 99,296 (7.3%) |
Employment Status by Educational Attainment in Kings County
According to labor force statistics for Kings County, 79.3% of individuals (1,167,309) out of the total population between 25 and 64 years of age (1,472,017) are in the labor force, with 6.4% or 74,708 of them being unemployed. The group with the highest labor force participation rate are those with the educational attainment of bachelor's degree or higher, with 89.8% or 581,853 individuals in the labor force. Within the labor force, individuals with less than high school education have the highest percentage of unemployment, with 9.2% or 10,947 of them being unemployed.
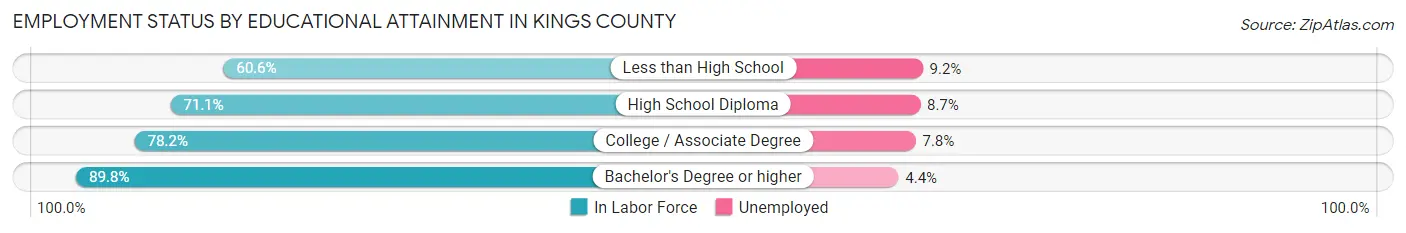
| Educational Attainment | In Labor Force | Unemployed |
| Less than High School | 118,987 (60.6%) | 18,064 (9.2%) |
| High School Diploma | 246,319 (71.1%) | 30,140 (8.7%) |
| College / Associate Degree | 219,966 (78.2%) | 21,940 (7.8%) |
| Bachelor's Degree or higher | 581,853 (89.8%) | 28,509 (4.4%) |
| Total | 1,167,309 (79.3%) | 94,209 (6.4%) |
Employment Occupations by Sex in Kings County
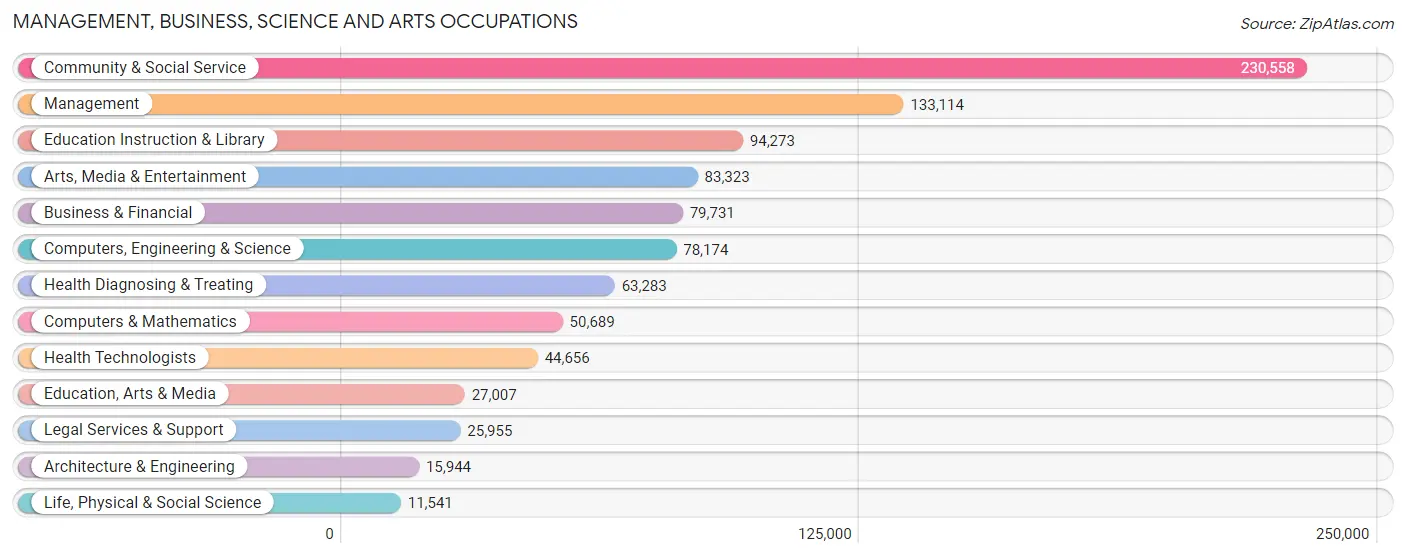
Management, Business, Science and Arts Occupations
The most common Management, Business, Science and Arts occupations in Kings County are Community & Social Service (230,558 | 18.3%), Management (133,114 | 10.6%), Education Instruction & Library (94,273 | 7.5%), Arts, Media & Entertainment (83,323 | 6.6%), and Business & Financial (79,731 | 6.3%).
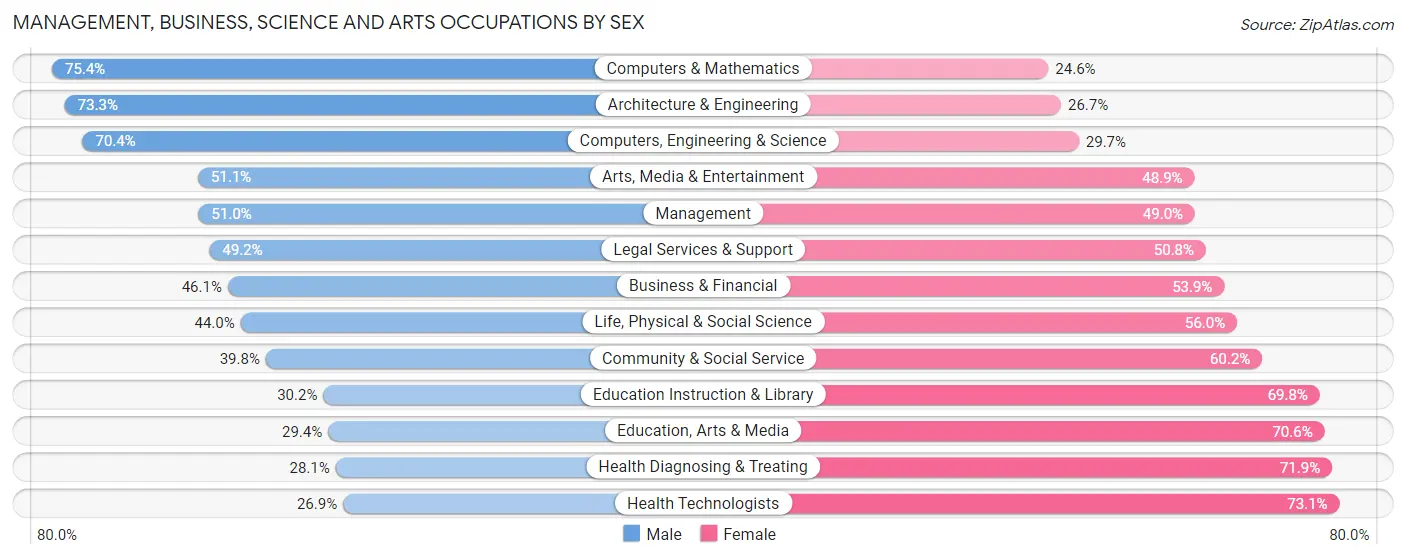
Management, Business, Science and Arts Occupations by Sex
Within the Management, Business, Science and Arts occupations in Kings County, the most male-oriented occupations are Computers & Mathematics (75.4%), Architecture & Engineering (73.3%), and Computers, Engineering & Science (70.4%), while the most female-oriented occupations are Health Technologists (73.1%), Health Diagnosing & Treating (71.9%), and Education, Arts & Media (70.6%).
| Occupation | Male | Female |
| Management | 67,869 (51.0%) | 65,245 (49.0%) |
| Business & Financial | 36,757 (46.1%) | 42,974 (53.9%) |
| Computers, Engineering & Science | 54,999 (70.4%) | 23,175 (29.6%) |
| Computers & Mathematics | 38,236 (75.4%) | 12,453 (24.6%) |
| Architecture & Engineering | 11,690 (73.3%) | 4,254 (26.7%) |
| Life, Physical & Social Science | 5,073 (44.0%) | 6,468 (56.0%) |
| Community & Social Service | 91,668 (39.8%) | 138,890 (60.2%) |
| Education, Arts & Media | 7,928 (29.4%) | 19,079 (70.6%) |
| Legal Services & Support | 12,760 (49.2%) | 13,195 (50.8%) |
| Education Instruction & Library | 28,431 (30.2%) | 65,842 (69.8%) |
| Arts, Media & Entertainment | 42,549 (51.1%) | 40,774 (48.9%) |
| Health Diagnosing & Treating | 17,787 (28.1%) | 45,496 (71.9%) |
| Health Technologists | 11,997 (26.9%) | 32,659 (73.1%) |
| Total (Category) | 269,080 (46.0%) | 315,780 (54.0%) |
| Total (Overall) | 624,135 (49.5%) | 636,501 (50.5%) |
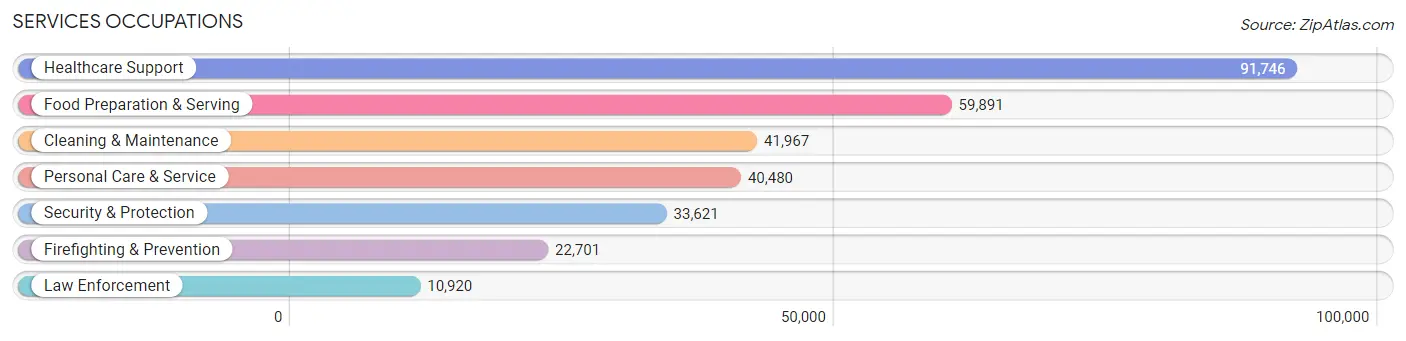
Services Occupations
The most common Services occupations in Kings County are Healthcare Support (91,746 | 7.3%), Food Preparation & Serving (59,891 | 4.8%), Cleaning & Maintenance (41,967 | 3.3%), Personal Care & Service (40,480 | 3.2%), and Security & Protection (33,621 | 2.7%).
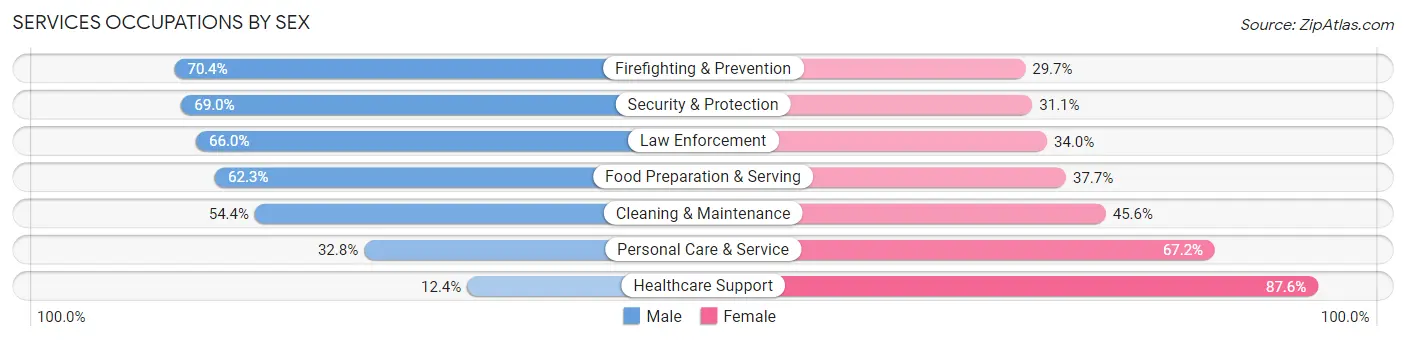
Services Occupations by Sex
Within the Services occupations in Kings County, the most male-oriented occupations are Firefighting & Prevention (70.4%), Security & Protection (69.0%), and Law Enforcement (66.0%), while the most female-oriented occupations are Healthcare Support (87.6%), Personal Care & Service (67.2%), and Cleaning & Maintenance (45.6%).
| Occupation | Male | Female |
| Healthcare Support | 11,355 (12.4%) | 80,391 (87.6%) |
| Security & Protection | 23,180 (69.0%) | 10,441 (31.0%) |
| Firefighting & Prevention | 15,970 (70.4%) | 6,731 (29.6%) |
| Law Enforcement | 7,210 (66.0%) | 3,710 (34.0%) |
| Food Preparation & Serving | 37,293 (62.3%) | 22,598 (37.7%) |
| Cleaning & Maintenance | 22,836 (54.4%) | 19,131 (45.6%) |
| Personal Care & Service | 13,278 (32.8%) | 27,202 (67.2%) |
| Total (Category) | 107,942 (40.3%) | 159,763 (59.7%) |
| Total (Overall) | 624,135 (49.5%) | 636,501 (50.5%) |
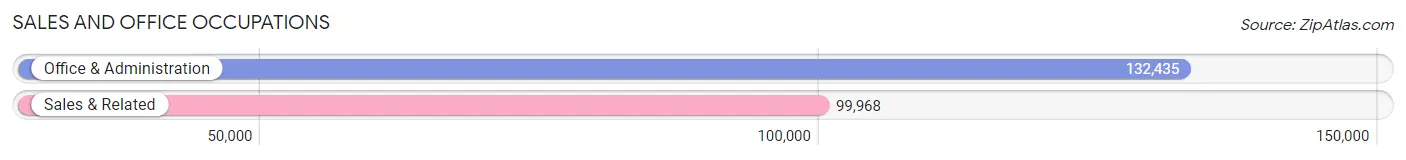
Sales and Office Occupations
The most common Sales and Office occupations in Kings County are Office & Administration (132,435 | 10.5%), and Sales & Related (99,968 | 7.9%).
Sales and Office Occupations by Sex
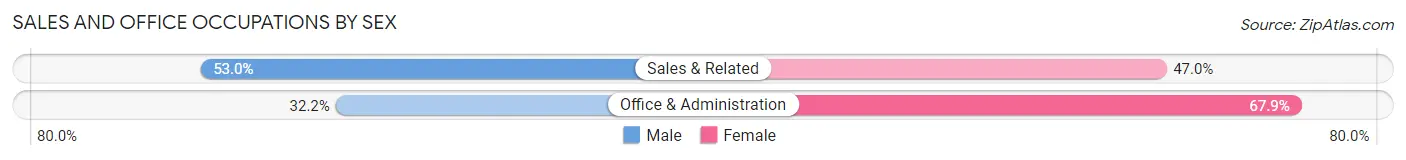
| Occupation | Male | Female |
| Sales & Related | 52,960 (53.0%) | 47,008 (47.0%) |
| Office & Administration | 42,574 (32.2%) | 89,861 (67.8%) |
| Total (Category) | 95,534 (41.1%) | 136,869 (58.9%) |
| Total (Overall) | 624,135 (49.5%) | 636,501 (50.5%) |
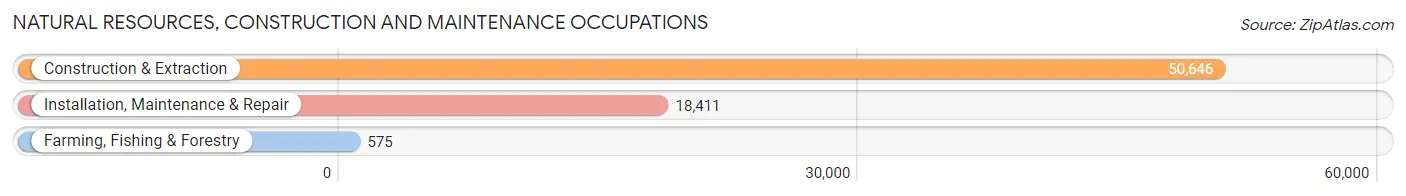
Natural Resources, Construction and Maintenance Occupations
The most common Natural Resources, Construction and Maintenance occupations in Kings County are Construction & Extraction (50,646 | 4.0%), Installation, Maintenance & Repair (18,411 | 1.5%), and Farming, Fishing & Forestry (575 | 0.1%).
Natural Resources, Construction and Maintenance Occupations by Sex
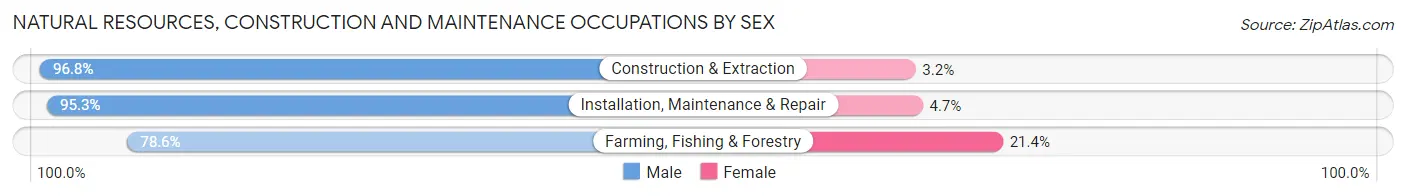
| Occupation | Male | Female |
| Farming, Fishing & Forestry | 452 (78.6%) | 123 (21.4%) |
| Construction & Extraction | 49,016 (96.8%) | 1,630 (3.2%) |
| Installation, Maintenance & Repair | 17,546 (95.3%) | 865 (4.7%) |
| Total (Category) | 67,014 (96.2%) | 2,618 (3.8%) |
| Total (Overall) | 624,135 (49.5%) | 636,501 (50.5%) |
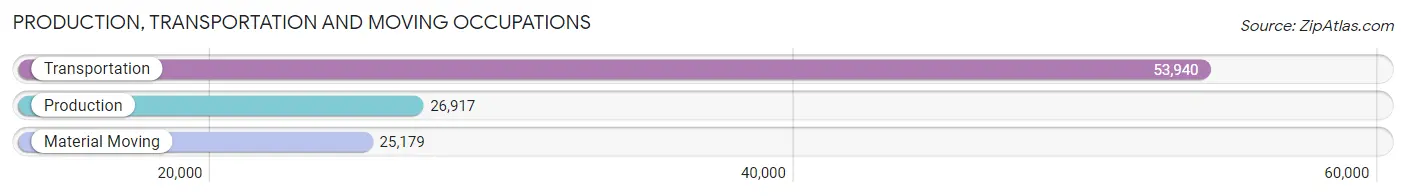
Production, Transportation and Moving Occupations
The most common Production, Transportation and Moving occupations in Kings County are Transportation (53,940 | 4.3%), Production (26,917 | 2.1%), and Material Moving (25,179 | 2.0%).
Production, Transportation and Moving Occupations by Sex
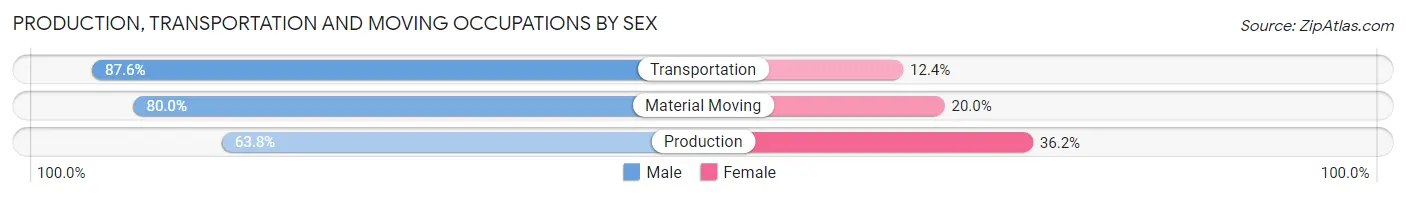
| Occupation | Male | Female |
| Production | 17,170 (63.8%) | 9,747 (36.2%) |
| Transportation | 47,253 (87.6%) | 6,687 (12.4%) |
| Material Moving | 20,142 (80.0%) | 5,037 (20.0%) |
| Total (Category) | 84,565 (79.7%) | 21,471 (20.3%) |
| Total (Overall) | 624,135 (49.5%) | 636,501 (50.5%) |
Employment Industries by Sex in Kings County
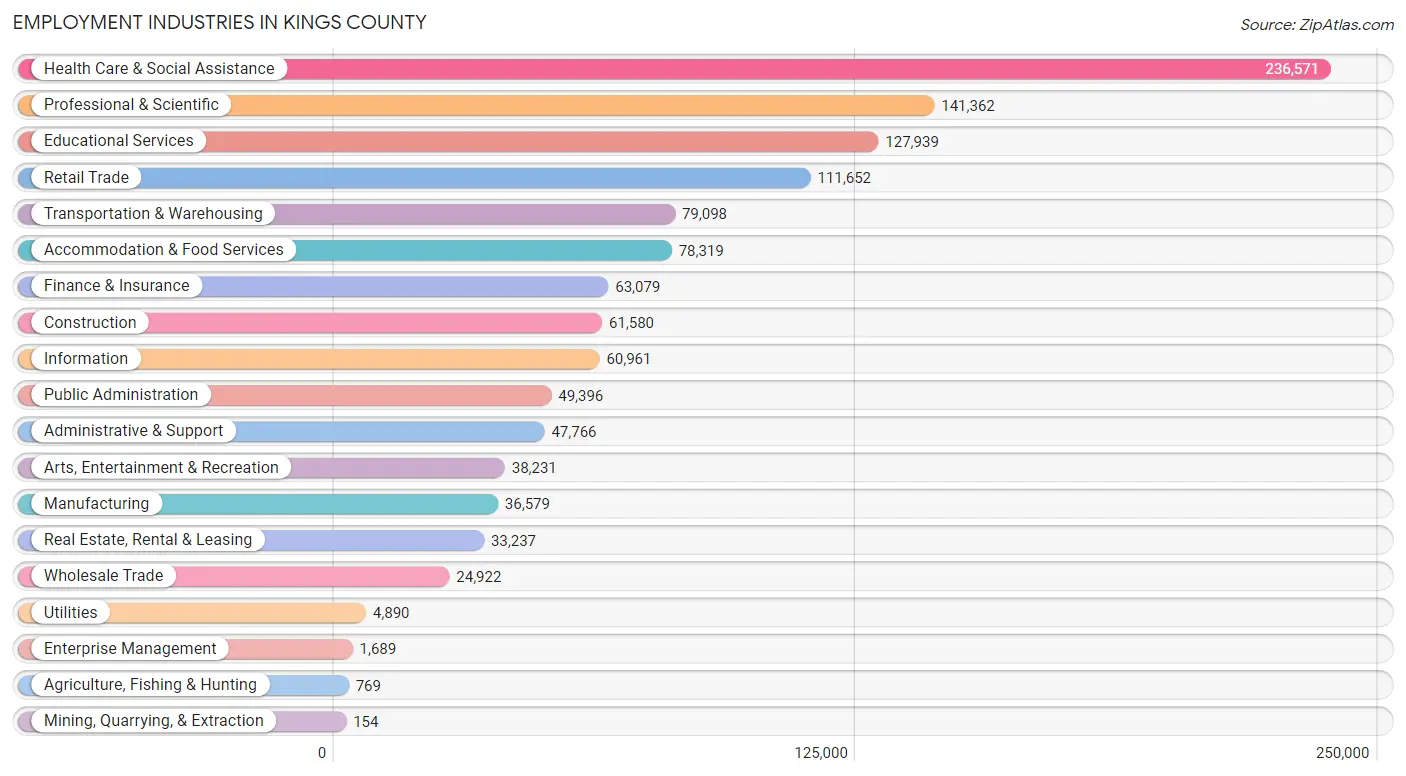
Employment Industries in Kings County
The major employment industries in Kings County include Health Care & Social Assistance (236,571 | 18.8%), Professional & Scientific (141,362 | 11.2%), Educational Services (127,939 | 10.2%), Retail Trade (111,652 | 8.9%), and Transportation & Warehousing (79,098 | 6.3%).
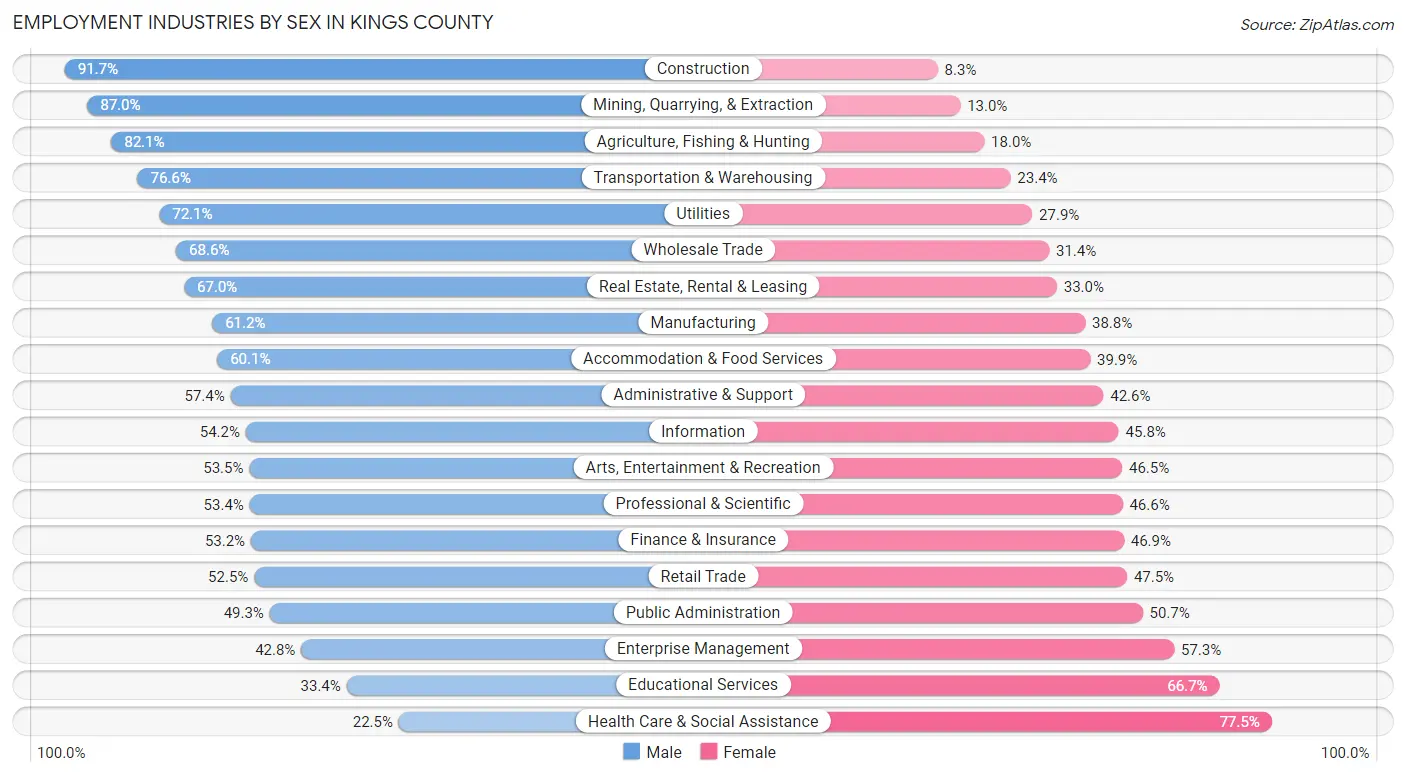
Employment Industries by Sex in Kings County
The Kings County industries that see more men than women are Construction (91.7%), Mining, Quarrying, & Extraction (87.0%), and Agriculture, Fishing & Hunting (82.1%), whereas the industries that tend to have a higher number of women are Health Care & Social Assistance (77.5%), Educational Services (66.6%), and Enterprise Management (57.3%).
| Industry | Male | Female |
| Agriculture, Fishing & Hunting | 631 (82.1%) | 138 (17.9%) |
| Mining, Quarrying, & Extraction | 134 (87.0%) | 20 (13.0%) |
| Construction | 56,448 (91.7%) | 5,132 (8.3%) |
| Manufacturing | 22,370 (61.2%) | 14,209 (38.8%) |
| Wholesale Trade | 17,102 (68.6%) | 7,820 (31.4%) |
| Retail Trade | 58,604 (52.5%) | 53,048 (47.5%) |
| Transportation & Warehousing | 60,600 (76.6%) | 18,498 (23.4%) |
| Utilities | 3,526 (72.1%) | 1,364 (27.9%) |
| Information | 33,049 (54.2%) | 27,912 (45.8%) |
| Finance & Insurance | 33,527 (53.1%) | 29,552 (46.9%) |
| Real Estate, Rental & Leasing | 22,271 (67.0%) | 10,966 (33.0%) |
| Professional & Scientific | 75,517 (53.4%) | 65,845 (46.6%) |
| Enterprise Management | 722 (42.7%) | 967 (57.3%) |
| Administrative & Support | 27,409 (57.4%) | 20,357 (42.6%) |
| Educational Services | 42,665 (33.4%) | 85,274 (66.6%) |
| Health Care & Social Assistance | 53,327 (22.5%) | 183,244 (77.5%) |
| Arts, Entertainment & Recreation | 20,455 (53.5%) | 17,776 (46.5%) |
| Accommodation & Food Services | 47,084 (60.1%) | 31,235 (39.9%) |
| Public Administration | 24,337 (49.3%) | 25,059 (50.7%) |
| Total | 624,135 (49.5%) | 636,501 (50.5%) |
Education in Kings County
School Enrollment in Kings County
The most common levels of schooling among the 650,230 students in Kings County are middle school (133,830 | 20.6%), elementary school (131,027 | 20.2%), and college / undergraduate (130,095 | 20.0%).
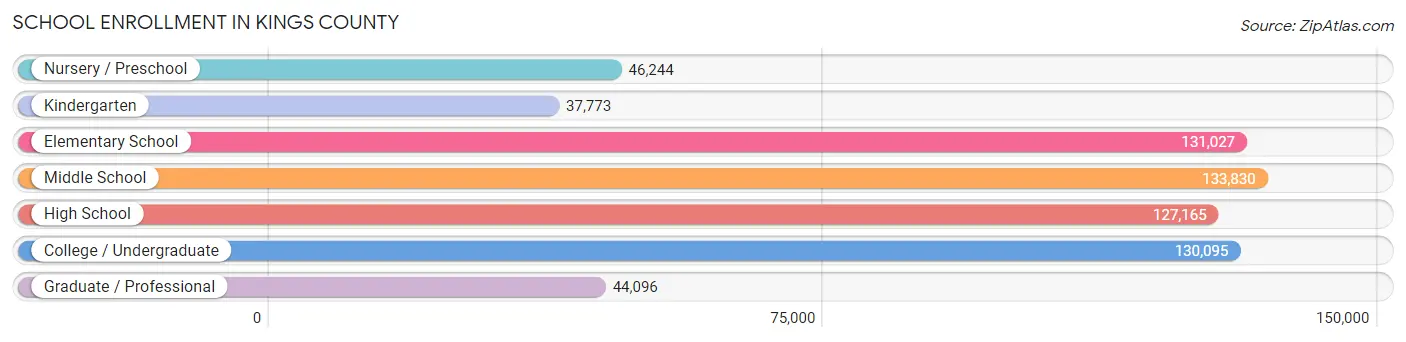
| School Level | # Students | % Students |
| Nursery / Preschool | 46,244 | 7.1% |
| Kindergarten | 37,773 | 5.8% |
| Elementary School | 131,027 | 20.2% |
| Middle School | 133,830 | 20.6% |
| High School | 127,165 | 19.6% |
| College / Undergraduate | 130,095 | 20.0% |
| Graduate / Professional | 44,096 | 6.8% |
| Total | 650,230 | 100.0% |
School Enrollment by Age by Funding Source in Kings County
Out of a total of 650,230 students who are enrolled in schools in Kings County, 210,675 (32.4%) attend a private institution, while the remaining 439,555 (67.6%) are enrolled in public schools. The age group of 25 to 34 year olds has the highest likelihood of being enrolled in private schools, with 23,060 (47.5% in the age bracket) enrolled. Conversely, the age group of 15 to 17 year olds has the lowest likelihood of being enrolled in a private school, with 66,928 (75.2% in the age bracket) attending a public institution.
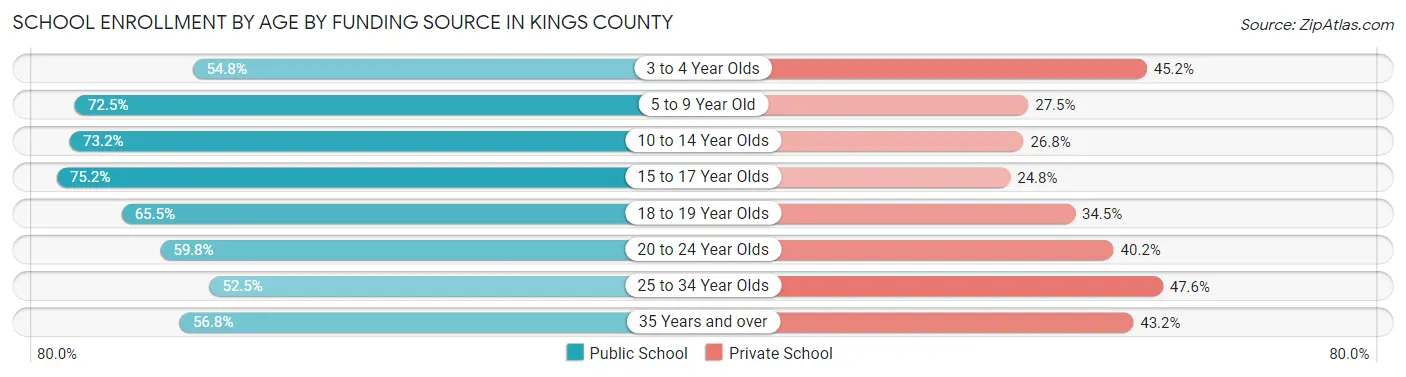
| Age Bracket | Public School | Private School |
| 3 to 4 Year Olds | 27,009 (54.8%) | 22,255 (45.2%) |
| 5 to 9 Year Old | 115,438 (72.5%) | 43,812 (27.5%) |
| 10 to 14 Year Olds | 118,395 (73.2%) | 43,334 (26.8%) |
| 15 to 17 Year Olds | 66,928 (75.2%) | 22,104 (24.8%) |
| 18 to 19 Year Olds | 26,814 (65.5%) | 14,110 (34.5%) |
| 20 to 24 Year Olds | 40,379 (59.8%) | 27,175 (40.2%) |
| 25 to 34 Year Olds | 25,434 (52.4%) | 23,060 (47.5%) |
| 35 Years and over | 19,315 (56.8%) | 14,668 (43.2%) |
| Total | 439,555 (67.6%) | 210,675 (32.4%) |
Educational Attainment by Field of Study in Kings County
Business (128,675 | 15.6%), visual & performing arts (98,581 | 12.0%), social sciences (94,271 | 11.4%), science & technology (63,956 | 7.8%), and literature & languages (60,015 | 7.3%) are the most common fields of study among 823,728 individuals in Kings County who have obtained a bachelor's degree or higher.
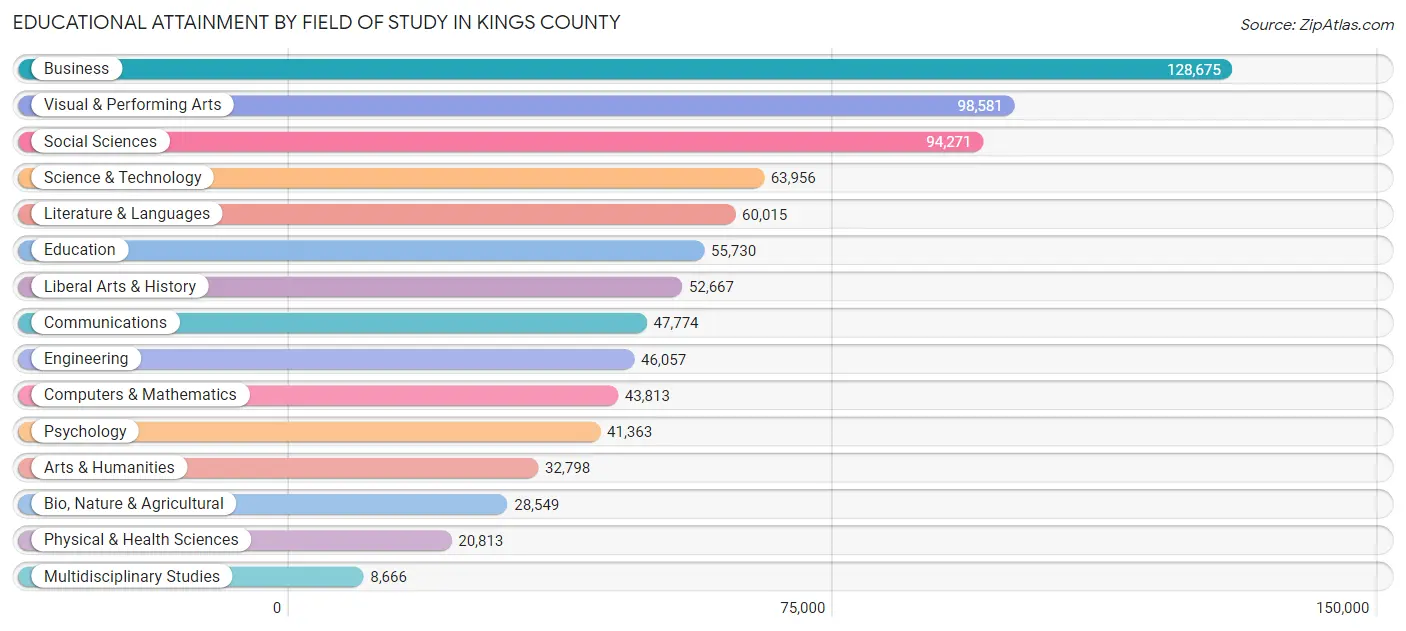
| Field of Study | # Graduates | % Graduates |
| Computers & Mathematics | 43,813 | 5.3% |
| Bio, Nature & Agricultural | 28,549 | 3.5% |
| Physical & Health Sciences | 20,813 | 2.5% |
| Psychology | 41,363 | 5.0% |
| Social Sciences | 94,271 | 11.4% |
| Engineering | 46,057 | 5.6% |
| Multidisciplinary Studies | 8,666 | 1.1% |
| Science & Technology | 63,956 | 7.8% |
| Business | 128,675 | 15.6% |
| Education | 55,730 | 6.8% |
| Literature & Languages | 60,015 | 7.3% |
| Liberal Arts & History | 52,667 | 6.4% |
| Visual & Performing Arts | 98,581 | 12.0% |
| Communications | 47,774 | 5.8% |
| Arts & Humanities | 32,798 | 4.0% |
| Total | 823,728 | 100.0% |
Transportation & Commute in Kings County
Vehicle Availability by Sex in Kings County
The most prevalent vehicle ownership categories in Kings County are males with no vehicle (263,734, accounting for 43.5%) and females with no vehicle (301,873, making up 43.2%).
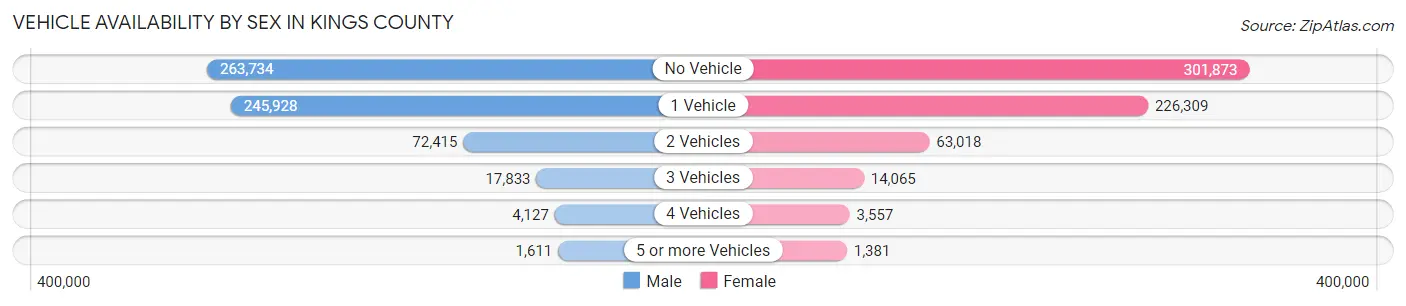
| Vehicles Available | Male | Female |
| No Vehicle | 263,734 (43.5%) | 301,873 (49.5%) |
| 1 Vehicle | 245,928 (40.6%) | 226,309 (37.1%) |
| 2 Vehicles | 72,415 (12.0%) | 63,018 (10.3%) |
| 3 Vehicles | 17,833 (2.9%) | 14,065 (2.3%) |
| 4 Vehicles | 4,127 (0.7%) | 3,557 (0.6%) |
| 5 or more Vehicles | 1,611 (0.3%) | 1,381 (0.2%) |
| Total | 605,648 (100.0%) | 610,203 (100.0%) |
Commute Time in Kings County
The most frequently occuring commute durations in Kings County are 60 to 89 minutes (216,456 commuters, 20.7%), 45 to 59 minutes (199,899 commuters, 19.1%), and 30 to 34 minutes (162,309 commuters, 15.5%).
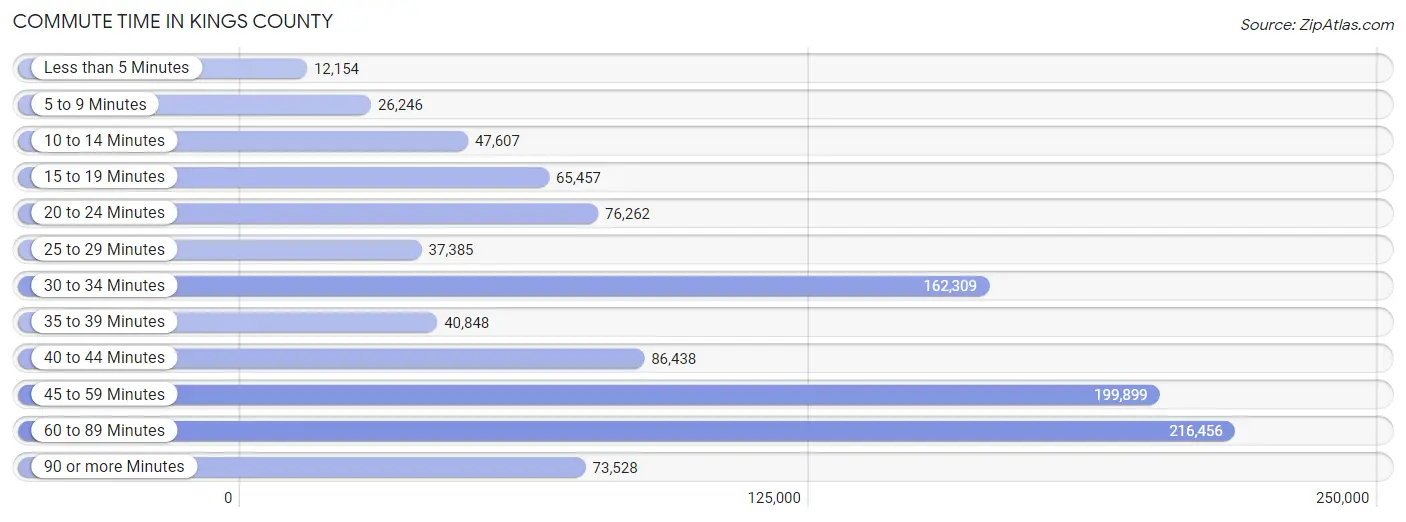
| Commute Time | # Commuters | % Commuters |
| Less than 5 Minutes | 12,154 | 1.2% |
| 5 to 9 Minutes | 26,246 | 2.5% |
| 10 to 14 Minutes | 47,607 | 4.6% |
| 15 to 19 Minutes | 65,457 | 6.3% |
| 20 to 24 Minutes | 76,262 | 7.3% |
| 25 to 29 Minutes | 37,385 | 3.6% |
| 30 to 34 Minutes | 162,309 | 15.5% |
| 35 to 39 Minutes | 40,848 | 3.9% |
| 40 to 44 Minutes | 86,438 | 8.3% |
| 45 to 59 Minutes | 199,899 | 19.1% |
| 60 to 89 Minutes | 216,456 | 20.7% |
| 90 or more Minutes | 73,528 | 7.0% |
Commute Time by Sex in Kings County
The most common commute times in Kings County are 60 to 89 minutes (109,841 commuters, 20.9%) for males and 60 to 89 minutes (106,615 commuters, 20.5%) for females.
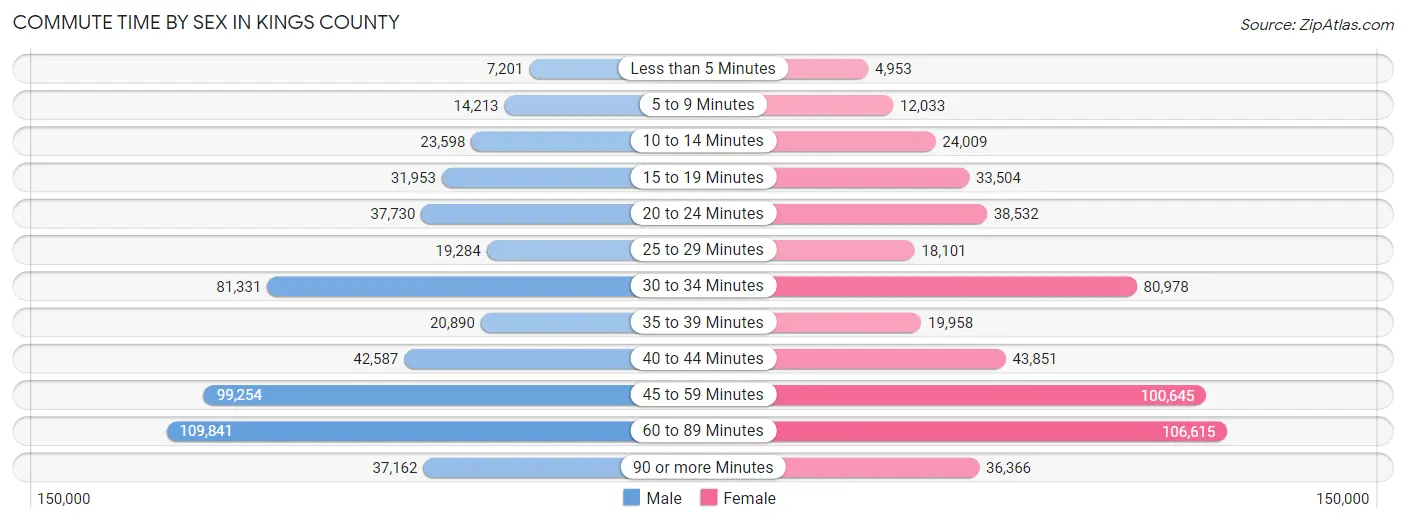
| Commute Time | Male | Female |
| Less than 5 Minutes | 7,201 (1.4%) | 4,953 (0.9%) |
| 5 to 9 Minutes | 14,213 (2.7%) | 12,033 (2.3%) |
| 10 to 14 Minutes | 23,598 (4.5%) | 24,009 (4.6%) |
| 15 to 19 Minutes | 31,953 (6.1%) | 33,504 (6.5%) |
| 20 to 24 Minutes | 37,730 (7.2%) | 38,532 (7.4%) |
| 25 to 29 Minutes | 19,284 (3.7%) | 18,101 (3.5%) |
| 30 to 34 Minutes | 81,331 (15.5%) | 80,978 (15.6%) |
| 35 to 39 Minutes | 20,890 (4.0%) | 19,958 (3.8%) |
| 40 to 44 Minutes | 42,587 (8.1%) | 43,851 (8.4%) |
| 45 to 59 Minutes | 99,254 (18.9%) | 100,645 (19.4%) |
| 60 to 89 Minutes | 109,841 (20.9%) | 106,615 (20.5%) |
| 90 or more Minutes | 37,162 (7.1%) | 36,366 (7.0%) |
Time of Departure to Work by Sex in Kings County
The most frequent times of departure to work in Kings County are 8:00 AM to 8:29 AM (84,157, 16.0%) for males and 8:00 AM to 8:29 AM (98,585, 19.0%) for females.
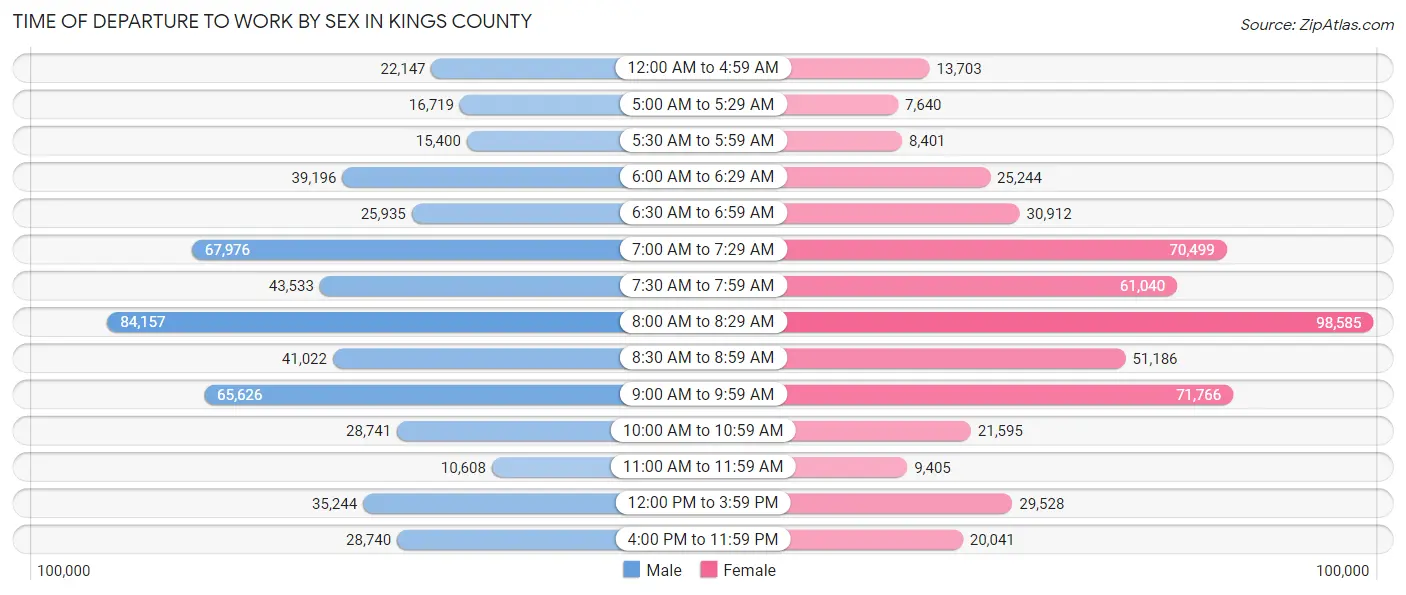
| Time of Departure | Male | Female |
| 12:00 AM to 4:59 AM | 22,147 (4.2%) | 13,703 (2.6%) |
| 5:00 AM to 5:29 AM | 16,719 (3.2%) | 7,640 (1.5%) |
| 5:30 AM to 5:59 AM | 15,400 (2.9%) | 8,401 (1.6%) |
| 6:00 AM to 6:29 AM | 39,196 (7.5%) | 25,244 (4.9%) |
| 6:30 AM to 6:59 AM | 25,935 (4.9%) | 30,912 (5.9%) |
| 7:00 AM to 7:29 AM | 67,976 (13.0%) | 70,499 (13.6%) |
| 7:30 AM to 7:59 AM | 43,533 (8.3%) | 61,040 (11.7%) |
| 8:00 AM to 8:29 AM | 84,157 (16.0%) | 98,585 (19.0%) |
| 8:30 AM to 8:59 AM | 41,022 (7.8%) | 51,186 (9.9%) |
| 9:00 AM to 9:59 AM | 65,626 (12.5%) | 71,766 (13.8%) |
| 10:00 AM to 10:59 AM | 28,741 (5.5%) | 21,595 (4.2%) |
| 11:00 AM to 11:59 AM | 10,608 (2.0%) | 9,405 (1.8%) |
| 12:00 PM to 3:59 PM | 35,244 (6.7%) | 29,528 (5.7%) |
| 4:00 PM to 11:59 PM | 28,740 (5.5%) | 20,041 (3.9%) |
| Total | 525,044 (100.0%) | 519,545 (100.0%) |
Housing Occupancy in Kings County
Occupancy by Ownership in Kings County
Of the total 997,957 dwellings in Kings County, owner-occupied units account for 302,505 (30.3%), while renter-occupied units make up 695,452 (69.7%).
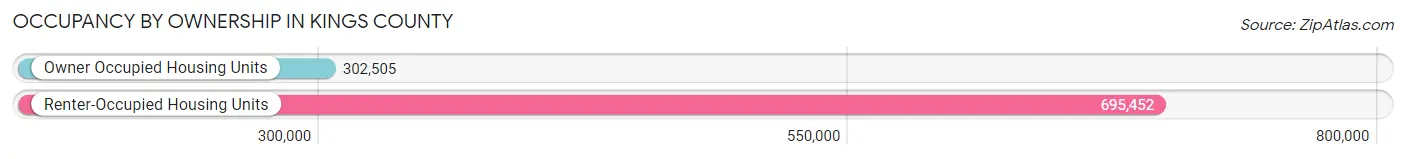
| Occupancy | # Housing Units | % Housing Units |
| Owner Occupied Housing Units | 302,505 | 30.3% |
| Renter-Occupied Housing Units | 695,452 | 69.7% |
| Total Occupied Housing Units | 997,957 | 100.0% |
Occupancy by Household Size in Kings County
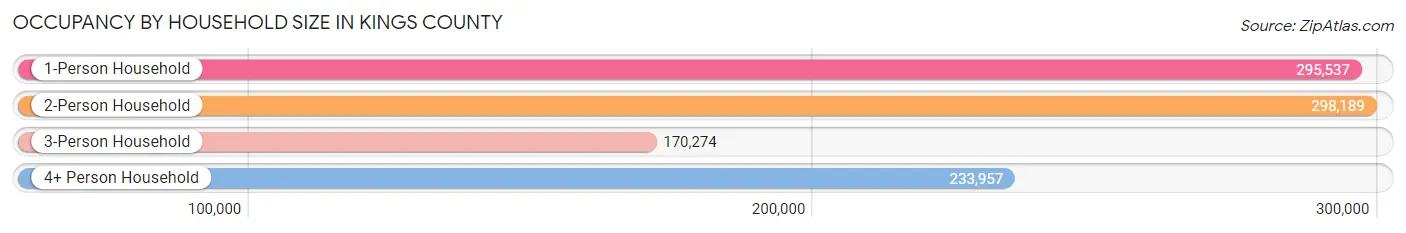
| Household Size | # Housing Units | % Housing Units |
| 1-Person Household | 295,537 | 29.6% |
| 2-Person Household | 298,189 | 29.9% |
| 3-Person Household | 170,274 | 17.1% |
| 4+ Person Household | 233,957 | 23.4% |
| Total Housing Units | 997,957 | 100.0% |
Occupancy by Ownership by Household Size in Kings County
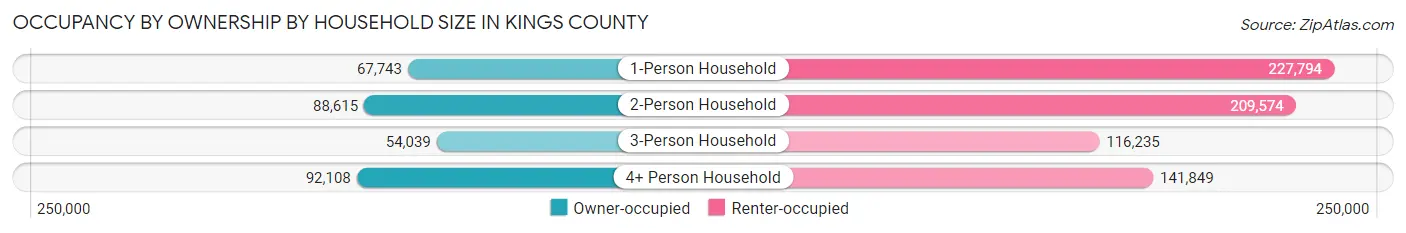
| Household Size | Owner-occupied | Renter-occupied |
| 1-Person Household | 67,743 (22.9%) | 227,794 (77.1%) |
| 2-Person Household | 88,615 (29.7%) | 209,574 (70.3%) |
| 3-Person Household | 54,039 (31.7%) | 116,235 (68.3%) |
| 4+ Person Household | 92,108 (39.4%) | 141,849 (60.6%) |
| Total Housing Units | 302,505 (30.3%) | 695,452 (69.7%) |
Occupancy by Educational Attainment in Kings County
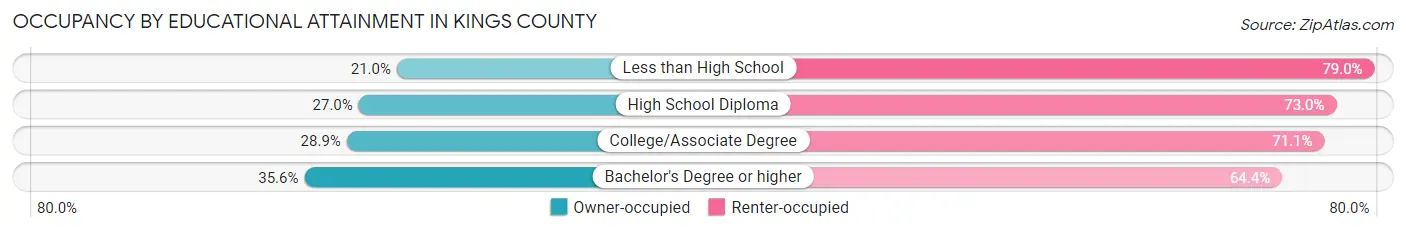
| Household Size | Owner-occupied | Renter-occupied |
| Less than High School | 29,355 (21.0%) | 110,614 (79.0%) |
| High School Diploma | 61,297 (27.0%) | 165,550 (73.0%) |
| College/Associate Degree | 56,367 (28.9%) | 138,555 (71.1%) |
| Bachelor's Degree or higher | 155,486 (35.6%) | 280,733 (64.4%) |
Occupancy by Age of Householder in Kings County
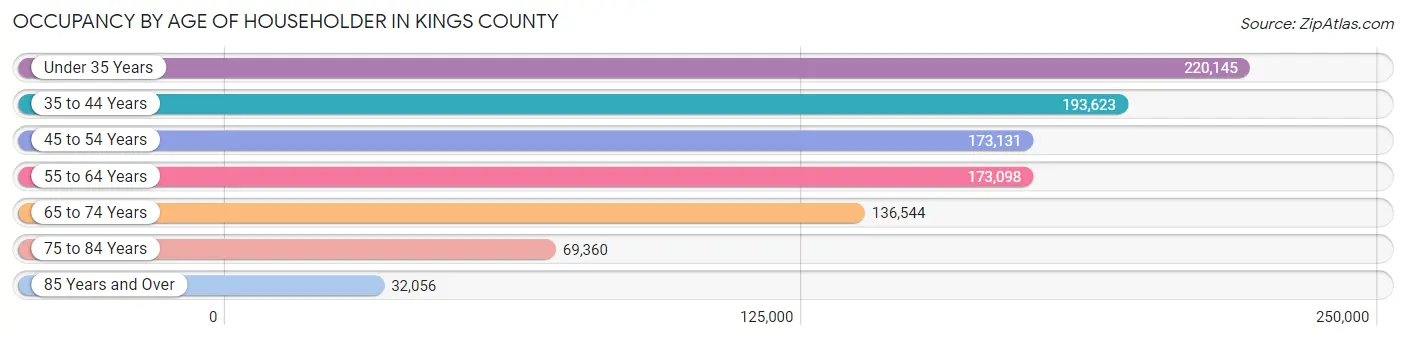
| Age Bracket | # Households | % Households |
| Under 35 Years | 220,145 | 22.1% |
| 35 to 44 Years | 193,623 | 19.4% |
| 45 to 54 Years | 173,131 | 17.3% |
| 55 to 64 Years | 173,098 | 17.3% |
| 65 to 74 Years | 136,544 | 13.7% |
| 75 to 84 Years | 69,360 | 7.0% |
| 85 Years and Over | 32,056 | 3.2% |
| Total | 997,957 | 100.0% |
Housing Finances in Kings County
Median Income by Occupancy in Kings County
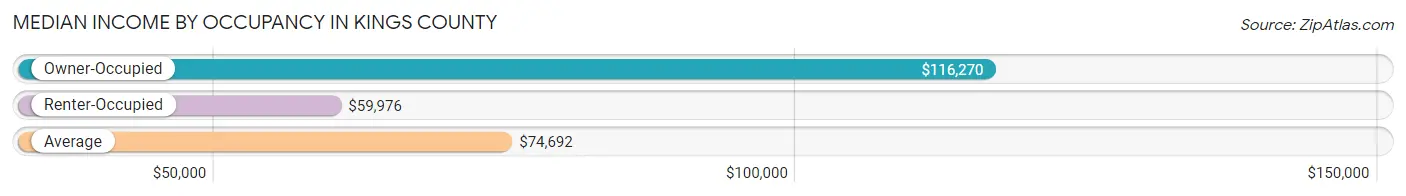
| Occupancy Type | # Households | Median Income |
| Owner-Occupied | 302,505 (30.3%) | $116,270 |
| Renter-Occupied | 695,452 (69.7%) | $59,976 |
| Average | 997,957 (100.0%) | $74,692 |
Occupancy by Householder Income Bracket in Kings County
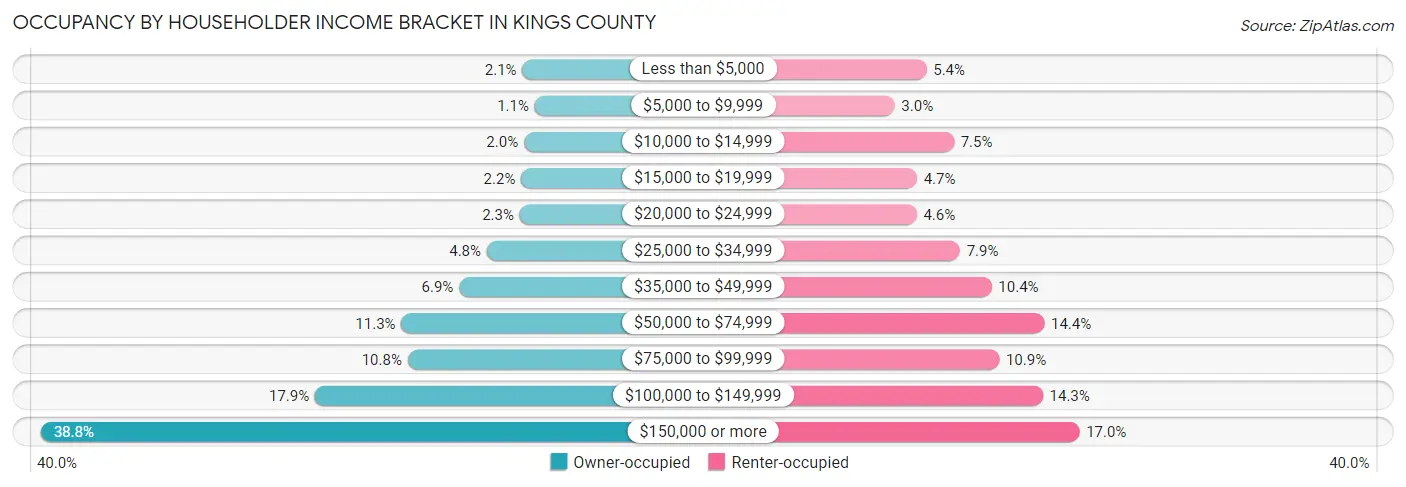
| Income Bracket | Owner-occupied | Renter-occupied |
| Less than $5,000 | 6,266 (2.1%) | 37,487 (5.4%) |
| $5,000 to $9,999 | 3,425 (1.1%) | 20,596 (3.0%) |
| $10,000 to $14,999 | 5,906 (1.9%) | 52,049 (7.5%) |
| $15,000 to $19,999 | 6,540 (2.2%) | 32,410 (4.7%) |
| $20,000 to $24,999 | 6,864 (2.3%) | 32,297 (4.6%) |
| $25,000 to $34,999 | 14,459 (4.8%) | 55,212 (7.9%) |
| $35,000 to $49,999 | 20,850 (6.9%) | 71,977 (10.3%) |
| $50,000 to $74,999 | 34,149 (11.3%) | 99,868 (14.4%) |
| $75,000 to $99,999 | 32,713 (10.8%) | 75,985 (10.9%) |
| $100,000 to $149,999 | 54,048 (17.9%) | 99,073 (14.2%) |
| $150,000 or more | 117,285 (38.8%) | 118,498 (17.0%) |
| Total | 302,505 (100.0%) | 695,452 (100.0%) |
Monthly Housing Cost Tiers in Kings County
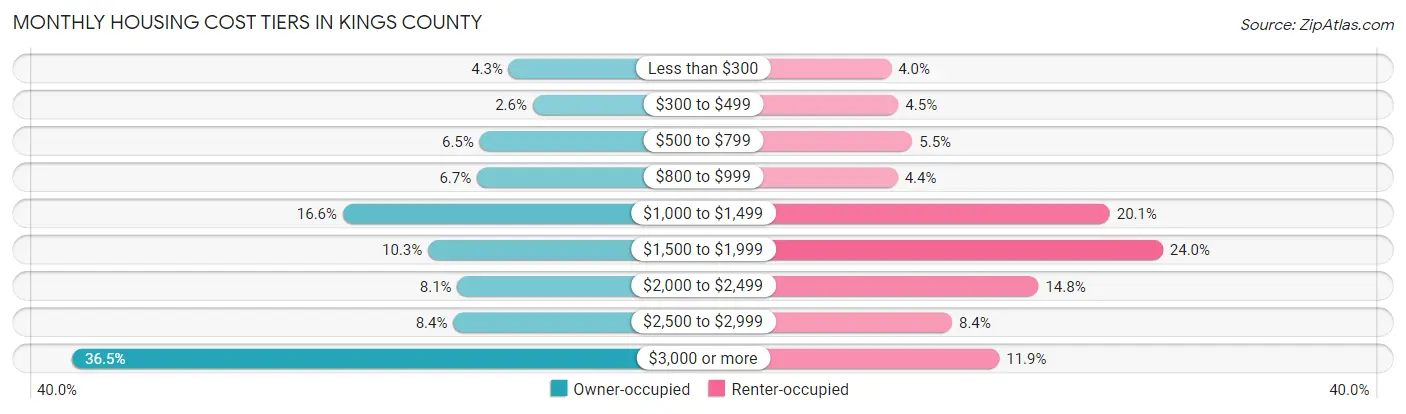
| Monthly Cost | Owner-occupied | Renter-occupied |
| Less than $300 | 13,133 (4.3%) | 27,570 (4.0%) |
| $300 to $499 | 7,789 (2.6%) | 31,246 (4.5%) |
| $500 to $799 | 19,632 (6.5%) | 38,356 (5.5%) |
| $800 to $999 | 20,220 (6.7%) | 30,906 (4.4%) |
| $1,000 to $1,499 | 50,109 (16.6%) | 139,489 (20.1%) |
| $1,500 to $1,999 | 31,121 (10.3%) | 166,691 (24.0%) |
| $2,000 to $2,499 | 24,573 (8.1%) | 102,974 (14.8%) |
| $2,500 to $2,999 | 25,513 (8.4%) | 58,698 (8.4%) |
| $3,000 or more | 110,415 (36.5%) | 82,875 (11.9%) |
| Total | 302,505 (100.0%) | 695,452 (100.0%) |
Physical Housing Characteristics in Kings County
Housing Structures in Kings County
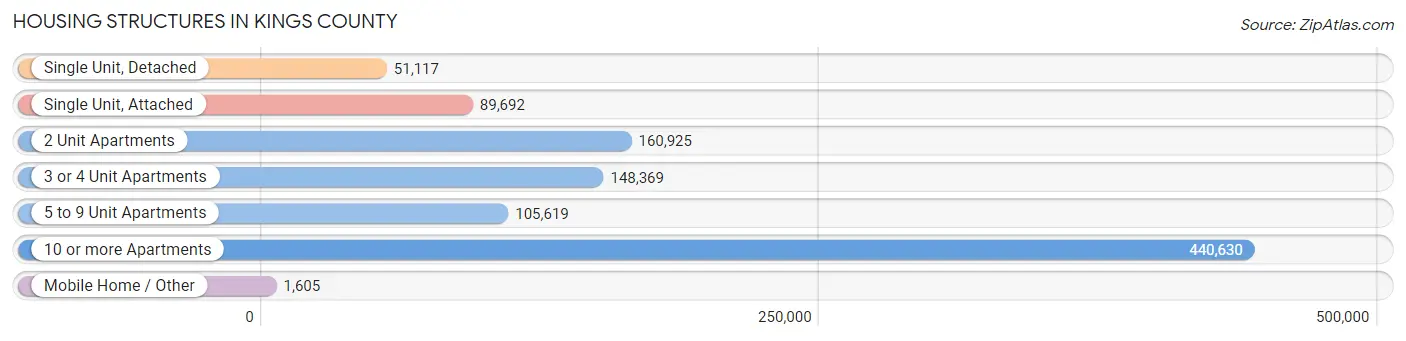
| Structure Type | # Housing Units | % Housing Units |
| Single Unit, Detached | 51,117 | 5.1% |
| Single Unit, Attached | 89,692 | 9.0% |
| 2 Unit Apartments | 160,925 | 16.1% |
| 3 or 4 Unit Apartments | 148,369 | 14.9% |
| 5 to 9 Unit Apartments | 105,619 | 10.6% |
| 10 or more Apartments | 440,630 | 44.2% |
| Mobile Home / Other | 1,605 | 0.2% |
| Total | 997,957 | 100.0% |
Housing Structures by Occupancy in Kings County
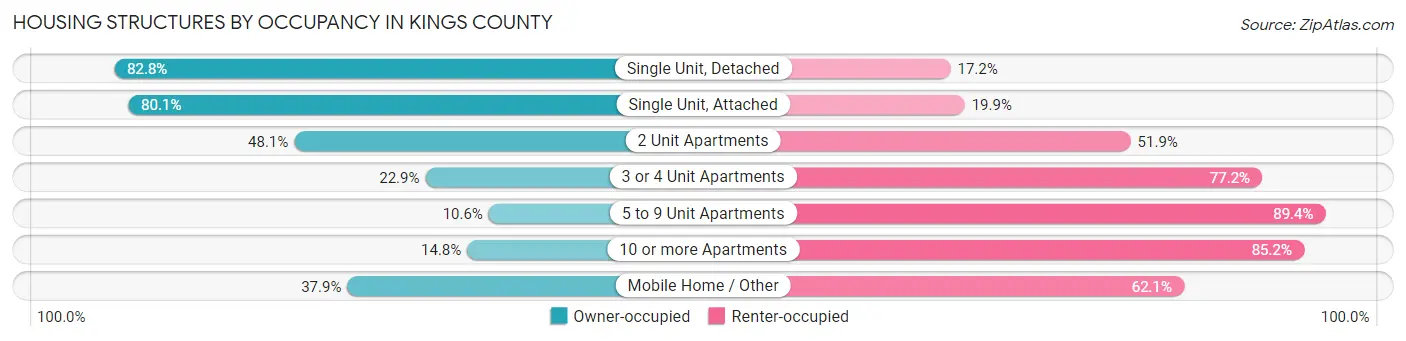
| Structure Type | Owner-occupied | Renter-occupied |
| Single Unit, Detached | 42,321 (82.8%) | 8,796 (17.2%) |
| Single Unit, Attached | 71,808 (80.1%) | 17,884 (19.9%) |
| 2 Unit Apartments | 77,417 (48.1%) | 83,508 (51.9%) |
| 3 or 4 Unit Apartments | 33,902 (22.9%) | 114,467 (77.1%) |
| 5 to 9 Unit Apartments | 11,239 (10.6%) | 94,380 (89.4%) |
| 10 or more Apartments | 65,210 (14.8%) | 375,420 (85.2%) |
| Mobile Home / Other | 608 (37.9%) | 997 (62.1%) |
| Total | 302,505 (30.3%) | 695,452 (69.7%) |
Housing Structures by Number of Rooms in Kings County
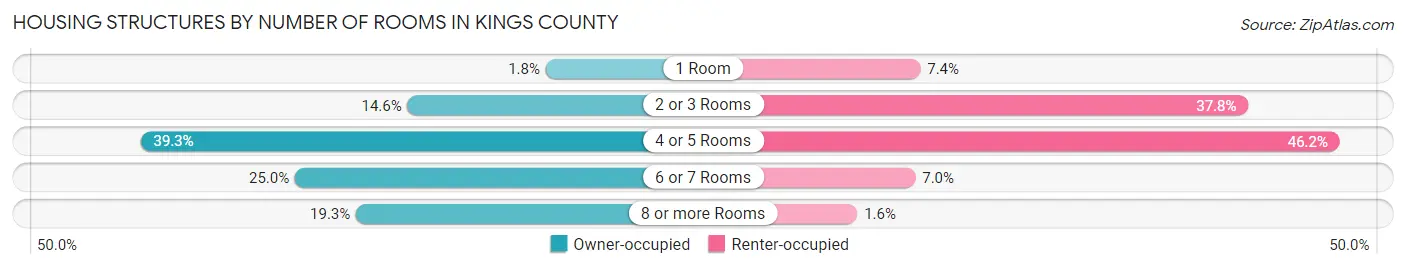
| Number of Rooms | Owner-occupied | Renter-occupied |
| 1 Room | 5,434 (1.8%) | 51,681 (7.4%) |
| 2 or 3 Rooms | 44,115 (14.6%) | 262,650 (37.8%) |
| 4 or 5 Rooms | 118,866 (39.3%) | 321,527 (46.2%) |
| 6 or 7 Rooms | 75,591 (25.0%) | 48,444 (7.0%) |
| 8 or more Rooms | 58,499 (19.3%) | 11,150 (1.6%) |
| Total | 302,505 (100.0%) | 695,452 (100.0%) |
Housing Structure by Heating Type in Kings County
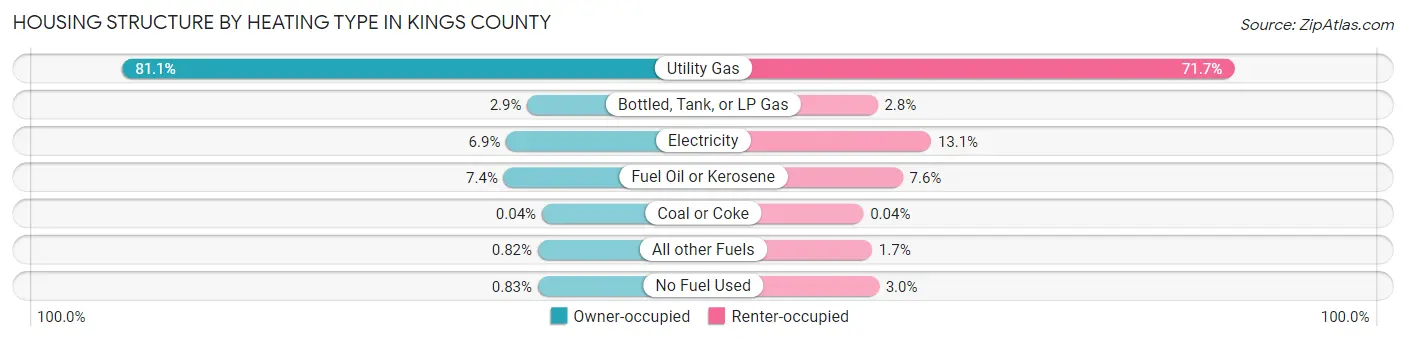
| Heating Type | Owner-occupied | Renter-occupied |
| Utility Gas | 245,371 (81.1%) | 498,535 (71.7%) |
| Bottled, Tank, or LP Gas | 8,665 (2.9%) | 19,387 (2.8%) |
| Electricity | 20,969 (6.9%) | 91,266 (13.1%) |
| Fuel Oil or Kerosene | 22,404 (7.4%) | 53,117 (7.6%) |
| Coal or Coke | 131 (0.0%) | 274 (0.0%) |
| All other Fuels | 2,467 (0.8%) | 11,896 (1.7%) |
| No Fuel Used | 2,498 (0.8%) | 20,977 (3.0%) |
| Total | 302,505 (100.0%) | 695,452 (100.0%) |
Household Vehicle Usage in Kings County
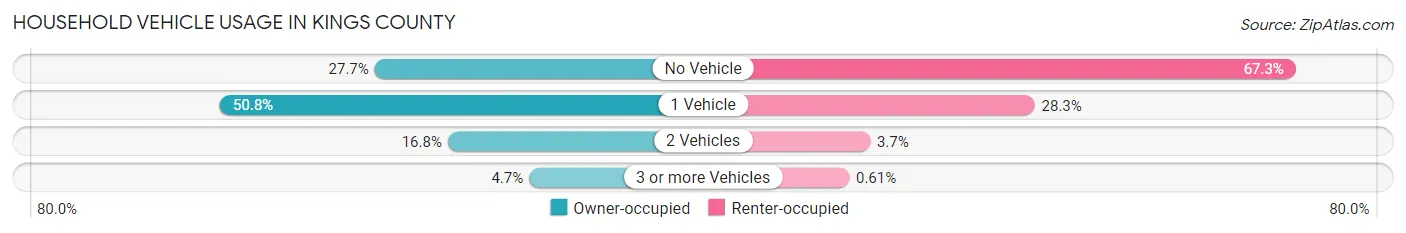
| Vehicles per Household | Owner-occupied | Renter-occupied |
| No Vehicle | 83,868 (27.7%) | 468,191 (67.3%) |
| 1 Vehicle | 153,743 (50.8%) | 196,987 (28.3%) |
| 2 Vehicles | 50,814 (16.8%) | 26,011 (3.7%) |
| 3 or more Vehicles | 14,080 (4.6%) | 4,263 (0.6%) |
| Total | 302,505 (100.0%) | 695,452 (100.0%) |
Real Estate & Mortgages in Kings County
Real Estate and Mortgage Overview in Kings County
| Characteristic | Without Mortgage | With Mortgage |
| Housing Units | 121,523 | 180,982 |
| Median Property Value | $826,400 | $889,000 |
| Median Household Income | $87,250 | $84,190 |
| Monthly Housing Costs | $1,057 | $108,465 |
| Real Estate Taxes | $6,212 | $15,899 |
Property Value by Mortgage Status in Kings County
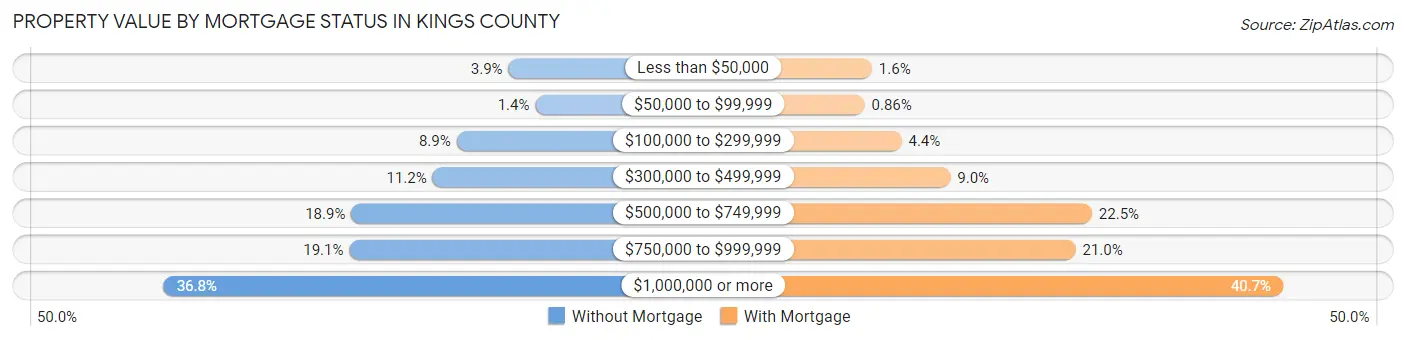
| Property Value | Without Mortgage | With Mortgage |
| Less than $50,000 | 4,766 (3.9%) | 2,829 (1.6%) |
| $50,000 to $99,999 | 1,647 (1.4%) | 1,558 (0.9%) |
| $100,000 to $299,999 | 10,761 (8.9%) | 7,932 (4.4%) |
| $300,000 to $499,999 | 13,547 (11.2%) | 16,350 (9.0%) |
| $500,000 to $749,999 | 22,954 (18.9%) | 40,738 (22.5%) |
| $750,000 to $999,999 | 23,185 (19.1%) | 37,915 (20.9%) |
| $1,000,000 or more | 44,663 (36.7%) | 73,660 (40.7%) |
| Total | 121,523 (100.0%) | 180,982 (100.0%) |
Household Income by Mortgage Status in Kings County
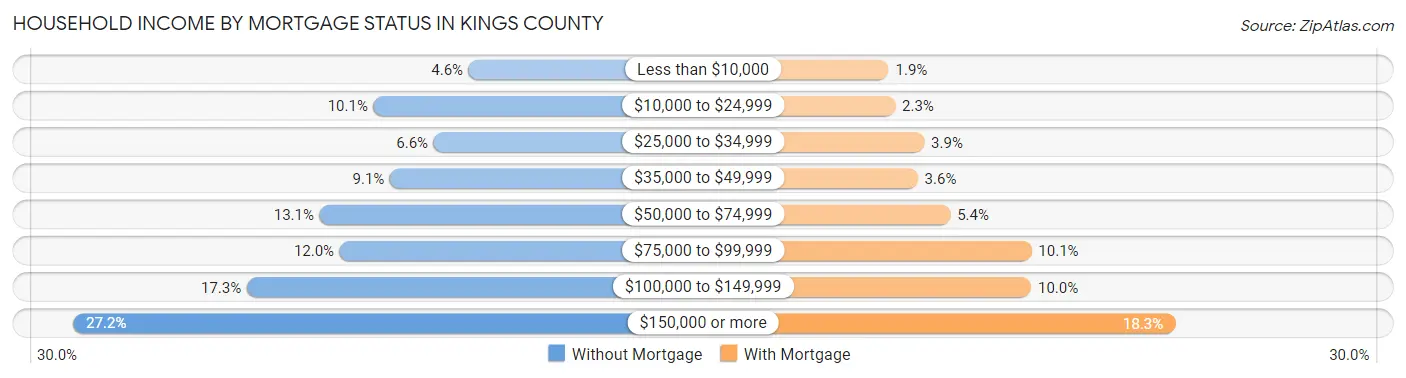
| Household Income | Without Mortgage | With Mortgage |
| Less than $10,000 | 5,601 (4.6%) | 3,415 (1.9%) |
| $10,000 to $24,999 | 12,207 (10.1%) | 4,090 (2.3%) |
| $25,000 to $34,999 | 8,033 (6.6%) | 7,103 (3.9%) |
| $35,000 to $49,999 | 11,067 (9.1%) | 6,426 (3.5%) |
| $50,000 to $74,999 | 15,955 (13.1%) | 9,783 (5.4%) |
| $75,000 to $99,999 | 14,557 (12.0%) | 18,194 (10.1%) |
| $100,000 to $149,999 | 21,008 (17.3%) | 18,156 (10.0%) |
| $150,000 or more | 33,095 (27.2%) | 33,040 (18.3%) |
| Total | 121,523 (100.0%) | 180,982 (100.0%) |
Property Value to Household Income Ratio in Kings County
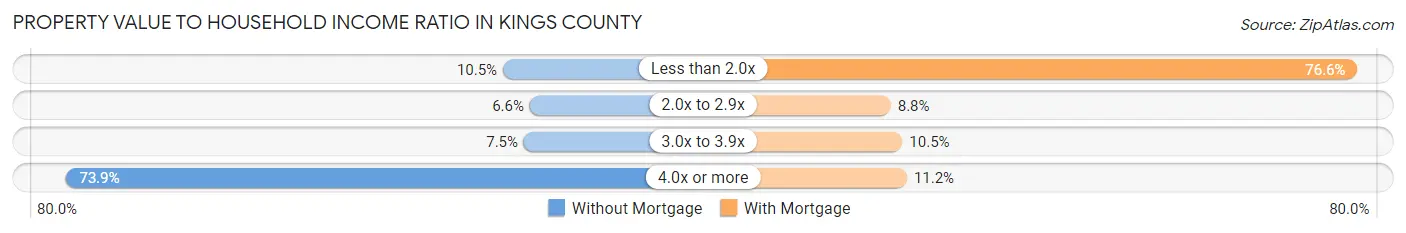
| Value-to-Income Ratio | Without Mortgage | With Mortgage |
| Less than 2.0x | 12,761 (10.5%) | 138,695 (76.6%) |
| 2.0x to 2.9x | 8,021 (6.6%) | 16,006 (8.8%) |
| 3.0x to 3.9x | 9,063 (7.5%) | 19,049 (10.5%) |
| 4.0x or more | 89,857 (73.9%) | 20,254 (11.2%) |
| Total | 121,523 (100.0%) | 180,982 (100.0%) |
Real Estate Taxes by Mortgage Status in Kings County
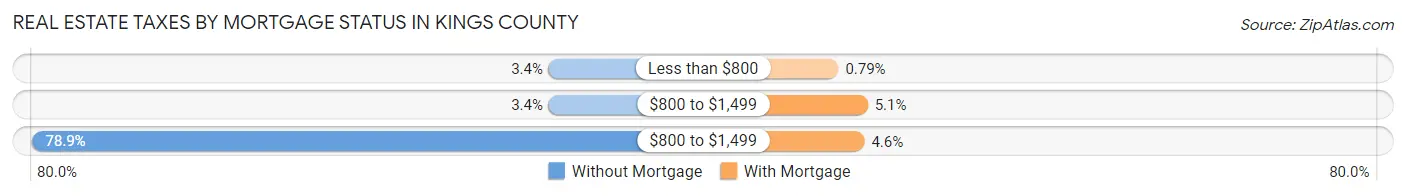
| Property Taxes | Without Mortgage | With Mortgage |
| Less than $800 | 4,131 (3.4%) | 1,423 (0.8%) |
| $800 to $1,499 | 4,150 (3.4%) | 9,153 (5.1%) |
| $800 to $1,499 | 95,821 (78.8%) | 8,316 (4.6%) |
| Total | 121,523 (100.0%) | 180,982 (100.0%) |
Health & Disability in Kings County
Health Insurance Coverage by Age in Kings County
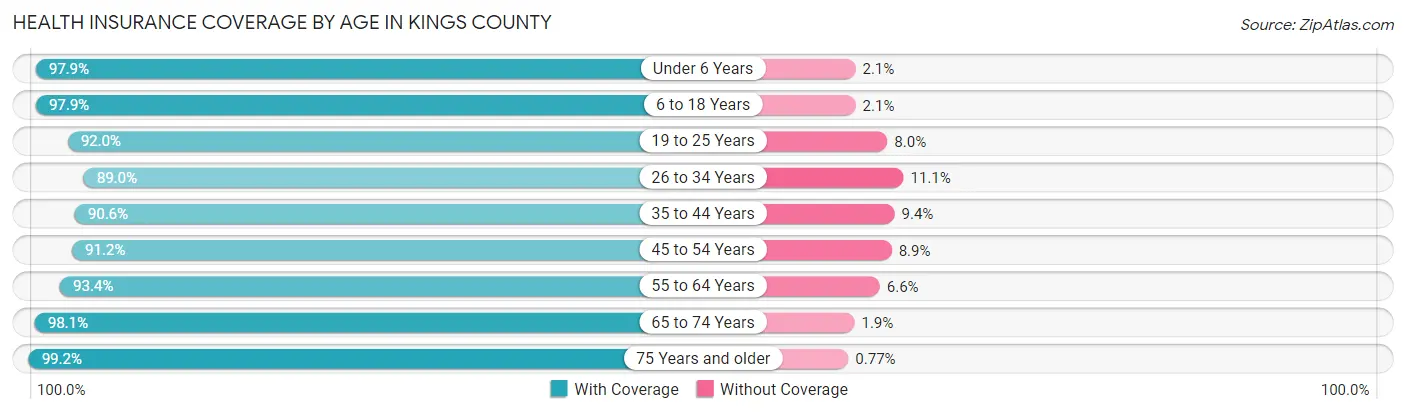
| Age Bracket | With Coverage | Without Coverage |
| Under 6 Years | 211,735 (97.9%) | 4,536 (2.1%) |
| 6 to 18 Years | 406,994 (97.9%) | 8,818 (2.1%) |
| 19 to 25 Years | 211,919 (92.0%) | 18,537 (8.0%) |
| 26 to 34 Years | 383,991 (88.9%) | 47,678 (11.1%) |
| 35 to 44 Years | 344,520 (90.6%) | 35,659 (9.4%) |
| 45 to 54 Years | 284,635 (91.1%) | 27,629 (8.8%) |
| 55 to 64 Years | 279,068 (93.4%) | 19,816 (6.6%) |
| 65 to 74 Years | 218,506 (98.1%) | 4,249 (1.9%) |
| 75 Years and older | 156,405 (99.2%) | 1,217 (0.8%) |
| Total | 2,497,773 (93.7%) | 168,139 (6.3%) |
Health Insurance Coverage by Citizenship Status in Kings County
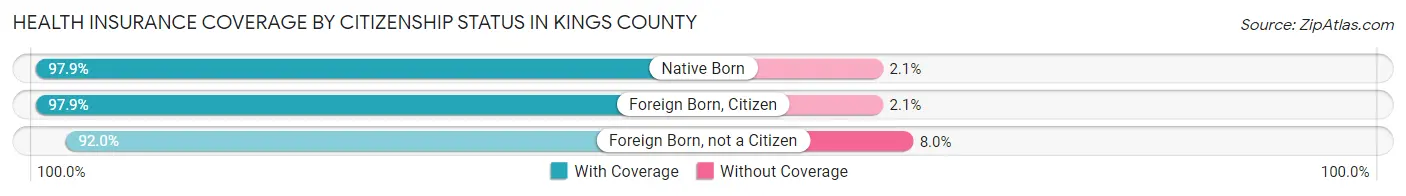
| Citizenship Status | With Coverage | Without Coverage |
| Native Born | 211,735 (97.9%) | 4,536 (2.1%) |
| Foreign Born, Citizen | 406,994 (97.9%) | 8,818 (2.1%) |
| Foreign Born, not a Citizen | 211,919 (92.0%) | 18,537 (8.0%) |
Health Insurance Coverage by Household Income in Kings County
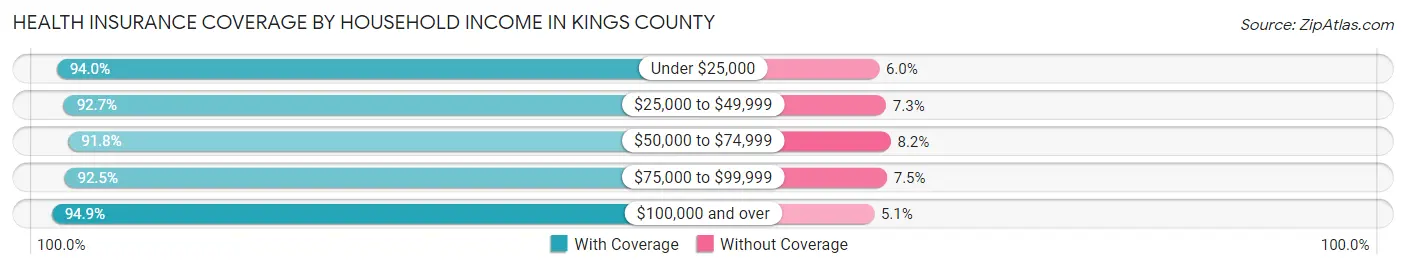
| Household Income | With Coverage | Without Coverage |
| Under $25,000 | 372,258 (94.0%) | 23,902 (6.0%) |
| $25,000 to $49,999 | 376,291 (92.7%) | 29,743 (7.3%) |
| $50,000 to $74,999 | 321,813 (91.8%) | 28,704 (8.2%) |
| $75,000 to $99,999 | 266,064 (92.5%) | 21,528 (7.5%) |
| $100,000 and over | 1,129,958 (94.9%) | 60,579 (5.1%) |
Public vs Private Health Insurance Coverage by Age in Kings County
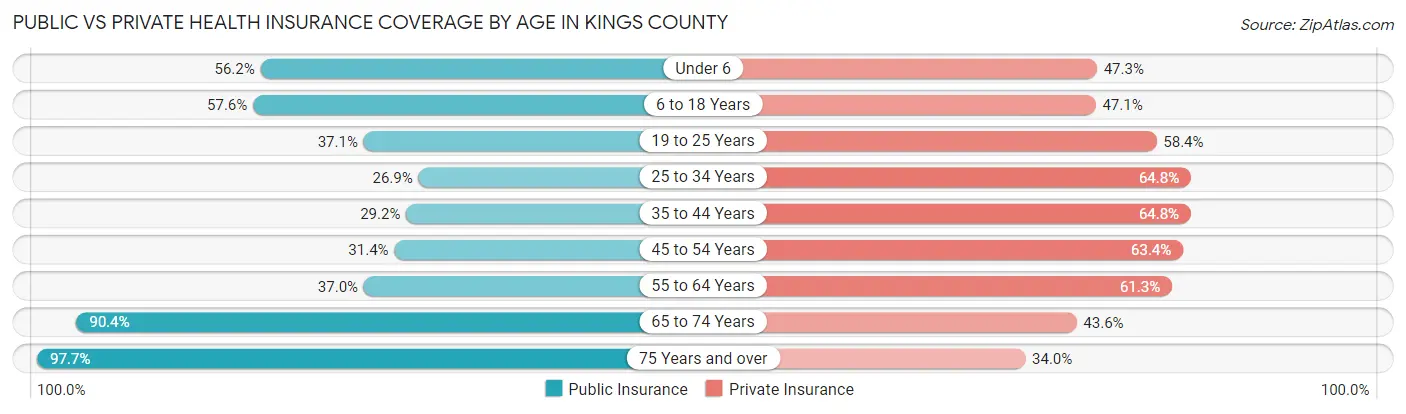
| Age Bracket | Public Insurance | Private Insurance |
| Under 6 | 121,572 (56.2%) | 102,330 (47.3%) |
| 6 to 18 Years | 239,464 (57.6%) | 195,821 (47.1%) |
| 19 to 25 Years | 85,389 (37.0%) | 134,568 (58.4%) |
| 25 to 34 Years | 116,016 (26.9%) | 279,761 (64.8%) |
| 35 to 44 Years | 110,846 (29.2%) | 246,341 (64.8%) |
| 45 to 54 Years | 97,922 (31.4%) | 197,823 (63.3%) |
| 55 to 64 Years | 110,661 (37.0%) | 183,207 (61.3%) |
| 65 to 74 Years | 201,352 (90.4%) | 97,003 (43.5%) |
| 75 Years and over | 153,974 (97.7%) | 53,629 (34.0%) |
| Total | 1,237,196 (46.4%) | 1,490,483 (55.9%) |
Disability Status by Sex by Age in Kings County
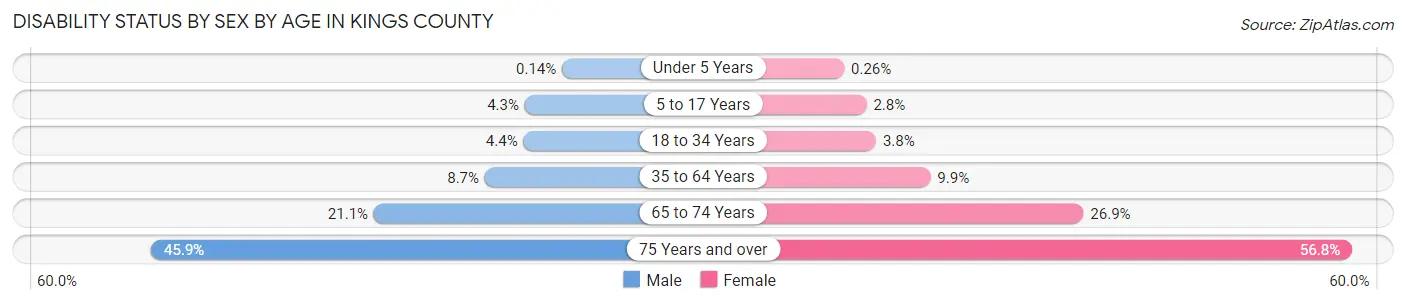
| Age Bracket | Male | Female |
| Under 5 Years | 132 (0.1%) | 235 (0.3%) |
| 5 to 17 Years | 9,244 (4.3%) | 5,657 (2.8%) |
| 18 to 34 Years | 14,905 (4.4%) | 13,525 (3.8%) |
| 35 to 64 Years | 41,096 (8.7%) | 51,446 (9.9%) |
| 65 to 74 Years | 20,644 (21.1%) | 33,622 (26.9%) |
| 75 Years and over | 26,905 (45.9%) | 56,270 (56.8%) |
Disability Class by Sex by Age in Kings County
Disability Class: Hearing Difficulty
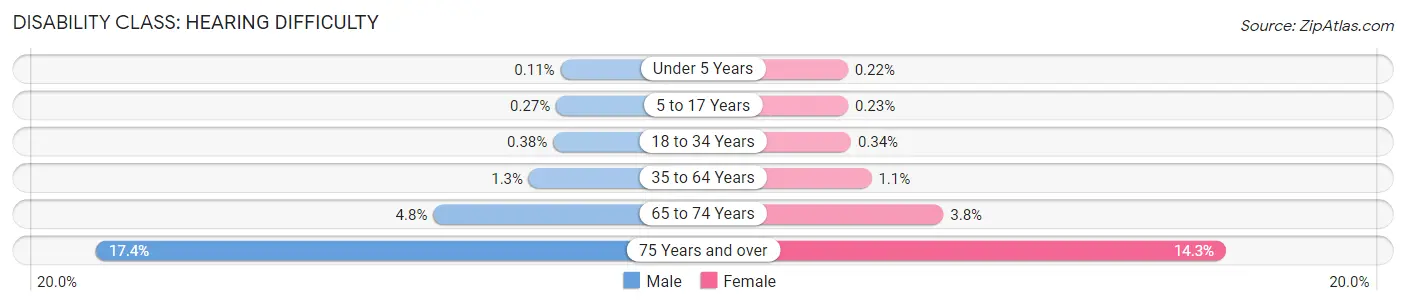
| Age Bracket | Male | Female |
| Under 5 Years | 101 (0.1%) | 201 (0.2%) |
| 5 to 17 Years | 584 (0.3%) | 473 (0.2%) |
| 18 to 34 Years | 1,284 (0.4%) | 1,198 (0.3%) |
| 35 to 64 Years | 6,021 (1.3%) | 5,748 (1.1%) |
| 65 to 74 Years | 4,722 (4.8%) | 4,712 (3.8%) |
| 75 Years and over | 10,162 (17.3%) | 14,126 (14.3%) |
Disability Class: Vision Difficulty
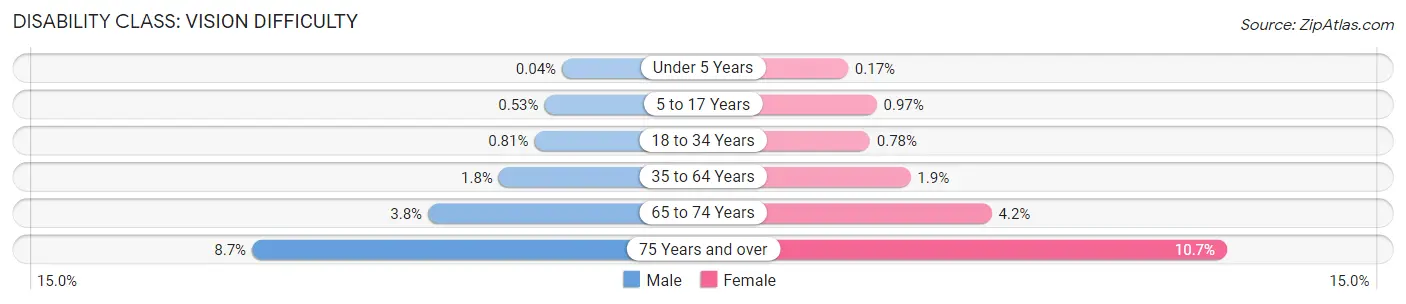
| Age Bracket | Male | Female |
| Under 5 Years | 37 (0.0%) | 150 (0.2%) |
| 5 to 17 Years | 1,136 (0.5%) | 1,994 (1.0%) |
| 18 to 34 Years | 2,709 (0.8%) | 2,750 (0.8%) |
| 35 to 64 Years | 8,486 (1.8%) | 9,953 (1.9%) |
| 65 to 74 Years | 3,686 (3.8%) | 5,216 (4.2%) |
| 75 Years and over | 5,080 (8.7%) | 10,621 (10.7%) |
Disability Class: Cognitive Difficulty
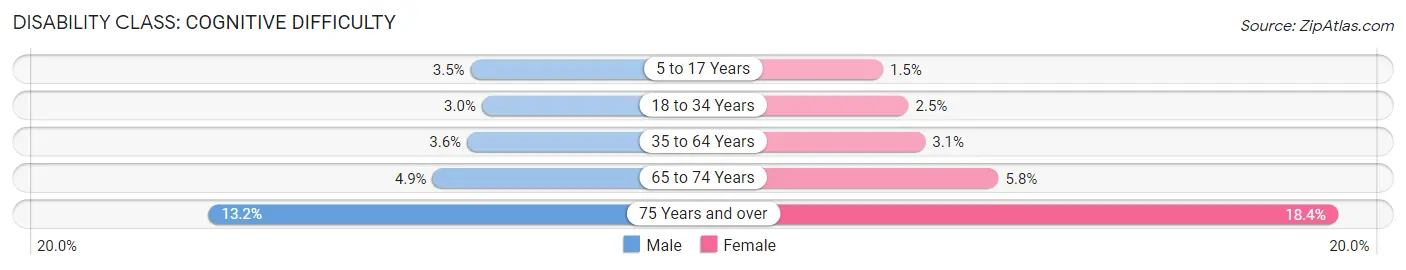
| Age Bracket | Male | Female |
| 5 to 17 Years | 7,438 (3.5%) | 3,134 (1.5%) |
| 18 to 34 Years | 10,157 (3.0%) | 8,785 (2.5%) |
| 35 to 64 Years | 16,843 (3.6%) | 16,167 (3.1%) |
| 65 to 74 Years | 4,754 (4.9%) | 7,275 (5.8%) |
| 75 Years and over | 7,717 (13.2%) | 18,226 (18.4%) |
Disability Class: Ambulatory Difficulty
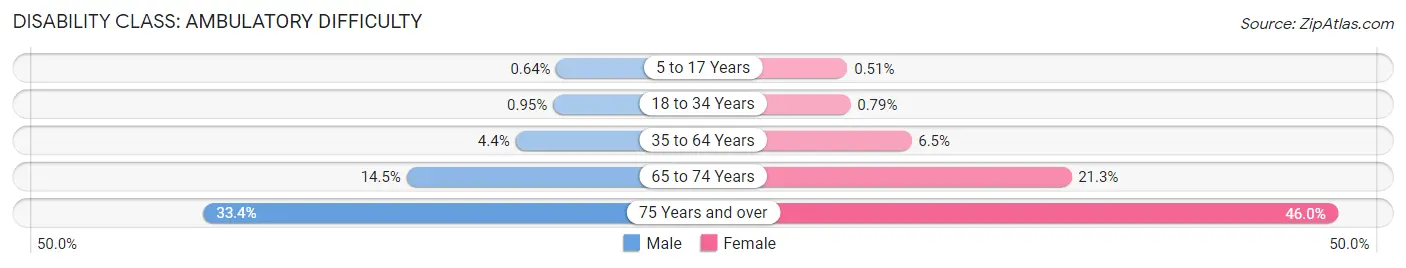
| Age Bracket | Male | Female |
| 5 to 17 Years | 1,378 (0.6%) | 1,043 (0.5%) |
| 18 to 34 Years | 3,192 (0.9%) | 2,798 (0.8%) |
| 35 to 64 Years | 20,895 (4.4%) | 33,612 (6.5%) |
| 65 to 74 Years | 14,223 (14.5%) | 26,600 (21.3%) |
| 75 Years and over | 19,572 (33.4%) | 45,554 (46.0%) |
Disability Class: Self-Care Difficulty
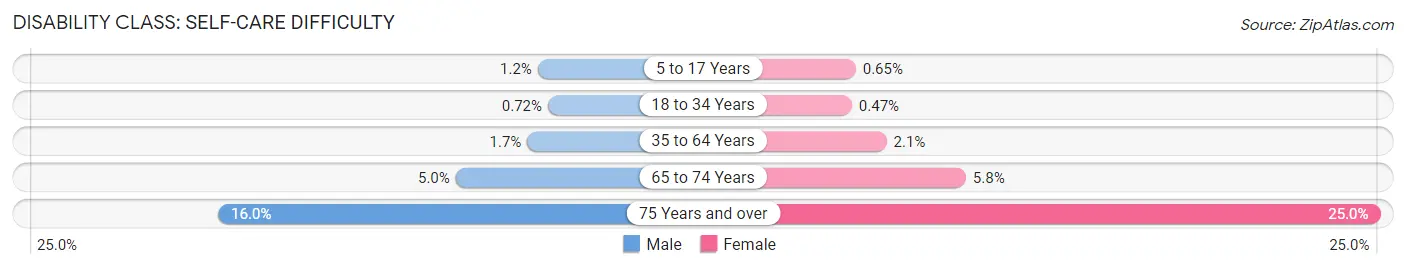
| Age Bracket | Male | Female |
| 5 to 17 Years | 2,569 (1.2%) | 1,330 (0.6%) |
| 18 to 34 Years | 2,428 (0.7%) | 1,674 (0.5%) |
| 35 to 64 Years | 7,922 (1.7%) | 10,817 (2.1%) |
| 65 to 74 Years | 4,888 (5.0%) | 7,197 (5.8%) |
| 75 Years and over | 9,384 (16.0%) | 24,750 (25.0%) |
Technology Access in Kings County
Computing Device Access in Kings County
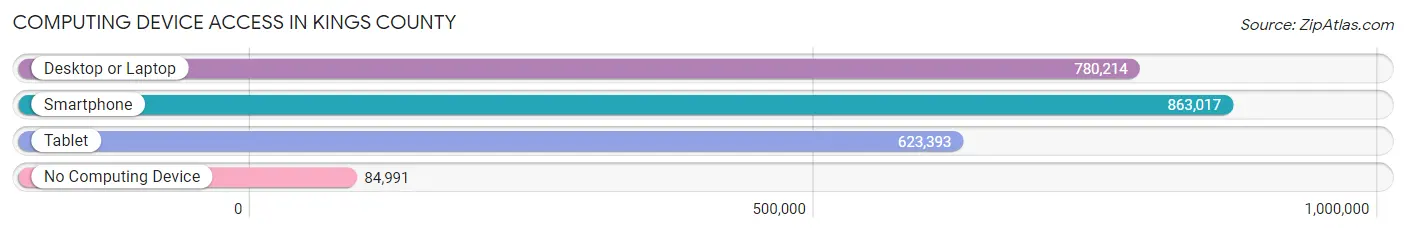
| Device Type | # Households | % Households |
| Desktop or Laptop | 780,214 | 78.2% |
| Smartphone | 863,017 | 86.5% |
| Tablet | 623,393 | 62.5% |
| No Computing Device | 84,991 | 8.5% |
| Total | 997,957 | 100.0% |
Internet Access in Kings County
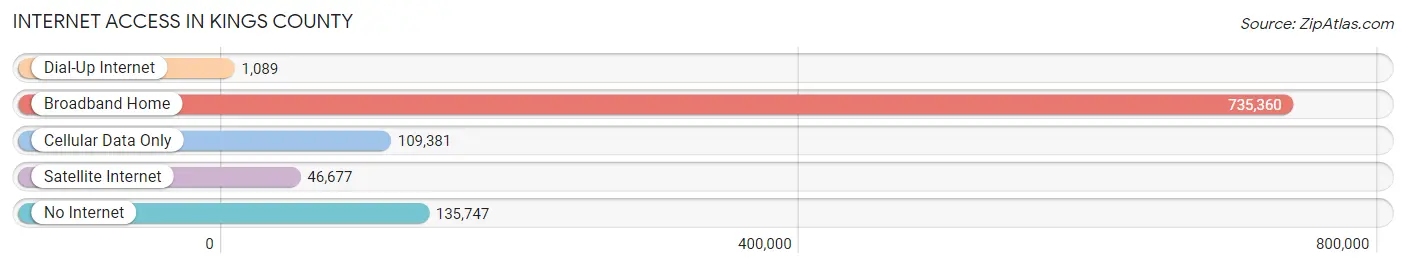
| Internet Type | # Households | % Households |
| Dial-Up Internet | 1,089 | 0.1% |
| Broadband Home | 735,360 | 73.7% |
| Cellular Data Only | 109,381 | 11.0% |
| Satellite Internet | 46,677 | 4.7% |
| No Internet | 135,747 | 13.6% |
| Total | 997,957 | 100.0% |
Kings County Summary
Kings County, NY is located in the southeastern corner of New York State and is part of the New York City metropolitan area. It is the most populous county in the state, with an estimated population of 2.6 million people in 2019. Kings County is home to the boroughs of Brooklyn and Staten Island, as well as the cities of New York and Long Island City.
Geography
Kings County is located in the southeastern corner of New York State, and is bordered by the Atlantic Ocean to the south, the Hudson River to the west, and the East River to the east. The county is divided into four distinct geographic regions: the Brooklyn-Queens border, the Brooklyn-Staten Island border, the Brooklyn-Long Island border, and the Brooklyn-Manhattan border. The county covers an area of approximately 71 square miles, and is the second-smallest county in the state.
The terrain of Kings County is mostly flat, with some rolling hills in the northern and western parts of the county. The highest point in the county is the summit of Prospect Park, which stands at an elevation of 266 feet. The county is home to numerous parks and green spaces, including Prospect Park, Brooklyn Bridge Park, and the Brooklyn Botanic Garden.
History
Kings County was established in 1683, when it was part of the Province of New York. The county was named after King Charles II of England, who had granted the land to his brother, the Duke of York. The county was originally part of Queens County, but was separated in 1683.
In the late 18th century, Kings County became a major center of commerce and industry, with the development of the Brooklyn Navy Yard and the opening of the Brooklyn Bridge in 1883. The county was also home to a large number of immigrants, particularly from Ireland and Italy.
In 1898, Kings County was consolidated with the City of Brooklyn, and in 1898, it became part of the five boroughs of New York City. The county has since become a major center of culture and commerce, and is home to numerous iconic landmarks, including the Brooklyn Bridge, the Brooklyn Museum, and the Coney Island amusement park.
Economy
The economy of Kings County is largely driven by the service sector, which accounts for approximately 80% of the county’s total employment. The largest employers in the county are the New York City government, the New York City Health and Hospitals Corporation, and the New York City Department of Education.
The county is also home to a number of major corporations, including JPMorgan Chase, Goldman Sachs, and Barclays. The Brooklyn Navy Yard is also a major employer in the county, and is home to a number of manufacturing and technology companies.
Demographics
As of 2019, the population of Kings County was estimated to be 2.6 million people. The population is racially and ethnically diverse, with the largest racial/ethnic groups being White (44.3%), Black or African American (25.3%), Hispanic or Latino (19.2%), and Asian (10.2%).
The median household income in the county is $60,879, and the median home value is $717,400. The poverty rate in the county is 14.2%, and the unemployment rate is 4.2%.
Conclusion
Kings County, NY is a vibrant and diverse county located in the southeastern corner of New York State. It is home to the boroughs of Brooklyn and Staten Island, as well as the cities of New York and Long Island City. The county is home to numerous iconic landmarks, and is a major center of culture and commerce. The economy of the county is largely driven by the service sector, and the population is racially and ethnically diverse.
Common Questions
What is Per Capita Income in Kings County?
Per Capita income in Kings County is $43,165.
What is the Median Family Income in Kings County?
Median Family Income in Kings County is $84,136.
What is the Median Household income in Kings County?
Median Household Income in Kings County is $74,692.
What is Income or Wage Gap in Kings County?
Income or Wage Gap in Kings County is 14.4%.
Women in Kings County earn 85.6 cents for every dollar earned by a man.
What is Family Income Deficit in Kings County?
Family Income Deficit in Kings County is $11,083.
Families that are below poverty line in Kings County earn $11,083 less on average than the poverty threshold level.
What is Inequality or Gini Index in Kings County?
Inequality or Gini Index in Kings County is 0.53.
What is the Total Population of Kings County?
Total Population of Kings County is 2,679,620.
What is the Total Male Population of Kings County?
Total Male Population of Kings County is 1,279,425.
What is the Total Female Population of Kings County?
Total Female Population of Kings County is 1,400,195.
What is the Ratio of Males per 100 Females in Kings County?
There are 91.37 Males per 100 Females in Kings County.
What is the Ratio of Females per 100 Males in Kings County?
There are 109.44 Females per 100 Males in Kings County.
What is the Median Population Age in Kings County?
Median Population Age in Kings County is 35.9 Years.
What is the Average Family Size in Kings County
Average Family Size in Kings County is 3.4 People.
What is the Average Household Size in Kings County
Average Household Size in Kings County is 2.6 People.
How Large is the Labor Force in Kings County?
There are 1,360,215 People in the Labor Forcein in Kings County.
What is the Percentage of People in the Labor Force in Kings County?
63.7% of People are in the Labor Force in Kings County.
What is the Unemployment Rate in Kings County?
Unemployment Rate in Kings County is 7.3%.