Zip Codes with the Highest Percentage of Population Employed in Arts, Entertainment & Recreation in Maryland
RELATED REPORTS & OPTIONS
Arts, Entertainment & Recreation
Maryland
Compare Zip Codes
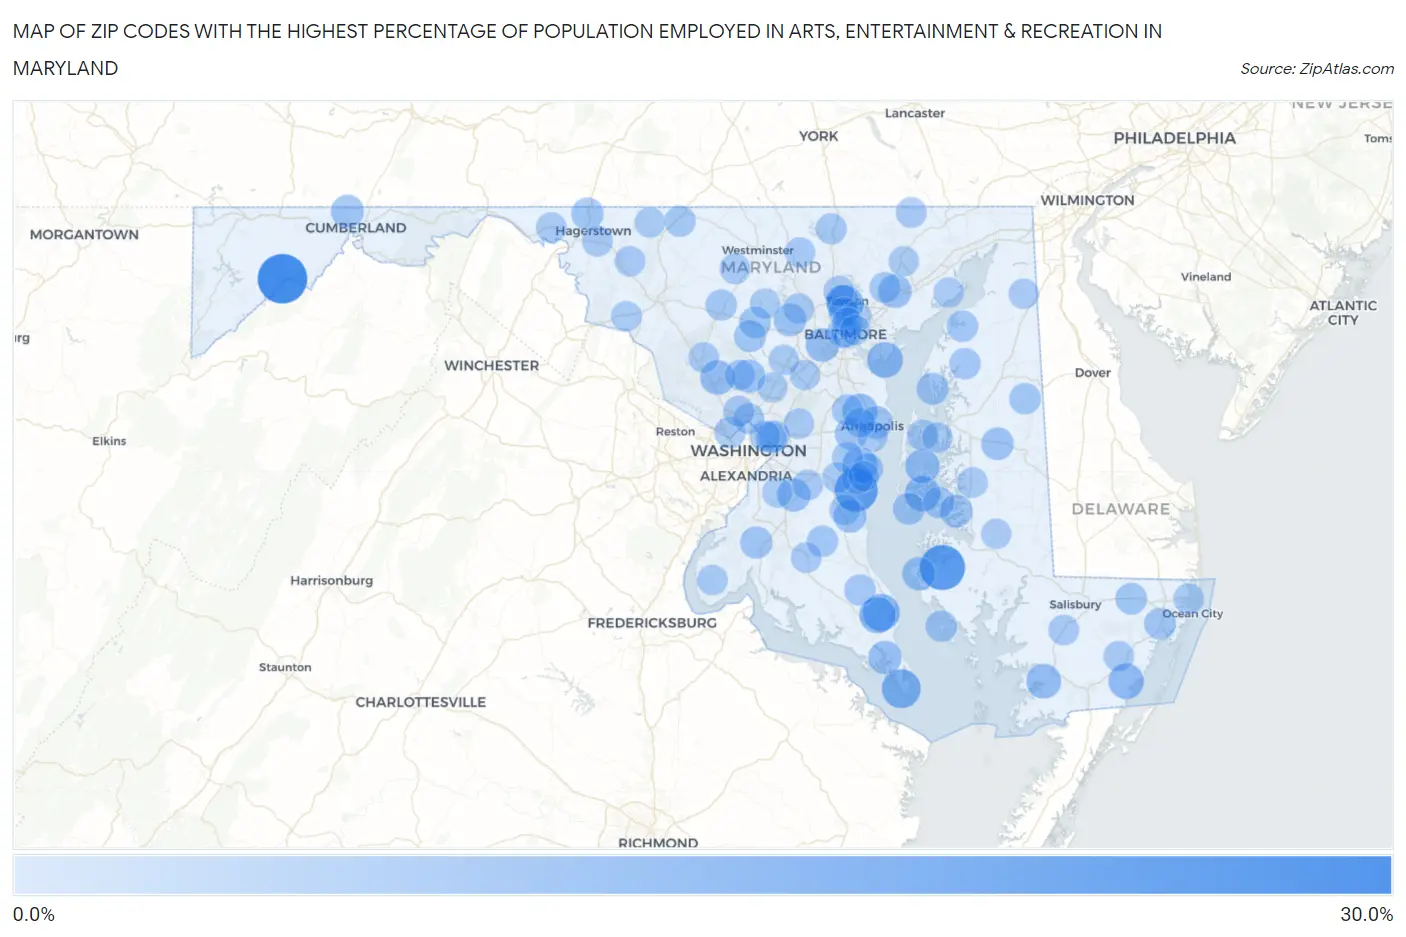
Map of Zip Codes with the Highest Percentage of Population Employed in Arts, Entertainment & Recreation in Maryland
0.0%
30.0%
Zip Codes with the Highest Percentage of Population Employed in Arts, Entertainment & Recreation in Maryland
| Zip Code | % Employed | vs State | vs National | |
| 1. | 21523 | 27.4% | 1.9%(+25.5)#1 | 2.1%(+25.3)#98 |
| 2. | 21677 | 21.6% | 1.9%(+19.7)#2 | 2.1%(+19.5)#156 |
| 3. | 20779 | 18.9% | 1.9%(+16.9)#3 | 2.1%(+16.8)#211 |
| 4. | 20687 | 13.7% | 1.9%(+11.8)#4 | 2.1%(+11.6)#405 |
| 5. | 20629 | 11.0% | 1.9%(+9.12)#5 | 2.1%(+8.95)#600 |
| 6. | 21252 | 11.0% | 1.9%(+9.05)#6 | 2.1%(+8.88)#605 |
| 7. | 20688 | 10.1% | 1.9%(+8.22)#7 | 2.1%(+8.04)#689 |
| 8. | 21052 | 9.4% | 1.9%(+7.45)#8 | 2.1%(+7.28)#796 |
| 9. | 21829 | 9.2% | 1.9%(+7.28)#9 | 2.1%(+7.11)#823 |
| 10. | 21612 | 9.1% | 1.9%(+7.15)#10 | 2.1%(+6.98)#847 |
| 11. | 20765 | 8.9% | 1.9%(+6.98)#11 | 2.1%(+6.81)#868 |
| 12. | 21405 | 8.6% | 1.9%(+6.66)#12 | 2.1%(+6.49)#924 |
| 13. | 21871 | 8.2% | 1.9%(+6.28)#13 | 2.1%(+6.10)#1,008 |
| 14. | 20880 | 7.9% | 1.9%(+6.03)#14 | 2.1%(+5.85)#1,075 |
| 15. | 21624 | 7.5% | 1.9%(+5.54)#15 | 2.1%(+5.37)#1,189 |
| 16. | 21250 | 6.9% | 1.9%(+4.94)#16 | 2.1%(+4.77)#1,377 |
| 17. | 21156 | 6.6% | 1.9%(+4.73)#17 | 2.1%(+4.55)#1,446 |
| 18. | 20686 | 6.6% | 1.9%(+4.70)#18 | 2.1%(+4.53)#1,453 |
| 19. | 20623 | 6.5% | 1.9%(+4.60)#19 | 2.1%(+4.43)#1,486 |
| 20. | 21669 | 6.3% | 1.9%(+4.40)#20 | 2.1%(+4.23)#1,578 |
| 21. | 20860 | 6.1% | 1.9%(+4.23)#21 | 2.1%(+4.06)#1,634 |
| 22. | 21402 | 5.9% | 1.9%(+3.99)#22 | 2.1%(+3.82)#1,747 |
| 23. | 20689 | 5.9% | 1.9%(+3.98)#23 | 2.1%(+3.81)#1,756 |
| 24. | 21524 | 5.7% | 1.9%(+3.82)#24 | 2.1%(+3.65)#1,831 |
| 25. | 21140 | 5.7% | 1.9%(+3.80)#25 | 2.1%(+3.63)#1,849 |
| 26. | 21654 | 5.6% | 1.9%(+3.70)#26 | 2.1%(+3.53)#1,900 |
| 27. | 21641 | 5.4% | 1.9%(+3.47)#27 | 2.1%(+3.29)#2,037 |
| 28. | 21163 | 5.4% | 1.9%(+3.46)#28 | 2.1%(+3.29)#2,040 |
| 29. | 21204 | 5.4% | 1.9%(+3.45)#29 | 2.1%(+3.28)#2,050 |
| 30. | 20675 | 5.1% | 1.9%(+3.14)#30 | 2.1%(+2.97)#2,248 |
| 31. | 21767 | 5.1% | 1.9%(+3.14)#31 | 2.1%(+2.97)#2,249 |
| 32. | 21671 | 4.7% | 1.9%(+2.79)#32 | 2.1%(+2.61)#2,539 |
| 33. | 21661 | 4.7% | 1.9%(+2.77)#33 | 2.1%(+2.60)#2,551 |
| 34. | 21738 | 4.5% | 1.9%(+2.58)#34 | 2.1%(+2.40)#2,757 |
| 35. | 21811 | 4.4% | 1.9%(+2.52)#35 | 2.1%(+2.35)#2,817 |
| 36. | 21874 | 4.4% | 1.9%(+2.46)#36 | 2.1%(+2.29)#2,881 |
| 37. | 21723 | 4.4% | 1.9%(+2.45)#37 | 2.1%(+2.27)#2,895 |
| 38. | 20710 | 4.2% | 1.9%(+2.27)#38 | 2.1%(+2.10)#3,106 |
| 39. | 21640 | 4.1% | 1.9%(+2.23)#39 | 2.1%(+2.06)#3,163 |
| 40. | 21634 | 4.1% | 1.9%(+2.23)#40 | 2.1%(+2.06)#3,165 |
| 41. | 21662 | 4.1% | 1.9%(+2.15)#41 | 2.1%(+1.98)#3,243 |
| 42. | 21678 | 4.1% | 1.9%(+2.15)#42 | 2.1%(+1.98)#3,254 |
| 43. | 20615 | 4.0% | 1.9%(+2.08)#43 | 2.1%(+1.91)#3,358 |
| 44. | 20781 | 3.9% | 1.9%(+2.04)#44 | 2.1%(+1.87)#3,404 |
| 45. | 20608 | 3.9% | 1.9%(+2.01)#45 | 2.1%(+1.84)#3,450 |
| 46. | 20816 | 3.9% | 1.9%(+1.99)#46 | 2.1%(+1.82)#3,476 |
| 47. | 21771 | 3.9% | 1.9%(+1.99)#47 | 2.1%(+1.82)#3,478 |
| 48. | 20764 | 3.9% | 1.9%(+1.97)#48 | 2.1%(+1.80)#3,513 |
| 49. | 21620 | 3.8% | 1.9%(+1.94)#49 | 2.1%(+1.77)#3,555 |
| 50. | 21727 | 3.7% | 1.9%(+1.76)#50 | 2.1%(+1.59)#3,819 |
| 51. | 21032 | 3.7% | 1.9%(+1.74)#51 | 2.1%(+1.57)#3,845 |
| 52. | 20776 | 3.6% | 1.9%(+1.67)#52 | 2.1%(+1.50)#3,979 |
| 53. | 21619 | 3.6% | 1.9%(+1.66)#53 | 2.1%(+1.49)#4,004 |
| 54. | 21120 | 3.6% | 1.9%(+1.65)#54 | 2.1%(+1.48)#4,015 |
| 55. | 20712 | 3.4% | 1.9%(+1.54)#55 | 2.1%(+1.36)#4,251 |
| 56. | 21087 | 3.4% | 1.9%(+1.49)#56 | 2.1%(+1.31)#4,361 |
| 57. | 20910 | 3.3% | 1.9%(+1.42)#57 | 2.1%(+1.25)#4,504 |
| 58. | 21201 | 3.3% | 1.9%(+1.41)#58 | 2.1%(+1.23)#4,536 |
| 59. | 20751 | 3.3% | 1.9%(+1.36)#59 | 2.1%(+1.19)#4,635 |
| 60. | 20895 | 3.2% | 1.9%(+1.31)#60 | 2.1%(+1.13)#4,758 |
| 61. | 20736 | 3.2% | 1.9%(+1.30)#61 | 2.1%(+1.13)#4,782 |
| 62. | 21160 | 3.2% | 1.9%(+1.26)#62 | 2.1%(+1.09)#4,864 |
| 63. | 21601 | 3.1% | 1.9%(+1.23)#63 | 2.1%(+1.06)#4,942 |
| 64. | 21093 | 3.1% | 1.9%(+1.21)#64 | 2.1%(+1.04)#5,003 |
| 65. | 21822 | 3.1% | 1.9%(+1.18)#65 | 2.1%(+1.01)#5,091 |
| 66. | 21133 | 3.1% | 1.9%(+1.18)#66 | 2.1%(+1.00)#5,101 |
| 67. | 20711 | 3.1% | 1.9%(+1.17)#67 | 2.1%(+1.000)#5,117 |
| 68. | 21202 | 3.1% | 1.9%(+1.16)#68 | 2.1%(+0.989)#5,157 |
| 69. | 21734 | 3.0% | 1.9%(+1.11)#69 | 2.1%(+0.941)#5,294 |
| 70. | 21776 | 3.0% | 1.9%(+1.10)#70 | 2.1%(+0.931)#5,320 |
| 71. | 21863 | 3.0% | 1.9%(+1.10)#71 | 2.1%(+0.927)#5,332 |
| 72. | 20772 | 3.0% | 1.9%(+1.06)#72 | 2.1%(+0.892)#5,434 |
| 73. | 20769 | 3.0% | 1.9%(+1.06)#73 | 2.1%(+0.889)#5,443 |
| 74. | 20876 | 3.0% | 1.9%(+1.05)#74 | 2.1%(+0.880)#5,473 |
| 75. | 20832 | 2.9% | 1.9%(+1.01)#75 | 2.1%(+0.836)#5,599 |
| 76. | 21722 | 2.9% | 1.9%(+0.984)#76 | 2.1%(+0.812)#5,661 |
| 77. | 21638 | 2.9% | 1.9%(+0.981)#77 | 2.1%(+0.809)#5,674 |
| 78. | 21842 | 2.9% | 1.9%(+0.970)#78 | 2.1%(+0.798)#5,706 |
| 79. | 20794 | 2.9% | 1.9%(+0.963)#79 | 2.1%(+0.791)#5,731 |
| 80. | 20733 | 2.9% | 1.9%(+0.961)#80 | 2.1%(+0.789)#5,741 |
| 81. | 20637 | 2.9% | 1.9%(+0.946)#81 | 2.1%(+0.775)#5,781 |
| 82. | 21403 | 2.8% | 1.9%(+0.936)#82 | 2.1%(+0.764)#5,831 |
| 83. | 21155 | 2.8% | 1.9%(+0.904)#83 | 2.1%(+0.732)#5,939 |
| 84. | 21773 | 2.8% | 1.9%(+0.898)#84 | 2.1%(+0.727)#5,955 |
| 85. | 21755 | 2.8% | 1.9%(+0.890)#85 | 2.1%(+0.719)#5,991 |
| 86. | 21214 | 2.8% | 1.9%(+0.877)#86 | 2.1%(+0.706)#6,045 |
| 87. | 21212 | 2.7% | 1.9%(+0.834)#87 | 2.1%(+0.662)#6,212 |
| 88. | 20662 | 2.7% | 1.9%(+0.818)#88 | 2.1%(+0.646)#6,254 |
| 89. | 21005 | 2.7% | 1.9%(+0.801)#89 | 2.1%(+0.629)#6,314 |
| 90. | 21912 | 2.7% | 1.9%(+0.783)#90 | 2.1%(+0.611)#6,390 |
| 91. | 21044 | 2.7% | 1.9%(+0.780)#91 | 2.1%(+0.609)#6,397 |
| 92. | 21401 | 2.6% | 1.9%(+0.731)#92 | 2.1%(+0.560)#6,597 |
| 93. | 21780 | 2.6% | 1.9%(+0.721)#93 | 2.1%(+0.549)#6,637 |
| 94. | 21664 | 2.6% | 1.9%(+0.703)#94 | 2.1%(+0.532)#6,699 |
| 95. | 20735 | 2.6% | 1.9%(+0.695)#95 | 2.1%(+0.523)#6,734 |
| 96. | 21784 | 2.6% | 1.9%(+0.688)#96 | 2.1%(+0.516)#6,760 |
| 97. | 21014 | 2.6% | 1.9%(+0.684)#97 | 2.1%(+0.513)#6,778 |
| 98. | 20866 | 2.6% | 1.9%(+0.675)#98 | 2.1%(+0.504)#6,813 |
| 99. | 21218 | 2.6% | 1.9%(+0.663)#99 | 2.1%(+0.492)#6,854 |
| 100. | 21205 | 2.5% | 1.9%(+0.638)#100 | 2.1%(+0.467)#6,958 |
Common Questions
What are the Top 10 Zip Codes with the Highest Percentage of Population Employed in Arts, Entertainment & Recreation in Maryland?
Top 10 Zip Codes with the Highest Percentage of Population Employed in Arts, Entertainment & Recreation in Maryland are:
What zip code has the Highest Percentage of Population Employed in Arts, Entertainment & Recreation in Maryland?
21523 has the Highest Percentage of Population Employed in Arts, Entertainment & Recreation in Maryland with 27.4%.
What is the Percentage of Population Employed in Arts, Entertainment & Recreation in the State of Maryland?
Percentage of Population Employed in Arts, Entertainment & Recreation in Maryland is 1.9%.
What is the Percentage of Population Employed in Arts, Entertainment & Recreation in the United States?
Percentage of Population Employed in Arts, Entertainment & Recreation in the United States is 2.1%.