South Wallins, KY Map & Demographics
South Wallins Map
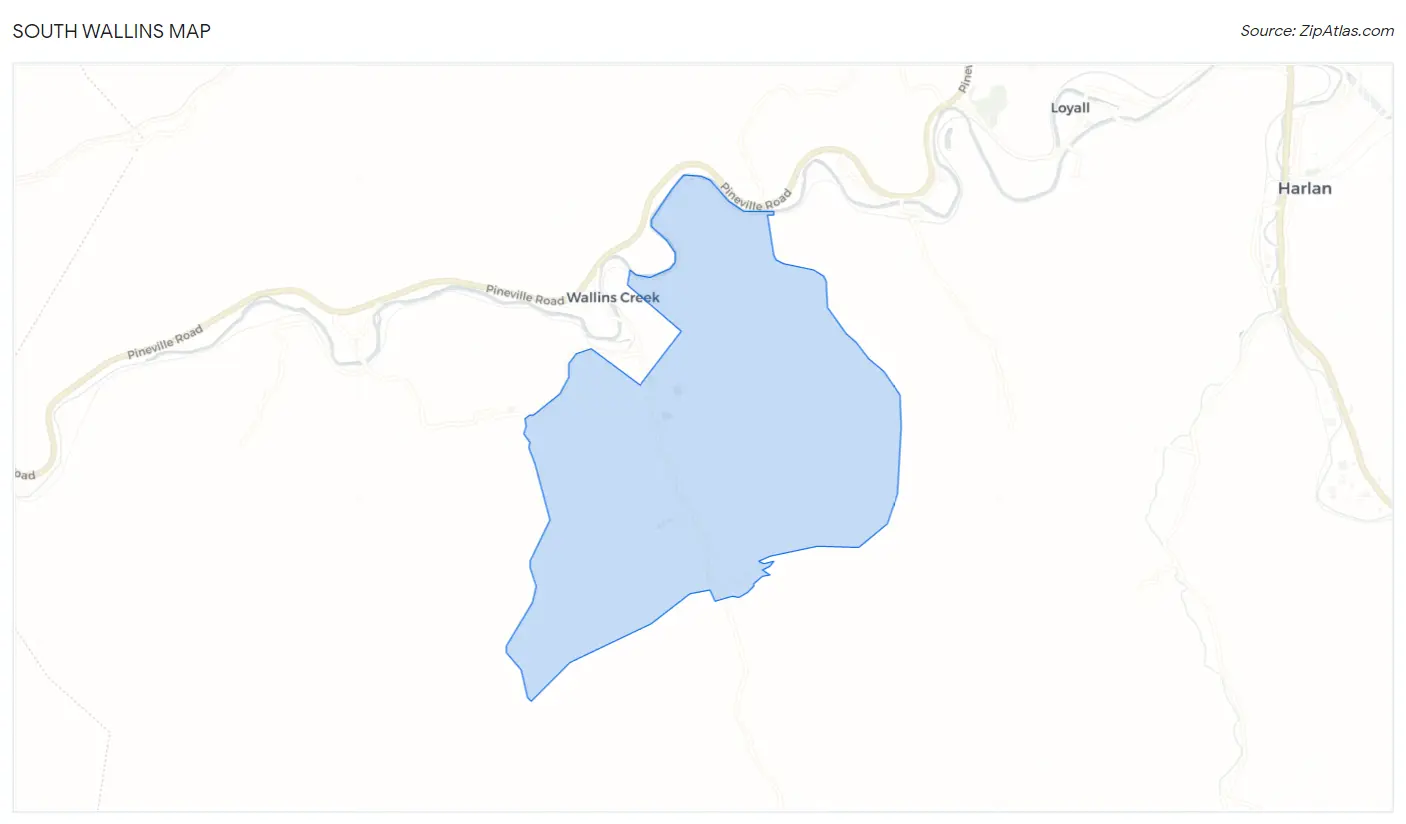
South Wallins Overview
$15,652
PER CAPITA INCOME
$57,660
AVG FAMILY INCOME
$52,833
AVG HOUSEHOLD INCOME
35.7%
WAGE / INCOME GAP [ % ]
64.3¢/ $1
WAGE / INCOME GAP [ $ ]
0.33
INEQUALITY / GINI INDEX
976
TOTAL POPULATION
468
MALE POPULATION
508
FEMALE POPULATION
92.13
MALES / 100 FEMALES
108.55
FEMALES / 100 MALES
34.2
MEDIAN AGE
3.6
AVG FAMILY SIZE
3.0
AVG HOUSEHOLD SIZE
221
LABOR FORCE [ PEOPLE ]
32.7%
PERCENT IN LABOR FORCE
9.0%
UNEMPLOYMENT RATE
Income in South Wallins
Income Overview in South Wallins
Per Capita Income in South Wallins is $15,652, while median incomes of families and households are $57,660 and $52,833 respectively.
| Characteristic | Number | Measure |
| Per Capita Income | 976 | $15,652 |
| Median Family Income | 252 | $57,660 |
| Mean Family Income | 252 | $51,504 |
| Median Household Income | 322 | $52,833 |
| Mean Household Income | 322 | $45,065 |
| Income Deficit | 252 | $0 |
| Wage / Income Gap (%) | 976 | 35.66% |
| Wage / Income Gap ($) | 976 | 64.34¢ per $1 |
| Gini / Inequality Index | 976 | 0.33 |
Earnings by Sex in South Wallins
Average Earnings in South Wallins are $42,866, $44,609 for men and $28,700 for women, a difference of 35.7%.
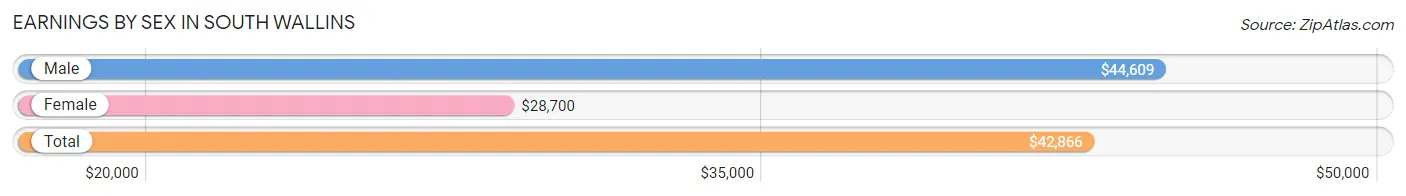
| Sex | Number | Average Earnings |
| Male | 164 (73.2%) | $44,609 |
| Female | 60 (26.8%) | $28,700 |
| Total | 224 (100.0%) | $42,866 |
Earnings by Sex by Income Bracket in South Wallins
The most common earnings brackets in South Wallins are $75,000 to $99,999 for men (49 | 29.9%) and $25,000 to $29,999 for women (25 | 41.7%).
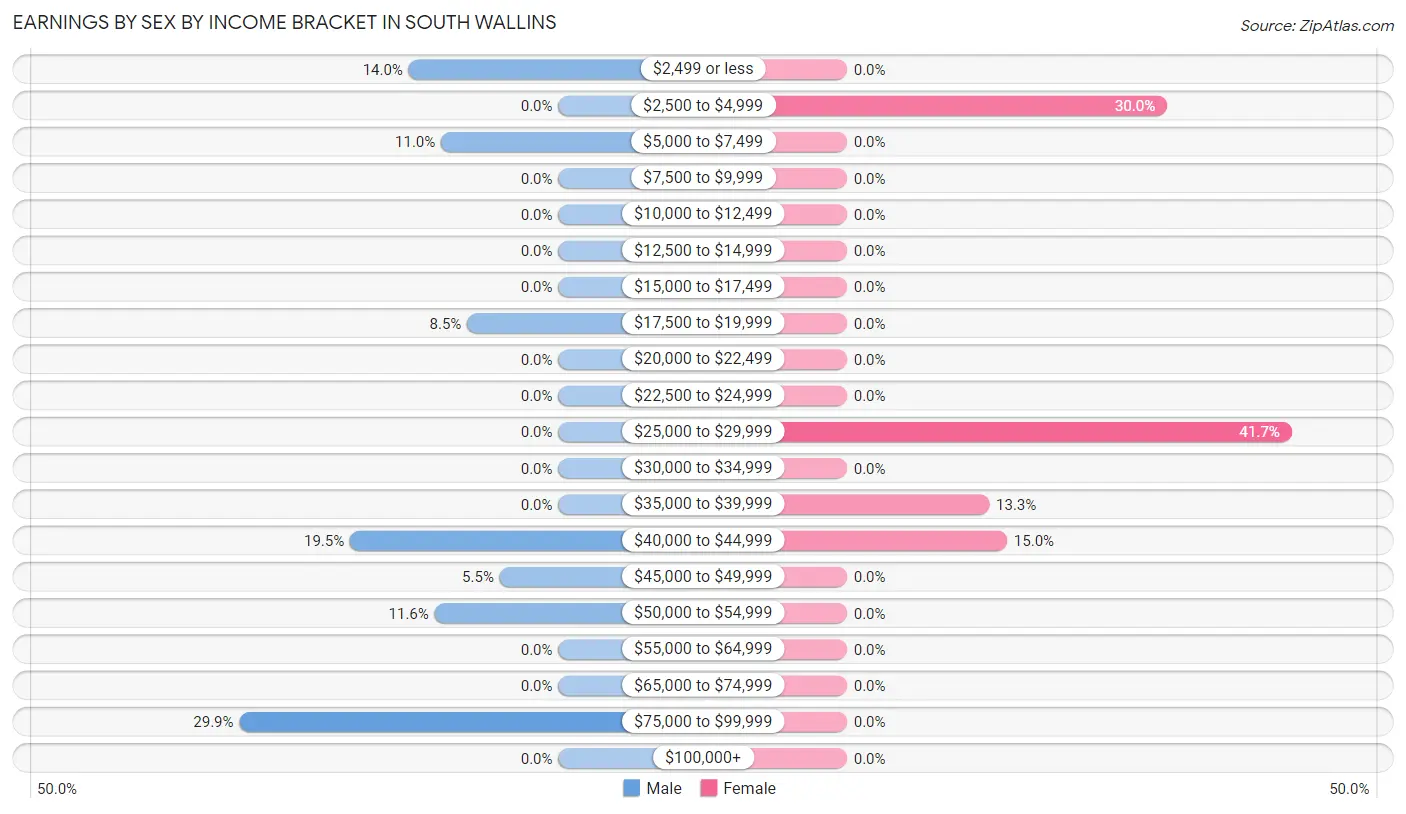
| Income | Male | Female |
| $2,499 or less | 23 (14.0%) | 0 (0.0%) |
| $2,500 to $4,999 | 0 (0.0%) | 18 (30.0%) |
| $5,000 to $7,499 | 18 (11.0%) | 0 (0.0%) |
| $7,500 to $9,999 | 0 (0.0%) | 0 (0.0%) |
| $10,000 to $12,499 | 0 (0.0%) | 0 (0.0%) |
| $12,500 to $14,999 | 0 (0.0%) | 0 (0.0%) |
| $15,000 to $17,499 | 0 (0.0%) | 0 (0.0%) |
| $17,500 to $19,999 | 14 (8.5%) | 0 (0.0%) |
| $20,000 to $22,499 | 0 (0.0%) | 0 (0.0%) |
| $22,500 to $24,999 | 0 (0.0%) | 0 (0.0%) |
| $25,000 to $29,999 | 0 (0.0%) | 25 (41.7%) |
| $30,000 to $34,999 | 0 (0.0%) | 0 (0.0%) |
| $35,000 to $39,999 | 0 (0.0%) | 8 (13.3%) |
| $40,000 to $44,999 | 32 (19.5%) | 9 (15.0%) |
| $45,000 to $49,999 | 9 (5.5%) | 0 (0.0%) |
| $50,000 to $54,999 | 19 (11.6%) | 0 (0.0%) |
| $55,000 to $64,999 | 0 (0.0%) | 0 (0.0%) |
| $65,000 to $74,999 | 0 (0.0%) | 0 (0.0%) |
| $75,000 to $99,999 | 49 (29.9%) | 0 (0.0%) |
| $100,000+ | 0 (0.0%) | 0 (0.0%) |
| Total | 164 (100.0%) | 60 (100.0%) |
Earnings by Sex by Educational Attainment in South Wallins
| Educational Attainment | Male Income | Female Income |
| Less than High School | - | - |
| High School Diploma | - | - |
| College or Associate's Degree | - | - |
| Bachelor's Degree | - | - |
| Graduate Degree | - | - |
| Total | $44,609 | $29,600 |
Family Income in South Wallins
Family Income Brackets in South Wallins
According to the South Wallins family income data, there are 82 families falling into the $75,000 to $99,999 income range, which is the most common income bracket and makes up 32.5% of all families.
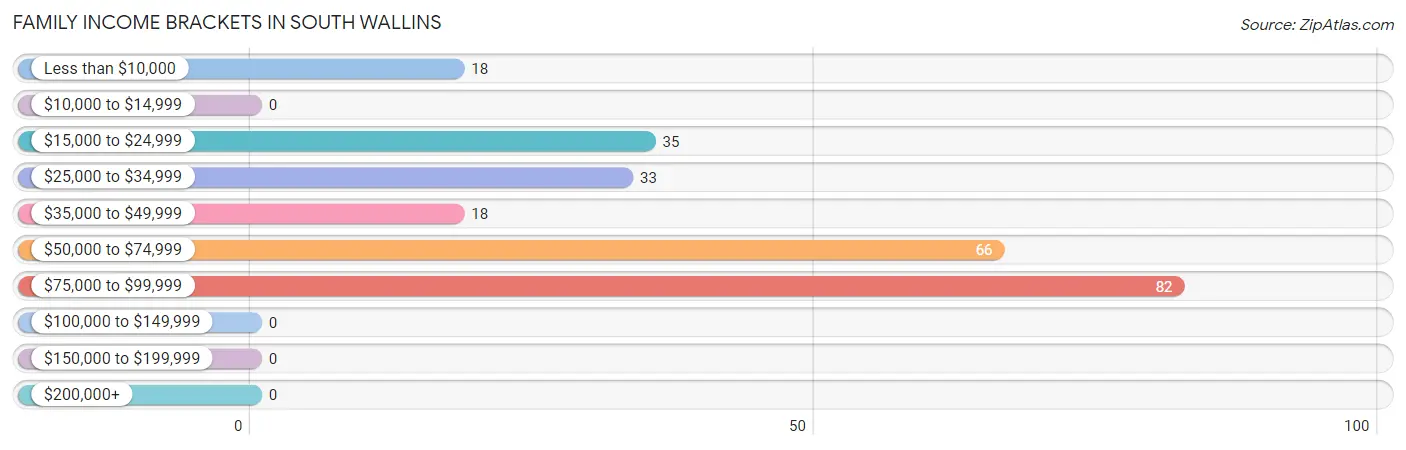
| Income Bracket | # Families | % Families |
| Less than $10,000 | 18 | 7.1% |
| $10,000 to $14,999 | 0 | 0.0% |
| $15,000 to $24,999 | 35 | 13.9% |
| $25,000 to $34,999 | 33 | 13.1% |
| $35,000 to $49,999 | 18 | 7.1% |
| $50,000 to $74,999 | 66 | 26.2% |
| $75,000 to $99,999 | 82 | 32.5% |
| $100,000 to $149,999 | 0 | 0.0% |
| $150,000 to $199,999 | 0 | 0.0% |
| $200,000+ | 0 | 0.0% |
Family Income by Famaliy Size in South Wallins
2-person families (82 | 32.5%) account for the highest median family income in South Wallins with $49,167 per family, while 2-person families (82 | 32.5%) have the highest median income of $24,584 per family member.
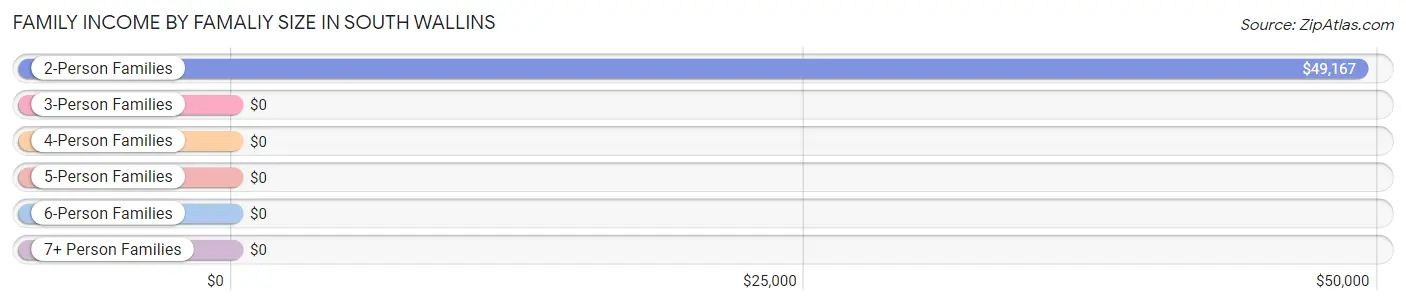
| Income Bracket | # Families | Median Income |
| 2-Person Families | 82 (32.5%) | $49,167 |
| 3-Person Families | 33 (13.1%) | $0 |
| 4-Person Families | 86 (34.1%) | $0 |
| 5-Person Families | 51 (20.2%) | $0 |
| 6-Person Families | 0 (0.0%) | $0 |
| 7+ Person Families | 0 (0.0%) | $0 |
| Total | 252 (100.0%) | $57,660 |
Family Income by Number of Earners in South Wallins
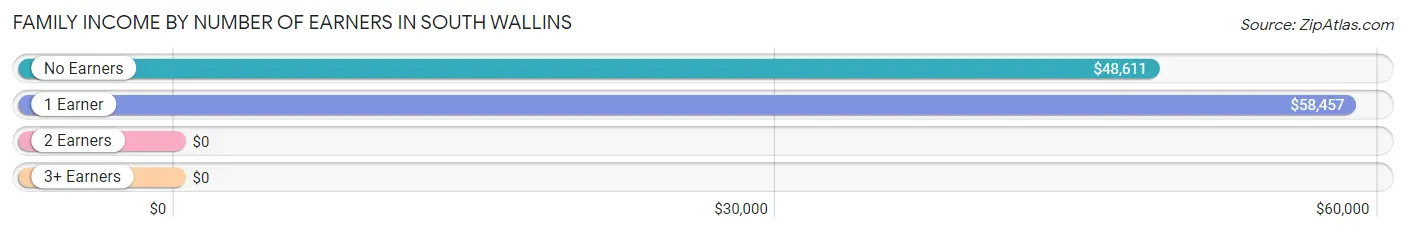
| Number of Earners | # Families | Median Income |
| No Earners | 74 (29.4%) | $48,611 |
| 1 Earner | 150 (59.5%) | $58,457 |
| 2 Earners | 28 (11.1%) | $0 |
| 3+ Earners | 0 (0.0%) | $0 |
| Total | 252 (100.0%) | $57,660 |
Household Income in South Wallins
Household Income Brackets in South Wallins
With 82 households falling in the category, the $75,000 to $99,999 income range is the most frequent in South Wallins, accounting for 25.5% of all households.
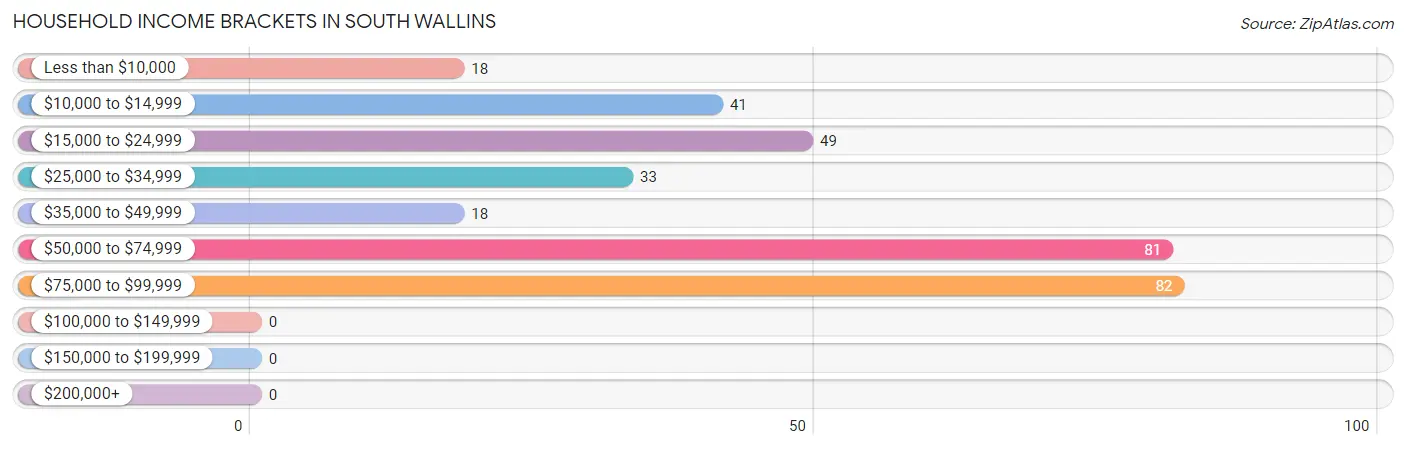
| Income Bracket | # Households | % Households |
| Less than $10,000 | 18 | 5.6% |
| $10,000 to $14,999 | 41 | 12.7% |
| $15,000 to $24,999 | 49 | 15.2% |
| $25,000 to $34,999 | 33 | 10.2% |
| $35,000 to $49,999 | 18 | 5.6% |
| $50,000 to $74,999 | 81 | 25.2% |
| $75,000 to $99,999 | 82 | 25.5% |
| $100,000 to $149,999 | 0 | 0.0% |
| $150,000 to $199,999 | 0 | 0.0% |
| $200,000+ | 0 | 0.0% |
Household Income by Householder Age in South Wallins
The median household income in South Wallins is $52,833, with the highest median household income of $57,813 found in the 45 to 64 years age bracket for the primary householder. A total of 128 households (39.8%) fall into this category.
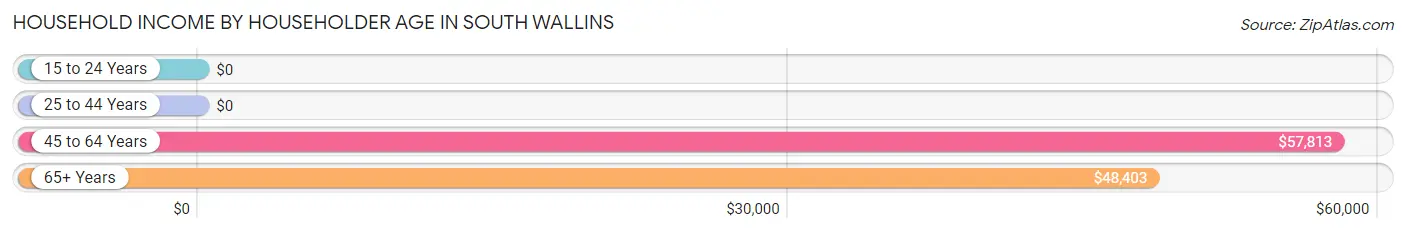
| Income Bracket | # Households | Median Income |
| 15 to 24 Years | 0 (0.0%) | $0 |
| 25 to 44 Years | 95 (29.5%) | $0 |
| 45 to 64 Years | 128 (39.8%) | $57,813 |
| 65+ Years | 99 (30.7%) | $48,403 |
| Total | 322 (100.0%) | $52,833 |
Poverty in South Wallins
Income Below Poverty by Sex and Age in South Wallins
With 26.5% poverty level for males and 28.3% for females among the residents of South Wallins, 16 and 17 year old males and 35 to 44 year old females are the most vulnerable to poverty, with 28 males (100.0%) and 40 females (61.5%) in their respective age groups living below the poverty level.
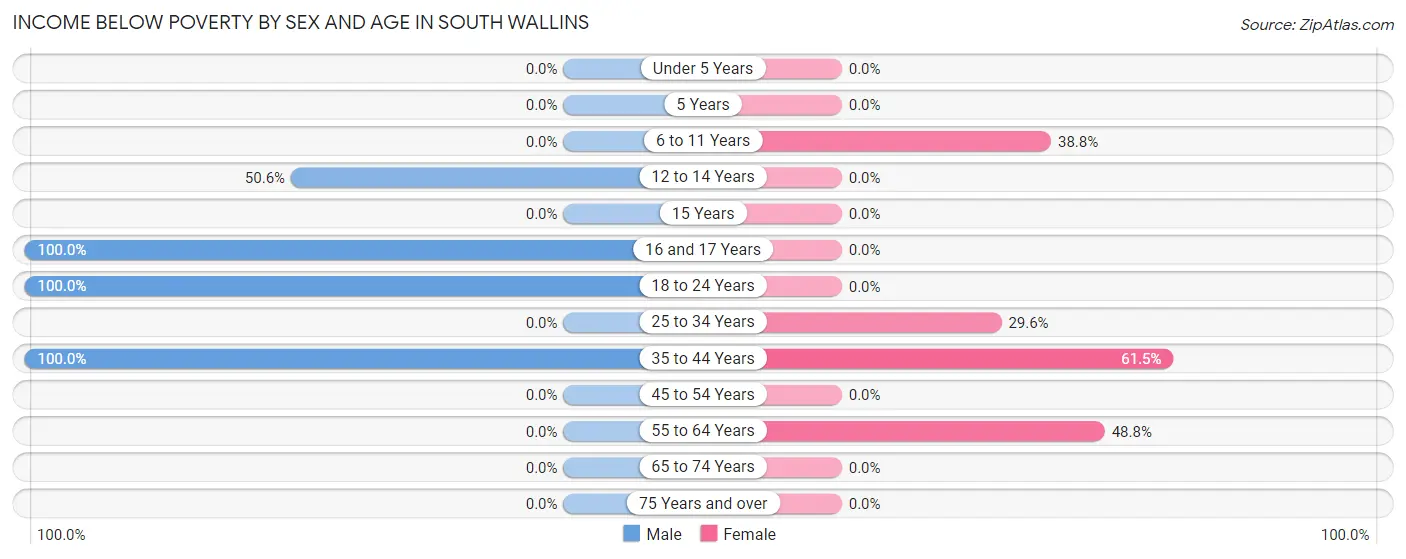
| Age Bracket | Male | Female |
| Under 5 Years | 0 (0.0%) | 0 (0.0%) |
| 5 Years | 0 (0.0%) | 0 (0.0%) |
| 6 to 11 Years | 0 (0.0%) | 47 (38.8%) |
| 12 to 14 Years | 44 (50.6%) | 0 (0.0%) |
| 15 Years | 0 (0.0%) | 0 (0.0%) |
| 16 and 17 Years | 28 (100.0%) | 0 (0.0%) |
| 18 to 24 Years | 20 (100.0%) | 0 (0.0%) |
| 25 to 34 Years | 0 (0.0%) | 16 (29.6%) |
| 35 to 44 Years | 32 (100.0%) | 40 (61.5%) |
| 45 to 54 Years | 0 (0.0%) | 0 (0.0%) |
| 55 to 64 Years | 0 (0.0%) | 41 (48.8%) |
| 65 to 74 Years | 0 (0.0%) | 0 (0.0%) |
| 75 Years and over | 0 (0.0%) | 0 (0.0%) |
| Total | 124 (26.5%) | 144 (28.3%) |
Income Above Poverty by Sex and Age in South Wallins
According to the poverty statistics in South Wallins, males aged 6 to 11 years and females aged under 5 years are the age groups that are most secure financially, with 100.0% of males and 100.0% of females in these age groups living above the poverty line.
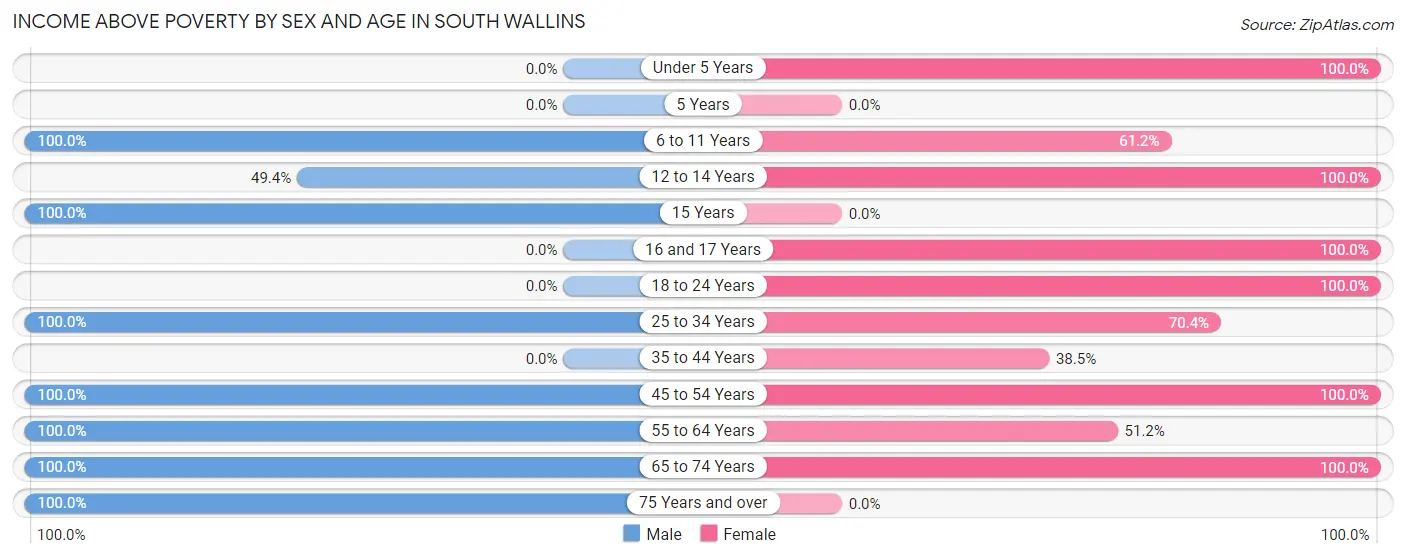
| Age Bracket | Male | Female |
| Under 5 Years | 0 (0.0%) | 26 (100.0%) |
| 5 Years | 0 (0.0%) | 0 (0.0%) |
| 6 to 11 Years | 34 (100.0%) | 74 (61.2%) |
| 12 to 14 Years | 43 (49.4%) | 23 (100.0%) |
| 15 Years | 9 (100.0%) | 0 (0.0%) |
| 16 and 17 Years | 0 (0.0%) | 33 (100.0%) |
| 18 to 24 Years | 0 (0.0%) | 18 (100.0%) |
| 25 to 34 Years | 72 (100.0%) | 38 (70.4%) |
| 35 to 44 Years | 0 (0.0%) | 25 (38.5%) |
| 45 to 54 Years | 60 (100.0%) | 34 (100.0%) |
| 55 to 64 Years | 27 (100.0%) | 43 (51.2%) |
| 65 to 74 Years | 70 (100.0%) | 50 (100.0%) |
| 75 Years and over | 29 (100.0%) | 0 (0.0%) |
| Total | 344 (73.5%) | 364 (71.7%) |
Income Below Poverty Among Married-Couple Families in South Wallins
The poverty statistics for married-couple families in South Wallins show that 14.1% or 32 of the total 227 families live below the poverty line. Families with 1 or 2 children have the highest poverty rate of 17.5%, comprising of 14 families. On the other hand, families with 3 or 4 children have the lowest poverty rate of 0.0%, which includes 0 families.
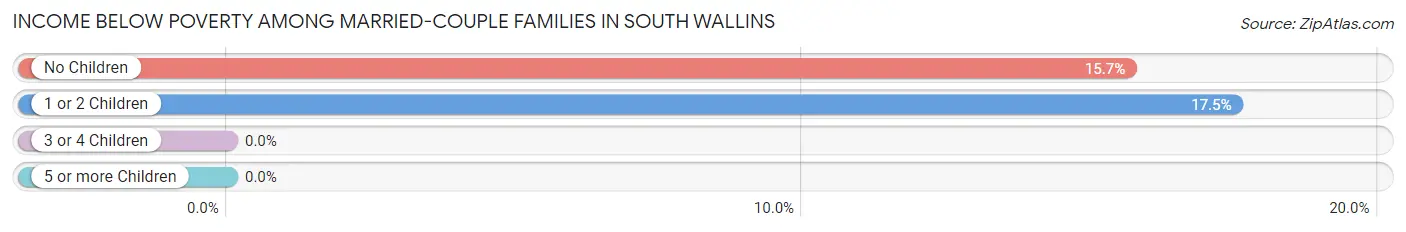
| Children | Above Poverty | Below Poverty |
| No Children | 97 (84.4%) | 18 (15.7%) |
| 1 or 2 Children | 66 (82.5%) | 14 (17.5%) |
| 3 or 4 Children | 32 (100.0%) | 0 (0.0%) |
| 5 or more Children | 0 (0.0%) | 0 (0.0%) |
| Total | 195 (85.9%) | 32 (14.1%) |
Income Below Poverty Among Single-Parent Households in South Wallins
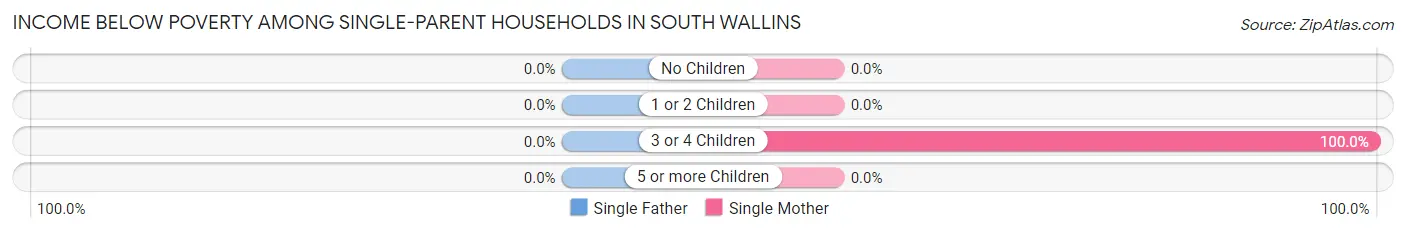
| Children | Single Father | Single Mother |
| No Children | 0 (0.0%) | 0 (0.0%) |
| 1 or 2 Children | 0 (0.0%) | 0 (0.0%) |
| 3 or 4 Children | 0 (0.0%) | 25 (100.0%) |
| 5 or more Children | 0 (0.0%) | 0 (0.0%) |
| Total | 0 (0.0%) | 25 (100.0%) |
Income Below Poverty Among Married-Couple vs Single-Parent Households in South Wallins
The poverty data for South Wallins shows that 32 of the married-couple family households (14.1%) and 25 of the single-parent households (100.0%) are living below the poverty level. Within the married-couple family households, those with 1 or 2 children have the highest poverty rate, with 14 households (17.5%) falling below the poverty line. Among the single-parent households, those with 3 or 4 children have the highest poverty rate, with 25 household (100.0%) living below poverty.
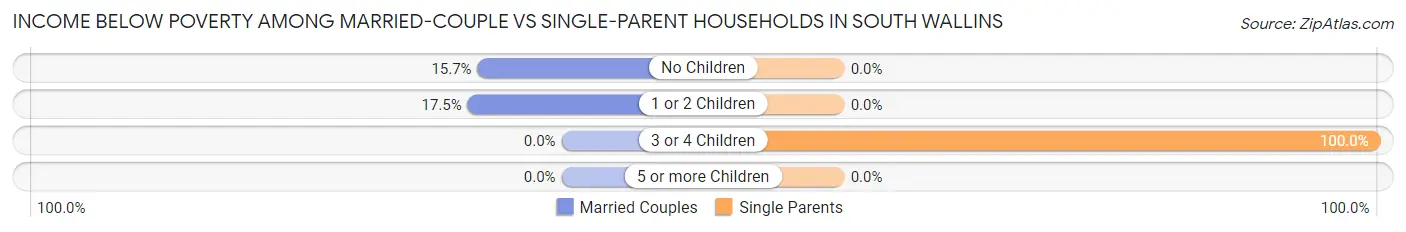
| Children | Married-Couple Families | Single-Parent Households |
| No Children | 18 (15.7%) | 0 (0.0%) |
| 1 or 2 Children | 14 (17.5%) | 0 (0.0%) |
| 3 or 4 Children | 0 (0.0%) | 25 (100.0%) |
| 5 or more Children | 0 (0.0%) | 0 (0.0%) |
| Total | 32 (14.1%) | 25 (100.0%) |
Race in South Wallins
The most populous races in South Wallins are , and White / Caucasian (976 | 100.0%).
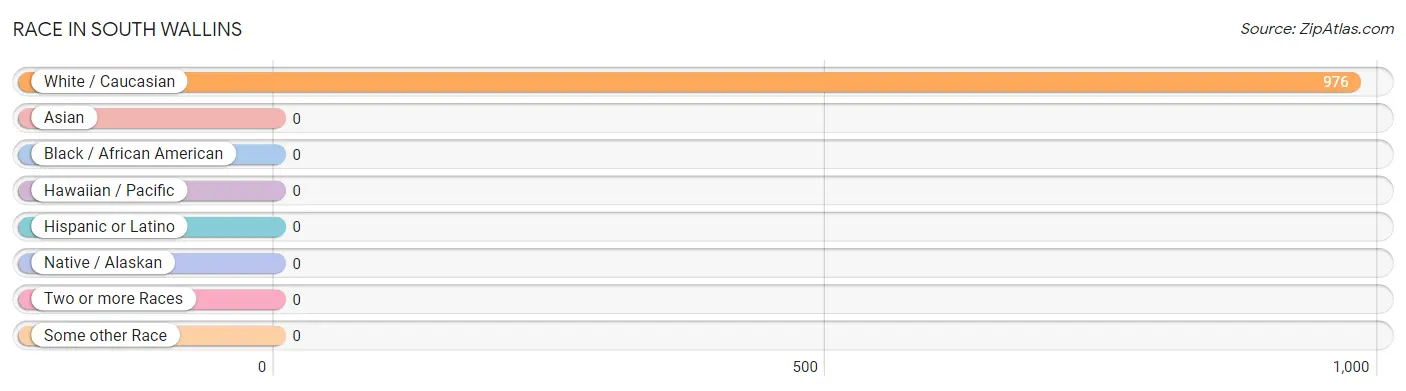
| Race | # Population | % Population |
| Asian | 0 | 0.0% |
| Black / African American | 0 | 0.0% |
| Hawaiian / Pacific | 0 | 0.0% |
| Hispanic or Latino | 0 | 0.0% |
| Native / Alaskan | 0 | 0.0% |
| White / Caucasian | 976 | 100.0% |
| Two or more Races | 0 | 0.0% |
| Some other Race | 0 | 0.0% |
| Total | 976 | 100.0% |
Ancestry in South Wallins
The most populous ancestries reported in South Wallins are American (117 | 12.0%), English (107 | 11.0%), German (58 | 5.9%), and European (35 | 3.6%), together accounting for 32.5% of all South Wallins residents.
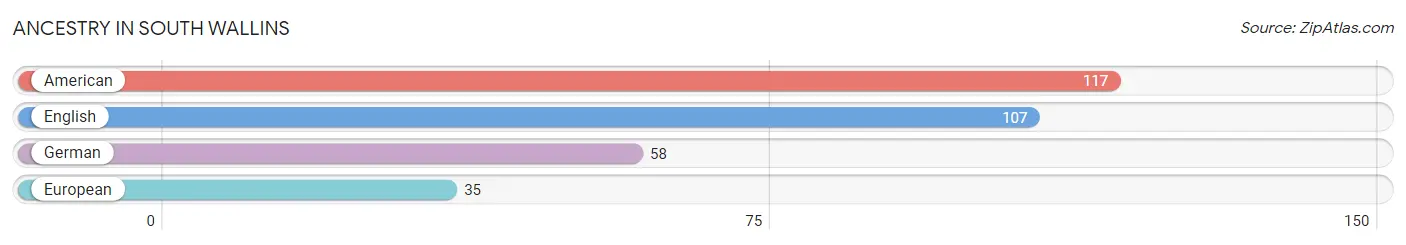
| Ancestry | # Population | % Population |
| American | 117 | 12.0% |
| English | 107 | 11.0% |
| European | 35 | 3.6% |
| German | 58 | 5.9% | View All 4 Rows |
Immigrants in South Wallins

| Immigration Origin | # Population | % Population | View All 0 Rows |
Sex and Age in South Wallins
Sex and Age in South Wallins
The most populous age groups in South Wallins are 10 to 14 Years (121 | 25.9%) for men and 5 to 9 Years (89 | 17.5%) for women.
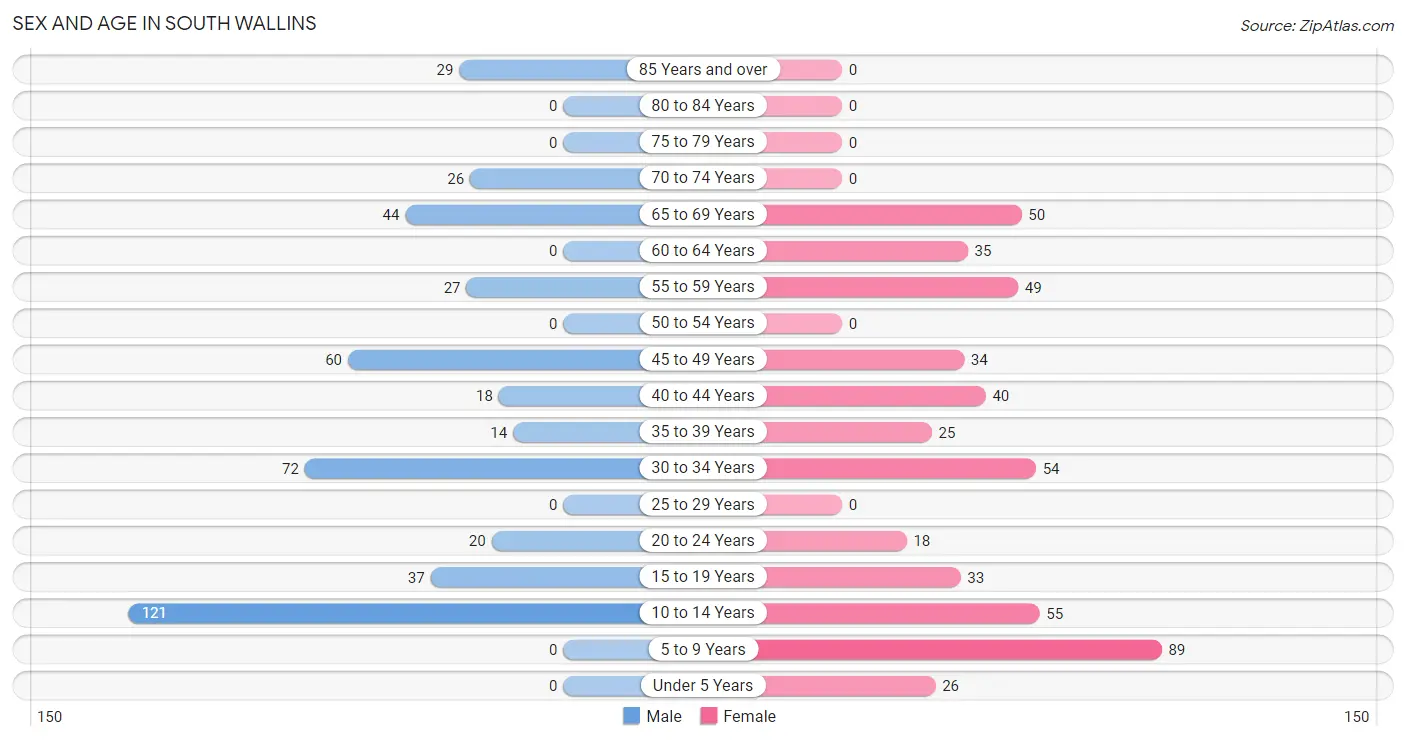
| Age Bracket | Male | Female |
| Under 5 Years | 0 (0.0%) | 26 (5.1%) |
| 5 to 9 Years | 0 (0.0%) | 89 (17.5%) |
| 10 to 14 Years | 121 (25.9%) | 55 (10.8%) |
| 15 to 19 Years | 37 (7.9%) | 33 (6.5%) |
| 20 to 24 Years | 20 (4.3%) | 18 (3.5%) |
| 25 to 29 Years | 0 (0.0%) | 0 (0.0%) |
| 30 to 34 Years | 72 (15.4%) | 54 (10.6%) |
| 35 to 39 Years | 14 (3.0%) | 25 (4.9%) |
| 40 to 44 Years | 18 (3.8%) | 40 (7.9%) |
| 45 to 49 Years | 60 (12.8%) | 34 (6.7%) |
| 50 to 54 Years | 0 (0.0%) | 0 (0.0%) |
| 55 to 59 Years | 27 (5.8%) | 49 (9.7%) |
| 60 to 64 Years | 0 (0.0%) | 35 (6.9%) |
| 65 to 69 Years | 44 (9.4%) | 50 (9.8%) |
| 70 to 74 Years | 26 (5.6%) | 0 (0.0%) |
| 75 to 79 Years | 0 (0.0%) | 0 (0.0%) |
| 80 to 84 Years | 0 (0.0%) | 0 (0.0%) |
| 85 Years and over | 29 (6.2%) | 0 (0.0%) |
| Total | 468 (100.0%) | 508 (100.0%) |
Families and Households in South Wallins
Median Family Size in South Wallins
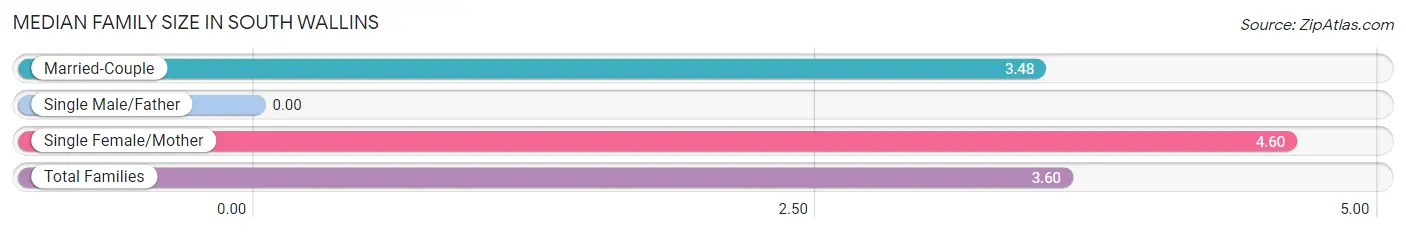
| Family Type | # Families | Family Size |
| Married-Couple | 227 (90.1%) | 3.48 |
| Single Male/Father | 0 (0.0%) | - |
| Single Female/Mother | 25 (9.9%) | 4.60 |
| Total Families | 252 (100.0%) | 3.60 |
Median Household Size in South Wallins
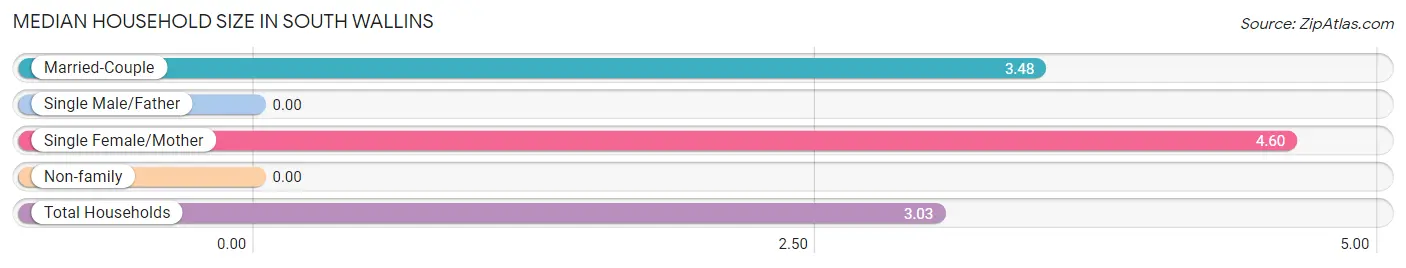
| Household Type | # Households | Household Size |
| Married-Couple | 227 (70.5%) | 3.48 |
| Single Male/Father | 0 (0.0%) | - |
| Single Female/Mother | 25 (7.8%) | 4.60 |
| Non-family | 70 (21.7%) | - |
| Total Households | 322 (100.0%) | 3.03 |
Household Size by Marriage Status in South Wallins
Out of a total of 322 households in South Wallins, 252 (78.3%) are family households, while 70 (21.7%) are nonfamily households. The most numerous type of family households are 4-person households, comprising 86, and the most common type of nonfamily households are 1-person households, comprising 70.
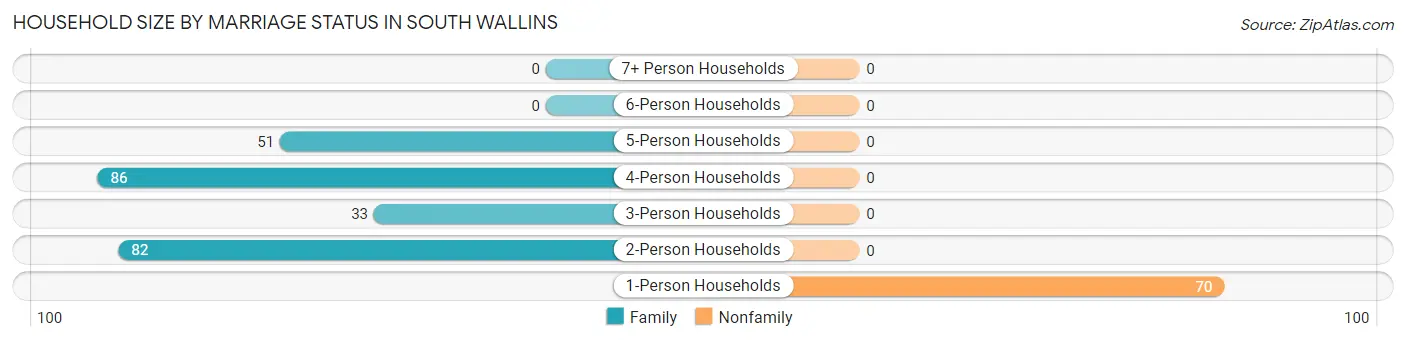
| Household Size | Family Households | Nonfamily Households |
| 1-Person Households | - | 70 (21.7%) |
| 2-Person Households | 82 (25.5%) | 0 (0.0%) |
| 3-Person Households | 33 (10.2%) | 0 (0.0%) |
| 4-Person Households | 86 (26.7%) | 0 (0.0%) |
| 5-Person Households | 51 (15.8%) | 0 (0.0%) |
| 6-Person Households | 0 (0.0%) | 0 (0.0%) |
| 7+ Person Households | 0 (0.0%) | 0 (0.0%) |
| Total | 252 (78.3%) | 70 (21.7%) |
Female Fertility in South Wallins
Fertility by Age in South Wallins
Average fertility rate in South Wallins is 88.0 births per 1,000 women. Women in the age bracket of 20 to 34 years have the highest fertility rate with 250.0 births per 1,000 women. Women in the age bracket of 20 to 34 years acount for 100.0% of all women with births.
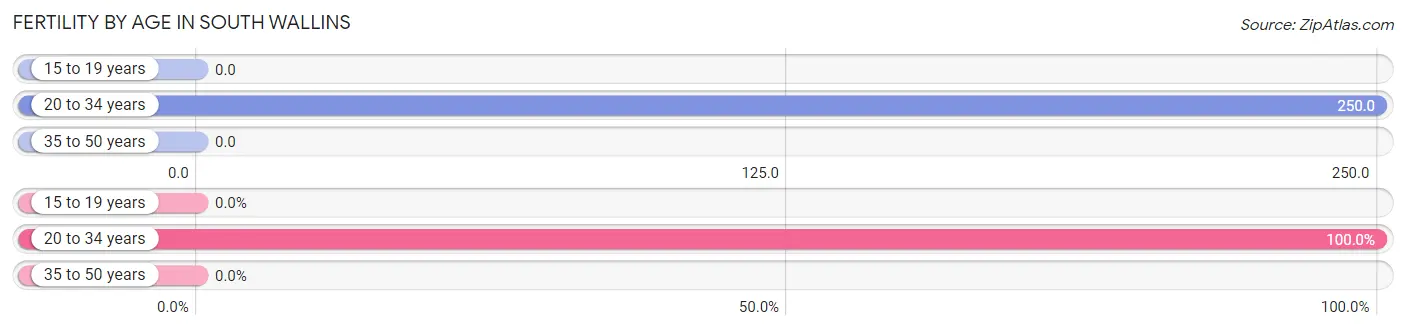
| Age Bracket | Women with Births | Births / 1,000 Women |
| 15 to 19 years | 0 (0.0%) | 0.0 |
| 20 to 34 years | 18 (100.0%) | 250.0 |
| 35 to 50 years | 0 (0.0%) | 0.0 |
| Total | 18 (100.0%) | 88.0 |
Fertility by Age by Marriage Status in South Wallins
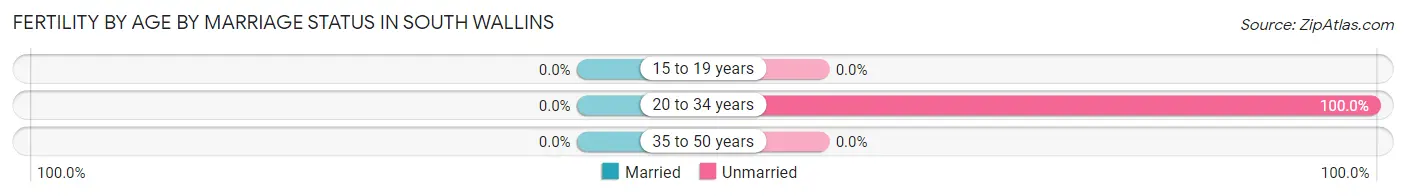
| Age Bracket | Married | Unmarried |
| 15 to 19 years | 0 (0.0%) | 0 (0.0%) |
| 20 to 34 years | 0 (0.0%) | 18 (100.0%) |
| 35 to 50 years | 0 (0.0%) | 0 (0.0%) |
| Total | 0 (0.0%) | 18 (100.0%) |
Fertility by Education in South Wallins
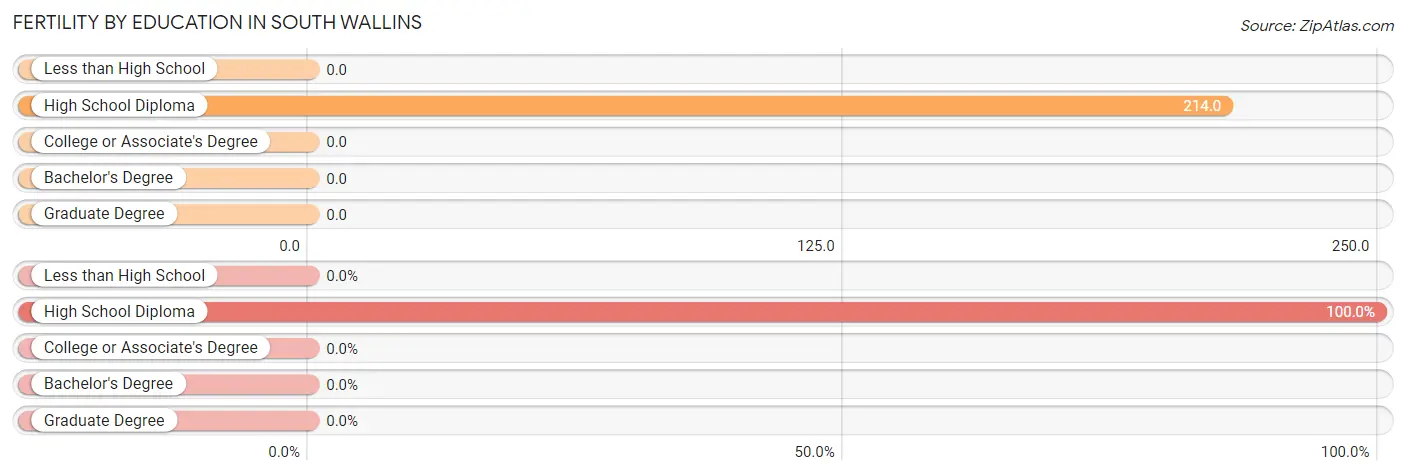
| Educational Attainment | Women with Births | Births / 1,000 Women |
| Less than High School | 0 (0.0%) | 0.0 |
| High School Diploma | 18 (100.0%) | 214.0 |
| College or Associate's Degree | 0 (0.0%) | 0.0 |
| Bachelor's Degree | 0 (0.0%) | 0.0 |
| Graduate Degree | 0 (0.0%) | 0.0 |
| Total | 18 (100.0%) | 88.0 |
Fertility by Education by Marriage Status in South Wallins
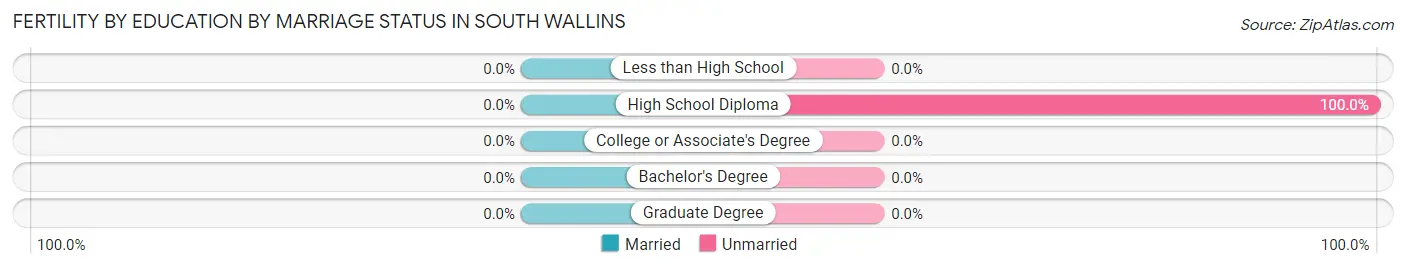
| Educational Attainment | Married | Unmarried |
| Less than High School | 0 (0.0%) | 0 (0.0%) |
| High School Diploma | 0 (0.0%) | 18 (100.0%) |
| College or Associate's Degree | 0 (0.0%) | 0 (0.0%) |
| Bachelor's Degree | 0 (0.0%) | 0 (0.0%) |
| Graduate Degree | 0 (0.0%) | 0 (0.0%) |
| Total | 0 (0.0%) | 18 (100.0%) |
Employment Characteristics in South Wallins
Employment by Class of Employer in South Wallins
Among the 201 employed individuals in South Wallins, private company employees (100 | 49.7%), state government employees (49 | 24.4%), and not-for-profit organizations (34 | 16.9%) make up the most common classes of employment.
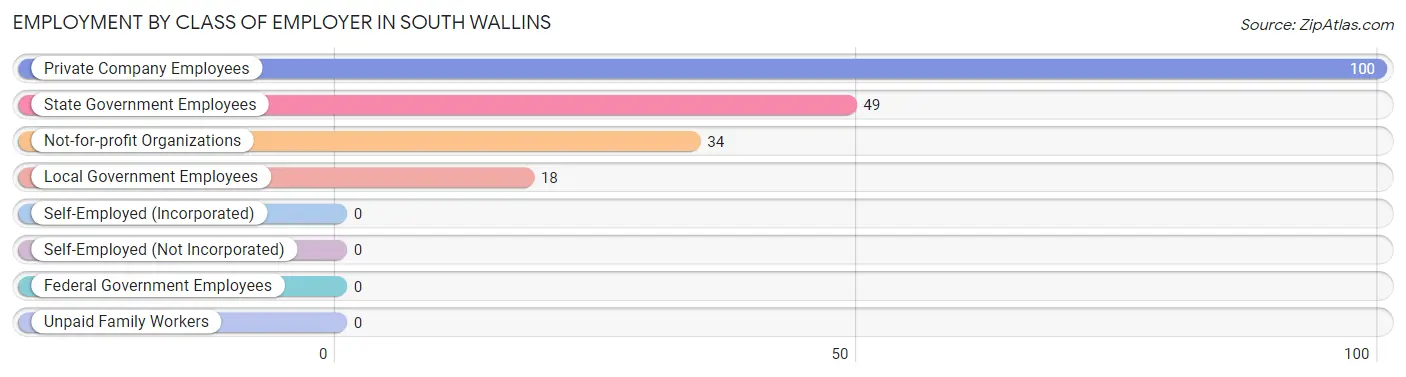
| Employer Class | # Employees | % Employees |
| Private Company Employees | 100 | 49.7% |
| Self-Employed (Incorporated) | 0 | 0.0% |
| Self-Employed (Not Incorporated) | 0 | 0.0% |
| Not-for-profit Organizations | 34 | 16.9% |
| Local Government Employees | 18 | 9.0% |
| State Government Employees | 49 | 24.4% |
| Federal Government Employees | 0 | 0.0% |
| Unpaid Family Workers | 0 | 0.0% |
| Total | 201 | 100.0% |
Employment Status by Age in South Wallins
According to the labor force statistics for South Wallins, out of the total population over 16 years of age (676), 32.7% or 221 individuals are in the labor force, with 9.0% or 20 of them unemployed. The age group with the highest labor force participation rate is 20 to 24 years, with 100.0% or 38 individuals in the labor force. Within the labor force, the 20 to 24 years age range has the highest percentage of unemployed individuals, with 52.6% or 20 of them being unemployed.
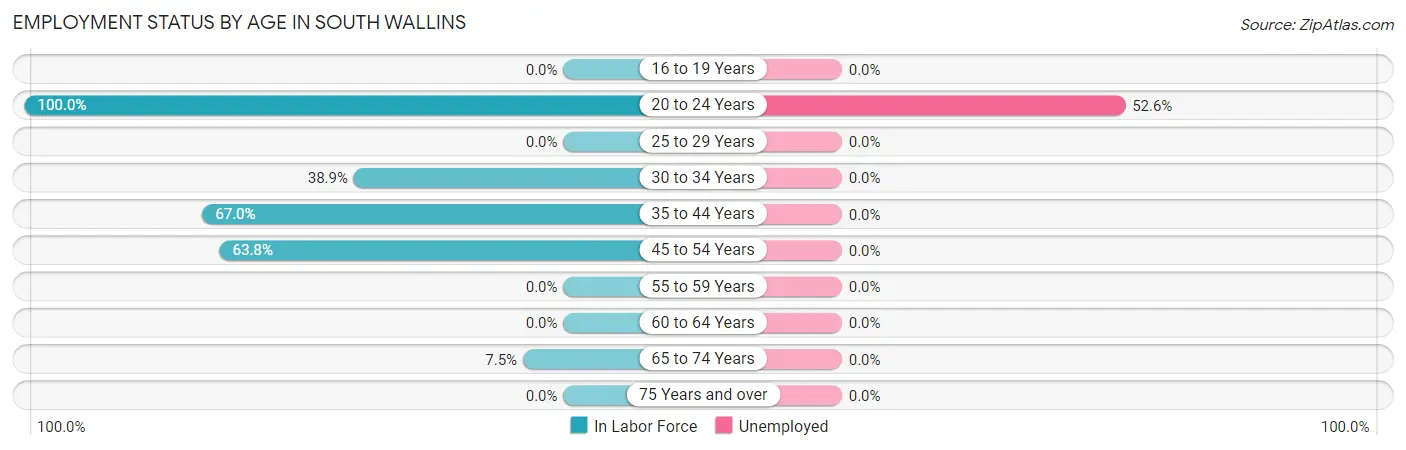
| Age Bracket | In Labor Force | Unemployed |
| 16 to 19 Years | 0 (0.0%) | 0 (0.0%) |
| 20 to 24 Years | 38 (100.0%) | 20 (52.6%) |
| 25 to 29 Years | 0 (0.0%) | 0 (0.0%) |
| 30 to 34 Years | 49 (38.9%) | 0 (0.0%) |
| 35 to 44 Years | 65 (67.0%) | 0 (0.0%) |
| 45 to 54 Years | 60 (63.8%) | 0 (0.0%) |
| 55 to 59 Years | 0 (0.0%) | 0 (0.0%) |
| 60 to 64 Years | 0 (0.0%) | 0 (0.0%) |
| 65 to 74 Years | 9 (7.5%) | 0 (0.0%) |
| 75 Years and over | 0 (0.0%) | 0 (0.0%) |
| Total | 221 (32.7%) | 20 (9.0%) |
Employment Status by Educational Attainment in South Wallins
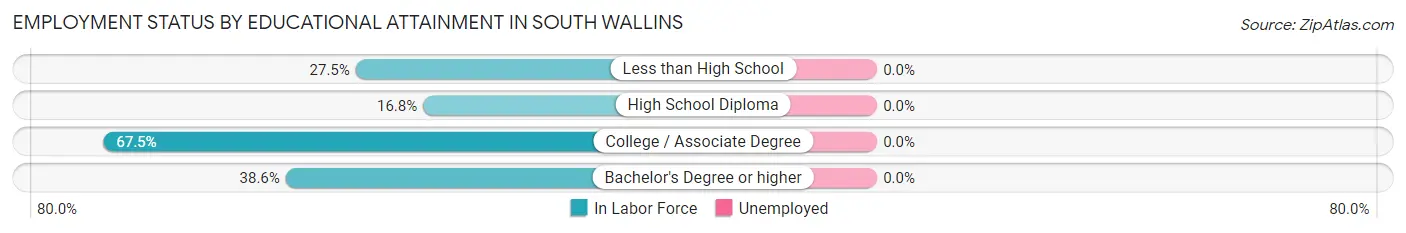
| Educational Attainment | In Labor Force | Unemployed |
| Less than High School | 33 (27.5%) | 0 (0.0%) |
| High School Diploma | 18 (16.8%) | 0 (0.0%) |
| College / Associate Degree | 106 (67.5%) | 0 (0.0%) |
| Bachelor's Degree or higher | 17 (38.6%) | 0 (0.0%) |
| Total | 174 (40.7%) | 0 (0.0%) |
Employment Occupations by Sex in South Wallins
Management, Business, Science and Arts Occupations
The most common Management, Business, Science and Arts occupations in South Wallins are Community & Social Service (17 | 8.5%), Education Instruction & Library (17 | 8.5%), and Health Diagnosing & Treating (9 | 4.5%).
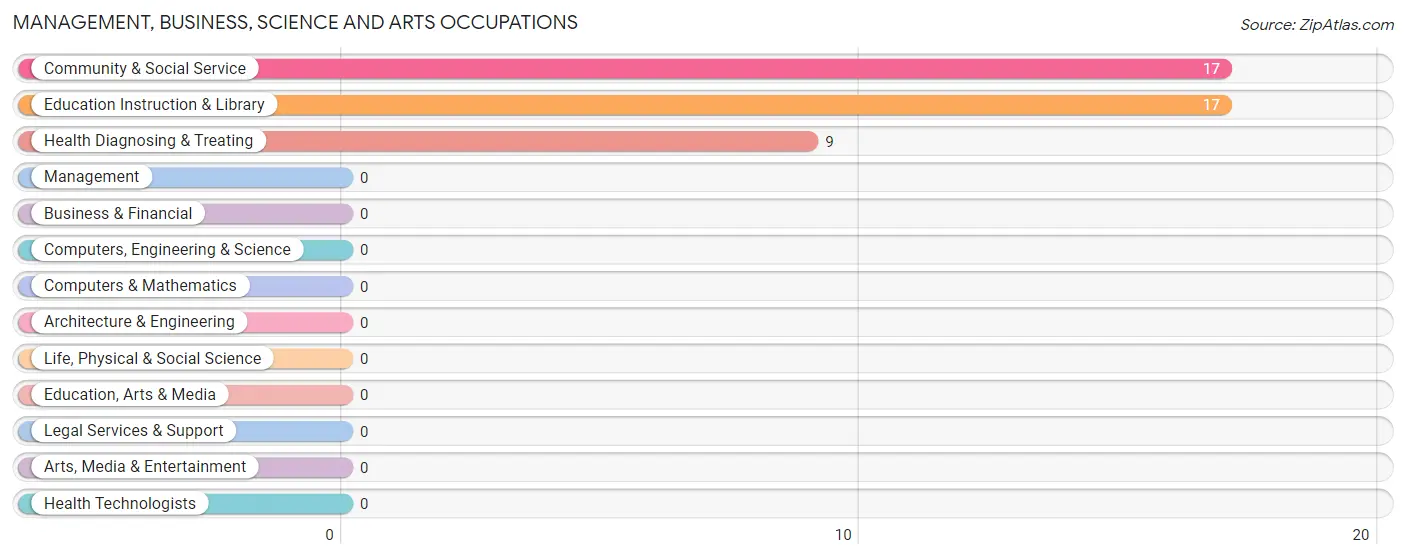
Management, Business, Science and Arts Occupations by Sex
Within the Management, Business, Science and Arts occupations in South Wallins, the most male-oriented occupations are Community & Social Service (52.9%), and Education Instruction & Library (52.9%), while the most female-oriented occupations are Health Diagnosing & Treating (100.0%), Community & Social Service (47.1%), and Education Instruction & Library (47.1%).
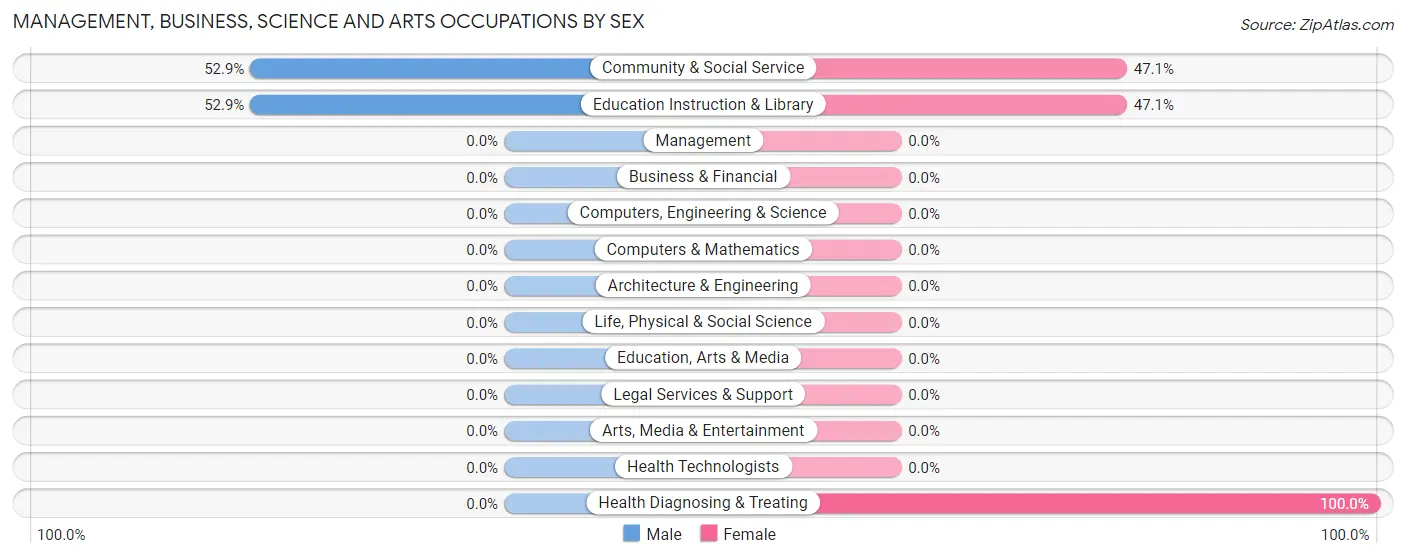
| Occupation | Male | Female |
| Management | 0 (0.0%) | 0 (0.0%) |
| Business & Financial | 0 (0.0%) | 0 (0.0%) |
| Computers, Engineering & Science | 0 (0.0%) | 0 (0.0%) |
| Computers & Mathematics | 0 (0.0%) | 0 (0.0%) |
| Architecture & Engineering | 0 (0.0%) | 0 (0.0%) |
| Life, Physical & Social Science | 0 (0.0%) | 0 (0.0%) |
| Community & Social Service | 9 (52.9%) | 8 (47.1%) |
| Education, Arts & Media | 0 (0.0%) | 0 (0.0%) |
| Legal Services & Support | 0 (0.0%) | 0 (0.0%) |
| Education Instruction & Library | 9 (52.9%) | 8 (47.1%) |
| Arts, Media & Entertainment | 0 (0.0%) | 0 (0.0%) |
| Health Diagnosing & Treating | 0 (0.0%) | 9 (100.0%) |
| Health Technologists | 0 (0.0%) | 0 (0.0%) |
| Total (Category) | 9 (34.6%) | 17 (65.4%) |
| Total (Overall) | 141 (70.2%) | 60 (29.8%) |
Services Occupations
Services Occupations by Sex
| Occupation | Male | Female |
| Healthcare Support | 0 (0.0%) | 0 (0.0%) |
| Security & Protection | 0 (0.0%) | 0 (0.0%) |
| Firefighting & Prevention | 0 (0.0%) | 0 (0.0%) |
| Law Enforcement | 0 (0.0%) | 0 (0.0%) |
| Food Preparation & Serving | 0 (0.0%) | 0 (0.0%) |
| Cleaning & Maintenance | 0 (0.0%) | 0 (0.0%) |
| Personal Care & Service | 0 (0.0%) | 0 (0.0%) |
| Total (Category) | 0 (0.0%) | 0 (0.0%) |
| Total (Overall) | 141 (70.2%) | 60 (29.8%) |
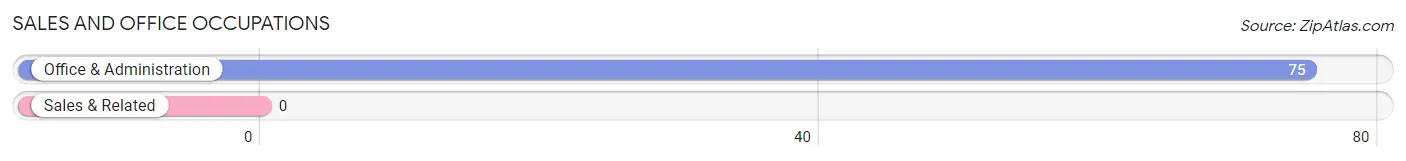
Sales and Office Occupations
The most common Sales and Office occupations in South Wallins are , and Office & Administration (75 | 37.3%).
Sales and Office Occupations by Sex
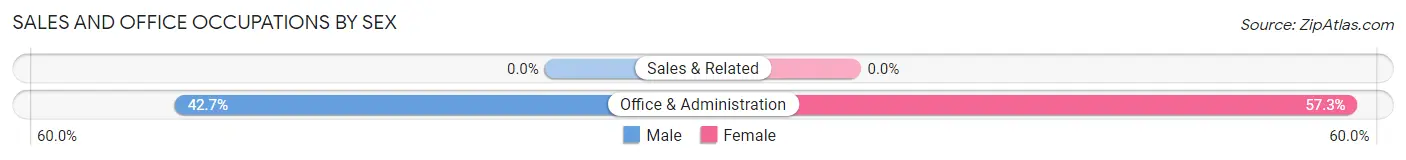
| Occupation | Male | Female |
| Sales & Related | 0 (0.0%) | 0 (0.0%) |
| Office & Administration | 32 (42.7%) | 43 (57.3%) |
| Total (Category) | 32 (42.7%) | 43 (57.3%) |
| Total (Overall) | 141 (70.2%) | 60 (29.8%) |
Natural Resources, Construction and Maintenance Occupations
The most common Natural Resources, Construction and Maintenance occupations in South Wallins are Installation, Maintenance & Repair (49 | 24.4%), Construction & Extraction (19 | 9.5%), and Farming, Fishing & Forestry (14 | 7.0%).
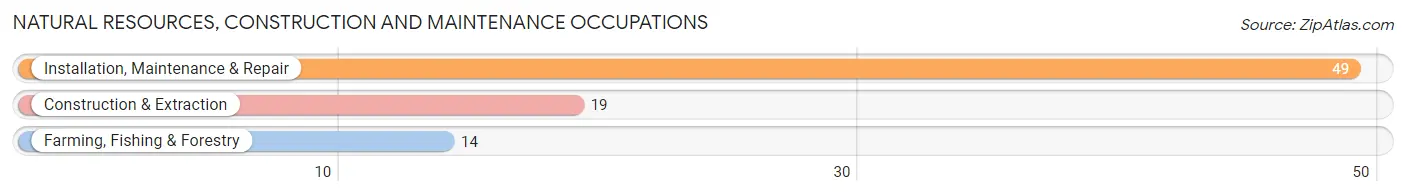
Natural Resources, Construction and Maintenance Occupations by Sex
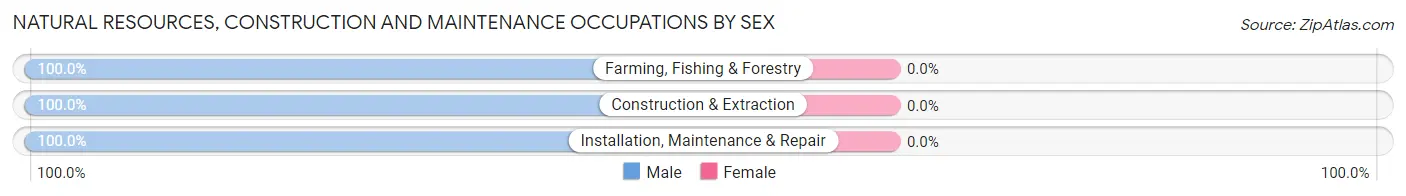
| Occupation | Male | Female |
| Farming, Fishing & Forestry | 14 (100.0%) | 0 (0.0%) |
| Construction & Extraction | 19 (100.0%) | 0 (0.0%) |
| Installation, Maintenance & Repair | 49 (100.0%) | 0 (0.0%) |
| Total (Category) | 82 (100.0%) | 0 (0.0%) |
| Total (Overall) | 141 (70.2%) | 60 (29.8%) |
Production, Transportation and Moving Occupations
The most common Production, Transportation and Moving occupations in South Wallins are , and Material Moving (18 | 9.0%).
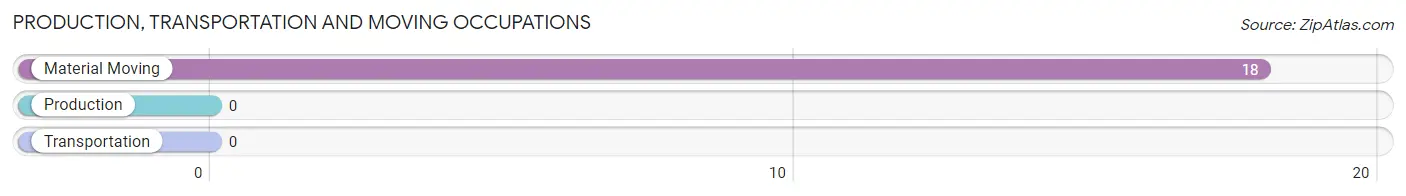
Production, Transportation and Moving Occupations by Sex
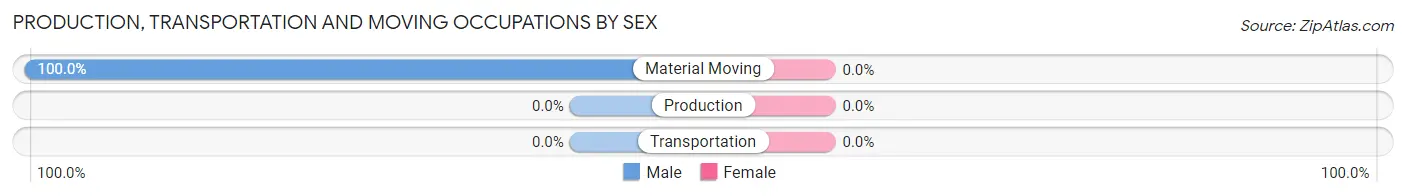
| Occupation | Male | Female |
| Production | 0 (0.0%) | 0 (0.0%) |
| Transportation | 0 (0.0%) | 0 (0.0%) |
| Material Moving | 18 (100.0%) | 0 (0.0%) |
| Total (Category) | 18 (100.0%) | 0 (0.0%) |
| Total (Overall) | 141 (70.2%) | 60 (29.8%) |
Employment Industries by Sex in South Wallins
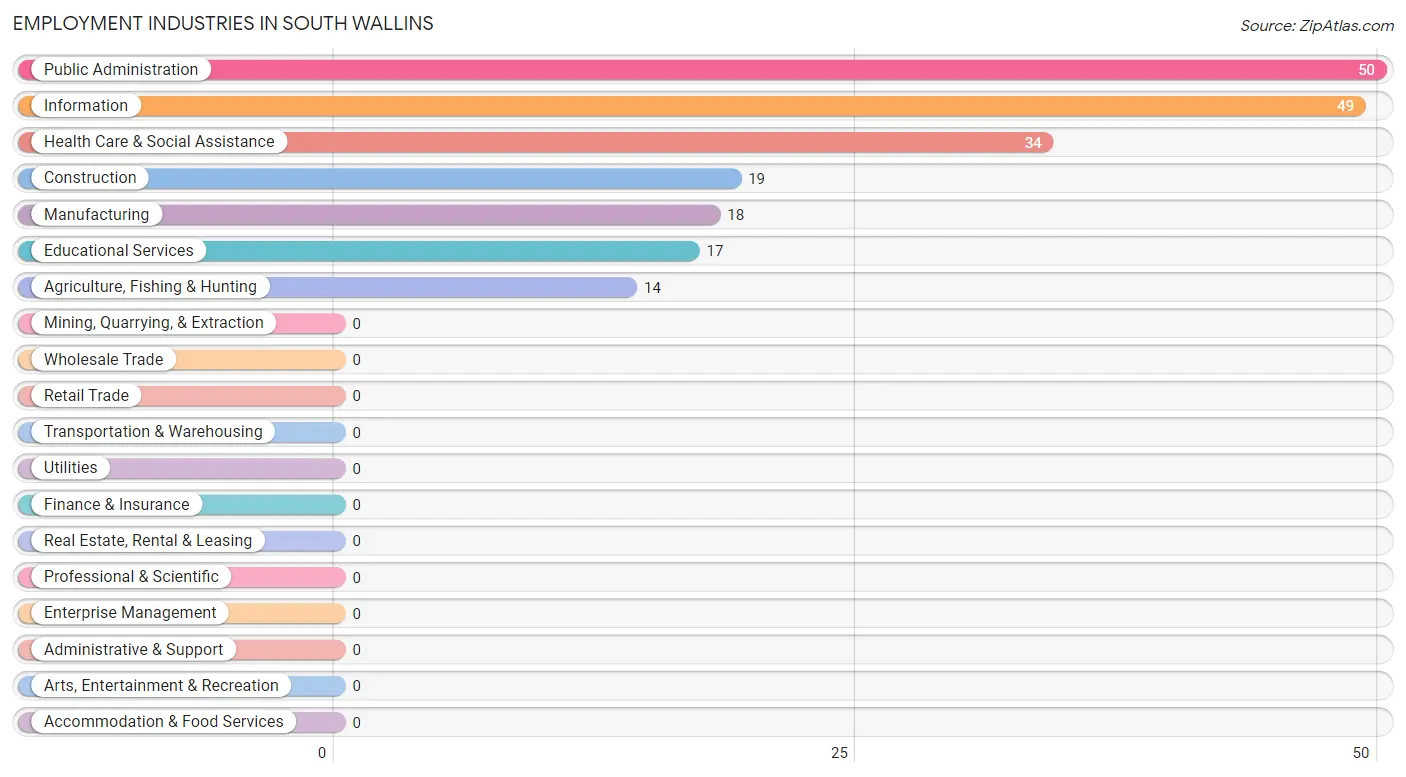
Employment Industries in South Wallins
The major employment industries in South Wallins include Public Administration (50 | 24.9%), Information (49 | 24.4%), Health Care & Social Assistance (34 | 16.9%), Construction (19 | 9.5%), and Manufacturing (18 | 9.0%).
Employment Industries by Sex in South Wallins
The South Wallins industries that see more men than women are Agriculture, Fishing & Hunting (100.0%), Construction (100.0%), and Manufacturing (100.0%), whereas the industries that tend to have a higher number of women are Health Care & Social Assistance (100.0%), Educational Services (47.1%), and Public Administration (36.0%).
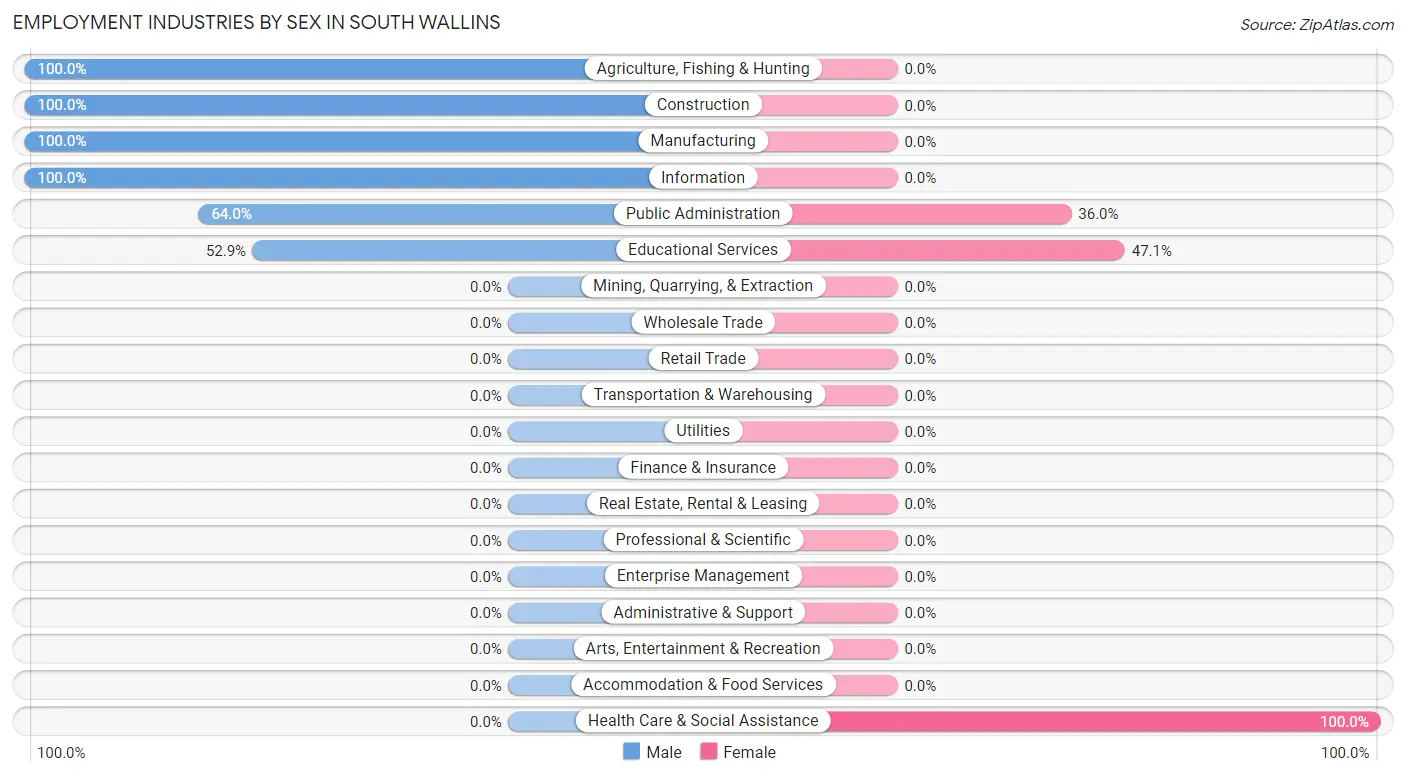
| Industry | Male | Female |
| Agriculture, Fishing & Hunting | 14 (100.0%) | 0 (0.0%) |
| Mining, Quarrying, & Extraction | 0 (0.0%) | 0 (0.0%) |
| Construction | 19 (100.0%) | 0 (0.0%) |
| Manufacturing | 18 (100.0%) | 0 (0.0%) |
| Wholesale Trade | 0 (0.0%) | 0 (0.0%) |
| Retail Trade | 0 (0.0%) | 0 (0.0%) |
| Transportation & Warehousing | 0 (0.0%) | 0 (0.0%) |
| Utilities | 0 (0.0%) | 0 (0.0%) |
| Information | 49 (100.0%) | 0 (0.0%) |
| Finance & Insurance | 0 (0.0%) | 0 (0.0%) |
| Real Estate, Rental & Leasing | 0 (0.0%) | 0 (0.0%) |
| Professional & Scientific | 0 (0.0%) | 0 (0.0%) |
| Enterprise Management | 0 (0.0%) | 0 (0.0%) |
| Administrative & Support | 0 (0.0%) | 0 (0.0%) |
| Educational Services | 9 (52.9%) | 8 (47.1%) |
| Health Care & Social Assistance | 0 (0.0%) | 34 (100.0%) |
| Arts, Entertainment & Recreation | 0 (0.0%) | 0 (0.0%) |
| Accommodation & Food Services | 0 (0.0%) | 0 (0.0%) |
| Public Administration | 32 (64.0%) | 18 (36.0%) |
| Total | 141 (70.2%) | 60 (29.8%) |
Education in South Wallins
School Enrollment in South Wallins
The most common levels of schooling among the 343 students in South Wallins are middle school (185 | 53.9%), elementary school (89 | 26.0%), and high school (61 | 17.8%).
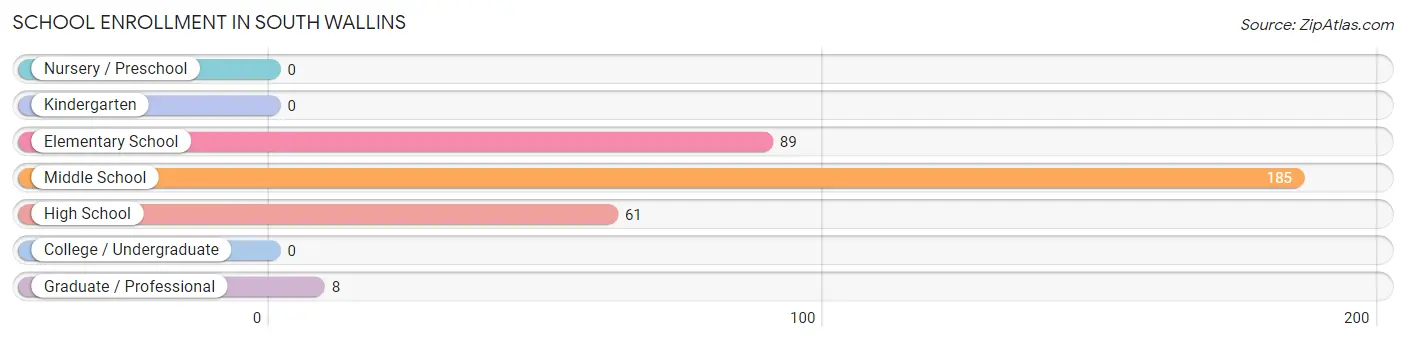
| School Level | # Students | % Students |
| Nursery / Preschool | 0 | 0.0% |
| Kindergarten | 0 | 0.0% |
| Elementary School | 89 | 26.0% |
| Middle School | 185 | 53.9% |
| High School | 61 | 17.8% |
| College / Undergraduate | 0 | 0.0% |
| Graduate / Professional | 8 | 2.3% |
| Total | 343 | 100.0% |
School Enrollment by Age by Funding Source in South Wallins
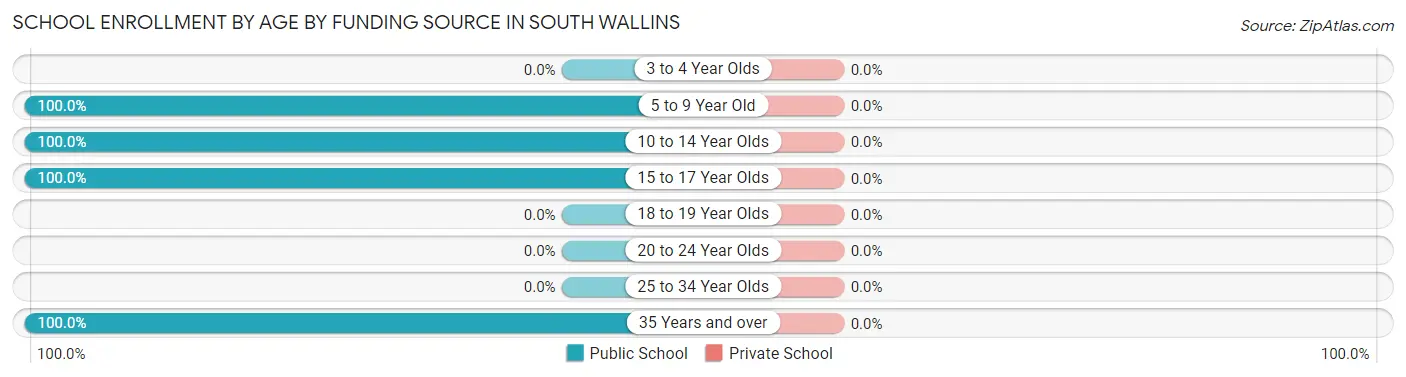
| Age Bracket | Public School | Private School |
| 3 to 4 Year Olds | 0 (0.0%) | 0 (0.0%) |
| 5 to 9 Year Old | 89 (100.0%) | 0 (0.0%) |
| 10 to 14 Year Olds | 176 (100.0%) | 0 (0.0%) |
| 15 to 17 Year Olds | 70 (100.0%) | 0 (0.0%) |
| 18 to 19 Year Olds | 0 (0.0%) | 0 (0.0%) |
| 20 to 24 Year Olds | 0 (0.0%) | 0 (0.0%) |
| 25 to 34 Year Olds | 0 (0.0%) | 0 (0.0%) |
| 35 Years and over | 8 (100.0%) | 0 (0.0%) |
| Total | 343 (100.0%) | 0 (0.0%) |
Educational Attainment by Field of Study in South Wallins
Education (36 | 48.6%), business (30 | 40.5%), and social sciences (8 | 10.8%) are the most common fields of study among 74 individuals in South Wallins who have obtained a bachelor's degree or higher.
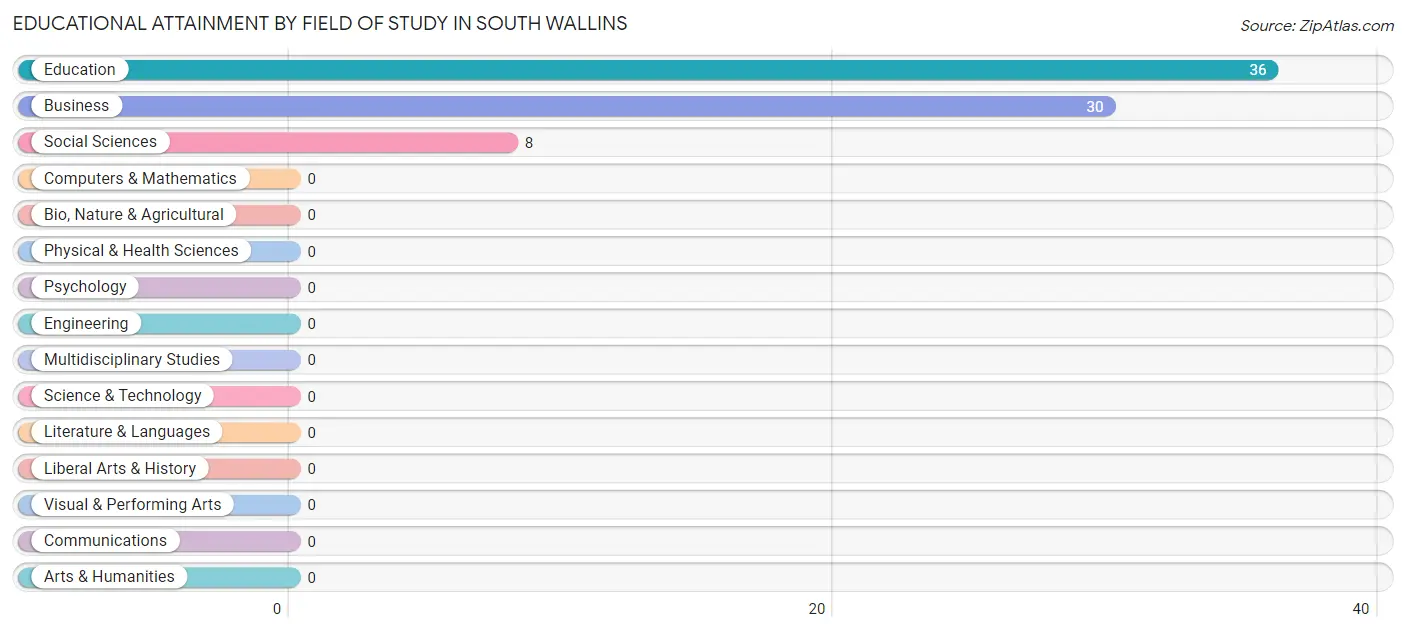
| Field of Study | # Graduates | % Graduates |
| Computers & Mathematics | 0 | 0.0% |
| Bio, Nature & Agricultural | 0 | 0.0% |
| Physical & Health Sciences | 0 | 0.0% |
| Psychology | 0 | 0.0% |
| Social Sciences | 8 | 10.8% |
| Engineering | 0 | 0.0% |
| Multidisciplinary Studies | 0 | 0.0% |
| Science & Technology | 0 | 0.0% |
| Business | 30 | 40.5% |
| Education | 36 | 48.6% |
| Literature & Languages | 0 | 0.0% |
| Liberal Arts & History | 0 | 0.0% |
| Visual & Performing Arts | 0 | 0.0% |
| Communications | 0 | 0.0% |
| Arts & Humanities | 0 | 0.0% |
| Total | 74 | 100.0% |
Transportation & Commute in South Wallins
Vehicle Availability by Sex in South Wallins
The most prevalent vehicle ownership categories in South Wallins are males with 2 vehicles (72, accounting for 51.1%) and females with 2 vehicles (33, making up 120.0%).
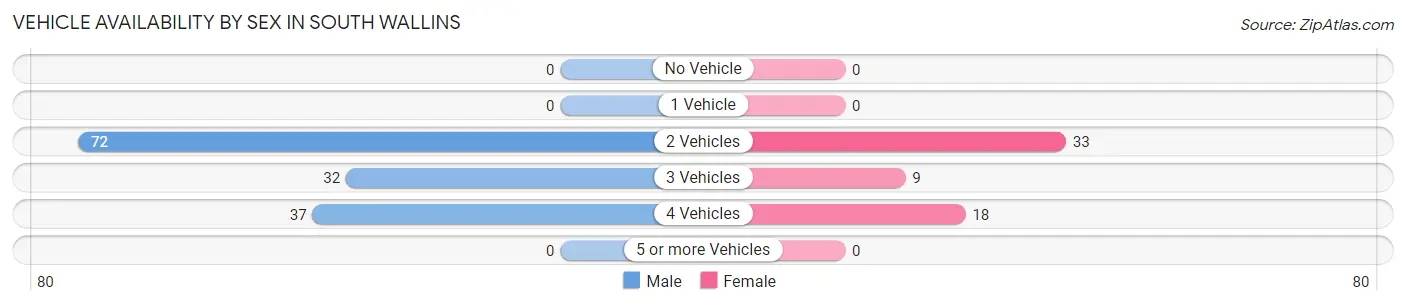
| Vehicles Available | Male | Female |
| No Vehicle | 0 (0.0%) | 0 (0.0%) |
| 1 Vehicle | 0 (0.0%) | 0 (0.0%) |
| 2 Vehicles | 72 (51.1%) | 33 (55.0%) |
| 3 Vehicles | 32 (22.7%) | 9 (15.0%) |
| 4 Vehicles | 37 (26.2%) | 18 (30.0%) |
| 5 or more Vehicles | 0 (0.0%) | 0 (0.0%) |
| Total | 141 (100.0%) | 60 (100.0%) |
Commute Time in South Wallins
The most frequently occuring commute durations in South Wallins are 15 to 19 minutes (87 commuters, 43.3%), 90 or more minutes (49 commuters, 24.4%), and 10 to 14 minutes (25 commuters, 12.4%).
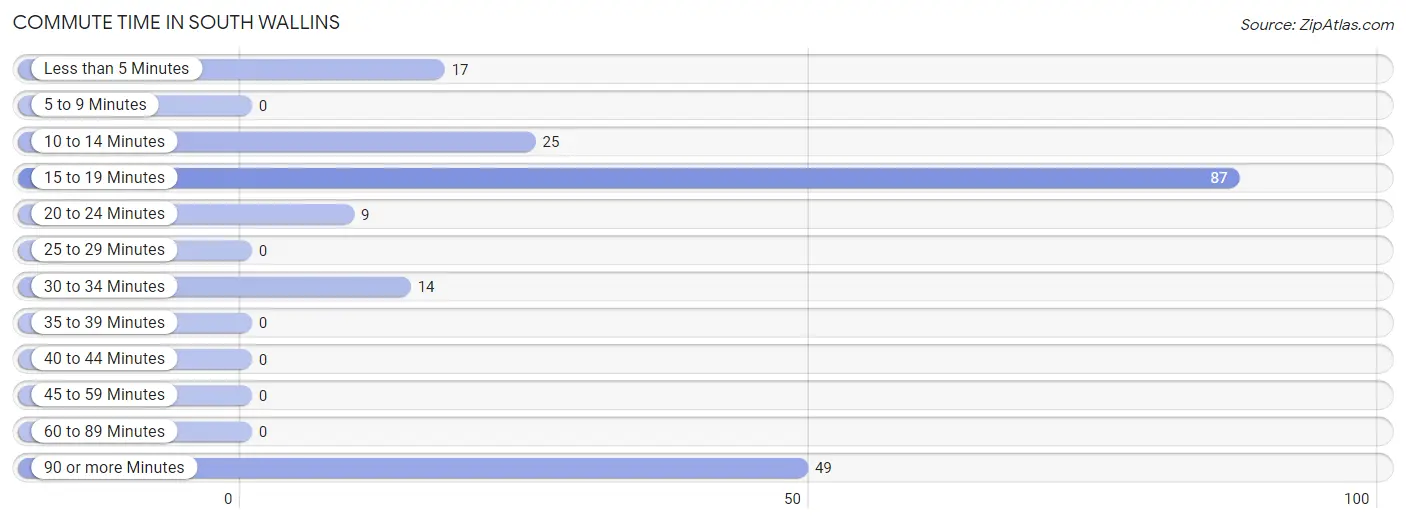
| Commute Time | # Commuters | % Commuters |
| Less than 5 Minutes | 17 | 8.5% |
| 5 to 9 Minutes | 0 | 0.0% |
| 10 to 14 Minutes | 25 | 12.4% |
| 15 to 19 Minutes | 87 | 43.3% |
| 20 to 24 Minutes | 9 | 4.5% |
| 25 to 29 Minutes | 0 | 0.0% |
| 30 to 34 Minutes | 14 | 7.0% |
| 35 to 39 Minutes | 0 | 0.0% |
| 40 to 44 Minutes | 0 | 0.0% |
| 45 to 59 Minutes | 0 | 0.0% |
| 60 to 89 Minutes | 0 | 0.0% |
| 90 or more Minutes | 49 | 24.4% |
Commute Time by Sex in South Wallins
The most common commute times in South Wallins are 15 to 19 minutes (69 commuters, 48.9%) for males and 10 to 14 minutes (25 commuters, 41.7%) for females.
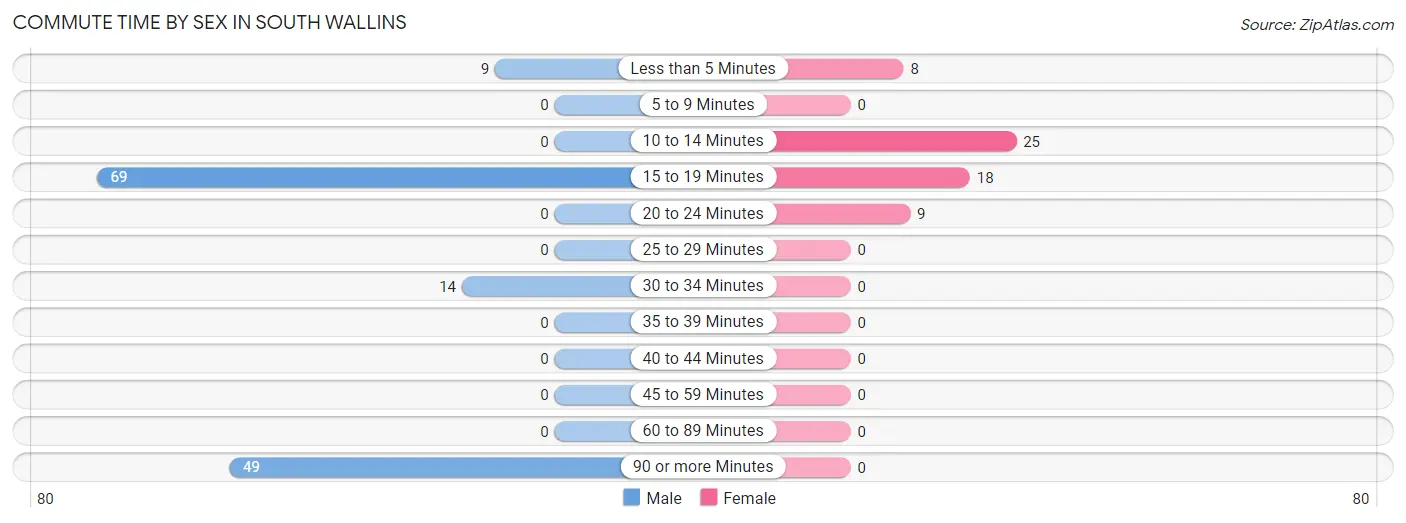
| Commute Time | Male | Female |
| Less than 5 Minutes | 9 (6.4%) | 8 (13.3%) |
| 5 to 9 Minutes | 0 (0.0%) | 0 (0.0%) |
| 10 to 14 Minutes | 0 (0.0%) | 25 (41.7%) |
| 15 to 19 Minutes | 69 (48.9%) | 18 (30.0%) |
| 20 to 24 Minutes | 0 (0.0%) | 9 (15.0%) |
| 25 to 29 Minutes | 0 (0.0%) | 0 (0.0%) |
| 30 to 34 Minutes | 14 (9.9%) | 0 (0.0%) |
| 35 to 39 Minutes | 0 (0.0%) | 0 (0.0%) |
| 40 to 44 Minutes | 0 (0.0%) | 0 (0.0%) |
| 45 to 59 Minutes | 0 (0.0%) | 0 (0.0%) |
| 60 to 89 Minutes | 0 (0.0%) | 0 (0.0%) |
| 90 or more Minutes | 49 (34.7%) | 0 (0.0%) |
Time of Departure to Work by Sex in South Wallins
The most frequent times of departure to work in South Wallins are 12:00 PM to 3:59 PM (49, 34.7%) for males and 7:00 AM to 7:29 AM (33, 55.0%) for females.
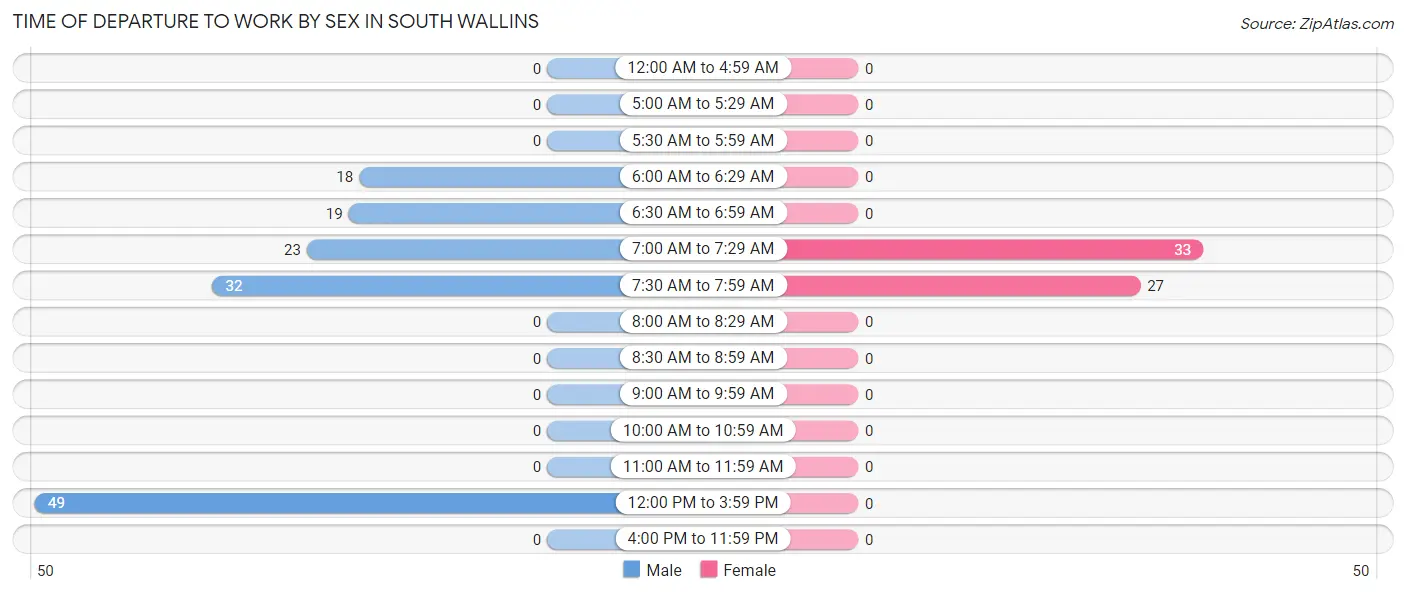
| Time of Departure | Male | Female |
| 12:00 AM to 4:59 AM | 0 (0.0%) | 0 (0.0%) |
| 5:00 AM to 5:29 AM | 0 (0.0%) | 0 (0.0%) |
| 5:30 AM to 5:59 AM | 0 (0.0%) | 0 (0.0%) |
| 6:00 AM to 6:29 AM | 18 (12.8%) | 0 (0.0%) |
| 6:30 AM to 6:59 AM | 19 (13.5%) | 0 (0.0%) |
| 7:00 AM to 7:29 AM | 23 (16.3%) | 33 (55.0%) |
| 7:30 AM to 7:59 AM | 32 (22.7%) | 27 (45.0%) |
| 8:00 AM to 8:29 AM | 0 (0.0%) | 0 (0.0%) |
| 8:30 AM to 8:59 AM | 0 (0.0%) | 0 (0.0%) |
| 9:00 AM to 9:59 AM | 0 (0.0%) | 0 (0.0%) |
| 10:00 AM to 10:59 AM | 0 (0.0%) | 0 (0.0%) |
| 11:00 AM to 11:59 AM | 0 (0.0%) | 0 (0.0%) |
| 12:00 PM to 3:59 PM | 49 (34.7%) | 0 (0.0%) |
| 4:00 PM to 11:59 PM | 0 (0.0%) | 0 (0.0%) |
| Total | 141 (100.0%) | 60 (100.0%) |
Housing Occupancy in South Wallins
Occupancy by Ownership in South Wallins
Of the total 322 dwellings in South Wallins, owner-occupied units account for 218 (67.7%), while renter-occupied units make up 104 (32.3%).
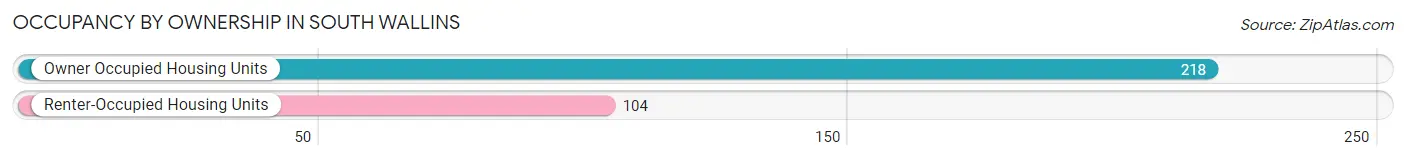
| Occupancy | # Housing Units | % Housing Units |
| Owner Occupied Housing Units | 218 | 67.7% |
| Renter-Occupied Housing Units | 104 | 32.3% |
| Total Occupied Housing Units | 322 | 100.0% |
Occupancy by Household Size in South Wallins
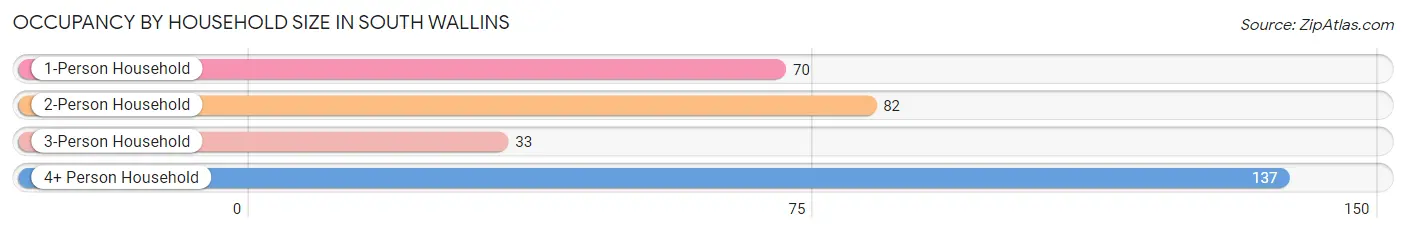
| Household Size | # Housing Units | % Housing Units |
| 1-Person Household | 70 | 21.7% |
| 2-Person Household | 82 | 25.5% |
| 3-Person Household | 33 | 10.2% |
| 4+ Person Household | 137 | 42.5% |
| Total Housing Units | 322 | 100.0% |
Occupancy by Ownership by Household Size in South Wallins
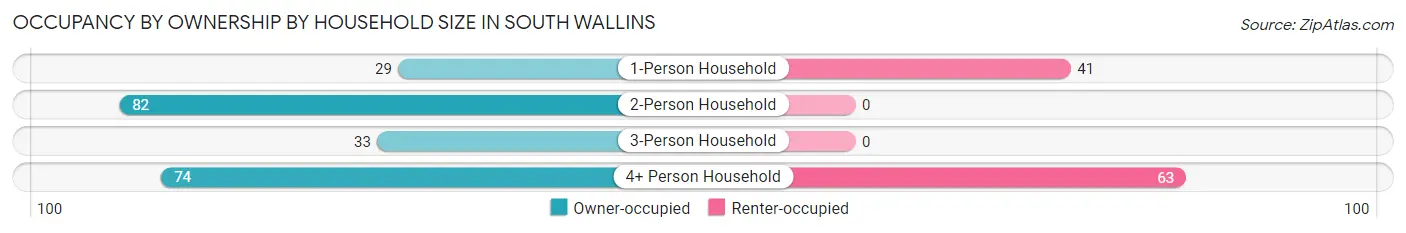
| Household Size | Owner-occupied | Renter-occupied |
| 1-Person Household | 29 (41.4%) | 41 (58.6%) |
| 2-Person Household | 82 (100.0%) | 0 (0.0%) |
| 3-Person Household | 33 (100.0%) | 0 (0.0%) |
| 4+ Person Household | 74 (54.0%) | 63 (46.0%) |
| Total Housing Units | 218 (67.7%) | 104 (32.3%) |
Occupancy by Educational Attainment in South Wallins
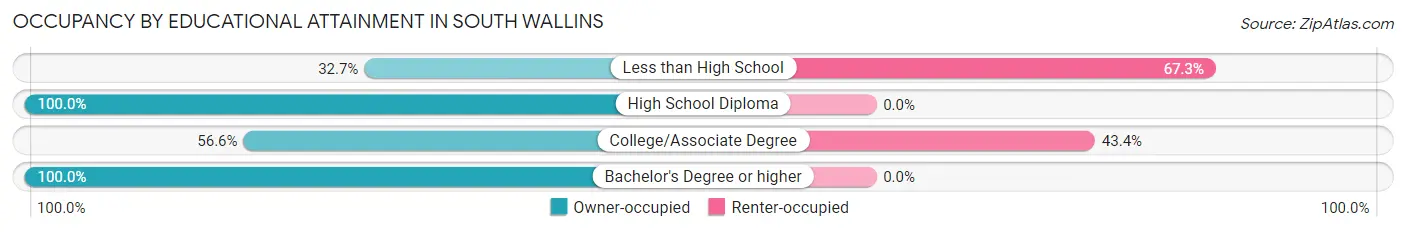
| Household Size | Owner-occupied | Renter-occupied |
| Less than High School | 33 (32.7%) | 68 (67.3%) |
| High School Diploma | 81 (100.0%) | 0 (0.0%) |
| College/Associate Degree | 47 (56.6%) | 36 (43.4%) |
| Bachelor's Degree or higher | 57 (100.0%) | 0 (0.0%) |
Occupancy by Age of Householder in South Wallins
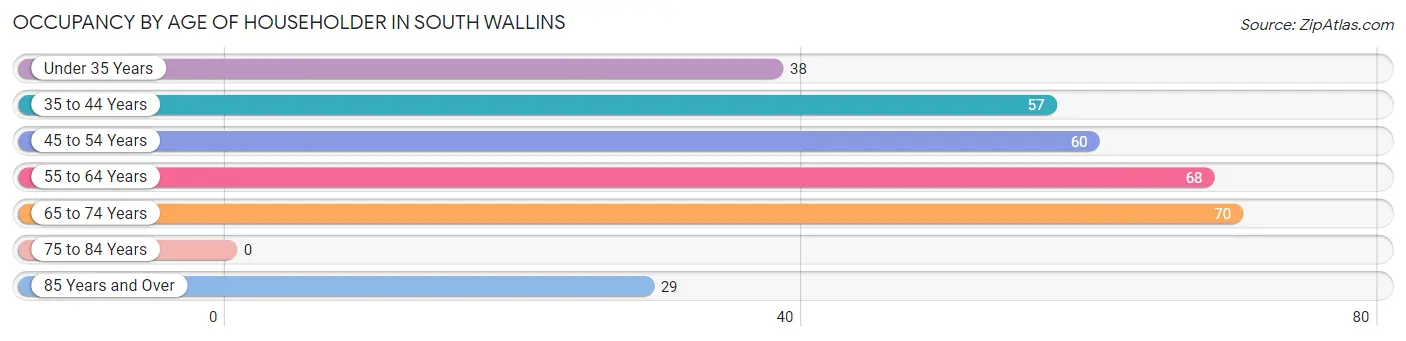
| Age Bracket | # Households | % Households |
| Under 35 Years | 38 | 11.8% |
| 35 to 44 Years | 57 | 17.7% |
| 45 to 54 Years | 60 | 18.6% |
| 55 to 64 Years | 68 | 21.1% |
| 65 to 74 Years | 70 | 21.7% |
| 75 to 84 Years | 0 | 0.0% |
| 85 Years and Over | 29 | 9.0% |
| Total | 322 | 100.0% |
Housing Finances in South Wallins
Median Income by Occupancy in South Wallins
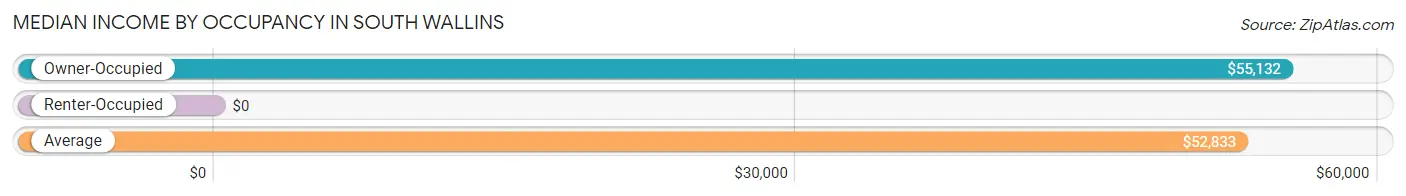
| Occupancy Type | # Households | Median Income |
| Owner-Occupied | 218 (67.7%) | $55,132 |
| Renter-Occupied | 104 (32.3%) | $0 |
| Average | 322 (100.0%) | $52,833 |
Occupancy by Householder Income Bracket in South Wallins
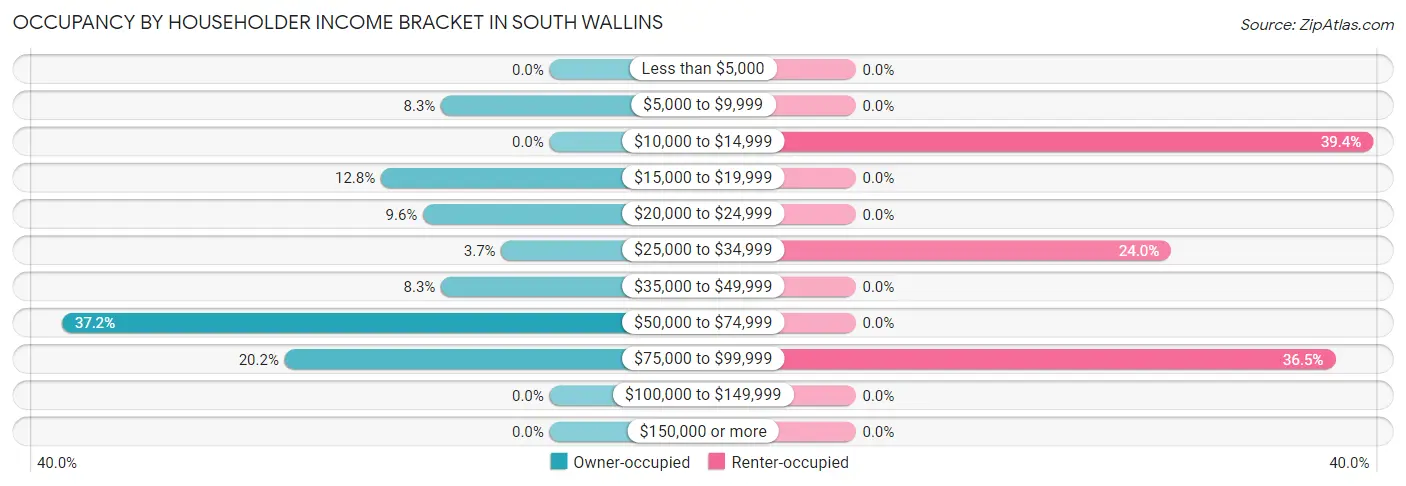
| Income Bracket | Owner-occupied | Renter-occupied |
| Less than $5,000 | 0 (0.0%) | 0 (0.0%) |
| $5,000 to $9,999 | 18 (8.3%) | 0 (0.0%) |
| $10,000 to $14,999 | 0 (0.0%) | 41 (39.4%) |
| $15,000 to $19,999 | 28 (12.8%) | 0 (0.0%) |
| $20,000 to $24,999 | 21 (9.6%) | 0 (0.0%) |
| $25,000 to $34,999 | 8 (3.7%) | 25 (24.0%) |
| $35,000 to $49,999 | 18 (8.3%) | 0 (0.0%) |
| $50,000 to $74,999 | 81 (37.2%) | 0 (0.0%) |
| $75,000 to $99,999 | 44 (20.2%) | 38 (36.5%) |
| $100,000 to $149,999 | 0 (0.0%) | 0 (0.0%) |
| $150,000 or more | 0 (0.0%) | 0 (0.0%) |
| Total | 218 (100.0%) | 104 (100.0%) |
Monthly Housing Cost Tiers in South Wallins
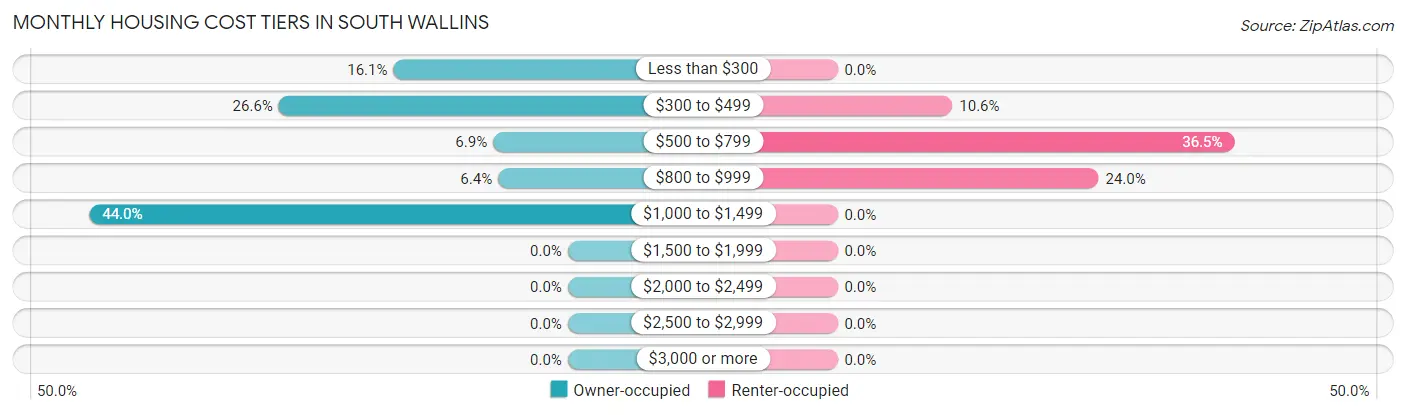
| Monthly Cost | Owner-occupied | Renter-occupied |
| Less than $300 | 35 (16.1%) | 0 (0.0%) |
| $300 to $499 | 58 (26.6%) | 11 (10.6%) |
| $500 to $799 | 15 (6.9%) | 38 (36.5%) |
| $800 to $999 | 14 (6.4%) | 25 (24.0%) |
| $1,000 to $1,499 | 96 (44.0%) | 0 (0.0%) |
| $1,500 to $1,999 | 0 (0.0%) | 0 (0.0%) |
| $2,000 to $2,499 | 0 (0.0%) | 0 (0.0%) |
| $2,500 to $2,999 | 0 (0.0%) | 0 (0.0%) |
| $3,000 or more | 0 (0.0%) | 0 (0.0%) |
| Total | 218 (100.0%) | 104 (100.0%) |
Physical Housing Characteristics in South Wallins
Housing Structures in South Wallins
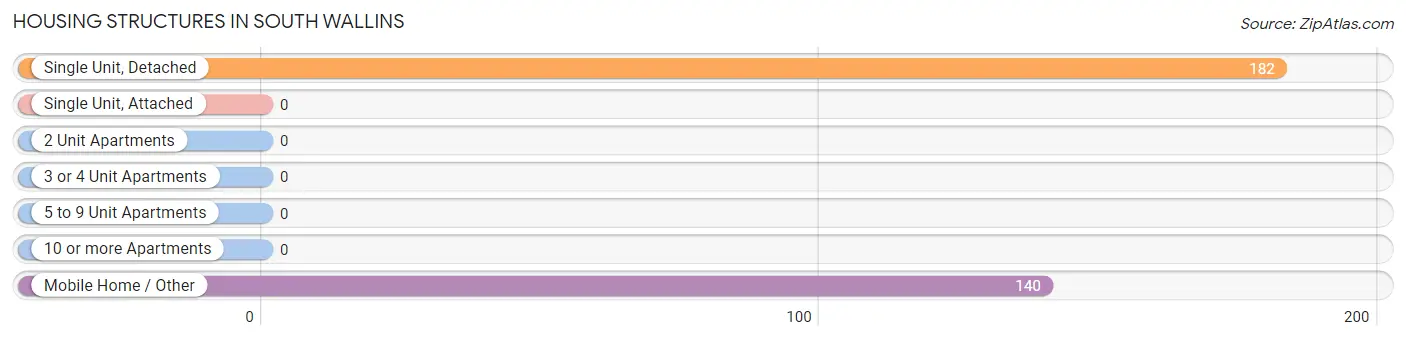
| Structure Type | # Housing Units | % Housing Units |
| Single Unit, Detached | 182 | 56.5% |
| Single Unit, Attached | 0 | 0.0% |
| 2 Unit Apartments | 0 | 0.0% |
| 3 or 4 Unit Apartments | 0 | 0.0% |
| 5 to 9 Unit Apartments | 0 | 0.0% |
| 10 or more Apartments | 0 | 0.0% |
| Mobile Home / Other | 140 | 43.5% |
| Total | 322 | 100.0% |
Housing Structures by Occupancy in South Wallins
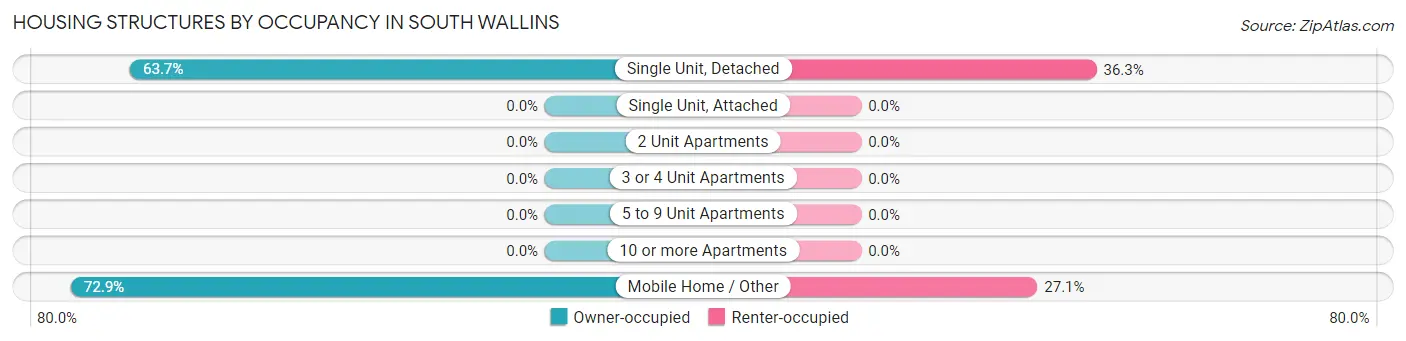
| Structure Type | Owner-occupied | Renter-occupied |
| Single Unit, Detached | 116 (63.7%) | 66 (36.3%) |
| Single Unit, Attached | 0 (0.0%) | 0 (0.0%) |
| 2 Unit Apartments | 0 (0.0%) | 0 (0.0%) |
| 3 or 4 Unit Apartments | 0 (0.0%) | 0 (0.0%) |
| 5 to 9 Unit Apartments | 0 (0.0%) | 0 (0.0%) |
| 10 or more Apartments | 0 (0.0%) | 0 (0.0%) |
| Mobile Home / Other | 102 (72.9%) | 38 (27.1%) |
| Total | 218 (67.7%) | 104 (32.3%) |
Housing Structures by Number of Rooms in South Wallins
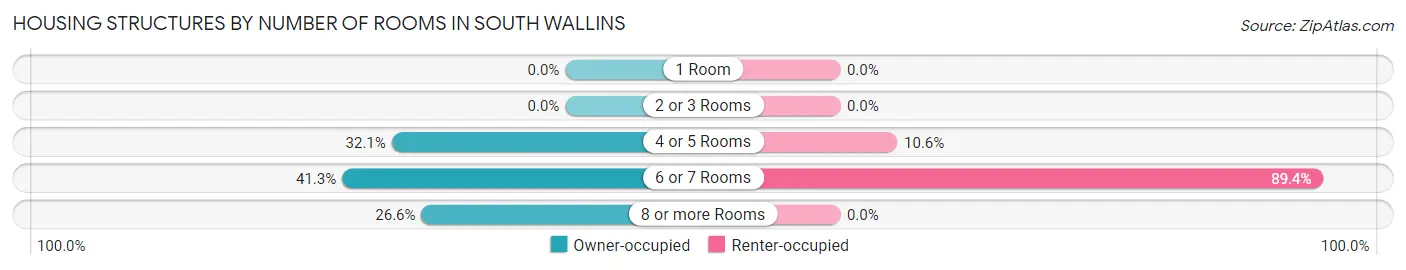
| Number of Rooms | Owner-occupied | Renter-occupied |
| 1 Room | 0 (0.0%) | 0 (0.0%) |
| 2 or 3 Rooms | 0 (0.0%) | 0 (0.0%) |
| 4 or 5 Rooms | 70 (32.1%) | 11 (10.6%) |
| 6 or 7 Rooms | 90 (41.3%) | 93 (89.4%) |
| 8 or more Rooms | 58 (26.6%) | 0 (0.0%) |
| Total | 218 (100.0%) | 104 (100.0%) |
Housing Structure by Heating Type in South Wallins
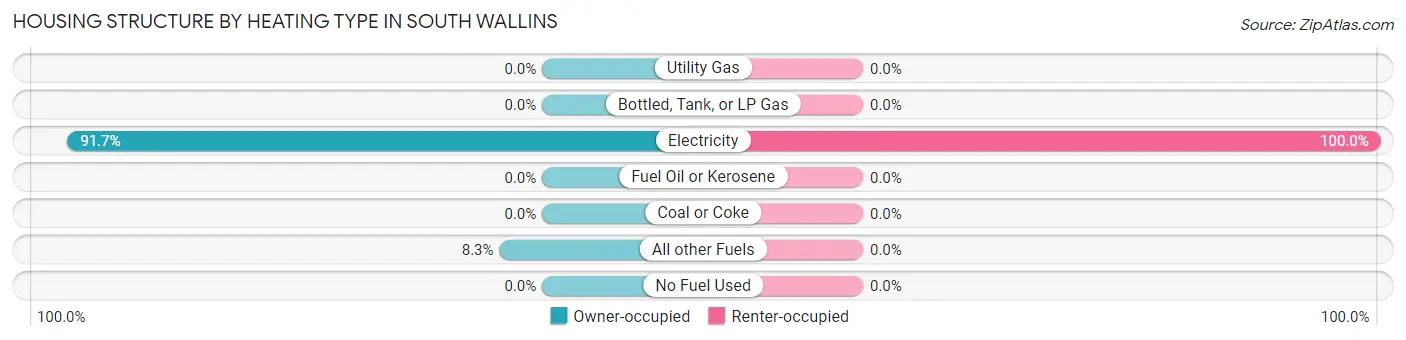
| Heating Type | Owner-occupied | Renter-occupied |
| Utility Gas | 0 (0.0%) | 0 (0.0%) |
| Bottled, Tank, or LP Gas | 0 (0.0%) | 0 (0.0%) |
| Electricity | 200 (91.7%) | 104 (100.0%) |
| Fuel Oil or Kerosene | 0 (0.0%) | 0 (0.0%) |
| Coal or Coke | 0 (0.0%) | 0 (0.0%) |
| All other Fuels | 18 (8.3%) | 0 (0.0%) |
| No Fuel Used | 0 (0.0%) | 0 (0.0%) |
| Total | 218 (100.0%) | 104 (100.0%) |
Household Vehicle Usage in South Wallins
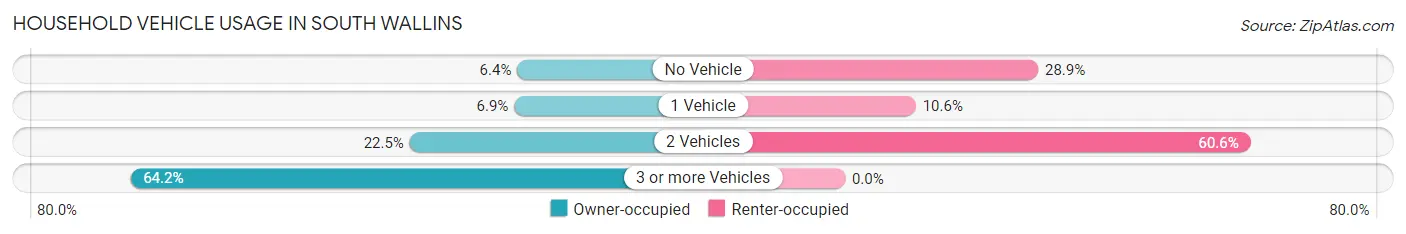
| Vehicles per Household | Owner-occupied | Renter-occupied |
| No Vehicle | 14 (6.4%) | 30 (28.8%) |
| 1 Vehicle | 15 (6.9%) | 11 (10.6%) |
| 2 Vehicles | 49 (22.5%) | 63 (60.6%) |
| 3 or more Vehicles | 140 (64.2%) | 0 (0.0%) |
| Total | 218 (100.0%) | 104 (100.0%) |
Real Estate & Mortgages in South Wallins
Real Estate and Mortgage Overview in South Wallins
| Characteristic | Without Mortgage | With Mortgage |
| Housing Units | 72 | 146 |
| Median Property Value | $71,300 | $57,500 |
| Median Household Income | $49,444 | $0 |
| Monthly Housing Costs | $356 | $0 |
| Real Estate Taxes | - | - |
Property Value by Mortgage Status in South Wallins
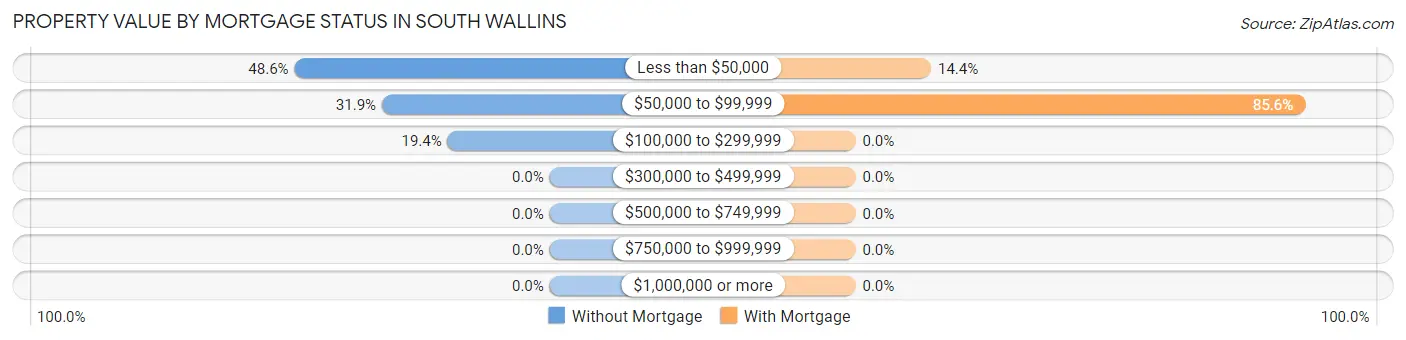
| Property Value | Without Mortgage | With Mortgage |
| Less than $50,000 | 35 (48.6%) | 21 (14.4%) |
| $50,000 to $99,999 | 23 (31.9%) | 125 (85.6%) |
| $100,000 to $299,999 | 14 (19.4%) | 0 (0.0%) |
| $300,000 to $499,999 | 0 (0.0%) | 0 (0.0%) |
| $500,000 to $749,999 | 0 (0.0%) | 0 (0.0%) |
| $750,000 to $999,999 | 0 (0.0%) | 0 (0.0%) |
| $1,000,000 or more | 0 (0.0%) | 0 (0.0%) |
| Total | 72 (100.0%) | 146 (100.0%) |
Household Income by Mortgage Status in South Wallins
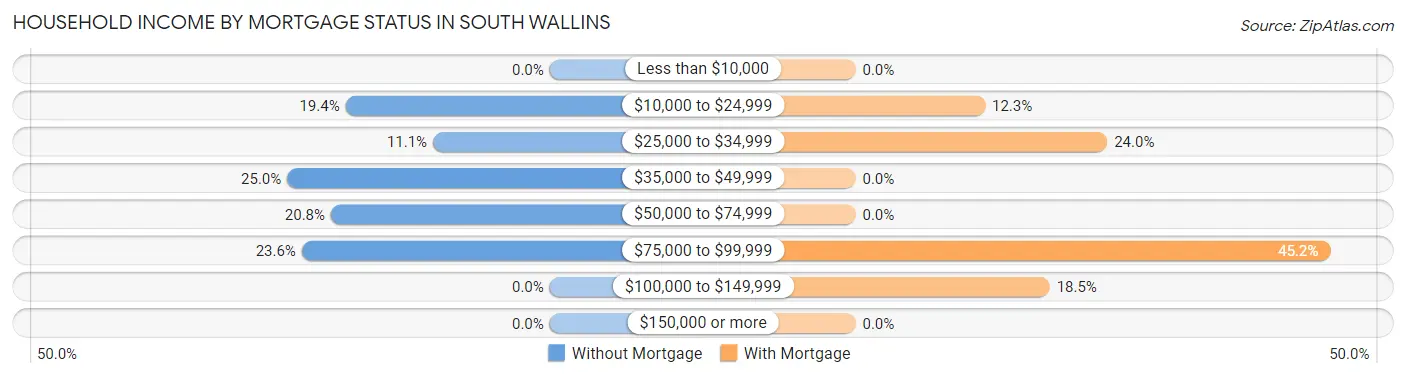
| Household Income | Without Mortgage | With Mortgage |
| Less than $10,000 | 0 (0.0%) | 0 (0.0%) |
| $10,000 to $24,999 | 14 (19.4%) | 18 (12.3%) |
| $25,000 to $34,999 | 8 (11.1%) | 35 (24.0%) |
| $35,000 to $49,999 | 18 (25.0%) | 0 (0.0%) |
| $50,000 to $74,999 | 15 (20.8%) | 0 (0.0%) |
| $75,000 to $99,999 | 17 (23.6%) | 66 (45.2%) |
| $100,000 to $149,999 | 0 (0.0%) | 27 (18.5%) |
| $150,000 or more | 0 (0.0%) | 0 (0.0%) |
| Total | 72 (100.0%) | 146 (100.0%) |
Property Value to Household Income Ratio in South Wallins
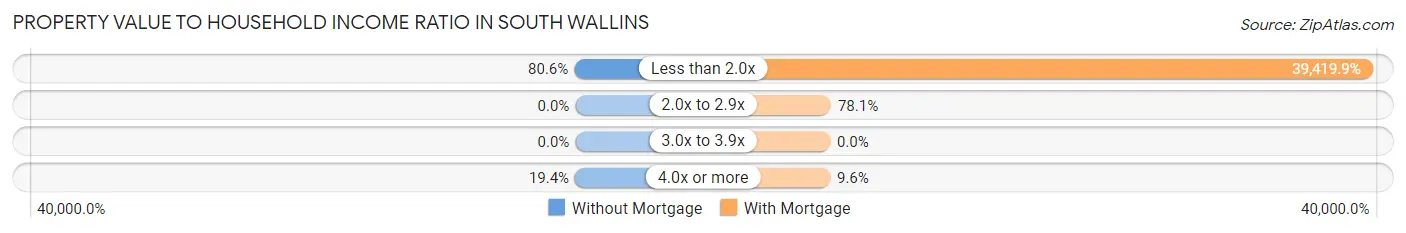
| Value-to-Income Ratio | Without Mortgage | With Mortgage |
| Less than 2.0x | 58 (80.6%) | 57,553 (39,419.9%) |
| 2.0x to 2.9x | 0 (0.0%) | 114 (78.1%) |
| 3.0x to 3.9x | 0 (0.0%) | 0 (0.0%) |
| 4.0x or more | 14 (19.4%) | 14 (9.6%) |
| Total | 72 (100.0%) | 146 (100.0%) |
Real Estate Taxes by Mortgage Status in South Wallins
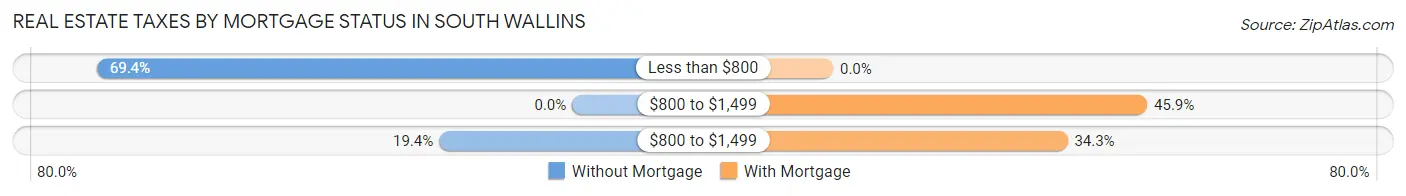
| Property Taxes | Without Mortgage | With Mortgage |
| Less than $800 | 50 (69.4%) | 0 (0.0%) |
| $800 to $1,499 | 0 (0.0%) | 67 (45.9%) |
| $800 to $1,499 | 14 (19.4%) | 50 (34.3%) |
| Total | 72 (100.0%) | 146 (100.0%) |
Health & Disability in South Wallins
Health Insurance Coverage by Age in South Wallins
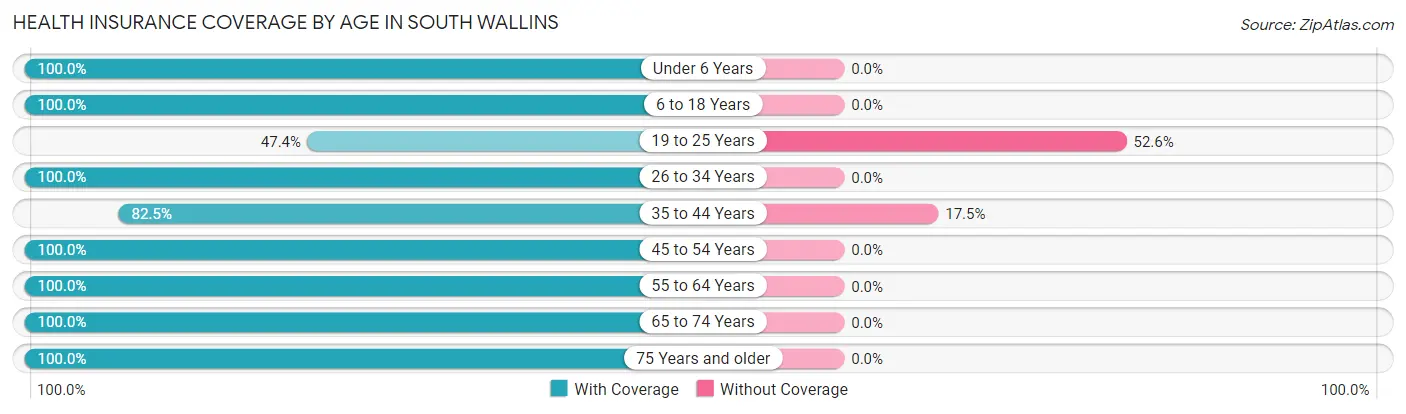
| Age Bracket | With Coverage | Without Coverage |
| Under 6 Years | 26 (100.0%) | 0 (0.0%) |
| 6 to 18 Years | 335 (100.0%) | 0 (0.0%) |
| 19 to 25 Years | 18 (47.4%) | 20 (52.6%) |
| 26 to 34 Years | 126 (100.0%) | 0 (0.0%) |
| 35 to 44 Years | 80 (82.5%) | 17 (17.5%) |
| 45 to 54 Years | 94 (100.0%) | 0 (0.0%) |
| 55 to 64 Years | 111 (100.0%) | 0 (0.0%) |
| 65 to 74 Years | 120 (100.0%) | 0 (0.0%) |
| 75 Years and older | 29 (100.0%) | 0 (0.0%) |
| Total | 939 (96.2%) | 37 (3.8%) |
Health Insurance Coverage by Citizenship Status in South Wallins
| Citizenship Status | With Coverage | Without Coverage |
| Native Born | 26 (100.0%) | 0 (0.0%) |
| Foreign Born, Citizen | 335 (100.0%) | 0 (0.0%) |
| Foreign Born, not a Citizen | 18 (47.4%) | 20 (52.6%) |
Health Insurance Coverage by Household Income in South Wallins
| Household Income | With Coverage | Without Coverage |
| Under $25,000 | 187 (90.3%) | 20 (9.7%) |
| $25,000 to $49,999 | 167 (100.0%) | 0 (0.0%) |
| $50,000 to $74,999 | 327 (95.1%) | 17 (4.9%) |
| $75,000 to $99,999 | 258 (100.0%) | 0 (0.0%) |
| $100,000 and over | 0 (0.0%) | 0 (0.0%) |
Public vs Private Health Insurance Coverage by Age in South Wallins
| Age Bracket | Public Insurance | Private Insurance |
| Under 6 | 26 (100.0%) | 0 (0.0%) |
| 6 to 18 Years | 249 (74.3%) | 86 (25.7%) |
| 19 to 25 Years | 18 (47.4%) | 0 (0.0%) |
| 25 to 34 Years | 39 (30.9%) | 87 (69.1%) |
| 35 to 44 Years | 39 (40.2%) | 41 (42.3%) |
| 45 to 54 Years | 34 (36.2%) | 60 (63.8%) |
| 55 to 64 Years | 92 (82.9%) | 43 (38.7%) |
| 65 to 74 Years | 120 (100.0%) | 104 (86.7%) |
| 75 Years and over | 29 (100.0%) | 0 (0.0%) |
| Total | 646 (66.2%) | 421 (43.1%) |
Disability Status by Sex by Age in South Wallins
| Age Bracket | Male | Female |
| Under 5 Years | 0 (0.0%) | 0 (0.0%) |
| 5 to 17 Years | 0 (0.0%) | 0 (0.0%) |
| 18 to 34 Years | 0 (0.0%) | 0 (0.0%) |
| 35 to 64 Years | 0 (0.0%) | 30 (16.4%) |
| 65 to 74 Years | 36 (51.4%) | 41 (82.0%) |
| 75 Years and over | 14 (48.3%) | 0 (0.0%) |
Disability Class by Sex by Age in South Wallins
Disability Class: Hearing Difficulty
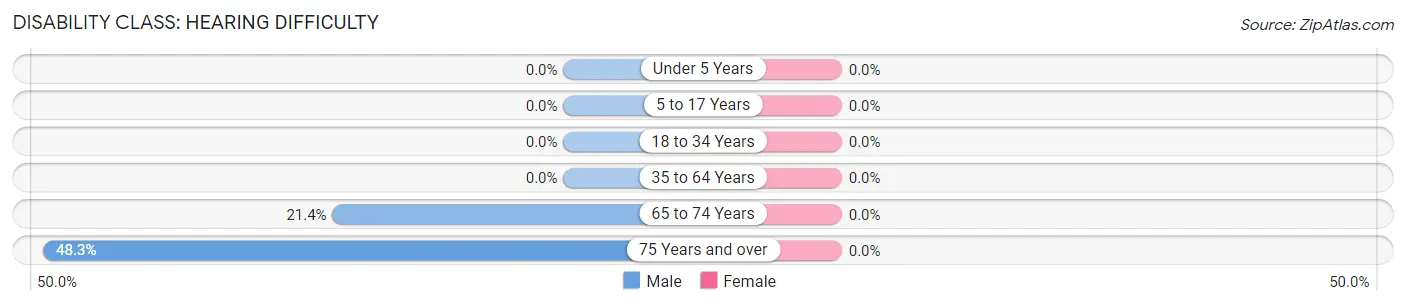
| Age Bracket | Male | Female |
| Under 5 Years | 0 (0.0%) | 0 (0.0%) |
| 5 to 17 Years | 0 (0.0%) | 0 (0.0%) |
| 18 to 34 Years | 0 (0.0%) | 0 (0.0%) |
| 35 to 64 Years | 0 (0.0%) | 0 (0.0%) |
| 65 to 74 Years | 15 (21.4%) | 0 (0.0%) |
| 75 Years and over | 14 (48.3%) | 0 (0.0%) |
Disability Class: Vision Difficulty
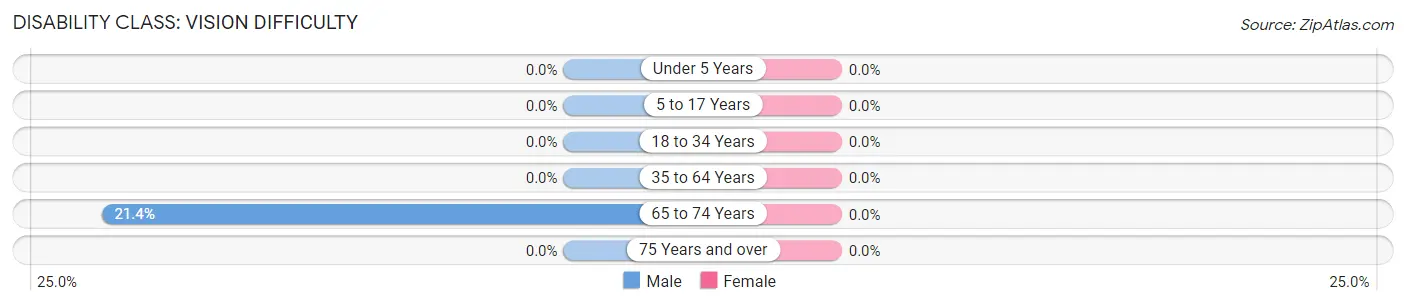
| Age Bracket | Male | Female |
| Under 5 Years | 0 (0.0%) | 0 (0.0%) |
| 5 to 17 Years | 0 (0.0%) | 0 (0.0%) |
| 18 to 34 Years | 0 (0.0%) | 0 (0.0%) |
| 35 to 64 Years | 0 (0.0%) | 0 (0.0%) |
| 65 to 74 Years | 15 (21.4%) | 0 (0.0%) |
| 75 Years and over | 0 (0.0%) | 0 (0.0%) |
Disability Class: Cognitive Difficulty
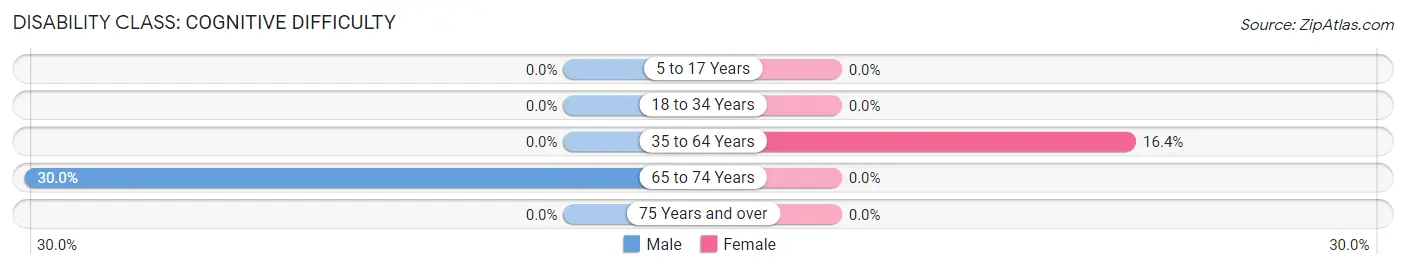
| Age Bracket | Male | Female |
| 5 to 17 Years | 0 (0.0%) | 0 (0.0%) |
| 18 to 34 Years | 0 (0.0%) | 0 (0.0%) |
| 35 to 64 Years | 0 (0.0%) | 30 (16.4%) |
| 65 to 74 Years | 21 (30.0%) | 0 (0.0%) |
| 75 Years and over | 0 (0.0%) | 0 (0.0%) |
Disability Class: Ambulatory Difficulty
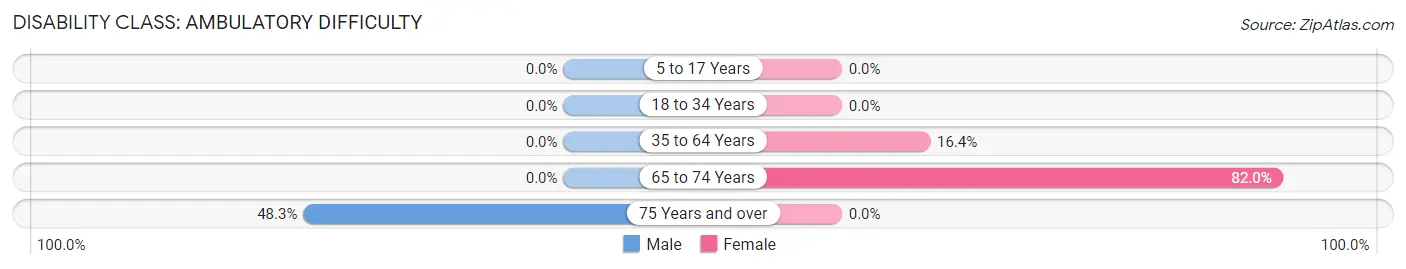
| Age Bracket | Male | Female |
| 5 to 17 Years | 0 (0.0%) | 0 (0.0%) |
| 18 to 34 Years | 0 (0.0%) | 0 (0.0%) |
| 35 to 64 Years | 0 (0.0%) | 30 (16.4%) |
| 65 to 74 Years | 0 (0.0%) | 41 (82.0%) |
| 75 Years and over | 14 (48.3%) | 0 (0.0%) |
Disability Class: Self-Care Difficulty
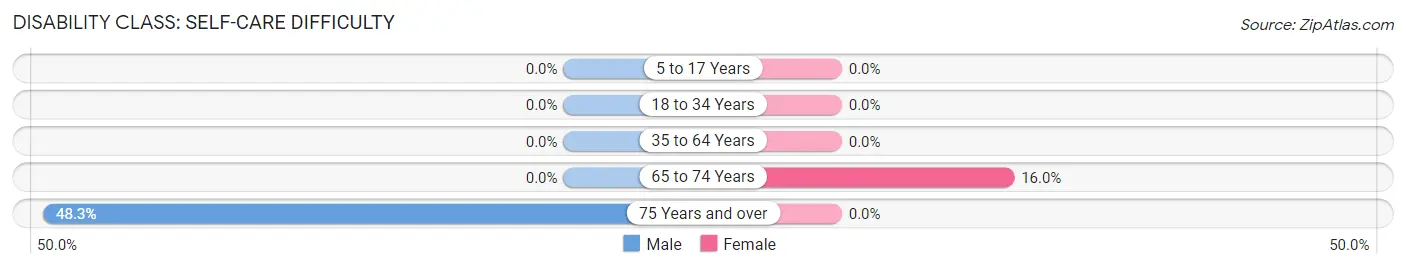
| Age Bracket | Male | Female |
| 5 to 17 Years | 0 (0.0%) | 0 (0.0%) |
| 18 to 34 Years | 0 (0.0%) | 0 (0.0%) |
| 35 to 64 Years | 0 (0.0%) | 0 (0.0%) |
| 65 to 74 Years | 0 (0.0%) | 8 (16.0%) |
| 75 Years and over | 14 (48.3%) | 0 (0.0%) |
Technology Access in South Wallins
Computing Device Access in South Wallins
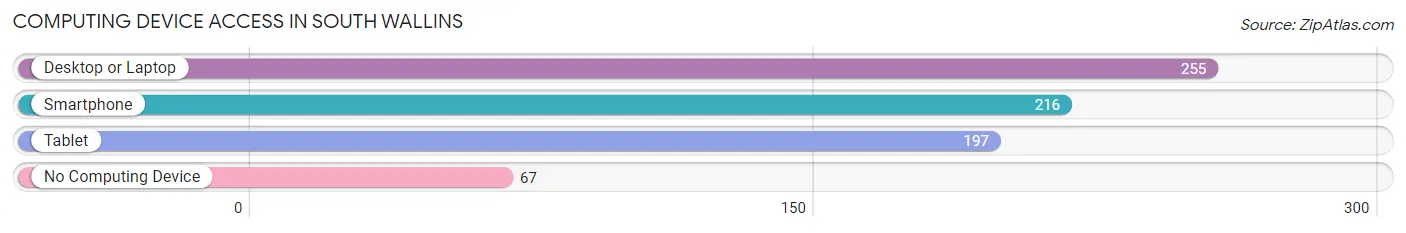
| Device Type | # Households | % Households |
| Desktop or Laptop | 255 | 79.2% |
| Smartphone | 216 | 67.1% |
| Tablet | 197 | 61.2% |
| No Computing Device | 67 | 20.8% |
| Total | 322 | 100.0% |
Internet Access in South Wallins
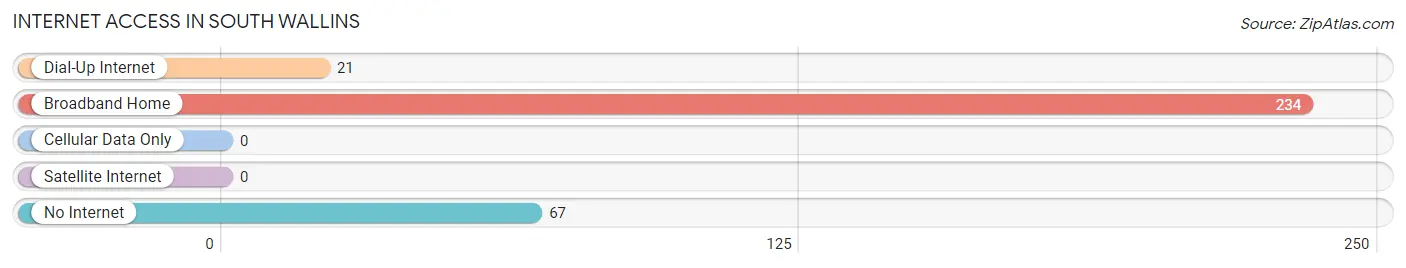
| Internet Type | # Households | % Households |
| Dial-Up Internet | 21 | 6.5% |
| Broadband Home | 234 | 72.7% |
| Cellular Data Only | 0 | 0.0% |
| Satellite Internet | 0 | 0.0% |
| No Internet | 67 | 20.8% |
| Total | 322 | 100.0% |
South Wallins Summary
Wallins, Kentucky is a small unincorporated community located in Harlan County, Kentucky. It is situated on the south side of the Cumberland Mountains, near the Kentucky-Virginia border. The community is named after the Wallins Creek, which runs through the area.
History
Wallins, Kentucky was first settled in the late 1700s by a group of settlers from Virginia. The settlers were primarily of English and Scottish descent. The area was originally known as Wallins Creek, and the creek was named after the Wallins family, who were among the first settlers in the area.
The first post office in Wallins was established in 1845. The community was officially incorporated in 1891. During the late 1800s and early 1900s, Wallins was a thriving coal mining town. The coal industry was the primary source of employment for the residents of Wallins.
Geography
Wallins is located in Harlan County, Kentucky, near the Kentucky-Virginia border. The community is situated on the south side of the Cumberland Mountains. The Wallins Creek runs through the area. The elevation of Wallins is 1,845 feet above sea level.
The climate in Wallins is humid subtropical, with hot summers and mild winters. The average annual temperature is around 57 degrees Fahrenheit. The average annual precipitation is around 45 inches.
Economy
The economy of Wallins is largely based on coal mining. The coal industry has been the primary source of employment for the residents of Wallins since the late 1800s. The coal industry has declined in recent years, however, and many of the coal mines in the area have closed.
In addition to coal mining, Wallins also has a few small businesses, including a grocery store, a hardware store, and a few restaurants. The community also has a few small manufacturing companies.
Demographics
As of the 2010 census, the population of Wallins was 1,845. The racial makeup of the community was 97.3% White, 0.7% African American, 0.2% Native American, 0.2% Asian, and 1.6% from other races. The median household income in Wallins was $25,000, and the median family income was $30,000.
Conclusion
Wallins, Kentucky is a small unincorporated community located in Harlan County, Kentucky. It is situated on the south side of the Cumberland Mountains, near the Kentucky-Virginia border. The community is named after the Wallins Creek, which runs through the area. The economy of Wallins is largely based on coal mining, although there are also a few small businesses in the area. As of the 2010 census, the population of Wallins was 1,845. The racial makeup of the community was 97.3% White, 0.7% African American, 0.2% Native American, 0.2% Asian, and 1.6% from other races. The median household income in Wallins was $25,000, and the median family income was $30,000.
Common Questions
What is Per Capita Income in South Wallins?
Per Capita income in South Wallins is $15,652.
What is the Median Family Income in South Wallins?
Median Family Income in South Wallins is $57,660.
What is the Median Household income in South Wallins?
Median Household Income in South Wallins is $52,833.
What is Income or Wage Gap in South Wallins?
Income or Wage Gap in South Wallins is 35.7%.
Women in South Wallins earn 64.3 cents for every dollar earned by a man.
What is Inequality or Gini Index in South Wallins?
Inequality or Gini Index in South Wallins is 0.33.
What is the Total Population of South Wallins?
Total Population of South Wallins is 976.
What is the Total Male Population of South Wallins?
Total Male Population of South Wallins is 468.
What is the Total Female Population of South Wallins?
Total Female Population of South Wallins is 508.
What is the Ratio of Males per 100 Females in South Wallins?
There are 92.13 Males per 100 Females in South Wallins.
What is the Ratio of Females per 100 Males in South Wallins?
There are 108.55 Females per 100 Males in South Wallins.
What is the Median Population Age in South Wallins?
Median Population Age in South Wallins is 34.2 Years.
What is the Average Family Size in South Wallins
Average Family Size in South Wallins is 3.6 People.
What is the Average Household Size in South Wallins
Average Household Size in South Wallins is 3.0 People.
How Large is the Labor Force in South Wallins?
There are 221 People in the Labor Forcein in South Wallins.
What is the Percentage of People in the Labor Force in South Wallins?
32.7% of People are in the Labor Force in South Wallins.
What is the Unemployment Rate in South Wallins?
Unemployment Rate in South Wallins is 9.0%.