Bathgate, ND Map & Demographics
Bathgate Map
Bathgate Overview
$83,215
PER CAPITA INCOME
$158,438
AVG FAMILY INCOME
0.40
INEQUALITY / GINI INDEX
48
TOTAL POPULATION
23
MALE POPULATION
25
FEMALE POPULATION
92.00
MALES / 100 FEMALES
108.70
FEMALES / 100 MALES
58.6
MEDIAN AGE
2.3
AVG FAMILY SIZE
1.5
AVG HOUSEHOLD SIZE
26
LABOR FORCE [ PEOPLE ]
57.8%
PERCENT IN LABOR FORCE
3.8%
UNEMPLOYMENT RATE
Bathgate Zip Codes
Bathgate Area Codes
Income in Bathgate
Income Overview in Bathgate
| Characteristic | Number | Measure |
| Per Capita Income | 48 | $83,215 |
| Median Family Income | 7 | $158,438 |
| Mean Family Income | 7 | $157,443 |
| Median Household Income | 17 | $0 |
| Mean Household Income | 17 | $96,612 |
| Income Deficit | 7 | $0 |
| Wage / Income Gap (%) | 48 | 0.00% |
| Wage / Income Gap ($) | 48 | 100.00¢ per $1 |
| Gini / Inequality Index | 48 | 0.40 |
Earnings by Sex in Bathgate
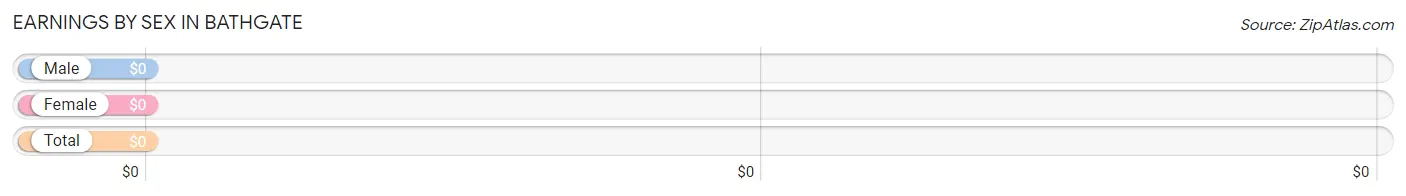
| Sex | Number | Average Earnings |
| Male | 8 (29.6%) | $0 |
| Female | 19 (70.4%) | $0 |
| Total | 27 (100.0%) | $0 |
Earnings by Sex by Income Bracket in Bathgate
The most common earnings brackets in Bathgate are $100,000+ for men (4 | 50.0%) and $12,500 to $14,999 for women (9 | 47.4%).
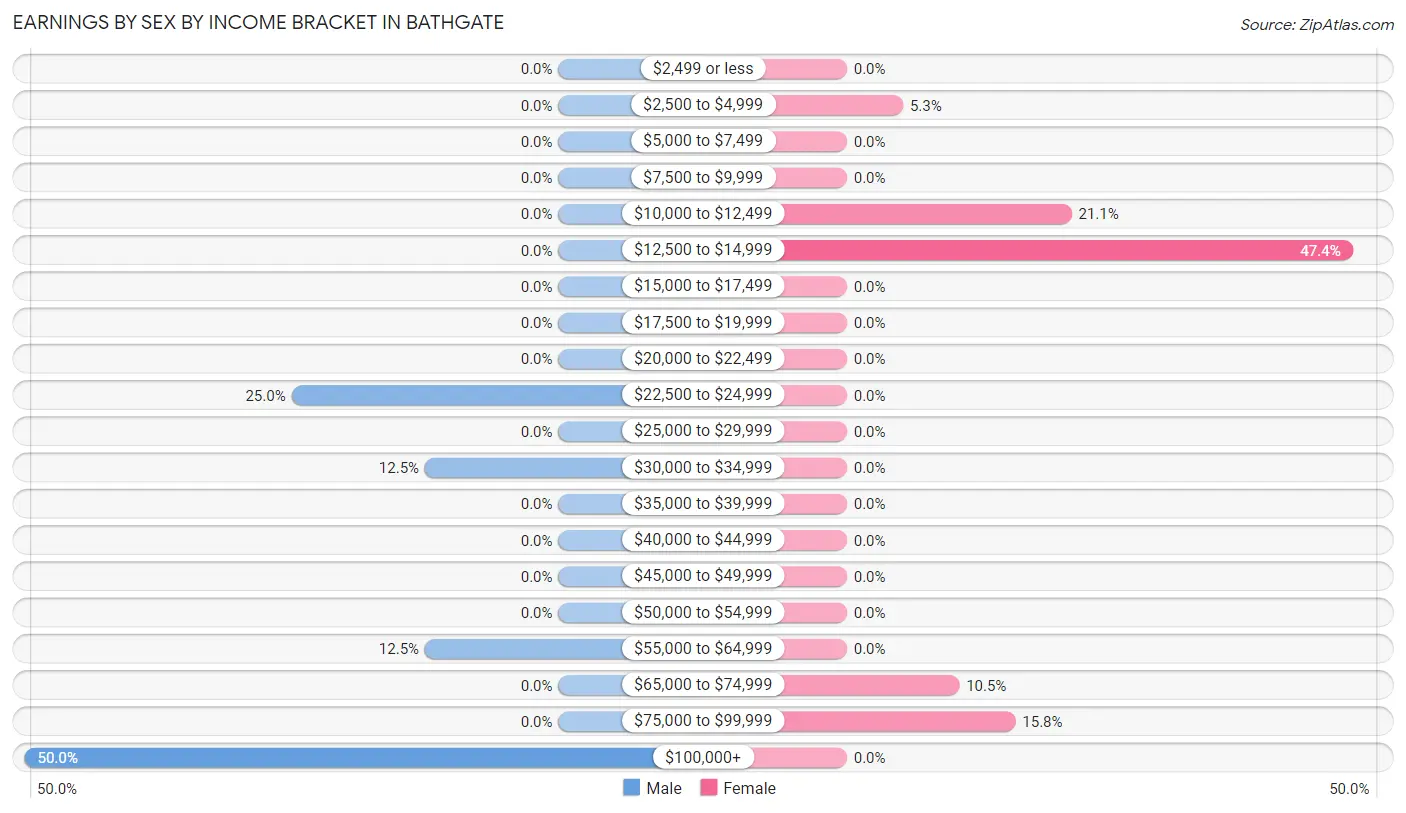
| Income | Male | Female |
| $2,499 or less | 0 (0.0%) | 0 (0.0%) |
| $2,500 to $4,999 | 0 (0.0%) | 1 (5.3%) |
| $5,000 to $7,499 | 0 (0.0%) | 0 (0.0%) |
| $7,500 to $9,999 | 0 (0.0%) | 0 (0.0%) |
| $10,000 to $12,499 | 0 (0.0%) | 4 (21.0%) |
| $12,500 to $14,999 | 0 (0.0%) | 9 (47.4%) |
| $15,000 to $17,499 | 0 (0.0%) | 0 (0.0%) |
| $17,500 to $19,999 | 0 (0.0%) | 0 (0.0%) |
| $20,000 to $22,499 | 0 (0.0%) | 0 (0.0%) |
| $22,500 to $24,999 | 2 (25.0%) | 0 (0.0%) |
| $25,000 to $29,999 | 0 (0.0%) | 0 (0.0%) |
| $30,000 to $34,999 | 1 (12.5%) | 0 (0.0%) |
| $35,000 to $39,999 | 0 (0.0%) | 0 (0.0%) |
| $40,000 to $44,999 | 0 (0.0%) | 0 (0.0%) |
| $45,000 to $49,999 | 0 (0.0%) | 0 (0.0%) |
| $50,000 to $54,999 | 0 (0.0%) | 0 (0.0%) |
| $55,000 to $64,999 | 1 (12.5%) | 0 (0.0%) |
| $65,000 to $74,999 | 0 (0.0%) | 2 (10.5%) |
| $75,000 to $99,999 | 0 (0.0%) | 3 (15.8%) |
| $100,000+ | 4 (50.0%) | 0 (0.0%) |
| Total | 8 (100.0%) | 19 (100.0%) |
Earnings by Sex by Educational Attainment in Bathgate
| Educational Attainment | Male Income | Female Income |
| Less than High School | - | - |
| High School Diploma | - | - |
| College or Associate's Degree | - | - |
| Bachelor's Degree | - | - |
| Graduate Degree | - | - |
| Total | - | - |
Family Income in Bathgate
Family Income Brackets in Bathgate
According to the Bathgate family income data, there are 5 families falling into the $150,000 to $199,999 income range, which is the most common income bracket and makes up 71.4% of all families.
| Income Bracket | # Families | % Families |
| Less than $10,000 | 0 | 0.0% |
| $10,000 to $14,999 | 0 | 0.0% |
| $15,000 to $24,999 | 1 | 14.3% |
| $25,000 to $34,999 | 0 | 0.0% |
| $35,000 to $49,999 | 0 | 0.0% |
| $50,000 to $74,999 | 0 | 0.0% |
| $75,000 to $99,999 | 0 | 0.0% |
| $100,000 to $149,999 | 0 | 0.0% |
| $150,000 to $199,999 | 5 | 71.4% |
| $200,000+ | 1 | 14.3% |
Family Income by Famaliy Size in Bathgate
2-person families (6 | 85.7%) account for the highest median family income in Bathgate with $158,125 per family, while 2-person families (6 | 85.7%) have the highest median income of $79,062 per family member.
| Income Bracket | # Families | Median Income |
| 2-Person Families | 6 (85.7%) | $158,125 |
| 3-Person Families | 0 (0.0%) | $0 |
| 4-Person Families | 0 (0.0%) | $0 |
| 5-Person Families | 1 (14.3%) | $0 |
| 6-Person Families | 0 (0.0%) | $0 |
| 7+ Person Families | 0 (0.0%) | $0 |
| Total | 7 (100.0%) | $158,438 |
Family Income by Number of Earners in Bathgate
| Number of Earners | # Families | Median Income |
| No Earners | 1 (14.3%) | $0 |
| 1 Earner | 1 (14.3%) | $0 |
| 2 Earners | 5 (71.4%) | $0 |
| 3+ Earners | 0 (0.0%) | $0 |
| Total | 7 (100.0%) | $158,438 |
Household Income in Bathgate
Household Income Brackets in Bathgate
With 5 households falling in the category, the $150,000 to $199,999 income range is the most frequent in Bathgate, accounting for 29.4% of all households.
| Income Bracket | # Households | % Households |
| Less than $10,000 | 0 | 0.0% |
| $10,000 to $14,999 | 0 | 0.0% |
| $15,000 to $24,999 | 4 | 23.5% |
| $25,000 to $34,999 | 1 | 5.9% |
| $35,000 to $49,999 | 1 | 5.9% |
| $50,000 to $74,999 | 2 | 11.8% |
| $75,000 to $99,999 | 3 | 17.6% |
| $100,000 to $149,999 | 0 | 0.0% |
| $150,000 to $199,999 | 5 | 29.4% |
| $200,000+ | 1 | 5.9% |
Household Income by Householder Age in Bathgate
The median household income in Bathgate is $0, with the highest median household income of $68,750 found in the 45 to 64 years age bracket for the primary householder. A total of 8 households (47.1%) fall into this category.
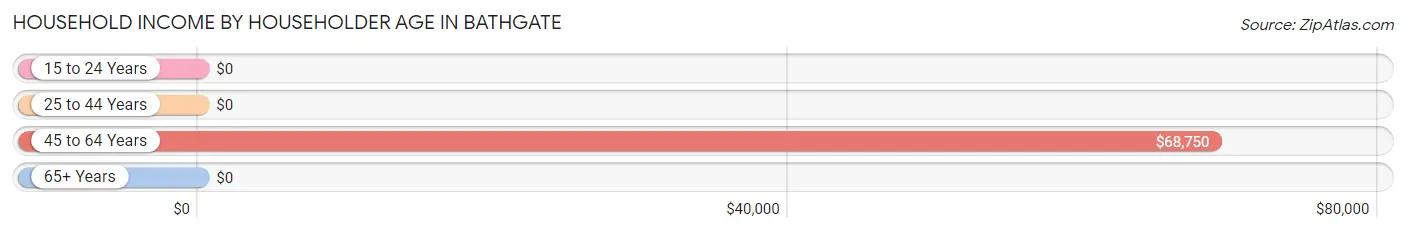
| Income Bracket | # Households | Median Income |
| 15 to 24 Years | 0 (0.0%) | $0 |
| 25 to 44 Years | 1 (5.9%) | $0 |
| 45 to 64 Years | 8 (47.1%) | $68,750 |
| 65+ Years | 8 (47.1%) | $0 |
| Total | 17 (100.0%) | $0 |
Poverty in Bathgate
Income Below Poverty by Sex and Age in Bathgate
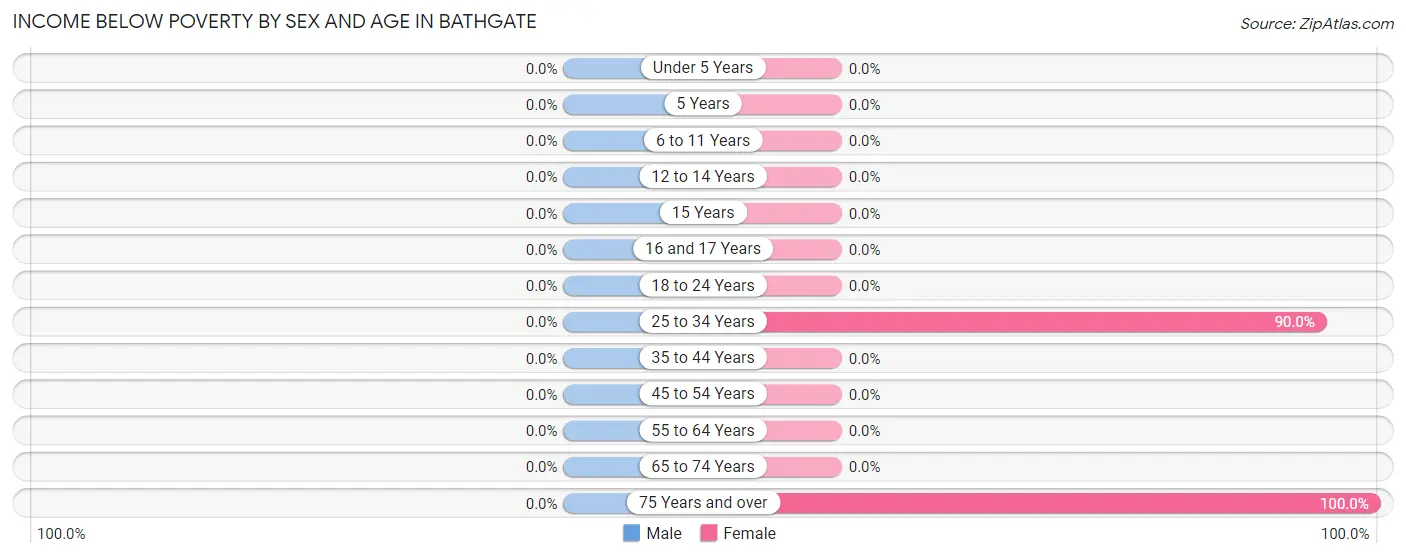
| Age Bracket | Male | Female |
| Under 5 Years | 0 (0.0%) | 0 (0.0%) |
| 5 Years | 0 (0.0%) | 0 (0.0%) |
| 6 to 11 Years | 0 (0.0%) | 0 (0.0%) |
| 12 to 14 Years | 0 (0.0%) | 0 (0.0%) |
| 15 Years | 0 (0.0%) | 0 (0.0%) |
| 16 and 17 Years | 0 (0.0%) | 0 (0.0%) |
| 18 to 24 Years | 0 (0.0%) | 0 (0.0%) |
| 25 to 34 Years | 0 (0.0%) | 9 (90.0%) |
| 35 to 44 Years | 0 (0.0%) | 0 (0.0%) |
| 45 to 54 Years | 0 (0.0%) | 0 (0.0%) |
| 55 to 64 Years | 0 (0.0%) | 0 (0.0%) |
| 65 to 74 Years | 0 (0.0%) | 0 (0.0%) |
| 75 Years and over | 0 (0.0%) | 5 (100.0%) |
| Total | 0 (0.0%) | 14 (56.0%) |
Income Above Poverty by Sex and Age in Bathgate
According to the poverty statistics in Bathgate, males aged under 5 years and females aged 45 to 54 years are the age groups that are most secure financially, with 100.0% of males and 100.0% of females in these age groups living above the poverty line.
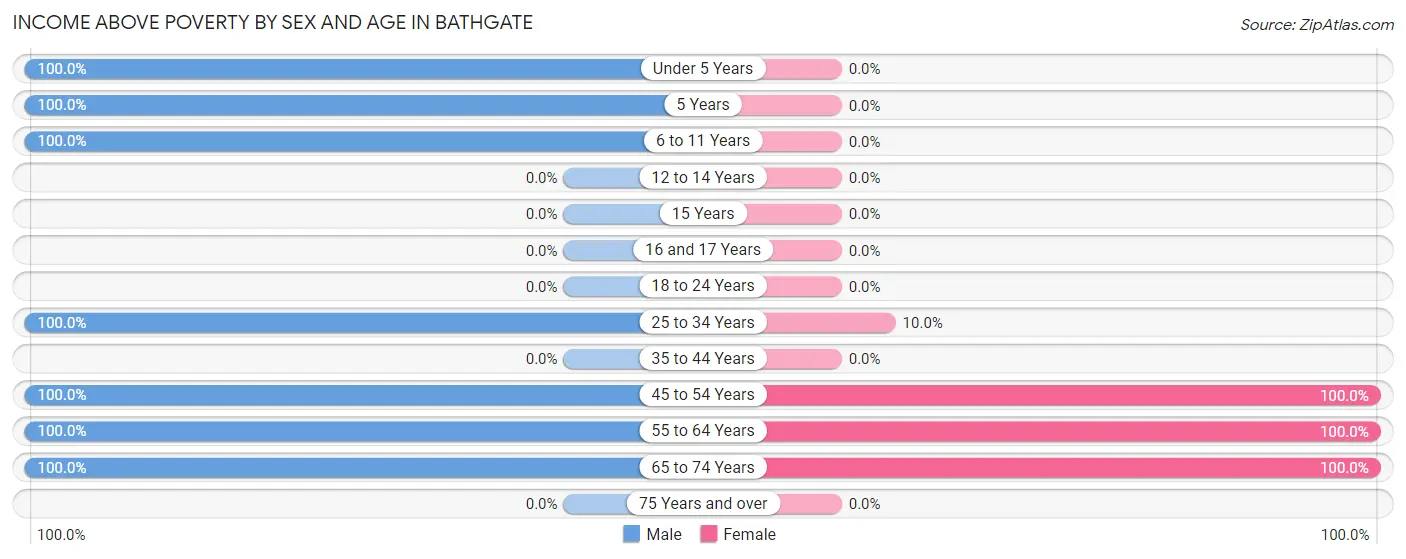
| Age Bracket | Male | Female |
| Under 5 Years | 1 (100.0%) | 0 (0.0%) |
| 5 Years | 1 (100.0%) | 0 (0.0%) |
| 6 to 11 Years | 1 (100.0%) | 0 (0.0%) |
| 12 to 14 Years | 0 (0.0%) | 0 (0.0%) |
| 15 Years | 0 (0.0%) | 0 (0.0%) |
| 16 and 17 Years | 0 (0.0%) | 0 (0.0%) |
| 18 to 24 Years | 0 (0.0%) | 0 (0.0%) |
| 25 to 34 Years | 1 (100.0%) | 1 (10.0%) |
| 35 to 44 Years | 0 (0.0%) | 0 (0.0%) |
| 45 to 54 Years | 3 (100.0%) | 2 (100.0%) |
| 55 to 64 Years | 9 (100.0%) | 3 (100.0%) |
| 65 to 74 Years | 7 (100.0%) | 5 (100.0%) |
| 75 Years and over | 0 (0.0%) | 0 (0.0%) |
| Total | 23 (100.0%) | 11 (44.0%) |
Income Below Poverty Among Married-Couple Families in Bathgate
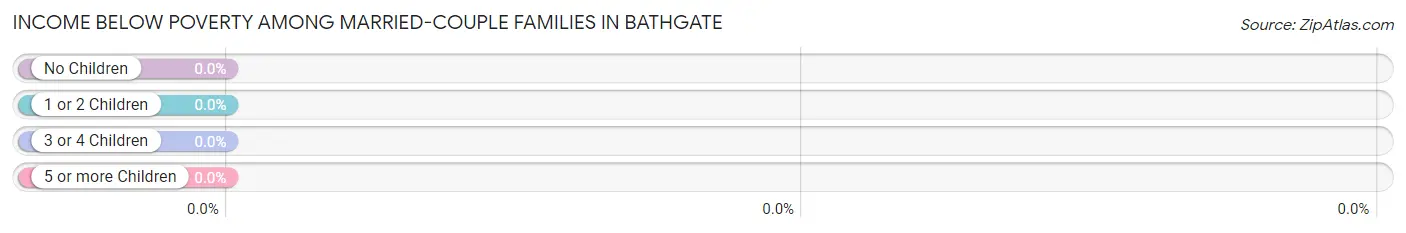
| Children | Above Poverty | Below Poverty |
| No Children | 5 (100.0%) | 0 (0.0%) |
| 1 or 2 Children | 0 (0.0%) | 0 (0.0%) |
| 3 or 4 Children | 1 (100.0%) | 0 (0.0%) |
| 5 or more Children | 0 (0.0%) | 0 (0.0%) |
| Total | 6 (100.0%) | 0 (0.0%) |
Income Below Poverty Among Single-Parent Households in Bathgate
| Children | Single Father | Single Mother |
| No Children | 0 (0.0%) | 0 (0.0%) |
| 1 or 2 Children | 0 (0.0%) | 0 (0.0%) |
| 3 or 4 Children | 0 (0.0%) | 0 (0.0%) |
| 5 or more Children | 0 (0.0%) | 0 (0.0%) |
| Total | 0 (0.0%) | 0 (0.0%) |
Income Below Poverty Among Married-Couple vs Single-Parent Households in Bathgate
| Children | Married-Couple Families | Single-Parent Households |
| No Children | 0 (0.0%) | 0 (0.0%) |
| 1 or 2 Children | 0 (0.0%) | 0 (0.0%) |
| 3 or 4 Children | 0 (0.0%) | 0 (0.0%) |
| 5 or more Children | 0 (0.0%) | 0 (0.0%) |
| Total | 0 (0.0%) | 0 (0.0%) |
Race in Bathgate
The most populous races in Bathgate are White / Caucasian (40 | 83.3%), and Black / African American (8 | 16.7%).
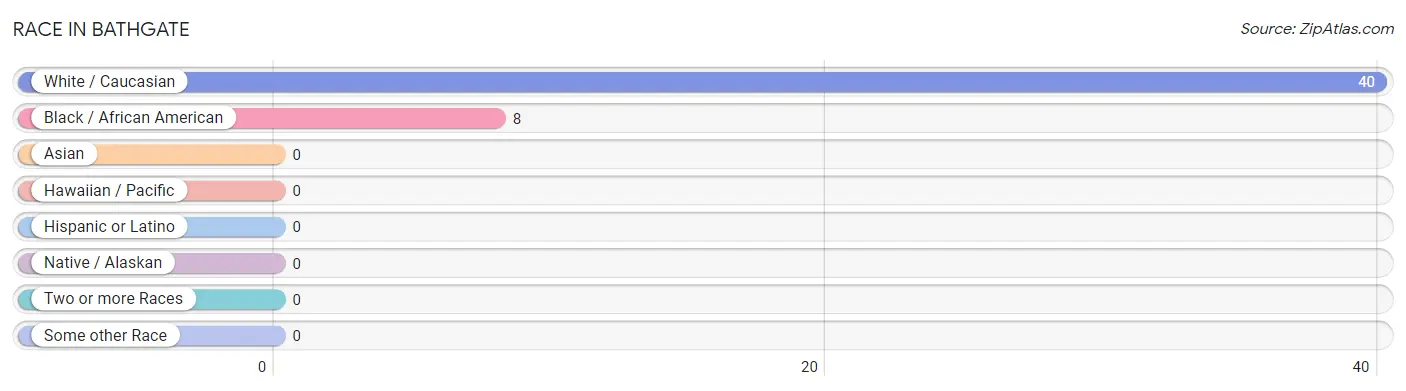
| Race | # Population | % Population |
| Asian | 0 | 0.0% |
| Black / African American | 8 | 16.7% |
| Hawaiian / Pacific | 0 | 0.0% |
| Hispanic or Latino | 0 | 0.0% |
| Native / Alaskan | 0 | 0.0% |
| White / Caucasian | 40 | 83.3% |
| Two or more Races | 0 | 0.0% |
| Some other Race | 0 | 0.0% |
| Total | 48 | 100.0% |
Ancestry in Bathgate
The most populous ancestries reported in Bathgate are German (24 | 50.0%), Swedish (9 | 18.8%), Norwegian (8 | 16.7%), Polish (5 | 10.4%), and European (4 | 8.3%), together accounting for 104.2% of all Bathgate residents.
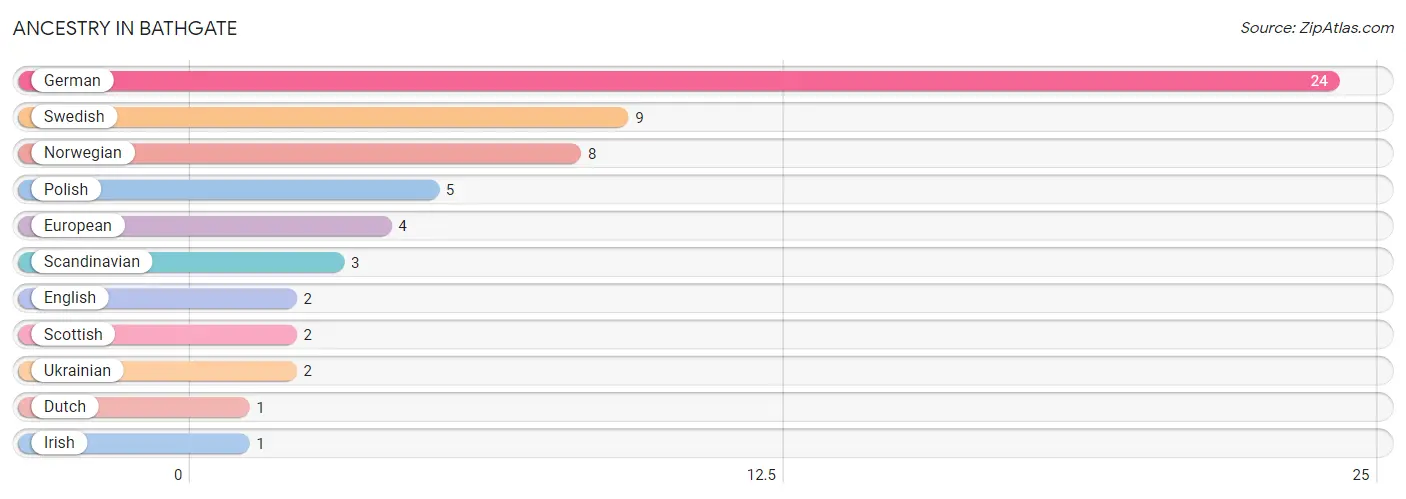
| Ancestry | # Population | % Population |
| Dutch | 1 | 2.1% |
| English | 2 | 4.2% |
| European | 4 | 8.3% |
| German | 24 | 50.0% |
| Irish | 1 | 2.1% |
| Norwegian | 8 | 16.7% |
| Polish | 5 | 10.4% |
| Scandinavian | 3 | 6.2% |
| Scottish | 2 | 4.2% |
| Swedish | 9 | 18.8% |
| Ukrainian | 2 | 4.2% | View All 11 Rows |
Immigrants in Bathgate
The most numerous immigrant groups reported in Bathgate came from Africa (8 | 16.7%), Nigeria (8 | 16.7%), Western Africa (8 | 16.7%), and Canada (2 | 4.2%), together accounting for 54.2% of all Bathgate residents.
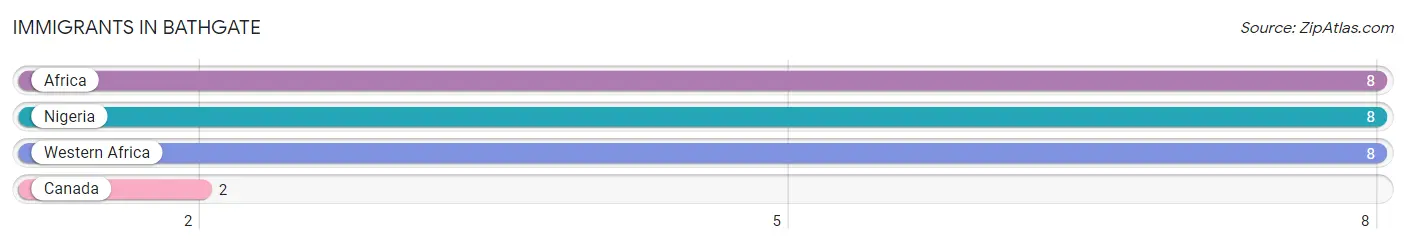
| Immigration Origin | # Population | % Population |
| Africa | 8 | 16.7% |
| Canada | 2 | 4.2% |
| Nigeria | 8 | 16.7% |
| Western Africa | 8 | 16.7% | View All 4 Rows |
Sex and Age in Bathgate
Sex and Age in Bathgate
The most populous age groups in Bathgate are 55 to 59 Years (8 | 34.8%) for men and 30 to 34 Years (10 | 40.0%) for women.
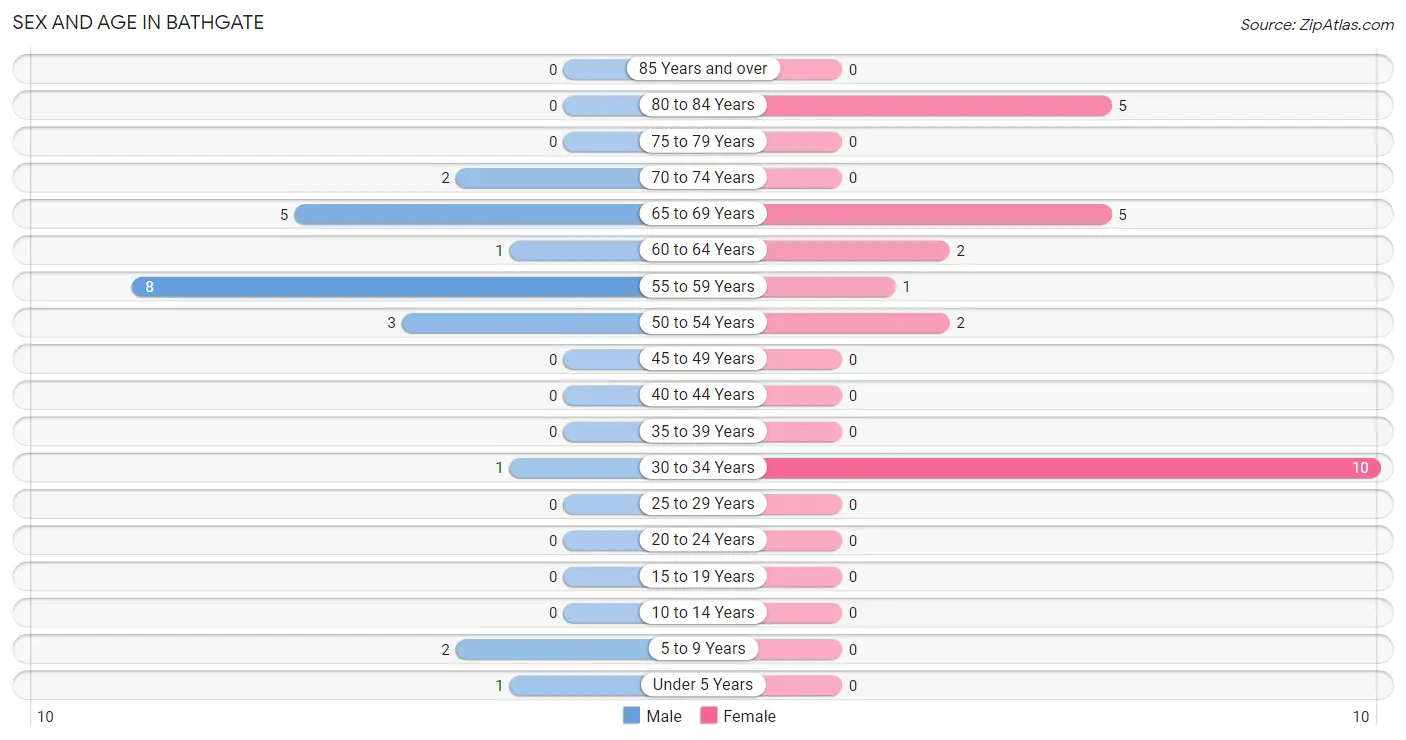
| Age Bracket | Male | Female |
| Under 5 Years | 1 (4.3%) | 0 (0.0%) |
| 5 to 9 Years | 2 (8.7%) | 0 (0.0%) |
| 10 to 14 Years | 0 (0.0%) | 0 (0.0%) |
| 15 to 19 Years | 0 (0.0%) | 0 (0.0%) |
| 20 to 24 Years | 0 (0.0%) | 0 (0.0%) |
| 25 to 29 Years | 0 (0.0%) | 0 (0.0%) |
| 30 to 34 Years | 1 (4.3%) | 10 (40.0%) |
| 35 to 39 Years | 0 (0.0%) | 0 (0.0%) |
| 40 to 44 Years | 0 (0.0%) | 0 (0.0%) |
| 45 to 49 Years | 0 (0.0%) | 0 (0.0%) |
| 50 to 54 Years | 3 (13.0%) | 2 (8.0%) |
| 55 to 59 Years | 8 (34.8%) | 1 (4.0%) |
| 60 to 64 Years | 1 (4.3%) | 2 (8.0%) |
| 65 to 69 Years | 5 (21.7%) | 5 (20.0%) |
| 70 to 74 Years | 2 (8.7%) | 0 (0.0%) |
| 75 to 79 Years | 0 (0.0%) | 0 (0.0%) |
| 80 to 84 Years | 0 (0.0%) | 5 (20.0%) |
| 85 Years and over | 0 (0.0%) | 0 (0.0%) |
| Total | 23 (100.0%) | 25 (100.0%) |
Families and Households in Bathgate
Median Family Size in Bathgate
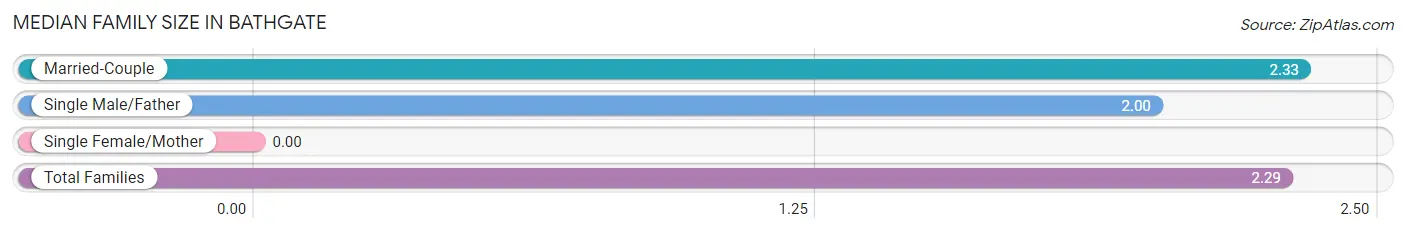
| Family Type | # Families | Family Size |
| Married-Couple | 6 (85.7%) | 2.33 |
| Single Male/Father | 1 (14.3%) | 2.00 |
| Single Female/Mother | 0 (0.0%) | - |
| Total Families | 7 (100.0%) | 2.29 |
Median Household Size in Bathgate
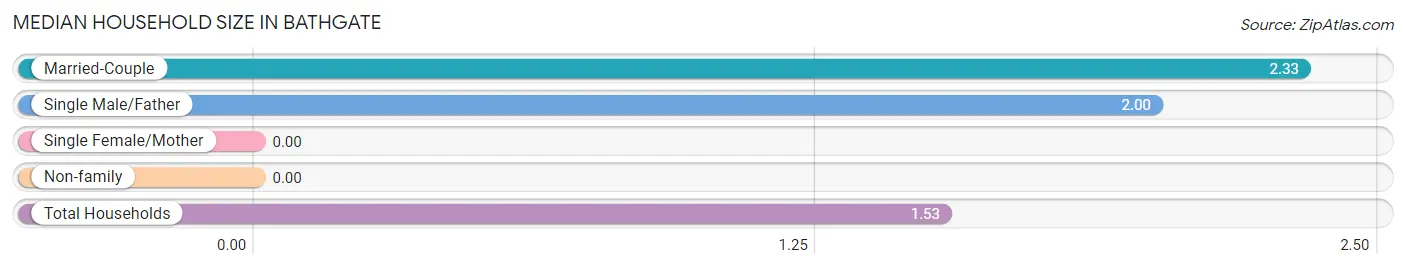
| Household Type | # Households | Household Size |
| Married-Couple | 6 (35.3%) | 2.33 |
| Single Male/Father | 1 (5.9%) | 2.00 |
| Single Female/Mother | 0 (0.0%) | - |
| Non-family | 10 (58.8%) | - |
| Total Households | 17 (100.0%) | 1.53 |
Household Size by Marriage Status in Bathgate
Out of a total of 17 households in Bathgate, 7 (41.2%) are family households, while 10 (58.8%) are nonfamily households. The most numerous type of family households are 2-person households, comprising 6, and the most common type of nonfamily households are 1-person households, comprising 10.
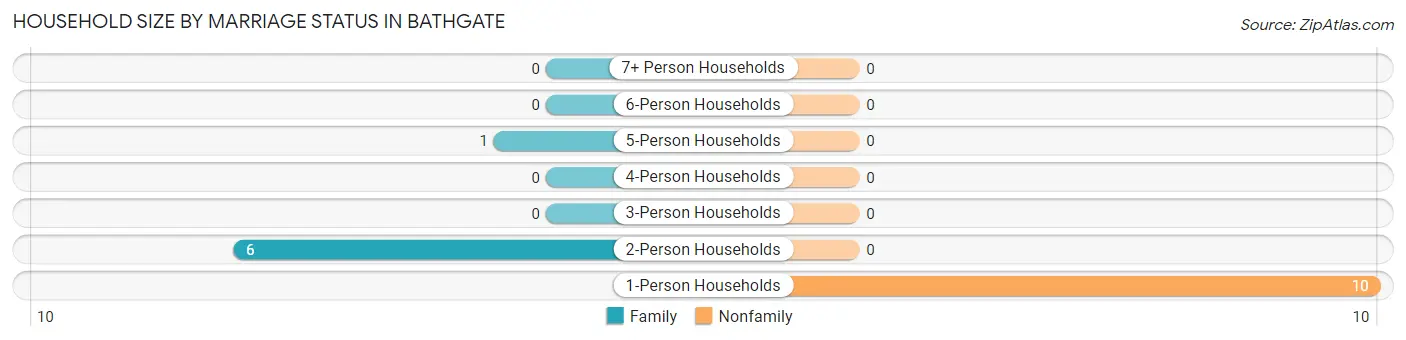
| Household Size | Family Households | Nonfamily Households |
| 1-Person Households | - | 10 (58.8%) |
| 2-Person Households | 6 (35.3%) | 0 (0.0%) |
| 3-Person Households | 0 (0.0%) | 0 (0.0%) |
| 4-Person Households | 0 (0.0%) | 0 (0.0%) |
| 5-Person Households | 1 (5.9%) | 0 (0.0%) |
| 6-Person Households | 0 (0.0%) | 0 (0.0%) |
| 7+ Person Households | 0 (0.0%) | 0 (0.0%) |
| Total | 7 (41.2%) | 10 (58.8%) |
Female Fertility in Bathgate
Fertility by Age in Bathgate
| Age Bracket | Women with Births | Births / 1,000 Women |
| 15 to 19 years | 0 (0.0%) | 0.0 |
| 20 to 34 years | 0 (0.0%) | 0.0 |
| 35 to 50 years | 0 (0.0%) | 0.0 |
| Total | 0 (0.0%) | 0.0 |
Fertility by Age by Marriage Status in Bathgate
| Age Bracket | Married | Unmarried |
| 15 to 19 years | 0 (0.0%) | 0 (0.0%) |
| 20 to 34 years | 0 (0.0%) | 0 (0.0%) |
| 35 to 50 years | 0 (0.0%) | 0 (0.0%) |
| Total | 0 (0.0%) | 0 (0.0%) |
Fertility by Education in Bathgate
| Educational Attainment | Women with Births | Births / 1,000 Women |
| Less than High School | 0 (0.0%) | 0.0 |
| High School Diploma | 0 (0.0%) | 0.0 |
| College or Associate's Degree | 0 (0.0%) | 0.0 |
| Bachelor's Degree | 0 (0.0%) | 0.0 |
| Graduate Degree | 0 (0.0%) | 0.0 |
| Total | 0 (0.0%) | 0.0 |
Fertility by Education by Marriage Status in Bathgate
| Educational Attainment | Married | Unmarried |
| Less than High School | 0 (0.0%) | 0 (0.0%) |
| High School Diploma | 0 (0.0%) | 0 (0.0%) |
| College or Associate's Degree | 0 (0.0%) | 0 (0.0%) |
| Bachelor's Degree | 0 (0.0%) | 0 (0.0%) |
| Graduate Degree | 0 (0.0%) | 0 (0.0%) |
| Total | 0 (0.0%) | 0 (0.0%) |
Employment Characteristics in Bathgate
Employment by Class of Employer in Bathgate
Among the 25 employed individuals in Bathgate, private company employees (14 | 56.0%), not-for-profit organizations (9 | 36.0%), and self-employed (not incorporated) (2 | 8.0%) make up the most common classes of employment.
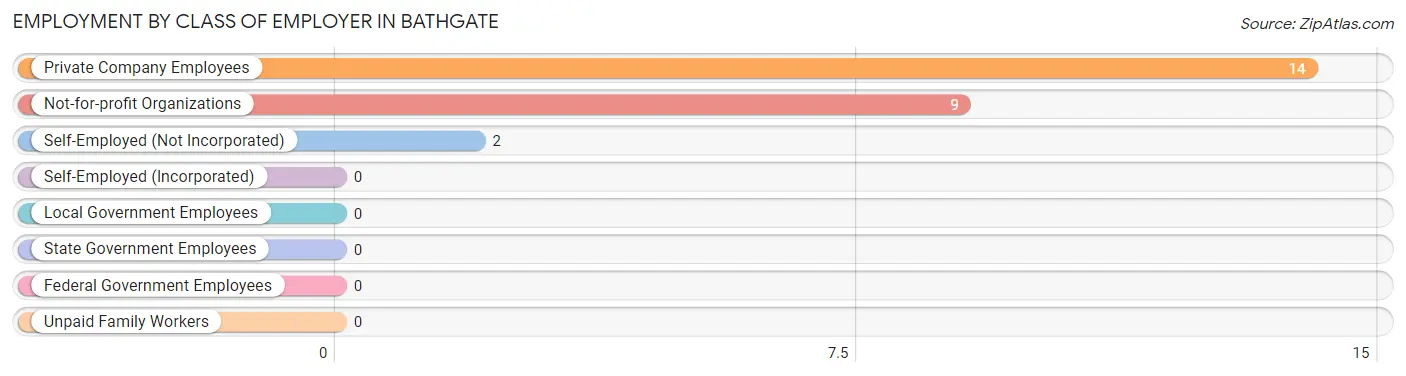
| Employer Class | # Employees | % Employees |
| Private Company Employees | 14 | 56.0% |
| Self-Employed (Incorporated) | 0 | 0.0% |
| Self-Employed (Not Incorporated) | 2 | 8.0% |
| Not-for-profit Organizations | 9 | 36.0% |
| Local Government Employees | 0 | 0.0% |
| State Government Employees | 0 | 0.0% |
| Federal Government Employees | 0 | 0.0% |
| Unpaid Family Workers | 0 | 0.0% |
| Total | 25 | 100.0% |
Employment Status by Age in Bathgate
According to the labor force statistics for Bathgate, out of the total population over 16 years of age (45), 57.8% or 26 individuals are in the labor force, with 3.8% or 1 of them unemployed. The age group with the highest labor force participation rate is 45 to 54 years, with 100.0% or 5 individuals in the labor force. Within the labor force, the 45 to 54 years age range has the highest percentage of unemployed individuals, with 20.0% or 1 of them being unemployed.
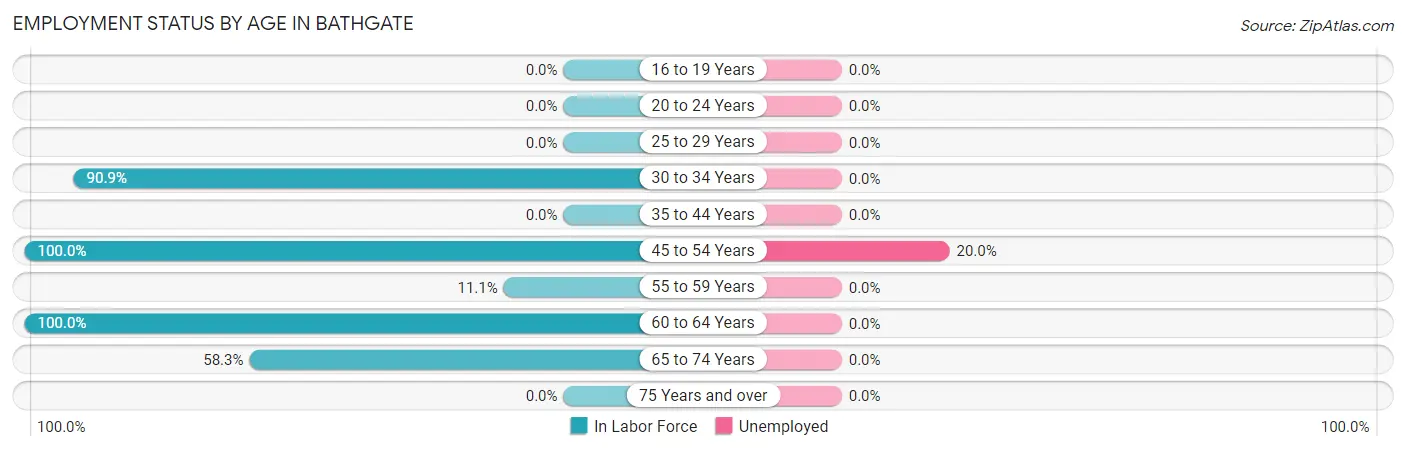
| Age Bracket | In Labor Force | Unemployed |
| 16 to 19 Years | 0 (0.0%) | 0 (0.0%) |
| 20 to 24 Years | 0 (0.0%) | 0 (0.0%) |
| 25 to 29 Years | 0 (0.0%) | 0 (0.0%) |
| 30 to 34 Years | 10 (90.9%) | 0 (0.0%) |
| 35 to 44 Years | 0 (0.0%) | 0 (0.0%) |
| 45 to 54 Years | 5 (100.0%) | 1 (20.0%) |
| 55 to 59 Years | 1 (11.1%) | 0 (0.0%) |
| 60 to 64 Years | 3 (100.0%) | 0 (0.0%) |
| 65 to 74 Years | 7 (58.3%) | 0 (0.0%) |
| 75 Years and over | 0 (0.0%) | 0 (0.0%) |
| Total | 26 (57.8%) | 1 (3.8%) |
Employment Status by Educational Attainment in Bathgate
According to labor force statistics for Bathgate, 67.9% of individuals (19) out of the total population between 25 and 64 years of age (28) are in the labor force, with 5.3% or 1 of them being unemployed. The group with the highest labor force participation rate are those with the educational attainment of college / associate degree, with 100.0% or 15 individuals in the labor force. Within the labor force, individuals with college / associate degree education have the highest percentage of unemployment, with 6.7% or 1 of them being unemployed.
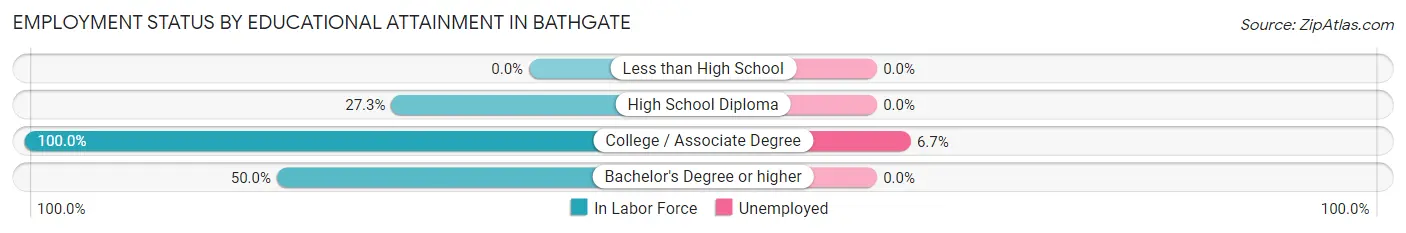
| Educational Attainment | In Labor Force | Unemployed |
| Less than High School | 0 (0.0%) | 0 (0.0%) |
| High School Diploma | 3 (27.3%) | 0 (0.0%) |
| College / Associate Degree | 15 (100.0%) | 1 (6.7%) |
| Bachelor's Degree or higher | 1 (50.0%) | 0 (0.0%) |
| Total | 19 (67.9%) | 1 (5.3%) |
Employment Occupations by Sex in Bathgate
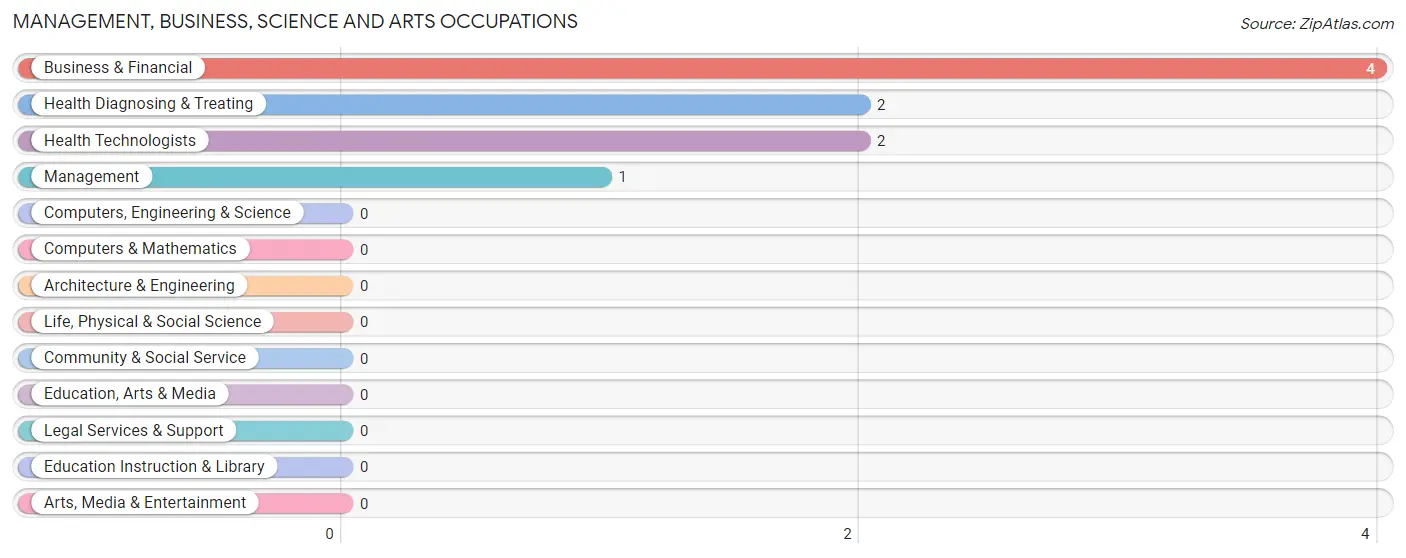
Management, Business, Science and Arts Occupations
The most common Management, Business, Science and Arts occupations in Bathgate are Business & Financial (4 | 16.0%), Health Diagnosing & Treating (2 | 8.0%), Health Technologists (2 | 8.0%), and Management (1 | 4.0%).
Management, Business, Science and Arts Occupations by Sex
Within the Management, Business, Science and Arts occupations in Bathgate, the most male-oriented occupations are Management (100.0%), and Business & Financial (100.0%), while the most female-oriented occupations are Health Diagnosing & Treating (100.0%), and Health Technologists (100.0%).
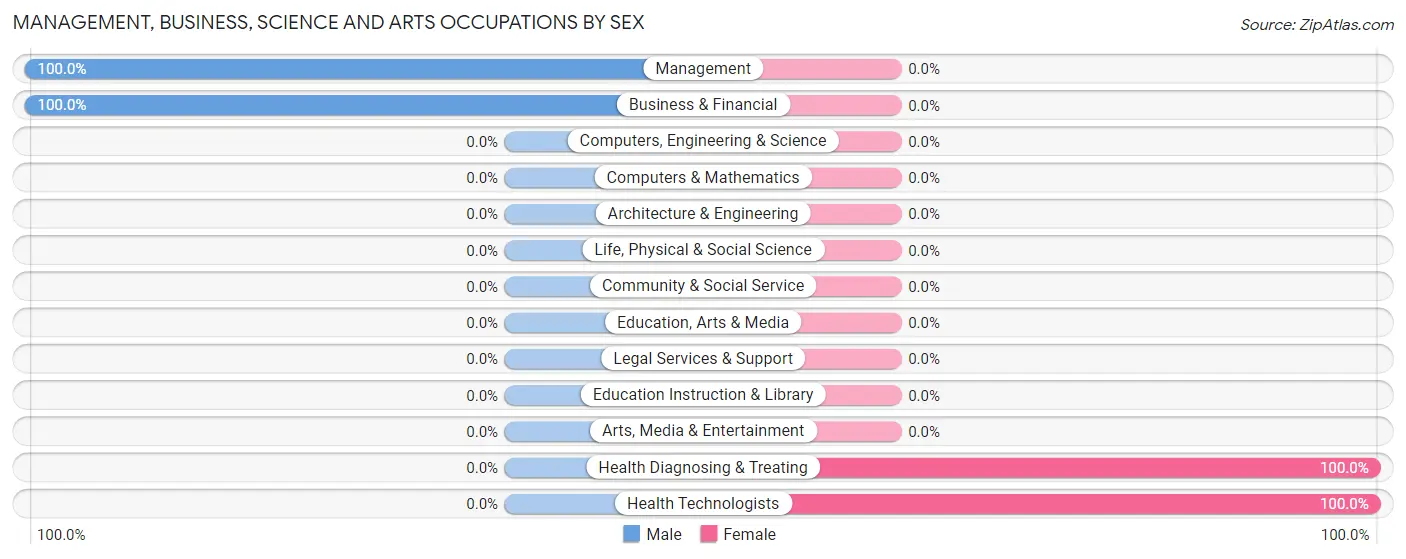
| Occupation | Male | Female |
| Management | 1 (100.0%) | 0 (0.0%) |
| Business & Financial | 4 (100.0%) | 0 (0.0%) |
| Computers, Engineering & Science | 0 (0.0%) | 0 (0.0%) |
| Computers & Mathematics | 0 (0.0%) | 0 (0.0%) |
| Architecture & Engineering | 0 (0.0%) | 0 (0.0%) |
| Life, Physical & Social Science | 0 (0.0%) | 0 (0.0%) |
| Community & Social Service | 0 (0.0%) | 0 (0.0%) |
| Education, Arts & Media | 0 (0.0%) | 0 (0.0%) |
| Legal Services & Support | 0 (0.0%) | 0 (0.0%) |
| Education Instruction & Library | 0 (0.0%) | 0 (0.0%) |
| Arts, Media & Entertainment | 0 (0.0%) | 0 (0.0%) |
| Health Diagnosing & Treating | 0 (0.0%) | 2 (100.0%) |
| Health Technologists | 0 (0.0%) | 2 (100.0%) |
| Total (Category) | 5 (71.4%) | 2 (28.6%) |
| Total (Overall) | 7 (28.0%) | 18 (72.0%) |
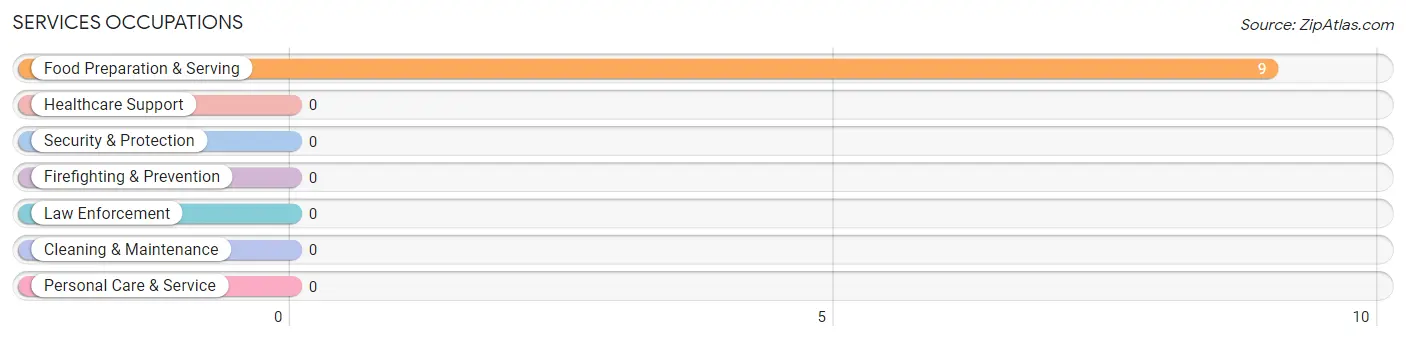
Services Occupations
The most common Services occupations in Bathgate are , and Food Preparation & Serving (9 | 36.0%).
Services Occupations by Sex
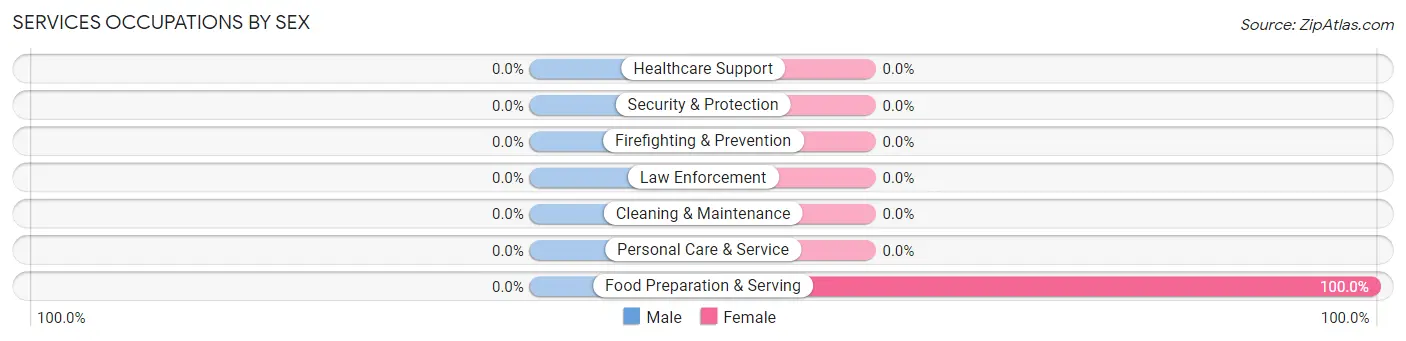
| Occupation | Male | Female |
| Healthcare Support | 0 (0.0%) | 0 (0.0%) |
| Security & Protection | 0 (0.0%) | 0 (0.0%) |
| Firefighting & Prevention | 0 (0.0%) | 0 (0.0%) |
| Law Enforcement | 0 (0.0%) | 0 (0.0%) |
| Food Preparation & Serving | 0 (0.0%) | 9 (100.0%) |
| Cleaning & Maintenance | 0 (0.0%) | 0 (0.0%) |
| Personal Care & Service | 0 (0.0%) | 0 (0.0%) |
| Total (Category) | 0 (0.0%) | 9 (100.0%) |
| Total (Overall) | 7 (28.0%) | 18 (72.0%) |
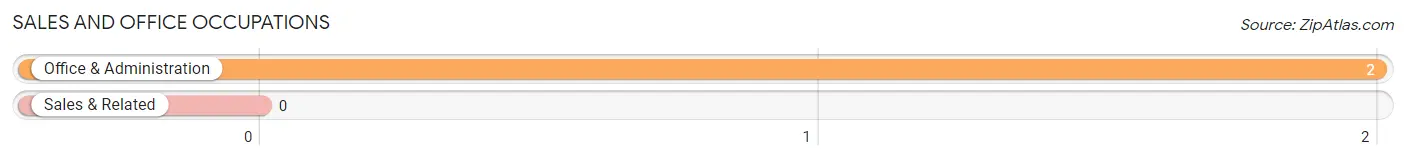
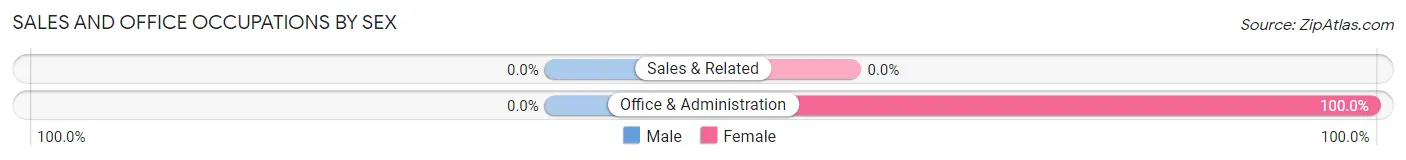
Sales and Office Occupations
The most common Sales and Office occupations in Bathgate are , and Office & Administration (2 | 8.0%).
Sales and Office Occupations by Sex
| Occupation | Male | Female |
| Sales & Related | 0 (0.0%) | 0 (0.0%) |
| Office & Administration | 0 (0.0%) | 2 (100.0%) |
| Total (Category) | 0 (0.0%) | 2 (100.0%) |
| Total (Overall) | 7 (28.0%) | 18 (72.0%) |
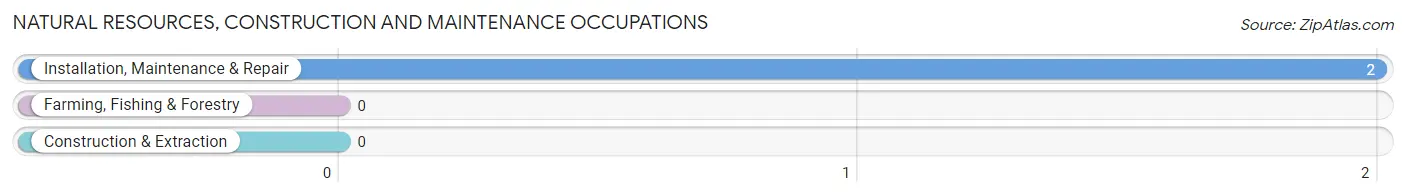
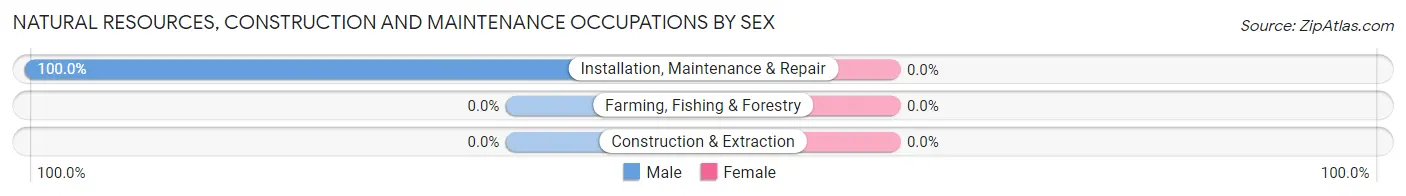
Natural Resources, Construction and Maintenance Occupations
The most common Natural Resources, Construction and Maintenance occupations in Bathgate are , and Installation, Maintenance & Repair (2 | 8.0%).
Natural Resources, Construction and Maintenance Occupations by Sex
| Occupation | Male | Female |
| Farming, Fishing & Forestry | 0 (0.0%) | 0 (0.0%) |
| Construction & Extraction | 0 (0.0%) | 0 (0.0%) |
| Installation, Maintenance & Repair | 2 (100.0%) | 0 (0.0%) |
| Total (Category) | 2 (100.0%) | 0 (0.0%) |
| Total (Overall) | 7 (28.0%) | 18 (72.0%) |
Production, Transportation and Moving Occupations
The most common Production, Transportation and Moving occupations in Bathgate are Material Moving (4 | 16.0%), and Production (1 | 4.0%).
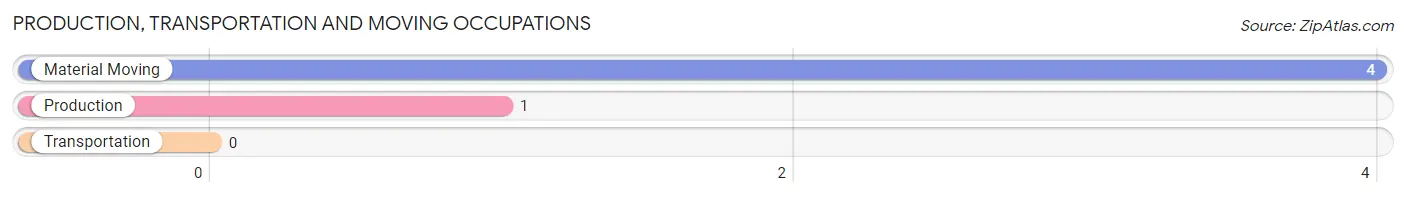
Production, Transportation and Moving Occupations by Sex
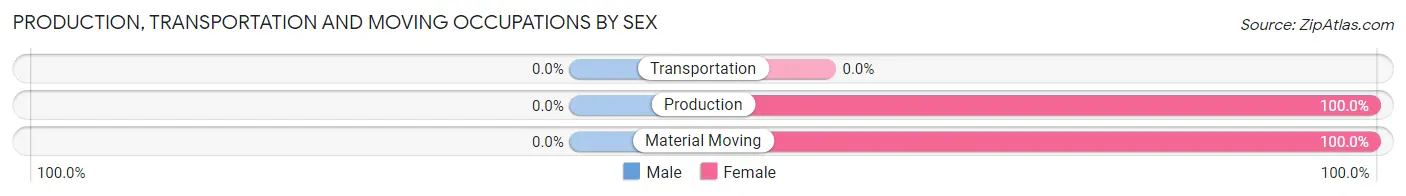
| Occupation | Male | Female |
| Production | 0 (0.0%) | 1 (100.0%) |
| Transportation | 0 (0.0%) | 0 (0.0%) |
| Material Moving | 0 (0.0%) | 4 (100.0%) |
| Total (Category) | 0 (0.0%) | 5 (100.0%) |
| Total (Overall) | 7 (28.0%) | 18 (72.0%) |
Employment Industries by Sex in Bathgate
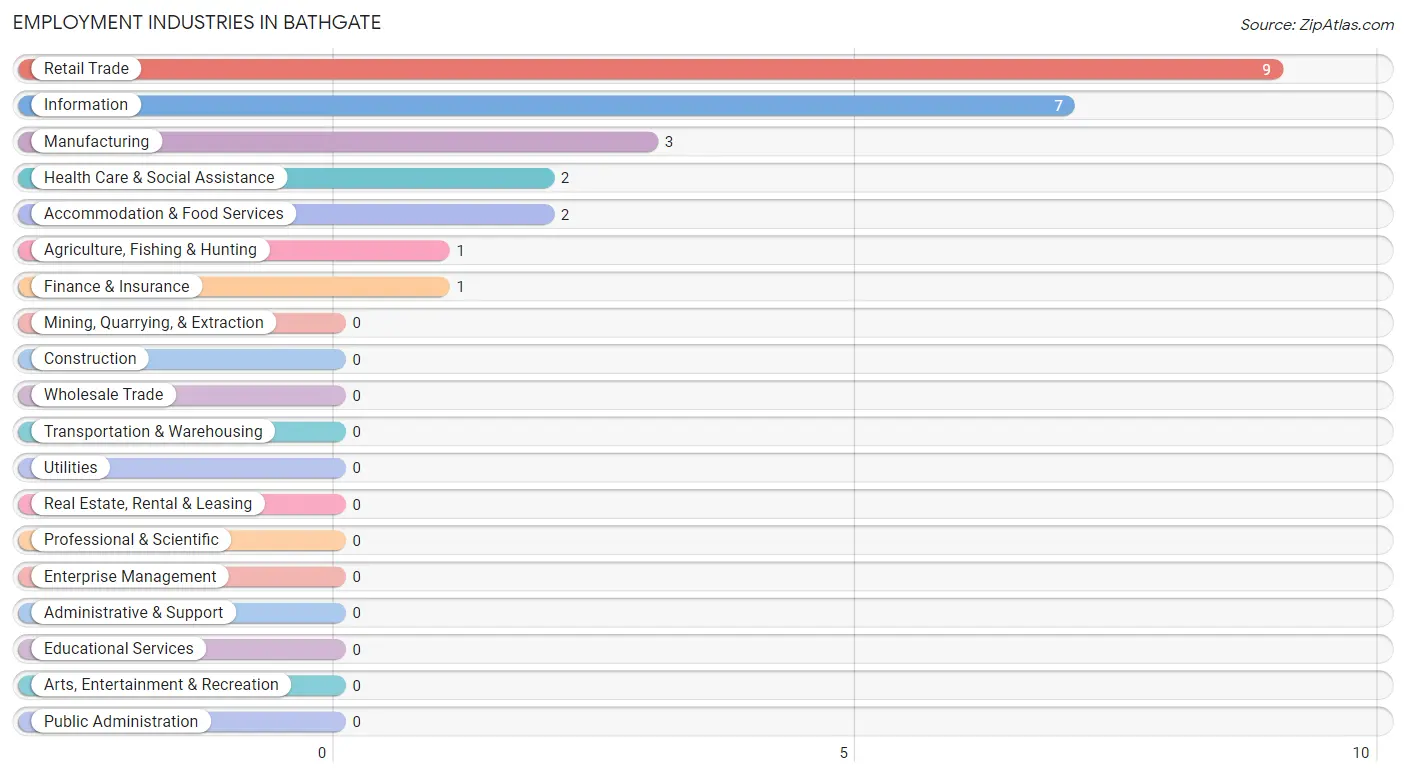
Employment Industries in Bathgate
The major employment industries in Bathgate include Retail Trade (9 | 36.0%), Information (7 | 28.0%), Manufacturing (3 | 12.0%), Health Care & Social Assistance (2 | 8.0%), and Accommodation & Food Services (2 | 8.0%).
Employment Industries by Sex in Bathgate
The Bathgate industries that see more men than women are Agriculture, Fishing & Hunting (100.0%), Finance & Insurance (100.0%), and Accommodation & Food Services (100.0%), whereas the industries that tend to have a higher number of women are Manufacturing (100.0%), Retail Trade (100.0%), and Health Care & Social Assistance (100.0%).
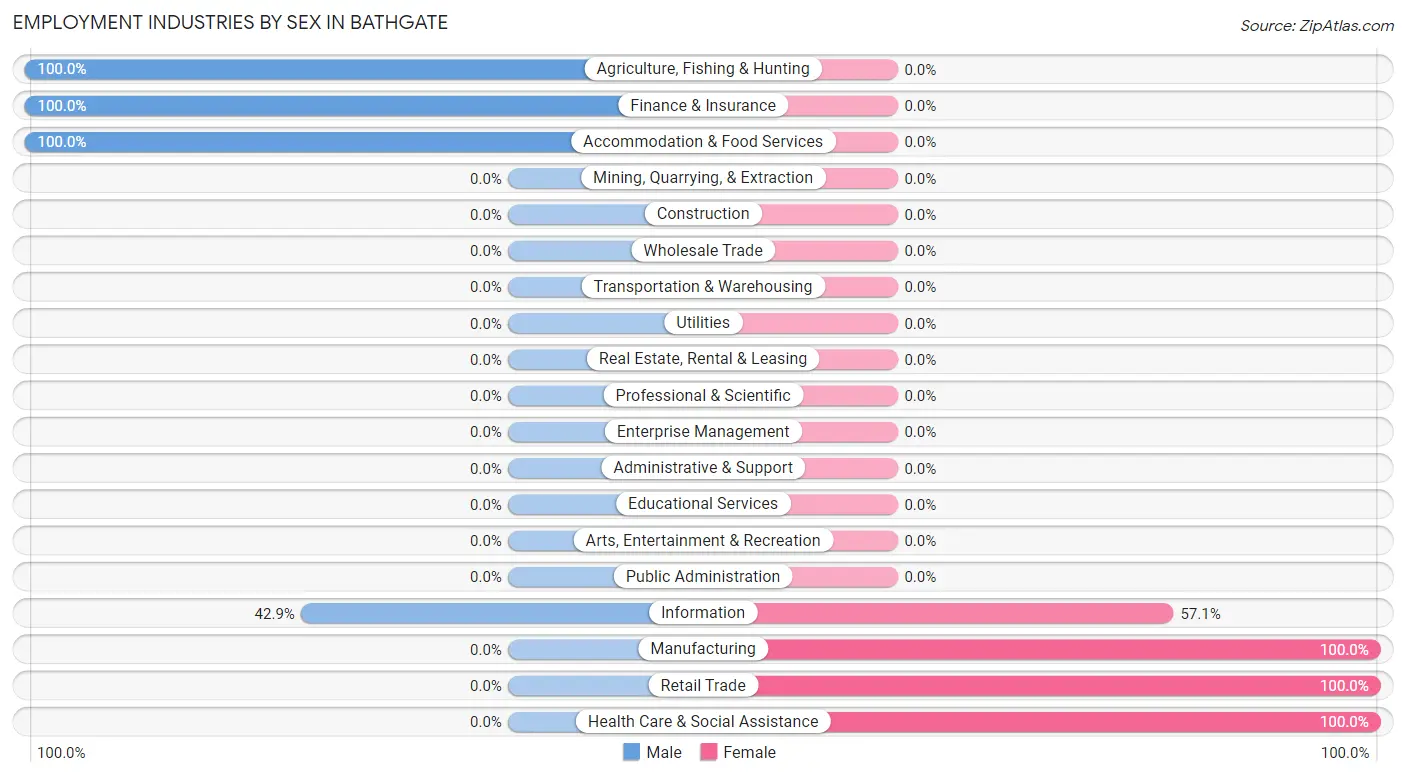
| Industry | Male | Female |
| Agriculture, Fishing & Hunting | 1 (100.0%) | 0 (0.0%) |
| Mining, Quarrying, & Extraction | 0 (0.0%) | 0 (0.0%) |
| Construction | 0 (0.0%) | 0 (0.0%) |
| Manufacturing | 0 (0.0%) | 3 (100.0%) |
| Wholesale Trade | 0 (0.0%) | 0 (0.0%) |
| Retail Trade | 0 (0.0%) | 9 (100.0%) |
| Transportation & Warehousing | 0 (0.0%) | 0 (0.0%) |
| Utilities | 0 (0.0%) | 0 (0.0%) |
| Information | 3 (42.9%) | 4 (57.1%) |
| Finance & Insurance | 1 (100.0%) | 0 (0.0%) |
| Real Estate, Rental & Leasing | 0 (0.0%) | 0 (0.0%) |
| Professional & Scientific | 0 (0.0%) | 0 (0.0%) |
| Enterprise Management | 0 (0.0%) | 0 (0.0%) |
| Administrative & Support | 0 (0.0%) | 0 (0.0%) |
| Educational Services | 0 (0.0%) | 0 (0.0%) |
| Health Care & Social Assistance | 0 (0.0%) | 2 (100.0%) |
| Arts, Entertainment & Recreation | 0 (0.0%) | 0 (0.0%) |
| Accommodation & Food Services | 2 (100.0%) | 0 (0.0%) |
| Public Administration | 0 (0.0%) | 0 (0.0%) |
| Total | 7 (28.0%) | 18 (72.0%) |
Education in Bathgate
School Enrollment in Bathgate
The most common levels of schooling among the 3 students in Bathgate are kindergarten (1 | 33.3%), elementary school (1 | 33.3%), and college / undergraduate (1 | 33.3%).
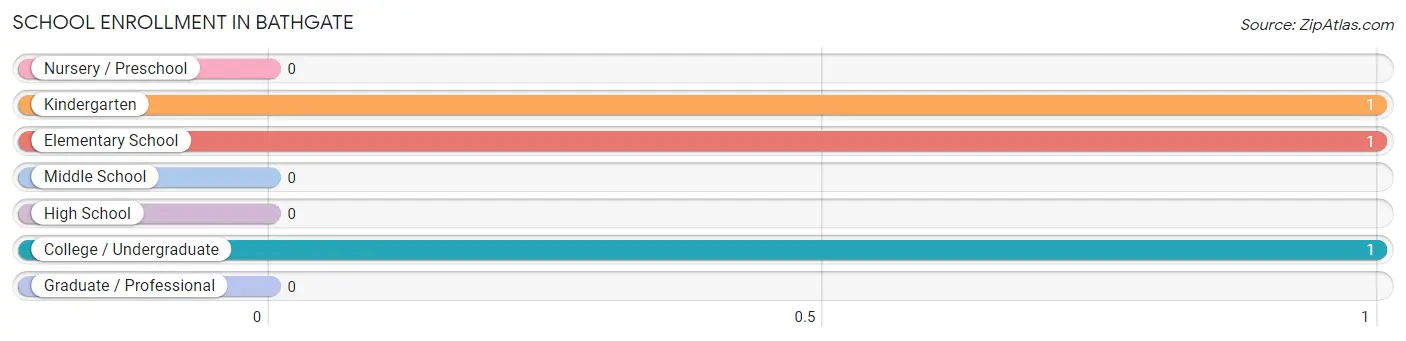
| School Level | # Students | % Students |
| Nursery / Preschool | 0 | 0.0% |
| Kindergarten | 1 | 33.3% |
| Elementary School | 1 | 33.3% |
| Middle School | 0 | 0.0% |
| High School | 0 | 0.0% |
| College / Undergraduate | 1 | 33.3% |
| Graduate / Professional | 0 | 0.0% |
| Total | 3 | 100.0% |
School Enrollment by Age by Funding Source in Bathgate
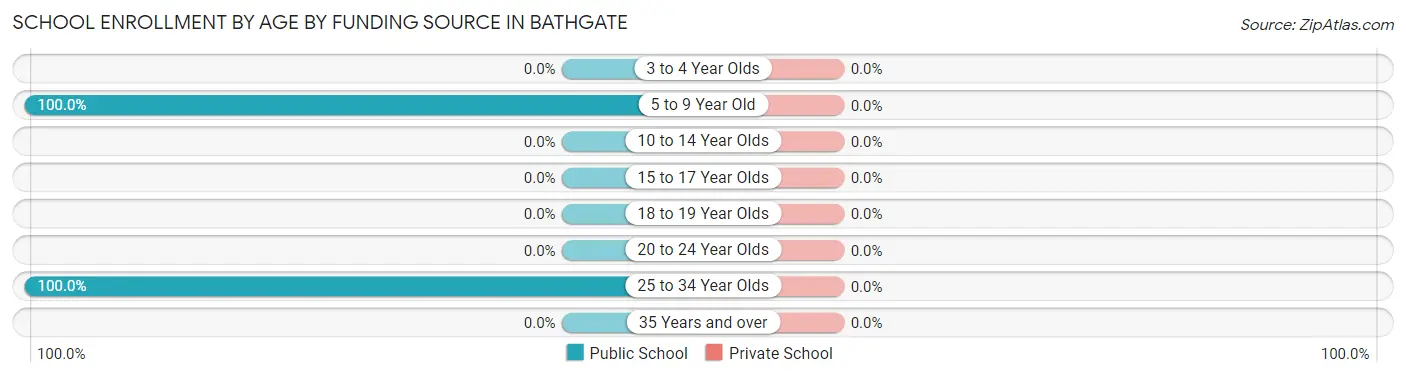
| Age Bracket | Public School | Private School |
| 3 to 4 Year Olds | 0 (0.0%) | 0 (0.0%) |
| 5 to 9 Year Old | 2 (100.0%) | 0 (0.0%) |
| 10 to 14 Year Olds | 0 (0.0%) | 0 (0.0%) |
| 15 to 17 Year Olds | 0 (0.0%) | 0 (0.0%) |
| 18 to 19 Year Olds | 0 (0.0%) | 0 (0.0%) |
| 20 to 24 Year Olds | 0 (0.0%) | 0 (0.0%) |
| 25 to 34 Year Olds | 1 (100.0%) | 0 (0.0%) |
| 35 Years and over | 0 (0.0%) | 0 (0.0%) |
| Total | 3 (100.0%) | 0 (0.0%) |
Educational Attainment by Field of Study in Bathgate
Liberal arts & history (6 | 40.0%), science & technology (4 | 26.7%), literature & languages (3 | 20.0%), business (1 | 6.7%), and communications (1 | 6.7%) are the most common fields of study among 15 individuals in Bathgate who have obtained a bachelor's degree or higher.
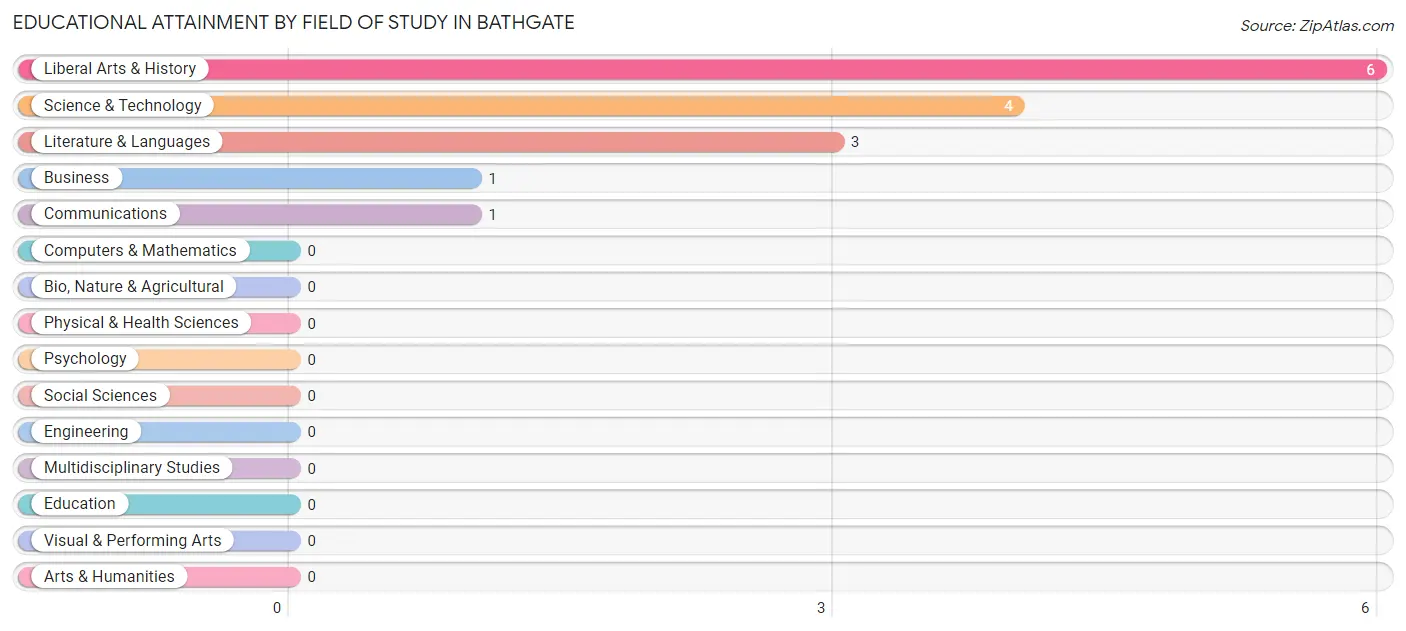
| Field of Study | # Graduates | % Graduates |
| Computers & Mathematics | 0 | 0.0% |
| Bio, Nature & Agricultural | 0 | 0.0% |
| Physical & Health Sciences | 0 | 0.0% |
| Psychology | 0 | 0.0% |
| Social Sciences | 0 | 0.0% |
| Engineering | 0 | 0.0% |
| Multidisciplinary Studies | 0 | 0.0% |
| Science & Technology | 4 | 26.7% |
| Business | 1 | 6.7% |
| Education | 0 | 0.0% |
| Literature & Languages | 3 | 20.0% |
| Liberal Arts & History | 6 | 40.0% |
| Visual & Performing Arts | 0 | 0.0% |
| Communications | 1 | 6.7% |
| Arts & Humanities | 0 | 0.0% |
| Total | 15 | 100.0% |
Transportation & Commute in Bathgate
Vehicle Availability by Sex in Bathgate
The most prevalent vehicle ownership categories in Bathgate are males with no vehicle (3, accounting for 42.9%) and females with no vehicle (4, making up 33.3%).
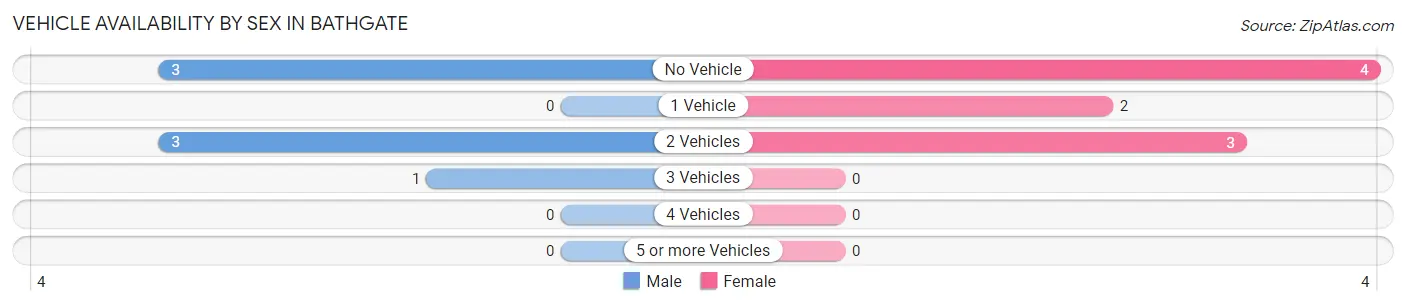
| Vehicles Available | Male | Female |
| No Vehicle | 3 (42.9%) | 4 (44.4%) |
| 1 Vehicle | 0 (0.0%) | 2 (22.2%) |
| 2 Vehicles | 3 (42.9%) | 3 (33.3%) |
| 3 Vehicles | 1 (14.3%) | 0 (0.0%) |
| 4 Vehicles | 0 (0.0%) | 0 (0.0%) |
| 5 or more Vehicles | 0 (0.0%) | 0 (0.0%) |
| Total | 7 (100.0%) | 9 (100.0%) |
Commute Time in Bathgate
The most frequently occuring commute durations in Bathgate are 25 to 29 minutes (9 commuters, 39.1%), 15 to 19 minutes (7 commuters, 30.4%), and 20 to 24 minutes (3 commuters, 13.0%).
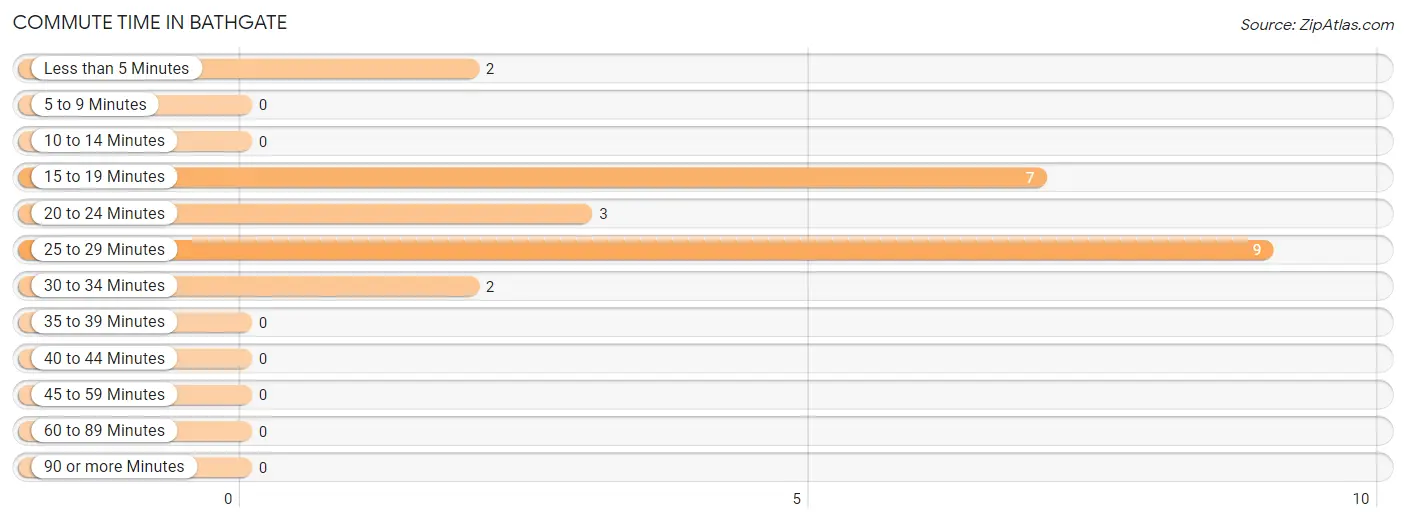
| Commute Time | # Commuters | % Commuters |
| Less than 5 Minutes | 2 | 8.7% |
| 5 to 9 Minutes | 0 | 0.0% |
| 10 to 14 Minutes | 0 | 0.0% |
| 15 to 19 Minutes | 7 | 30.4% |
| 20 to 24 Minutes | 3 | 13.0% |
| 25 to 29 Minutes | 9 | 39.1% |
| 30 to 34 Minutes | 2 | 8.7% |
| 35 to 39 Minutes | 0 | 0.0% |
| 40 to 44 Minutes | 0 | 0.0% |
| 45 to 59 Minutes | 0 | 0.0% |
| 60 to 89 Minutes | 0 | 0.0% |
| 90 or more Minutes | 0 | 0.0% |
Commute Time by Sex in Bathgate
The most common commute times in Bathgate are 15 to 19 minutes (3 commuters, 42.9%) for males and 25 to 29 minutes (9 commuters, 56.2%) for females.
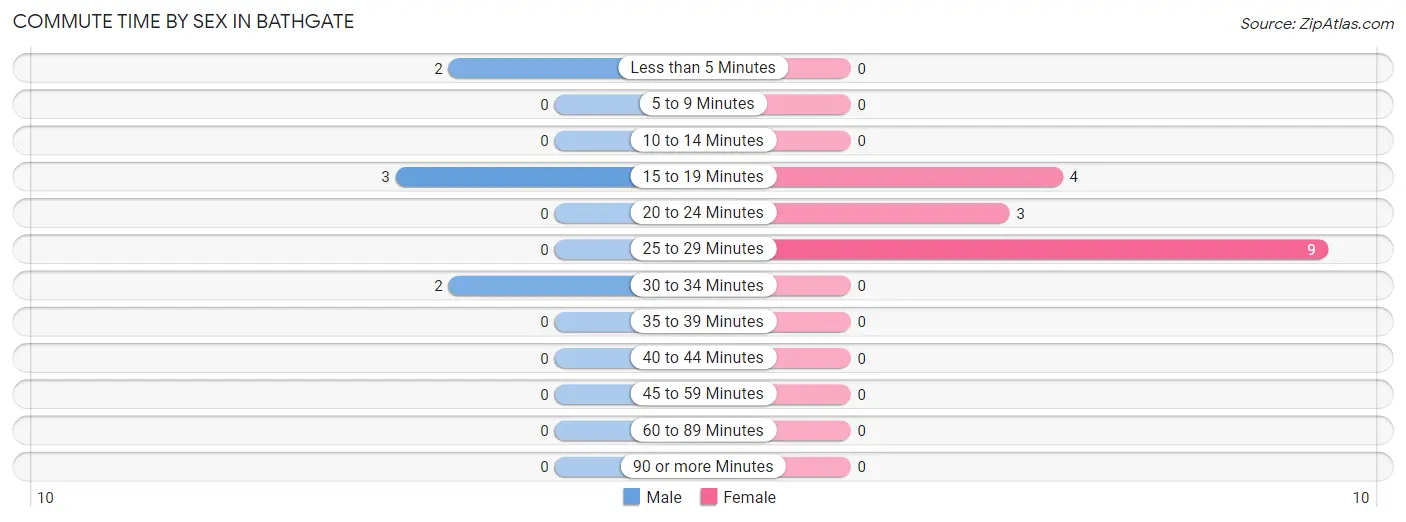
| Commute Time | Male | Female |
| Less than 5 Minutes | 2 (28.6%) | 0 (0.0%) |
| 5 to 9 Minutes | 0 (0.0%) | 0 (0.0%) |
| 10 to 14 Minutes | 0 (0.0%) | 0 (0.0%) |
| 15 to 19 Minutes | 3 (42.9%) | 4 (25.0%) |
| 20 to 24 Minutes | 0 (0.0%) | 3 (18.8%) |
| 25 to 29 Minutes | 0 (0.0%) | 9 (56.2%) |
| 30 to 34 Minutes | 2 (28.6%) | 0 (0.0%) |
| 35 to 39 Minutes | 0 (0.0%) | 0 (0.0%) |
| 40 to 44 Minutes | 0 (0.0%) | 0 (0.0%) |
| 45 to 59 Minutes | 0 (0.0%) | 0 (0.0%) |
| 60 to 89 Minutes | 0 (0.0%) | 0 (0.0%) |
| 90 or more Minutes | 0 (0.0%) | 0 (0.0%) |
Time of Departure to Work by Sex in Bathgate
The most frequent times of departure to work in Bathgate are 8:00 AM to 8:29 AM (3, 42.9%) for males and 12:00 PM to 3:59 PM (9, 56.2%) for females.
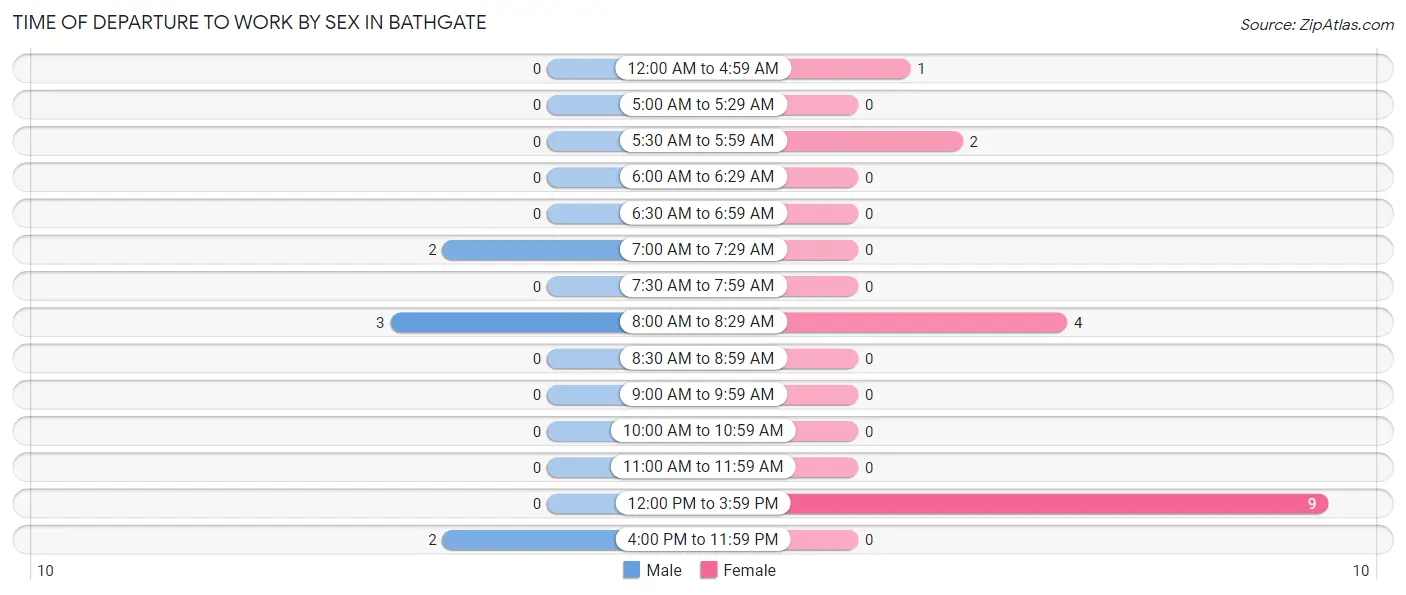
| Time of Departure | Male | Female |
| 12:00 AM to 4:59 AM | 0 (0.0%) | 1 (6.2%) |
| 5:00 AM to 5:29 AM | 0 (0.0%) | 0 (0.0%) |
| 5:30 AM to 5:59 AM | 0 (0.0%) | 2 (12.5%) |
| 6:00 AM to 6:29 AM | 0 (0.0%) | 0 (0.0%) |
| 6:30 AM to 6:59 AM | 0 (0.0%) | 0 (0.0%) |
| 7:00 AM to 7:29 AM | 2 (28.6%) | 0 (0.0%) |
| 7:30 AM to 7:59 AM | 0 (0.0%) | 0 (0.0%) |
| 8:00 AM to 8:29 AM | 3 (42.9%) | 4 (25.0%) |
| 8:30 AM to 8:59 AM | 0 (0.0%) | 0 (0.0%) |
| 9:00 AM to 9:59 AM | 0 (0.0%) | 0 (0.0%) |
| 10:00 AM to 10:59 AM | 0 (0.0%) | 0 (0.0%) |
| 11:00 AM to 11:59 AM | 0 (0.0%) | 0 (0.0%) |
| 12:00 PM to 3:59 PM | 0 (0.0%) | 9 (56.2%) |
| 4:00 PM to 11:59 PM | 2 (28.6%) | 0 (0.0%) |
| Total | 7 (100.0%) | 16 (100.0%) |
Housing Occupancy in Bathgate
Occupancy by Ownership in Bathgate
Of the total 17 dwellings in Bathgate, owner-occupied units account for 12 (70.6%), while renter-occupied units make up 5 (29.4%).
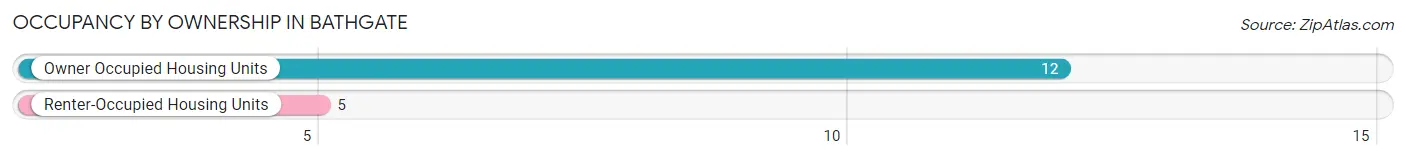
| Occupancy | # Housing Units | % Housing Units |
| Owner Occupied Housing Units | 12 | 70.6% |
| Renter-Occupied Housing Units | 5 | 29.4% |
| Total Occupied Housing Units | 17 | 100.0% |
Occupancy by Household Size in Bathgate
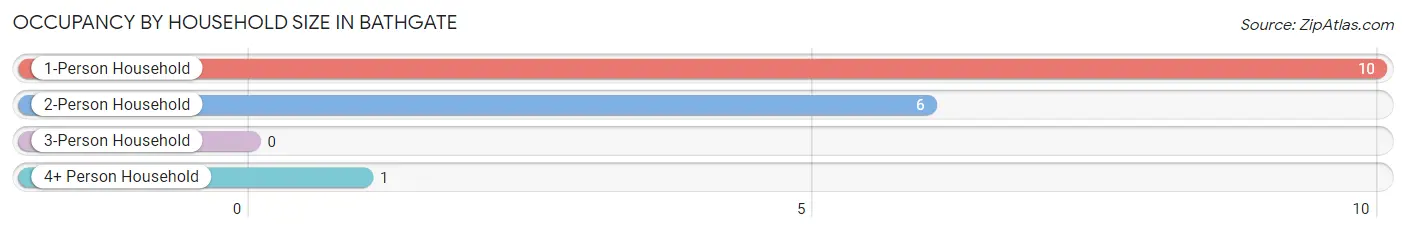
| Household Size | # Housing Units | % Housing Units |
| 1-Person Household | 10 | 58.8% |
| 2-Person Household | 6 | 35.3% |
| 3-Person Household | 0 | 0.0% |
| 4+ Person Household | 1 | 5.9% |
| Total Housing Units | 17 | 100.0% |
Occupancy by Ownership by Household Size in Bathgate
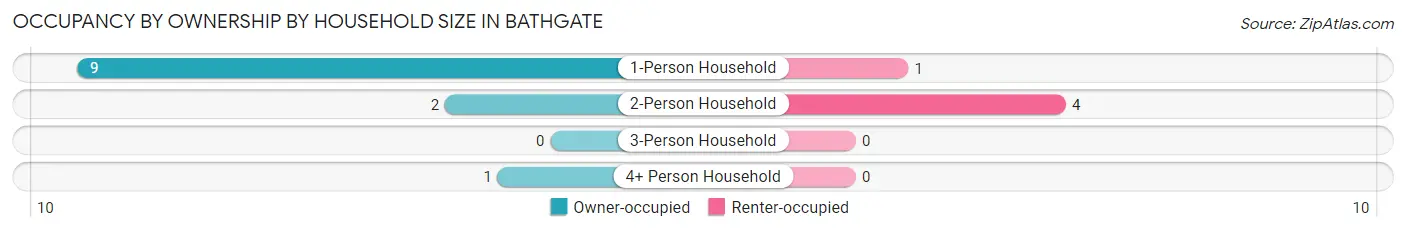
| Household Size | Owner-occupied | Renter-occupied |
| 1-Person Household | 9 (90.0%) | 1 (10.0%) |
| 2-Person Household | 2 (33.3%) | 4 (66.7%) |
| 3-Person Household | 0 (0.0%) | 0 (0.0%) |
| 4+ Person Household | 1 (100.0%) | 0 (0.0%) |
| Total Housing Units | 12 (70.6%) | 5 (29.4%) |
Occupancy by Educational Attainment in Bathgate
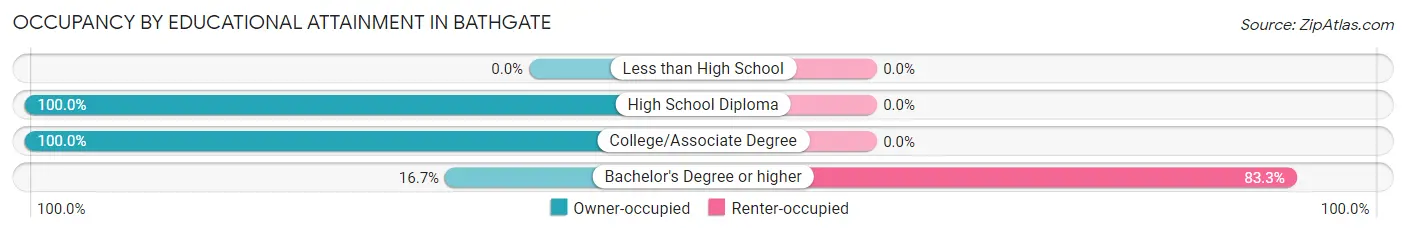
| Household Size | Owner-occupied | Renter-occupied |
| Less than High School | 0 (0.0%) | 0 (0.0%) |
| High School Diploma | 6 (100.0%) | 0 (0.0%) |
| College/Associate Degree | 5 (100.0%) | 0 (0.0%) |
| Bachelor's Degree or higher | 1 (16.7%) | 5 (83.3%) |
Occupancy by Age of Householder in Bathgate
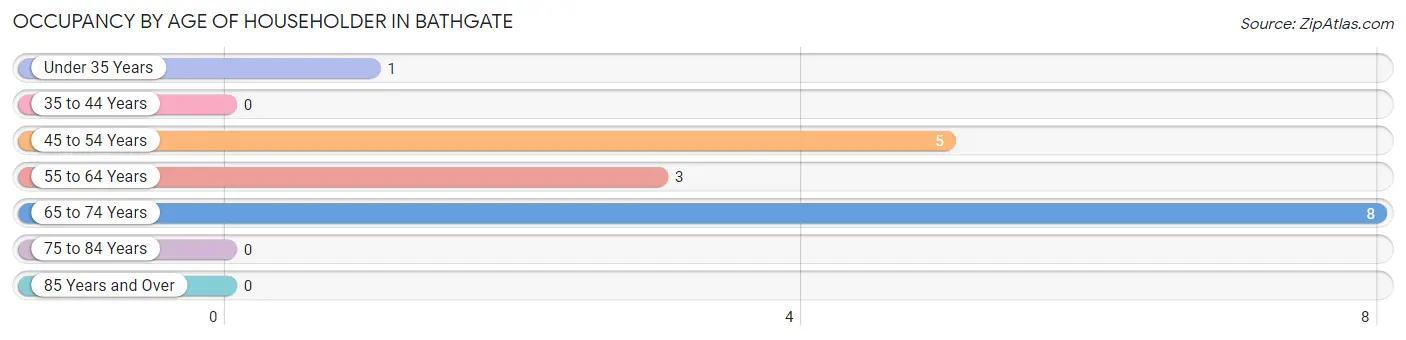
| Age Bracket | # Households | % Households |
| Under 35 Years | 1 | 5.9% |
| 35 to 44 Years | 0 | 0.0% |
| 45 to 54 Years | 5 | 29.4% |
| 55 to 64 Years | 3 | 17.6% |
| 65 to 74 Years | 8 | 47.1% |
| 75 to 84 Years | 0 | 0.0% |
| 85 Years and Over | 0 | 0.0% |
| Total | 17 | 100.0% |
Housing Finances in Bathgate
Median Income by Occupancy in Bathgate
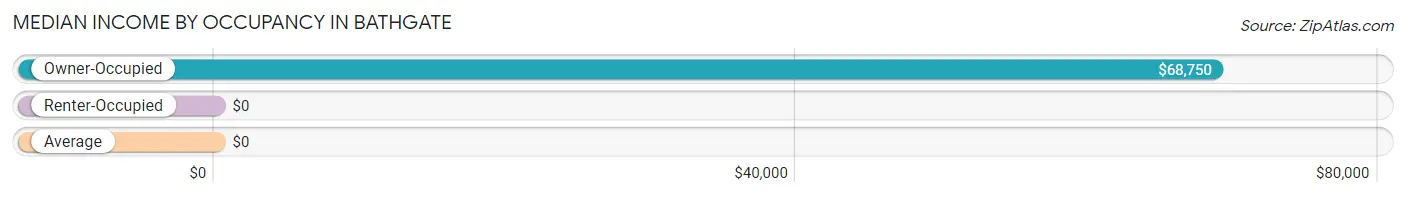
| Occupancy Type | # Households | Median Income |
| Owner-Occupied | 12 (70.6%) | $68,750 |
| Renter-Occupied | 5 (29.4%) | $0 |
| Average | 17 (100.0%) | $0 |
Occupancy by Householder Income Bracket in Bathgate
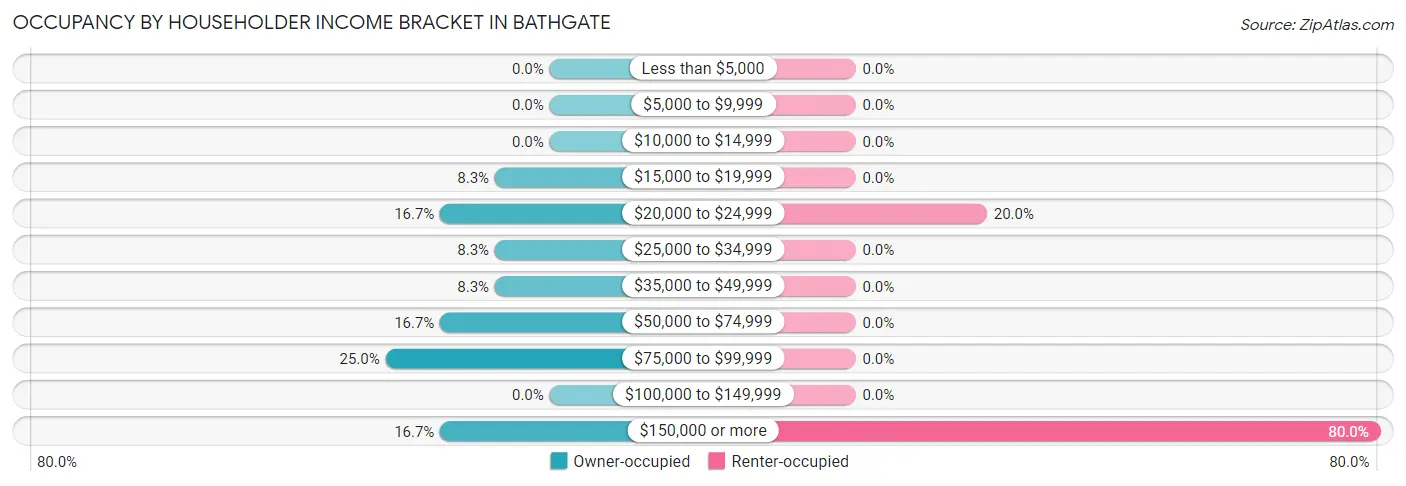
| Income Bracket | Owner-occupied | Renter-occupied |
| Less than $5,000 | 0 (0.0%) | 0 (0.0%) |
| $5,000 to $9,999 | 0 (0.0%) | 0 (0.0%) |
| $10,000 to $14,999 | 0 (0.0%) | 0 (0.0%) |
| $15,000 to $19,999 | 1 (8.3%) | 0 (0.0%) |
| $20,000 to $24,999 | 2 (16.7%) | 1 (20.0%) |
| $25,000 to $34,999 | 1 (8.3%) | 0 (0.0%) |
| $35,000 to $49,999 | 1 (8.3%) | 0 (0.0%) |
| $50,000 to $74,999 | 2 (16.7%) | 0 (0.0%) |
| $75,000 to $99,999 | 3 (25.0%) | 0 (0.0%) |
| $100,000 to $149,999 | 0 (0.0%) | 0 (0.0%) |
| $150,000 or more | 2 (16.7%) | 4 (80.0%) |
| Total | 12 (100.0%) | 5 (100.0%) |
Monthly Housing Cost Tiers in Bathgate
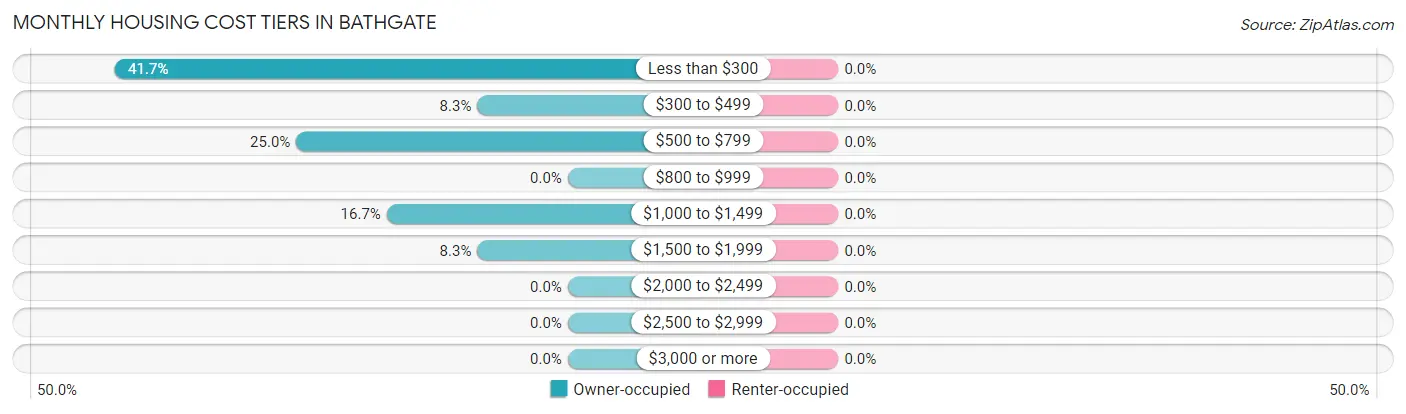
| Monthly Cost | Owner-occupied | Renter-occupied |
| Less than $300 | 5 (41.7%) | 0 (0.0%) |
| $300 to $499 | 1 (8.3%) | 0 (0.0%) |
| $500 to $799 | 3 (25.0%) | 0 (0.0%) |
| $800 to $999 | 0 (0.0%) | 0 (0.0%) |
| $1,000 to $1,499 | 2 (16.7%) | 0 (0.0%) |
| $1,500 to $1,999 | 1 (8.3%) | 0 (0.0%) |
| $2,000 to $2,499 | 0 (0.0%) | 0 (0.0%) |
| $2,500 to $2,999 | 0 (0.0%) | 0 (0.0%) |
| $3,000 or more | 0 (0.0%) | 0 (0.0%) |
| Total | 12 (100.0%) | 5 (100.0%) |
Physical Housing Characteristics in Bathgate
Housing Structures in Bathgate
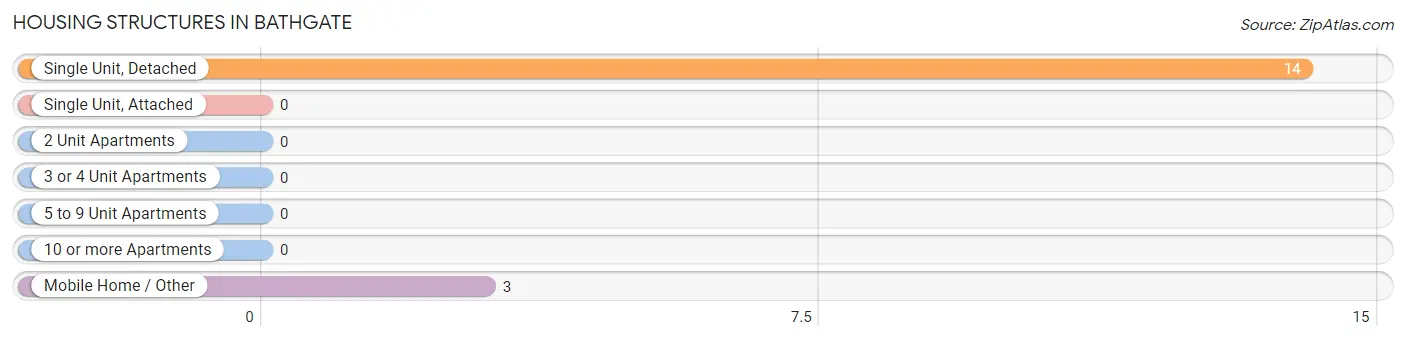
| Structure Type | # Housing Units | % Housing Units |
| Single Unit, Detached | 14 | 82.4% |
| Single Unit, Attached | 0 | 0.0% |
| 2 Unit Apartments | 0 | 0.0% |
| 3 or 4 Unit Apartments | 0 | 0.0% |
| 5 to 9 Unit Apartments | 0 | 0.0% |
| 10 or more Apartments | 0 | 0.0% |
| Mobile Home / Other | 3 | 17.6% |
| Total | 17 | 100.0% |
Housing Structures by Occupancy in Bathgate
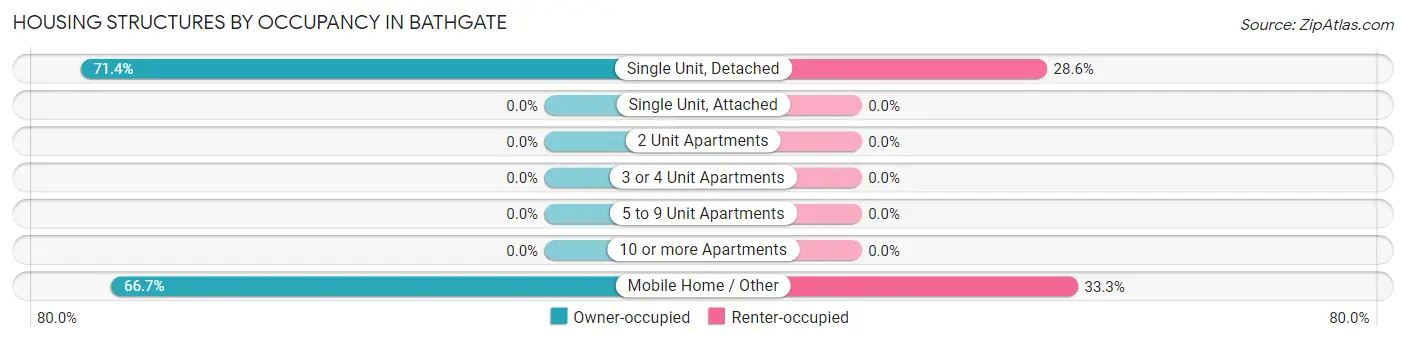
| Structure Type | Owner-occupied | Renter-occupied |
| Single Unit, Detached | 10 (71.4%) | 4 (28.6%) |
| Single Unit, Attached | 0 (0.0%) | 0 (0.0%) |
| 2 Unit Apartments | 0 (0.0%) | 0 (0.0%) |
| 3 or 4 Unit Apartments | 0 (0.0%) | 0 (0.0%) |
| 5 to 9 Unit Apartments | 0 (0.0%) | 0 (0.0%) |
| 10 or more Apartments | 0 (0.0%) | 0 (0.0%) |
| Mobile Home / Other | 2 (66.7%) | 1 (33.3%) |
| Total | 12 (70.6%) | 5 (29.4%) |
Housing Structures by Number of Rooms in Bathgate
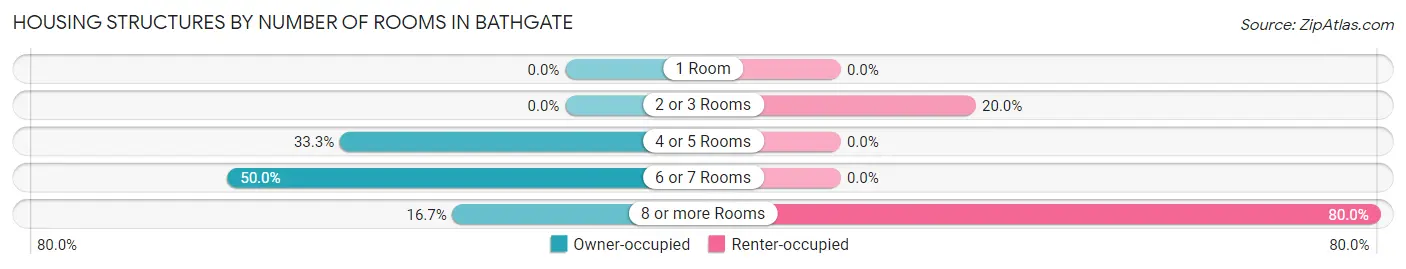
| Number of Rooms | Owner-occupied | Renter-occupied |
| 1 Room | 0 (0.0%) | 0 (0.0%) |
| 2 or 3 Rooms | 0 (0.0%) | 1 (20.0%) |
| 4 or 5 Rooms | 4 (33.3%) | 0 (0.0%) |
| 6 or 7 Rooms | 6 (50.0%) | 0 (0.0%) |
| 8 or more Rooms | 2 (16.7%) | 4 (80.0%) |
| Total | 12 (100.0%) | 5 (100.0%) |
Housing Structure by Heating Type in Bathgate
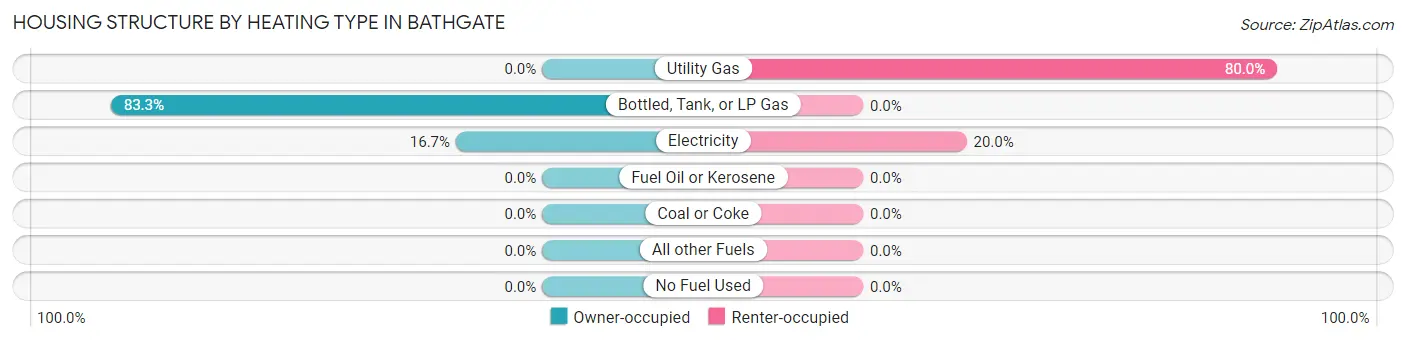
| Heating Type | Owner-occupied | Renter-occupied |
| Utility Gas | 0 (0.0%) | 4 (80.0%) |
| Bottled, Tank, or LP Gas | 10 (83.3%) | 0 (0.0%) |
| Electricity | 2 (16.7%) | 1 (20.0%) |
| Fuel Oil or Kerosene | 0 (0.0%) | 0 (0.0%) |
| Coal or Coke | 0 (0.0%) | 0 (0.0%) |
| All other Fuels | 0 (0.0%) | 0 (0.0%) |
| No Fuel Used | 0 (0.0%) | 0 (0.0%) |
| Total | 12 (100.0%) | 5 (100.0%) |
Household Vehicle Usage in Bathgate
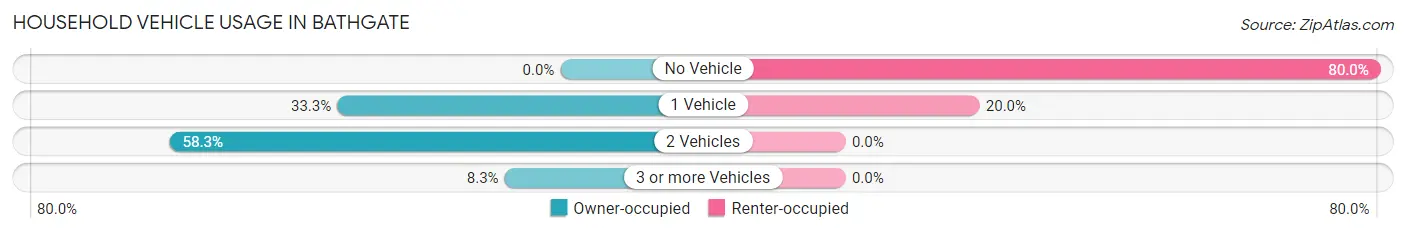
| Vehicles per Household | Owner-occupied | Renter-occupied |
| No Vehicle | 0 (0.0%) | 4 (80.0%) |
| 1 Vehicle | 4 (33.3%) | 1 (20.0%) |
| 2 Vehicles | 7 (58.3%) | 0 (0.0%) |
| 3 or more Vehicles | 1 (8.3%) | 0 (0.0%) |
| Total | 12 (100.0%) | 5 (100.0%) |
Real Estate & Mortgages in Bathgate
Real Estate and Mortgage Overview in Bathgate
| Characteristic | Without Mortgage | With Mortgage |
| Housing Units | 9 | 3 |
| Median Property Value | $33,800 | $0 |
| Median Household Income | $68,125 | $2 |
| Monthly Housing Costs | $294 | $0 |
| Real Estate Taxes | - | - |
Property Value by Mortgage Status in Bathgate
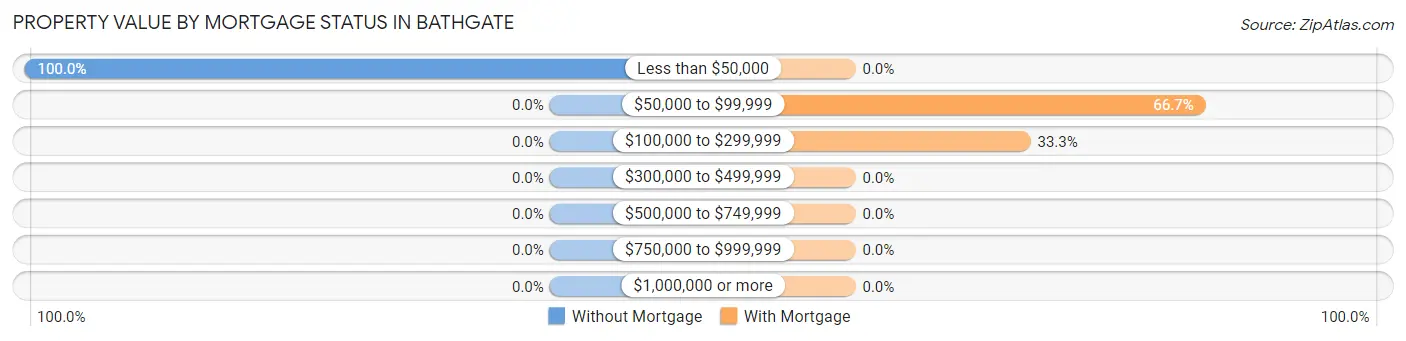
| Property Value | Without Mortgage | With Mortgage |
| Less than $50,000 | 9 (100.0%) | 0 (0.0%) |
| $50,000 to $99,999 | 0 (0.0%) | 2 (66.7%) |
| $100,000 to $299,999 | 0 (0.0%) | 1 (33.3%) |
| $300,000 to $499,999 | 0 (0.0%) | 0 (0.0%) |
| $500,000 to $749,999 | 0 (0.0%) | 0 (0.0%) |
| $750,000 to $999,999 | 0 (0.0%) | 0 (0.0%) |
| $1,000,000 or more | 0 (0.0%) | 0 (0.0%) |
| Total | 9 (100.0%) | 3 (100.0%) |
Household Income by Mortgage Status in Bathgate
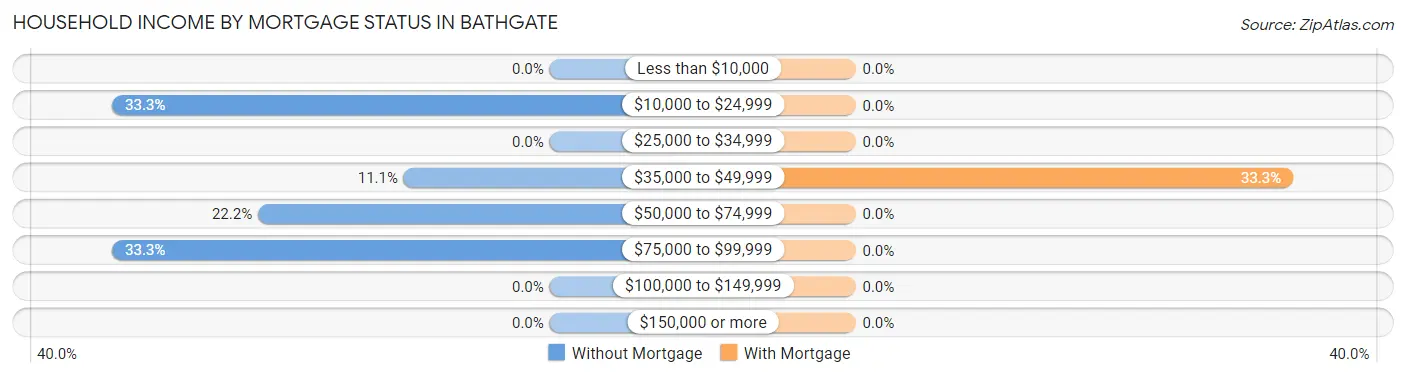
| Household Income | Without Mortgage | With Mortgage |
| Less than $10,000 | 0 (0.0%) | 0 (0.0%) |
| $10,000 to $24,999 | 3 (33.3%) | 0 (0.0%) |
| $25,000 to $34,999 | 0 (0.0%) | 0 (0.0%) |
| $35,000 to $49,999 | 1 (11.1%) | 1 (33.3%) |
| $50,000 to $74,999 | 2 (22.2%) | 0 (0.0%) |
| $75,000 to $99,999 | 3 (33.3%) | 0 (0.0%) |
| $100,000 to $149,999 | 0 (0.0%) | 0 (0.0%) |
| $150,000 or more | 0 (0.0%) | 0 (0.0%) |
| Total | 9 (100.0%) | 3 (100.0%) |
Property Value to Household Income Ratio in Bathgate
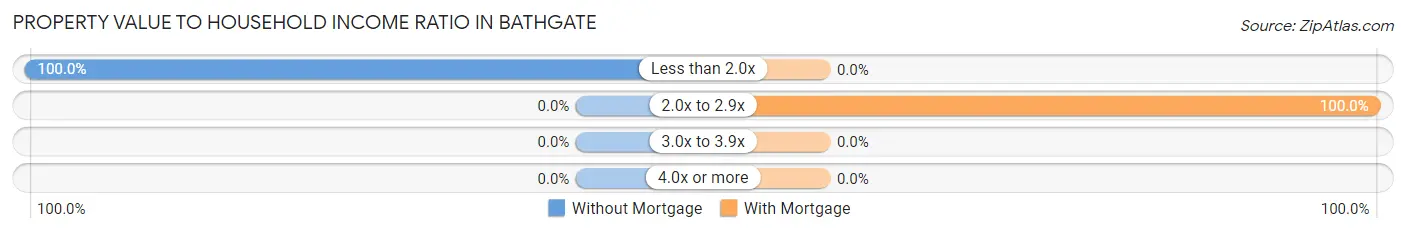
| Value-to-Income Ratio | Without Mortgage | With Mortgage |
| Less than 2.0x | 9 (100.0%) | 0 (0.0%) |
| 2.0x to 2.9x | 0 (0.0%) | 3 (100.0%) |
| 3.0x to 3.9x | 0 (0.0%) | 0 (0.0%) |
| 4.0x or more | 0 (0.0%) | 0 (0.0%) |
| Total | 9 (100.0%) | 3 (100.0%) |
Real Estate Taxes by Mortgage Status in Bathgate
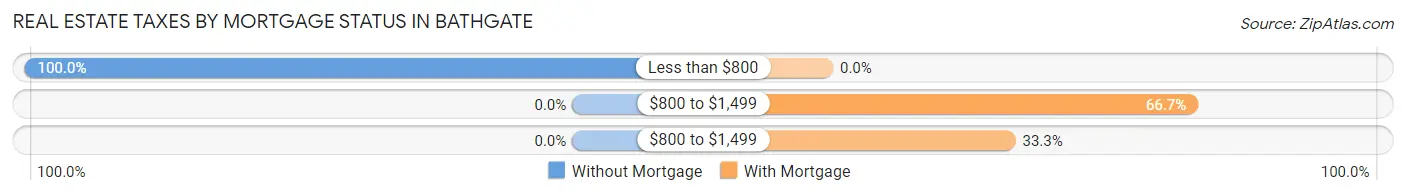
| Property Taxes | Without Mortgage | With Mortgage |
| Less than $800 | 9 (100.0%) | 0 (0.0%) |
| $800 to $1,499 | 0 (0.0%) | 2 (66.7%) |
| $800 to $1,499 | 0 (0.0%) | 1 (33.3%) |
| Total | 9 (100.0%) | 3 (100.0%) |
Health & Disability in Bathgate
Health Insurance Coverage by Age in Bathgate
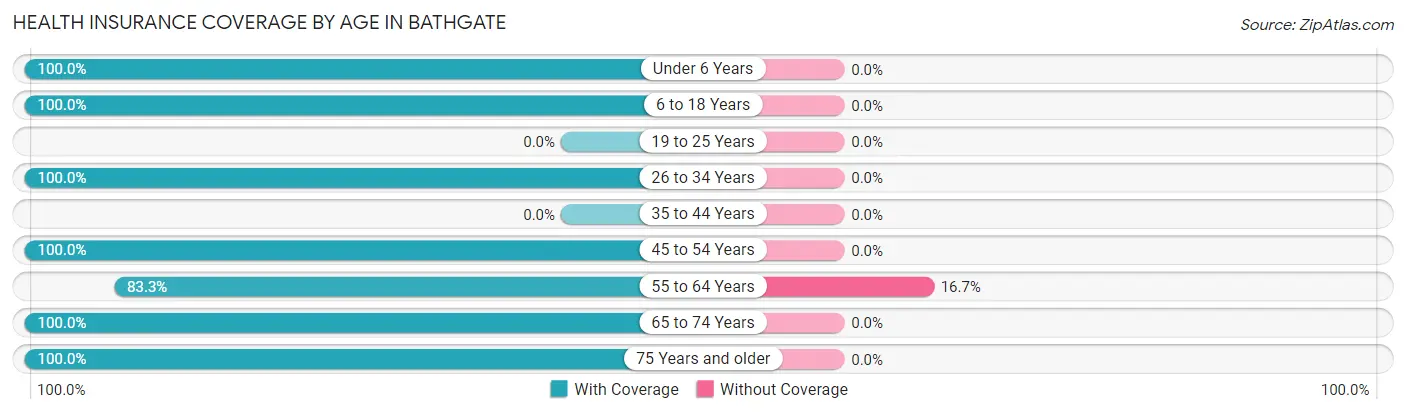
| Age Bracket | With Coverage | Without Coverage |
| Under 6 Years | 2 (100.0%) | 0 (0.0%) |
| 6 to 18 Years | 1 (100.0%) | 0 (0.0%) |
| 19 to 25 Years | 0 (0.0%) | 0 (0.0%) |
| 26 to 34 Years | 11 (100.0%) | 0 (0.0%) |
| 35 to 44 Years | 0 (0.0%) | 0 (0.0%) |
| 45 to 54 Years | 5 (100.0%) | 0 (0.0%) |
| 55 to 64 Years | 10 (83.3%) | 2 (16.7%) |
| 65 to 74 Years | 12 (100.0%) | 0 (0.0%) |
| 75 Years and older | 5 (100.0%) | 0 (0.0%) |
| Total | 46 (95.8%) | 2 (4.2%) |
Health Insurance Coverage by Citizenship Status in Bathgate
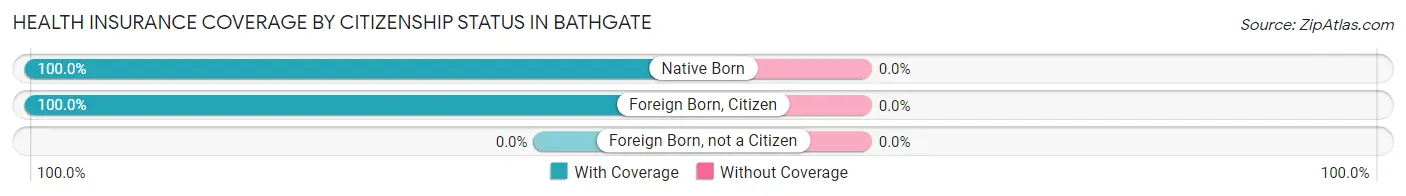
| Citizenship Status | With Coverage | Without Coverage |
| Native Born | 2 (100.0%) | 0 (0.0%) |
| Foreign Born, Citizen | 1 (100.0%) | 0 (0.0%) |
| Foreign Born, not a Citizen | 0 (0.0%) | 0 (0.0%) |
Health Insurance Coverage by Household Income in Bathgate
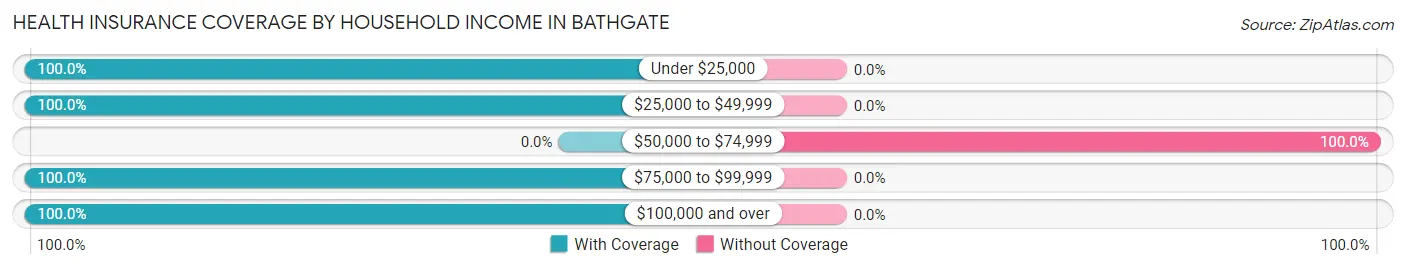
| Household Income | With Coverage | Without Coverage |
| Under $25,000 | 5 (100.0%) | 0 (0.0%) |
| $25,000 to $49,999 | 2 (100.0%) | 0 (0.0%) |
| $50,000 to $74,999 | 0 (0.0%) | 2 (100.0%) |
| $75,000 to $99,999 | 3 (100.0%) | 0 (0.0%) |
| $100,000 and over | 14 (100.0%) | 0 (0.0%) |
Public vs Private Health Insurance Coverage by Age in Bathgate
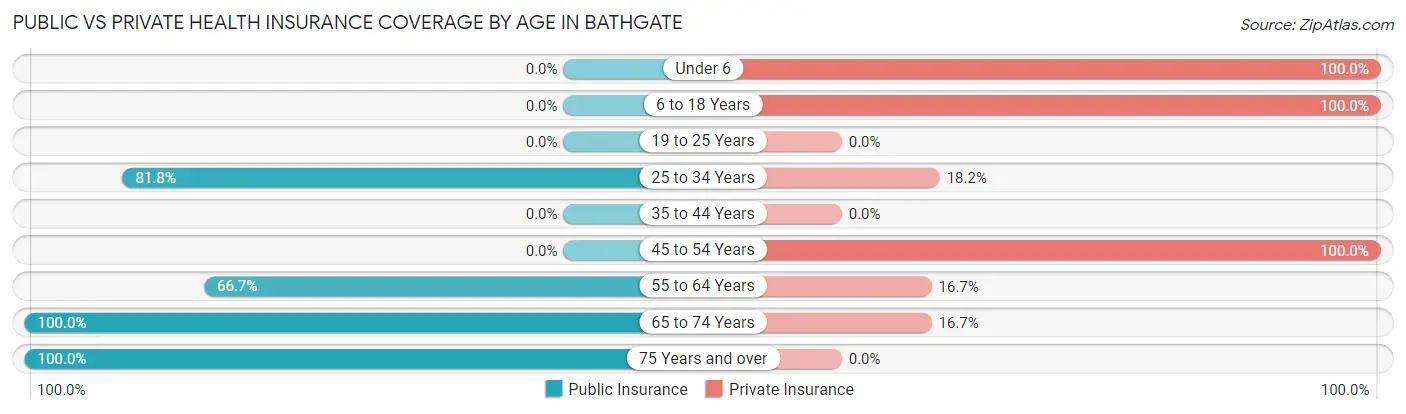
| Age Bracket | Public Insurance | Private Insurance |
| Under 6 | 0 (0.0%) | 2 (100.0%) |
| 6 to 18 Years | 0 (0.0%) | 1 (100.0%) |
| 19 to 25 Years | 0 (0.0%) | 0 (0.0%) |
| 25 to 34 Years | 9 (81.8%) | 2 (18.2%) |
| 35 to 44 Years | 0 (0.0%) | 0 (0.0%) |
| 45 to 54 Years | 0 (0.0%) | 5 (100.0%) |
| 55 to 64 Years | 8 (66.7%) | 2 (16.7%) |
| 65 to 74 Years | 12 (100.0%) | 2 (16.7%) |
| 75 Years and over | 5 (100.0%) | 0 (0.0%) |
| Total | 34 (70.8%) | 14 (29.2%) |
Disability Status by Sex by Age in Bathgate
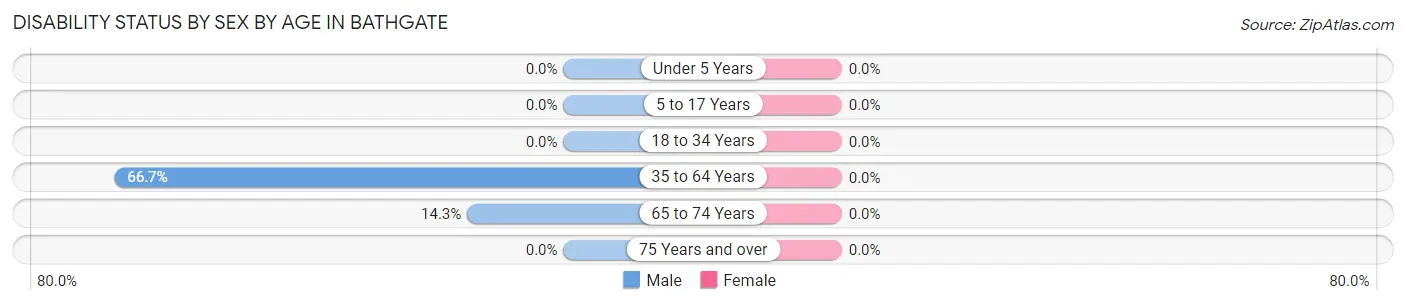
| Age Bracket | Male | Female |
| Under 5 Years | 0 (0.0%) | 0 (0.0%) |
| 5 to 17 Years | 0 (0.0%) | 0 (0.0%) |
| 18 to 34 Years | 0 (0.0%) | 0 (0.0%) |
| 35 to 64 Years | 8 (66.7%) | 0 (0.0%) |
| 65 to 74 Years | 1 (14.3%) | 0 (0.0%) |
| 75 Years and over | 0 (0.0%) | 0 (0.0%) |
Disability Class by Sex by Age in Bathgate
Disability Class: Hearing Difficulty
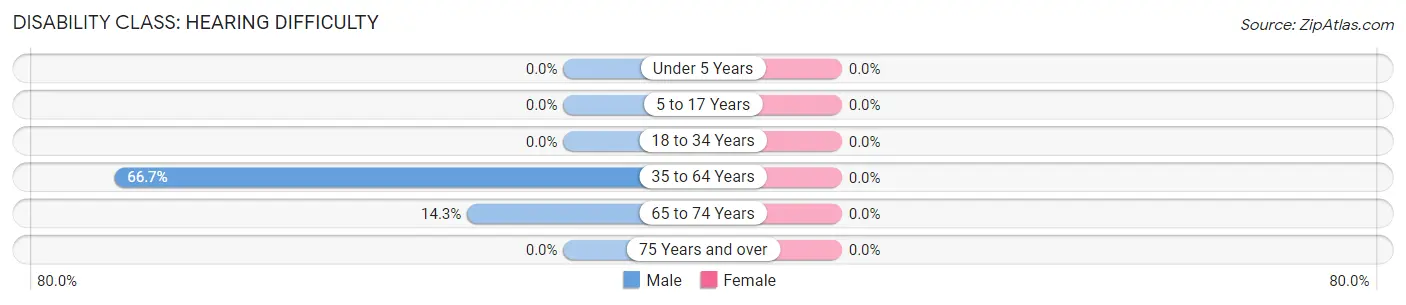
| Age Bracket | Male | Female |
| Under 5 Years | 0 (0.0%) | 0 (0.0%) |
| 5 to 17 Years | 0 (0.0%) | 0 (0.0%) |
| 18 to 34 Years | 0 (0.0%) | 0 (0.0%) |
| 35 to 64 Years | 8 (66.7%) | 0 (0.0%) |
| 65 to 74 Years | 1 (14.3%) | 0 (0.0%) |
| 75 Years and over | 0 (0.0%) | 0 (0.0%) |
Disability Class: Vision Difficulty
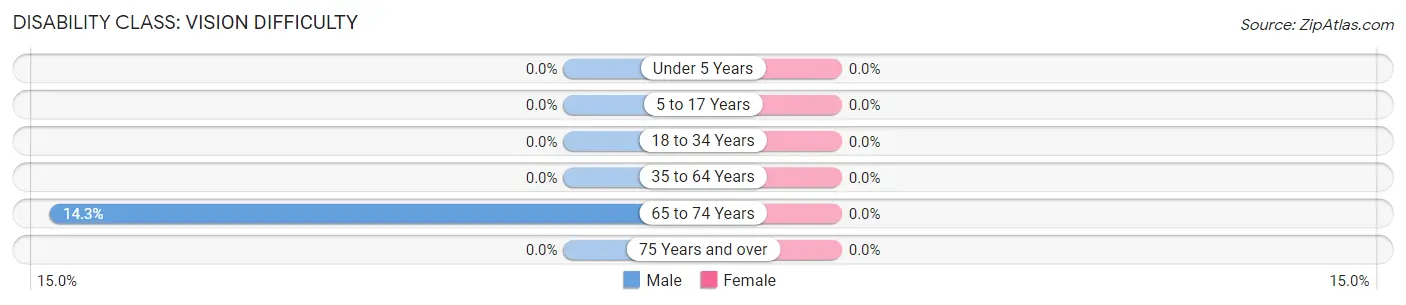
| Age Bracket | Male | Female |
| Under 5 Years | 0 (0.0%) | 0 (0.0%) |
| 5 to 17 Years | 0 (0.0%) | 0 (0.0%) |
| 18 to 34 Years | 0 (0.0%) | 0 (0.0%) |
| 35 to 64 Years | 0 (0.0%) | 0 (0.0%) |
| 65 to 74 Years | 1 (14.3%) | 0 (0.0%) |
| 75 Years and over | 0 (0.0%) | 0 (0.0%) |
Disability Class: Cognitive Difficulty
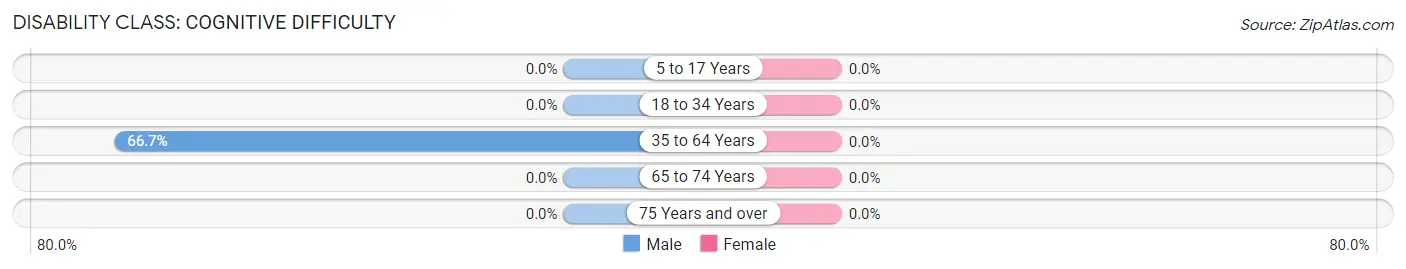
| Age Bracket | Male | Female |
| 5 to 17 Years | 0 (0.0%) | 0 (0.0%) |
| 18 to 34 Years | 0 (0.0%) | 0 (0.0%) |
| 35 to 64 Years | 8 (66.7%) | 0 (0.0%) |
| 65 to 74 Years | 0 (0.0%) | 0 (0.0%) |
| 75 Years and over | 0 (0.0%) | 0 (0.0%) |
Disability Class: Ambulatory Difficulty
| Age Bracket | Male | Female |
| 5 to 17 Years | 0 (0.0%) | 0 (0.0%) |
| 18 to 34 Years | 0 (0.0%) | 0 (0.0%) |
| 35 to 64 Years | 0 (0.0%) | 0 (0.0%) |
| 65 to 74 Years | 0 (0.0%) | 0 (0.0%) |
| 75 Years and over | 0 (0.0%) | 0 (0.0%) |
Disability Class: Self-Care Difficulty
| Age Bracket | Male | Female |
| 5 to 17 Years | 0 (0.0%) | 0 (0.0%) |
| 18 to 34 Years | 0 (0.0%) | 0 (0.0%) |
| 35 to 64 Years | 0 (0.0%) | 0 (0.0%) |
| 65 to 74 Years | 0 (0.0%) | 0 (0.0%) |
| 75 Years and over | 0 (0.0%) | 0 (0.0%) |
Technology Access in Bathgate
Computing Device Access in Bathgate
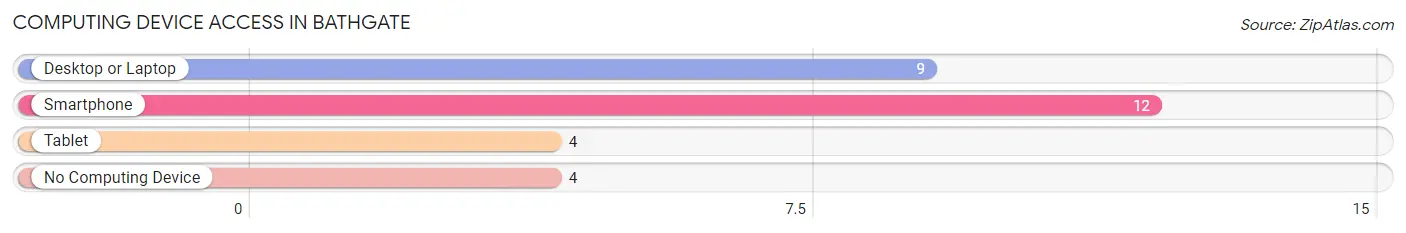
| Device Type | # Households | % Households |
| Desktop or Laptop | 9 | 52.9% |
| Smartphone | 12 | 70.6% |
| Tablet | 4 | 23.5% |
| No Computing Device | 4 | 23.5% |
| Total | 17 | 100.0% |
Internet Access in Bathgate
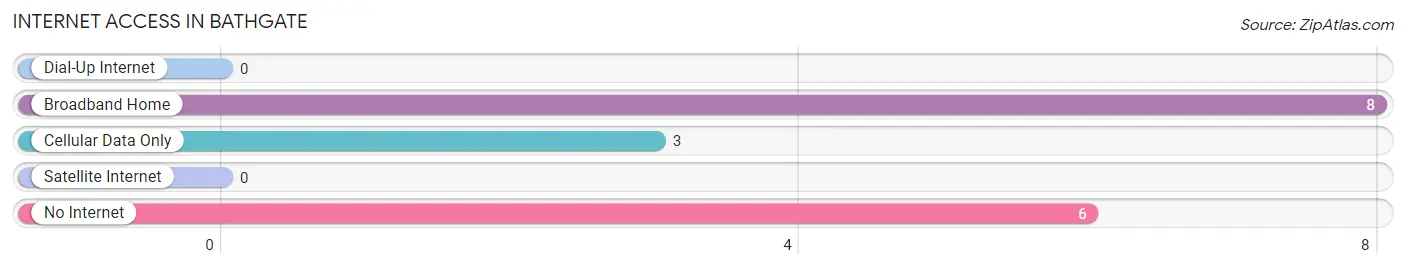
| Internet Type | # Households | % Households |
| Dial-Up Internet | 0 | 0.0% |
| Broadband Home | 8 | 47.1% |
| Cellular Data Only | 3 | 17.6% |
| Satellite Internet | 0 | 0.0% |
| No Internet | 6 | 35.3% |
| Total | 17 | 100.0% |
Bathgate Summary
Bathgate is a small town located in the state of North Dakota, United States. It is situated in the southeastern corner of the state, near the border with Minnesota. The town was founded in 1883 and is named after the Scottish town of Bathgate. The population of Bathgate was estimated to be 545 in 2019.
Geography
Bathgate is located in the Red River Valley, a flat, fertile region of the Great Plains. The town is situated on the banks of the Red River, which forms the border between North Dakota and Minnesota. The town is surrounded by agricultural land, with the nearest major city being Fargo, located about 40 miles to the north.
Climate
Bathgate has a humid continental climate, with cold winters and hot summers. The average annual temperature is around 45°F (7°C). The average annual precipitation is around 20 inches (51 cm).
Economy
Bathgate's economy is largely based on agriculture. The town is home to several grain elevators, which store and process grain for export. The town also has a small manufacturing sector, producing a variety of products such as furniture, clothing, and food products.
Demographics
As of 2019, the population of Bathgate was estimated to be 545. The town is predominantly white, with around 95% of the population being of European descent. The median household income is around $45,000, and the median home value is around $90,000.
Education
Bathgate is served by the Bathgate Public School District, which includes an elementary school, a middle school, and a high school. The town also has a public library, which offers a variety of services and programs.
Transportation
Bathgate is served by a number of highways, including US Highway 2 and North Dakota State Highway 18. The nearest airport is the Hector International Airport, located in Fargo.
Culture
Bathgate is home to a number of cultural attractions, including the Bathgate Historical Museum, which houses a collection of artifacts and photographs related to the town's history. The town also hosts a number of annual events, such as the Bathgate Summer Festival and the Bathgate Fall Festival.
Bathgate is a small town with a rich history and a vibrant culture. The town is home to a diverse population and a strong economy, and is a great place to live and work.
Common Questions
What is Per Capita Income in Bathgate?
Per Capita income in Bathgate is $83,215.
What is the Median Family Income in Bathgate?
Median Family Income in Bathgate is $158,438.
What is Inequality or Gini Index in Bathgate?
Inequality or Gini Index in Bathgate is 0.40.
What is the Total Population of Bathgate?
Total Population of Bathgate is 48.
What is the Total Male Population of Bathgate?
Total Male Population of Bathgate is 23.
What is the Total Female Population of Bathgate?
Total Female Population of Bathgate is 25.
What is the Ratio of Males per 100 Females in Bathgate?
There are 92.00 Males per 100 Females in Bathgate.
What is the Ratio of Females per 100 Males in Bathgate?
There are 108.70 Females per 100 Males in Bathgate.
What is the Median Population Age in Bathgate?
Median Population Age in Bathgate is 58.6 Years.
What is the Average Family Size in Bathgate
Average Family Size in Bathgate is 2.3 People.
What is the Average Household Size in Bathgate
Average Household Size in Bathgate is 1.5 People.
How Large is the Labor Force in Bathgate?
There are 26 People in the Labor Forcein in Bathgate.
What is the Percentage of People in the Labor Force in Bathgate?
57.8% of People are in the Labor Force in Bathgate.
What is the Unemployment Rate in Bathgate?
Unemployment Rate in Bathgate is 3.8%.