Raynham, NC Map & Demographics
Raynham Map
Raynham Overview
$32,657
PER CAPITA INCOME
47.7%
WAGE / INCOME GAP [ % ]
52.3¢/ $1
WAGE / INCOME GAP [ $ ]
0.55
INEQUALITY / GINI INDEX
37
TOTAL POPULATION
15
MALE POPULATION
22
FEMALE POPULATION
68.18
MALES / 100 FEMALES
146.67
FEMALES / 100 MALES
60.3
MEDIAN AGE
2.4
AVG FAMILY SIZE
1.7
AVG HOUSEHOLD SIZE
19
LABOR FORCE [ PEOPLE ]
51.4%
PERCENT IN LABOR FORCE
21.1%
UNEMPLOYMENT RATE
Raynham Area Codes
Income in Raynham
Income Overview in Raynham
| Characteristic | Number | Measure |
| Per Capita Income | 37 | $32,657 |
| Median Family Income | 10 | $0 |
| Mean Family Income | 10 | $82,240 |
| Median Household Income | 22 | $0 |
| Mean Household Income | 22 | $56,068 |
| Income Deficit | 10 | $0 |
| Wage / Income Gap (%) | 37 | 47.69% |
| Wage / Income Gap ($) | 37 | 52.31¢ per $1 |
| Gini / Inequality Index | 37 | 0.55 |
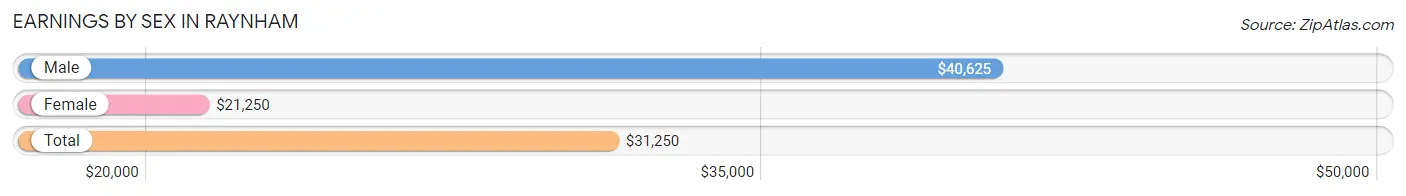
Earnings by Sex in Raynham
Average Earnings in Raynham are $31,250, $40,625 for men and $21,250 for women, a difference of 47.7%.
| Sex | Number | Average Earnings |
| Male | 11 (50.0%) | $40,625 |
| Female | 11 (50.0%) | $21,250 |
| Total | 22 (100.0%) | $31,250 |
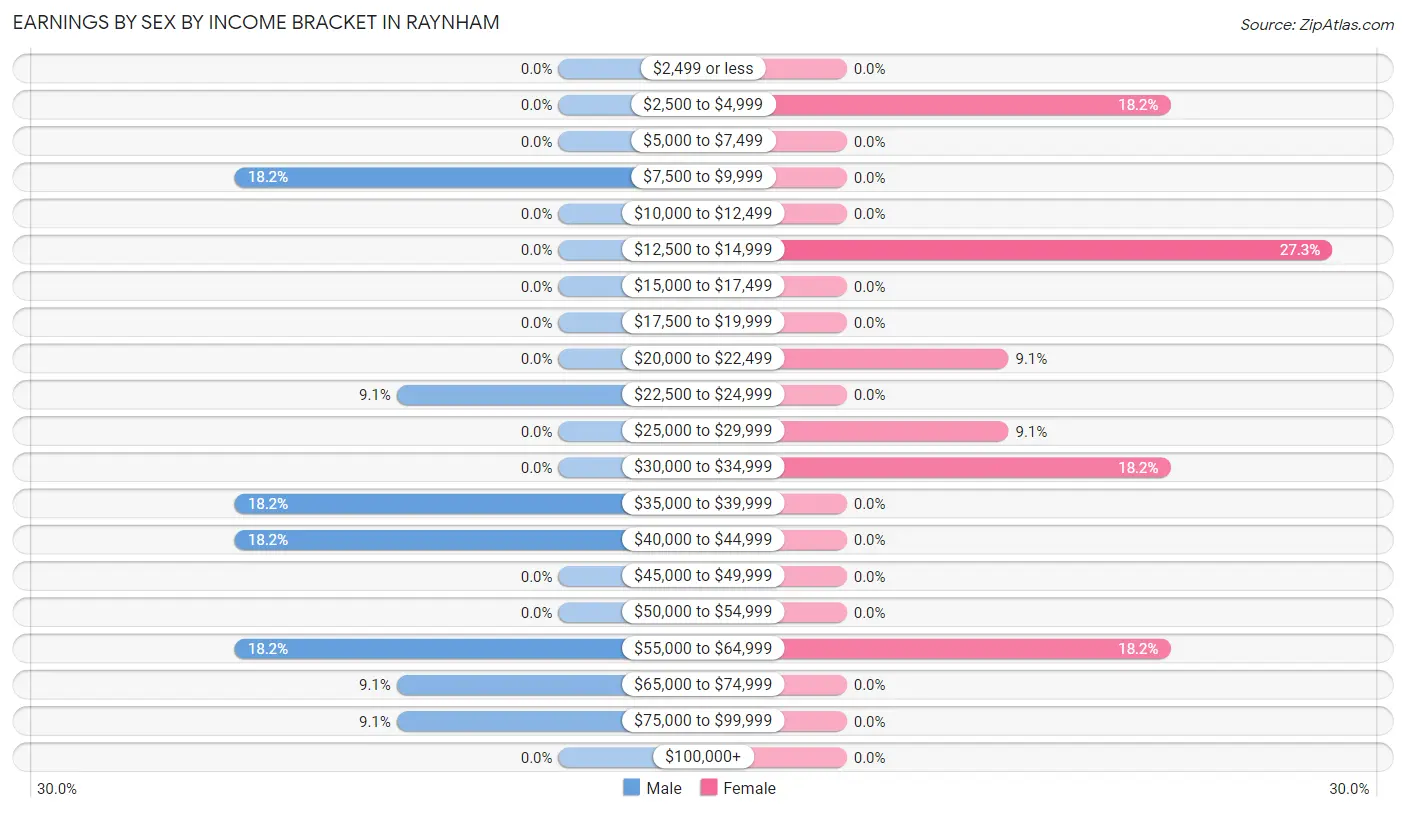
Earnings by Sex by Income Bracket in Raynham
The most common earnings brackets in Raynham are $7,500 to $9,999 for men (2 | 18.2%) and $12,500 to $14,999 for women (3 | 27.3%).
| Income | Male | Female |
| $2,499 or less | 0 (0.0%) | 0 (0.0%) |
| $2,500 to $4,999 | 0 (0.0%) | 2 (18.2%) |
| $5,000 to $7,499 | 0 (0.0%) | 0 (0.0%) |
| $7,500 to $9,999 | 2 (18.2%) | 0 (0.0%) |
| $10,000 to $12,499 | 0 (0.0%) | 0 (0.0%) |
| $12,500 to $14,999 | 0 (0.0%) | 3 (27.3%) |
| $15,000 to $17,499 | 0 (0.0%) | 0 (0.0%) |
| $17,500 to $19,999 | 0 (0.0%) | 0 (0.0%) |
| $20,000 to $22,499 | 0 (0.0%) | 1 (9.1%) |
| $22,500 to $24,999 | 1 (9.1%) | 0 (0.0%) |
| $25,000 to $29,999 | 0 (0.0%) | 1 (9.1%) |
| $30,000 to $34,999 | 0 (0.0%) | 2 (18.2%) |
| $35,000 to $39,999 | 2 (18.2%) | 0 (0.0%) |
| $40,000 to $44,999 | 2 (18.2%) | 0 (0.0%) |
| $45,000 to $49,999 | 0 (0.0%) | 0 (0.0%) |
| $50,000 to $54,999 | 0 (0.0%) | 0 (0.0%) |
| $55,000 to $64,999 | 2 (18.2%) | 2 (18.2%) |
| $65,000 to $74,999 | 1 (9.1%) | 0 (0.0%) |
| $75,000 to $99,999 | 1 (9.1%) | 0 (0.0%) |
| $100,000+ | 0 (0.0%) | 0 (0.0%) |
| Total | 11 (100.0%) | 11 (100.0%) |
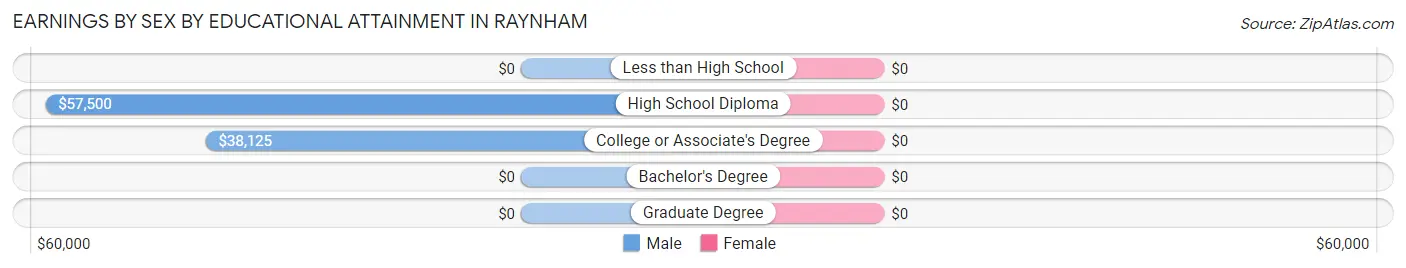
Earnings by Sex by Educational Attainment in Raynham
| Educational Attainment | Male Income | Female Income |
| Less than High School | - | - |
| High School Diploma | $57,500 | $0 |
| College or Associate's Degree | $38,125 | $0 |
| Bachelor's Degree | - | - |
| Graduate Degree | - | - |
| Total | $40,625 | $30,000 |
Family Income in Raynham
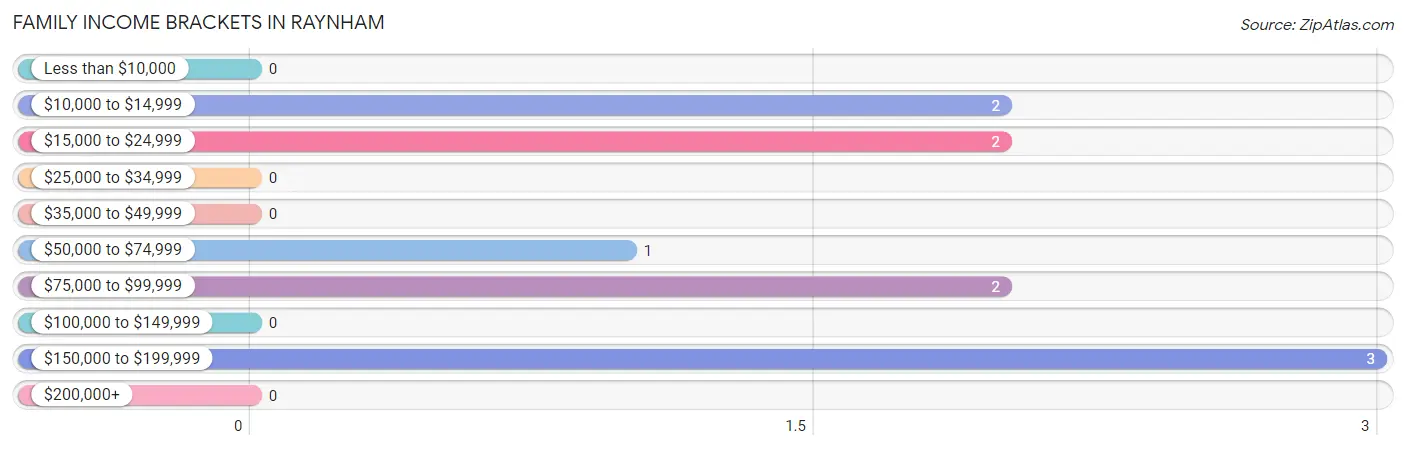
Family Income Brackets in Raynham
According to the Raynham family income data, there are 3 families falling into the $150,000 to $199,999 income range, which is the most common income bracket and makes up 30.0% of all families.
| Income Bracket | # Families | % Families |
| Less than $10,000 | 0 | 0.0% |
| $10,000 to $14,999 | 2 | 20.0% |
| $15,000 to $24,999 | 2 | 20.0% |
| $25,000 to $34,999 | 0 | 0.0% |
| $35,000 to $49,999 | 0 | 0.0% |
| $50,000 to $74,999 | 1 | 10.0% |
| $75,000 to $99,999 | 2 | 20.0% |
| $100,000 to $149,999 | 0 | 0.0% |
| $150,000 to $199,999 | 3 | 30.0% |
| $200,000+ | 0 | 0.0% |
Family Income by Famaliy Size in Raynham
| Income Bracket | # Families | Median Income |
| 2-Person Families | 8 (80.0%) | $0 |
| 3-Person Families | 2 (20.0%) | $0 |
| 4-Person Families | 0 (0.0%) | $0 |
| 5-Person Families | 0 (0.0%) | $0 |
| 6-Person Families | 0 (0.0%) | $0 |
| 7+ Person Families | 0 (0.0%) | $0 |
| Total | 10 (100.0%) | $0 |
Family Income by Number of Earners in Raynham
| Number of Earners | # Families | Median Income |
| No Earners | 0 (0.0%) | $0 |
| 1 Earner | 4 (40.0%) | $0 |
| 2 Earners | 4 (40.0%) | $0 |
| 3+ Earners | 2 (20.0%) | $0 |
| Total | 10 (100.0%) | $0 |
Household Income in Raynham
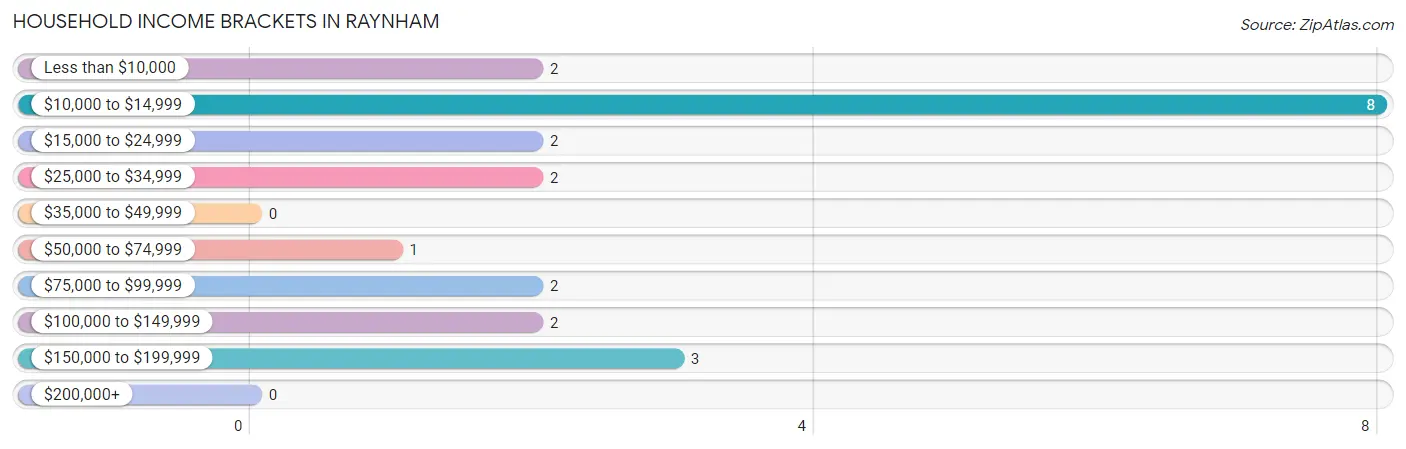
Household Income Brackets in Raynham
With 8 households falling in the category, the $10,000 to $14,999 income range is the most frequent in Raynham, accounting for 36.4% of all households.
| Income Bracket | # Households | % Households |
| Less than $10,000 | 2 | 9.1% |
| $10,000 to $14,999 | 8 | 36.4% |
| $15,000 to $24,999 | 2 | 9.1% |
| $25,000 to $34,999 | 2 | 9.1% |
| $35,000 to $49,999 | 0 | 0.0% |
| $50,000 to $74,999 | 1 | 4.5% |
| $75,000 to $99,999 | 2 | 9.1% |
| $100,000 to $149,999 | 2 | 9.1% |
| $150,000 to $199,999 | 3 | 13.6% |
| $200,000+ | 0 | 0.0% |
Household Income by Householder Age in Raynham
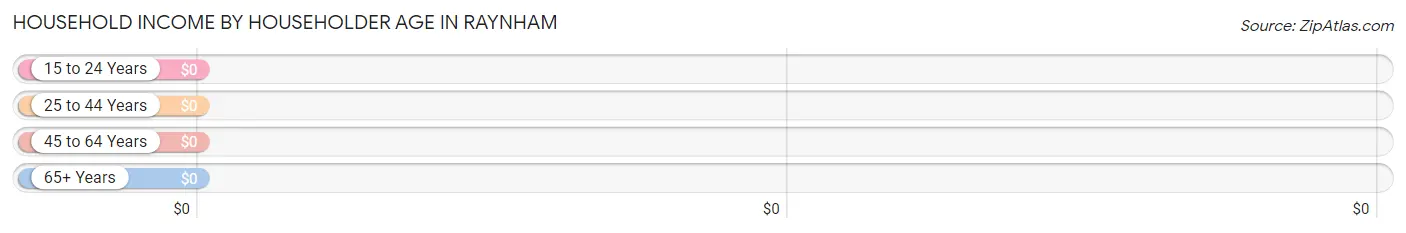
| Income Bracket | # Households | Median Income |
| 15 to 24 Years | 0 (0.0%) | $0 |
| 25 to 44 Years | 3 (13.6%) | $0 |
| 45 to 64 Years | 9 (40.9%) | $0 |
| 65+ Years | 10 (45.5%) | $0 |
| Total | 22 (100.0%) | $0 |
Poverty in Raynham
Income Below Poverty by Sex and Age in Raynham
With 13.3% poverty level for males and 45.5% for females among the residents of Raynham, 35 to 44 year old males and 35 to 44 year old females are the most vulnerable to poverty, with 2 males (50.0%) and 2 females (100.0%) in their respective age groups living below the poverty level.
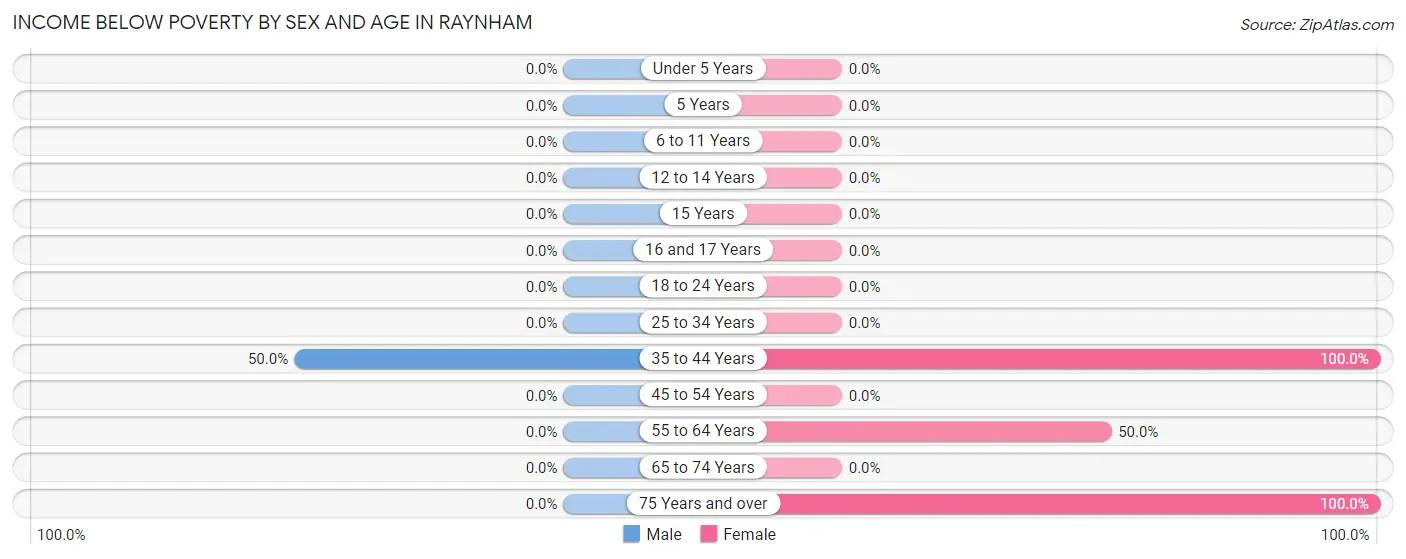
| Age Bracket | Male | Female |
| Under 5 Years | 0 (0.0%) | 0 (0.0%) |
| 5 Years | 0 (0.0%) | 0 (0.0%) |
| 6 to 11 Years | 0 (0.0%) | 0 (0.0%) |
| 12 to 14 Years | 0 (0.0%) | 0 (0.0%) |
| 15 Years | 0 (0.0%) | 0 (0.0%) |
| 16 and 17 Years | 0 (0.0%) | 0 (0.0%) |
| 18 to 24 Years | 0 (0.0%) | 0 (0.0%) |
| 25 to 34 Years | 0 (0.0%) | 0 (0.0%) |
| 35 to 44 Years | 2 (50.0%) | 2 (100.0%) |
| 45 to 54 Years | 0 (0.0%) | 0 (0.0%) |
| 55 to 64 Years | 0 (0.0%) | 2 (50.0%) |
| 65 to 74 Years | 0 (0.0%) | 0 (0.0%) |
| 75 Years and over | 0 (0.0%) | 6 (100.0%) |
| Total | 2 (13.3%) | 10 (45.5%) |
Income Above Poverty by Sex and Age in Raynham
According to the poverty statistics in Raynham, males aged 25 to 34 years and females aged 18 to 24 years are the age groups that are most secure financially, with 100.0% of males and 100.0% of females in these age groups living above the poverty line.
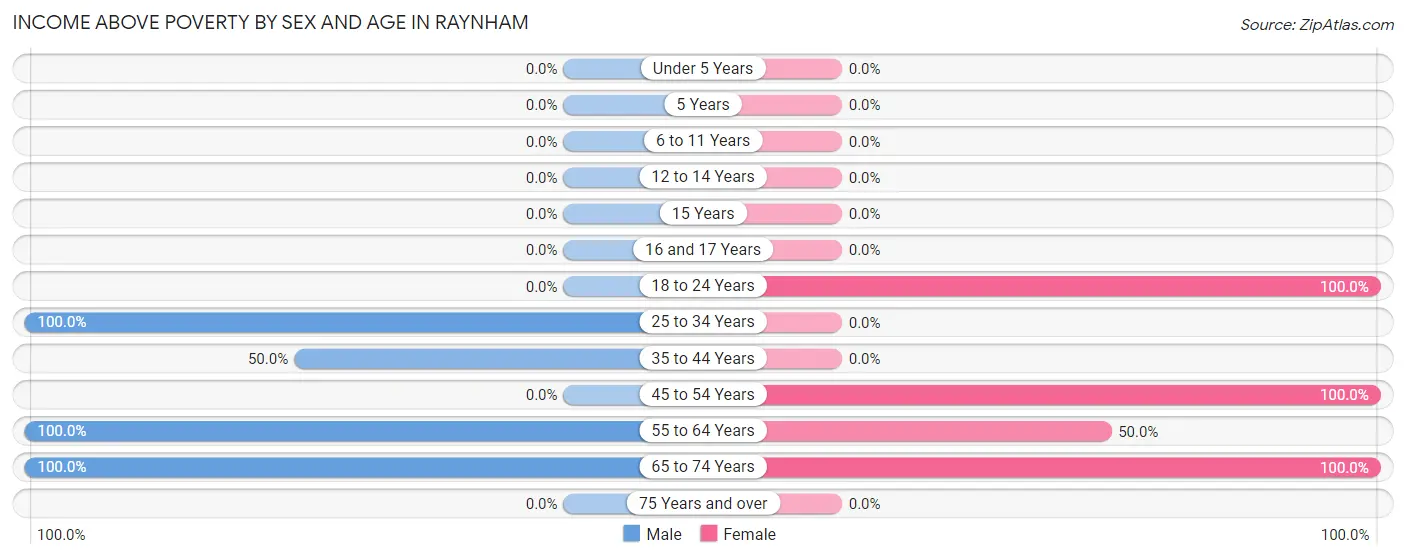
| Age Bracket | Male | Female |
| Under 5 Years | 0 (0.0%) | 0 (0.0%) |
| 5 Years | 0 (0.0%) | 0 (0.0%) |
| 6 to 11 Years | 0 (0.0%) | 0 (0.0%) |
| 12 to 14 Years | 0 (0.0%) | 0 (0.0%) |
| 15 Years | 0 (0.0%) | 0 (0.0%) |
| 16 and 17 Years | 0 (0.0%) | 0 (0.0%) |
| 18 to 24 Years | 0 (0.0%) | 3 (100.0%) |
| 25 to 34 Years | 1 (100.0%) | 0 (0.0%) |
| 35 to 44 Years | 2 (50.0%) | 0 (0.0%) |
| 45 to 54 Years | 0 (0.0%) | 4 (100.0%) |
| 55 to 64 Years | 5 (100.0%) | 2 (50.0%) |
| 65 to 74 Years | 5 (100.0%) | 3 (100.0%) |
| 75 Years and over | 0 (0.0%) | 0 (0.0%) |
| Total | 13 (86.7%) | 12 (54.5%) |
Income Below Poverty Among Married-Couple Families in Raynham
The poverty statistics for married-couple families in Raynham show that 22.2% or 2 of the total 9 families live below the poverty line. Families with no children have the highest poverty rate of 22.2%, comprising of 2 families. On the other hand, families with no children have the lowest poverty rate of 22.2%, which includes 2 families.
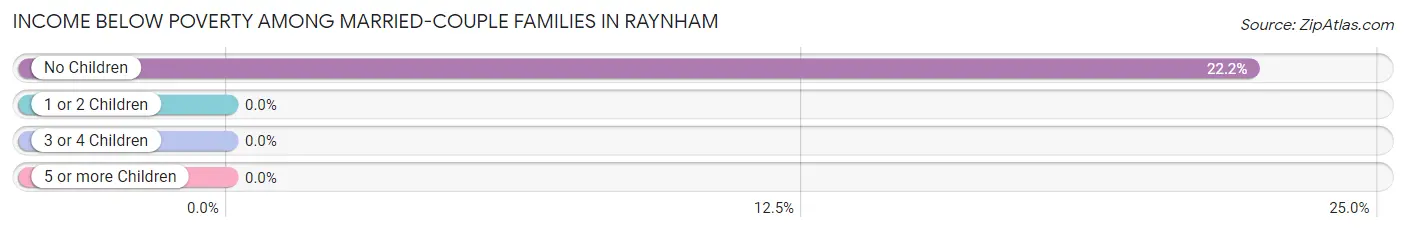
| Children | Above Poverty | Below Poverty |
| No Children | 7 (77.8%) | 2 (22.2%) |
| 1 or 2 Children | 0 (0.0%) | 0 (0.0%) |
| 3 or 4 Children | 0 (0.0%) | 0 (0.0%) |
| 5 or more Children | 0 (0.0%) | 0 (0.0%) |
| Total | 7 (77.8%) | 2 (22.2%) |
Income Below Poverty Among Single-Parent Households in Raynham
| Children | Single Father | Single Mother |
| No Children | 0 (0.0%) | 0 (0.0%) |
| 1 or 2 Children | 0 (0.0%) | 0 (0.0%) |
| 3 or 4 Children | 0 (0.0%) | 0 (0.0%) |
| 5 or more Children | 0 (0.0%) | 0 (0.0%) |
| Total | 0 (0.0%) | 0 (0.0%) |
Income Below Poverty Among Married-Couple vs Single-Parent Households in Raynham
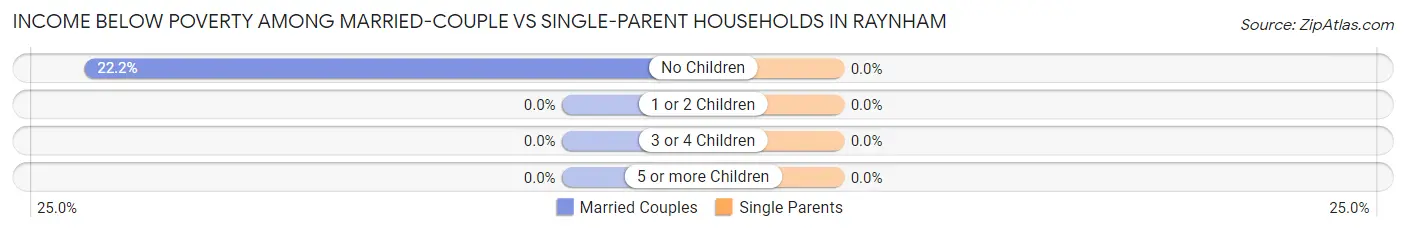
| Children | Married-Couple Families | Single-Parent Households |
| No Children | 2 (22.2%) | 0 (0.0%) |
| 1 or 2 Children | 0 (0.0%) | 0 (0.0%) |
| 3 or 4 Children | 0 (0.0%) | 0 (0.0%) |
| 5 or more Children | 0 (0.0%) | 0 (0.0%) |
| Total | 2 (22.2%) | 0 (0.0%) |
Race in Raynham
The most populous races in Raynham are Native / Alaskan (16 | 43.2%), White / Caucasian (15 | 40.5%), and Black / African American (6 | 16.2%).
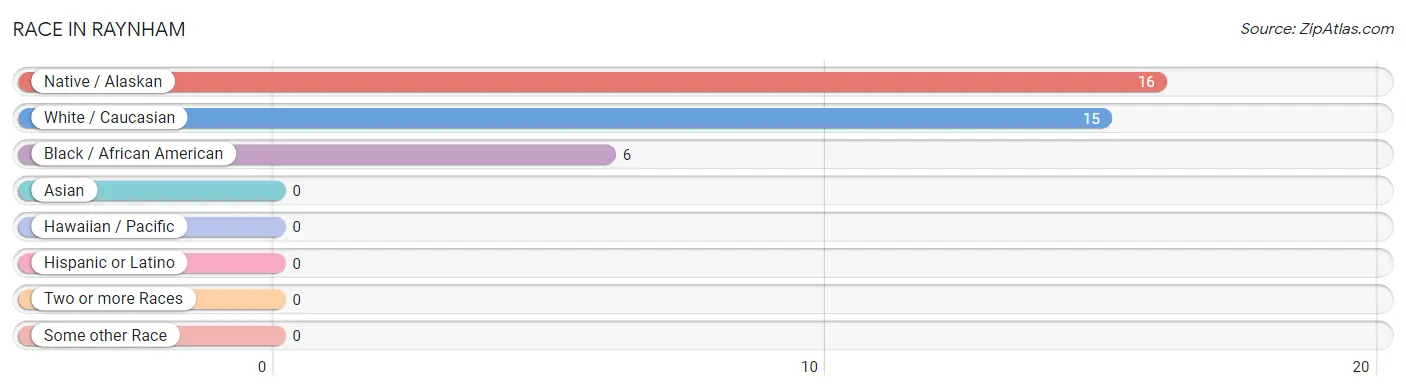
| Race | # Population | % Population |
| Asian | 0 | 0.0% |
| Black / African American | 6 | 16.2% |
| Hawaiian / Pacific | 0 | 0.0% |
| Hispanic or Latino | 0 | 0.0% |
| Native / Alaskan | 16 | 43.2% |
| White / Caucasian | 15 | 40.5% |
| Two or more Races | 0 | 0.0% |
| Some other Race | 0 | 0.0% |
| Total | 37 | 100.0% |
Ancestry in Raynham
The most populous ancestries reported in Raynham are Lumbee (14 | 37.8%), American (5 | 13.5%), English (4 | 10.8%), European (2 | 5.4%), and Irish (1 | 2.7%), together accounting for 70.3% of all Raynham residents.
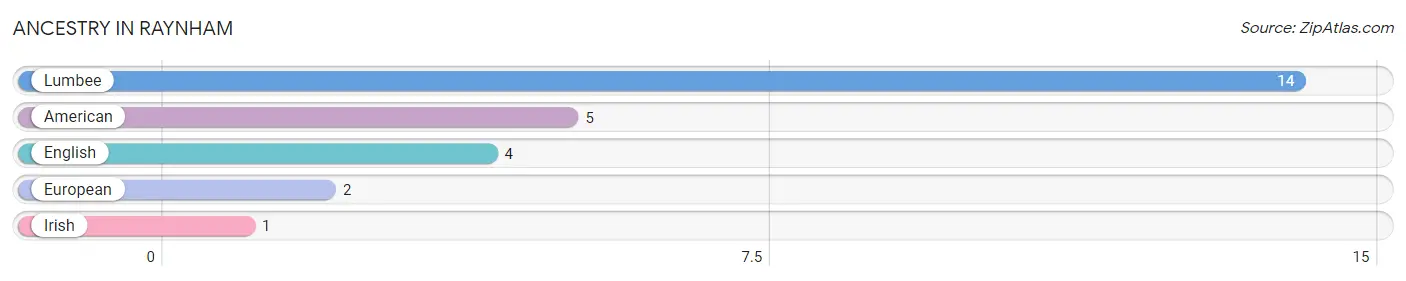
| Ancestry | # Population | % Population |
| American | 5 | 13.5% |
| English | 4 | 10.8% |
| European | 2 | 5.4% |
| Irish | 1 | 2.7% |
| Lumbee | 14 | 37.8% | View All 5 Rows |
Immigrants in Raynham

| Immigration Origin | # Population | % Population | View All 0 Rows |
Sex and Age in Raynham
Sex and Age in Raynham
The most populous age groups in Raynham are 55 to 59 Years (3 | 20.0%) for men and 75 to 79 Years (6 | 27.3%) for women.
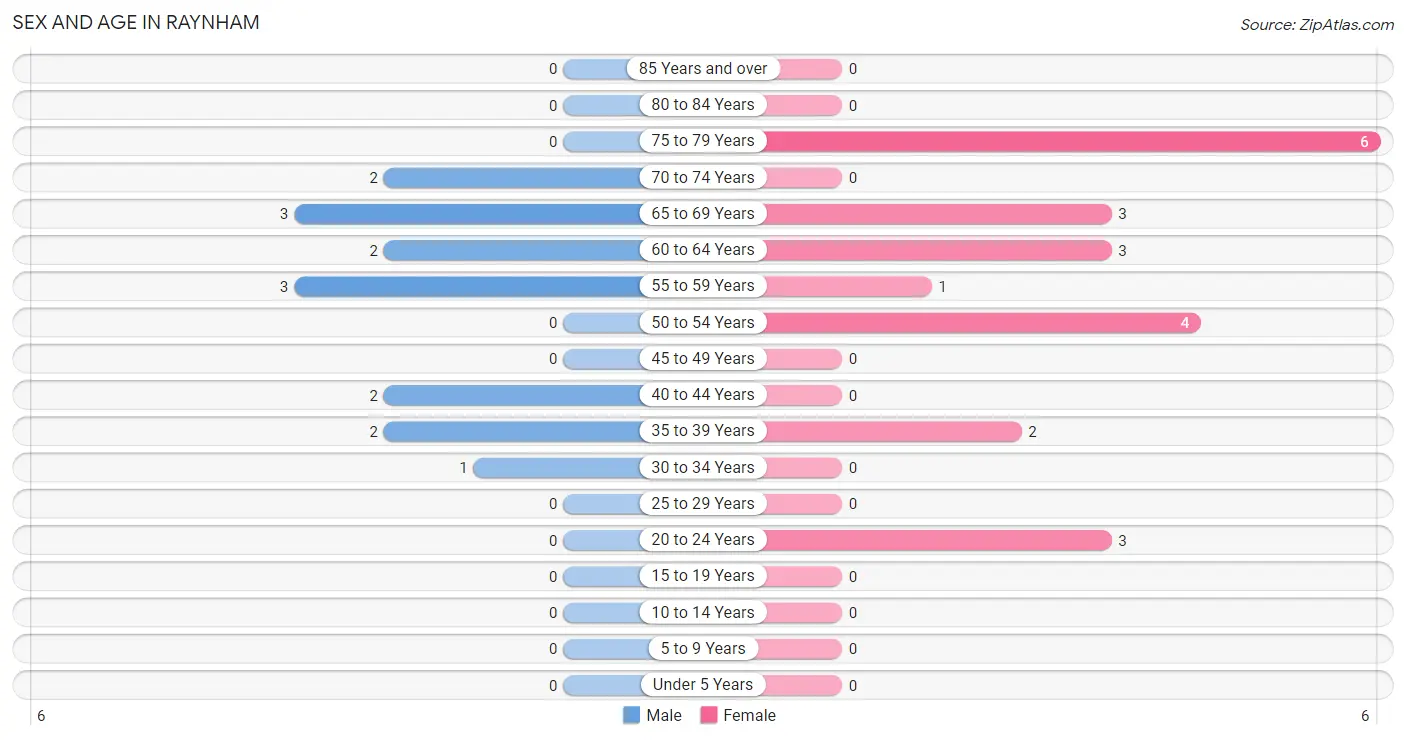
| Age Bracket | Male | Female |
| Under 5 Years | 0 (0.0%) | 0 (0.0%) |
| 5 to 9 Years | 0 (0.0%) | 0 (0.0%) |
| 10 to 14 Years | 0 (0.0%) | 0 (0.0%) |
| 15 to 19 Years | 0 (0.0%) | 0 (0.0%) |
| 20 to 24 Years | 0 (0.0%) | 3 (13.6%) |
| 25 to 29 Years | 0 (0.0%) | 0 (0.0%) |
| 30 to 34 Years | 1 (6.7%) | 0 (0.0%) |
| 35 to 39 Years | 2 (13.3%) | 2 (9.1%) |
| 40 to 44 Years | 2 (13.3%) | 0 (0.0%) |
| 45 to 49 Years | 0 (0.0%) | 0 (0.0%) |
| 50 to 54 Years | 0 (0.0%) | 4 (18.2%) |
| 55 to 59 Years | 3 (20.0%) | 1 (4.5%) |
| 60 to 64 Years | 2 (13.3%) | 3 (13.6%) |
| 65 to 69 Years | 3 (20.0%) | 3 (13.6%) |
| 70 to 74 Years | 2 (13.3%) | 0 (0.0%) |
| 75 to 79 Years | 0 (0.0%) | 6 (27.3%) |
| 80 to 84 Years | 0 (0.0%) | 0 (0.0%) |
| 85 Years and over | 0 (0.0%) | 0 (0.0%) |
| Total | 15 (100.0%) | 22 (100.0%) |
Families and Households in Raynham
Median Family Size in Raynham
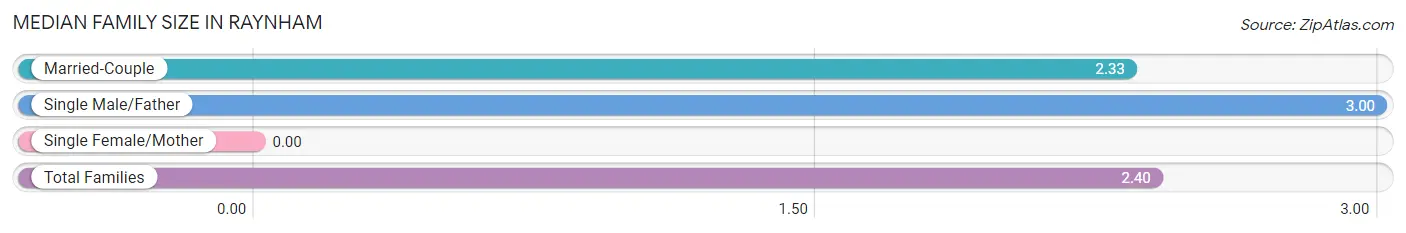
| Family Type | # Families | Family Size |
| Married-Couple | 9 (90.0%) | 2.33 |
| Single Male/Father | 1 (10.0%) | 3.00 |
| Single Female/Mother | 0 (0.0%) | - |
| Total Families | 10 (100.0%) | 2.40 |
Median Household Size in Raynham
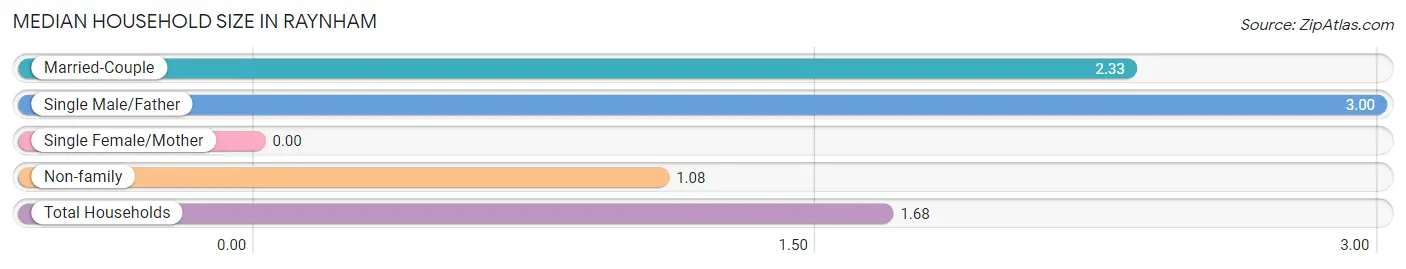
| Household Type | # Households | Household Size |
| Married-Couple | 9 (40.9%) | 2.33 |
| Single Male/Father | 1 (4.5%) | 3.00 |
| Single Female/Mother | 0 (0.0%) | - |
| Non-family | 12 (54.5%) | 1.08 |
| Total Households | 22 (100.0%) | 1.68 |
Household Size by Marriage Status in Raynham
Out of a total of 22 households in Raynham, 10 (45.5%) are family households, while 12 (54.5%) are nonfamily households. The most numerous type of family households are 2-person households, comprising 8, and the most common type of nonfamily households are 1-person households, comprising 10.
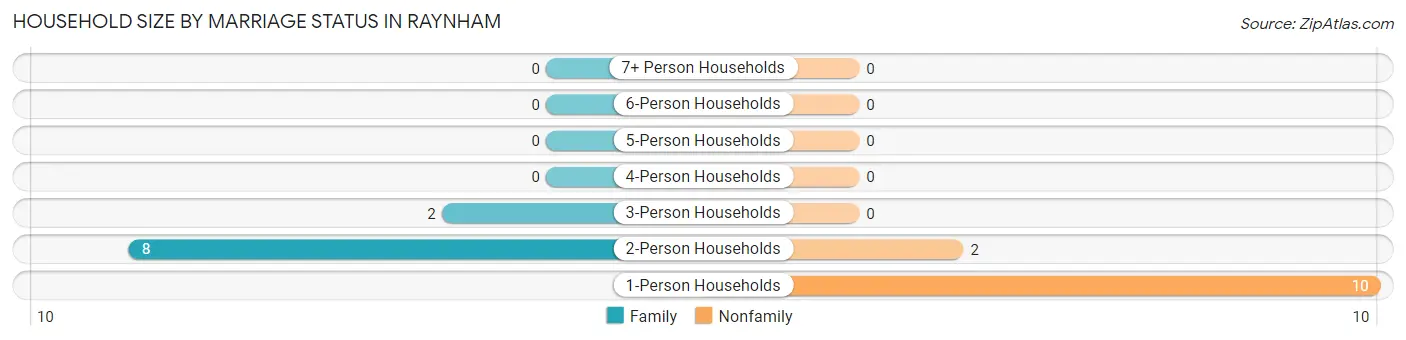
| Household Size | Family Households | Nonfamily Households |
| 1-Person Households | - | 10 (45.5%) |
| 2-Person Households | 8 (36.4%) | 2 (9.1%) |
| 3-Person Households | 2 (9.1%) | 0 (0.0%) |
| 4-Person Households | 0 (0.0%) | 0 (0.0%) |
| 5-Person Households | 0 (0.0%) | 0 (0.0%) |
| 6-Person Households | 0 (0.0%) | 0 (0.0%) |
| 7+ Person Households | 0 (0.0%) | 0 (0.0%) |
| Total | 10 (45.5%) | 12 (54.5%) |
Female Fertility in Raynham
Fertility by Age in Raynham
| Age Bracket | Women with Births | Births / 1,000 Women |
| 15 to 19 years | 0 (0.0%) | 0.0 |
| 20 to 34 years | 0 (0.0%) | 0.0 |
| 35 to 50 years | 0 (0.0%) | 0.0 |
| Total | 0 (0.0%) | 0.0 |
Fertility by Age by Marriage Status in Raynham
| Age Bracket | Married | Unmarried |
| 15 to 19 years | 0 (0.0%) | 0 (0.0%) |
| 20 to 34 years | 0 (0.0%) | 0 (0.0%) |
| 35 to 50 years | 0 (0.0%) | 0 (0.0%) |
| Total | 0 (0.0%) | 0 (0.0%) |
Fertility by Education in Raynham
| Educational Attainment | Women with Births | Births / 1,000 Women |
| Less than High School | 0 (0.0%) | 0.0 |
| High School Diploma | 0 (0.0%) | 0.0 |
| College or Associate's Degree | 0 (0.0%) | 0.0 |
| Bachelor's Degree | 0 (0.0%) | 0.0 |
| Graduate Degree | 0 (0.0%) | 0.0 |
| Total | 0 (0.0%) | 0.0 |
Fertility by Education by Marriage Status in Raynham
| Educational Attainment | Married | Unmarried |
| Less than High School | 0 (0.0%) | 0 (0.0%) |
| High School Diploma | 0 (0.0%) | 0 (0.0%) |
| College or Associate's Degree | 0 (0.0%) | 0 (0.0%) |
| Bachelor's Degree | 0 (0.0%) | 0 (0.0%) |
| Graduate Degree | 0 (0.0%) | 0 (0.0%) |
| Total | 0 (0.0%) | 0 (0.0%) |
Employment Characteristics in Raynham
Employment by Class of Employer in Raynham
Among the 15 employed individuals in Raynham, self-employed (incorporated) (5 | 33.3%), private company employees (4 | 26.7%), and local government employees (3 | 20.0%) make up the most common classes of employment.
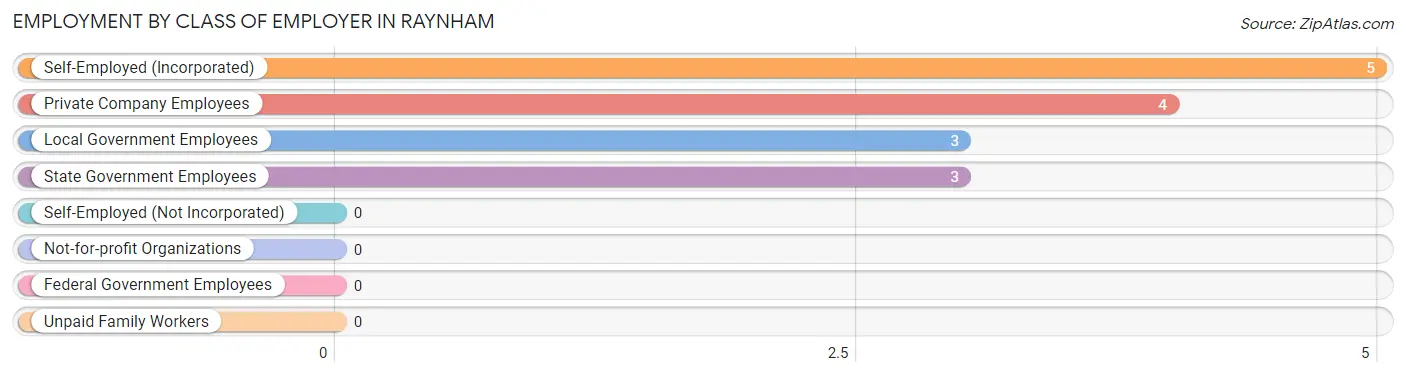
| Employer Class | # Employees | % Employees |
| Private Company Employees | 4 | 26.7% |
| Self-Employed (Incorporated) | 5 | 33.3% |
| Self-Employed (Not Incorporated) | 0 | 0.0% |
| Not-for-profit Organizations | 0 | 0.0% |
| Local Government Employees | 3 | 20.0% |
| State Government Employees | 3 | 20.0% |
| Federal Government Employees | 0 | 0.0% |
| Unpaid Family Workers | 0 | 0.0% |
| Total | 15 | 100.0% |
Employment Status by Age in Raynham
According to the labor force statistics for Raynham, out of the total population over 16 years of age (37), 51.4% or 19 individuals are in the labor force, with 21.1% or 4 of them unemployed. The age group with the highest labor force participation rate is 20 to 24 years, with 100.0% or 3 individuals in the labor force. Within the labor force, the 35 to 44 years age range has the highest percentage of unemployed individuals, with 66.7% or 4 of them being unemployed.
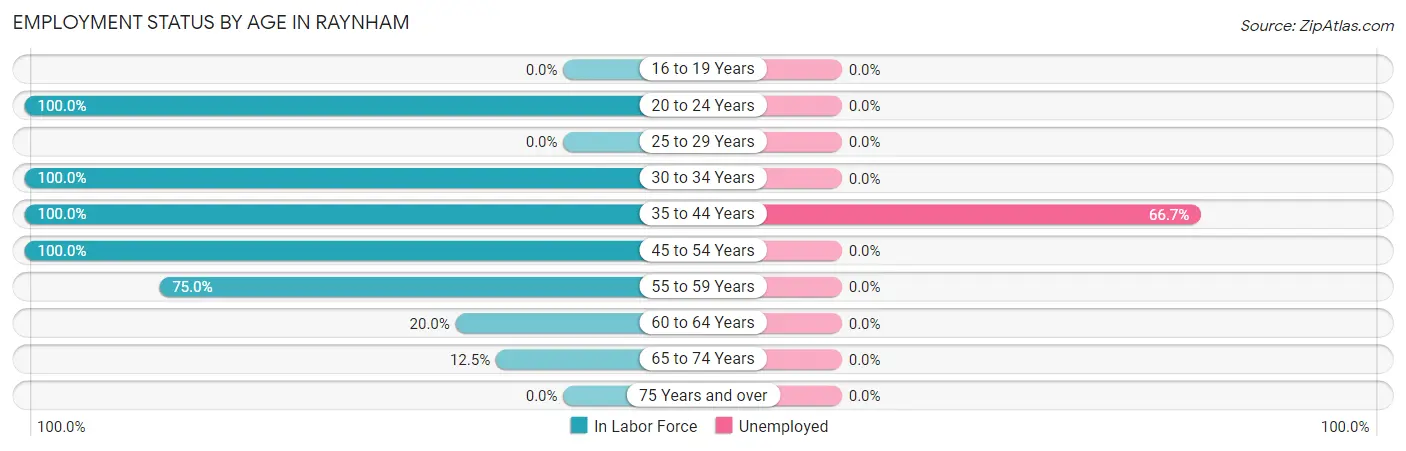
| Age Bracket | In Labor Force | Unemployed |
| 16 to 19 Years | 0 (0.0%) | 0 (0.0%) |
| 20 to 24 Years | 3 (100.0%) | 0 (0.0%) |
| 25 to 29 Years | 0 (0.0%) | 0 (0.0%) |
| 30 to 34 Years | 1 (100.0%) | 0 (0.0%) |
| 35 to 44 Years | 6 (100.0%) | 4 (66.7%) |
| 45 to 54 Years | 4 (100.0%) | 0 (0.0%) |
| 55 to 59 Years | 3 (75.0%) | 0 (0.0%) |
| 60 to 64 Years | 1 (20.0%) | 0 (0.0%) |
| 65 to 74 Years | 1 (12.5%) | 0 (0.0%) |
| 75 Years and over | 0 (0.0%) | 0 (0.0%) |
| Total | 19 (51.4%) | 4 (21.1%) |
Employment Status by Educational Attainment in Raynham
According to labor force statistics for Raynham, 75.0% of individuals (15) out of the total population between 25 and 64 years of age (20) are in the labor force, with 26.7% or 4 of them being unemployed. The group with the highest labor force participation rate are those with the educational attainment of high school diploma, with 100.0% or 8 individuals in the labor force. Within the labor force, individuals with college / associate degree education have the highest percentage of unemployment, with 28.6% or 2 of them being unemployed.
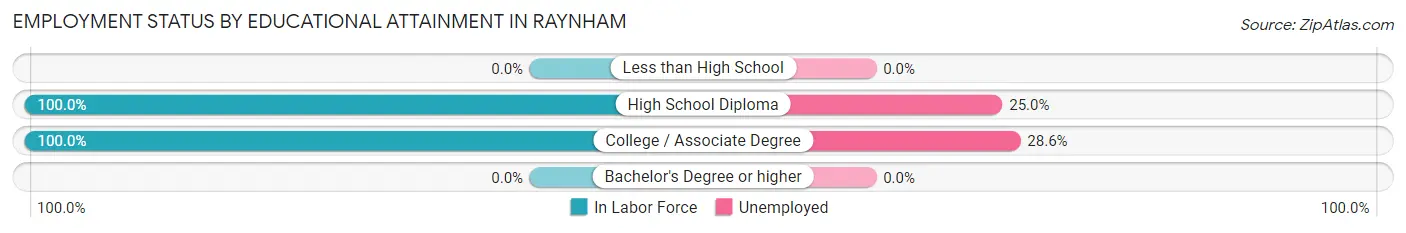
| Educational Attainment | In Labor Force | Unemployed |
| Less than High School | 0 (0.0%) | 0 (0.0%) |
| High School Diploma | 8 (100.0%) | 2 (25.0%) |
| College / Associate Degree | 7 (100.0%) | 2 (28.6%) |
| Bachelor's Degree or higher | 0 (0.0%) | 0 (0.0%) |
| Total | 15 (75.0%) | 5 (26.7%) |
Employment Occupations by Sex in Raynham
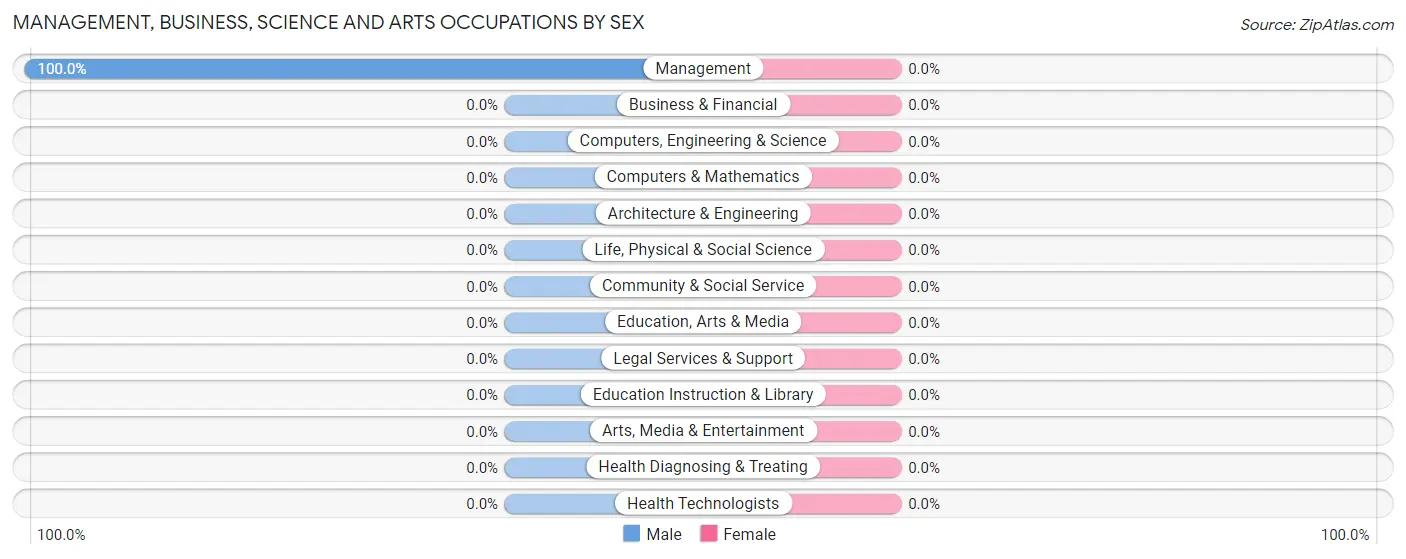
Management, Business, Science and Arts Occupations
The most common Management, Business, Science and Arts occupations in Raynham are , and Management (1 | 6.7%).
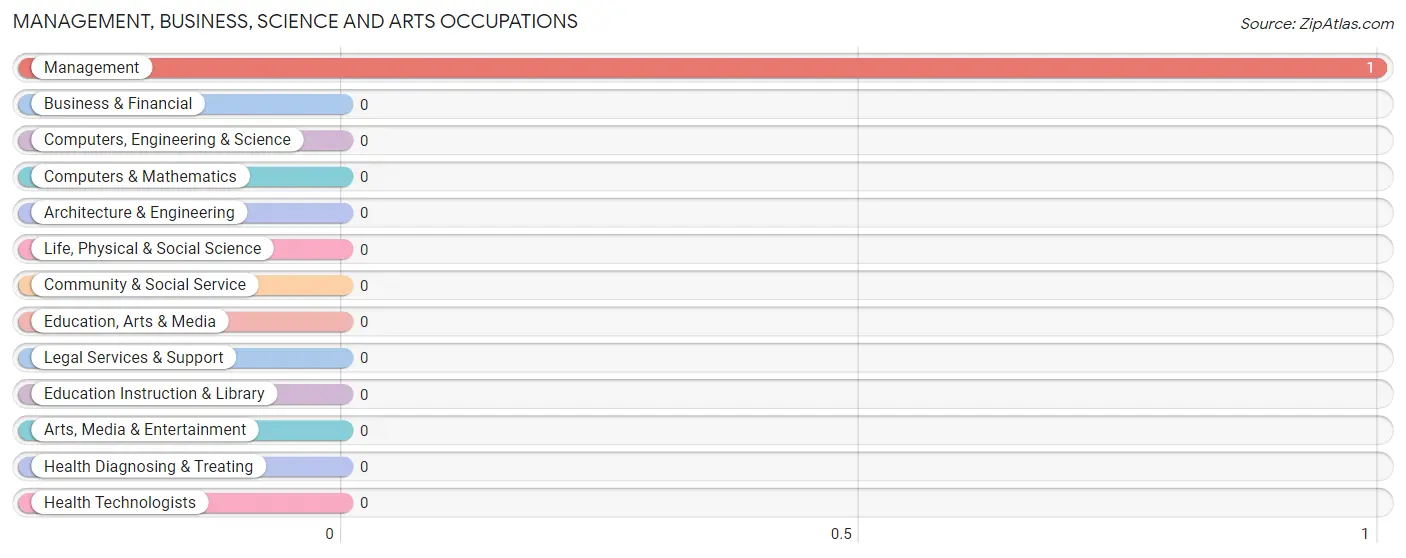
Management, Business, Science and Arts Occupations by Sex
| Occupation | Male | Female |
| Management | 1 (100.0%) | 0 (0.0%) |
| Business & Financial | 0 (0.0%) | 0 (0.0%) |
| Computers, Engineering & Science | 0 (0.0%) | 0 (0.0%) |
| Computers & Mathematics | 0 (0.0%) | 0 (0.0%) |
| Architecture & Engineering | 0 (0.0%) | 0 (0.0%) |
| Life, Physical & Social Science | 0 (0.0%) | 0 (0.0%) |
| Community & Social Service | 0 (0.0%) | 0 (0.0%) |
| Education, Arts & Media | 0 (0.0%) | 0 (0.0%) |
| Legal Services & Support | 0 (0.0%) | 0 (0.0%) |
| Education Instruction & Library | 0 (0.0%) | 0 (0.0%) |
| Arts, Media & Entertainment | 0 (0.0%) | 0 (0.0%) |
| Health Diagnosing & Treating | 0 (0.0%) | 0 (0.0%) |
| Health Technologists | 0 (0.0%) | 0 (0.0%) |
| Total (Category) | 1 (100.0%) | 0 (0.0%) |
| Total (Overall) | 7 (46.7%) | 8 (53.3%) |
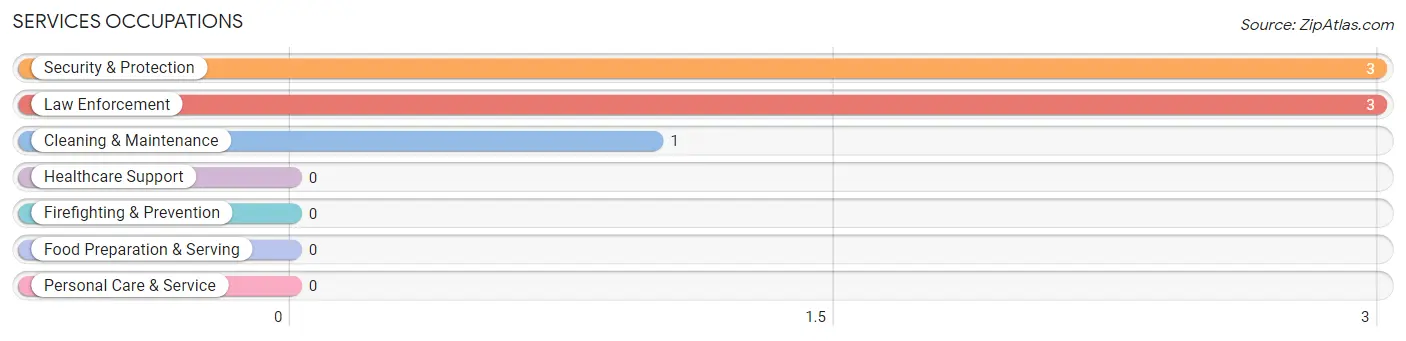
Services Occupations
The most common Services occupations in Raynham are Security & Protection (3 | 20.0%), Law Enforcement (3 | 20.0%), and Cleaning & Maintenance (1 | 6.7%).
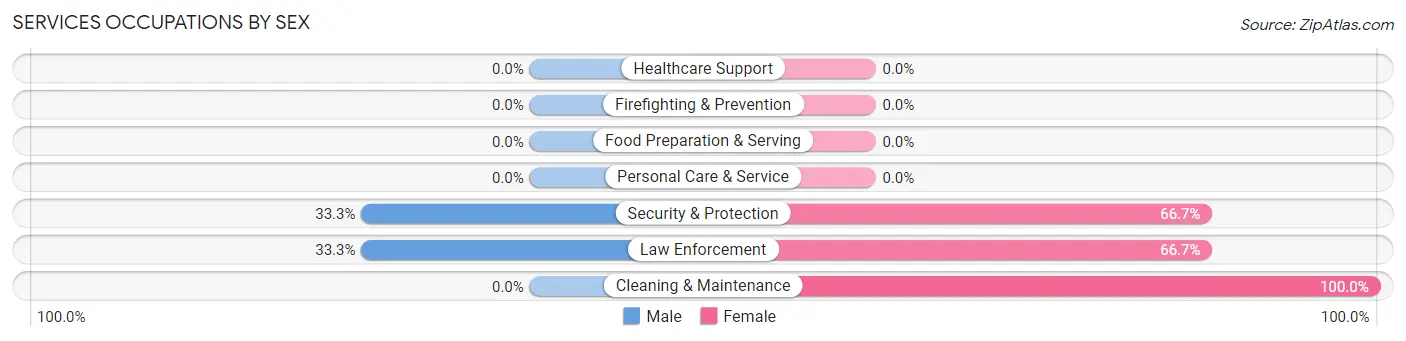
Services Occupations by Sex
Within the Services occupations in Raynham, the most male-oriented occupations are Security & Protection (33.3%), and Law Enforcement (33.3%), while the most female-oriented occupations are Cleaning & Maintenance (100.0%), Security & Protection (66.7%), and Law Enforcement (66.7%).
| Occupation | Male | Female |
| Healthcare Support | 0 (0.0%) | 0 (0.0%) |
| Security & Protection | 1 (33.3%) | 2 (66.7%) |
| Firefighting & Prevention | 0 (0.0%) | 0 (0.0%) |
| Law Enforcement | 1 (33.3%) | 2 (66.7%) |
| Food Preparation & Serving | 0 (0.0%) | 0 (0.0%) |
| Cleaning & Maintenance | 0 (0.0%) | 1 (100.0%) |
| Personal Care & Service | 0 (0.0%) | 0 (0.0%) |
| Total (Category) | 1 (25.0%) | 3 (75.0%) |
| Total (Overall) | 7 (46.7%) | 8 (53.3%) |
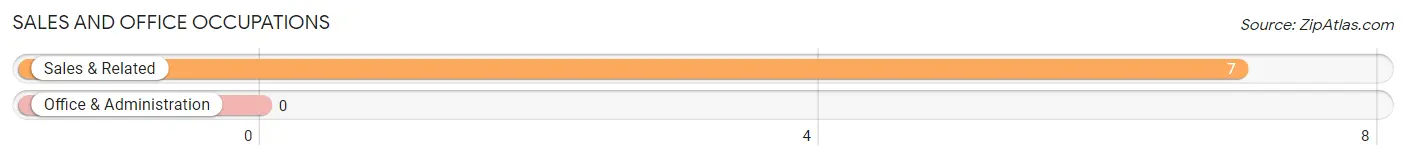
Sales and Office Occupations
The most common Sales and Office occupations in Raynham are , and Sales & Related (7 | 46.7%).
Sales and Office Occupations by Sex
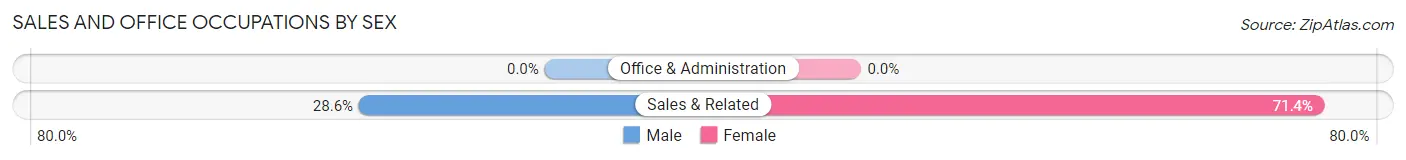
| Occupation | Male | Female |
| Sales & Related | 2 (28.6%) | 5 (71.4%) |
| Office & Administration | 0 (0.0%) | 0 (0.0%) |
| Total (Category) | 2 (28.6%) | 5 (71.4%) |
| Total (Overall) | 7 (46.7%) | 8 (53.3%) |
Natural Resources, Construction and Maintenance Occupations
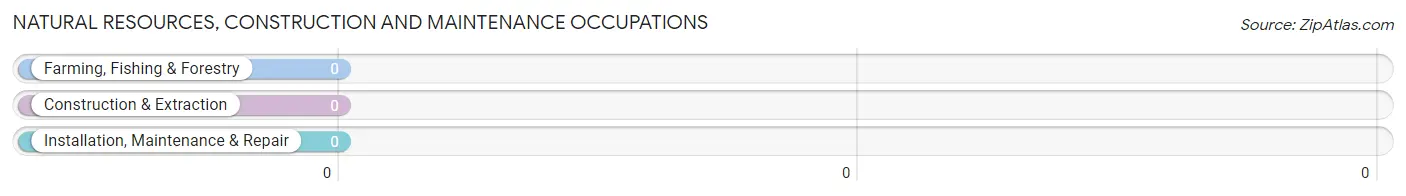
Natural Resources, Construction and Maintenance Occupations by Sex
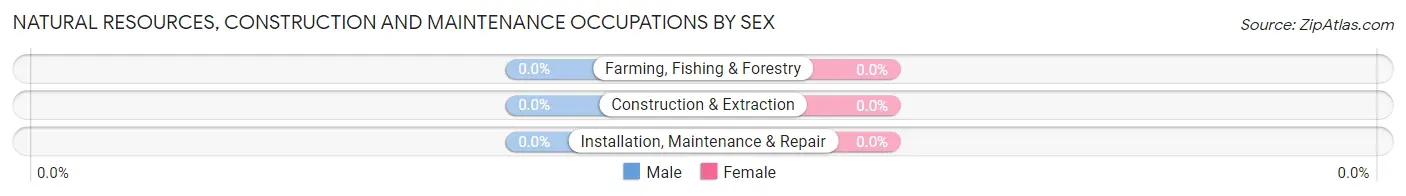
| Occupation | Male | Female |
| Farming, Fishing & Forestry | 0 (0.0%) | 0 (0.0%) |
| Construction & Extraction | 0 (0.0%) | 0 (0.0%) |
| Installation, Maintenance & Repair | 0 (0.0%) | 0 (0.0%) |
| Total (Category) | 0 (0.0%) | 0 (0.0%) |
| Total (Overall) | 7 (46.7%) | 8 (53.3%) |
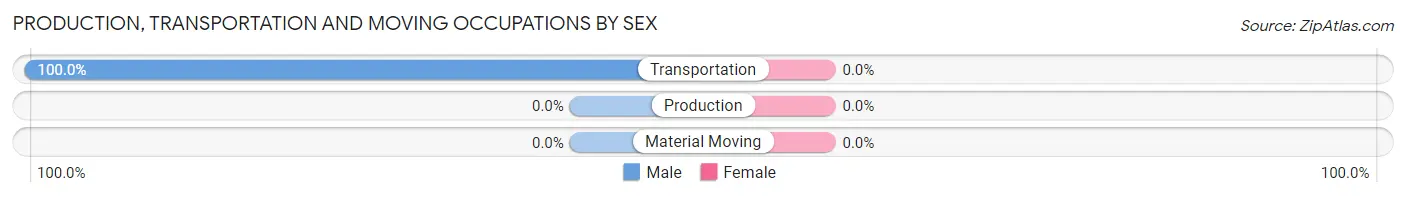
Production, Transportation and Moving Occupations
The most common Production, Transportation and Moving occupations in Raynham are , and Transportation (3 | 20.0%).
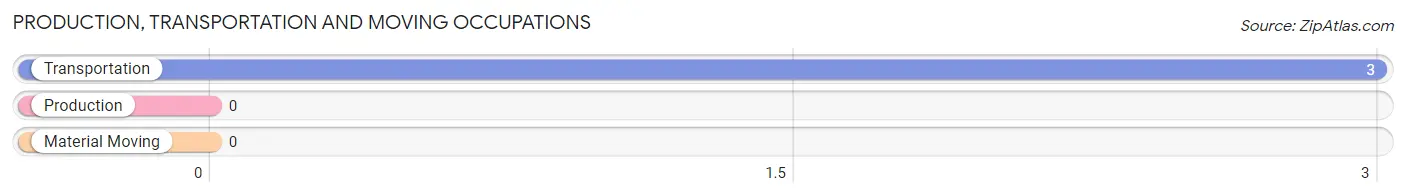
Production, Transportation and Moving Occupations by Sex
| Occupation | Male | Female |
| Production | 0 (0.0%) | 0 (0.0%) |
| Transportation | 3 (100.0%) | 0 (0.0%) |
| Material Moving | 0 (0.0%) | 0 (0.0%) |
| Total (Category) | 3 (100.0%) | 0 (0.0%) |
| Total (Overall) | 7 (46.7%) | 8 (53.3%) |
Employment Industries by Sex in Raynham
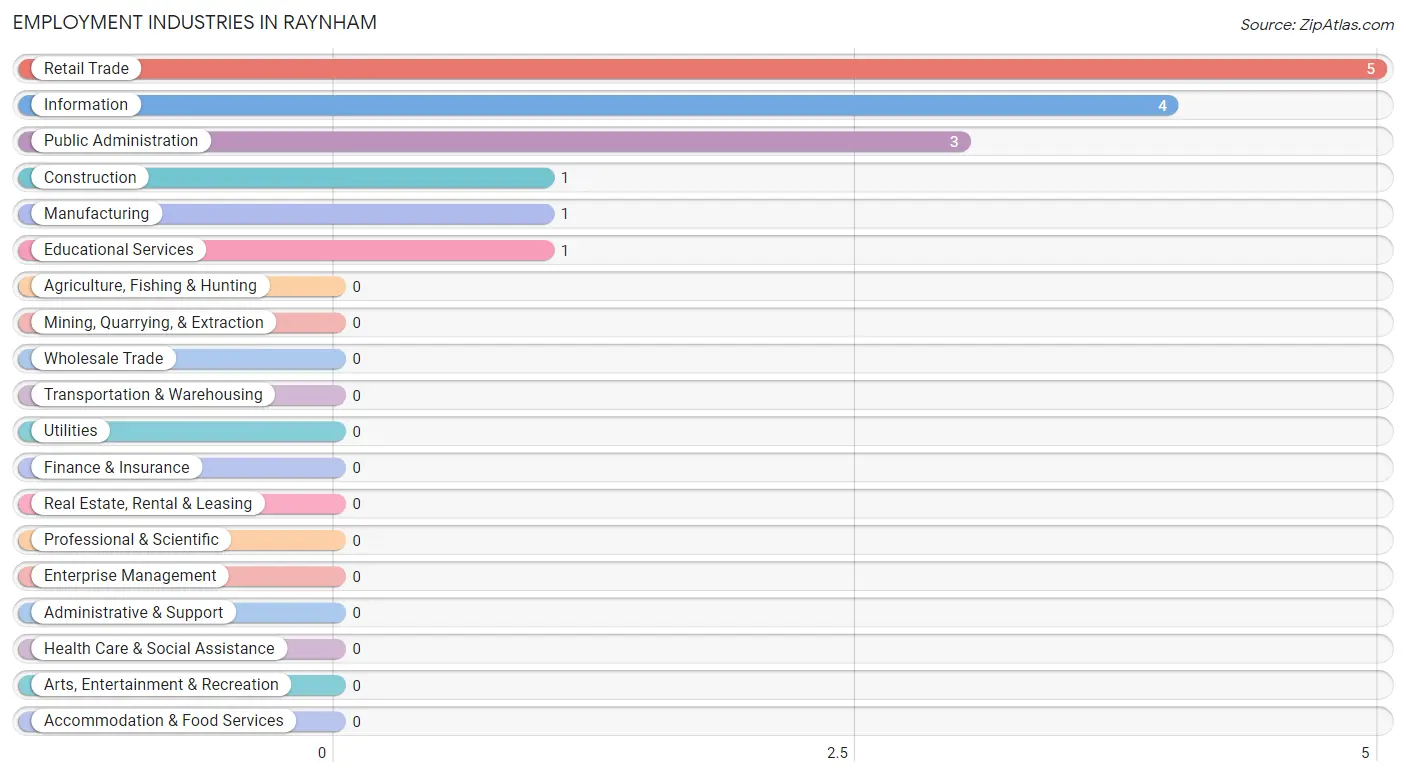
Employment Industries in Raynham
The major employment industries in Raynham include Retail Trade (5 | 33.3%), Information (4 | 26.7%), Public Administration (3 | 20.0%), Construction (1 | 6.7%), and Manufacturing (1 | 6.7%).
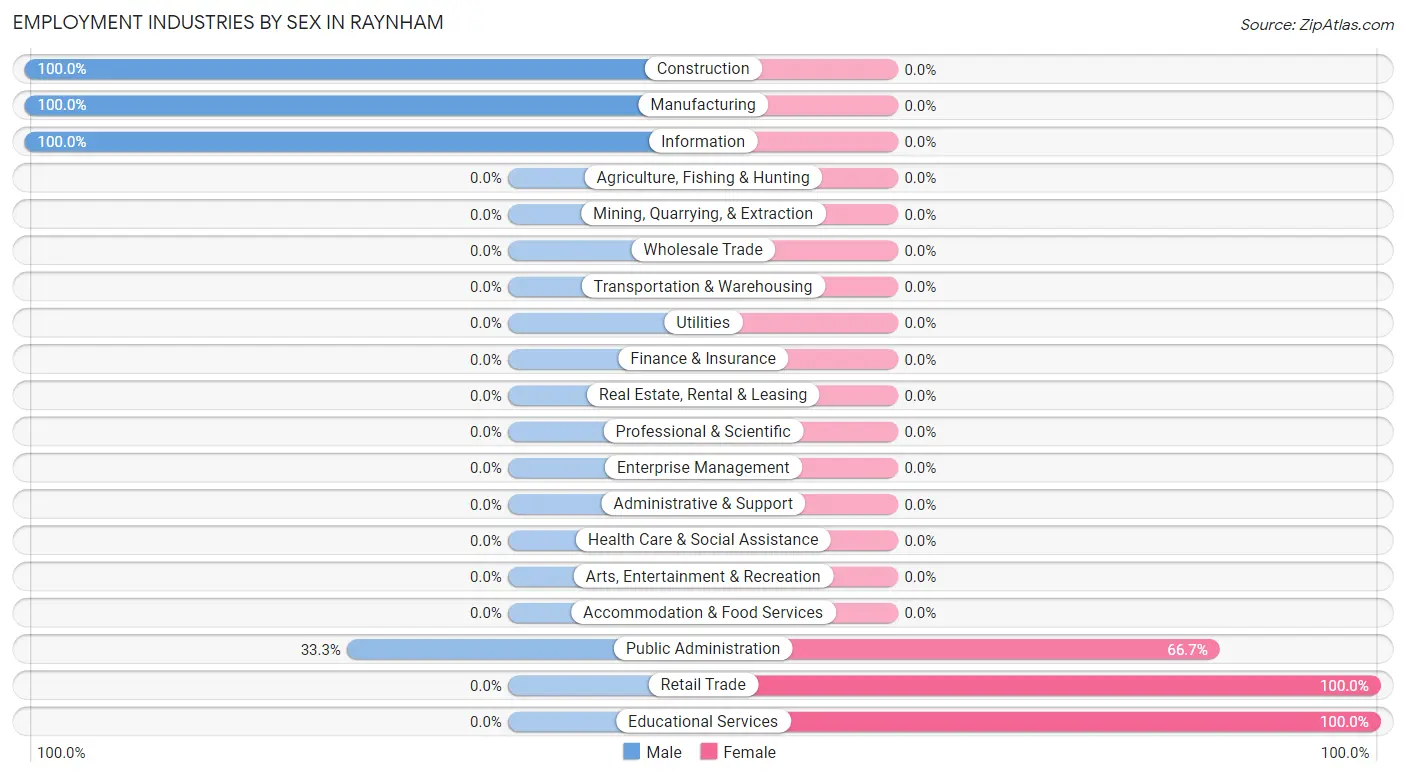
Employment Industries by Sex in Raynham
The Raynham industries that see more men than women are Construction (100.0%), Manufacturing (100.0%), and Information (100.0%), whereas the industries that tend to have a higher number of women are Retail Trade (100.0%), Educational Services (100.0%), and Public Administration (66.7%).
| Industry | Male | Female |
| Agriculture, Fishing & Hunting | 0 (0.0%) | 0 (0.0%) |
| Mining, Quarrying, & Extraction | 0 (0.0%) | 0 (0.0%) |
| Construction | 1 (100.0%) | 0 (0.0%) |
| Manufacturing | 1 (100.0%) | 0 (0.0%) |
| Wholesale Trade | 0 (0.0%) | 0 (0.0%) |
| Retail Trade | 0 (0.0%) | 5 (100.0%) |
| Transportation & Warehousing | 0 (0.0%) | 0 (0.0%) |
| Utilities | 0 (0.0%) | 0 (0.0%) |
| Information | 4 (100.0%) | 0 (0.0%) |
| Finance & Insurance | 0 (0.0%) | 0 (0.0%) |
| Real Estate, Rental & Leasing | 0 (0.0%) | 0 (0.0%) |
| Professional & Scientific | 0 (0.0%) | 0 (0.0%) |
| Enterprise Management | 0 (0.0%) | 0 (0.0%) |
| Administrative & Support | 0 (0.0%) | 0 (0.0%) |
| Educational Services | 0 (0.0%) | 1 (100.0%) |
| Health Care & Social Assistance | 0 (0.0%) | 0 (0.0%) |
| Arts, Entertainment & Recreation | 0 (0.0%) | 0 (0.0%) |
| Accommodation & Food Services | 0 (0.0%) | 0 (0.0%) |
| Public Administration | 1 (33.3%) | 2 (66.7%) |
| Total | 7 (46.7%) | 8 (53.3%) |
Education in Raynham
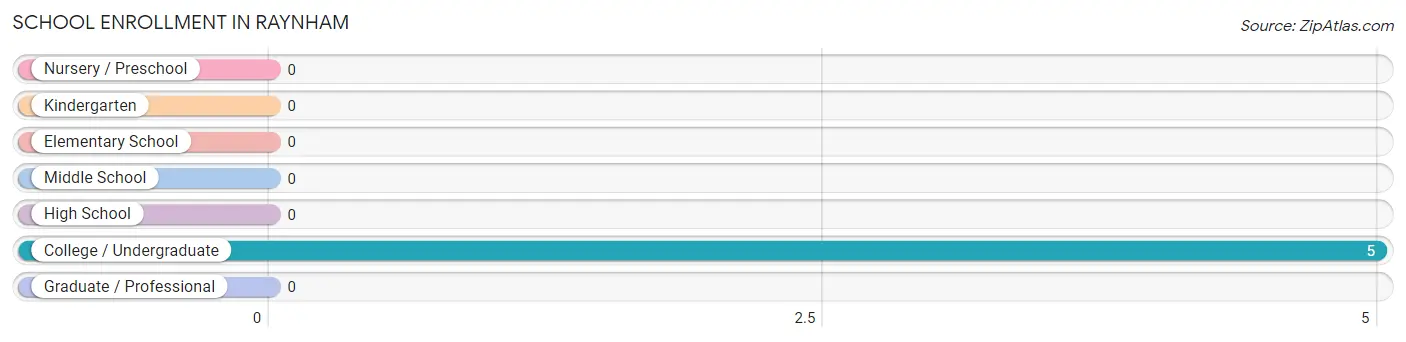
School Enrollment in Raynham
| School Level | # Students | % Students |
| Nursery / Preschool | 0 | 0.0% |
| Kindergarten | 0 | 0.0% |
| Elementary School | 0 | 0.0% |
| Middle School | 0 | 0.0% |
| High School | 0 | 0.0% |
| College / Undergraduate | 5 | 100.0% |
| Graduate / Professional | 0 | 0.0% |
| Total | 5 | 100.0% |
School Enrollment by Age by Funding Source in Raynham
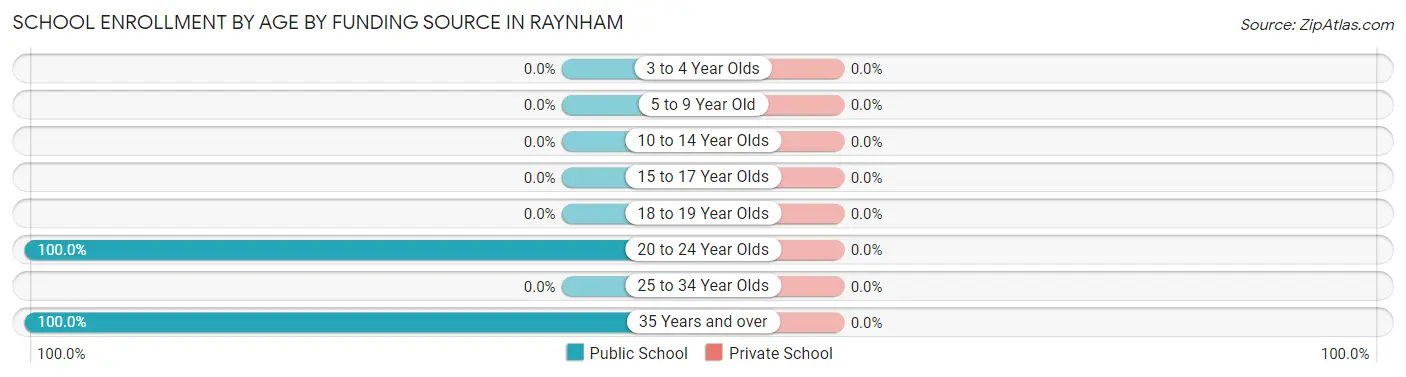
| Age Bracket | Public School | Private School |
| 3 to 4 Year Olds | 0 (0.0%) | 0 (0.0%) |
| 5 to 9 Year Old | 0 (0.0%) | 0 (0.0%) |
| 10 to 14 Year Olds | 0 (0.0%) | 0 (0.0%) |
| 15 to 17 Year Olds | 0 (0.0%) | 0 (0.0%) |
| 18 to 19 Year Olds | 0 (0.0%) | 0 (0.0%) |
| 20 to 24 Year Olds | 3 (100.0%) | 0 (0.0%) |
| 25 to 34 Year Olds | 0 (0.0%) | 0 (0.0%) |
| 35 Years and over | 2 (100.0%) | 0 (0.0%) |
| Total | 5 (100.0%) | 0 (0.0%) |
Educational Attainment by Field of Study in Raynham
, and education (1 | 100.0%) are the most common fields of study among 1 individuals in Raynham who have obtained a bachelor's degree or higher.
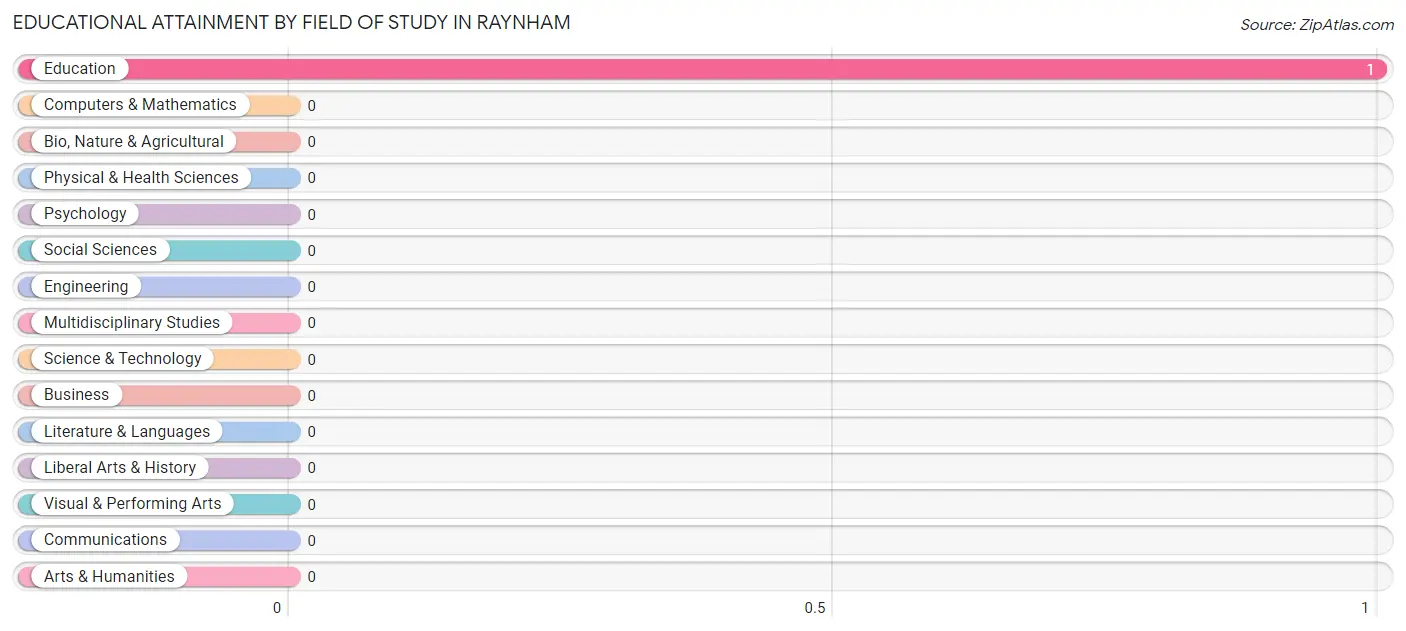
| Field of Study | # Graduates | % Graduates |
| Computers & Mathematics | 0 | 0.0% |
| Bio, Nature & Agricultural | 0 | 0.0% |
| Physical & Health Sciences | 0 | 0.0% |
| Psychology | 0 | 0.0% |
| Social Sciences | 0 | 0.0% |
| Engineering | 0 | 0.0% |
| Multidisciplinary Studies | 0 | 0.0% |
| Science & Technology | 0 | 0.0% |
| Business | 0 | 0.0% |
| Education | 1 | 100.0% |
| Literature & Languages | 0 | 0.0% |
| Liberal Arts & History | 0 | 0.0% |
| Visual & Performing Arts | 0 | 0.0% |
| Communications | 0 | 0.0% |
| Arts & Humanities | 0 | 0.0% |
| Total | 1 | 100.0% |
Transportation & Commute in Raynham
Vehicle Availability by Sex in Raynham
The most prevalent vehicle ownership categories in Raynham are males with 1 vehicle (3, accounting for 42.9%) and females with 1 vehicle (0, making up 37.5%).
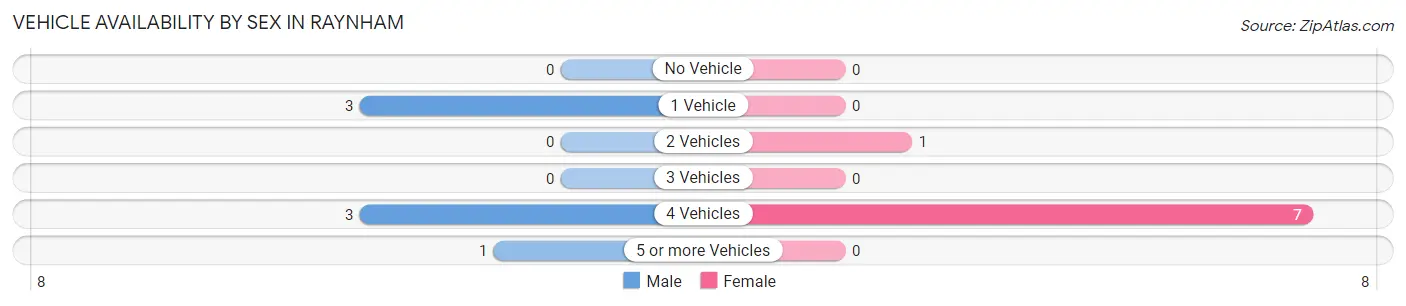
| Vehicles Available | Male | Female |
| No Vehicle | 0 (0.0%) | 0 (0.0%) |
| 1 Vehicle | 3 (42.9%) | 0 (0.0%) |
| 2 Vehicles | 0 (0.0%) | 1 (12.5%) |
| 3 Vehicles | 0 (0.0%) | 0 (0.0%) |
| 4 Vehicles | 3 (42.9%) | 7 (87.5%) |
| 5 or more Vehicles | 1 (14.3%) | 0 (0.0%) |
| Total | 7 (100.0%) | 8 (100.0%) |
Commute Time in Raynham
The most frequently occuring commute durations in Raynham are 15 to 19 minutes (8 commuters, 53.3%), 20 to 24 minutes (5 commuters, 33.3%), and 10 to 14 minutes (1 commuters, 6.7%).
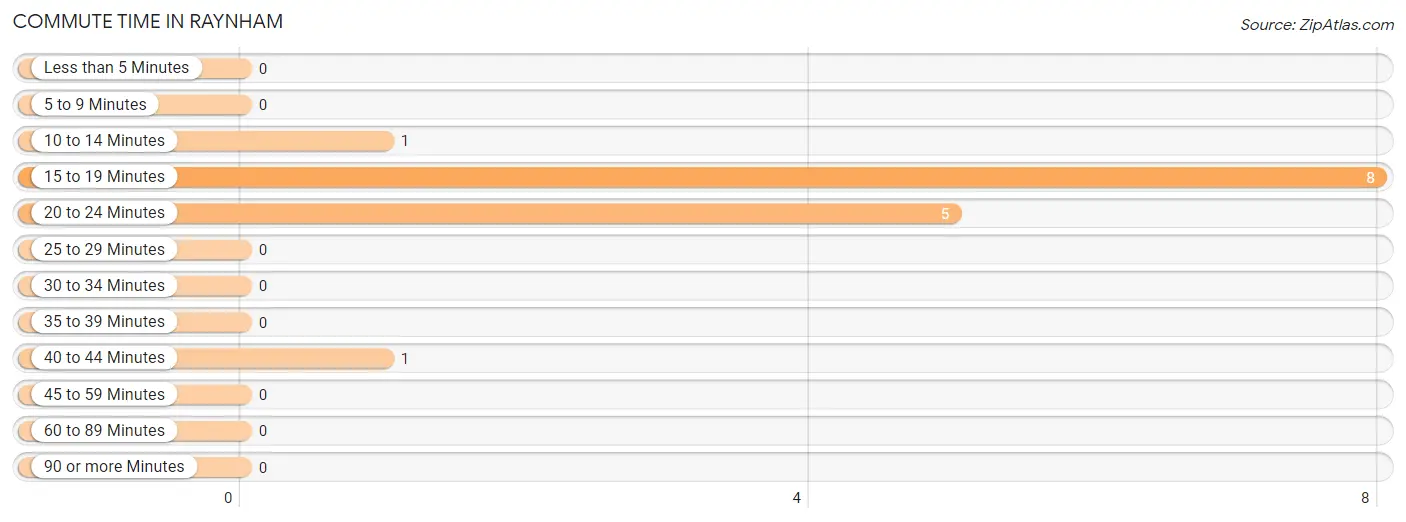
| Commute Time | # Commuters | % Commuters |
| Less than 5 Minutes | 0 | 0.0% |
| 5 to 9 Minutes | 0 | 0.0% |
| 10 to 14 Minutes | 1 | 6.7% |
| 15 to 19 Minutes | 8 | 53.3% |
| 20 to 24 Minutes | 5 | 33.3% |
| 25 to 29 Minutes | 0 | 0.0% |
| 30 to 34 Minutes | 0 | 0.0% |
| 35 to 39 Minutes | 0 | 0.0% |
| 40 to 44 Minutes | 1 | 6.7% |
| 45 to 59 Minutes | 0 | 0.0% |
| 60 to 89 Minutes | 0 | 0.0% |
| 90 or more Minutes | 0 | 0.0% |
Commute Time by Sex in Raynham
The most common commute times in Raynham are 15 to 19 minutes (3 commuters, 42.9%) for males and 15 to 19 minutes (5 commuters, 62.5%) for females.
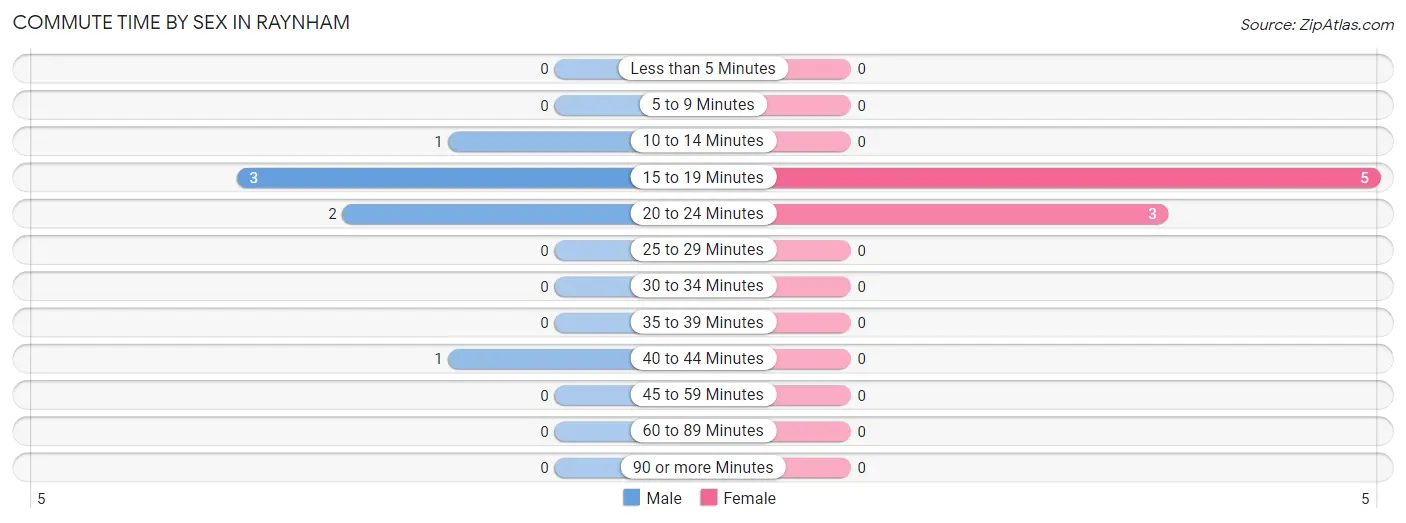
| Commute Time | Male | Female |
| Less than 5 Minutes | 0 (0.0%) | 0 (0.0%) |
| 5 to 9 Minutes | 0 (0.0%) | 0 (0.0%) |
| 10 to 14 Minutes | 1 (14.3%) | 0 (0.0%) |
| 15 to 19 Minutes | 3 (42.9%) | 5 (62.5%) |
| 20 to 24 Minutes | 2 (28.6%) | 3 (37.5%) |
| 25 to 29 Minutes | 0 (0.0%) | 0 (0.0%) |
| 30 to 34 Minutes | 0 (0.0%) | 0 (0.0%) |
| 35 to 39 Minutes | 0 (0.0%) | 0 (0.0%) |
| 40 to 44 Minutes | 1 (14.3%) | 0 (0.0%) |
| 45 to 59 Minutes | 0 (0.0%) | 0 (0.0%) |
| 60 to 89 Minutes | 0 (0.0%) | 0 (0.0%) |
| 90 or more Minutes | 0 (0.0%) | 0 (0.0%) |
Time of Departure to Work by Sex in Raynham
The most frequent times of departure to work in Raynham are 12:00 AM to 4:59 AM (2, 28.6%) for males and 6:00 AM to 6:29 AM (3, 37.5%) for females.
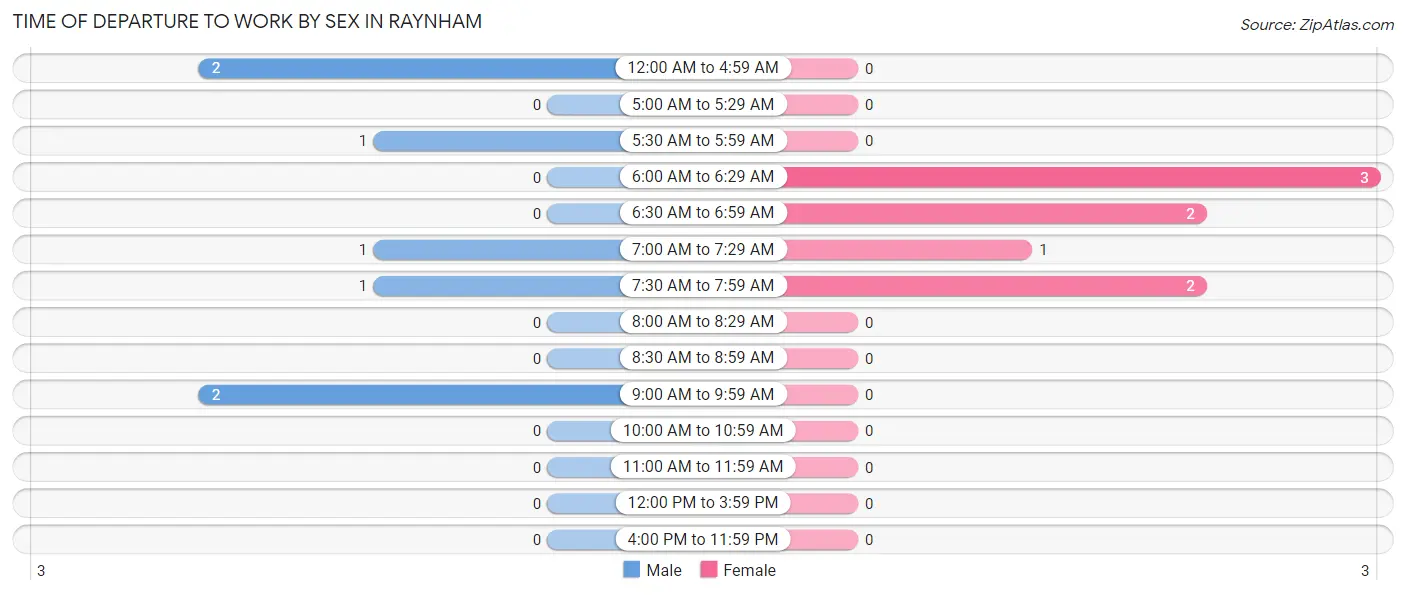
| Time of Departure | Male | Female |
| 12:00 AM to 4:59 AM | 2 (28.6%) | 0 (0.0%) |
| 5:00 AM to 5:29 AM | 0 (0.0%) | 0 (0.0%) |
| 5:30 AM to 5:59 AM | 1 (14.3%) | 0 (0.0%) |
| 6:00 AM to 6:29 AM | 0 (0.0%) | 3 (37.5%) |
| 6:30 AM to 6:59 AM | 0 (0.0%) | 2 (25.0%) |
| 7:00 AM to 7:29 AM | 1 (14.3%) | 1 (12.5%) |
| 7:30 AM to 7:59 AM | 1 (14.3%) | 2 (25.0%) |
| 8:00 AM to 8:29 AM | 0 (0.0%) | 0 (0.0%) |
| 8:30 AM to 8:59 AM | 0 (0.0%) | 0 (0.0%) |
| 9:00 AM to 9:59 AM | 2 (28.6%) | 0 (0.0%) |
| 10:00 AM to 10:59 AM | 0 (0.0%) | 0 (0.0%) |
| 11:00 AM to 11:59 AM | 0 (0.0%) | 0 (0.0%) |
| 12:00 PM to 3:59 PM | 0 (0.0%) | 0 (0.0%) |
| 4:00 PM to 11:59 PM | 0 (0.0%) | 0 (0.0%) |
| Total | 7 (100.0%) | 8 (100.0%) |
Housing Occupancy in Raynham
Occupancy by Ownership in Raynham
Of the total 22 dwellings in Raynham, owner-occupied units account for 20 (90.9%), while renter-occupied units make up 2 (9.1%).
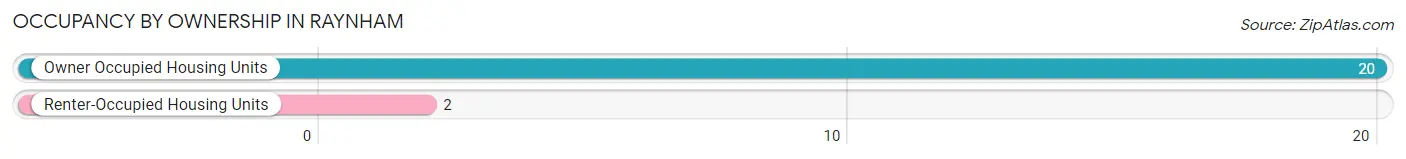
| Occupancy | # Housing Units | % Housing Units |
| Owner Occupied Housing Units | 20 | 90.9% |
| Renter-Occupied Housing Units | 2 | 9.1% |
| Total Occupied Housing Units | 22 | 100.0% |
Occupancy by Household Size in Raynham
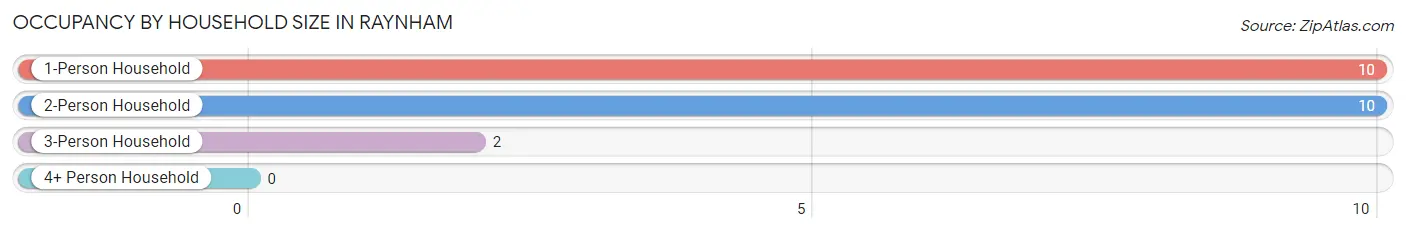
| Household Size | # Housing Units | % Housing Units |
| 1-Person Household | 10 | 45.5% |
| 2-Person Household | 10 | 45.5% |
| 3-Person Household | 2 | 9.1% |
| 4+ Person Household | 0 | 0.0% |
| Total Housing Units | 22 | 100.0% |
Occupancy by Ownership by Household Size in Raynham
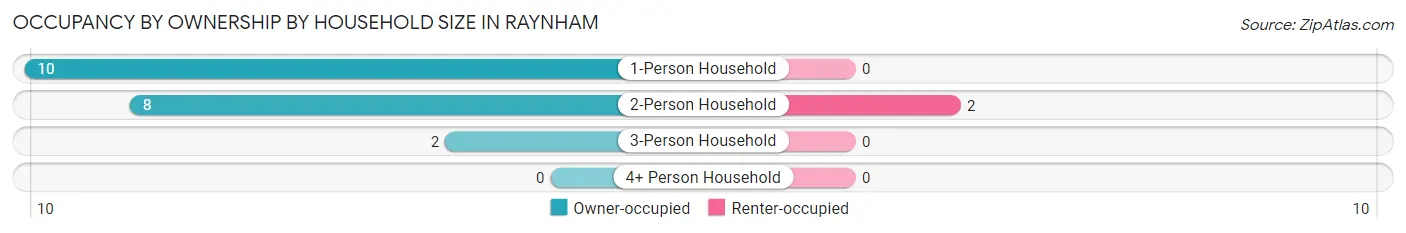
| Household Size | Owner-occupied | Renter-occupied |
| 1-Person Household | 10 (100.0%) | 0 (0.0%) |
| 2-Person Household | 8 (80.0%) | 2 (20.0%) |
| 3-Person Household | 2 (100.0%) | 0 (0.0%) |
| 4+ Person Household | 0 (0.0%) | 0 (0.0%) |
| Total Housing Units | 20 (90.9%) | 2 (9.1%) |
Occupancy by Educational Attainment in Raynham
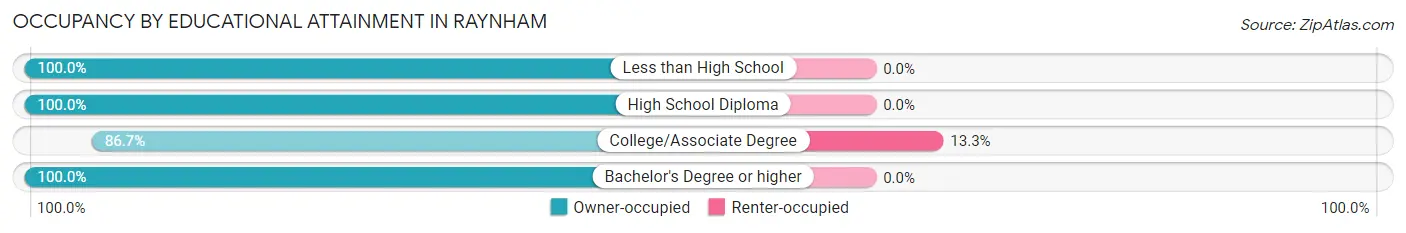
| Household Size | Owner-occupied | Renter-occupied |
| Less than High School | 4 (100.0%) | 0 (0.0%) |
| High School Diploma | 2 (100.0%) | 0 (0.0%) |
| College/Associate Degree | 13 (86.7%) | 2 (13.3%) |
| Bachelor's Degree or higher | 1 (100.0%) | 0 (0.0%) |
Occupancy by Age of Householder in Raynham
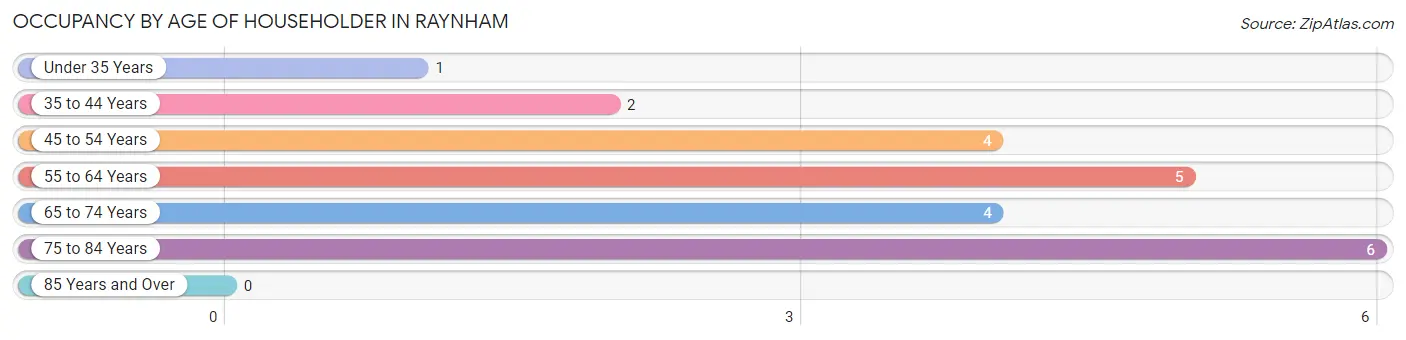
| Age Bracket | # Households | % Households |
| Under 35 Years | 1 | 4.5% |
| 35 to 44 Years | 2 | 9.1% |
| 45 to 54 Years | 4 | 18.2% |
| 55 to 64 Years | 5 | 22.7% |
| 65 to 74 Years | 4 | 18.2% |
| 75 to 84 Years | 6 | 27.3% |
| 85 Years and Over | 0 | 0.0% |
| Total | 22 | 100.0% |
Housing Finances in Raynham
Median Income by Occupancy in Raynham
| Occupancy Type | # Households | Median Income |
| Owner-Occupied | 20 (90.9%) | $0 |
| Renter-Occupied | 2 (9.1%) | $0 |
| Average | 22 (100.0%) | $0 |
Occupancy by Householder Income Bracket in Raynham
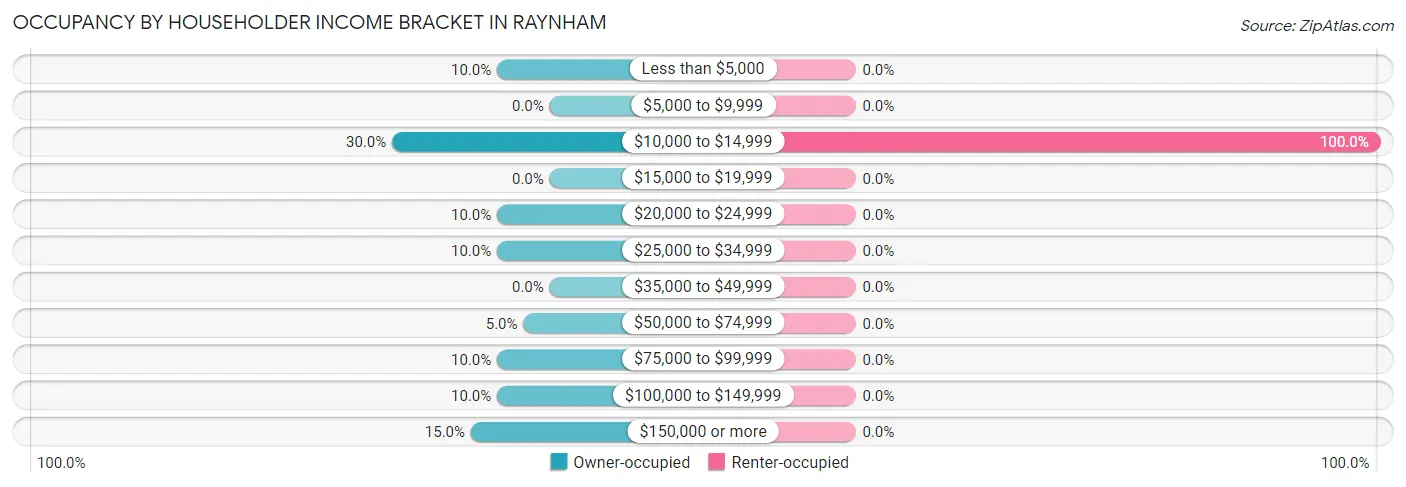
| Income Bracket | Owner-occupied | Renter-occupied |
| Less than $5,000 | 2 (10.0%) | 0 (0.0%) |
| $5,000 to $9,999 | 0 (0.0%) | 0 (0.0%) |
| $10,000 to $14,999 | 6 (30.0%) | 2 (100.0%) |
| $15,000 to $19,999 | 0 (0.0%) | 0 (0.0%) |
| $20,000 to $24,999 | 2 (10.0%) | 0 (0.0%) |
| $25,000 to $34,999 | 2 (10.0%) | 0 (0.0%) |
| $35,000 to $49,999 | 0 (0.0%) | 0 (0.0%) |
| $50,000 to $74,999 | 1 (5.0%) | 0 (0.0%) |
| $75,000 to $99,999 | 2 (10.0%) | 0 (0.0%) |
| $100,000 to $149,999 | 2 (10.0%) | 0 (0.0%) |
| $150,000 or more | 3 (15.0%) | 0 (0.0%) |
| Total | 20 (100.0%) | 2 (100.0%) |
Monthly Housing Cost Tiers in Raynham
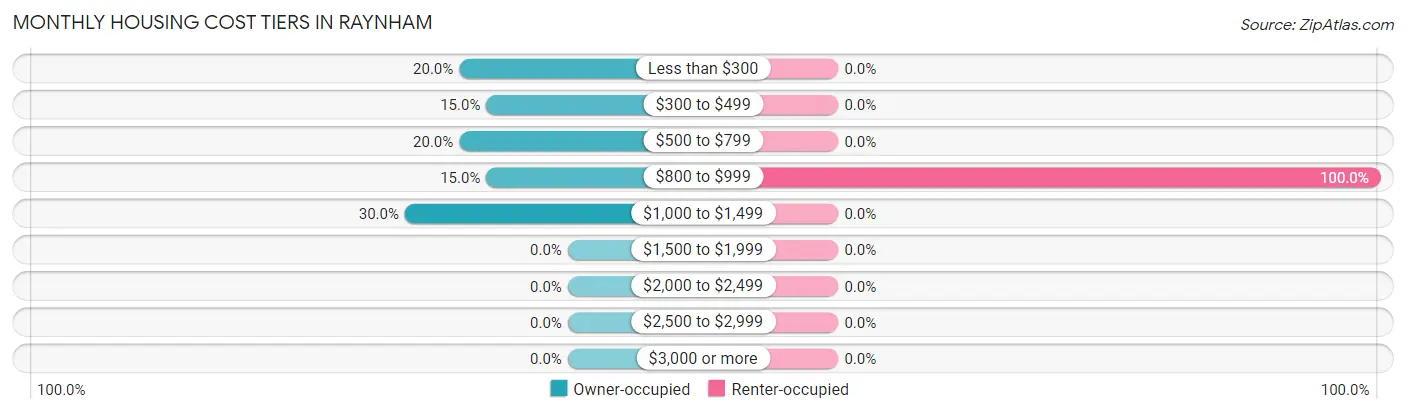
| Monthly Cost | Owner-occupied | Renter-occupied |
| Less than $300 | 4 (20.0%) | 0 (0.0%) |
| $300 to $499 | 3 (15.0%) | 0 (0.0%) |
| $500 to $799 | 4 (20.0%) | 0 (0.0%) |
| $800 to $999 | 3 (15.0%) | 2 (100.0%) |
| $1,000 to $1,499 | 6 (30.0%) | 0 (0.0%) |
| $1,500 to $1,999 | 0 (0.0%) | 0 (0.0%) |
| $2,000 to $2,499 | 0 (0.0%) | 0 (0.0%) |
| $2,500 to $2,999 | 0 (0.0%) | 0 (0.0%) |
| $3,000 or more | 0 (0.0%) | 0 (0.0%) |
| Total | 20 (100.0%) | 2 (100.0%) |
Physical Housing Characteristics in Raynham
Housing Structures in Raynham
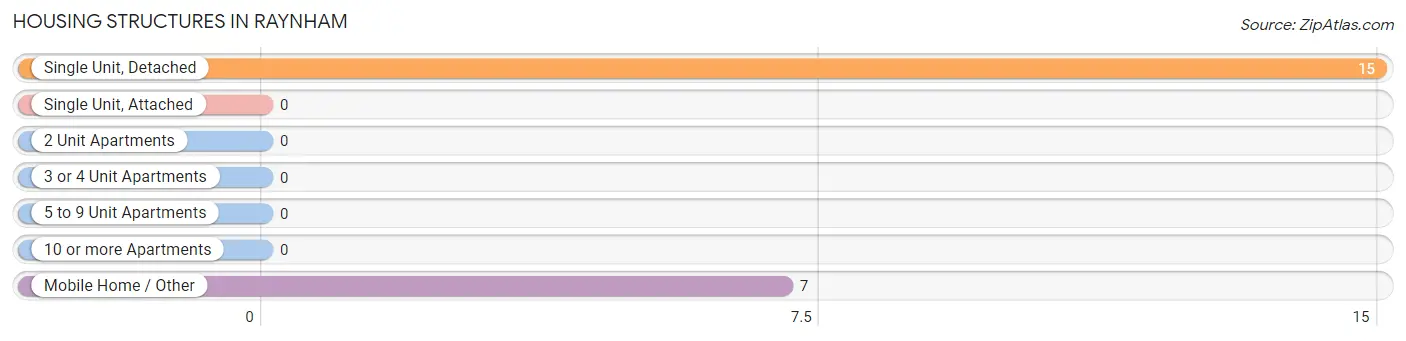
| Structure Type | # Housing Units | % Housing Units |
| Single Unit, Detached | 15 | 68.2% |
| Single Unit, Attached | 0 | 0.0% |
| 2 Unit Apartments | 0 | 0.0% |
| 3 or 4 Unit Apartments | 0 | 0.0% |
| 5 to 9 Unit Apartments | 0 | 0.0% |
| 10 or more Apartments | 0 | 0.0% |
| Mobile Home / Other | 7 | 31.8% |
| Total | 22 | 100.0% |
Housing Structures by Occupancy in Raynham
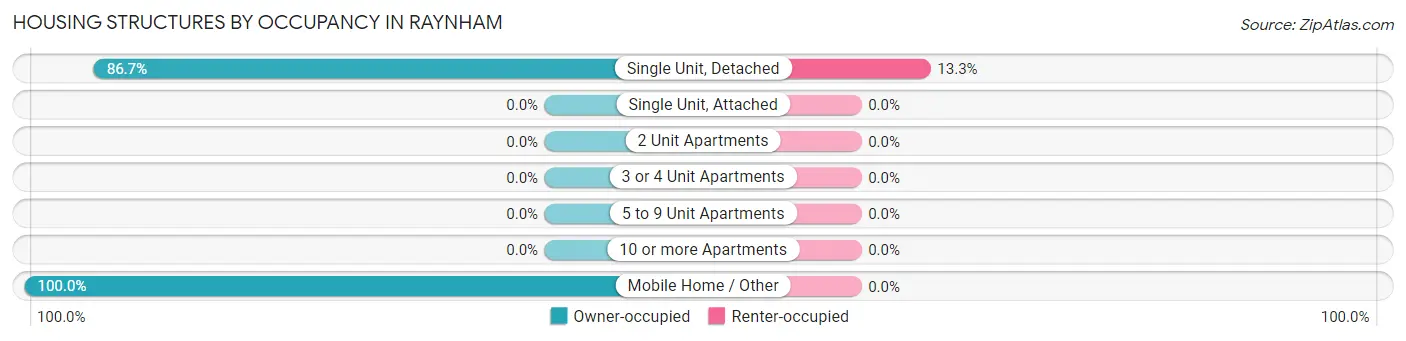
| Structure Type | Owner-occupied | Renter-occupied |
| Single Unit, Detached | 13 (86.7%) | 2 (13.3%) |
| Single Unit, Attached | 0 (0.0%) | 0 (0.0%) |
| 2 Unit Apartments | 0 (0.0%) | 0 (0.0%) |
| 3 or 4 Unit Apartments | 0 (0.0%) | 0 (0.0%) |
| 5 to 9 Unit Apartments | 0 (0.0%) | 0 (0.0%) |
| 10 or more Apartments | 0 (0.0%) | 0 (0.0%) |
| Mobile Home / Other | 7 (100.0%) | 0 (0.0%) |
| Total | 20 (90.9%) | 2 (9.1%) |
Housing Structures by Number of Rooms in Raynham
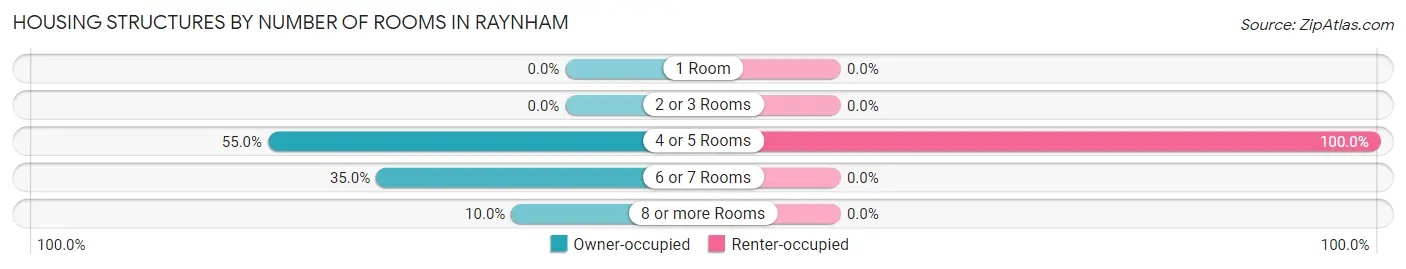
| Number of Rooms | Owner-occupied | Renter-occupied |
| 1 Room | 0 (0.0%) | 0 (0.0%) |
| 2 or 3 Rooms | 0 (0.0%) | 0 (0.0%) |
| 4 or 5 Rooms | 11 (55.0%) | 2 (100.0%) |
| 6 or 7 Rooms | 7 (35.0%) | 0 (0.0%) |
| 8 or more Rooms | 2 (10.0%) | 0 (0.0%) |
| Total | 20 (100.0%) | 2 (100.0%) |
Housing Structure by Heating Type in Raynham
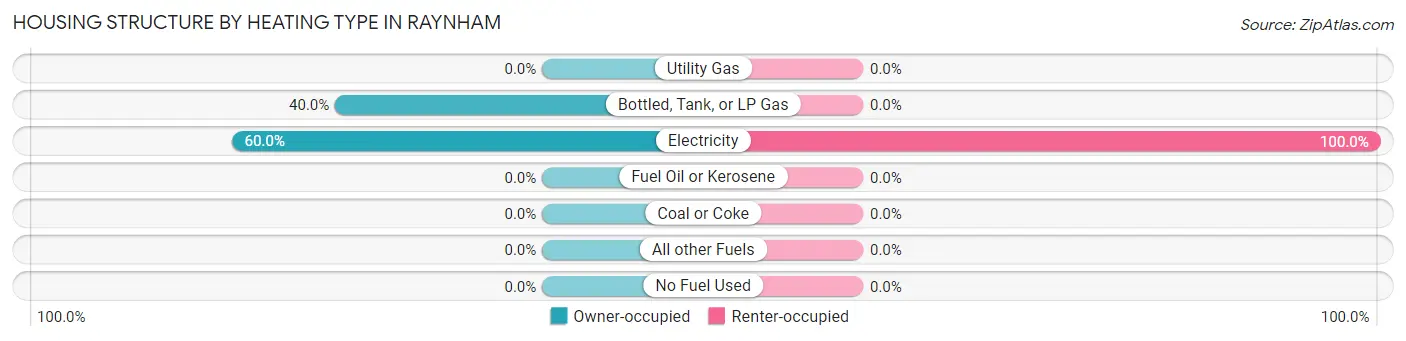
| Heating Type | Owner-occupied | Renter-occupied |
| Utility Gas | 0 (0.0%) | 0 (0.0%) |
| Bottled, Tank, or LP Gas | 8 (40.0%) | 0 (0.0%) |
| Electricity | 12 (60.0%) | 2 (100.0%) |
| Fuel Oil or Kerosene | 0 (0.0%) | 0 (0.0%) |
| Coal or Coke | 0 (0.0%) | 0 (0.0%) |
| All other Fuels | 0 (0.0%) | 0 (0.0%) |
| No Fuel Used | 0 (0.0%) | 0 (0.0%) |
| Total | 20 (100.0%) | 2 (100.0%) |
Household Vehicle Usage in Raynham
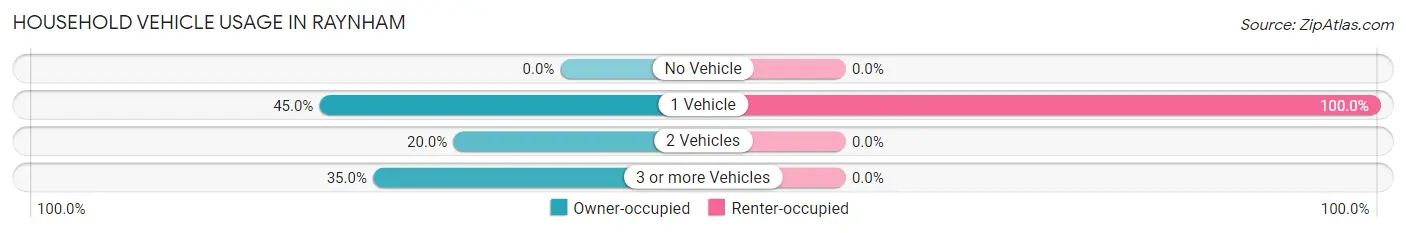
| Vehicles per Household | Owner-occupied | Renter-occupied |
| No Vehicle | 0 (0.0%) | 0 (0.0%) |
| 1 Vehicle | 9 (45.0%) | 2 (100.0%) |
| 2 Vehicles | 4 (20.0%) | 0 (0.0%) |
| 3 or more Vehicles | 7 (35.0%) | 0 (0.0%) |
| Total | 20 (100.0%) | 2 (100.0%) |
Real Estate & Mortgages in Raynham
Real Estate and Mortgage Overview in Raynham
| Characteristic | Without Mortgage | With Mortgage |
| Housing Units | 10 | 10 |
| Median Property Value | - | - |
| Median Household Income | - | - |
| Monthly Housing Costs | $433 | $0 |
| Real Estate Taxes | $900 | $0 |
Property Value by Mortgage Status in Raynham
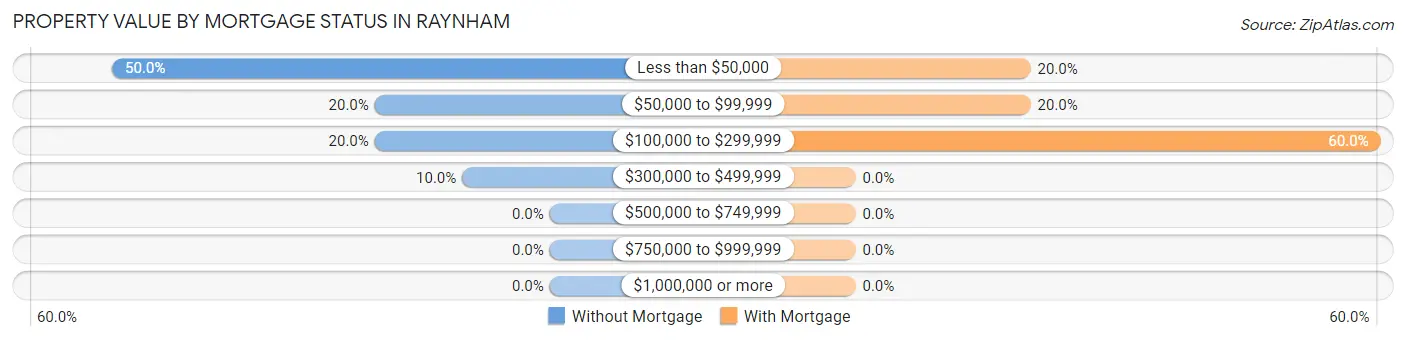
| Property Value | Without Mortgage | With Mortgage |
| Less than $50,000 | 5 (50.0%) | 2 (20.0%) |
| $50,000 to $99,999 | 2 (20.0%) | 2 (20.0%) |
| $100,000 to $299,999 | 2 (20.0%) | 6 (60.0%) |
| $300,000 to $499,999 | 1 (10.0%) | 0 (0.0%) |
| $500,000 to $749,999 | 0 (0.0%) | 0 (0.0%) |
| $750,000 to $999,999 | 0 (0.0%) | 0 (0.0%) |
| $1,000,000 or more | 0 (0.0%) | 0 (0.0%) |
| Total | 10 (100.0%) | 10 (100.0%) |
Household Income by Mortgage Status in Raynham
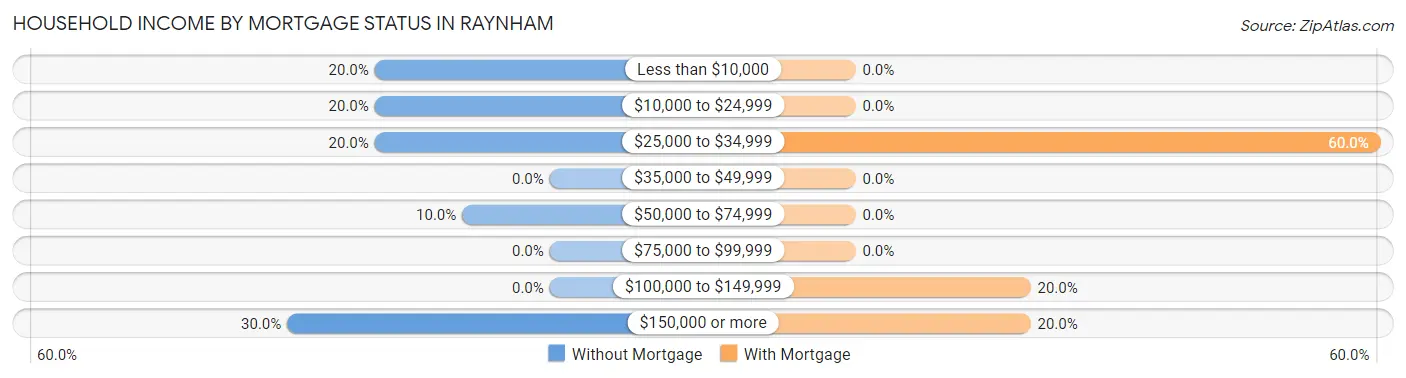
| Household Income | Without Mortgage | With Mortgage |
| Less than $10,000 | 2 (20.0%) | 0 (0.0%) |
| $10,000 to $24,999 | 2 (20.0%) | 0 (0.0%) |
| $25,000 to $34,999 | 2 (20.0%) | 6 (60.0%) |
| $35,000 to $49,999 | 0 (0.0%) | 0 (0.0%) |
| $50,000 to $74,999 | 1 (10.0%) | 0 (0.0%) |
| $75,000 to $99,999 | 0 (0.0%) | 0 (0.0%) |
| $100,000 to $149,999 | 0 (0.0%) | 2 (20.0%) |
| $150,000 or more | 3 (30.0%) | 2 (20.0%) |
| Total | 10 (100.0%) | 10 (100.0%) |
Property Value to Household Income Ratio in Raynham
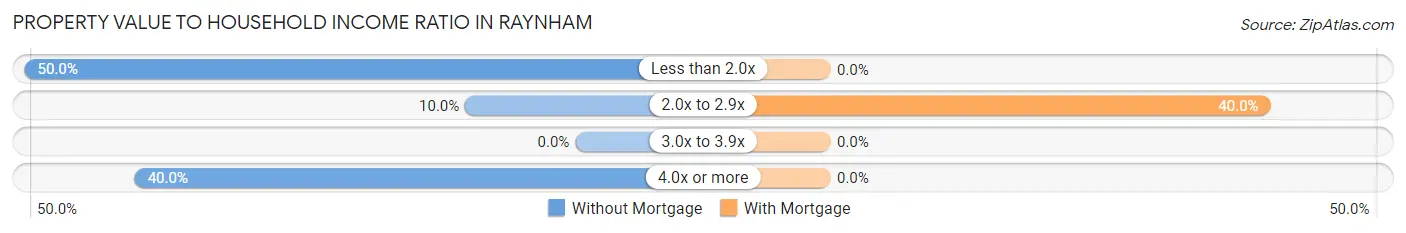
| Value-to-Income Ratio | Without Mortgage | With Mortgage |
| Less than 2.0x | 5 (50.0%) | 0 (0.0%) |
| 2.0x to 2.9x | 1 (10.0%) | 4 (40.0%) |
| 3.0x to 3.9x | 0 (0.0%) | 0 (0.0%) |
| 4.0x or more | 4 (40.0%) | 0 (0.0%) |
| Total | 10 (100.0%) | 10 (100.0%) |
Real Estate Taxes by Mortgage Status in Raynham
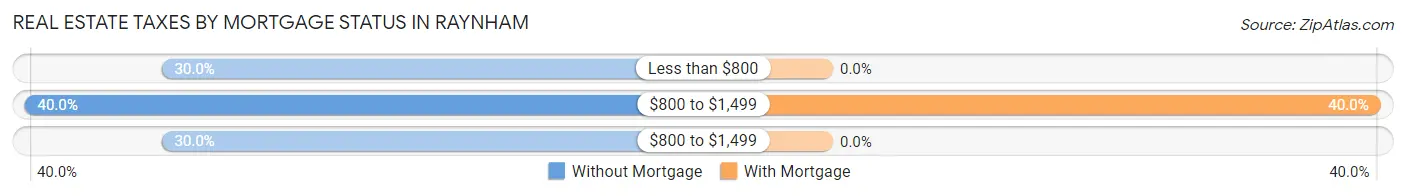
| Property Taxes | Without Mortgage | With Mortgage |
| Less than $800 | 3 (30.0%) | 0 (0.0%) |
| $800 to $1,499 | 4 (40.0%) | 4 (40.0%) |
| $800 to $1,499 | 3 (30.0%) | 0 (0.0%) |
| Total | 10 (100.0%) | 10 (100.0%) |
Health & Disability in Raynham
Health Insurance Coverage by Age in Raynham
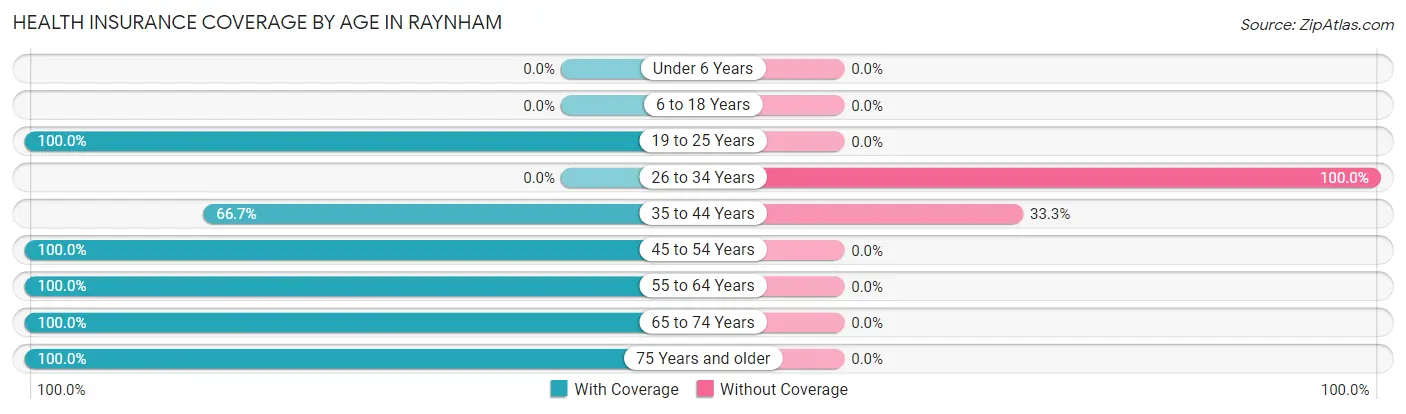
| Age Bracket | With Coverage | Without Coverage |
| Under 6 Years | 0 (0.0%) | 0 (0.0%) |
| 6 to 18 Years | 0 (0.0%) | 0 (0.0%) |
| 19 to 25 Years | 3 (100.0%) | 0 (0.0%) |
| 26 to 34 Years | 0 (0.0%) | 1 (100.0%) |
| 35 to 44 Years | 4 (66.7%) | 2 (33.3%) |
| 45 to 54 Years | 4 (100.0%) | 0 (0.0%) |
| 55 to 64 Years | 9 (100.0%) | 0 (0.0%) |
| 65 to 74 Years | 8 (100.0%) | 0 (0.0%) |
| 75 Years and older | 6 (100.0%) | 0 (0.0%) |
| Total | 34 (91.9%) | 3 (8.1%) |
Health Insurance Coverage by Citizenship Status in Raynham
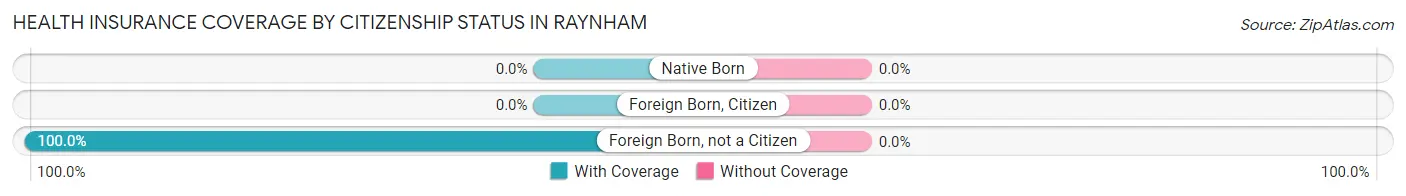
| Citizenship Status | With Coverage | Without Coverage |
| Native Born | 0 (0.0%) | 0 (0.0%) |
| Foreign Born, Citizen | 0 (0.0%) | 0 (0.0%) |
| Foreign Born, not a Citizen | 3 (100.0%) | 0 (0.0%) |
Health Insurance Coverage by Household Income in Raynham
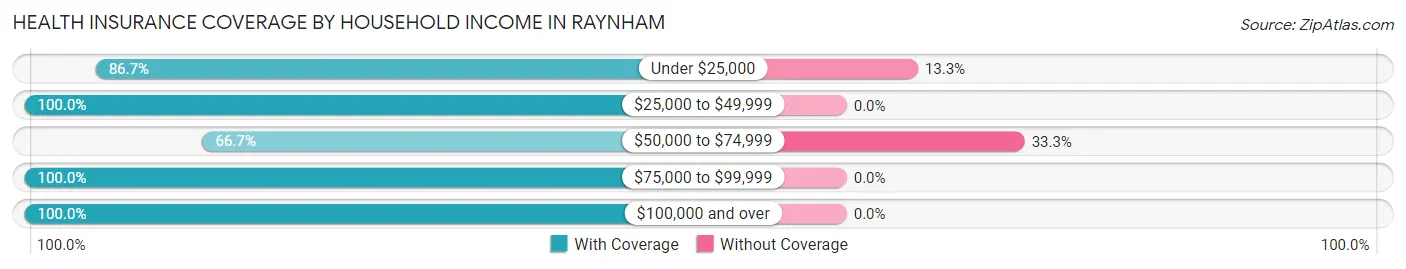
| Household Income | With Coverage | Without Coverage |
| Under $25,000 | 13 (86.7%) | 2 (13.3%) |
| $25,000 to $49,999 | 2 (100.0%) | 0 (0.0%) |
| $50,000 to $74,999 | 2 (66.7%) | 1 (33.3%) |
| $75,000 to $99,999 | 7 (100.0%) | 0 (0.0%) |
| $100,000 and over | 10 (100.0%) | 0 (0.0%) |
Public vs Private Health Insurance Coverage by Age in Raynham
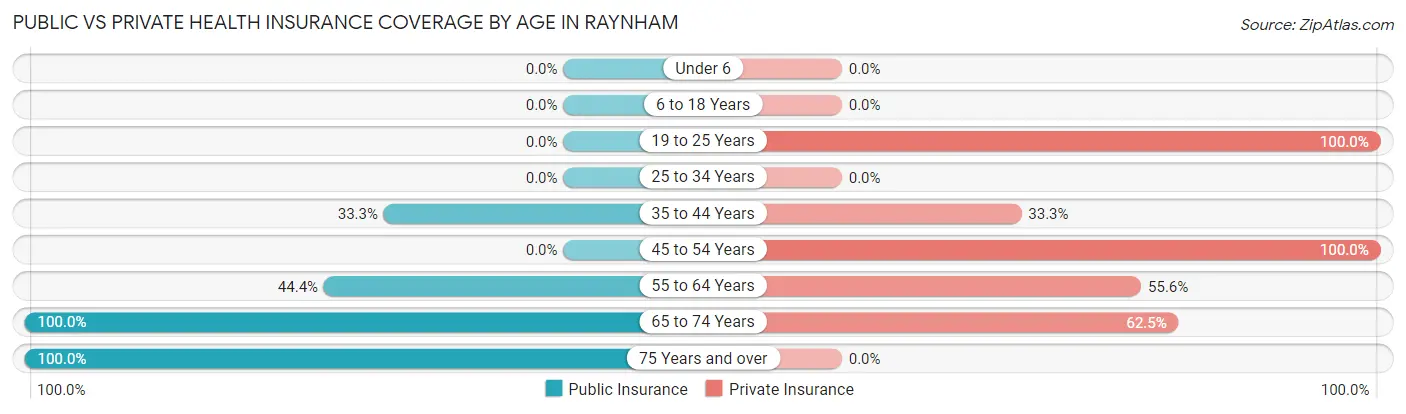
| Age Bracket | Public Insurance | Private Insurance |
| Under 6 | 0 (0.0%) | 0 (0.0%) |
| 6 to 18 Years | 0 (0.0%) | 0 (0.0%) |
| 19 to 25 Years | 0 (0.0%) | 3 (100.0%) |
| 25 to 34 Years | 0 (0.0%) | 0 (0.0%) |
| 35 to 44 Years | 2 (33.3%) | 2 (33.3%) |
| 45 to 54 Years | 0 (0.0%) | 4 (100.0%) |
| 55 to 64 Years | 4 (44.4%) | 5 (55.6%) |
| 65 to 74 Years | 8 (100.0%) | 5 (62.5%) |
| 75 Years and over | 6 (100.0%) | 0 (0.0%) |
| Total | 20 (54.0%) | 19 (51.3%) |
Disability Status by Sex by Age in Raynham
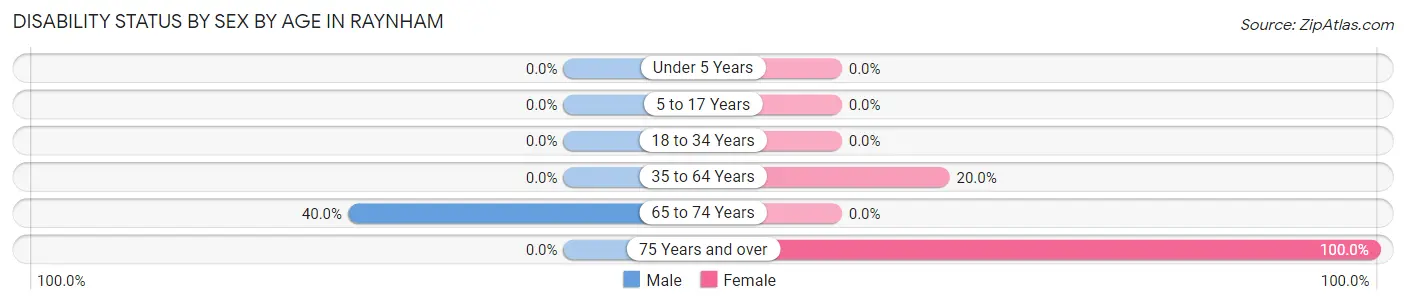
| Age Bracket | Male | Female |
| Under 5 Years | 0 (0.0%) | 0 (0.0%) |
| 5 to 17 Years | 0 (0.0%) | 0 (0.0%) |
| 18 to 34 Years | 0 (0.0%) | 0 (0.0%) |
| 35 to 64 Years | 0 (0.0%) | 2 (20.0%) |
| 65 to 74 Years | 2 (40.0%) | 0 (0.0%) |
| 75 Years and over | 0 (0.0%) | 6 (100.0%) |
Disability Class by Sex by Age in Raynham
Disability Class: Hearing Difficulty
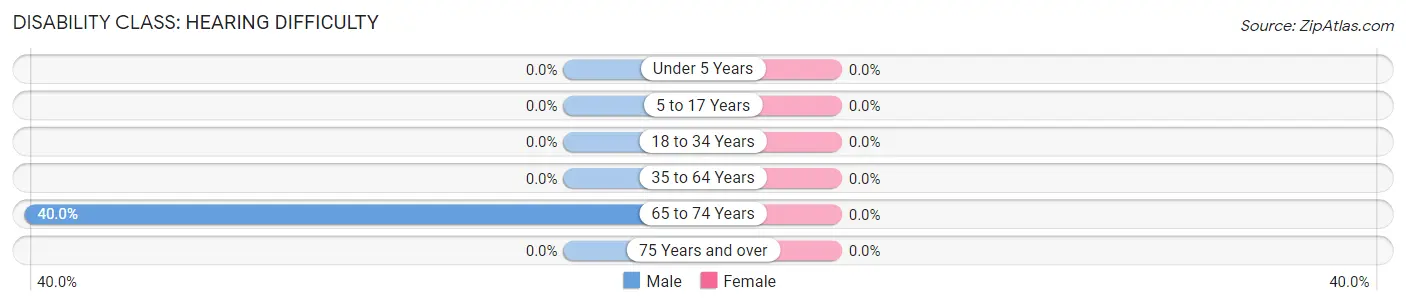
| Age Bracket | Male | Female |
| Under 5 Years | 0 (0.0%) | 0 (0.0%) |
| 5 to 17 Years | 0 (0.0%) | 0 (0.0%) |
| 18 to 34 Years | 0 (0.0%) | 0 (0.0%) |
| 35 to 64 Years | 0 (0.0%) | 0 (0.0%) |
| 65 to 74 Years | 2 (40.0%) | 0 (0.0%) |
| 75 Years and over | 0 (0.0%) | 0 (0.0%) |
Disability Class: Vision Difficulty
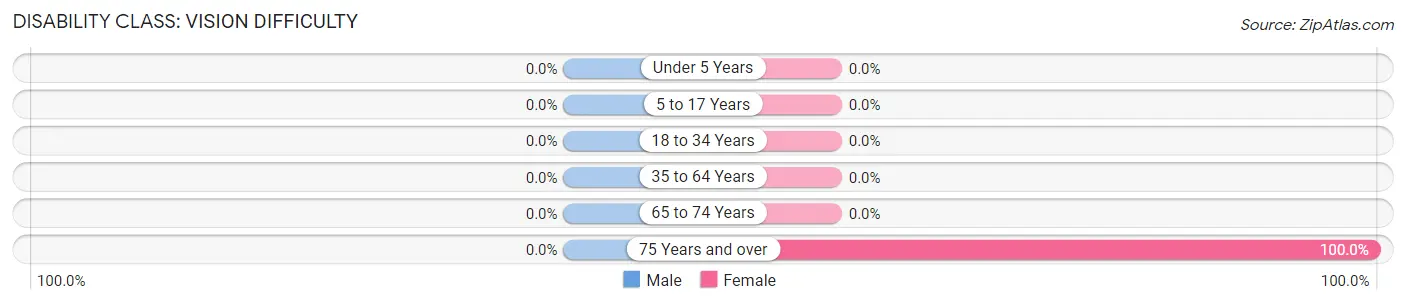
| Age Bracket | Male | Female |
| Under 5 Years | 0 (0.0%) | 0 (0.0%) |
| 5 to 17 Years | 0 (0.0%) | 0 (0.0%) |
| 18 to 34 Years | 0 (0.0%) | 0 (0.0%) |
| 35 to 64 Years | 0 (0.0%) | 0 (0.0%) |
| 65 to 74 Years | 0 (0.0%) | 0 (0.0%) |
| 75 Years and over | 0 (0.0%) | 6 (100.0%) |
Disability Class: Cognitive Difficulty
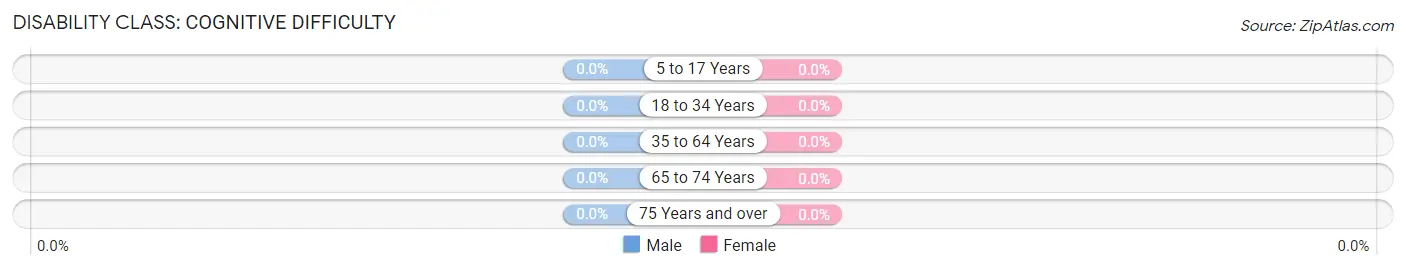
| Age Bracket | Male | Female |
| 5 to 17 Years | 0 (0.0%) | 0 (0.0%) |
| 18 to 34 Years | 0 (0.0%) | 0 (0.0%) |
| 35 to 64 Years | 0 (0.0%) | 0 (0.0%) |
| 65 to 74 Years | 0 (0.0%) | 0 (0.0%) |
| 75 Years and over | 0 (0.0%) | 0 (0.0%) |
Disability Class: Ambulatory Difficulty
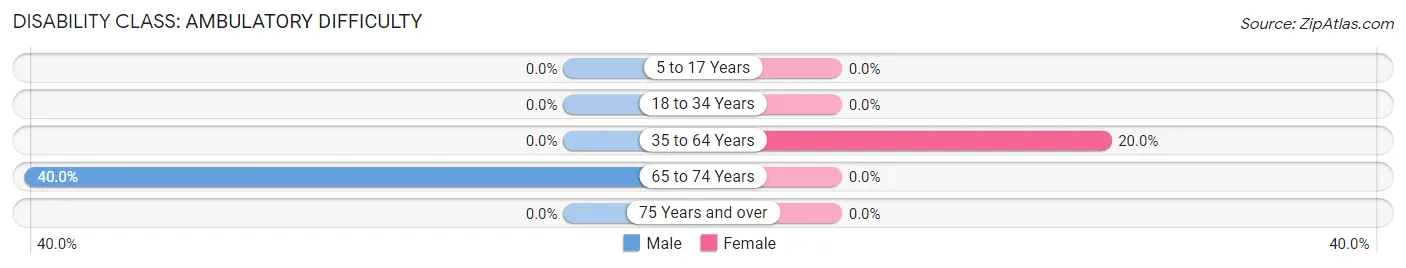
| Age Bracket | Male | Female |
| 5 to 17 Years | 0 (0.0%) | 0 (0.0%) |
| 18 to 34 Years | 0 (0.0%) | 0 (0.0%) |
| 35 to 64 Years | 0 (0.0%) | 2 (20.0%) |
| 65 to 74 Years | 2 (40.0%) | 0 (0.0%) |
| 75 Years and over | 0 (0.0%) | 0 (0.0%) |
Disability Class: Self-Care Difficulty
| Age Bracket | Male | Female |
| 5 to 17 Years | 0 (0.0%) | 0 (0.0%) |
| 18 to 34 Years | 0 (0.0%) | 0 (0.0%) |
| 35 to 64 Years | 0 (0.0%) | 0 (0.0%) |
| 65 to 74 Years | 0 (0.0%) | 0 (0.0%) |
| 75 Years and over | 0 (0.0%) | 0 (0.0%) |
Technology Access in Raynham
Computing Device Access in Raynham
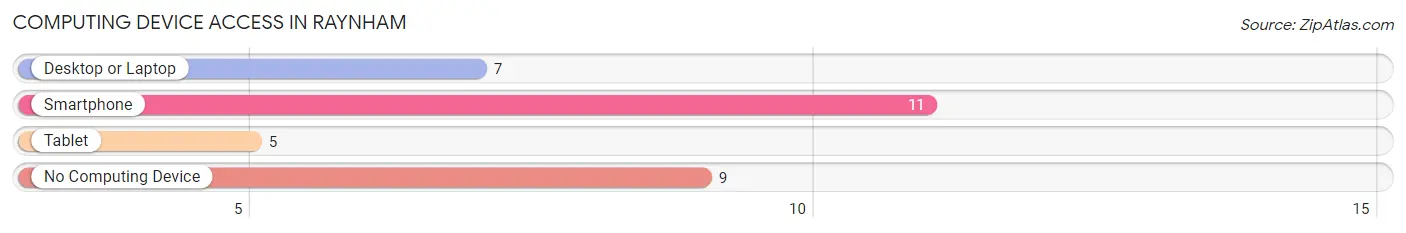
| Device Type | # Households | % Households |
| Desktop or Laptop | 7 | 31.8% |
| Smartphone | 11 | 50.0% |
| Tablet | 5 | 22.7% |
| No Computing Device | 9 | 40.9% |
| Total | 22 | 100.0% |
Internet Access in Raynham
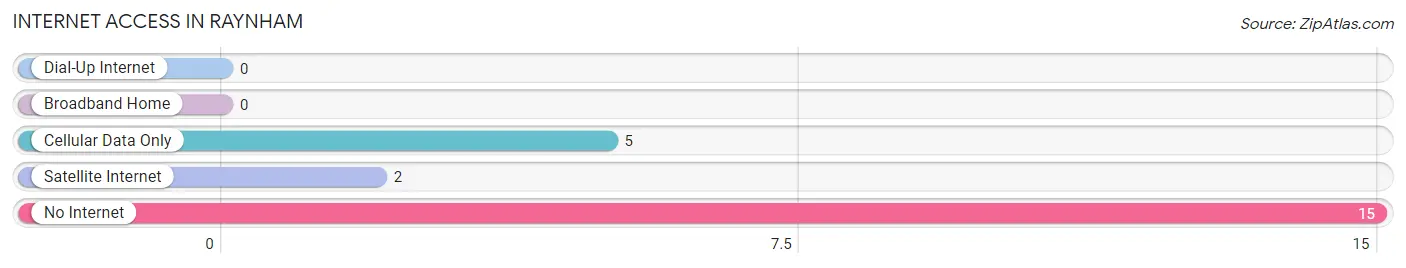
| Internet Type | # Households | % Households |
| Dial-Up Internet | 0 | 0.0% |
| Broadband Home | 0 | 0.0% |
| Cellular Data Only | 5 | 22.7% |
| Satellite Internet | 2 | 9.1% |
| No Internet | 15 | 68.2% |
| Total | 22 | 100.0% |
Raynham Summary
Raynham, NC is a small town located in the foothills of the Blue Ridge Mountains in North Carolina. It is situated in the Yadkin Valley region of the state, and is part of the larger Winston-Salem metropolitan area. The town has a population of just over 1,000 people, and is known for its rural charm and small-town atmosphere.
History
Raynham was first settled in the late 1700s by a group of settlers from Pennsylvania. The town was originally known as Raynham Crossroads, and was named after the Raynham family who owned the land. The town was officially incorporated in 1891, and the first post office was established in 1892.
In the early 1900s, Raynham was a thriving agricultural community, with many of the town’s residents working in the tobacco and cotton industries. The town also had a thriving lumber industry, and was home to several sawmills.
In the 1950s, the town began to experience a decline in population as many of its residents moved away in search of better economic opportunities. However, in recent years, the town has seen a resurgence in population as people have moved back to the area in search of a more rural lifestyle.
Geography
Raynham is located in the foothills of the Blue Ridge Mountains in North Carolina. The town is situated in the Yadkin Valley region of the state, and is part of the larger Winston-Salem metropolitan area. The town is located approximately 25 miles south of Winston-Salem, and is bordered by the towns of Yadkinville, East Bend, and Boonville.
The town is situated at an elevation of 1,000 feet, and is surrounded by rolling hills and lush forests. The town is located near several rivers, including the Yadkin River, the Catawba River, and the South Yadkin River.
Economy
The economy of Raynham is largely based on agriculture and tourism. The town is home to several farms, and many of the town’s residents are employed in the agricultural industry. The town is also home to several wineries, and is a popular destination for wine-tasting tours.
The town is also home to several small businesses, including restaurants, shops, and other services. The town is also home to several manufacturing companies, including a furniture factory and a textile mill.
Demographics
As of the 2010 census, the population of Raynham was 1,072. The town has a median age of 44.7 years, and the median household income is $41,250. The town is predominantly white, with 87.3% of the population identifying as white. The town also has a small Hispanic population, with 4.3% of the population identifying as Hispanic or Latino. The town also has a small African American population, with 2.2% of the population identifying as African American. The town also has a small Asian population, with 1.2% of the population identifying as Asian.
Common Questions
What is Per Capita Income in Raynham?
Per Capita income in Raynham is $32,657.
What is Income or Wage Gap in Raynham?
Income or Wage Gap in Raynham is 47.7%.
Women in Raynham earn 52.3 cents for every dollar earned by a man.
What is Inequality or Gini Index in Raynham?
Inequality or Gini Index in Raynham is 0.55.
What is the Total Population of Raynham?
Total Population of Raynham is 37.
What is the Total Male Population of Raynham?
Total Male Population of Raynham is 15.
What is the Total Female Population of Raynham?
Total Female Population of Raynham is 22.
What is the Ratio of Males per 100 Females in Raynham?
There are 68.18 Males per 100 Females in Raynham.
What is the Ratio of Females per 100 Males in Raynham?
There are 146.67 Females per 100 Males in Raynham.
What is the Median Population Age in Raynham?
Median Population Age in Raynham is 60.3 Years.
What is the Average Family Size in Raynham
Average Family Size in Raynham is 2.4 People.
What is the Average Household Size in Raynham
Average Household Size in Raynham is 1.7 People.
How Large is the Labor Force in Raynham?
There are 19 People in the Labor Forcein in Raynham.
What is the Percentage of People in the Labor Force in Raynham?
51.4% of People are in the Labor Force in Raynham.
What is the Unemployment Rate in Raynham?
Unemployment Rate in Raynham is 21.1%.