Ponderosa, NM Map & Demographics
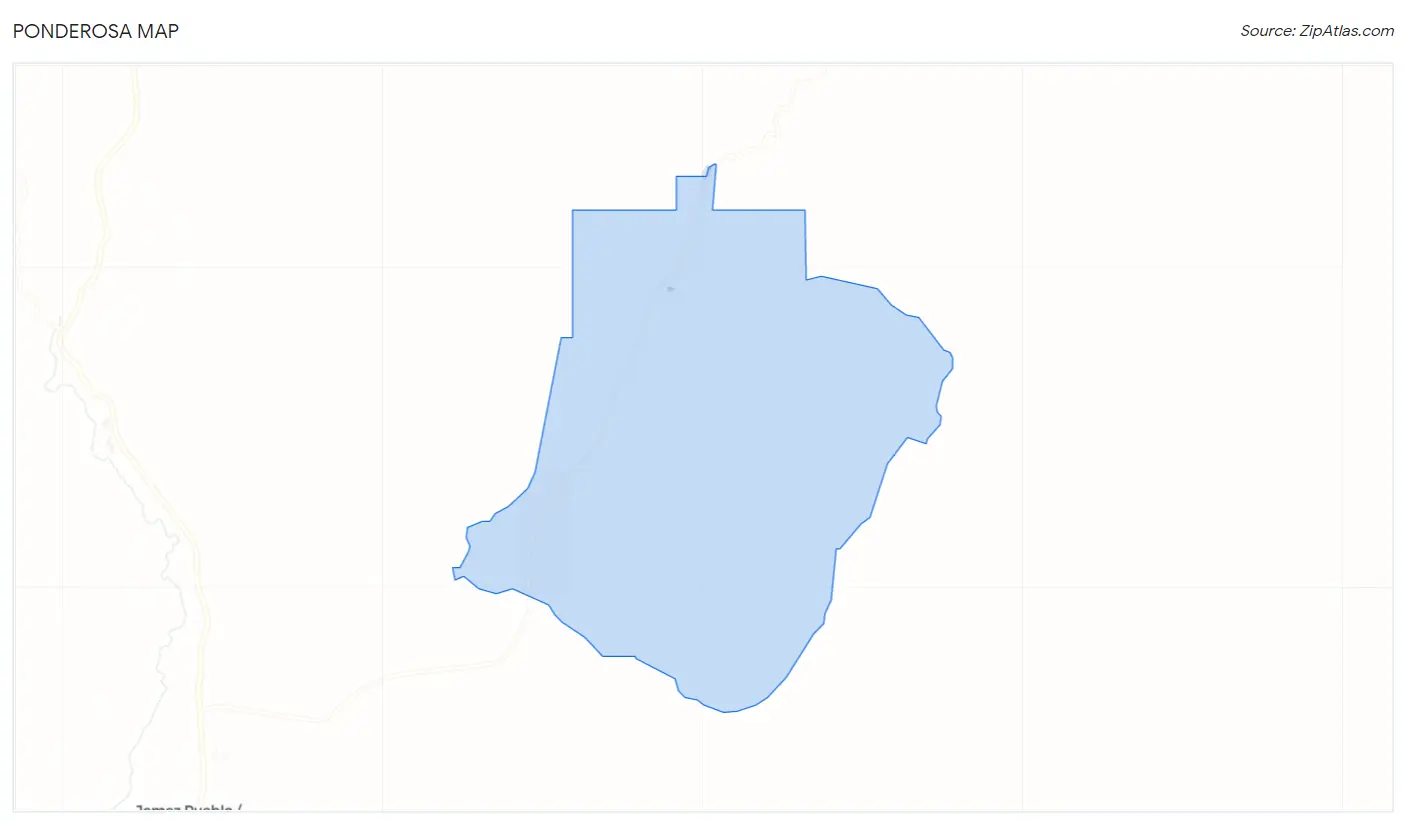
Ponderosa Map
Ponderosa Overview
$28,384
PER CAPITA INCOME
$55,625
AVG HOUSEHOLD INCOME
0.31
INEQUALITY / GINI INDEX
160
TOTAL POPULATION
90
MALE POPULATION
70
FEMALE POPULATION
128.57
MALES / 100 FEMALES
77.78
FEMALES / 100 MALES
61.8
MEDIAN AGE
2.0
AVG FAMILY SIZE
1.5
AVG HOUSEHOLD SIZE
67
LABOR FORCE [ PEOPLE ]
41.9%
PERCENT IN LABOR FORCE
Ponderosa Zip Codes
Ponderosa Area Codes
Income in Ponderosa
Income Overview in Ponderosa
| Characteristic | Number | Measure |
| Per Capita Income | 160 | $28,384 |
| Median Family Income | 26 | $0 |
| Mean Family Income | 26 | $49,442 |
| Median Household Income | 104 | $55,625 |
| Mean Household Income | 104 | $44,201 |
| Income Deficit | 26 | $0 |
| Wage / Income Gap (%) | 160 | 0.00% |
| Wage / Income Gap ($) | 160 | 100.00¢ per $1 |
| Gini / Inequality Index | 160 | 0.31 |
Earnings by Sex in Ponderosa
| Sex | Number | Average Earnings |
| Male | 43 (64.2%) | $0 |
| Female | 24 (35.8%) | $0 |
| Total | 67 (100.0%) | $0 |
Earnings by Sex by Income Bracket in Ponderosa
The most common earnings brackets in Ponderosa are $2,499 or less for men (18 | 41.9%) and $55,000 to $64,999 for women (18 | 75.0%).
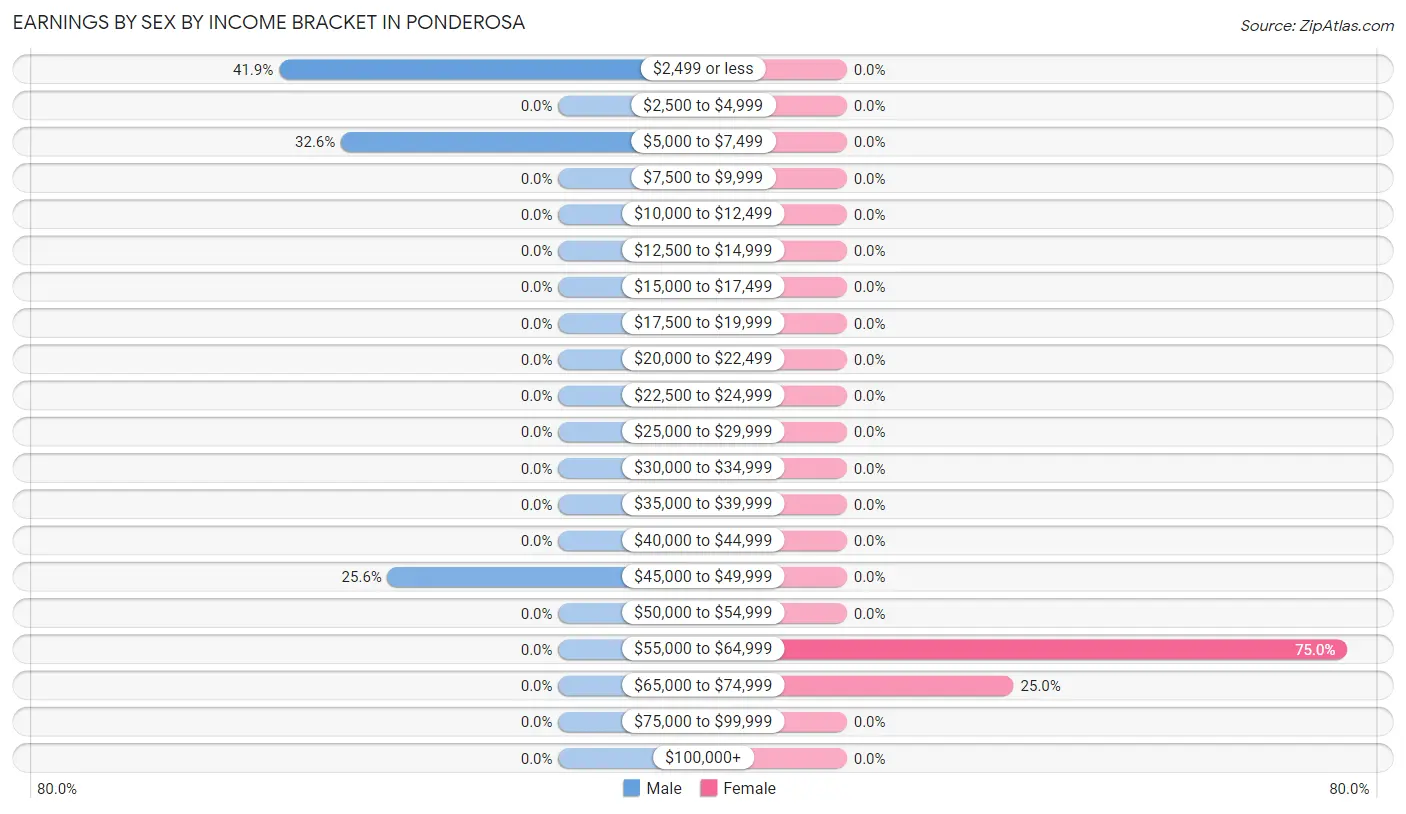
| Income | Male | Female |
| $2,499 or less | 18 (41.9%) | 0 (0.0%) |
| $2,500 to $4,999 | 0 (0.0%) | 0 (0.0%) |
| $5,000 to $7,499 | 14 (32.6%) | 0 (0.0%) |
| $7,500 to $9,999 | 0 (0.0%) | 0 (0.0%) |
| $10,000 to $12,499 | 0 (0.0%) | 0 (0.0%) |
| $12,500 to $14,999 | 0 (0.0%) | 0 (0.0%) |
| $15,000 to $17,499 | 0 (0.0%) | 0 (0.0%) |
| $17,500 to $19,999 | 0 (0.0%) | 0 (0.0%) |
| $20,000 to $22,499 | 0 (0.0%) | 0 (0.0%) |
| $22,500 to $24,999 | 0 (0.0%) | 0 (0.0%) |
| $25,000 to $29,999 | 0 (0.0%) | 0 (0.0%) |
| $30,000 to $34,999 | 0 (0.0%) | 0 (0.0%) |
| $35,000 to $39,999 | 0 (0.0%) | 0 (0.0%) |
| $40,000 to $44,999 | 0 (0.0%) | 0 (0.0%) |
| $45,000 to $49,999 | 11 (25.6%) | 0 (0.0%) |
| $50,000 to $54,999 | 0 (0.0%) | 0 (0.0%) |
| $55,000 to $64,999 | 0 (0.0%) | 18 (75.0%) |
| $65,000 to $74,999 | 0 (0.0%) | 6 (25.0%) |
| $75,000 to $99,999 | 0 (0.0%) | 0 (0.0%) |
| $100,000+ | 0 (0.0%) | 0 (0.0%) |
| Total | 43 (100.0%) | 24 (100.0%) |
Earnings by Sex by Educational Attainment in Ponderosa
| Educational Attainment | Male Income | Female Income |
| Less than High School | - | - |
| High School Diploma | - | - |
| College or Associate's Degree | - | - |
| Bachelor's Degree | - | - |
| Graduate Degree | - | - |
| Total | - | - |
Family Income in Ponderosa
Family Income Brackets in Ponderosa
According to the Ponderosa family income data, there are 12 families falling into the $25,000 to $34,999 income range, which is the most common income bracket and makes up 46.2% of all families.
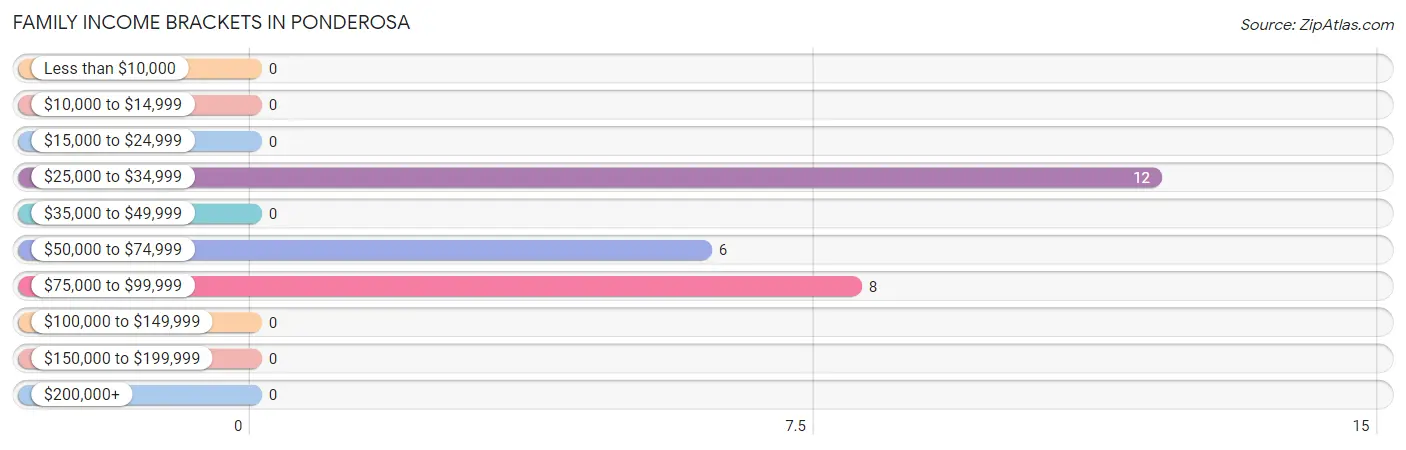
| Income Bracket | # Families | % Families |
| Less than $10,000 | 0 | 0.0% |
| $10,000 to $14,999 | 0 | 0.0% |
| $15,000 to $24,999 | 0 | 0.0% |
| $25,000 to $34,999 | 12 | 46.2% |
| $35,000 to $49,999 | 0 | 0.0% |
| $50,000 to $74,999 | 6 | 23.1% |
| $75,000 to $99,999 | 8 | 30.8% |
| $100,000 to $149,999 | 0 | 0.0% |
| $150,000 to $199,999 | 0 | 0.0% |
| $200,000+ | 0 | 0.0% |
Family Income by Famaliy Size in Ponderosa
| Income Bracket | # Families | Median Income |
| 2-Person Families | 26 (100.0%) | $0 |
| 3-Person Families | 0 (0.0%) | $0 |
| 4-Person Families | 0 (0.0%) | $0 |
| 5-Person Families | 0 (0.0%) | $0 |
| 6-Person Families | 0 (0.0%) | $0 |
| 7+ Person Families | 0 (0.0%) | $0 |
| Total | 26 (100.0%) | $0 |
Family Income by Number of Earners in Ponderosa
| Number of Earners | # Families | Median Income |
| No Earners | 14 (53.8%) | $0 |
| 1 Earner | 12 (46.2%) | $0 |
| 2 Earners | 0 (0.0%) | $0 |
| 3+ Earners | 0 (0.0%) | $0 |
| Total | 26 (100.0%) | $0 |
Household Income in Ponderosa
Household Income Brackets in Ponderosa
With 47 households falling in the category, the $50,000 to $74,999 income range is the most frequent in Ponderosa, accounting for 45.2% of all households.
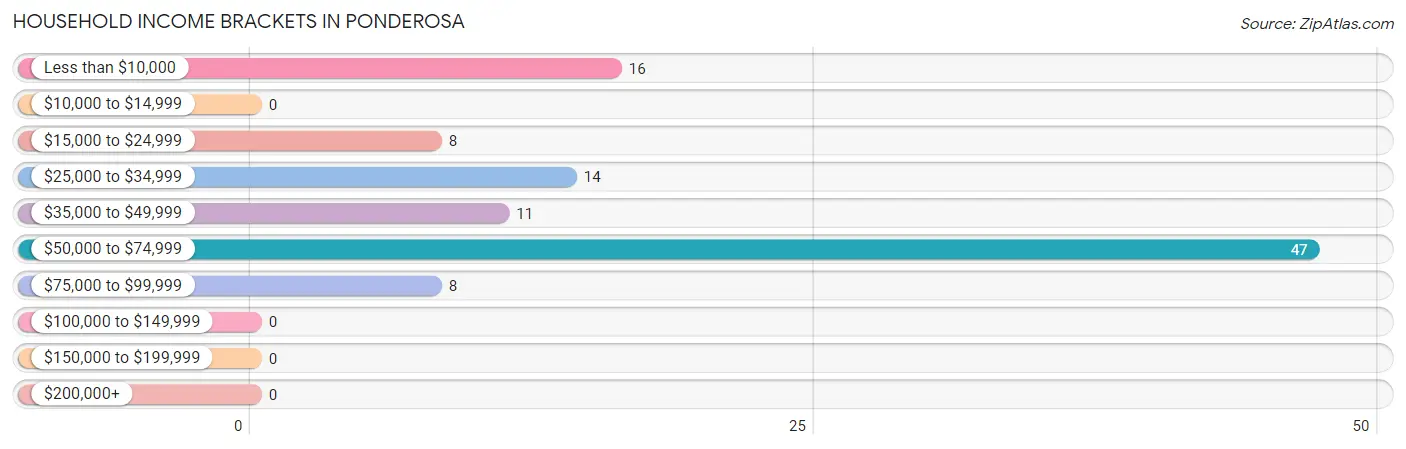
| Income Bracket | # Households | % Households |
| Less than $10,000 | 16 | 15.4% |
| $10,000 to $14,999 | 0 | 0.0% |
| $15,000 to $24,999 | 8 | 7.7% |
| $25,000 to $34,999 | 14 | 13.5% |
| $35,000 to $49,999 | 11 | 10.6% |
| $50,000 to $74,999 | 47 | 45.2% |
| $75,000 to $99,999 | 8 | 7.7% |
| $100,000 to $149,999 | 0 | 0.0% |
| $150,000 to $199,999 | 0 | 0.0% |
| $200,000+ | 0 | 0.0% |
Household Income by Householder Age in Ponderosa
The median household income in Ponderosa is $55,625, with the highest median household income of $55,417 found in the 65+ years age bracket for the primary householder. A total of 48 households (46.2%) fall into this category.
| Income Bracket | # Households | Median Income |
| 15 to 24 Years | 0 (0.0%) | $0 |
| 25 to 44 Years | 18 (17.3%) | $0 |
| 45 to 64 Years | 38 (36.5%) | $0 |
| 65+ Years | 48 (46.2%) | $55,417 |
| Total | 104 (100.0%) | $55,625 |
Poverty in Ponderosa
Income Below Poverty by Sex and Age in Ponderosa
With 20.0% poverty level for males and 22.9% for females among the residents of Ponderosa, 45 to 54 year old males and 55 to 64 year old females are the most vulnerable to poverty, with 18 males (100.0%) and 16 females (100.0%) in their respective age groups living below the poverty level.
| Age Bracket | Male | Female |
| Under 5 Years | 0 (0.0%) | 0 (0.0%) |
| 5 Years | 0 (0.0%) | 0 (0.0%) |
| 6 to 11 Years | 0 (0.0%) | 0 (0.0%) |
| 12 to 14 Years | 0 (0.0%) | 0 (0.0%) |
| 15 Years | 0 (0.0%) | 0 (0.0%) |
| 16 and 17 Years | 0 (0.0%) | 0 (0.0%) |
| 18 to 24 Years | 0 (0.0%) | 0 (0.0%) |
| 25 to 34 Years | 0 (0.0%) | 0 (0.0%) |
| 35 to 44 Years | 0 (0.0%) | 0 (0.0%) |
| 45 to 54 Years | 18 (100.0%) | 0 (0.0%) |
| 55 to 64 Years | 0 (0.0%) | 16 (100.0%) |
| 65 to 74 Years | 0 (0.0%) | 0 (0.0%) |
| 75 Years and over | 0 (0.0%) | 0 (0.0%) |
| Total | 18 (20.0%) | 16 (22.9%) |
Income Above Poverty by Sex and Age in Ponderosa
According to the poverty statistics in Ponderosa, males aged 35 to 44 years and females aged 35 to 44 years are the age groups that are most secure financially, with 100.0% of males and 100.0% of females in these age groups living above the poverty line.
| Age Bracket | Male | Female |
| Under 5 Years | 0 (0.0%) | 0 (0.0%) |
| 5 Years | 0 (0.0%) | 0 (0.0%) |
| 6 to 11 Years | 0 (0.0%) | 0 (0.0%) |
| 12 to 14 Years | 0 (0.0%) | 0 (0.0%) |
| 15 Years | 0 (0.0%) | 0 (0.0%) |
| 16 and 17 Years | 0 (0.0%) | 0 (0.0%) |
| 18 to 24 Years | 0 (0.0%) | 0 (0.0%) |
| 25 to 34 Years | 0 (0.0%) | 0 (0.0%) |
| 35 to 44 Years | 14 (100.0%) | 18 (100.0%) |
| 45 to 54 Years | 0 (0.0%) | 6 (100.0%) |
| 55 to 64 Years | 16 (100.0%) | 0 (0.0%) |
| 65 to 74 Years | 20 (100.0%) | 30 (100.0%) |
| 75 Years and over | 22 (100.0%) | 0 (0.0%) |
| Total | 72 (80.0%) | 54 (77.1%) |
Income Below Poverty Among Married-Couple Families in Ponderosa
| Children | Above Poverty | Below Poverty |
| No Children | 14 (100.0%) | 0 (0.0%) |
| 1 or 2 Children | 0 (0.0%) | 0 (0.0%) |
| 3 or 4 Children | 0 (0.0%) | 0 (0.0%) |
| 5 or more Children | 0 (0.0%) | 0 (0.0%) |
| Total | 14 (100.0%) | 0 (0.0%) |
Income Below Poverty Among Single-Parent Households in Ponderosa
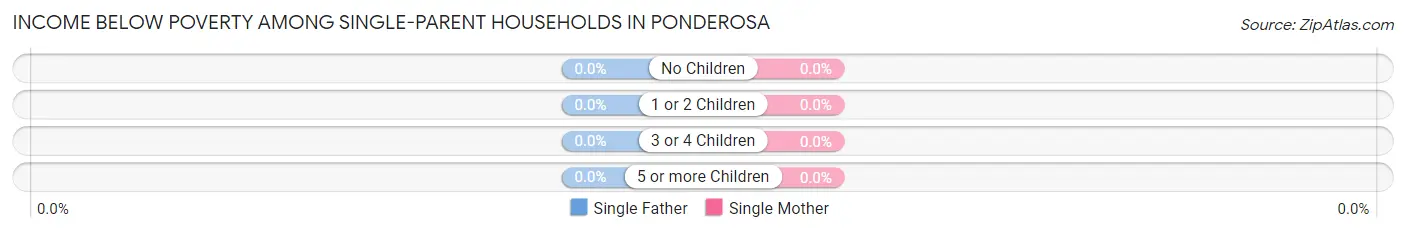
| Children | Single Father | Single Mother |
| No Children | 0 (0.0%) | 0 (0.0%) |
| 1 or 2 Children | 0 (0.0%) | 0 (0.0%) |
| 3 or 4 Children | 0 (0.0%) | 0 (0.0%) |
| 5 or more Children | 0 (0.0%) | 0 (0.0%) |
| Total | 0 (0.0%) | 0 (0.0%) |
Income Below Poverty Among Married-Couple vs Single-Parent Households in Ponderosa
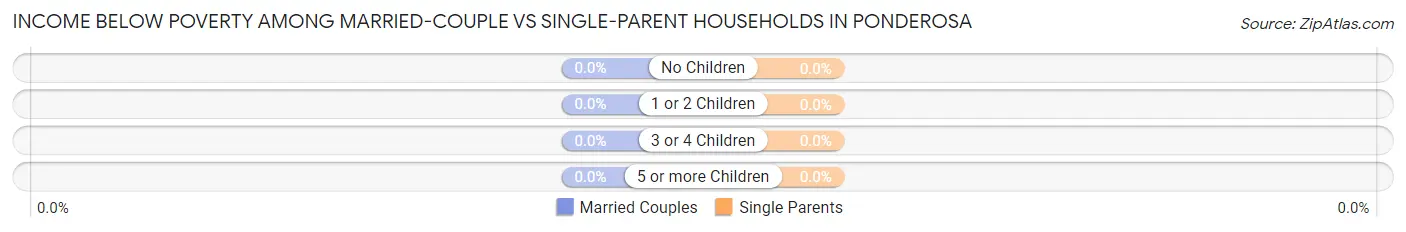
| Children | Married-Couple Families | Single-Parent Households |
| No Children | 0 (0.0%) | 0 (0.0%) |
| 1 or 2 Children | 0 (0.0%) | 0 (0.0%) |
| 3 or 4 Children | 0 (0.0%) | 0 (0.0%) |
| 5 or more Children | 0 (0.0%) | 0 (0.0%) |
| Total | 0 (0.0%) | 0 (0.0%) |
Race in Ponderosa
The most populous races in Ponderosa are White / Caucasian (117 | 73.1%), Hispanic or Latino (25 | 15.6%), and Two or more Races (24 | 15.0%).
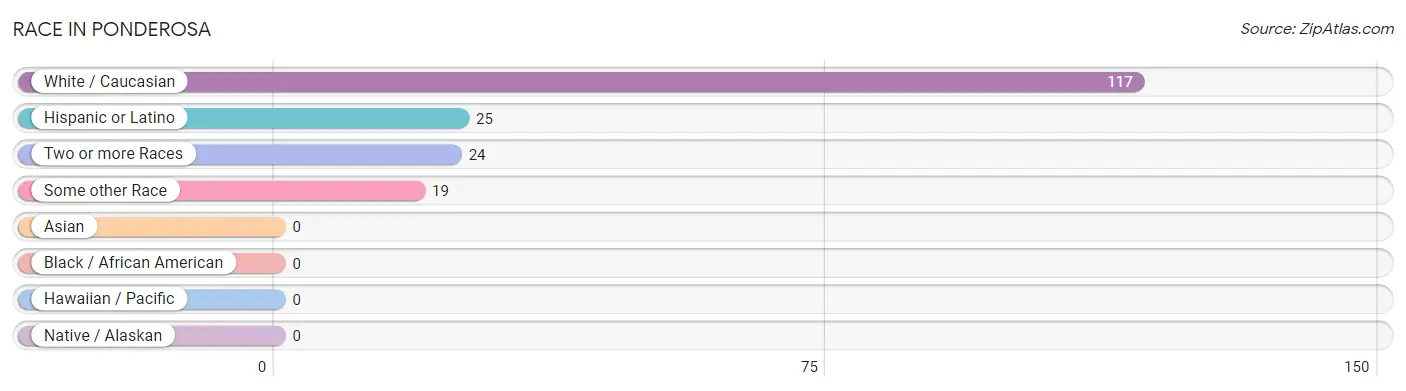
| Race | # Population | % Population |
| Asian | 0 | 0.0% |
| Black / African American | 0 | 0.0% |
| Hawaiian / Pacific | 0 | 0.0% |
| Hispanic or Latino | 25 | 15.6% |
| Native / Alaskan | 0 | 0.0% |
| White / Caucasian | 117 | 73.1% |
| Two or more Races | 24 | 15.0% |
| Some other Race | 19 | 11.9% |
| Total | 160 | 100.0% |
Ancestry in Ponderosa
The most populous ancestries reported in Ponderosa are German (57 | 35.6%), Canadian (38 | 23.7%), Irish (24 | 15.0%), Spanish (19 | 11.9%), and English (18 | 11.3%), together accounting for 97.5% of all Ponderosa residents.
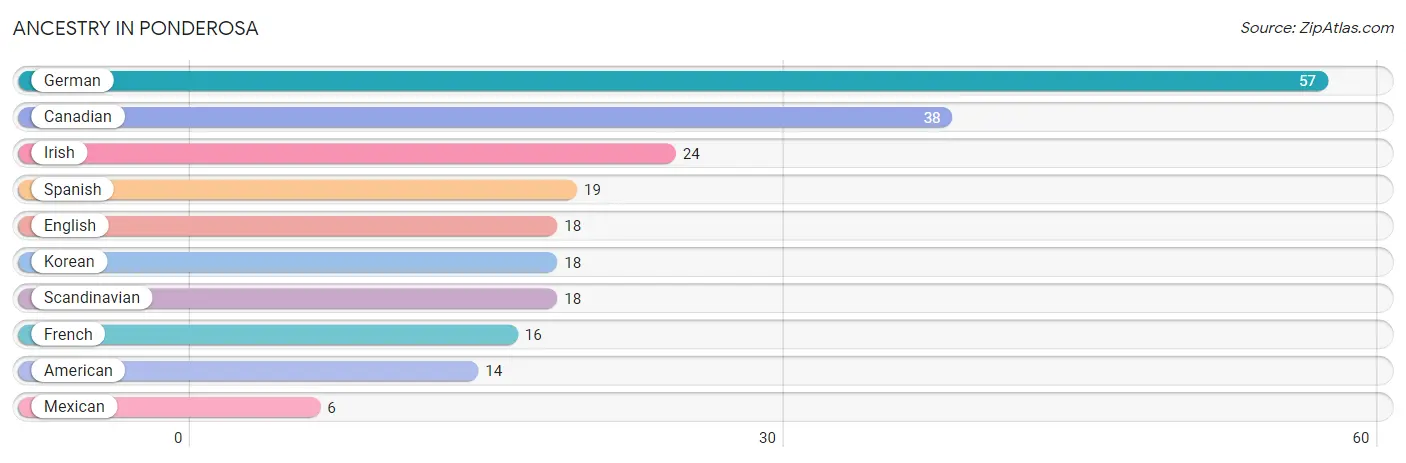
| Ancestry | # Population | % Population |
| American | 14 | 8.7% |
| Canadian | 38 | 23.7% |
| English | 18 | 11.3% |
| French | 16 | 10.0% |
| German | 57 | 35.6% |
| Irish | 24 | 15.0% |
| Korean | 18 | 11.3% |
| Mexican | 6 | 3.7% |
| Scandinavian | 18 | 11.3% |
| Spanish | 19 | 11.9% | View All 10 Rows |
Immigrants in Ponderosa
The most numerous immigrant groups reported in Ponderosa came from Europe (6 | 3.7%), Germany (6 | 3.7%), and Western Europe (6 | 3.7%), together accounting for 11.2% of all Ponderosa residents.
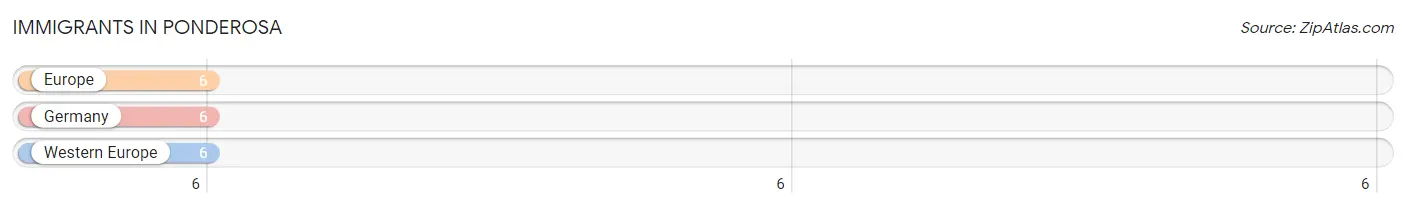
| Immigration Origin | # Population | % Population |
| Europe | 6 | 3.7% |
| Germany | 6 | 3.7% |
| Western Europe | 6 | 3.7% | View All 3 Rows |
Sex and Age in Ponderosa
Sex and Age in Ponderosa
The most populous age groups in Ponderosa are 65 to 69 Years (20 | 22.2%) for men and 65 to 69 Years (20 | 28.6%) for women.
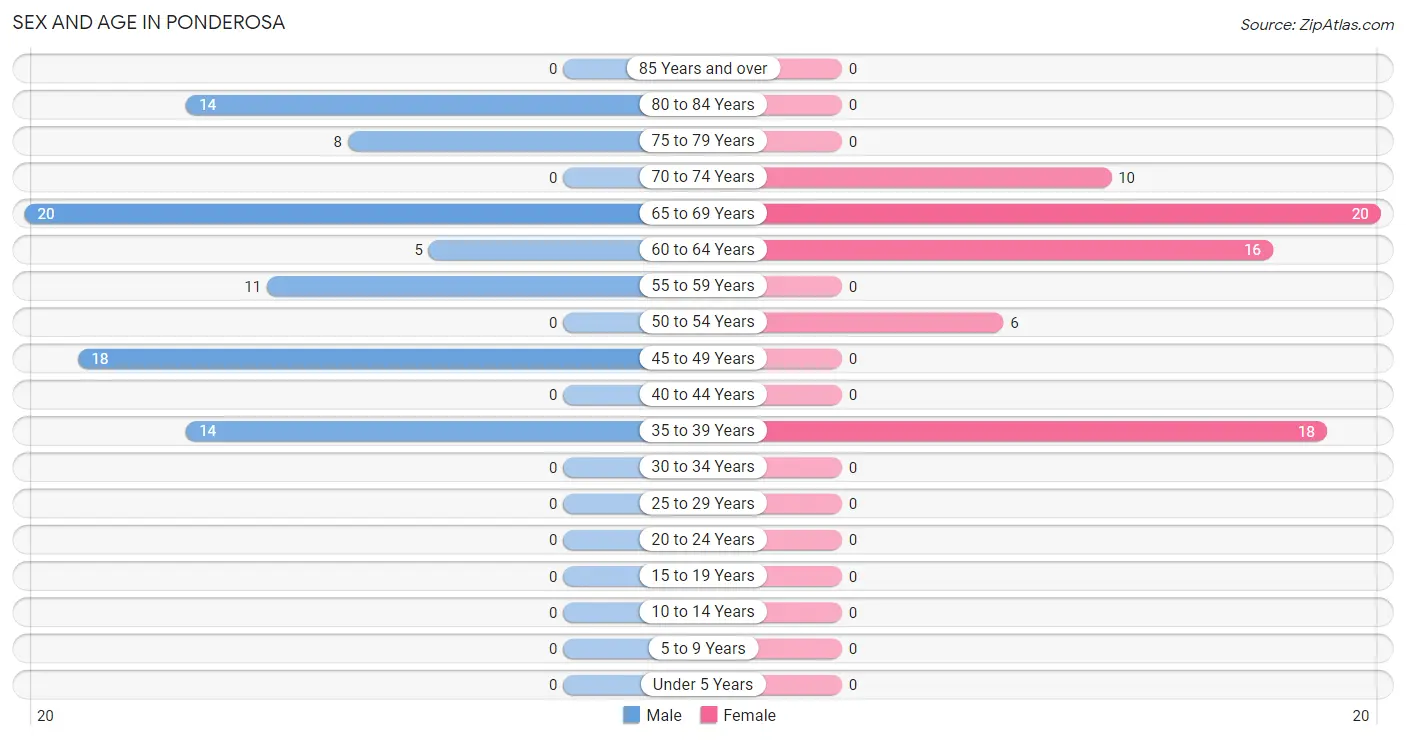
| Age Bracket | Male | Female |
| Under 5 Years | 0 (0.0%) | 0 (0.0%) |
| 5 to 9 Years | 0 (0.0%) | 0 (0.0%) |
| 10 to 14 Years | 0 (0.0%) | 0 (0.0%) |
| 15 to 19 Years | 0 (0.0%) | 0 (0.0%) |
| 20 to 24 Years | 0 (0.0%) | 0 (0.0%) |
| 25 to 29 Years | 0 (0.0%) | 0 (0.0%) |
| 30 to 34 Years | 0 (0.0%) | 0 (0.0%) |
| 35 to 39 Years | 14 (15.6%) | 18 (25.7%) |
| 40 to 44 Years | 0 (0.0%) | 0 (0.0%) |
| 45 to 49 Years | 18 (20.0%) | 0 (0.0%) |
| 50 to 54 Years | 0 (0.0%) | 6 (8.6%) |
| 55 to 59 Years | 11 (12.2%) | 0 (0.0%) |
| 60 to 64 Years | 5 (5.6%) | 16 (22.9%) |
| 65 to 69 Years | 20 (22.2%) | 20 (28.6%) |
| 70 to 74 Years | 0 (0.0%) | 10 (14.3%) |
| 75 to 79 Years | 8 (8.9%) | 0 (0.0%) |
| 80 to 84 Years | 14 (15.6%) | 0 (0.0%) |
| 85 Years and over | 0 (0.0%) | 0 (0.0%) |
| Total | 90 (100.0%) | 70 (100.0%) |
Families and Households in Ponderosa
Median Family Size in Ponderosa
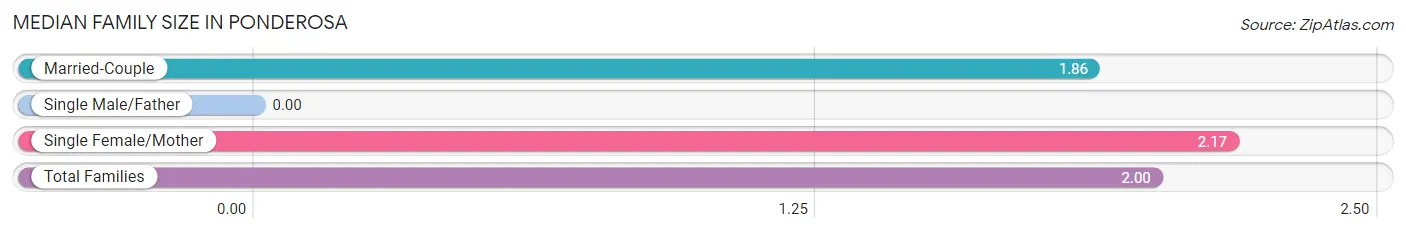
| Family Type | # Families | Family Size |
| Married-Couple | 14 (53.8%) | 1.86 |
| Single Male/Father | 0 (0.0%) | - |
| Single Female/Mother | 12 (46.2%) | 2.17 |
| Total Families | 26 (100.0%) | 2.00 |
Median Household Size in Ponderosa
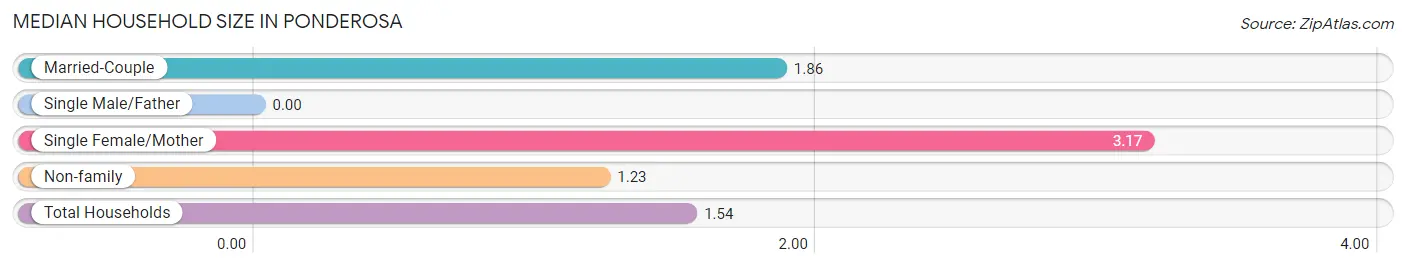
| Household Type | # Households | Household Size |
| Married-Couple | 14 (13.5%) | 1.86 |
| Single Male/Father | 0 (0.0%) | - |
| Single Female/Mother | 12 (11.5%) | 3.17 |
| Non-family | 78 (75.0%) | 1.23 |
| Total Households | 104 (100.0%) | 1.54 |
Household Size by Marriage Status in Ponderosa
Out of a total of 104 households in Ponderosa, 26 (25.0%) are family households, while 78 (75.0%) are nonfamily households. The most numerous type of family households are 2-person households, comprising 14, and the most common type of nonfamily households are 1-person households, comprising 60.
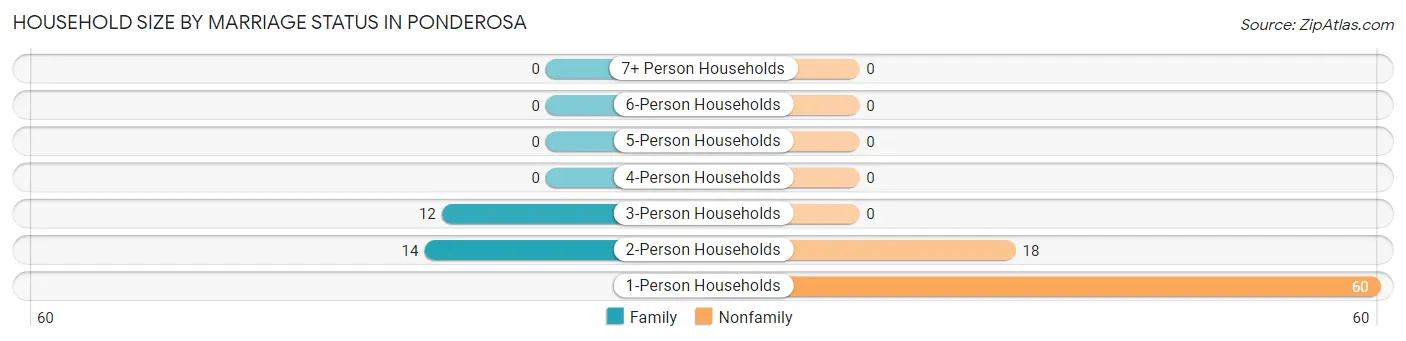
| Household Size | Family Households | Nonfamily Households |
| 1-Person Households | - | 60 (57.7%) |
| 2-Person Households | 14 (13.5%) | 18 (17.3%) |
| 3-Person Households | 12 (11.5%) | 0 (0.0%) |
| 4-Person Households | 0 (0.0%) | 0 (0.0%) |
| 5-Person Households | 0 (0.0%) | 0 (0.0%) |
| 6-Person Households | 0 (0.0%) | 0 (0.0%) |
| 7+ Person Households | 0 (0.0%) | 0 (0.0%) |
| Total | 26 (25.0%) | 78 (75.0%) |
Female Fertility in Ponderosa
Fertility by Age in Ponderosa
| Age Bracket | Women with Births | Births / 1,000 Women |
| 15 to 19 years | 0 (0.0%) | 0.0 |
| 20 to 34 years | 0 (0.0%) | 0.0 |
| 35 to 50 years | 0 (0.0%) | 0.0 |
| Total | 0 (0.0%) | 0.0 |
Fertility by Age by Marriage Status in Ponderosa
| Age Bracket | Married | Unmarried |
| 15 to 19 years | 0 (0.0%) | 0 (0.0%) |
| 20 to 34 years | 0 (0.0%) | 0 (0.0%) |
| 35 to 50 years | 0 (0.0%) | 0 (0.0%) |
| Total | 0 (0.0%) | 0 (0.0%) |
Fertility by Education in Ponderosa
| Educational Attainment | Women with Births | Births / 1,000 Women |
| Less than High School | 0 (0.0%) | 0.0 |
| High School Diploma | 0 (0.0%) | 0.0 |
| College or Associate's Degree | 0 (0.0%) | 0.0 |
| Bachelor's Degree | 0 (0.0%) | 0.0 |
| Graduate Degree | 0 (0.0%) | 0.0 |
| Total | 0 (0.0%) | 0.0 |
Fertility by Education by Marriage Status in Ponderosa
| Educational Attainment | Married | Unmarried |
| Less than High School | 0 (0.0%) | 0 (0.0%) |
| High School Diploma | 0 (0.0%) | 0 (0.0%) |
| College or Associate's Degree | 0 (0.0%) | 0 (0.0%) |
| Bachelor's Degree | 0 (0.0%) | 0 (0.0%) |
| Graduate Degree | 0 (0.0%) | 0 (0.0%) |
| Total | 0 (0.0%) | 0 (0.0%) |
Employment Characteristics in Ponderosa
Employment by Class of Employer in Ponderosa
Among the 67 employed individuals in Ponderosa, self-employed (not incorporated) (32 | 47.8%), private company employees (29 | 43.3%), and local government employees (6 | 9.0%) make up the most common classes of employment.
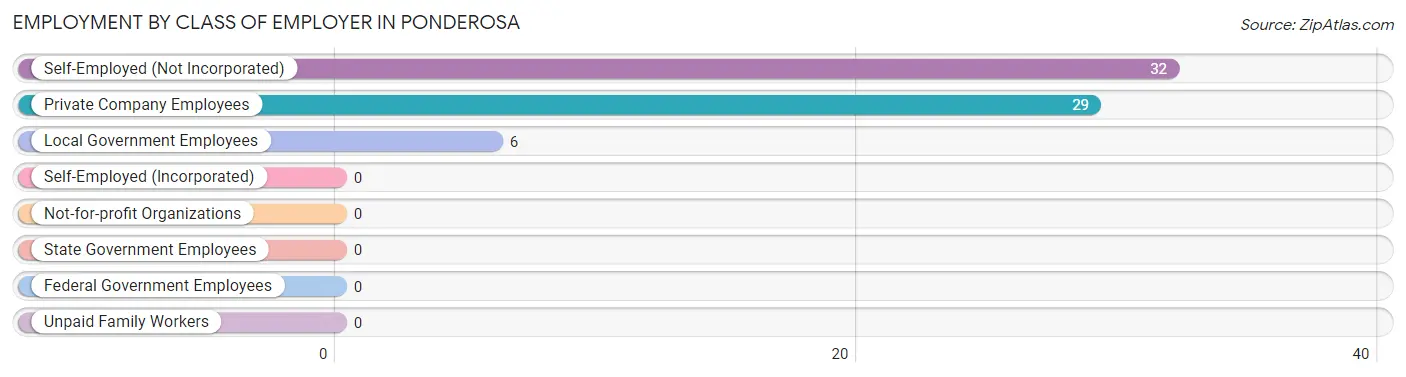
| Employer Class | # Employees | % Employees |
| Private Company Employees | 29 | 43.3% |
| Self-Employed (Incorporated) | 0 | 0.0% |
| Self-Employed (Not Incorporated) | 32 | 47.8% |
| Not-for-profit Organizations | 0 | 0.0% |
| Local Government Employees | 6 | 9.0% |
| State Government Employees | 0 | 0.0% |
| Federal Government Employees | 0 | 0.0% |
| Unpaid Family Workers | 0 | 0.0% |
| Total | 67 | 100.0% |
Employment Status by Age in Ponderosa
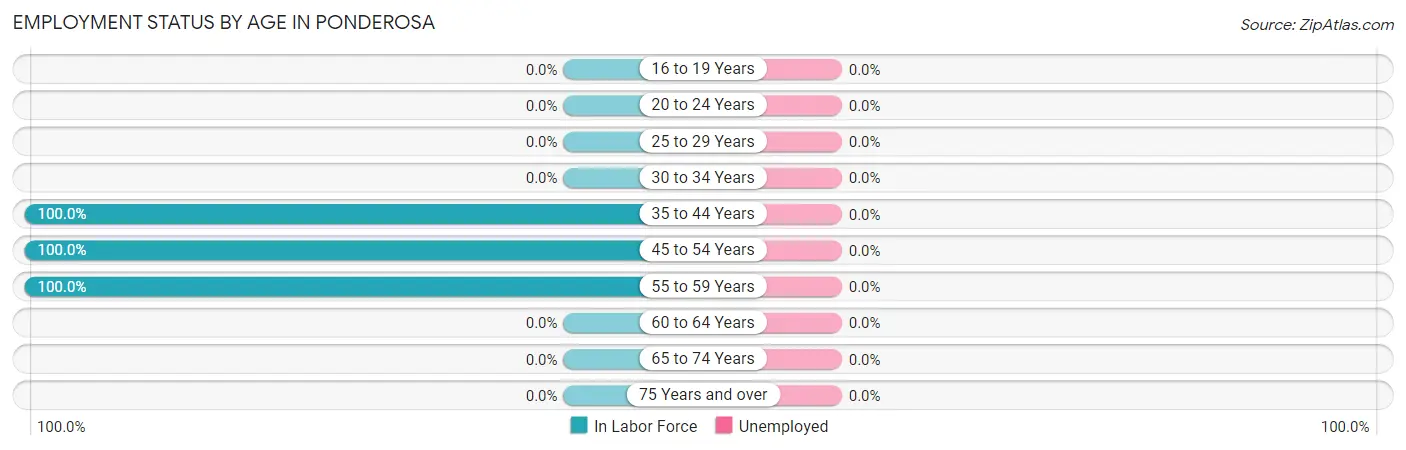
| Age Bracket | In Labor Force | Unemployed |
| 16 to 19 Years | 0 (0.0%) | 0 (0.0%) |
| 20 to 24 Years | 0 (0.0%) | 0 (0.0%) |
| 25 to 29 Years | 0 (0.0%) | 0 (0.0%) |
| 30 to 34 Years | 0 (0.0%) | 0 (0.0%) |
| 35 to 44 Years | 32 (100.0%) | 0 (0.0%) |
| 45 to 54 Years | 24 (100.0%) | 0 (0.0%) |
| 55 to 59 Years | 11 (100.0%) | 0 (0.0%) |
| 60 to 64 Years | 0 (0.0%) | 0 (0.0%) |
| 65 to 74 Years | 0 (0.0%) | 0 (0.0%) |
| 75 Years and over | 0 (0.0%) | 0 (0.0%) |
| Total | 67 (41.9%) | 0 (0.0%) |
Employment Status by Educational Attainment in Ponderosa
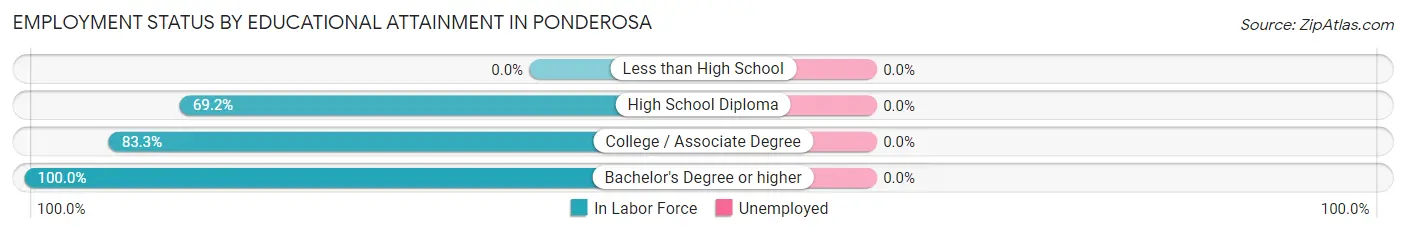
| Educational Attainment | In Labor Force | Unemployed |
| Less than High School | 0 (0.0%) | 0 (0.0%) |
| High School Diploma | 36 (69.2%) | 0 (0.0%) |
| College / Associate Degree | 25 (83.3%) | 0 (0.0%) |
| Bachelor's Degree or higher | 6 (100.0%) | 0 (0.0%) |
| Total | 67 (76.1%) | 0 (0.0%) |
Employment Occupations by Sex in Ponderosa
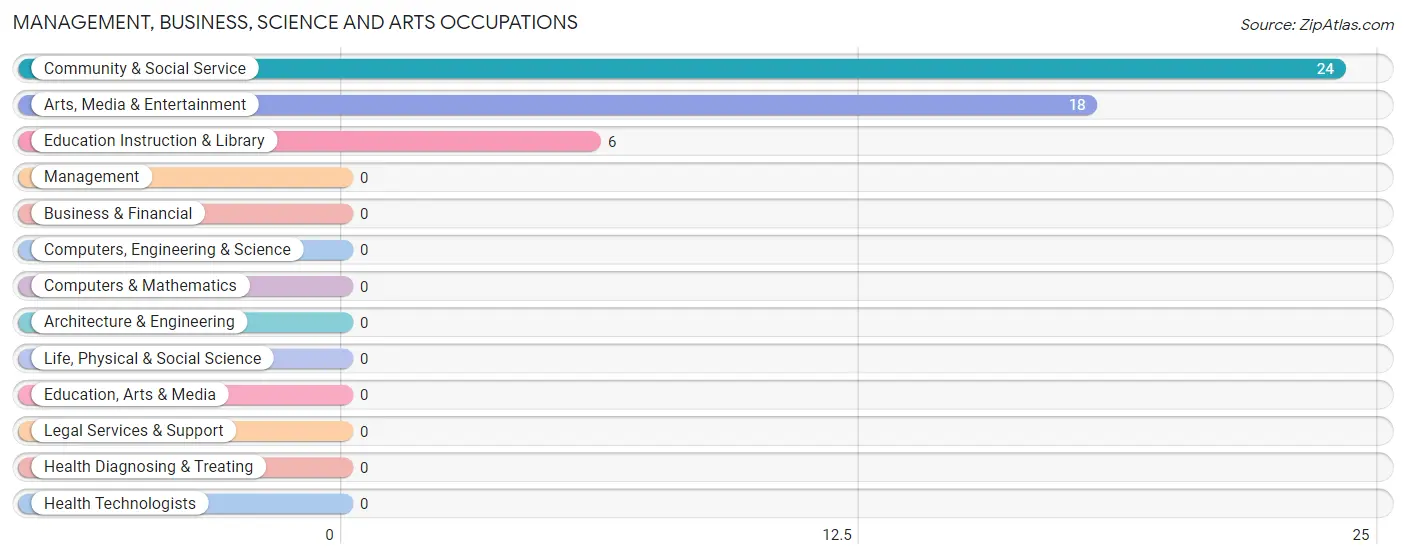
Management, Business, Science and Arts Occupations
The most common Management, Business, Science and Arts occupations in Ponderosa are Community & Social Service (24 | 35.8%), Arts, Media & Entertainment (18 | 26.9%), and Education Instruction & Library (6 | 9.0%).
Management, Business, Science and Arts Occupations by Sex
Within the Management, Business, Science and Arts occupations in Ponderosa, the most male-oriented occupations are Arts, Media & Entertainment (100.0%), and Community & Social Service (75.0%), while the most female-oriented occupations are Education Instruction & Library (100.0%), and Community & Social Service (25.0%).
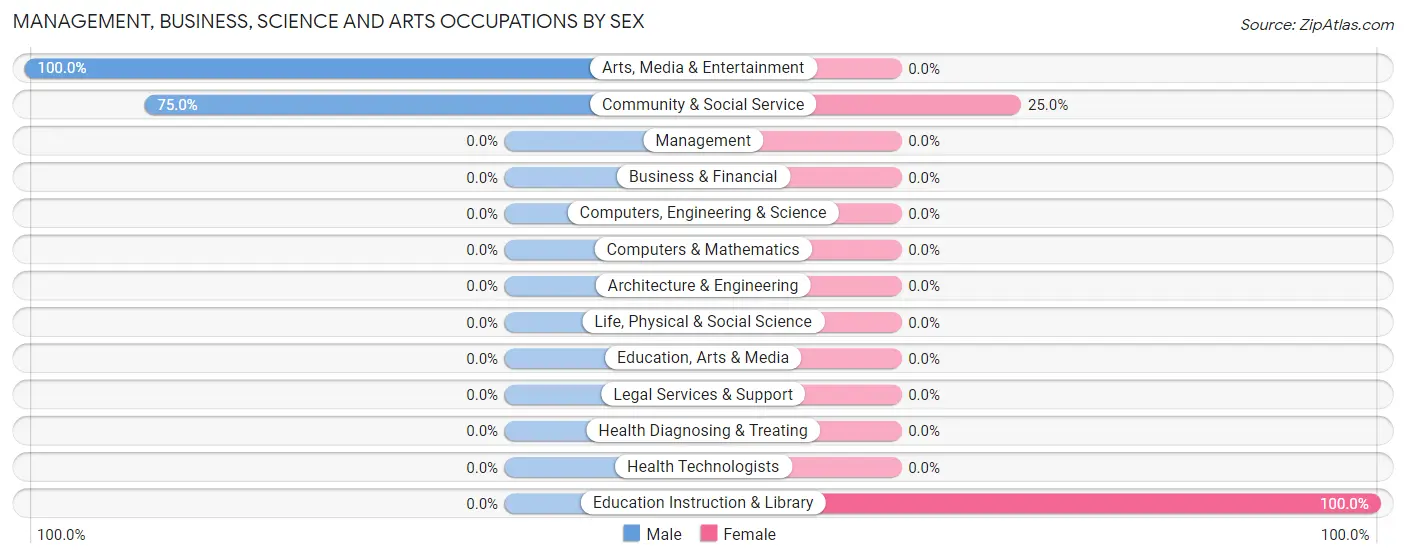
| Occupation | Male | Female |
| Management | 0 (0.0%) | 0 (0.0%) |
| Business & Financial | 0 (0.0%) | 0 (0.0%) |
| Computers, Engineering & Science | 0 (0.0%) | 0 (0.0%) |
| Computers & Mathematics | 0 (0.0%) | 0 (0.0%) |
| Architecture & Engineering | 0 (0.0%) | 0 (0.0%) |
| Life, Physical & Social Science | 0 (0.0%) | 0 (0.0%) |
| Community & Social Service | 18 (75.0%) | 6 (25.0%) |
| Education, Arts & Media | 0 (0.0%) | 0 (0.0%) |
| Legal Services & Support | 0 (0.0%) | 0 (0.0%) |
| Education Instruction & Library | 0 (0.0%) | 6 (100.0%) |
| Arts, Media & Entertainment | 18 (100.0%) | 0 (0.0%) |
| Health Diagnosing & Treating | 0 (0.0%) | 0 (0.0%) |
| Health Technologists | 0 (0.0%) | 0 (0.0%) |
| Total (Category) | 18 (75.0%) | 6 (25.0%) |
| Total (Overall) | 43 (64.2%) | 24 (35.8%) |
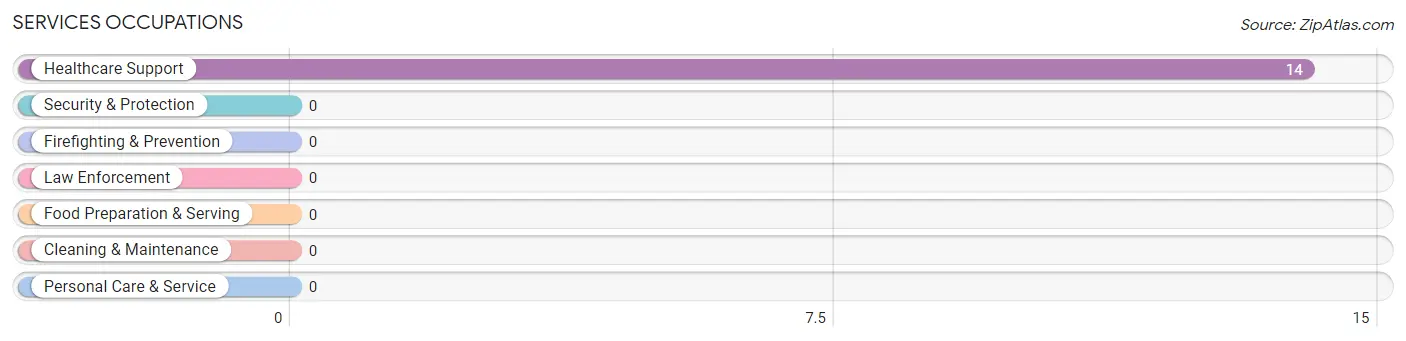
Services Occupations
The most common Services occupations in Ponderosa are , and Healthcare Support (14 | 20.9%).
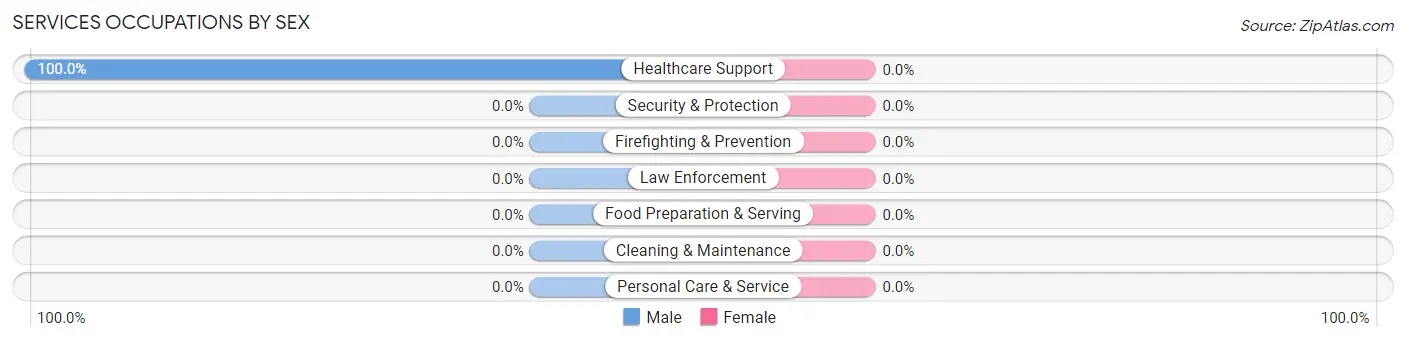
Services Occupations by Sex
| Occupation | Male | Female |
| Healthcare Support | 14 (100.0%) | 0 (0.0%) |
| Security & Protection | 0 (0.0%) | 0 (0.0%) |
| Firefighting & Prevention | 0 (0.0%) | 0 (0.0%) |
| Law Enforcement | 0 (0.0%) | 0 (0.0%) |
| Food Preparation & Serving | 0 (0.0%) | 0 (0.0%) |
| Cleaning & Maintenance | 0 (0.0%) | 0 (0.0%) |
| Personal Care & Service | 0 (0.0%) | 0 (0.0%) |
| Total (Category) | 14 (100.0%) | 0 (0.0%) |
| Total (Overall) | 43 (64.2%) | 24 (35.8%) |
Sales and Office Occupations
The most common Sales and Office occupations in Ponderosa are , and Office & Administration (29 | 43.3%).
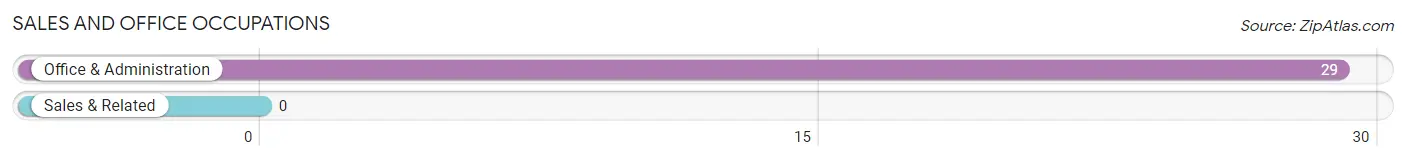
Sales and Office Occupations by Sex
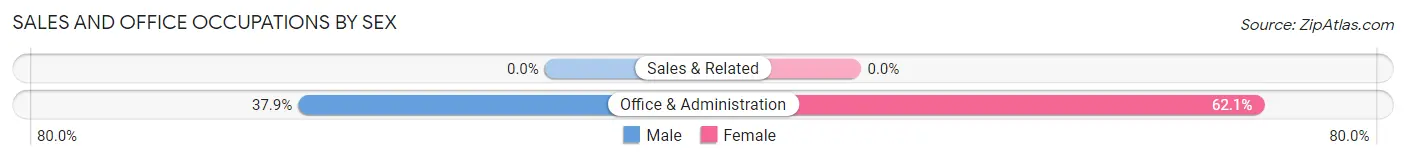
| Occupation | Male | Female |
| Sales & Related | 0 (0.0%) | 0 (0.0%) |
| Office & Administration | 11 (37.9%) | 18 (62.1%) |
| Total (Category) | 11 (37.9%) | 18 (62.1%) |
| Total (Overall) | 43 (64.2%) | 24 (35.8%) |
Natural Resources, Construction and Maintenance Occupations
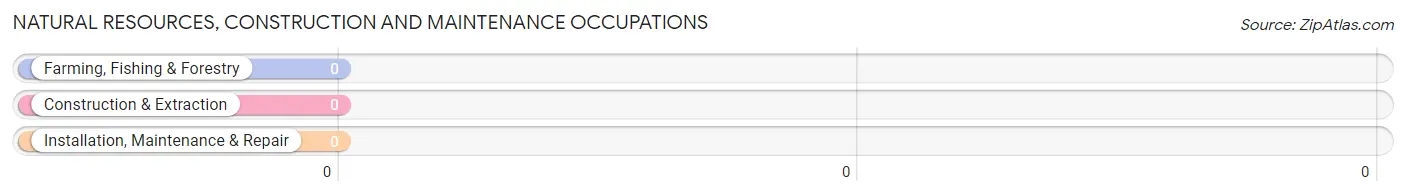
Natural Resources, Construction and Maintenance Occupations by Sex
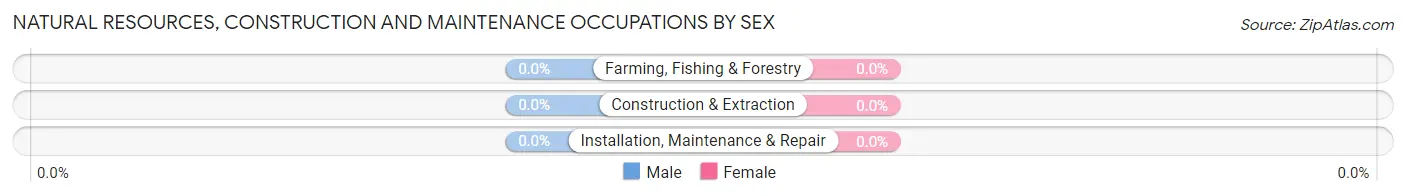
| Occupation | Male | Female |
| Farming, Fishing & Forestry | 0 (0.0%) | 0 (0.0%) |
| Construction & Extraction | 0 (0.0%) | 0 (0.0%) |
| Installation, Maintenance & Repair | 0 (0.0%) | 0 (0.0%) |
| Total (Category) | 0 (0.0%) | 0 (0.0%) |
| Total (Overall) | 43 (64.2%) | 24 (35.8%) |
Production, Transportation and Moving Occupations
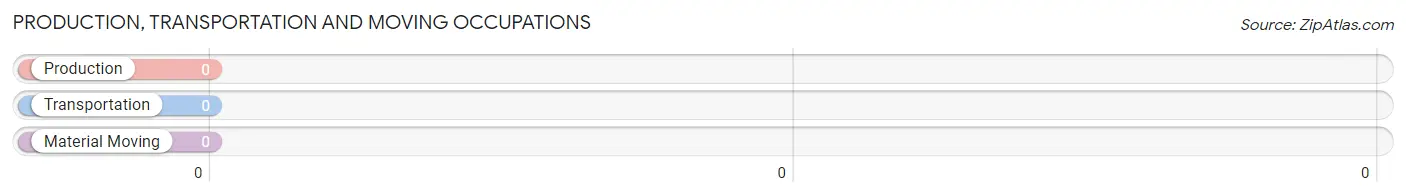
Production, Transportation and Moving Occupations by Sex
| Occupation | Male | Female |
| Production | 0 (0.0%) | 0 (0.0%) |
| Transportation | 0 (0.0%) | 0 (0.0%) |
| Material Moving | 0 (0.0%) | 0 (0.0%) |
| Total (Category) | 0 (0.0%) | 0 (0.0%) |
| Total (Overall) | 43 (64.2%) | 24 (35.8%) |
Employment Industries by Sex in Ponderosa
Employment Industries in Ponderosa
The major employment industries in Ponderosa include Information (18 | 26.9%), Administrative & Support (18 | 26.9%), Professional & Scientific (11 | 16.4%), and Educational Services (6 | 9.0%).
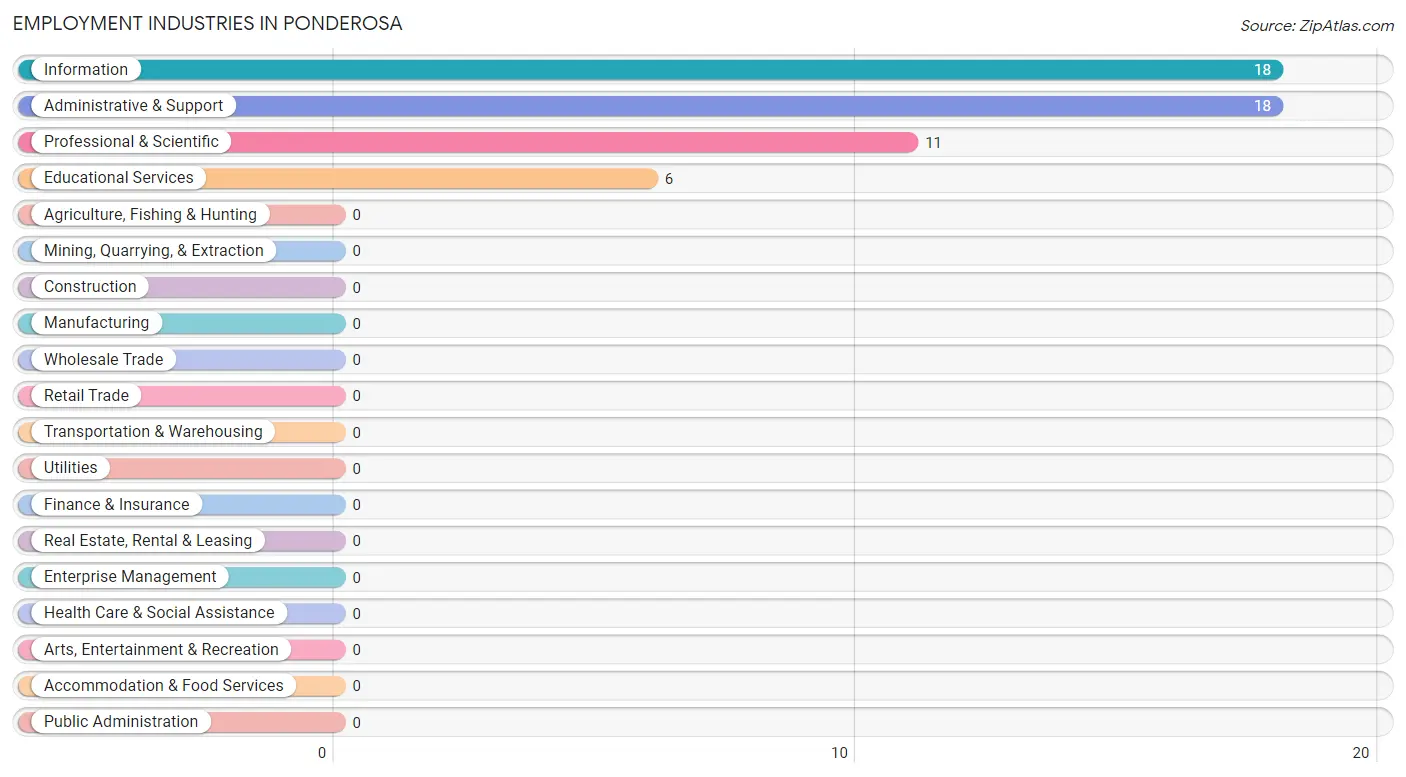
Employment Industries by Sex in Ponderosa
The Ponderosa industries that see more men than women are Information (100.0%), and Professional & Scientific (100.0%), whereas the industries that tend to have a higher number of women are Administrative & Support (100.0%), and Educational Services (100.0%).
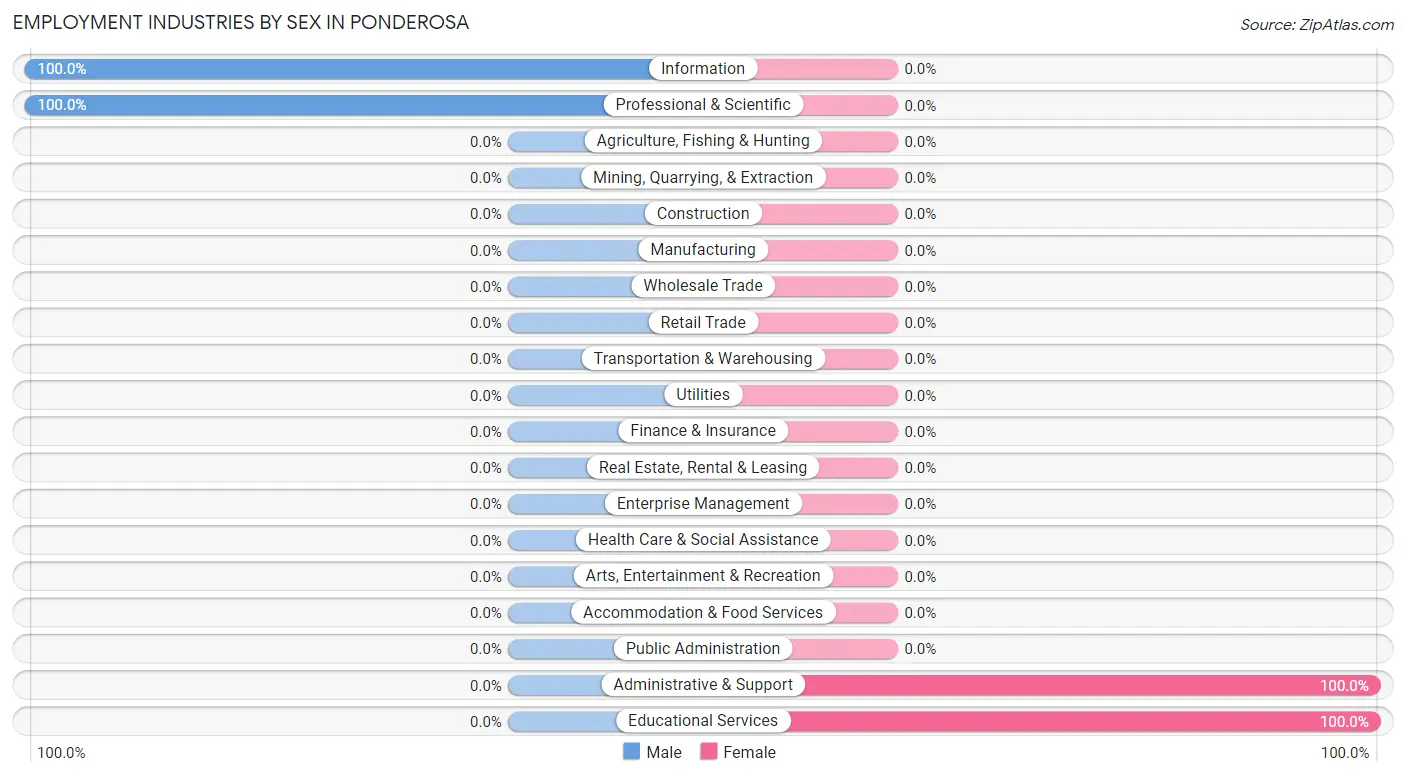
| Industry | Male | Female |
| Agriculture, Fishing & Hunting | 0 (0.0%) | 0 (0.0%) |
| Mining, Quarrying, & Extraction | 0 (0.0%) | 0 (0.0%) |
| Construction | 0 (0.0%) | 0 (0.0%) |
| Manufacturing | 0 (0.0%) | 0 (0.0%) |
| Wholesale Trade | 0 (0.0%) | 0 (0.0%) |
| Retail Trade | 0 (0.0%) | 0 (0.0%) |
| Transportation & Warehousing | 0 (0.0%) | 0 (0.0%) |
| Utilities | 0 (0.0%) | 0 (0.0%) |
| Information | 18 (100.0%) | 0 (0.0%) |
| Finance & Insurance | 0 (0.0%) | 0 (0.0%) |
| Real Estate, Rental & Leasing | 0 (0.0%) | 0 (0.0%) |
| Professional & Scientific | 11 (100.0%) | 0 (0.0%) |
| Enterprise Management | 0 (0.0%) | 0 (0.0%) |
| Administrative & Support | 0 (0.0%) | 18 (100.0%) |
| Educational Services | 0 (0.0%) | 6 (100.0%) |
| Health Care & Social Assistance | 0 (0.0%) | 0 (0.0%) |
| Arts, Entertainment & Recreation | 0 (0.0%) | 0 (0.0%) |
| Accommodation & Food Services | 0 (0.0%) | 0 (0.0%) |
| Public Administration | 0 (0.0%) | 0 (0.0%) |
| Total | 43 (64.2%) | 24 (35.8%) |
Education in Ponderosa
School Enrollment in Ponderosa
| School Level | # Students | % Students |
| Nursery / Preschool | 0 | 0.0% |
| Kindergarten | 0 | 0.0% |
| Elementary School | 0 | 0.0% |
| Middle School | 0 | 0.0% |
| High School | 0 | 0.0% |
| College / Undergraduate | 0 | 0.0% |
| Graduate / Professional | 0 | 0.0% |
| Total | 0 | 0.0% |
School Enrollment by Age by Funding Source in Ponderosa
| Age Bracket | Public School | Private School |
| 3 to 4 Year Olds | 0 (0.0%) | 0 (0.0%) |
| 5 to 9 Year Old | 0 (0.0%) | 0 (0.0%) |
| 10 to 14 Year Olds | 0 (0.0%) | 0 (0.0%) |
| 15 to 17 Year Olds | 0 (0.0%) | 0 (0.0%) |
| 18 to 19 Year Olds | 0 (0.0%) | 0 (0.0%) |
| 20 to 24 Year Olds | 0 (0.0%) | 0 (0.0%) |
| 25 to 34 Year Olds | 0 (0.0%) | 0 (0.0%) |
| 35 Years and over | 0 (0.0%) | 0 (0.0%) |
| Total | 0 (0.0%) | 0 (0.0%) |
Educational Attainment by Field of Study in Ponderosa
Social sciences (18 | 42.9%), business (12 | 28.6%), psychology (6 | 14.3%), and science & technology (6 | 14.3%) are the most common fields of study among 42 individuals in Ponderosa who have obtained a bachelor's degree or higher.
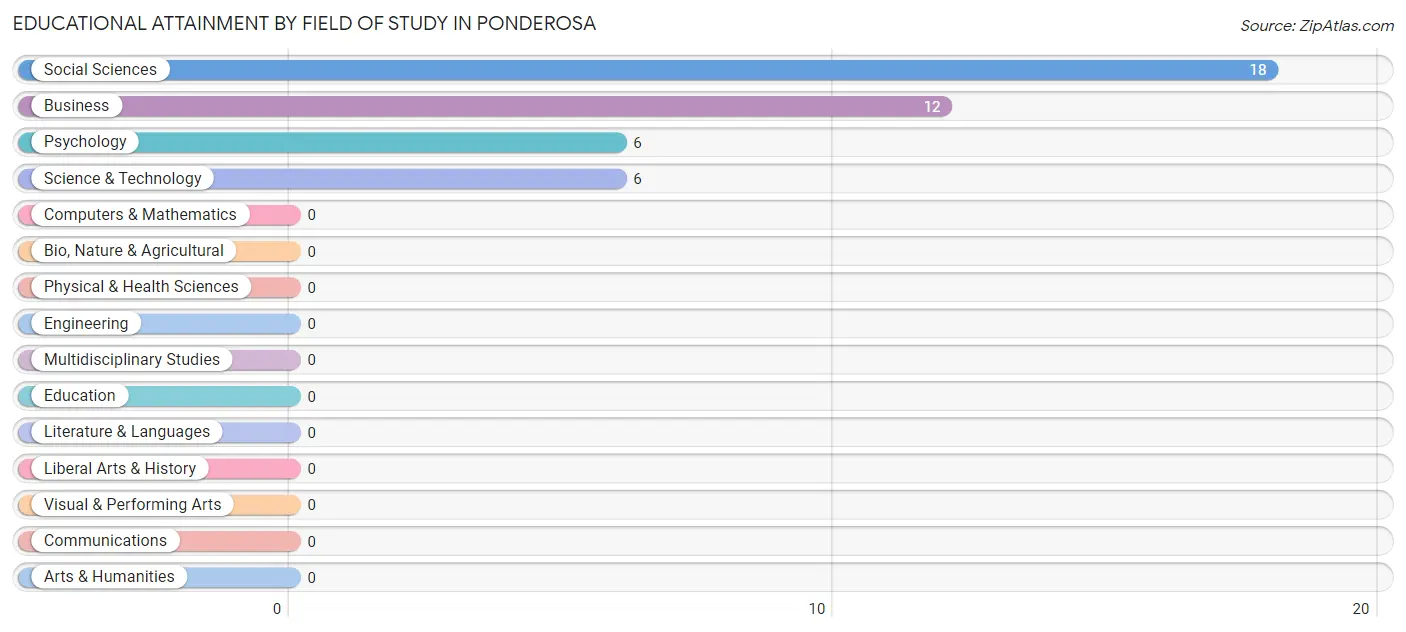
| Field of Study | # Graduates | % Graduates |
| Computers & Mathematics | 0 | 0.0% |
| Bio, Nature & Agricultural | 0 | 0.0% |
| Physical & Health Sciences | 0 | 0.0% |
| Psychology | 6 | 14.3% |
| Social Sciences | 18 | 42.9% |
| Engineering | 0 | 0.0% |
| Multidisciplinary Studies | 0 | 0.0% |
| Science & Technology | 6 | 14.3% |
| Business | 12 | 28.6% |
| Education | 0 | 0.0% |
| Literature & Languages | 0 | 0.0% |
| Liberal Arts & History | 0 | 0.0% |
| Visual & Performing Arts | 0 | 0.0% |
| Communications | 0 | 0.0% |
| Arts & Humanities | 0 | 0.0% |
| Total | 42 | 100.0% |
Transportation & Commute in Ponderosa
Vehicle Availability by Sex in Ponderosa
The most prevalent vehicle ownership categories in Ponderosa are males with 2 vehicles (25, accounting for 58.1%) and females with 2 vehicles (0, making up 104.2%).
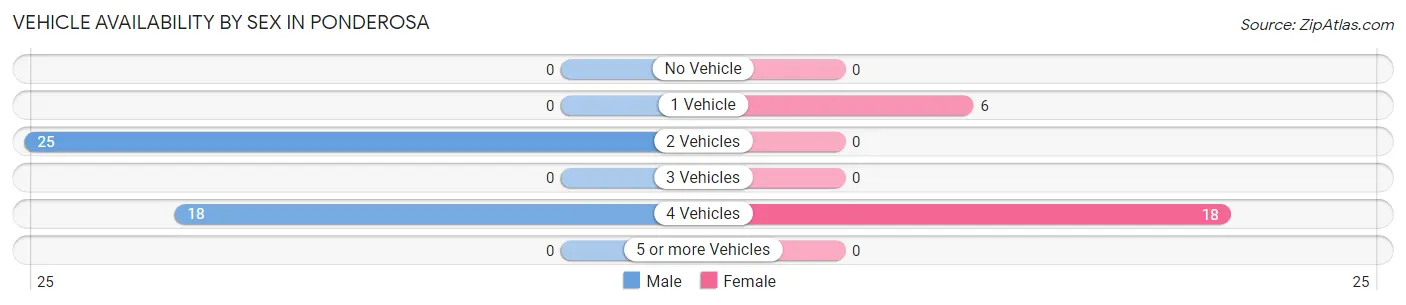
| Vehicles Available | Male | Female |
| No Vehicle | 0 (0.0%) | 0 (0.0%) |
| 1 Vehicle | 0 (0.0%) | 6 (25.0%) |
| 2 Vehicles | 25 (58.1%) | 0 (0.0%) |
| 3 Vehicles | 0 (0.0%) | 0 (0.0%) |
| 4 Vehicles | 18 (41.9%) | 18 (75.0%) |
| 5 or more Vehicles | 0 (0.0%) | 0 (0.0%) |
| Total | 43 (100.0%) | 24 (100.0%) |
Commute Time in Ponderosa
The most frequently occuring commute durations in Ponderosa are 35 to 39 minutes (18 commuters, 36.7%), 20 to 24 minutes (14 commuters, 28.6%), and 60 to 89 minutes (11 commuters, 22.5%).
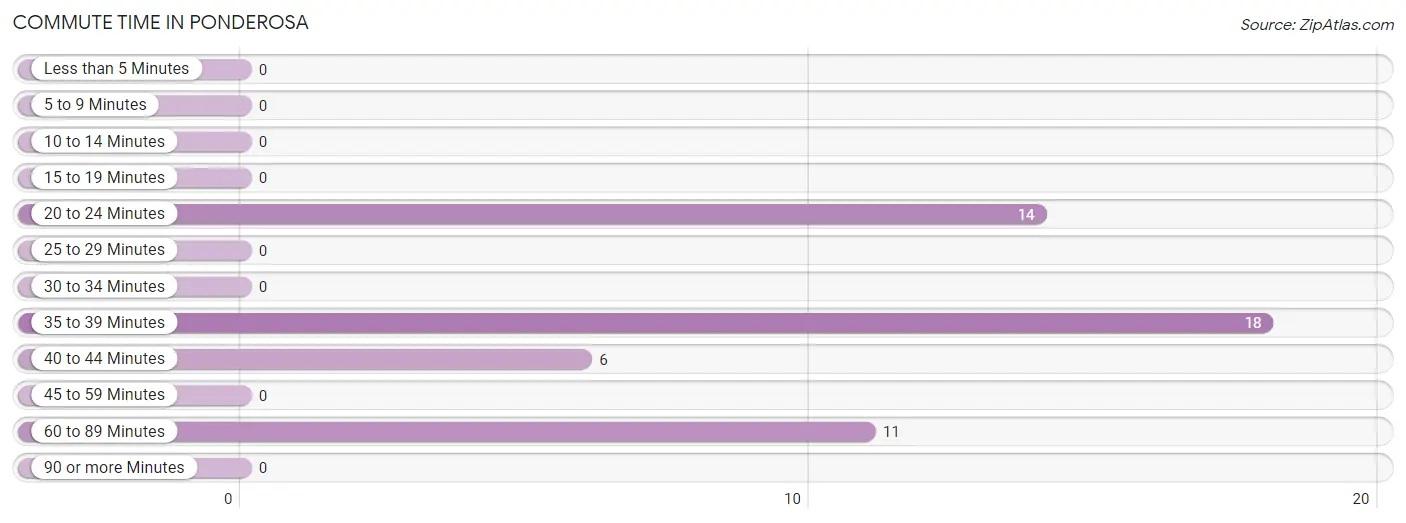
| Commute Time | # Commuters | % Commuters |
| Less than 5 Minutes | 0 | 0.0% |
| 5 to 9 Minutes | 0 | 0.0% |
| 10 to 14 Minutes | 0 | 0.0% |
| 15 to 19 Minutes | 0 | 0.0% |
| 20 to 24 Minutes | 14 | 28.6% |
| 25 to 29 Minutes | 0 | 0.0% |
| 30 to 34 Minutes | 0 | 0.0% |
| 35 to 39 Minutes | 18 | 36.7% |
| 40 to 44 Minutes | 6 | 12.2% |
| 45 to 59 Minutes | 0 | 0.0% |
| 60 to 89 Minutes | 11 | 22.5% |
| 90 or more Minutes | 0 | 0.0% |
Commute Time by Sex in Ponderosa
The most common commute times in Ponderosa are 20 to 24 minutes (14 commuters, 56.0%) for males and 35 to 39 minutes (18 commuters, 75.0%) for females.
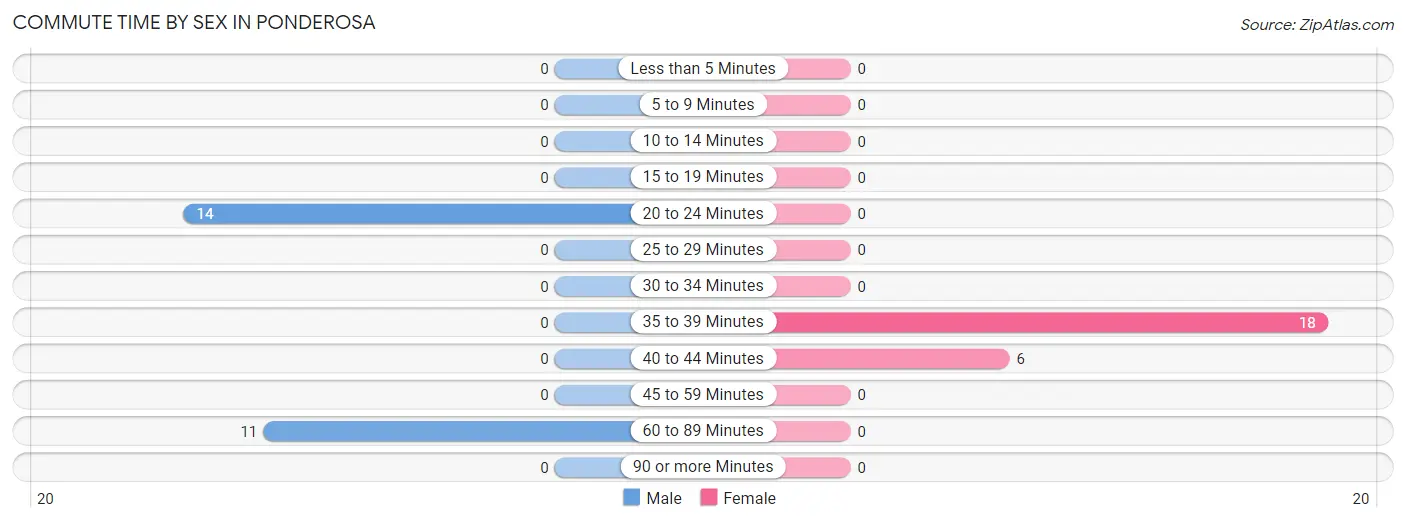
| Commute Time | Male | Female |
| Less than 5 Minutes | 0 (0.0%) | 0 (0.0%) |
| 5 to 9 Minutes | 0 (0.0%) | 0 (0.0%) |
| 10 to 14 Minutes | 0 (0.0%) | 0 (0.0%) |
| 15 to 19 Minutes | 0 (0.0%) | 0 (0.0%) |
| 20 to 24 Minutes | 14 (56.0%) | 0 (0.0%) |
| 25 to 29 Minutes | 0 (0.0%) | 0 (0.0%) |
| 30 to 34 Minutes | 0 (0.0%) | 0 (0.0%) |
| 35 to 39 Minutes | 0 (0.0%) | 18 (75.0%) |
| 40 to 44 Minutes | 0 (0.0%) | 6 (25.0%) |
| 45 to 59 Minutes | 0 (0.0%) | 0 (0.0%) |
| 60 to 89 Minutes | 11 (44.0%) | 0 (0.0%) |
| 90 or more Minutes | 0 (0.0%) | 0 (0.0%) |
Time of Departure to Work by Sex in Ponderosa
The most frequent times of departure to work in Ponderosa are 7:00 AM to 7:29 AM (14, 56.0%) for males and 8:00 AM to 8:29 AM (18, 75.0%) for females.
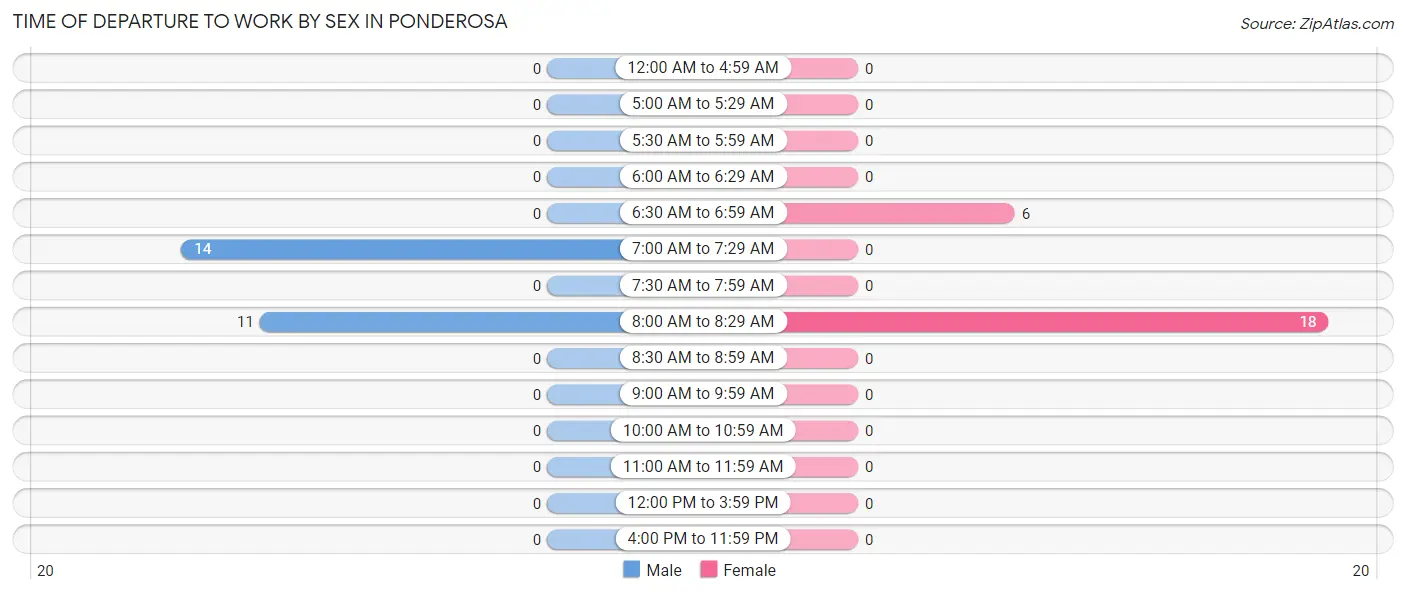
| Time of Departure | Male | Female |
| 12:00 AM to 4:59 AM | 0 (0.0%) | 0 (0.0%) |
| 5:00 AM to 5:29 AM | 0 (0.0%) | 0 (0.0%) |
| 5:30 AM to 5:59 AM | 0 (0.0%) | 0 (0.0%) |
| 6:00 AM to 6:29 AM | 0 (0.0%) | 0 (0.0%) |
| 6:30 AM to 6:59 AM | 0 (0.0%) | 6 (25.0%) |
| 7:00 AM to 7:29 AM | 14 (56.0%) | 0 (0.0%) |
| 7:30 AM to 7:59 AM | 0 (0.0%) | 0 (0.0%) |
| 8:00 AM to 8:29 AM | 11 (44.0%) | 18 (75.0%) |
| 8:30 AM to 8:59 AM | 0 (0.0%) | 0 (0.0%) |
| 9:00 AM to 9:59 AM | 0 (0.0%) | 0 (0.0%) |
| 10:00 AM to 10:59 AM | 0 (0.0%) | 0 (0.0%) |
| 11:00 AM to 11:59 AM | 0 (0.0%) | 0 (0.0%) |
| 12:00 PM to 3:59 PM | 0 (0.0%) | 0 (0.0%) |
| 4:00 PM to 11:59 PM | 0 (0.0%) | 0 (0.0%) |
| Total | 25 (100.0%) | 24 (100.0%) |
Housing Occupancy in Ponderosa
Occupancy by Ownership in Ponderosa
Of the total 104 dwellings in Ponderosa, owner-occupied units account for 104 (100.0%), while renter-occupied units make up 0 (0.0%).
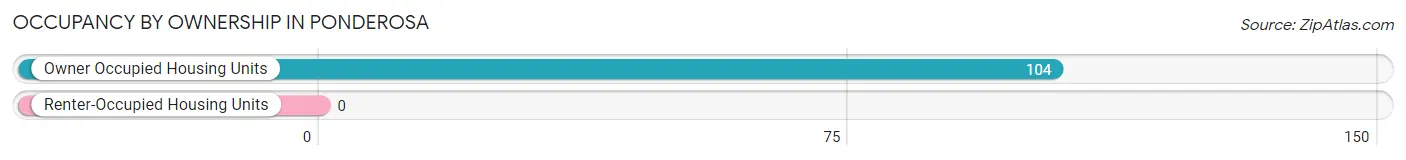
| Occupancy | # Housing Units | % Housing Units |
| Owner Occupied Housing Units | 104 | 100.0% |
| Renter-Occupied Housing Units | 0 | 0.0% |
| Total Occupied Housing Units | 104 | 100.0% |
Occupancy by Household Size in Ponderosa
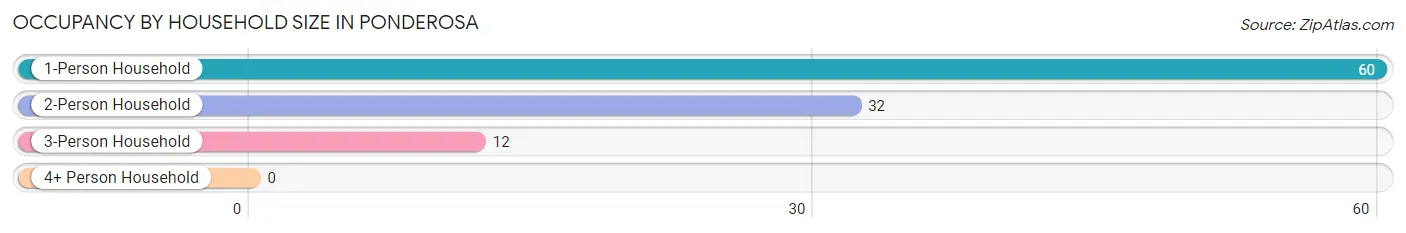
| Household Size | # Housing Units | % Housing Units |
| 1-Person Household | 60 | 57.7% |
| 2-Person Household | 32 | 30.8% |
| 3-Person Household | 12 | 11.5% |
| 4+ Person Household | 0 | 0.0% |
| Total Housing Units | 104 | 100.0% |
Occupancy by Ownership by Household Size in Ponderosa
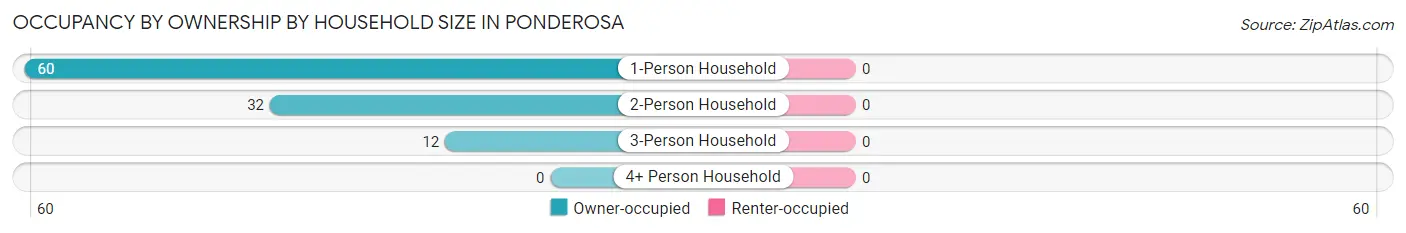
| Household Size | Owner-occupied | Renter-occupied |
| 1-Person Household | 60 (100.0%) | 0 (0.0%) |
| 2-Person Household | 32 (100.0%) | 0 (0.0%) |
| 3-Person Household | 12 (100.0%) | 0 (0.0%) |
| 4+ Person Household | 0 (0.0%) | 0 (0.0%) |
| Total Housing Units | 104 (100.0%) | 0 (0.0%) |
Occupancy by Educational Attainment in Ponderosa
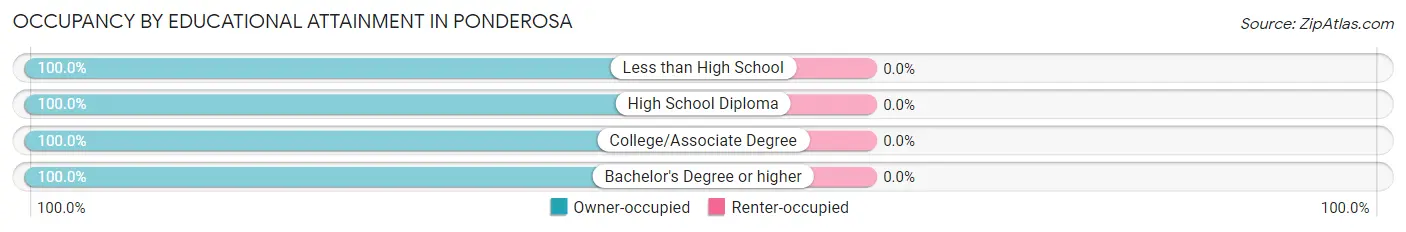
| Household Size | Owner-occupied | Renter-occupied |
| Less than High School | 8 (100.0%) | 0 (0.0%) |
| High School Diploma | 56 (100.0%) | 0 (0.0%) |
| College/Associate Degree | 16 (100.0%) | 0 (0.0%) |
| Bachelor's Degree or higher | 24 (100.0%) | 0 (0.0%) |
Occupancy by Age of Householder in Ponderosa
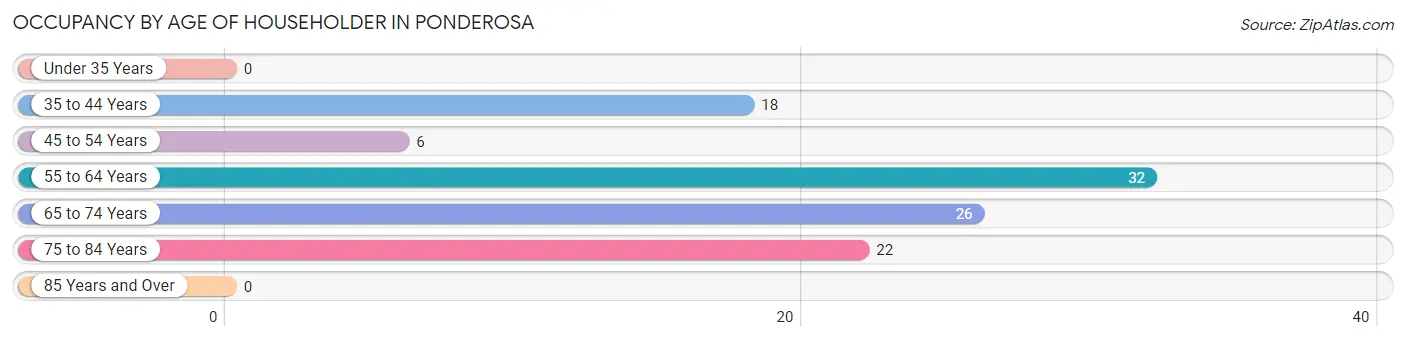
| Age Bracket | # Households | % Households |
| Under 35 Years | 0 | 0.0% |
| 35 to 44 Years | 18 | 17.3% |
| 45 to 54 Years | 6 | 5.8% |
| 55 to 64 Years | 32 | 30.8% |
| 65 to 74 Years | 26 | 25.0% |
| 75 to 84 Years | 22 | 21.1% |
| 85 Years and Over | 0 | 0.0% |
| Total | 104 | 100.0% |
Housing Finances in Ponderosa
Median Income by Occupancy in Ponderosa
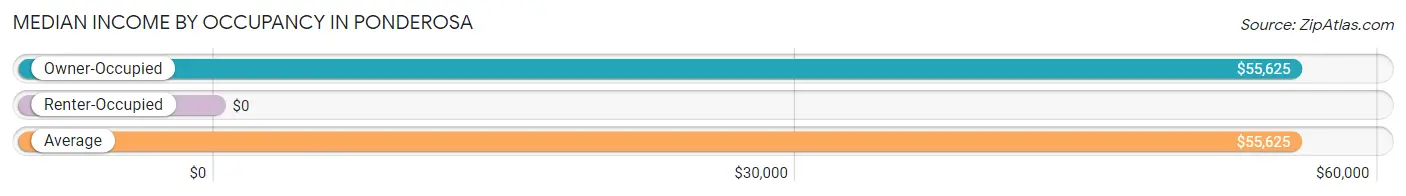
| Occupancy Type | # Households | Median Income |
| Owner-Occupied | 104 (100.0%) | $55,625 |
| Renter-Occupied | 0 (0.0%) | $0 |
| Average | 104 (100.0%) | $55,625 |
Occupancy by Householder Income Bracket in Ponderosa
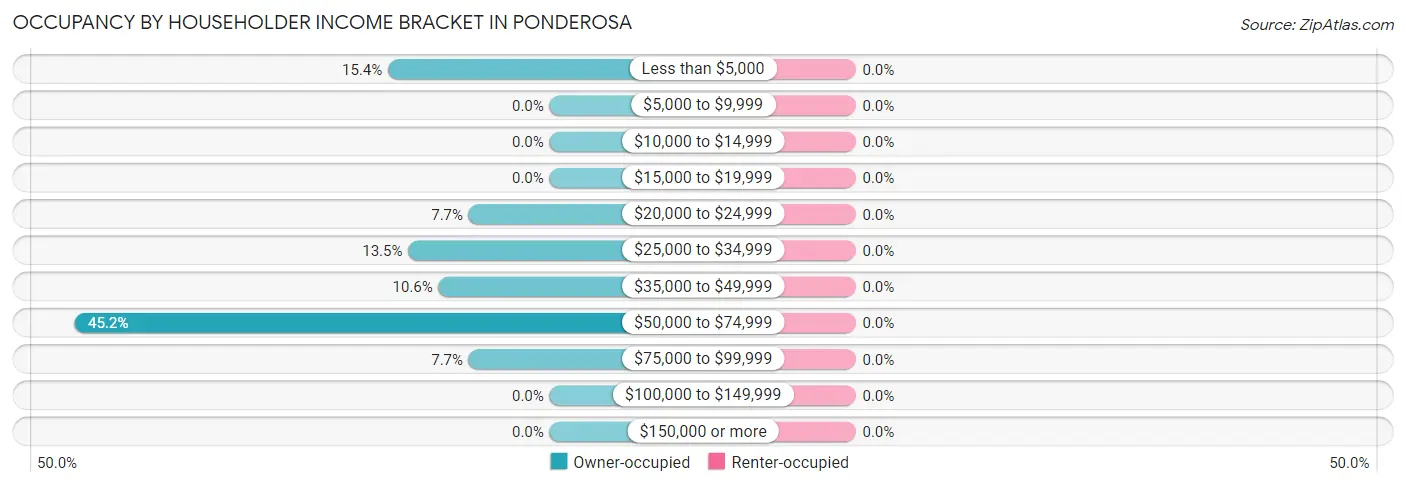
| Income Bracket | Owner-occupied | Renter-occupied |
| Less than $5,000 | 16 (15.4%) | 0 (0.0%) |
| $5,000 to $9,999 | 0 (0.0%) | 0 (0.0%) |
| $10,000 to $14,999 | 0 (0.0%) | 0 (0.0%) |
| $15,000 to $19,999 | 0 (0.0%) | 0 (0.0%) |
| $20,000 to $24,999 | 8 (7.7%) | 0 (0.0%) |
| $25,000 to $34,999 | 14 (13.5%) | 0 (0.0%) |
| $35,000 to $49,999 | 11 (10.6%) | 0 (0.0%) |
| $50,000 to $74,999 | 47 (45.2%) | 0 (0.0%) |
| $75,000 to $99,999 | 8 (7.7%) | 0 (0.0%) |
| $100,000 to $149,999 | 0 (0.0%) | 0 (0.0%) |
| $150,000 or more | 0 (0.0%) | 0 (0.0%) |
| Total | 104 (100.0%) | 0 (0.0%) |
Monthly Housing Cost Tiers in Ponderosa
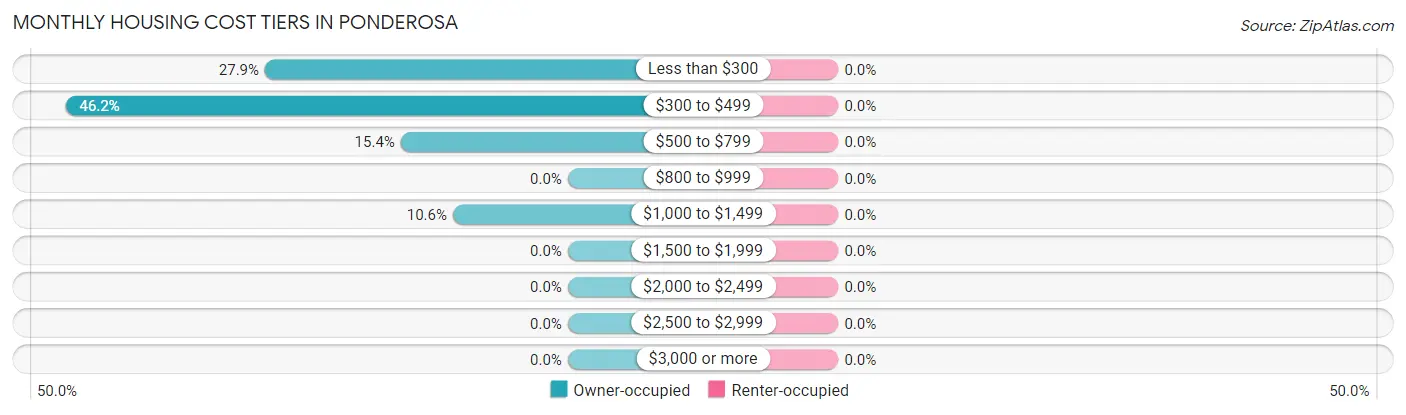
| Monthly Cost | Owner-occupied | Renter-occupied |
| Less than $300 | 29 (27.9%) | 0 (0.0%) |
| $300 to $499 | 48 (46.2%) | 0 (0.0%) |
| $500 to $799 | 16 (15.4%) | 0 (0.0%) |
| $800 to $999 | 0 (0.0%) | 0 (0.0%) |
| $1,000 to $1,499 | 11 (10.6%) | 0 (0.0%) |
| $1,500 to $1,999 | 0 (0.0%) | 0 (0.0%) |
| $2,000 to $2,499 | 0 (0.0%) | 0 (0.0%) |
| $2,500 to $2,999 | 0 (0.0%) | 0 (0.0%) |
| $3,000 or more | 0 (0.0%) | 0 (0.0%) |
| Total | 104 (100.0%) | 0 (0.0%) |
Physical Housing Characteristics in Ponderosa
Housing Structures in Ponderosa
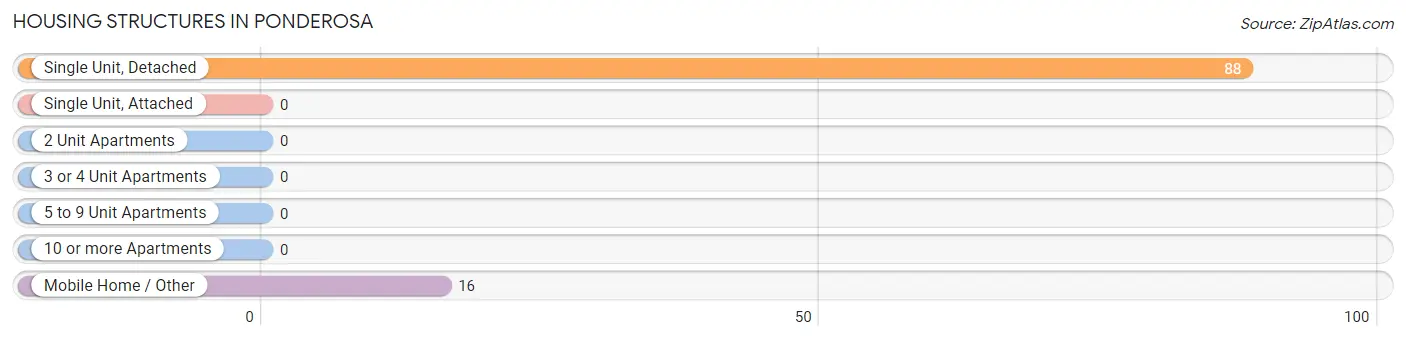
| Structure Type | # Housing Units | % Housing Units |
| Single Unit, Detached | 88 | 84.6% |
| Single Unit, Attached | 0 | 0.0% |
| 2 Unit Apartments | 0 | 0.0% |
| 3 or 4 Unit Apartments | 0 | 0.0% |
| 5 to 9 Unit Apartments | 0 | 0.0% |
| 10 or more Apartments | 0 | 0.0% |
| Mobile Home / Other | 16 | 15.4% |
| Total | 104 | 100.0% |
Housing Structures by Occupancy in Ponderosa
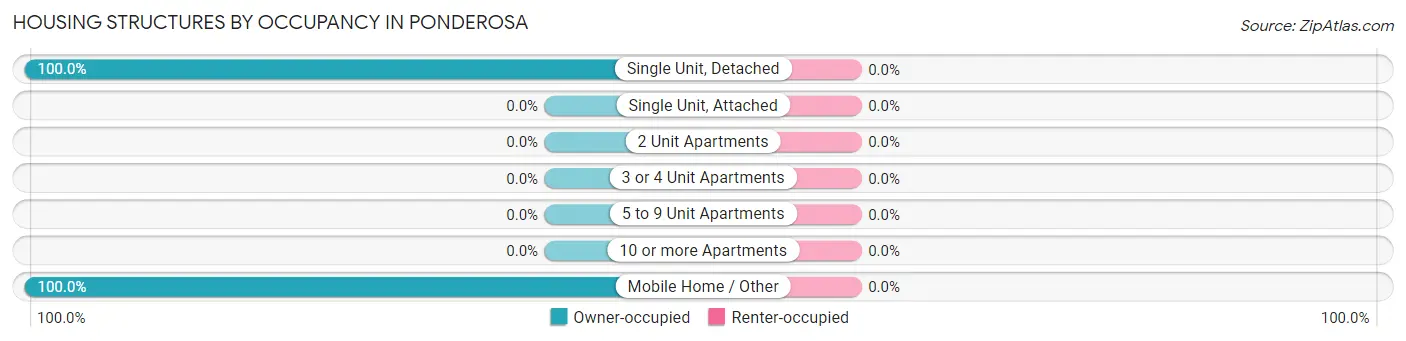
| Structure Type | Owner-occupied | Renter-occupied |
| Single Unit, Detached | 88 (100.0%) | 0 (0.0%) |
| Single Unit, Attached | 0 (0.0%) | 0 (0.0%) |
| 2 Unit Apartments | 0 (0.0%) | 0 (0.0%) |
| 3 or 4 Unit Apartments | 0 (0.0%) | 0 (0.0%) |
| 5 to 9 Unit Apartments | 0 (0.0%) | 0 (0.0%) |
| 10 or more Apartments | 0 (0.0%) | 0 (0.0%) |
| Mobile Home / Other | 16 (100.0%) | 0 (0.0%) |
| Total | 104 (100.0%) | 0 (0.0%) |
Housing Structures by Number of Rooms in Ponderosa
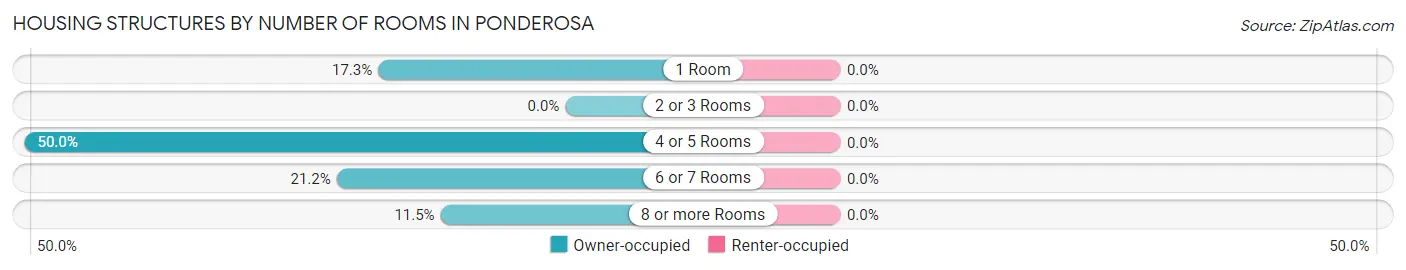
| Number of Rooms | Owner-occupied | Renter-occupied |
| 1 Room | 18 (17.3%) | 0 (0.0%) |
| 2 or 3 Rooms | 0 (0.0%) | 0 (0.0%) |
| 4 or 5 Rooms | 52 (50.0%) | 0 (0.0%) |
| 6 or 7 Rooms | 22 (21.1%) | 0 (0.0%) |
| 8 or more Rooms | 12 (11.5%) | 0 (0.0%) |
| Total | 104 (100.0%) | 0 (0.0%) |
Housing Structure by Heating Type in Ponderosa
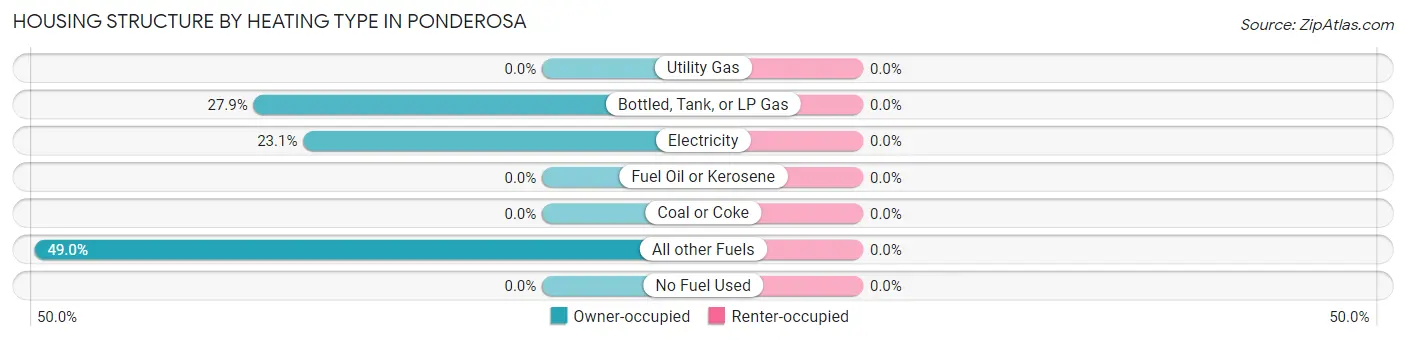
| Heating Type | Owner-occupied | Renter-occupied |
| Utility Gas | 0 (0.0%) | 0 (0.0%) |
| Bottled, Tank, or LP Gas | 29 (27.9%) | 0 (0.0%) |
| Electricity | 24 (23.1%) | 0 (0.0%) |
| Fuel Oil or Kerosene | 0 (0.0%) | 0 (0.0%) |
| Coal or Coke | 0 (0.0%) | 0 (0.0%) |
| All other Fuels | 51 (49.0%) | 0 (0.0%) |
| No Fuel Used | 0 (0.0%) | 0 (0.0%) |
| Total | 104 (100.0%) | 0 (0.0%) |
Household Vehicle Usage in Ponderosa
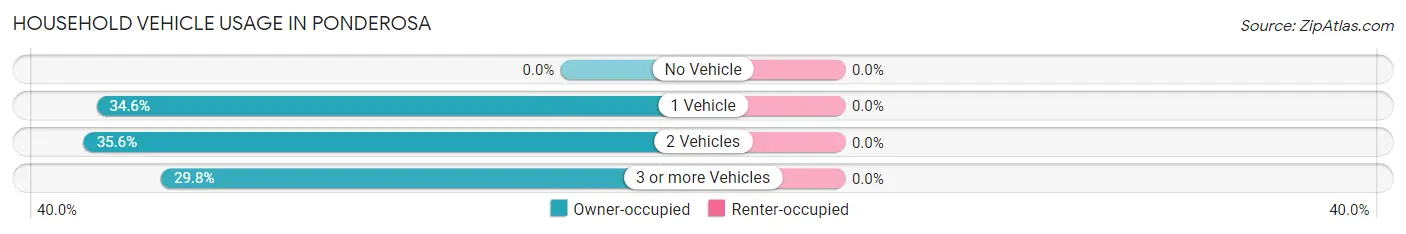
| Vehicles per Household | Owner-occupied | Renter-occupied |
| No Vehicle | 0 (0.0%) | 0 (0.0%) |
| 1 Vehicle | 36 (34.6%) | 0 (0.0%) |
| 2 Vehicles | 37 (35.6%) | 0 (0.0%) |
| 3 or more Vehicles | 31 (29.8%) | 0 (0.0%) |
| Total | 104 (100.0%) | 0 (0.0%) |
Real Estate & Mortgages in Ponderosa
Real Estate and Mortgage Overview in Ponderosa
| Characteristic | Without Mortgage | With Mortgage |
| Housing Units | 77 | 27 |
| Median Property Value | $170,300 | $0 |
| Median Household Income | $56,146 | $0 |
| Monthly Housing Costs | $374 | $0 |
| Real Estate Taxes | $621 | $0 |
Property Value by Mortgage Status in Ponderosa
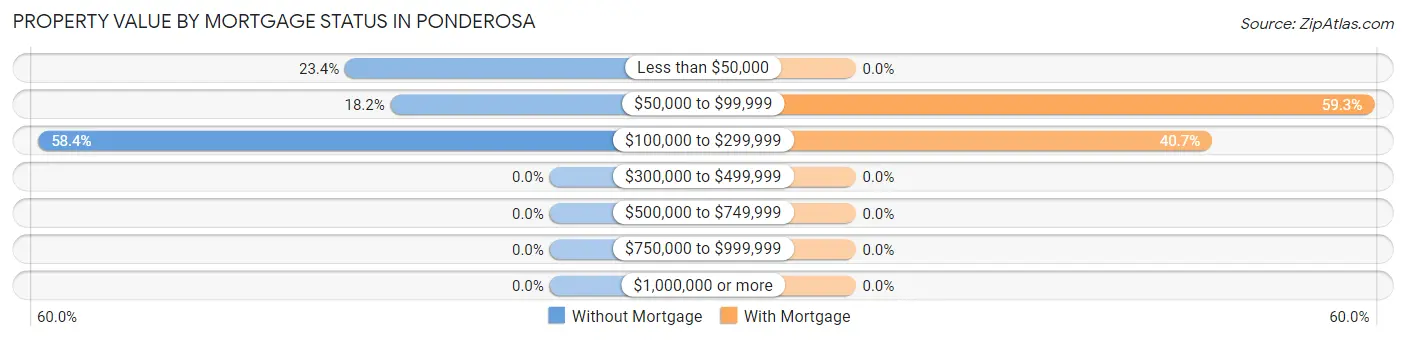
| Property Value | Without Mortgage | With Mortgage |
| Less than $50,000 | 18 (23.4%) | 0 (0.0%) |
| $50,000 to $99,999 | 14 (18.2%) | 16 (59.3%) |
| $100,000 to $299,999 | 45 (58.4%) | 11 (40.7%) |
| $300,000 to $499,999 | 0 (0.0%) | 0 (0.0%) |
| $500,000 to $749,999 | 0 (0.0%) | 0 (0.0%) |
| $750,000 to $999,999 | 0 (0.0%) | 0 (0.0%) |
| $1,000,000 or more | 0 (0.0%) | 0 (0.0%) |
| Total | 77 (100.0%) | 27 (100.0%) |
Household Income by Mortgage Status in Ponderosa
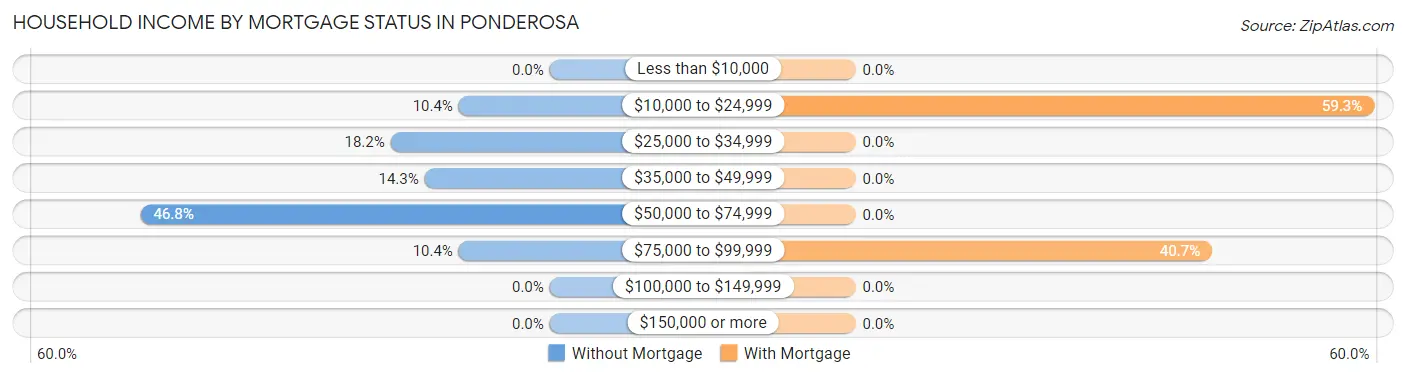
| Household Income | Without Mortgage | With Mortgage |
| Less than $10,000 | 0 (0.0%) | 0 (0.0%) |
| $10,000 to $24,999 | 8 (10.4%) | 16 (59.3%) |
| $25,000 to $34,999 | 14 (18.2%) | 0 (0.0%) |
| $35,000 to $49,999 | 11 (14.3%) | 0 (0.0%) |
| $50,000 to $74,999 | 36 (46.8%) | 0 (0.0%) |
| $75,000 to $99,999 | 8 (10.4%) | 11 (40.7%) |
| $100,000 to $149,999 | 0 (0.0%) | 0 (0.0%) |
| $150,000 or more | 0 (0.0%) | 0 (0.0%) |
| Total | 77 (100.0%) | 27 (100.0%) |
Property Value to Household Income Ratio in Ponderosa
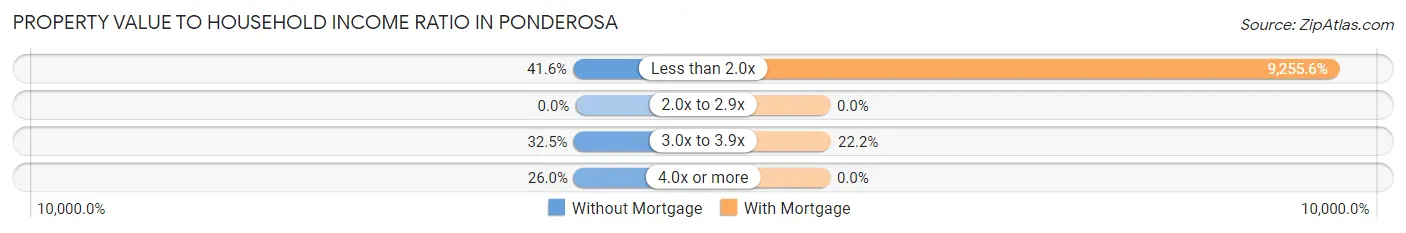
| Value-to-Income Ratio | Without Mortgage | With Mortgage |
| Less than 2.0x | 32 (41.6%) | 2,499 (9,255.6%) |
| 2.0x to 2.9x | 0 (0.0%) | 0 (0.0%) |
| 3.0x to 3.9x | 25 (32.5%) | 6 (22.2%) |
| 4.0x or more | 20 (26.0%) | 0 (0.0%) |
| Total | 77 (100.0%) | 27 (100.0%) |
Real Estate Taxes by Mortgage Status in Ponderosa
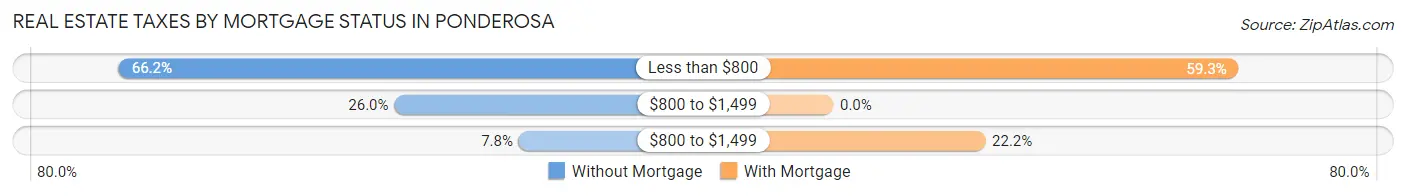
| Property Taxes | Without Mortgage | With Mortgage |
| Less than $800 | 51 (66.2%) | 16 (59.3%) |
| $800 to $1,499 | 20 (26.0%) | 0 (0.0%) |
| $800 to $1,499 | 6 (7.8%) | 6 (22.2%) |
| Total | 77 (100.0%) | 27 (100.0%) |
Health & Disability in Ponderosa
Health Insurance Coverage by Age in Ponderosa
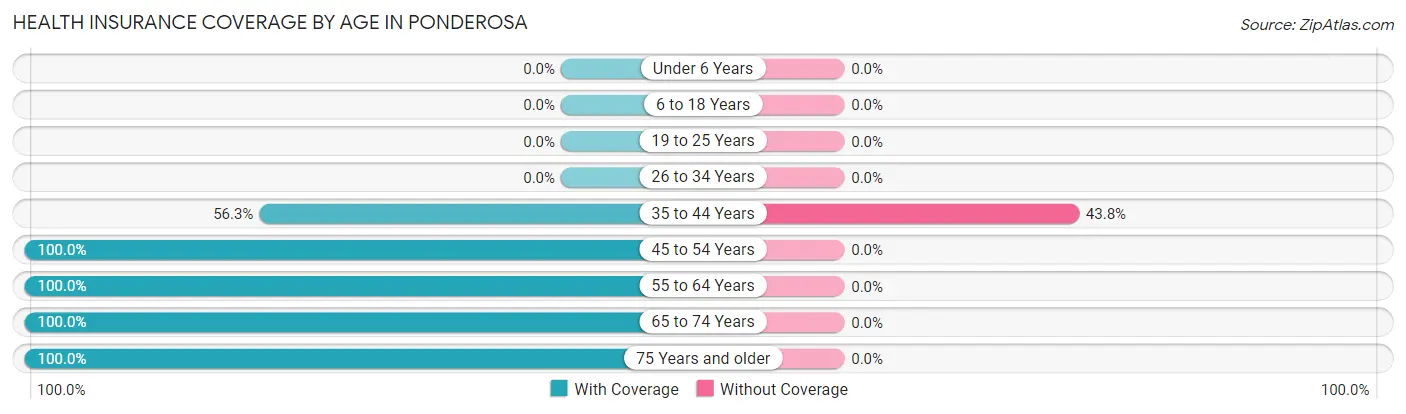
| Age Bracket | With Coverage | Without Coverage |
| Under 6 Years | 0 (0.0%) | 0 (0.0%) |
| 6 to 18 Years | 0 (0.0%) | 0 (0.0%) |
| 19 to 25 Years | 0 (0.0%) | 0 (0.0%) |
| 26 to 34 Years | 0 (0.0%) | 0 (0.0%) |
| 35 to 44 Years | 18 (56.2%) | 14 (43.8%) |
| 45 to 54 Years | 24 (100.0%) | 0 (0.0%) |
| 55 to 64 Years | 32 (100.0%) | 0 (0.0%) |
| 65 to 74 Years | 50 (100.0%) | 0 (0.0%) |
| 75 Years and older | 22 (100.0%) | 0 (0.0%) |
| Total | 146 (91.2%) | 14 (8.7%) |
Health Insurance Coverage by Citizenship Status in Ponderosa
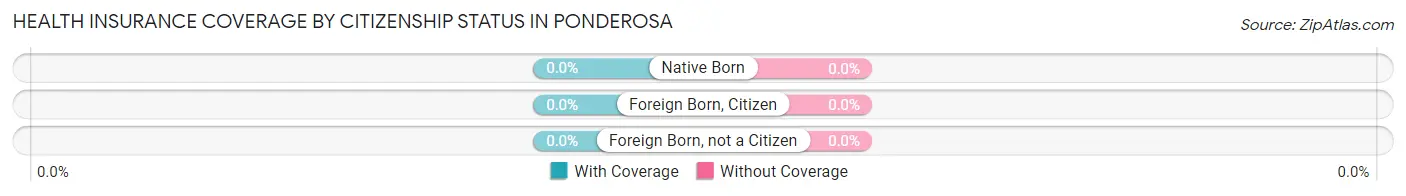
| Citizenship Status | With Coverage | Without Coverage |
| Native Born | 0 (0.0%) | 0 (0.0%) |
| Foreign Born, Citizen | 0 (0.0%) | 0 (0.0%) |
| Foreign Born, not a Citizen | 0 (0.0%) | 0 (0.0%) |
Health Insurance Coverage by Household Income in Ponderosa
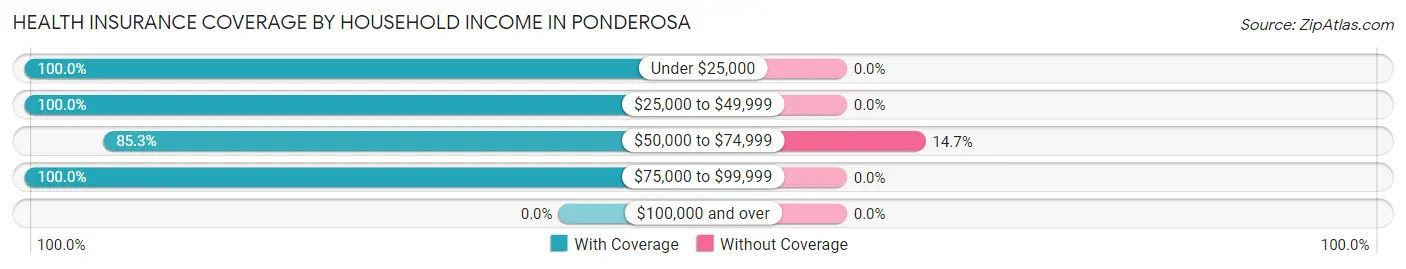
| Household Income | With Coverage | Without Coverage |
| Under $25,000 | 24 (100.0%) | 0 (0.0%) |
| $25,000 to $49,999 | 25 (100.0%) | 0 (0.0%) |
| $50,000 to $74,999 | 81 (85.3%) | 14 (14.7%) |
| $75,000 to $99,999 | 16 (100.0%) | 0 (0.0%) |
| $100,000 and over | 0 (0.0%) | 0 (0.0%) |
Public vs Private Health Insurance Coverage by Age in Ponderosa
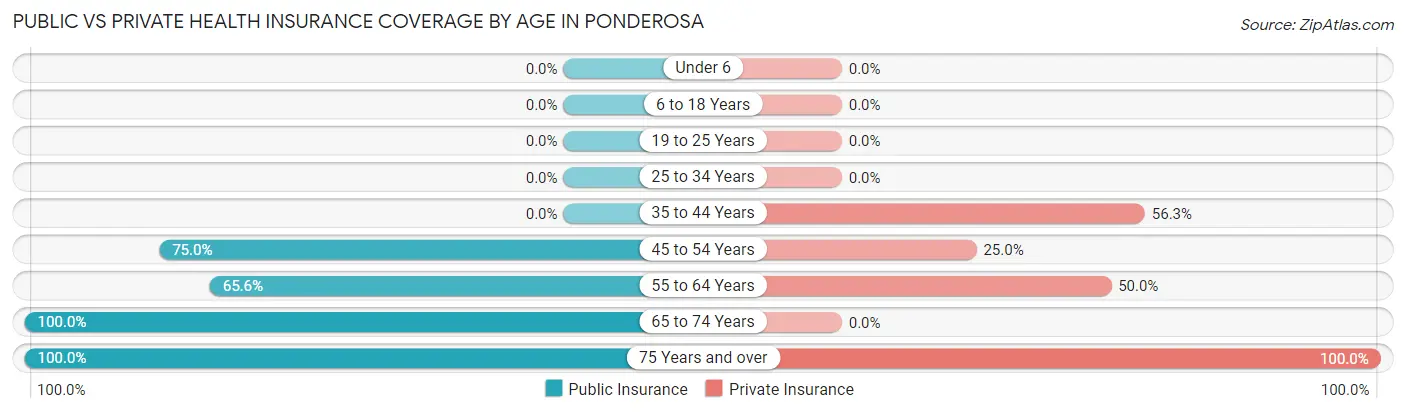
| Age Bracket | Public Insurance | Private Insurance |
| Under 6 | 0 (0.0%) | 0 (0.0%) |
| 6 to 18 Years | 0 (0.0%) | 0 (0.0%) |
| 19 to 25 Years | 0 (0.0%) | 0 (0.0%) |
| 25 to 34 Years | 0 (0.0%) | 0 (0.0%) |
| 35 to 44 Years | 0 (0.0%) | 18 (56.2%) |
| 45 to 54 Years | 18 (75.0%) | 6 (25.0%) |
| 55 to 64 Years | 21 (65.6%) | 16 (50.0%) |
| 65 to 74 Years | 50 (100.0%) | 0 (0.0%) |
| 75 Years and over | 22 (100.0%) | 22 (100.0%) |
| Total | 111 (69.4%) | 62 (38.8%) |
Disability Status by Sex by Age in Ponderosa
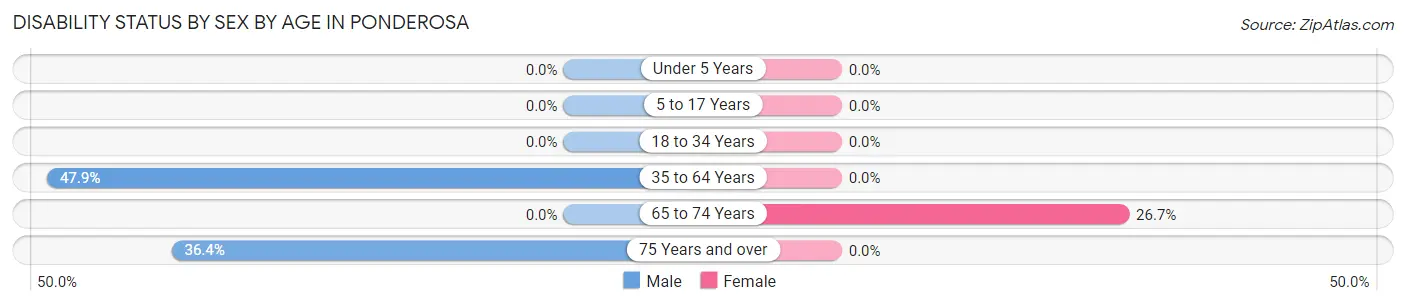
| Age Bracket | Male | Female |
| Under 5 Years | 0 (0.0%) | 0 (0.0%) |
| 5 to 17 Years | 0 (0.0%) | 0 (0.0%) |
| 18 to 34 Years | 0 (0.0%) | 0 (0.0%) |
| 35 to 64 Years | 23 (47.9%) | 0 (0.0%) |
| 65 to 74 Years | 0 (0.0%) | 8 (26.7%) |
| 75 Years and over | 8 (36.4%) | 0 (0.0%) |
Disability Class by Sex by Age in Ponderosa
Disability Class: Hearing Difficulty
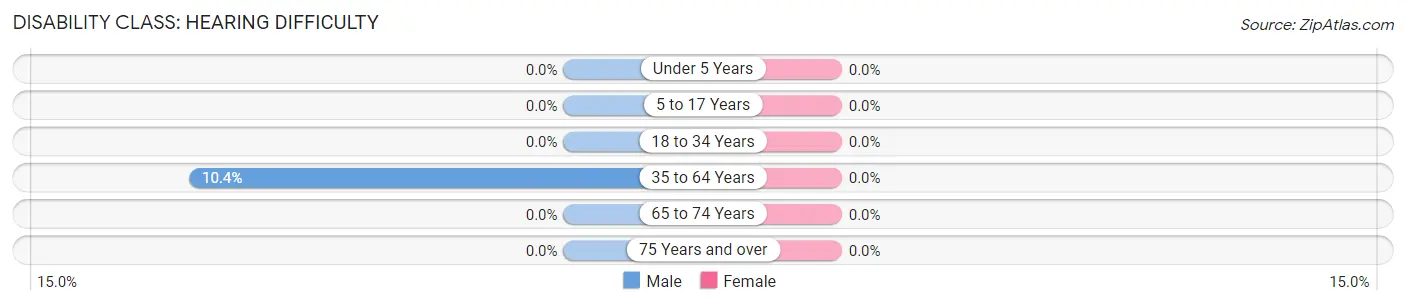
| Age Bracket | Male | Female |
| Under 5 Years | 0 (0.0%) | 0 (0.0%) |
| 5 to 17 Years | 0 (0.0%) | 0 (0.0%) |
| 18 to 34 Years | 0 (0.0%) | 0 (0.0%) |
| 35 to 64 Years | 5 (10.4%) | 0 (0.0%) |
| 65 to 74 Years | 0 (0.0%) | 0 (0.0%) |
| 75 Years and over | 0 (0.0%) | 0 (0.0%) |
Disability Class: Vision Difficulty
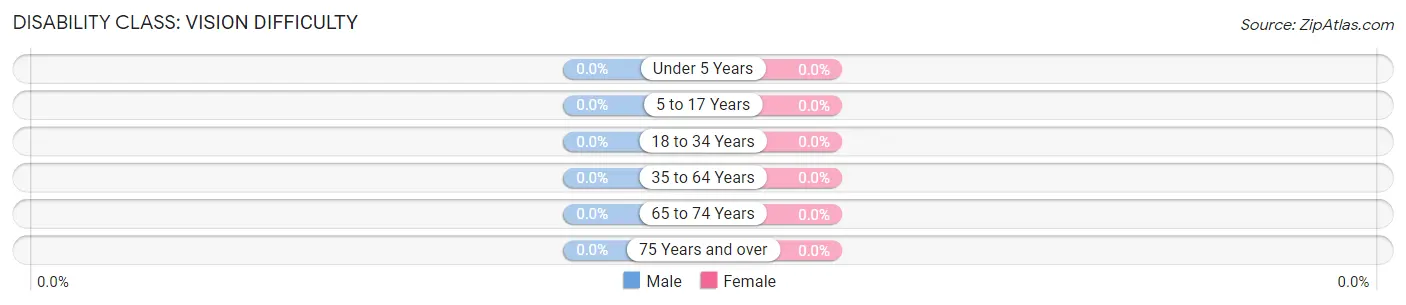
| Age Bracket | Male | Female |
| Under 5 Years | 0 (0.0%) | 0 (0.0%) |
| 5 to 17 Years | 0 (0.0%) | 0 (0.0%) |
| 18 to 34 Years | 0 (0.0%) | 0 (0.0%) |
| 35 to 64 Years | 0 (0.0%) | 0 (0.0%) |
| 65 to 74 Years | 0 (0.0%) | 0 (0.0%) |
| 75 Years and over | 0 (0.0%) | 0 (0.0%) |
Disability Class: Cognitive Difficulty
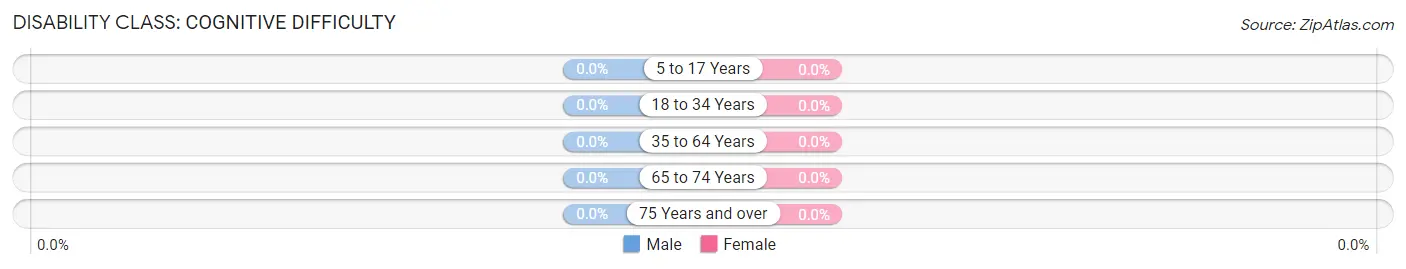
| Age Bracket | Male | Female |
| 5 to 17 Years | 0 (0.0%) | 0 (0.0%) |
| 18 to 34 Years | 0 (0.0%) | 0 (0.0%) |
| 35 to 64 Years | 0 (0.0%) | 0 (0.0%) |
| 65 to 74 Years | 0 (0.0%) | 0 (0.0%) |
| 75 Years and over | 0 (0.0%) | 0 (0.0%) |
Disability Class: Ambulatory Difficulty
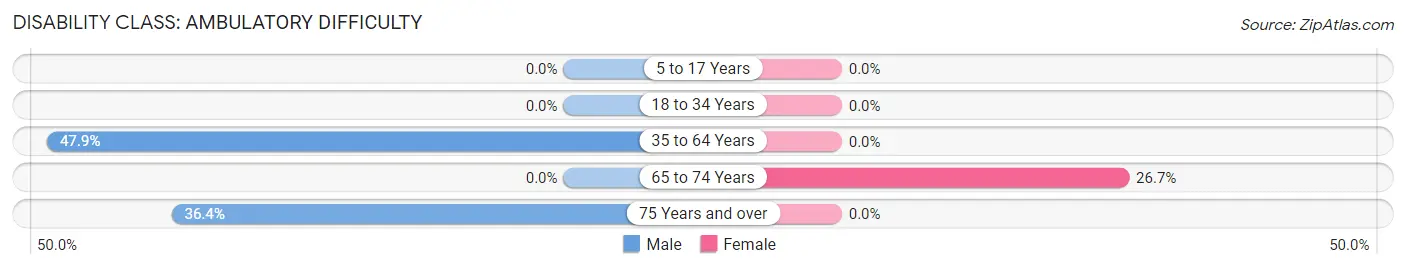
| Age Bracket | Male | Female |
| 5 to 17 Years | 0 (0.0%) | 0 (0.0%) |
| 18 to 34 Years | 0 (0.0%) | 0 (0.0%) |
| 35 to 64 Years | 23 (47.9%) | 0 (0.0%) |
| 65 to 74 Years | 0 (0.0%) | 8 (26.7%) |
| 75 Years and over | 8 (36.4%) | 0 (0.0%) |
Disability Class: Self-Care Difficulty

| Age Bracket | Male | Female |
| 5 to 17 Years | 0 (0.0%) | 0 (0.0%) |
| 18 to 34 Years | 0 (0.0%) | 0 (0.0%) |
| 35 to 64 Years | 0 (0.0%) | 0 (0.0%) |
| 65 to 74 Years | 0 (0.0%) | 0 (0.0%) |
| 75 Years and over | 0 (0.0%) | 0 (0.0%) |
Technology Access in Ponderosa
Computing Device Access in Ponderosa
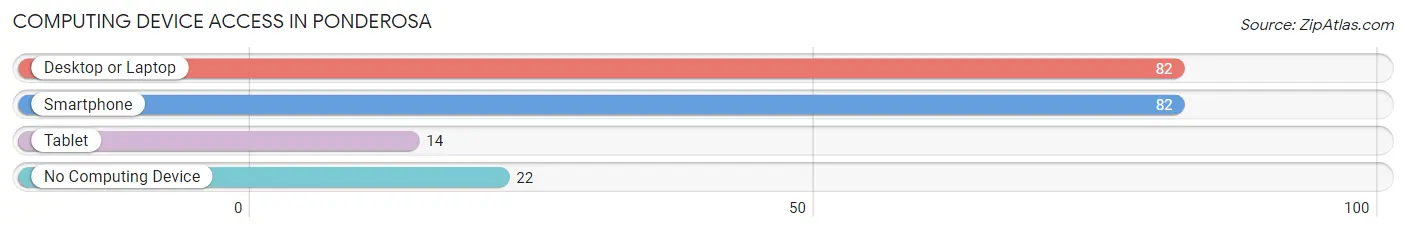
| Device Type | # Households | % Households |
| Desktop or Laptop | 82 | 78.8% |
| Smartphone | 82 | 78.8% |
| Tablet | 14 | 13.5% |
| No Computing Device | 22 | 21.1% |
| Total | 104 | 100.0% |
Internet Access in Ponderosa
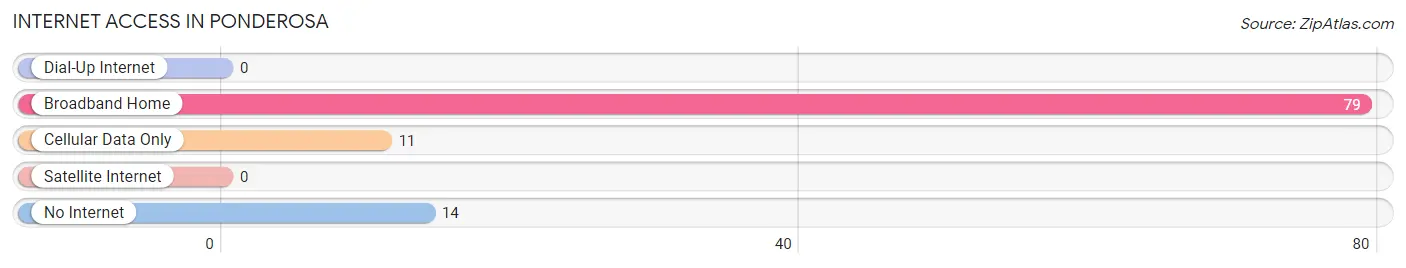
| Internet Type | # Households | % Households |
| Dial-Up Internet | 0 | 0.0% |
| Broadband Home | 79 | 76.0% |
| Cellular Data Only | 11 | 10.6% |
| Satellite Internet | 0 | 0.0% |
| No Internet | 14 | 13.5% |
| Total | 104 | 100.0% |
Ponderosa Summary
Ponderosa, New Mexico is a small unincorporated community located in the foothills of the Sangre de Cristo Mountains in Santa Fe County. It is situated about 25 miles northeast of Santa Fe and is home to a population of approximately 1,000 people.
History
The area that is now Ponderosa was first settled by Spanish colonists in the late 1700s. The area was originally known as El Valle de los Pinos, or Valley of the Pines, due to the abundance of pine trees in the area. The area was later renamed Ponderosa after the Ponderosa Pine, which is native to the area.
In the late 1800s, the area was home to a number of small ranches and farms. The area was also home to a number of Native American tribes, including the Apache, Navajo, and Pueblo.
In the early 1900s, the area began to attract more settlers, and the population began to grow. The area was home to a number of small businesses, including a general store, a post office, and a school.
Geography
Ponderosa is located in the foothills of the Sangre de Cristo Mountains in Santa Fe County. The area is characterized by rolling hills, pine forests, and grassy meadows. The area is also home to a number of small streams and creeks.
The climate in Ponderosa is semi-arid, with hot summers and cold winters. The average annual temperature is around 50 degrees Fahrenheit. The area receives an average of 12 inches of precipitation per year.
Economy
The economy of Ponderosa is largely based on agriculture and tourism. The area is home to a number of small farms and ranches, which produce a variety of crops, including hay, alfalfa, and vegetables. The area is also home to a number of small businesses, including restaurants, stores, and lodges.
Tourism is an important part of the local economy. The area is home to a number of attractions, including the Ponderosa State Park, which offers camping, hiking, and fishing. The area is also home to a number of art galleries, museums, and historic sites.
Demographics
As of the 2010 census, the population of Ponderosa was 1,000. The population is largely Hispanic, with a small percentage of Native Americans. The median household income is around $30,000, and the median home value is around $150,000.
Conclusion
Ponderosa, New Mexico is a small unincorporated community located in the foothills of the Sangre de Cristo Mountains in Santa Fe County. The area has a rich history, and is home to a population of approximately 1,000 people. The economy of Ponderosa is largely based on agriculture and tourism, and the population is largely Hispanic, with a small percentage of Native Americans.
Common Questions
What is Per Capita Income in Ponderosa?
Per Capita income in Ponderosa is $28,384.
What is the Median Household income in Ponderosa?
Median Household Income in Ponderosa is $55,625.
What is Inequality or Gini Index in Ponderosa?
Inequality or Gini Index in Ponderosa is 0.31.
What is the Total Population of Ponderosa?
Total Population of Ponderosa is 160.
What is the Total Male Population of Ponderosa?
Total Male Population of Ponderosa is 90.
What is the Total Female Population of Ponderosa?
Total Female Population of Ponderosa is 70.
What is the Ratio of Males per 100 Females in Ponderosa?
There are 128.57 Males per 100 Females in Ponderosa.
What is the Ratio of Females per 100 Males in Ponderosa?
There are 77.78 Females per 100 Males in Ponderosa.
What is the Median Population Age in Ponderosa?
Median Population Age in Ponderosa is 61.8 Years.
What is the Average Family Size in Ponderosa
Average Family Size in Ponderosa is 2.0 People.
What is the Average Household Size in Ponderosa
Average Household Size in Ponderosa is 1.5 People.
How Large is the Labor Force in Ponderosa?
There are 67 People in the Labor Forcein in Ponderosa.
What is the Percentage of People in the Labor Force in Ponderosa?
41.9% of People are in the Labor Force in Ponderosa.