Franktown, CO Map & Demographics
Franktown Map
Franktown Overview
$104,457
PER CAPITA INCOME
0.61
INEQUALITY / GINI INDEX
351
TOTAL POPULATION
171
MALE POPULATION
180
FEMALE POPULATION
95.00
MALES / 100 FEMALES
105.26
FEMALES / 100 MALES
44.7
MEDIAN AGE
3.2
AVG FAMILY SIZE
3.2
AVG HOUSEHOLD SIZE
156
LABOR FORCE [ PEOPLE ]
64.2%
PERCENT IN LABOR FORCE
Franktown Zip Codes
Franktown Area Codes
Income in Franktown
Income Overview in Franktown
| Characteristic | Number | Measure |
| Per Capita Income | 351 | $104,457 |
| Median Family Income | 108 | $0 |
| Mean Family Income | 108 | $322,109 |
| Median Household Income | 108 | $0 |
| Mean Household Income | 108 | $322,109 |
| Income Deficit | 108 | $0 |
| Wage / Income Gap (%) | 351 | 0.00% |
| Wage / Income Gap ($) | 351 | 100.00¢ per $1 |
| Gini / Inequality Index | 351 | 0.61 |
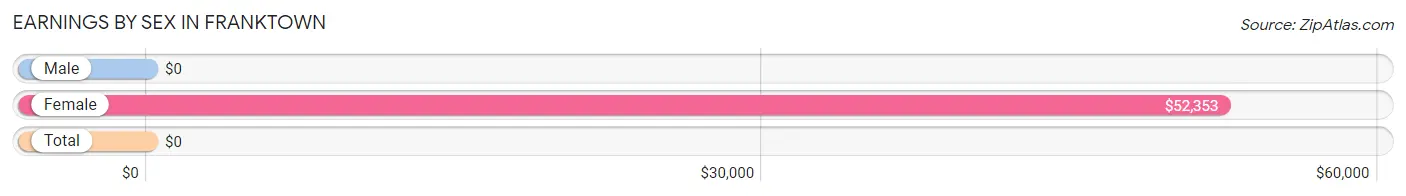
Earnings by Sex in Franktown
| Sex | Number | Average Earnings |
| Male | 70 (44.9%) | $0 |
| Female | 86 (55.1%) | $52,353 |
| Total | 156 (100.0%) | $0 |
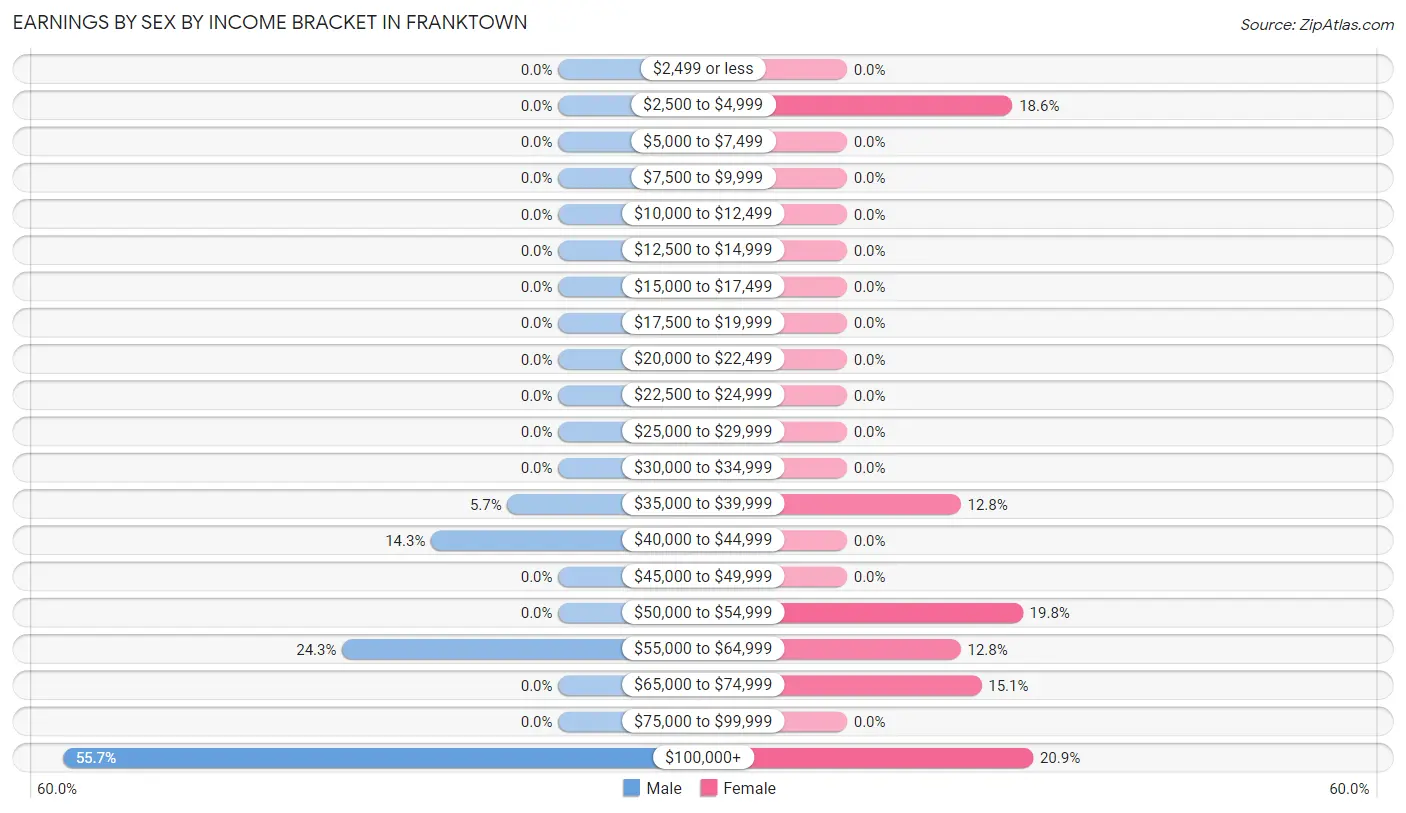
Earnings by Sex by Income Bracket in Franktown
The most common earnings brackets in Franktown are $100,000+ for men (39 | 55.7%) and $100,000+ for women (18 | 20.9%).
| Income | Male | Female |
| $2,499 or less | 0 (0.0%) | 0 (0.0%) |
| $2,500 to $4,999 | 0 (0.0%) | 16 (18.6%) |
| $5,000 to $7,499 | 0 (0.0%) | 0 (0.0%) |
| $7,500 to $9,999 | 0 (0.0%) | 0 (0.0%) |
| $10,000 to $12,499 | 0 (0.0%) | 0 (0.0%) |
| $12,500 to $14,999 | 0 (0.0%) | 0 (0.0%) |
| $15,000 to $17,499 | 0 (0.0%) | 0 (0.0%) |
| $17,500 to $19,999 | 0 (0.0%) | 0 (0.0%) |
| $20,000 to $22,499 | 0 (0.0%) | 0 (0.0%) |
| $22,500 to $24,999 | 0 (0.0%) | 0 (0.0%) |
| $25,000 to $29,999 | 0 (0.0%) | 0 (0.0%) |
| $30,000 to $34,999 | 0 (0.0%) | 0 (0.0%) |
| $35,000 to $39,999 | 4 (5.7%) | 11 (12.8%) |
| $40,000 to $44,999 | 10 (14.3%) | 0 (0.0%) |
| $45,000 to $49,999 | 0 (0.0%) | 0 (0.0%) |
| $50,000 to $54,999 | 0 (0.0%) | 17 (19.8%) |
| $55,000 to $64,999 | 17 (24.3%) | 11 (12.8%) |
| $65,000 to $74,999 | 0 (0.0%) | 13 (15.1%) |
| $75,000 to $99,999 | 0 (0.0%) | 0 (0.0%) |
| $100,000+ | 39 (55.7%) | 18 (20.9%) |
| Total | 70 (100.0%) | 86 (100.0%) |
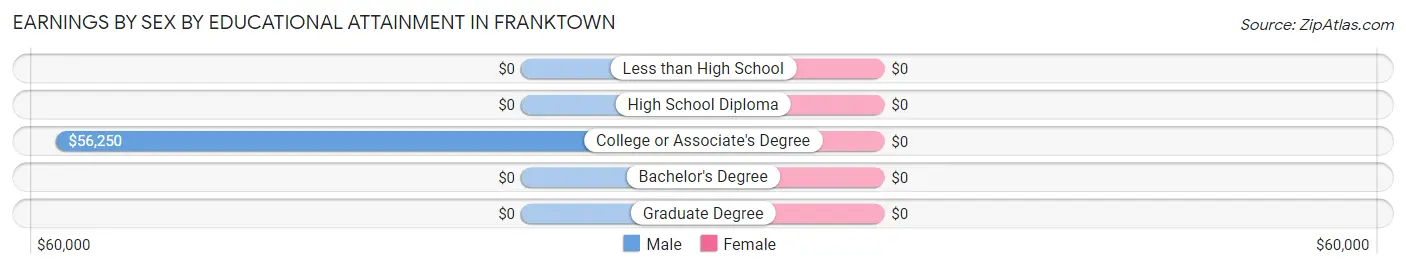
Earnings by Sex by Educational Attainment in Franktown
| Educational Attainment | Male Income | Female Income |
| Less than High School | - | - |
| High School Diploma | - | - |
| College or Associate's Degree | $56,250 | $0 |
| Bachelor's Degree | - | - |
| Graduate Degree | - | - |
| Total | - | - |
Family Income in Franktown
Family Income Brackets in Franktown
According to the Franktown family income data, there are 38 families falling into the $200,000+ income range, which is the most common income bracket and makes up 35.2% of all families.
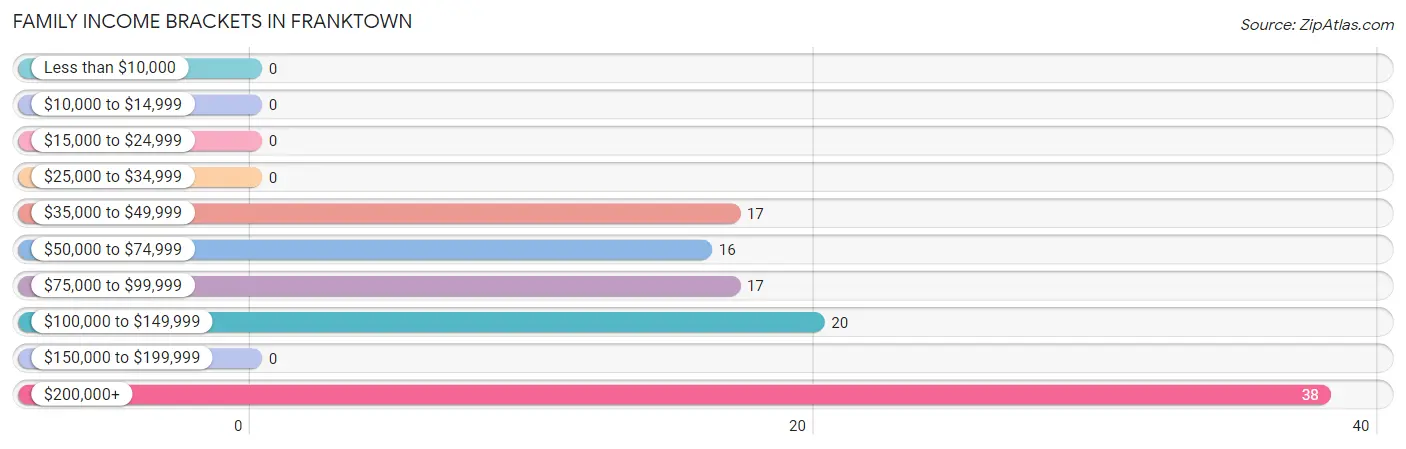
| Income Bracket | # Families | % Families |
| Less than $10,000 | 0 | 0.0% |
| $10,000 to $14,999 | 0 | 0.0% |
| $15,000 to $24,999 | 0 | 0.0% |
| $25,000 to $34,999 | 0 | 0.0% |
| $35,000 to $49,999 | 17 | 15.7% |
| $50,000 to $74,999 | 16 | 14.8% |
| $75,000 to $99,999 | 17 | 15.7% |
| $100,000 to $149,999 | 20 | 18.5% |
| $150,000 to $199,999 | 0 | 0.0% |
| $200,000+ | 38 | 35.2% |
Family Income by Famaliy Size in Franktown
2-person families (51 | 47.2%) account for the highest median family income in Franktown with $88,750 per family, while 2-person families (51 | 47.2%) have the highest median income of $44,375 per family member.
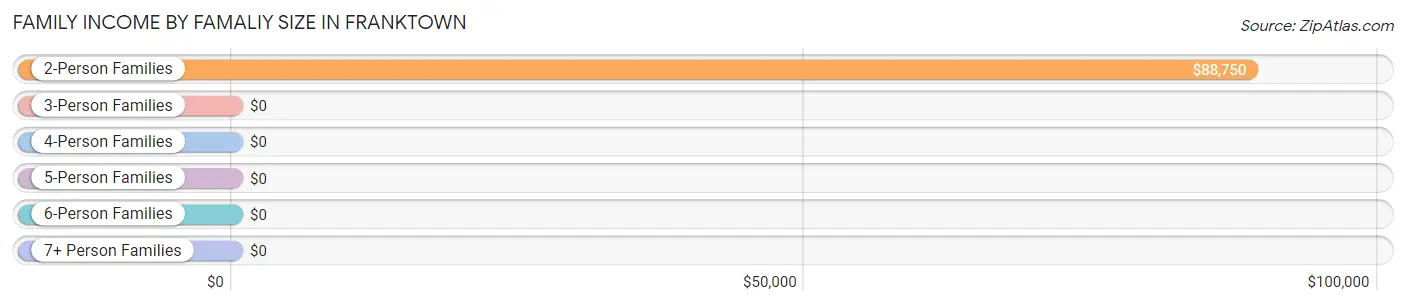
| Income Bracket | # Families | Median Income |
| 2-Person Families | 51 (47.2%) | $88,750 |
| 3-Person Families | 21 (19.4%) | $0 |
| 4-Person Families | 3 (2.8%) | $0 |
| 5-Person Families | 33 (30.6%) | $0 |
| 6-Person Families | 0 (0.0%) | $0 |
| 7+ Person Families | 0 (0.0%) | $0 |
| Total | 108 (100.0%) | $0 |
Family Income by Number of Earners in Franktown
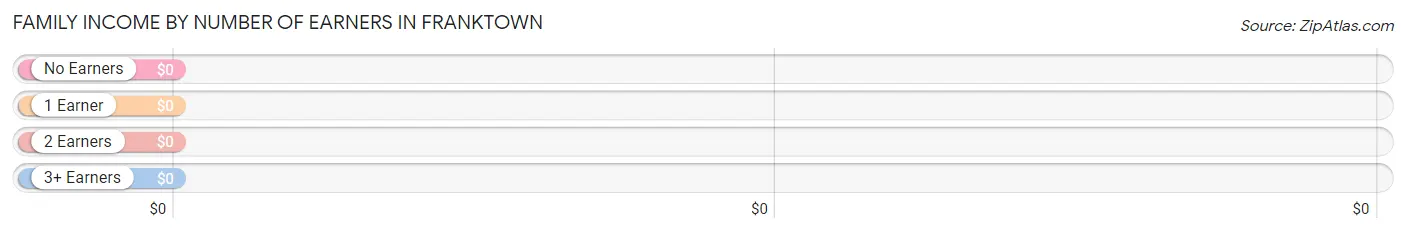
| Number of Earners | # Families | Median Income |
| No Earners | 34 (31.5%) | $0 |
| 1 Earner | 17 (15.7%) | $0 |
| 2 Earners | 36 (33.3%) | $0 |
| 3+ Earners | 21 (19.4%) | $0 |
| Total | 108 (100.0%) | $0 |
Household Income in Franktown
Household Income Brackets in Franktown
With 38 households falling in the category, the $200,000+ income range is the most frequent in Franktown, accounting for 35.2% of all households.
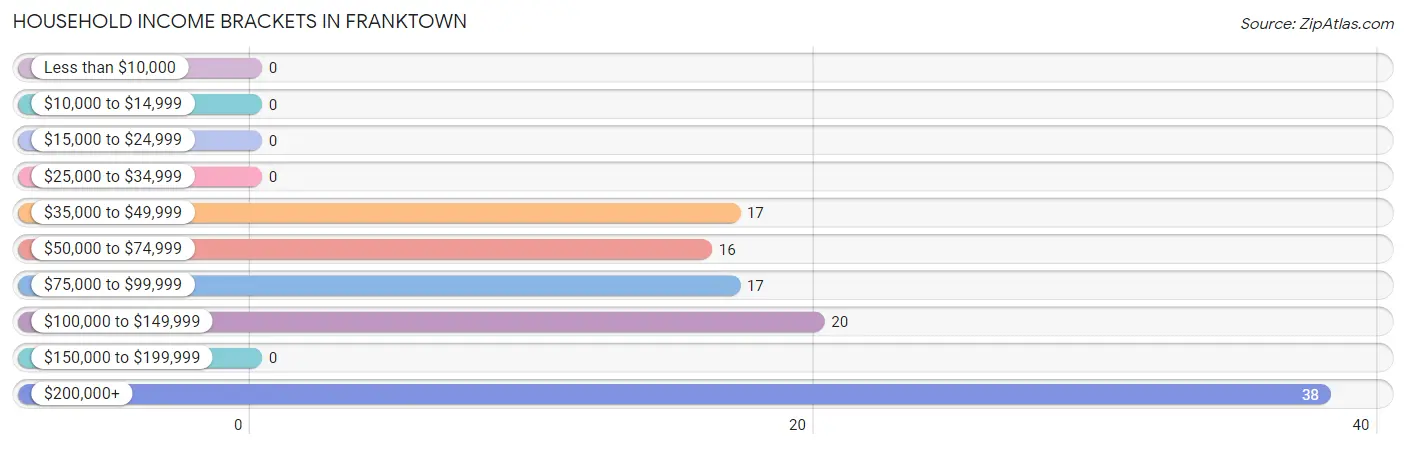
| Income Bracket | # Households | % Households |
| Less than $10,000 | 0 | 0.0% |
| $10,000 to $14,999 | 0 | 0.0% |
| $15,000 to $24,999 | 0 | 0.0% |
| $25,000 to $34,999 | 0 | 0.0% |
| $35,000 to $49,999 | 17 | 15.7% |
| $50,000 to $74,999 | 16 | 14.8% |
| $75,000 to $99,999 | 17 | 15.7% |
| $100,000 to $149,999 | 20 | 18.5% |
| $150,000 to $199,999 | 0 | 0.0% |
| $200,000+ | 38 | 35.2% |
Household Income by Householder Age in Franktown
The median household income in Franktown is $0, with the highest median household income of $250,001 found in the 45 to 64 years age bracket for the primary householder. A total of 38 households (35.2%) fall into this category.
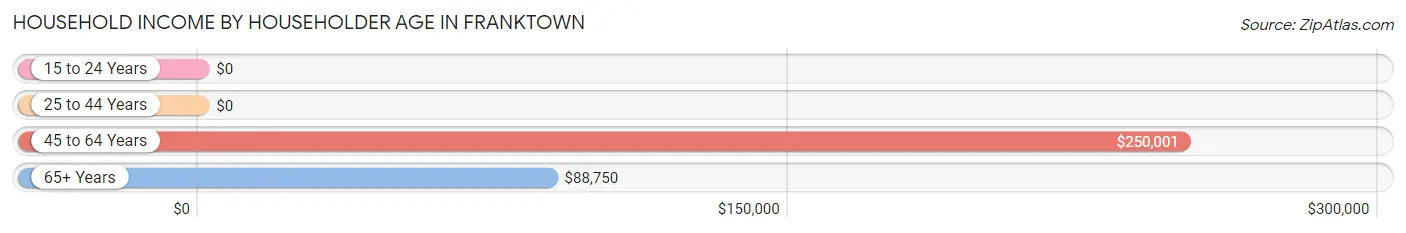
| Income Bracket | # Households | Median Income |
| 15 to 24 Years | 0 (0.0%) | $0 |
| 25 to 44 Years | 19 (17.6%) | $0 |
| 45 to 64 Years | 38 (35.2%) | $250,001 |
| 65+ Years | 51 (47.2%) | $88,750 |
| Total | 108 (100.0%) | $0 |
Poverty in Franktown
Income Below Poverty by Sex and Age in Franktown
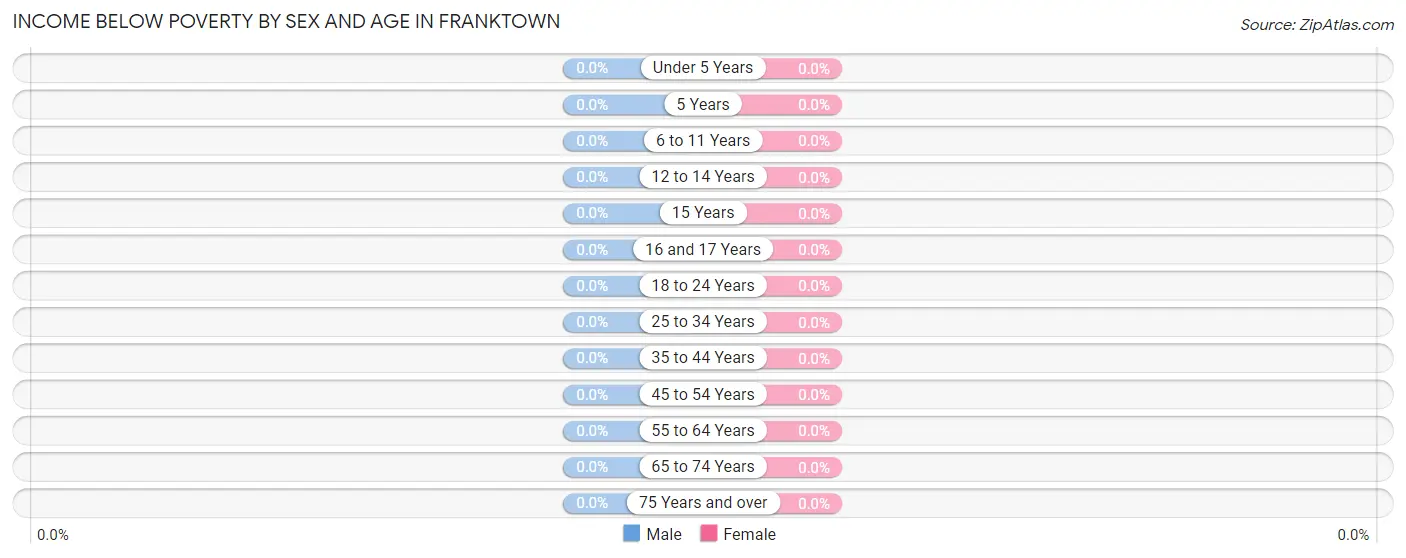
| Age Bracket | Male | Female |
| Under 5 Years | 0 (0.0%) | 0 (0.0%) |
| 5 Years | 0 (0.0%) | 0 (0.0%) |
| 6 to 11 Years | 0 (0.0%) | 0 (0.0%) |
| 12 to 14 Years | 0 (0.0%) | 0 (0.0%) |
| 15 Years | 0 (0.0%) | 0 (0.0%) |
| 16 and 17 Years | 0 (0.0%) | 0 (0.0%) |
| 18 to 24 Years | 0 (0.0%) | 0 (0.0%) |
| 25 to 34 Years | 0 (0.0%) | 0 (0.0%) |
| 35 to 44 Years | 0 (0.0%) | 0 (0.0%) |
| 45 to 54 Years | 0 (0.0%) | 0 (0.0%) |
| 55 to 64 Years | 0 (0.0%) | 0 (0.0%) |
| 65 to 74 Years | 0 (0.0%) | 0 (0.0%) |
| 75 Years and over | 0 (0.0%) | 0 (0.0%) |
| Total | 0 (0.0%) | 0 (0.0%) |
Income Above Poverty by Sex and Age in Franktown
According to the poverty statistics in Franktown, males aged 6 to 11 years and females aged under 5 years are the age groups that are most secure financially, with 100.0% of males and 100.0% of females in these age groups living above the poverty line.
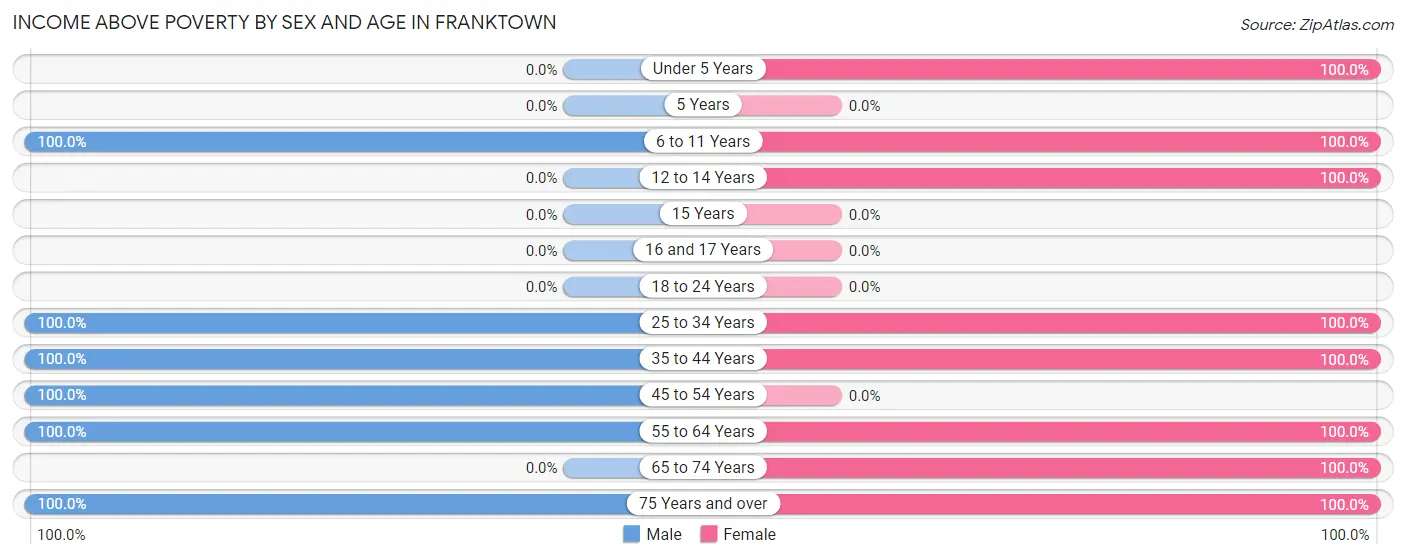
| Age Bracket | Male | Female |
| Under 5 Years | 0 (0.0%) | 8 (100.0%) |
| 5 Years | 0 (0.0%) | 0 (0.0%) |
| 6 to 11 Years | 49 (100.0%) | 34 (100.0%) |
| 12 to 14 Years | 0 (0.0%) | 17 (100.0%) |
| 15 Years | 0 (0.0%) | 0 (0.0%) |
| 16 and 17 Years | 0 (0.0%) | 0 (0.0%) |
| 18 to 24 Years | 0 (0.0%) | 0 (0.0%) |
| 25 to 34 Years | 10 (100.0%) | 11 (100.0%) |
| 35 to 44 Years | 21 (100.0%) | 37 (100.0%) |
| 45 to 54 Years | 17 (100.0%) | 0 (0.0%) |
| 55 to 64 Years | 22 (100.0%) | 21 (100.0%) |
| 65 to 74 Years | 0 (0.0%) | 34 (100.0%) |
| 75 Years and over | 52 (100.0%) | 18 (100.0%) |
| Total | 171 (100.0%) | 180 (100.0%) |
Income Below Poverty Among Married-Couple Families in Franktown
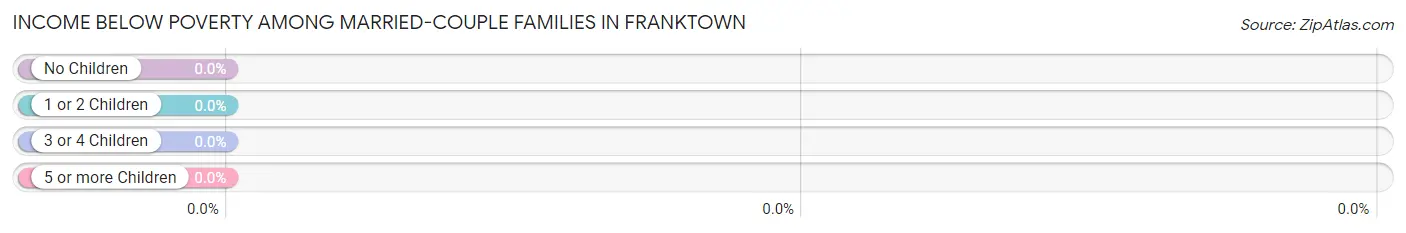
| Children | Above Poverty | Below Poverty |
| No Children | 72 (100.0%) | 0 (0.0%) |
| 1 or 2 Children | 3 (100.0%) | 0 (0.0%) |
| 3 or 4 Children | 33 (100.0%) | 0 (0.0%) |
| 5 or more Children | 0 (0.0%) | 0 (0.0%) |
| Total | 108 (100.0%) | 0 (0.0%) |
Income Below Poverty Among Single-Parent Households in Franktown
| Children | Single Father | Single Mother |
| No Children | 0 (0.0%) | 0 (0.0%) |
| 1 or 2 Children | 0 (0.0%) | 0 (0.0%) |
| 3 or 4 Children | 0 (0.0%) | 0 (0.0%) |
| 5 or more Children | 0 (0.0%) | 0 (0.0%) |
| Total | 0 (0.0%) | 0 (0.0%) |
Income Below Poverty Among Married-Couple vs Single-Parent Households in Franktown
| Children | Married-Couple Families | Single-Parent Households |
| No Children | 0 (0.0%) | 0 (0.0%) |
| 1 or 2 Children | 0 (0.0%) | 0 (0.0%) |
| 3 or 4 Children | 0 (0.0%) | 0 (0.0%) |
| 5 or more Children | 0 (0.0%) | 0 (0.0%) |
| Total | 0 (0.0%) | 0 (0.0%) |
Race in Franktown
The most populous races in Franktown are , and White / Caucasian (351 | 100.0%).
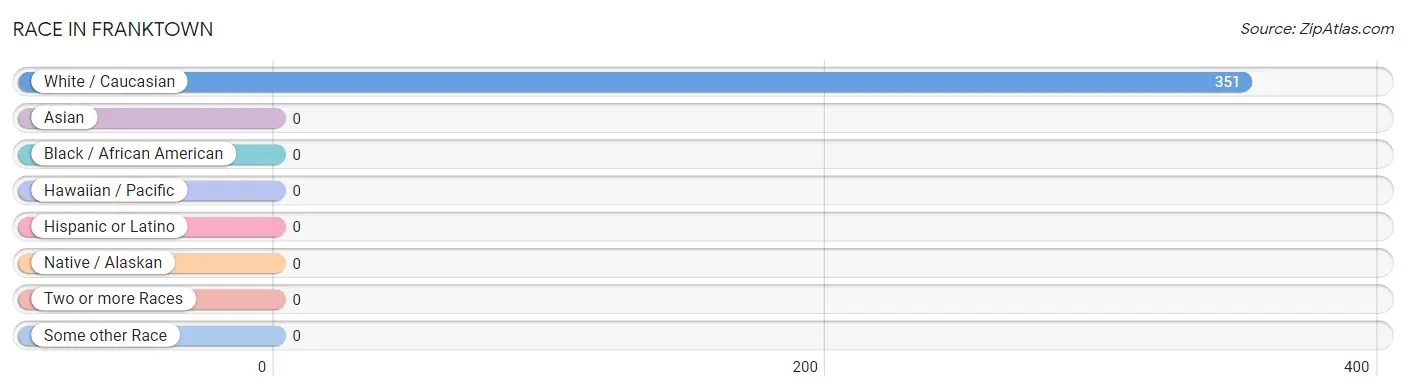
| Race | # Population | % Population |
| Asian | 0 | 0.0% |
| Black / African American | 0 | 0.0% |
| Hawaiian / Pacific | 0 | 0.0% |
| Hispanic or Latino | 0 | 0.0% |
| Native / Alaskan | 0 | 0.0% |
| White / Caucasian | 351 | 100.0% |
| Two or more Races | 0 | 0.0% |
| Some other Race | 0 | 0.0% |
| Total | 351 | 100.0% |
Ancestry in Franktown
The most populous ancestries reported in Franktown are Italian (157 | 44.7%), English (97 | 27.6%), French (85 | 24.2%), German (51 | 14.5%), and Scottish (30 | 8.6%), together accounting for 119.7% of all Franktown residents.
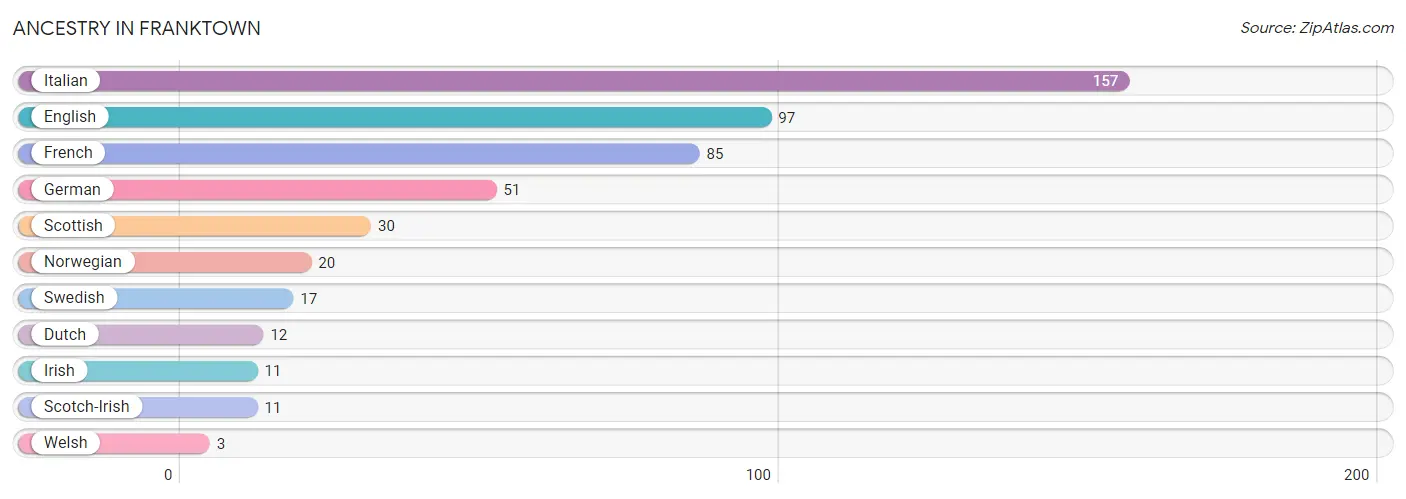
| Ancestry | # Population | % Population |
| Dutch | 12 | 3.4% |
| English | 97 | 27.6% |
| French | 85 | 24.2% |
| German | 51 | 14.5% |
| Irish | 11 | 3.1% |
| Italian | 157 | 44.7% |
| Norwegian | 20 | 5.7% |
| Scotch-Irish | 11 | 3.1% |
| Scottish | 30 | 8.6% |
| Swedish | 17 | 4.8% |
| Welsh | 3 | 0.9% | View All 11 Rows |
Immigrants in Franktown

| Immigration Origin | # Population | % Population | View All 0 Rows |
Sex and Age in Franktown
Sex and Age in Franktown
The most populous age groups in Franktown are 5 to 9 Years (49 | 28.6%) for men and 10 to 14 Years (51 | 28.3%) for women.
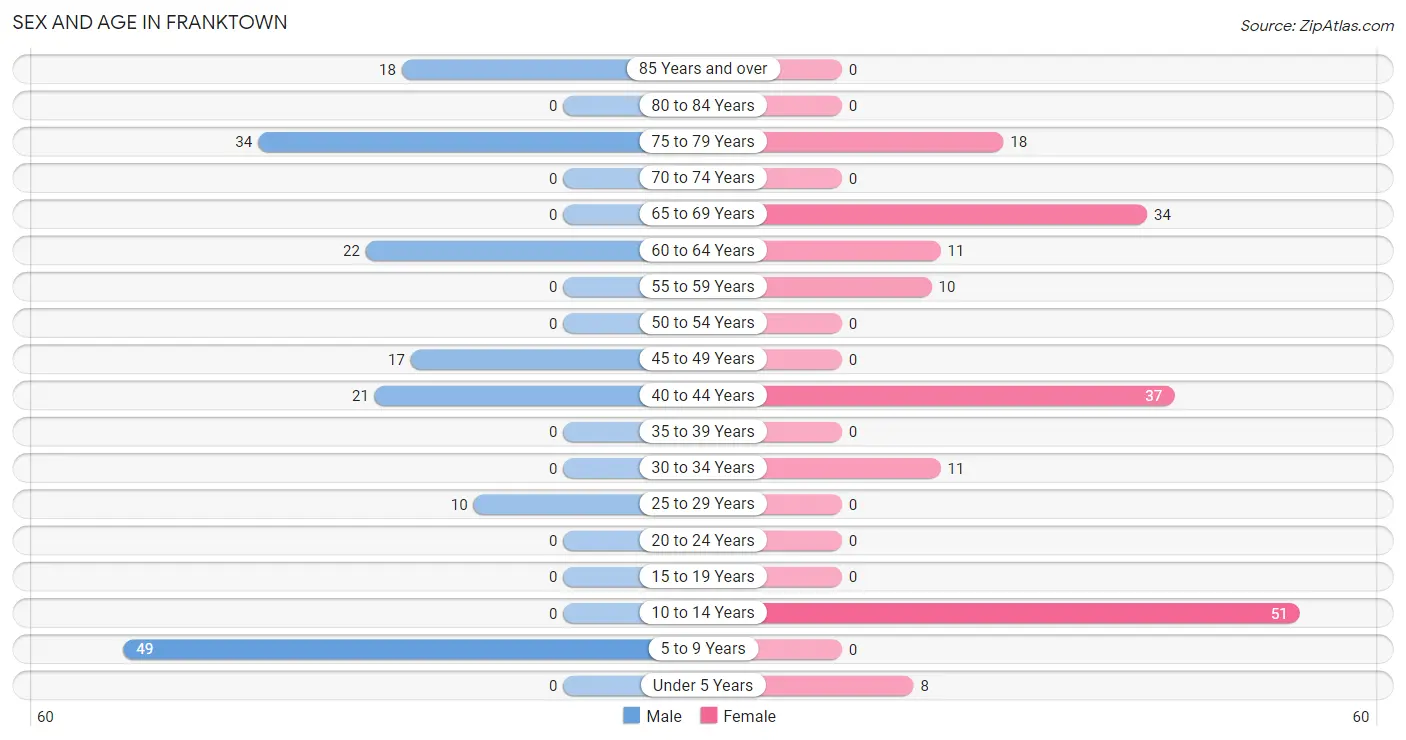
| Age Bracket | Male | Female |
| Under 5 Years | 0 (0.0%) | 8 (4.4%) |
| 5 to 9 Years | 49 (28.6%) | 0 (0.0%) |
| 10 to 14 Years | 0 (0.0%) | 51 (28.3%) |
| 15 to 19 Years | 0 (0.0%) | 0 (0.0%) |
| 20 to 24 Years | 0 (0.0%) | 0 (0.0%) |
| 25 to 29 Years | 10 (5.9%) | 0 (0.0%) |
| 30 to 34 Years | 0 (0.0%) | 11 (6.1%) |
| 35 to 39 Years | 0 (0.0%) | 0 (0.0%) |
| 40 to 44 Years | 21 (12.3%) | 37 (20.6%) |
| 45 to 49 Years | 17 (9.9%) | 0 (0.0%) |
| 50 to 54 Years | 0 (0.0%) | 0 (0.0%) |
| 55 to 59 Years | 0 (0.0%) | 10 (5.6%) |
| 60 to 64 Years | 22 (12.9%) | 11 (6.1%) |
| 65 to 69 Years | 0 (0.0%) | 34 (18.9%) |
| 70 to 74 Years | 0 (0.0%) | 0 (0.0%) |
| 75 to 79 Years | 34 (19.9%) | 18 (10.0%) |
| 80 to 84 Years | 0 (0.0%) | 0 (0.0%) |
| 85 Years and over | 18 (10.5%) | 0 (0.0%) |
| Total | 171 (100.0%) | 180 (100.0%) |
Families and Households in Franktown
Median Family Size in Franktown
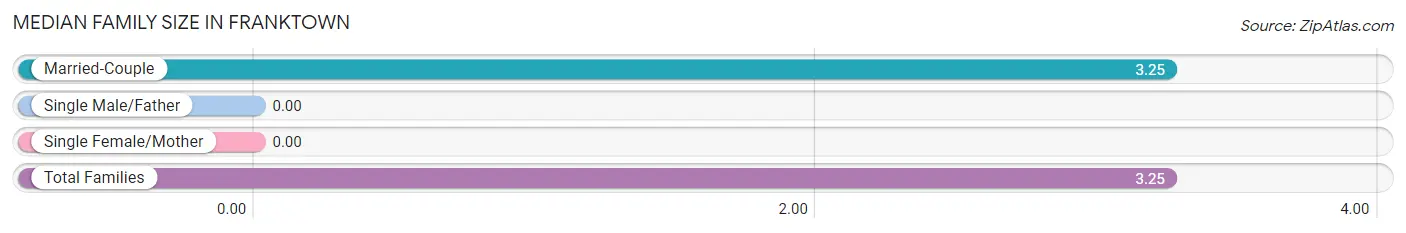
| Family Type | # Families | Family Size |
| Married-Couple | 108 (100.0%) | 3.25 |
| Single Male/Father | 0 (0.0%) | - |
| Single Female/Mother | 0 (0.0%) | - |
| Total Families | 108 (100.0%) | 3.25 |
Median Household Size in Franktown
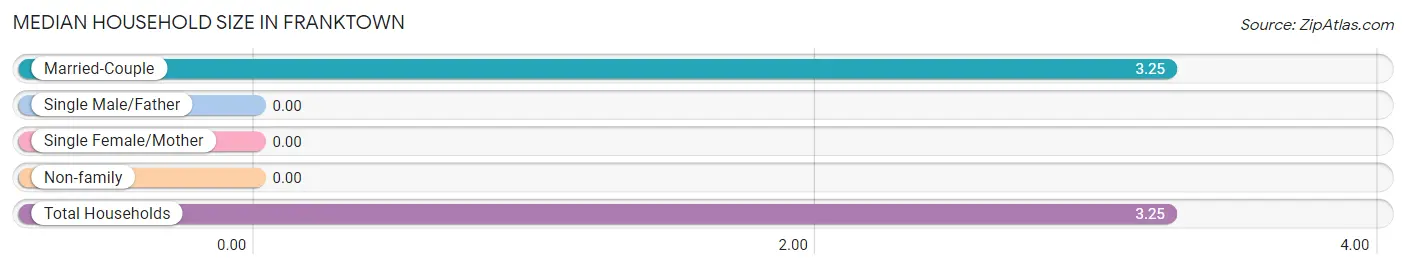
| Household Type | # Households | Household Size |
| Married-Couple | 108 (100.0%) | 3.25 |
| Single Male/Father | 0 (0.0%) | - |
| Single Female/Mother | 0 (0.0%) | - |
| Non-family | 0 (0.0%) | - |
| Total Households | 108 (100.0%) | 3.25 |
Household Size by Marriage Status in Franktown
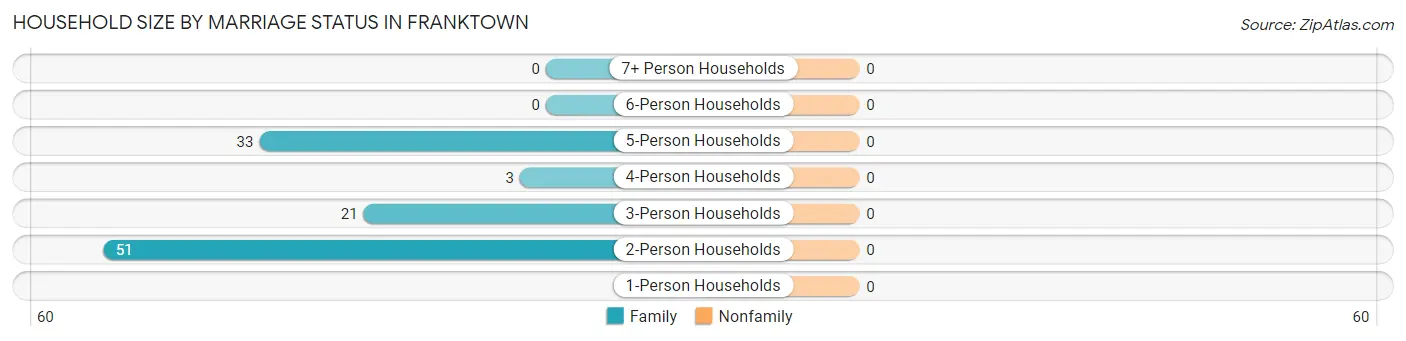
| Household Size | Family Households | Nonfamily Households |
| 1-Person Households | - | 0 (0.0%) |
| 2-Person Households | 51 (47.2%) | 0 (0.0%) |
| 3-Person Households | 21 (19.4%) | 0 (0.0%) |
| 4-Person Households | 3 (2.8%) | 0 (0.0%) |
| 5-Person Households | 33 (30.6%) | 0 (0.0%) |
| 6-Person Households | 0 (0.0%) | 0 (0.0%) |
| 7+ Person Households | 0 (0.0%) | 0 (0.0%) |
| Total | 108 (100.0%) | 0 (0.0%) |
Female Fertility in Franktown
Fertility by Age in Franktown
| Age Bracket | Women with Births | Births / 1,000 Women |
| 15 to 19 years | 0 (0.0%) | 0.0 |
| 20 to 34 years | 0 (0.0%) | 0.0 |
| 35 to 50 years | 0 (0.0%) | 0.0 |
| Total | 0 (0.0%) | 0.0 |
Fertility by Age by Marriage Status in Franktown
| Age Bracket | Married | Unmarried |
| 15 to 19 years | 0 (0.0%) | 0 (0.0%) |
| 20 to 34 years | 0 (0.0%) | 0 (0.0%) |
| 35 to 50 years | 0 (0.0%) | 0 (0.0%) |
| Total | 0 (0.0%) | 0 (0.0%) |
Fertility by Education in Franktown
| Educational Attainment | Women with Births | Births / 1,000 Women |
| Less than High School | 0 (0.0%) | 0.0 |
| High School Diploma | 0 (0.0%) | 0.0 |
| College or Associate's Degree | 0 (0.0%) | 0.0 |
| Bachelor's Degree | 0 (0.0%) | 0.0 |
| Graduate Degree | 0 (0.0%) | 0.0 |
| Total | 0 (0.0%) | 0.0 |
Fertility by Education by Marriage Status in Franktown
| Educational Attainment | Married | Unmarried |
| Less than High School | 0 (0.0%) | 0 (0.0%) |
| High School Diploma | 0 (0.0%) | 0 (0.0%) |
| College or Associate's Degree | 0 (0.0%) | 0 (0.0%) |
| Bachelor's Degree | 0 (0.0%) | 0 (0.0%) |
| Graduate Degree | 0 (0.0%) | 0 (0.0%) |
| Total | 0 (0.0%) | 0 (0.0%) |
Employment Characteristics in Franktown
Employment by Class of Employer in Franktown
Among the 156 employed individuals in Franktown, private company employees (113 | 72.4%), not-for-profit organizations (28 | 17.9%), and local government employees (11 | 7.0%) make up the most common classes of employment.
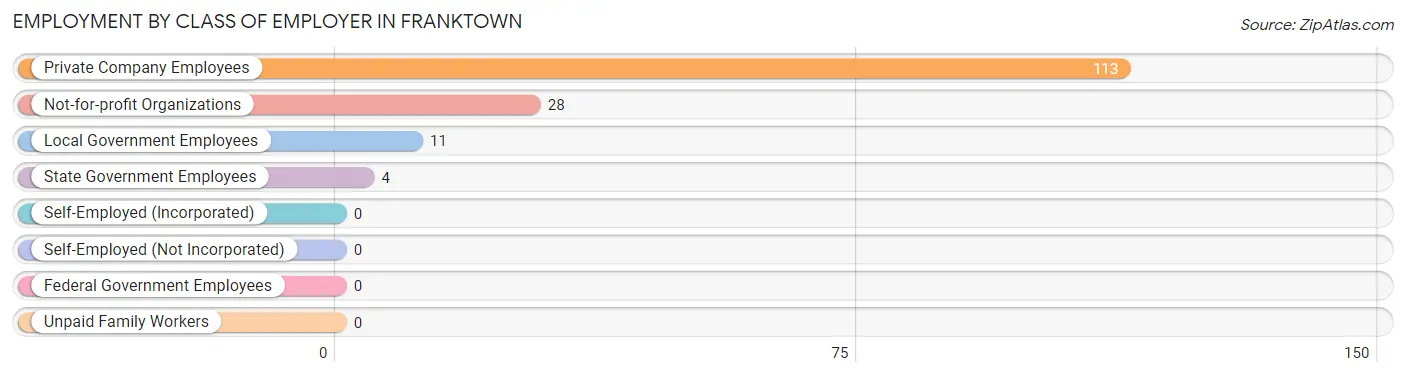
| Employer Class | # Employees | % Employees |
| Private Company Employees | 113 | 72.4% |
| Self-Employed (Incorporated) | 0 | 0.0% |
| Self-Employed (Not Incorporated) | 0 | 0.0% |
| Not-for-profit Organizations | 28 | 17.9% |
| Local Government Employees | 11 | 7.0% |
| State Government Employees | 4 | 2.6% |
| Federal Government Employees | 0 | 0.0% |
| Unpaid Family Workers | 0 | 0.0% |
| Total | 156 | 100.0% |
Employment Status by Age in Franktown
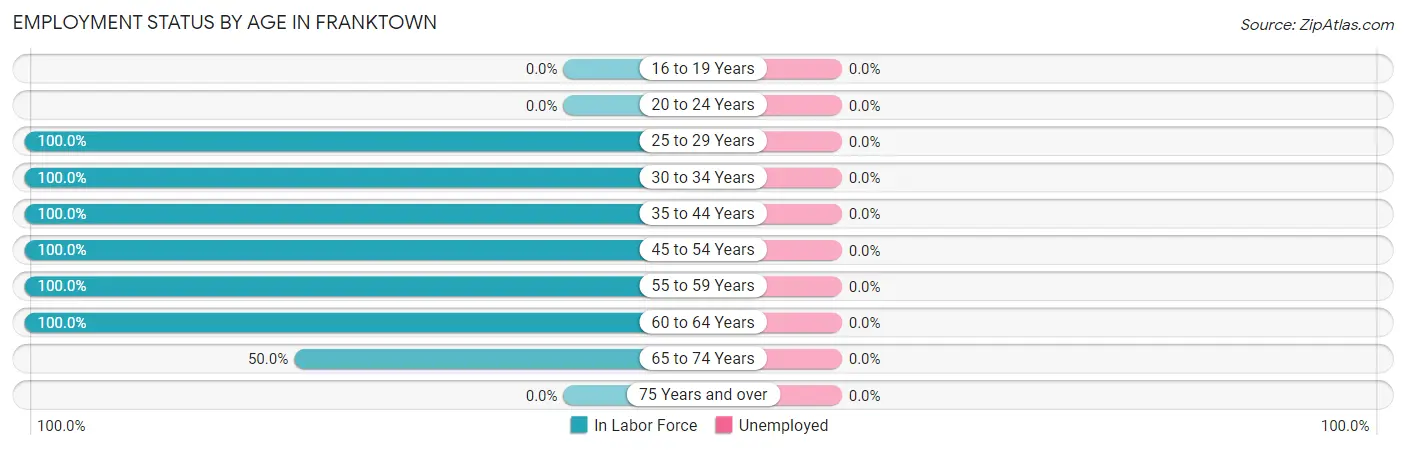
| Age Bracket | In Labor Force | Unemployed |
| 16 to 19 Years | 0 (0.0%) | 0 (0.0%) |
| 20 to 24 Years | 0 (0.0%) | 0 (0.0%) |
| 25 to 29 Years | 10 (100.0%) | 0 (0.0%) |
| 30 to 34 Years | 11 (100.0%) | 0 (0.0%) |
| 35 to 44 Years | 58 (100.0%) | 0 (0.0%) |
| 45 to 54 Years | 17 (100.0%) | 0 (0.0%) |
| 55 to 59 Years | 10 (100.0%) | 0 (0.0%) |
| 60 to 64 Years | 33 (100.0%) | 0 (0.0%) |
| 65 to 74 Years | 17 (50.0%) | 0 (0.0%) |
| 75 Years and over | 0 (0.0%) | 0 (0.0%) |
| Total | 156 (64.2%) | 0 (0.0%) |
Employment Status by Educational Attainment in Franktown
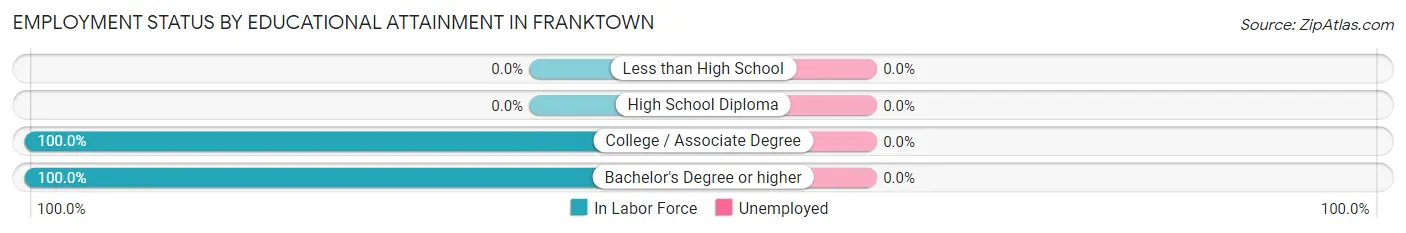
| Educational Attainment | In Labor Force | Unemployed |
| Less than High School | 0 (0.0%) | 0 (0.0%) |
| High School Diploma | 0 (0.0%) | 0 (0.0%) |
| College / Associate Degree | 63 (100.0%) | 0 (0.0%) |
| Bachelor's Degree or higher | 76 (100.0%) | 0 (0.0%) |
| Total | 139 (100.0%) | 0 (0.0%) |
Employment Occupations by Sex in Franktown
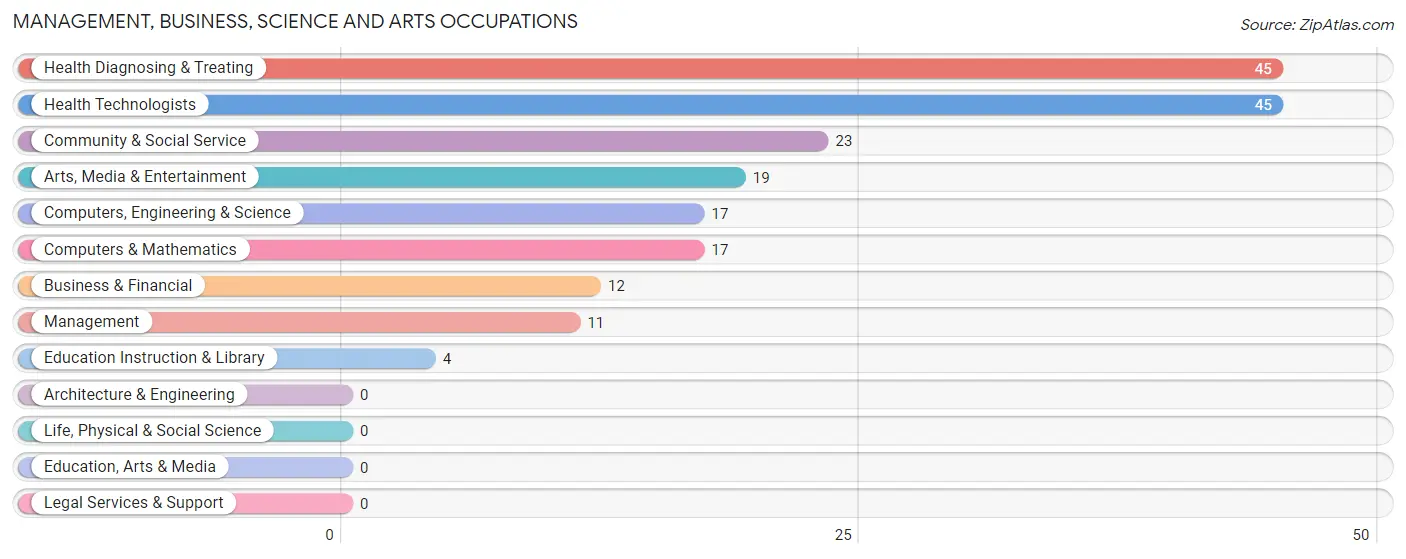
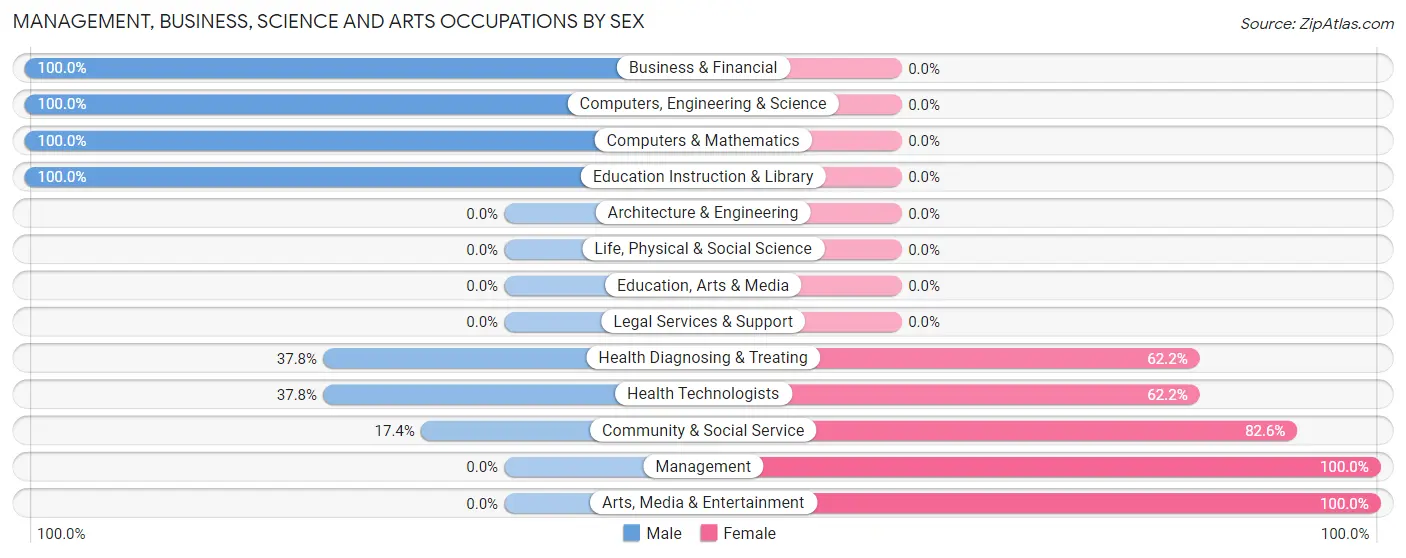
Management, Business, Science and Arts Occupations
The most common Management, Business, Science and Arts occupations in Franktown are Health Diagnosing & Treating (45 | 28.8%), Health Technologists (45 | 28.8%), Community & Social Service (23 | 14.7%), Arts, Media & Entertainment (19 | 12.2%), and Computers, Engineering & Science (17 | 10.9%).
Management, Business, Science and Arts Occupations by Sex
Within the Management, Business, Science and Arts occupations in Franktown, the most male-oriented occupations are Business & Financial (100.0%), Computers, Engineering & Science (100.0%), and Computers & Mathematics (100.0%), while the most female-oriented occupations are Management (100.0%), Arts, Media & Entertainment (100.0%), and Community & Social Service (82.6%).
| Occupation | Male | Female |
| Management | 0 (0.0%) | 11 (100.0%) |
| Business & Financial | 12 (100.0%) | 0 (0.0%) |
| Computers, Engineering & Science | 17 (100.0%) | 0 (0.0%) |
| Computers & Mathematics | 17 (100.0%) | 0 (0.0%) |
| Architecture & Engineering | 0 (0.0%) | 0 (0.0%) |
| Life, Physical & Social Science | 0 (0.0%) | 0 (0.0%) |
| Community & Social Service | 4 (17.4%) | 19 (82.6%) |
| Education, Arts & Media | 0 (0.0%) | 0 (0.0%) |
| Legal Services & Support | 0 (0.0%) | 0 (0.0%) |
| Education Instruction & Library | 4 (100.0%) | 0 (0.0%) |
| Arts, Media & Entertainment | 0 (0.0%) | 19 (100.0%) |
| Health Diagnosing & Treating | 17 (37.8%) | 28 (62.2%) |
| Health Technologists | 17 (37.8%) | 28 (62.2%) |
| Total (Category) | 50 (46.3%) | 58 (53.7%) |
| Total (Overall) | 70 (44.9%) | 86 (55.1%) |
Services Occupations
Services Occupations by Sex
| Occupation | Male | Female |
| Healthcare Support | 0 (0.0%) | 0 (0.0%) |
| Security & Protection | 0 (0.0%) | 0 (0.0%) |
| Firefighting & Prevention | 0 (0.0%) | 0 (0.0%) |
| Law Enforcement | 0 (0.0%) | 0 (0.0%) |
| Food Preparation & Serving | 0 (0.0%) | 0 (0.0%) |
| Cleaning & Maintenance | 0 (0.0%) | 0 (0.0%) |
| Personal Care & Service | 0 (0.0%) | 0 (0.0%) |
| Total (Category) | 0 (0.0%) | 0 (0.0%) |
| Total (Overall) | 70 (44.9%) | 86 (55.1%) |
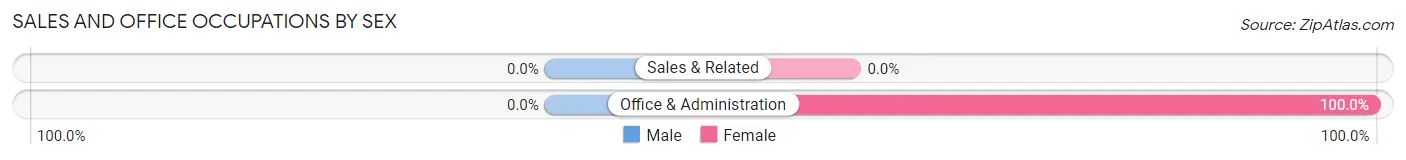
Sales and Office Occupations
The most common Sales and Office occupations in Franktown are , and Office & Administration (28 | 17.9%).
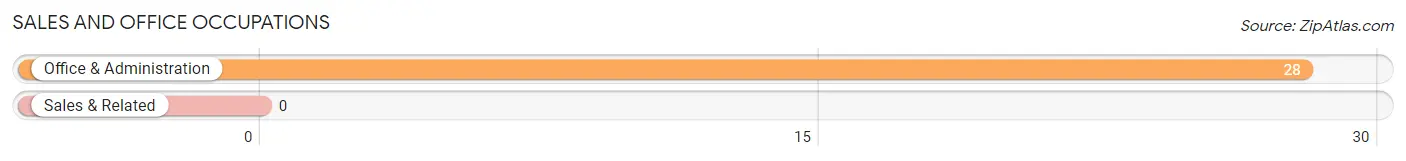
Sales and Office Occupations by Sex
| Occupation | Male | Female |
| Sales & Related | 0 (0.0%) | 0 (0.0%) |
| Office & Administration | 0 (0.0%) | 28 (100.0%) |
| Total (Category) | 0 (0.0%) | 28 (100.0%) |
| Total (Overall) | 70 (44.9%) | 86 (55.1%) |
Natural Resources, Construction and Maintenance Occupations
The most common Natural Resources, Construction and Maintenance occupations in Franktown are , and Installation, Maintenance & Repair (10 | 6.4%).
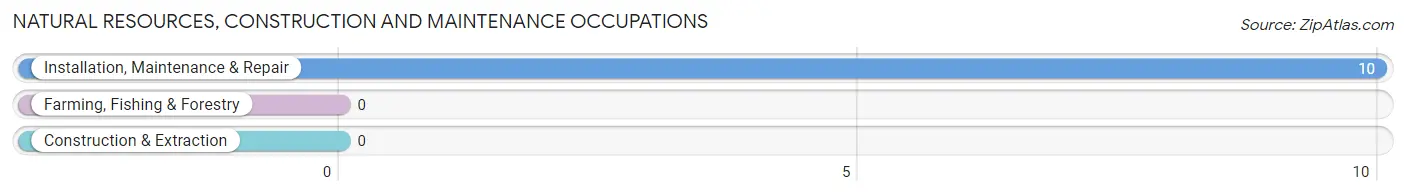
Natural Resources, Construction and Maintenance Occupations by Sex
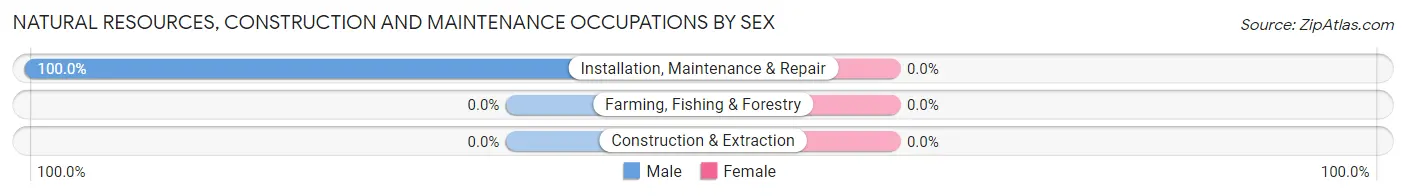
| Occupation | Male | Female |
| Farming, Fishing & Forestry | 0 (0.0%) | 0 (0.0%) |
| Construction & Extraction | 0 (0.0%) | 0 (0.0%) |
| Installation, Maintenance & Repair | 10 (100.0%) | 0 (0.0%) |
| Total (Category) | 10 (100.0%) | 0 (0.0%) |
| Total (Overall) | 70 (44.9%) | 86 (55.1%) |
Production, Transportation and Moving Occupations
The most common Production, Transportation and Moving occupations in Franktown are , and Transportation (10 | 6.4%).
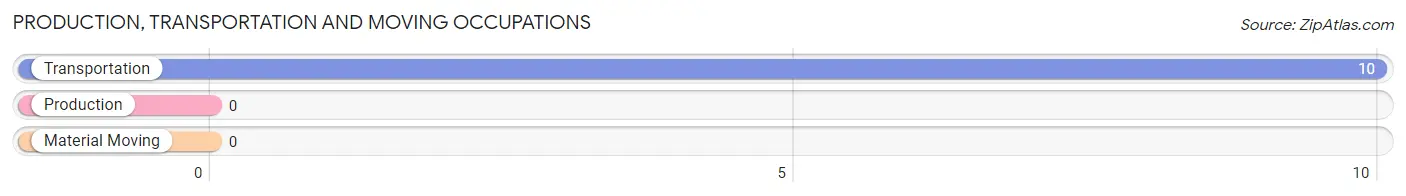
Production, Transportation and Moving Occupations by Sex
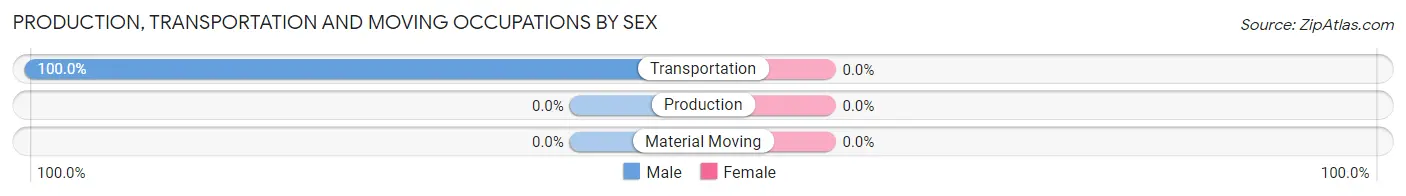
| Occupation | Male | Female |
| Production | 0 (0.0%) | 0 (0.0%) |
| Transportation | 10 (100.0%) | 0 (0.0%) |
| Material Moving | 0 (0.0%) | 0 (0.0%) |
| Total (Category) | 10 (100.0%) | 0 (0.0%) |
| Total (Overall) | 70 (44.9%) | 86 (55.1%) |
Employment Industries by Sex in Franktown
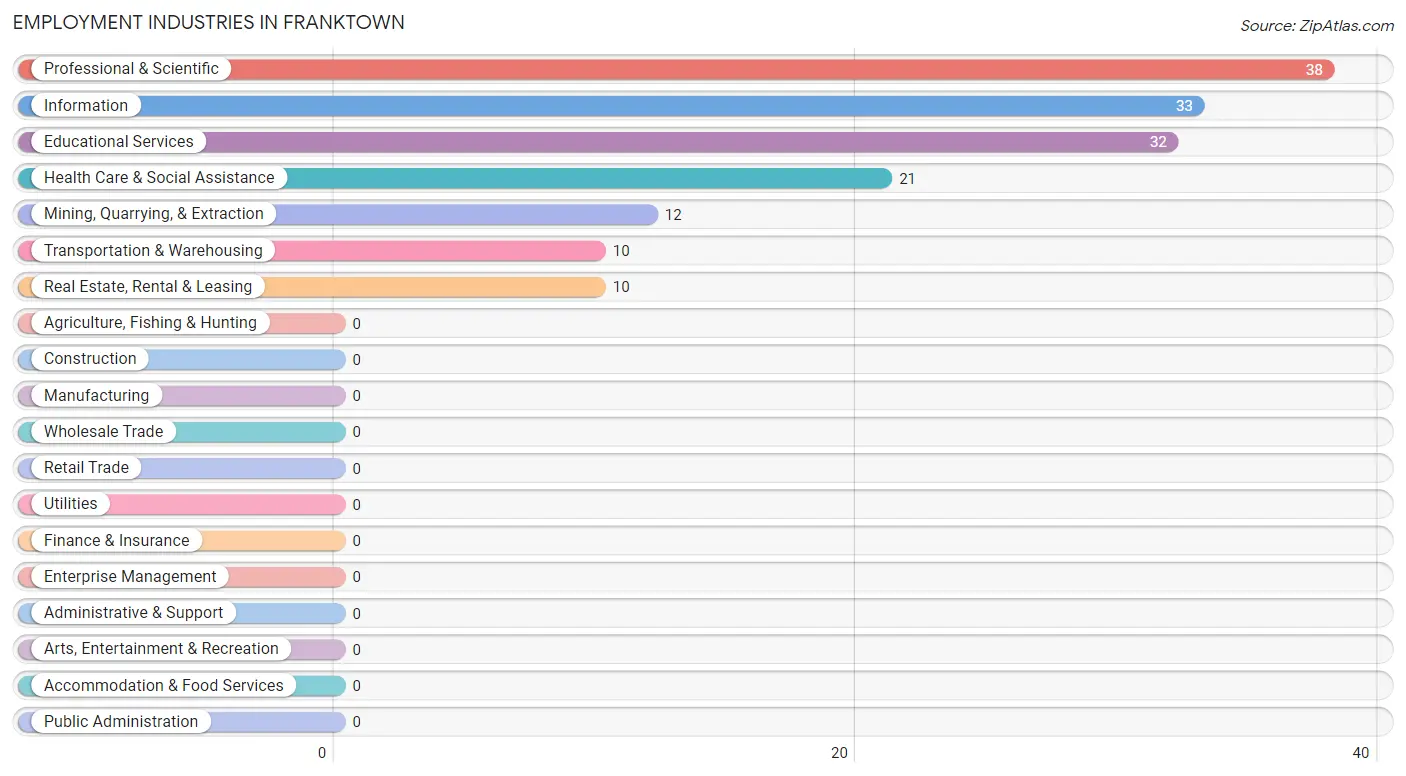
Employment Industries in Franktown
The major employment industries in Franktown include Professional & Scientific (38 | 24.4%), Information (33 | 21.1%), Educational Services (32 | 20.5%), Health Care & Social Assistance (21 | 13.5%), and Mining, Quarrying, & Extraction (12 | 7.7%).
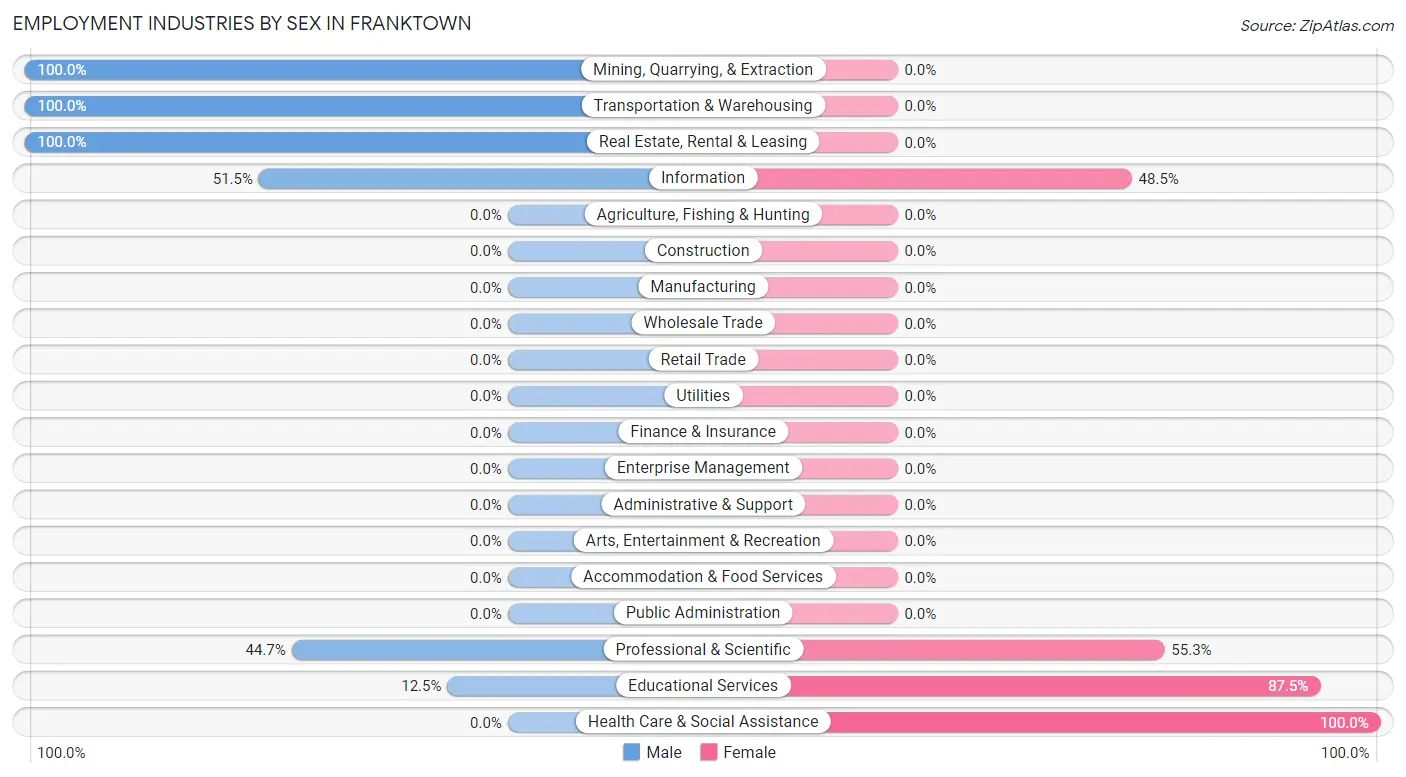
Employment Industries by Sex in Franktown
The Franktown industries that see more men than women are Mining, Quarrying, & Extraction (100.0%), Transportation & Warehousing (100.0%), and Real Estate, Rental & Leasing (100.0%), whereas the industries that tend to have a higher number of women are Health Care & Social Assistance (100.0%), Educational Services (87.5%), and Professional & Scientific (55.3%).
| Industry | Male | Female |
| Agriculture, Fishing & Hunting | 0 (0.0%) | 0 (0.0%) |
| Mining, Quarrying, & Extraction | 12 (100.0%) | 0 (0.0%) |
| Construction | 0 (0.0%) | 0 (0.0%) |
| Manufacturing | 0 (0.0%) | 0 (0.0%) |
| Wholesale Trade | 0 (0.0%) | 0 (0.0%) |
| Retail Trade | 0 (0.0%) | 0 (0.0%) |
| Transportation & Warehousing | 10 (100.0%) | 0 (0.0%) |
| Utilities | 0 (0.0%) | 0 (0.0%) |
| Information | 17 (51.5%) | 16 (48.5%) |
| Finance & Insurance | 0 (0.0%) | 0 (0.0%) |
| Real Estate, Rental & Leasing | 10 (100.0%) | 0 (0.0%) |
| Professional & Scientific | 17 (44.7%) | 21 (55.3%) |
| Enterprise Management | 0 (0.0%) | 0 (0.0%) |
| Administrative & Support | 0 (0.0%) | 0 (0.0%) |
| Educational Services | 4 (12.5%) | 28 (87.5%) |
| Health Care & Social Assistance | 0 (0.0%) | 21 (100.0%) |
| Arts, Entertainment & Recreation | 0 (0.0%) | 0 (0.0%) |
| Accommodation & Food Services | 0 (0.0%) | 0 (0.0%) |
| Public Administration | 0 (0.0%) | 0 (0.0%) |
| Total | 70 (44.9%) | 86 (55.1%) |
Education in Franktown
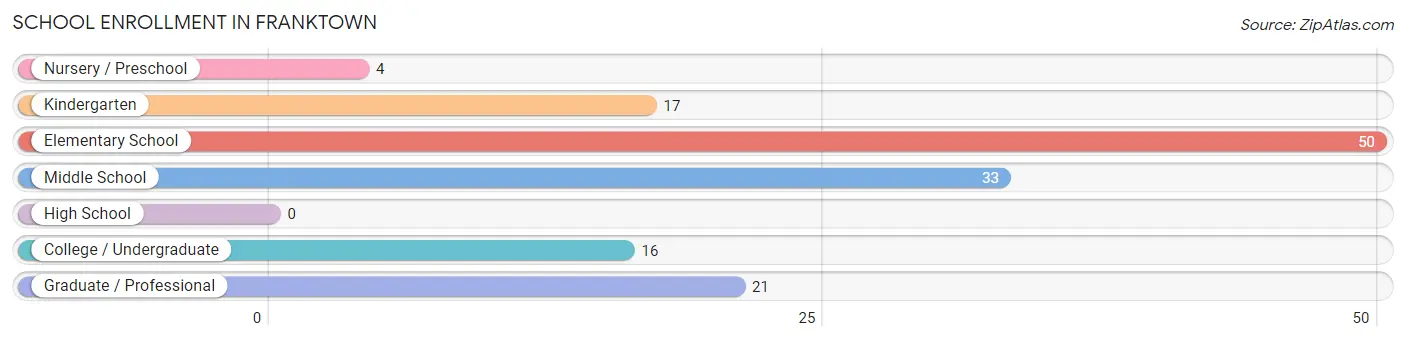
School Enrollment in Franktown
The most common levels of schooling among the 141 students in Franktown are elementary school (50 | 35.5%), middle school (33 | 23.4%), and graduate / professional (21 | 14.9%).
| School Level | # Students | % Students |
| Nursery / Preschool | 4 | 2.8% |
| Kindergarten | 17 | 12.1% |
| Elementary School | 50 | 35.5% |
| Middle School | 33 | 23.4% |
| High School | 0 | 0.0% |
| College / Undergraduate | 16 | 11.4% |
| Graduate / Professional | 21 | 14.9% |
| Total | 141 | 100.0% |
School Enrollment by Age by Funding Source in Franktown
Out of a total of 141 students who are enrolled in schools in Franktown, 37 (26.2%) attend a private institution, while the remaining 104 (73.8%) are enrolled in public schools. The age group of 3 to 4 year olds has the highest likelihood of being enrolled in private schools, with 4 (100.0% in the age bracket) enrolled. Conversely, the age group of 5 to 9 year old has the lowest likelihood of being enrolled in a private school, with 49 (100.0% in the age bracket) attending a public institution.
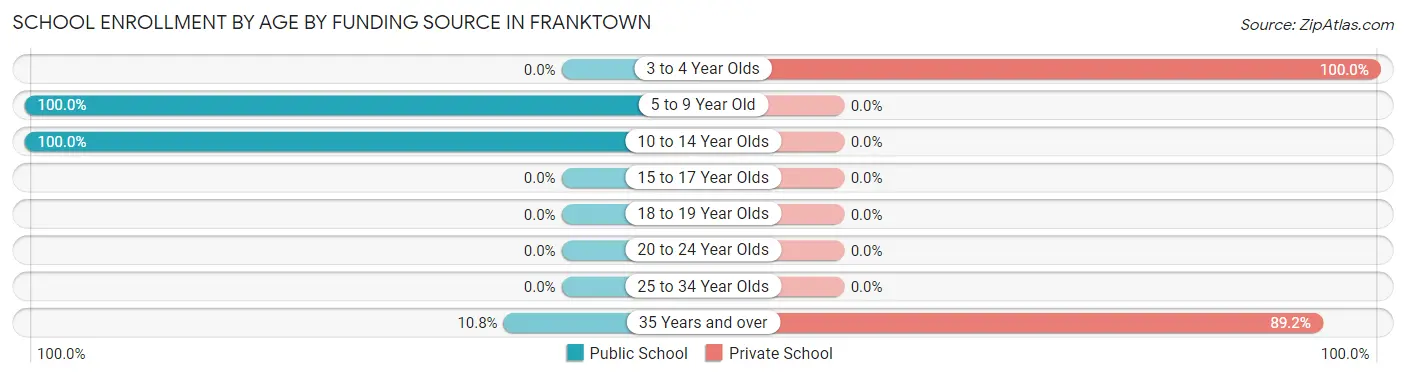
| Age Bracket | Public School | Private School |
| 3 to 4 Year Olds | 0 (0.0%) | 4 (100.0%) |
| 5 to 9 Year Old | 49 (100.0%) | 0 (0.0%) |
| 10 to 14 Year Olds | 51 (100.0%) | 0 (0.0%) |
| 15 to 17 Year Olds | 0 (0.0%) | 0 (0.0%) |
| 18 to 19 Year Olds | 0 (0.0%) | 0 (0.0%) |
| 20 to 24 Year Olds | 0 (0.0%) | 0 (0.0%) |
| 25 to 34 Year Olds | 0 (0.0%) | 0 (0.0%) |
| 35 Years and over | 4 (10.8%) | 33 (89.2%) |
| Total | 104 (73.8%) | 37 (26.2%) |
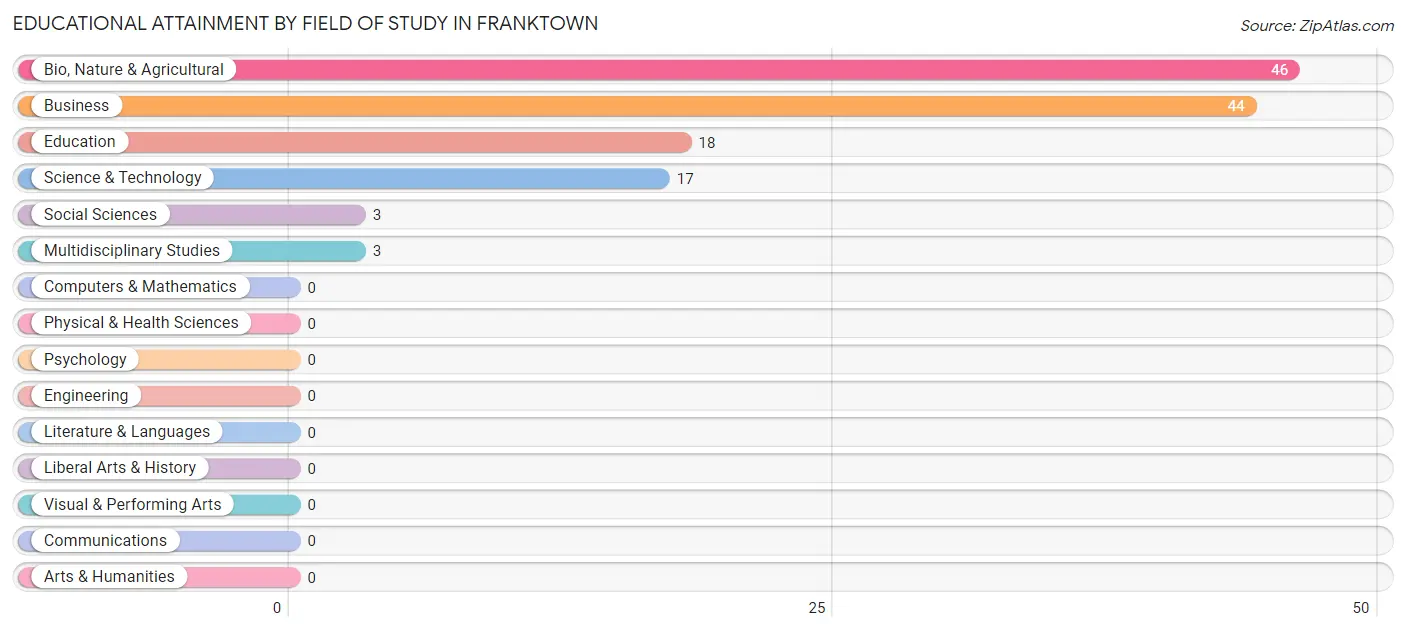
Educational Attainment by Field of Study in Franktown
Bio, nature & agricultural (46 | 35.1%), business (44 | 33.6%), education (18 | 13.7%), science & technology (17 | 13.0%), and social sciences (3 | 2.3%) are the most common fields of study among 131 individuals in Franktown who have obtained a bachelor's degree or higher.
| Field of Study | # Graduates | % Graduates |
| Computers & Mathematics | 0 | 0.0% |
| Bio, Nature & Agricultural | 46 | 35.1% |
| Physical & Health Sciences | 0 | 0.0% |
| Psychology | 0 | 0.0% |
| Social Sciences | 3 | 2.3% |
| Engineering | 0 | 0.0% |
| Multidisciplinary Studies | 3 | 2.3% |
| Science & Technology | 17 | 13.0% |
| Business | 44 | 33.6% |
| Education | 18 | 13.7% |
| Literature & Languages | 0 | 0.0% |
| Liberal Arts & History | 0 | 0.0% |
| Visual & Performing Arts | 0 | 0.0% |
| Communications | 0 | 0.0% |
| Arts & Humanities | 0 | 0.0% |
| Total | 131 | 100.0% |
Transportation & Commute in Franktown
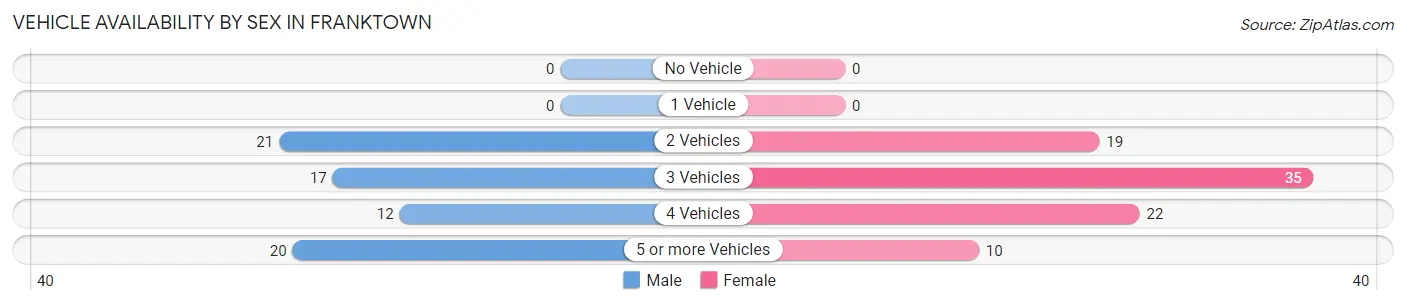
Vehicle Availability by Sex in Franktown
The most prevalent vehicle ownership categories in Franktown are males with 2 vehicles (21, accounting for 30.0%) and females with 2 vehicles (19, making up 24.4%).
| Vehicles Available | Male | Female |
| No Vehicle | 0 (0.0%) | 0 (0.0%) |
| 1 Vehicle | 0 (0.0%) | 0 (0.0%) |
| 2 Vehicles | 21 (30.0%) | 19 (22.1%) |
| 3 Vehicles | 17 (24.3%) | 35 (40.7%) |
| 4 Vehicles | 12 (17.1%) | 22 (25.6%) |
| 5 or more Vehicles | 20 (28.6%) | 10 (11.6%) |
| Total | 70 (100.0%) | 86 (100.0%) |
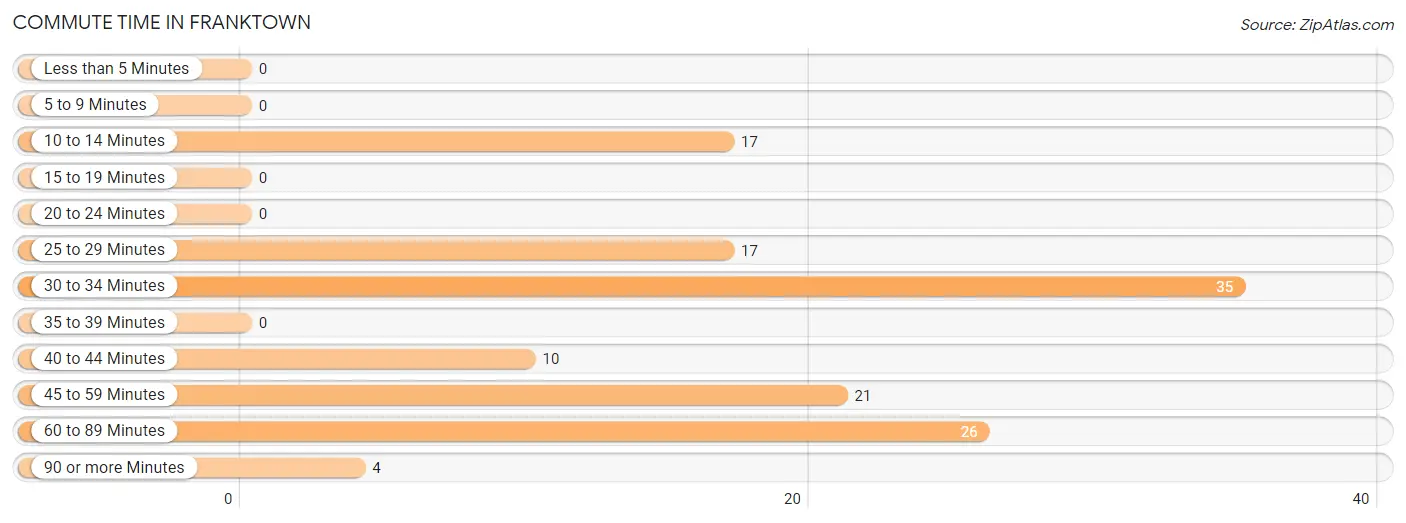
Commute Time in Franktown
The most frequently occuring commute durations in Franktown are 30 to 34 minutes (35 commuters, 26.9%), 60 to 89 minutes (26 commuters, 20.0%), and 45 to 59 minutes (21 commuters, 16.2%).
| Commute Time | # Commuters | % Commuters |
| Less than 5 Minutes | 0 | 0.0% |
| 5 to 9 Minutes | 0 | 0.0% |
| 10 to 14 Minutes | 17 | 13.1% |
| 15 to 19 Minutes | 0 | 0.0% |
| 20 to 24 Minutes | 0 | 0.0% |
| 25 to 29 Minutes | 17 | 13.1% |
| 30 to 34 Minutes | 35 | 26.9% |
| 35 to 39 Minutes | 0 | 0.0% |
| 40 to 44 Minutes | 10 | 7.7% |
| 45 to 59 Minutes | 21 | 16.2% |
| 60 to 89 Minutes | 26 | 20.0% |
| 90 or more Minutes | 4 | 3.1% |
Commute Time by Sex in Franktown
The most common commute times in Franktown are 10 to 14 minutes (17 commuters, 29.3%) for males and 30 to 34 minutes (35 commuters, 48.6%) for females.
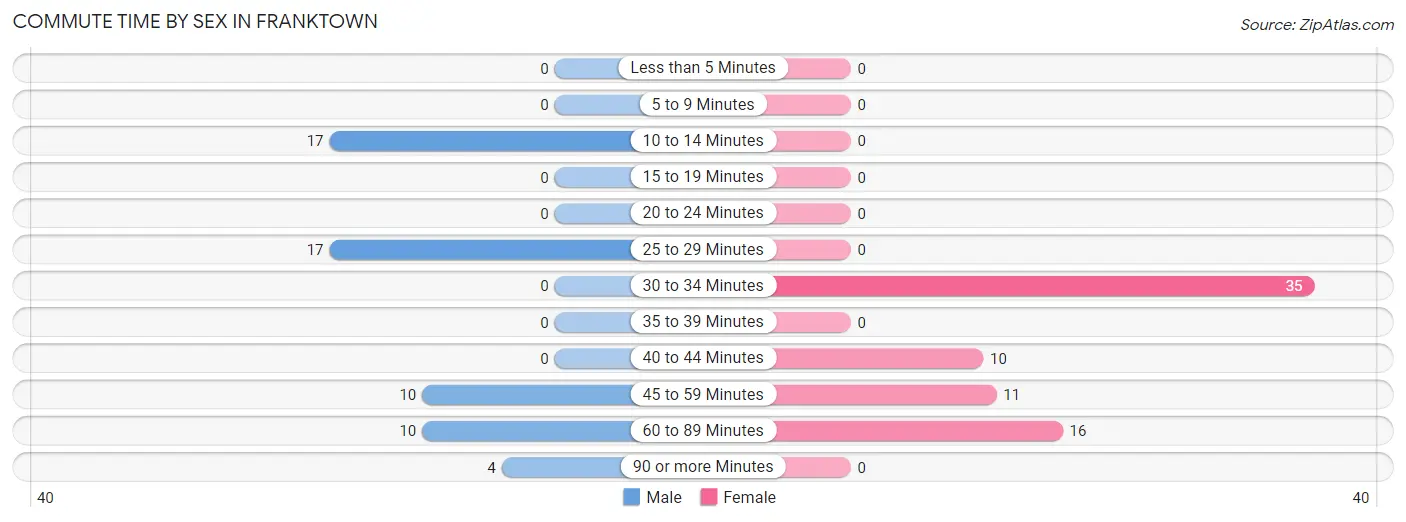
| Commute Time | Male | Female |
| Less than 5 Minutes | 0 (0.0%) | 0 (0.0%) |
| 5 to 9 Minutes | 0 (0.0%) | 0 (0.0%) |
| 10 to 14 Minutes | 17 (29.3%) | 0 (0.0%) |
| 15 to 19 Minutes | 0 (0.0%) | 0 (0.0%) |
| 20 to 24 Minutes | 0 (0.0%) | 0 (0.0%) |
| 25 to 29 Minutes | 17 (29.3%) | 0 (0.0%) |
| 30 to 34 Minutes | 0 (0.0%) | 35 (48.6%) |
| 35 to 39 Minutes | 0 (0.0%) | 0 (0.0%) |
| 40 to 44 Minutes | 0 (0.0%) | 10 (13.9%) |
| 45 to 59 Minutes | 10 (17.2%) | 11 (15.3%) |
| 60 to 89 Minutes | 10 (17.2%) | 16 (22.2%) |
| 90 or more Minutes | 4 (6.9%) | 0 (0.0%) |
Time of Departure to Work by Sex in Franktown
The most frequent times of departure to work in Franktown are 5:30 AM to 5:59 AM (27, 46.6%) for males and 7:30 AM to 7:59 AM (34, 47.2%) for females.
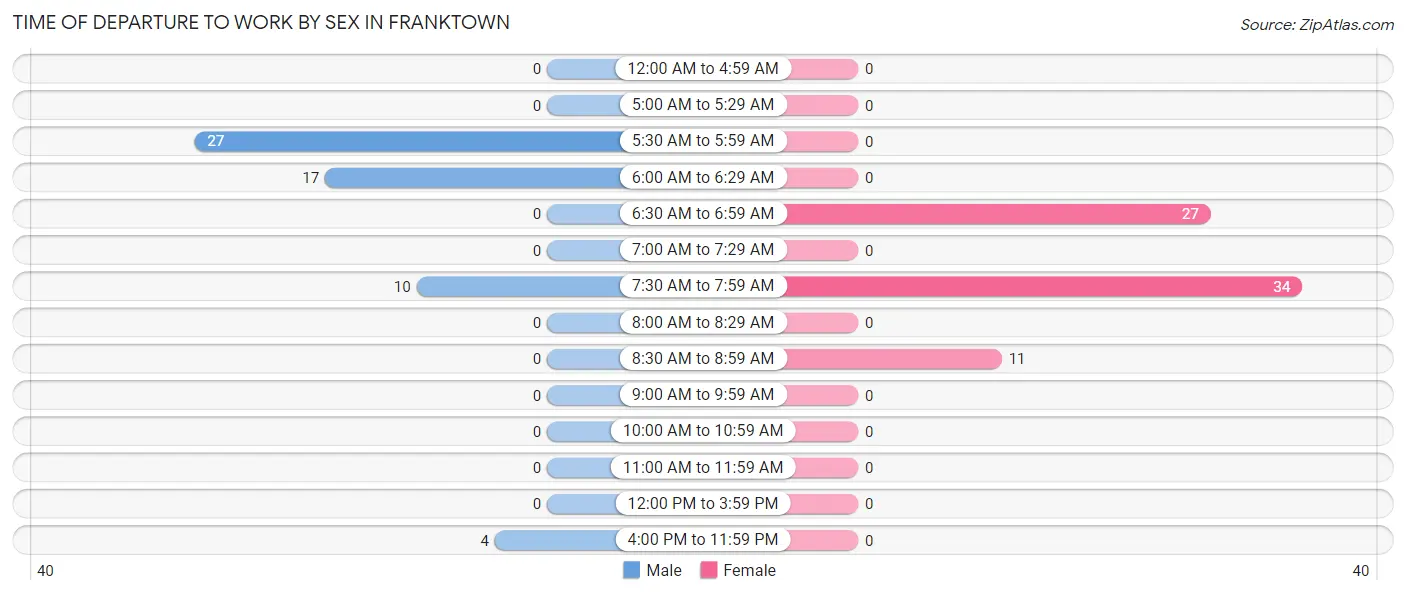
| Time of Departure | Male | Female |
| 12:00 AM to 4:59 AM | 0 (0.0%) | 0 (0.0%) |
| 5:00 AM to 5:29 AM | 0 (0.0%) | 0 (0.0%) |
| 5:30 AM to 5:59 AM | 27 (46.6%) | 0 (0.0%) |
| 6:00 AM to 6:29 AM | 17 (29.3%) | 0 (0.0%) |
| 6:30 AM to 6:59 AM | 0 (0.0%) | 27 (37.5%) |
| 7:00 AM to 7:29 AM | 0 (0.0%) | 0 (0.0%) |
| 7:30 AM to 7:59 AM | 10 (17.2%) | 34 (47.2%) |
| 8:00 AM to 8:29 AM | 0 (0.0%) | 0 (0.0%) |
| 8:30 AM to 8:59 AM | 0 (0.0%) | 11 (15.3%) |
| 9:00 AM to 9:59 AM | 0 (0.0%) | 0 (0.0%) |
| 10:00 AM to 10:59 AM | 0 (0.0%) | 0 (0.0%) |
| 11:00 AM to 11:59 AM | 0 (0.0%) | 0 (0.0%) |
| 12:00 PM to 3:59 PM | 0 (0.0%) | 0 (0.0%) |
| 4:00 PM to 11:59 PM | 4 (6.9%) | 0 (0.0%) |
| Total | 58 (100.0%) | 72 (100.0%) |
Housing Occupancy in Franktown
Occupancy by Ownership in Franktown
Of the total 108 dwellings in Franktown, owner-occupied units account for 108 (100.0%), while renter-occupied units make up 0 (0.0%).
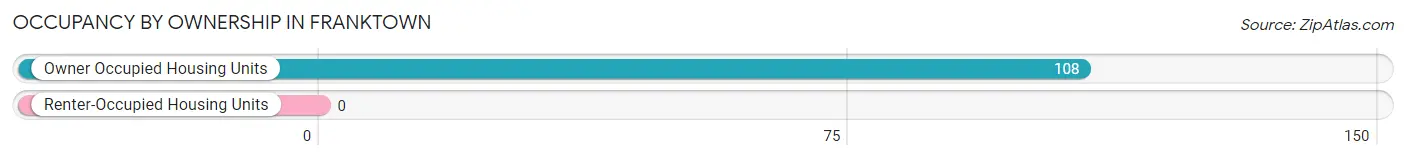
| Occupancy | # Housing Units | % Housing Units |
| Owner Occupied Housing Units | 108 | 100.0% |
| Renter-Occupied Housing Units | 0 | 0.0% |
| Total Occupied Housing Units | 108 | 100.0% |
Occupancy by Household Size in Franktown
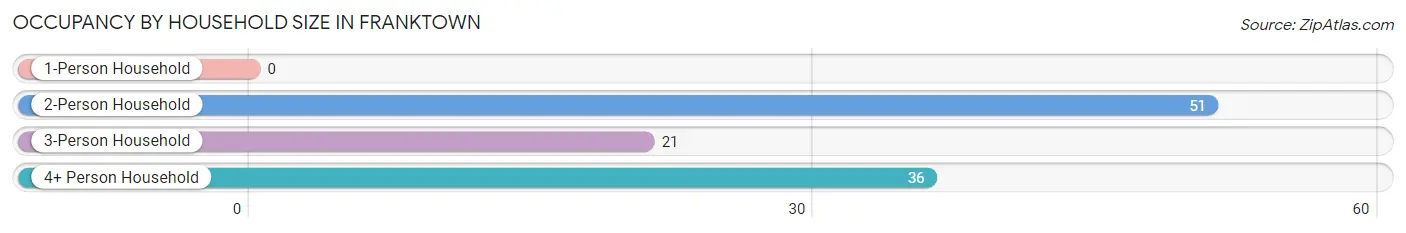
| Household Size | # Housing Units | % Housing Units |
| 1-Person Household | 0 | 0.0% |
| 2-Person Household | 51 | 47.2% |
| 3-Person Household | 21 | 19.4% |
| 4+ Person Household | 36 | 33.3% |
| Total Housing Units | 108 | 100.0% |
Occupancy by Ownership by Household Size in Franktown
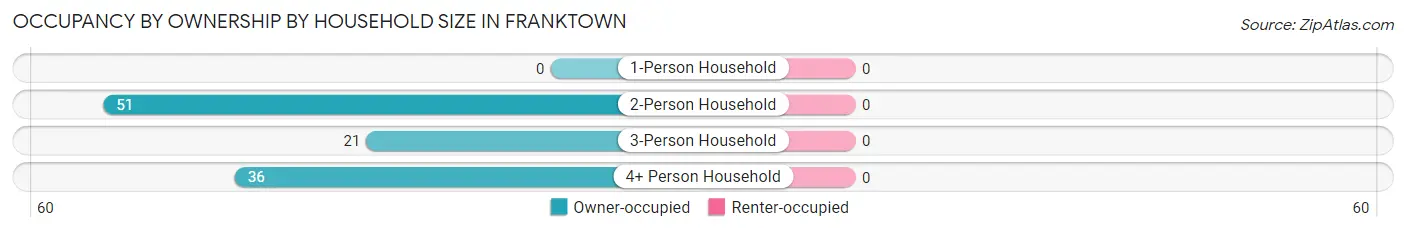
| Household Size | Owner-occupied | Renter-occupied |
| 1-Person Household | 0 (0.0%) | 0 (0.0%) |
| 2-Person Household | 51 (100.0%) | 0 (0.0%) |
| 3-Person Household | 21 (100.0%) | 0 (0.0%) |
| 4+ Person Household | 36 (100.0%) | 0 (0.0%) |
| Total Housing Units | 108 (100.0%) | 0 (0.0%) |
Occupancy by Educational Attainment in Franktown
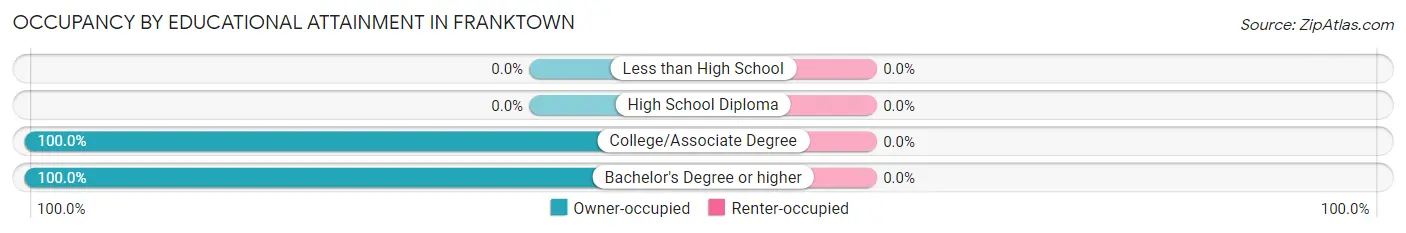
| Household Size | Owner-occupied | Renter-occupied |
| Less than High School | 0 (0.0%) | 0 (0.0%) |
| High School Diploma | 0 (0.0%) | 0 (0.0%) |
| College/Associate Degree | 60 (100.0%) | 0 (0.0%) |
| Bachelor's Degree or higher | 48 (100.0%) | 0 (0.0%) |
Occupancy by Age of Householder in Franktown
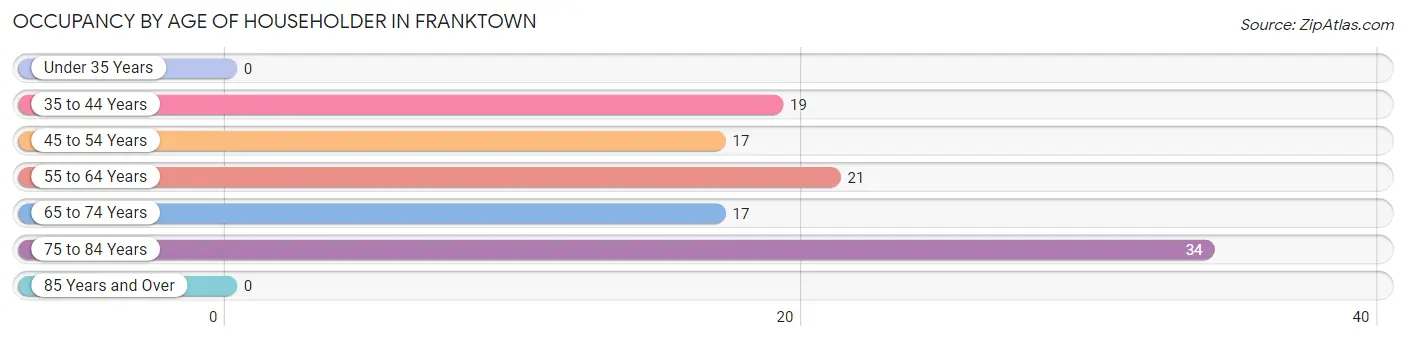
| Age Bracket | # Households | % Households |
| Under 35 Years | 0 | 0.0% |
| 35 to 44 Years | 19 | 17.6% |
| 45 to 54 Years | 17 | 15.7% |
| 55 to 64 Years | 21 | 19.4% |
| 65 to 74 Years | 17 | 15.7% |
| 75 to 84 Years | 34 | 31.5% |
| 85 Years and Over | 0 | 0.0% |
| Total | 108 | 100.0% |
Housing Finances in Franktown
Median Income by Occupancy in Franktown
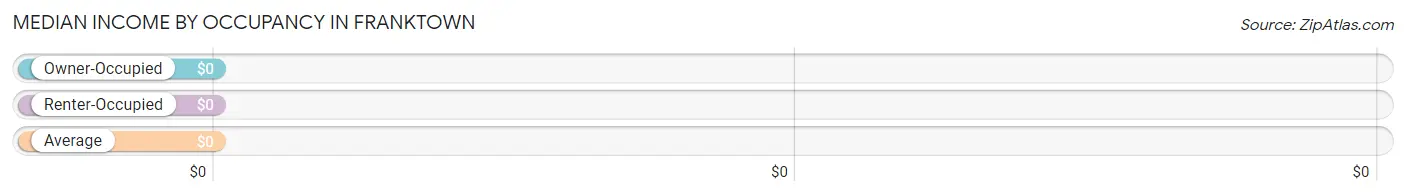
| Occupancy Type | # Households | Median Income |
| Owner-Occupied | 108 (100.0%) | $0 |
| Renter-Occupied | 0 (0.0%) | $0 |
| Average | 108 (100.0%) | $0 |
Occupancy by Householder Income Bracket in Franktown
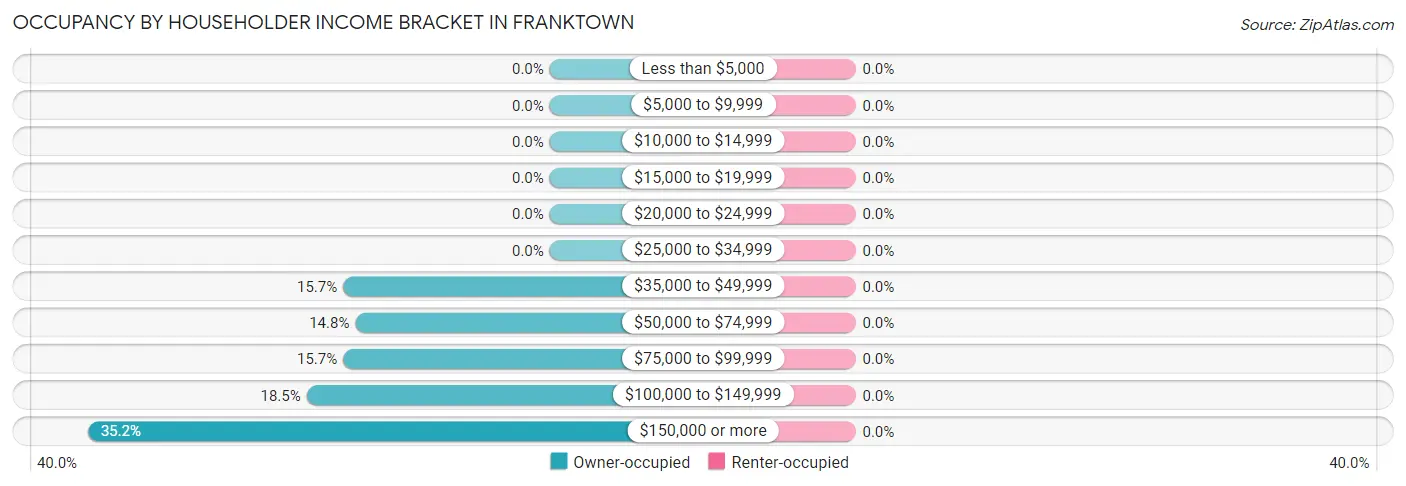
| Income Bracket | Owner-occupied | Renter-occupied |
| Less than $5,000 | 0 (0.0%) | 0 (0.0%) |
| $5,000 to $9,999 | 0 (0.0%) | 0 (0.0%) |
| $10,000 to $14,999 | 0 (0.0%) | 0 (0.0%) |
| $15,000 to $19,999 | 0 (0.0%) | 0 (0.0%) |
| $20,000 to $24,999 | 0 (0.0%) | 0 (0.0%) |
| $25,000 to $34,999 | 0 (0.0%) | 0 (0.0%) |
| $35,000 to $49,999 | 17 (15.7%) | 0 (0.0%) |
| $50,000 to $74,999 | 16 (14.8%) | 0 (0.0%) |
| $75,000 to $99,999 | 17 (15.7%) | 0 (0.0%) |
| $100,000 to $149,999 | 20 (18.5%) | 0 (0.0%) |
| $150,000 or more | 38 (35.2%) | 0 (0.0%) |
| Total | 108 (100.0%) | 0 (0.0%) |
Monthly Housing Cost Tiers in Franktown
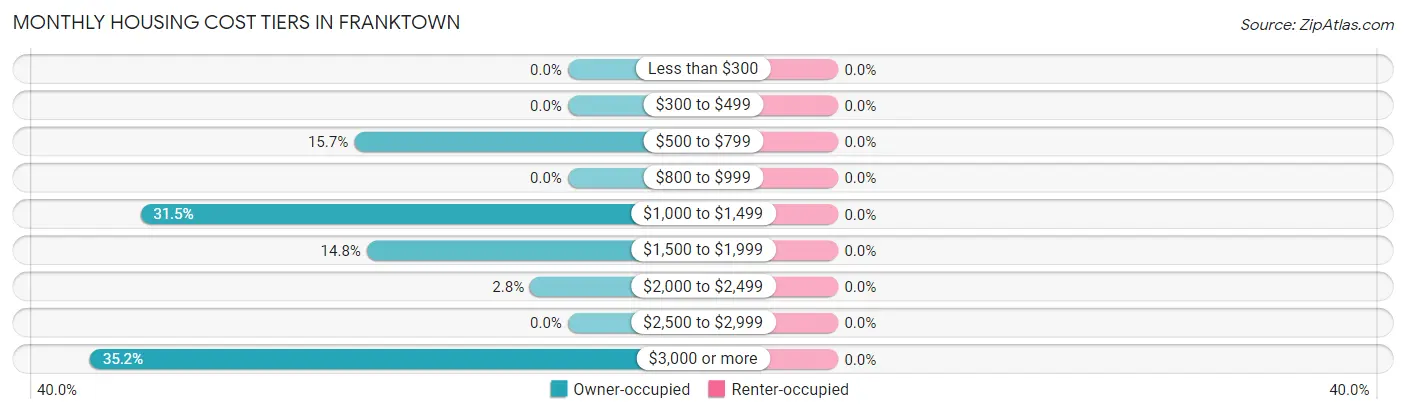
| Monthly Cost | Owner-occupied | Renter-occupied |
| Less than $300 | 0 (0.0%) | 0 (0.0%) |
| $300 to $499 | 0 (0.0%) | 0 (0.0%) |
| $500 to $799 | 17 (15.7%) | 0 (0.0%) |
| $800 to $999 | 0 (0.0%) | 0 (0.0%) |
| $1,000 to $1,499 | 34 (31.5%) | 0 (0.0%) |
| $1,500 to $1,999 | 16 (14.8%) | 0 (0.0%) |
| $2,000 to $2,499 | 3 (2.8%) | 0 (0.0%) |
| $2,500 to $2,999 | 0 (0.0%) | 0 (0.0%) |
| $3,000 or more | 38 (35.2%) | 0 (0.0%) |
| Total | 108 (100.0%) | 0 (0.0%) |
Physical Housing Characteristics in Franktown
Housing Structures in Franktown
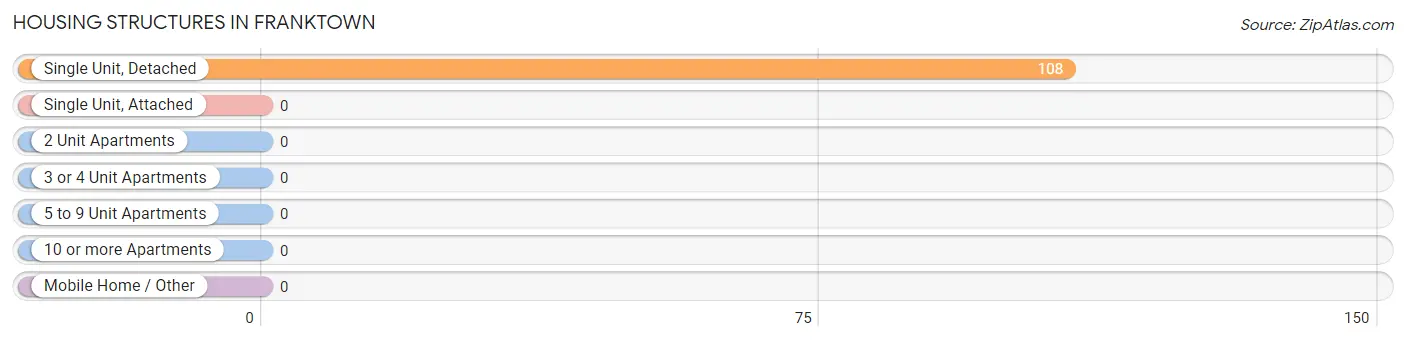
| Structure Type | # Housing Units | % Housing Units |
| Single Unit, Detached | 108 | 100.0% |
| Single Unit, Attached | 0 | 0.0% |
| 2 Unit Apartments | 0 | 0.0% |
| 3 or 4 Unit Apartments | 0 | 0.0% |
| 5 to 9 Unit Apartments | 0 | 0.0% |
| 10 or more Apartments | 0 | 0.0% |
| Mobile Home / Other | 0 | 0.0% |
| Total | 108 | 100.0% |
Housing Structures by Occupancy in Franktown
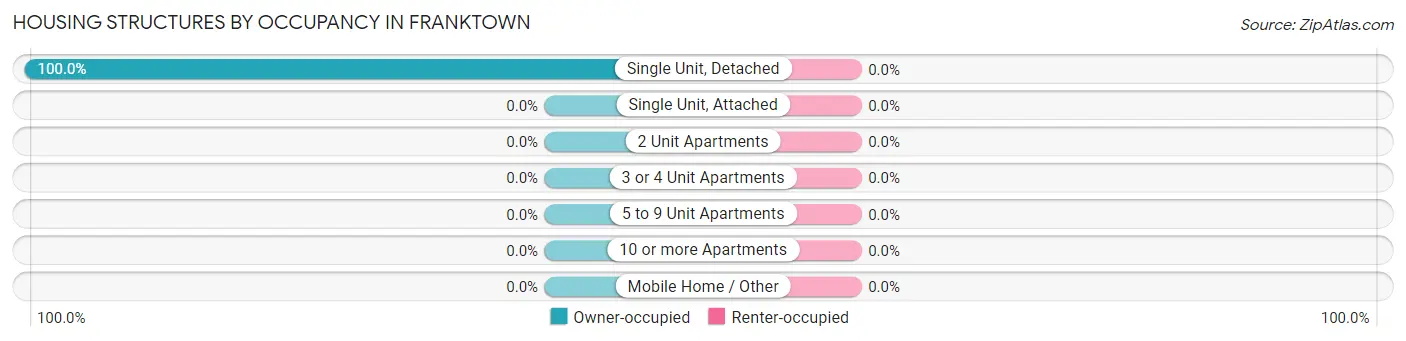
| Structure Type | Owner-occupied | Renter-occupied |
| Single Unit, Detached | 108 (100.0%) | 0 (0.0%) |
| Single Unit, Attached | 0 (0.0%) | 0 (0.0%) |
| 2 Unit Apartments | 0 (0.0%) | 0 (0.0%) |
| 3 or 4 Unit Apartments | 0 (0.0%) | 0 (0.0%) |
| 5 to 9 Unit Apartments | 0 (0.0%) | 0 (0.0%) |
| 10 or more Apartments | 0 (0.0%) | 0 (0.0%) |
| Mobile Home / Other | 0 (0.0%) | 0 (0.0%) |
| Total | 108 (100.0%) | 0 (0.0%) |
Housing Structures by Number of Rooms in Franktown
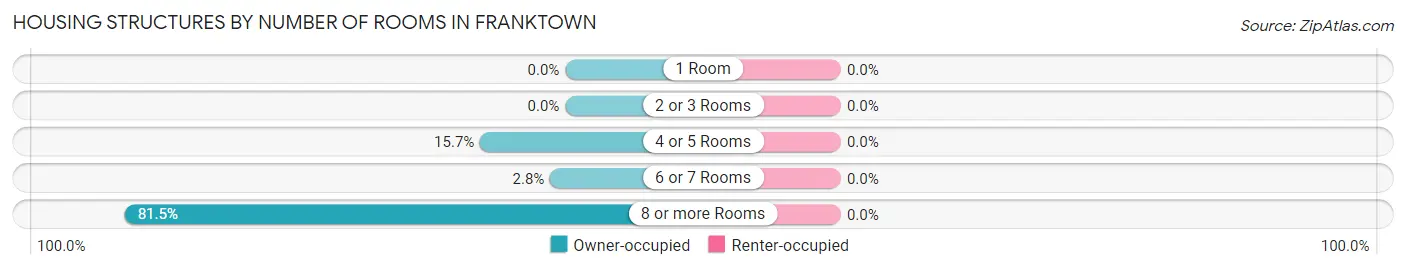
| Number of Rooms | Owner-occupied | Renter-occupied |
| 1 Room | 0 (0.0%) | 0 (0.0%) |
| 2 or 3 Rooms | 0 (0.0%) | 0 (0.0%) |
| 4 or 5 Rooms | 17 (15.7%) | 0 (0.0%) |
| 6 or 7 Rooms | 3 (2.8%) | 0 (0.0%) |
| 8 or more Rooms | 88 (81.5%) | 0 (0.0%) |
| Total | 108 (100.0%) | 0 (0.0%) |
Housing Structure by Heating Type in Franktown
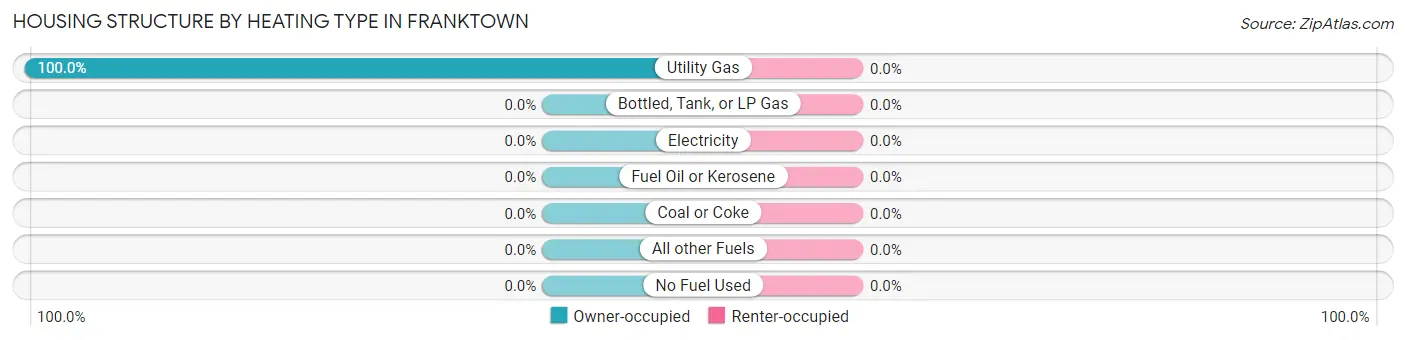
| Heating Type | Owner-occupied | Renter-occupied |
| Utility Gas | 108 (100.0%) | 0 (0.0%) |
| Bottled, Tank, or LP Gas | 0 (0.0%) | 0 (0.0%) |
| Electricity | 0 (0.0%) | 0 (0.0%) |
| Fuel Oil or Kerosene | 0 (0.0%) | 0 (0.0%) |
| Coal or Coke | 0 (0.0%) | 0 (0.0%) |
| All other Fuels | 0 (0.0%) | 0 (0.0%) |
| No Fuel Used | 0 (0.0%) | 0 (0.0%) |
| Total | 108 (100.0%) | 0 (0.0%) |
Household Vehicle Usage in Franktown
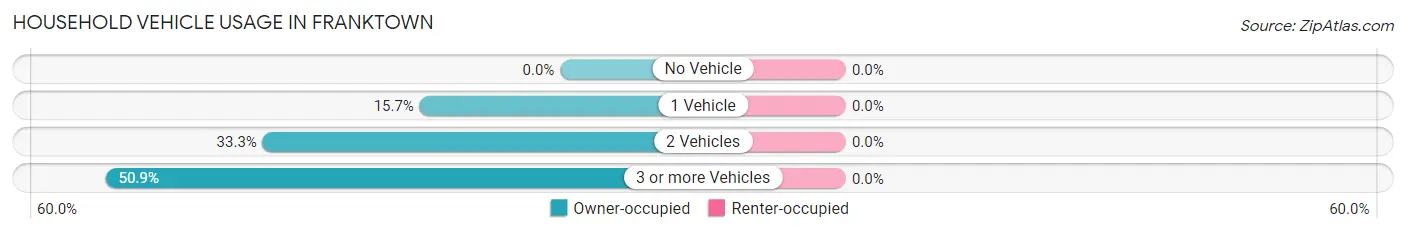
| Vehicles per Household | Owner-occupied | Renter-occupied |
| No Vehicle | 0 (0.0%) | 0 (0.0%) |
| 1 Vehicle | 17 (15.7%) | 0 (0.0%) |
| 2 Vehicles | 36 (33.3%) | 0 (0.0%) |
| 3 or more Vehicles | 55 (50.9%) | 0 (0.0%) |
| Total | 108 (100.0%) | 0 (0.0%) |
Real Estate & Mortgages in Franktown
Real Estate and Mortgage Overview in Franktown
| Characteristic | Without Mortgage | With Mortgage |
| Housing Units | 34 | 74 |
| Median Property Value | - | - |
| Median Household Income | - | - |
| Monthly Housing Costs | - | - |
| Real Estate Taxes | - | - |
Property Value by Mortgage Status in Franktown
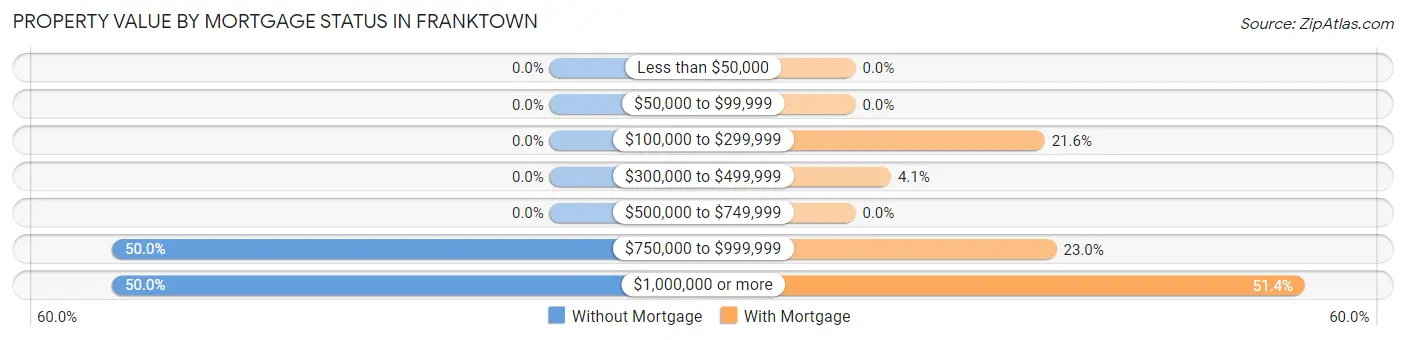
| Property Value | Without Mortgage | With Mortgage |
| Less than $50,000 | 0 (0.0%) | 0 (0.0%) |
| $50,000 to $99,999 | 0 (0.0%) | 0 (0.0%) |
| $100,000 to $299,999 | 0 (0.0%) | 16 (21.6%) |
| $300,000 to $499,999 | 0 (0.0%) | 3 (4.1%) |
| $500,000 to $749,999 | 0 (0.0%) | 0 (0.0%) |
| $750,000 to $999,999 | 17 (50.0%) | 17 (23.0%) |
| $1,000,000 or more | 17 (50.0%) | 38 (51.3%) |
| Total | 34 (100.0%) | 74 (100.0%) |
Household Income by Mortgage Status in Franktown
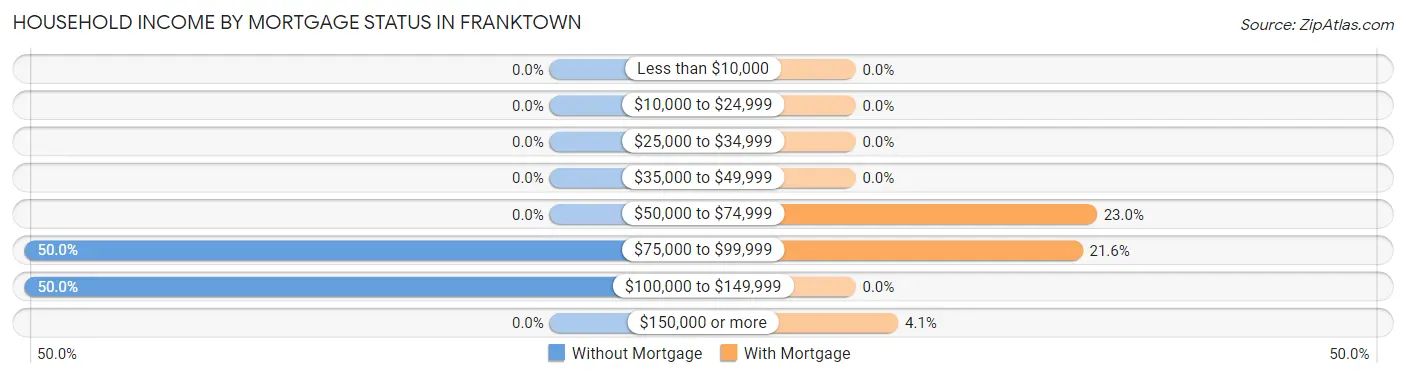
| Household Income | Without Mortgage | With Mortgage |
| Less than $10,000 | 0 (0.0%) | 0 (0.0%) |
| $10,000 to $24,999 | 0 (0.0%) | 0 (0.0%) |
| $25,000 to $34,999 | 0 (0.0%) | 0 (0.0%) |
| $35,000 to $49,999 | 0 (0.0%) | 0 (0.0%) |
| $50,000 to $74,999 | 0 (0.0%) | 17 (23.0%) |
| $75,000 to $99,999 | 17 (50.0%) | 16 (21.6%) |
| $100,000 to $149,999 | 17 (50.0%) | 0 (0.0%) |
| $150,000 or more | 0 (0.0%) | 3 (4.1%) |
| Total | 34 (100.0%) | 74 (100.0%) |
Property Value to Household Income Ratio in Franktown
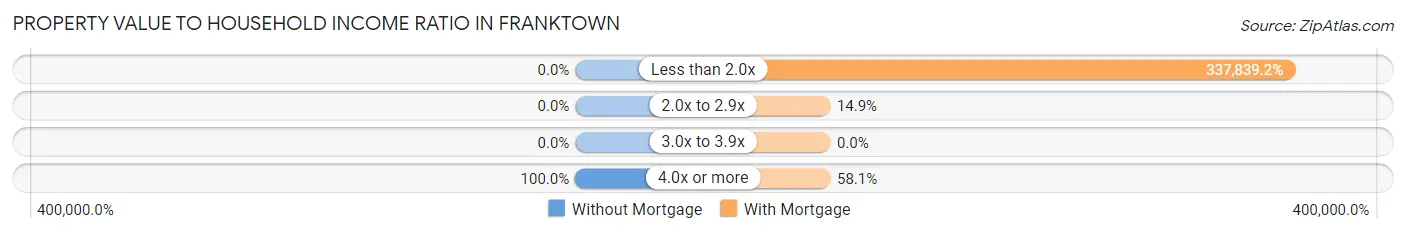
| Value-to-Income Ratio | Without Mortgage | With Mortgage |
| Less than 2.0x | 0 (0.0%) | 250,001 (337,839.2%) |
| 2.0x to 2.9x | 0 (0.0%) | 11 (14.9%) |
| 3.0x to 3.9x | 0 (0.0%) | 0 (0.0%) |
| 4.0x or more | 34 (100.0%) | 43 (58.1%) |
| Total | 34 (100.0%) | 74 (100.0%) |
Real Estate Taxes by Mortgage Status in Franktown
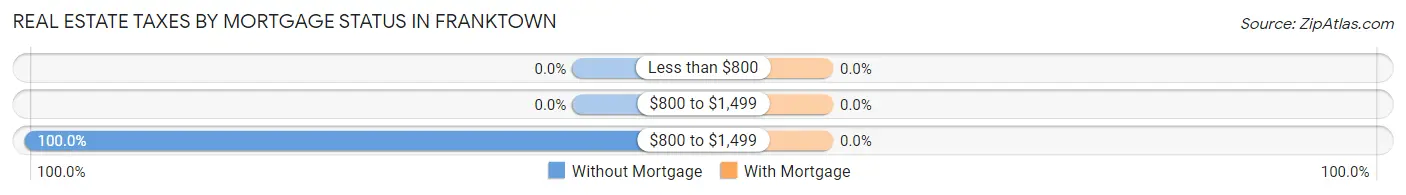
| Property Taxes | Without Mortgage | With Mortgage |
| Less than $800 | 0 (0.0%) | 0 (0.0%) |
| $800 to $1,499 | 0 (0.0%) | 0 (0.0%) |
| $800 to $1,499 | 34 (100.0%) | 0 (0.0%) |
| Total | 34 (100.0%) | 74 (100.0%) |
Health & Disability in Franktown
Health Insurance Coverage by Age in Franktown
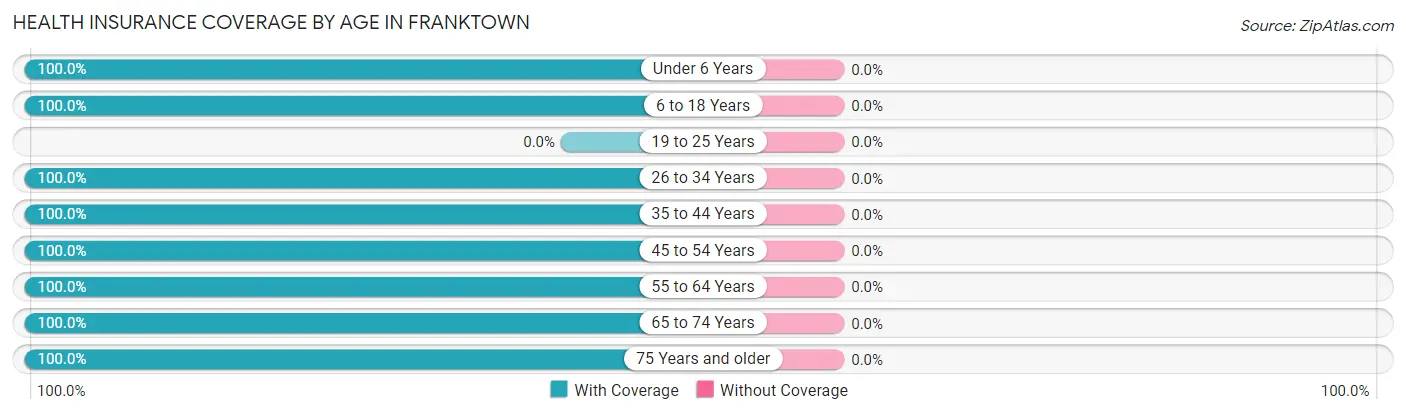
| Age Bracket | With Coverage | Without Coverage |
| Under 6 Years | 8 (100.0%) | 0 (0.0%) |
| 6 to 18 Years | 100 (100.0%) | 0 (0.0%) |
| 19 to 25 Years | 0 (0.0%) | 0 (0.0%) |
| 26 to 34 Years | 21 (100.0%) | 0 (0.0%) |
| 35 to 44 Years | 58 (100.0%) | 0 (0.0%) |
| 45 to 54 Years | 17 (100.0%) | 0 (0.0%) |
| 55 to 64 Years | 43 (100.0%) | 0 (0.0%) |
| 65 to 74 Years | 34 (100.0%) | 0 (0.0%) |
| 75 Years and older | 70 (100.0%) | 0 (0.0%) |
| Total | 351 (100.0%) | 0 (0.0%) |
Health Insurance Coverage by Citizenship Status in Franktown
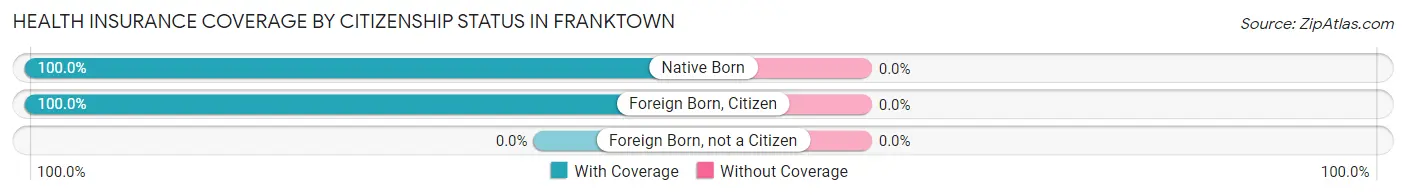
| Citizenship Status | With Coverage | Without Coverage |
| Native Born | 8 (100.0%) | 0 (0.0%) |
| Foreign Born, Citizen | 100 (100.0%) | 0 (0.0%) |
| Foreign Born, not a Citizen | 0 (0.0%) | 0 (0.0%) |
Health Insurance Coverage by Household Income in Franktown
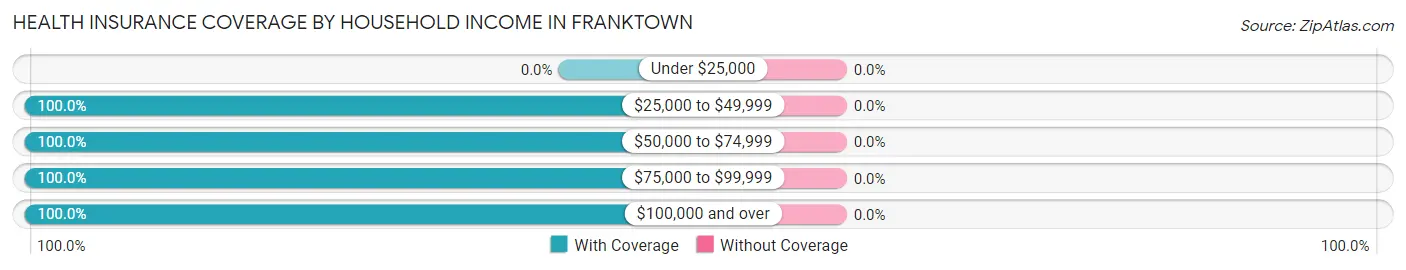
| Household Income | With Coverage | Without Coverage |
| Under $25,000 | 0 (0.0%) | 0 (0.0%) |
| $25,000 to $49,999 | 35 (100.0%) | 0 (0.0%) |
| $50,000 to $74,999 | 81 (100.0%) | 0 (0.0%) |
| $75,000 to $99,999 | 35 (100.0%) | 0 (0.0%) |
| $100,000 and over | 200 (100.0%) | 0 (0.0%) |
Public vs Private Health Insurance Coverage by Age in Franktown
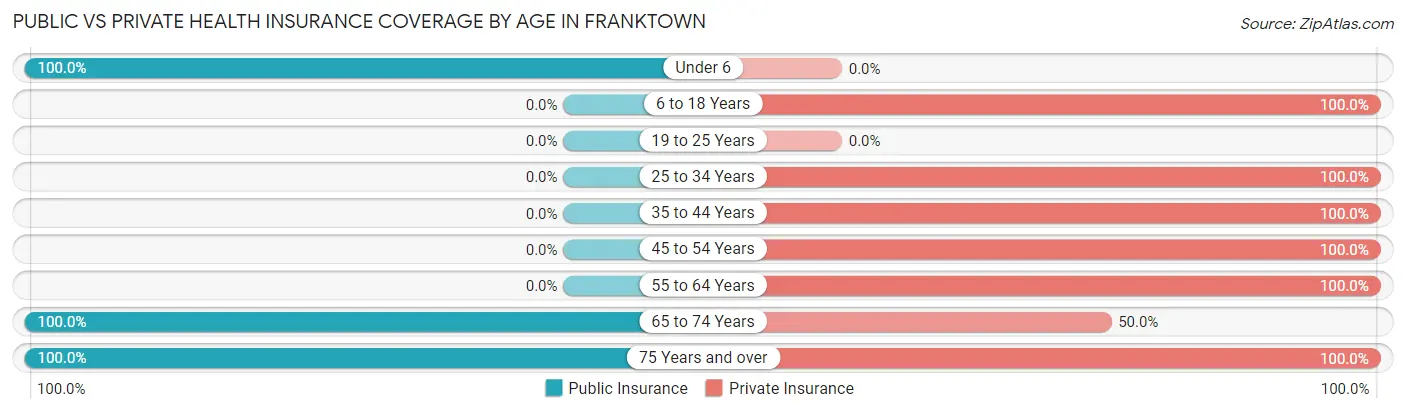
| Age Bracket | Public Insurance | Private Insurance |
| Under 6 | 8 (100.0%) | 0 (0.0%) |
| 6 to 18 Years | 0 (0.0%) | 100 (100.0%) |
| 19 to 25 Years | 0 (0.0%) | 0 (0.0%) |
| 25 to 34 Years | 0 (0.0%) | 21 (100.0%) |
| 35 to 44 Years | 0 (0.0%) | 58 (100.0%) |
| 45 to 54 Years | 0 (0.0%) | 17 (100.0%) |
| 55 to 64 Years | 0 (0.0%) | 43 (100.0%) |
| 65 to 74 Years | 34 (100.0%) | 17 (50.0%) |
| 75 Years and over | 70 (100.0%) | 70 (100.0%) |
| Total | 112 (31.9%) | 326 (92.9%) |
Disability Status by Sex by Age in Franktown
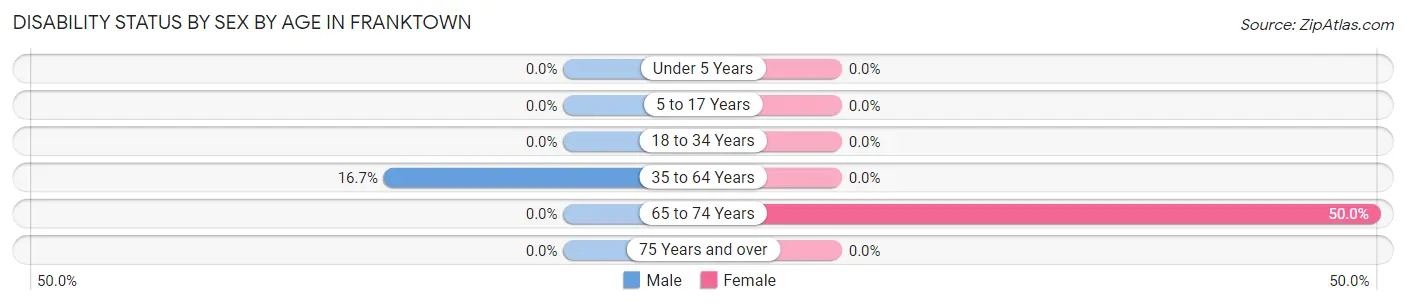
| Age Bracket | Male | Female |
| Under 5 Years | 0 (0.0%) | 0 (0.0%) |
| 5 to 17 Years | 0 (0.0%) | 0 (0.0%) |
| 18 to 34 Years | 0 (0.0%) | 0 (0.0%) |
| 35 to 64 Years | 10 (16.7%) | 0 (0.0%) |
| 65 to 74 Years | 0 (0.0%) | 17 (50.0%) |
| 75 Years and over | 0 (0.0%) | 0 (0.0%) |
Disability Class by Sex by Age in Franktown
Disability Class: Hearing Difficulty
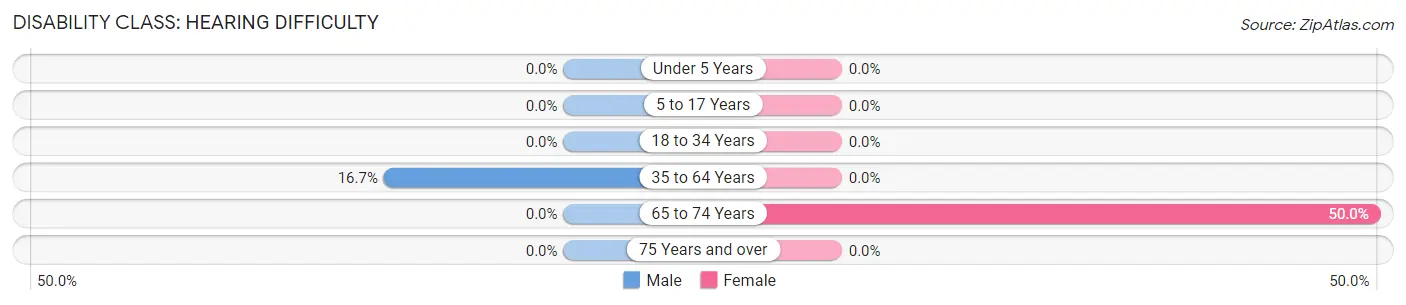
| Age Bracket | Male | Female |
| Under 5 Years | 0 (0.0%) | 0 (0.0%) |
| 5 to 17 Years | 0 (0.0%) | 0 (0.0%) |
| 18 to 34 Years | 0 (0.0%) | 0 (0.0%) |
| 35 to 64 Years | 10 (16.7%) | 0 (0.0%) |
| 65 to 74 Years | 0 (0.0%) | 17 (50.0%) |
| 75 Years and over | 0 (0.0%) | 0 (0.0%) |
Disability Class: Vision Difficulty
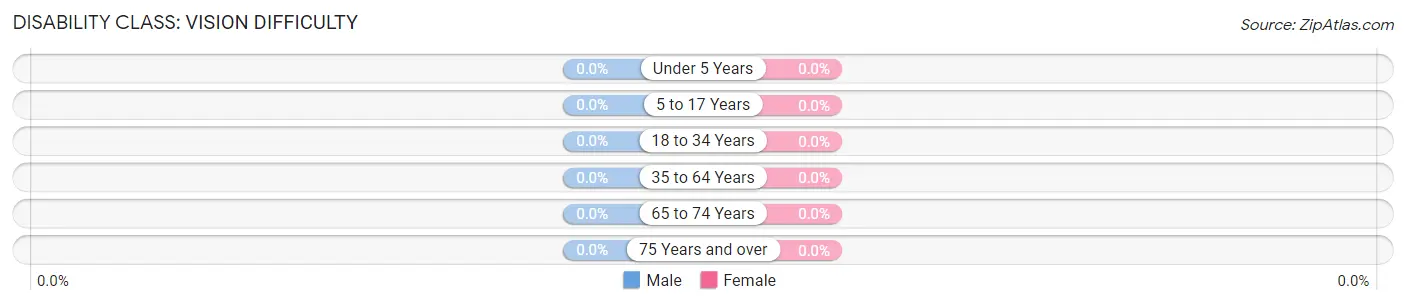
| Age Bracket | Male | Female |
| Under 5 Years | 0 (0.0%) | 0 (0.0%) |
| 5 to 17 Years | 0 (0.0%) | 0 (0.0%) |
| 18 to 34 Years | 0 (0.0%) | 0 (0.0%) |
| 35 to 64 Years | 0 (0.0%) | 0 (0.0%) |
| 65 to 74 Years | 0 (0.0%) | 0 (0.0%) |
| 75 Years and over | 0 (0.0%) | 0 (0.0%) |
Disability Class: Cognitive Difficulty
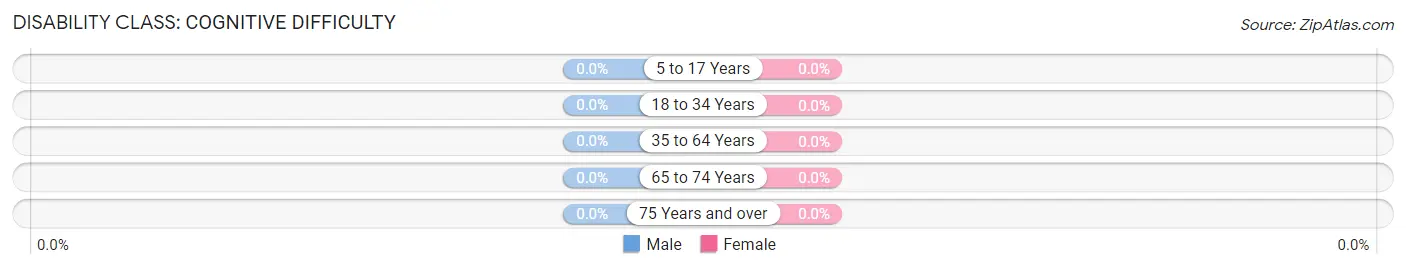
| Age Bracket | Male | Female |
| 5 to 17 Years | 0 (0.0%) | 0 (0.0%) |
| 18 to 34 Years | 0 (0.0%) | 0 (0.0%) |
| 35 to 64 Years | 0 (0.0%) | 0 (0.0%) |
| 65 to 74 Years | 0 (0.0%) | 0 (0.0%) |
| 75 Years and over | 0 (0.0%) | 0 (0.0%) |
Disability Class: Ambulatory Difficulty
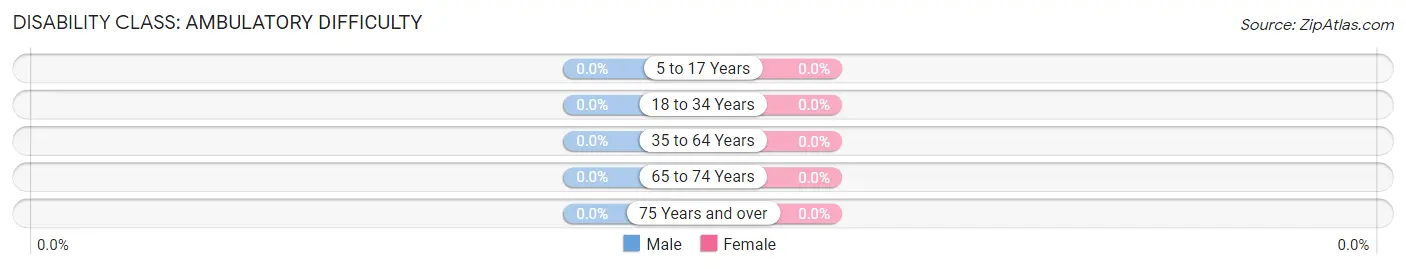
| Age Bracket | Male | Female |
| 5 to 17 Years | 0 (0.0%) | 0 (0.0%) |
| 18 to 34 Years | 0 (0.0%) | 0 (0.0%) |
| 35 to 64 Years | 0 (0.0%) | 0 (0.0%) |
| 65 to 74 Years | 0 (0.0%) | 0 (0.0%) |
| 75 Years and over | 0 (0.0%) | 0 (0.0%) |
Disability Class: Self-Care Difficulty
| Age Bracket | Male | Female |
| 5 to 17 Years | 0 (0.0%) | 0 (0.0%) |
| 18 to 34 Years | 0 (0.0%) | 0 (0.0%) |
| 35 to 64 Years | 0 (0.0%) | 0 (0.0%) |
| 65 to 74 Years | 0 (0.0%) | 0 (0.0%) |
| 75 Years and over | 0 (0.0%) | 0 (0.0%) |
Technology Access in Franktown
Computing Device Access in Franktown
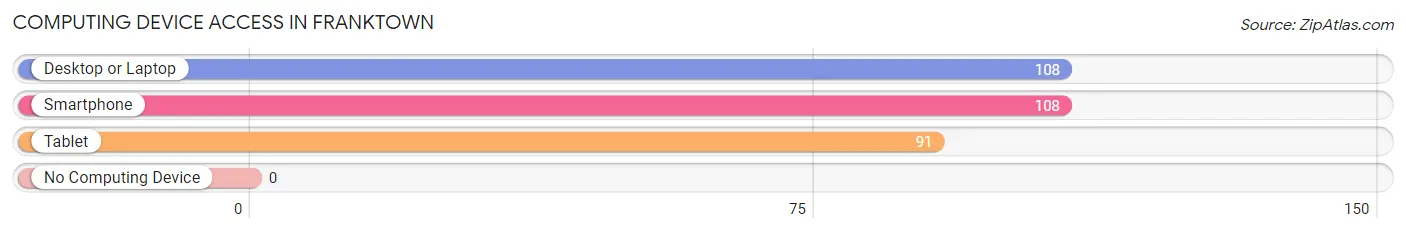
| Device Type | # Households | % Households |
| Desktop or Laptop | 108 | 100.0% |
| Smartphone | 108 | 100.0% |
| Tablet | 91 | 84.3% |
| No Computing Device | 0 | 0.0% |
| Total | 108 | 100.0% |
Internet Access in Franktown
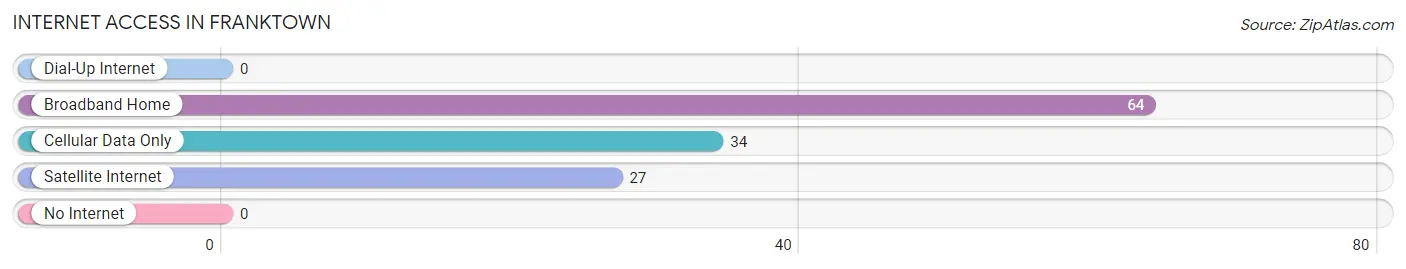
| Internet Type | # Households | % Households |
| Dial-Up Internet | 0 | 0.0% |
| Broadband Home | 64 | 59.3% |
| Cellular Data Only | 34 | 31.5% |
| Satellite Internet | 27 | 25.0% |
| No Internet | 0 | 0.0% |
| Total | 108 | 100.0% |
Franktown Summary
Franktown is a small unincorporated community located in Douglas County, Colorado, United States. It is situated approximately 25 miles southeast of Denver and is part of the Denver-Aurora-Lakewood Metropolitan Statistical Area. The population of Franktown was estimated to be 1,845 in 2019.
History
Franktown was founded in 1871 by a group of settlers led by Frank and Mary Miller. The Millers had traveled from Ohio to Colorado in search of a new home and found the area to be ideal for farming and ranching. The town was named after Frank Miller and was originally known as "Frank's Town". The town grew slowly over the years and by the early 1900s had become a popular stop for travelers on the Denver and Rio Grande Railroad.
In the 1950s, Franktown began to experience a population boom as people moved to the area from other parts of the country. This growth was largely due to the development of the nearby Denver-Aurora-Lakewood metropolitan area. The population of Franktown continued to grow throughout the 1960s and 1970s, reaching its peak in the 1980s.
Geography
Franktown is located in the foothills of the Rocky Mountains at an elevation of 6,000 feet. The town is situated on the eastern edge of Douglas County, just south of the Denver-Aurora-Lakewood metropolitan area. The town is bordered by the towns of Parker and Elizabeth to the north, Castle Rock to the east, and Larkspur to the south.
The town is located in a semi-arid climate, with hot summers and cold winters. The average annual temperature is around 50 degrees Fahrenheit, with temperatures ranging from the low 30s in the winter to the high 80s in the summer. The average annual precipitation is around 16 inches, with most of the precipitation occurring in the spring and summer months.
Economy
Franktown's economy is largely based on agriculture and ranching. The town is home to several farms and ranches, which produce a variety of crops and livestock. The town is also home to several small businesses, including restaurants, retail stores, and service providers.
The town is also home to several large employers, including the Douglas County School District, the University of Colorado Denver, and the Denver-Aurora-Lakewood metropolitan area. The town is also home to several technology companies, including the software company Oracle and the telecommunications company AT&T.
Demographics
As of the 2019 census, the population of Franktown was estimated to be 1,845. The racial makeup of the town was 94.3% White, 1.2% African American, 0.7% Native American, 0.7% Asian, 0.2% Pacific Islander, 1.2% from other races, and 1.7% from two or more races. Hispanic or Latino of any race were 4.2% of the population.
The median household income in Franktown was $76,944 in 2019, and the median family income was $87,813. The per capita income was $35,945. The town has a poverty rate of 8.3%. The town is served by the Douglas County School District, which has an enrollment of over 8,000 students.
Common Questions
What is Per Capita Income in Franktown?
Per Capita income in Franktown is $104,457.
What is Inequality or Gini Index in Franktown?
Inequality or Gini Index in Franktown is 0.61.
What is the Total Population of Franktown?
Total Population of Franktown is 351.
What is the Total Male Population of Franktown?
Total Male Population of Franktown is 171.
What is the Total Female Population of Franktown?
Total Female Population of Franktown is 180.
What is the Ratio of Males per 100 Females in Franktown?
There are 95.00 Males per 100 Females in Franktown.
What is the Ratio of Females per 100 Males in Franktown?
There are 105.26 Females per 100 Males in Franktown.
What is the Median Population Age in Franktown?
Median Population Age in Franktown is 44.7 Years.
What is the Average Family Size in Franktown
Average Family Size in Franktown is 3.2 People.
What is the Average Household Size in Franktown
Average Household Size in Franktown is 3.2 People.
How Large is the Labor Force in Franktown?
There are 156 People in the Labor Forcein in Franktown.
What is the Percentage of People in the Labor Force in Franktown?
64.2% of People are in the Labor Force in Franktown.