River Bend, MO Map & Demographics
River Bend Map
River Bend Overview
$59,420
PER CAPITA INCOME
$91,250
AVG HOUSEHOLD INCOME
0.29
INEQUALITY / GINI INDEX
5
TOTAL POPULATION
3
MALE POPULATION
2
FEMALE POPULATION
150.00
MALES / 100 FEMALES
66.67
FEMALES / 100 MALES
63.3
MEDIAN AGE
2.0
AVG FAMILY SIZE
1.2
AVG HOUSEHOLD SIZE
4
LABOR FORCE [ PEOPLE ]
80.0%
PERCENT IN LABOR FORCE
Income in River Bend
Income Overview in River Bend
| Characteristic | Number | Measure |
| Per Capita Income | 5 | $59,420 |
| Median Family Income | 1 | $0 |
| Mean Family Income | 1 | $0 |
| Median Household Income | 4 | $91,250 |
| Mean Household Income | 4 | $74,275 |
| Income Deficit | 1 | $0 |
| Wage / Income Gap (%) | 5 | 0.00% |
| Wage / Income Gap ($) | 5 | 100.00¢ per $1 |
| Gini / Inequality Index | 5 | 0.29 |
Earnings by Sex in River Bend
| Sex | Number | Average Earnings |
| Male | 2 (50.0%) | $0 |
| Female | 2 (50.0%) | $0 |
| Total | 4 (100.0%) | $0 |
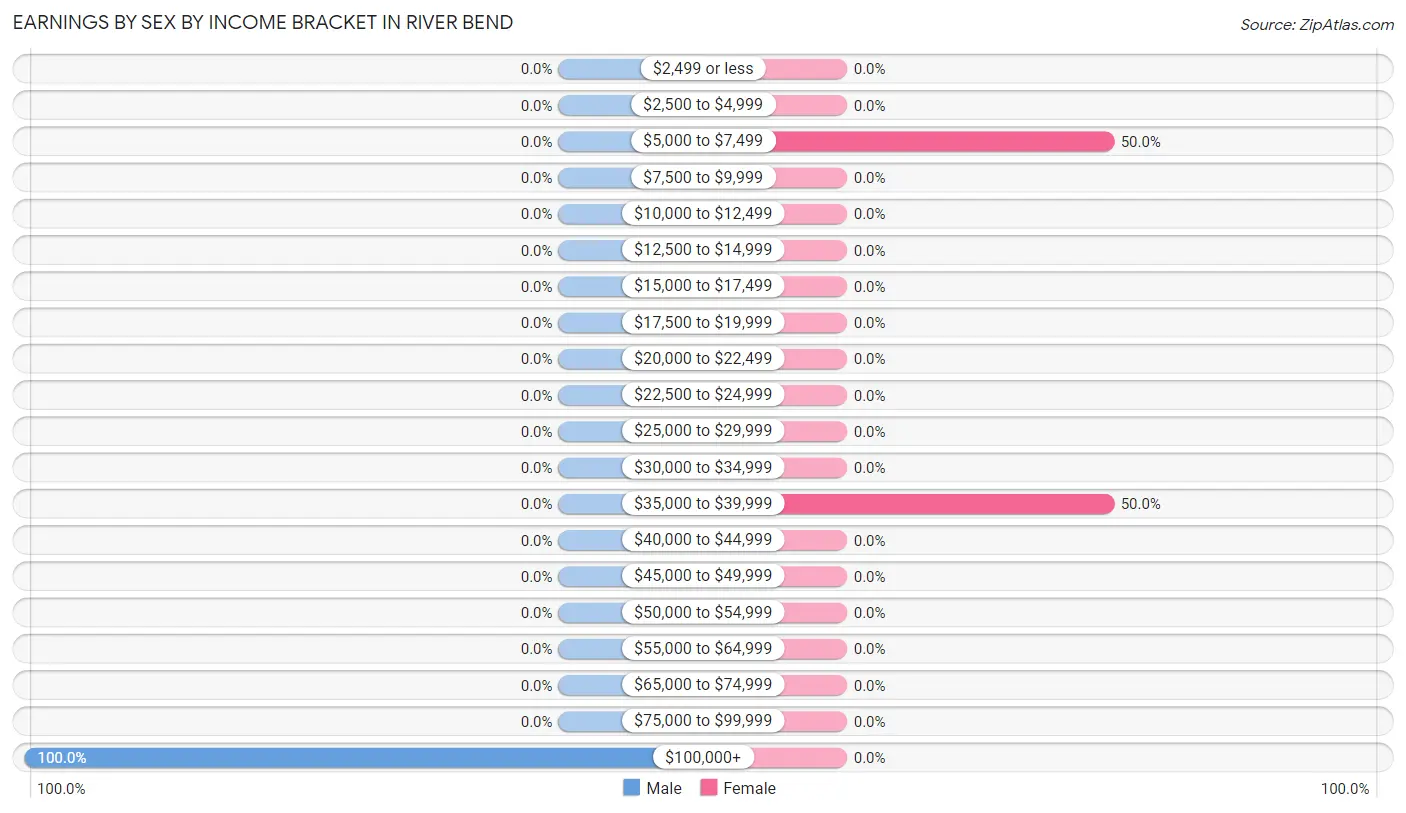
Earnings by Sex by Income Bracket in River Bend
The most common earnings brackets in River Bend are $100,000+ for men (2 | 100.0%) and $5,000 to $7,499 for women (1 | 50.0%).
| Income | Male | Female |
| $2,499 or less | 0 (0.0%) | 0 (0.0%) |
| $2,500 to $4,999 | 0 (0.0%) | 0 (0.0%) |
| $5,000 to $7,499 | 0 (0.0%) | 1 (50.0%) |
| $7,500 to $9,999 | 0 (0.0%) | 0 (0.0%) |
| $10,000 to $12,499 | 0 (0.0%) | 0 (0.0%) |
| $12,500 to $14,999 | 0 (0.0%) | 0 (0.0%) |
| $15,000 to $17,499 | 0 (0.0%) | 0 (0.0%) |
| $17,500 to $19,999 | 0 (0.0%) | 0 (0.0%) |
| $20,000 to $22,499 | 0 (0.0%) | 0 (0.0%) |
| $22,500 to $24,999 | 0 (0.0%) | 0 (0.0%) |
| $25,000 to $29,999 | 0 (0.0%) | 0 (0.0%) |
| $30,000 to $34,999 | 0 (0.0%) | 0 (0.0%) |
| $35,000 to $39,999 | 0 (0.0%) | 1 (50.0%) |
| $40,000 to $44,999 | 0 (0.0%) | 0 (0.0%) |
| $45,000 to $49,999 | 0 (0.0%) | 0 (0.0%) |
| $50,000 to $54,999 | 0 (0.0%) | 0 (0.0%) |
| $55,000 to $64,999 | 0 (0.0%) | 0 (0.0%) |
| $65,000 to $74,999 | 0 (0.0%) | 0 (0.0%) |
| $75,000 to $99,999 | 0 (0.0%) | 0 (0.0%) |
| $100,000+ | 2 (100.0%) | 0 (0.0%) |
| Total | 2 (100.0%) | 2 (100.0%) |
Earnings by Sex by Educational Attainment in River Bend
| Educational Attainment | Male Income | Female Income |
| Less than High School | - | - |
| High School Diploma | - | - |
| College or Associate's Degree | - | - |
| Bachelor's Degree | - | - |
| Graduate Degree | - | - |
| Total | - | - |
Family Income in River Bend
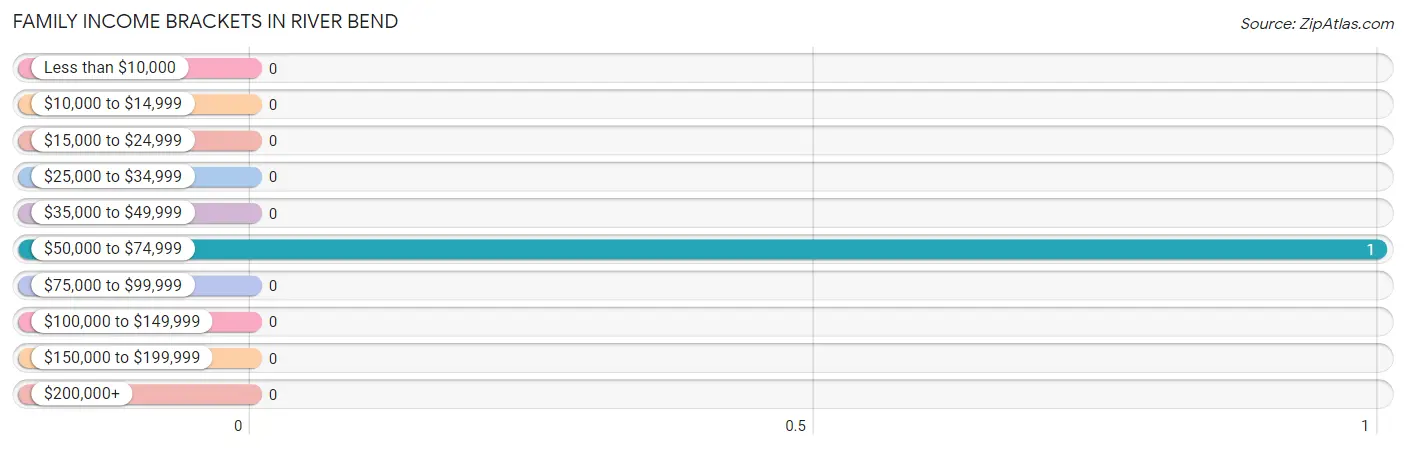
Family Income Brackets in River Bend
According to the River Bend family income data, there are 1 families falling into the $50,000 to $74,999 income range, which is the most common income bracket and makes up 100.0% of all families.
| Income Bracket | # Families | % Families |
| Less than $10,000 | 0 | 0.0% |
| $10,000 to $14,999 | 0 | 0.0% |
| $15,000 to $24,999 | 0 | 0.0% |
| $25,000 to $34,999 | 0 | 0.0% |
| $35,000 to $49,999 | 0 | 0.0% |
| $50,000 to $74,999 | 1 | 100.0% |
| $75,000 to $99,999 | 0 | 0.0% |
| $100,000 to $149,999 | 0 | 0.0% |
| $150,000 to $199,999 | 0 | 0.0% |
| $200,000+ | 0 | 0.0% |
Family Income by Famaliy Size in River Bend
| Income Bracket | # Families | Median Income |
| 2-Person Families | 1 (100.0%) | $0 |
| 3-Person Families | 0 (0.0%) | $0 |
| 4-Person Families | 0 (0.0%) | $0 |
| 5-Person Families | 0 (0.0%) | $0 |
| 6-Person Families | 0 (0.0%) | $0 |
| 7+ Person Families | 0 (0.0%) | $0 |
| Total | 1 (100.0%) | $0 |
Family Income by Number of Earners in River Bend
| Number of Earners | # Families | Median Income |
| No Earners | 0 (0.0%) | $0 |
| 1 Earner | 1 (100.0%) | $0 |
| 2 Earners | 0 (0.0%) | $0 |
| 3+ Earners | 0 (0.0%) | $0 |
| Total | 1 (100.0%) | $0 |
Household Income in River Bend
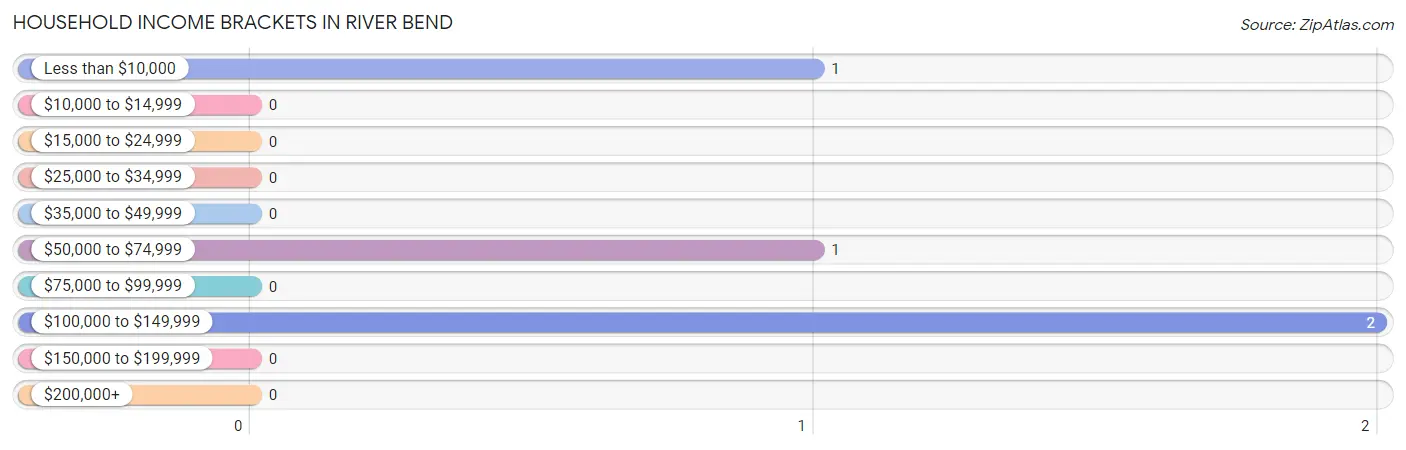
Household Income Brackets in River Bend
With 2 households falling in the category, the $100,000 to $149,999 income range is the most frequent in River Bend, accounting for 50.0% of all households.
| Income Bracket | # Households | % Households |
| Less than $10,000 | 1 | 25.0% |
| $10,000 to $14,999 | 0 | 0.0% |
| $15,000 to $24,999 | 0 | 0.0% |
| $25,000 to $34,999 | 0 | 0.0% |
| $35,000 to $49,999 | 0 | 0.0% |
| $50,000 to $74,999 | 1 | 25.0% |
| $75,000 to $99,999 | 0 | 0.0% |
| $100,000 to $149,999 | 2 | 50.0% |
| $150,000 to $199,999 | 0 | 0.0% |
| $200,000+ | 0 | 0.0% |
Household Income by Householder Age in River Bend
The median household income in River Bend is $91,250, with the highest median household income of $91,250 found in the 45 to 64 years age bracket for the primary householder. A total of 4 households (100.0%) fall into this category.
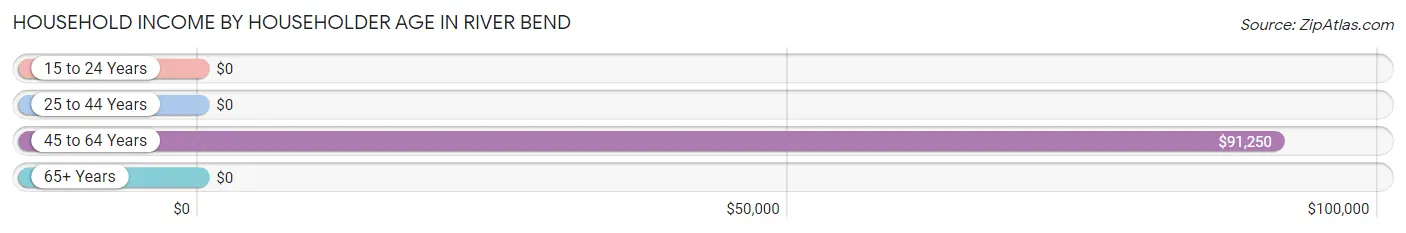
| Income Bracket | # Households | Median Income |
| 15 to 24 Years | 0 (0.0%) | $0 |
| 25 to 44 Years | 0 (0.0%) | $0 |
| 45 to 64 Years | 4 (100.0%) | $91,250 |
| 65+ Years | 0 (0.0%) | $0 |
| Total | 4 (100.0%) | $91,250 |
Poverty in River Bend
Income Below Poverty by Sex and Age in River Bend
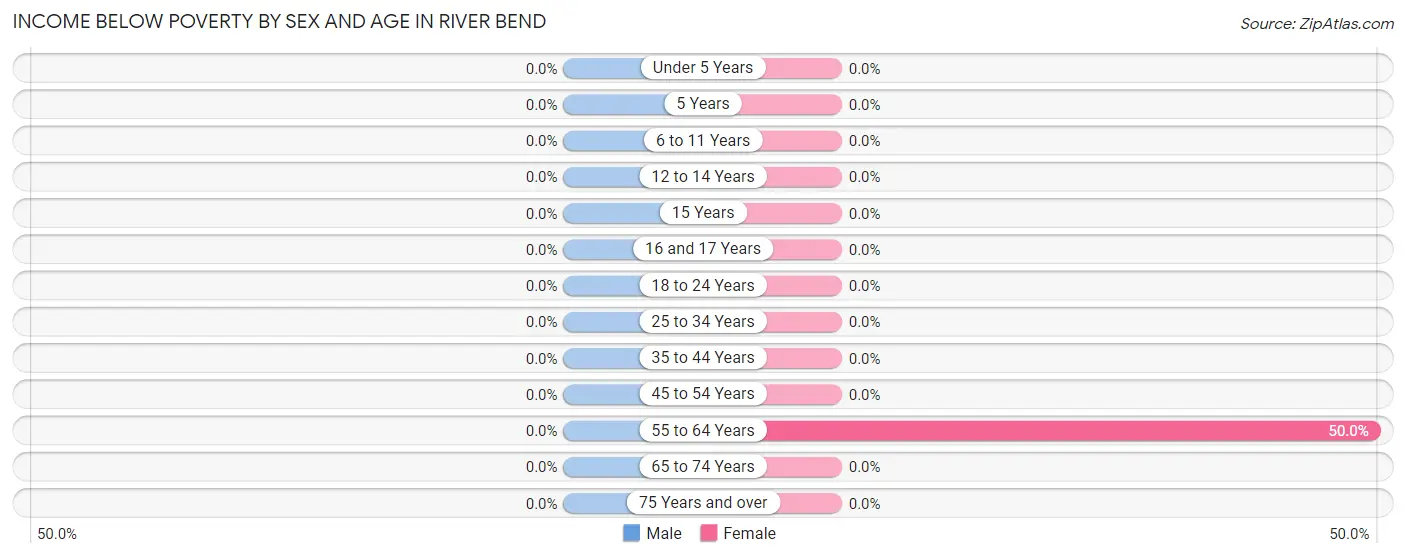
| Age Bracket | Male | Female |
| Under 5 Years | 0 (0.0%) | 0 (0.0%) |
| 5 Years | 0 (0.0%) | 0 (0.0%) |
| 6 to 11 Years | 0 (0.0%) | 0 (0.0%) |
| 12 to 14 Years | 0 (0.0%) | 0 (0.0%) |
| 15 Years | 0 (0.0%) | 0 (0.0%) |
| 16 and 17 Years | 0 (0.0%) | 0 (0.0%) |
| 18 to 24 Years | 0 (0.0%) | 0 (0.0%) |
| 25 to 34 Years | 0 (0.0%) | 0 (0.0%) |
| 35 to 44 Years | 0 (0.0%) | 0 (0.0%) |
| 45 to 54 Years | 0 (0.0%) | 0 (0.0%) |
| 55 to 64 Years | 0 (0.0%) | 1 (50.0%) |
| 65 to 74 Years | 0 (0.0%) | 0 (0.0%) |
| 75 Years and over | 0 (0.0%) | 0 (0.0%) |
| Total | 0 (0.0%) | 1 (50.0%) |
Income Above Poverty by Sex and Age in River Bend
According to the poverty statistics in River Bend, males aged 45 to 54 years and females aged 55 to 64 years are the age groups that are most secure financially, with 100.0% of males and 50.0% of females in these age groups living above the poverty line.
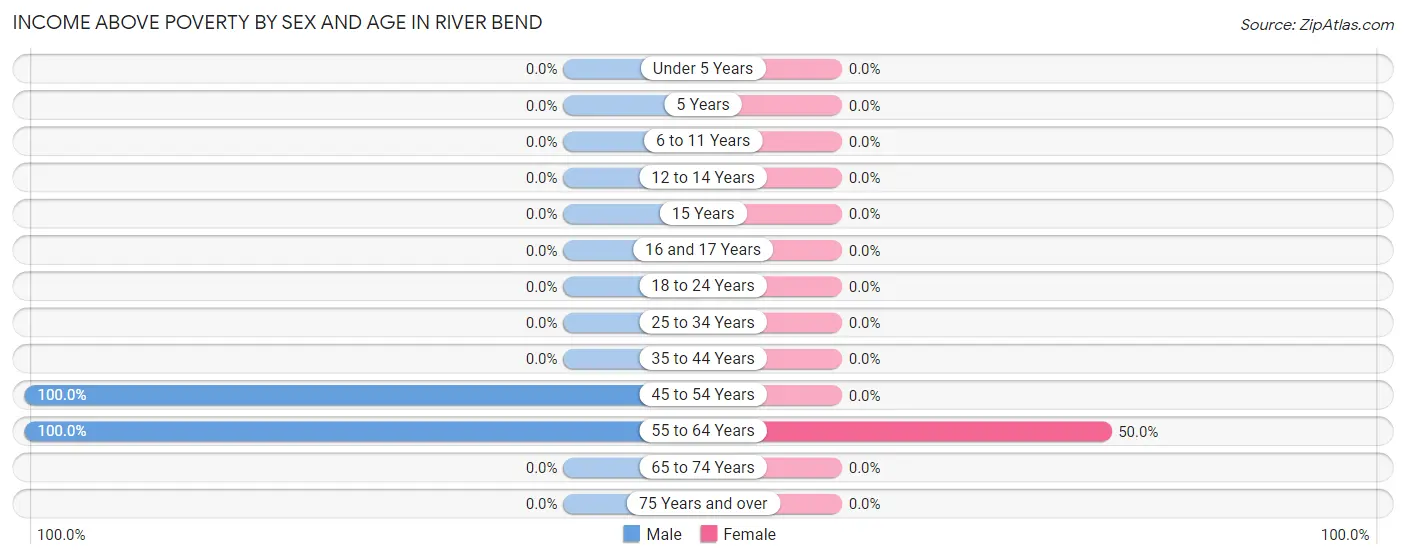
| Age Bracket | Male | Female |
| Under 5 Years | 0 (0.0%) | 0 (0.0%) |
| 5 Years | 0 (0.0%) | 0 (0.0%) |
| 6 to 11 Years | 0 (0.0%) | 0 (0.0%) |
| 12 to 14 Years | 0 (0.0%) | 0 (0.0%) |
| 15 Years | 0 (0.0%) | 0 (0.0%) |
| 16 and 17 Years | 0 (0.0%) | 0 (0.0%) |
| 18 to 24 Years | 0 (0.0%) | 0 (0.0%) |
| 25 to 34 Years | 0 (0.0%) | 0 (0.0%) |
| 35 to 44 Years | 0 (0.0%) | 0 (0.0%) |
| 45 to 54 Years | 2 (100.0%) | 0 (0.0%) |
| 55 to 64 Years | 1 (100.0%) | 1 (50.0%) |
| 65 to 74 Years | 0 (0.0%) | 0 (0.0%) |
| 75 Years and over | 0 (0.0%) | 0 (0.0%) |
| Total | 3 (100.0%) | 1 (50.0%) |
Income Below Poverty Among Married-Couple Families in River Bend
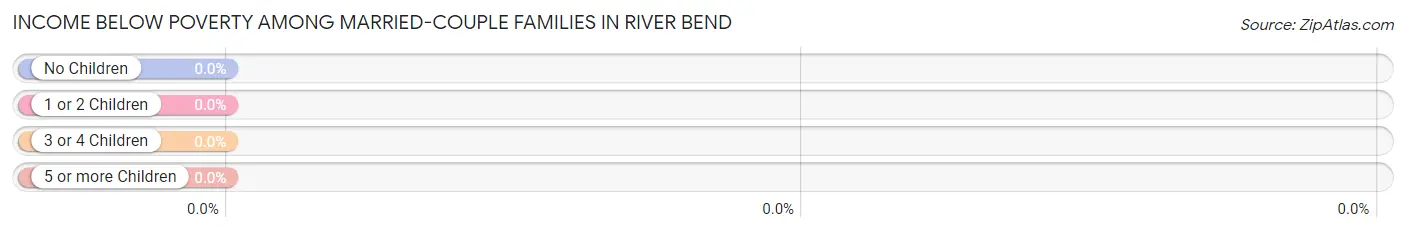
| Children | Above Poverty | Below Poverty |
| No Children | 1 (100.0%) | 0 (0.0%) |
| 1 or 2 Children | 0 (0.0%) | 0 (0.0%) |
| 3 or 4 Children | 0 (0.0%) | 0 (0.0%) |
| 5 or more Children | 0 (0.0%) | 0 (0.0%) |
| Total | 1 (100.0%) | 0 (0.0%) |
Income Below Poverty Among Single-Parent Households in River Bend
| Children | Single Father | Single Mother |
| No Children | 0 (0.0%) | 0 (0.0%) |
| 1 or 2 Children | 0 (0.0%) | 0 (0.0%) |
| 3 or 4 Children | 0 (0.0%) | 0 (0.0%) |
| 5 or more Children | 0 (0.0%) | 0 (0.0%) |
| Total | 0 (0.0%) | 0 (0.0%) |
Income Below Poverty Among Married-Couple vs Single-Parent Households in River Bend
| Children | Married-Couple Families | Single-Parent Households |
| No Children | 0 (0.0%) | 0 (0.0%) |
| 1 or 2 Children | 0 (0.0%) | 0 (0.0%) |
| 3 or 4 Children | 0 (0.0%) | 0 (0.0%) |
| 5 or more Children | 0 (0.0%) | 0 (0.0%) |
| Total | 0 (0.0%) | 0 (0.0%) |
Race in River Bend
The most populous races in River Bend are , and White / Caucasian (5 | 100.0%).
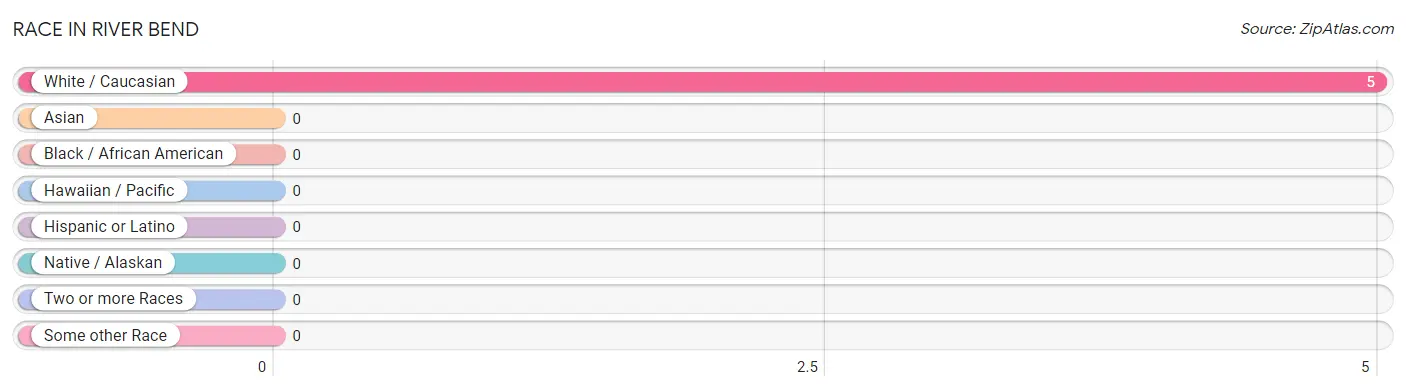
| Race | # Population | % Population |
| Asian | 0 | 0.0% |
| Black / African American | 0 | 0.0% |
| Hawaiian / Pacific | 0 | 0.0% |
| Hispanic or Latino | 0 | 0.0% |
| Native / Alaskan | 0 | 0.0% |
| White / Caucasian | 5 | 100.0% |
| Two or more Races | 0 | 0.0% |
| Some other Race | 0 | 0.0% |
| Total | 5 | 100.0% |
Ancestry in River Bend
The most populous ancestries reported in River Bend are European (2 | 40.0%), and Hungarian (1 | 20.0%), together accounting for 60.0% of all River Bend residents.
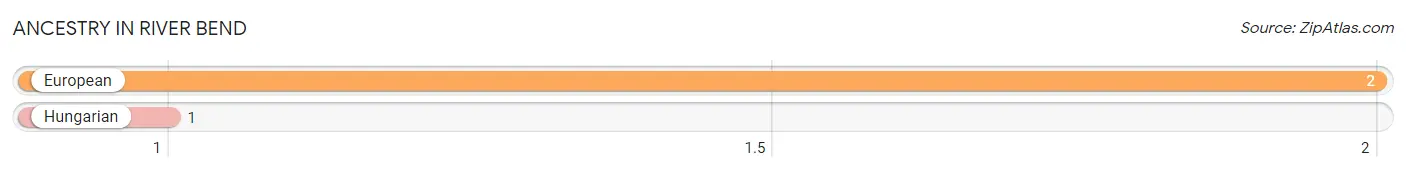
| Ancestry | # Population | % Population |
| European | 2 | 40.0% |
| Hungarian | 1 | 20.0% | View All 2 Rows |
Immigrants in River Bend

| Immigration Origin | # Population | % Population | View All 0 Rows |
Sex and Age in River Bend
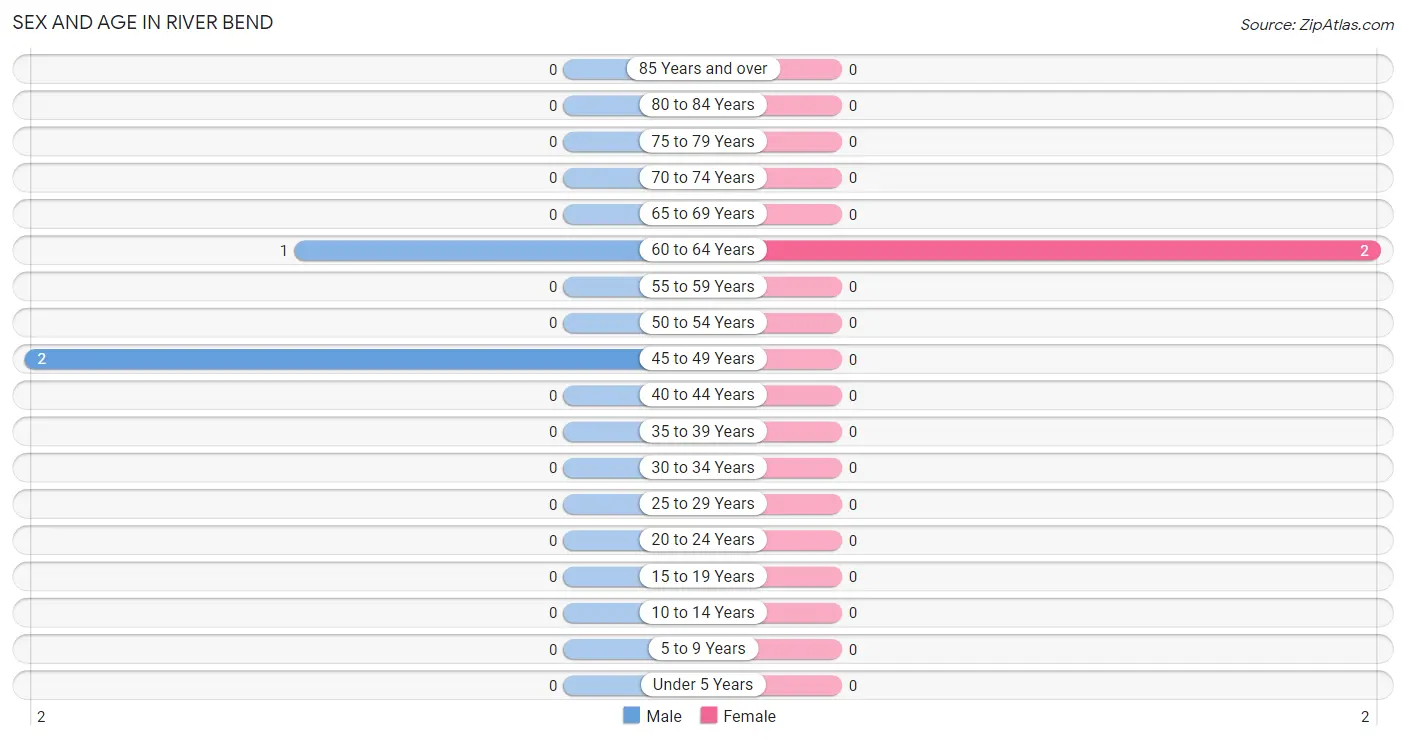
Sex and Age in River Bend
The most populous age groups in River Bend are 45 to 49 Years (2 | 66.7%) for men and 60 to 64 Years (2 | 100.0%) for women.
| Age Bracket | Male | Female |
| Under 5 Years | 0 (0.0%) | 0 (0.0%) |
| 5 to 9 Years | 0 (0.0%) | 0 (0.0%) |
| 10 to 14 Years | 0 (0.0%) | 0 (0.0%) |
| 15 to 19 Years | 0 (0.0%) | 0 (0.0%) |
| 20 to 24 Years | 0 (0.0%) | 0 (0.0%) |
| 25 to 29 Years | 0 (0.0%) | 0 (0.0%) |
| 30 to 34 Years | 0 (0.0%) | 0 (0.0%) |
| 35 to 39 Years | 0 (0.0%) | 0 (0.0%) |
| 40 to 44 Years | 0 (0.0%) | 0 (0.0%) |
| 45 to 49 Years | 2 (66.7%) | 0 (0.0%) |
| 50 to 54 Years | 0 (0.0%) | 0 (0.0%) |
| 55 to 59 Years | 0 (0.0%) | 0 (0.0%) |
| 60 to 64 Years | 1 (33.3%) | 2 (100.0%) |
| 65 to 69 Years | 0 (0.0%) | 0 (0.0%) |
| 70 to 74 Years | 0 (0.0%) | 0 (0.0%) |
| 75 to 79 Years | 0 (0.0%) | 0 (0.0%) |
| 80 to 84 Years | 0 (0.0%) | 0 (0.0%) |
| 85 Years and over | 0 (0.0%) | 0 (0.0%) |
| Total | 3 (100.0%) | 2 (100.0%) |
Families and Households in River Bend
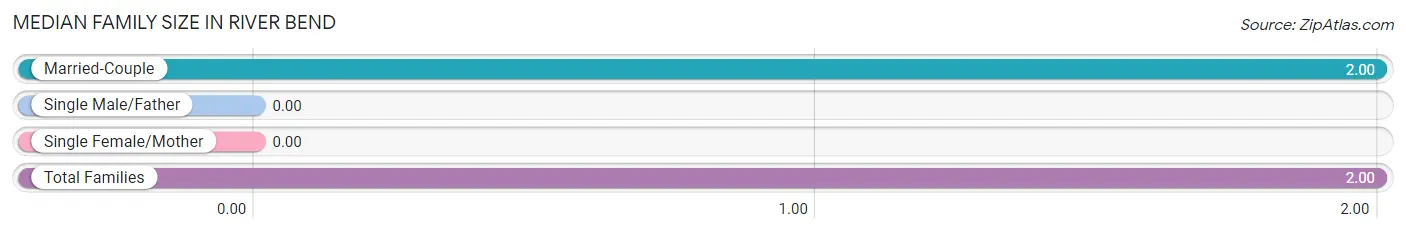
Median Family Size in River Bend
| Family Type | # Families | Family Size |
| Married-Couple | 1 (100.0%) | 2.00 |
| Single Male/Father | 0 (0.0%) | - |
| Single Female/Mother | 0 (0.0%) | - |
| Total Families | 1 (100.0%) | 2.00 |
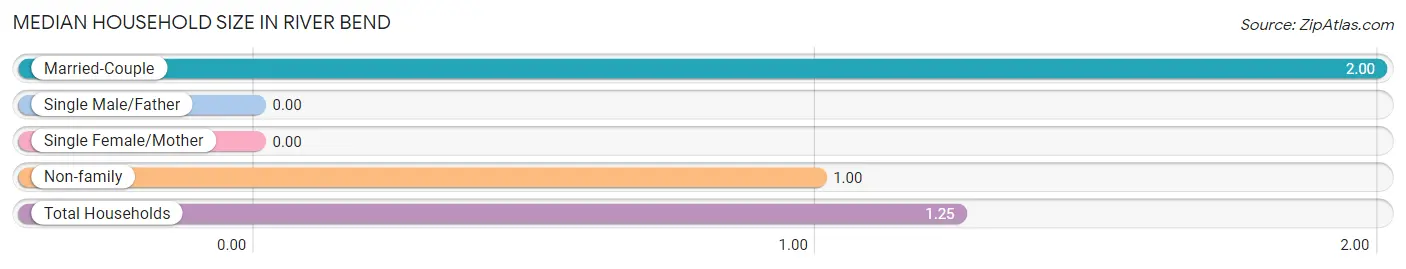
Median Household Size in River Bend
| Household Type | # Households | Household Size |
| Married-Couple | 1 (25.0%) | 2.00 |
| Single Male/Father | 0 (0.0%) | - |
| Single Female/Mother | 0 (0.0%) | - |
| Non-family | 3 (75.0%) | 1.00 |
| Total Households | 4 (100.0%) | 1.25 |
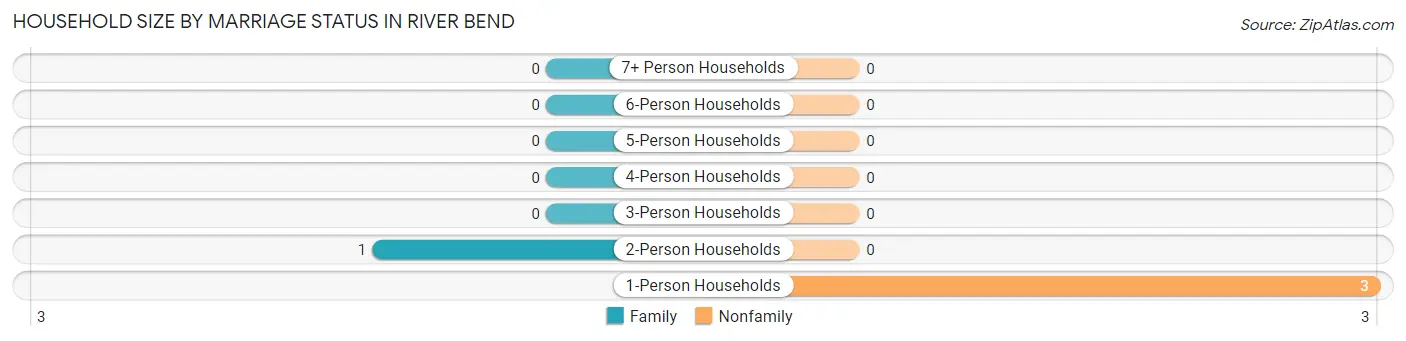
Household Size by Marriage Status in River Bend
Out of a total of 4 households in River Bend, 1 (25.0%) are family households, while 3 (75.0%) are nonfamily households. The most numerous type of family households are 2-person households, comprising 1, and the most common type of nonfamily households are 1-person households, comprising 3.
| Household Size | Family Households | Nonfamily Households |
| 1-Person Households | - | 3 (75.0%) |
| 2-Person Households | 1 (25.0%) | 0 (0.0%) |
| 3-Person Households | 0 (0.0%) | 0 (0.0%) |
| 4-Person Households | 0 (0.0%) | 0 (0.0%) |
| 5-Person Households | 0 (0.0%) | 0 (0.0%) |
| 6-Person Households | 0 (0.0%) | 0 (0.0%) |
| 7+ Person Households | 0 (0.0%) | 0 (0.0%) |
| Total | 1 (25.0%) | 3 (75.0%) |
Female Fertility in River Bend
Fertility by Age in River Bend
| Age Bracket | Women with Births | Births / 1,000 Women |
| 15 to 19 years | 0 (0.0%) | 0.0 |
| 20 to 34 years | 0 (0.0%) | 0.0 |
| 35 to 50 years | 0 (0.0%) | 0.0 |
| Total | 0 (0.0%) | 0.0 |
Fertility by Age by Marriage Status in River Bend
| Age Bracket | Married | Unmarried |
| 15 to 19 years | 0 (0.0%) | 0 (0.0%) |
| 20 to 34 years | 0 (0.0%) | 0 (0.0%) |
| 35 to 50 years | 0 (0.0%) | 0 (0.0%) |
| Total | 0 (0.0%) | 0 (0.0%) |
Fertility by Education in River Bend
| Educational Attainment | Women with Births | Births / 1,000 Women |
| Less than High School | 0 (0.0%) | 0.0 |
| High School Diploma | 0 (0.0%) | 0.0 |
| College or Associate's Degree | 0 (0.0%) | 0.0 |
| Bachelor's Degree | 0 (0.0%) | 0.0 |
| Graduate Degree | 0 (0.0%) | 0.0 |
| Total | 0 (0.0%) | 0.0 |
Fertility by Education by Marriage Status in River Bend
| Educational Attainment | Married | Unmarried |
| Less than High School | 0 (0.0%) | 0 (0.0%) |
| High School Diploma | 0 (0.0%) | 0 (0.0%) |
| College or Associate's Degree | 0 (0.0%) | 0 (0.0%) |
| Bachelor's Degree | 0 (0.0%) | 0 (0.0%) |
| Graduate Degree | 0 (0.0%) | 0 (0.0%) |
| Total | 0 (0.0%) | 0 (0.0%) |
Employment Characteristics in River Bend
Employment by Class of Employer in River Bend
Among the 4 employed individuals in River Bend, , and private company employees (4 | 100.0%) make up the most common classes of employment.
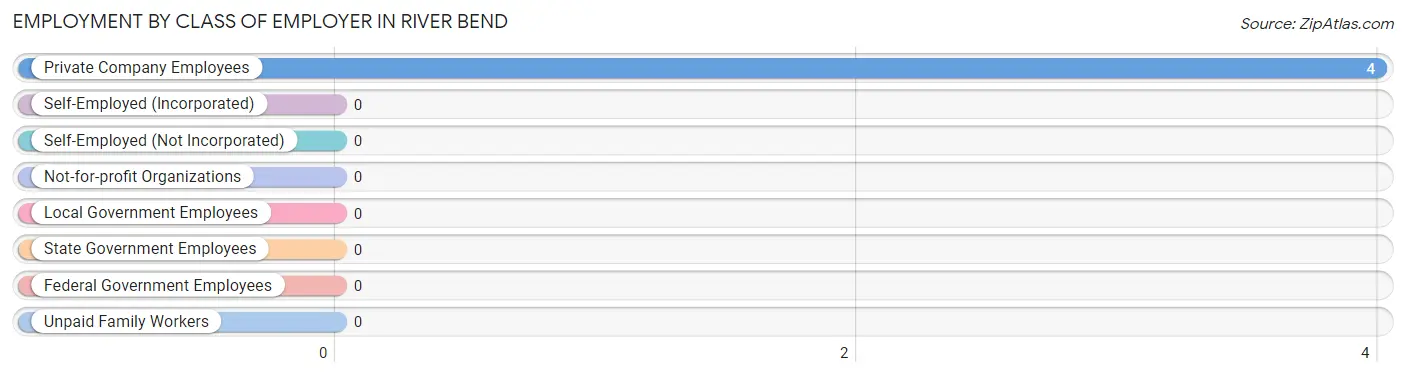
| Employer Class | # Employees | % Employees |
| Private Company Employees | 4 | 100.0% |
| Self-Employed (Incorporated) | 0 | 0.0% |
| Self-Employed (Not Incorporated) | 0 | 0.0% |
| Not-for-profit Organizations | 0 | 0.0% |
| Local Government Employees | 0 | 0.0% |
| State Government Employees | 0 | 0.0% |
| Federal Government Employees | 0 | 0.0% |
| Unpaid Family Workers | 0 | 0.0% |
| Total | 4 | 100.0% |
Employment Status by Age in River Bend
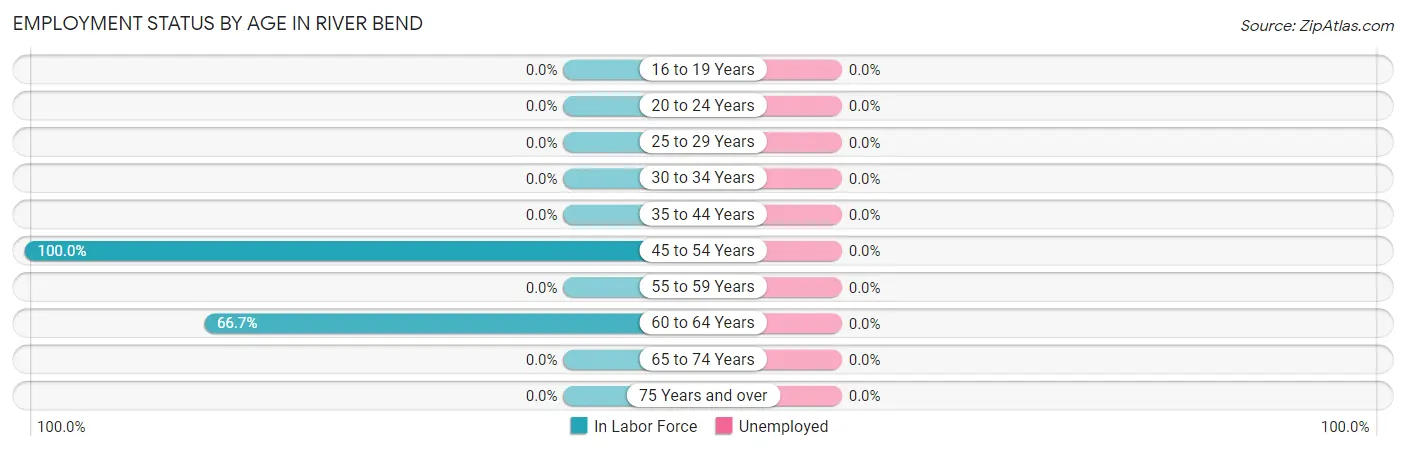
| Age Bracket | In Labor Force | Unemployed |
| 16 to 19 Years | 0 (0.0%) | 0 (0.0%) |
| 20 to 24 Years | 0 (0.0%) | 0 (0.0%) |
| 25 to 29 Years | 0 (0.0%) | 0 (0.0%) |
| 30 to 34 Years | 0 (0.0%) | 0 (0.0%) |
| 35 to 44 Years | 0 (0.0%) | 0 (0.0%) |
| 45 to 54 Years | 2 (100.0%) | 0 (0.0%) |
| 55 to 59 Years | 0 (0.0%) | 0 (0.0%) |
| 60 to 64 Years | 2 (66.7%) | 0 (0.0%) |
| 65 to 74 Years | 0 (0.0%) | 0 (0.0%) |
| 75 Years and over | 0 (0.0%) | 0 (0.0%) |
| Total | 4 (80.0%) | 0 (0.0%) |
Employment Status by Educational Attainment in River Bend
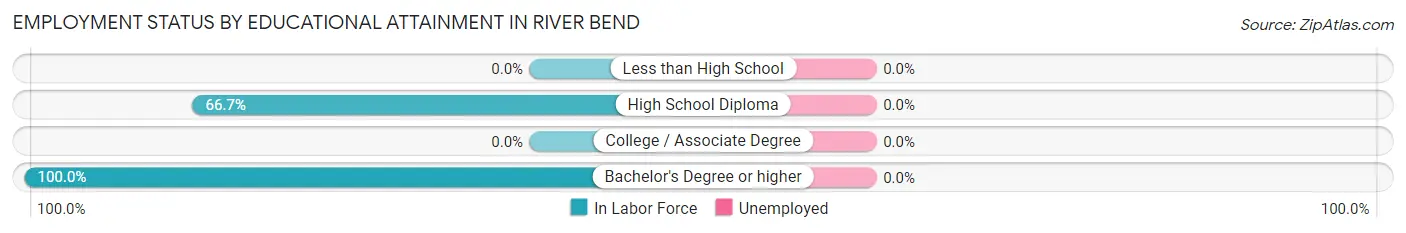
| Educational Attainment | In Labor Force | Unemployed |
| Less than High School | 0 (0.0%) | 0 (0.0%) |
| High School Diploma | 2 (66.7%) | 0 (0.0%) |
| College / Associate Degree | 0 (0.0%) | 0 (0.0%) |
| Bachelor's Degree or higher | 2 (100.0%) | 0 (0.0%) |
| Total | 4 (80.0%) | 0 (0.0%) |
Employment Occupations by Sex in River Bend
Management, Business, Science and Arts Occupations
The most common Management, Business, Science and Arts occupations in River Bend are , and Business & Financial (2 | 50.0%).
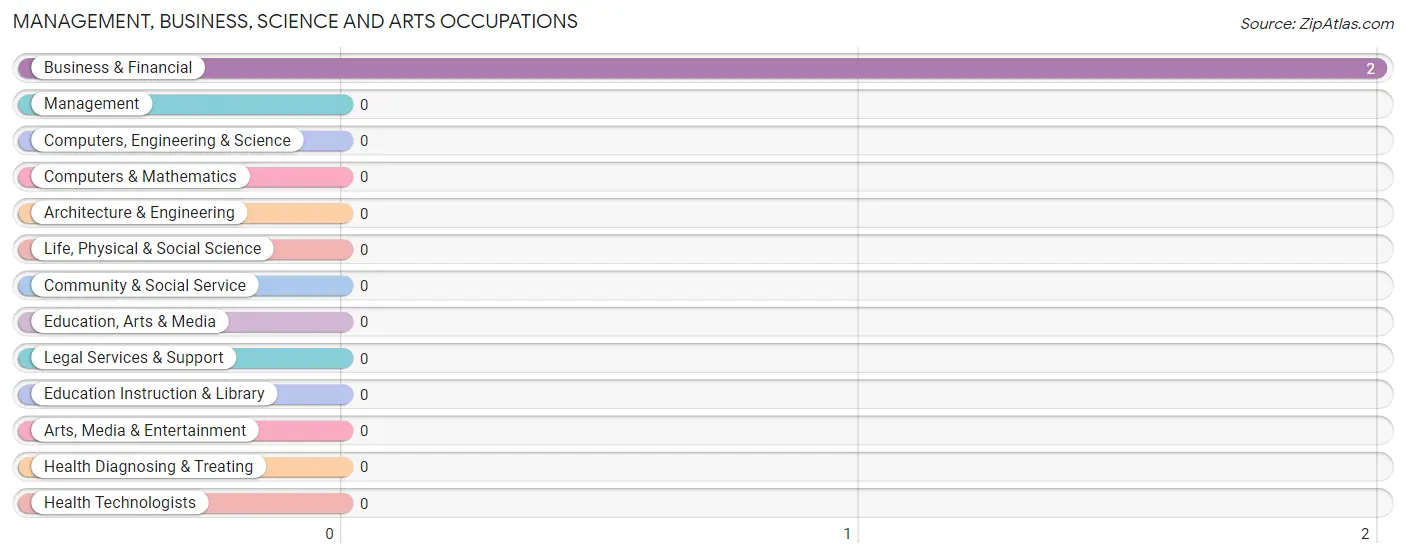
Management, Business, Science and Arts Occupations by Sex
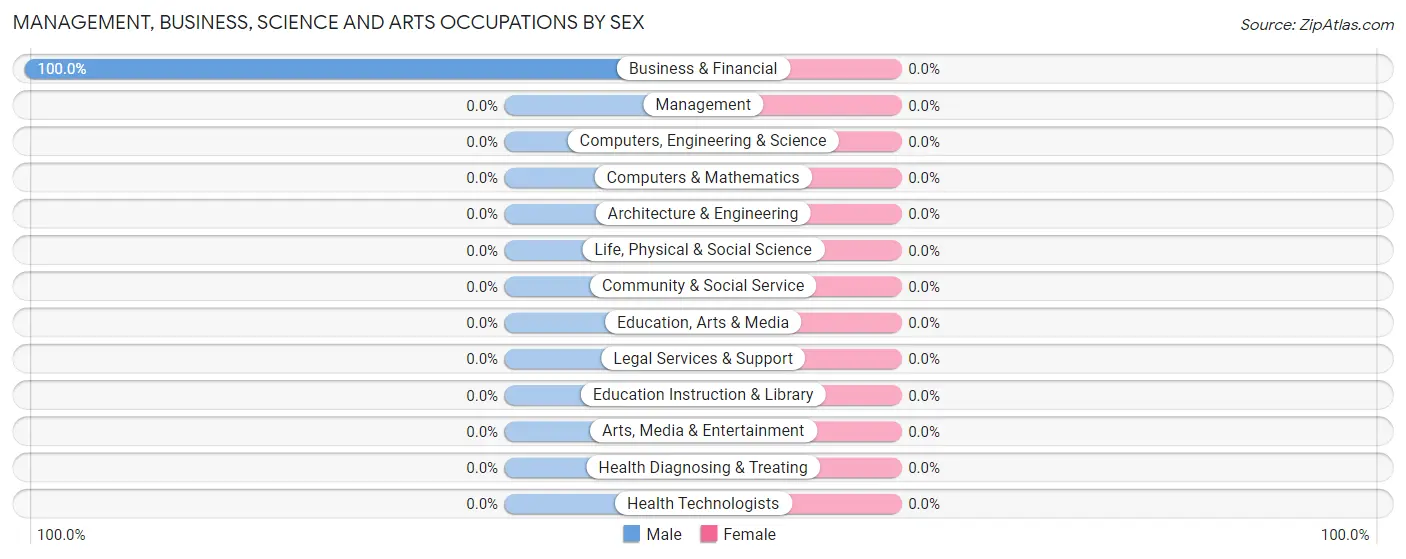
| Occupation | Male | Female |
| Management | 0 (0.0%) | 0 (0.0%) |
| Business & Financial | 2 (100.0%) | 0 (0.0%) |
| Computers, Engineering & Science | 0 (0.0%) | 0 (0.0%) |
| Computers & Mathematics | 0 (0.0%) | 0 (0.0%) |
| Architecture & Engineering | 0 (0.0%) | 0 (0.0%) |
| Life, Physical & Social Science | 0 (0.0%) | 0 (0.0%) |
| Community & Social Service | 0 (0.0%) | 0 (0.0%) |
| Education, Arts & Media | 0 (0.0%) | 0 (0.0%) |
| Legal Services & Support | 0 (0.0%) | 0 (0.0%) |
| Education Instruction & Library | 0 (0.0%) | 0 (0.0%) |
| Arts, Media & Entertainment | 0 (0.0%) | 0 (0.0%) |
| Health Diagnosing & Treating | 0 (0.0%) | 0 (0.0%) |
| Health Technologists | 0 (0.0%) | 0 (0.0%) |
| Total (Category) | 2 (100.0%) | 0 (0.0%) |
| Total (Overall) | 2 (50.0%) | 2 (50.0%) |
Services Occupations
Services Occupations by Sex
| Occupation | Male | Female |
| Healthcare Support | 0 (0.0%) | 0 (0.0%) |
| Security & Protection | 0 (0.0%) | 0 (0.0%) |
| Firefighting & Prevention | 0 (0.0%) | 0 (0.0%) |
| Law Enforcement | 0 (0.0%) | 0 (0.0%) |
| Food Preparation & Serving | 0 (0.0%) | 0 (0.0%) |
| Cleaning & Maintenance | 0 (0.0%) | 0 (0.0%) |
| Personal Care & Service | 0 (0.0%) | 0 (0.0%) |
| Total (Category) | 0 (0.0%) | 0 (0.0%) |
| Total (Overall) | 2 (50.0%) | 2 (50.0%) |
Sales and Office Occupations
The most common Sales and Office occupations in River Bend are , and Office & Administration (2 | 50.0%).
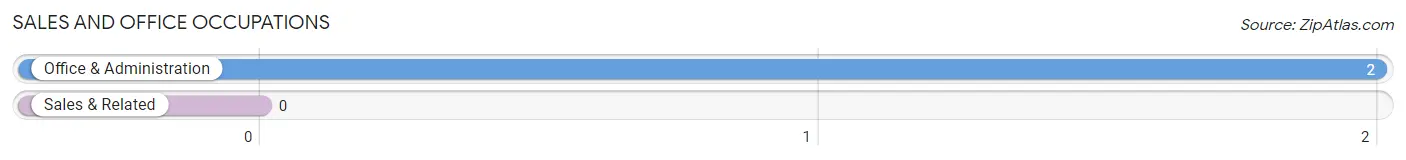
Sales and Office Occupations by Sex
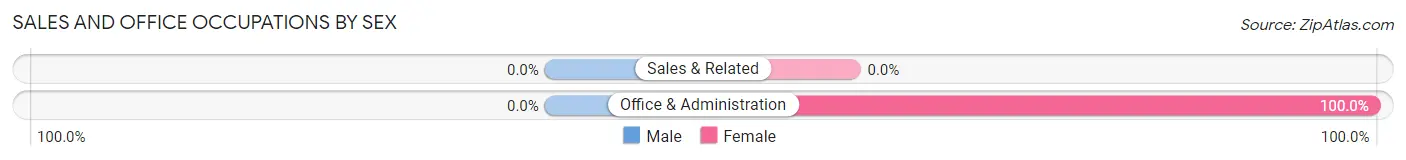
| Occupation | Male | Female |
| Sales & Related | 0 (0.0%) | 0 (0.0%) |
| Office & Administration | 0 (0.0%) | 2 (100.0%) |
| Total (Category) | 0 (0.0%) | 2 (100.0%) |
| Total (Overall) | 2 (50.0%) | 2 (50.0%) |
Natural Resources, Construction and Maintenance Occupations
Natural Resources, Construction and Maintenance Occupations by Sex
| Occupation | Male | Female |
| Farming, Fishing & Forestry | 0 (0.0%) | 0 (0.0%) |
| Construction & Extraction | 0 (0.0%) | 0 (0.0%) |
| Installation, Maintenance & Repair | 0 (0.0%) | 0 (0.0%) |
| Total (Category) | 0 (0.0%) | 0 (0.0%) |
| Total (Overall) | 2 (50.0%) | 2 (50.0%) |
Production, Transportation and Moving Occupations
Production, Transportation and Moving Occupations by Sex
| Occupation | Male | Female |
| Production | 0 (0.0%) | 0 (0.0%) |
| Transportation | 0 (0.0%) | 0 (0.0%) |
| Material Moving | 0 (0.0%) | 0 (0.0%) |
| Total (Category) | 0 (0.0%) | 0 (0.0%) |
| Total (Overall) | 2 (50.0%) | 2 (50.0%) |
Employment Industries by Sex in River Bend
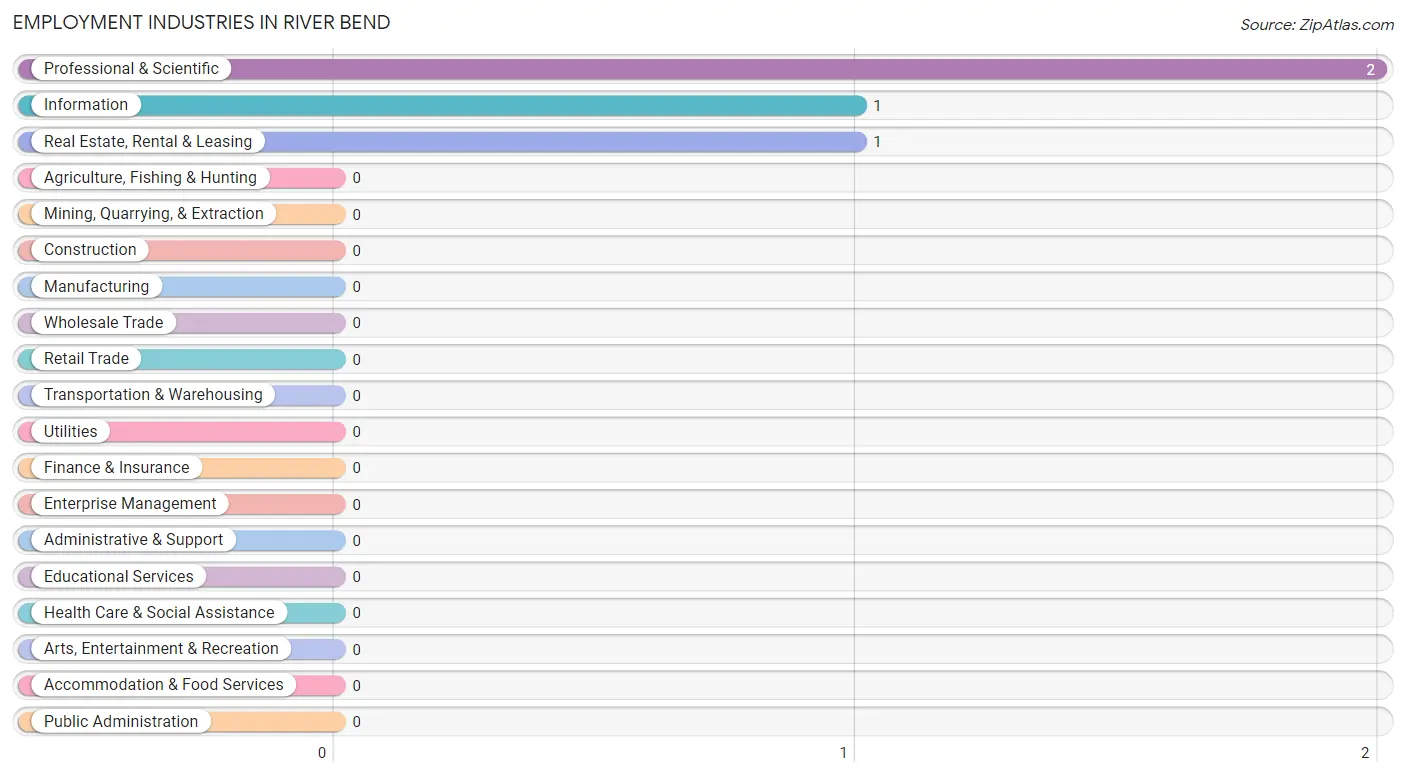
Employment Industries in River Bend
The major employment industries in River Bend include Professional & Scientific (2 | 50.0%), Information (1 | 25.0%), and Real Estate, Rental & Leasing (1 | 25.0%).
Employment Industries by Sex in River Bend
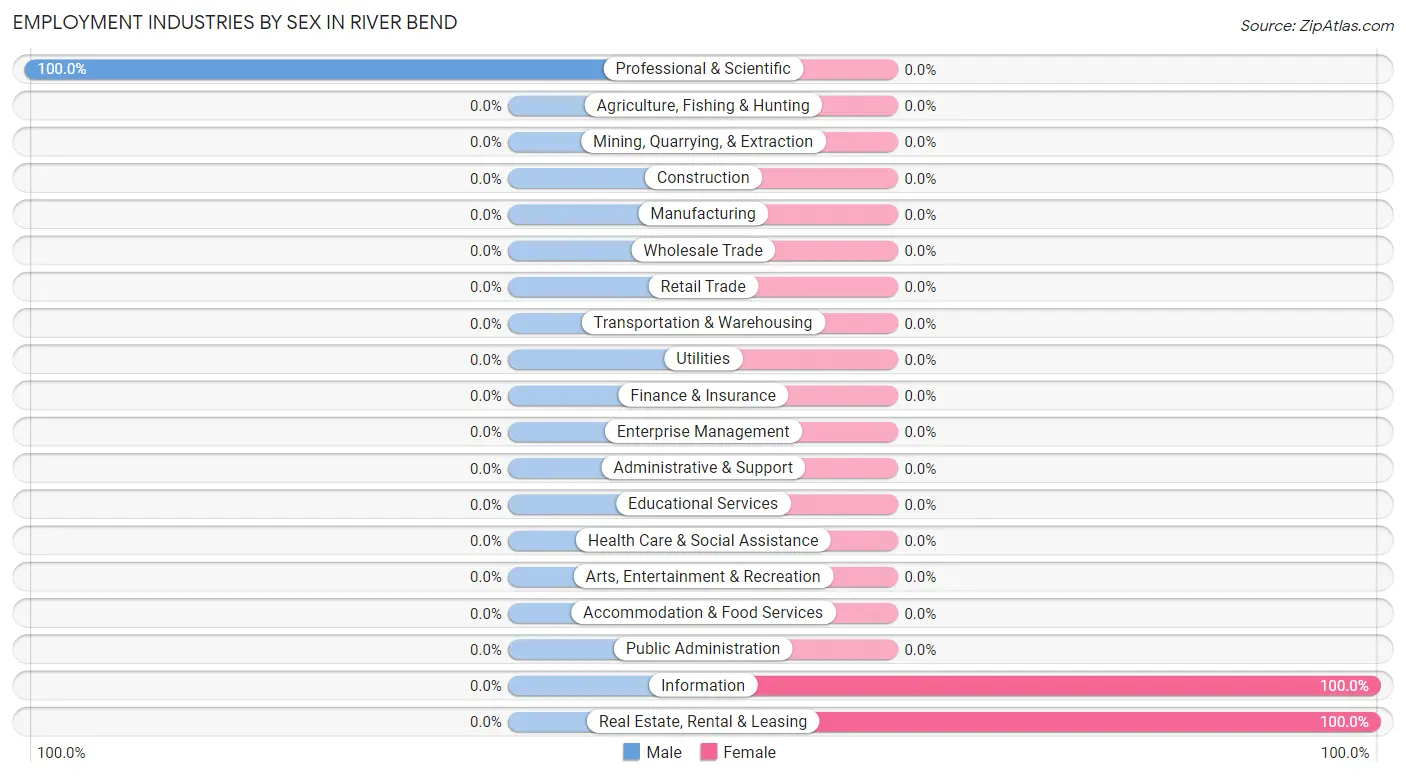
| Industry | Male | Female |
| Agriculture, Fishing & Hunting | 0 (0.0%) | 0 (0.0%) |
| Mining, Quarrying, & Extraction | 0 (0.0%) | 0 (0.0%) |
| Construction | 0 (0.0%) | 0 (0.0%) |
| Manufacturing | 0 (0.0%) | 0 (0.0%) |
| Wholesale Trade | 0 (0.0%) | 0 (0.0%) |
| Retail Trade | 0 (0.0%) | 0 (0.0%) |
| Transportation & Warehousing | 0 (0.0%) | 0 (0.0%) |
| Utilities | 0 (0.0%) | 0 (0.0%) |
| Information | 0 (0.0%) | 1 (100.0%) |
| Finance & Insurance | 0 (0.0%) | 0 (0.0%) |
| Real Estate, Rental & Leasing | 0 (0.0%) | 1 (100.0%) |
| Professional & Scientific | 2 (100.0%) | 0 (0.0%) |
| Enterprise Management | 0 (0.0%) | 0 (0.0%) |
| Administrative & Support | 0 (0.0%) | 0 (0.0%) |
| Educational Services | 0 (0.0%) | 0 (0.0%) |
| Health Care & Social Assistance | 0 (0.0%) | 0 (0.0%) |
| Arts, Entertainment & Recreation | 0 (0.0%) | 0 (0.0%) |
| Accommodation & Food Services | 0 (0.0%) | 0 (0.0%) |
| Public Administration | 0 (0.0%) | 0 (0.0%) |
| Total | 2 (50.0%) | 2 (50.0%) |
Education in River Bend
School Enrollment in River Bend
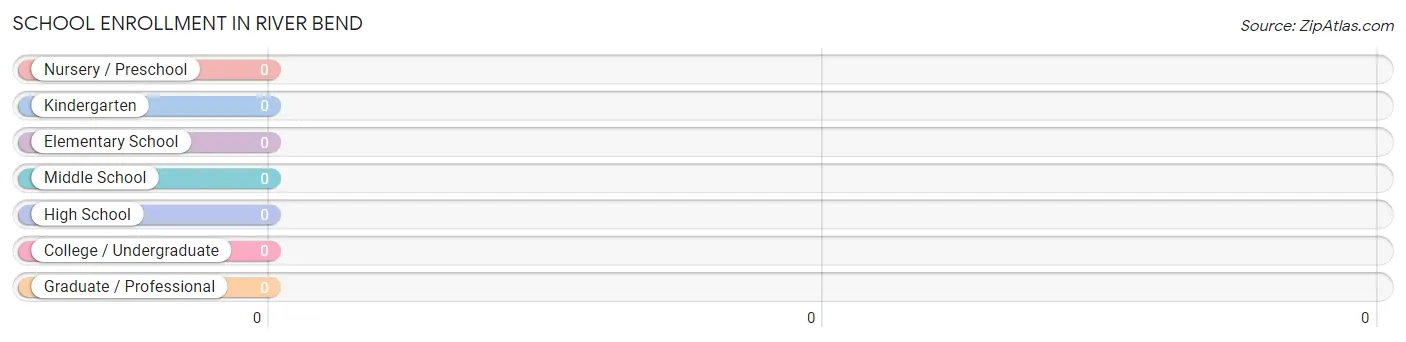
| School Level | # Students | % Students |
| Nursery / Preschool | 0 | 0.0% |
| Kindergarten | 0 | 0.0% |
| Elementary School | 0 | 0.0% |
| Middle School | 0 | 0.0% |
| High School | 0 | 0.0% |
| College / Undergraduate | 0 | 0.0% |
| Graduate / Professional | 0 | 0.0% |
| Total | 0 | 0.0% |
School Enrollment by Age by Funding Source in River Bend
| Age Bracket | Public School | Private School |
| 3 to 4 Year Olds | 0 (0.0%) | 0 (0.0%) |
| 5 to 9 Year Old | 0 (0.0%) | 0 (0.0%) |
| 10 to 14 Year Olds | 0 (0.0%) | 0 (0.0%) |
| 15 to 17 Year Olds | 0 (0.0%) | 0 (0.0%) |
| 18 to 19 Year Olds | 0 (0.0%) | 0 (0.0%) |
| 20 to 24 Year Olds | 0 (0.0%) | 0 (0.0%) |
| 25 to 34 Year Olds | 0 (0.0%) | 0 (0.0%) |
| 35 Years and over | 0 (0.0%) | 0 (0.0%) |
| Total | 0 (0.0%) | 0 (0.0%) |
Educational Attainment by Field of Study in River Bend
, and arts & humanities (2 | 100.0%) are the most common fields of study among 2 individuals in River Bend who have obtained a bachelor's degree or higher.
| Field of Study | # Graduates | % Graduates |
| Computers & Mathematics | 0 | 0.0% |
| Bio, Nature & Agricultural | 0 | 0.0% |
| Physical & Health Sciences | 0 | 0.0% |
| Psychology | 0 | 0.0% |
| Social Sciences | 0 | 0.0% |
| Engineering | 0 | 0.0% |
| Multidisciplinary Studies | 0 | 0.0% |
| Science & Technology | 0 | 0.0% |
| Business | 0 | 0.0% |
| Education | 0 | 0.0% |
| Literature & Languages | 0 | 0.0% |
| Liberal Arts & History | 0 | 0.0% |
| Visual & Performing Arts | 0 | 0.0% |
| Communications | 0 | 0.0% |
| Arts & Humanities | 2 | 100.0% |
| Total | 2 | 100.0% |
Transportation & Commute in River Bend
Vehicle Availability by Sex in River Bend
The most prevalent vehicle ownership categories in River Bend are males with 1 vehicle (2, accounting for 100.0%) and females with 1 vehicle (1, making up 100.0%).
| Vehicles Available | Male | Female |
| No Vehicle | 0 (0.0%) | 0 (0.0%) |
| 1 Vehicle | 2 (100.0%) | 1 (50.0%) |
| 2 Vehicles | 0 (0.0%) | 0 (0.0%) |
| 3 Vehicles | 0 (0.0%) | 1 (50.0%) |
| 4 Vehicles | 0 (0.0%) | 0 (0.0%) |
| 5 or more Vehicles | 0 (0.0%) | 0 (0.0%) |
| Total | 2 (100.0%) | 2 (100.0%) |
Commute Time in River Bend
The most frequently occuring commute durations in River Bend are 35 to 39 minutes (2 commuters, 50.0%), 20 to 24 minutes (1 commuters, 25.0%), and 60 to 89 minutes (1 commuters, 25.0%).
| Commute Time | # Commuters | % Commuters |
| Less than 5 Minutes | 0 | 0.0% |
| 5 to 9 Minutes | 0 | 0.0% |
| 10 to 14 Minutes | 0 | 0.0% |
| 15 to 19 Minutes | 0 | 0.0% |
| 20 to 24 Minutes | 1 | 25.0% |
| 25 to 29 Minutes | 0 | 0.0% |
| 30 to 34 Minutes | 0 | 0.0% |
| 35 to 39 Minutes | 2 | 50.0% |
| 40 to 44 Minutes | 0 | 0.0% |
| 45 to 59 Minutes | 0 | 0.0% |
| 60 to 89 Minutes | 1 | 25.0% |
| 90 or more Minutes | 0 | 0.0% |
Commute Time by Sex in River Bend
The most common commute times in River Bend are 35 to 39 minutes (2 commuters, 100.0%) for males and 20 to 24 minutes (1 commuters, 50.0%) for females.
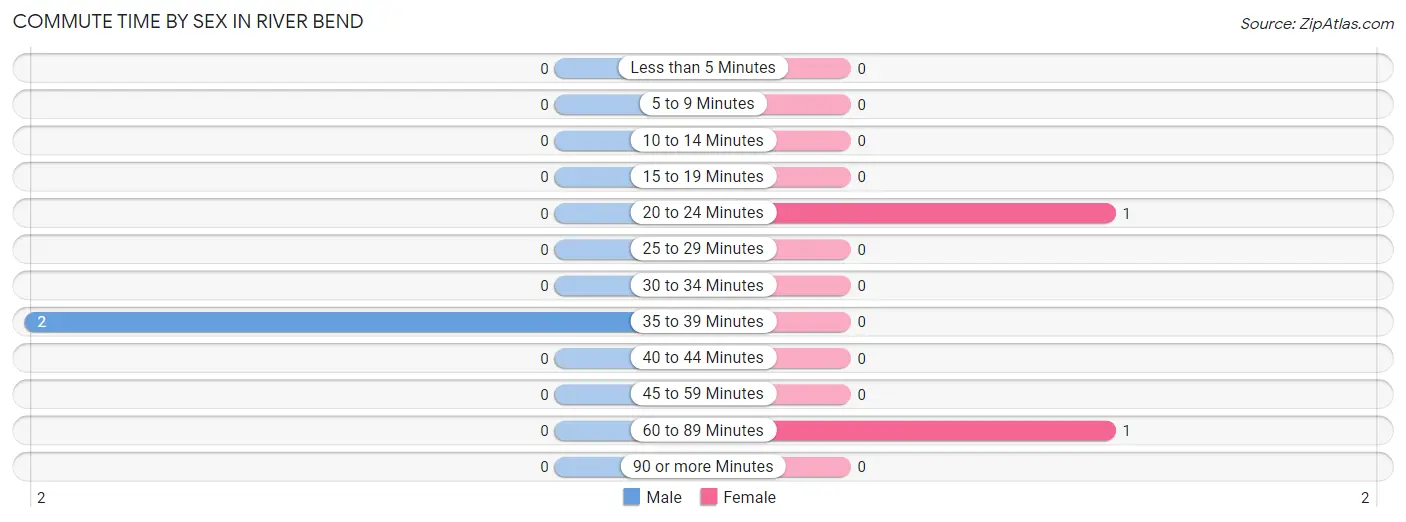
| Commute Time | Male | Female |
| Less than 5 Minutes | 0 (0.0%) | 0 (0.0%) |
| 5 to 9 Minutes | 0 (0.0%) | 0 (0.0%) |
| 10 to 14 Minutes | 0 (0.0%) | 0 (0.0%) |
| 15 to 19 Minutes | 0 (0.0%) | 0 (0.0%) |
| 20 to 24 Minutes | 0 (0.0%) | 1 (50.0%) |
| 25 to 29 Minutes | 0 (0.0%) | 0 (0.0%) |
| 30 to 34 Minutes | 0 (0.0%) | 0 (0.0%) |
| 35 to 39 Minutes | 2 (100.0%) | 0 (0.0%) |
| 40 to 44 Minutes | 0 (0.0%) | 0 (0.0%) |
| 45 to 59 Minutes | 0 (0.0%) | 0 (0.0%) |
| 60 to 89 Minutes | 0 (0.0%) | 1 (50.0%) |
| 90 or more Minutes | 0 (0.0%) | 0 (0.0%) |
Time of Departure to Work by Sex in River Bend
The most frequent times of departure to work in River Bend are 7:00 AM to 7:29 AM (2, 100.0%) for males and 6:00 AM to 6:29 AM (1, 50.0%) for females.
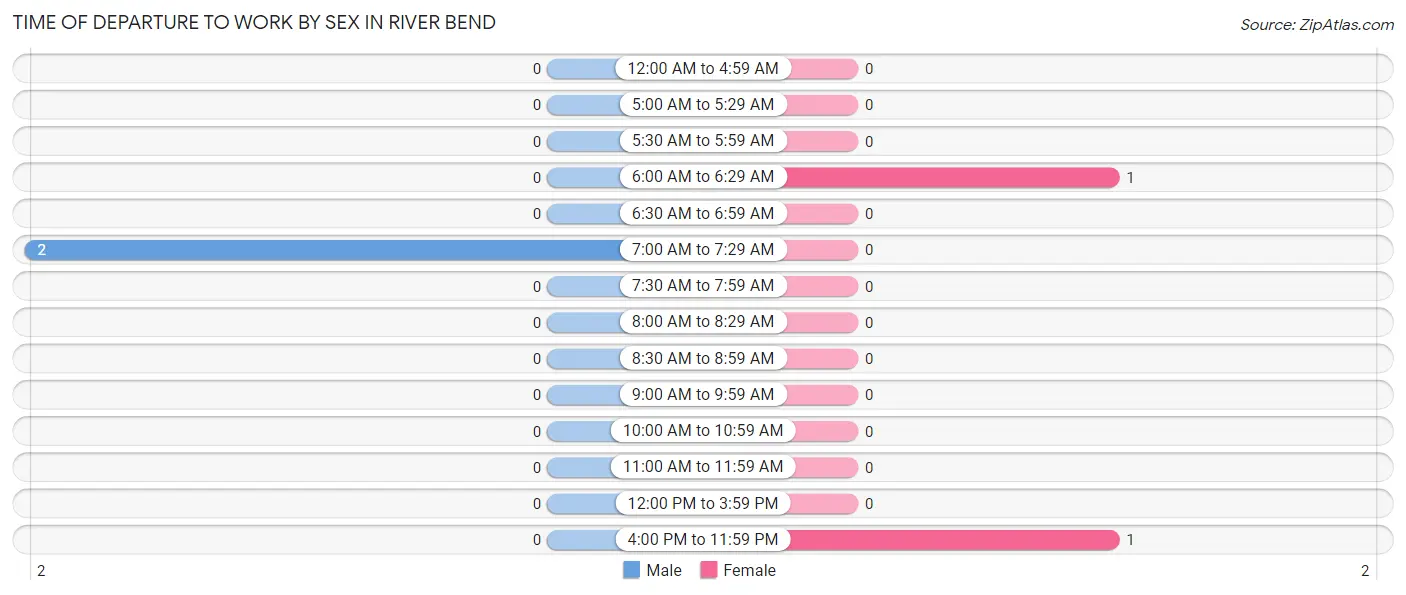
| Time of Departure | Male | Female |
| 12:00 AM to 4:59 AM | 0 (0.0%) | 0 (0.0%) |
| 5:00 AM to 5:29 AM | 0 (0.0%) | 0 (0.0%) |
| 5:30 AM to 5:59 AM | 0 (0.0%) | 0 (0.0%) |
| 6:00 AM to 6:29 AM | 0 (0.0%) | 1 (50.0%) |
| 6:30 AM to 6:59 AM | 0 (0.0%) | 0 (0.0%) |
| 7:00 AM to 7:29 AM | 2 (100.0%) | 0 (0.0%) |
| 7:30 AM to 7:59 AM | 0 (0.0%) | 0 (0.0%) |
| 8:00 AM to 8:29 AM | 0 (0.0%) | 0 (0.0%) |
| 8:30 AM to 8:59 AM | 0 (0.0%) | 0 (0.0%) |
| 9:00 AM to 9:59 AM | 0 (0.0%) | 0 (0.0%) |
| 10:00 AM to 10:59 AM | 0 (0.0%) | 0 (0.0%) |
| 11:00 AM to 11:59 AM | 0 (0.0%) | 0 (0.0%) |
| 12:00 PM to 3:59 PM | 0 (0.0%) | 0 (0.0%) |
| 4:00 PM to 11:59 PM | 0 (0.0%) | 1 (50.0%) |
| Total | 2 (100.0%) | 2 (100.0%) |
Housing Occupancy in River Bend
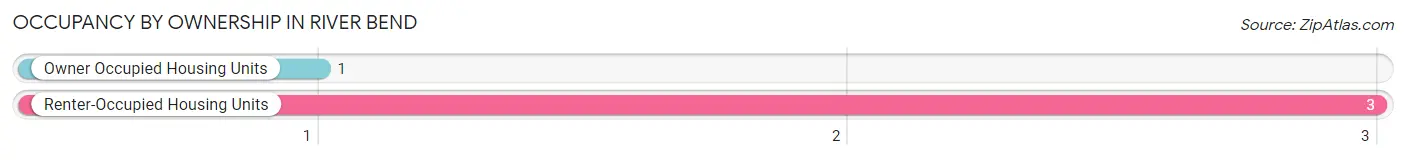
Occupancy by Ownership in River Bend
Of the total 4 dwellings in River Bend, owner-occupied units account for 1 (25.0%), while renter-occupied units make up 3 (75.0%).
| Occupancy | # Housing Units | % Housing Units |
| Owner Occupied Housing Units | 1 | 25.0% |
| Renter-Occupied Housing Units | 3 | 75.0% |
| Total Occupied Housing Units | 4 | 100.0% |
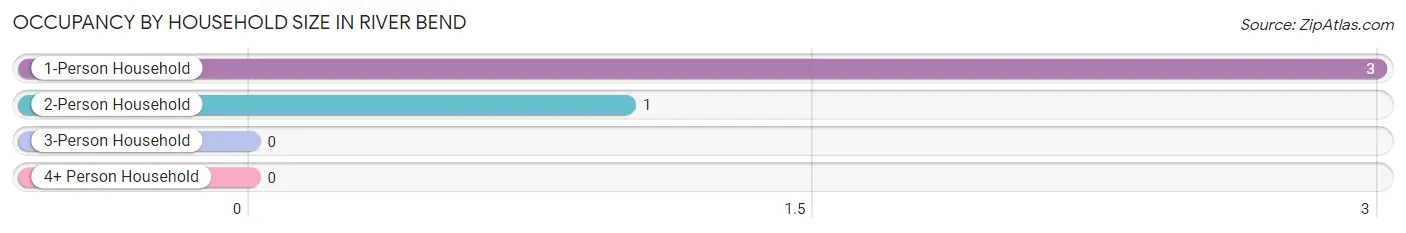
Occupancy by Household Size in River Bend
| Household Size | # Housing Units | % Housing Units |
| 1-Person Household | 3 | 75.0% |
| 2-Person Household | 1 | 25.0% |
| 3-Person Household | 0 | 0.0% |
| 4+ Person Household | 0 | 0.0% |
| Total Housing Units | 4 | 100.0% |
Occupancy by Ownership by Household Size in River Bend
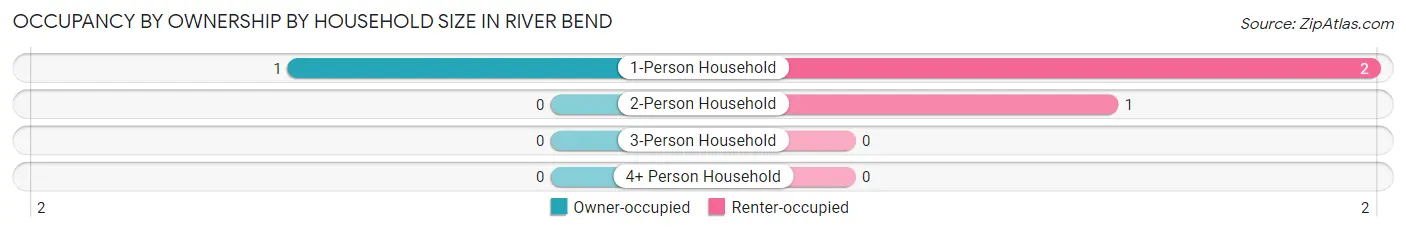
| Household Size | Owner-occupied | Renter-occupied |
| 1-Person Household | 1 (33.3%) | 2 (66.7%) |
| 2-Person Household | 0 (0.0%) | 1 (100.0%) |
| 3-Person Household | 0 (0.0%) | 0 (0.0%) |
| 4+ Person Household | 0 (0.0%) | 0 (0.0%) |
| Total Housing Units | 1 (25.0%) | 3 (75.0%) |
Occupancy by Educational Attainment in River Bend
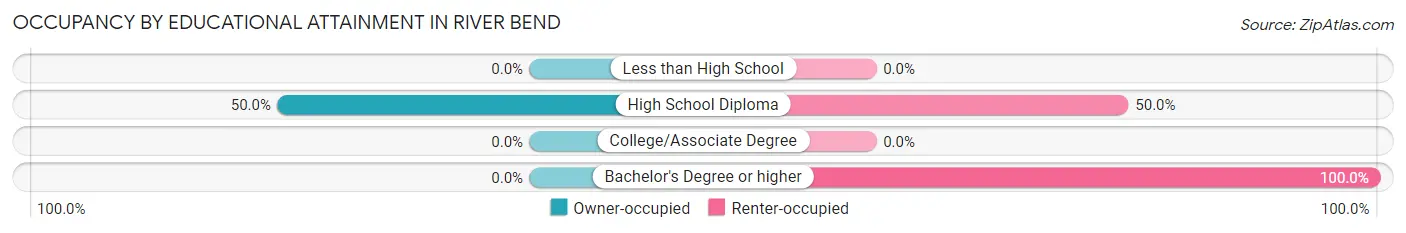
| Household Size | Owner-occupied | Renter-occupied |
| Less than High School | 0 (0.0%) | 0 (0.0%) |
| High School Diploma | 1 (50.0%) | 1 (50.0%) |
| College/Associate Degree | 0 (0.0%) | 0 (0.0%) |
| Bachelor's Degree or higher | 0 (0.0%) | 2 (100.0%) |
Occupancy by Age of Householder in River Bend
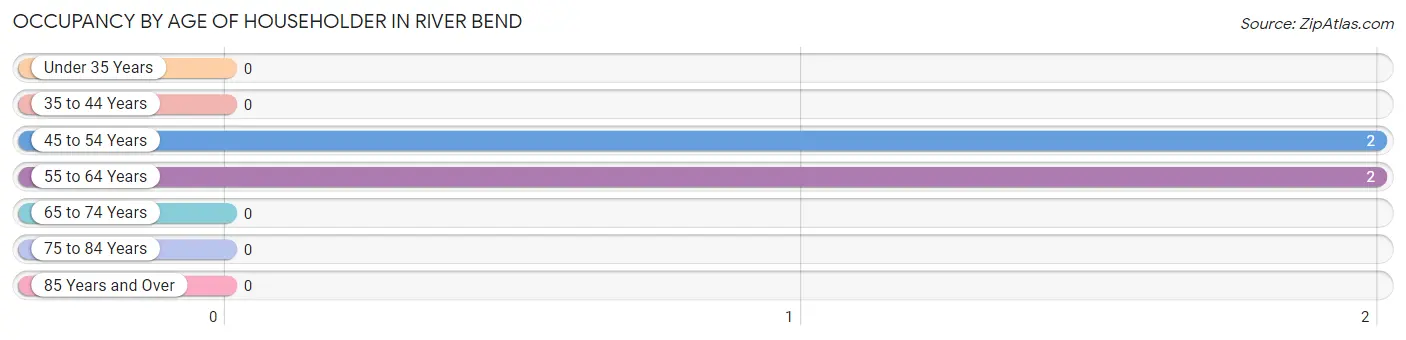
| Age Bracket | # Households | % Households |
| Under 35 Years | 0 | 0.0% |
| 35 to 44 Years | 0 | 0.0% |
| 45 to 54 Years | 2 | 50.0% |
| 55 to 64 Years | 2 | 50.0% |
| 65 to 74 Years | 0 | 0.0% |
| 75 to 84 Years | 0 | 0.0% |
| 85 Years and Over | 0 | 0.0% |
| Total | 4 | 100.0% |
Housing Finances in River Bend
Median Income by Occupancy in River Bend
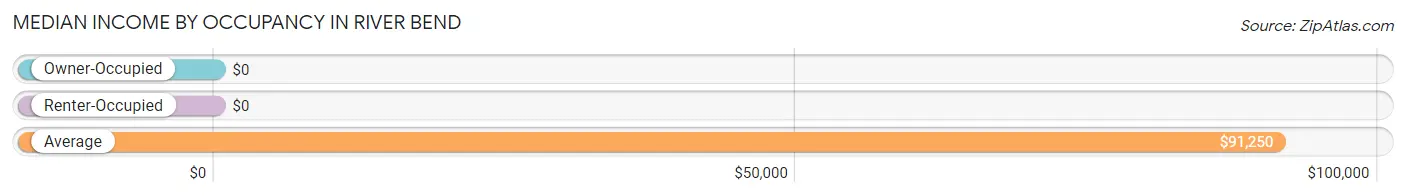
| Occupancy Type | # Households | Median Income |
| Owner-Occupied | 1 (25.0%) | $0 |
| Renter-Occupied | 3 (75.0%) | $0 |
| Average | 4 (100.0%) | $91,250 |
Occupancy by Householder Income Bracket in River Bend
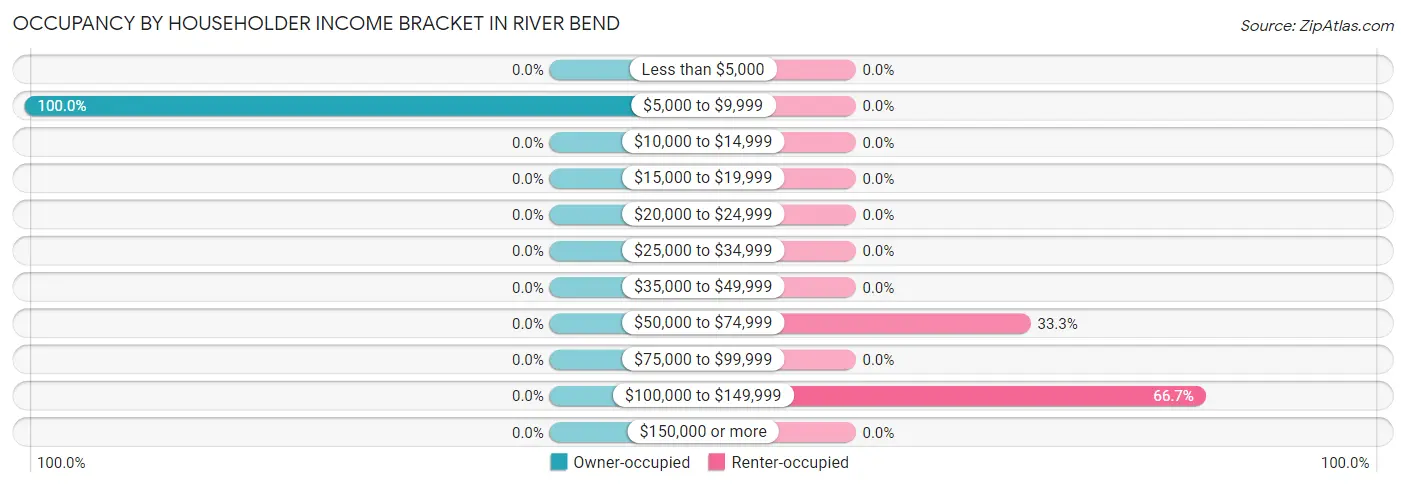
| Income Bracket | Owner-occupied | Renter-occupied |
| Less than $5,000 | 0 (0.0%) | 0 (0.0%) |
| $5,000 to $9,999 | 1 (100.0%) | 0 (0.0%) |
| $10,000 to $14,999 | 0 (0.0%) | 0 (0.0%) |
| $15,000 to $19,999 | 0 (0.0%) | 0 (0.0%) |
| $20,000 to $24,999 | 0 (0.0%) | 0 (0.0%) |
| $25,000 to $34,999 | 0 (0.0%) | 0 (0.0%) |
| $35,000 to $49,999 | 0 (0.0%) | 0 (0.0%) |
| $50,000 to $74,999 | 0 (0.0%) | 1 (33.3%) |
| $75,000 to $99,999 | 0 (0.0%) | 0 (0.0%) |
| $100,000 to $149,999 | 0 (0.0%) | 2 (66.7%) |
| $150,000 or more | 0 (0.0%) | 0 (0.0%) |
| Total | 1 (100.0%) | 3 (100.0%) |
Monthly Housing Cost Tiers in River Bend
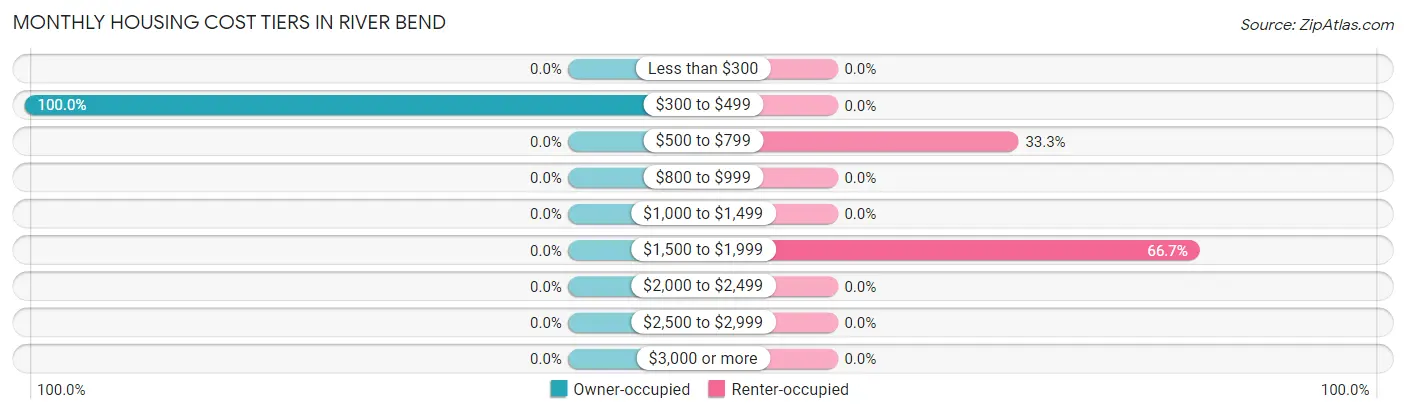
| Monthly Cost | Owner-occupied | Renter-occupied |
| Less than $300 | 0 (0.0%) | 0 (0.0%) |
| $300 to $499 | 1 (100.0%) | 0 (0.0%) |
| $500 to $799 | 0 (0.0%) | 1 (33.3%) |
| $800 to $999 | 0 (0.0%) | 0 (0.0%) |
| $1,000 to $1,499 | 0 (0.0%) | 0 (0.0%) |
| $1,500 to $1,999 | 0 (0.0%) | 2 (66.7%) |
| $2,000 to $2,499 | 0 (0.0%) | 0 (0.0%) |
| $2,500 to $2,999 | 0 (0.0%) | 0 (0.0%) |
| $3,000 or more | 0 (0.0%) | 0 (0.0%) |
| Total | 1 (100.0%) | 3 (100.0%) |
Physical Housing Characteristics in River Bend
Housing Structures in River Bend
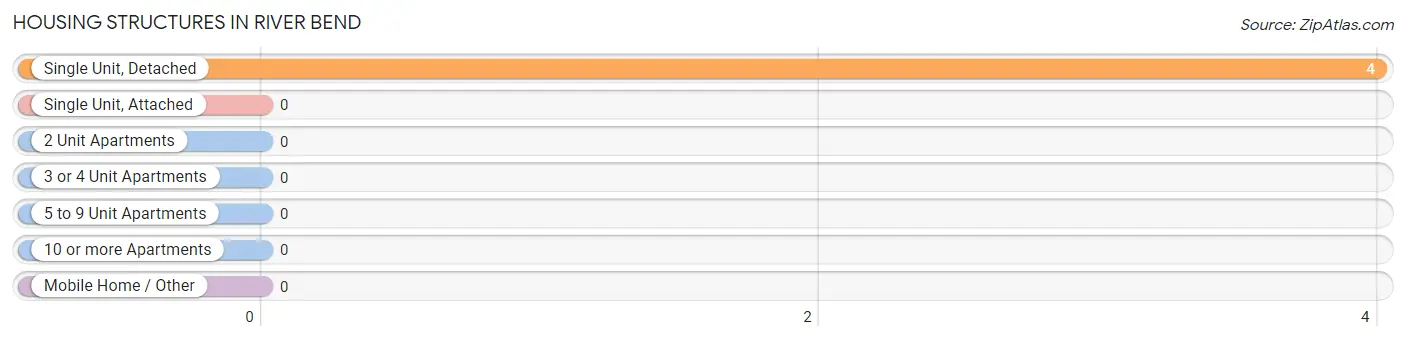
| Structure Type | # Housing Units | % Housing Units |
| Single Unit, Detached | 4 | 100.0% |
| Single Unit, Attached | 0 | 0.0% |
| 2 Unit Apartments | 0 | 0.0% |
| 3 or 4 Unit Apartments | 0 | 0.0% |
| 5 to 9 Unit Apartments | 0 | 0.0% |
| 10 or more Apartments | 0 | 0.0% |
| Mobile Home / Other | 0 | 0.0% |
| Total | 4 | 100.0% |
Housing Structures by Occupancy in River Bend
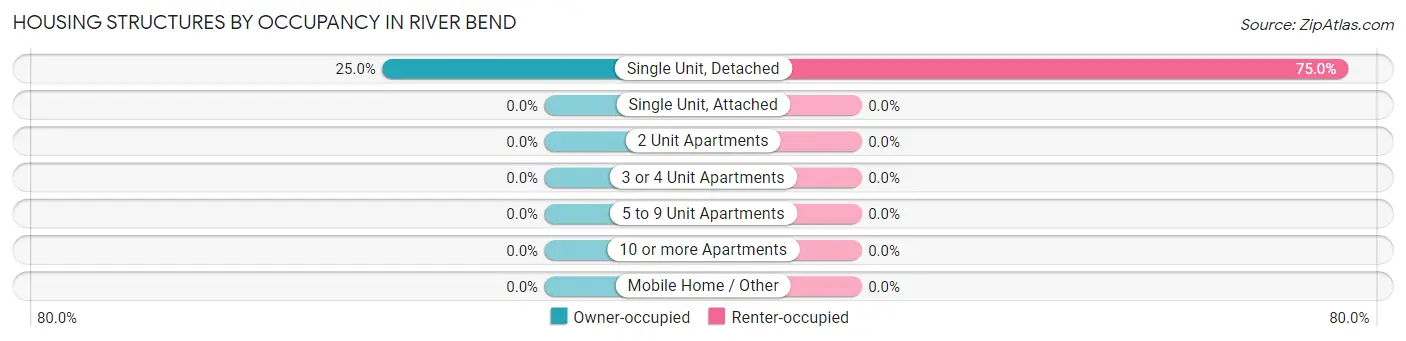
| Structure Type | Owner-occupied | Renter-occupied |
| Single Unit, Detached | 1 (25.0%) | 3 (75.0%) |
| Single Unit, Attached | 0 (0.0%) | 0 (0.0%) |
| 2 Unit Apartments | 0 (0.0%) | 0 (0.0%) |
| 3 or 4 Unit Apartments | 0 (0.0%) | 0 (0.0%) |
| 5 to 9 Unit Apartments | 0 (0.0%) | 0 (0.0%) |
| 10 or more Apartments | 0 (0.0%) | 0 (0.0%) |
| Mobile Home / Other | 0 (0.0%) | 0 (0.0%) |
| Total | 1 (25.0%) | 3 (75.0%) |
Housing Structures by Number of Rooms in River Bend
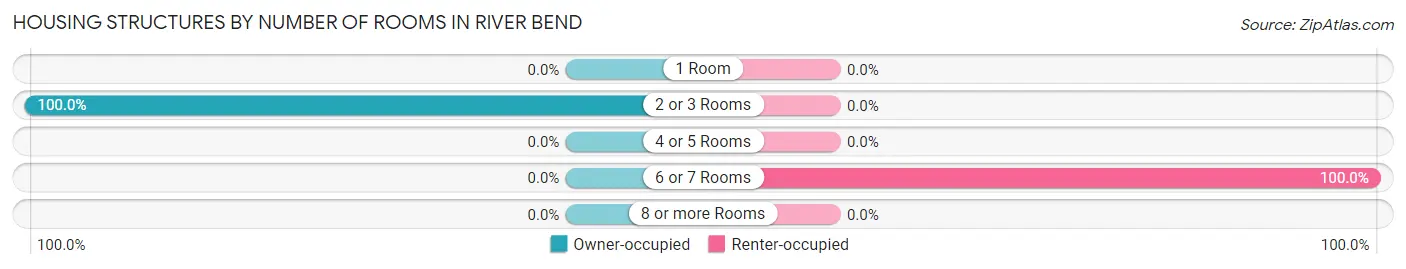
| Number of Rooms | Owner-occupied | Renter-occupied |
| 1 Room | 0 (0.0%) | 0 (0.0%) |
| 2 or 3 Rooms | 1 (100.0%) | 0 (0.0%) |
| 4 or 5 Rooms | 0 (0.0%) | 0 (0.0%) |
| 6 or 7 Rooms | 0 (0.0%) | 3 (100.0%) |
| 8 or more Rooms | 0 (0.0%) | 0 (0.0%) |
| Total | 1 (100.0%) | 3 (100.0%) |
Housing Structure by Heating Type in River Bend
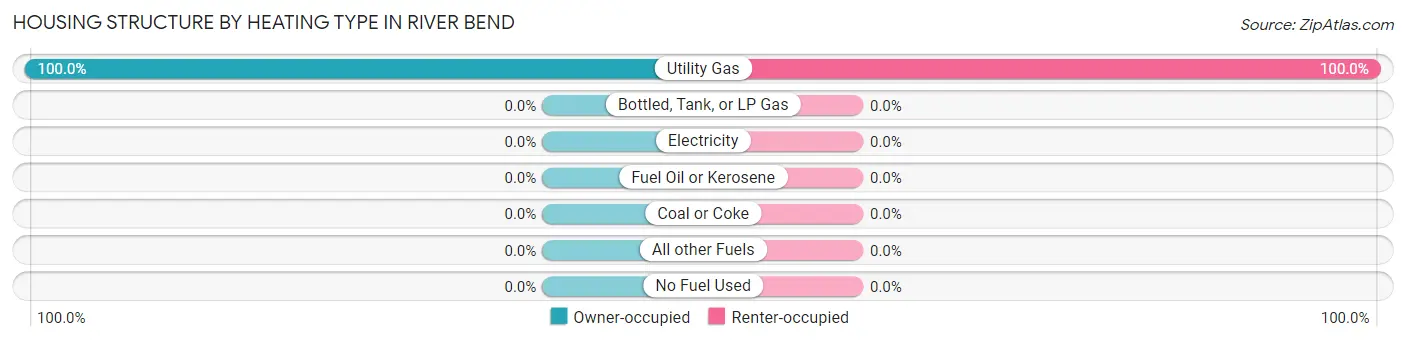
| Heating Type | Owner-occupied | Renter-occupied |
| Utility Gas | 1 (100.0%) | 3 (100.0%) |
| Bottled, Tank, or LP Gas | 0 (0.0%) | 0 (0.0%) |
| Electricity | 0 (0.0%) | 0 (0.0%) |
| Fuel Oil or Kerosene | 0 (0.0%) | 0 (0.0%) |
| Coal or Coke | 0 (0.0%) | 0 (0.0%) |
| All other Fuels | 0 (0.0%) | 0 (0.0%) |
| No Fuel Used | 0 (0.0%) | 0 (0.0%) |
| Total | 1 (100.0%) | 3 (100.0%) |
Household Vehicle Usage in River Bend
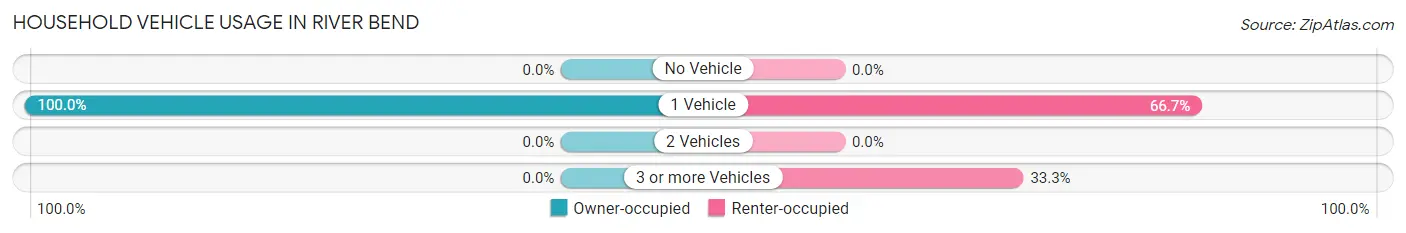
| Vehicles per Household | Owner-occupied | Renter-occupied |
| No Vehicle | 0 (0.0%) | 0 (0.0%) |
| 1 Vehicle | 1 (100.0%) | 2 (66.7%) |
| 2 Vehicles | 0 (0.0%) | 0 (0.0%) |
| 3 or more Vehicles | 0 (0.0%) | 1 (33.3%) |
| Total | 1 (100.0%) | 3 (100.0%) |
Real Estate & Mortgages in River Bend
Real Estate and Mortgage Overview in River Bend
| Characteristic | Without Mortgage | With Mortgage |
| Housing Units | 1 | 0 |
| Median Property Value | - | - |
| Median Household Income | - | - |
| Monthly Housing Costs | - | - |
| Real Estate Taxes | - | - |
Property Value by Mortgage Status in River Bend
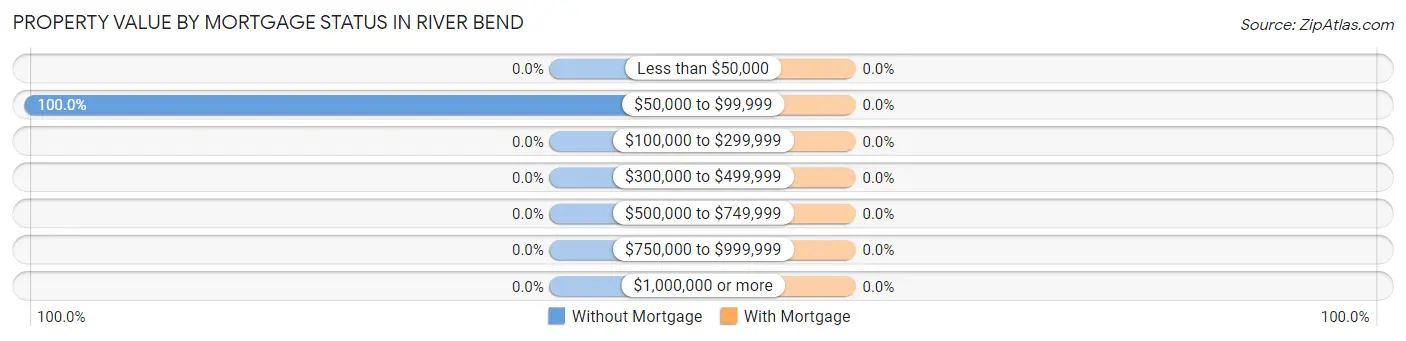
| Property Value | Without Mortgage | With Mortgage |
| Less than $50,000 | 0 (0.0%) | 0 (0.0%) |
| $50,000 to $99,999 | 1 (100.0%) | 0 (0.0%) |
| $100,000 to $299,999 | 0 (0.0%) | 0 (0.0%) |
| $300,000 to $499,999 | 0 (0.0%) | 0 (0.0%) |
| $500,000 to $749,999 | 0 (0.0%) | 0 (0.0%) |
| $750,000 to $999,999 | 0 (0.0%) | 0 (0.0%) |
| $1,000,000 or more | 0 (0.0%) | 0 (0.0%) |
| Total | 1 (100.0%) | 0 (0.0%) |
Household Income by Mortgage Status in River Bend
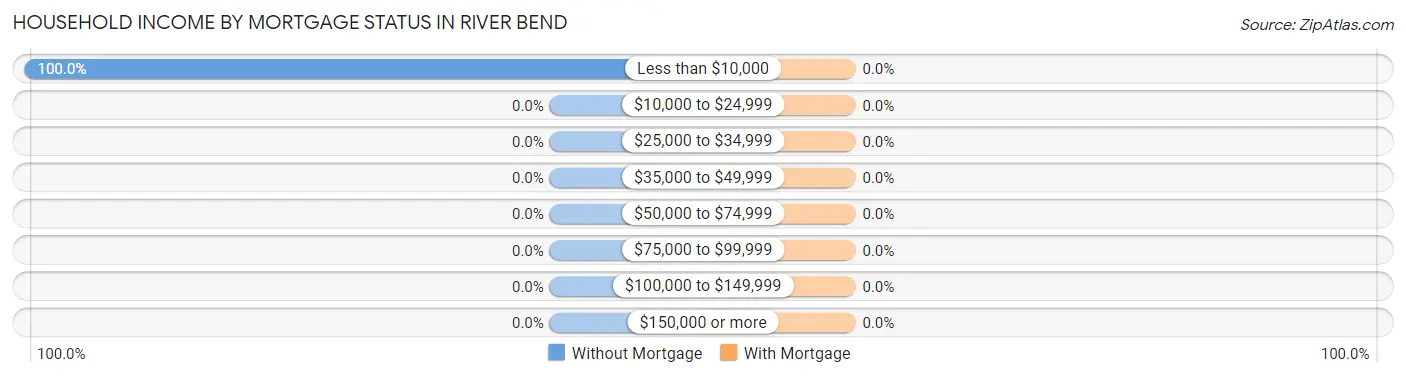
| Household Income | Without Mortgage | With Mortgage |
| Less than $10,000 | 1 (100.0%) | 0 (0.0%) |
| $10,000 to $24,999 | 0 (0.0%) | 0 (0.0%) |
| $25,000 to $34,999 | 0 (0.0%) | 0 (0.0%) |
| $35,000 to $49,999 | 0 (0.0%) | 0 (0.0%) |
| $50,000 to $74,999 | 0 (0.0%) | 0 (0.0%) |
| $75,000 to $99,999 | 0 (0.0%) | 0 (0.0%) |
| $100,000 to $149,999 | 0 (0.0%) | 0 (0.0%) |
| $150,000 or more | 0 (0.0%) | 0 (0.0%) |
| Total | 1 (100.0%) | 0 (0.0%) |
Property Value to Household Income Ratio in River Bend
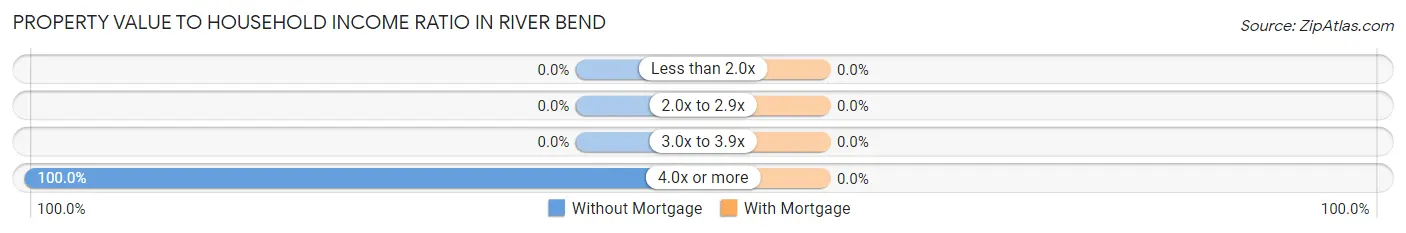
| Value-to-Income Ratio | Without Mortgage | With Mortgage |
| Less than 2.0x | 0 (0.0%) | 0 (0.0%) |
| 2.0x to 2.9x | 0 (0.0%) | 0 (0.0%) |
| 3.0x to 3.9x | 0 (0.0%) | 0 (0.0%) |
| 4.0x or more | 1 (100.0%) | 0 (0.0%) |
| Total | 1 (100.0%) | 0 (0.0%) |
Real Estate Taxes by Mortgage Status in River Bend
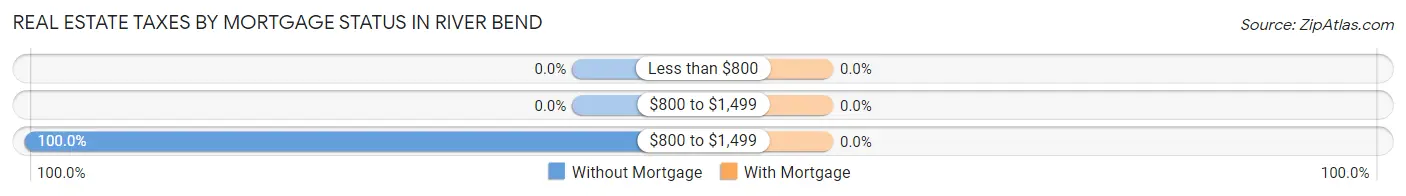
| Property Taxes | Without Mortgage | With Mortgage |
| Less than $800 | 0 (0.0%) | 0 (0.0%) |
| $800 to $1,499 | 0 (0.0%) | 0 (0.0%) |
| $800 to $1,499 | 1 (100.0%) | 0 (0.0%) |
| Total | 1 (100.0%) | 0 (0.0%) |
Health & Disability in River Bend
Health Insurance Coverage by Age in River Bend
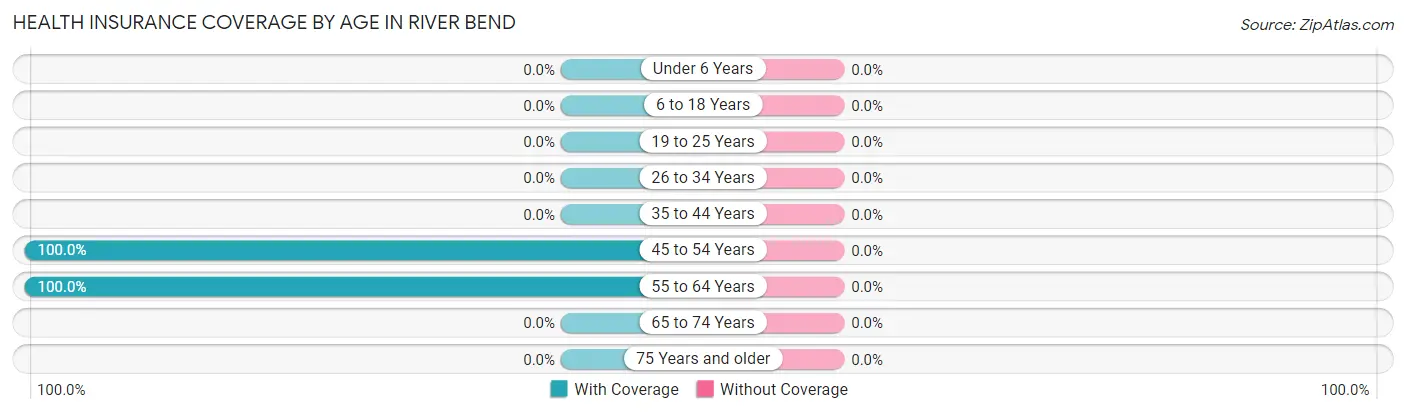
| Age Bracket | With Coverage | Without Coverage |
| Under 6 Years | 0 (0.0%) | 0 (0.0%) |
| 6 to 18 Years | 0 (0.0%) | 0 (0.0%) |
| 19 to 25 Years | 0 (0.0%) | 0 (0.0%) |
| 26 to 34 Years | 0 (0.0%) | 0 (0.0%) |
| 35 to 44 Years | 0 (0.0%) | 0 (0.0%) |
| 45 to 54 Years | 2 (100.0%) | 0 (0.0%) |
| 55 to 64 Years | 3 (100.0%) | 0 (0.0%) |
| 65 to 74 Years | 0 (0.0%) | 0 (0.0%) |
| 75 Years and older | 0 (0.0%) | 0 (0.0%) |
| Total | 5 (100.0%) | 0 (0.0%) |
Health Insurance Coverage by Citizenship Status in River Bend
| Citizenship Status | With Coverage | Without Coverage |
| Native Born | 0 (0.0%) | 0 (0.0%) |
| Foreign Born, Citizen | 0 (0.0%) | 0 (0.0%) |
| Foreign Born, not a Citizen | 0 (0.0%) | 0 (0.0%) |
Health Insurance Coverage by Household Income in River Bend
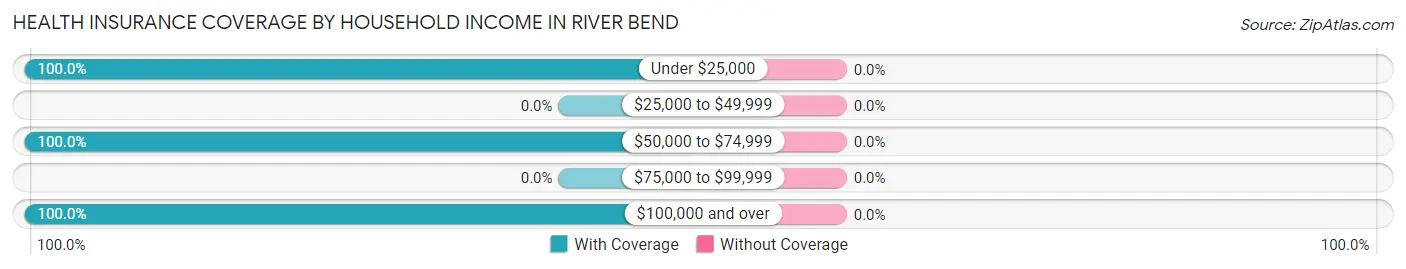
| Household Income | With Coverage | Without Coverage |
| Under $25,000 | 1 (100.0%) | 0 (0.0%) |
| $25,000 to $49,999 | 0 (0.0%) | 0 (0.0%) |
| $50,000 to $74,999 | 2 (100.0%) | 0 (0.0%) |
| $75,000 to $99,999 | 0 (0.0%) | 0 (0.0%) |
| $100,000 and over | 2 (100.0%) | 0 (0.0%) |
Public vs Private Health Insurance Coverage by Age in River Bend
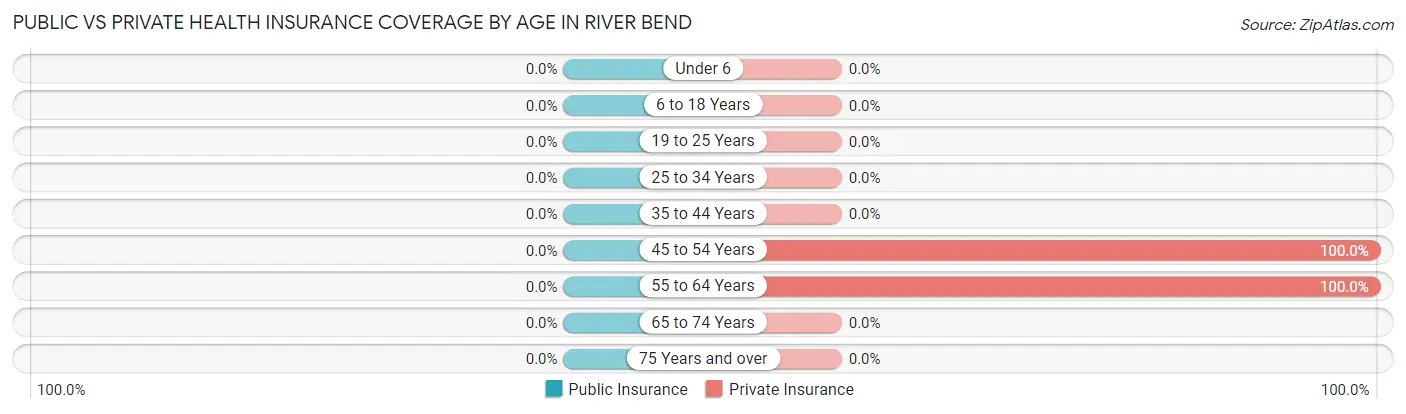
| Age Bracket | Public Insurance | Private Insurance |
| Under 6 | 0 (0.0%) | 0 (0.0%) |
| 6 to 18 Years | 0 (0.0%) | 0 (0.0%) |
| 19 to 25 Years | 0 (0.0%) | 0 (0.0%) |
| 25 to 34 Years | 0 (0.0%) | 0 (0.0%) |
| 35 to 44 Years | 0 (0.0%) | 0 (0.0%) |
| 45 to 54 Years | 0 (0.0%) | 2 (100.0%) |
| 55 to 64 Years | 0 (0.0%) | 3 (100.0%) |
| 65 to 74 Years | 0 (0.0%) | 0 (0.0%) |
| 75 Years and over | 0 (0.0%) | 0 (0.0%) |
| Total | 0 (0.0%) | 5 (100.0%) |
Disability Status by Sex by Age in River Bend
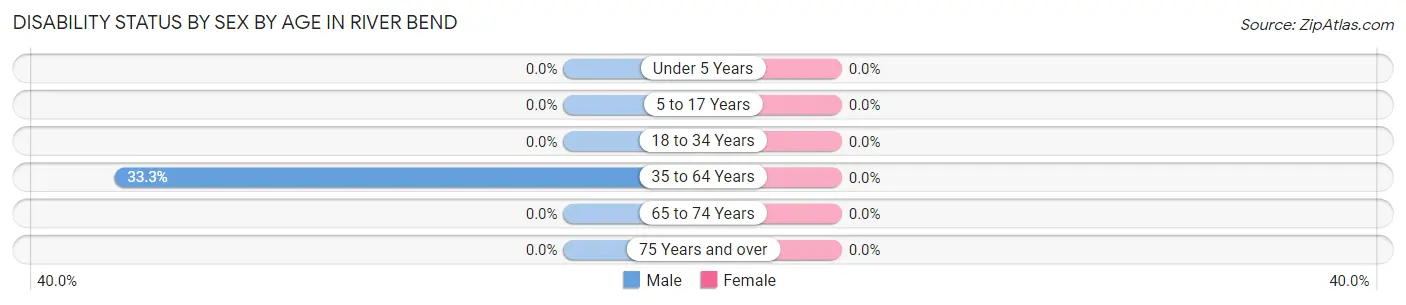
| Age Bracket | Male | Female |
| Under 5 Years | 0 (0.0%) | 0 (0.0%) |
| 5 to 17 Years | 0 (0.0%) | 0 (0.0%) |
| 18 to 34 Years | 0 (0.0%) | 0 (0.0%) |
| 35 to 64 Years | 1 (33.3%) | 0 (0.0%) |
| 65 to 74 Years | 0 (0.0%) | 0 (0.0%) |
| 75 Years and over | 0 (0.0%) | 0 (0.0%) |
Disability Class by Sex by Age in River Bend
Disability Class: Hearing Difficulty
| Age Bracket | Male | Female |
| Under 5 Years | 0 (0.0%) | 0 (0.0%) |
| 5 to 17 Years | 0 (0.0%) | 0 (0.0%) |
| 18 to 34 Years | 0 (0.0%) | 0 (0.0%) |
| 35 to 64 Years | 0 (0.0%) | 0 (0.0%) |
| 65 to 74 Years | 0 (0.0%) | 0 (0.0%) |
| 75 Years and over | 0 (0.0%) | 0 (0.0%) |
Disability Class: Vision Difficulty
| Age Bracket | Male | Female |
| Under 5 Years | 0 (0.0%) | 0 (0.0%) |
| 5 to 17 Years | 0 (0.0%) | 0 (0.0%) |
| 18 to 34 Years | 0 (0.0%) | 0 (0.0%) |
| 35 to 64 Years | 0 (0.0%) | 0 (0.0%) |
| 65 to 74 Years | 0 (0.0%) | 0 (0.0%) |
| 75 Years and over | 0 (0.0%) | 0 (0.0%) |
Disability Class: Cognitive Difficulty
| Age Bracket | Male | Female |
| 5 to 17 Years | 0 (0.0%) | 0 (0.0%) |
| 18 to 34 Years | 0 (0.0%) | 0 (0.0%) |
| 35 to 64 Years | 0 (0.0%) | 0 (0.0%) |
| 65 to 74 Years | 0 (0.0%) | 0 (0.0%) |
| 75 Years and over | 0 (0.0%) | 0 (0.0%) |
Disability Class: Ambulatory Difficulty
| Age Bracket | Male | Female |
| 5 to 17 Years | 0 (0.0%) | 0 (0.0%) |
| 18 to 34 Years | 0 (0.0%) | 0 (0.0%) |
| 35 to 64 Years | 1 (33.3%) | 0 (0.0%) |
| 65 to 74 Years | 0 (0.0%) | 0 (0.0%) |
| 75 Years and over | 0 (0.0%) | 0 (0.0%) |
Disability Class: Self-Care Difficulty
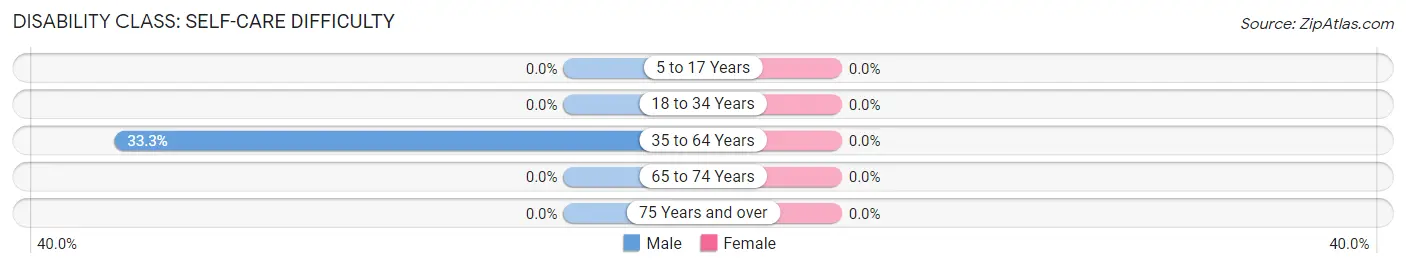
| Age Bracket | Male | Female |
| 5 to 17 Years | 0 (0.0%) | 0 (0.0%) |
| 18 to 34 Years | 0 (0.0%) | 0 (0.0%) |
| 35 to 64 Years | 1 (33.3%) | 0 (0.0%) |
| 65 to 74 Years | 0 (0.0%) | 0 (0.0%) |
| 75 Years and over | 0 (0.0%) | 0 (0.0%) |
Technology Access in River Bend
Computing Device Access in River Bend
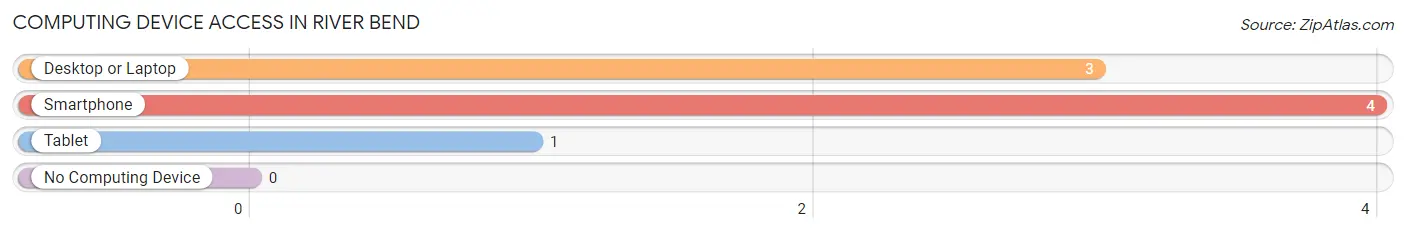
| Device Type | # Households | % Households |
| Desktop or Laptop | 3 | 75.0% |
| Smartphone | 4 | 100.0% |
| Tablet | 1 | 25.0% |
| No Computing Device | 0 | 0.0% |
| Total | 4 | 100.0% |
Internet Access in River Bend
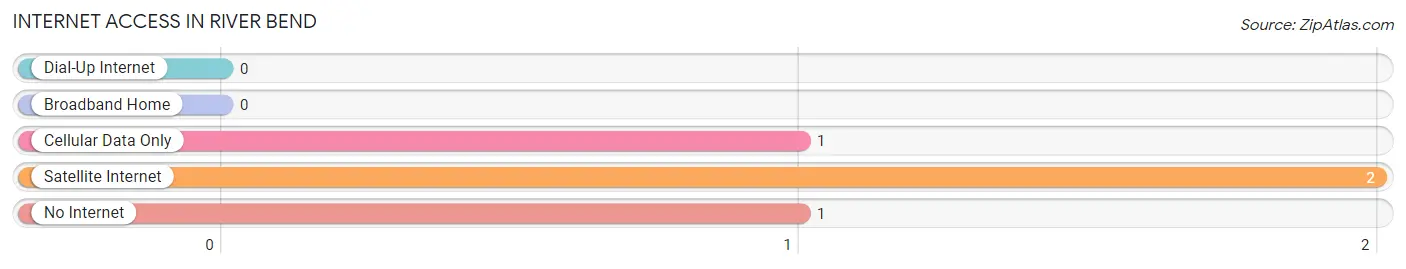
| Internet Type | # Households | % Households |
| Dial-Up Internet | 0 | 0.0% |
| Broadband Home | 0 | 0.0% |
| Cellular Data Only | 1 | 25.0% |
| Satellite Internet | 2 | 50.0% |
| No Internet | 1 | 25.0% |
| Total | 4 | 100.0% |
River Bend Summary
River Bend, Missouri is a small town located in the southeastern corner of the state, near the Mississippi River. It is part of the St. Louis metropolitan area and is home to a population of just over 1,000 people. The town was founded in 1819 and has a rich history of industry, agriculture, and commerce.
Geography
River Bend is located in the southeastern corner of Missouri, near the Mississippi River. It is part of the St. Louis metropolitan area and is bordered by the towns of Arnold, Festus, and Crystal City. The town is situated on a bluff overlooking the Mississippi River, and is surrounded by rolling hills and farmland. The town is located in the Ozark Plateau region of Missouri, and is characterized by its hilly terrain and lush vegetation.
Economy
River Bend’s economy is largely based on agriculture and manufacturing. The town is home to several large farms, which produce a variety of crops, including corn, soybeans, and wheat. The town is also home to several manufacturing companies, which produce a variety of products, including furniture, clothing, and automotive parts. Additionally, the town is home to several small businesses, including restaurants, retail stores, and service providers.
Demographics
As of the 2010 census, River Bend had a population of 1,072 people. The population is largely white (94.2%), with small percentages of African American (2.3%), Hispanic (1.3%), and Asian (1.2%) residents. The median household income in River Bend is $45,000, and the median age is 40. The town is home to a variety of religious denominations, including Baptist, Methodist, and Catholic.
History
River Bend was founded in 1819 by a group of settlers from Kentucky. The town was originally known as “River Bend Settlement”, and was located on a bluff overlooking the Mississippi River. The town quickly grew, and by the mid-1800s, it was a thriving agricultural and commercial center. The town was home to several mills, which produced flour, lumber, and other goods. The town was also home to several stores, which sold a variety of goods, including clothing, furniture, and tools.
In the late 1800s, the town began to decline, as the railroad bypassed the town and the population began to move away. However, the town was revitalized in the early 1900s, when the St. Louis and San Francisco Railroad built a line through the town. This allowed the town to become a major shipping center, and the population began to grow again.
Today, River Bend is a small, rural town with a population of just over 1,000 people. The town is home to several small businesses, including restaurants, retail stores, and service providers. The town is also home to several large farms, which produce a variety of crops, including corn, soybeans, and wheat. Additionally, the town is home to several manufacturing companies, which produce a variety of products, including furniture, clothing, and automotive parts.
Common Questions
What is Per Capita Income in River Bend?
Per Capita income in River Bend is $59,420.
What is the Median Household income in River Bend?
Median Household Income in River Bend is $91,250.
What is Inequality or Gini Index in River Bend?
Inequality or Gini Index in River Bend is 0.29.
What is the Total Population of River Bend?
Total Population of River Bend is 5.
What is the Total Male Population of River Bend?
Total Male Population of River Bend is 3.
What is the Total Female Population of River Bend?
Total Female Population of River Bend is 2.
What is the Ratio of Males per 100 Females in River Bend?
There are 150.00 Males per 100 Females in River Bend.
What is the Ratio of Females per 100 Males in River Bend?
There are 66.67 Females per 100 Males in River Bend.
What is the Median Population Age in River Bend?
Median Population Age in River Bend is 63.3 Years.
What is the Average Family Size in River Bend
Average Family Size in River Bend is 2.0 People.
What is the Average Household Size in River Bend
Average Household Size in River Bend is 1.2 People.
How Large is the Labor Force in River Bend?
There are 4 People in the Labor Forcein in River Bend.
What is the Percentage of People in the Labor Force in River Bend?
80.0% of People are in the Labor Force in River Bend.