Placerville, ID Map & Demographics
Placerville Map
Placerville Overview
$37,727
PER CAPITA INCOME
$91,250
AVG FAMILY INCOME
$59,688
AVG HOUSEHOLD INCOME
0.29
INEQUALITY / GINI INDEX
41
TOTAL POPULATION
26
MALE POPULATION
15
FEMALE POPULATION
173.33
MALES / 100 FEMALES
57.69
FEMALES / 100 MALES
65.5
MEDIAN AGE
2.5
AVG FAMILY SIZE
1.9
AVG HOUSEHOLD SIZE
8
LABOR FORCE [ PEOPLE ]
22.2%
PERCENT IN LABOR FORCE
12.5%
UNEMPLOYMENT RATE
Placerville Zip Codes
Placerville Area Codes
Income in Placerville
Income Overview in Placerville
Per Capita Income in Placerville is $37,727, while median incomes of families and households are $91,250 and $59,688 respectively.
| Characteristic | Number | Measure |
| Per Capita Income | 41 | $37,727 |
| Median Family Income | 13 | $91,250 |
| Mean Family Income | 13 | $84,654 |
| Median Household Income | 21 | $59,688 |
| Mean Household Income | 21 | $70,733 |
| Income Deficit | 13 | $0 |
| Wage / Income Gap (%) | 41 | 0.00% |
| Wage / Income Gap ($) | 41 | 100.00¢ per $1 |
| Gini / Inequality Index | 41 | 0.29 |
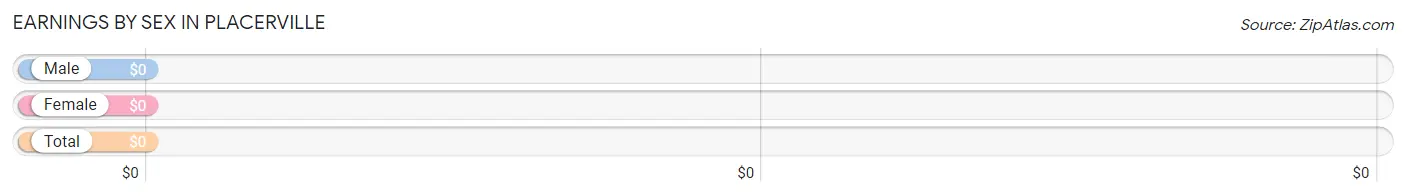
Earnings by Sex in Placerville
| Sex | Number | Average Earnings |
| Male | 14 (93.3%) | $0 |
| Female | 1 (6.7%) | $0 |
| Total | 15 (100.0%) | $0 |
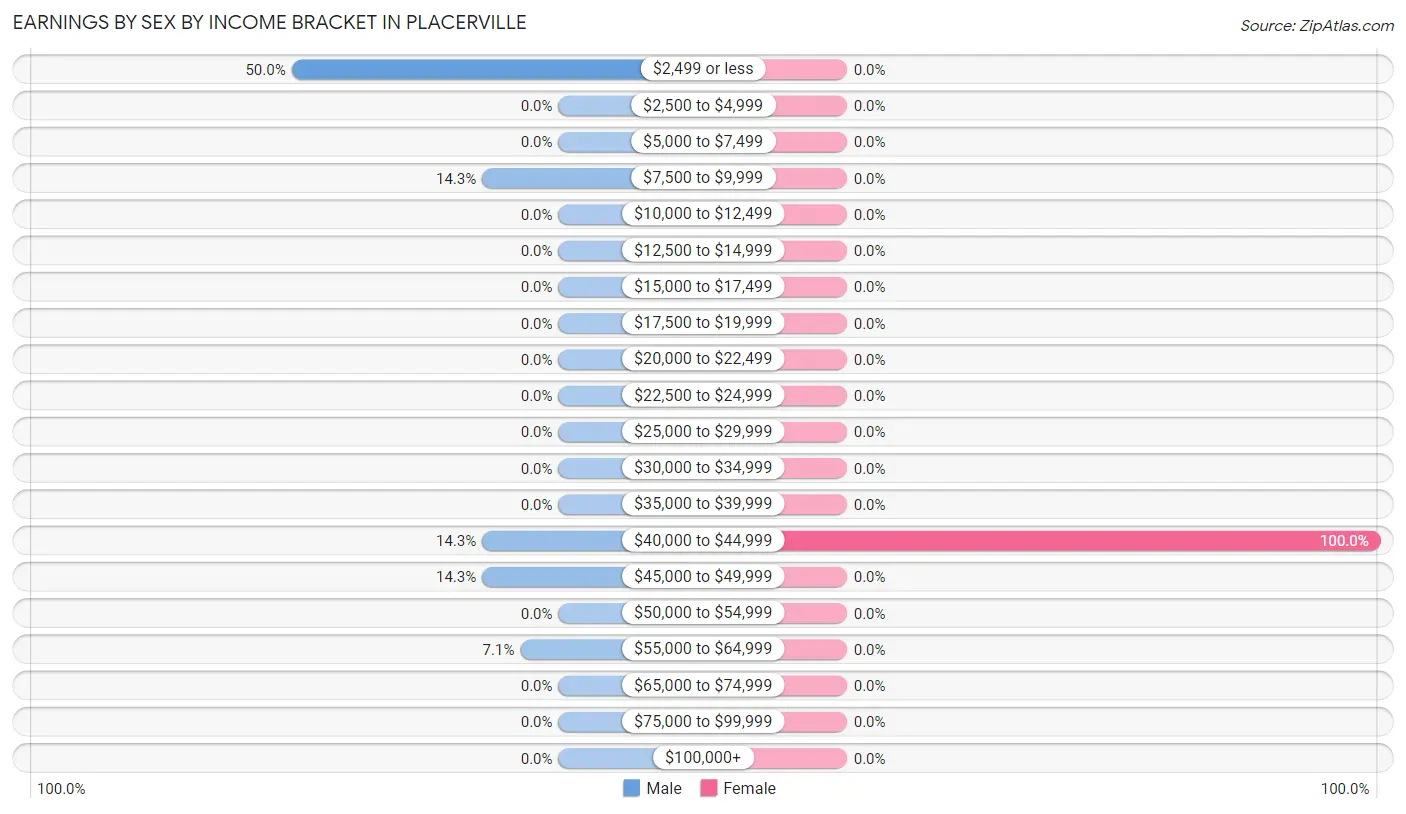
Earnings by Sex by Income Bracket in Placerville
The most common earnings brackets in Placerville are $2,499 or less for men (7 | 50.0%) and $40,000 to $44,999 for women (1 | 100.0%).
| Income | Male | Female |
| $2,499 or less | 7 (50.0%) | 0 (0.0%) |
| $2,500 to $4,999 | 0 (0.0%) | 0 (0.0%) |
| $5,000 to $7,499 | 0 (0.0%) | 0 (0.0%) |
| $7,500 to $9,999 | 2 (14.3%) | 0 (0.0%) |
| $10,000 to $12,499 | 0 (0.0%) | 0 (0.0%) |
| $12,500 to $14,999 | 0 (0.0%) | 0 (0.0%) |
| $15,000 to $17,499 | 0 (0.0%) | 0 (0.0%) |
| $17,500 to $19,999 | 0 (0.0%) | 0 (0.0%) |
| $20,000 to $22,499 | 0 (0.0%) | 0 (0.0%) |
| $22,500 to $24,999 | 0 (0.0%) | 0 (0.0%) |
| $25,000 to $29,999 | 0 (0.0%) | 0 (0.0%) |
| $30,000 to $34,999 | 0 (0.0%) | 0 (0.0%) |
| $35,000 to $39,999 | 0 (0.0%) | 0 (0.0%) |
| $40,000 to $44,999 | 2 (14.3%) | 1 (100.0%) |
| $45,000 to $49,999 | 2 (14.3%) | 0 (0.0%) |
| $50,000 to $54,999 | 0 (0.0%) | 0 (0.0%) |
| $55,000 to $64,999 | 1 (7.1%) | 0 (0.0%) |
| $65,000 to $74,999 | 0 (0.0%) | 0 (0.0%) |
| $75,000 to $99,999 | 0 (0.0%) | 0 (0.0%) |
| $100,000+ | 0 (0.0%) | 0 (0.0%) |
| Total | 14 (100.0%) | 1 (100.0%) |
Earnings by Sex by Educational Attainment in Placerville
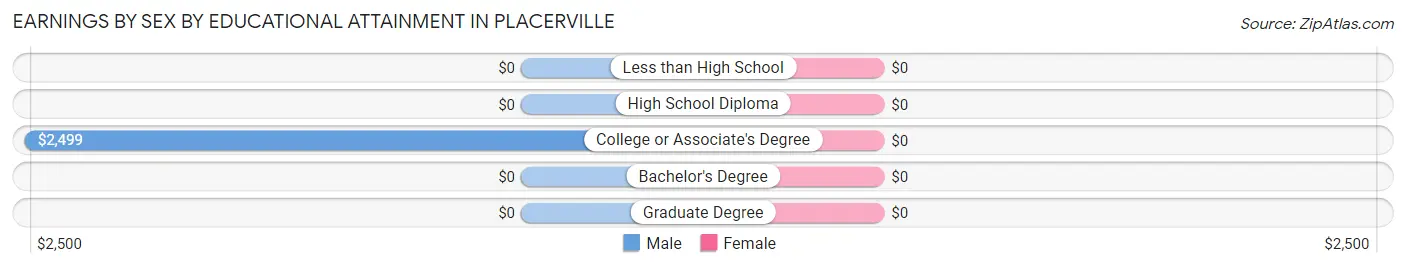
| Educational Attainment | Male Income | Female Income |
| Less than High School | - | - |
| High School Diploma | - | - |
| College or Associate's Degree | $2,499 | $0 |
| Bachelor's Degree | - | - |
| Graduate Degree | - | - |
| Total | - | - |
Family Income in Placerville
Family Income Brackets in Placerville
According to the Placerville family income data, there are 6 families falling into the $100,000 to $149,999 income range, which is the most common income bracket and makes up 46.2% of all families.
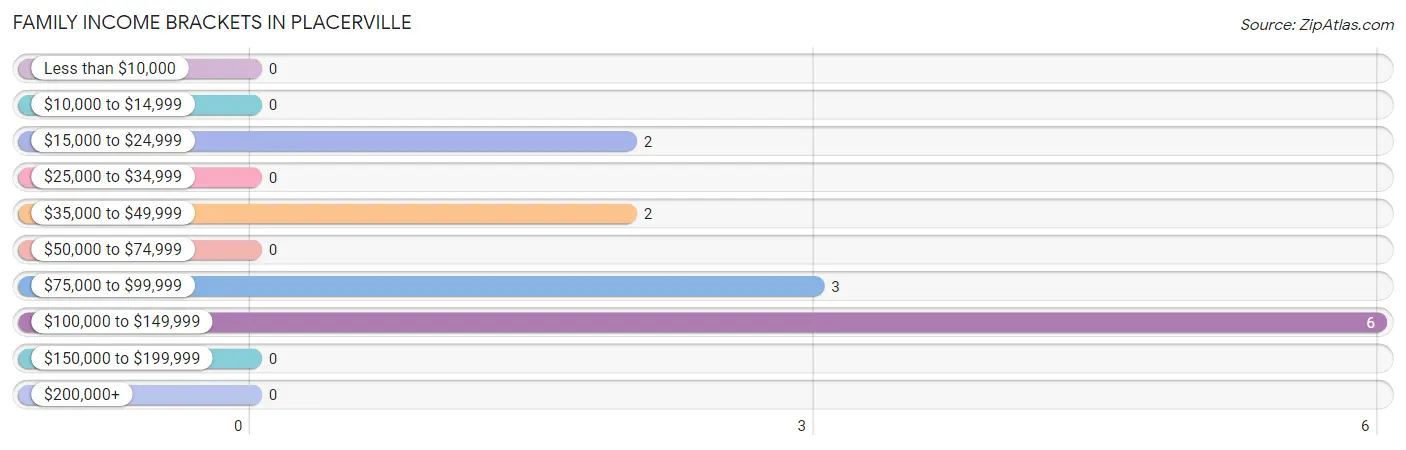
| Income Bracket | # Families | % Families |
| Less than $10,000 | 0 | 0.0% |
| $10,000 to $14,999 | 0 | 0.0% |
| $15,000 to $24,999 | 2 | 15.4% |
| $25,000 to $34,999 | 0 | 0.0% |
| $35,000 to $49,999 | 2 | 15.4% |
| $50,000 to $74,999 | 0 | 0.0% |
| $75,000 to $99,999 | 3 | 23.1% |
| $100,000 to $149,999 | 6 | 46.2% |
| $150,000 to $199,999 | 0 | 0.0% |
| $200,000+ | 0 | 0.0% |
Family Income by Famaliy Size in Placerville
2-person families (11 | 84.6%) account for the highest median family income in Placerville with $115,313 per family, while 2-person families (11 | 84.6%) have the highest median income of $57,656 per family member.
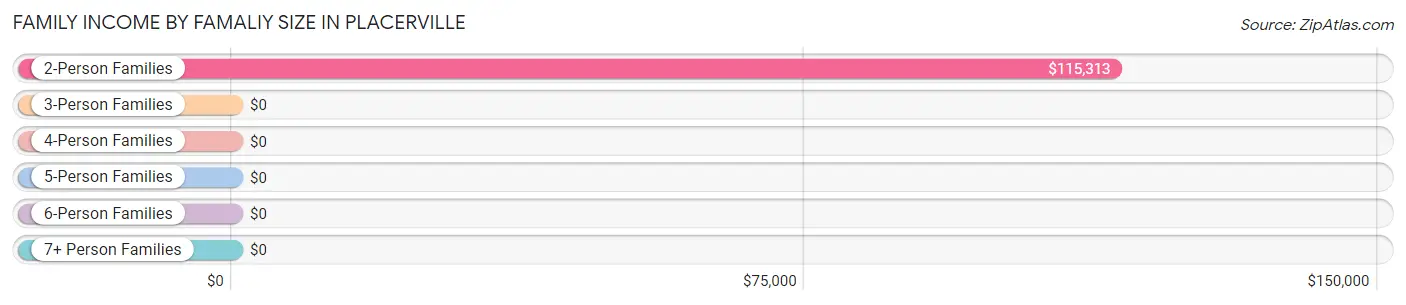
| Income Bracket | # Families | Median Income |
| 2-Person Families | 11 (84.6%) | $115,313 |
| 3-Person Families | 0 (0.0%) | $0 |
| 4-Person Families | 0 (0.0%) | $0 |
| 5-Person Families | 2 (15.4%) | $0 |
| 6-Person Families | 0 (0.0%) | $0 |
| 7+ Person Families | 0 (0.0%) | $0 |
| Total | 13 (100.0%) | $91,250 |
Family Income by Number of Earners in Placerville
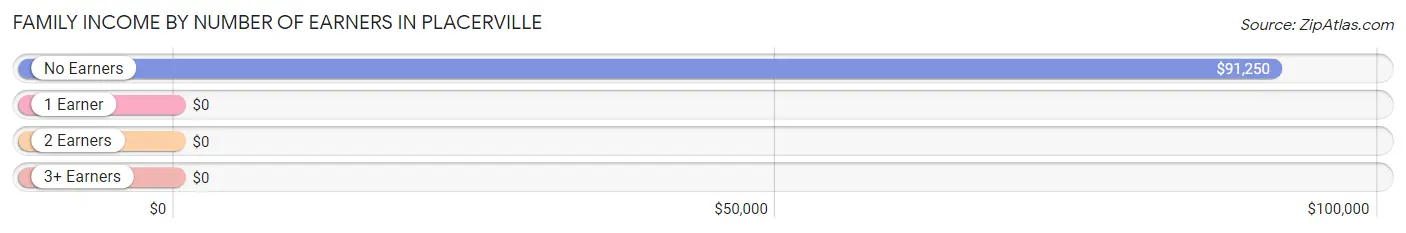
| Number of Earners | # Families | Median Income |
| No Earners | 7 (53.8%) | $91,250 |
| 1 Earner | 5 (38.5%) | $0 |
| 2 Earners | 1 (7.7%) | $0 |
| 3+ Earners | 0 (0.0%) | $0 |
| Total | 13 (100.0%) | $91,250 |
Household Income in Placerville
Household Income Brackets in Placerville
With 6 households falling in the category, the $100,000 to $149,999 income range is the most frequent in Placerville, accounting for 28.6% of all households.
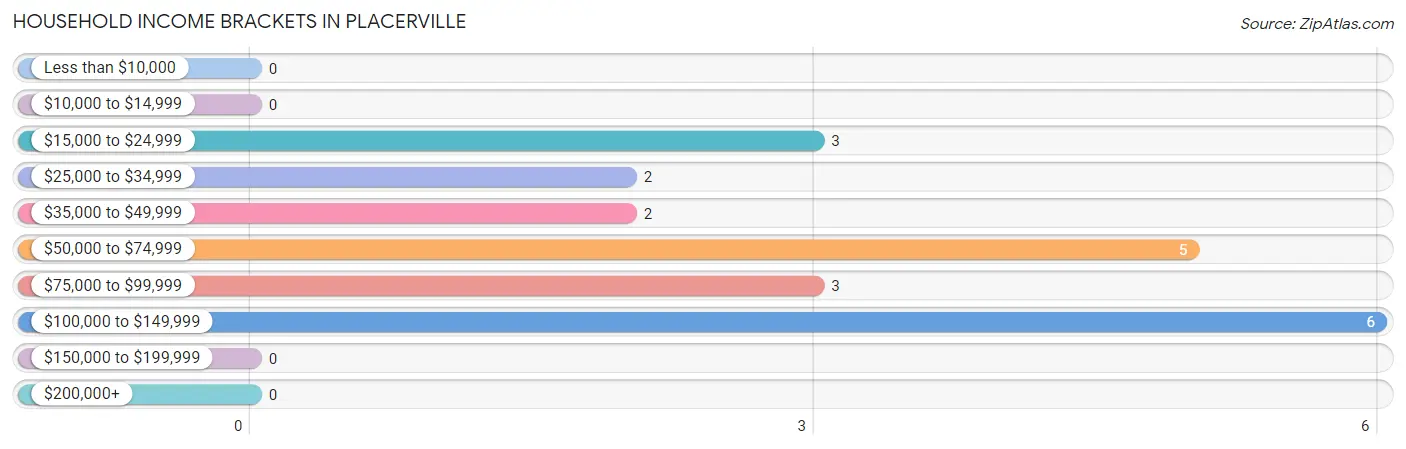
| Income Bracket | # Households | % Households |
| Less than $10,000 | 0 | 0.0% |
| $10,000 to $14,999 | 0 | 0.0% |
| $15,000 to $24,999 | 3 | 14.3% |
| $25,000 to $34,999 | 2 | 9.5% |
| $35,000 to $49,999 | 2 | 9.5% |
| $50,000 to $74,999 | 5 | 23.8% |
| $75,000 to $99,999 | 3 | 14.3% |
| $100,000 to $149,999 | 6 | 28.6% |
| $150,000 to $199,999 | 0 | 0.0% |
| $200,000+ | 0 | 0.0% |
Household Income by Householder Age in Placerville
The median household income in Placerville is $59,688, with the highest median household income of $59,375 found in the 65+ years age bracket for the primary householder. A total of 12 households (57.1%) fall into this category.
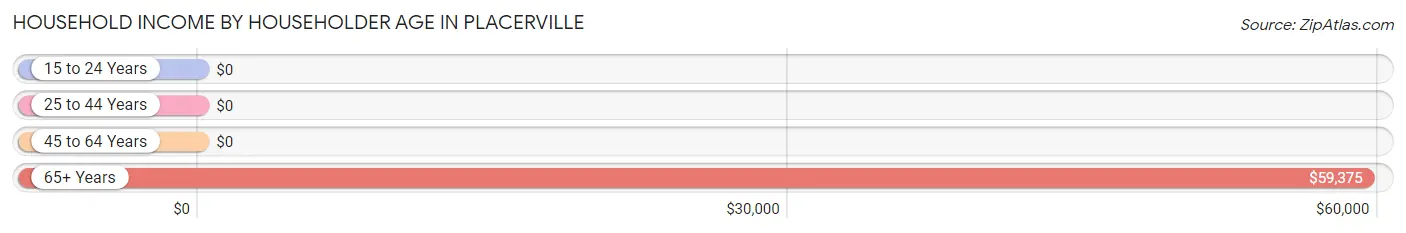
| Income Bracket | # Households | Median Income |
| 15 to 24 Years | 0 (0.0%) | $0 |
| 25 to 44 Years | 3 (14.3%) | $0 |
| 45 to 64 Years | 6 (28.6%) | $0 |
| 65+ Years | 12 (57.1%) | $59,375 |
| Total | 21 (100.0%) | $59,688 |
Poverty in Placerville
Income Below Poverty by Sex and Age in Placerville
With 7.7% poverty level for males and 13.3% for females among the residents of Placerville, 55 to 64 year old males and 55 to 64 year old females are the most vulnerable to poverty, with 2 males (33.3%) and 2 females (100.0%) in their respective age groups living below the poverty level.
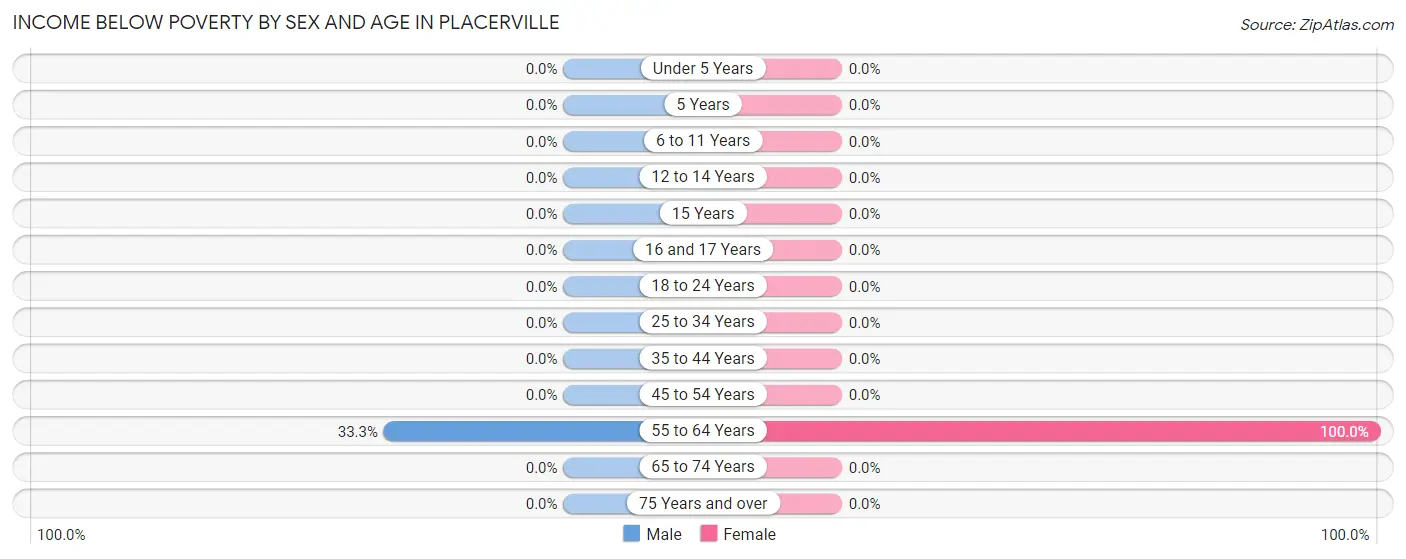
| Age Bracket | Male | Female |
| Under 5 Years | 0 (0.0%) | 0 (0.0%) |
| 5 Years | 0 (0.0%) | 0 (0.0%) |
| 6 to 11 Years | 0 (0.0%) | 0 (0.0%) |
| 12 to 14 Years | 0 (0.0%) | 0 (0.0%) |
| 15 Years | 0 (0.0%) | 0 (0.0%) |
| 16 and 17 Years | 0 (0.0%) | 0 (0.0%) |
| 18 to 24 Years | 0 (0.0%) | 0 (0.0%) |
| 25 to 34 Years | 0 (0.0%) | 0 (0.0%) |
| 35 to 44 Years | 0 (0.0%) | 0 (0.0%) |
| 45 to 54 Years | 0 (0.0%) | 0 (0.0%) |
| 55 to 64 Years | 2 (33.3%) | 2 (100.0%) |
| 65 to 74 Years | 0 (0.0%) | 0 (0.0%) |
| 75 Years and over | 0 (0.0%) | 0 (0.0%) |
| Total | 2 (7.7%) | 2 (13.3%) |
Income Above Poverty by Sex and Age in Placerville
According to the poverty statistics in Placerville, males aged 6 to 11 years and females aged under 5 years are the age groups that are most secure financially, with 100.0% of males and 100.0% of females in these age groups living above the poverty line.
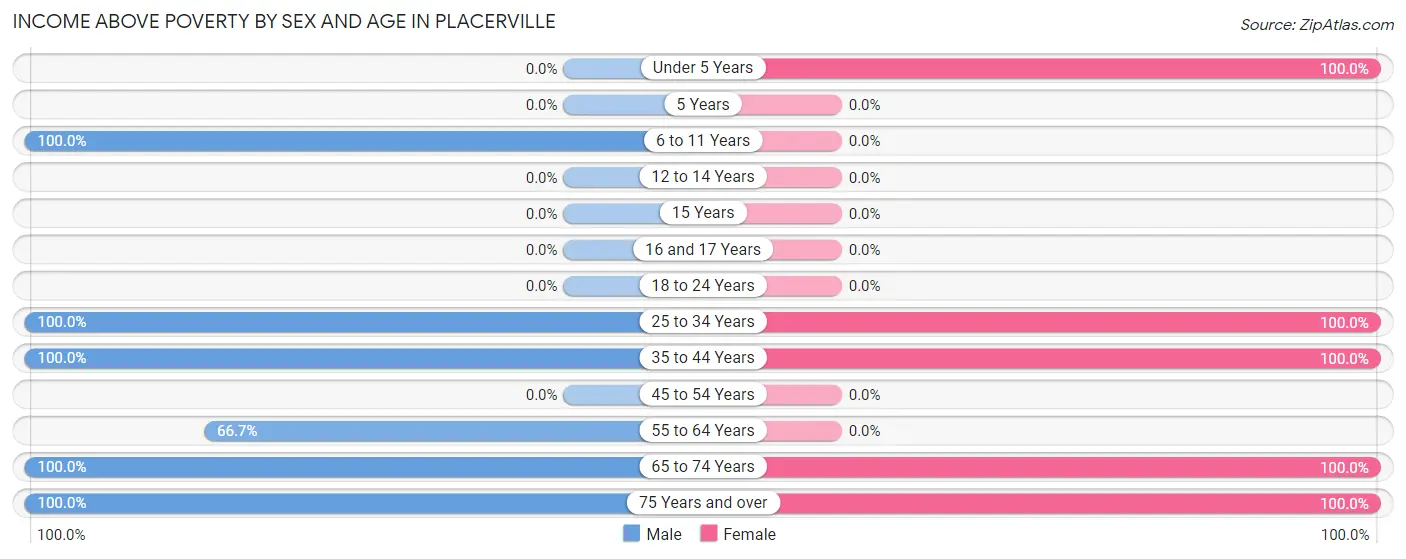
| Age Bracket | Male | Female |
| Under 5 Years | 0 (0.0%) | 1 (100.0%) |
| 5 Years | 0 (0.0%) | 0 (0.0%) |
| 6 to 11 Years | 4 (100.0%) | 0 (0.0%) |
| 12 to 14 Years | 0 (0.0%) | 0 (0.0%) |
| 15 Years | 0 (0.0%) | 0 (0.0%) |
| 16 and 17 Years | 0 (0.0%) | 0 (0.0%) |
| 18 to 24 Years | 0 (0.0%) | 0 (0.0%) |
| 25 to 34 Years | 2 (100.0%) | 2 (100.0%) |
| 35 to 44 Years | 2 (100.0%) | 1 (100.0%) |
| 45 to 54 Years | 0 (0.0%) | 0 (0.0%) |
| 55 to 64 Years | 4 (66.7%) | 0 (0.0%) |
| 65 to 74 Years | 6 (100.0%) | 7 (100.0%) |
| 75 Years and over | 6 (100.0%) | 2 (100.0%) |
| Total | 24 (92.3%) | 13 (86.7%) |
Income Below Poverty Among Married-Couple Families in Placerville
The poverty statistics for married-couple families in Placerville show that 15.4% or 2 of the total 13 families live below the poverty line. Families with no children have the highest poverty rate of 18.2%, comprising of 2 families. On the other hand, families with 3 or 4 children have the lowest poverty rate of 0.0%, which includes 0 families.
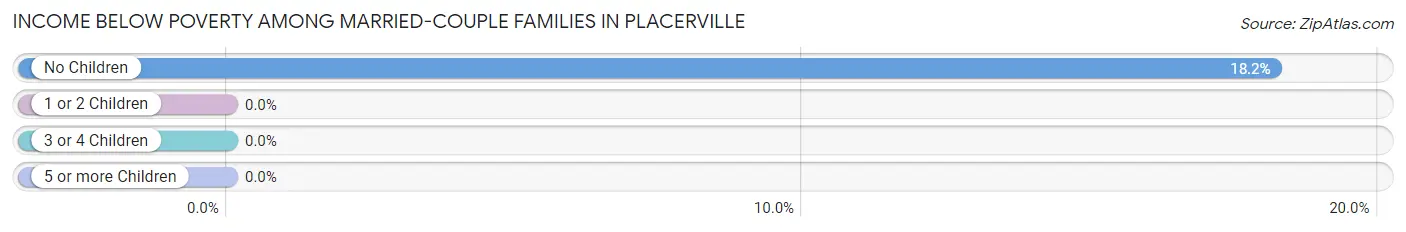
| Children | Above Poverty | Below Poverty |
| No Children | 9 (81.8%) | 2 (18.2%) |
| 1 or 2 Children | 0 (0.0%) | 0 (0.0%) |
| 3 or 4 Children | 2 (100.0%) | 0 (0.0%) |
| 5 or more Children | 0 (0.0%) | 0 (0.0%) |
| Total | 11 (84.6%) | 2 (15.4%) |
Income Below Poverty Among Single-Parent Households in Placerville
| Children | Single Father | Single Mother |
| No Children | 0 (0.0%) | 0 (0.0%) |
| 1 or 2 Children | 0 (0.0%) | 0 (0.0%) |
| 3 or 4 Children | 0 (0.0%) | 0 (0.0%) |
| 5 or more Children | 0 (0.0%) | 0 (0.0%) |
| Total | 0 (0.0%) | 0 (0.0%) |
Income Below Poverty Among Married-Couple vs Single-Parent Households in Placerville
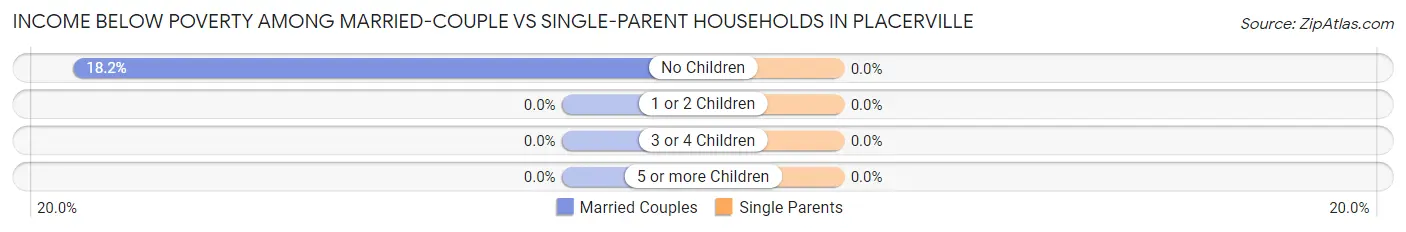
| Children | Married-Couple Families | Single-Parent Households |
| No Children | 2 (18.2%) | 0 (0.0%) |
| 1 or 2 Children | 0 (0.0%) | 0 (0.0%) |
| 3 or 4 Children | 0 (0.0%) | 0 (0.0%) |
| 5 or more Children | 0 (0.0%) | 0 (0.0%) |
| Total | 2 (15.4%) | 0 (0.0%) |
Race in Placerville
The most populous races in Placerville are White / Caucasian (41 | 100.0%), and Hispanic or Latino (7 | 17.1%).
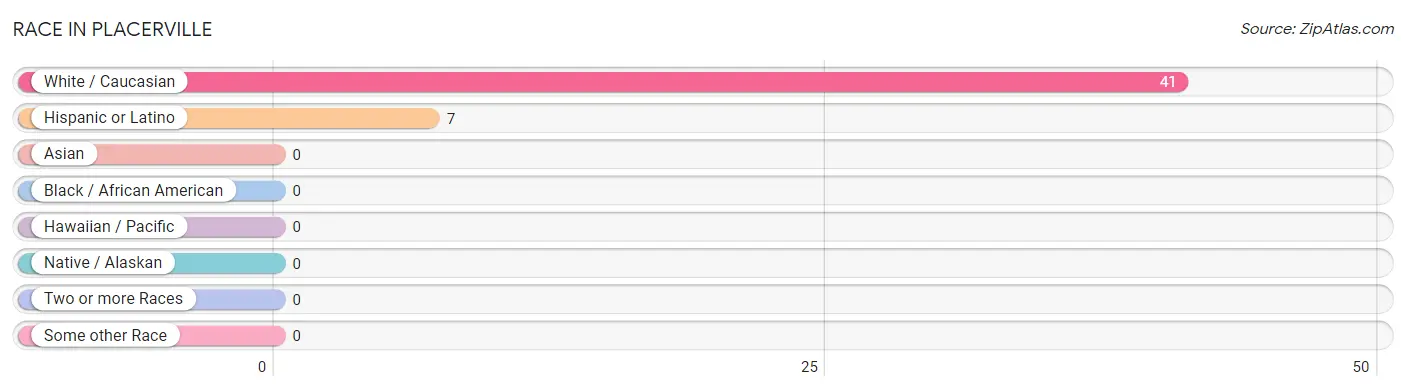
| Race | # Population | % Population |
| Asian | 0 | 0.0% |
| Black / African American | 0 | 0.0% |
| Hawaiian / Pacific | 0 | 0.0% |
| Hispanic or Latino | 7 | 17.1% |
| Native / Alaskan | 0 | 0.0% |
| White / Caucasian | 41 | 100.0% |
| Two or more Races | 0 | 0.0% |
| Some other Race | 0 | 0.0% |
| Total | 41 | 100.0% |
Ancestry in Placerville
The most populous ancestries reported in Placerville are English (13 | 31.7%), Irish (11 | 26.8%), German (9 | 22.0%), Mexican (7 | 17.1%), and American (6 | 14.6%), together accounting for 112.2% of all Placerville residents.
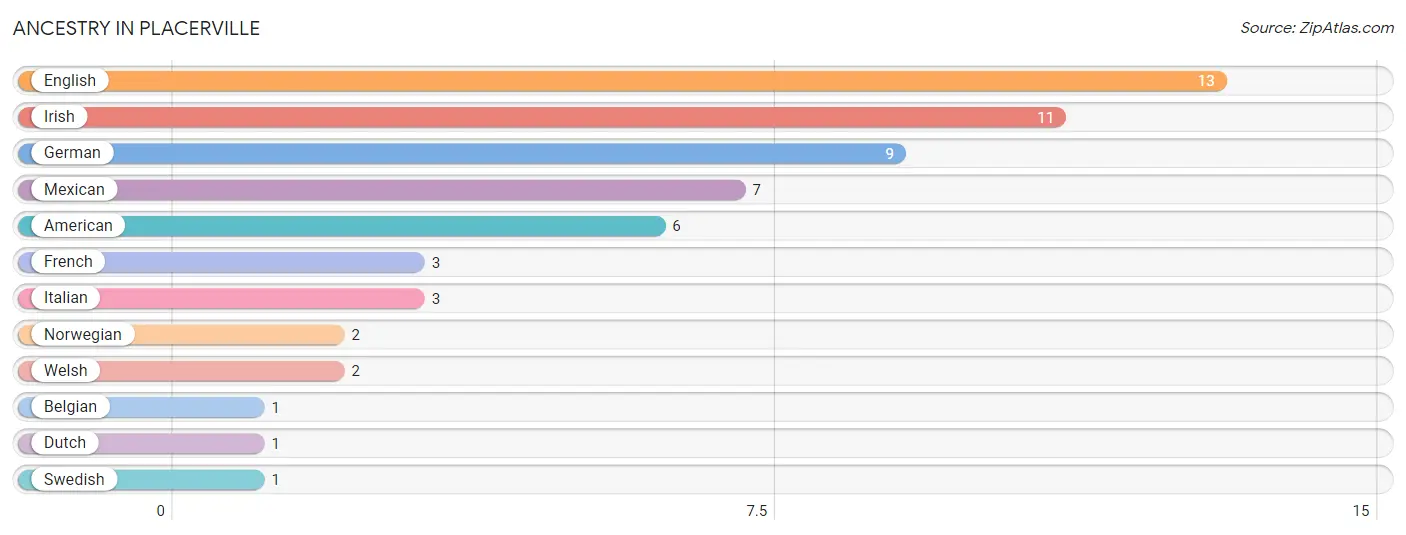
| Ancestry | # Population | % Population |
| American | 6 | 14.6% |
| Belgian | 1 | 2.4% |
| Dutch | 1 | 2.4% |
| English | 13 | 31.7% |
| French | 3 | 7.3% |
| German | 9 | 22.0% |
| Irish | 11 | 26.8% |
| Italian | 3 | 7.3% |
| Mexican | 7 | 17.1% |
| Norwegian | 2 | 4.9% |
| Swedish | 1 | 2.4% |
| Welsh | 2 | 4.9% | View All 12 Rows |
Immigrants in Placerville
The most numerous immigrant groups reported in Placerville came from , and Canada (1 | 2.4%), together accounting for 2.4% of all Placerville residents.

| Immigration Origin | # Population | % Population |
| Canada | 1 | 2.4% | View All 1 Rows |
Sex and Age in Placerville
Sex and Age in Placerville
The most populous age groups in Placerville are 80 to 84 Years (6 | 23.1%) for men and 65 to 69 Years (6 | 40.0%) for women.
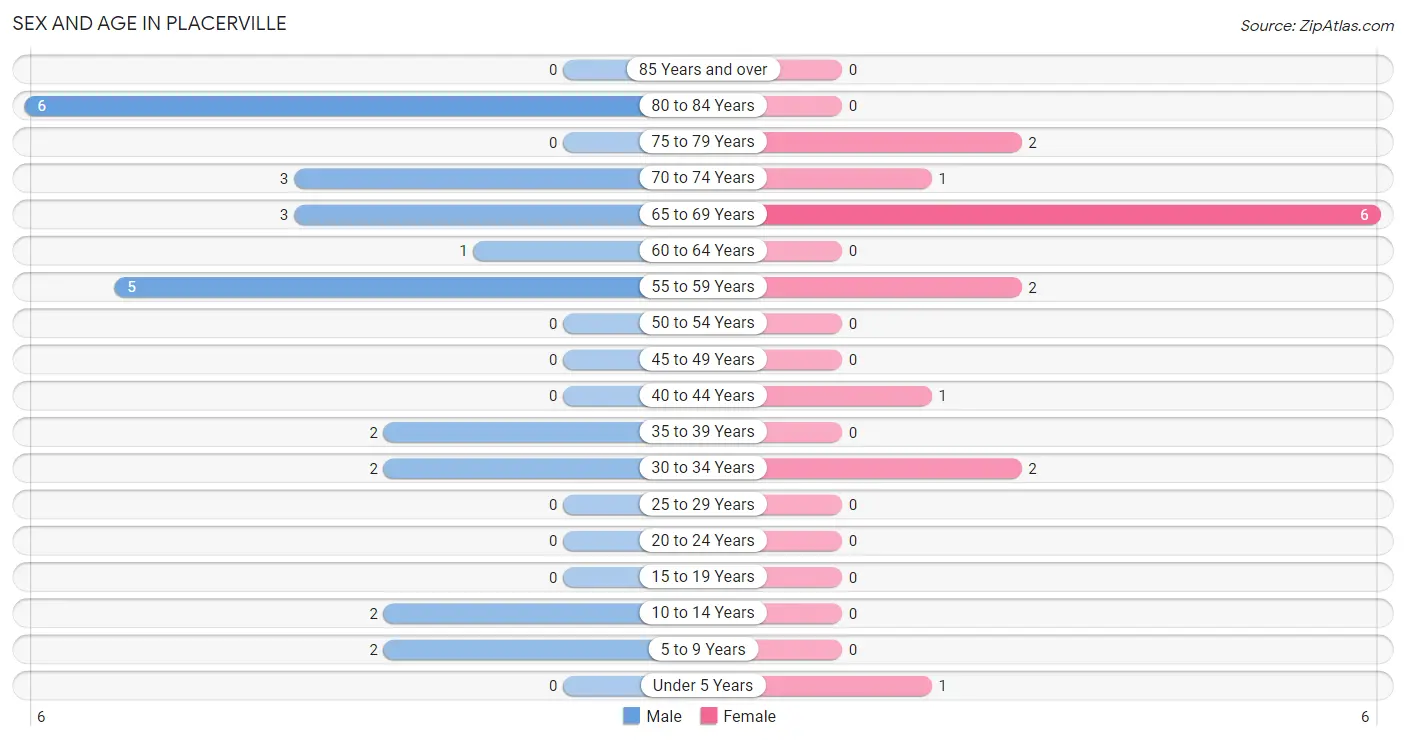
| Age Bracket | Male | Female |
| Under 5 Years | 0 (0.0%) | 1 (6.7%) |
| 5 to 9 Years | 2 (7.7%) | 0 (0.0%) |
| 10 to 14 Years | 2 (7.7%) | 0 (0.0%) |
| 15 to 19 Years | 0 (0.0%) | 0 (0.0%) |
| 20 to 24 Years | 0 (0.0%) | 0 (0.0%) |
| 25 to 29 Years | 0 (0.0%) | 0 (0.0%) |
| 30 to 34 Years | 2 (7.7%) | 2 (13.3%) |
| 35 to 39 Years | 2 (7.7%) | 0 (0.0%) |
| 40 to 44 Years | 0 (0.0%) | 1 (6.7%) |
| 45 to 49 Years | 0 (0.0%) | 0 (0.0%) |
| 50 to 54 Years | 0 (0.0%) | 0 (0.0%) |
| 55 to 59 Years | 5 (19.2%) | 2 (13.3%) |
| 60 to 64 Years | 1 (3.8%) | 0 (0.0%) |
| 65 to 69 Years | 3 (11.5%) | 6 (40.0%) |
| 70 to 74 Years | 3 (11.5%) | 1 (6.7%) |
| 75 to 79 Years | 0 (0.0%) | 2 (13.3%) |
| 80 to 84 Years | 6 (23.1%) | 0 (0.0%) |
| 85 Years and over | 0 (0.0%) | 0 (0.0%) |
| Total | 26 (100.0%) | 15 (100.0%) |
Families and Households in Placerville
Median Family Size in Placerville
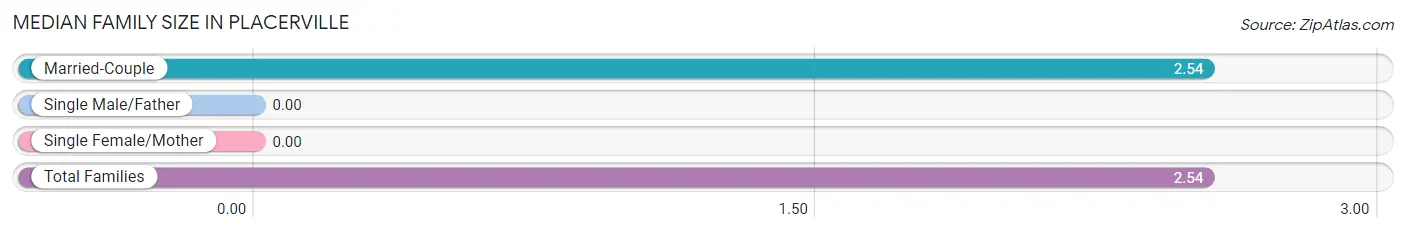
| Family Type | # Families | Family Size |
| Married-Couple | 13 (100.0%) | 2.54 |
| Single Male/Father | 0 (0.0%) | - |
| Single Female/Mother | 0 (0.0%) | - |
| Total Families | 13 (100.0%) | 2.54 |
Median Household Size in Placerville
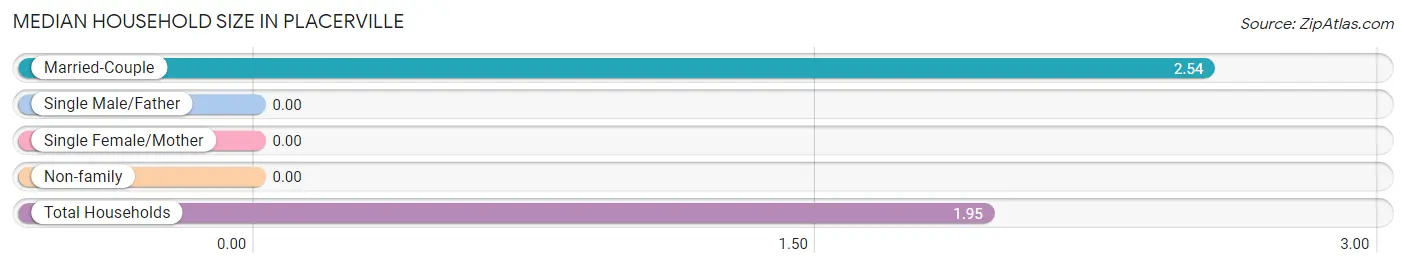
| Household Type | # Households | Household Size |
| Married-Couple | 13 (61.9%) | 2.54 |
| Single Male/Father | 0 (0.0%) | - |
| Single Female/Mother | 0 (0.0%) | - |
| Non-family | 8 (38.1%) | - |
| Total Households | 21 (100.0%) | 1.95 |
Household Size by Marriage Status in Placerville
Out of a total of 21 households in Placerville, 13 (61.9%) are family households, while 8 (38.1%) are nonfamily households. The most numerous type of family households are 2-person households, comprising 11, and the most common type of nonfamily households are 1-person households, comprising 8.
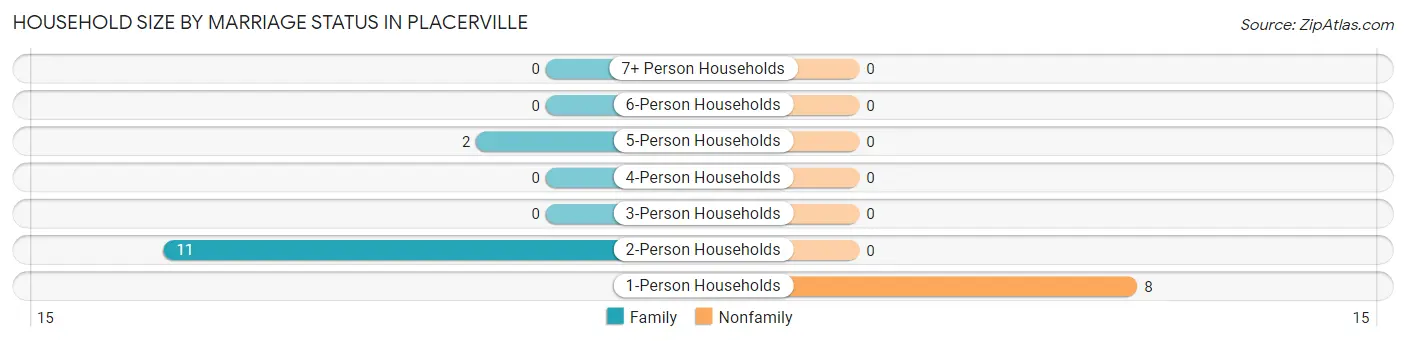
| Household Size | Family Households | Nonfamily Households |
| 1-Person Households | - | 8 (38.1%) |
| 2-Person Households | 11 (52.4%) | 0 (0.0%) |
| 3-Person Households | 0 (0.0%) | 0 (0.0%) |
| 4-Person Households | 0 (0.0%) | 0 (0.0%) |
| 5-Person Households | 2 (9.5%) | 0 (0.0%) |
| 6-Person Households | 0 (0.0%) | 0 (0.0%) |
| 7+ Person Households | 0 (0.0%) | 0 (0.0%) |
| Total | 13 (61.9%) | 8 (38.1%) |
Female Fertility in Placerville
Fertility by Age in Placerville
| Age Bracket | Women with Births | Births / 1,000 Women |
| 15 to 19 years | 0 (0.0%) | 0.0 |
| 20 to 34 years | 0 (0.0%) | 0.0 |
| 35 to 50 years | 0 (0.0%) | 0.0 |
| Total | 0 (0.0%) | 0.0 |
Fertility by Age by Marriage Status in Placerville
| Age Bracket | Married | Unmarried |
| 15 to 19 years | 0 (0.0%) | 0 (0.0%) |
| 20 to 34 years | 0 (0.0%) | 0 (0.0%) |
| 35 to 50 years | 0 (0.0%) | 0 (0.0%) |
| Total | 0 (0.0%) | 0 (0.0%) |
Fertility by Education in Placerville
| Educational Attainment | Women with Births | Births / 1,000 Women |
| Less than High School | 0 (0.0%) | 0.0 |
| High School Diploma | 0 (0.0%) | 0.0 |
| College or Associate's Degree | 0 (0.0%) | 0.0 |
| Bachelor's Degree | 0 (0.0%) | 0.0 |
| Graduate Degree | 0 (0.0%) | 0.0 |
| Total | 0 (0.0%) | 0.0 |
Fertility by Education by Marriage Status in Placerville
| Educational Attainment | Married | Unmarried |
| Less than High School | 0 (0.0%) | 0 (0.0%) |
| High School Diploma | 0 (0.0%) | 0 (0.0%) |
| College or Associate's Degree | 0 (0.0%) | 0 (0.0%) |
| Bachelor's Degree | 0 (0.0%) | 0 (0.0%) |
| Graduate Degree | 0 (0.0%) | 0 (0.0%) |
| Total | 0 (0.0%) | 0 (0.0%) |
Employment Characteristics in Placerville
Employment by Class of Employer in Placerville
Among the 7 employed individuals in Placerville, , and private company employees (7 | 100.0%) make up the most common classes of employment.
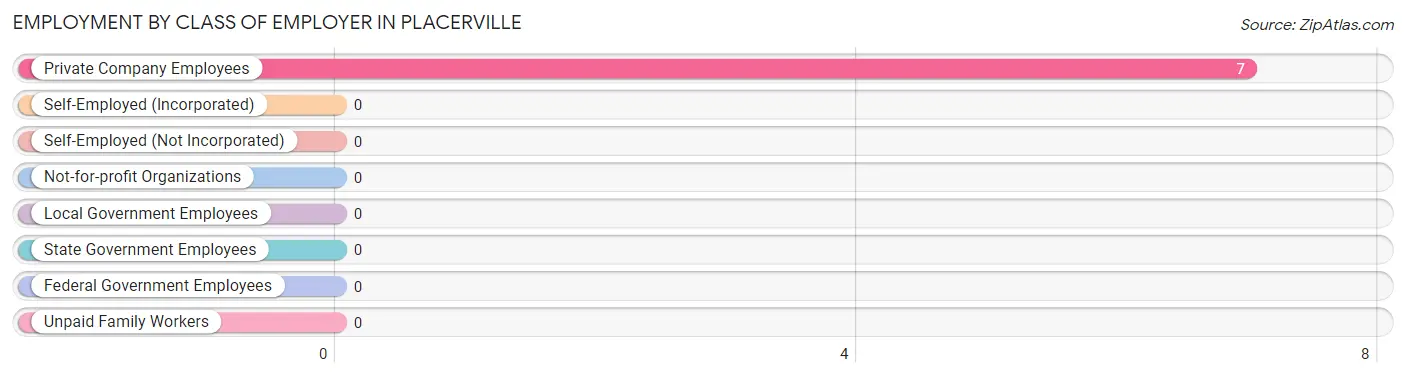
| Employer Class | # Employees | % Employees |
| Private Company Employees | 7 | 100.0% |
| Self-Employed (Incorporated) | 0 | 0.0% |
| Self-Employed (Not Incorporated) | 0 | 0.0% |
| Not-for-profit Organizations | 0 | 0.0% |
| Local Government Employees | 0 | 0.0% |
| State Government Employees | 0 | 0.0% |
| Federal Government Employees | 0 | 0.0% |
| Unpaid Family Workers | 0 | 0.0% |
| Total | 7 | 100.0% |
Employment Status by Age in Placerville
According to the labor force statistics for Placerville, out of the total population over 16 years of age (36), 22.2% or 8 individuals are in the labor force, with 12.5% or 1 of them unemployed. The age group with the highest labor force participation rate is 35 to 44 years, with 100.0% or 3 individuals in the labor force. Within the labor force, the 60 to 64 years age range has the highest percentage of unemployed individuals, with 100.0% or 1 of them being unemployed.
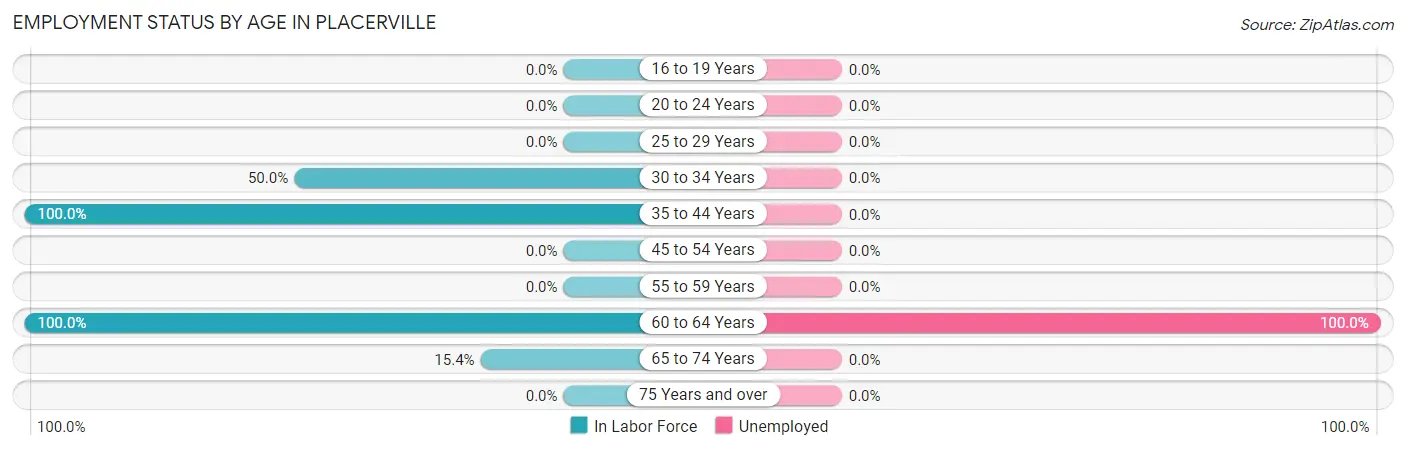
| Age Bracket | In Labor Force | Unemployed |
| 16 to 19 Years | 0 (0.0%) | 0 (0.0%) |
| 20 to 24 Years | 0 (0.0%) | 0 (0.0%) |
| 25 to 29 Years | 0 (0.0%) | 0 (0.0%) |
| 30 to 34 Years | 2 (50.0%) | 0 (0.0%) |
| 35 to 44 Years | 3 (100.0%) | 0 (0.0%) |
| 45 to 54 Years | 0 (0.0%) | 0 (0.0%) |
| 55 to 59 Years | 0 (0.0%) | 0 (0.0%) |
| 60 to 64 Years | 1 (100.0%) | 1 (100.0%) |
| 65 to 74 Years | 2 (15.4%) | 0 (0.0%) |
| 75 Years and over | 0 (0.0%) | 0 (0.0%) |
| Total | 8 (22.2%) | 1 (12.5%) |
Employment Status by Educational Attainment in Placerville
According to labor force statistics for Placerville, 40.0% of individuals (6) out of the total population between 25 and 64 years of age (15) are in the labor force, with 16.7% or 1 of them being unemployed. The group with the highest labor force participation rate are those with the educational attainment of high school diploma, with 40.0% or 4 individuals in the labor force. Within the labor force, individuals with high school diploma education have the highest percentage of unemployment, with 25.0% or 1 of them being unemployed.
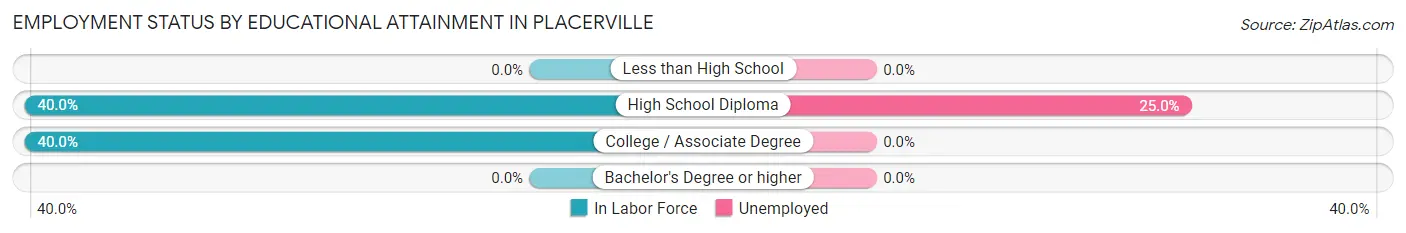
| Educational Attainment | In Labor Force | Unemployed |
| Less than High School | 0 (0.0%) | 0 (0.0%) |
| High School Diploma | 4 (40.0%) | 2 (25.0%) |
| College / Associate Degree | 2 (40.0%) | 0 (0.0%) |
| Bachelor's Degree or higher | 0 (0.0%) | 0 (0.0%) |
| Total | 6 (40.0%) | 3 (16.7%) |
Employment Occupations by Sex in Placerville
Management, Business, Science and Arts Occupations
The most common Management, Business, Science and Arts occupations in Placerville are , and Health Diagnosing & Treating (1 | 14.3%).
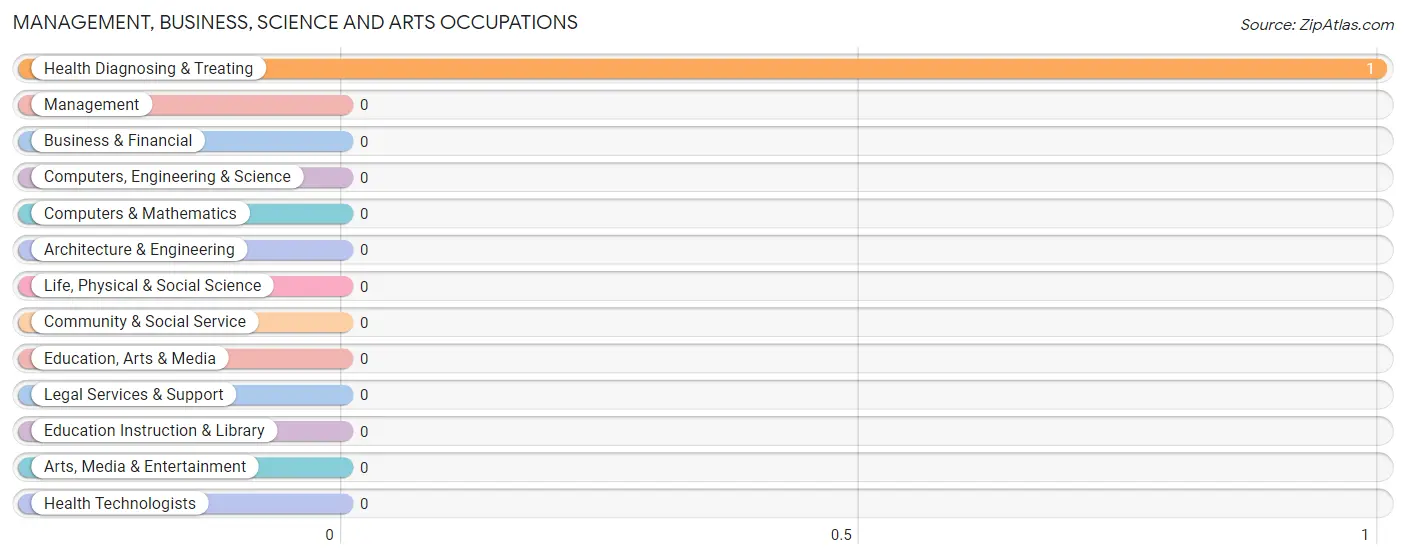
Management, Business, Science and Arts Occupations by Sex
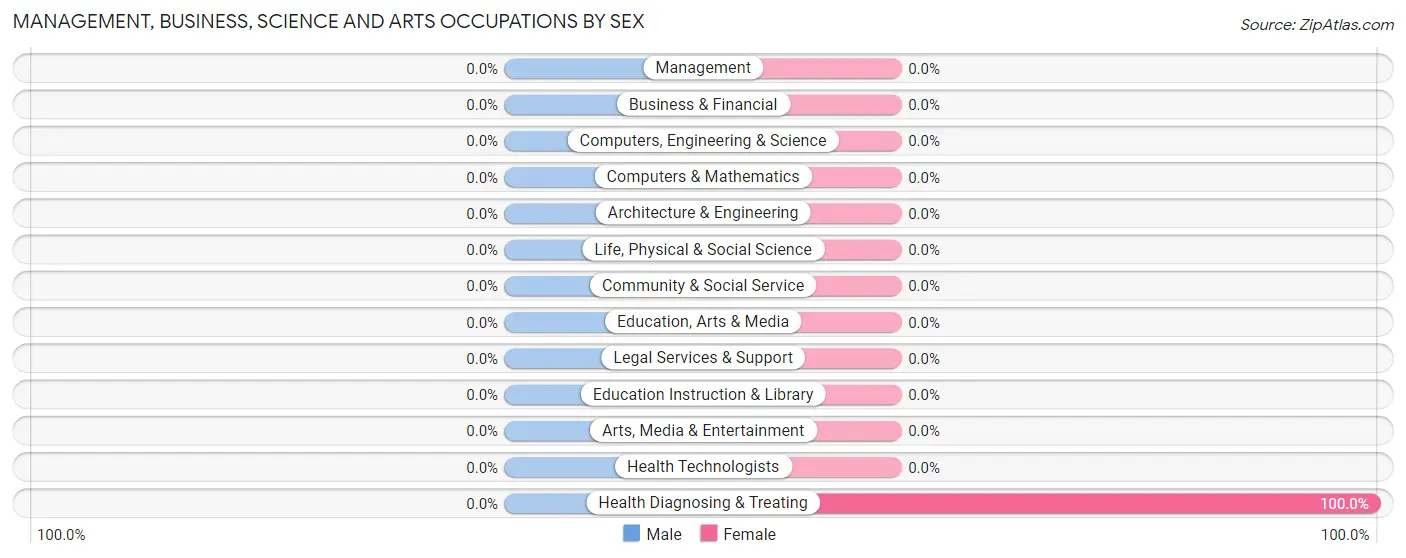
| Occupation | Male | Female |
| Management | 0 (0.0%) | 0 (0.0%) |
| Business & Financial | 0 (0.0%) | 0 (0.0%) |
| Computers, Engineering & Science | 0 (0.0%) | 0 (0.0%) |
| Computers & Mathematics | 0 (0.0%) | 0 (0.0%) |
| Architecture & Engineering | 0 (0.0%) | 0 (0.0%) |
| Life, Physical & Social Science | 0 (0.0%) | 0 (0.0%) |
| Community & Social Service | 0 (0.0%) | 0 (0.0%) |
| Education, Arts & Media | 0 (0.0%) | 0 (0.0%) |
| Legal Services & Support | 0 (0.0%) | 0 (0.0%) |
| Education Instruction & Library | 0 (0.0%) | 0 (0.0%) |
| Arts, Media & Entertainment | 0 (0.0%) | 0 (0.0%) |
| Health Diagnosing & Treating | 0 (0.0%) | 1 (100.0%) |
| Health Technologists | 0 (0.0%) | 0 (0.0%) |
| Total (Category) | 0 (0.0%) | 1 (100.0%) |
| Total (Overall) | 6 (85.7%) | 1 (14.3%) |
Services Occupations
Services Occupations by Sex
| Occupation | Male | Female |
| Healthcare Support | 0 (0.0%) | 0 (0.0%) |
| Security & Protection | 0 (0.0%) | 0 (0.0%) |
| Firefighting & Prevention | 0 (0.0%) | 0 (0.0%) |
| Law Enforcement | 0 (0.0%) | 0 (0.0%) |
| Food Preparation & Serving | 0 (0.0%) | 0 (0.0%) |
| Cleaning & Maintenance | 0 (0.0%) | 0 (0.0%) |
| Personal Care & Service | 0 (0.0%) | 0 (0.0%) |
| Total (Category) | 0 (0.0%) | 0 (0.0%) |
| Total (Overall) | 6 (85.7%) | 1 (14.3%) |
Sales and Office Occupations
The most common Sales and Office occupations in Placerville are , and Office & Administration (2 | 28.6%).
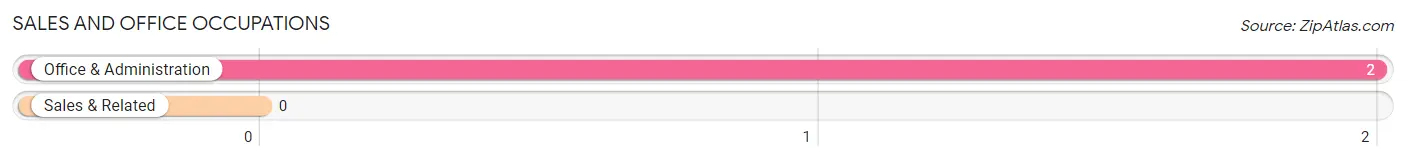
Sales and Office Occupations by Sex

| Occupation | Male | Female |
| Sales & Related | 0 (0.0%) | 0 (0.0%) |
| Office & Administration | 2 (100.0%) | 0 (0.0%) |
| Total (Category) | 2 (100.0%) | 0 (0.0%) |
| Total (Overall) | 6 (85.7%) | 1 (14.3%) |
Natural Resources, Construction and Maintenance Occupations
The most common Natural Resources, Construction and Maintenance occupations in Placerville are , and Construction & Extraction (2 | 28.6%).
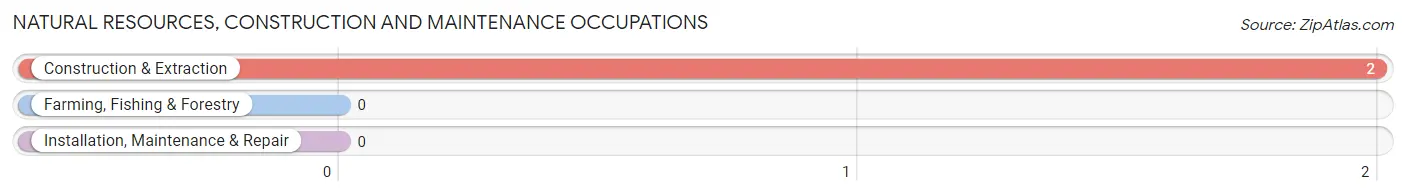
Natural Resources, Construction and Maintenance Occupations by Sex
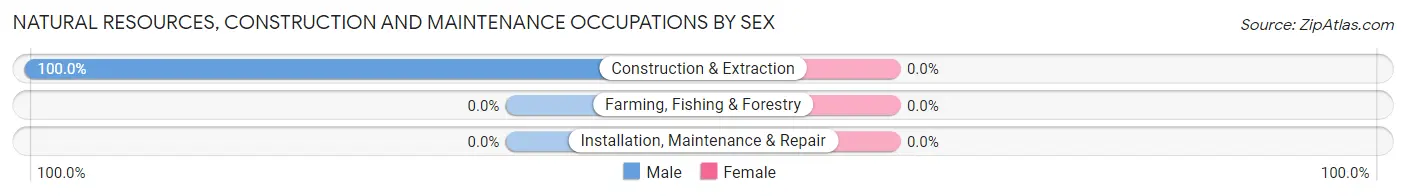
| Occupation | Male | Female |
| Farming, Fishing & Forestry | 0 (0.0%) | 0 (0.0%) |
| Construction & Extraction | 2 (100.0%) | 0 (0.0%) |
| Installation, Maintenance & Repair | 0 (0.0%) | 0 (0.0%) |
| Total (Category) | 2 (100.0%) | 0 (0.0%) |
| Total (Overall) | 6 (85.7%) | 1 (14.3%) |
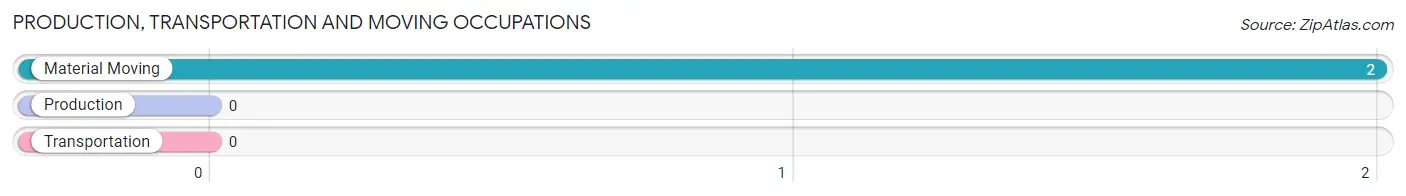
Production, Transportation and Moving Occupations
The most common Production, Transportation and Moving occupations in Placerville are , and Material Moving (2 | 28.6%).
Production, Transportation and Moving Occupations by Sex
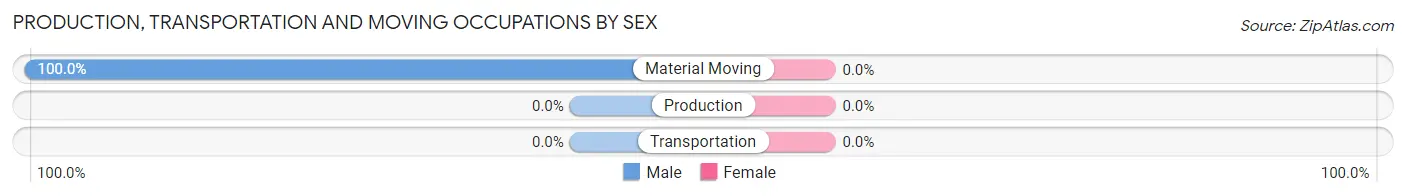
| Occupation | Male | Female |
| Production | 0 (0.0%) | 0 (0.0%) |
| Transportation | 0 (0.0%) | 0 (0.0%) |
| Material Moving | 2 (100.0%) | 0 (0.0%) |
| Total (Category) | 2 (100.0%) | 0 (0.0%) |
| Total (Overall) | 6 (85.7%) | 1 (14.3%) |
Employment Industries by Sex in Placerville
Employment Industries in Placerville
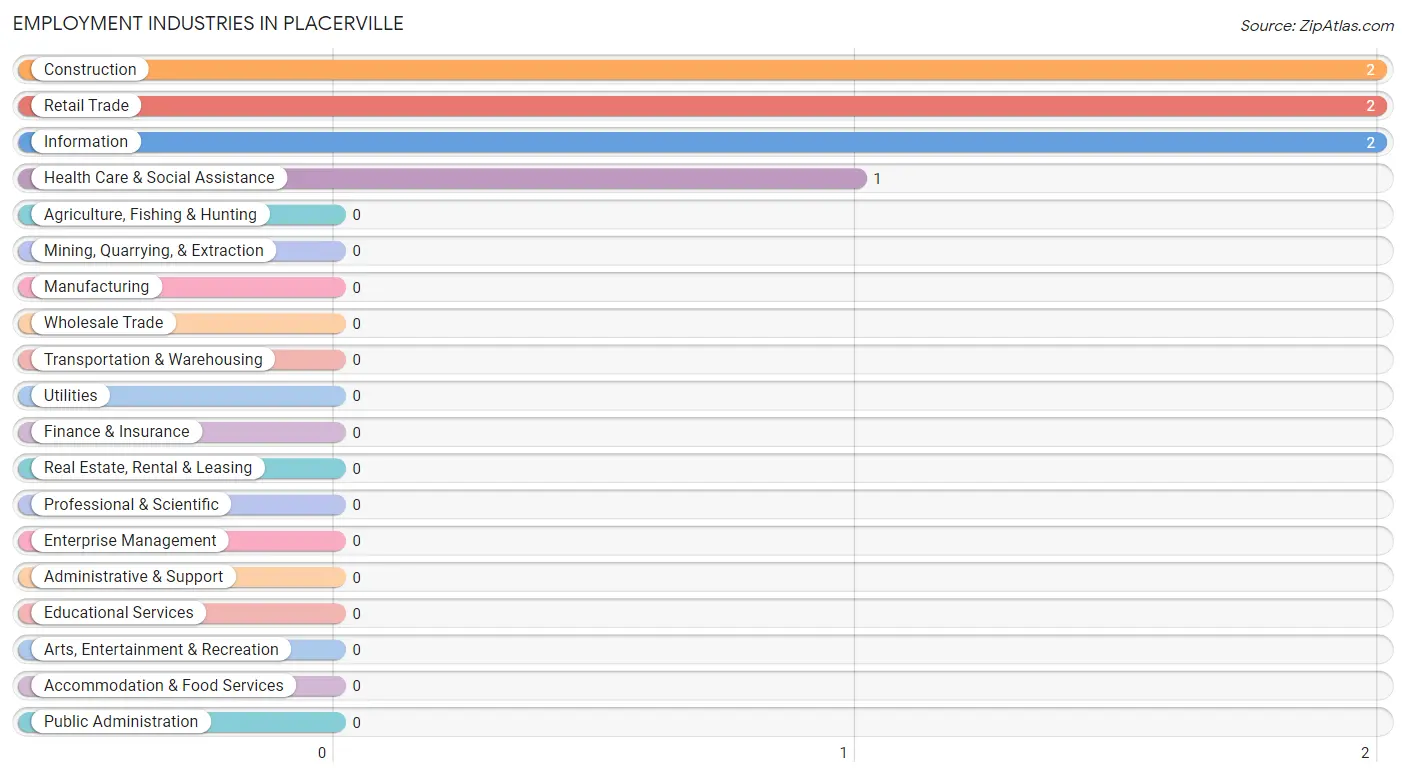
The major employment industries in Placerville include Construction (2 | 28.6%), Retail Trade (2 | 28.6%), Information (2 | 28.6%), and Health Care & Social Assistance (1 | 14.3%).
Employment Industries by Sex in Placerville
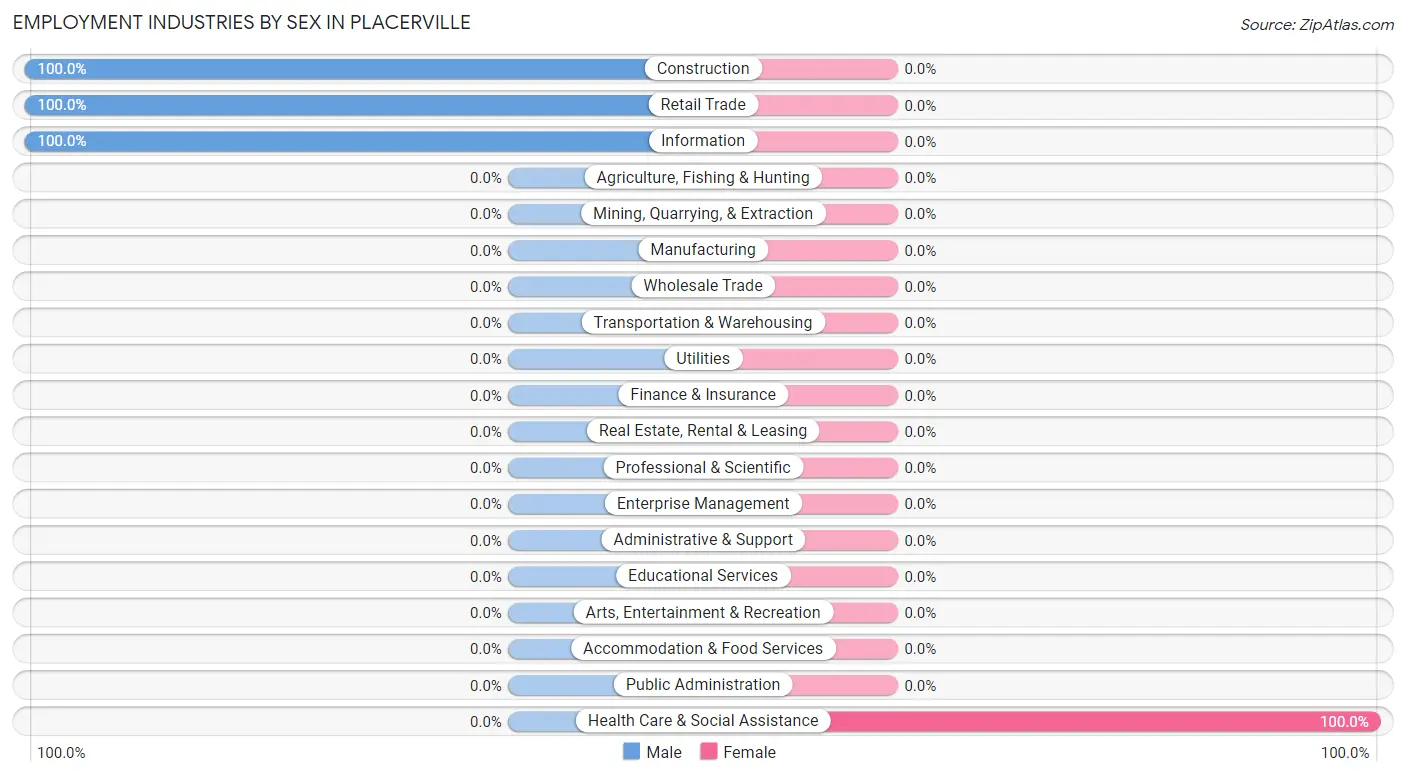
| Industry | Male | Female |
| Agriculture, Fishing & Hunting | 0 (0.0%) | 0 (0.0%) |
| Mining, Quarrying, & Extraction | 0 (0.0%) | 0 (0.0%) |
| Construction | 2 (100.0%) | 0 (0.0%) |
| Manufacturing | 0 (0.0%) | 0 (0.0%) |
| Wholesale Trade | 0 (0.0%) | 0 (0.0%) |
| Retail Trade | 2 (100.0%) | 0 (0.0%) |
| Transportation & Warehousing | 0 (0.0%) | 0 (0.0%) |
| Utilities | 0 (0.0%) | 0 (0.0%) |
| Information | 2 (100.0%) | 0 (0.0%) |
| Finance & Insurance | 0 (0.0%) | 0 (0.0%) |
| Real Estate, Rental & Leasing | 0 (0.0%) | 0 (0.0%) |
| Professional & Scientific | 0 (0.0%) | 0 (0.0%) |
| Enterprise Management | 0 (0.0%) | 0 (0.0%) |
| Administrative & Support | 0 (0.0%) | 0 (0.0%) |
| Educational Services | 0 (0.0%) | 0 (0.0%) |
| Health Care & Social Assistance | 0 (0.0%) | 1 (100.0%) |
| Arts, Entertainment & Recreation | 0 (0.0%) | 0 (0.0%) |
| Accommodation & Food Services | 0 (0.0%) | 0 (0.0%) |
| Public Administration | 0 (0.0%) | 0 (0.0%) |
| Total | 6 (85.7%) | 1 (14.3%) |
Education in Placerville
School Enrollment in Placerville
The most common levels of schooling among the 4 students in Placerville are kindergarten (2 | 50.0%), and middle school (2 | 50.0%).
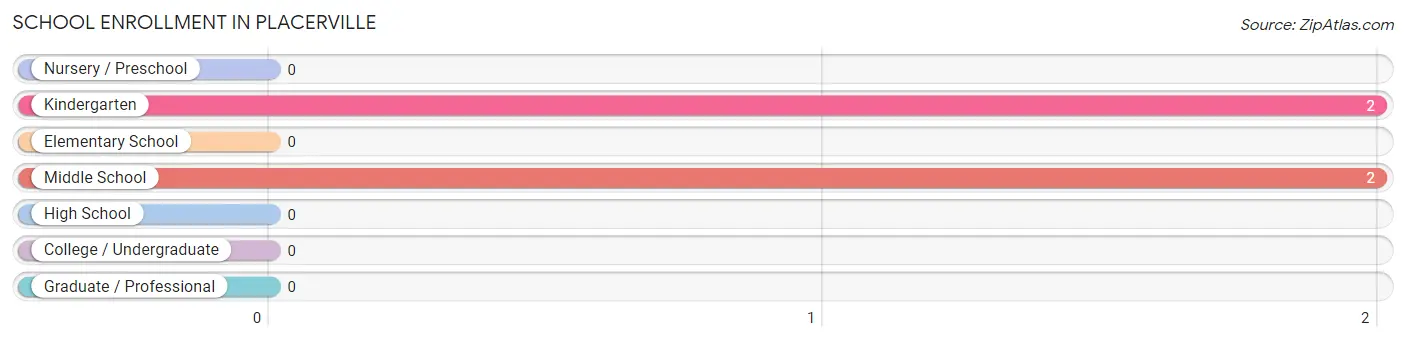
| School Level | # Students | % Students |
| Nursery / Preschool | 0 | 0.0% |
| Kindergarten | 2 | 50.0% |
| Elementary School | 0 | 0.0% |
| Middle School | 2 | 50.0% |
| High School | 0 | 0.0% |
| College / Undergraduate | 0 | 0.0% |
| Graduate / Professional | 0 | 0.0% |
| Total | 4 | 100.0% |
School Enrollment by Age by Funding Source in Placerville
Out of a total of 4 students who are enrolled in schools in Placerville, 2 (50.0%) attend a private institution, while the remaining 2 (50.0%) are enrolled in public schools. The age group of 5 to 9 year old has the highest likelihood of being enrolled in private schools, with 2 (100.0% in the age bracket) enrolled. Conversely, the age group of 10 to 14 year olds has the lowest likelihood of being enrolled in a private school, with 2 (100.0% in the age bracket) attending a public institution.
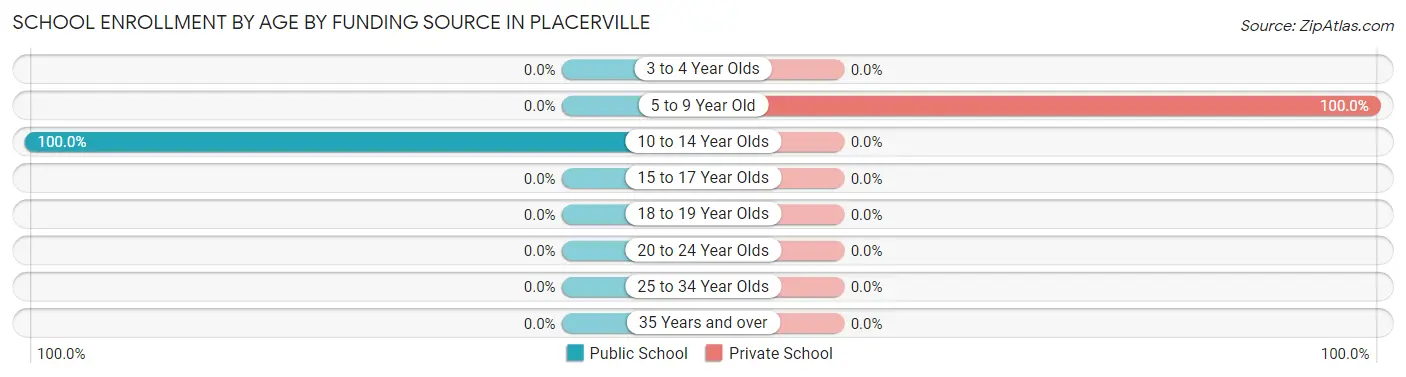
| Age Bracket | Public School | Private School |
| 3 to 4 Year Olds | 0 (0.0%) | 0 (0.0%) |
| 5 to 9 Year Old | 0 (0.0%) | 2 (100.0%) |
| 10 to 14 Year Olds | 2 (100.0%) | 0 (0.0%) |
| 15 to 17 Year Olds | 0 (0.0%) | 0 (0.0%) |
| 18 to 19 Year Olds | 0 (0.0%) | 0 (0.0%) |
| 20 to 24 Year Olds | 0 (0.0%) | 0 (0.0%) |
| 25 to 34 Year Olds | 0 (0.0%) | 0 (0.0%) |
| 35 Years and over | 0 (0.0%) | 0 (0.0%) |
| Total | 2 (50.0%) | 2 (50.0%) |
Educational Attainment by Field of Study in Placerville
Business (1 | 50.0%), and education (1 | 50.0%) are the most common fields of study among 2 individuals in Placerville who have obtained a bachelor's degree or higher.
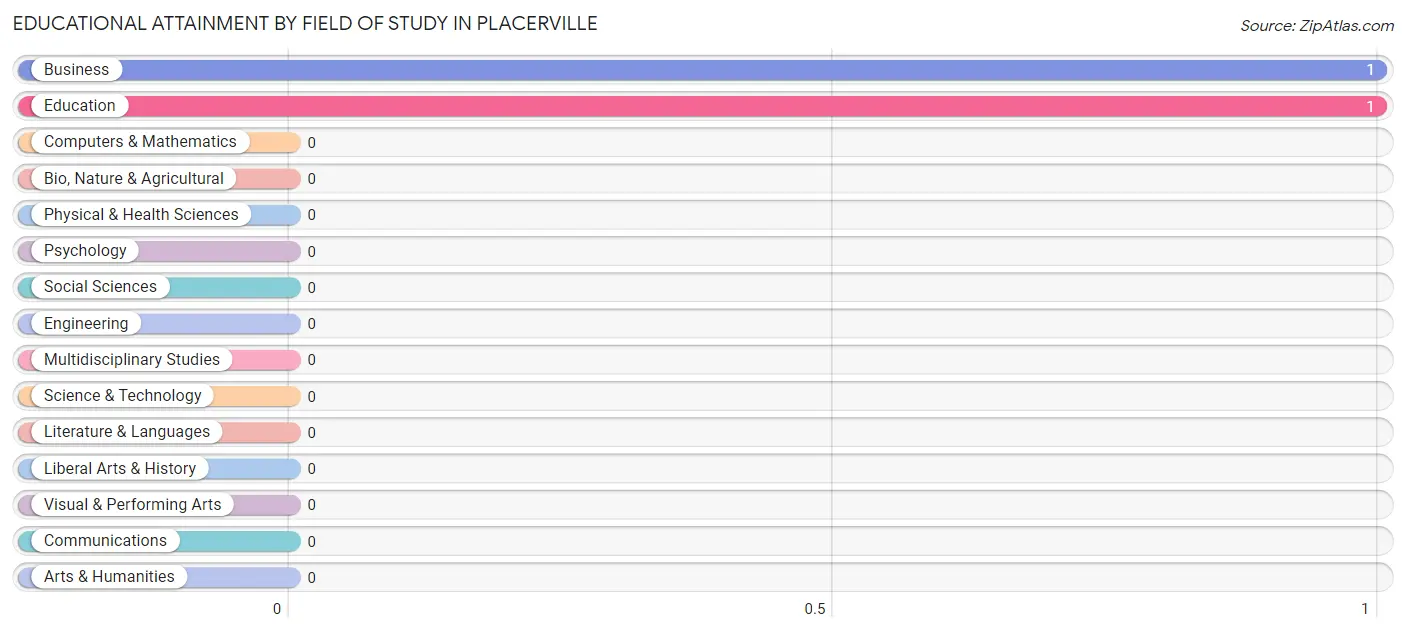
| Field of Study | # Graduates | % Graduates |
| Computers & Mathematics | 0 | 0.0% |
| Bio, Nature & Agricultural | 0 | 0.0% |
| Physical & Health Sciences | 0 | 0.0% |
| Psychology | 0 | 0.0% |
| Social Sciences | 0 | 0.0% |
| Engineering | 0 | 0.0% |
| Multidisciplinary Studies | 0 | 0.0% |
| Science & Technology | 0 | 0.0% |
| Business | 1 | 50.0% |
| Education | 1 | 50.0% |
| Literature & Languages | 0 | 0.0% |
| Liberal Arts & History | 0 | 0.0% |
| Visual & Performing Arts | 0 | 0.0% |
| Communications | 0 | 0.0% |
| Arts & Humanities | 0 | 0.0% |
| Total | 2 | 100.0% |
Transportation & Commute in Placerville
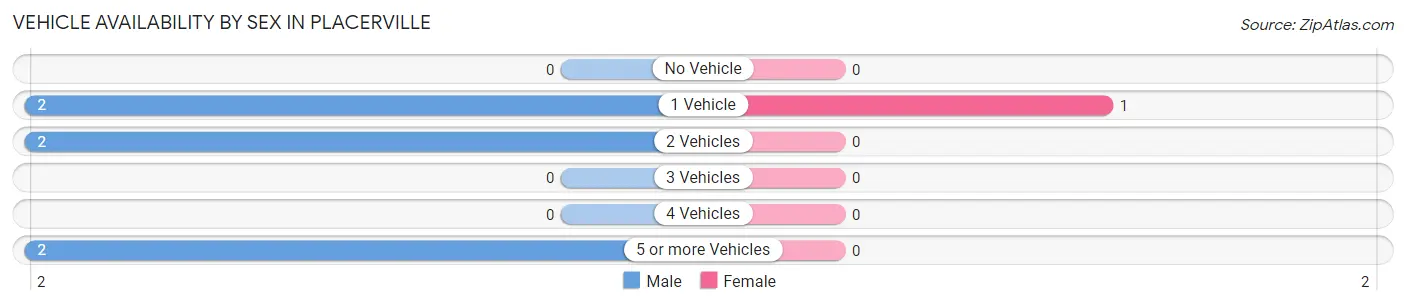
Vehicle Availability by Sex in Placerville
The most prevalent vehicle ownership categories in Placerville are males with 1 vehicle (2, accounting for 33.3%) and females with 1 vehicle (1, making up 200.0%).
| Vehicles Available | Male | Female |
| No Vehicle | 0 (0.0%) | 0 (0.0%) |
| 1 Vehicle | 2 (33.3%) | 1 (100.0%) |
| 2 Vehicles | 2 (33.3%) | 0 (0.0%) |
| 3 Vehicles | 0 (0.0%) | 0 (0.0%) |
| 4 Vehicles | 0 (0.0%) | 0 (0.0%) |
| 5 or more Vehicles | 2 (33.3%) | 0 (0.0%) |
| Total | 6 (100.0%) | 1 (100.0%) |
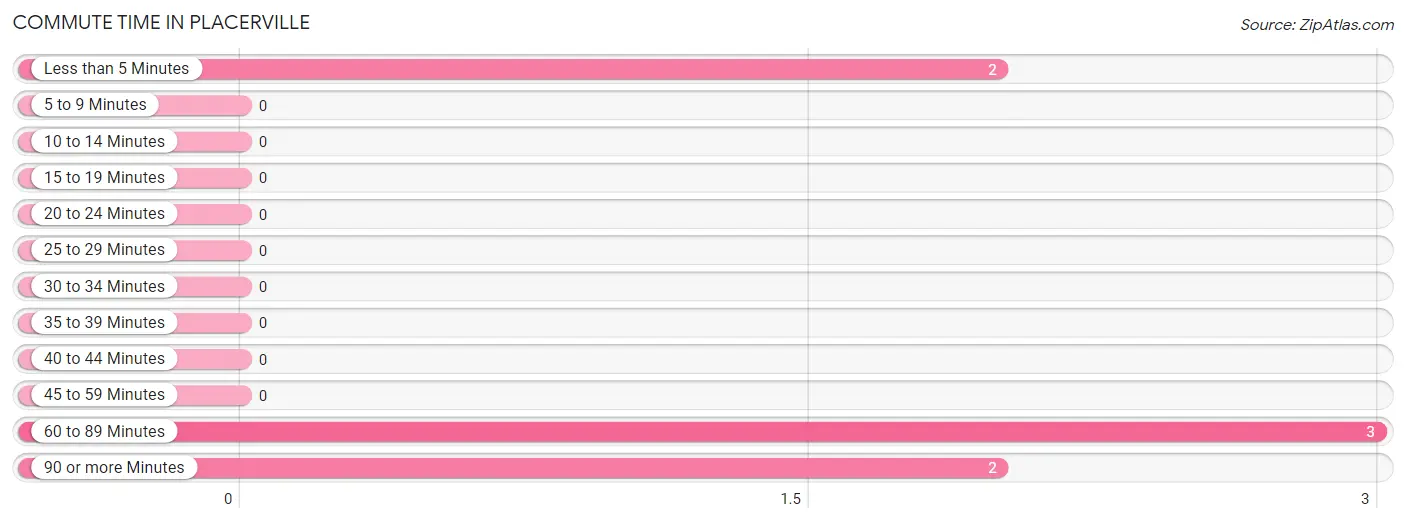
Commute Time in Placerville
The most frequently occuring commute durations in Placerville are 60 to 89 minutes (3 commuters, 42.9%), less than 5 minutes (2 commuters, 28.6%), and 90 or more minutes (2 commuters, 28.6%).
| Commute Time | # Commuters | % Commuters |
| Less than 5 Minutes | 2 | 28.6% |
| 5 to 9 Minutes | 0 | 0.0% |
| 10 to 14 Minutes | 0 | 0.0% |
| 15 to 19 Minutes | 0 | 0.0% |
| 20 to 24 Minutes | 0 | 0.0% |
| 25 to 29 Minutes | 0 | 0.0% |
| 30 to 34 Minutes | 0 | 0.0% |
| 35 to 39 Minutes | 0 | 0.0% |
| 40 to 44 Minutes | 0 | 0.0% |
| 45 to 59 Minutes | 0 | 0.0% |
| 60 to 89 Minutes | 3 | 42.9% |
| 90 or more Minutes | 2 | 28.6% |
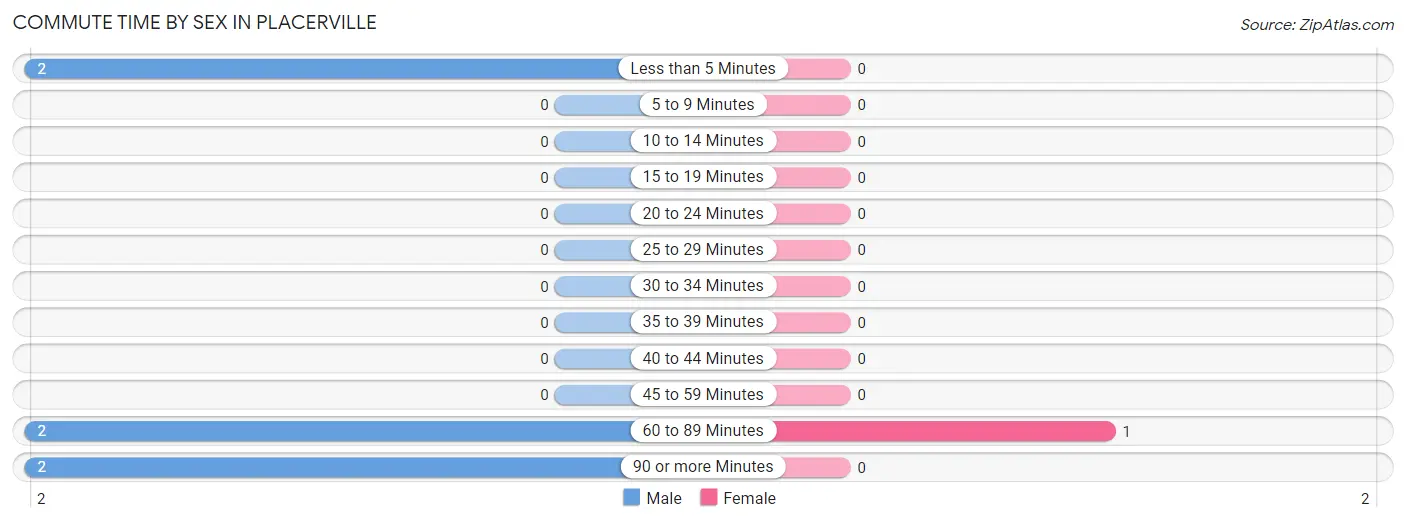
Commute Time by Sex in Placerville
The most common commute times in Placerville are less than 5 minutes (2 commuters, 33.3%) for males and 60 to 89 minutes (1 commuters, 100.0%) for females.
| Commute Time | Male | Female |
| Less than 5 Minutes | 2 (33.3%) | 0 (0.0%) |
| 5 to 9 Minutes | 0 (0.0%) | 0 (0.0%) |
| 10 to 14 Minutes | 0 (0.0%) | 0 (0.0%) |
| 15 to 19 Minutes | 0 (0.0%) | 0 (0.0%) |
| 20 to 24 Minutes | 0 (0.0%) | 0 (0.0%) |
| 25 to 29 Minutes | 0 (0.0%) | 0 (0.0%) |
| 30 to 34 Minutes | 0 (0.0%) | 0 (0.0%) |
| 35 to 39 Minutes | 0 (0.0%) | 0 (0.0%) |
| 40 to 44 Minutes | 0 (0.0%) | 0 (0.0%) |
| 45 to 59 Minutes | 0 (0.0%) | 0 (0.0%) |
| 60 to 89 Minutes | 2 (33.3%) | 1 (100.0%) |
| 90 or more Minutes | 2 (33.3%) | 0 (0.0%) |
Time of Departure to Work by Sex in Placerville
The most frequent times of departure to work in Placerville are 5:00 AM to 5:29 AM (2, 33.3%) for males and 6:00 AM to 6:29 AM (1, 100.0%) for females.
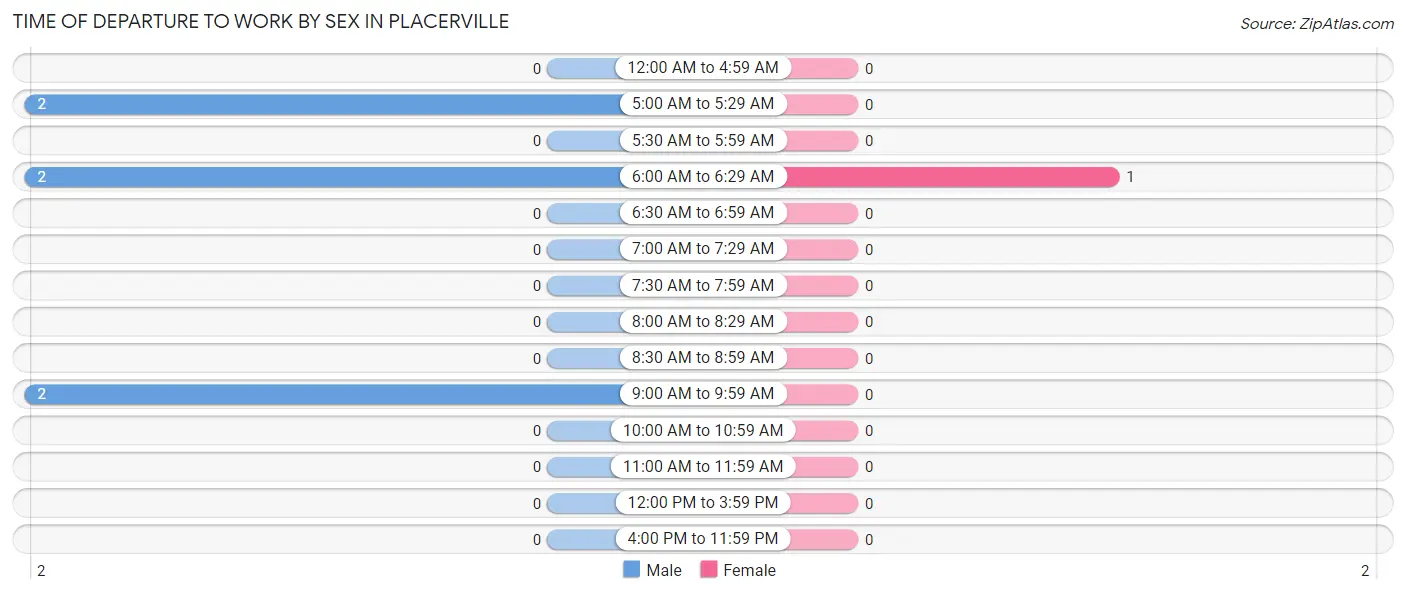
| Time of Departure | Male | Female |
| 12:00 AM to 4:59 AM | 0 (0.0%) | 0 (0.0%) |
| 5:00 AM to 5:29 AM | 2 (33.3%) | 0 (0.0%) |
| 5:30 AM to 5:59 AM | 0 (0.0%) | 0 (0.0%) |
| 6:00 AM to 6:29 AM | 2 (33.3%) | 1 (100.0%) |
| 6:30 AM to 6:59 AM | 0 (0.0%) | 0 (0.0%) |
| 7:00 AM to 7:29 AM | 0 (0.0%) | 0 (0.0%) |
| 7:30 AM to 7:59 AM | 0 (0.0%) | 0 (0.0%) |
| 8:00 AM to 8:29 AM | 0 (0.0%) | 0 (0.0%) |
| 8:30 AM to 8:59 AM | 0 (0.0%) | 0 (0.0%) |
| 9:00 AM to 9:59 AM | 2 (33.3%) | 0 (0.0%) |
| 10:00 AM to 10:59 AM | 0 (0.0%) | 0 (0.0%) |
| 11:00 AM to 11:59 AM | 0 (0.0%) | 0 (0.0%) |
| 12:00 PM to 3:59 PM | 0 (0.0%) | 0 (0.0%) |
| 4:00 PM to 11:59 PM | 0 (0.0%) | 0 (0.0%) |
| Total | 6 (100.0%) | 1 (100.0%) |
Housing Occupancy in Placerville
Occupancy by Ownership in Placerville
Of the total 21 dwellings in Placerville, owner-occupied units account for 16 (76.2%), while renter-occupied units make up 5 (23.8%).
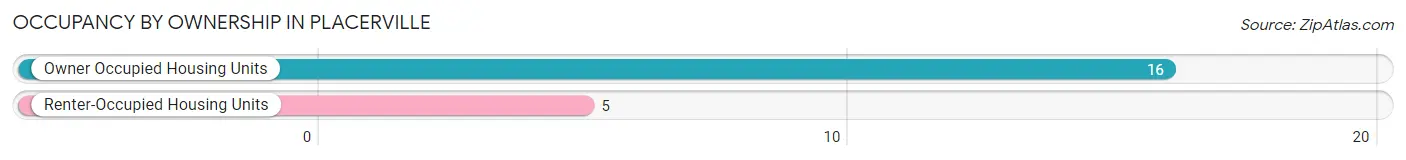
| Occupancy | # Housing Units | % Housing Units |
| Owner Occupied Housing Units | 16 | 76.2% |
| Renter-Occupied Housing Units | 5 | 23.8% |
| Total Occupied Housing Units | 21 | 100.0% |
Occupancy by Household Size in Placerville
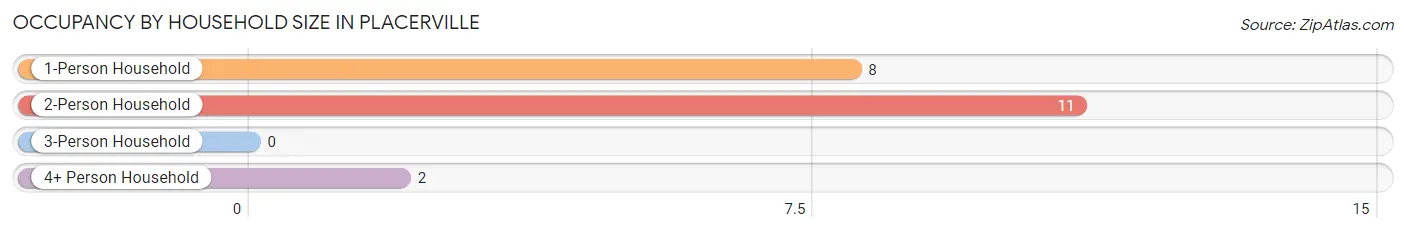
| Household Size | # Housing Units | % Housing Units |
| 1-Person Household | 8 | 38.1% |
| 2-Person Household | 11 | 52.4% |
| 3-Person Household | 0 | 0.0% |
| 4+ Person Household | 2 | 9.5% |
| Total Housing Units | 21 | 100.0% |
Occupancy by Ownership by Household Size in Placerville
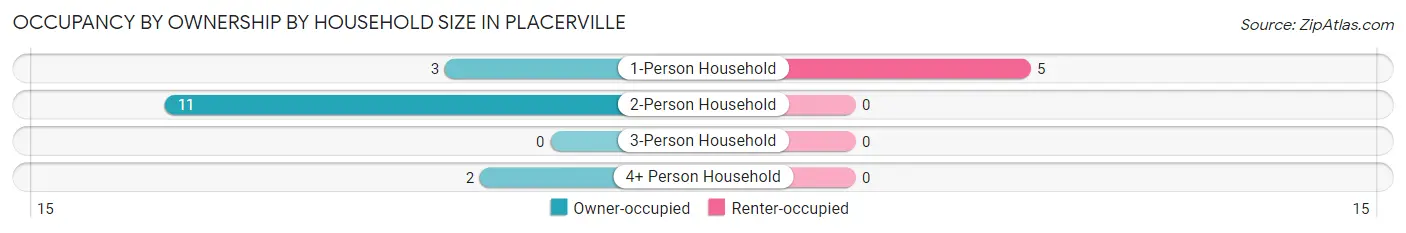
| Household Size | Owner-occupied | Renter-occupied |
| 1-Person Household | 3 (37.5%) | 5 (62.5%) |
| 2-Person Household | 11 (100.0%) | 0 (0.0%) |
| 3-Person Household | 0 (0.0%) | 0 (0.0%) |
| 4+ Person Household | 2 (100.0%) | 0 (0.0%) |
| Total Housing Units | 16 (76.2%) | 5 (23.8%) |
Occupancy by Educational Attainment in Placerville
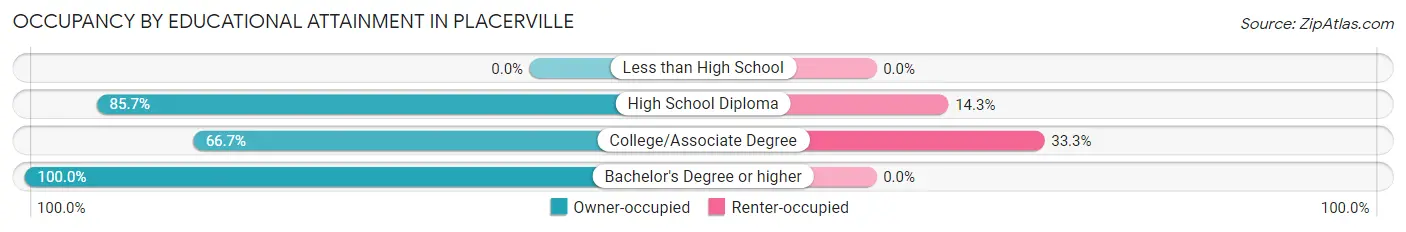
| Household Size | Owner-occupied | Renter-occupied |
| Less than High School | 0 (0.0%) | 0 (0.0%) |
| High School Diploma | 6 (85.7%) | 1 (14.3%) |
| College/Associate Degree | 8 (66.7%) | 4 (33.3%) |
| Bachelor's Degree or higher | 2 (100.0%) | 0 (0.0%) |
Occupancy by Age of Householder in Placerville
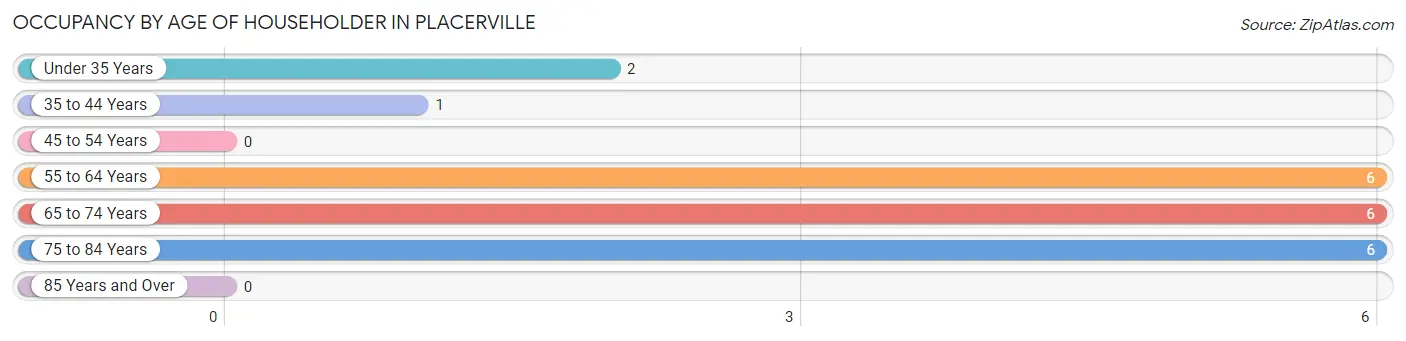
| Age Bracket | # Households | % Households |
| Under 35 Years | 2 | 9.5% |
| 35 to 44 Years | 1 | 4.8% |
| 45 to 54 Years | 0 | 0.0% |
| 55 to 64 Years | 6 | 28.6% |
| 65 to 74 Years | 6 | 28.6% |
| 75 to 84 Years | 6 | 28.6% |
| 85 Years and Over | 0 | 0.0% |
| Total | 21 | 100.0% |
Housing Finances in Placerville
Median Income by Occupancy in Placerville
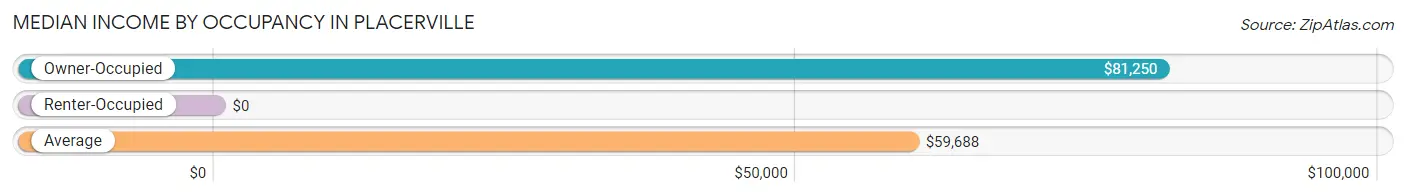
| Occupancy Type | # Households | Median Income |
| Owner-Occupied | 16 (76.2%) | $81,250 |
| Renter-Occupied | 5 (23.8%) | $0 |
| Average | 21 (100.0%) | $59,688 |
Occupancy by Householder Income Bracket in Placerville
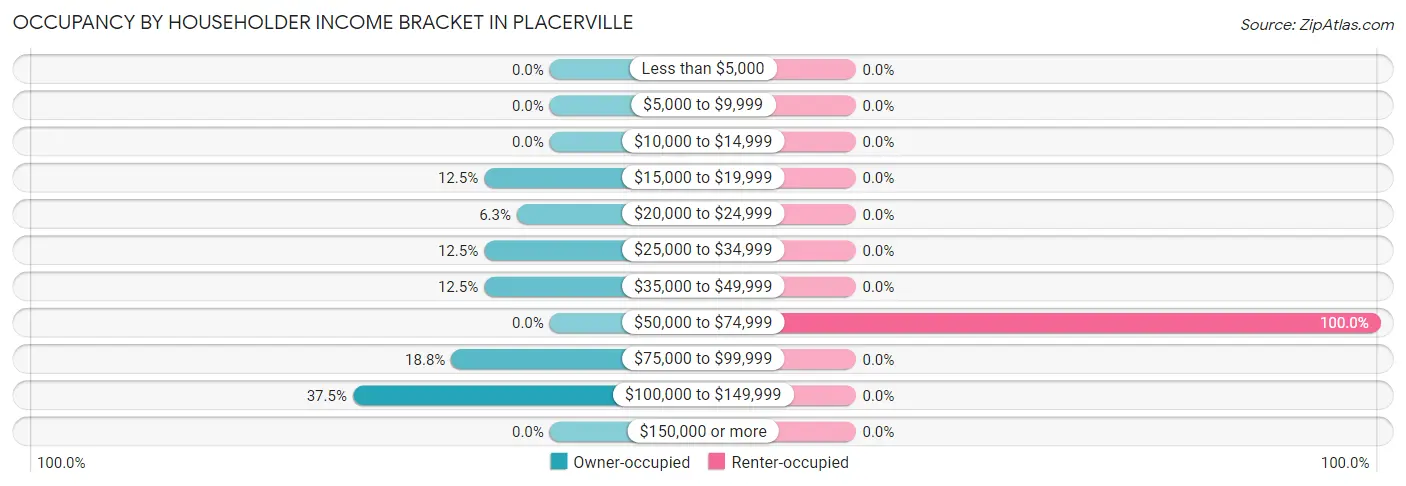
| Income Bracket | Owner-occupied | Renter-occupied |
| Less than $5,000 | 0 (0.0%) | 0 (0.0%) |
| $5,000 to $9,999 | 0 (0.0%) | 0 (0.0%) |
| $10,000 to $14,999 | 0 (0.0%) | 0 (0.0%) |
| $15,000 to $19,999 | 2 (12.5%) | 0 (0.0%) |
| $20,000 to $24,999 | 1 (6.2%) | 0 (0.0%) |
| $25,000 to $34,999 | 2 (12.5%) | 0 (0.0%) |
| $35,000 to $49,999 | 2 (12.5%) | 0 (0.0%) |
| $50,000 to $74,999 | 0 (0.0%) | 5 (100.0%) |
| $75,000 to $99,999 | 3 (18.8%) | 0 (0.0%) |
| $100,000 to $149,999 | 6 (37.5%) | 0 (0.0%) |
| $150,000 or more | 0 (0.0%) | 0 (0.0%) |
| Total | 16 (100.0%) | 5 (100.0%) |
Monthly Housing Cost Tiers in Placerville
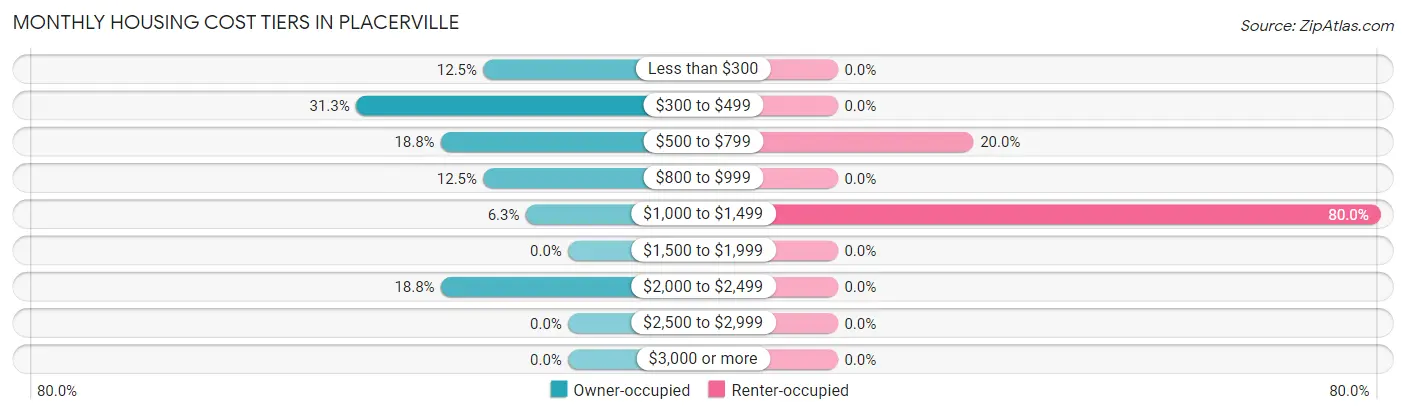
| Monthly Cost | Owner-occupied | Renter-occupied |
| Less than $300 | 2 (12.5%) | 0 (0.0%) |
| $300 to $499 | 5 (31.2%) | 0 (0.0%) |
| $500 to $799 | 3 (18.8%) | 1 (20.0%) |
| $800 to $999 | 2 (12.5%) | 0 (0.0%) |
| $1,000 to $1,499 | 1 (6.2%) | 4 (80.0%) |
| $1,500 to $1,999 | 0 (0.0%) | 0 (0.0%) |
| $2,000 to $2,499 | 3 (18.8%) | 0 (0.0%) |
| $2,500 to $2,999 | 0 (0.0%) | 0 (0.0%) |
| $3,000 or more | 0 (0.0%) | 0 (0.0%) |
| Total | 16 (100.0%) | 5 (100.0%) |
Physical Housing Characteristics in Placerville
Housing Structures in Placerville
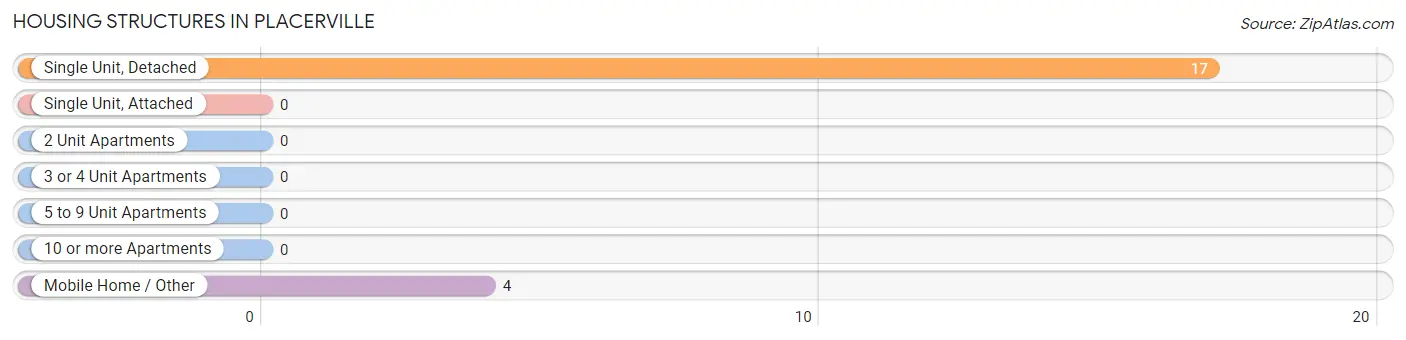
| Structure Type | # Housing Units | % Housing Units |
| Single Unit, Detached | 17 | 80.9% |
| Single Unit, Attached | 0 | 0.0% |
| 2 Unit Apartments | 0 | 0.0% |
| 3 or 4 Unit Apartments | 0 | 0.0% |
| 5 to 9 Unit Apartments | 0 | 0.0% |
| 10 or more Apartments | 0 | 0.0% |
| Mobile Home / Other | 4 | 19.1% |
| Total | 21 | 100.0% |
Housing Structures by Occupancy in Placerville
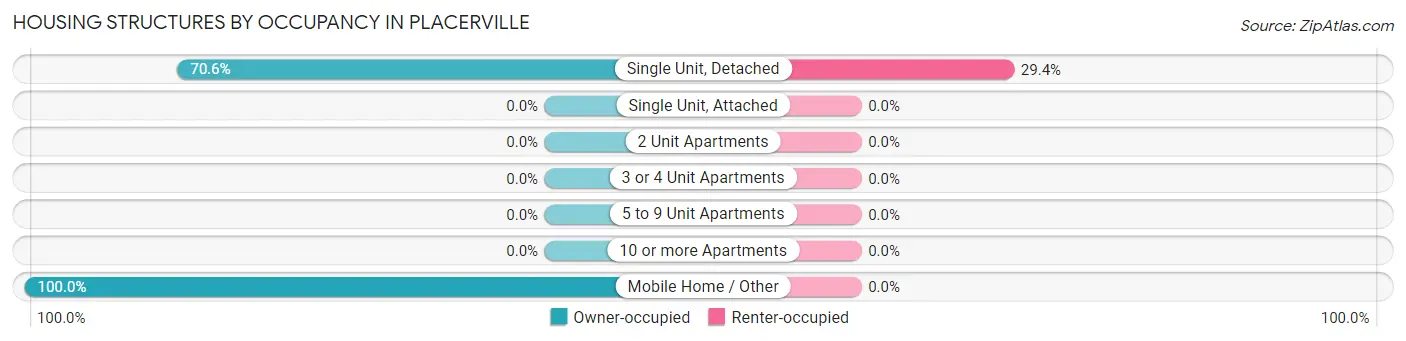
| Structure Type | Owner-occupied | Renter-occupied |
| Single Unit, Detached | 12 (70.6%) | 5 (29.4%) |
| Single Unit, Attached | 0 (0.0%) | 0 (0.0%) |
| 2 Unit Apartments | 0 (0.0%) | 0 (0.0%) |
| 3 or 4 Unit Apartments | 0 (0.0%) | 0 (0.0%) |
| 5 to 9 Unit Apartments | 0 (0.0%) | 0 (0.0%) |
| 10 or more Apartments | 0 (0.0%) | 0 (0.0%) |
| Mobile Home / Other | 4 (100.0%) | 0 (0.0%) |
| Total | 16 (76.2%) | 5 (23.8%) |
Housing Structures by Number of Rooms in Placerville
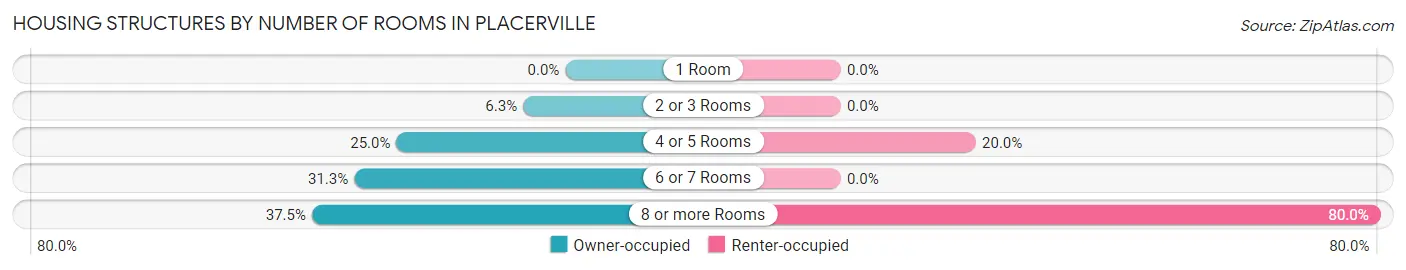
| Number of Rooms | Owner-occupied | Renter-occupied |
| 1 Room | 0 (0.0%) | 0 (0.0%) |
| 2 or 3 Rooms | 1 (6.2%) | 0 (0.0%) |
| 4 or 5 Rooms | 4 (25.0%) | 1 (20.0%) |
| 6 or 7 Rooms | 5 (31.2%) | 0 (0.0%) |
| 8 or more Rooms | 6 (37.5%) | 4 (80.0%) |
| Total | 16 (100.0%) | 5 (100.0%) |
Housing Structure by Heating Type in Placerville
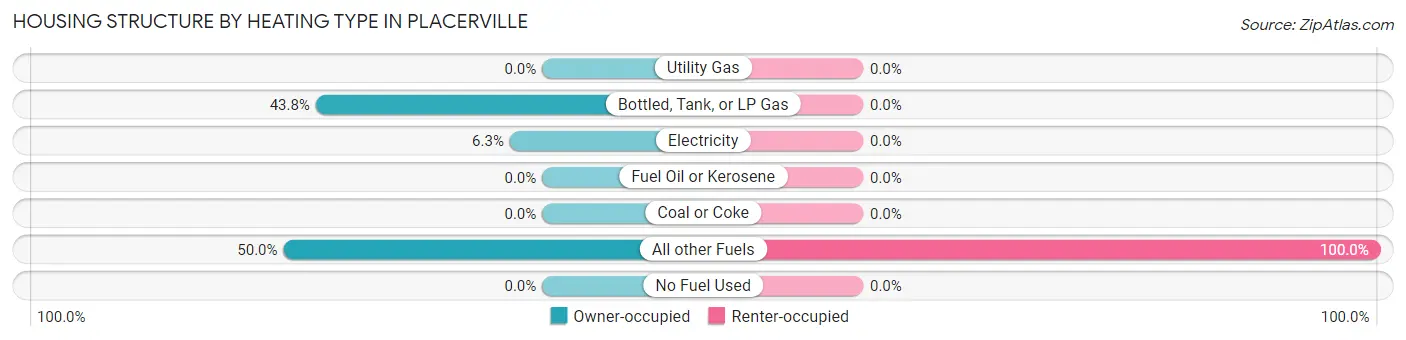
| Heating Type | Owner-occupied | Renter-occupied |
| Utility Gas | 0 (0.0%) | 0 (0.0%) |
| Bottled, Tank, or LP Gas | 7 (43.8%) | 0 (0.0%) |
| Electricity | 1 (6.2%) | 0 (0.0%) |
| Fuel Oil or Kerosene | 0 (0.0%) | 0 (0.0%) |
| Coal or Coke | 0 (0.0%) | 0 (0.0%) |
| All other Fuels | 8 (50.0%) | 5 (100.0%) |
| No Fuel Used | 0 (0.0%) | 0 (0.0%) |
| Total | 16 (100.0%) | 5 (100.0%) |
Household Vehicle Usage in Placerville
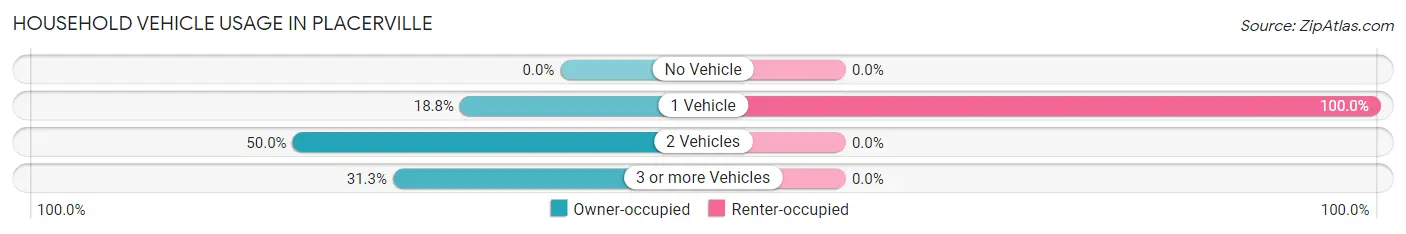
| Vehicles per Household | Owner-occupied | Renter-occupied |
| No Vehicle | 0 (0.0%) | 0 (0.0%) |
| 1 Vehicle | 3 (18.8%) | 5 (100.0%) |
| 2 Vehicles | 8 (50.0%) | 0 (0.0%) |
| 3 or more Vehicles | 5 (31.2%) | 0 (0.0%) |
| Total | 16 (100.0%) | 5 (100.0%) |
Real Estate & Mortgages in Placerville
Real Estate and Mortgage Overview in Placerville
| Characteristic | Without Mortgage | With Mortgage |
| Housing Units | 6 | 10 |
| Median Property Value | - | - |
| Median Household Income | $62,500 | $0 |
| Monthly Housing Costs | $350 | $0 |
| Real Estate Taxes | $800 | $0 |
Property Value by Mortgage Status in Placerville
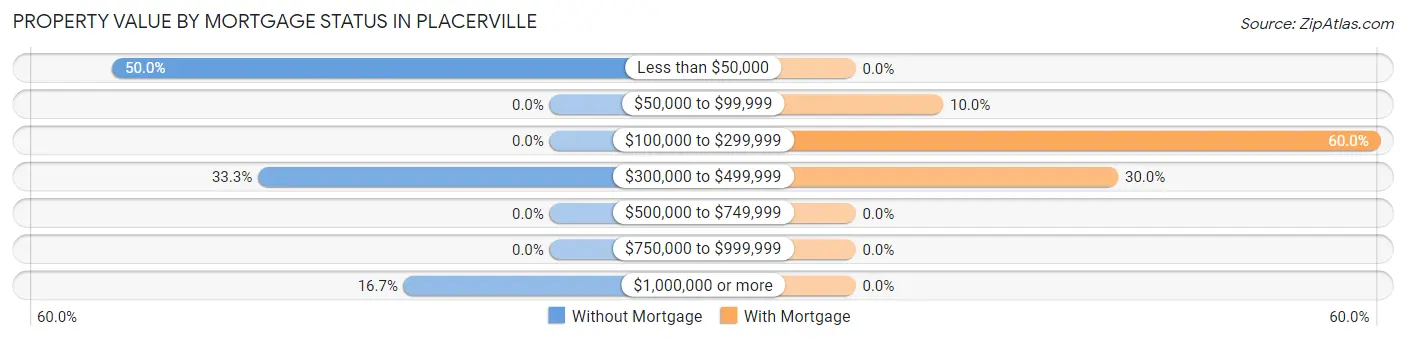
| Property Value | Without Mortgage | With Mortgage |
| Less than $50,000 | 3 (50.0%) | 0 (0.0%) |
| $50,000 to $99,999 | 0 (0.0%) | 1 (10.0%) |
| $100,000 to $299,999 | 0 (0.0%) | 6 (60.0%) |
| $300,000 to $499,999 | 2 (33.3%) | 3 (30.0%) |
| $500,000 to $749,999 | 0 (0.0%) | 0 (0.0%) |
| $750,000 to $999,999 | 0 (0.0%) | 0 (0.0%) |
| $1,000,000 or more | 1 (16.7%) | 0 (0.0%) |
| Total | 6 (100.0%) | 10 (100.0%) |
Household Income by Mortgage Status in Placerville
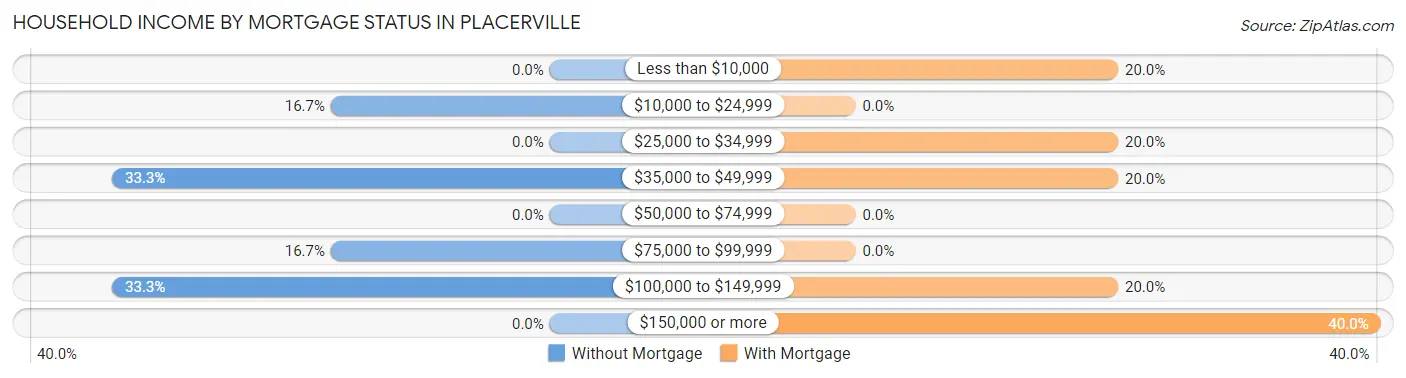
| Household Income | Without Mortgage | With Mortgage |
| Less than $10,000 | 0 (0.0%) | 2 (20.0%) |
| $10,000 to $24,999 | 1 (16.7%) | 0 (0.0%) |
| $25,000 to $34,999 | 0 (0.0%) | 2 (20.0%) |
| $35,000 to $49,999 | 2 (33.3%) | 2 (20.0%) |
| $50,000 to $74,999 | 0 (0.0%) | 0 (0.0%) |
| $75,000 to $99,999 | 1 (16.7%) | 0 (0.0%) |
| $100,000 to $149,999 | 2 (33.3%) | 2 (20.0%) |
| $150,000 or more | 0 (0.0%) | 4 (40.0%) |
| Total | 6 (100.0%) | 10 (100.0%) |
Property Value to Household Income Ratio in Placerville
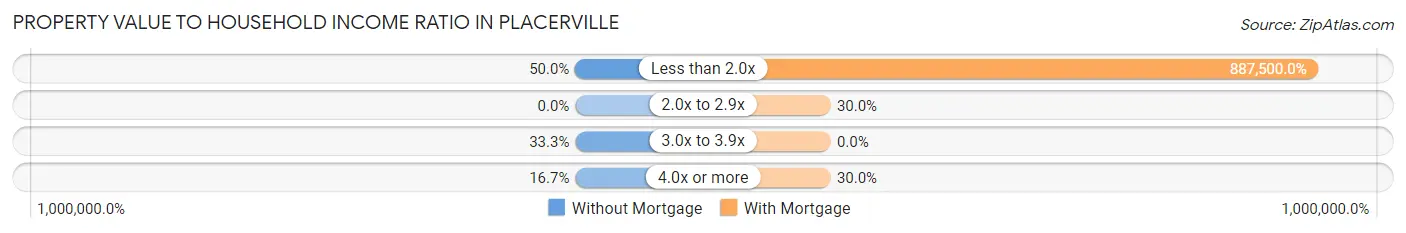
| Value-to-Income Ratio | Without Mortgage | With Mortgage |
| Less than 2.0x | 3 (50.0%) | 88,750 (887,500.0%) |
| 2.0x to 2.9x | 0 (0.0%) | 3 (30.0%) |
| 3.0x to 3.9x | 2 (33.3%) | 0 (0.0%) |
| 4.0x or more | 1 (16.7%) | 3 (30.0%) |
| Total | 6 (100.0%) | 10 (100.0%) |
Real Estate Taxes by Mortgage Status in Placerville
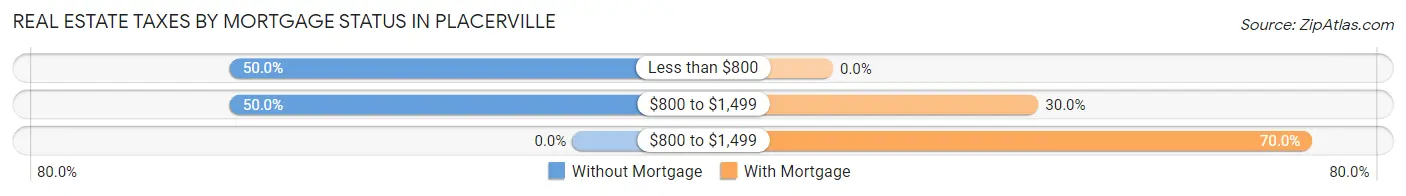
| Property Taxes | Without Mortgage | With Mortgage |
| Less than $800 | 3 (50.0%) | 0 (0.0%) |
| $800 to $1,499 | 3 (50.0%) | 3 (30.0%) |
| $800 to $1,499 | 0 (0.0%) | 7 (70.0%) |
| Total | 6 (100.0%) | 10 (100.0%) |
Health & Disability in Placerville
Health Insurance Coverage by Age in Placerville
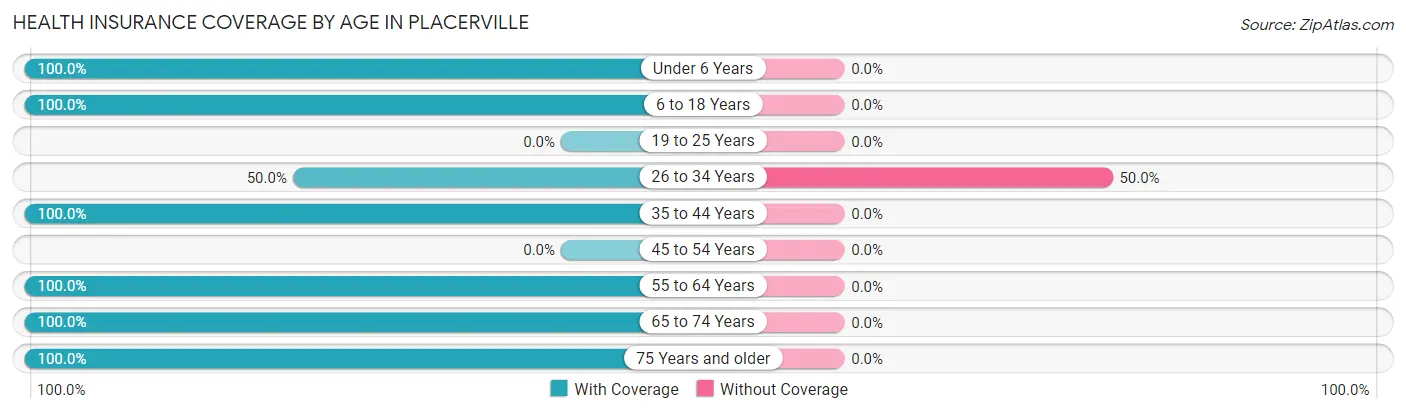
| Age Bracket | With Coverage | Without Coverage |
| Under 6 Years | 1 (100.0%) | 0 (0.0%) |
| 6 to 18 Years | 4 (100.0%) | 0 (0.0%) |
| 19 to 25 Years | 0 (0.0%) | 0 (0.0%) |
| 26 to 34 Years | 2 (50.0%) | 2 (50.0%) |
| 35 to 44 Years | 3 (100.0%) | 0 (0.0%) |
| 45 to 54 Years | 0 (0.0%) | 0 (0.0%) |
| 55 to 64 Years | 8 (100.0%) | 0 (0.0%) |
| 65 to 74 Years | 13 (100.0%) | 0 (0.0%) |
| 75 Years and older | 8 (100.0%) | 0 (0.0%) |
| Total | 39 (95.1%) | 2 (4.9%) |
Health Insurance Coverage by Citizenship Status in Placerville
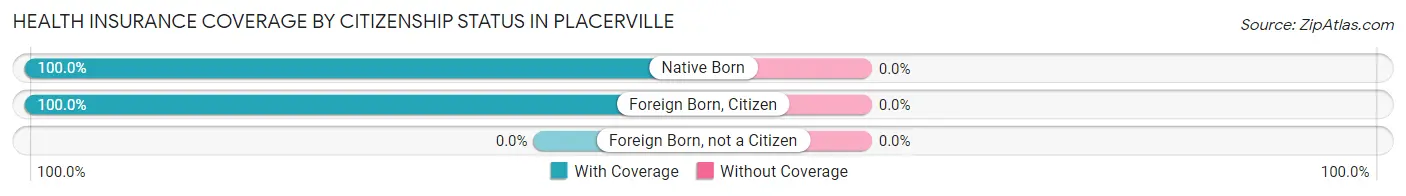
| Citizenship Status | With Coverage | Without Coverage |
| Native Born | 1 (100.0%) | 0 (0.0%) |
| Foreign Born, Citizen | 4 (100.0%) | 0 (0.0%) |
| Foreign Born, not a Citizen | 0 (0.0%) | 0 (0.0%) |
Health Insurance Coverage by Household Income in Placerville
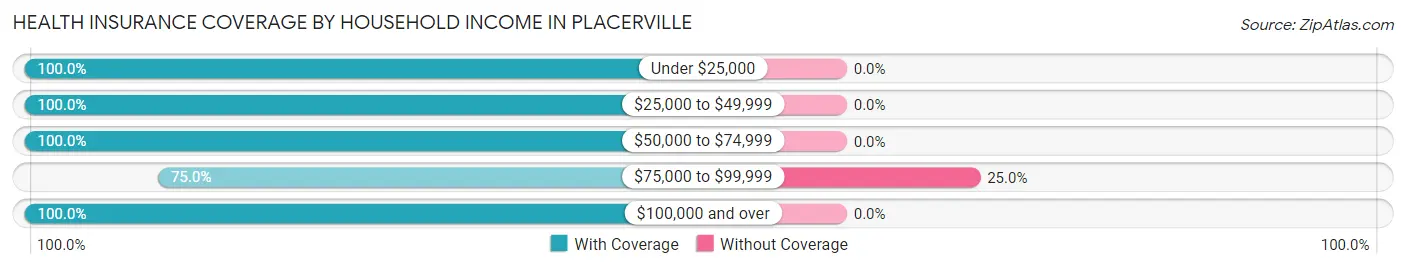
| Household Income | With Coverage | Without Coverage |
| Under $25,000 | 5 (100.0%) | 0 (0.0%) |
| $25,000 to $49,999 | 11 (100.0%) | 0 (0.0%) |
| $50,000 to $74,999 | 5 (100.0%) | 0 (0.0%) |
| $75,000 to $99,999 | 6 (75.0%) | 2 (25.0%) |
| $100,000 and over | 12 (100.0%) | 0 (0.0%) |
Public vs Private Health Insurance Coverage by Age in Placerville
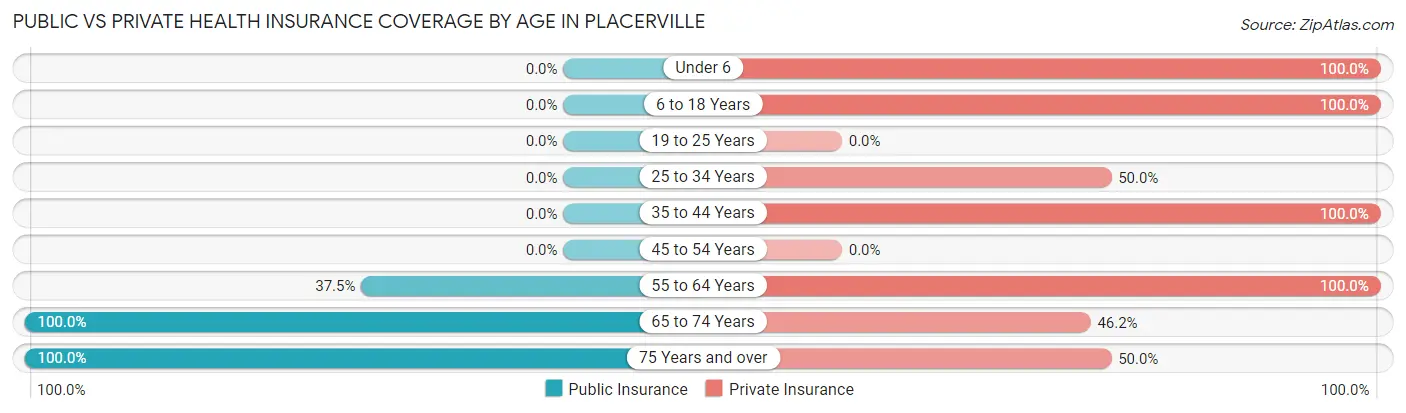
| Age Bracket | Public Insurance | Private Insurance |
| Under 6 | 0 (0.0%) | 1 (100.0%) |
| 6 to 18 Years | 0 (0.0%) | 4 (100.0%) |
| 19 to 25 Years | 0 (0.0%) | 0 (0.0%) |
| 25 to 34 Years | 0 (0.0%) | 2 (50.0%) |
| 35 to 44 Years | 0 (0.0%) | 3 (100.0%) |
| 45 to 54 Years | 0 (0.0%) | 0 (0.0%) |
| 55 to 64 Years | 3 (37.5%) | 8 (100.0%) |
| 65 to 74 Years | 13 (100.0%) | 6 (46.2%) |
| 75 Years and over | 8 (100.0%) | 4 (50.0%) |
| Total | 24 (58.5%) | 28 (68.3%) |
Disability Status by Sex by Age in Placerville
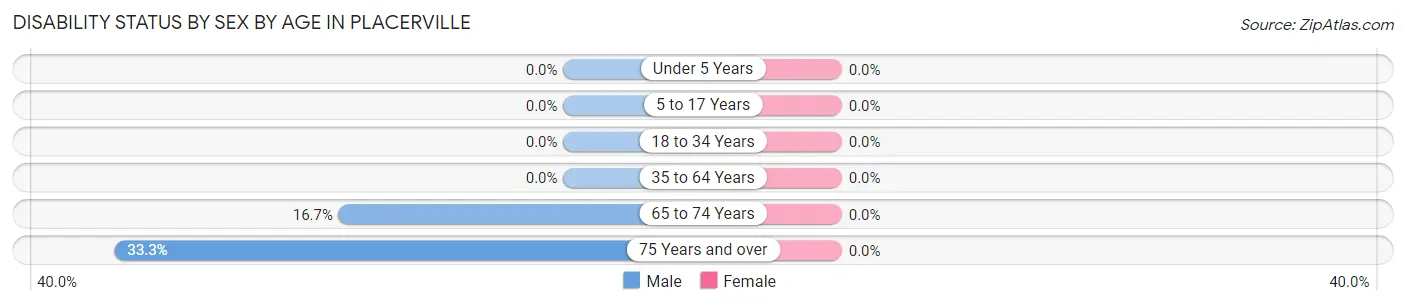
| Age Bracket | Male | Female |
| Under 5 Years | 0 (0.0%) | 0 (0.0%) |
| 5 to 17 Years | 0 (0.0%) | 0 (0.0%) |
| 18 to 34 Years | 0 (0.0%) | 0 (0.0%) |
| 35 to 64 Years | 0 (0.0%) | 0 (0.0%) |
| 65 to 74 Years | 1 (16.7%) | 0 (0.0%) |
| 75 Years and over | 2 (33.3%) | 0 (0.0%) |
Disability Class by Sex by Age in Placerville
Disability Class: Hearing Difficulty
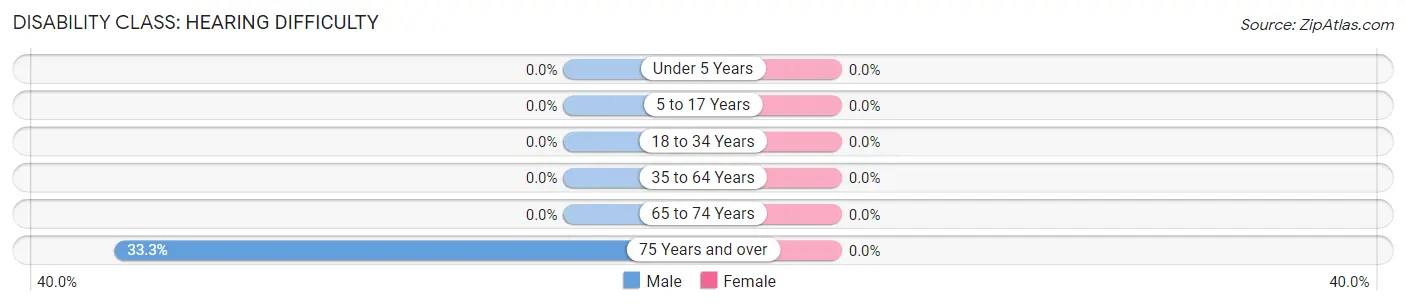
| Age Bracket | Male | Female |
| Under 5 Years | 0 (0.0%) | 0 (0.0%) |
| 5 to 17 Years | 0 (0.0%) | 0 (0.0%) |
| 18 to 34 Years | 0 (0.0%) | 0 (0.0%) |
| 35 to 64 Years | 0 (0.0%) | 0 (0.0%) |
| 65 to 74 Years | 0 (0.0%) | 0 (0.0%) |
| 75 Years and over | 2 (33.3%) | 0 (0.0%) |
Disability Class: Vision Difficulty
| Age Bracket | Male | Female |
| Under 5 Years | 0 (0.0%) | 0 (0.0%) |
| 5 to 17 Years | 0 (0.0%) | 0 (0.0%) |
| 18 to 34 Years | 0 (0.0%) | 0 (0.0%) |
| 35 to 64 Years | 0 (0.0%) | 0 (0.0%) |
| 65 to 74 Years | 0 (0.0%) | 0 (0.0%) |
| 75 Years and over | 0 (0.0%) | 0 (0.0%) |
Disability Class: Cognitive Difficulty

| Age Bracket | Male | Female |
| 5 to 17 Years | 0 (0.0%) | 0 (0.0%) |
| 18 to 34 Years | 0 (0.0%) | 0 (0.0%) |
| 35 to 64 Years | 0 (0.0%) | 0 (0.0%) |
| 65 to 74 Years | 0 (0.0%) | 0 (0.0%) |
| 75 Years and over | 0 (0.0%) | 0 (0.0%) |
Disability Class: Ambulatory Difficulty
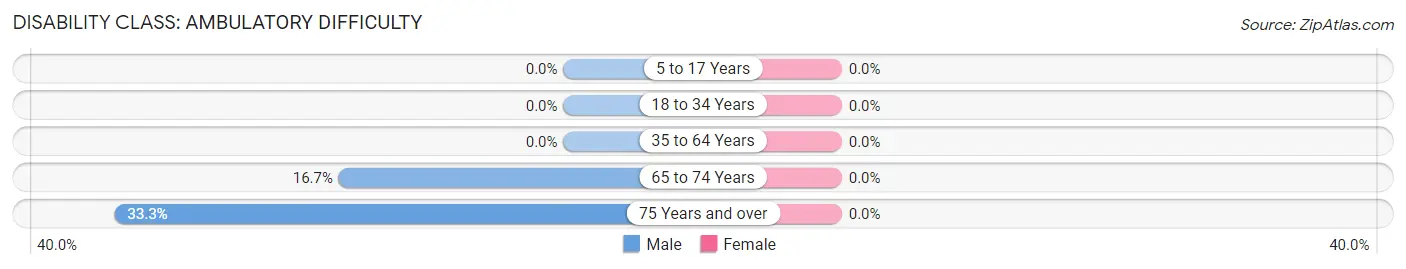
| Age Bracket | Male | Female |
| 5 to 17 Years | 0 (0.0%) | 0 (0.0%) |
| 18 to 34 Years | 0 (0.0%) | 0 (0.0%) |
| 35 to 64 Years | 0 (0.0%) | 0 (0.0%) |
| 65 to 74 Years | 1 (16.7%) | 0 (0.0%) |
| 75 Years and over | 2 (33.3%) | 0 (0.0%) |
Disability Class: Self-Care Difficulty
| Age Bracket | Male | Female |
| 5 to 17 Years | 0 (0.0%) | 0 (0.0%) |
| 18 to 34 Years | 0 (0.0%) | 0 (0.0%) |
| 35 to 64 Years | 0 (0.0%) | 0 (0.0%) |
| 65 to 74 Years | 0 (0.0%) | 0 (0.0%) |
| 75 Years and over | 0 (0.0%) | 0 (0.0%) |
Technology Access in Placerville
Computing Device Access in Placerville
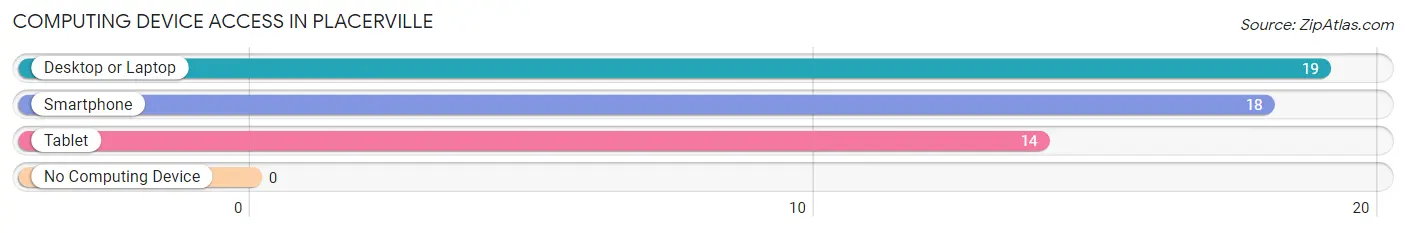
| Device Type | # Households | % Households |
| Desktop or Laptop | 19 | 90.5% |
| Smartphone | 18 | 85.7% |
| Tablet | 14 | 66.7% |
| No Computing Device | 0 | 0.0% |
| Total | 21 | 100.0% |
Internet Access in Placerville
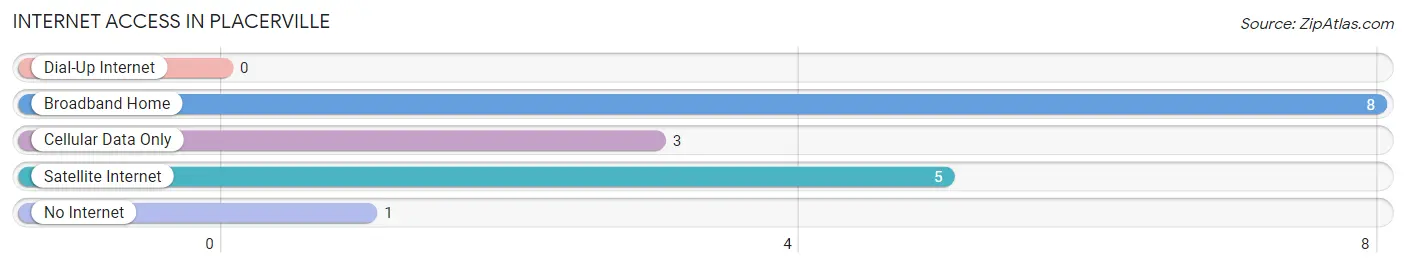
| Internet Type | # Households | % Households |
| Dial-Up Internet | 0 | 0.0% |
| Broadband Home | 8 | 38.1% |
| Cellular Data Only | 3 | 14.3% |
| Satellite Internet | 5 | 23.8% |
| No Internet | 1 | 4.8% |
| Total | 21 | 100.0% |
Placerville Summary
Placerville, Idaho is a small town located in the northern part of the state, in Shoshone County. It is situated at the junction of the North and South Forks of the Coeur d'Alene River, and is surrounded by the Coeur d'Alene National Forest. The town has a population of just over 500 people, and is a popular destination for outdoor recreation.
History
Placerville was founded in 1883 by a group of miners who were searching for gold in the area. The town was named after the nearby Placer Creek, which was named for the gold deposits that were found in the area. The town quickly grew, and by the early 1900s, it had become a bustling mining town with a population of over 1,000 people.
The town was also home to a number of businesses, including a hotel, a general store, a saloon, and a blacksmith shop. The town was also home to a number of churches, including the First Presbyterian Church, which was founded in 1885.
The town's population began to decline in the early 1900s, as the gold deposits in the area began to run out. By the 1950s, the population had dropped to just over 500 people.
Geography
Placerville is located in the northern part of Idaho, in Shoshone County. It is situated at the junction of the North and South Forks of the Coeur d'Alene River, and is surrounded by the Coeur d'Alene National Forest. The town is located at an elevation of 2,845 feet above sea level.
The climate in Placerville is generally mild, with warm summers and cold winters. The average high temperature in the summer is around 85 degrees Fahrenheit, and the average low temperature in the winter is around 20 degrees Fahrenheit.
Economy
The economy of Placerville is largely based on tourism and outdoor recreation. The town is a popular destination for fishing, hunting, camping, and other outdoor activities. The town is also home to a number of small businesses, including restaurants, shops, and lodging.
Demographics
As of the 2010 census, the population of Placerville was 514 people. The racial makeup of the town was 95.3% White, 0.6% Native American, 0.2% Asian, 0.2% from other races, and 3.7% from two or more races. The median household income in the town was $35,625, and the median family income was $41,250.
Conclusion
Placerville, Idaho is a small town located in the northern part of the state, in Shoshone County. It is situated at the junction of the North and South Forks of the Coeur d'Alene River, and is surrounded by the Coeur d'Alene National Forest. The town has a population of just over 500 people, and is a popular destination for outdoor recreation. The economy of Placerville is largely based on tourism and outdoor recreation, and the town is home to a number of small businesses. The racial makeup of the town is predominantly White, with a small percentage of Native American, Asian, and other races.
Common Questions
What is Per Capita Income in Placerville?
Per Capita income in Placerville is $37,727.
What is the Median Family Income in Placerville?
Median Family Income in Placerville is $91,250.
What is the Median Household income in Placerville?
Median Household Income in Placerville is $59,688.
What is Inequality or Gini Index in Placerville?
Inequality or Gini Index in Placerville is 0.29.
What is the Total Population of Placerville?
Total Population of Placerville is 41.
What is the Total Male Population of Placerville?
Total Male Population of Placerville is 26.
What is the Total Female Population of Placerville?
Total Female Population of Placerville is 15.
What is the Ratio of Males per 100 Females in Placerville?
There are 173.33 Males per 100 Females in Placerville.
What is the Ratio of Females per 100 Males in Placerville?
There are 57.69 Females per 100 Males in Placerville.
What is the Median Population Age in Placerville?
Median Population Age in Placerville is 65.5 Years.
What is the Average Family Size in Placerville
Average Family Size in Placerville is 2.5 People.
What is the Average Household Size in Placerville
Average Household Size in Placerville is 1.9 People.
How Large is the Labor Force in Placerville?
There are 8 People in the Labor Forcein in Placerville.
What is the Percentage of People in the Labor Force in Placerville?
22.2% of People are in the Labor Force in Placerville.
What is the Unemployment Rate in Placerville?
Unemployment Rate in Placerville is 12.5%.