Russian Mission, AK Map & Demographics
Russian Mission Map
Russian Mission Overview
$12,465
PER CAPITA INCOME
0.39
INEQUALITY / GINI INDEX
51
TOTAL POPULATION
18
MALE POPULATION
33
FEMALE POPULATION
54.55
MALES / 100 FEMALES
183.33
FEMALES / 100 MALES
24.4
MEDIAN AGE
4.6
AVG FAMILY SIZE
4.6
AVG HOUSEHOLD SIZE
10
LABOR FORCE [ PEOPLE ]
32.3%
PERCENT IN LABOR FORCE
Russian Mission Zip Codes
Russian Mission Area Codes
Income in Russian Mission
Income Overview in Russian Mission
| Characteristic | Number | Measure |
| Per Capita Income | 51 | $12,465 |
| Median Family Income | 11 | $0 |
| Mean Family Income | 11 | $84,909 |
| Median Household Income | 11 | $0 |
| Mean Household Income | 11 | $84,909 |
| Income Deficit | 11 | $0 |
| Wage / Income Gap (%) | 51 | 0.00% |
| Wage / Income Gap ($) | 51 | 100.00¢ per $1 |
| Gini / Inequality Index | 51 | 0.39 |
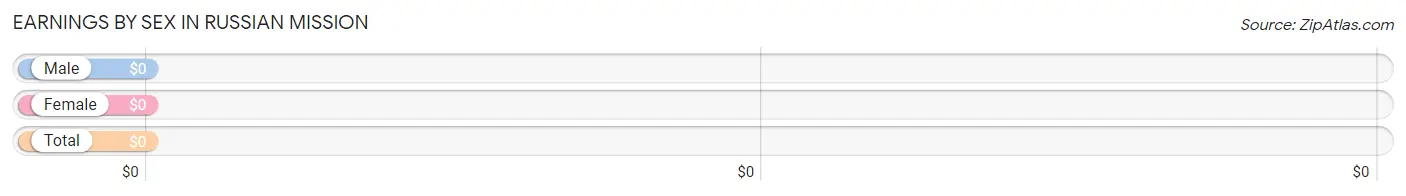
Earnings by Sex in Russian Mission
| Sex | Number | Average Earnings |
| Male | 4 (40.0%) | $0 |
| Female | 6 (60.0%) | $0 |
| Total | 10 (100.0%) | $0 |
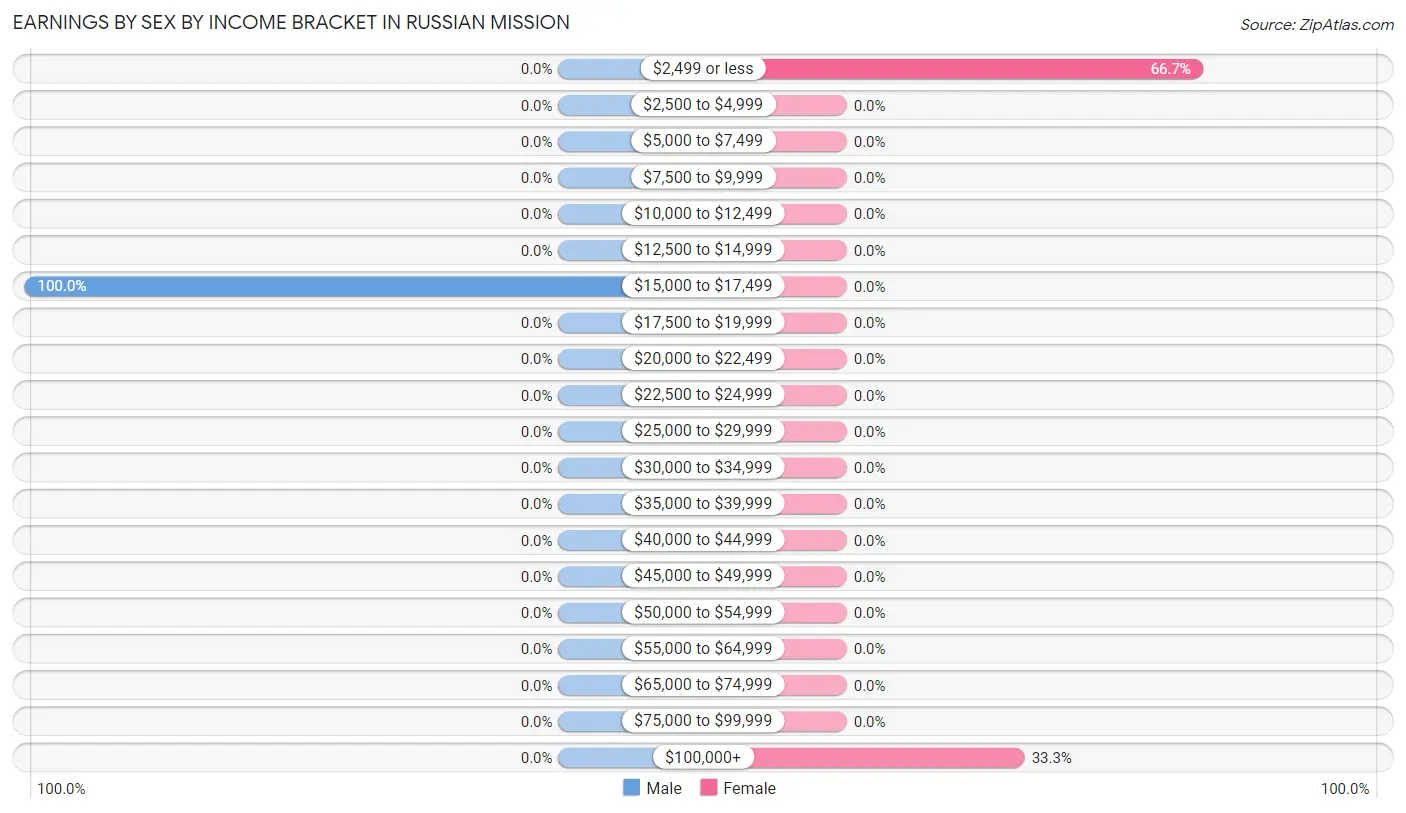
Earnings by Sex by Income Bracket in Russian Mission
The most common earnings brackets in Russian Mission are $15,000 to $17,499 for men (4 | 100.0%) and $2,499 or less for women (4 | 66.7%).
| Income | Male | Female |
| $2,499 or less | 0 (0.0%) | 4 (66.7%) |
| $2,500 to $4,999 | 0 (0.0%) | 0 (0.0%) |
| $5,000 to $7,499 | 0 (0.0%) | 0 (0.0%) |
| $7,500 to $9,999 | 0 (0.0%) | 0 (0.0%) |
| $10,000 to $12,499 | 0 (0.0%) | 0 (0.0%) |
| $12,500 to $14,999 | 0 (0.0%) | 0 (0.0%) |
| $15,000 to $17,499 | 4 (100.0%) | 0 (0.0%) |
| $17,500 to $19,999 | 0 (0.0%) | 0 (0.0%) |
| $20,000 to $22,499 | 0 (0.0%) | 0 (0.0%) |
| $22,500 to $24,999 | 0 (0.0%) | 0 (0.0%) |
| $25,000 to $29,999 | 0 (0.0%) | 0 (0.0%) |
| $30,000 to $34,999 | 0 (0.0%) | 0 (0.0%) |
| $35,000 to $39,999 | 0 (0.0%) | 0 (0.0%) |
| $40,000 to $44,999 | 0 (0.0%) | 0 (0.0%) |
| $45,000 to $49,999 | 0 (0.0%) | 0 (0.0%) |
| $50,000 to $54,999 | 0 (0.0%) | 0 (0.0%) |
| $55,000 to $64,999 | 0 (0.0%) | 0 (0.0%) |
| $65,000 to $74,999 | 0 (0.0%) | 0 (0.0%) |
| $75,000 to $99,999 | 0 (0.0%) | 0 (0.0%) |
| $100,000+ | 0 (0.0%) | 2 (33.3%) |
| Total | 4 (100.0%) | 6 (100.0%) |
Earnings by Sex by Educational Attainment in Russian Mission
| Educational Attainment | Male Income | Female Income |
| Less than High School | - | - |
| High School Diploma | - | - |
| College or Associate's Degree | - | - |
| Bachelor's Degree | - | - |
| Graduate Degree | - | - |
| Total | - | - |
Family Income in Russian Mission
Family Income Brackets in Russian Mission
According to the Russian Mission family income data, there are 4 families falling into the $35,000 to $49,999 income range, which is the most common income bracket and makes up 36.4% of all families.
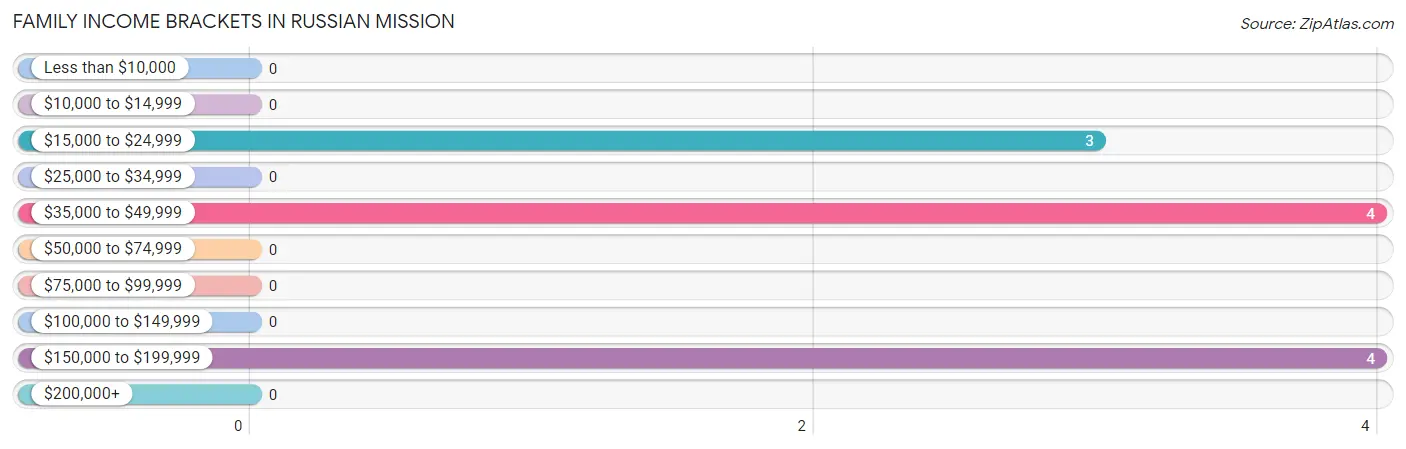
| Income Bracket | # Families | % Families |
| Less than $10,000 | 0 | 0.0% |
| $10,000 to $14,999 | 0 | 0.0% |
| $15,000 to $24,999 | 3 | 27.3% |
| $25,000 to $34,999 | 0 | 0.0% |
| $35,000 to $49,999 | 4 | 36.4% |
| $50,000 to $74,999 | 0 | 0.0% |
| $75,000 to $99,999 | 0 | 0.0% |
| $100,000 to $149,999 | 0 | 0.0% |
| $150,000 to $199,999 | 4 | 36.4% |
| $200,000+ | 0 | 0.0% |
Family Income by Famaliy Size in Russian Mission
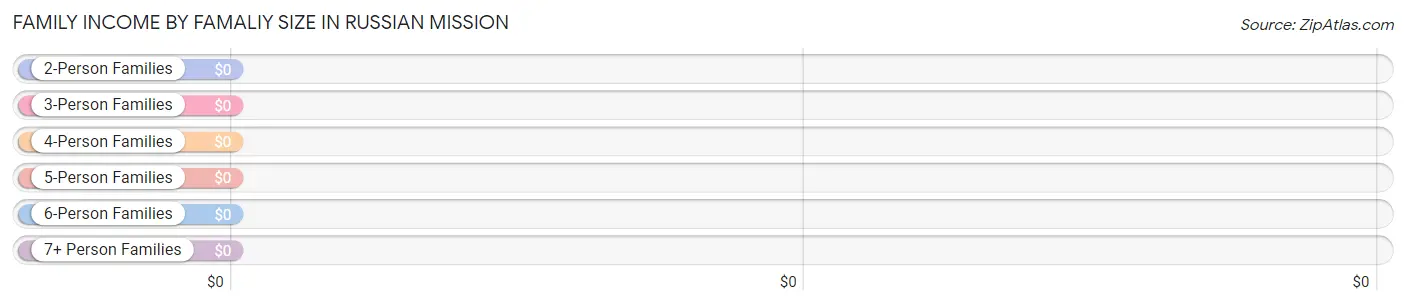
| Income Bracket | # Families | Median Income |
| 2-Person Families | 4 (36.4%) | $0 |
| 3-Person Families | 0 (0.0%) | $0 |
| 4-Person Families | 0 (0.0%) | $0 |
| 5-Person Families | 0 (0.0%) | $0 |
| 6-Person Families | 3 (27.3%) | $0 |
| 7+ Person Families | 4 (36.4%) | $0 |
| Total | 11 (100.0%) | $0 |
Family Income by Number of Earners in Russian Mission
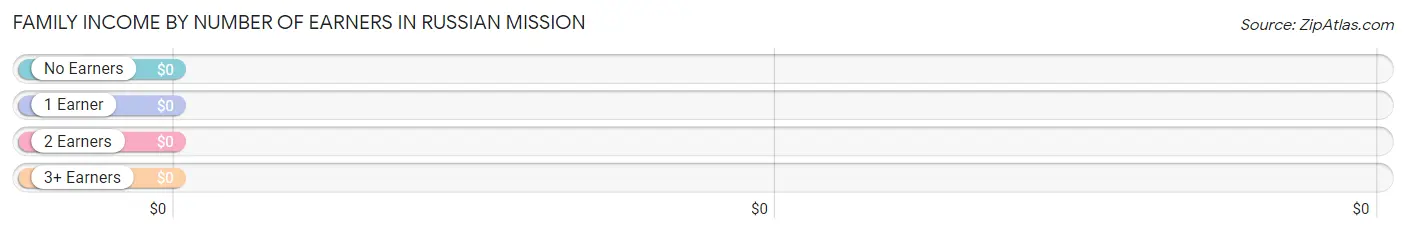
| Number of Earners | # Families | Median Income |
| No Earners | 4 (36.4%) | $0 |
| 1 Earner | 3 (27.3%) | $0 |
| 2 Earners | 4 (36.4%) | $0 |
| 3+ Earners | 0 (0.0%) | $0 |
| Total | 11 (100.0%) | $0 |
Household Income in Russian Mission
Household Income Brackets in Russian Mission
With 4 households falling in the category, the $35,000 to $49,999 income range is the most frequent in Russian Mission, accounting for 36.4% of all households.
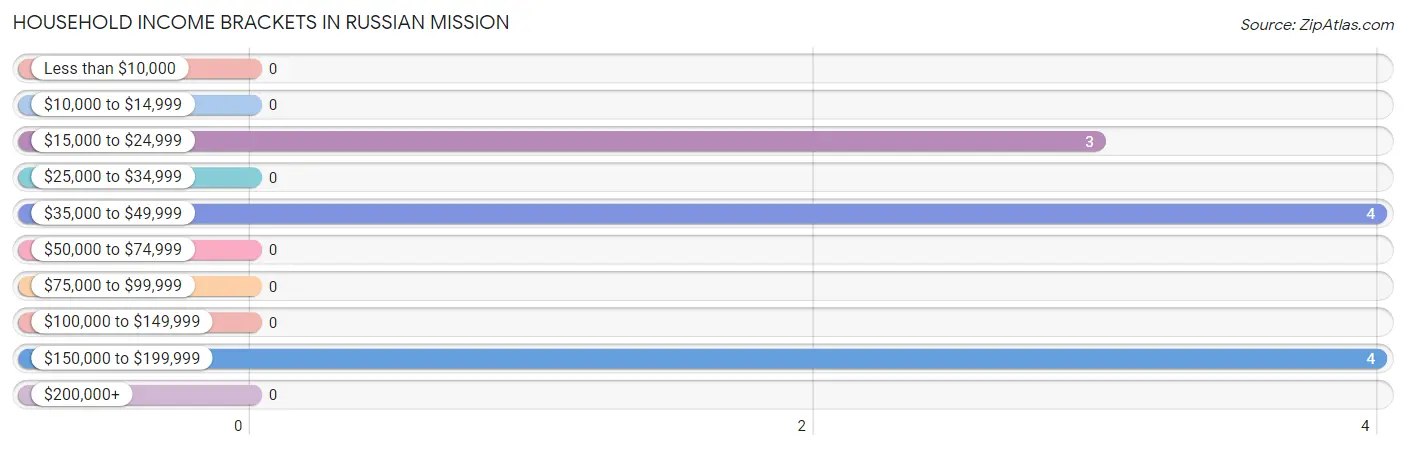
| Income Bracket | # Households | % Households |
| Less than $10,000 | 0 | 0.0% |
| $10,000 to $14,999 | 0 | 0.0% |
| $15,000 to $24,999 | 3 | 27.3% |
| $25,000 to $34,999 | 0 | 0.0% |
| $35,000 to $49,999 | 4 | 36.4% |
| $50,000 to $74,999 | 0 | 0.0% |
| $75,000 to $99,999 | 0 | 0.0% |
| $100,000 to $149,999 | 0 | 0.0% |
| $150,000 to $199,999 | 4 | 36.4% |
| $200,000+ | 0 | 0.0% |
Household Income by Householder Age in Russian Mission
| Income Bracket | # Households | Median Income |
| 15 to 24 Years | 0 (0.0%) | $0 |
| 25 to 44 Years | 0 (0.0%) | $0 |
| 45 to 64 Years | 3 (27.3%) | $0 |
| 65+ Years | 8 (72.7%) | $0 |
| Total | 11 (100.0%) | $0 |
Poverty in Russian Mission
Income Below Poverty by Sex and Age in Russian Mission
With 16.7% poverty level for males and 54.5% for females among the residents of Russian Mission, 55 to 64 year old males and under 5 year old females are the most vulnerable to poverty, with 3 males (100.0%) and 8 females (100.0%) in their respective age groups living below the poverty level.
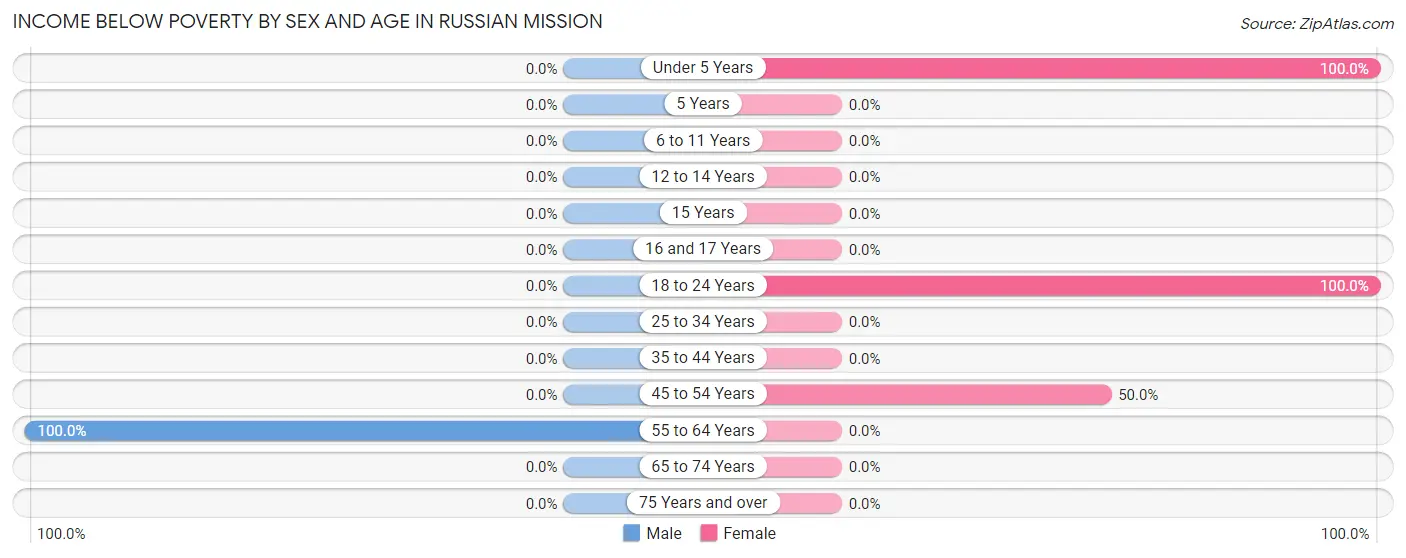
| Age Bracket | Male | Female |
| Under 5 Years | 0 (0.0%) | 8 (100.0%) |
| 5 Years | 0 (0.0%) | 0 (0.0%) |
| 6 to 11 Years | 0 (0.0%) | 0 (0.0%) |
| 12 to 14 Years | 0 (0.0%) | 0 (0.0%) |
| 15 Years | 0 (0.0%) | 0 (0.0%) |
| 16 and 17 Years | 0 (0.0%) | 0 (0.0%) |
| 18 to 24 Years | 0 (0.0%) | 8 (100.0%) |
| 25 to 34 Years | 0 (0.0%) | 0 (0.0%) |
| 35 to 44 Years | 0 (0.0%) | 0 (0.0%) |
| 45 to 54 Years | 0 (0.0%) | 2 (50.0%) |
| 55 to 64 Years | 3 (100.0%) | 0 (0.0%) |
| 65 to 74 Years | 0 (0.0%) | 0 (0.0%) |
| 75 Years and over | 0 (0.0%) | 0 (0.0%) |
| Total | 3 (16.7%) | 18 (54.5%) |
Income Above Poverty by Sex and Age in Russian Mission
According to the poverty statistics in Russian Mission, males aged under 5 years and females aged 6 to 11 years are the age groups that are most secure financially, with 100.0% of males and 100.0% of females in these age groups living above the poverty line.
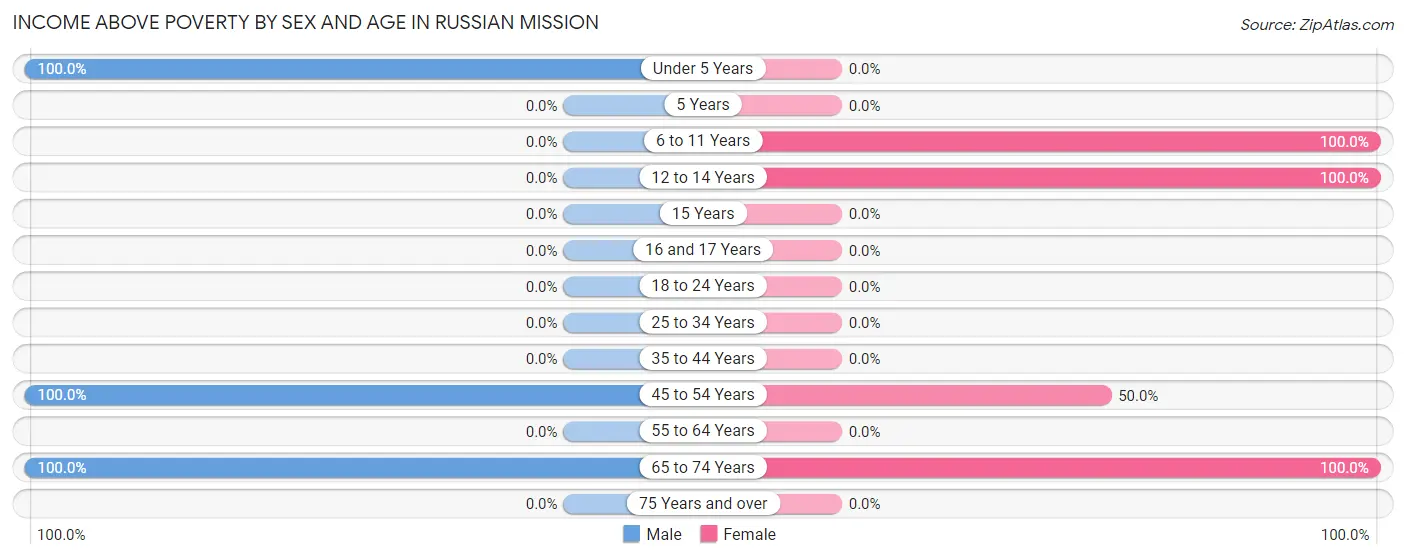
| Age Bracket | Male | Female |
| Under 5 Years | 4 (100.0%) | 0 (0.0%) |
| 5 Years | 0 (0.0%) | 0 (0.0%) |
| 6 to 11 Years | 0 (0.0%) | 4 (100.0%) |
| 12 to 14 Years | 0 (0.0%) | 4 (100.0%) |
| 15 Years | 0 (0.0%) | 0 (0.0%) |
| 16 and 17 Years | 0 (0.0%) | 0 (0.0%) |
| 18 to 24 Years | 0 (0.0%) | 0 (0.0%) |
| 25 to 34 Years | 0 (0.0%) | 0 (0.0%) |
| 35 to 44 Years | 0 (0.0%) | 0 (0.0%) |
| 45 to 54 Years | 3 (100.0%) | 2 (50.0%) |
| 55 to 64 Years | 0 (0.0%) | 0 (0.0%) |
| 65 to 74 Years | 8 (100.0%) | 5 (100.0%) |
| 75 Years and over | 0 (0.0%) | 0 (0.0%) |
| Total | 15 (83.3%) | 15 (45.5%) |
Income Below Poverty Among Married-Couple Families in Russian Mission
The poverty statistics for married-couple families in Russian Mission show that 27.3% or 3 of the total 11 families live below the poverty line. Families with 1 or 2 children have the highest poverty rate of 100.0%, comprising of 3 families. On the other hand, families with no children have the lowest poverty rate of 0.0%, which includes 0 families.
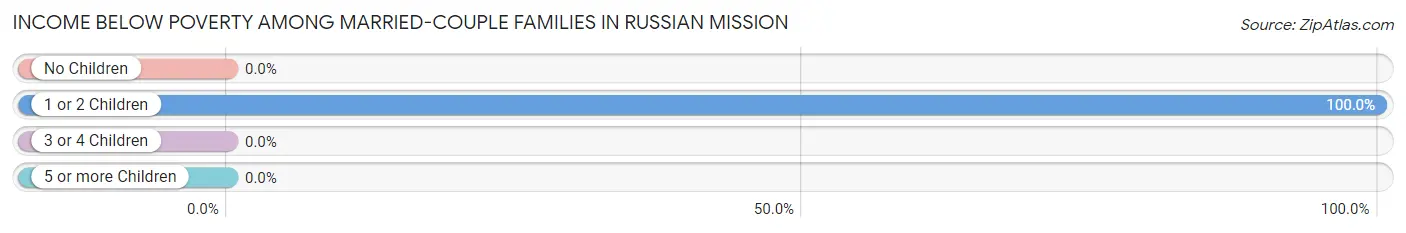
| Children | Above Poverty | Below Poverty |
| No Children | 4 (100.0%) | 0 (0.0%) |
| 1 or 2 Children | 0 (0.0%) | 3 (100.0%) |
| 3 or 4 Children | 4 (100.0%) | 0 (0.0%) |
| 5 or more Children | 0 (0.0%) | 0 (0.0%) |
| Total | 8 (72.7%) | 3 (27.3%) |
Income Below Poverty Among Single-Parent Households in Russian Mission
| Children | Single Father | Single Mother |
| No Children | 0 (0.0%) | 0 (0.0%) |
| 1 or 2 Children | 0 (0.0%) | 0 (0.0%) |
| 3 or 4 Children | 0 (0.0%) | 0 (0.0%) |
| 5 or more Children | 0 (0.0%) | 0 (0.0%) |
| Total | 0 (0.0%) | 0 (0.0%) |
Income Below Poverty Among Married-Couple vs Single-Parent Households in Russian Mission
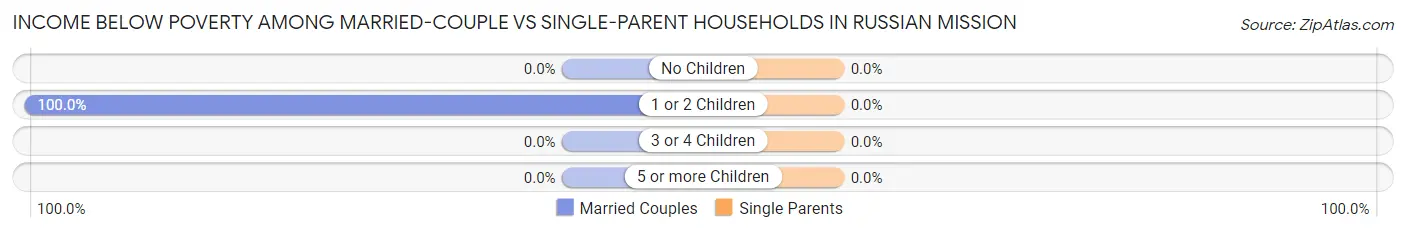
| Children | Married-Couple Families | Single-Parent Households |
| No Children | 0 (0.0%) | 0 (0.0%) |
| 1 or 2 Children | 3 (100.0%) | 0 (0.0%) |
| 3 or 4 Children | 0 (0.0%) | 0 (0.0%) |
| 5 or more Children | 0 (0.0%) | 0 (0.0%) |
| Total | 3 (27.3%) | 0 (0.0%) |
Race in Russian Mission
The most populous races in Russian Mission are Native / Alaskan (30 | 58.8%), and Two or more Races (21 | 41.2%).
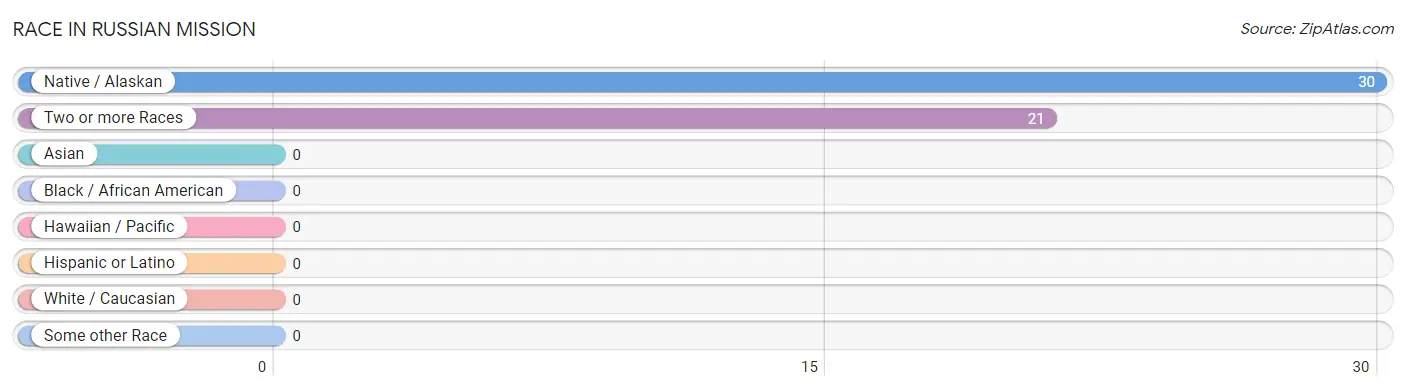
| Race | # Population | % Population |
| Asian | 0 | 0.0% |
| Black / African American | 0 | 0.0% |
| Hawaiian / Pacific | 0 | 0.0% |
| Hispanic or Latino | 0 | 0.0% |
| Native / Alaskan | 30 | 58.8% |
| White / Caucasian | 0 | 0.0% |
| Two or more Races | 21 | 41.2% |
| Some other Race | 0 | 0.0% |
| Total | 51 | 100.0% |
Ancestry in Russian Mission
The most populous ancestries reported in Russian Mission are Inupiat (24 | 47.1%), and Yup'ik (6 | 11.8%), together accounting for 58.8% of all Russian Mission residents.
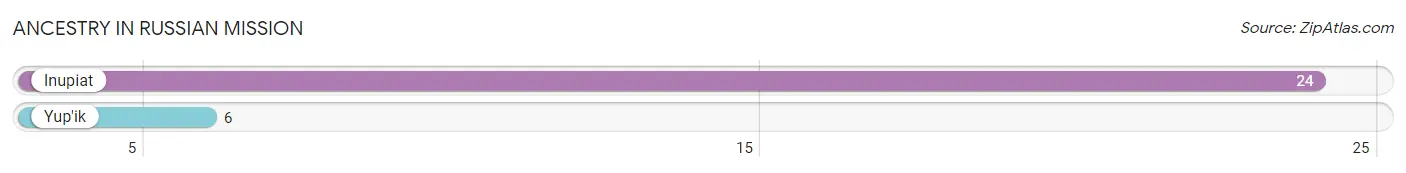
| Ancestry | # Population | % Population |
| Inupiat | 24 | 47.1% |
| Yup'ik | 6 | 11.8% | View All 2 Rows |
Immigrants in Russian Mission

| Immigration Origin | # Population | % Population | View All 0 Rows |
Sex and Age in Russian Mission
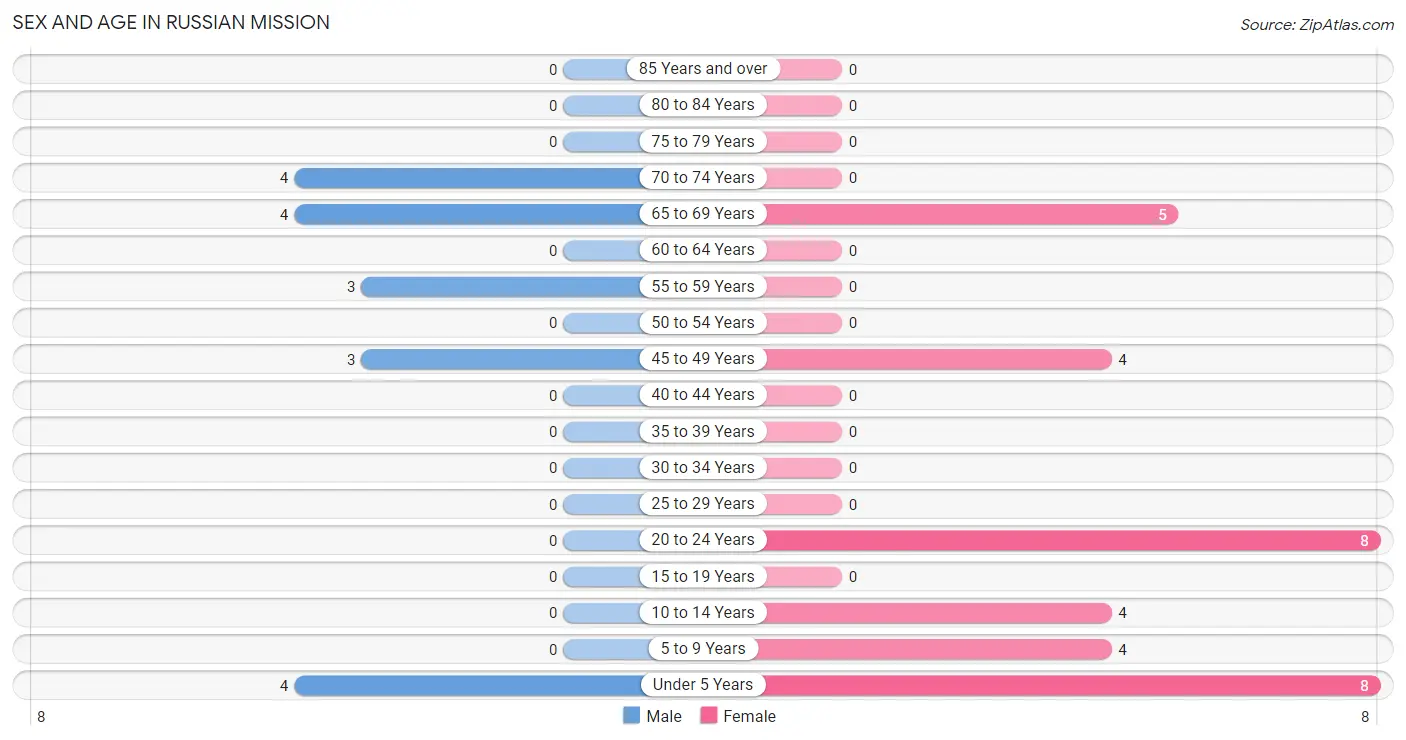
Sex and Age in Russian Mission
The most populous age groups in Russian Mission are Under 5 Years (4 | 22.2%) for men and Under 5 Years (8 | 24.2%) for women.
| Age Bracket | Male | Female |
| Under 5 Years | 4 (22.2%) | 8 (24.2%) |
| 5 to 9 Years | 0 (0.0%) | 4 (12.1%) |
| 10 to 14 Years | 0 (0.0%) | 4 (12.1%) |
| 15 to 19 Years | 0 (0.0%) | 0 (0.0%) |
| 20 to 24 Years | 0 (0.0%) | 8 (24.2%) |
| 25 to 29 Years | 0 (0.0%) | 0 (0.0%) |
| 30 to 34 Years | 0 (0.0%) | 0 (0.0%) |
| 35 to 39 Years | 0 (0.0%) | 0 (0.0%) |
| 40 to 44 Years | 0 (0.0%) | 0 (0.0%) |
| 45 to 49 Years | 3 (16.7%) | 4 (12.1%) |
| 50 to 54 Years | 0 (0.0%) | 0 (0.0%) |
| 55 to 59 Years | 3 (16.7%) | 0 (0.0%) |
| 60 to 64 Years | 0 (0.0%) | 0 (0.0%) |
| 65 to 69 Years | 4 (22.2%) | 5 (15.1%) |
| 70 to 74 Years | 4 (22.2%) | 0 (0.0%) |
| 75 to 79 Years | 0 (0.0%) | 0 (0.0%) |
| 80 to 84 Years | 0 (0.0%) | 0 (0.0%) |
| 85 Years and over | 0 (0.0%) | 0 (0.0%) |
| Total | 18 (100.0%) | 33 (100.0%) |
Families and Households in Russian Mission
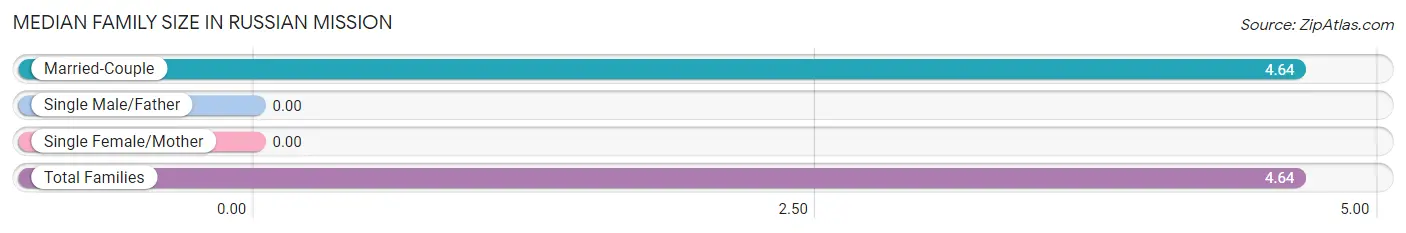
Median Family Size in Russian Mission
| Family Type | # Families | Family Size |
| Married-Couple | 11 (100.0%) | 4.64 |
| Single Male/Father | 0 (0.0%) | - |
| Single Female/Mother | 0 (0.0%) | - |
| Total Families | 11 (100.0%) | 4.64 |
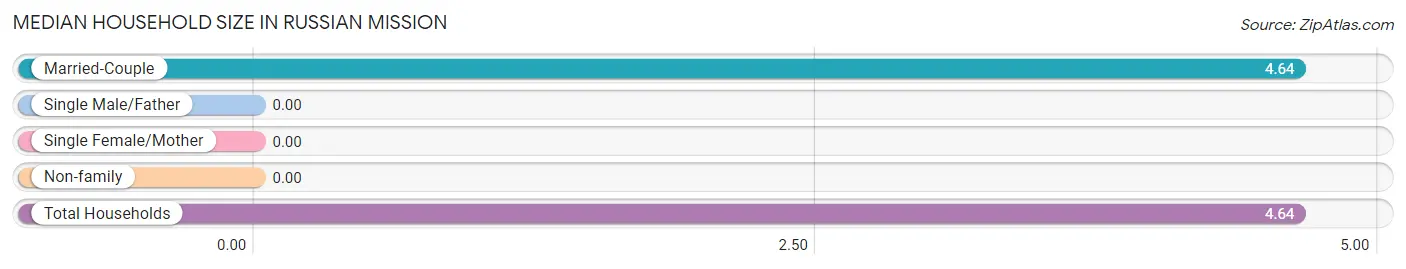
Median Household Size in Russian Mission
| Household Type | # Households | Household Size |
| Married-Couple | 11 (100.0%) | 4.64 |
| Single Male/Father | 0 (0.0%) | - |
| Single Female/Mother | 0 (0.0%) | - |
| Non-family | 0 (0.0%) | - |
| Total Households | 11 (100.0%) | 4.64 |
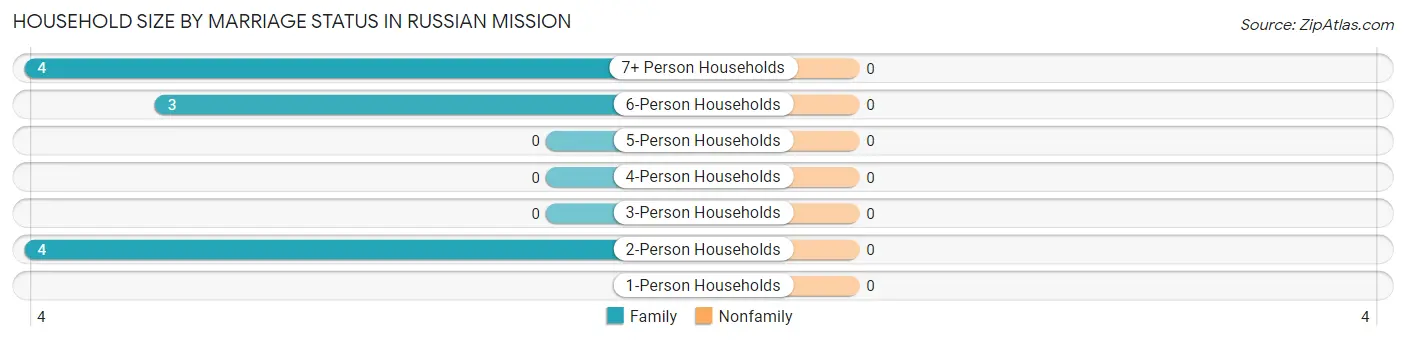
Household Size by Marriage Status in Russian Mission
| Household Size | Family Households | Nonfamily Households |
| 1-Person Households | - | 0 (0.0%) |
| 2-Person Households | 4 (36.4%) | 0 (0.0%) |
| 3-Person Households | 0 (0.0%) | 0 (0.0%) |
| 4-Person Households | 0 (0.0%) | 0 (0.0%) |
| 5-Person Households | 0 (0.0%) | 0 (0.0%) |
| 6-Person Households | 3 (27.3%) | 0 (0.0%) |
| 7+ Person Households | 4 (36.4%) | 0 (0.0%) |
| Total | 11 (100.0%) | 0 (0.0%) |
Female Fertility in Russian Mission
Fertility by Age in Russian Mission
| Age Bracket | Women with Births | Births / 1,000 Women |
| 15 to 19 years | 0 (0.0%) | 0.0 |
| 20 to 34 years | 0 (0.0%) | 0.0 |
| 35 to 50 years | 0 (0.0%) | 0.0 |
| Total | 0 (0.0%) | 0.0 |
Fertility by Age by Marriage Status in Russian Mission
| Age Bracket | Married | Unmarried |
| 15 to 19 years | 0 (0.0%) | 0 (0.0%) |
| 20 to 34 years | 0 (0.0%) | 0 (0.0%) |
| 35 to 50 years | 0 (0.0%) | 0 (0.0%) |
| Total | 0 (0.0%) | 0 (0.0%) |
Fertility by Education in Russian Mission
| Educational Attainment | Women with Births | Births / 1,000 Women |
| Less than High School | 0 (0.0%) | 0.0 |
| High School Diploma | 0 (0.0%) | 0.0 |
| College or Associate's Degree | 0 (0.0%) | 0.0 |
| Bachelor's Degree | 0 (0.0%) | 0.0 |
| Graduate Degree | 0 (0.0%) | 0.0 |
| Total | 0 (0.0%) | 0.0 |
Fertility by Education by Marriage Status in Russian Mission
| Educational Attainment | Married | Unmarried |
| Less than High School | 0 (0.0%) | 0 (0.0%) |
| High School Diploma | 0 (0.0%) | 0 (0.0%) |
| College or Associate's Degree | 0 (0.0%) | 0 (0.0%) |
| Bachelor's Degree | 0 (0.0%) | 0 (0.0%) |
| Graduate Degree | 0 (0.0%) | 0 (0.0%) |
| Total | 0 (0.0%) | 0 (0.0%) |
Employment Characteristics in Russian Mission
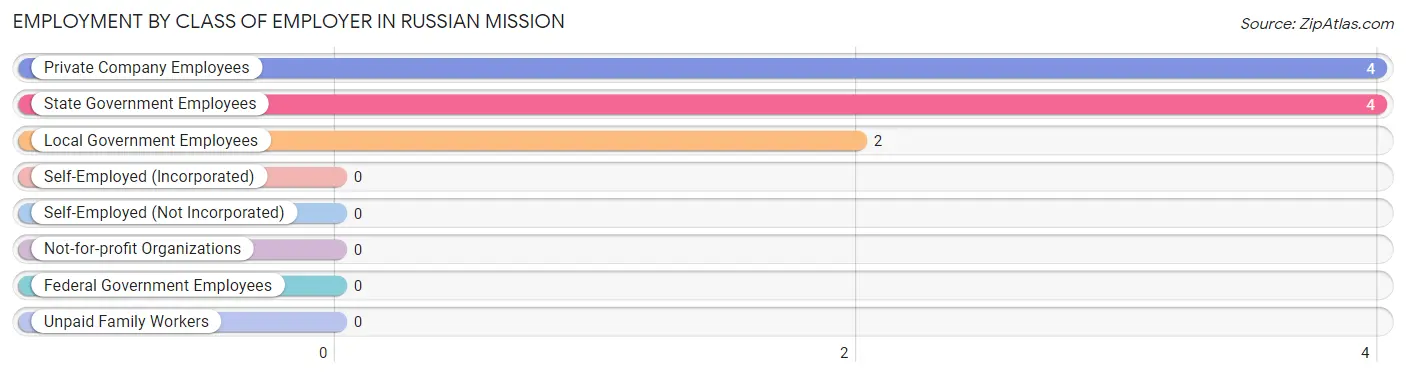
Employment by Class of Employer in Russian Mission
Among the 10 employed individuals in Russian Mission, private company employees (4 | 40.0%), state government employees (4 | 40.0%), and local government employees (2 | 20.0%) make up the most common classes of employment.
| Employer Class | # Employees | % Employees |
| Private Company Employees | 4 | 40.0% |
| Self-Employed (Incorporated) | 0 | 0.0% |
| Self-Employed (Not Incorporated) | 0 | 0.0% |
| Not-for-profit Organizations | 0 | 0.0% |
| Local Government Employees | 2 | 20.0% |
| State Government Employees | 4 | 40.0% |
| Federal Government Employees | 0 | 0.0% |
| Unpaid Family Workers | 0 | 0.0% |
| Total | 10 | 100.0% |
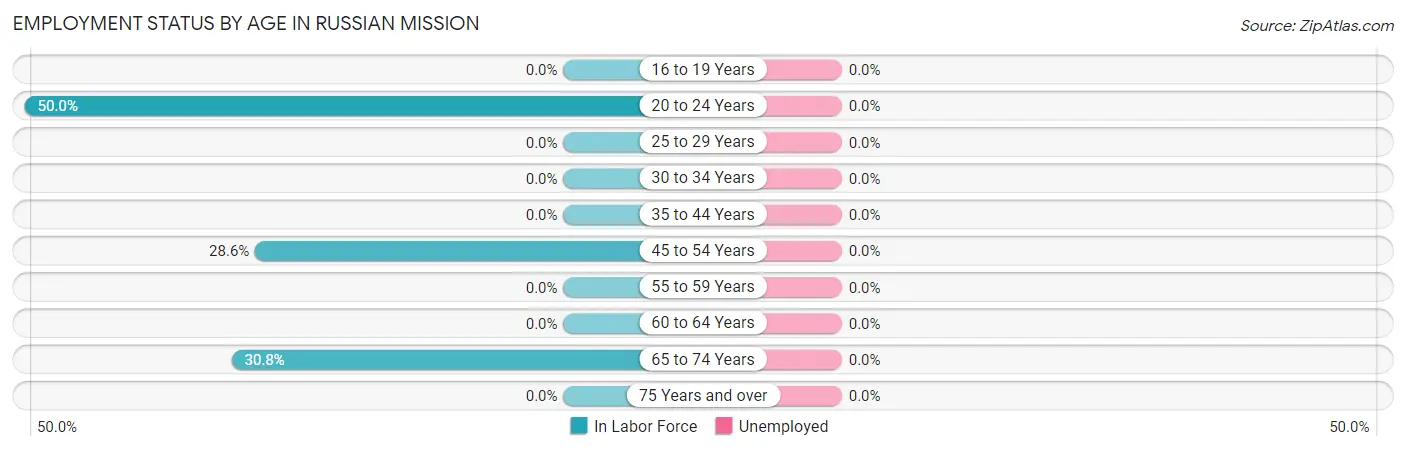
Employment Status by Age in Russian Mission
| Age Bracket | In Labor Force | Unemployed |
| 16 to 19 Years | 0 (0.0%) | 0 (0.0%) |
| 20 to 24 Years | 4 (50.0%) | 0 (0.0%) |
| 25 to 29 Years | 0 (0.0%) | 0 (0.0%) |
| 30 to 34 Years | 0 (0.0%) | 0 (0.0%) |
| 35 to 44 Years | 0 (0.0%) | 0 (0.0%) |
| 45 to 54 Years | 2 (28.6%) | 0 (0.0%) |
| 55 to 59 Years | 0 (0.0%) | 0 (0.0%) |
| 60 to 64 Years | 0 (0.0%) | 0 (0.0%) |
| 65 to 74 Years | 4 (30.8%) | 0 (0.0%) |
| 75 Years and over | 0 (0.0%) | 0 (0.0%) |
| Total | 10 (32.3%) | 0 (0.0%) |
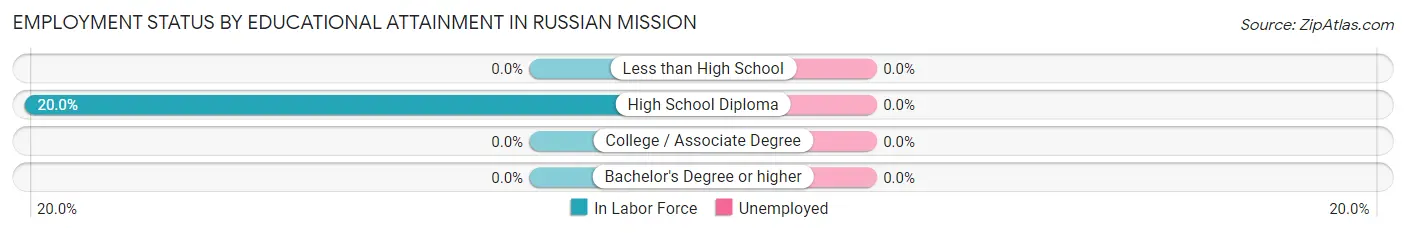
Employment Status by Educational Attainment in Russian Mission
| Educational Attainment | In Labor Force | Unemployed |
| Less than High School | 0 (0.0%) | 0 (0.0%) |
| High School Diploma | 2 (20.0%) | 0 (0.0%) |
| College / Associate Degree | 0 (0.0%) | 0 (0.0%) |
| Bachelor's Degree or higher | 0 (0.0%) | 0 (0.0%) |
| Total | 2 (20.0%) | 0 (0.0%) |
Employment Occupations by Sex in Russian Mission
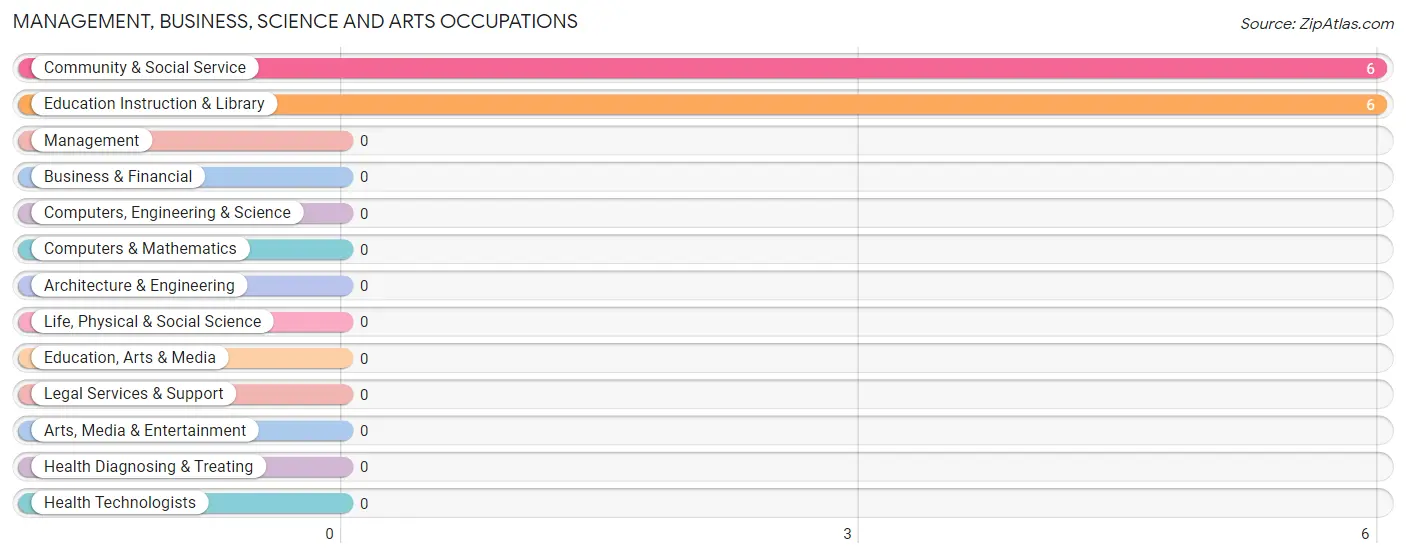
Management, Business, Science and Arts Occupations
The most common Management, Business, Science and Arts occupations in Russian Mission are Community & Social Service (6 | 60.0%), and Education Instruction & Library (6 | 60.0%).
Management, Business, Science and Arts Occupations by Sex
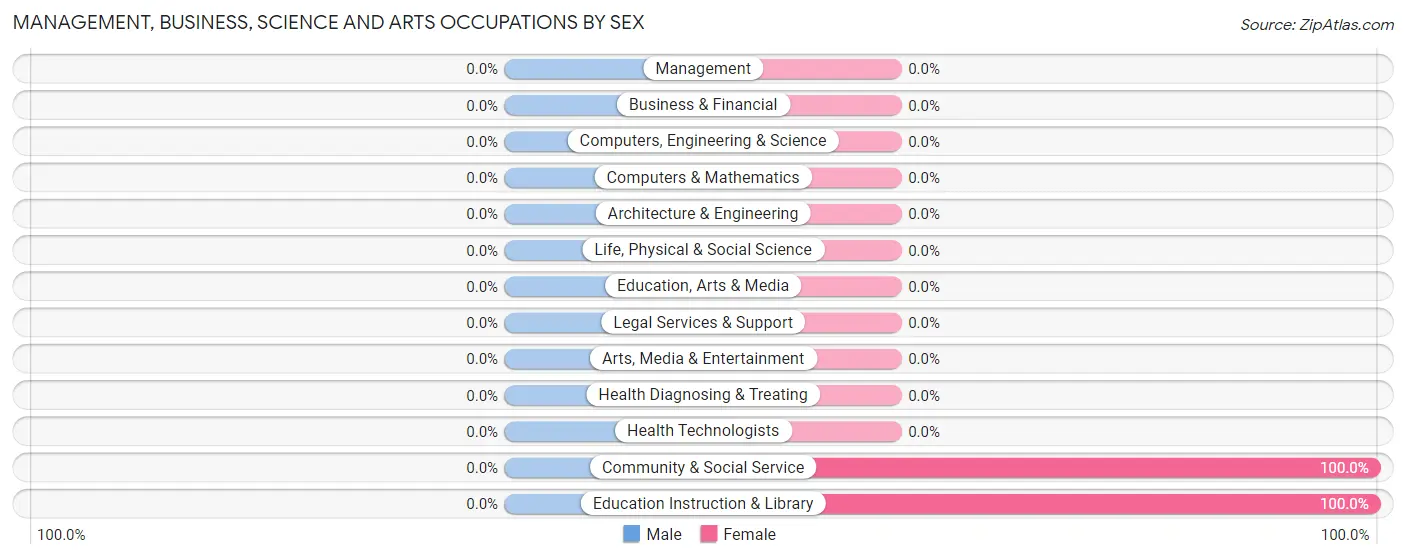
| Occupation | Male | Female |
| Management | 0 (0.0%) | 0 (0.0%) |
| Business & Financial | 0 (0.0%) | 0 (0.0%) |
| Computers, Engineering & Science | 0 (0.0%) | 0 (0.0%) |
| Computers & Mathematics | 0 (0.0%) | 0 (0.0%) |
| Architecture & Engineering | 0 (0.0%) | 0 (0.0%) |
| Life, Physical & Social Science | 0 (0.0%) | 0 (0.0%) |
| Community & Social Service | 0 (0.0%) | 6 (100.0%) |
| Education, Arts & Media | 0 (0.0%) | 0 (0.0%) |
| Legal Services & Support | 0 (0.0%) | 0 (0.0%) |
| Education Instruction & Library | 0 (0.0%) | 6 (100.0%) |
| Arts, Media & Entertainment | 0 (0.0%) | 0 (0.0%) |
| Health Diagnosing & Treating | 0 (0.0%) | 0 (0.0%) |
| Health Technologists | 0 (0.0%) | 0 (0.0%) |
| Total (Category) | 0 (0.0%) | 6 (100.0%) |
| Total (Overall) | 4 (40.0%) | 6 (60.0%) |
Services Occupations
Services Occupations by Sex
| Occupation | Male | Female |
| Healthcare Support | 0 (0.0%) | 0 (0.0%) |
| Security & Protection | 0 (0.0%) | 0 (0.0%) |
| Firefighting & Prevention | 0 (0.0%) | 0 (0.0%) |
| Law Enforcement | 0 (0.0%) | 0 (0.0%) |
| Food Preparation & Serving | 0 (0.0%) | 0 (0.0%) |
| Cleaning & Maintenance | 0 (0.0%) | 0 (0.0%) |
| Personal Care & Service | 0 (0.0%) | 0 (0.0%) |
| Total (Category) | 0 (0.0%) | 0 (0.0%) |
| Total (Overall) | 4 (40.0%) | 6 (60.0%) |
Sales and Office Occupations
Sales and Office Occupations by Sex
| Occupation | Male | Female |
| Sales & Related | 0 (0.0%) | 0 (0.0%) |
| Office & Administration | 0 (0.0%) | 0 (0.0%) |
| Total (Category) | 0 (0.0%) | 0 (0.0%) |
| Total (Overall) | 4 (40.0%) | 6 (60.0%) |
Natural Resources, Construction and Maintenance Occupations
The most common Natural Resources, Construction and Maintenance occupations in Russian Mission are , and Installation, Maintenance & Repair (4 | 40.0%).
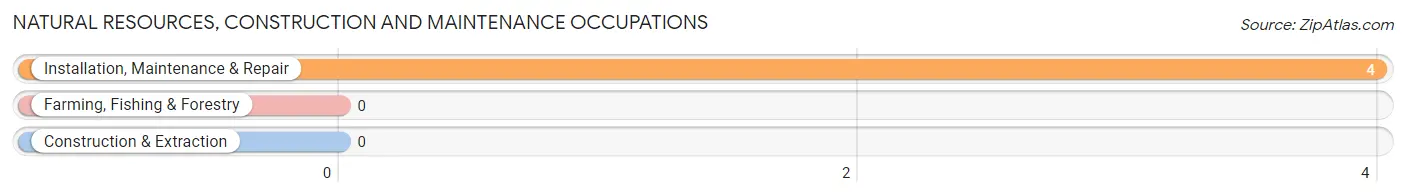
Natural Resources, Construction and Maintenance Occupations by Sex
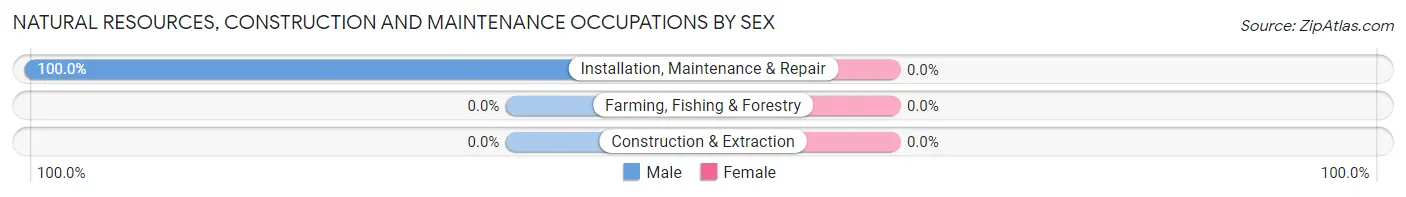
| Occupation | Male | Female |
| Farming, Fishing & Forestry | 0 (0.0%) | 0 (0.0%) |
| Construction & Extraction | 0 (0.0%) | 0 (0.0%) |
| Installation, Maintenance & Repair | 4 (100.0%) | 0 (0.0%) |
| Total (Category) | 4 (100.0%) | 0 (0.0%) |
| Total (Overall) | 4 (40.0%) | 6 (60.0%) |
Production, Transportation and Moving Occupations
Production, Transportation and Moving Occupations by Sex
| Occupation | Male | Female |
| Production | 0 (0.0%) | 0 (0.0%) |
| Transportation | 0 (0.0%) | 0 (0.0%) |
| Material Moving | 0 (0.0%) | 0 (0.0%) |
| Total (Category) | 0 (0.0%) | 0 (0.0%) |
| Total (Overall) | 4 (40.0%) | 6 (60.0%) |
Employment Industries by Sex in Russian Mission
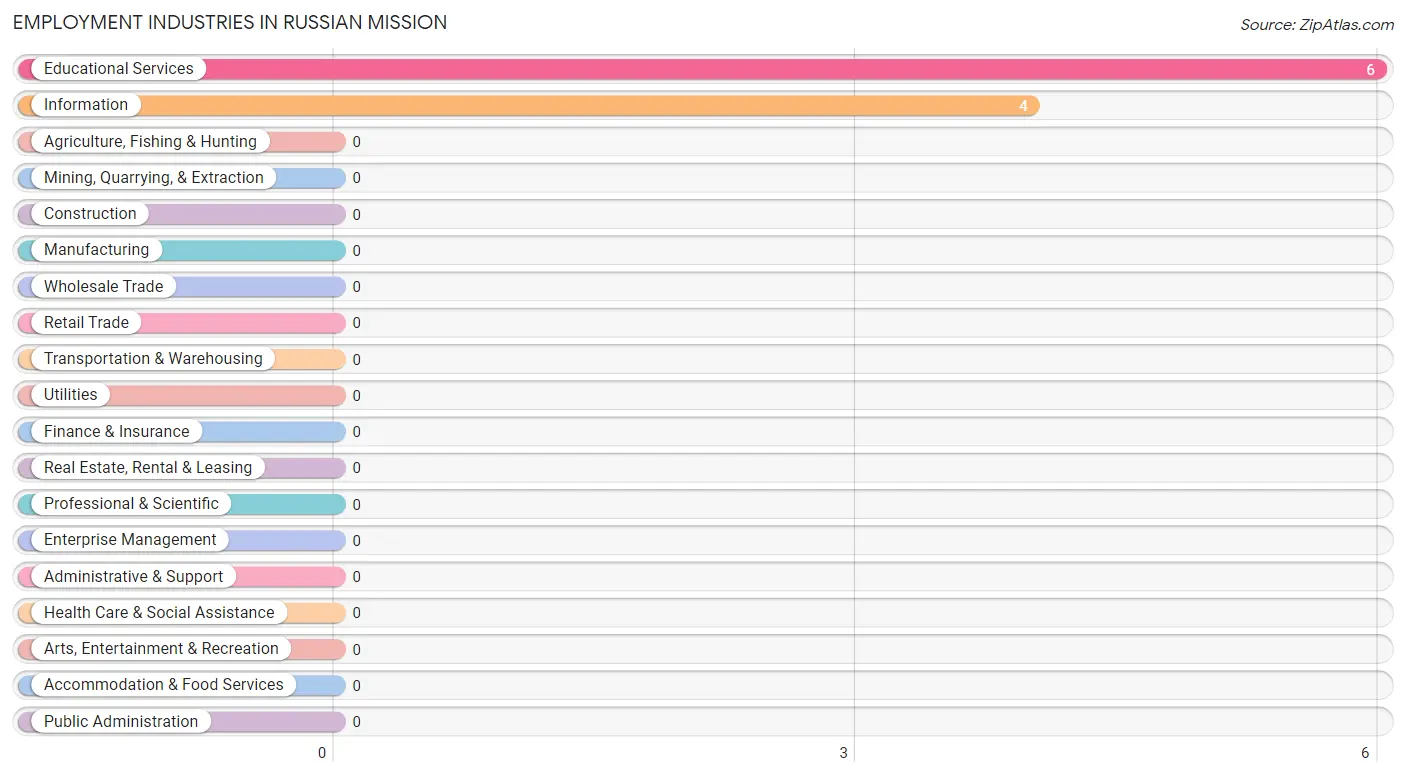
Employment Industries in Russian Mission
The major employment industries in Russian Mission include Educational Services (6 | 60.0%), and Information (4 | 40.0%).
Employment Industries by Sex in Russian Mission
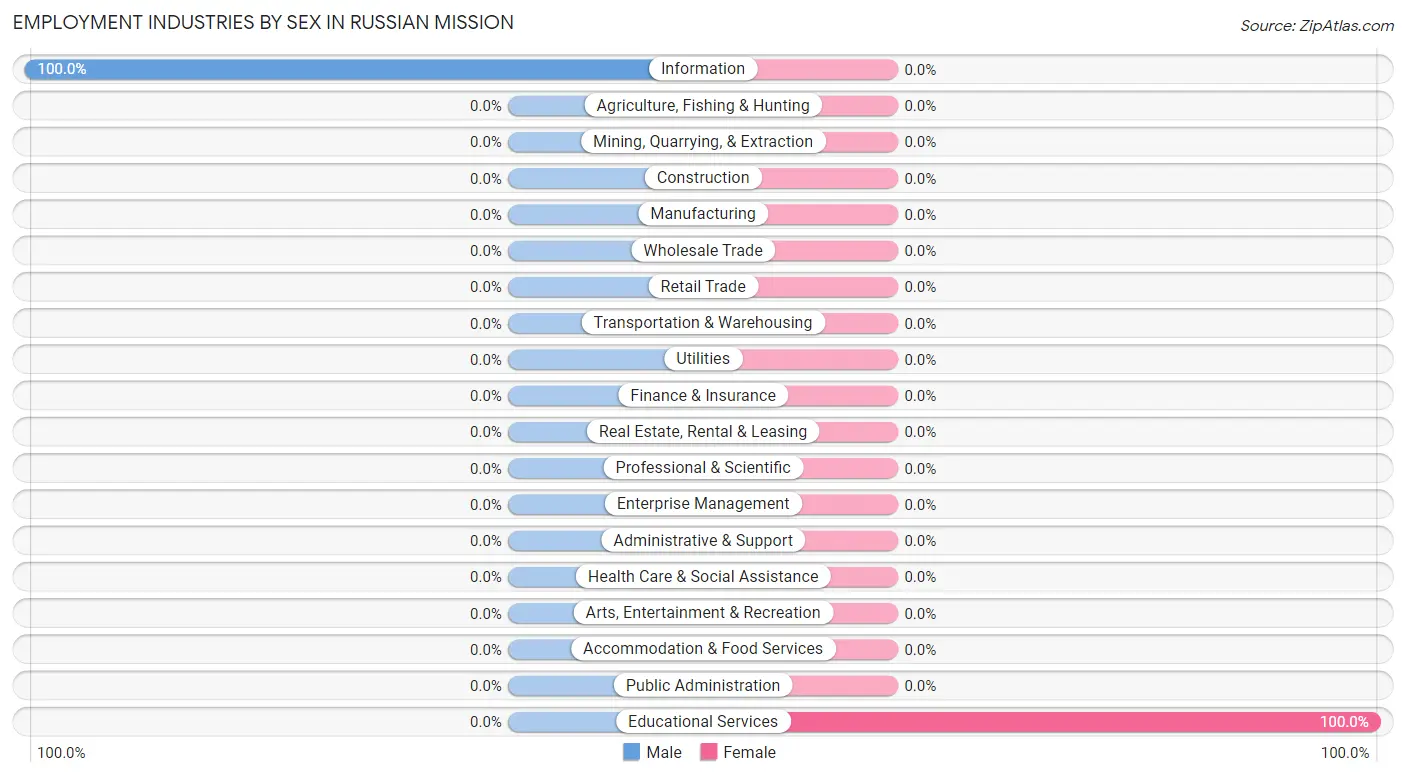
| Industry | Male | Female |
| Agriculture, Fishing & Hunting | 0 (0.0%) | 0 (0.0%) |
| Mining, Quarrying, & Extraction | 0 (0.0%) | 0 (0.0%) |
| Construction | 0 (0.0%) | 0 (0.0%) |
| Manufacturing | 0 (0.0%) | 0 (0.0%) |
| Wholesale Trade | 0 (0.0%) | 0 (0.0%) |
| Retail Trade | 0 (0.0%) | 0 (0.0%) |
| Transportation & Warehousing | 0 (0.0%) | 0 (0.0%) |
| Utilities | 0 (0.0%) | 0 (0.0%) |
| Information | 4 (100.0%) | 0 (0.0%) |
| Finance & Insurance | 0 (0.0%) | 0 (0.0%) |
| Real Estate, Rental & Leasing | 0 (0.0%) | 0 (0.0%) |
| Professional & Scientific | 0 (0.0%) | 0 (0.0%) |
| Enterprise Management | 0 (0.0%) | 0 (0.0%) |
| Administrative & Support | 0 (0.0%) | 0 (0.0%) |
| Educational Services | 0 (0.0%) | 6 (100.0%) |
| Health Care & Social Assistance | 0 (0.0%) | 0 (0.0%) |
| Arts, Entertainment & Recreation | 0 (0.0%) | 0 (0.0%) |
| Accommodation & Food Services | 0 (0.0%) | 0 (0.0%) |
| Public Administration | 0 (0.0%) | 0 (0.0%) |
| Total | 4 (40.0%) | 6 (60.0%) |
Education in Russian Mission
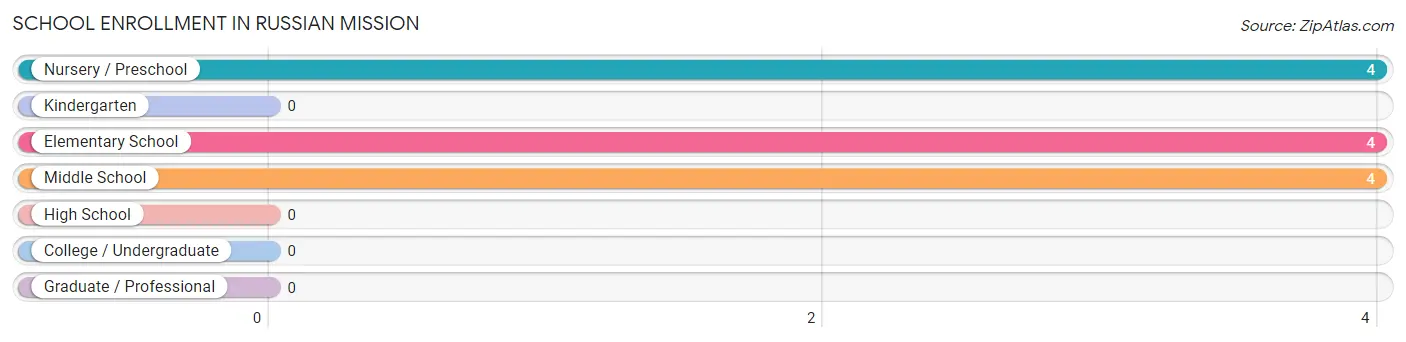
School Enrollment in Russian Mission
The most common levels of schooling among the 12 students in Russian Mission are nursery / preschool (4 | 33.3%), elementary school (4 | 33.3%), and middle school (4 | 33.3%).
| School Level | # Students | % Students |
| Nursery / Preschool | 4 | 33.3% |
| Kindergarten | 0 | 0.0% |
| Elementary School | 4 | 33.3% |
| Middle School | 4 | 33.3% |
| High School | 0 | 0.0% |
| College / Undergraduate | 0 | 0.0% |
| Graduate / Professional | 0 | 0.0% |
| Total | 12 | 100.0% |
School Enrollment by Age by Funding Source in Russian Mission
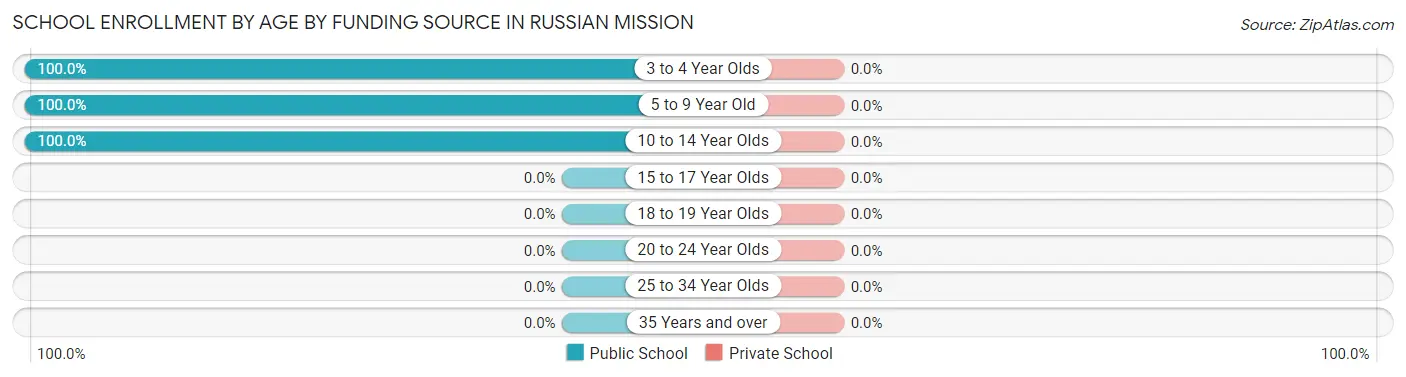
| Age Bracket | Public School | Private School |
| 3 to 4 Year Olds | 4 (100.0%) | 0 (0.0%) |
| 5 to 9 Year Old | 4 (100.0%) | 0 (0.0%) |
| 10 to 14 Year Olds | 4 (100.0%) | 0 (0.0%) |
| 15 to 17 Year Olds | 0 (0.0%) | 0 (0.0%) |
| 18 to 19 Year Olds | 0 (0.0%) | 0 (0.0%) |
| 20 to 24 Year Olds | 0 (0.0%) | 0 (0.0%) |
| 25 to 34 Year Olds | 0 (0.0%) | 0 (0.0%) |
| 35 Years and over | 0 (0.0%) | 0 (0.0%) |
| Total | 12 (100.0%) | 0 (0.0%) |
Educational Attainment by Field of Study in Russian Mission
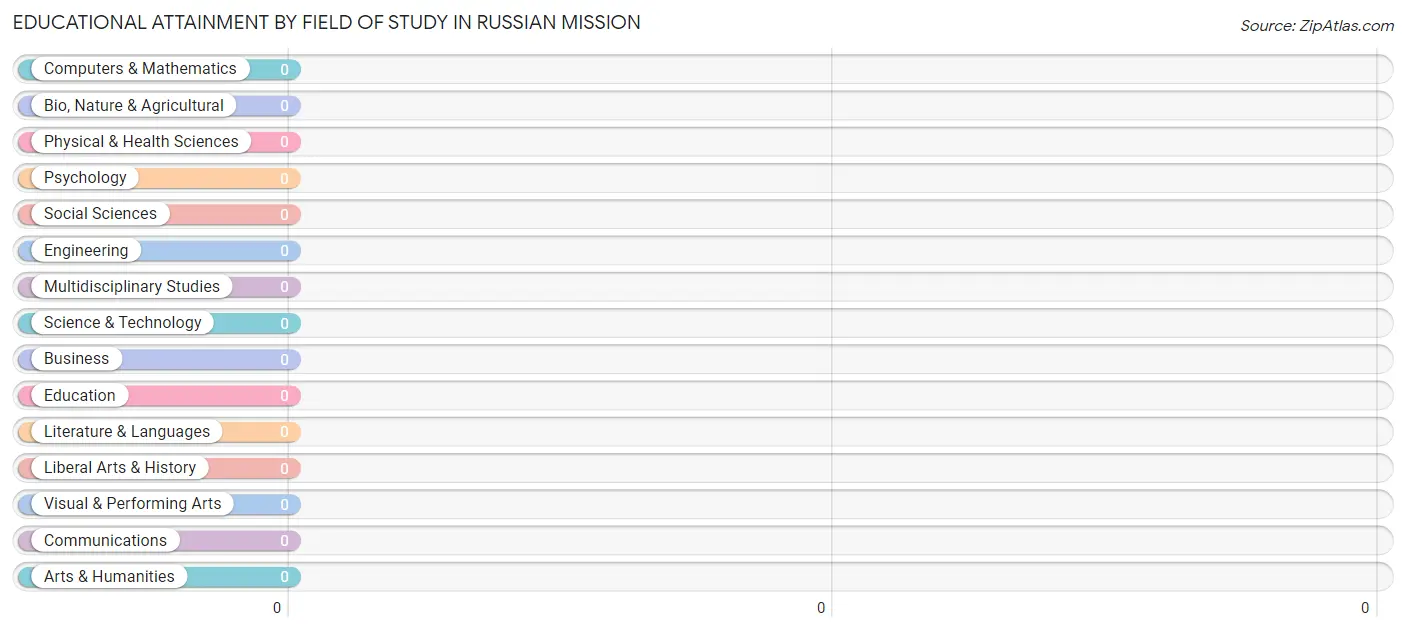
| Field of Study | # Graduates | % Graduates |
| Computers & Mathematics | 0 | 0.0% |
| Bio, Nature & Agricultural | 0 | 0.0% |
| Physical & Health Sciences | 0 | 0.0% |
| Psychology | 0 | 0.0% |
| Social Sciences | 0 | 0.0% |
| Engineering | 0 | 0.0% |
| Multidisciplinary Studies | 0 | 0.0% |
| Science & Technology | 0 | 0.0% |
| Business | 0 | 0.0% |
| Education | 0 | 0.0% |
| Literature & Languages | 0 | 0.0% |
| Liberal Arts & History | 0 | 0.0% |
| Visual & Performing Arts | 0 | 0.0% |
| Communications | 0 | 0.0% |
| Arts & Humanities | 0 | 0.0% |
| Total | 0 | 0.0% |
Transportation & Commute in Russian Mission
Vehicle Availability by Sex in Russian Mission
The most prevalent vehicle ownership categories in Russian Mission are males with no vehicle (4, accounting for 100.0%) and females with no vehicle (6, making up 66.7%).
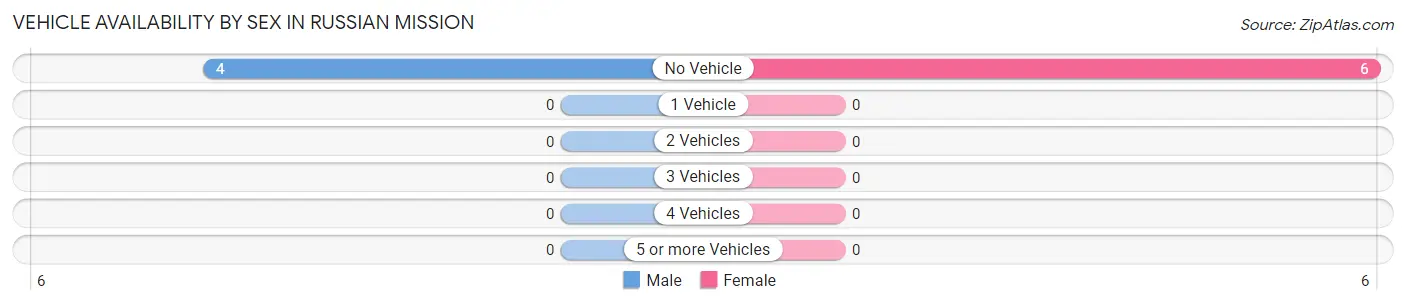
| Vehicles Available | Male | Female |
| No Vehicle | 4 (100.0%) | 6 (100.0%) |
| 1 Vehicle | 0 (0.0%) | 0 (0.0%) |
| 2 Vehicles | 0 (0.0%) | 0 (0.0%) |
| 3 Vehicles | 0 (0.0%) | 0 (0.0%) |
| 4 Vehicles | 0 (0.0%) | 0 (0.0%) |
| 5 or more Vehicles | 0 (0.0%) | 0 (0.0%) |
| Total | 4 (100.0%) | 6 (100.0%) |
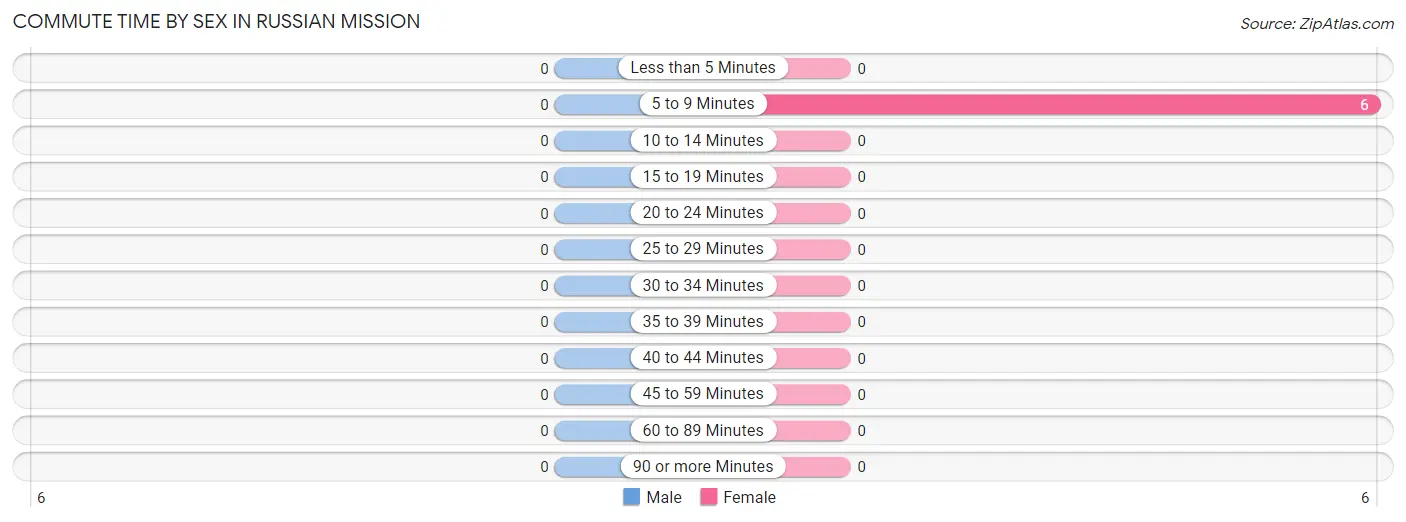
Commute Time in Russian Mission
The most frequently occuring commute durations in Russian Mission are 5 to 9 minutes (6 commuters, 100.0%), less than 5 minutes (0 commuters, 0.0%), and 10 to 14 minutes (0 commuters, 0.0%).
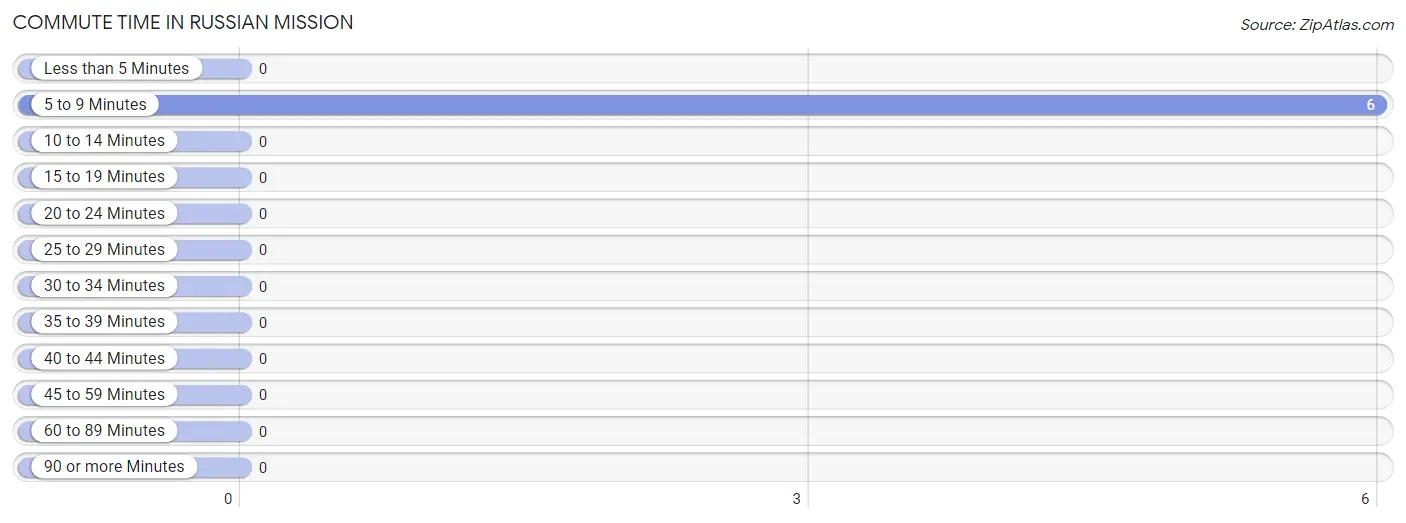
| Commute Time | # Commuters | % Commuters |
| Less than 5 Minutes | 0 | 0.0% |
| 5 to 9 Minutes | 6 | 100.0% |
| 10 to 14 Minutes | 0 | 0.0% |
| 15 to 19 Minutes | 0 | 0.0% |
| 20 to 24 Minutes | 0 | 0.0% |
| 25 to 29 Minutes | 0 | 0.0% |
| 30 to 34 Minutes | 0 | 0.0% |
| 35 to 39 Minutes | 0 | 0.0% |
| 40 to 44 Minutes | 0 | 0.0% |
| 45 to 59 Minutes | 0 | 0.0% |
| 60 to 89 Minutes | 0 | 0.0% |
| 90 or more Minutes | 0 | 0.0% |
Commute Time by Sex in Russian Mission
| Commute Time | Male | Female |
| Less than 5 Minutes | 0 (0.0%) | 0 (0.0%) |
| 5 to 9 Minutes | 0 (0.0%) | 6 (100.0%) |
| 10 to 14 Minutes | 0 (0.0%) | 0 (0.0%) |
| 15 to 19 Minutes | 0 (0.0%) | 0 (0.0%) |
| 20 to 24 Minutes | 0 (0.0%) | 0 (0.0%) |
| 25 to 29 Minutes | 0 (0.0%) | 0 (0.0%) |
| 30 to 34 Minutes | 0 (0.0%) | 0 (0.0%) |
| 35 to 39 Minutes | 0 (0.0%) | 0 (0.0%) |
| 40 to 44 Minutes | 0 (0.0%) | 0 (0.0%) |
| 45 to 59 Minutes | 0 (0.0%) | 0 (0.0%) |
| 60 to 89 Minutes | 0 (0.0%) | 0 (0.0%) |
| 90 or more Minutes | 0 (0.0%) | 0 (0.0%) |
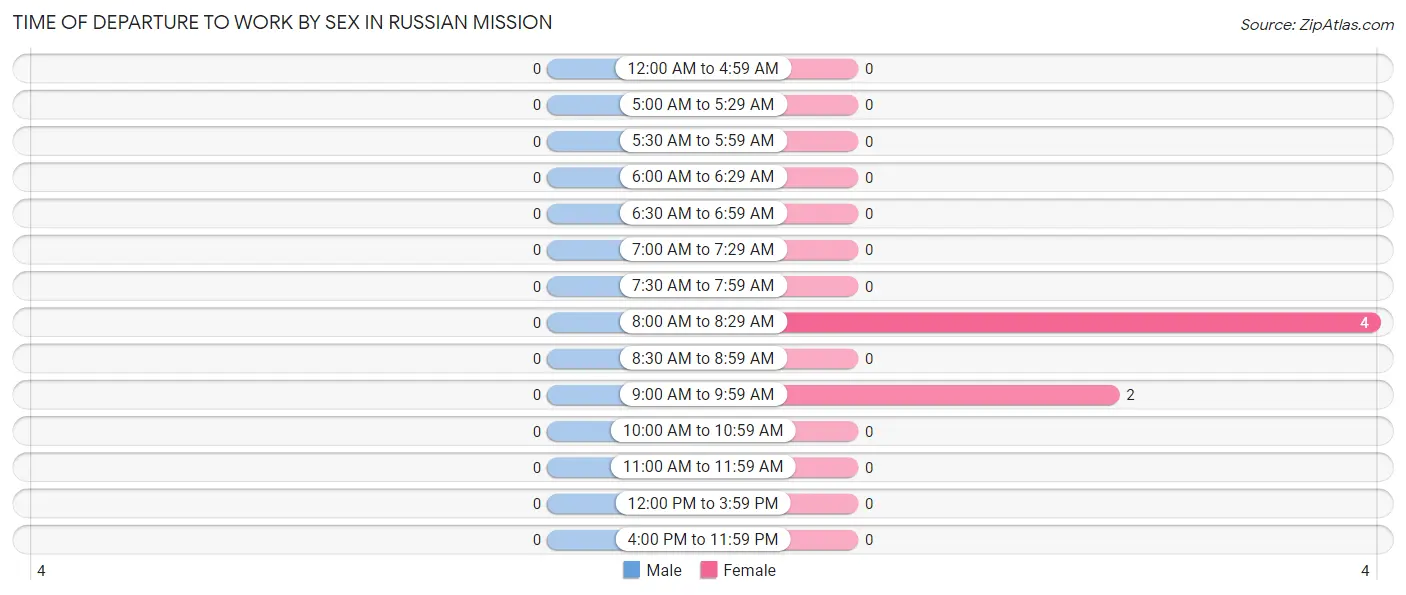
Time of Departure to Work by Sex in Russian Mission
| Time of Departure | Male | Female |
| 12:00 AM to 4:59 AM | 0 (0.0%) | 0 (0.0%) |
| 5:00 AM to 5:29 AM | 0 (0.0%) | 0 (0.0%) |
| 5:30 AM to 5:59 AM | 0 (0.0%) | 0 (0.0%) |
| 6:00 AM to 6:29 AM | 0 (0.0%) | 0 (0.0%) |
| 6:30 AM to 6:59 AM | 0 (0.0%) | 0 (0.0%) |
| 7:00 AM to 7:29 AM | 0 (0.0%) | 0 (0.0%) |
| 7:30 AM to 7:59 AM | 0 (0.0%) | 0 (0.0%) |
| 8:00 AM to 8:29 AM | 0 (0.0%) | 4 (66.7%) |
| 8:30 AM to 8:59 AM | 0 (0.0%) | 0 (0.0%) |
| 9:00 AM to 9:59 AM | 0 (0.0%) | 2 (33.3%) |
| 10:00 AM to 10:59 AM | 0 (0.0%) | 0 (0.0%) |
| 11:00 AM to 11:59 AM | 0 (0.0%) | 0 (0.0%) |
| 12:00 PM to 3:59 PM | 0 (0.0%) | 0 (0.0%) |
| 4:00 PM to 11:59 PM | 0 (0.0%) | 0 (0.0%) |
| Total | 0 (0.0%) | 6 (100.0%) |
Housing Occupancy in Russian Mission
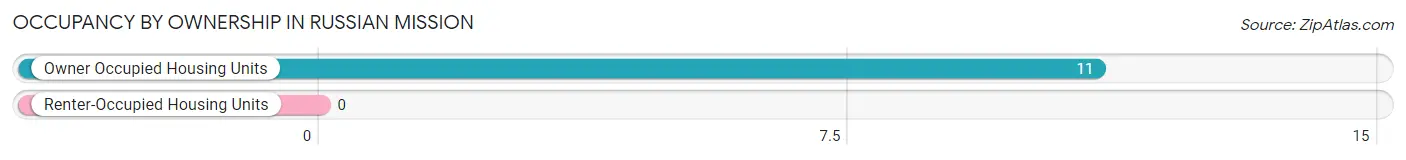
Occupancy by Ownership in Russian Mission
Of the total 11 dwellings in Russian Mission, owner-occupied units account for 11 (100.0%), while renter-occupied units make up 0 (0.0%).
| Occupancy | # Housing Units | % Housing Units |
| Owner Occupied Housing Units | 11 | 100.0% |
| Renter-Occupied Housing Units | 0 | 0.0% |
| Total Occupied Housing Units | 11 | 100.0% |
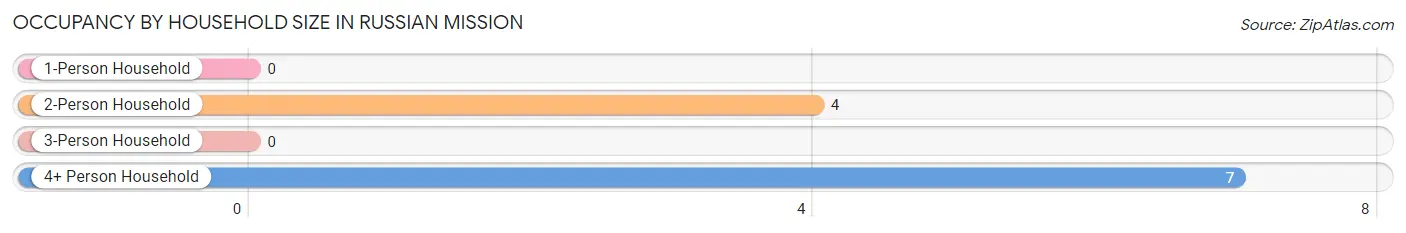
Occupancy by Household Size in Russian Mission
| Household Size | # Housing Units | % Housing Units |
| 1-Person Household | 0 | 0.0% |
| 2-Person Household | 4 | 36.4% |
| 3-Person Household | 0 | 0.0% |
| 4+ Person Household | 7 | 63.6% |
| Total Housing Units | 11 | 100.0% |
Occupancy by Ownership by Household Size in Russian Mission
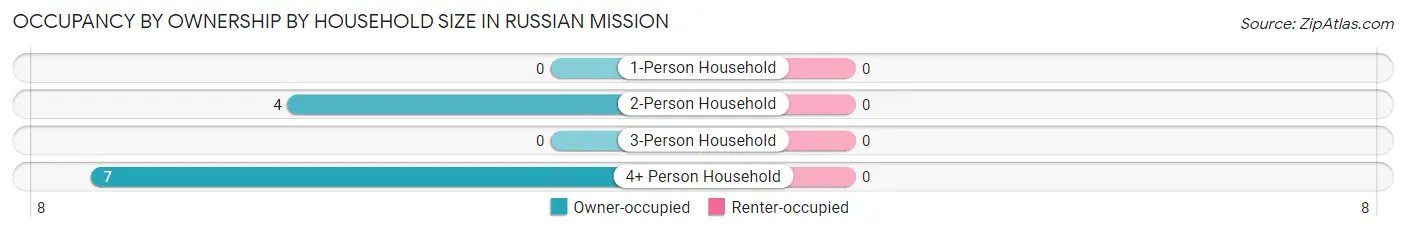
| Household Size | Owner-occupied | Renter-occupied |
| 1-Person Household | 0 (0.0%) | 0 (0.0%) |
| 2-Person Household | 4 (100.0%) | 0 (0.0%) |
| 3-Person Household | 0 (0.0%) | 0 (0.0%) |
| 4+ Person Household | 7 (100.0%) | 0 (0.0%) |
| Total Housing Units | 11 (100.0%) | 0 (0.0%) |
Occupancy by Educational Attainment in Russian Mission
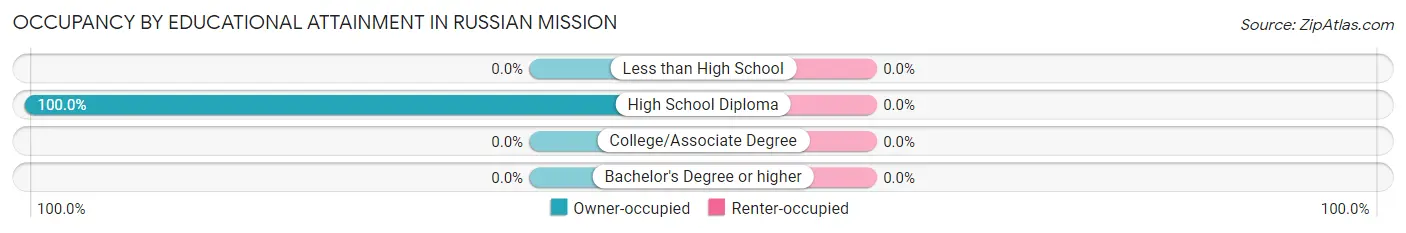
| Household Size | Owner-occupied | Renter-occupied |
| Less than High School | 0 (0.0%) | 0 (0.0%) |
| High School Diploma | 11 (100.0%) | 0 (0.0%) |
| College/Associate Degree | 0 (0.0%) | 0 (0.0%) |
| Bachelor's Degree or higher | 0 (0.0%) | 0 (0.0%) |
Occupancy by Age of Householder in Russian Mission
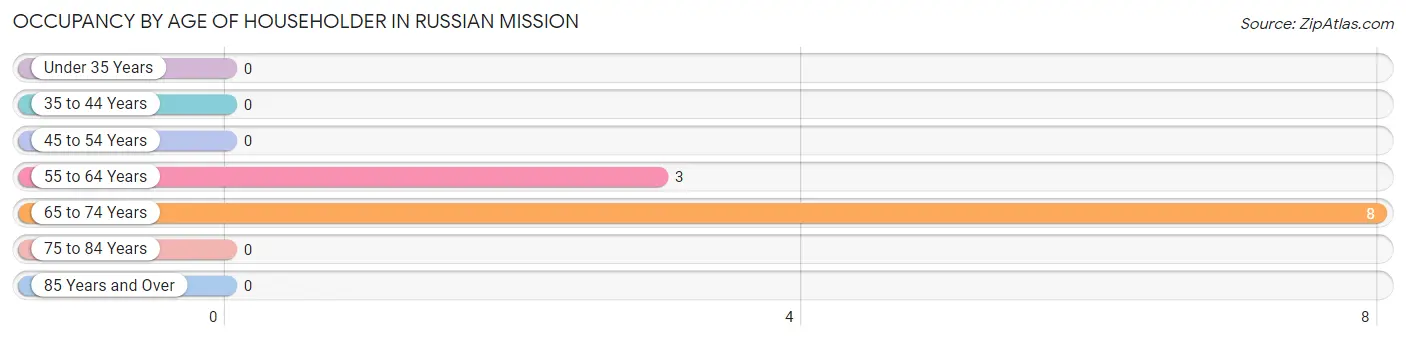
| Age Bracket | # Households | % Households |
| Under 35 Years | 0 | 0.0% |
| 35 to 44 Years | 0 | 0.0% |
| 45 to 54 Years | 0 | 0.0% |
| 55 to 64 Years | 3 | 27.3% |
| 65 to 74 Years | 8 | 72.7% |
| 75 to 84 Years | 0 | 0.0% |
| 85 Years and Over | 0 | 0.0% |
| Total | 11 | 100.0% |
Housing Finances in Russian Mission
Median Income by Occupancy in Russian Mission
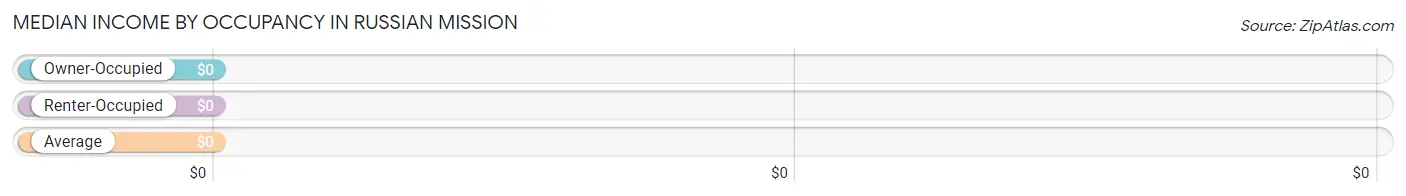
| Occupancy Type | # Households | Median Income |
| Owner-Occupied | 11 (100.0%) | $0 |
| Renter-Occupied | 0 (0.0%) | $0 |
| Average | 11 (100.0%) | $0 |
Occupancy by Householder Income Bracket in Russian Mission
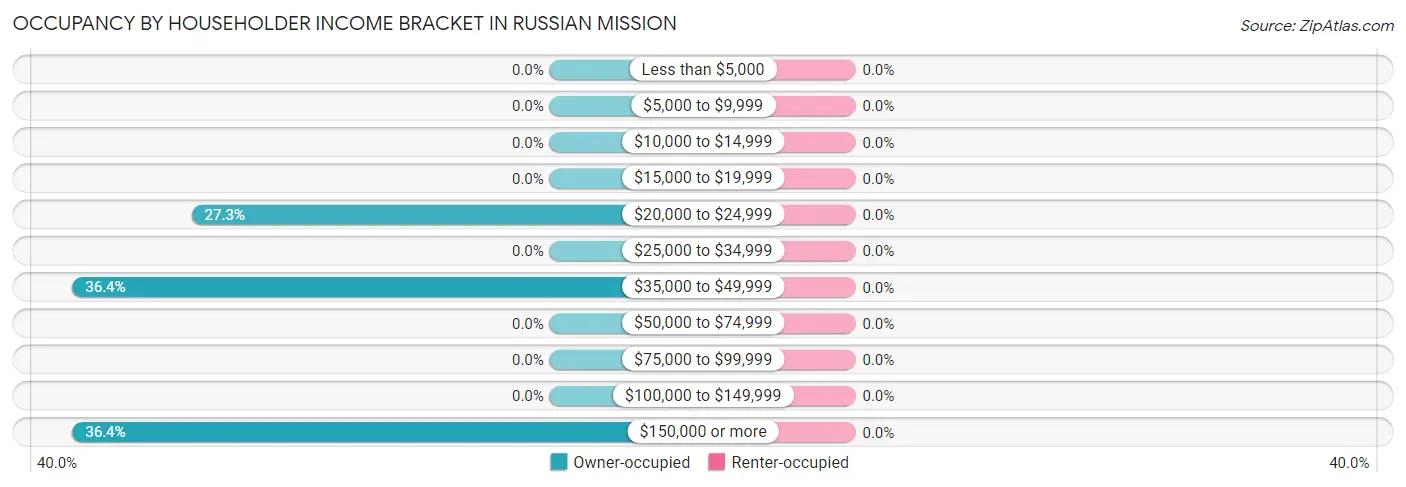
| Income Bracket | Owner-occupied | Renter-occupied |
| Less than $5,000 | 0 (0.0%) | 0 (0.0%) |
| $5,000 to $9,999 | 0 (0.0%) | 0 (0.0%) |
| $10,000 to $14,999 | 0 (0.0%) | 0 (0.0%) |
| $15,000 to $19,999 | 0 (0.0%) | 0 (0.0%) |
| $20,000 to $24,999 | 3 (27.3%) | 0 (0.0%) |
| $25,000 to $34,999 | 0 (0.0%) | 0 (0.0%) |
| $35,000 to $49,999 | 4 (36.4%) | 0 (0.0%) |
| $50,000 to $74,999 | 0 (0.0%) | 0 (0.0%) |
| $75,000 to $99,999 | 0 (0.0%) | 0 (0.0%) |
| $100,000 to $149,999 | 0 (0.0%) | 0 (0.0%) |
| $150,000 or more | 4 (36.4%) | 0 (0.0%) |
| Total | 11 (100.0%) | 0 (0.0%) |
Monthly Housing Cost Tiers in Russian Mission
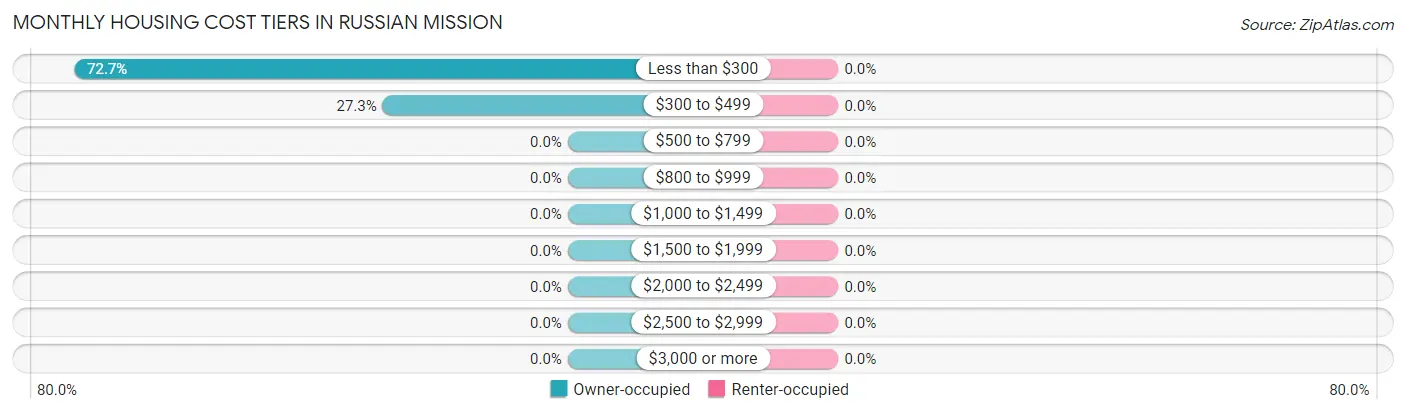
| Monthly Cost | Owner-occupied | Renter-occupied |
| Less than $300 | 8 (72.7%) | 0 (0.0%) |
| $300 to $499 | 3 (27.3%) | 0 (0.0%) |
| $500 to $799 | 0 (0.0%) | 0 (0.0%) |
| $800 to $999 | 0 (0.0%) | 0 (0.0%) |
| $1,000 to $1,499 | 0 (0.0%) | 0 (0.0%) |
| $1,500 to $1,999 | 0 (0.0%) | 0 (0.0%) |
| $2,000 to $2,499 | 0 (0.0%) | 0 (0.0%) |
| $2,500 to $2,999 | 0 (0.0%) | 0 (0.0%) |
| $3,000 or more | 0 (0.0%) | 0 (0.0%) |
| Total | 11 (100.0%) | 0 (0.0%) |
Physical Housing Characteristics in Russian Mission
Housing Structures in Russian Mission
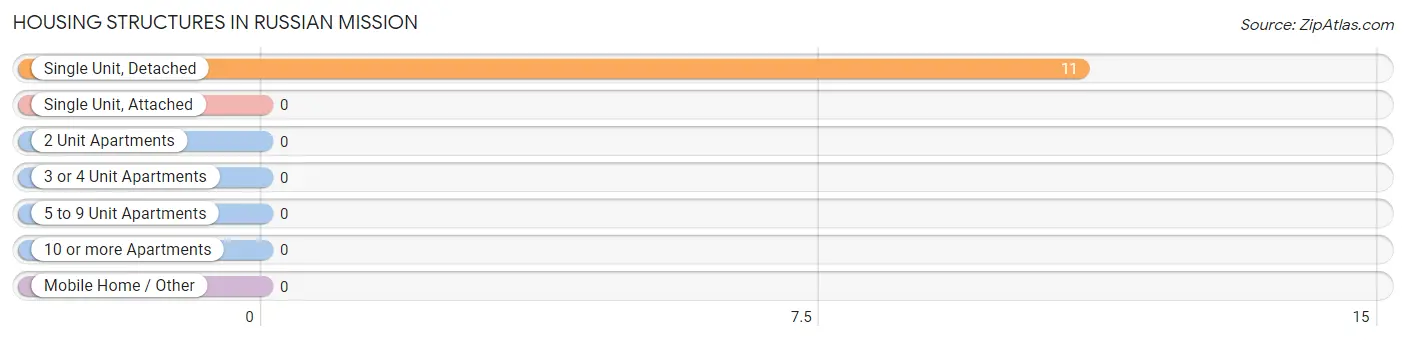
| Structure Type | # Housing Units | % Housing Units |
| Single Unit, Detached | 11 | 100.0% |
| Single Unit, Attached | 0 | 0.0% |
| 2 Unit Apartments | 0 | 0.0% |
| 3 or 4 Unit Apartments | 0 | 0.0% |
| 5 to 9 Unit Apartments | 0 | 0.0% |
| 10 or more Apartments | 0 | 0.0% |
| Mobile Home / Other | 0 | 0.0% |
| Total | 11 | 100.0% |
Housing Structures by Occupancy in Russian Mission
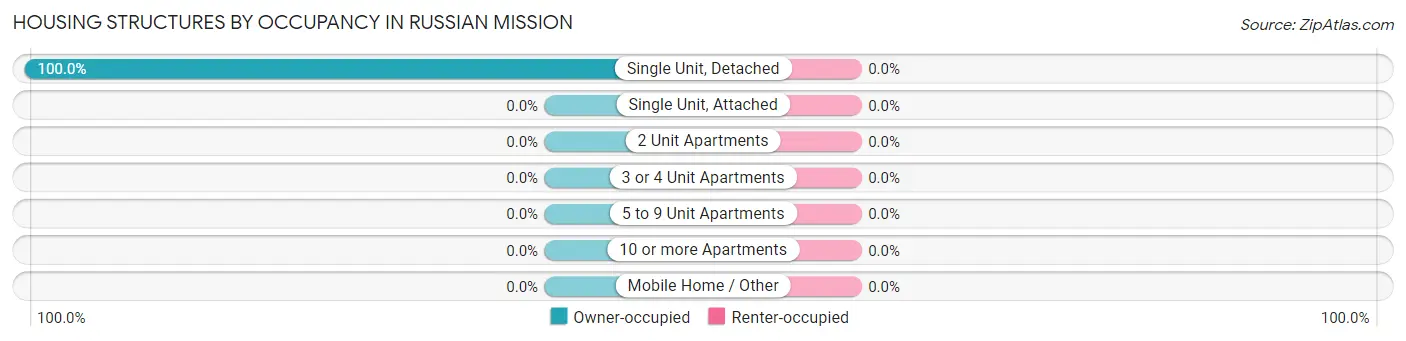
| Structure Type | Owner-occupied | Renter-occupied |
| Single Unit, Detached | 11 (100.0%) | 0 (0.0%) |
| Single Unit, Attached | 0 (0.0%) | 0 (0.0%) |
| 2 Unit Apartments | 0 (0.0%) | 0 (0.0%) |
| 3 or 4 Unit Apartments | 0 (0.0%) | 0 (0.0%) |
| 5 to 9 Unit Apartments | 0 (0.0%) | 0 (0.0%) |
| 10 or more Apartments | 0 (0.0%) | 0 (0.0%) |
| Mobile Home / Other | 0 (0.0%) | 0 (0.0%) |
| Total | 11 (100.0%) | 0 (0.0%) |
Housing Structures by Number of Rooms in Russian Mission
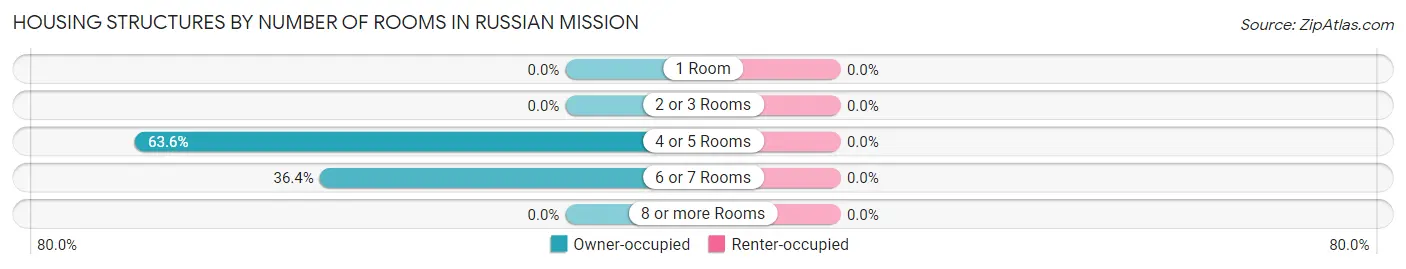
| Number of Rooms | Owner-occupied | Renter-occupied |
| 1 Room | 0 (0.0%) | 0 (0.0%) |
| 2 or 3 Rooms | 0 (0.0%) | 0 (0.0%) |
| 4 or 5 Rooms | 7 (63.6%) | 0 (0.0%) |
| 6 or 7 Rooms | 4 (36.4%) | 0 (0.0%) |
| 8 or more Rooms | 0 (0.0%) | 0 (0.0%) |
| Total | 11 (100.0%) | 0 (0.0%) |
Housing Structure by Heating Type in Russian Mission
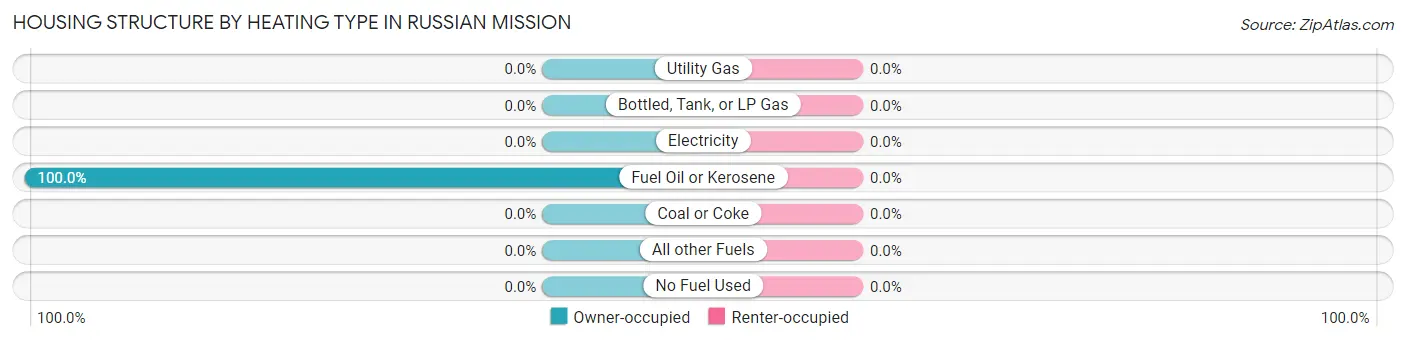
| Heating Type | Owner-occupied | Renter-occupied |
| Utility Gas | 0 (0.0%) | 0 (0.0%) |
| Bottled, Tank, or LP Gas | 0 (0.0%) | 0 (0.0%) |
| Electricity | 0 (0.0%) | 0 (0.0%) |
| Fuel Oil or Kerosene | 11 (100.0%) | 0 (0.0%) |
| Coal or Coke | 0 (0.0%) | 0 (0.0%) |
| All other Fuels | 0 (0.0%) | 0 (0.0%) |
| No Fuel Used | 0 (0.0%) | 0 (0.0%) |
| Total | 11 (100.0%) | 0 (0.0%) |
Household Vehicle Usage in Russian Mission
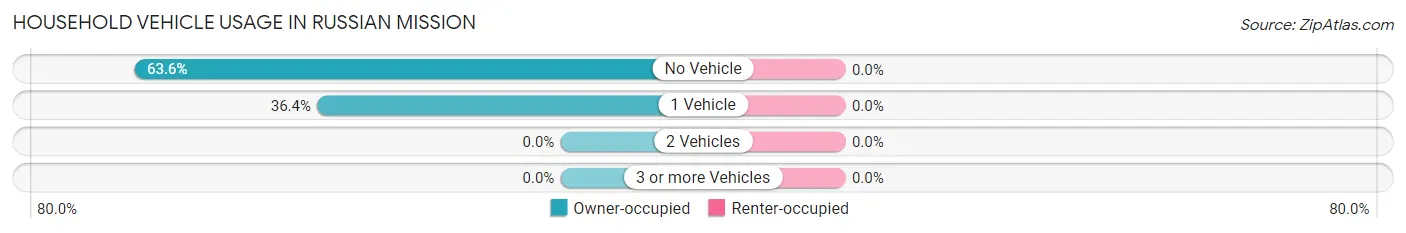
| Vehicles per Household | Owner-occupied | Renter-occupied |
| No Vehicle | 7 (63.6%) | 0 (0.0%) |
| 1 Vehicle | 4 (36.4%) | 0 (0.0%) |
| 2 Vehicles | 0 (0.0%) | 0 (0.0%) |
| 3 or more Vehicles | 0 (0.0%) | 0 (0.0%) |
| Total | 11 (100.0%) | 0 (0.0%) |
Real Estate & Mortgages in Russian Mission
Real Estate and Mortgage Overview in Russian Mission
| Characteristic | Without Mortgage | With Mortgage |
| Housing Units | 11 | 0 |
| Median Property Value | $155,400 | $0 |
| Median Household Income | - | - |
| Monthly Housing Costs | - | - |
| Real Estate Taxes | - | - |
Property Value by Mortgage Status in Russian Mission
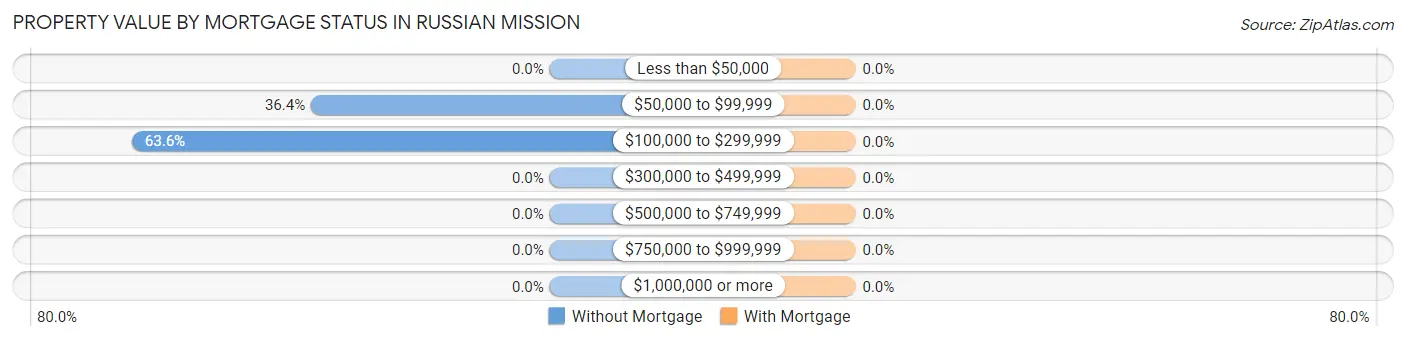
| Property Value | Without Mortgage | With Mortgage |
| Less than $50,000 | 0 (0.0%) | 0 (0.0%) |
| $50,000 to $99,999 | 4 (36.4%) | 0 (0.0%) |
| $100,000 to $299,999 | 7 (63.6%) | 0 (0.0%) |
| $300,000 to $499,999 | 0 (0.0%) | 0 (0.0%) |
| $500,000 to $749,999 | 0 (0.0%) | 0 (0.0%) |
| $750,000 to $999,999 | 0 (0.0%) | 0 (0.0%) |
| $1,000,000 or more | 0 (0.0%) | 0 (0.0%) |
| Total | 11 (100.0%) | 0 (0.0%) |
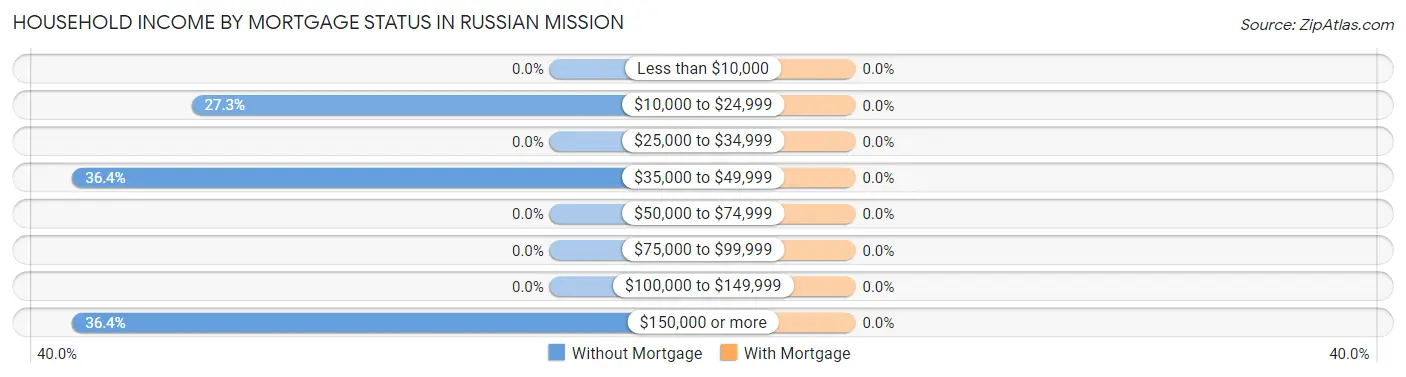
Household Income by Mortgage Status in Russian Mission
| Household Income | Without Mortgage | With Mortgage |
| Less than $10,000 | 0 (0.0%) | 0 (0.0%) |
| $10,000 to $24,999 | 3 (27.3%) | 0 (0.0%) |
| $25,000 to $34,999 | 0 (0.0%) | 0 (0.0%) |
| $35,000 to $49,999 | 4 (36.4%) | 0 (0.0%) |
| $50,000 to $74,999 | 0 (0.0%) | 0 (0.0%) |
| $75,000 to $99,999 | 0 (0.0%) | 0 (0.0%) |
| $100,000 to $149,999 | 0 (0.0%) | 0 (0.0%) |
| $150,000 or more | 4 (36.4%) | 0 (0.0%) |
| Total | 11 (100.0%) | 0 (0.0%) |
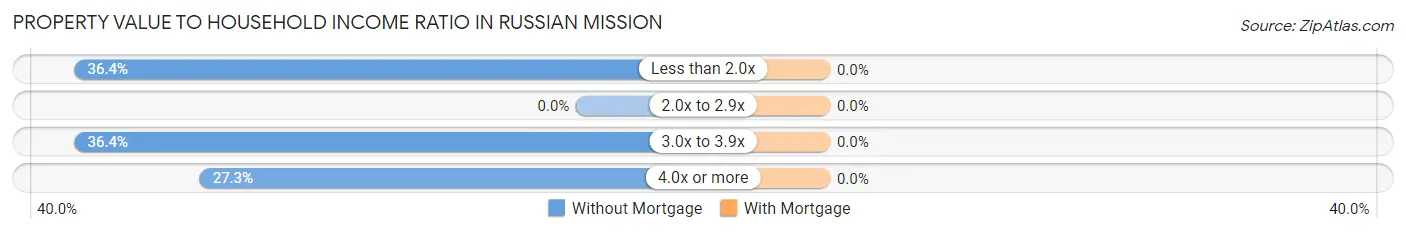
Property Value to Household Income Ratio in Russian Mission
| Value-to-Income Ratio | Without Mortgage | With Mortgage |
| Less than 2.0x | 4 (36.4%) | 0 (0.0%) |
| 2.0x to 2.9x | 0 (0.0%) | 0 (0.0%) |
| 3.0x to 3.9x | 4 (36.4%) | 0 (0.0%) |
| 4.0x or more | 3 (27.3%) | 0 (0.0%) |
| Total | 11 (100.0%) | 0 (0.0%) |
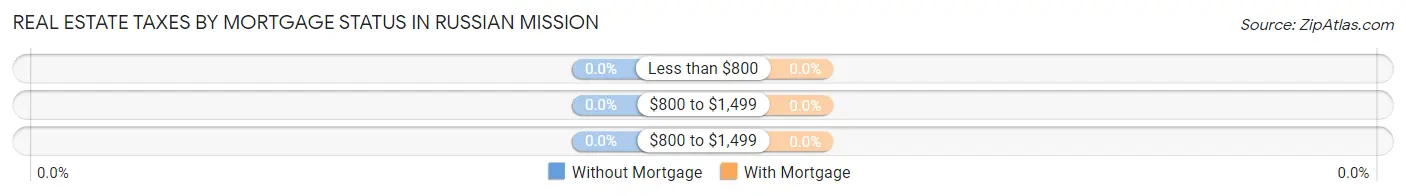
Real Estate Taxes by Mortgage Status in Russian Mission
| Property Taxes | Without Mortgage | With Mortgage |
| Less than $800 | 0 (0.0%) | 0 (0.0%) |
| $800 to $1,499 | 0 (0.0%) | 0 (0.0%) |
| $800 to $1,499 | 0 (0.0%) | 0 (0.0%) |
| Total | 11 (100.0%) | 0 (0.0%) |
Health & Disability in Russian Mission
Health Insurance Coverage by Age in Russian Mission
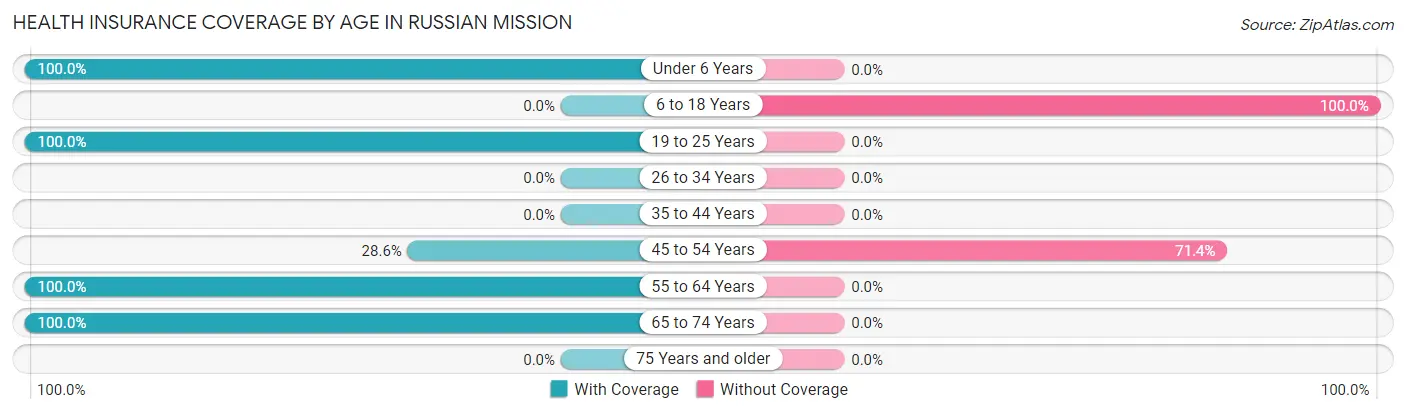
| Age Bracket | With Coverage | Without Coverage |
| Under 6 Years | 12 (100.0%) | 0 (0.0%) |
| 6 to 18 Years | 0 (0.0%) | 8 (100.0%) |
| 19 to 25 Years | 8 (100.0%) | 0 (0.0%) |
| 26 to 34 Years | 0 (0.0%) | 0 (0.0%) |
| 35 to 44 Years | 0 (0.0%) | 0 (0.0%) |
| 45 to 54 Years | 2 (28.6%) | 5 (71.4%) |
| 55 to 64 Years | 3 (100.0%) | 0 (0.0%) |
| 65 to 74 Years | 13 (100.0%) | 0 (0.0%) |
| 75 Years and older | 0 (0.0%) | 0 (0.0%) |
| Total | 38 (74.5%) | 13 (25.5%) |
Health Insurance Coverage by Citizenship Status in Russian Mission
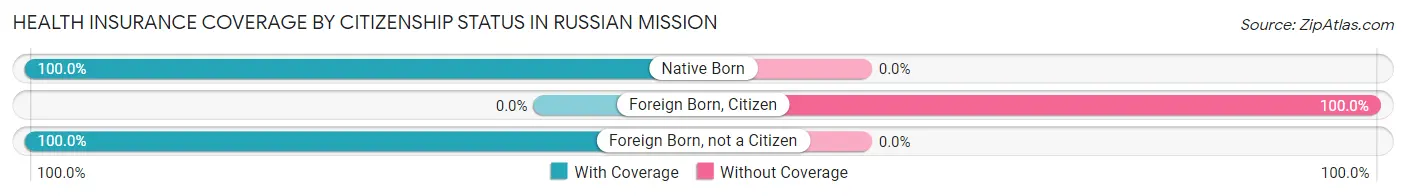
| Citizenship Status | With Coverage | Without Coverage |
| Native Born | 12 (100.0%) | 0 (0.0%) |
| Foreign Born, Citizen | 0 (0.0%) | 8 (100.0%) |
| Foreign Born, not a Citizen | 8 (100.0%) | 0 (0.0%) |
Health Insurance Coverage by Household Income in Russian Mission
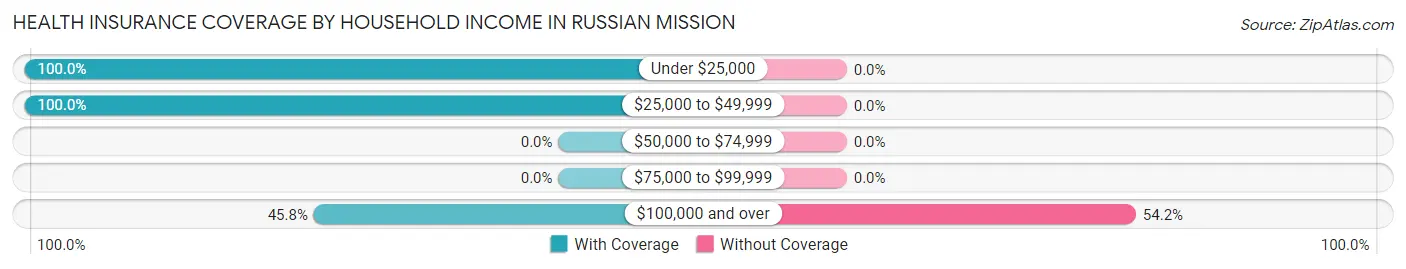
| Household Income | With Coverage | Without Coverage |
| Under $25,000 | 21 (100.0%) | 0 (0.0%) |
| $25,000 to $49,999 | 6 (100.0%) | 0 (0.0%) |
| $50,000 to $74,999 | 0 (0.0%) | 0 (0.0%) |
| $75,000 to $99,999 | 0 (0.0%) | 0 (0.0%) |
| $100,000 and over | 11 (45.8%) | 13 (54.2%) |
Public vs Private Health Insurance Coverage by Age in Russian Mission
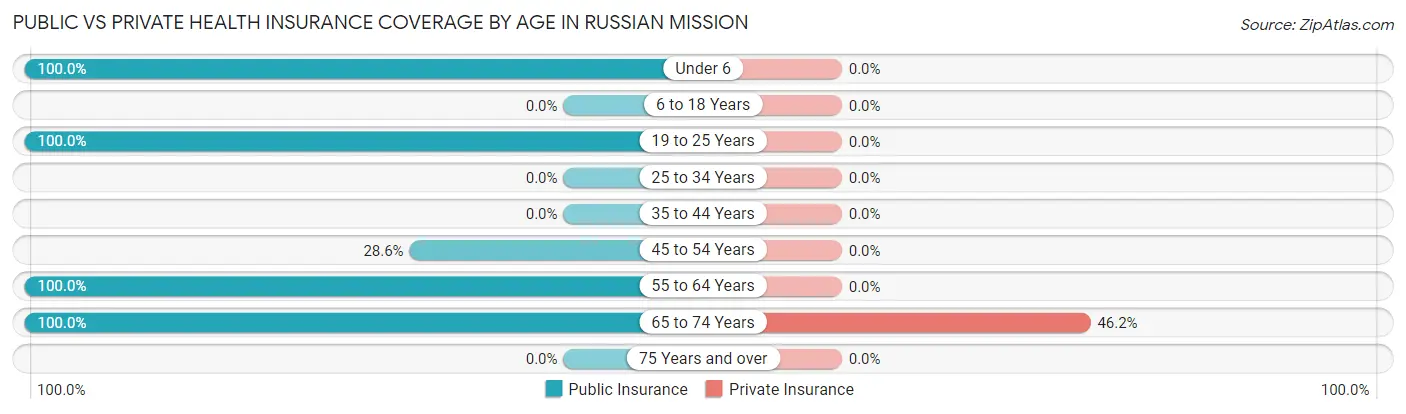
| Age Bracket | Public Insurance | Private Insurance |
| Under 6 | 12 (100.0%) | 0 (0.0%) |
| 6 to 18 Years | 0 (0.0%) | 0 (0.0%) |
| 19 to 25 Years | 8 (100.0%) | 0 (0.0%) |
| 25 to 34 Years | 0 (0.0%) | 0 (0.0%) |
| 35 to 44 Years | 0 (0.0%) | 0 (0.0%) |
| 45 to 54 Years | 2 (28.6%) | 0 (0.0%) |
| 55 to 64 Years | 3 (100.0%) | 0 (0.0%) |
| 65 to 74 Years | 13 (100.0%) | 6 (46.2%) |
| 75 Years and over | 0 (0.0%) | 0 (0.0%) |
| Total | 38 (74.5%) | 6 (11.8%) |
Disability Status by Sex by Age in Russian Mission
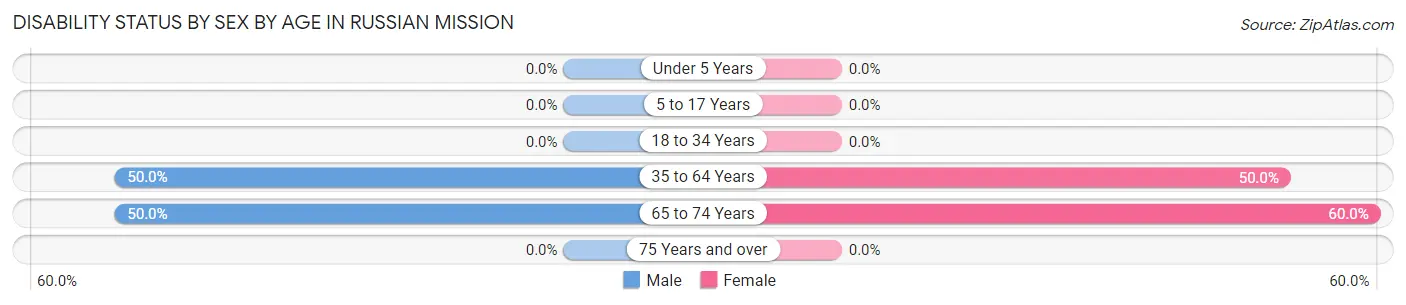
| Age Bracket | Male | Female |
| Under 5 Years | 0 (0.0%) | 0 (0.0%) |
| 5 to 17 Years | 0 (0.0%) | 0 (0.0%) |
| 18 to 34 Years | 0 (0.0%) | 0 (0.0%) |
| 35 to 64 Years | 3 (50.0%) | 2 (50.0%) |
| 65 to 74 Years | 4 (50.0%) | 3 (60.0%) |
| 75 Years and over | 0 (0.0%) | 0 (0.0%) |
Disability Class by Sex by Age in Russian Mission
Disability Class: Hearing Difficulty
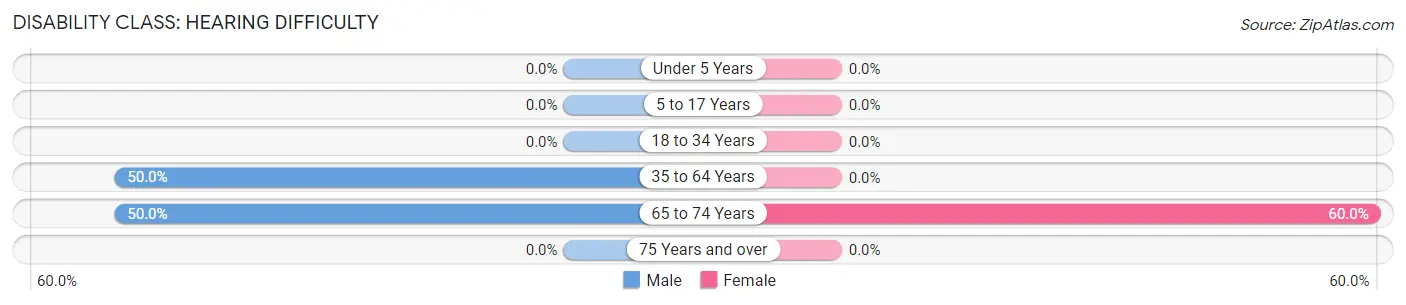
| Age Bracket | Male | Female |
| Under 5 Years | 0 (0.0%) | 0 (0.0%) |
| 5 to 17 Years | 0 (0.0%) | 0 (0.0%) |
| 18 to 34 Years | 0 (0.0%) | 0 (0.0%) |
| 35 to 64 Years | 3 (50.0%) | 0 (0.0%) |
| 65 to 74 Years | 4 (50.0%) | 3 (60.0%) |
| 75 Years and over | 0 (0.0%) | 0 (0.0%) |
Disability Class: Vision Difficulty
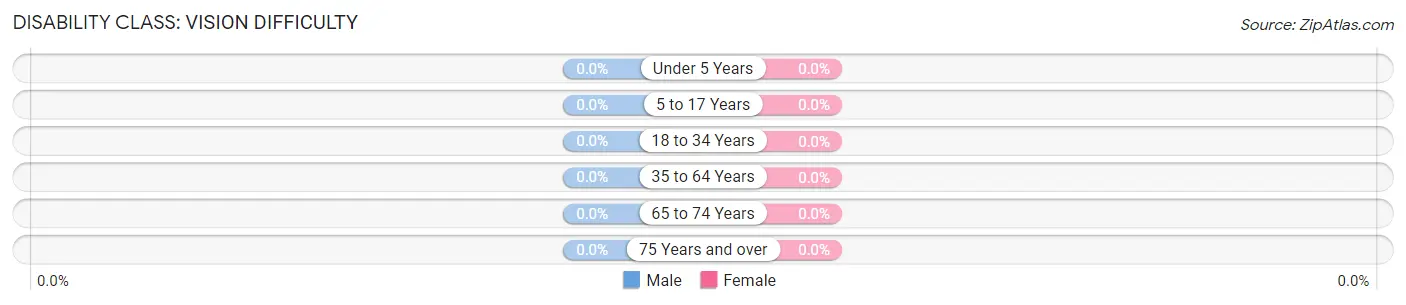
| Age Bracket | Male | Female |
| Under 5 Years | 0 (0.0%) | 0 (0.0%) |
| 5 to 17 Years | 0 (0.0%) | 0 (0.0%) |
| 18 to 34 Years | 0 (0.0%) | 0 (0.0%) |
| 35 to 64 Years | 0 (0.0%) | 0 (0.0%) |
| 65 to 74 Years | 0 (0.0%) | 0 (0.0%) |
| 75 Years and over | 0 (0.0%) | 0 (0.0%) |
Disability Class: Cognitive Difficulty
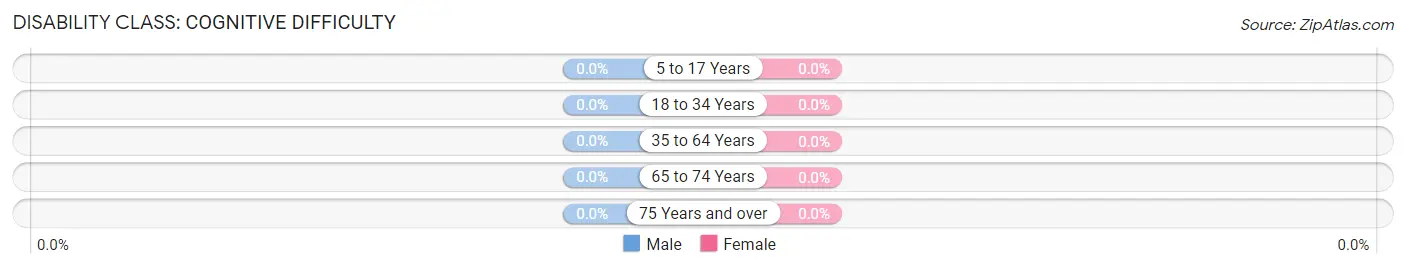
| Age Bracket | Male | Female |
| 5 to 17 Years | 0 (0.0%) | 0 (0.0%) |
| 18 to 34 Years | 0 (0.0%) | 0 (0.0%) |
| 35 to 64 Years | 0 (0.0%) | 0 (0.0%) |
| 65 to 74 Years | 0 (0.0%) | 0 (0.0%) |
| 75 Years and over | 0 (0.0%) | 0 (0.0%) |
Disability Class: Ambulatory Difficulty
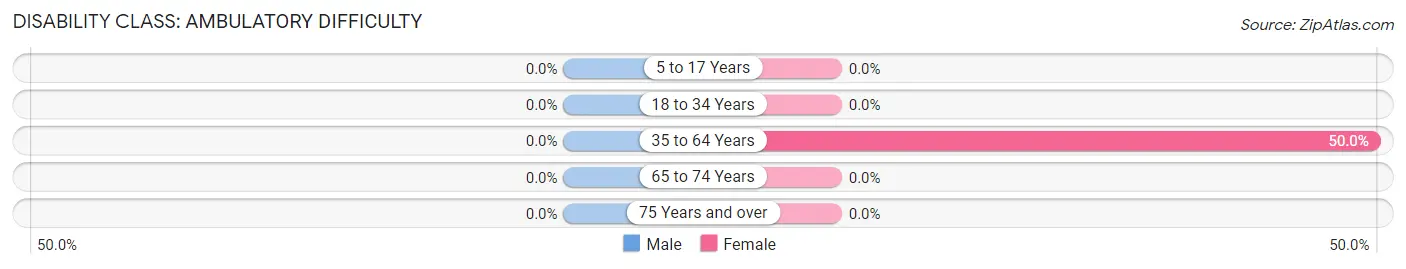
| Age Bracket | Male | Female |
| 5 to 17 Years | 0 (0.0%) | 0 (0.0%) |
| 18 to 34 Years | 0 (0.0%) | 0 (0.0%) |
| 35 to 64 Years | 0 (0.0%) | 2 (50.0%) |
| 65 to 74 Years | 0 (0.0%) | 0 (0.0%) |
| 75 Years and over | 0 (0.0%) | 0 (0.0%) |
Disability Class: Self-Care Difficulty
| Age Bracket | Male | Female |
| 5 to 17 Years | 0 (0.0%) | 0 (0.0%) |
| 18 to 34 Years | 0 (0.0%) | 0 (0.0%) |
| 35 to 64 Years | 0 (0.0%) | 0 (0.0%) |
| 65 to 74 Years | 0 (0.0%) | 0 (0.0%) |
| 75 Years and over | 0 (0.0%) | 0 (0.0%) |
Technology Access in Russian Mission
Computing Device Access in Russian Mission
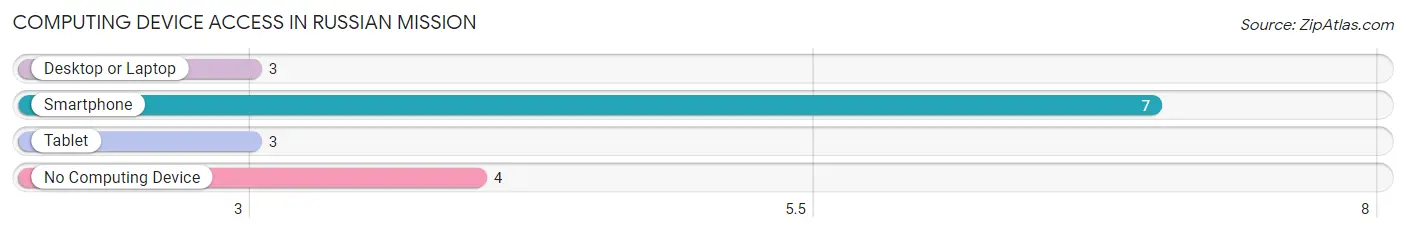
| Device Type | # Households | % Households |
| Desktop or Laptop | 3 | 27.3% |
| Smartphone | 7 | 63.6% |
| Tablet | 3 | 27.3% |
| No Computing Device | 4 | 36.4% |
| Total | 11 | 100.0% |
Internet Access in Russian Mission
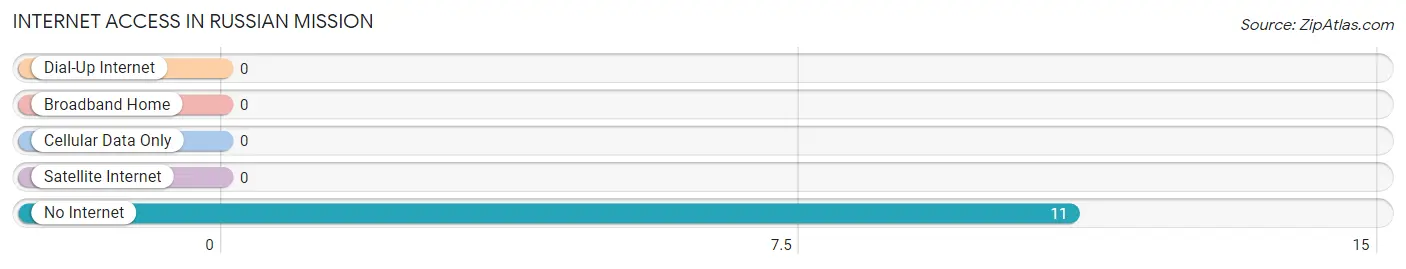
| Internet Type | # Households | % Households |
| Dial-Up Internet | 0 | 0.0% |
| Broadband Home | 0 | 0.0% |
| Cellular Data Only | 0 | 0.0% |
| Satellite Internet | 0 | 0.0% |
| No Internet | 11 | 100.0% |
| Total | 11 | 100.0% |
Russian Mission Summary
The Russian Mission, Alaska is a small city located in the Yukon-Kuskokwim Delta region of the U.S. state of Alaska. It is situated on the west bank of the Yukon River, approximately 50 miles (80 km) upstream from the Bering Sea. The city is the administrative center of the Yukon-Kuskokwim Delta Borough, and is home to a population of approximately 500 people.
History
The area around Russian Mission has been inhabited by the Yup'ik people for centuries. The first European to visit the area was Russian explorer Vitus Bering, who arrived in 1741. The area was later explored by Russian fur traders, who established a trading post in the area in 1818. The trading post was named "Russian Mission" in honor of the Russian Orthodox Church, which had established a mission in the area in 1824.
The town was officially incorporated in 1901, and in the early 20th century, it became a hub for the region's fur trade. The town also served as a supply center for gold miners in the area. In the 1950s, the town's economy shifted to fishing and subsistence hunting.
Geography
Russian Mission is located in the Yukon-Kuskokwim Delta region of Alaska, on the west bank of the Yukon River. The city is situated approximately 50 miles (80 km) upstream from the Bering Sea. The area is characterized by flat, marshy terrain, with numerous small lakes and ponds. The climate is subarctic, with long, cold winters and short, mild summers.
Economy
The economy of Russian Mission is largely based on subsistence hunting and fishing. The city is also home to a number of small businesses, including a grocery store, a hardware store, and a restaurant. The city is also home to a number of government offices, including the Yukon-Kuskokwim Delta Borough offices.
Demographics
As of the 2010 census, the population of Russian Mission was 498, with a population density of 0.3 people per square mile (0.1/km2). The racial makeup of the city was 95.2% Native American, 2.2% White, 0.2% Asian, 0.2% Pacific Islander, and 2.2% from two or more races. The median age of the population was 28.7 years, and the median household income was $25,000. The city is predominantly Yup'ik, with a small population of Russian and other European descent.
Common Questions
What is Per Capita Income in Russian Mission?
Per Capita income in Russian Mission is $12,465.
What is Inequality or Gini Index in Russian Mission?
Inequality or Gini Index in Russian Mission is 0.39.
What is the Total Population of Russian Mission?
Total Population of Russian Mission is 51.
What is the Total Male Population of Russian Mission?
Total Male Population of Russian Mission is 18.
What is the Total Female Population of Russian Mission?
Total Female Population of Russian Mission is 33.
What is the Ratio of Males per 100 Females in Russian Mission?
There are 54.55 Males per 100 Females in Russian Mission.
What is the Ratio of Females per 100 Males in Russian Mission?
There are 183.33 Females per 100 Males in Russian Mission.
What is the Median Population Age in Russian Mission?
Median Population Age in Russian Mission is 24.4 Years.
What is the Average Family Size in Russian Mission
Average Family Size in Russian Mission is 4.6 People.
What is the Average Household Size in Russian Mission
Average Household Size in Russian Mission is 4.6 People.
How Large is the Labor Force in Russian Mission?
There are 10 People in the Labor Forcein in Russian Mission.
What is the Percentage of People in the Labor Force in Russian Mission?
32.3% of People are in the Labor Force in Russian Mission.