Relampago, TX Map & Demographics
Relampago Map
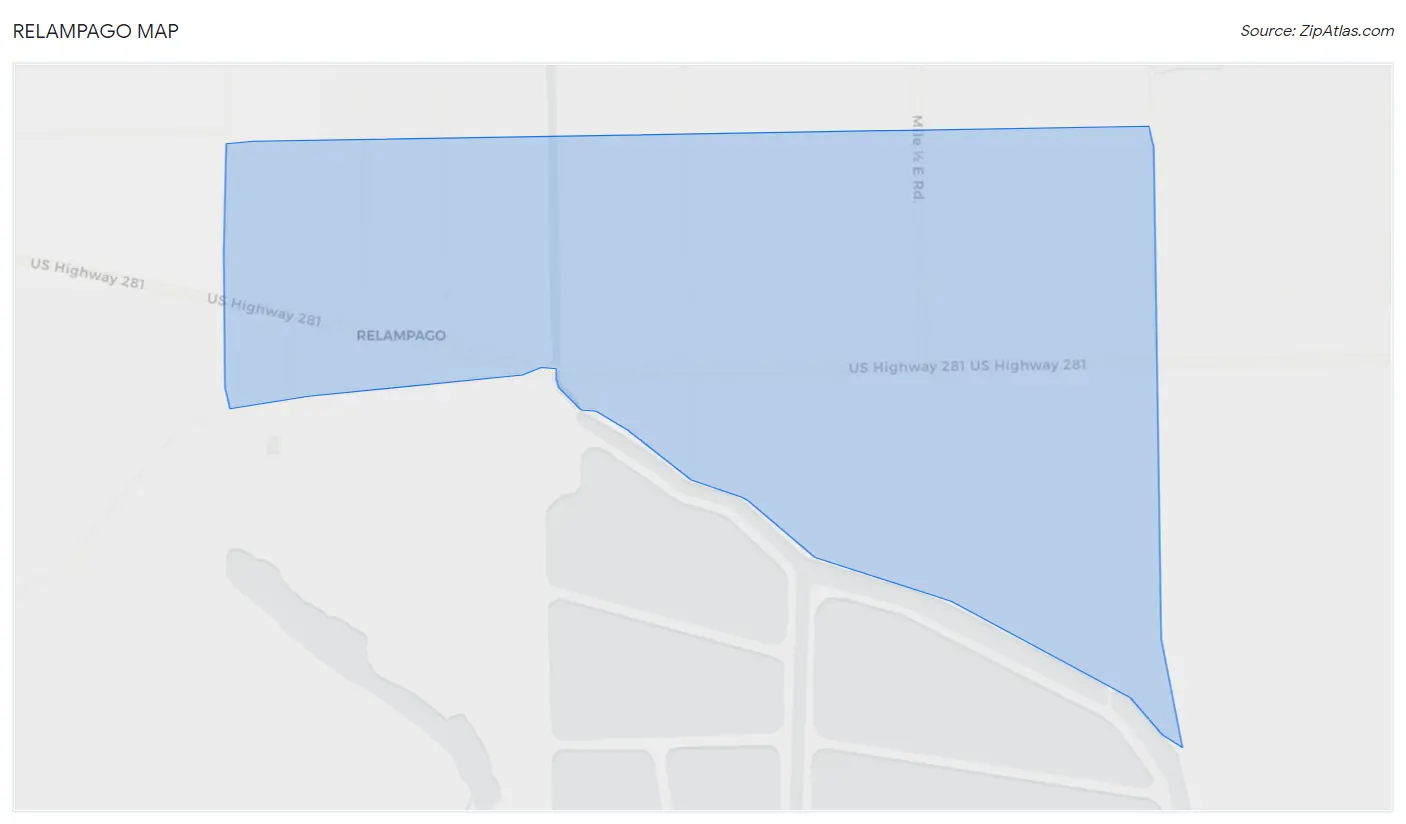
Relampago Overview
$23,297
PER CAPITA INCOME
$91,500
AVG FAMILY INCOME
$90,125
AVG HOUSEHOLD INCOME
0.16
INEQUALITY / GINI INDEX
292
TOTAL POPULATION
123
MALE POPULATION
169
FEMALE POPULATION
72.78
MALES / 100 FEMALES
137.40
FEMALES / 100 MALES
48.0
MEDIAN AGE
3.8
AVG FAMILY SIZE
3.4
AVG HOUSEHOLD SIZE
156
LABOR FORCE [ PEOPLE ]
60.7%
PERCENT IN LABOR FORCE
Income in Relampago
Income Overview in Relampago
Per Capita Income in Relampago is $23,297, while median incomes of families and households are $91,500 and $90,125 respectively.
| Characteristic | Number | Measure |
| Per Capita Income | 292 | $23,297 |
| Median Family Income | 74 | $91,500 |
| Mean Family Income | 74 | $82,154 |
| Median Household Income | 85 | $90,125 |
| Mean Household Income | 85 | $76,236 |
| Income Deficit | 74 | $0 |
| Wage / Income Gap (%) | 292 | 0.00% |
| Wage / Income Gap ($) | 292 | 100.00¢ per $1 |
| Gini / Inequality Index | 292 | 0.16 |
Earnings by Sex in Relampago
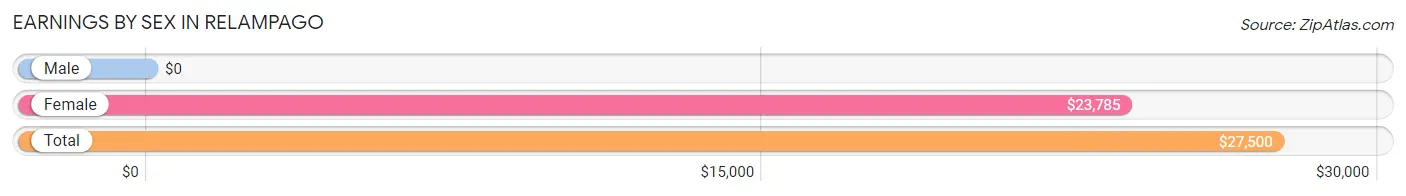
| Sex | Number | Average Earnings |
| Male | 35 (22.4%) | $0 |
| Female | 121 (77.6%) | $23,785 |
| Total | 156 (100.0%) | $27,500 |
Earnings by Sex by Income Bracket in Relampago
The most common earnings brackets in Relampago are $30,000 to $34,999 for men (35 | 100.0%) and $22,500 to $24,999 for women (36 | 29.7%).
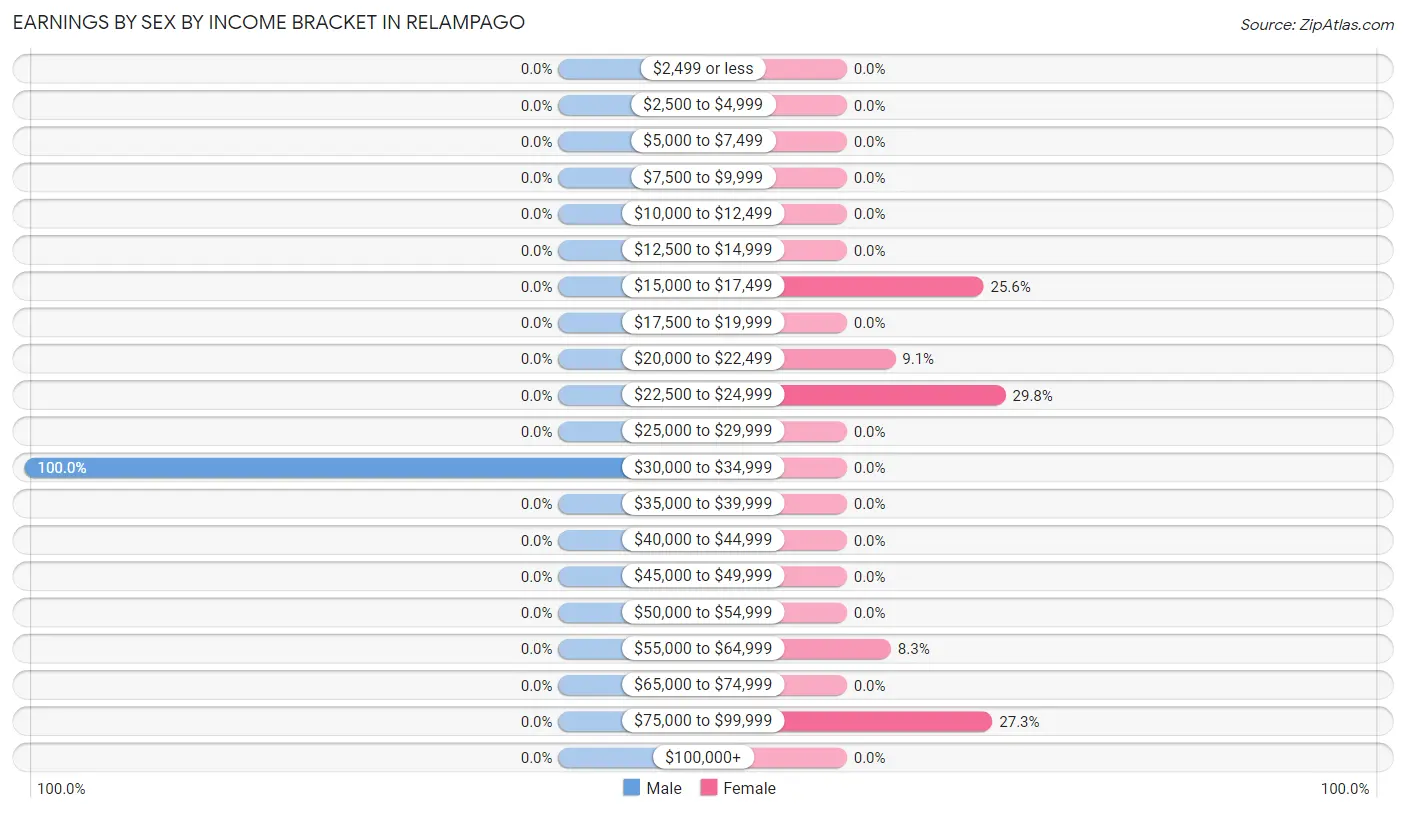
| Income | Male | Female |
| $2,499 or less | 0 (0.0%) | 0 (0.0%) |
| $2,500 to $4,999 | 0 (0.0%) | 0 (0.0%) |
| $5,000 to $7,499 | 0 (0.0%) | 0 (0.0%) |
| $7,500 to $9,999 | 0 (0.0%) | 0 (0.0%) |
| $10,000 to $12,499 | 0 (0.0%) | 0 (0.0%) |
| $12,500 to $14,999 | 0 (0.0%) | 0 (0.0%) |
| $15,000 to $17,499 | 0 (0.0%) | 31 (25.6%) |
| $17,500 to $19,999 | 0 (0.0%) | 0 (0.0%) |
| $20,000 to $22,499 | 0 (0.0%) | 11 (9.1%) |
| $22,500 to $24,999 | 0 (0.0%) | 36 (29.7%) |
| $25,000 to $29,999 | 0 (0.0%) | 0 (0.0%) |
| $30,000 to $34,999 | 35 (100.0%) | 0 (0.0%) |
| $35,000 to $39,999 | 0 (0.0%) | 0 (0.0%) |
| $40,000 to $44,999 | 0 (0.0%) | 0 (0.0%) |
| $45,000 to $49,999 | 0 (0.0%) | 0 (0.0%) |
| $50,000 to $54,999 | 0 (0.0%) | 0 (0.0%) |
| $55,000 to $64,999 | 0 (0.0%) | 10 (8.3%) |
| $65,000 to $74,999 | 0 (0.0%) | 0 (0.0%) |
| $75,000 to $99,999 | 0 (0.0%) | 33 (27.3%) |
| $100,000+ | 0 (0.0%) | 0 (0.0%) |
| Total | 35 (100.0%) | 121 (100.0%) |
Earnings by Sex by Educational Attainment in Relampago
| Educational Attainment | Male Income | Female Income |
| Less than High School | - | - |
| High School Diploma | - | - |
| College or Associate's Degree | - | - |
| Bachelor's Degree | - | - |
| Graduate Degree | - | - |
| Total | - | - |
Family Income in Relampago
Family Income Brackets in Relampago
According to the Relampago family income data, there are 33 families falling into the $100,000 to $149,999 income range, which is the most common income bracket and makes up 44.6% of all families.
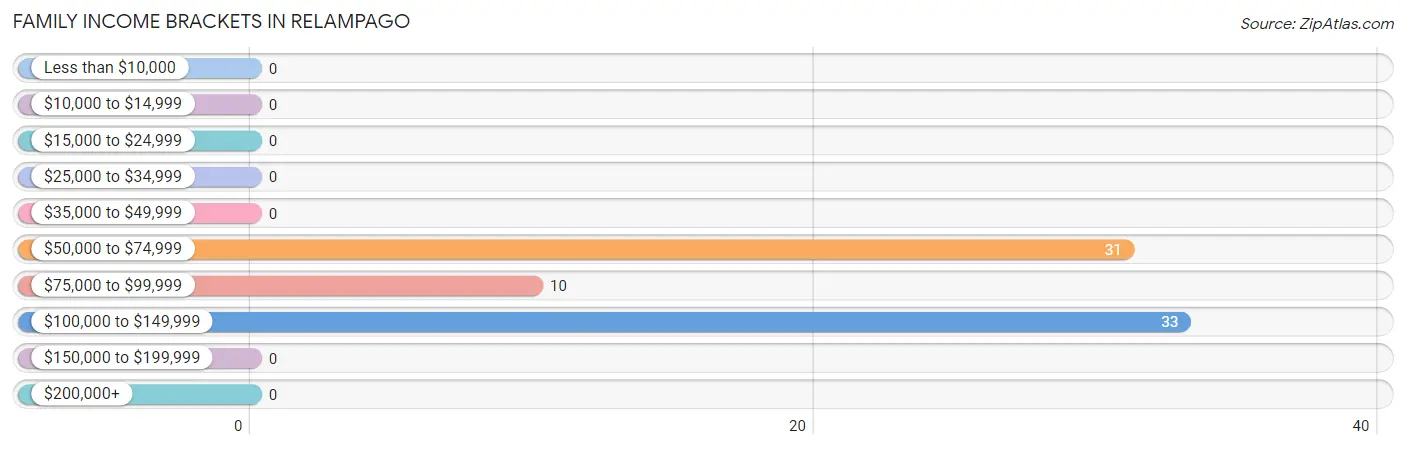
| Income Bracket | # Families | % Families |
| Less than $10,000 | 0 | 0.0% |
| $10,000 to $14,999 | 0 | 0.0% |
| $15,000 to $24,999 | 0 | 0.0% |
| $25,000 to $34,999 | 0 | 0.0% |
| $35,000 to $49,999 | 0 | 0.0% |
| $50,000 to $74,999 | 31 | 41.9% |
| $75,000 to $99,999 | 10 | 13.5% |
| $100,000 to $149,999 | 33 | 44.6% |
| $150,000 to $199,999 | 0 | 0.0% |
| $200,000+ | 0 | 0.0% |
Family Income by Famaliy Size in Relampago
| Income Bracket | # Families | Median Income |
| 2-Person Families | 0 (0.0%) | $0 |
| 3-Person Families | 41 (55.4%) | $0 |
| 4-Person Families | 33 (44.6%) | $0 |
| 5-Person Families | 0 (0.0%) | $0 |
| 6-Person Families | 0 (0.0%) | $0 |
| 7+ Person Families | 0 (0.0%) | $0 |
| Total | 74 (100.0%) | $91,500 |
Family Income by Number of Earners in Relampago
| Number of Earners | # Families | Median Income |
| No Earners | 0 (0.0%) | $0 |
| 1 Earner | 10 (13.5%) | $0 |
| 2 Earners | 64 (86.5%) | $0 |
| 3+ Earners | 0 (0.0%) | $0 |
| Total | 74 (100.0%) | $91,500 |
Household Income in Relampago
Household Income Brackets in Relampago
With 33 households falling in the category, the $100,000 to $149,999 income range is the most frequent in Relampago, accounting for 38.8% of all households.
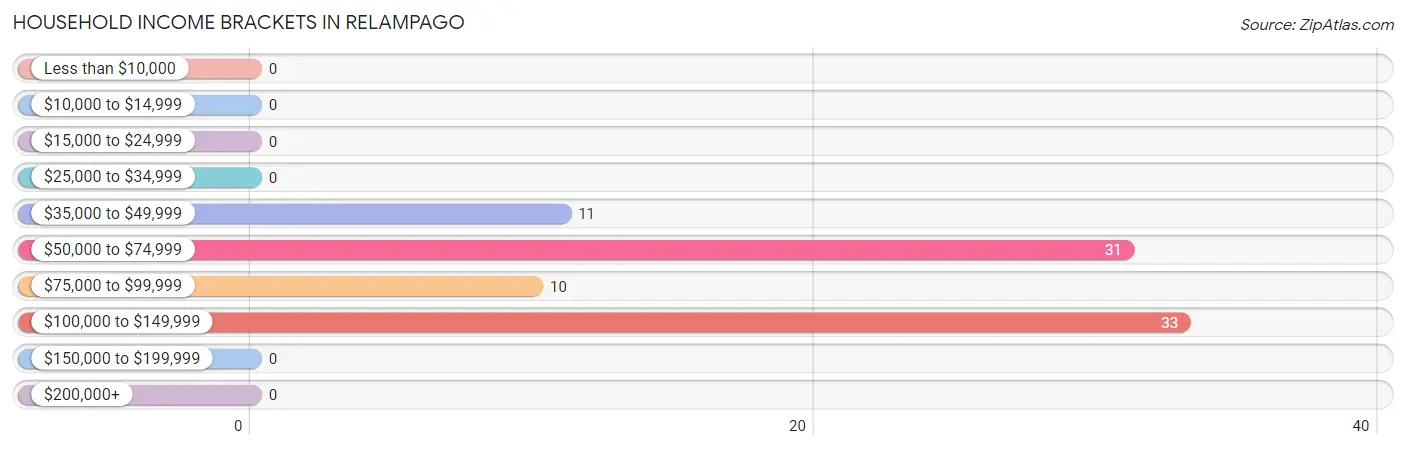
| Income Bracket | # Households | % Households |
| Less than $10,000 | 0 | 0.0% |
| $10,000 to $14,999 | 0 | 0.0% |
| $15,000 to $24,999 | 0 | 0.0% |
| $25,000 to $34,999 | 0 | 0.0% |
| $35,000 to $49,999 | 11 | 12.9% |
| $50,000 to $74,999 | 31 | 36.5% |
| $75,000 to $99,999 | 10 | 11.8% |
| $100,000 to $149,999 | 33 | 38.8% |
| $150,000 to $199,999 | 0 | 0.0% |
| $200,000+ | 0 | 0.0% |
Household Income by Householder Age in Relampago
| Income Bracket | # Households | Median Income |
| 15 to 24 Years | 0 (0.0%) | $0 |
| 25 to 44 Years | 0 (0.0%) | $0 |
| 45 to 64 Years | 43 (50.6%) | $0 |
| 65+ Years | 42 (49.4%) | $0 |
| Total | 85 (100.0%) | $90,125 |
Poverty in Relampago
Income Below Poverty by Sex and Age in Relampago
| Age Bracket | Male | Female |
| Under 5 Years | 0 (0.0%) | 0 (0.0%) |
| 5 Years | 0 (0.0%) | 0 (0.0%) |
| 6 to 11 Years | 0 (0.0%) | 0 (0.0%) |
| 12 to 14 Years | 0 (0.0%) | 0 (0.0%) |
| 15 Years | 0 (0.0%) | 0 (0.0%) |
| 16 and 17 Years | 0 (0.0%) | 0 (0.0%) |
| 18 to 24 Years | 0 (0.0%) | 0 (0.0%) |
| 25 to 34 Years | 0 (0.0%) | 0 (0.0%) |
| 35 to 44 Years | 0 (0.0%) | 0 (0.0%) |
| 45 to 54 Years | 0 (0.0%) | 0 (0.0%) |
| 55 to 64 Years | 0 (0.0%) | 0 (0.0%) |
| 65 to 74 Years | 0 (0.0%) | 0 (0.0%) |
| 75 Years and over | 0 (0.0%) | 0 (0.0%) |
| Total | 0 (0.0%) | 0 (0.0%) |
Income Above Poverty by Sex and Age in Relampago
According to the poverty statistics in Relampago, males aged 18 to 24 years and females aged 15 years are the age groups that are most secure financially, with 100.0% of males and 100.0% of females in these age groups living above the poverty line.
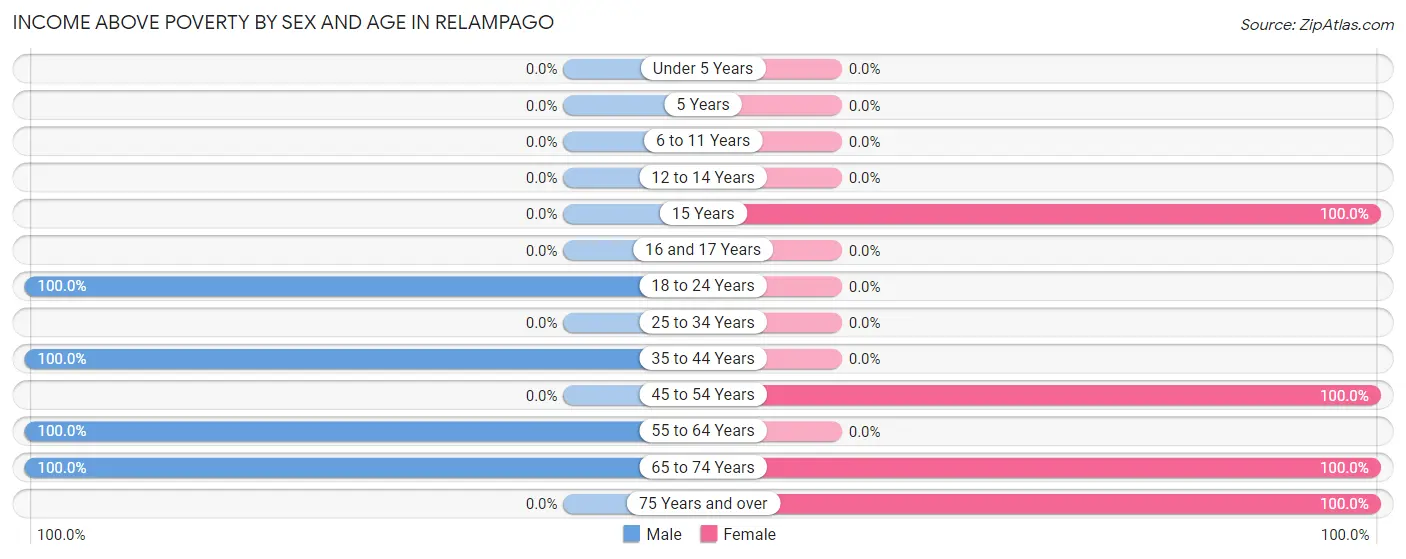
| Age Bracket | Male | Female |
| Under 5 Years | 0 (0.0%) | 0 (0.0%) |
| 5 Years | 0 (0.0%) | 0 (0.0%) |
| 6 to 11 Years | 0 (0.0%) | 0 (0.0%) |
| 12 to 14 Years | 0 (0.0%) | 0 (0.0%) |
| 15 Years | 0 (0.0%) | 35 (100.0%) |
| 16 and 17 Years | 0 (0.0%) | 0 (0.0%) |
| 18 to 24 Years | 38 (100.0%) | 0 (0.0%) |
| 25 to 34 Years | 0 (0.0%) | 0 (0.0%) |
| 35 to 44 Years | 37 (100.0%) | 0 (0.0%) |
| 45 to 54 Years | 0 (0.0%) | 79 (100.0%) |
| 55 to 64 Years | 13 (100.0%) | 0 (0.0%) |
| 65 to 74 Years | 35 (100.0%) | 42 (100.0%) |
| 75 Years and over | 0 (0.0%) | 13 (100.0%) |
| Total | 123 (100.0%) | 169 (100.0%) |
Income Below Poverty Among Married-Couple Families in Relampago
| Children | Above Poverty | Below Poverty |
| No Children | 31 (100.0%) | 0 (0.0%) |
| 1 or 2 Children | 0 (0.0%) | 0 (0.0%) |
| 3 or 4 Children | 0 (0.0%) | 0 (0.0%) |
| 5 or more Children | 0 (0.0%) | 0 (0.0%) |
| Total | 31 (100.0%) | 0 (0.0%) |
Income Below Poverty Among Single-Parent Households in Relampago
| Children | Single Father | Single Mother |
| No Children | 0 (0.0%) | 0 (0.0%) |
| 1 or 2 Children | 0 (0.0%) | 0 (0.0%) |
| 3 or 4 Children | 0 (0.0%) | 0 (0.0%) |
| 5 or more Children | 0 (0.0%) | 0 (0.0%) |
| Total | 0 (0.0%) | 0 (0.0%) |
Income Below Poverty Among Married-Couple vs Single-Parent Households in Relampago
| Children | Married-Couple Families | Single-Parent Households |
| No Children | 0 (0.0%) | 0 (0.0%) |
| 1 or 2 Children | 0 (0.0%) | 0 (0.0%) |
| 3 or 4 Children | 0 (0.0%) | 0 (0.0%) |
| 5 or more Children | 0 (0.0%) | 0 (0.0%) |
| Total | 0 (0.0%) | 0 (0.0%) |
Race in Relampago
The most populous races in Relampago are White / Caucasian (292 | 100.0%), and Hispanic or Latino (255 | 87.3%).
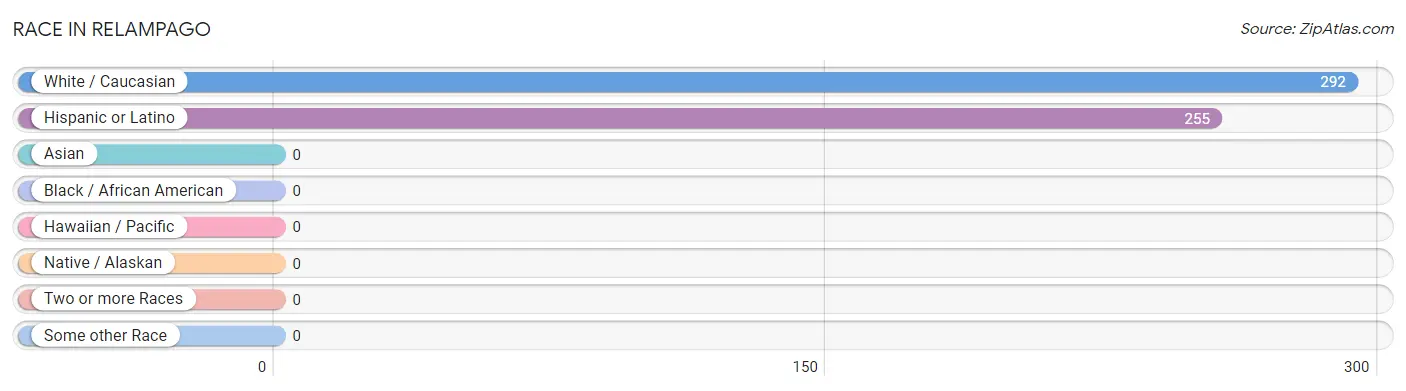
| Race | # Population | % Population |
| Asian | 0 | 0.0% |
| Black / African American | 0 | 0.0% |
| Hawaiian / Pacific | 0 | 0.0% |
| Hispanic or Latino | 255 | 87.3% |
| Native / Alaskan | 0 | 0.0% |
| White / Caucasian | 292 | 100.0% |
| Two or more Races | 0 | 0.0% |
| Some other Race | 0 | 0.0% |
| Total | 292 | 100.0% |
Ancestry in Relampago
The most populous ancestries reported in Relampago are Mexican (255 | 87.3%), and Irish (37 | 12.7%), together accounting for 100.0% of all Relampago residents.
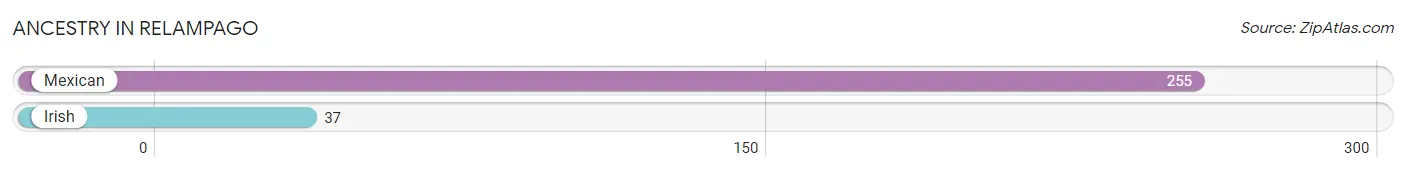
| Ancestry | # Population | % Population |
| Irish | 37 | 12.7% |
| Mexican | 255 | 87.3% | View All 2 Rows |
Immigrants in Relampago

| Immigration Origin | # Population | % Population | View All 0 Rows |
Sex and Age in Relampago
Sex and Age in Relampago
The most populous age groups in Relampago are 20 to 24 Years (38 | 30.9%) for men and 45 to 49 Years (79 | 46.8%) for women.
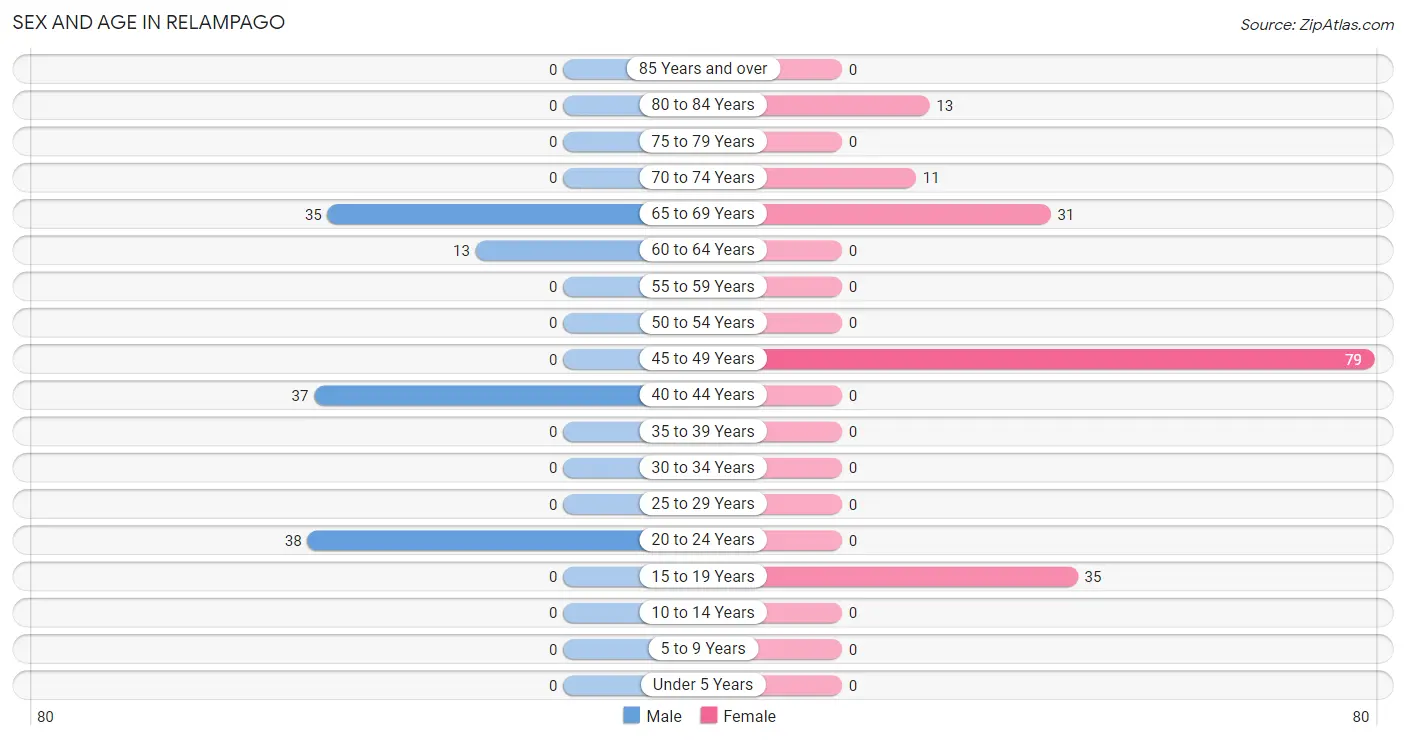
| Age Bracket | Male | Female |
| Under 5 Years | 0 (0.0%) | 0 (0.0%) |
| 5 to 9 Years | 0 (0.0%) | 0 (0.0%) |
| 10 to 14 Years | 0 (0.0%) | 0 (0.0%) |
| 15 to 19 Years | 0 (0.0%) | 35 (20.7%) |
| 20 to 24 Years | 38 (30.9%) | 0 (0.0%) |
| 25 to 29 Years | 0 (0.0%) | 0 (0.0%) |
| 30 to 34 Years | 0 (0.0%) | 0 (0.0%) |
| 35 to 39 Years | 0 (0.0%) | 0 (0.0%) |
| 40 to 44 Years | 37 (30.1%) | 0 (0.0%) |
| 45 to 49 Years | 0 (0.0%) | 79 (46.8%) |
| 50 to 54 Years | 0 (0.0%) | 0 (0.0%) |
| 55 to 59 Years | 0 (0.0%) | 0 (0.0%) |
| 60 to 64 Years | 13 (10.6%) | 0 (0.0%) |
| 65 to 69 Years | 35 (28.5%) | 31 (18.3%) |
| 70 to 74 Years | 0 (0.0%) | 11 (6.5%) |
| 75 to 79 Years | 0 (0.0%) | 0 (0.0%) |
| 80 to 84 Years | 0 (0.0%) | 13 (7.7%) |
| 85 Years and over | 0 (0.0%) | 0 (0.0%) |
| Total | 123 (100.0%) | 169 (100.0%) |
Families and Households in Relampago
Median Family Size in Relampago
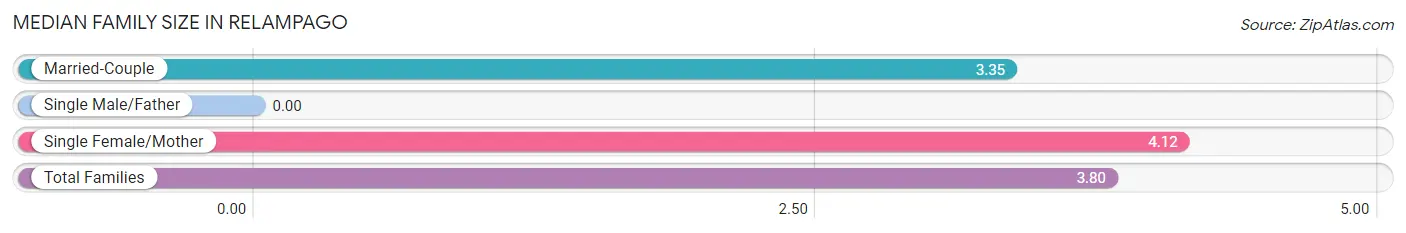
| Family Type | # Families | Family Size |
| Married-Couple | 31 (41.9%) | 3.35 |
| Single Male/Father | 0 (0.0%) | - |
| Single Female/Mother | 43 (58.1%) | 4.12 |
| Total Families | 74 (100.0%) | 3.80 |
Median Household Size in Relampago
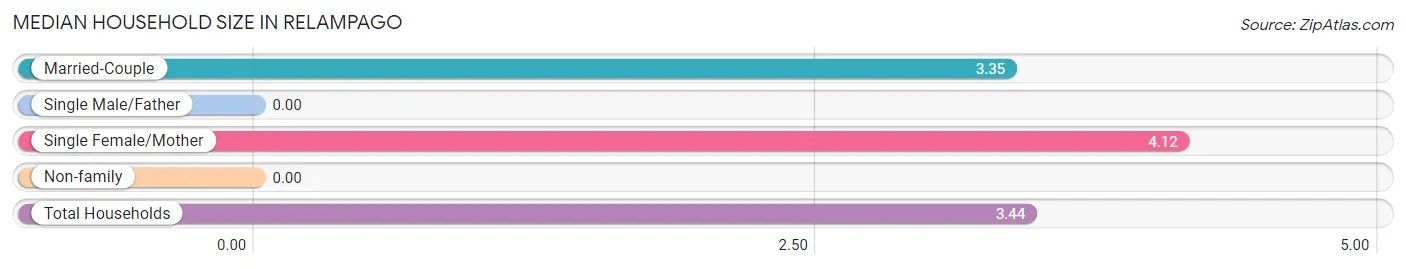
| Household Type | # Households | Household Size |
| Married-Couple | 31 (36.5%) | 3.35 |
| Single Male/Father | 0 (0.0%) | - |
| Single Female/Mother | 43 (50.6%) | 4.12 |
| Non-family | 11 (12.9%) | - |
| Total Households | 85 (100.0%) | 3.44 |
Household Size by Marriage Status in Relampago
Out of a total of 85 households in Relampago, 74 (87.1%) are family households, while 11 (12.9%) are nonfamily households. The most numerous type of family households are 3-person households, comprising 41, and the most common type of nonfamily households are 1-person households, comprising 11.
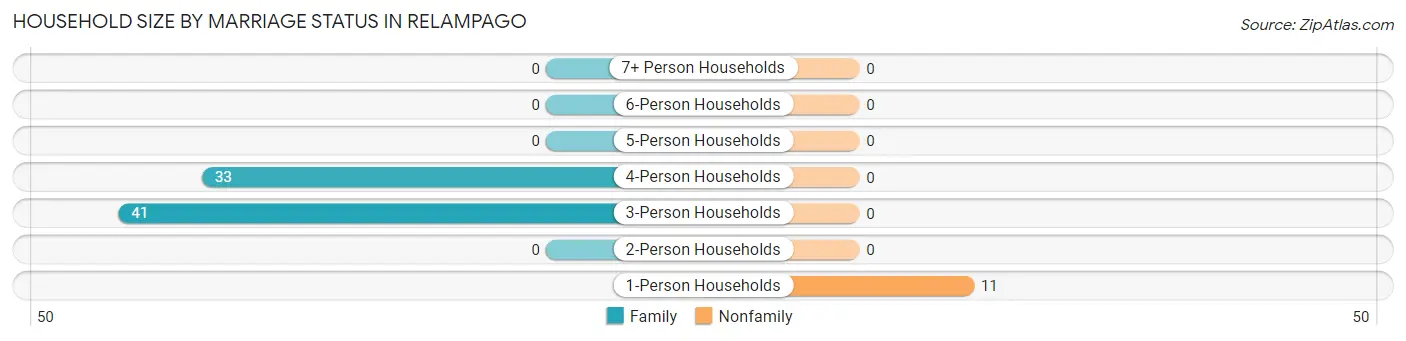
| Household Size | Family Households | Nonfamily Households |
| 1-Person Households | - | 11 (12.9%) |
| 2-Person Households | 0 (0.0%) | 0 (0.0%) |
| 3-Person Households | 41 (48.2%) | 0 (0.0%) |
| 4-Person Households | 33 (38.8%) | 0 (0.0%) |
| 5-Person Households | 0 (0.0%) | 0 (0.0%) |
| 6-Person Households | 0 (0.0%) | 0 (0.0%) |
| 7+ Person Households | 0 (0.0%) | 0 (0.0%) |
| Total | 74 (87.1%) | 11 (12.9%) |
Female Fertility in Relampago
Fertility by Age in Relampago
| Age Bracket | Women with Births | Births / 1,000 Women |
| 15 to 19 years | 0 (0.0%) | 0.0 |
| 20 to 34 years | 0 (0.0%) | 0.0 |
| 35 to 50 years | 0 (0.0%) | 0.0 |
| Total | 0 (0.0%) | 0.0 |
Fertility by Age by Marriage Status in Relampago
| Age Bracket | Married | Unmarried |
| 15 to 19 years | 0 (0.0%) | 0 (0.0%) |
| 20 to 34 years | 0 (0.0%) | 0 (0.0%) |
| 35 to 50 years | 0 (0.0%) | 0 (0.0%) |
| Total | 0 (0.0%) | 0 (0.0%) |
Fertility by Education in Relampago
| Educational Attainment | Women with Births | Births / 1,000 Women |
| Less than High School | 0 (0.0%) | 0.0 |
| High School Diploma | 0 (0.0%) | 0.0 |
| College or Associate's Degree | 0 (0.0%) | 0.0 |
| Bachelor's Degree | 0 (0.0%) | 0.0 |
| Graduate Degree | 0 (0.0%) | 0.0 |
| Total | 0 (0.0%) | 0.0 |
Fertility by Education by Marriage Status in Relampago
| Educational Attainment | Married | Unmarried |
| Less than High School | 0 (0.0%) | 0 (0.0%) |
| High School Diploma | 0 (0.0%) | 0 (0.0%) |
| College or Associate's Degree | 0 (0.0%) | 0 (0.0%) |
| Bachelor's Degree | 0 (0.0%) | 0 (0.0%) |
| Graduate Degree | 0 (0.0%) | 0 (0.0%) |
| Total | 0 (0.0%) | 0 (0.0%) |
Employment Characteristics in Relampago
Employment by Class of Employer in Relampago
Among the 156 employed individuals in Relampago, state government employees (69 | 44.2%), self-employed (not incorporated) (35 | 22.4%), and self-employed (incorporated) (31 | 19.9%) make up the most common classes of employment.
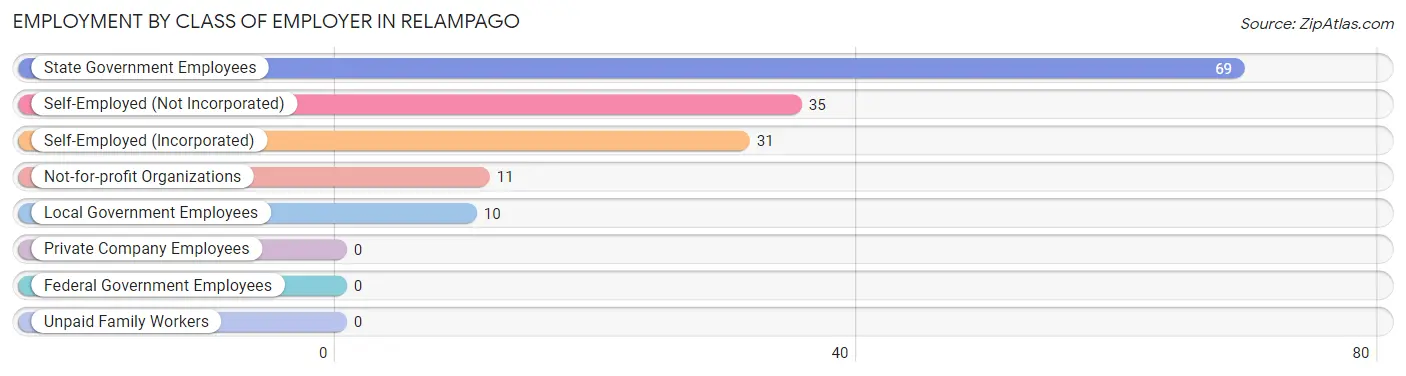
| Employer Class | # Employees | % Employees |
| Private Company Employees | 0 | 0.0% |
| Self-Employed (Incorporated) | 31 | 19.9% |
| Self-Employed (Not Incorporated) | 35 | 22.4% |
| Not-for-profit Organizations | 11 | 7.0% |
| Local Government Employees | 10 | 6.4% |
| State Government Employees | 69 | 44.2% |
| Federal Government Employees | 0 | 0.0% |
| Unpaid Family Workers | 0 | 0.0% |
| Total | 156 | 100.0% |
Employment Status by Age in Relampago
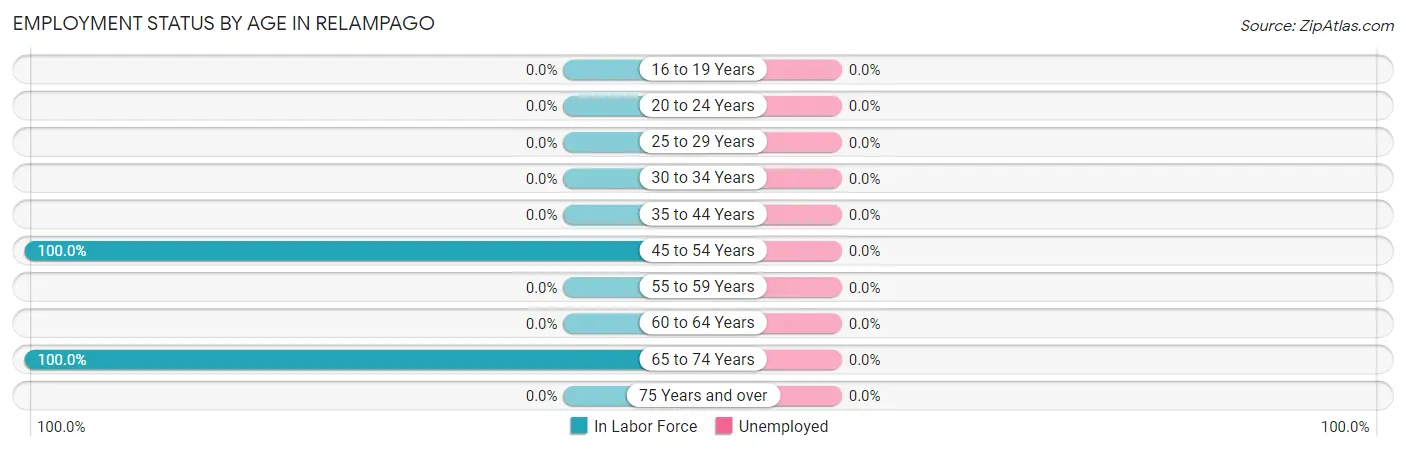
| Age Bracket | In Labor Force | Unemployed |
| 16 to 19 Years | 0 (0.0%) | 0 (0.0%) |
| 20 to 24 Years | 0 (0.0%) | 0 (0.0%) |
| 25 to 29 Years | 0 (0.0%) | 0 (0.0%) |
| 30 to 34 Years | 0 (0.0%) | 0 (0.0%) |
| 35 to 44 Years | 0 (0.0%) | 0 (0.0%) |
| 45 to 54 Years | 79 (100.0%) | 0 (0.0%) |
| 55 to 59 Years | 0 (0.0%) | 0 (0.0%) |
| 60 to 64 Years | 0 (0.0%) | 0 (0.0%) |
| 65 to 74 Years | 77 (100.0%) | 0 (0.0%) |
| 75 Years and over | 0 (0.0%) | 0 (0.0%) |
| Total | 156 (60.7%) | 0 (0.0%) |
Employment Status by Educational Attainment in Relampago
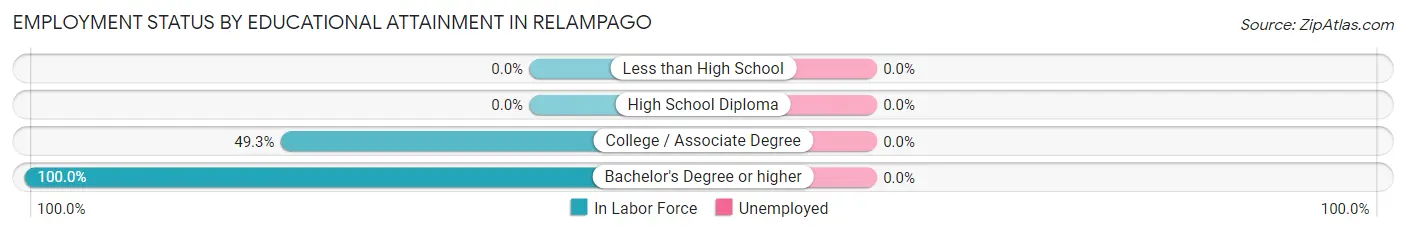
| Educational Attainment | In Labor Force | Unemployed |
| Less than High School | 0 (0.0%) | 0 (0.0%) |
| High School Diploma | 0 (0.0%) | 0 (0.0%) |
| College / Associate Degree | 36 (49.3%) | 0 (0.0%) |
| Bachelor's Degree or higher | 43 (100.0%) | 0 (0.0%) |
| Total | 79 (61.2%) | 0 (0.0%) |
Employment Occupations by Sex in Relampago
Management, Business, Science and Arts Occupations
The most common Management, Business, Science and Arts occupations in Relampago are Community & Social Service (43 | 27.6%), Education Instruction & Library (43 | 27.6%), and Management (35 | 22.4%).
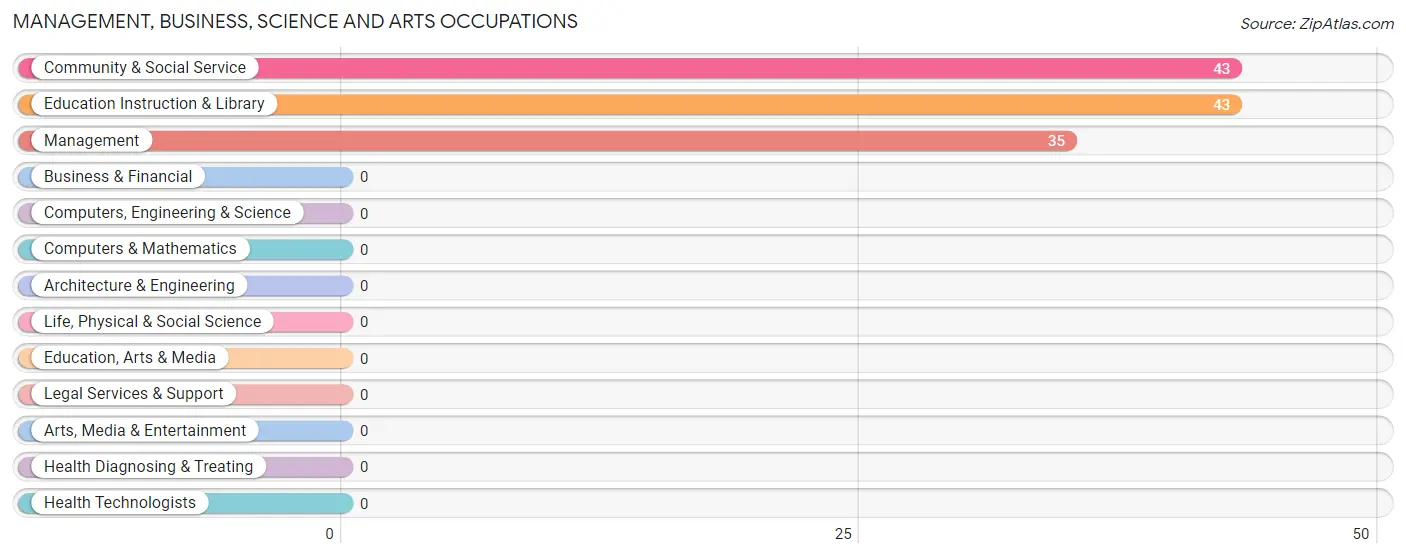
Management, Business, Science and Arts Occupations by Sex
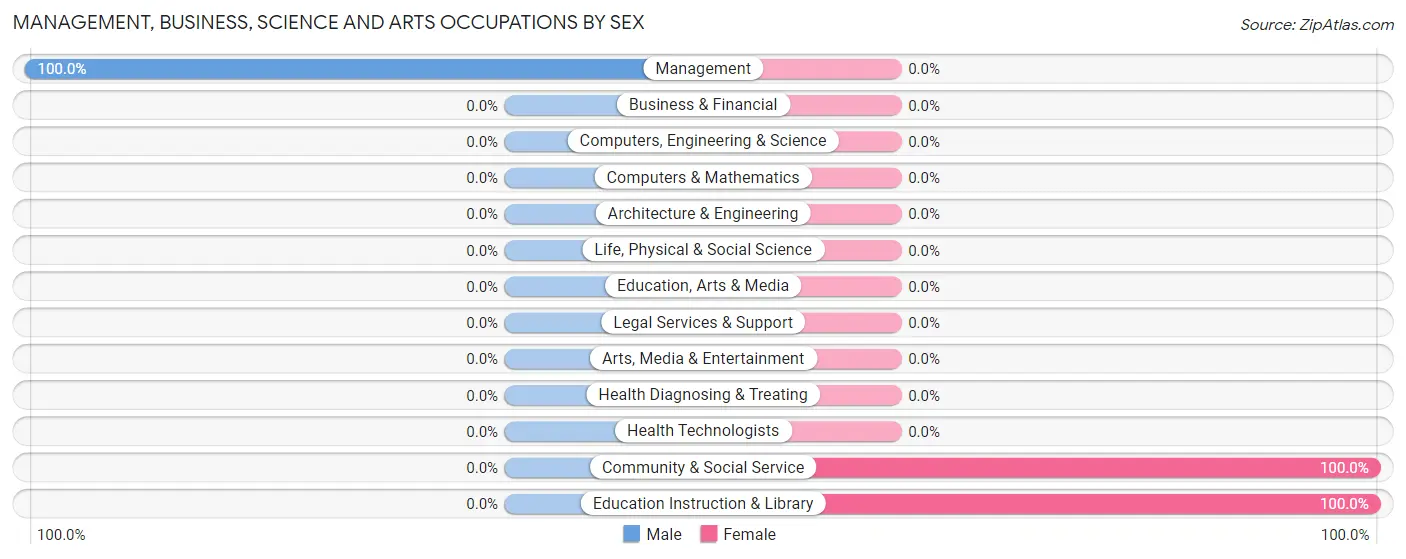
| Occupation | Male | Female |
| Management | 35 (100.0%) | 0 (0.0%) |
| Business & Financial | 0 (0.0%) | 0 (0.0%) |
| Computers, Engineering & Science | 0 (0.0%) | 0 (0.0%) |
| Computers & Mathematics | 0 (0.0%) | 0 (0.0%) |
| Architecture & Engineering | 0 (0.0%) | 0 (0.0%) |
| Life, Physical & Social Science | 0 (0.0%) | 0 (0.0%) |
| Community & Social Service | 0 (0.0%) | 43 (100.0%) |
| Education, Arts & Media | 0 (0.0%) | 0 (0.0%) |
| Legal Services & Support | 0 (0.0%) | 0 (0.0%) |
| Education Instruction & Library | 0 (0.0%) | 43 (100.0%) |
| Arts, Media & Entertainment | 0 (0.0%) | 0 (0.0%) |
| Health Diagnosing & Treating | 0 (0.0%) | 0 (0.0%) |
| Health Technologists | 0 (0.0%) | 0 (0.0%) |
| Total (Category) | 35 (44.9%) | 43 (55.1%) |
| Total (Overall) | 35 (22.4%) | 121 (77.6%) |
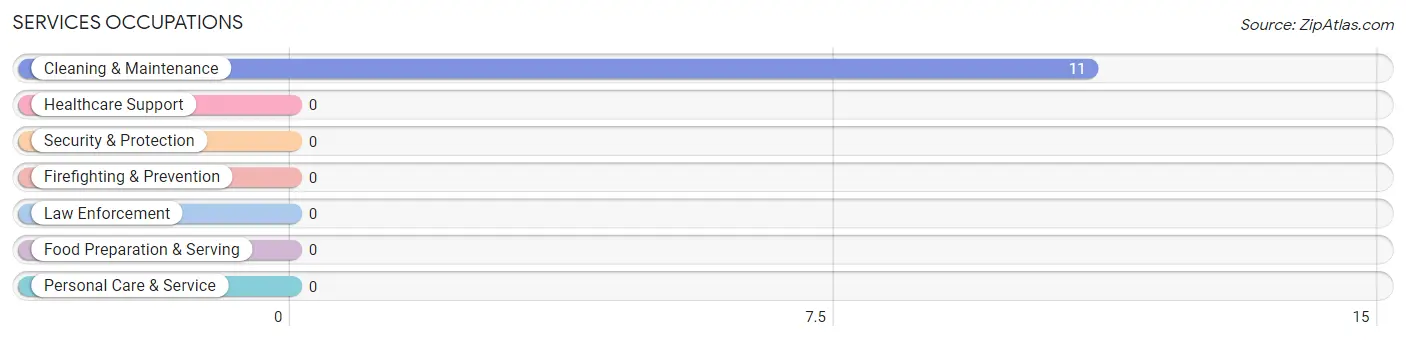
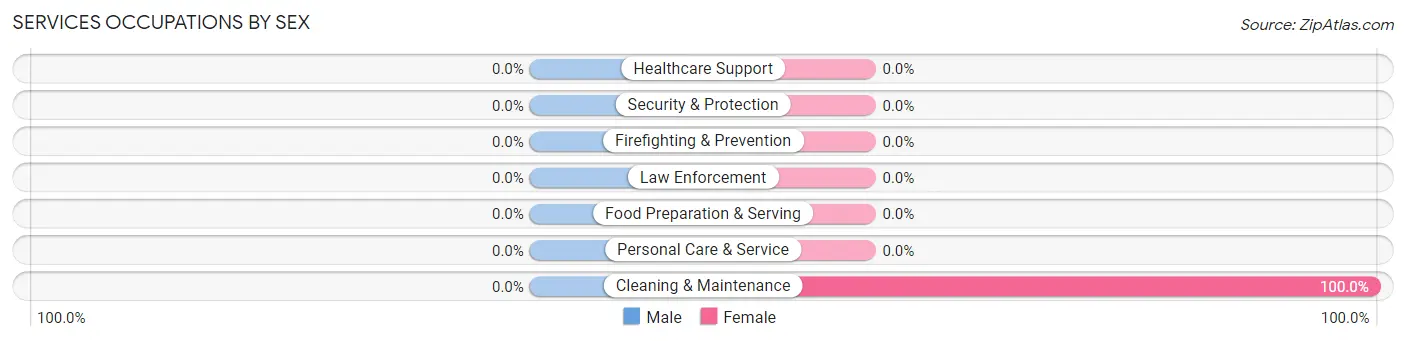
Services Occupations
The most common Services occupations in Relampago are , and Cleaning & Maintenance (11 | 7.0%).
Services Occupations by Sex
| Occupation | Male | Female |
| Healthcare Support | 0 (0.0%) | 0 (0.0%) |
| Security & Protection | 0 (0.0%) | 0 (0.0%) |
| Firefighting & Prevention | 0 (0.0%) | 0 (0.0%) |
| Law Enforcement | 0 (0.0%) | 0 (0.0%) |
| Food Preparation & Serving | 0 (0.0%) | 0 (0.0%) |
| Cleaning & Maintenance | 0 (0.0%) | 11 (100.0%) |
| Personal Care & Service | 0 (0.0%) | 0 (0.0%) |
| Total (Category) | 0 (0.0%) | 11 (100.0%) |
| Total (Overall) | 35 (22.4%) | 121 (77.6%) |
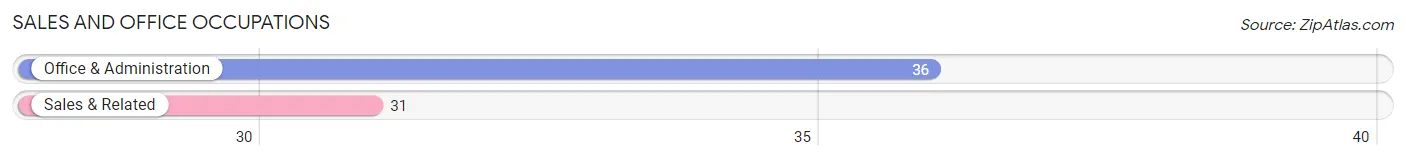
Sales and Office Occupations
The most common Sales and Office occupations in Relampago are Office & Administration (36 | 23.1%), and Sales & Related (31 | 19.9%).
Sales and Office Occupations by Sex
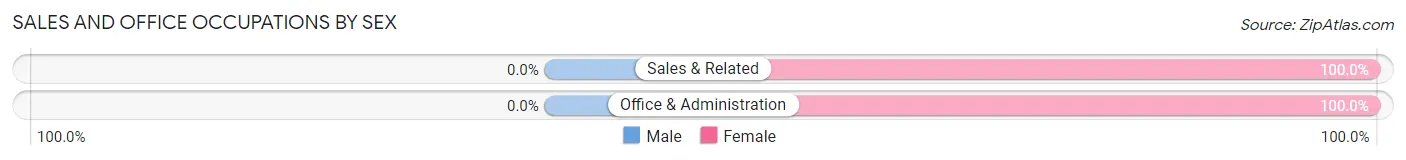
| Occupation | Male | Female |
| Sales & Related | 0 (0.0%) | 31 (100.0%) |
| Office & Administration | 0 (0.0%) | 36 (100.0%) |
| Total (Category) | 0 (0.0%) | 67 (100.0%) |
| Total (Overall) | 35 (22.4%) | 121 (77.6%) |
Natural Resources, Construction and Maintenance Occupations
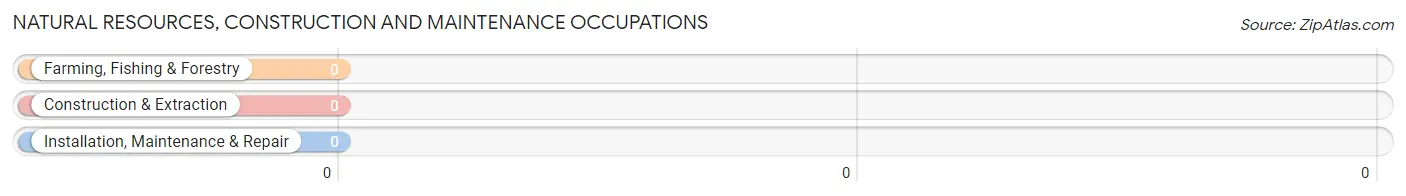
Natural Resources, Construction and Maintenance Occupations by Sex
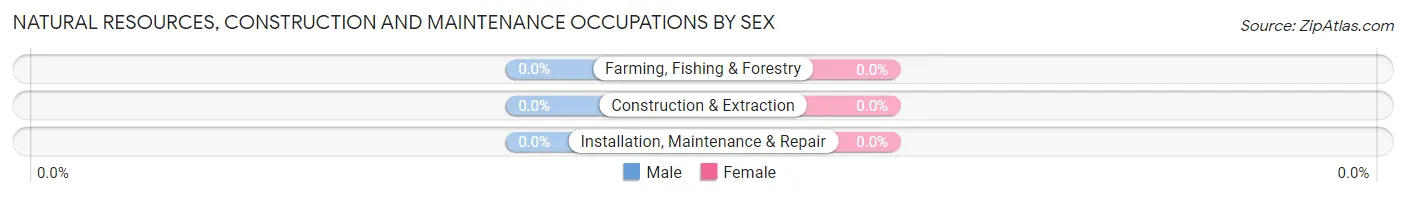
| Occupation | Male | Female |
| Farming, Fishing & Forestry | 0 (0.0%) | 0 (0.0%) |
| Construction & Extraction | 0 (0.0%) | 0 (0.0%) |
| Installation, Maintenance & Repair | 0 (0.0%) | 0 (0.0%) |
| Total (Category) | 0 (0.0%) | 0 (0.0%) |
| Total (Overall) | 35 (22.4%) | 121 (77.6%) |
Production, Transportation and Moving Occupations
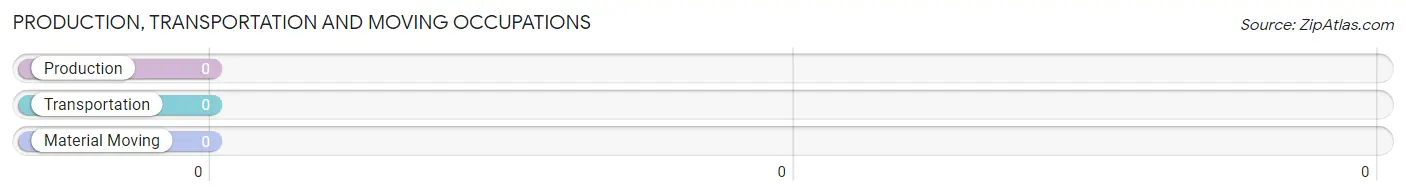
Production, Transportation and Moving Occupations by Sex
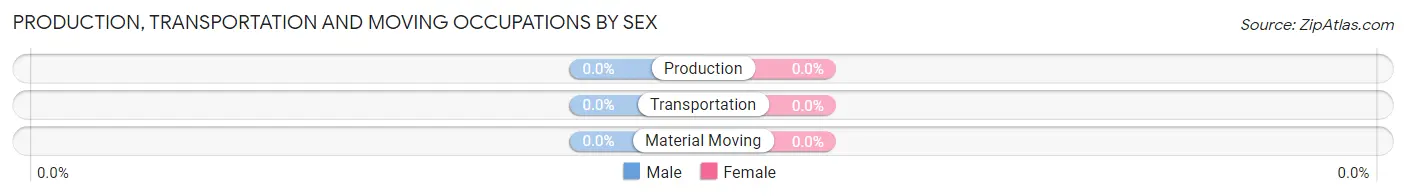
| Occupation | Male | Female |
| Production | 0 (0.0%) | 0 (0.0%) |
| Transportation | 0 (0.0%) | 0 (0.0%) |
| Material Moving | 0 (0.0%) | 0 (0.0%) |
| Total (Category) | 0 (0.0%) | 0 (0.0%) |
| Total (Overall) | 35 (22.4%) | 121 (77.6%) |
Employment Industries by Sex in Relampago
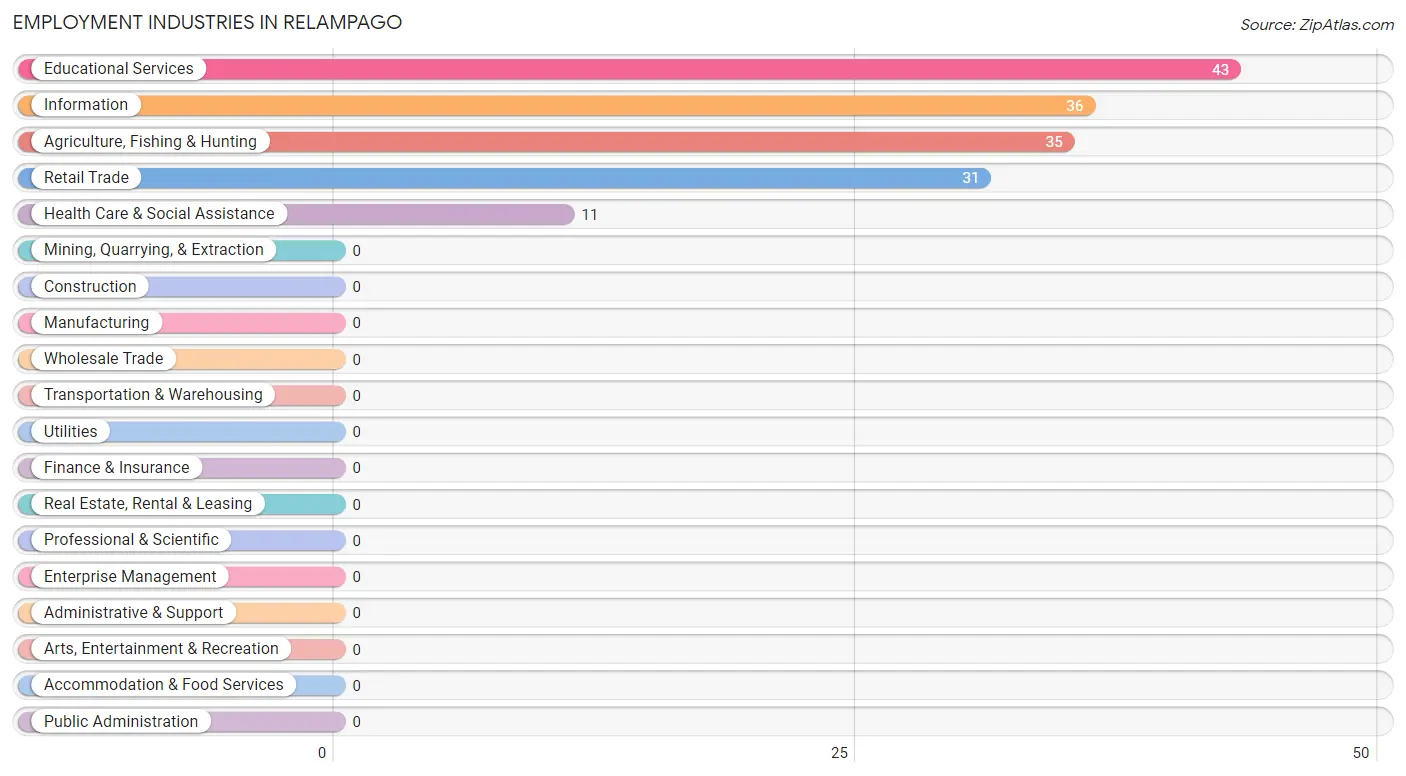
Employment Industries in Relampago
The major employment industries in Relampago include Educational Services (43 | 27.6%), Information (36 | 23.1%), Agriculture, Fishing & Hunting (35 | 22.4%), Retail Trade (31 | 19.9%), and Health Care & Social Assistance (11 | 7.0%).
Employment Industries by Sex in Relampago
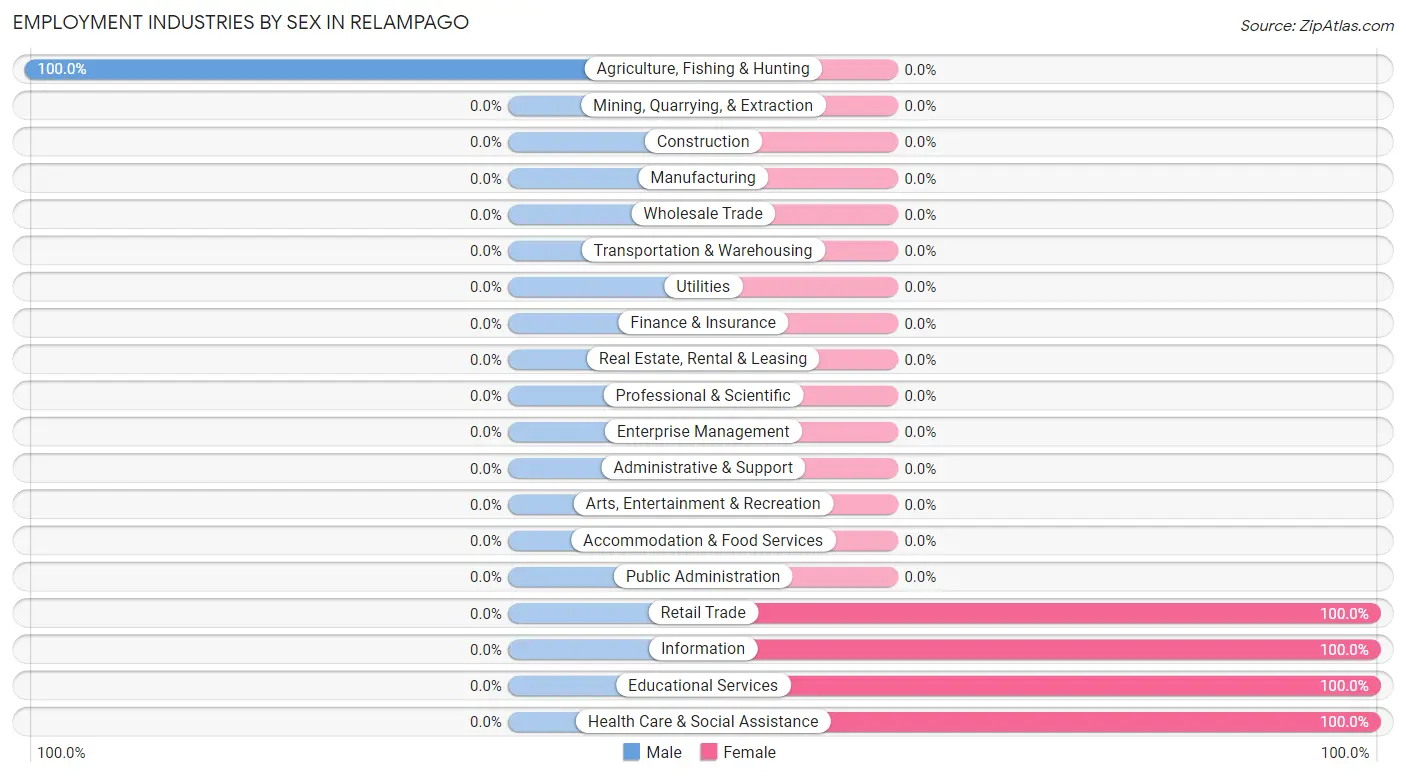
| Industry | Male | Female |
| Agriculture, Fishing & Hunting | 35 (100.0%) | 0 (0.0%) |
| Mining, Quarrying, & Extraction | 0 (0.0%) | 0 (0.0%) |
| Construction | 0 (0.0%) | 0 (0.0%) |
| Manufacturing | 0 (0.0%) | 0 (0.0%) |
| Wholesale Trade | 0 (0.0%) | 0 (0.0%) |
| Retail Trade | 0 (0.0%) | 31 (100.0%) |
| Transportation & Warehousing | 0 (0.0%) | 0 (0.0%) |
| Utilities | 0 (0.0%) | 0 (0.0%) |
| Information | 0 (0.0%) | 36 (100.0%) |
| Finance & Insurance | 0 (0.0%) | 0 (0.0%) |
| Real Estate, Rental & Leasing | 0 (0.0%) | 0 (0.0%) |
| Professional & Scientific | 0 (0.0%) | 0 (0.0%) |
| Enterprise Management | 0 (0.0%) | 0 (0.0%) |
| Administrative & Support | 0 (0.0%) | 0 (0.0%) |
| Educational Services | 0 (0.0%) | 43 (100.0%) |
| Health Care & Social Assistance | 0 (0.0%) | 11 (100.0%) |
| Arts, Entertainment & Recreation | 0 (0.0%) | 0 (0.0%) |
| Accommodation & Food Services | 0 (0.0%) | 0 (0.0%) |
| Public Administration | 0 (0.0%) | 0 (0.0%) |
| Total | 35 (22.4%) | 121 (77.6%) |
Education in Relampago
School Enrollment in Relampago
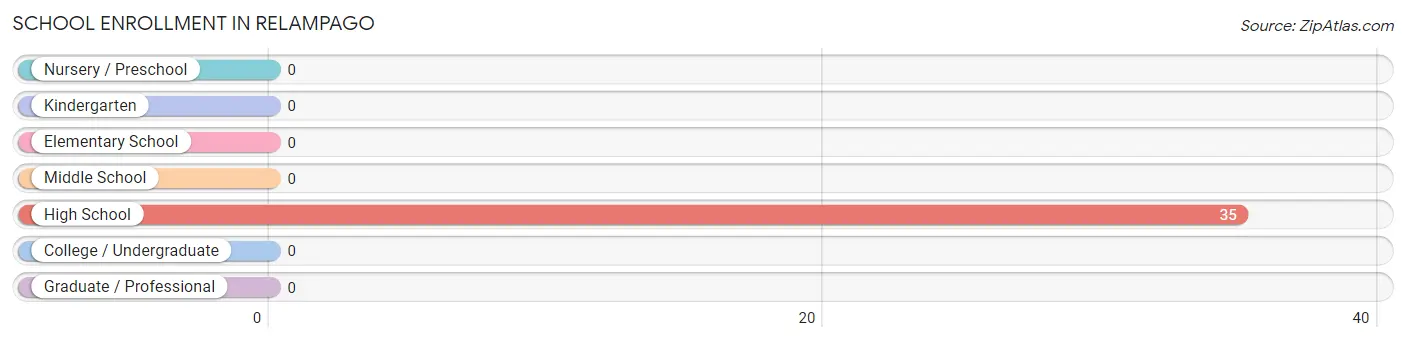
| School Level | # Students | % Students |
| Nursery / Preschool | 0 | 0.0% |
| Kindergarten | 0 | 0.0% |
| Elementary School | 0 | 0.0% |
| Middle School | 0 | 0.0% |
| High School | 35 | 100.0% |
| College / Undergraduate | 0 | 0.0% |
| Graduate / Professional | 0 | 0.0% |
| Total | 35 | 100.0% |
School Enrollment by Age by Funding Source in Relampago
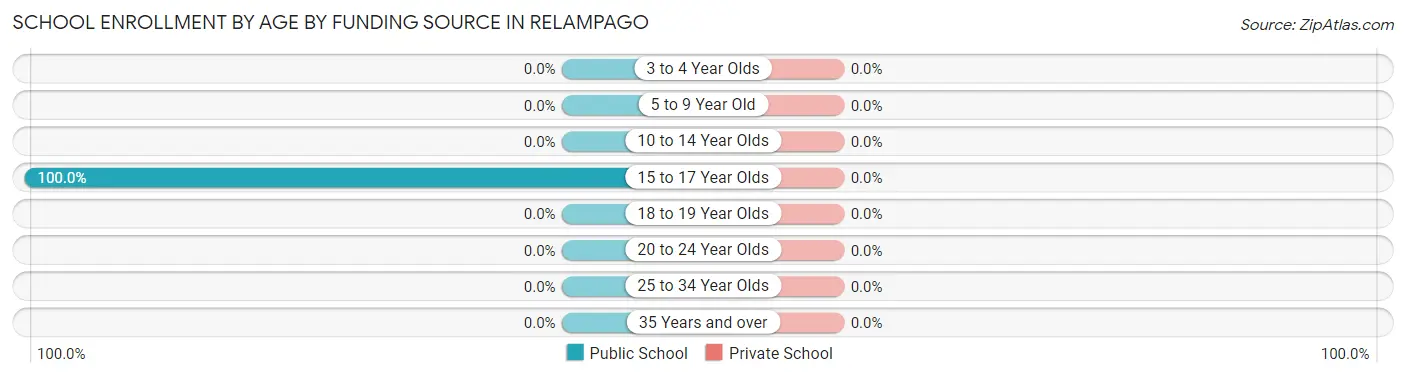
| Age Bracket | Public School | Private School |
| 3 to 4 Year Olds | 0 (0.0%) | 0 (0.0%) |
| 5 to 9 Year Old | 0 (0.0%) | 0 (0.0%) |
| 10 to 14 Year Olds | 0 (0.0%) | 0 (0.0%) |
| 15 to 17 Year Olds | 35 (100.0%) | 0 (0.0%) |
| 18 to 19 Year Olds | 0 (0.0%) | 0 (0.0%) |
| 20 to 24 Year Olds | 0 (0.0%) | 0 (0.0%) |
| 25 to 34 Year Olds | 0 (0.0%) | 0 (0.0%) |
| 35 Years and over | 0 (0.0%) | 0 (0.0%) |
| Total | 35 (100.0%) | 0 (0.0%) |
Educational Attainment by Field of Study in Relampago
Education (33 | 43.4%), arts & humanities (33 | 43.4%), and bio, nature & agricultural (10 | 13.2%) are the most common fields of study among 76 individuals in Relampago who have obtained a bachelor's degree or higher.
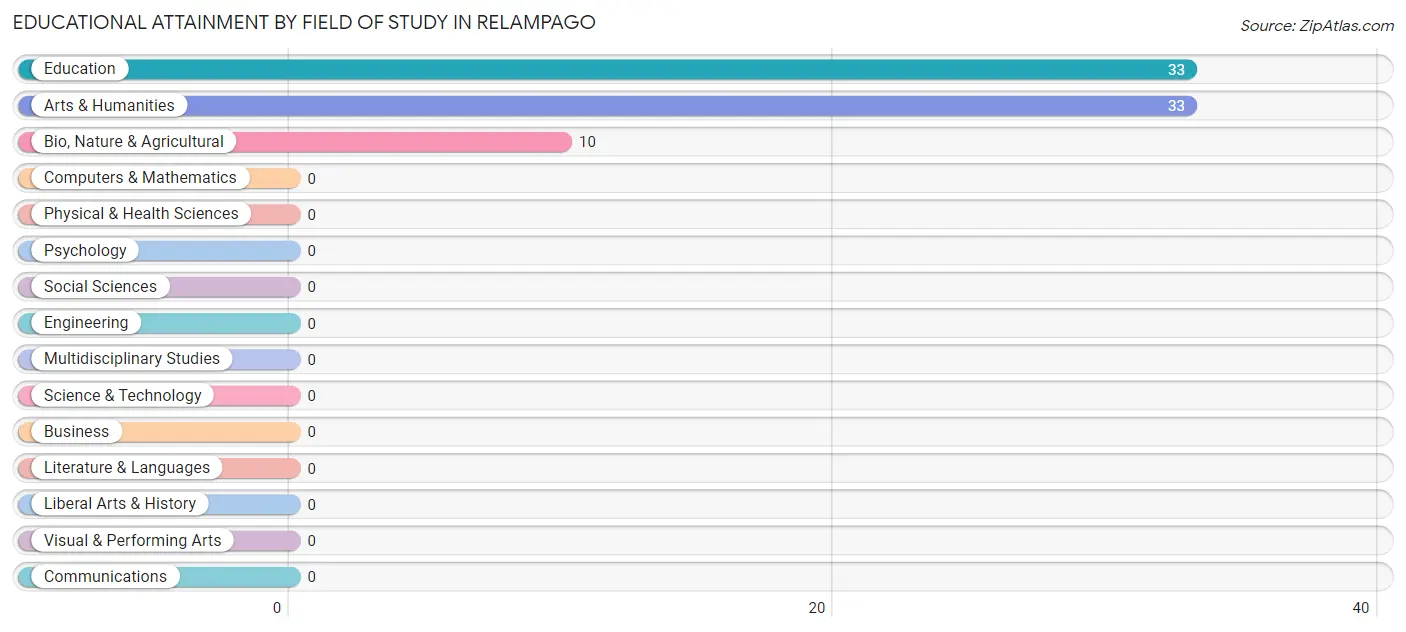
| Field of Study | # Graduates | % Graduates |
| Computers & Mathematics | 0 | 0.0% |
| Bio, Nature & Agricultural | 10 | 13.2% |
| Physical & Health Sciences | 0 | 0.0% |
| Psychology | 0 | 0.0% |
| Social Sciences | 0 | 0.0% |
| Engineering | 0 | 0.0% |
| Multidisciplinary Studies | 0 | 0.0% |
| Science & Technology | 0 | 0.0% |
| Business | 0 | 0.0% |
| Education | 33 | 43.4% |
| Literature & Languages | 0 | 0.0% |
| Liberal Arts & History | 0 | 0.0% |
| Visual & Performing Arts | 0 | 0.0% |
| Communications | 0 | 0.0% |
| Arts & Humanities | 33 | 43.4% |
| Total | 76 | 100.0% |
Transportation & Commute in Relampago
Vehicle Availability by Sex in Relampago
The most prevalent vehicle ownership categories in Relampago are males with 3 vehicles (35, accounting for 100.0%) and females with 3 vehicles (31, making up 28.9%).
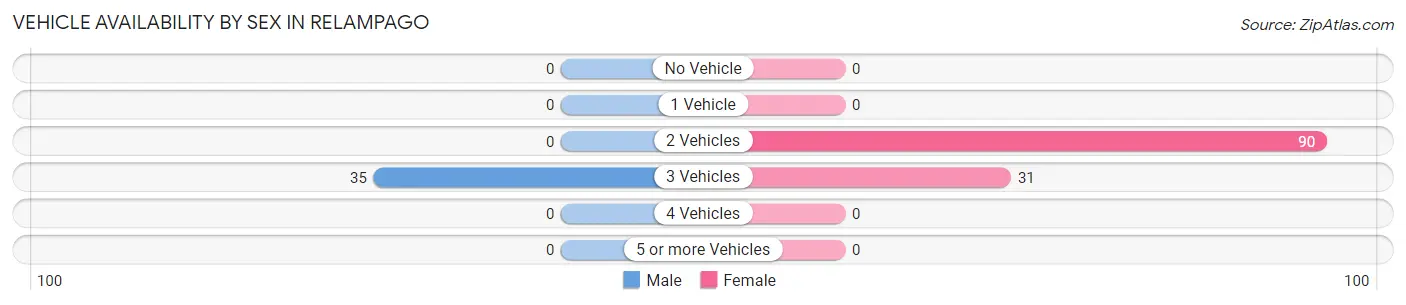
| Vehicles Available | Male | Female |
| No Vehicle | 0 (0.0%) | 0 (0.0%) |
| 1 Vehicle | 0 (0.0%) | 0 (0.0%) |
| 2 Vehicles | 0 (0.0%) | 90 (74.4%) |
| 3 Vehicles | 35 (100.0%) | 31 (25.6%) |
| 4 Vehicles | 0 (0.0%) | 0 (0.0%) |
| 5 or more Vehicles | 0 (0.0%) | 0 (0.0%) |
| Total | 35 (100.0%) | 121 (100.0%) |
Commute Time in Relampago
The most frequently occuring commute durations in Relampago are 20 to 24 minutes (80 commuters, 51.3%), 10 to 14 minutes (35 commuters, 22.4%), and 30 to 34 minutes (31 commuters, 19.9%).
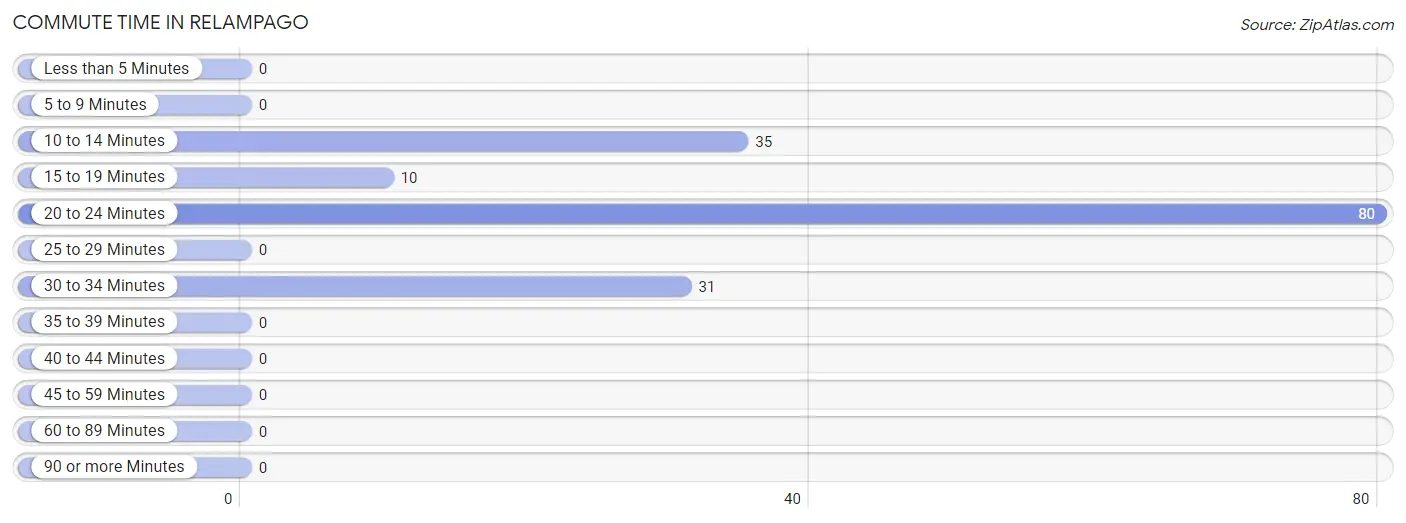
| Commute Time | # Commuters | % Commuters |
| Less than 5 Minutes | 0 | 0.0% |
| 5 to 9 Minutes | 0 | 0.0% |
| 10 to 14 Minutes | 35 | 22.4% |
| 15 to 19 Minutes | 10 | 6.4% |
| 20 to 24 Minutes | 80 | 51.3% |
| 25 to 29 Minutes | 0 | 0.0% |
| 30 to 34 Minutes | 31 | 19.9% |
| 35 to 39 Minutes | 0 | 0.0% |
| 40 to 44 Minutes | 0 | 0.0% |
| 45 to 59 Minutes | 0 | 0.0% |
| 60 to 89 Minutes | 0 | 0.0% |
| 90 or more Minutes | 0 | 0.0% |
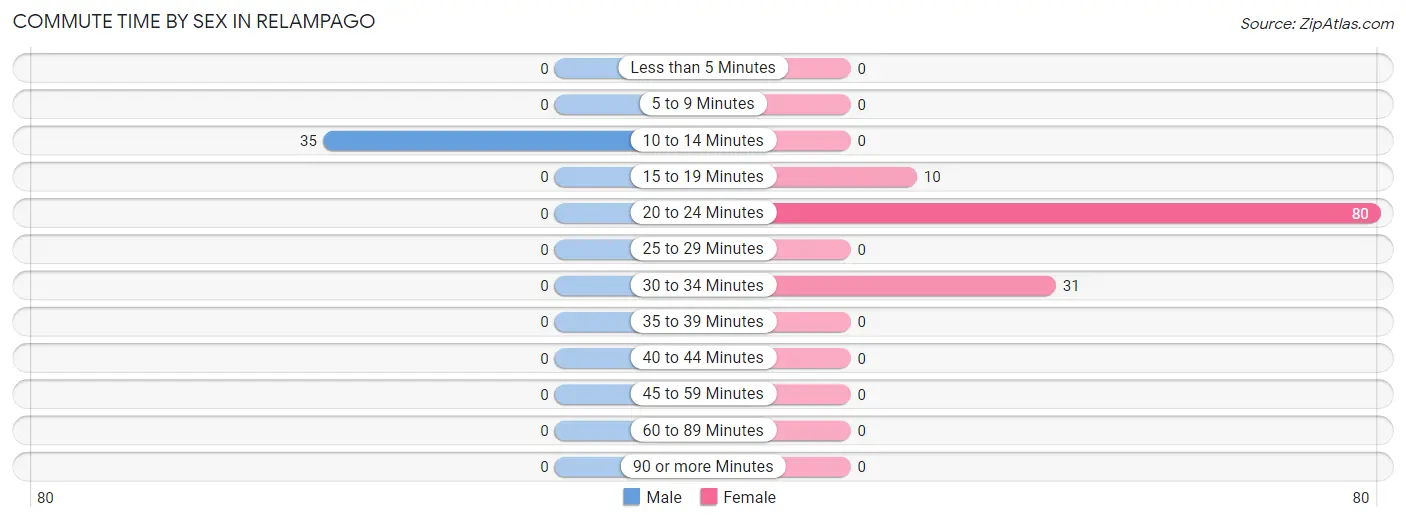
Commute Time by Sex in Relampago
The most common commute times in Relampago are 10 to 14 minutes (35 commuters, 100.0%) for males and 20 to 24 minutes (80 commuters, 66.1%) for females.
| Commute Time | Male | Female |
| Less than 5 Minutes | 0 (0.0%) | 0 (0.0%) |
| 5 to 9 Minutes | 0 (0.0%) | 0 (0.0%) |
| 10 to 14 Minutes | 35 (100.0%) | 0 (0.0%) |
| 15 to 19 Minutes | 0 (0.0%) | 10 (8.3%) |
| 20 to 24 Minutes | 0 (0.0%) | 80 (66.1%) |
| 25 to 29 Minutes | 0 (0.0%) | 0 (0.0%) |
| 30 to 34 Minutes | 0 (0.0%) | 31 (25.6%) |
| 35 to 39 Minutes | 0 (0.0%) | 0 (0.0%) |
| 40 to 44 Minutes | 0 (0.0%) | 0 (0.0%) |
| 45 to 59 Minutes | 0 (0.0%) | 0 (0.0%) |
| 60 to 89 Minutes | 0 (0.0%) | 0 (0.0%) |
| 90 or more Minutes | 0 (0.0%) | 0 (0.0%) |
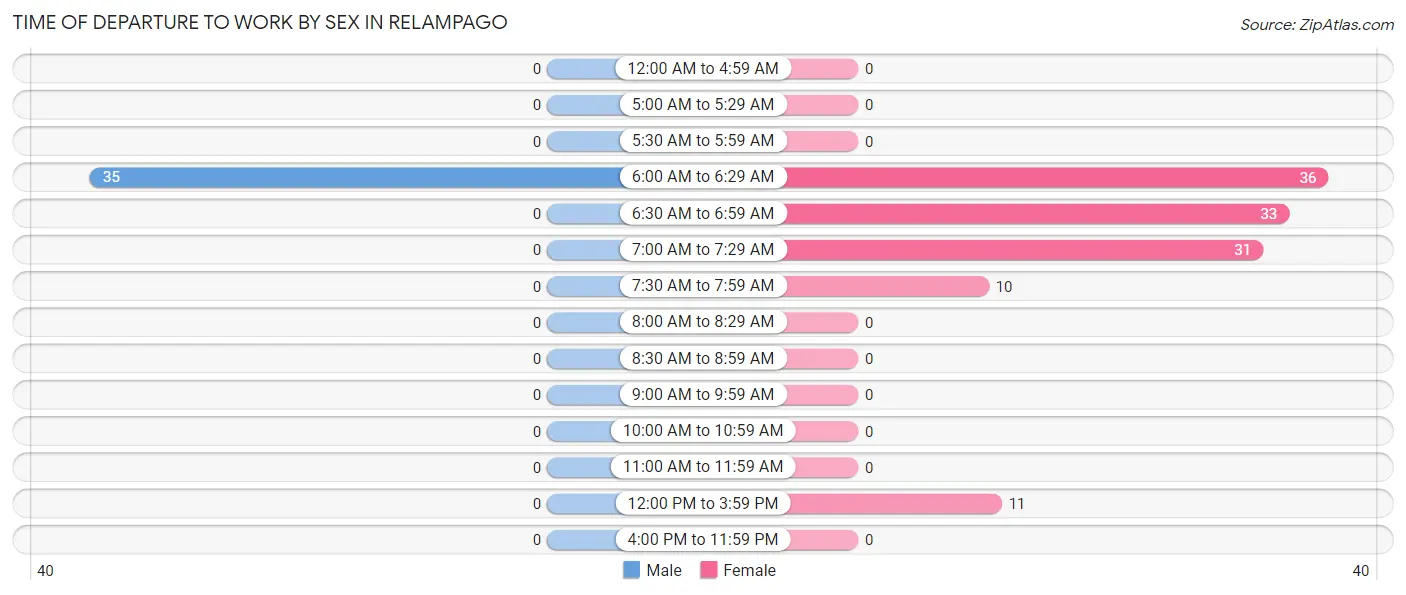
Time of Departure to Work by Sex in Relampago
The most frequent times of departure to work in Relampago are 6:00 AM to 6:29 AM (35, 100.0%) for males and 6:00 AM to 6:29 AM (36, 29.7%) for females.
| Time of Departure | Male | Female |
| 12:00 AM to 4:59 AM | 0 (0.0%) | 0 (0.0%) |
| 5:00 AM to 5:29 AM | 0 (0.0%) | 0 (0.0%) |
| 5:30 AM to 5:59 AM | 0 (0.0%) | 0 (0.0%) |
| 6:00 AM to 6:29 AM | 35 (100.0%) | 36 (29.7%) |
| 6:30 AM to 6:59 AM | 0 (0.0%) | 33 (27.3%) |
| 7:00 AM to 7:29 AM | 0 (0.0%) | 31 (25.6%) |
| 7:30 AM to 7:59 AM | 0 (0.0%) | 10 (8.3%) |
| 8:00 AM to 8:29 AM | 0 (0.0%) | 0 (0.0%) |
| 8:30 AM to 8:59 AM | 0 (0.0%) | 0 (0.0%) |
| 9:00 AM to 9:59 AM | 0 (0.0%) | 0 (0.0%) |
| 10:00 AM to 10:59 AM | 0 (0.0%) | 0 (0.0%) |
| 11:00 AM to 11:59 AM | 0 (0.0%) | 0 (0.0%) |
| 12:00 PM to 3:59 PM | 0 (0.0%) | 11 (9.1%) |
| 4:00 PM to 11:59 PM | 0 (0.0%) | 0 (0.0%) |
| Total | 35 (100.0%) | 121 (100.0%) |
Housing Occupancy in Relampago
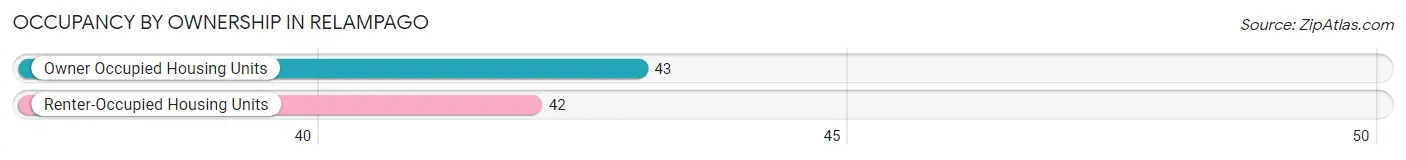
Occupancy by Ownership in Relampago
Of the total 85 dwellings in Relampago, owner-occupied units account for 43 (50.6%), while renter-occupied units make up 42 (49.4%).
| Occupancy | # Housing Units | % Housing Units |
| Owner Occupied Housing Units | 43 | 50.6% |
| Renter-Occupied Housing Units | 42 | 49.4% |
| Total Occupied Housing Units | 85 | 100.0% |
Occupancy by Household Size in Relampago
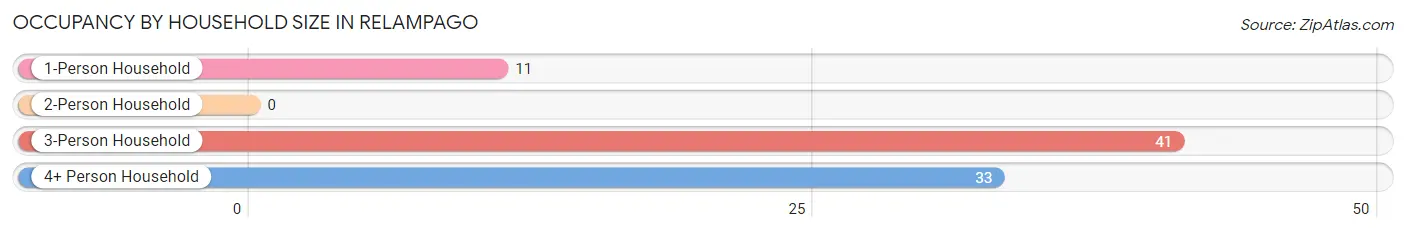
| Household Size | # Housing Units | % Housing Units |
| 1-Person Household | 11 | 12.9% |
| 2-Person Household | 0 | 0.0% |
| 3-Person Household | 41 | 48.2% |
| 4+ Person Household | 33 | 38.8% |
| Total Housing Units | 85 | 100.0% |
Occupancy by Ownership by Household Size in Relampago
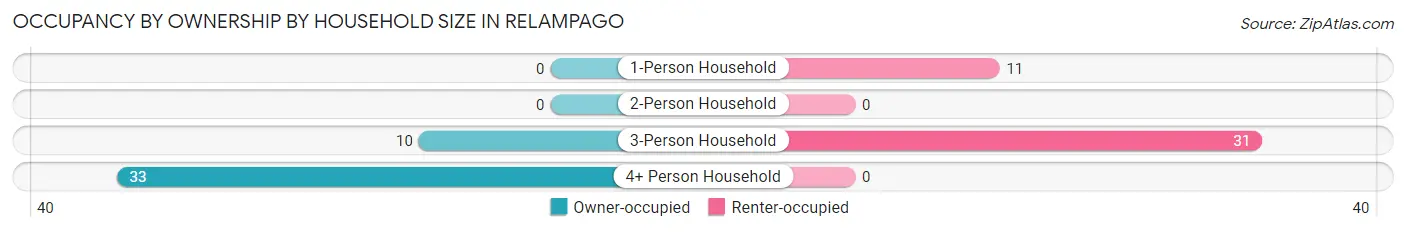
| Household Size | Owner-occupied | Renter-occupied |
| 1-Person Household | 0 (0.0%) | 11 (100.0%) |
| 2-Person Household | 0 (0.0%) | 0 (0.0%) |
| 3-Person Household | 10 (24.4%) | 31 (75.6%) |
| 4+ Person Household | 33 (100.0%) | 0 (0.0%) |
| Total Housing Units | 43 (50.6%) | 42 (49.4%) |
Occupancy by Educational Attainment in Relampago
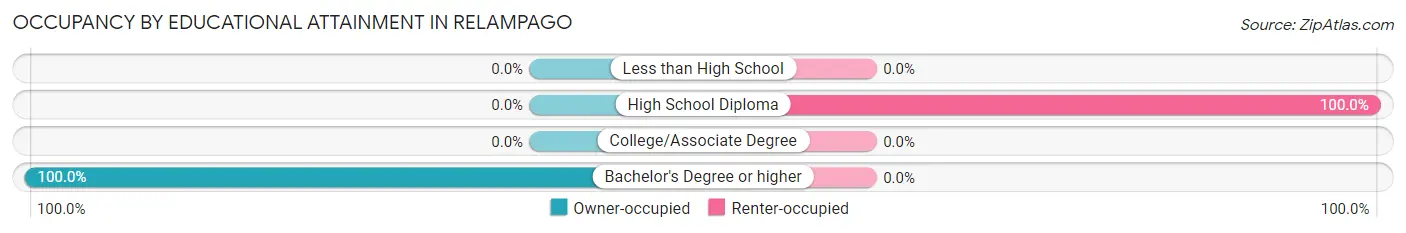
| Household Size | Owner-occupied | Renter-occupied |
| Less than High School | 0 (0.0%) | 0 (0.0%) |
| High School Diploma | 0 (0.0%) | 42 (100.0%) |
| College/Associate Degree | 0 (0.0%) | 0 (0.0%) |
| Bachelor's Degree or higher | 43 (100.0%) | 0 (0.0%) |
Occupancy by Age of Householder in Relampago
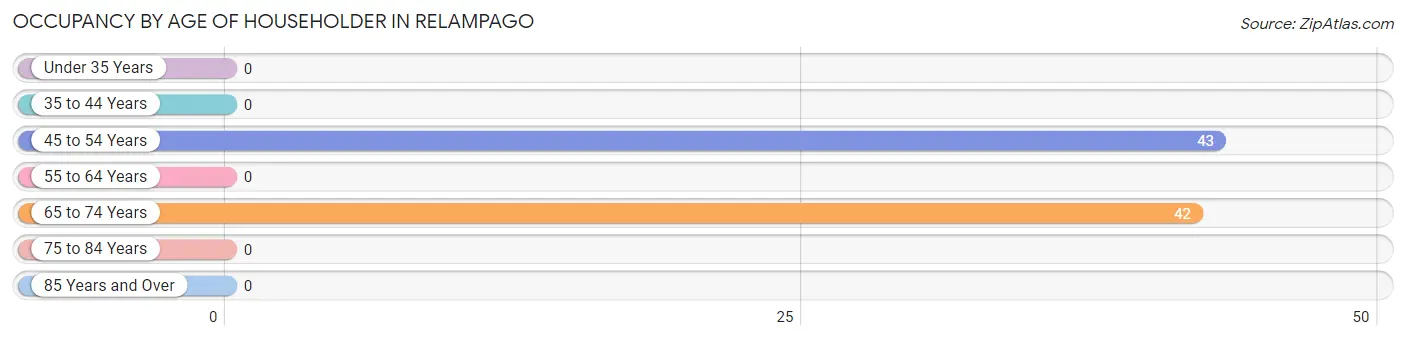
| Age Bracket | # Households | % Households |
| Under 35 Years | 0 | 0.0% |
| 35 to 44 Years | 0 | 0.0% |
| 45 to 54 Years | 43 | 50.6% |
| 55 to 64 Years | 0 | 0.0% |
| 65 to 74 Years | 42 | 49.4% |
| 75 to 84 Years | 0 | 0.0% |
| 85 Years and Over | 0 | 0.0% |
| Total | 85 | 100.0% |
Housing Finances in Relampago
Median Income by Occupancy in Relampago
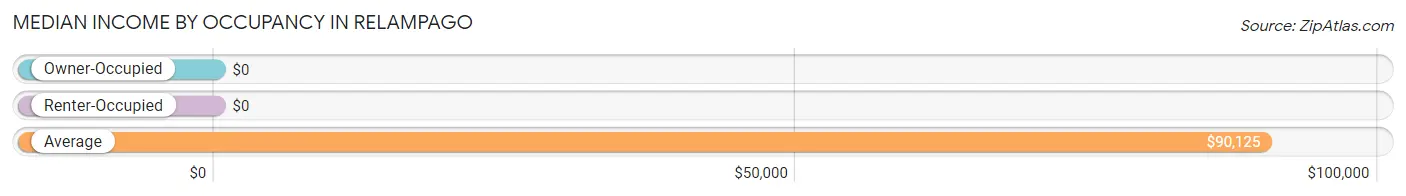
| Occupancy Type | # Households | Median Income |
| Owner-Occupied | 43 (50.6%) | $0 |
| Renter-Occupied | 42 (49.4%) | $0 |
| Average | 85 (100.0%) | $90,125 |
Occupancy by Householder Income Bracket in Relampago
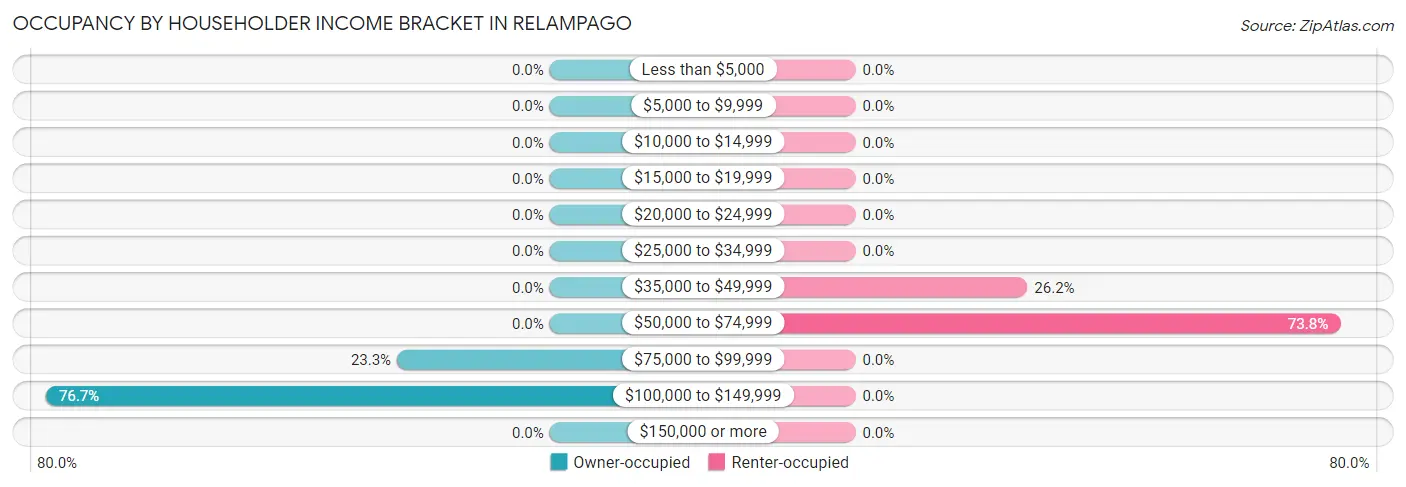
| Income Bracket | Owner-occupied | Renter-occupied |
| Less than $5,000 | 0 (0.0%) | 0 (0.0%) |
| $5,000 to $9,999 | 0 (0.0%) | 0 (0.0%) |
| $10,000 to $14,999 | 0 (0.0%) | 0 (0.0%) |
| $15,000 to $19,999 | 0 (0.0%) | 0 (0.0%) |
| $20,000 to $24,999 | 0 (0.0%) | 0 (0.0%) |
| $25,000 to $34,999 | 0 (0.0%) | 0 (0.0%) |
| $35,000 to $49,999 | 0 (0.0%) | 11 (26.2%) |
| $50,000 to $74,999 | 0 (0.0%) | 31 (73.8%) |
| $75,000 to $99,999 | 10 (23.3%) | 0 (0.0%) |
| $100,000 to $149,999 | 33 (76.7%) | 0 (0.0%) |
| $150,000 or more | 0 (0.0%) | 0 (0.0%) |
| Total | 43 (100.0%) | 42 (100.0%) |
Monthly Housing Cost Tiers in Relampago
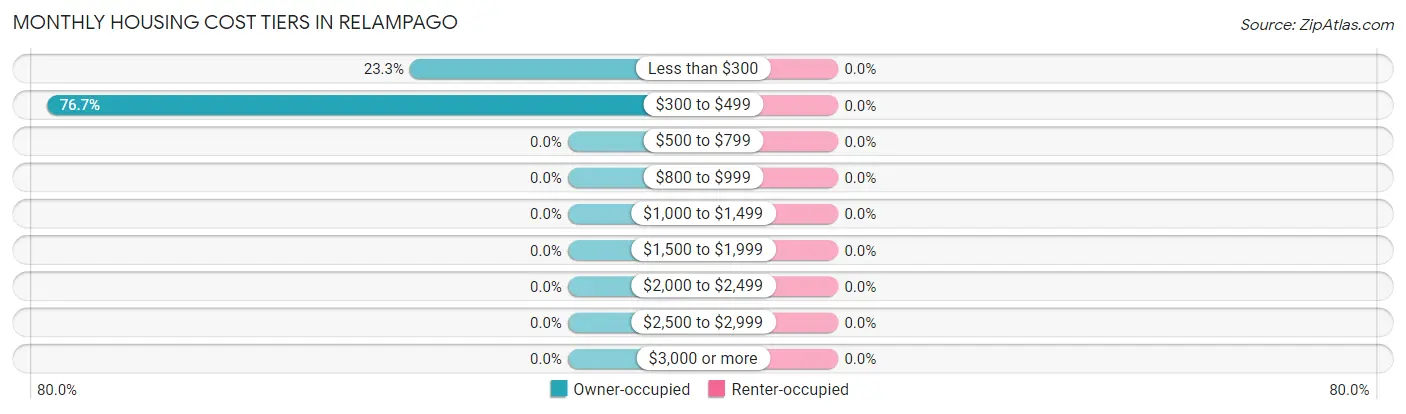
| Monthly Cost | Owner-occupied | Renter-occupied |
| Less than $300 | 10 (23.3%) | 0 (0.0%) |
| $300 to $499 | 33 (76.7%) | 0 (0.0%) |
| $500 to $799 | 0 (0.0%) | 0 (0.0%) |
| $800 to $999 | 0 (0.0%) | 0 (0.0%) |
| $1,000 to $1,499 | 0 (0.0%) | 0 (0.0%) |
| $1,500 to $1,999 | 0 (0.0%) | 0 (0.0%) |
| $2,000 to $2,499 | 0 (0.0%) | 0 (0.0%) |
| $2,500 to $2,999 | 0 (0.0%) | 0 (0.0%) |
| $3,000 or more | 0 (0.0%) | 0 (0.0%) |
| Total | 43 (100.0%) | 42 (100.0%) |
Physical Housing Characteristics in Relampago
Housing Structures in Relampago
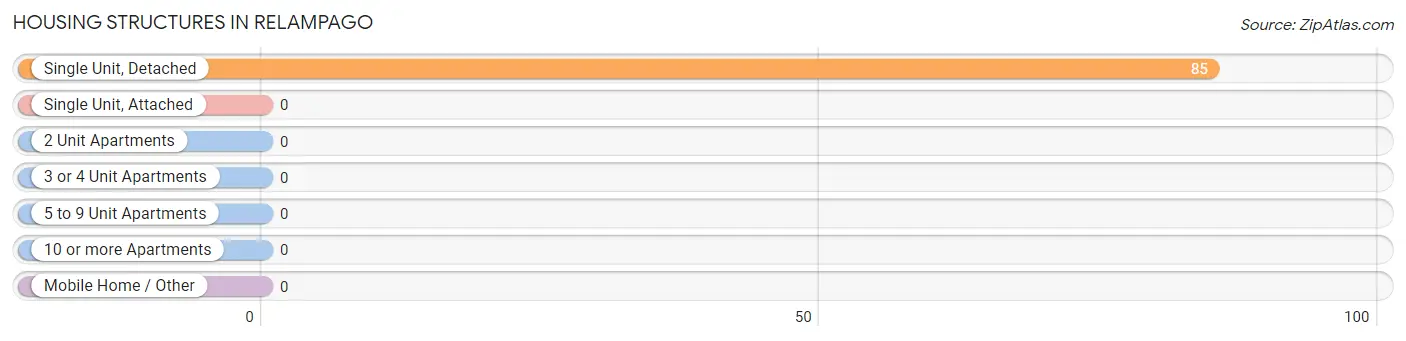
| Structure Type | # Housing Units | % Housing Units |
| Single Unit, Detached | 85 | 100.0% |
| Single Unit, Attached | 0 | 0.0% |
| 2 Unit Apartments | 0 | 0.0% |
| 3 or 4 Unit Apartments | 0 | 0.0% |
| 5 to 9 Unit Apartments | 0 | 0.0% |
| 10 or more Apartments | 0 | 0.0% |
| Mobile Home / Other | 0 | 0.0% |
| Total | 85 | 100.0% |
Housing Structures by Occupancy in Relampago
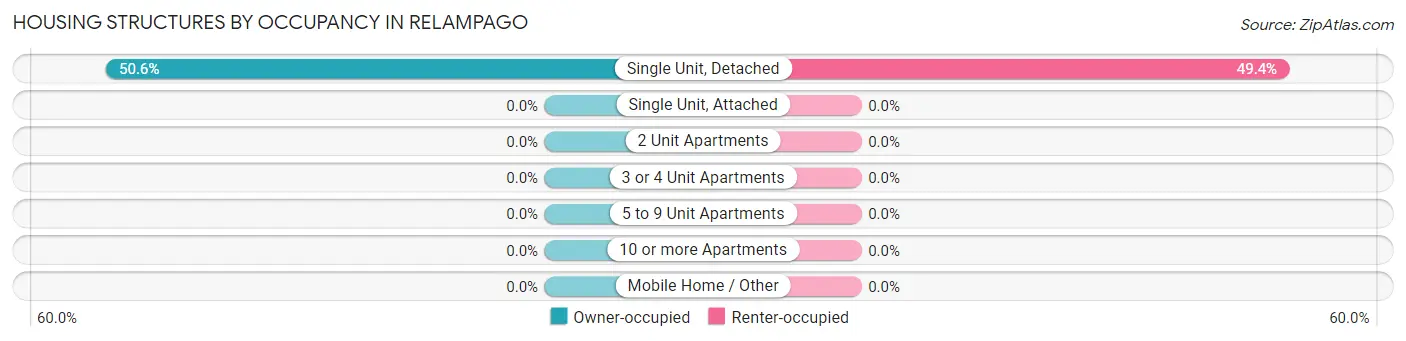
| Structure Type | Owner-occupied | Renter-occupied |
| Single Unit, Detached | 43 (50.6%) | 42 (49.4%) |
| Single Unit, Attached | 0 (0.0%) | 0 (0.0%) |
| 2 Unit Apartments | 0 (0.0%) | 0 (0.0%) |
| 3 or 4 Unit Apartments | 0 (0.0%) | 0 (0.0%) |
| 5 to 9 Unit Apartments | 0 (0.0%) | 0 (0.0%) |
| 10 or more Apartments | 0 (0.0%) | 0 (0.0%) |
| Mobile Home / Other | 0 (0.0%) | 0 (0.0%) |
| Total | 43 (50.6%) | 42 (49.4%) |
Housing Structures by Number of Rooms in Relampago
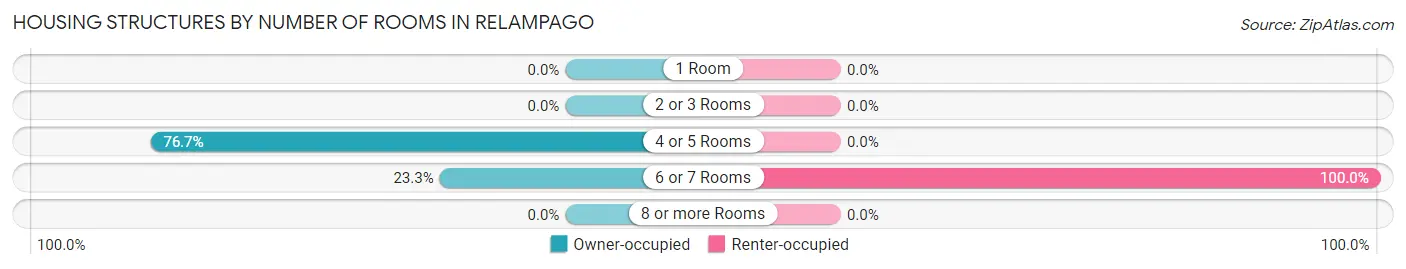
| Number of Rooms | Owner-occupied | Renter-occupied |
| 1 Room | 0 (0.0%) | 0 (0.0%) |
| 2 or 3 Rooms | 0 (0.0%) | 0 (0.0%) |
| 4 or 5 Rooms | 33 (76.7%) | 0 (0.0%) |
| 6 or 7 Rooms | 10 (23.3%) | 42 (100.0%) |
| 8 or more Rooms | 0 (0.0%) | 0 (0.0%) |
| Total | 43 (100.0%) | 42 (100.0%) |
Housing Structure by Heating Type in Relampago
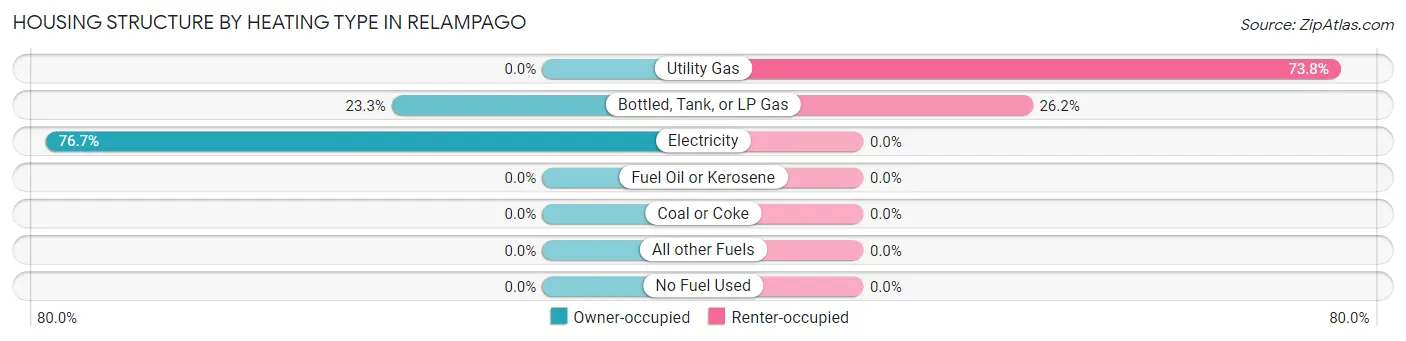
| Heating Type | Owner-occupied | Renter-occupied |
| Utility Gas | 0 (0.0%) | 31 (73.8%) |
| Bottled, Tank, or LP Gas | 10 (23.3%) | 11 (26.2%) |
| Electricity | 33 (76.7%) | 0 (0.0%) |
| Fuel Oil or Kerosene | 0 (0.0%) | 0 (0.0%) |
| Coal or Coke | 0 (0.0%) | 0 (0.0%) |
| All other Fuels | 0 (0.0%) | 0 (0.0%) |
| No Fuel Used | 0 (0.0%) | 0 (0.0%) |
| Total | 43 (100.0%) | 42 (100.0%) |
Household Vehicle Usage in Relampago
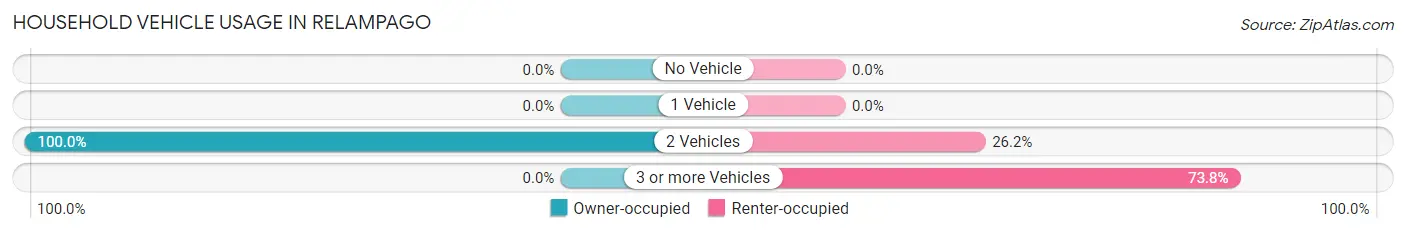
| Vehicles per Household | Owner-occupied | Renter-occupied |
| No Vehicle | 0 (0.0%) | 0 (0.0%) |
| 1 Vehicle | 0 (0.0%) | 0 (0.0%) |
| 2 Vehicles | 43 (100.0%) | 11 (26.2%) |
| 3 or more Vehicles | 0 (0.0%) | 31 (73.8%) |
| Total | 43 (100.0%) | 42 (100.0%) |
Real Estate & Mortgages in Relampago
Real Estate and Mortgage Overview in Relampago
| Characteristic | Without Mortgage | With Mortgage |
| Housing Units | 43 | 0 |
| Median Property Value | - | - |
| Median Household Income | - | - |
| Monthly Housing Costs | - | - |
| Real Estate Taxes | - | - |
Property Value by Mortgage Status in Relampago
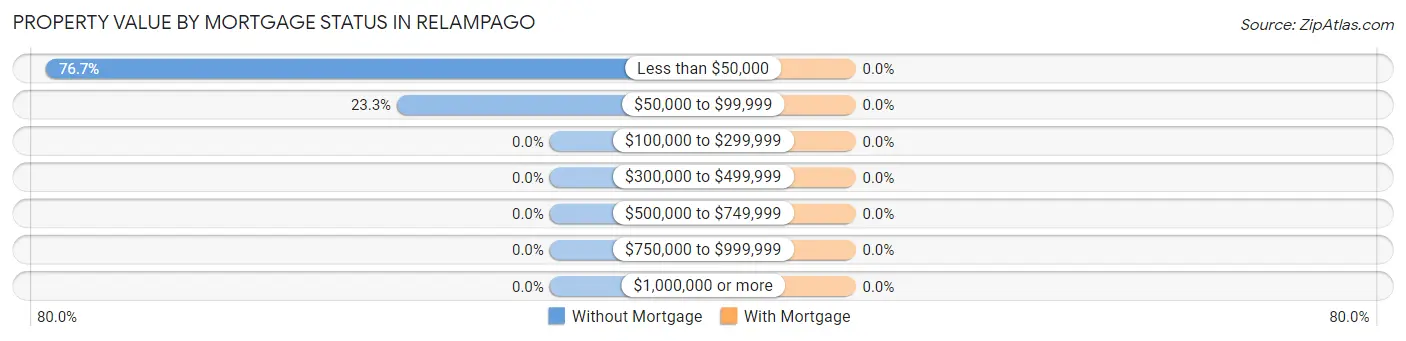
| Property Value | Without Mortgage | With Mortgage |
| Less than $50,000 | 33 (76.7%) | 0 (0.0%) |
| $50,000 to $99,999 | 10 (23.3%) | 0 (0.0%) |
| $100,000 to $299,999 | 0 (0.0%) | 0 (0.0%) |
| $300,000 to $499,999 | 0 (0.0%) | 0 (0.0%) |
| $500,000 to $749,999 | 0 (0.0%) | 0 (0.0%) |
| $750,000 to $999,999 | 0 (0.0%) | 0 (0.0%) |
| $1,000,000 or more | 0 (0.0%) | 0 (0.0%) |
| Total | 43 (100.0%) | 0 (0.0%) |
Household Income by Mortgage Status in Relampago
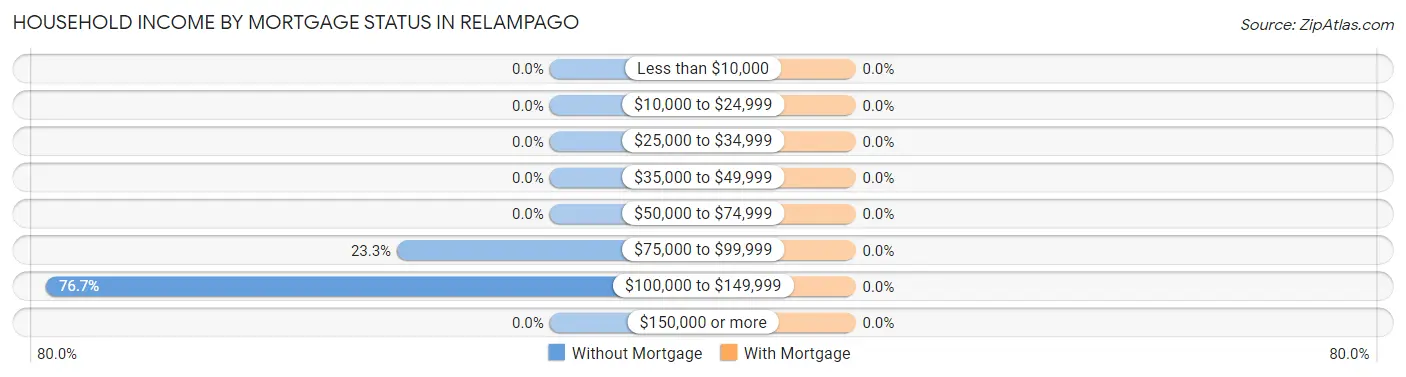
| Household Income | Without Mortgage | With Mortgage |
| Less than $10,000 | 0 (0.0%) | 0 (0.0%) |
| $10,000 to $24,999 | 0 (0.0%) | 0 (0.0%) |
| $25,000 to $34,999 | 0 (0.0%) | 0 (0.0%) |
| $35,000 to $49,999 | 0 (0.0%) | 0 (0.0%) |
| $50,000 to $74,999 | 0 (0.0%) | 0 (0.0%) |
| $75,000 to $99,999 | 10 (23.3%) | 0 (0.0%) |
| $100,000 to $149,999 | 33 (76.7%) | 0 (0.0%) |
| $150,000 or more | 0 (0.0%) | 0 (0.0%) |
| Total | 43 (100.0%) | 0 (0.0%) |
Property Value to Household Income Ratio in Relampago
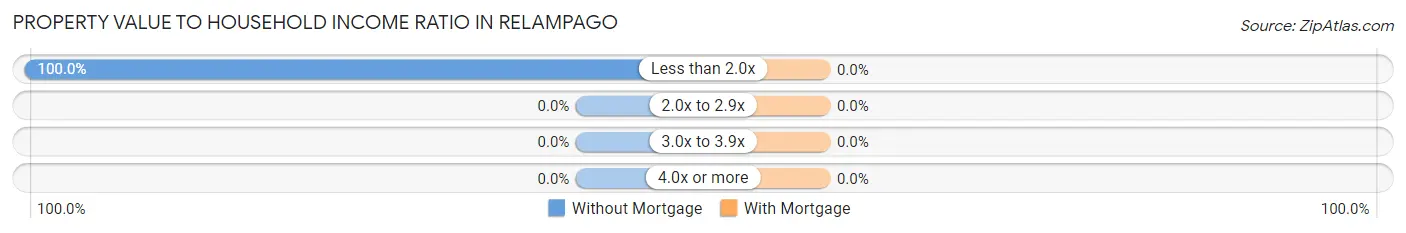
| Value-to-Income Ratio | Without Mortgage | With Mortgage |
| Less than 2.0x | 43 (100.0%) | 0 (0.0%) |
| 2.0x to 2.9x | 0 (0.0%) | 0 (0.0%) |
| 3.0x to 3.9x | 0 (0.0%) | 0 (0.0%) |
| 4.0x or more | 0 (0.0%) | 0 (0.0%) |
| Total | 43 (100.0%) | 0 (0.0%) |
Real Estate Taxes by Mortgage Status in Relampago
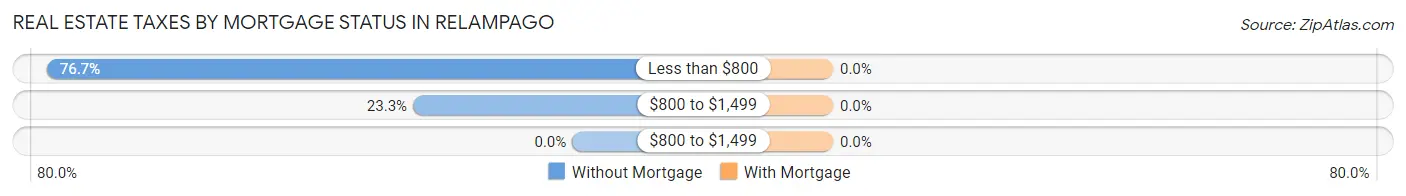
| Property Taxes | Without Mortgage | With Mortgage |
| Less than $800 | 33 (76.7%) | 0 (0.0%) |
| $800 to $1,499 | 10 (23.3%) | 0 (0.0%) |
| $800 to $1,499 | 0 (0.0%) | 0 (0.0%) |
| Total | 43 (100.0%) | 0 (0.0%) |
Health & Disability in Relampago
Health Insurance Coverage by Age in Relampago
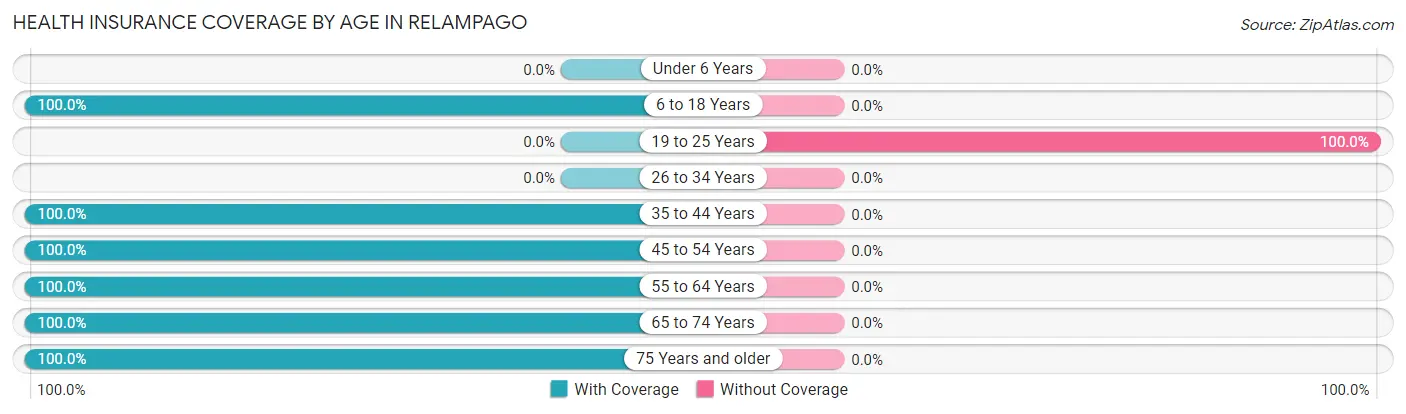
| Age Bracket | With Coverage | Without Coverage |
| Under 6 Years | 0 (0.0%) | 0 (0.0%) |
| 6 to 18 Years | 35 (100.0%) | 0 (0.0%) |
| 19 to 25 Years | 0 (0.0%) | 38 (100.0%) |
| 26 to 34 Years | 0 (0.0%) | 0 (0.0%) |
| 35 to 44 Years | 37 (100.0%) | 0 (0.0%) |
| 45 to 54 Years | 79 (100.0%) | 0 (0.0%) |
| 55 to 64 Years | 13 (100.0%) | 0 (0.0%) |
| 65 to 74 Years | 77 (100.0%) | 0 (0.0%) |
| 75 Years and older | 13 (100.0%) | 0 (0.0%) |
| Total | 254 (87.0%) | 38 (13.0%) |
Health Insurance Coverage by Citizenship Status in Relampago
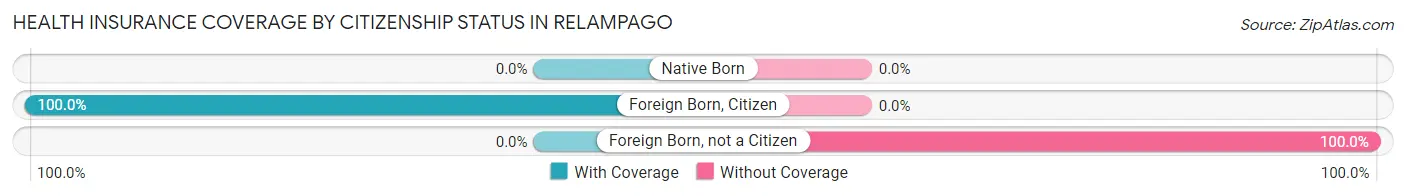
| Citizenship Status | With Coverage | Without Coverage |
| Native Born | 0 (0.0%) | 0 (0.0%) |
| Foreign Born, Citizen | 35 (100.0%) | 0 (0.0%) |
| Foreign Born, not a Citizen | 0 (0.0%) | 38 (100.0%) |
Health Insurance Coverage by Household Income in Relampago
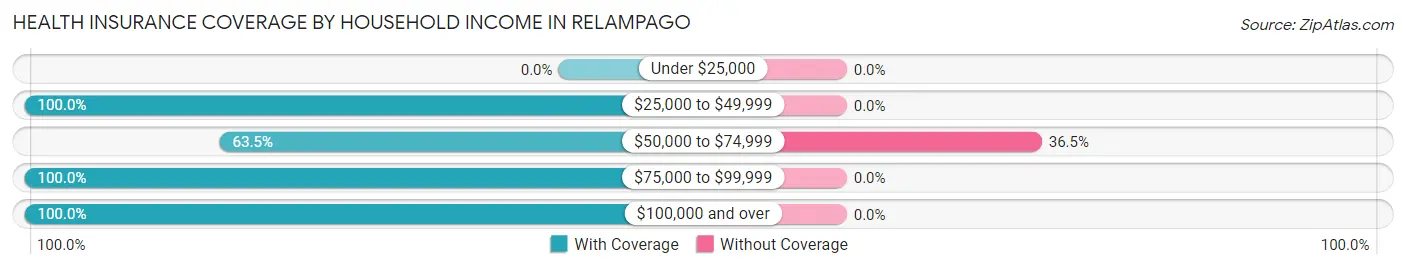
| Household Income | With Coverage | Without Coverage |
| Under $25,000 | 0 (0.0%) | 0 (0.0%) |
| $25,000 to $49,999 | 11 (100.0%) | 0 (0.0%) |
| $50,000 to $74,999 | 66 (63.5%) | 38 (36.5%) |
| $75,000 to $99,999 | 36 (100.0%) | 0 (0.0%) |
| $100,000 and over | 141 (100.0%) | 0 (0.0%) |
Public vs Private Health Insurance Coverage by Age in Relampago
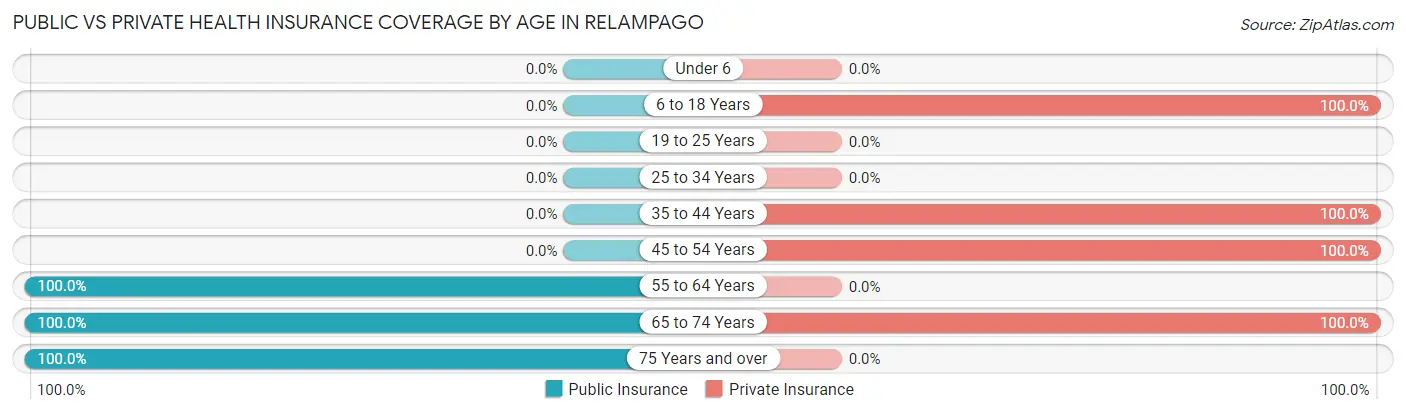
| Age Bracket | Public Insurance | Private Insurance |
| Under 6 | 0 (0.0%) | 0 (0.0%) |
| 6 to 18 Years | 0 (0.0%) | 35 (100.0%) |
| 19 to 25 Years | 0 (0.0%) | 0 (0.0%) |
| 25 to 34 Years | 0 (0.0%) | 0 (0.0%) |
| 35 to 44 Years | 0 (0.0%) | 37 (100.0%) |
| 45 to 54 Years | 0 (0.0%) | 79 (100.0%) |
| 55 to 64 Years | 13 (100.0%) | 0 (0.0%) |
| 65 to 74 Years | 77 (100.0%) | 77 (100.0%) |
| 75 Years and over | 13 (100.0%) | 0 (0.0%) |
| Total | 103 (35.3%) | 228 (78.1%) |
Disability Status by Sex by Age in Relampago
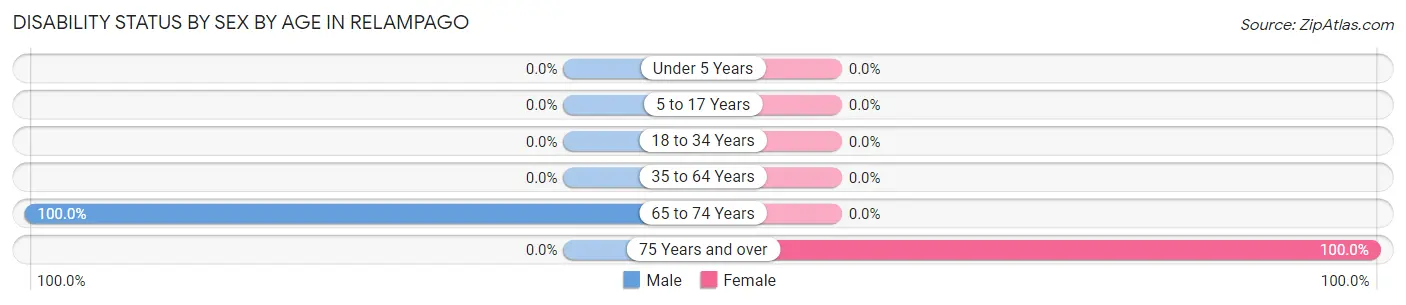
| Age Bracket | Male | Female |
| Under 5 Years | 0 (0.0%) | 0 (0.0%) |
| 5 to 17 Years | 0 (0.0%) | 0 (0.0%) |
| 18 to 34 Years | 0 (0.0%) | 0 (0.0%) |
| 35 to 64 Years | 0 (0.0%) | 0 (0.0%) |
| 65 to 74 Years | 35 (100.0%) | 0 (0.0%) |
| 75 Years and over | 0 (0.0%) | 13 (100.0%) |
Disability Class by Sex by Age in Relampago
Disability Class: Hearing Difficulty
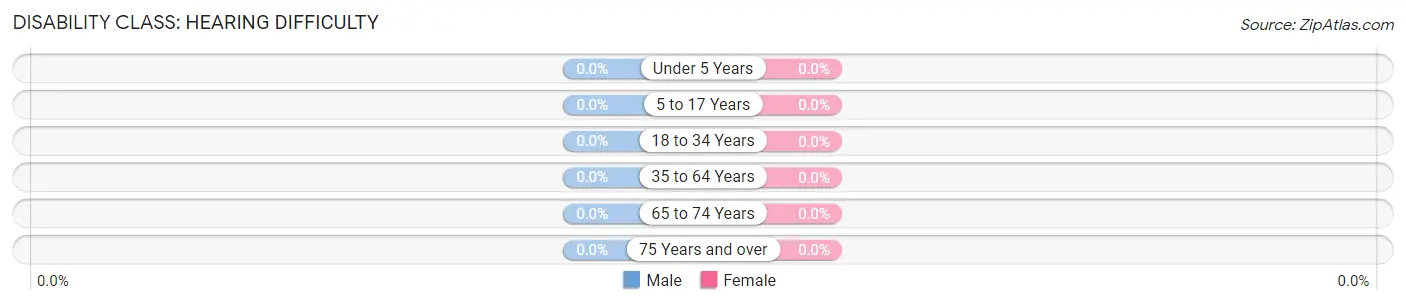
| Age Bracket | Male | Female |
| Under 5 Years | 0 (0.0%) | 0 (0.0%) |
| 5 to 17 Years | 0 (0.0%) | 0 (0.0%) |
| 18 to 34 Years | 0 (0.0%) | 0 (0.0%) |
| 35 to 64 Years | 0 (0.0%) | 0 (0.0%) |
| 65 to 74 Years | 0 (0.0%) | 0 (0.0%) |
| 75 Years and over | 0 (0.0%) | 0 (0.0%) |
Disability Class: Vision Difficulty
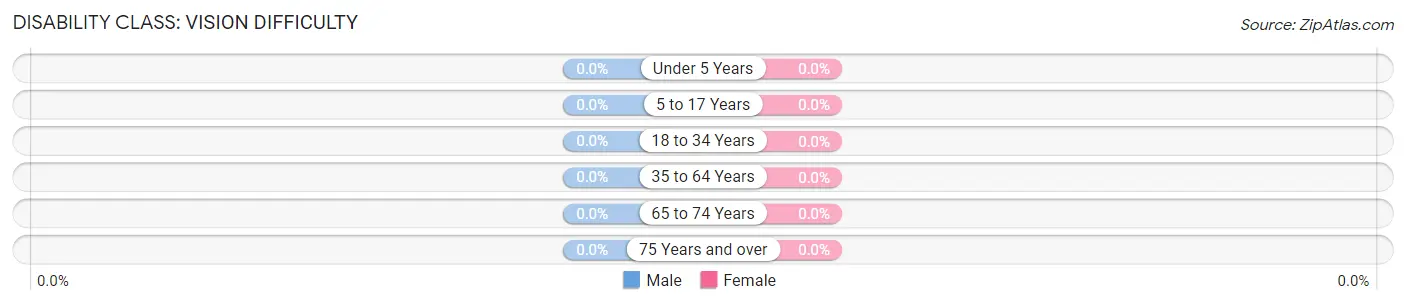
| Age Bracket | Male | Female |
| Under 5 Years | 0 (0.0%) | 0 (0.0%) |
| 5 to 17 Years | 0 (0.0%) | 0 (0.0%) |
| 18 to 34 Years | 0 (0.0%) | 0 (0.0%) |
| 35 to 64 Years | 0 (0.0%) | 0 (0.0%) |
| 65 to 74 Years | 0 (0.0%) | 0 (0.0%) |
| 75 Years and over | 0 (0.0%) | 0 (0.0%) |
Disability Class: Cognitive Difficulty
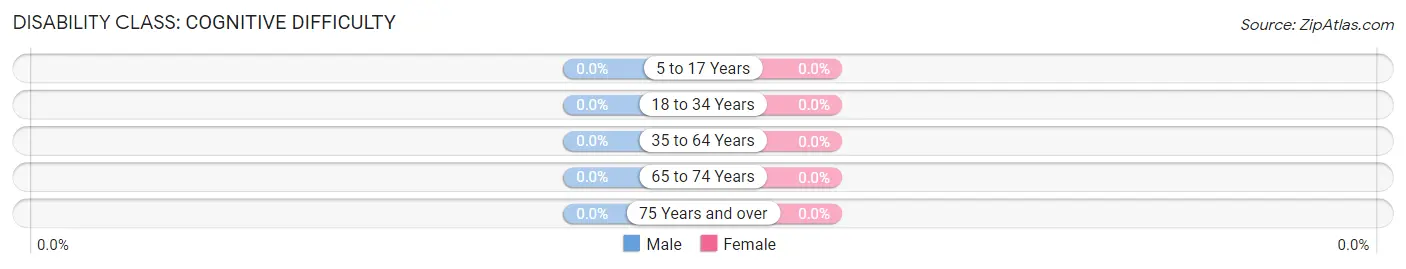
| Age Bracket | Male | Female |
| 5 to 17 Years | 0 (0.0%) | 0 (0.0%) |
| 18 to 34 Years | 0 (0.0%) | 0 (0.0%) |
| 35 to 64 Years | 0 (0.0%) | 0 (0.0%) |
| 65 to 74 Years | 0 (0.0%) | 0 (0.0%) |
| 75 Years and over | 0 (0.0%) | 0 (0.0%) |
Disability Class: Ambulatory Difficulty
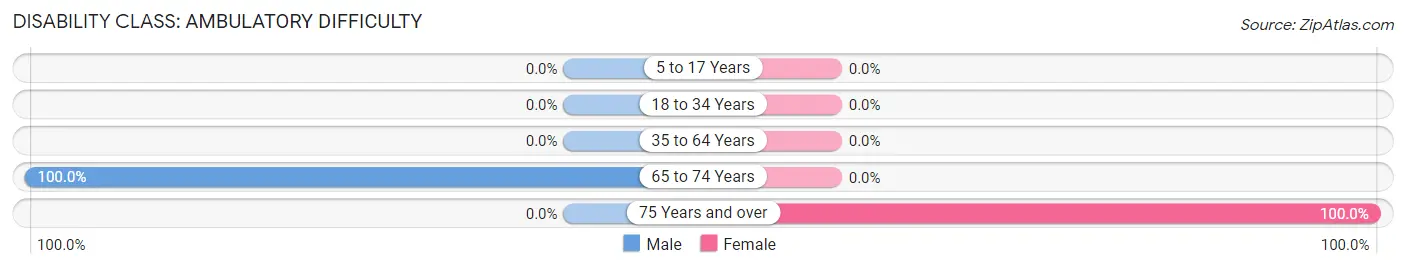
| Age Bracket | Male | Female |
| 5 to 17 Years | 0 (0.0%) | 0 (0.0%) |
| 18 to 34 Years | 0 (0.0%) | 0 (0.0%) |
| 35 to 64 Years | 0 (0.0%) | 0 (0.0%) |
| 65 to 74 Years | 35 (100.0%) | 0 (0.0%) |
| 75 Years and over | 0 (0.0%) | 13 (100.0%) |
Disability Class: Self-Care Difficulty
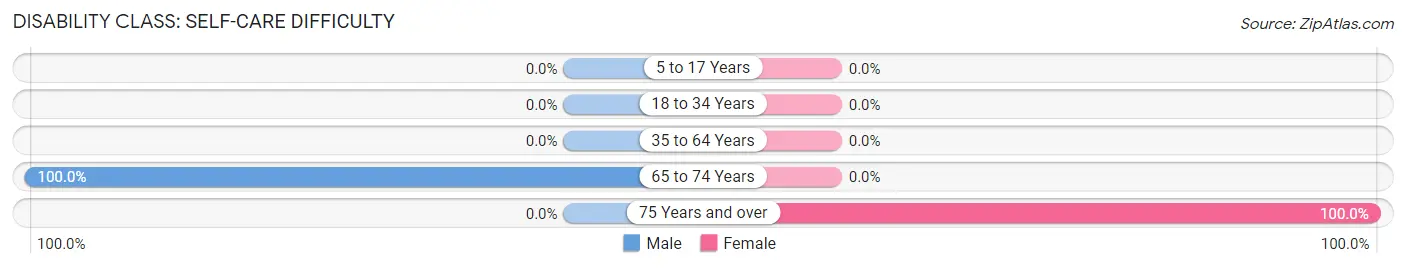
| Age Bracket | Male | Female |
| 5 to 17 Years | 0 (0.0%) | 0 (0.0%) |
| 18 to 34 Years | 0 (0.0%) | 0 (0.0%) |
| 35 to 64 Years | 0 (0.0%) | 0 (0.0%) |
| 65 to 74 Years | 35 (100.0%) | 0 (0.0%) |
| 75 Years and over | 0 (0.0%) | 13 (100.0%) |
Technology Access in Relampago
Computing Device Access in Relampago
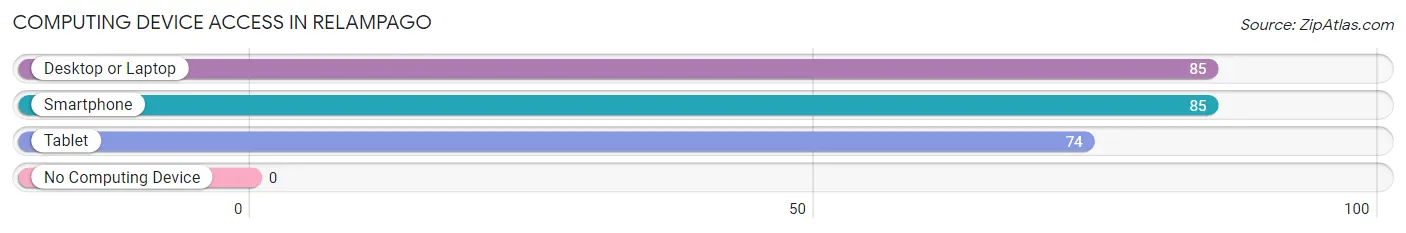
| Device Type | # Households | % Households |
| Desktop or Laptop | 85 | 100.0% |
| Smartphone | 85 | 100.0% |
| Tablet | 74 | 87.1% |
| No Computing Device | 0 | 0.0% |
| Total | 85 | 100.0% |
Internet Access in Relampago
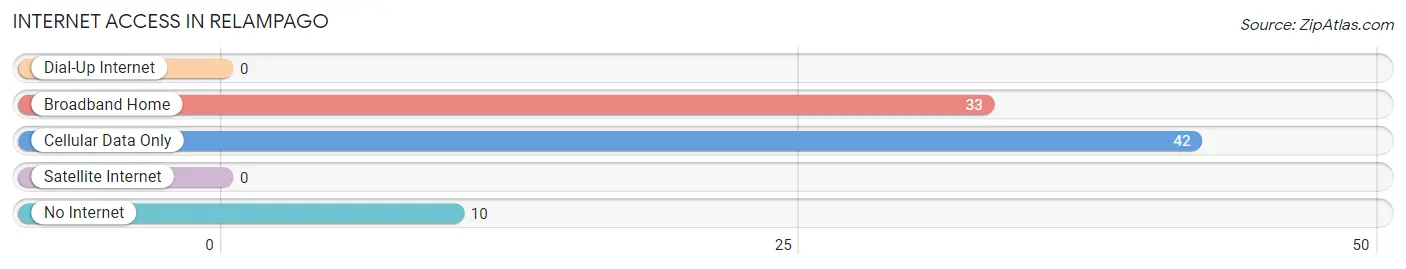
| Internet Type | # Households | % Households |
| Dial-Up Internet | 0 | 0.0% |
| Broadband Home | 33 | 38.8% |
| Cellular Data Only | 42 | 49.4% |
| Satellite Internet | 0 | 0.0% |
| No Internet | 10 | 11.8% |
| Total | 85 | 100.0% |
Relampago Summary
Relampago, Texas is a small unincorporated community located in Webb County, Texas. It is situated on the banks of the Rio Grande, just south of Laredo. The population of Relampago was estimated to be around 1,000 people in 2020.
Geography
Relampago is located in the Rio Grande Valley, a region of South Texas that is known for its rich agricultural land and its proximity to the Rio Grande. The Rio Grande forms the border between the United States and Mexico, and Relampago is located just south of the river. The area is characterized by flat terrain, with the highest elevation being just over 500 feet. The climate is semi-arid, with hot summers and mild winters.
History
Relampago was founded in the late 19th century by Mexican immigrants who were looking for a place to settle and farm. The area was originally known as El Refugio, but the name was changed to Relampago in the early 20th century. The name is derived from the Spanish word for lightning, and it is believed to have been chosen because of the frequent lightning storms in the area.
The town grew slowly over the years, and by the mid-20th century it had become a small farming community. In the late 20th century, the population began to decline as many of the younger residents moved away in search of better opportunities.
Economy
The economy of Relampago is largely based on agriculture. The area is known for its production of cotton, corn, sorghum, and other crops. In addition, the town is home to several small businesses, including a grocery store, a hardware store, and a few restaurants.
Demographics
The population of Relampago is predominantly Hispanic, with over 90% of the population identifying as such. The median household income is around $30,000, and the poverty rate is around 20%. The town is served by the United Independent School District, which provides education to the local children.
Conclusion
Relampago, Texas is a small unincorporated community located in Webb County, Texas. It is situated on the banks of the Rio Grande, just south of Laredo. The population of Relampago was estimated to be around 1,000 people in 2020. The economy of Relampago is largely based on agriculture, and the population is predominantly Hispanic. The town is served by the United Independent School District, which provides education to the local children.
Common Questions
What is Per Capita Income in Relampago?
Per Capita income in Relampago is $23,297.
What is the Median Family Income in Relampago?
Median Family Income in Relampago is $91,500.
What is the Median Household income in Relampago?
Median Household Income in Relampago is $90,125.
What is Inequality or Gini Index in Relampago?
Inequality or Gini Index in Relampago is 0.16.
What is the Total Population of Relampago?
Total Population of Relampago is 292.
What is the Total Male Population of Relampago?
Total Male Population of Relampago is 123.
What is the Total Female Population of Relampago?
Total Female Population of Relampago is 169.
What is the Ratio of Males per 100 Females in Relampago?
There are 72.78 Males per 100 Females in Relampago.
What is the Ratio of Females per 100 Males in Relampago?
There are 137.40 Females per 100 Males in Relampago.
What is the Median Population Age in Relampago?
Median Population Age in Relampago is 48.0 Years.
What is the Average Family Size in Relampago
Average Family Size in Relampago is 3.8 People.
What is the Average Household Size in Relampago
Average Household Size in Relampago is 3.4 People.
How Large is the Labor Force in Relampago?
There are 156 People in the Labor Forcein in Relampago.
What is the Percentage of People in the Labor Force in Relampago?
60.7% of People are in the Labor Force in Relampago.