Kenny Lake, AK Map & Demographics
Kenny Lake Map
Kenny Lake Overview
$27,999
PER CAPITA INCOME
$39,667
AVG HOUSEHOLD INCOME
0.49
INEQUALITY / GINI INDEX
222
TOTAL POPULATION
110
MALE POPULATION
112
FEMALE POPULATION
98.21
MALES / 100 FEMALES
101.82
FEMALES / 100 MALES
20.6
MEDIAN AGE
4.2
AVG FAMILY SIZE
3.2
AVG HOUSEHOLD SIZE
69
LABOR FORCE [ PEOPLE ]
50.0%
PERCENT IN LABOR FORCE
Income in Kenny Lake
Income Overview in Kenny Lake
| Characteristic | Number | Measure |
| Per Capita Income | 222 | $27,999 |
| Median Family Income | 48 | $0 |
| Mean Family Income | 48 | $119,985 |
| Median Household Income | 70 | $39,667 |
| Mean Household Income | 70 | $88,526 |
| Income Deficit | 48 | $0 |
| Wage / Income Gap (%) | 222 | 0.00% |
| Wage / Income Gap ($) | 222 | 100.00¢ per $1 |
| Gini / Inequality Index | 222 | 0.49 |
Earnings by Sex in Kenny Lake
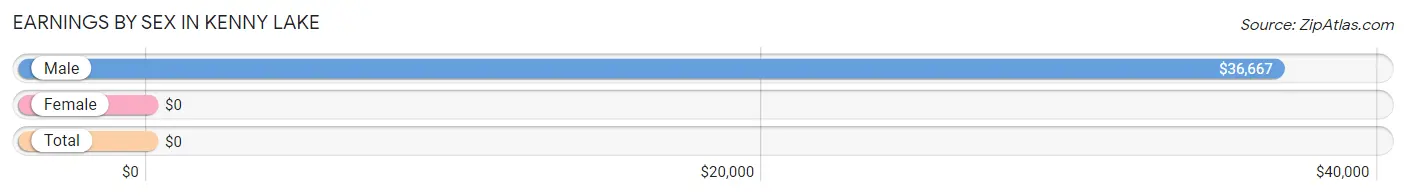
| Sex | Number | Average Earnings |
| Male | 58 (84.1%) | $36,667 |
| Female | 11 (15.9%) | $0 |
| Total | 69 (100.0%) | $0 |
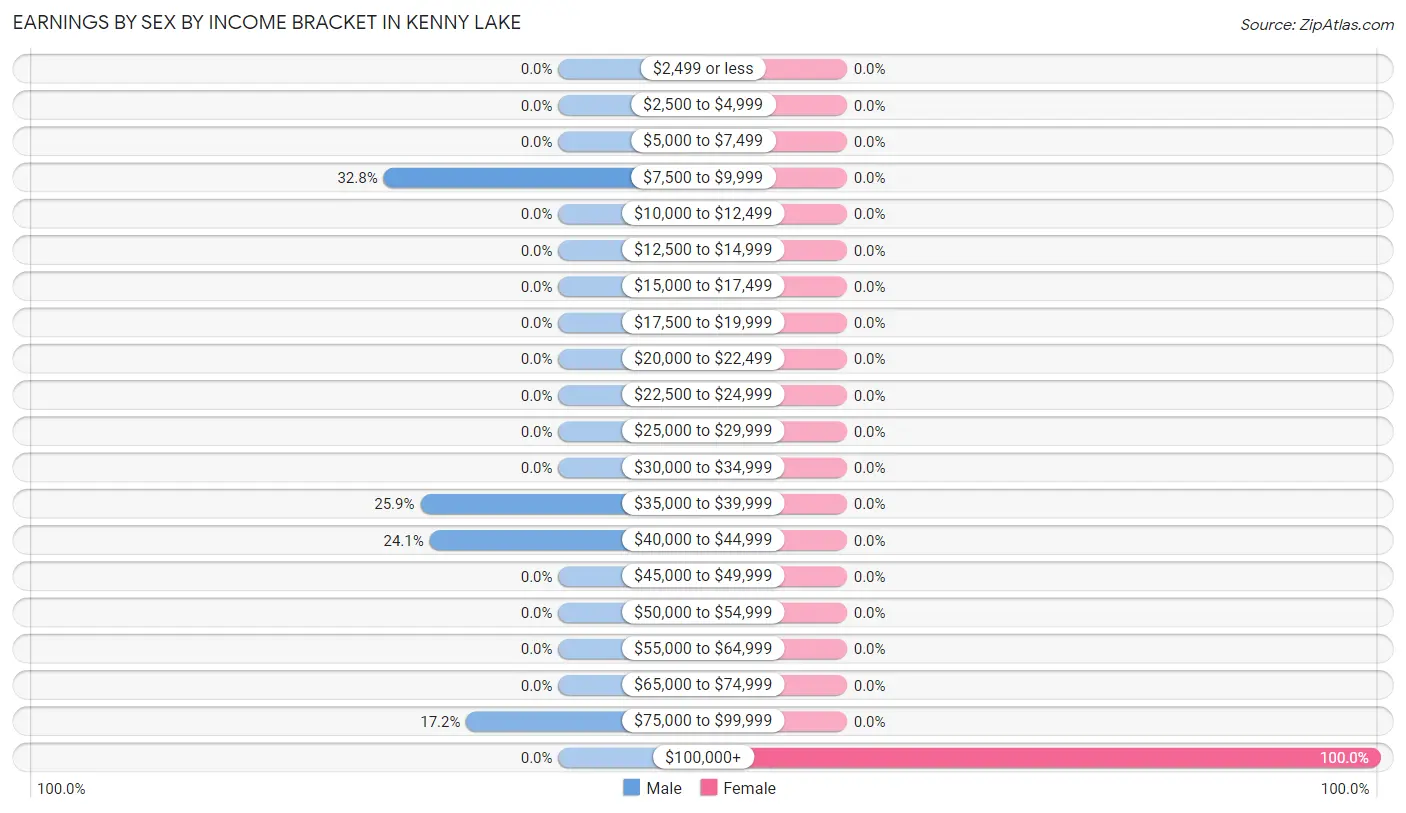
Earnings by Sex by Income Bracket in Kenny Lake
The most common earnings brackets in Kenny Lake are $7,500 to $9,999 for men (19 | 32.8%) and $100,000+ for women (11 | 100.0%).
| Income | Male | Female |
| $2,499 or less | 0 (0.0%) | 0 (0.0%) |
| $2,500 to $4,999 | 0 (0.0%) | 0 (0.0%) |
| $5,000 to $7,499 | 0 (0.0%) | 0 (0.0%) |
| $7,500 to $9,999 | 19 (32.8%) | 0 (0.0%) |
| $10,000 to $12,499 | 0 (0.0%) | 0 (0.0%) |
| $12,500 to $14,999 | 0 (0.0%) | 0 (0.0%) |
| $15,000 to $17,499 | 0 (0.0%) | 0 (0.0%) |
| $17,500 to $19,999 | 0 (0.0%) | 0 (0.0%) |
| $20,000 to $22,499 | 0 (0.0%) | 0 (0.0%) |
| $22,500 to $24,999 | 0 (0.0%) | 0 (0.0%) |
| $25,000 to $29,999 | 0 (0.0%) | 0 (0.0%) |
| $30,000 to $34,999 | 0 (0.0%) | 0 (0.0%) |
| $35,000 to $39,999 | 15 (25.9%) | 0 (0.0%) |
| $40,000 to $44,999 | 14 (24.1%) | 0 (0.0%) |
| $45,000 to $49,999 | 0 (0.0%) | 0 (0.0%) |
| $50,000 to $54,999 | 0 (0.0%) | 0 (0.0%) |
| $55,000 to $64,999 | 0 (0.0%) | 0 (0.0%) |
| $65,000 to $74,999 | 0 (0.0%) | 0 (0.0%) |
| $75,000 to $99,999 | 10 (17.2%) | 0 (0.0%) |
| $100,000+ | 0 (0.0%) | 11 (100.0%) |
| Total | 58 (100.0%) | 11 (100.0%) |
Earnings by Sex by Educational Attainment in Kenny Lake
| Educational Attainment | Male Income | Female Income |
| Less than High School | - | - |
| High School Diploma | - | - |
| College or Associate's Degree | - | - |
| Bachelor's Degree | - | - |
| Graduate Degree | - | - |
| Total | $40,804 | $0 |
Family Income in Kenny Lake
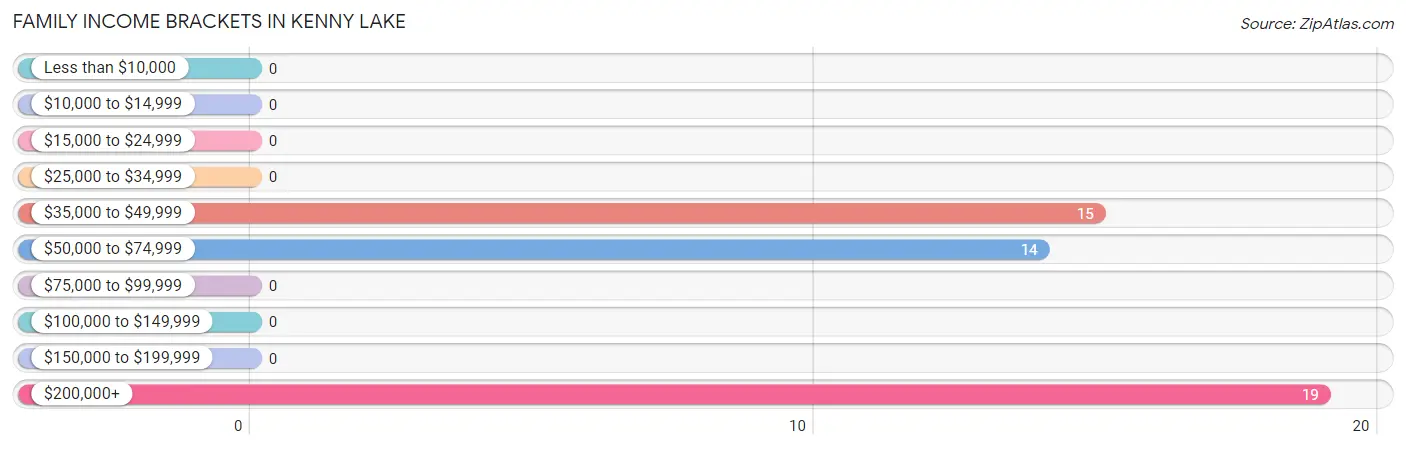
Family Income Brackets in Kenny Lake
According to the Kenny Lake family income data, there are 19 families falling into the $200,000+ income range, which is the most common income bracket and makes up 39.6% of all families.
| Income Bracket | # Families | % Families |
| Less than $10,000 | 0 | 0.0% |
| $10,000 to $14,999 | 0 | 0.0% |
| $15,000 to $24,999 | 0 | 0.0% |
| $25,000 to $34,999 | 0 | 0.0% |
| $35,000 to $49,999 | 15 | 31.3% |
| $50,000 to $74,999 | 14 | 29.2% |
| $75,000 to $99,999 | 0 | 0.0% |
| $100,000 to $149,999 | 0 | 0.0% |
| $150,000 to $199,999 | 0 | 0.0% |
| $200,000+ | 19 | 39.6% |
Family Income by Famaliy Size in Kenny Lake
| Income Bracket | # Families | Median Income |
| 2-Person Families | 19 (39.6%) | $0 |
| 3-Person Families | 0 (0.0%) | $0 |
| 4-Person Families | 15 (31.2%) | $0 |
| 5-Person Families | 14 (29.2%) | $0 |
| 6-Person Families | 0 (0.0%) | $0 |
| 7+ Person Families | 0 (0.0%) | $0 |
| Total | 48 (100.0%) | $0 |
Family Income by Number of Earners in Kenny Lake
| Number of Earners | # Families | Median Income |
| No Earners | 9 (18.8%) | $0 |
| 1 Earner | 15 (31.2%) | $0 |
| 2 Earners | 24 (50.0%) | $0 |
| 3+ Earners | 0 (0.0%) | $0 |
| Total | 48 (100.0%) | $0 |
Household Income in Kenny Lake
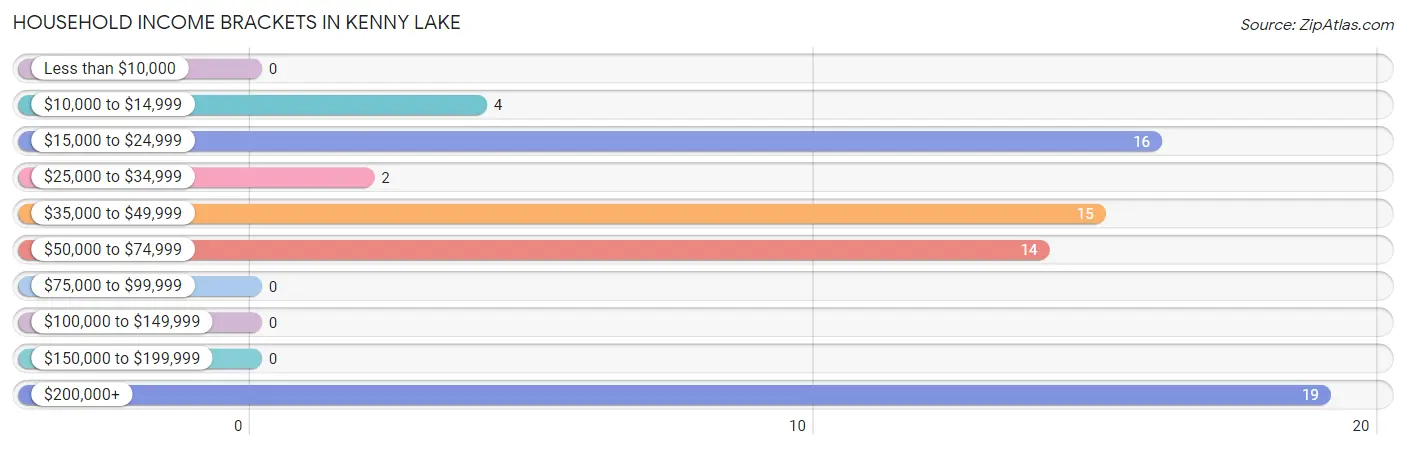
Household Income Brackets in Kenny Lake
With 19 households falling in the category, the $200,000+ income range is the most frequent in Kenny Lake, accounting for 27.1% of all households.
| Income Bracket | # Households | % Households |
| Less than $10,000 | 0 | 0.0% |
| $10,000 to $14,999 | 4 | 5.7% |
| $15,000 to $24,999 | 16 | 22.9% |
| $25,000 to $34,999 | 2 | 2.9% |
| $35,000 to $49,999 | 15 | 21.4% |
| $50,000 to $74,999 | 14 | 20.0% |
| $75,000 to $99,999 | 0 | 0.0% |
| $100,000 to $149,999 | 0 | 0.0% |
| $150,000 to $199,999 | 0 | 0.0% |
| $200,000+ | 19 | 27.1% |
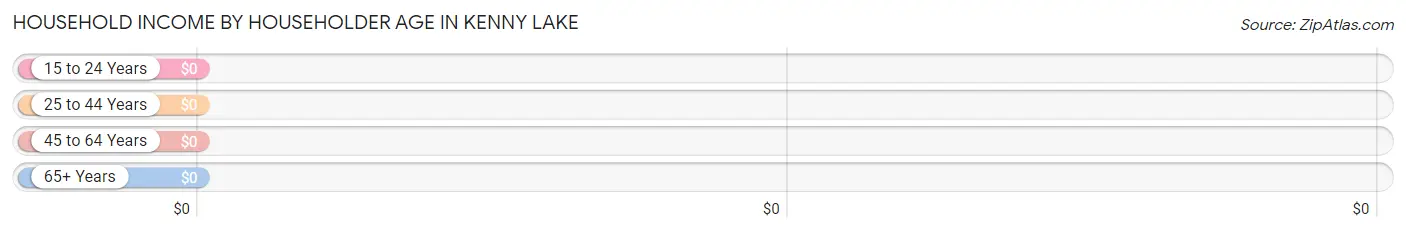
Household Income by Householder Age in Kenny Lake
| Income Bracket | # Households | Median Income |
| 15 to 24 Years | 0 (0.0%) | $0 |
| 25 to 44 Years | 25 (35.7%) | $0 |
| 45 to 64 Years | 14 (20.0%) | $0 |
| 65+ Years | 31 (44.3%) | $0 |
| Total | 70 (100.0%) | $39,667 |
Poverty in Kenny Lake
Income Below Poverty by Sex and Age in Kenny Lake
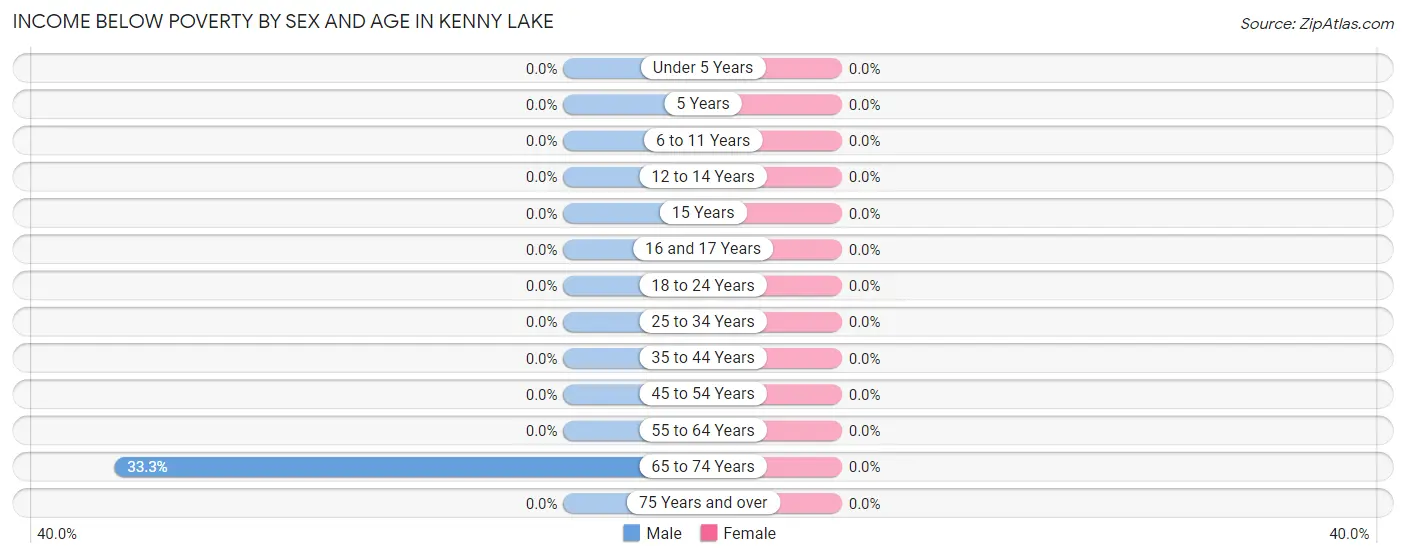
| Age Bracket | Male | Female |
| Under 5 Years | 0 (0.0%) | 0 (0.0%) |
| 5 Years | 0 (0.0%) | 0 (0.0%) |
| 6 to 11 Years | 0 (0.0%) | 0 (0.0%) |
| 12 to 14 Years | 0 (0.0%) | 0 (0.0%) |
| 15 Years | 0 (0.0%) | 0 (0.0%) |
| 16 and 17 Years | 0 (0.0%) | 0 (0.0%) |
| 18 to 24 Years | 0 (0.0%) | 0 (0.0%) |
| 25 to 34 Years | 0 (0.0%) | 0 (0.0%) |
| 35 to 44 Years | 0 (0.0%) | 0 (0.0%) |
| 45 to 54 Years | 0 (0.0%) | 0 (0.0%) |
| 55 to 64 Years | 0 (0.0%) | 0 (0.0%) |
| 65 to 74 Years | 4 (33.3%) | 0 (0.0%) |
| 75 Years and over | 0 (0.0%) | 0 (0.0%) |
| Total | 4 (3.6%) | 0 (0.0%) |
Income Above Poverty by Sex and Age in Kenny Lake
According to the poverty statistics in Kenny Lake, males aged under 5 years and females aged 12 to 14 years are the age groups that are most secure financially, with 100.0% of males and 100.0% of females in these age groups living above the poverty line.
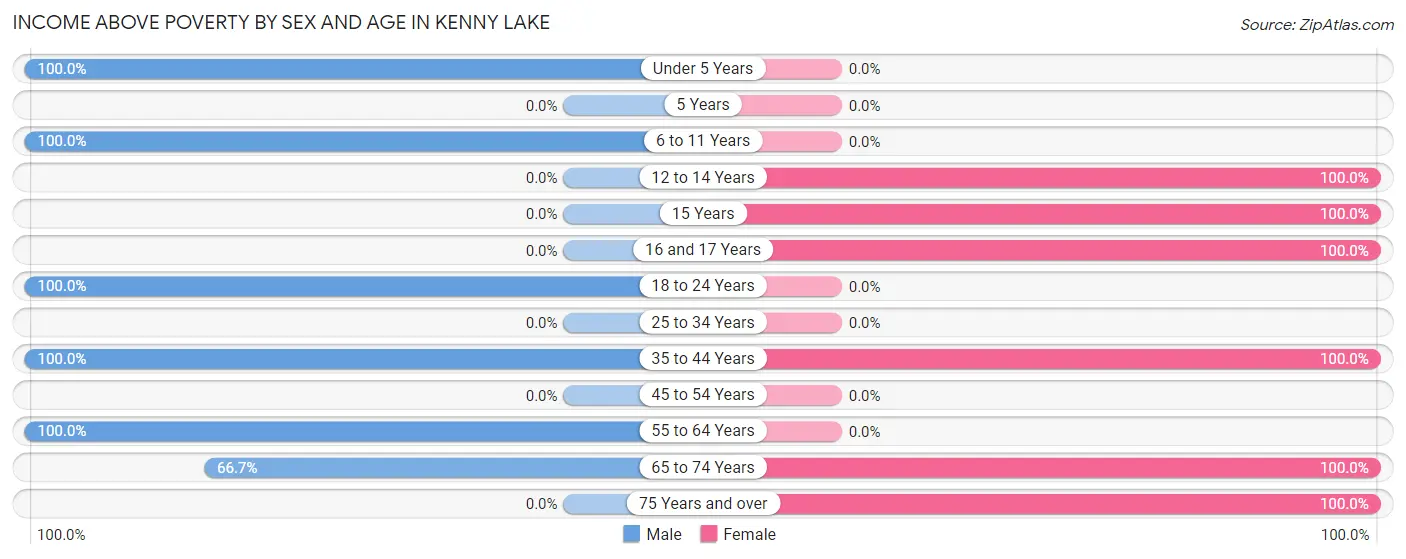
| Age Bracket | Male | Female |
| Under 5 Years | 25 (100.0%) | 0 (0.0%) |
| 5 Years | 0 (0.0%) | 0 (0.0%) |
| 6 to 11 Years | 15 (100.0%) | 0 (0.0%) |
| 12 to 14 Years | 0 (0.0%) | 29 (100.0%) |
| 15 Years | 0 (0.0%) | 15 (100.0%) |
| 16 and 17 Years | 0 (0.0%) | 15 (100.0%) |
| 18 to 24 Years | 19 (100.0%) | 0 (0.0%) |
| 25 to 34 Years | 0 (0.0%) | 0 (0.0%) |
| 35 to 44 Years | 25 (100.0%) | 26 (100.0%) |
| 45 to 54 Years | 0 (0.0%) | 0 (0.0%) |
| 55 to 64 Years | 14 (100.0%) | 0 (0.0%) |
| 65 to 74 Years | 8 (66.7%) | 11 (100.0%) |
| 75 Years and over | 0 (0.0%) | 16 (100.0%) |
| Total | 106 (96.4%) | 112 (100.0%) |
Income Below Poverty Among Married-Couple Families in Kenny Lake
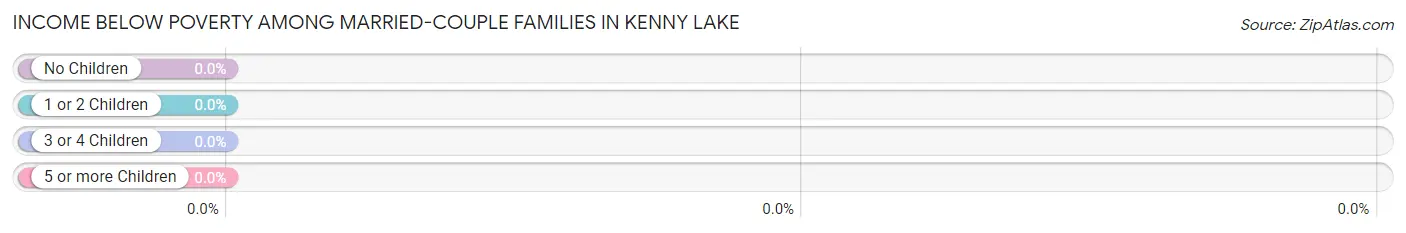
| Children | Above Poverty | Below Poverty |
| No Children | 19 (100.0%) | 0 (0.0%) |
| 1 or 2 Children | 15 (100.0%) | 0 (0.0%) |
| 3 or 4 Children | 0 (0.0%) | 0 (0.0%) |
| 5 or more Children | 0 (0.0%) | 0 (0.0%) |
| Total | 34 (100.0%) | 0 (0.0%) |
Income Below Poverty Among Single-Parent Households in Kenny Lake
| Children | Single Father | Single Mother |
| No Children | 0 (0.0%) | 0 (0.0%) |
| 1 or 2 Children | 0 (0.0%) | 0 (0.0%) |
| 3 or 4 Children | 0 (0.0%) | 0 (0.0%) |
| 5 or more Children | 0 (0.0%) | 0 (0.0%) |
| Total | 0 (0.0%) | 0 (0.0%) |
Income Below Poverty Among Married-Couple vs Single-Parent Households in Kenny Lake
| Children | Married-Couple Families | Single-Parent Households |
| No Children | 0 (0.0%) | 0 (0.0%) |
| 1 or 2 Children | 0 (0.0%) | 0 (0.0%) |
| 3 or 4 Children | 0 (0.0%) | 0 (0.0%) |
| 5 or more Children | 0 (0.0%) | 0 (0.0%) |
| Total | 0 (0.0%) | 0 (0.0%) |
Race in Kenny Lake
The most populous races in Kenny Lake are White / Caucasian (128 | 57.7%), and Native / Alaskan (94 | 42.3%).
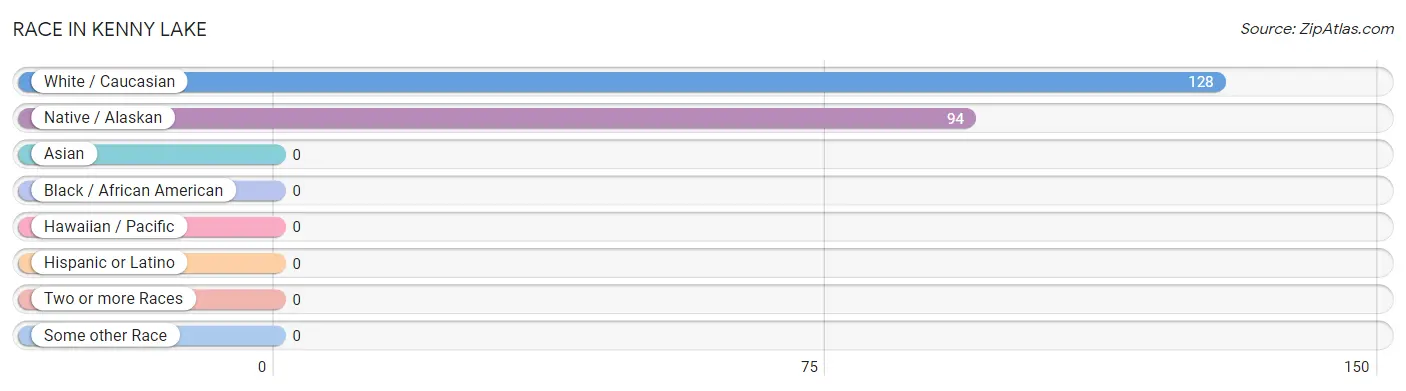
| Race | # Population | % Population |
| Asian | 0 | 0.0% |
| Black / African American | 0 | 0.0% |
| Hawaiian / Pacific | 0 | 0.0% |
| Hispanic or Latino | 0 | 0.0% |
| Native / Alaskan | 94 | 42.3% |
| White / Caucasian | 128 | 57.7% |
| Two or more Races | 0 | 0.0% |
| Some other Race | 0 | 0.0% |
| Total | 222 | 100.0% |
Ancestry in Kenny Lake
The most populous ancestries reported in Kenny Lake are Alaska Native (92 | 41.4%), French (59 | 26.6%), German (40 | 18.0%), Italian (16 | 7.2%), and Irish (13 | 5.9%), together accounting for 99.1% of all Kenny Lake residents.
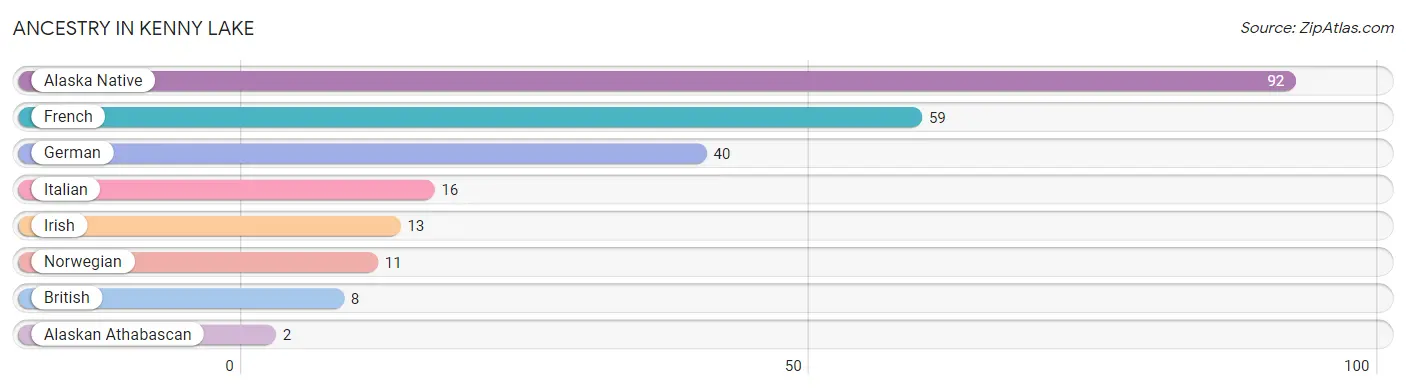
| Ancestry | # Population | % Population |
| Alaska Native | 92 | 41.4% |
| Alaskan Athabascan | 2 | 0.9% |
| British | 8 | 3.6% |
| French | 59 | 26.6% |
| German | 40 | 18.0% |
| Irish | 13 | 5.9% |
| Italian | 16 | 7.2% |
| Norwegian | 11 | 5.0% | View All 8 Rows |
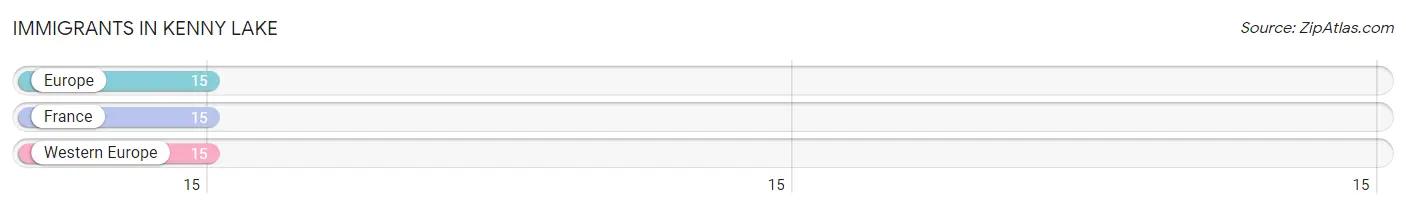
Immigrants in Kenny Lake
The most numerous immigrant groups reported in Kenny Lake came from Europe (15 | 6.8%), France (15 | 6.8%), and Western Europe (15 | 6.8%), together accounting for 20.3% of all Kenny Lake residents.
| Immigration Origin | # Population | % Population |
| Europe | 15 | 6.8% |
| France | 15 | 6.8% |
| Western Europe | 15 | 6.8% | View All 3 Rows |
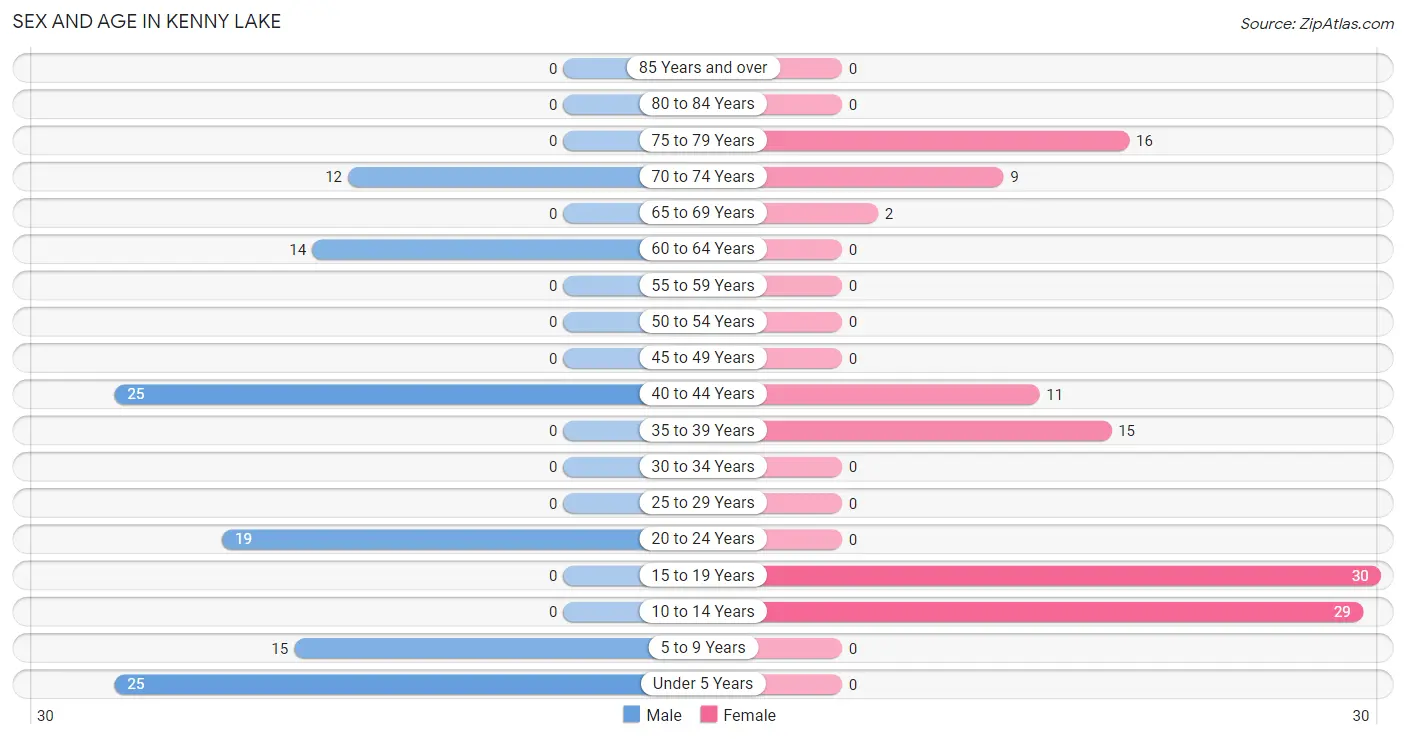
Sex and Age in Kenny Lake
Sex and Age in Kenny Lake
The most populous age groups in Kenny Lake are Under 5 Years (25 | 22.7%) for men and 15 to 19 Years (30 | 26.8%) for women.
| Age Bracket | Male | Female |
| Under 5 Years | 25 (22.7%) | 0 (0.0%) |
| 5 to 9 Years | 15 (13.6%) | 0 (0.0%) |
| 10 to 14 Years | 0 (0.0%) | 29 (25.9%) |
| 15 to 19 Years | 0 (0.0%) | 30 (26.8%) |
| 20 to 24 Years | 19 (17.3%) | 0 (0.0%) |
| 25 to 29 Years | 0 (0.0%) | 0 (0.0%) |
| 30 to 34 Years | 0 (0.0%) | 0 (0.0%) |
| 35 to 39 Years | 0 (0.0%) | 15 (13.4%) |
| 40 to 44 Years | 25 (22.7%) | 11 (9.8%) |
| 45 to 49 Years | 0 (0.0%) | 0 (0.0%) |
| 50 to 54 Years | 0 (0.0%) | 0 (0.0%) |
| 55 to 59 Years | 0 (0.0%) | 0 (0.0%) |
| 60 to 64 Years | 14 (12.7%) | 0 (0.0%) |
| 65 to 69 Years | 0 (0.0%) | 2 (1.8%) |
| 70 to 74 Years | 12 (10.9%) | 9 (8.0%) |
| 75 to 79 Years | 0 (0.0%) | 16 (14.3%) |
| 80 to 84 Years | 0 (0.0%) | 0 (0.0%) |
| 85 Years and over | 0 (0.0%) | 0 (0.0%) |
| Total | 110 (100.0%) | 112 (100.0%) |
Families and Households in Kenny Lake
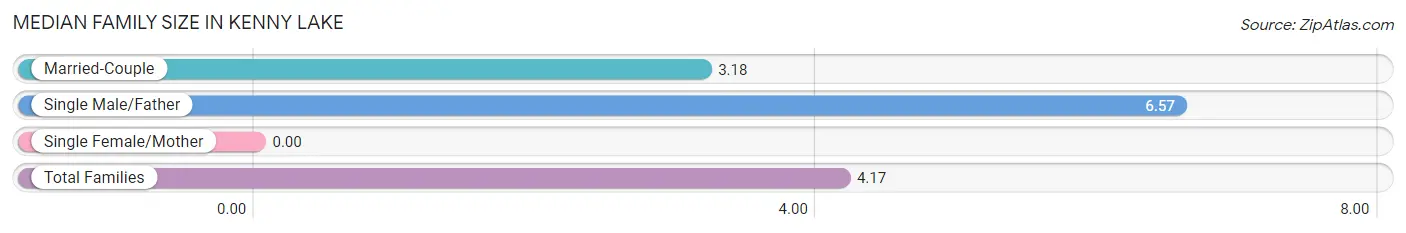
Median Family Size in Kenny Lake
| Family Type | # Families | Family Size |
| Married-Couple | 34 (70.8%) | 3.18 |
| Single Male/Father | 14 (29.2%) | 6.57 |
| Single Female/Mother | 0 (0.0%) | - |
| Total Families | 48 (100.0%) | 4.17 |
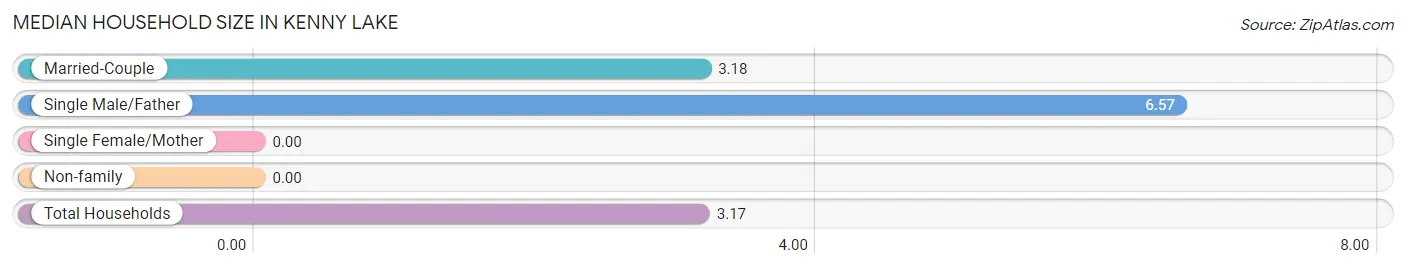
Median Household Size in Kenny Lake
| Household Type | # Households | Household Size |
| Married-Couple | 34 (48.6%) | 3.18 |
| Single Male/Father | 14 (20.0%) | 6.57 |
| Single Female/Mother | 0 (0.0%) | - |
| Non-family | 22 (31.4%) | - |
| Total Households | 70 (100.0%) | 3.17 |
Household Size by Marriage Status in Kenny Lake
Out of a total of 70 households in Kenny Lake, 48 (68.6%) are family households, while 22 (31.4%) are nonfamily households. The most numerous type of family households are 2-person households, comprising 19, and the most common type of nonfamily households are 1-person households, comprising 22.
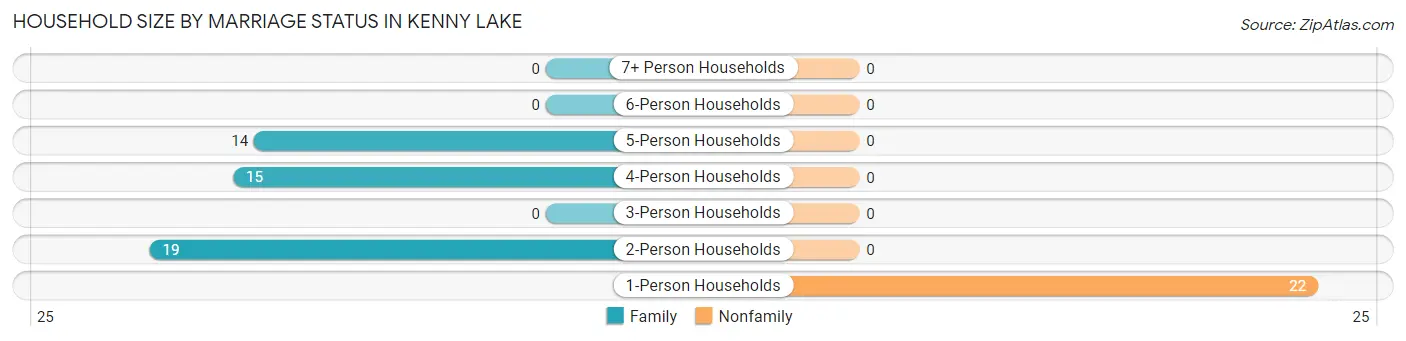
| Household Size | Family Households | Nonfamily Households |
| 1-Person Households | - | 22 (31.4%) |
| 2-Person Households | 19 (27.1%) | 0 (0.0%) |
| 3-Person Households | 0 (0.0%) | 0 (0.0%) |
| 4-Person Households | 15 (21.4%) | 0 (0.0%) |
| 5-Person Households | 14 (20.0%) | 0 (0.0%) |
| 6-Person Households | 0 (0.0%) | 0 (0.0%) |
| 7+ Person Households | 0 (0.0%) | 0 (0.0%) |
| Total | 48 (68.6%) | 22 (31.4%) |
Female Fertility in Kenny Lake
Fertility by Age in Kenny Lake
| Age Bracket | Women with Births | Births / 1,000 Women |
| 15 to 19 years | 0 (0.0%) | 0.0 |
| 20 to 34 years | 0 (0.0%) | 0.0 |
| 35 to 50 years | 0 (0.0%) | 0.0 |
| Total | 0 (0.0%) | 0.0 |
Fertility by Age by Marriage Status in Kenny Lake
| Age Bracket | Married | Unmarried |
| 15 to 19 years | 0 (0.0%) | 0 (0.0%) |
| 20 to 34 years | 0 (0.0%) | 0 (0.0%) |
| 35 to 50 years | 0 (0.0%) | 0 (0.0%) |
| Total | 0 (0.0%) | 0 (0.0%) |
Fertility by Education in Kenny Lake
| Educational Attainment | Women with Births | Births / 1,000 Women |
| Less than High School | 0 (0.0%) | 0.0 |
| High School Diploma | 0 (0.0%) | 0.0 |
| College or Associate's Degree | 0 (0.0%) | 0.0 |
| Bachelor's Degree | 0 (0.0%) | 0.0 |
| Graduate Degree | 0 (0.0%) | 0.0 |
| Total | 0 (0.0%) | 0.0 |
Fertility by Education by Marriage Status in Kenny Lake
| Educational Attainment | Married | Unmarried |
| Less than High School | 0 (0.0%) | 0 (0.0%) |
| High School Diploma | 0 (0.0%) | 0 (0.0%) |
| College or Associate's Degree | 0 (0.0%) | 0 (0.0%) |
| Bachelor's Degree | 0 (0.0%) | 0 (0.0%) |
| Graduate Degree | 0 (0.0%) | 0 (0.0%) |
| Total | 0 (0.0%) | 0 (0.0%) |
Employment Characteristics in Kenny Lake
Employment by Class of Employer in Kenny Lake
Among the 69 employed individuals in Kenny Lake, private company employees (50 | 72.5%), and local government employees (19 | 27.5%) make up the most common classes of employment.
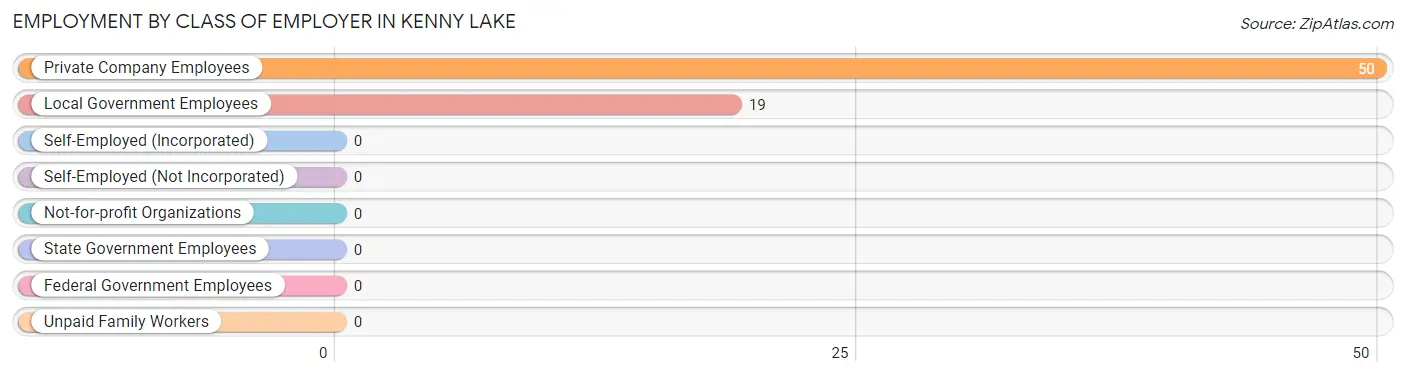
| Employer Class | # Employees | % Employees |
| Private Company Employees | 50 | 72.5% |
| Self-Employed (Incorporated) | 0 | 0.0% |
| Self-Employed (Not Incorporated) | 0 | 0.0% |
| Not-for-profit Organizations | 0 | 0.0% |
| Local Government Employees | 19 | 27.5% |
| State Government Employees | 0 | 0.0% |
| Federal Government Employees | 0 | 0.0% |
| Unpaid Family Workers | 0 | 0.0% |
| Total | 69 | 100.0% |
Employment Status by Age in Kenny Lake
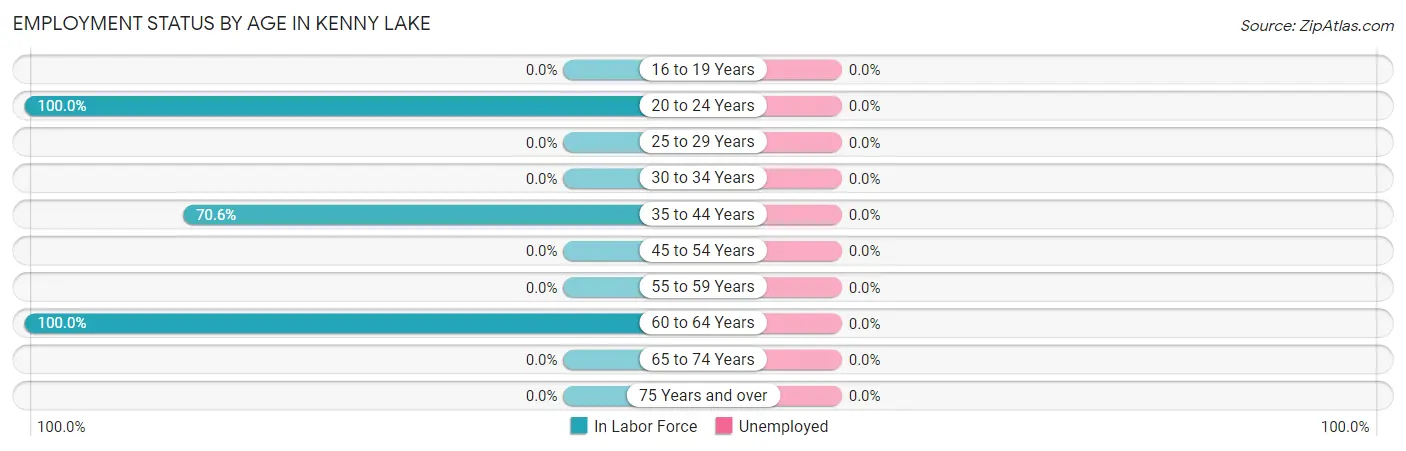
| Age Bracket | In Labor Force | Unemployed |
| 16 to 19 Years | 0 (0.0%) | 0 (0.0%) |
| 20 to 24 Years | 19 (100.0%) | 0 (0.0%) |
| 25 to 29 Years | 0 (0.0%) | 0 (0.0%) |
| 30 to 34 Years | 0 (0.0%) | 0 (0.0%) |
| 35 to 44 Years | 36 (70.6%) | 0 (0.0%) |
| 45 to 54 Years | 0 (0.0%) | 0 (0.0%) |
| 55 to 59 Years | 0 (0.0%) | 0 (0.0%) |
| 60 to 64 Years | 14 (100.0%) | 0 (0.0%) |
| 65 to 74 Years | 0 (0.0%) | 0 (0.0%) |
| 75 Years and over | 0 (0.0%) | 0 (0.0%) |
| Total | 69 (50.0%) | 0 (0.0%) |
Employment Status by Educational Attainment in Kenny Lake
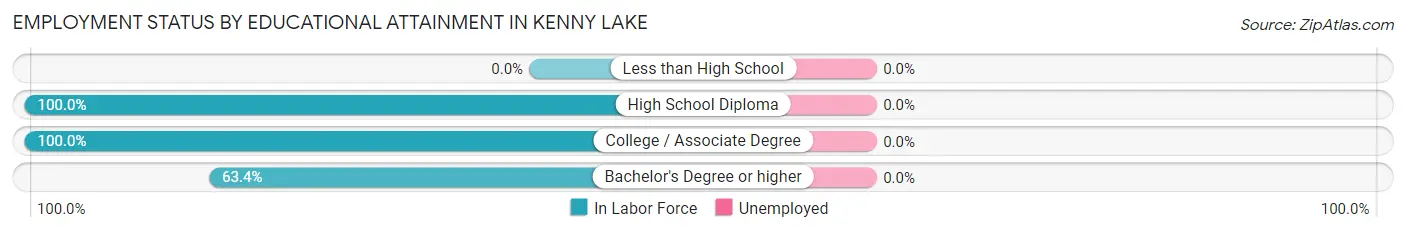
| Educational Attainment | In Labor Force | Unemployed |
| Less than High School | 0 (0.0%) | 0 (0.0%) |
| High School Diploma | 10 (100.0%) | 0 (0.0%) |
| College / Associate Degree | 14 (100.0%) | 0 (0.0%) |
| Bachelor's Degree or higher | 26 (63.4%) | 0 (0.0%) |
| Total | 50 (76.9%) | 0 (0.0%) |
Employment Occupations by Sex in Kenny Lake
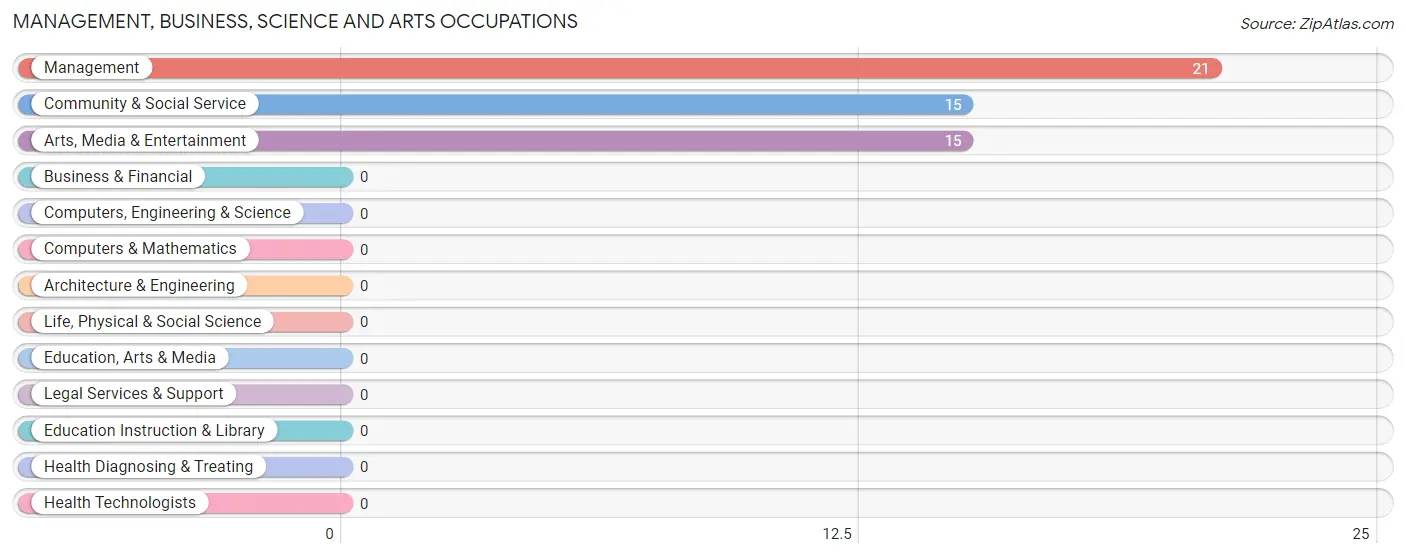
Management, Business, Science and Arts Occupations
The most common Management, Business, Science and Arts occupations in Kenny Lake are Management (21 | 30.4%), Community & Social Service (15 | 21.7%), and Arts, Media & Entertainment (15 | 21.7%).
Management, Business, Science and Arts Occupations by Sex
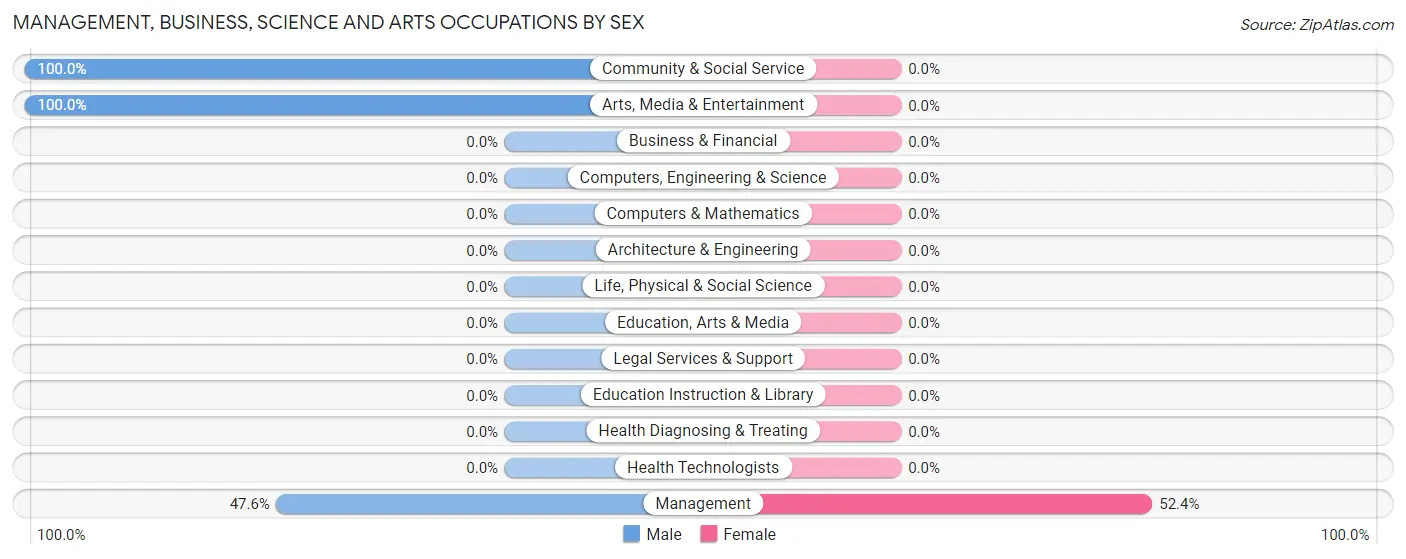
| Occupation | Male | Female |
| Management | 10 (47.6%) | 11 (52.4%) |
| Business & Financial | 0 (0.0%) | 0 (0.0%) |
| Computers, Engineering & Science | 0 (0.0%) | 0 (0.0%) |
| Computers & Mathematics | 0 (0.0%) | 0 (0.0%) |
| Architecture & Engineering | 0 (0.0%) | 0 (0.0%) |
| Life, Physical & Social Science | 0 (0.0%) | 0 (0.0%) |
| Community & Social Service | 15 (100.0%) | 0 (0.0%) |
| Education, Arts & Media | 0 (0.0%) | 0 (0.0%) |
| Legal Services & Support | 0 (0.0%) | 0 (0.0%) |
| Education Instruction & Library | 0 (0.0%) | 0 (0.0%) |
| Arts, Media & Entertainment | 15 (100.0%) | 0 (0.0%) |
| Health Diagnosing & Treating | 0 (0.0%) | 0 (0.0%) |
| Health Technologists | 0 (0.0%) | 0 (0.0%) |
| Total (Category) | 25 (69.4%) | 11 (30.6%) |
| Total (Overall) | 58 (84.1%) | 11 (15.9%) |
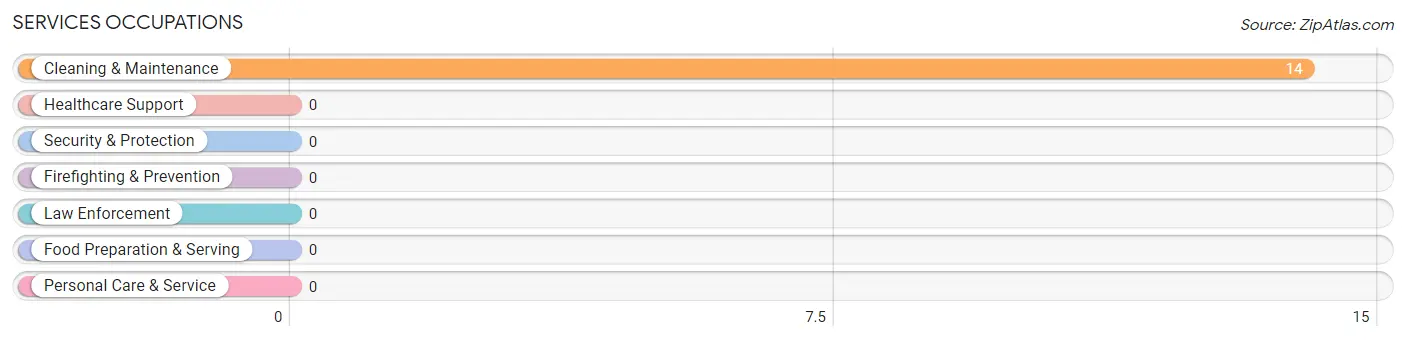
Services Occupations
The most common Services occupations in Kenny Lake are , and Cleaning & Maintenance (14 | 20.3%).
Services Occupations by Sex
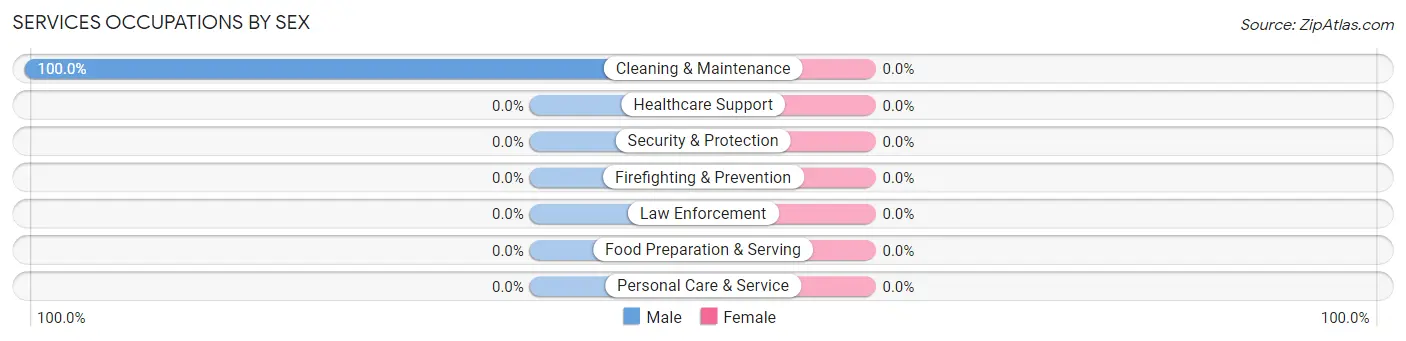
| Occupation | Male | Female |
| Healthcare Support | 0 (0.0%) | 0 (0.0%) |
| Security & Protection | 0 (0.0%) | 0 (0.0%) |
| Firefighting & Prevention | 0 (0.0%) | 0 (0.0%) |
| Law Enforcement | 0 (0.0%) | 0 (0.0%) |
| Food Preparation & Serving | 0 (0.0%) | 0 (0.0%) |
| Cleaning & Maintenance | 14 (100.0%) | 0 (0.0%) |
| Personal Care & Service | 0 (0.0%) | 0 (0.0%) |
| Total (Category) | 14 (100.0%) | 0 (0.0%) |
| Total (Overall) | 58 (84.1%) | 11 (15.9%) |
Sales and Office Occupations
Sales and Office Occupations by Sex
| Occupation | Male | Female |
| Sales & Related | 0 (0.0%) | 0 (0.0%) |
| Office & Administration | 0 (0.0%) | 0 (0.0%) |
| Total (Category) | 0 (0.0%) | 0 (0.0%) |
| Total (Overall) | 58 (84.1%) | 11 (15.9%) |
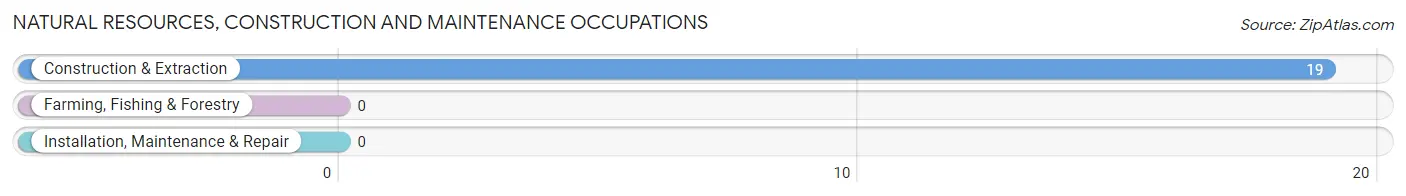
Natural Resources, Construction and Maintenance Occupations
The most common Natural Resources, Construction and Maintenance occupations in Kenny Lake are , and Construction & Extraction (19 | 27.5%).
Natural Resources, Construction and Maintenance Occupations by Sex
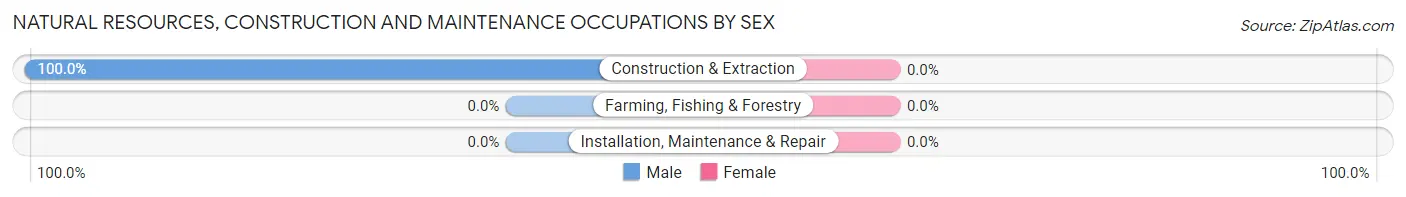
| Occupation | Male | Female |
| Farming, Fishing & Forestry | 0 (0.0%) | 0 (0.0%) |
| Construction & Extraction | 19 (100.0%) | 0 (0.0%) |
| Installation, Maintenance & Repair | 0 (0.0%) | 0 (0.0%) |
| Total (Category) | 19 (100.0%) | 0 (0.0%) |
| Total (Overall) | 58 (84.1%) | 11 (15.9%) |
Production, Transportation and Moving Occupations
Production, Transportation and Moving Occupations by Sex
| Occupation | Male | Female |
| Production | 0 (0.0%) | 0 (0.0%) |
| Transportation | 0 (0.0%) | 0 (0.0%) |
| Material Moving | 0 (0.0%) | 0 (0.0%) |
| Total (Category) | 0 (0.0%) | 0 (0.0%) |
| Total (Overall) | 58 (84.1%) | 11 (15.9%) |
Employment Industries by Sex in Kenny Lake
Employment Industries in Kenny Lake
The major employment industries in Kenny Lake include Construction (29 | 42.0%), Information (26 | 37.7%), and Utilities (14 | 20.3%).
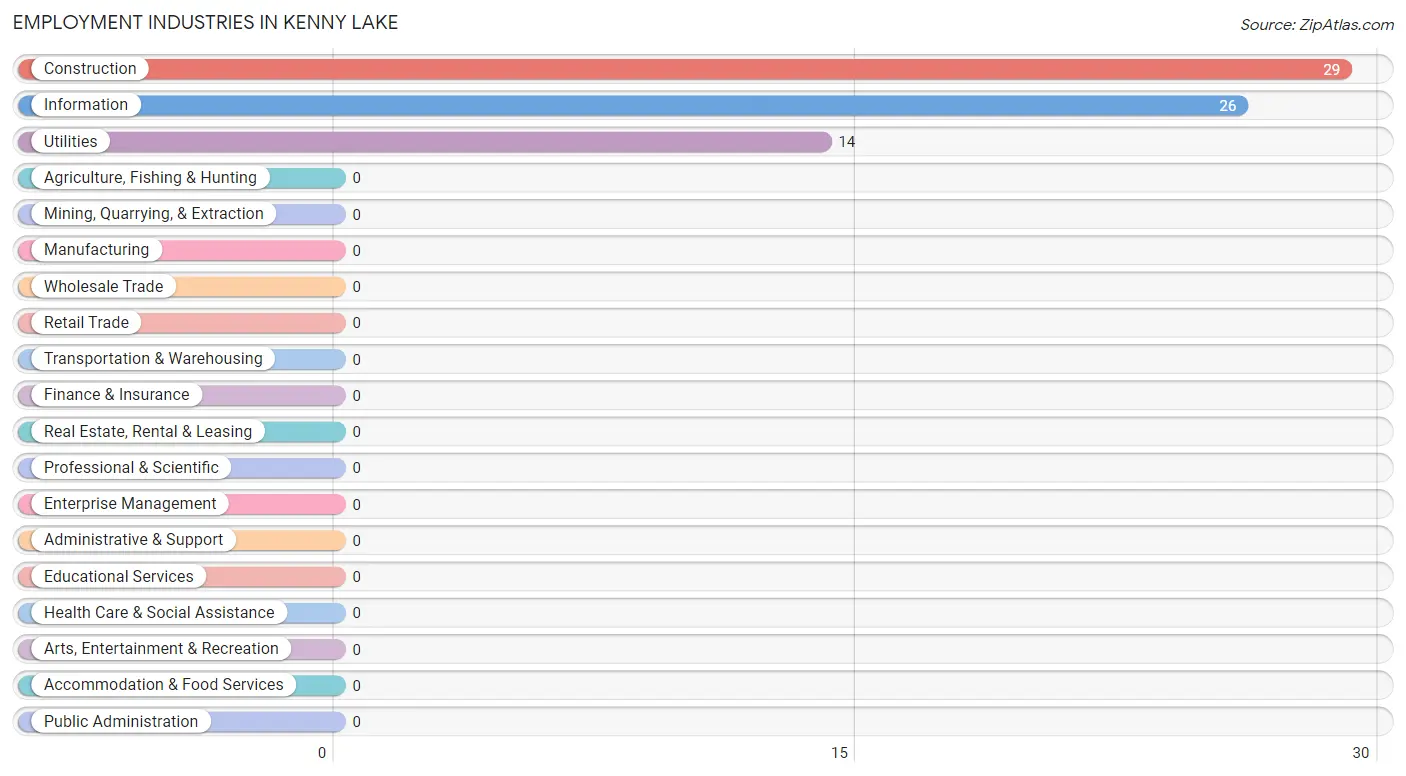
Employment Industries by Sex in Kenny Lake
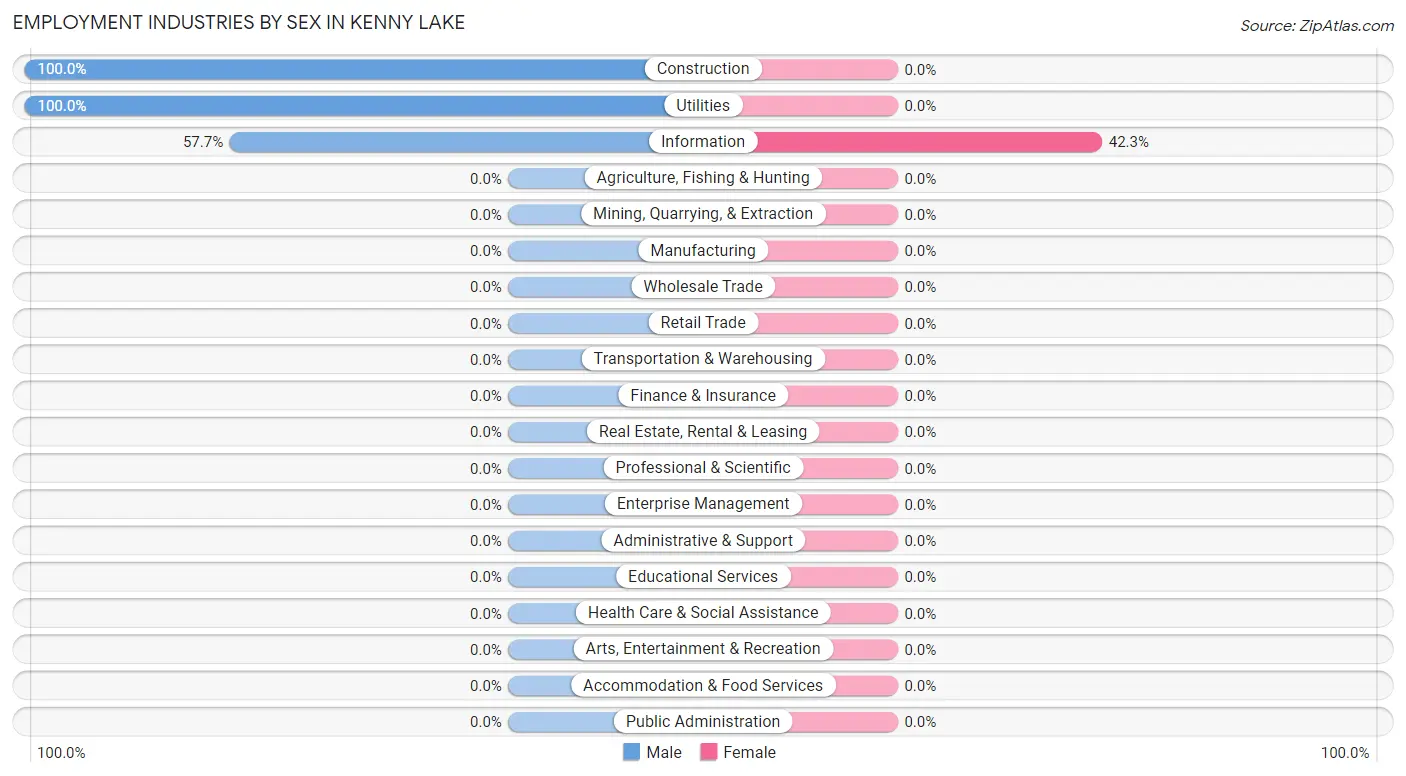
| Industry | Male | Female |
| Agriculture, Fishing & Hunting | 0 (0.0%) | 0 (0.0%) |
| Mining, Quarrying, & Extraction | 0 (0.0%) | 0 (0.0%) |
| Construction | 29 (100.0%) | 0 (0.0%) |
| Manufacturing | 0 (0.0%) | 0 (0.0%) |
| Wholesale Trade | 0 (0.0%) | 0 (0.0%) |
| Retail Trade | 0 (0.0%) | 0 (0.0%) |
| Transportation & Warehousing | 0 (0.0%) | 0 (0.0%) |
| Utilities | 14 (100.0%) | 0 (0.0%) |
| Information | 15 (57.7%) | 11 (42.3%) |
| Finance & Insurance | 0 (0.0%) | 0 (0.0%) |
| Real Estate, Rental & Leasing | 0 (0.0%) | 0 (0.0%) |
| Professional & Scientific | 0 (0.0%) | 0 (0.0%) |
| Enterprise Management | 0 (0.0%) | 0 (0.0%) |
| Administrative & Support | 0 (0.0%) | 0 (0.0%) |
| Educational Services | 0 (0.0%) | 0 (0.0%) |
| Health Care & Social Assistance | 0 (0.0%) | 0 (0.0%) |
| Arts, Entertainment & Recreation | 0 (0.0%) | 0 (0.0%) |
| Accommodation & Food Services | 0 (0.0%) | 0 (0.0%) |
| Public Administration | 0 (0.0%) | 0 (0.0%) |
| Total | 58 (84.1%) | 11 (15.9%) |
Education in Kenny Lake
School Enrollment in Kenny Lake
The most common levels of schooling among the 74 students in Kenny Lake are high school (59 | 79.7%), and kindergarten (15 | 20.3%).

| School Level | # Students | % Students |
| Nursery / Preschool | 0 | 0.0% |
| Kindergarten | 15 | 20.3% |
| Elementary School | 0 | 0.0% |
| Middle School | 0 | 0.0% |
| High School | 59 | 79.7% |
| College / Undergraduate | 0 | 0.0% |
| Graduate / Professional | 0 | 0.0% |
| Total | 74 | 100.0% |
School Enrollment by Age by Funding Source in Kenny Lake
Out of a total of 74 students who are enrolled in schools in Kenny Lake, 15 (20.3%) attend a private institution, while the remaining 59 (79.7%) are enrolled in public schools. The age group of 5 to 9 year old has the highest likelihood of being enrolled in private schools, with 15 (100.0% in the age bracket) enrolled. Conversely, the age group of 10 to 14 year olds has the lowest likelihood of being enrolled in a private school, with 29 (100.0% in the age bracket) attending a public institution.
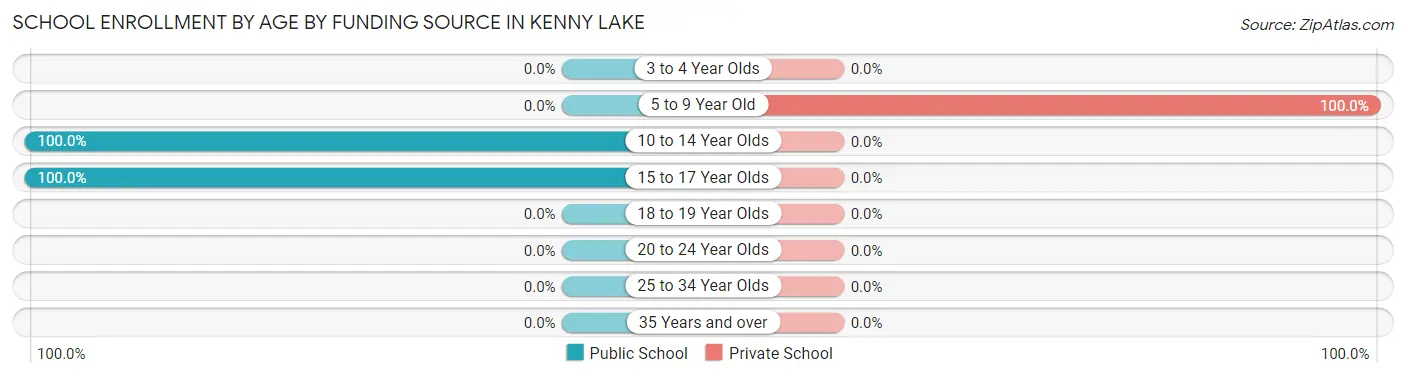
| Age Bracket | Public School | Private School |
| 3 to 4 Year Olds | 0 (0.0%) | 0 (0.0%) |
| 5 to 9 Year Old | 0 (0.0%) | 15 (100.0%) |
| 10 to 14 Year Olds | 29 (100.0%) | 0 (0.0%) |
| 15 to 17 Year Olds | 30 (100.0%) | 0 (0.0%) |
| 18 to 19 Year Olds | 0 (0.0%) | 0 (0.0%) |
| 20 to 24 Year Olds | 0 (0.0%) | 0 (0.0%) |
| 25 to 34 Year Olds | 0 (0.0%) | 0 (0.0%) |
| 35 Years and over | 0 (0.0%) | 0 (0.0%) |
| Total | 59 (79.7%) | 15 (20.3%) |
Educational Attainment by Field of Study in Kenny Lake
Literature & languages (23 | 29.5%), psychology (16 | 20.5%), liberal arts & history (15 | 19.2%), physical & health sciences (13 | 16.7%), and education (11 | 14.1%) are the most common fields of study among 78 individuals in Kenny Lake who have obtained a bachelor's degree or higher.
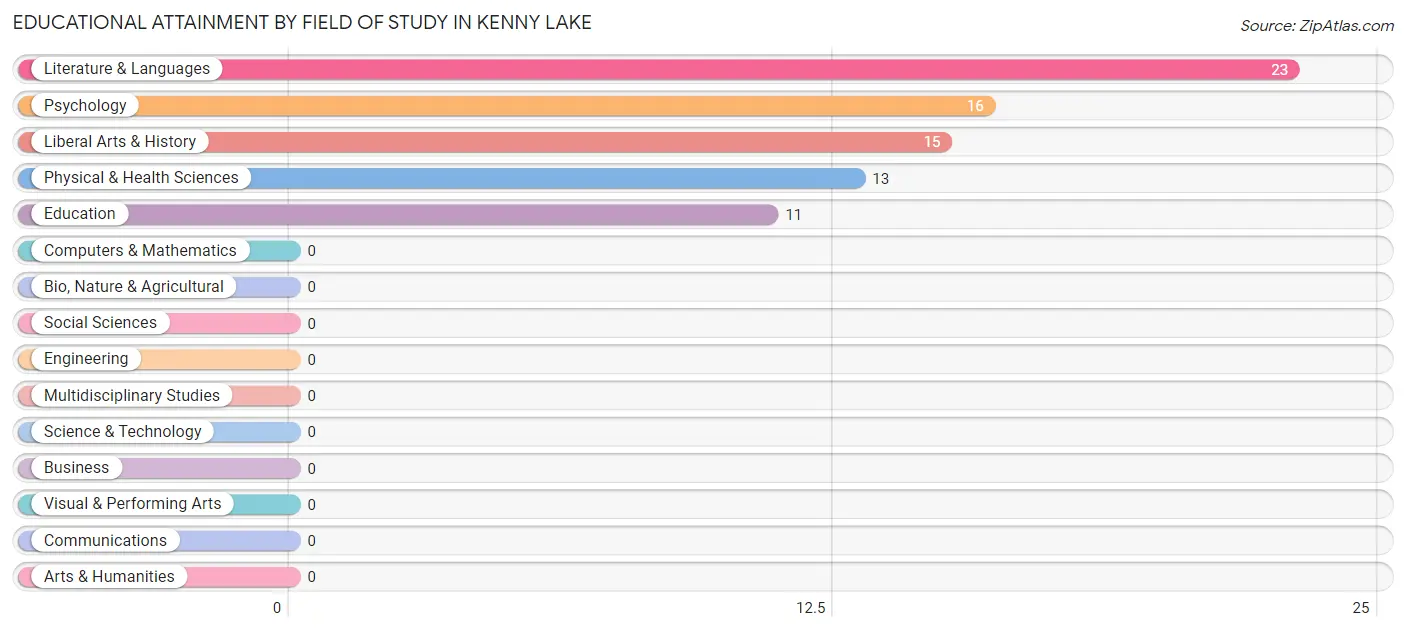
| Field of Study | # Graduates | % Graduates |
| Computers & Mathematics | 0 | 0.0% |
| Bio, Nature & Agricultural | 0 | 0.0% |
| Physical & Health Sciences | 13 | 16.7% |
| Psychology | 16 | 20.5% |
| Social Sciences | 0 | 0.0% |
| Engineering | 0 | 0.0% |
| Multidisciplinary Studies | 0 | 0.0% |
| Science & Technology | 0 | 0.0% |
| Business | 0 | 0.0% |
| Education | 11 | 14.1% |
| Literature & Languages | 23 | 29.5% |
| Liberal Arts & History | 15 | 19.2% |
| Visual & Performing Arts | 0 | 0.0% |
| Communications | 0 | 0.0% |
| Arts & Humanities | 0 | 0.0% |
| Total | 78 | 100.0% |
Transportation & Commute in Kenny Lake
Vehicle Availability by Sex in Kenny Lake
The most prevalent vehicle ownership categories in Kenny Lake are males with no vehicle (33, accounting for 56.9%) and females with no vehicle (0, making up 300.0%).
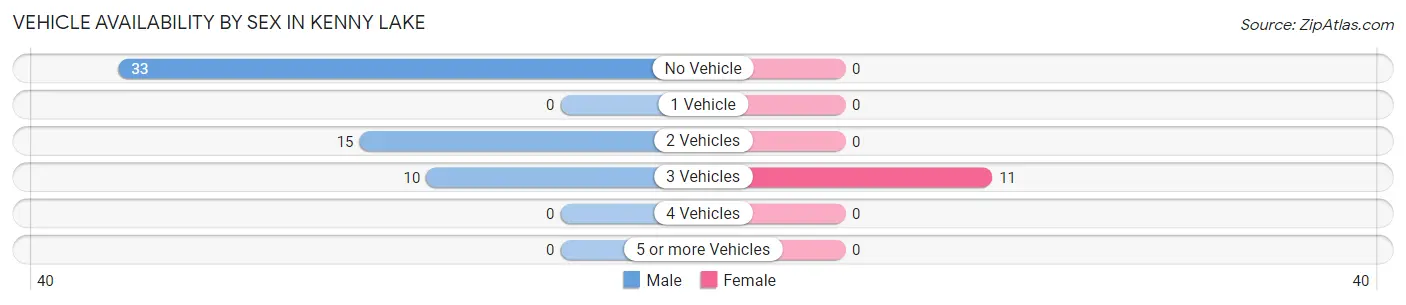
| Vehicles Available | Male | Female |
| No Vehicle | 33 (56.9%) | 0 (0.0%) |
| 1 Vehicle | 0 (0.0%) | 0 (0.0%) |
| 2 Vehicles | 15 (25.9%) | 0 (0.0%) |
| 3 Vehicles | 10 (17.2%) | 11 (100.0%) |
| 4 Vehicles | 0 (0.0%) | 0 (0.0%) |
| 5 or more Vehicles | 0 (0.0%) | 0 (0.0%) |
| Total | 58 (100.0%) | 11 (100.0%) |
Commute Time in Kenny Lake
The most frequently occuring commute durations in Kenny Lake are 15 to 19 minutes (19 commuters, 35.2%), 10 to 14 minutes (14 commuters, 25.9%), and 20 to 24 minutes (11 commuters, 20.4%).
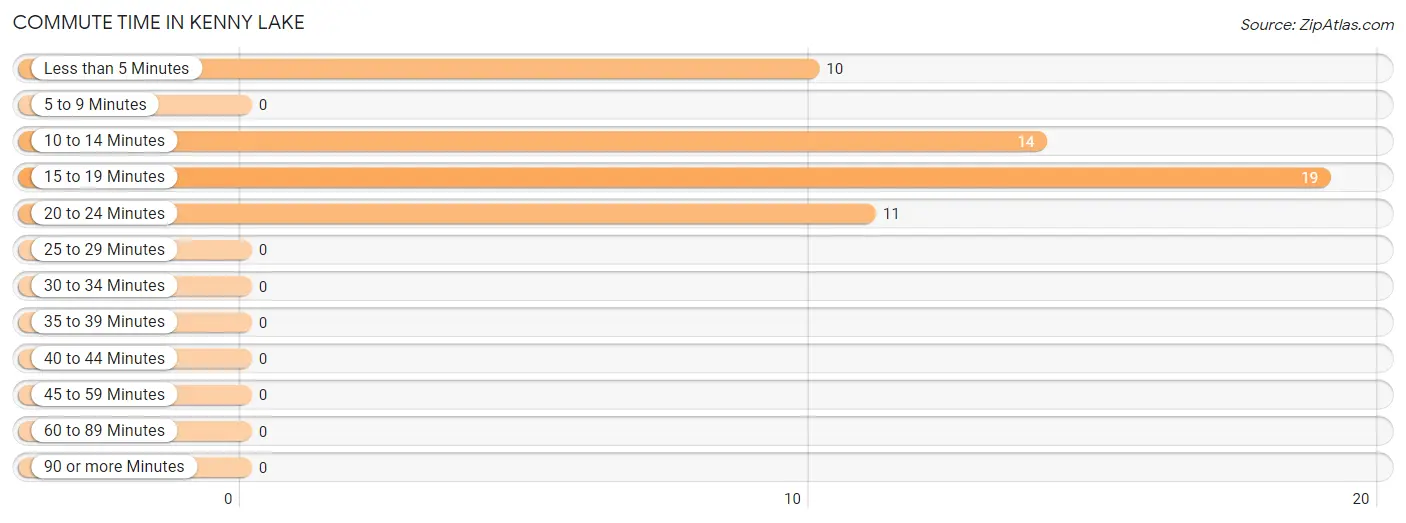
| Commute Time | # Commuters | % Commuters |
| Less than 5 Minutes | 10 | 18.5% |
| 5 to 9 Minutes | 0 | 0.0% |
| 10 to 14 Minutes | 14 | 25.9% |
| 15 to 19 Minutes | 19 | 35.2% |
| 20 to 24 Minutes | 11 | 20.4% |
| 25 to 29 Minutes | 0 | 0.0% |
| 30 to 34 Minutes | 0 | 0.0% |
| 35 to 39 Minutes | 0 | 0.0% |
| 40 to 44 Minutes | 0 | 0.0% |
| 45 to 59 Minutes | 0 | 0.0% |
| 60 to 89 Minutes | 0 | 0.0% |
| 90 or more Minutes | 0 | 0.0% |
Commute Time by Sex in Kenny Lake
The most common commute times in Kenny Lake are 15 to 19 minutes (19 commuters, 44.2%) for males and 20 to 24 minutes (11 commuters, 100.0%) for females.
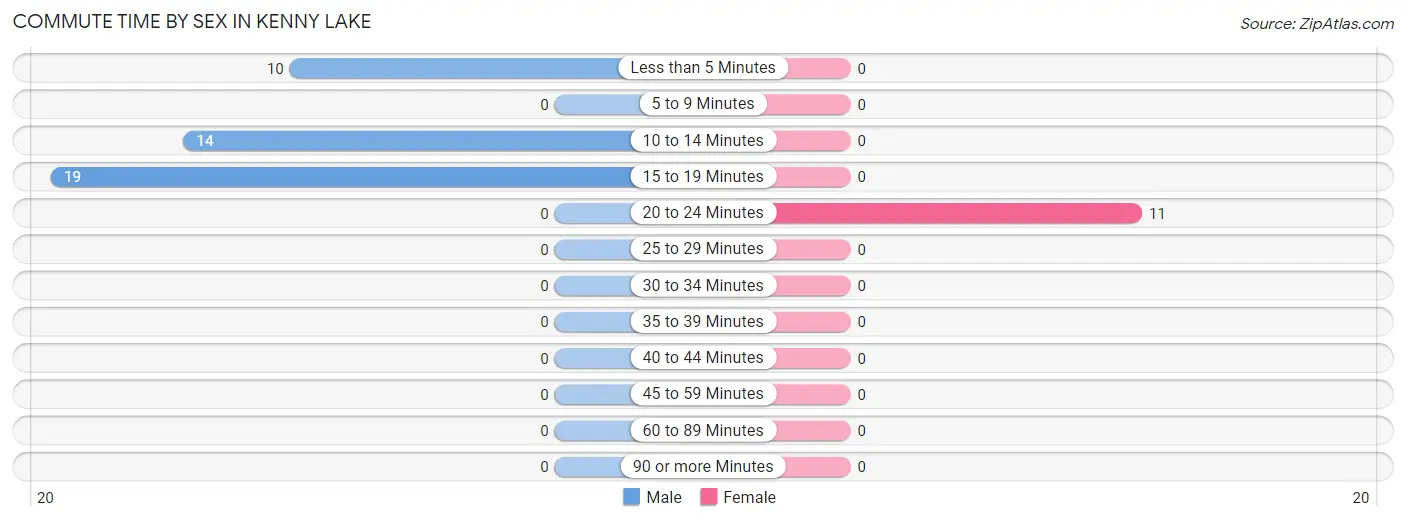
| Commute Time | Male | Female |
| Less than 5 Minutes | 10 (23.3%) | 0 (0.0%) |
| 5 to 9 Minutes | 0 (0.0%) | 0 (0.0%) |
| 10 to 14 Minutes | 14 (32.6%) | 0 (0.0%) |
| 15 to 19 Minutes | 19 (44.2%) | 0 (0.0%) |
| 20 to 24 Minutes | 0 (0.0%) | 11 (100.0%) |
| 25 to 29 Minutes | 0 (0.0%) | 0 (0.0%) |
| 30 to 34 Minutes | 0 (0.0%) | 0 (0.0%) |
| 35 to 39 Minutes | 0 (0.0%) | 0 (0.0%) |
| 40 to 44 Minutes | 0 (0.0%) | 0 (0.0%) |
| 45 to 59 Minutes | 0 (0.0%) | 0 (0.0%) |
| 60 to 89 Minutes | 0 (0.0%) | 0 (0.0%) |
| 90 or more Minutes | 0 (0.0%) | 0 (0.0%) |
Time of Departure to Work by Sex in Kenny Lake
The most frequent times of departure to work in Kenny Lake are 9:00 AM to 9:59 AM (33, 76.7%) for males and 7:30 AM to 7:59 AM (11, 100.0%) for females.
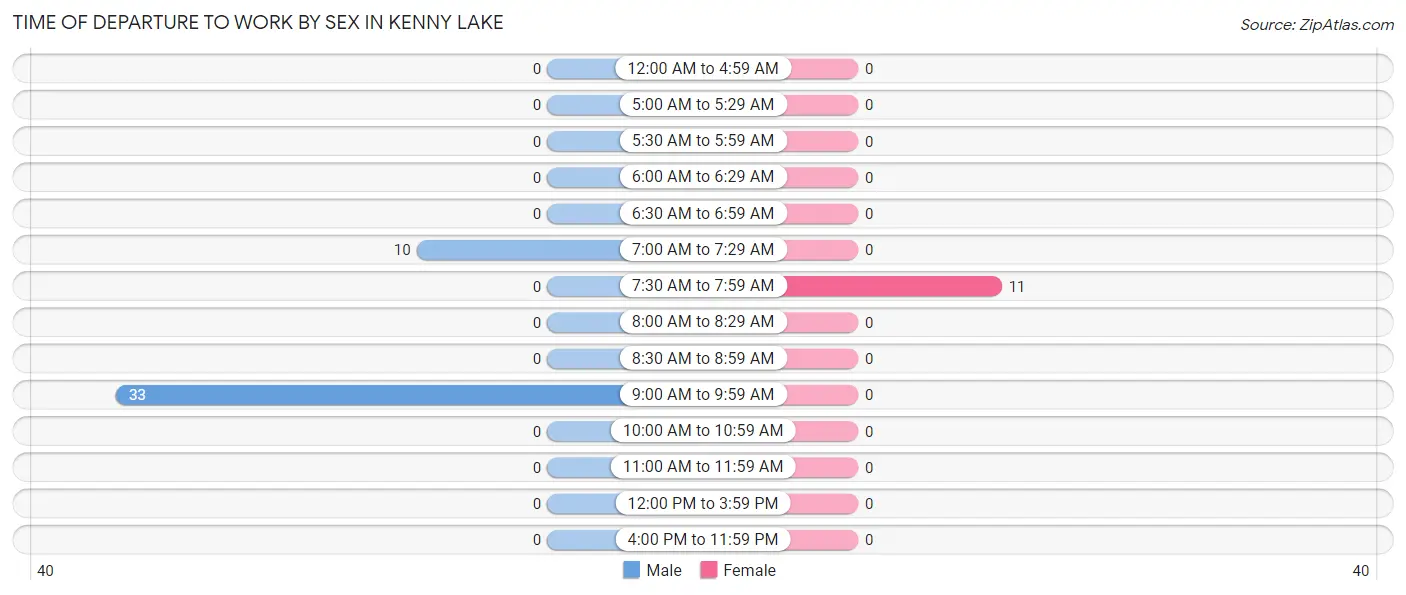
| Time of Departure | Male | Female |
| 12:00 AM to 4:59 AM | 0 (0.0%) | 0 (0.0%) |
| 5:00 AM to 5:29 AM | 0 (0.0%) | 0 (0.0%) |
| 5:30 AM to 5:59 AM | 0 (0.0%) | 0 (0.0%) |
| 6:00 AM to 6:29 AM | 0 (0.0%) | 0 (0.0%) |
| 6:30 AM to 6:59 AM | 0 (0.0%) | 0 (0.0%) |
| 7:00 AM to 7:29 AM | 10 (23.3%) | 0 (0.0%) |
| 7:30 AM to 7:59 AM | 0 (0.0%) | 11 (100.0%) |
| 8:00 AM to 8:29 AM | 0 (0.0%) | 0 (0.0%) |
| 8:30 AM to 8:59 AM | 0 (0.0%) | 0 (0.0%) |
| 9:00 AM to 9:59 AM | 33 (76.7%) | 0 (0.0%) |
| 10:00 AM to 10:59 AM | 0 (0.0%) | 0 (0.0%) |
| 11:00 AM to 11:59 AM | 0 (0.0%) | 0 (0.0%) |
| 12:00 PM to 3:59 PM | 0 (0.0%) | 0 (0.0%) |
| 4:00 PM to 11:59 PM | 0 (0.0%) | 0 (0.0%) |
| Total | 43 (100.0%) | 11 (100.0%) |
Housing Occupancy in Kenny Lake
Occupancy by Ownership in Kenny Lake
Of the total 70 dwellings in Kenny Lake, owner-occupied units account for 70 (100.0%), while renter-occupied units make up 0 (0.0%).
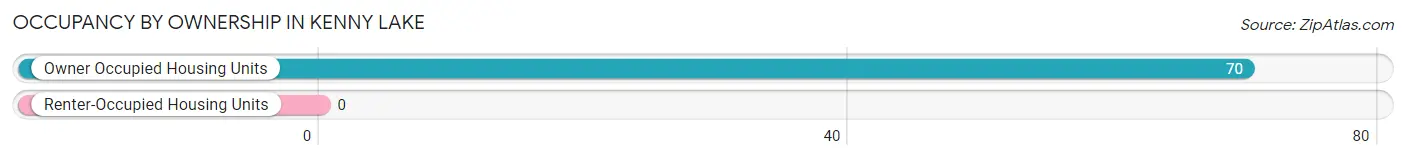
| Occupancy | # Housing Units | % Housing Units |
| Owner Occupied Housing Units | 70 | 100.0% |
| Renter-Occupied Housing Units | 0 | 0.0% |
| Total Occupied Housing Units | 70 | 100.0% |
Occupancy by Household Size in Kenny Lake
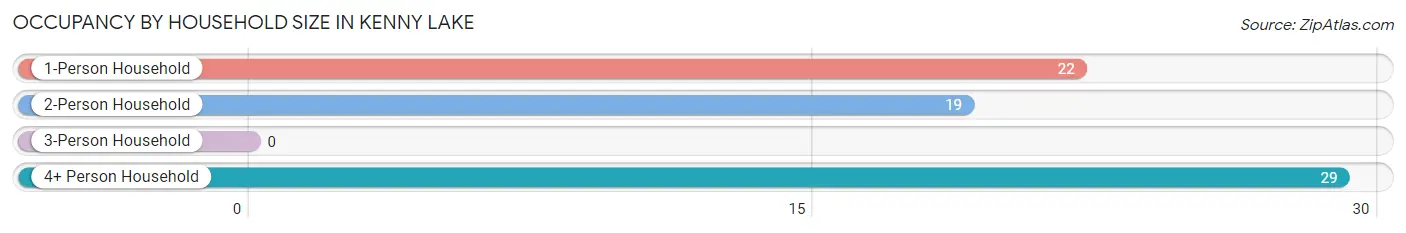
| Household Size | # Housing Units | % Housing Units |
| 1-Person Household | 22 | 31.4% |
| 2-Person Household | 19 | 27.1% |
| 3-Person Household | 0 | 0.0% |
| 4+ Person Household | 29 | 41.4% |
| Total Housing Units | 70 | 100.0% |
Occupancy by Ownership by Household Size in Kenny Lake
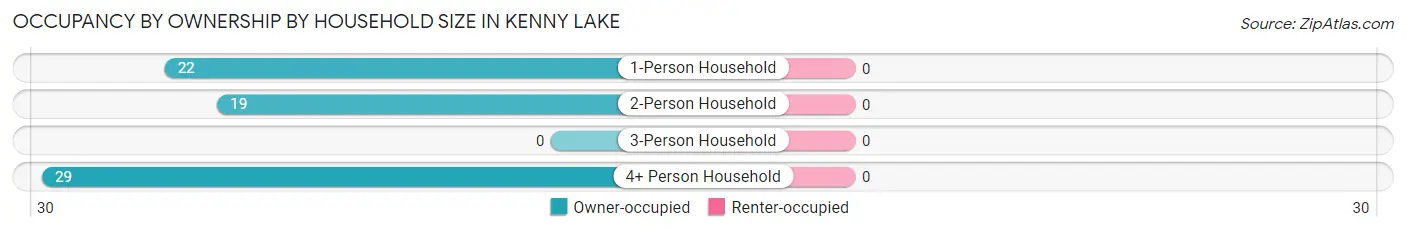
| Household Size | Owner-occupied | Renter-occupied |
| 1-Person Household | 22 (100.0%) | 0 (0.0%) |
| 2-Person Household | 19 (100.0%) | 0 (0.0%) |
| 3-Person Household | 0 (0.0%) | 0 (0.0%) |
| 4+ Person Household | 29 (100.0%) | 0 (0.0%) |
| Total Housing Units | 70 (100.0%) | 0 (0.0%) |
Occupancy by Educational Attainment in Kenny Lake
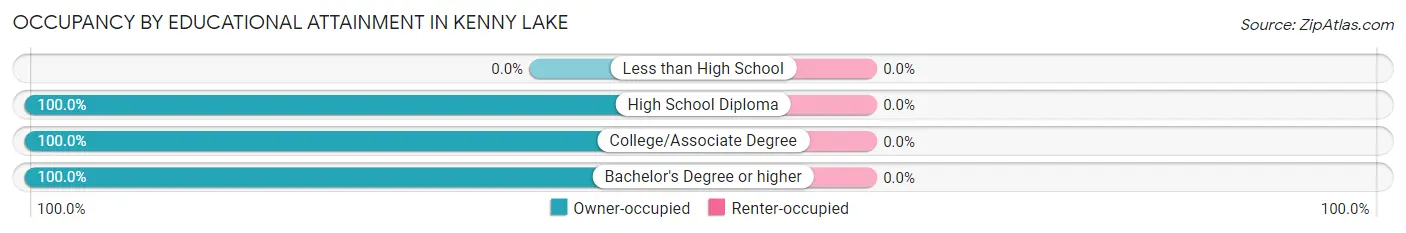
| Household Size | Owner-occupied | Renter-occupied |
| Less than High School | 0 (0.0%) | 0 (0.0%) |
| High School Diploma | 12 (100.0%) | 0 (0.0%) |
| College/Associate Degree | 14 (100.0%) | 0 (0.0%) |
| Bachelor's Degree or higher | 44 (100.0%) | 0 (0.0%) |
Occupancy by Age of Householder in Kenny Lake
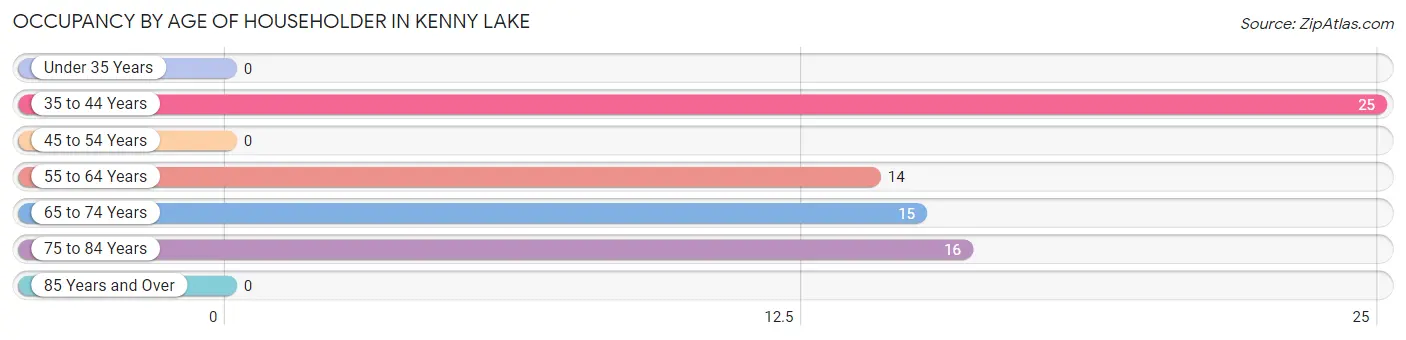
| Age Bracket | # Households | % Households |
| Under 35 Years | 0 | 0.0% |
| 35 to 44 Years | 25 | 35.7% |
| 45 to 54 Years | 0 | 0.0% |
| 55 to 64 Years | 14 | 20.0% |
| 65 to 74 Years | 15 | 21.4% |
| 75 to 84 Years | 16 | 22.9% |
| 85 Years and Over | 0 | 0.0% |
| Total | 70 | 100.0% |
Housing Finances in Kenny Lake
Median Income by Occupancy in Kenny Lake
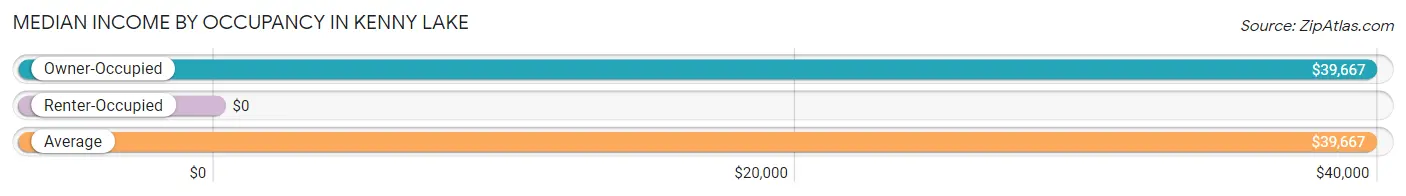
| Occupancy Type | # Households | Median Income |
| Owner-Occupied | 70 (100.0%) | $39,667 |
| Renter-Occupied | 0 (0.0%) | $0 |
| Average | 70 (100.0%) | $39,667 |
Occupancy by Householder Income Bracket in Kenny Lake
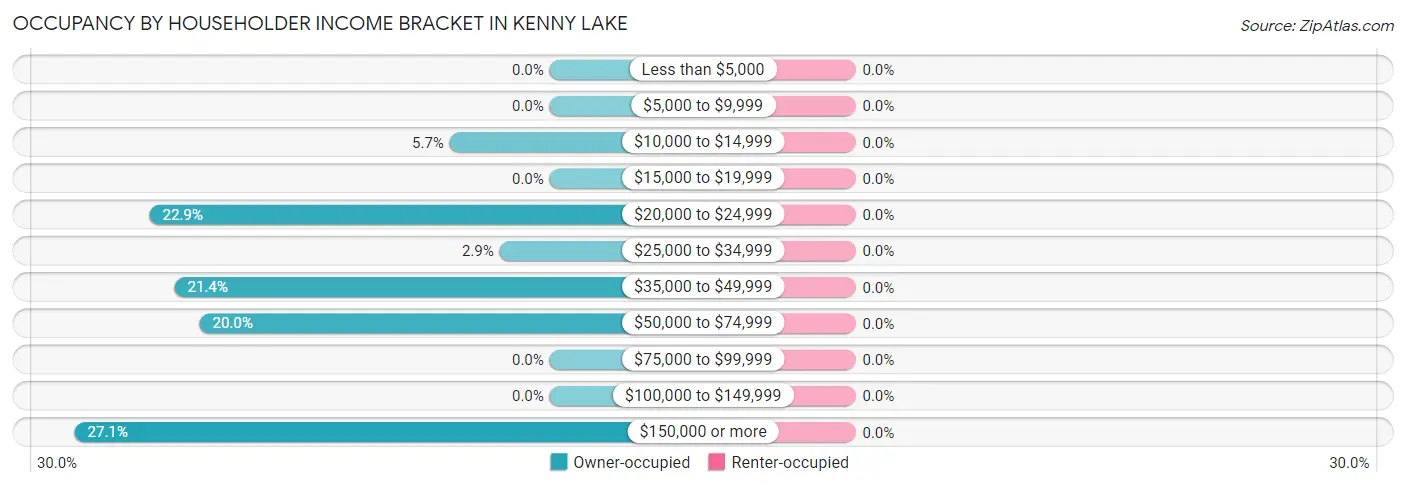
| Income Bracket | Owner-occupied | Renter-occupied |
| Less than $5,000 | 0 (0.0%) | 0 (0.0%) |
| $5,000 to $9,999 | 0 (0.0%) | 0 (0.0%) |
| $10,000 to $14,999 | 4 (5.7%) | 0 (0.0%) |
| $15,000 to $19,999 | 0 (0.0%) | 0 (0.0%) |
| $20,000 to $24,999 | 16 (22.9%) | 0 (0.0%) |
| $25,000 to $34,999 | 2 (2.9%) | 0 (0.0%) |
| $35,000 to $49,999 | 15 (21.4%) | 0 (0.0%) |
| $50,000 to $74,999 | 14 (20.0%) | 0 (0.0%) |
| $75,000 to $99,999 | 0 (0.0%) | 0 (0.0%) |
| $100,000 to $149,999 | 0 (0.0%) | 0 (0.0%) |
| $150,000 or more | 19 (27.1%) | 0 (0.0%) |
| Total | 70 (100.0%) | 0 (0.0%) |
Monthly Housing Cost Tiers in Kenny Lake
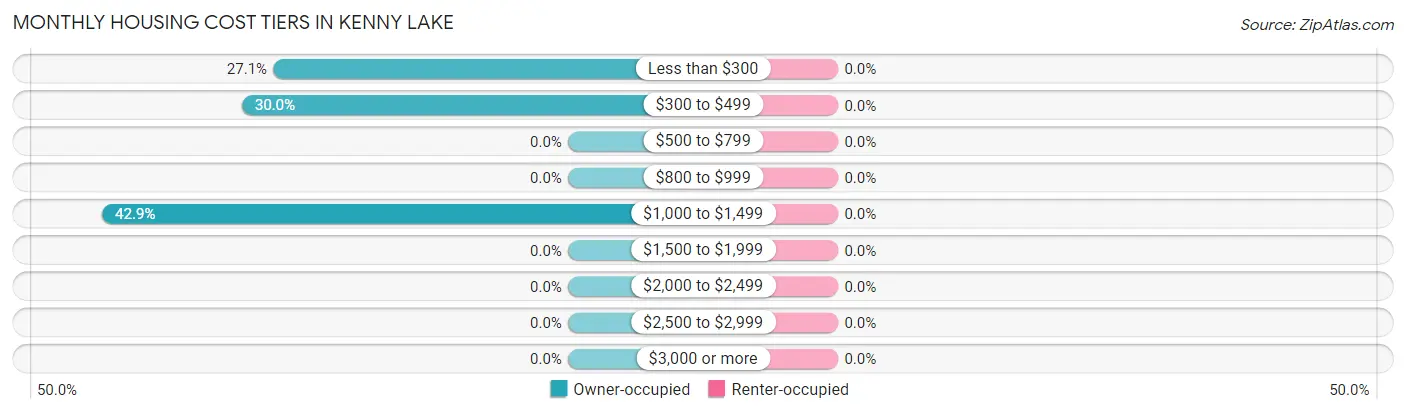
| Monthly Cost | Owner-occupied | Renter-occupied |
| Less than $300 | 19 (27.1%) | 0 (0.0%) |
| $300 to $499 | 21 (30.0%) | 0 (0.0%) |
| $500 to $799 | 0 (0.0%) | 0 (0.0%) |
| $800 to $999 | 0 (0.0%) | 0 (0.0%) |
| $1,000 to $1,499 | 30 (42.9%) | 0 (0.0%) |
| $1,500 to $1,999 | 0 (0.0%) | 0 (0.0%) |
| $2,000 to $2,499 | 0 (0.0%) | 0 (0.0%) |
| $2,500 to $2,999 | 0 (0.0%) | 0 (0.0%) |
| $3,000 or more | 0 (0.0%) | 0 (0.0%) |
| Total | 70 (100.0%) | 0 (0.0%) |
Physical Housing Characteristics in Kenny Lake
Housing Structures in Kenny Lake
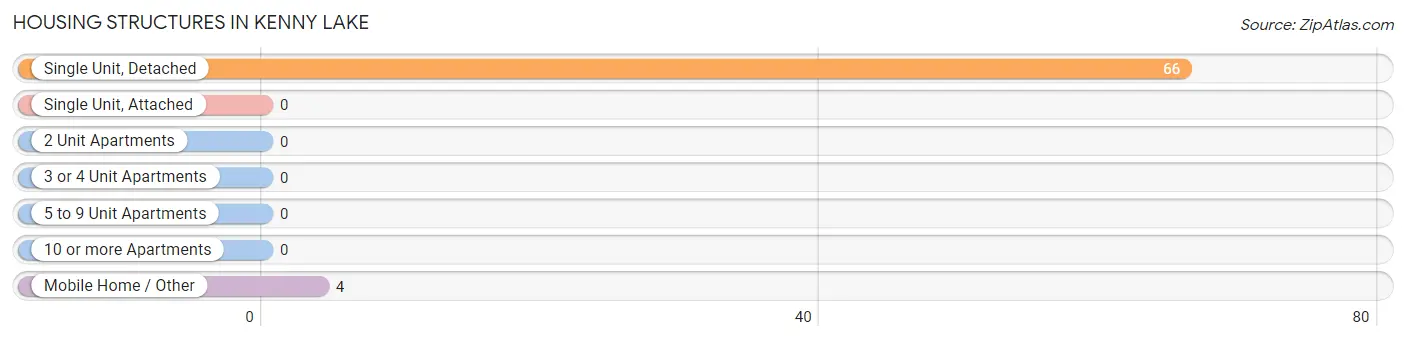
| Structure Type | # Housing Units | % Housing Units |
| Single Unit, Detached | 66 | 94.3% |
| Single Unit, Attached | 0 | 0.0% |
| 2 Unit Apartments | 0 | 0.0% |
| 3 or 4 Unit Apartments | 0 | 0.0% |
| 5 to 9 Unit Apartments | 0 | 0.0% |
| 10 or more Apartments | 0 | 0.0% |
| Mobile Home / Other | 4 | 5.7% |
| Total | 70 | 100.0% |
Housing Structures by Occupancy in Kenny Lake
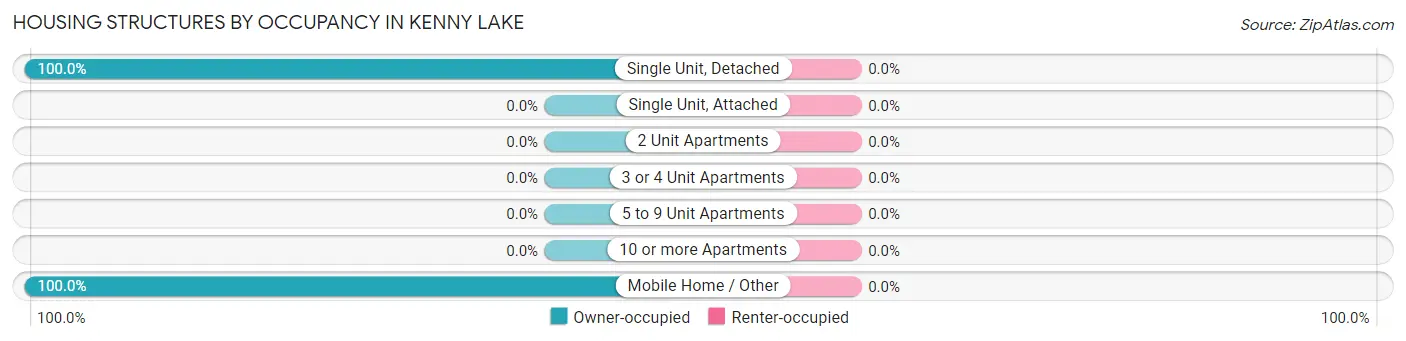
| Structure Type | Owner-occupied | Renter-occupied |
| Single Unit, Detached | 66 (100.0%) | 0 (0.0%) |
| Single Unit, Attached | 0 (0.0%) | 0 (0.0%) |
| 2 Unit Apartments | 0 (0.0%) | 0 (0.0%) |
| 3 or 4 Unit Apartments | 0 (0.0%) | 0 (0.0%) |
| 5 to 9 Unit Apartments | 0 (0.0%) | 0 (0.0%) |
| 10 or more Apartments | 0 (0.0%) | 0 (0.0%) |
| Mobile Home / Other | 4 (100.0%) | 0 (0.0%) |
| Total | 70 (100.0%) | 0 (0.0%) |
Housing Structures by Number of Rooms in Kenny Lake
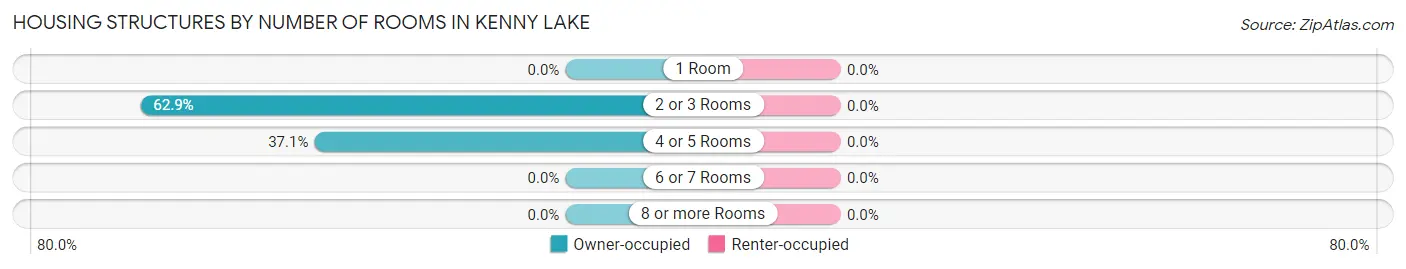
| Number of Rooms | Owner-occupied | Renter-occupied |
| 1 Room | 0 (0.0%) | 0 (0.0%) |
| 2 or 3 Rooms | 44 (62.9%) | 0 (0.0%) |
| 4 or 5 Rooms | 26 (37.1%) | 0 (0.0%) |
| 6 or 7 Rooms | 0 (0.0%) | 0 (0.0%) |
| 8 or more Rooms | 0 (0.0%) | 0 (0.0%) |
| Total | 70 (100.0%) | 0 (0.0%) |
Housing Structure by Heating Type in Kenny Lake
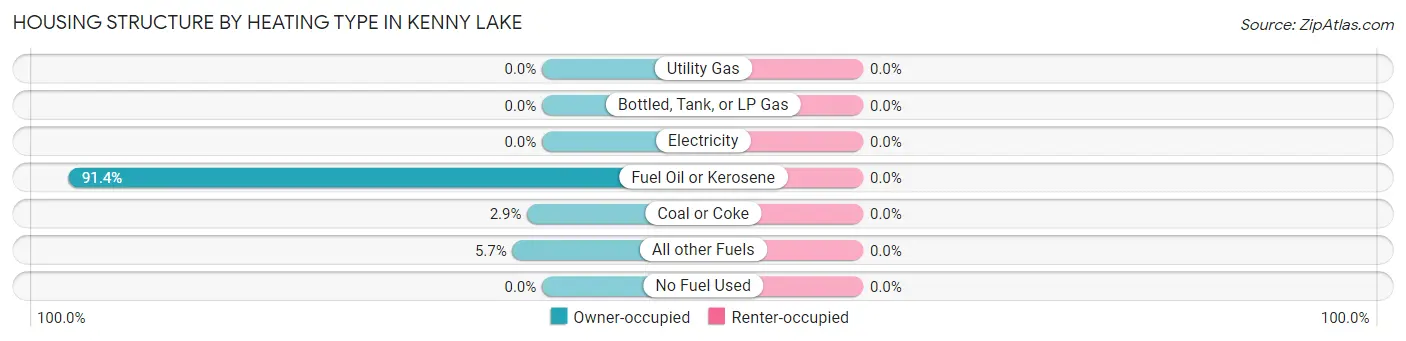
| Heating Type | Owner-occupied | Renter-occupied |
| Utility Gas | 0 (0.0%) | 0 (0.0%) |
| Bottled, Tank, or LP Gas | 0 (0.0%) | 0 (0.0%) |
| Electricity | 0 (0.0%) | 0 (0.0%) |
| Fuel Oil or Kerosene | 64 (91.4%) | 0 (0.0%) |
| Coal or Coke | 2 (2.9%) | 0 (0.0%) |
| All other Fuels | 4 (5.7%) | 0 (0.0%) |
| No Fuel Used | 0 (0.0%) | 0 (0.0%) |
| Total | 70 (100.0%) | 0 (0.0%) |
Household Vehicle Usage in Kenny Lake
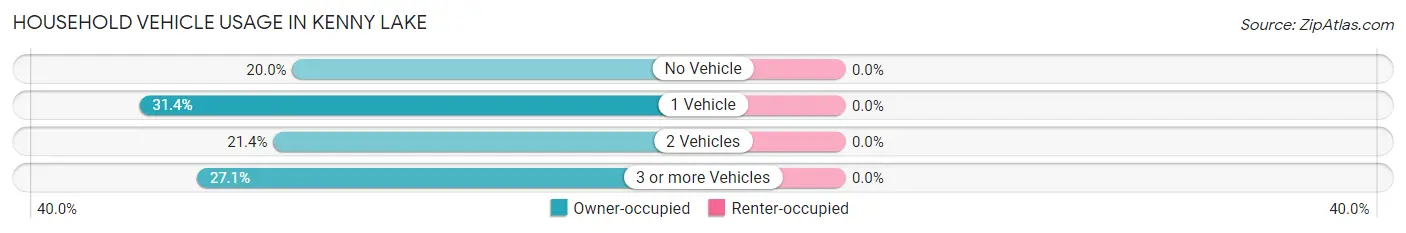
| Vehicles per Household | Owner-occupied | Renter-occupied |
| No Vehicle | 14 (20.0%) | 0 (0.0%) |
| 1 Vehicle | 22 (31.4%) | 0 (0.0%) |
| 2 Vehicles | 15 (21.4%) | 0 (0.0%) |
| 3 or more Vehicles | 19 (27.1%) | 0 (0.0%) |
| Total | 70 (100.0%) | 0 (0.0%) |
Real Estate & Mortgages in Kenny Lake
Real Estate and Mortgage Overview in Kenny Lake
| Characteristic | Without Mortgage | With Mortgage |
| Housing Units | 40 | 30 |
| Median Property Value | $164,000 | $0 |
| Median Household Income | - | - |
| Monthly Housing Costs | - | - |
| Real Estate Taxes | - | - |
Property Value by Mortgage Status in Kenny Lake
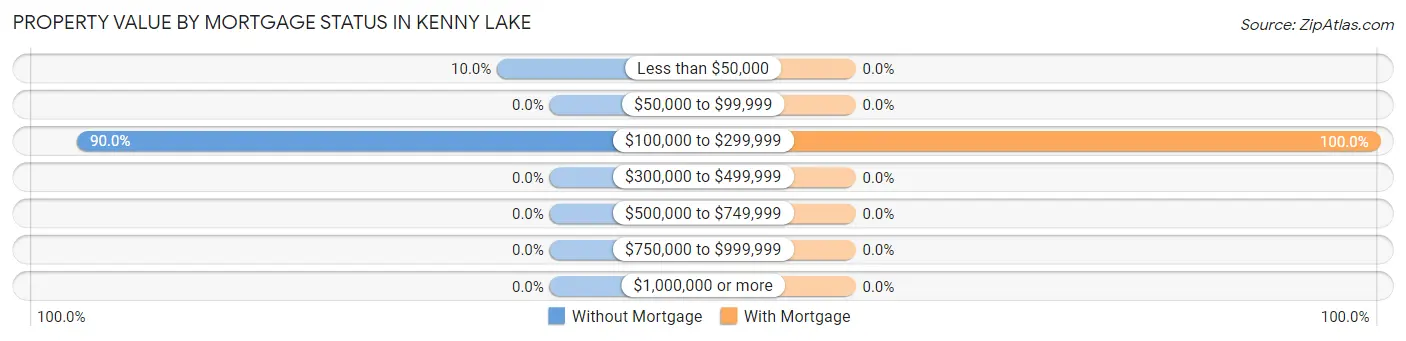
| Property Value | Without Mortgage | With Mortgage |
| Less than $50,000 | 4 (10.0%) | 0 (0.0%) |
| $50,000 to $99,999 | 0 (0.0%) | 0 (0.0%) |
| $100,000 to $299,999 | 36 (90.0%) | 30 (100.0%) |
| $300,000 to $499,999 | 0 (0.0%) | 0 (0.0%) |
| $500,000 to $749,999 | 0 (0.0%) | 0 (0.0%) |
| $750,000 to $999,999 | 0 (0.0%) | 0 (0.0%) |
| $1,000,000 or more | 0 (0.0%) | 0 (0.0%) |
| Total | 40 (100.0%) | 30 (100.0%) |
Household Income by Mortgage Status in Kenny Lake
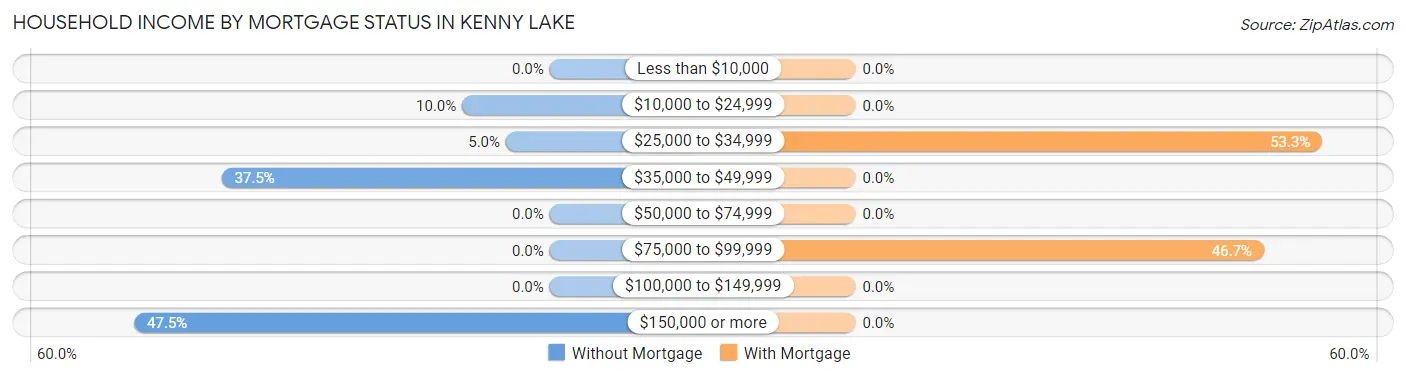
| Household Income | Without Mortgage | With Mortgage |
| Less than $10,000 | 0 (0.0%) | 0 (0.0%) |
| $10,000 to $24,999 | 4 (10.0%) | 0 (0.0%) |
| $25,000 to $34,999 | 2 (5.0%) | 16 (53.3%) |
| $35,000 to $49,999 | 15 (37.5%) | 0 (0.0%) |
| $50,000 to $74,999 | 0 (0.0%) | 0 (0.0%) |
| $75,000 to $99,999 | 0 (0.0%) | 14 (46.7%) |
| $100,000 to $149,999 | 0 (0.0%) | 0 (0.0%) |
| $150,000 or more | 19 (47.5%) | 0 (0.0%) |
| Total | 40 (100.0%) | 30 (100.0%) |
Property Value to Household Income Ratio in Kenny Lake
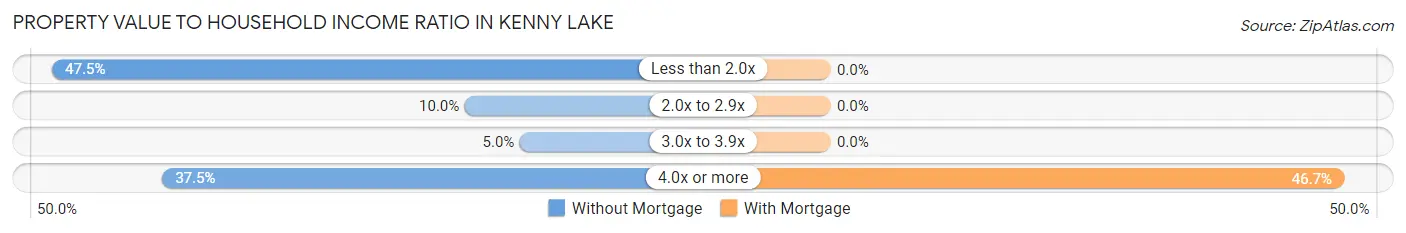
| Value-to-Income Ratio | Without Mortgage | With Mortgage |
| Less than 2.0x | 19 (47.5%) | 0 (0.0%) |
| 2.0x to 2.9x | 4 (10.0%) | 0 (0.0%) |
| 3.0x to 3.9x | 2 (5.0%) | 0 (0.0%) |
| 4.0x or more | 15 (37.5%) | 14 (46.7%) |
| Total | 40 (100.0%) | 30 (100.0%) |
Real Estate Taxes by Mortgage Status in Kenny Lake
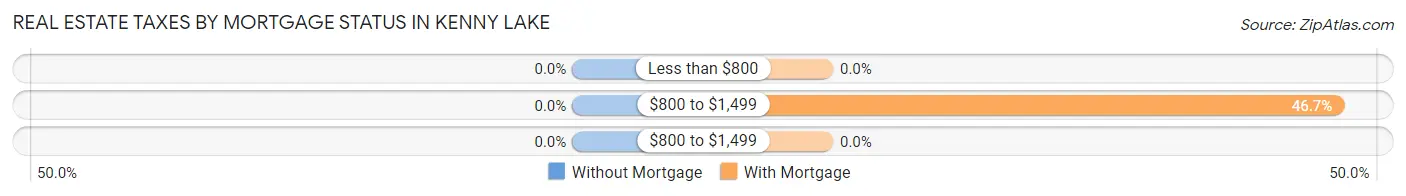
| Property Taxes | Without Mortgage | With Mortgage |
| Less than $800 | 0 (0.0%) | 0 (0.0%) |
| $800 to $1,499 | 0 (0.0%) | 14 (46.7%) |
| $800 to $1,499 | 0 (0.0%) | 0 (0.0%) |
| Total | 40 (100.0%) | 30 (100.0%) |
Health & Disability in Kenny Lake
Health Insurance Coverage by Age in Kenny Lake
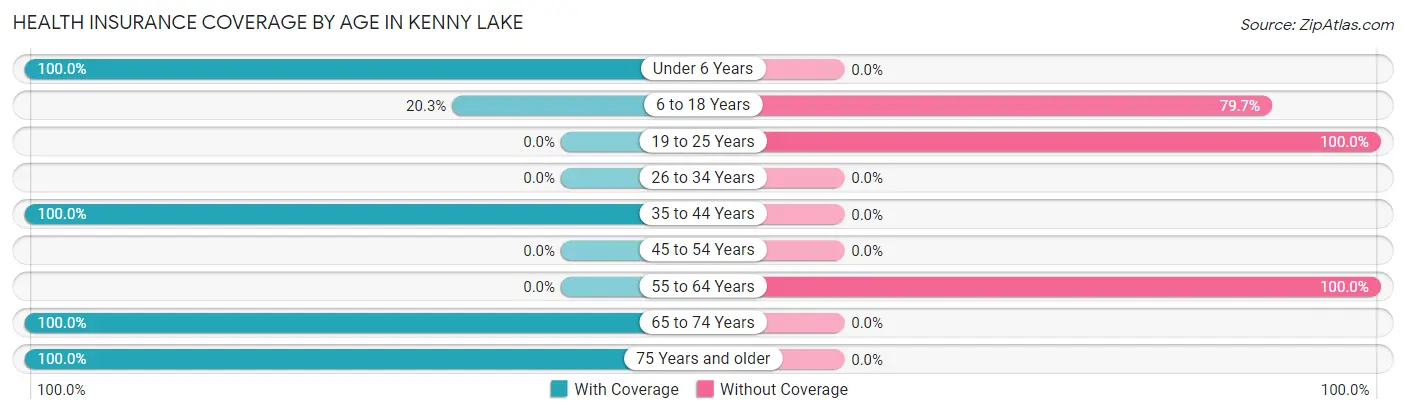
| Age Bracket | With Coverage | Without Coverage |
| Under 6 Years | 25 (100.0%) | 0 (0.0%) |
| 6 to 18 Years | 15 (20.3%) | 59 (79.7%) |
| 19 to 25 Years | 0 (0.0%) | 19 (100.0%) |
| 26 to 34 Years | 0 (0.0%) | 0 (0.0%) |
| 35 to 44 Years | 51 (100.0%) | 0 (0.0%) |
| 45 to 54 Years | 0 (0.0%) | 0 (0.0%) |
| 55 to 64 Years | 0 (0.0%) | 14 (100.0%) |
| 65 to 74 Years | 23 (100.0%) | 0 (0.0%) |
| 75 Years and older | 16 (100.0%) | 0 (0.0%) |
| Total | 130 (58.6%) | 92 (41.4%) |
Health Insurance Coverage by Citizenship Status in Kenny Lake
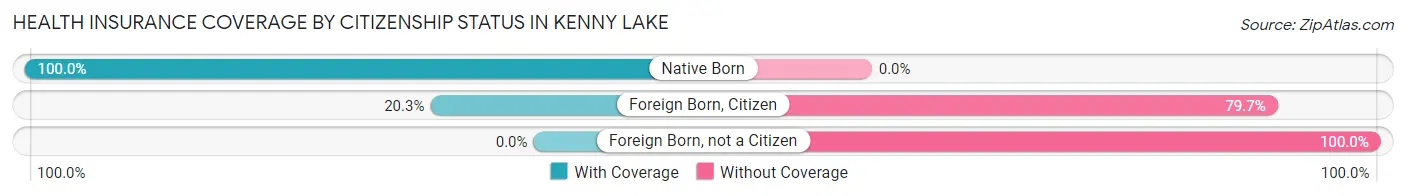
| Citizenship Status | With Coverage | Without Coverage |
| Native Born | 25 (100.0%) | 0 (0.0%) |
| Foreign Born, Citizen | 15 (20.3%) | 59 (79.7%) |
| Foreign Born, not a Citizen | 0 (0.0%) | 19 (100.0%) |
Health Insurance Coverage by Household Income in Kenny Lake
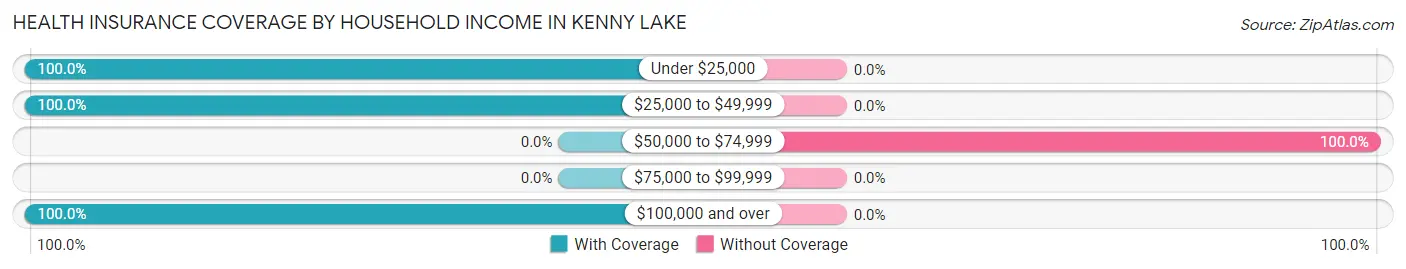
| Household Income | With Coverage | Without Coverage |
| Under $25,000 | 20 (100.0%) | 0 (0.0%) |
| $25,000 to $49,999 | 72 (100.0%) | 0 (0.0%) |
| $50,000 to $74,999 | 0 (0.0%) | 92 (100.0%) |
| $75,000 to $99,999 | 0 (0.0%) | 0 (0.0%) |
| $100,000 and over | 38 (100.0%) | 0 (0.0%) |
Public vs Private Health Insurance Coverage by Age in Kenny Lake
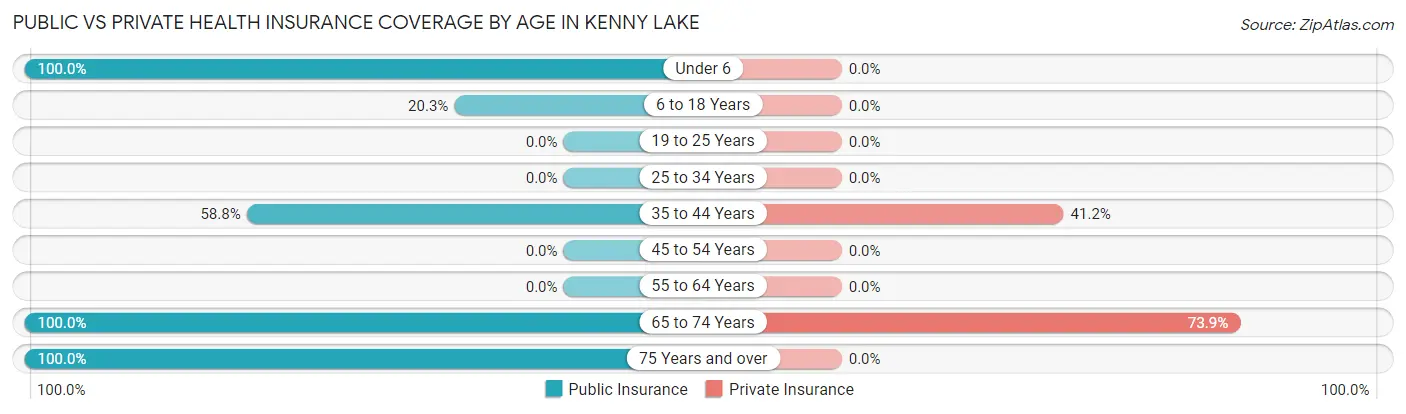
| Age Bracket | Public Insurance | Private Insurance |
| Under 6 | 25 (100.0%) | 0 (0.0%) |
| 6 to 18 Years | 15 (20.3%) | 0 (0.0%) |
| 19 to 25 Years | 0 (0.0%) | 0 (0.0%) |
| 25 to 34 Years | 0 (0.0%) | 0 (0.0%) |
| 35 to 44 Years | 30 (58.8%) | 21 (41.2%) |
| 45 to 54 Years | 0 (0.0%) | 0 (0.0%) |
| 55 to 64 Years | 0 (0.0%) | 0 (0.0%) |
| 65 to 74 Years | 23 (100.0%) | 17 (73.9%) |
| 75 Years and over | 16 (100.0%) | 0 (0.0%) |
| Total | 109 (49.1%) | 38 (17.1%) |
Disability Status by Sex by Age in Kenny Lake
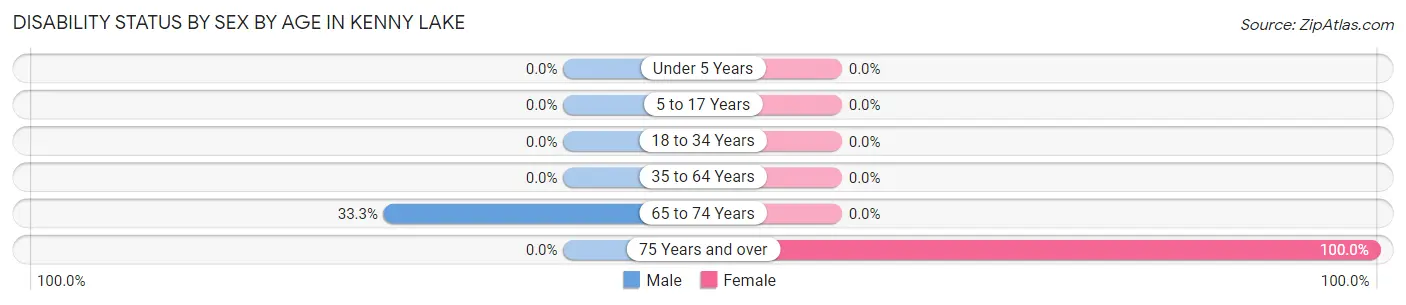
| Age Bracket | Male | Female |
| Under 5 Years | 0 (0.0%) | 0 (0.0%) |
| 5 to 17 Years | 0 (0.0%) | 0 (0.0%) |
| 18 to 34 Years | 0 (0.0%) | 0 (0.0%) |
| 35 to 64 Years | 0 (0.0%) | 0 (0.0%) |
| 65 to 74 Years | 4 (33.3%) | 0 (0.0%) |
| 75 Years and over | 0 (0.0%) | 16 (100.0%) |
Disability Class by Sex by Age in Kenny Lake
Disability Class: Hearing Difficulty
| Age Bracket | Male | Female |
| Under 5 Years | 0 (0.0%) | 0 (0.0%) |
| 5 to 17 Years | 0 (0.0%) | 0 (0.0%) |
| 18 to 34 Years | 0 (0.0%) | 0 (0.0%) |
| 35 to 64 Years | 0 (0.0%) | 0 (0.0%) |
| 65 to 74 Years | 0 (0.0%) | 0 (0.0%) |
| 75 Years and over | 0 (0.0%) | 0 (0.0%) |
Disability Class: Vision Difficulty
| Age Bracket | Male | Female |
| Under 5 Years | 0 (0.0%) | 0 (0.0%) |
| 5 to 17 Years | 0 (0.0%) | 0 (0.0%) |
| 18 to 34 Years | 0 (0.0%) | 0 (0.0%) |
| 35 to 64 Years | 0 (0.0%) | 0 (0.0%) |
| 65 to 74 Years | 4 (33.3%) | 0 (0.0%) |
| 75 Years and over | 0 (0.0%) | 0 (0.0%) |
Disability Class: Cognitive Difficulty
| Age Bracket | Male | Female |
| 5 to 17 Years | 0 (0.0%) | 0 (0.0%) |
| 18 to 34 Years | 0 (0.0%) | 0 (0.0%) |
| 35 to 64 Years | 0 (0.0%) | 0 (0.0%) |
| 65 to 74 Years | 0 (0.0%) | 0 (0.0%) |
| 75 Years and over | 0 (0.0%) | 16 (100.0%) |
Disability Class: Ambulatory Difficulty
| Age Bracket | Male | Female |
| 5 to 17 Years | 0 (0.0%) | 0 (0.0%) |
| 18 to 34 Years | 0 (0.0%) | 0 (0.0%) |
| 35 to 64 Years | 0 (0.0%) | 0 (0.0%) |
| 65 to 74 Years | 0 (0.0%) | 0 (0.0%) |
| 75 Years and over | 0 (0.0%) | 16 (100.0%) |
Disability Class: Self-Care Difficulty
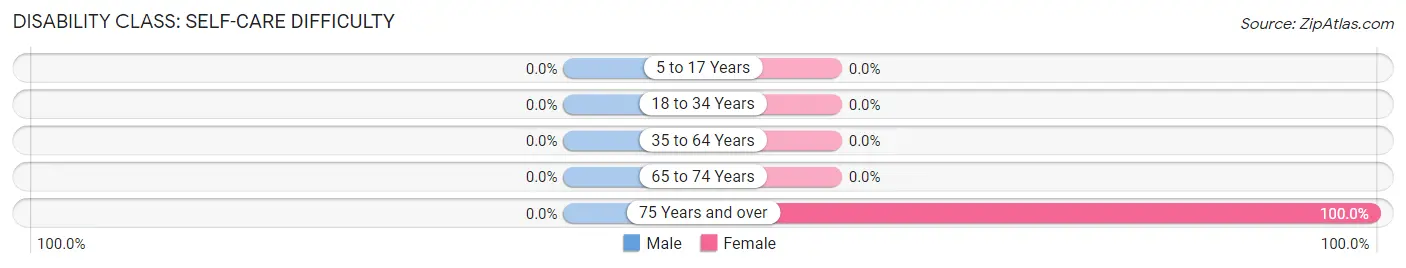
| Age Bracket | Male | Female |
| 5 to 17 Years | 0 (0.0%) | 0 (0.0%) |
| 18 to 34 Years | 0 (0.0%) | 0 (0.0%) |
| 35 to 64 Years | 0 (0.0%) | 0 (0.0%) |
| 65 to 74 Years | 0 (0.0%) | 0 (0.0%) |
| 75 Years and over | 0 (0.0%) | 16 (100.0%) |
Technology Access in Kenny Lake
Computing Device Access in Kenny Lake
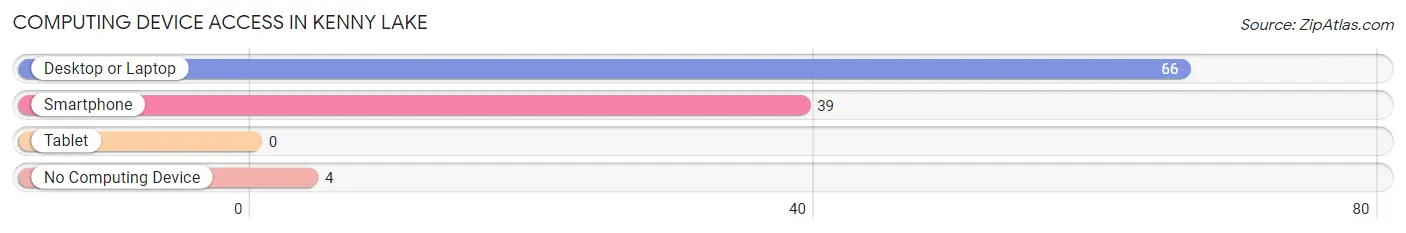
| Device Type | # Households | % Households |
| Desktop or Laptop | 66 | 94.3% |
| Smartphone | 39 | 55.7% |
| Tablet | 0 | 0.0% |
| No Computing Device | 4 | 5.7% |
| Total | 70 | 100.0% |
Internet Access in Kenny Lake
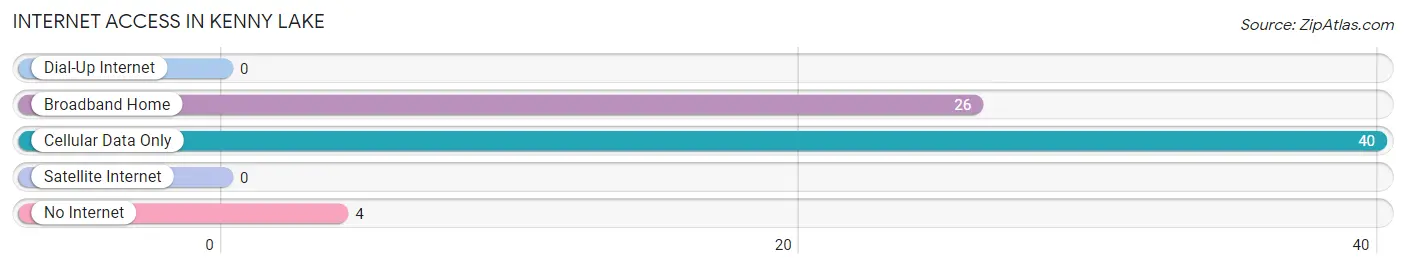
| Internet Type | # Households | % Households |
| Dial-Up Internet | 0 | 0.0% |
| Broadband Home | 26 | 37.1% |
| Cellular Data Only | 40 | 57.1% |
| Satellite Internet | 0 | 0.0% |
| No Internet | 4 | 5.7% |
| Total | 70 | 100.0% |
Kenny Lake Summary
Kenny Lake is a small unincorporated community located in the Copper River Valley of Southcentral Alaska. It is situated on the banks of the Copper River, approximately 40 miles east of the city of Glennallen. The community is home to approximately 200 people, most of whom are of Native American descent.
History
Kenny Lake was first settled by Native Americans in the late 1800s. The area was used as a seasonal fishing camp by the Ahtna people, who would come to the area to fish for salmon in the Copper River. The first non-Native settlers arrived in the area in the early 1900s, and the community was officially established in 1912. The community was named after a local prospector, Kenny Smith, who had discovered gold in the area.
The early settlers of Kenny Lake were mostly miners and trappers, who were attracted to the area by the abundance of natural resources. The community grew slowly over the years, and by the 1950s, it had become a popular tourist destination. The community was connected to the rest of Alaska by the Alaska Highway in the late 1950s, and the population began to grow rapidly.
Geography
Kenny Lake is located in the Copper River Valley of Southcentral Alaska. The community is situated on the banks of the Copper River, approximately 40 miles east of the city of Glennallen. The area is characterized by rolling hills and mountains, with the highest peak in the area being Mount Drum, which rises to an elevation of 11,000 feet. The climate in the area is generally mild, with temperatures ranging from the mid-30s in the winter to the mid-70s in the summer.
Economy
Kenny Lake’s economy is largely based on tourism and subsistence activities. The community is a popular destination for outdoor enthusiasts, who come to the area to take advantage of the abundant fishing, hunting, and hiking opportunities. The local economy is also supported by the nearby mining industry, which provides jobs for many of the local residents.
Demographics
As of the 2010 census, the population of Kenny Lake was 197. The racial makeup of the community was 95.4% Native American, 2.5% White, 0.5% Asian, and 1.6% from other races. The median household income in the community was $31,250, and the median age was 37. The unemployment rate in the community was 8.3%.
Kenny Lake is a small, rural community with a rich history and a vibrant culture. The community is home to a diverse population of Native Americans, miners, and outdoor enthusiasts, who all contribute to the unique character of the area. The local economy is largely based on tourism and subsistence activities, and the community is a popular destination for outdoor enthusiasts.
Common Questions
What is Per Capita Income in Kenny Lake?
Per Capita income in Kenny Lake is $27,999.
What is the Median Household income in Kenny Lake?
Median Household Income in Kenny Lake is $39,667.
What is Inequality or Gini Index in Kenny Lake?
Inequality or Gini Index in Kenny Lake is 0.49.
What is the Total Population of Kenny Lake?
Total Population of Kenny Lake is 222.
What is the Total Male Population of Kenny Lake?
Total Male Population of Kenny Lake is 110.
What is the Total Female Population of Kenny Lake?
Total Female Population of Kenny Lake is 112.
What is the Ratio of Males per 100 Females in Kenny Lake?
There are 98.21 Males per 100 Females in Kenny Lake.
What is the Ratio of Females per 100 Males in Kenny Lake?
There are 101.82 Females per 100 Males in Kenny Lake.
What is the Median Population Age in Kenny Lake?
Median Population Age in Kenny Lake is 20.6 Years.
What is the Average Family Size in Kenny Lake
Average Family Size in Kenny Lake is 4.2 People.
What is the Average Household Size in Kenny Lake
Average Household Size in Kenny Lake is 3.2 People.
How Large is the Labor Force in Kenny Lake?
There are 69 People in the Labor Forcein in Kenny Lake.
What is the Percentage of People in the Labor Force in Kenny Lake?
50.0% of People are in the Labor Force in Kenny Lake.