South Park, WY Map & Demographics
South Park Map
South Park Overview
$73,113
PER CAPITA INCOME
$114,492
AVG FAMILY INCOME
$109,402
AVG HOUSEHOLD INCOME
0.45
INEQUALITY / GINI INDEX
1,899
TOTAL POPULATION
882
MALE POPULATION
1,017
FEMALE POPULATION
86.73
MALES / 100 FEMALES
115.31
FEMALES / 100 MALES
52.1
MEDIAN AGE
2.9
AVG FAMILY SIZE
2.6
AVG HOUSEHOLD SIZE
1,094
LABOR FORCE [ PEOPLE ]
73.9%
PERCENT IN LABOR FORCE
3.6%
UNEMPLOYMENT RATE
Income in South Park
Income Overview in South Park
Per Capita Income in South Park is $73,113, while median incomes of families and households are $114,492 and $109,402 respectively.
| Characteristic | Number | Measure |
| Per Capita Income | 1,899 | $73,113 |
| Median Family Income | 601 | $114,492 |
| Mean Family Income | 601 | $210,041 |
| Median Household Income | 739 | $109,402 |
| Mean Household Income | 739 | $188,733 |
| Income Deficit | 601 | $0 |
| Wage / Income Gap (%) | 1,899 | 0.00% |
| Wage / Income Gap ($) | 1,899 | 100.00¢ per $1 |
| Gini / Inequality Index | 1,899 | 0.45 |
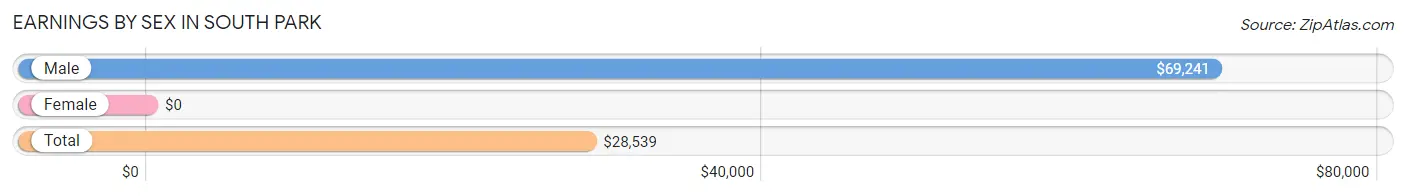
Earnings by Sex in South Park
| Sex | Number | Average Earnings |
| Male | 477 (41.7%) | $69,241 |
| Female | 668 (58.3%) | $0 |
| Total | 1,145 (100.0%) | $28,539 |
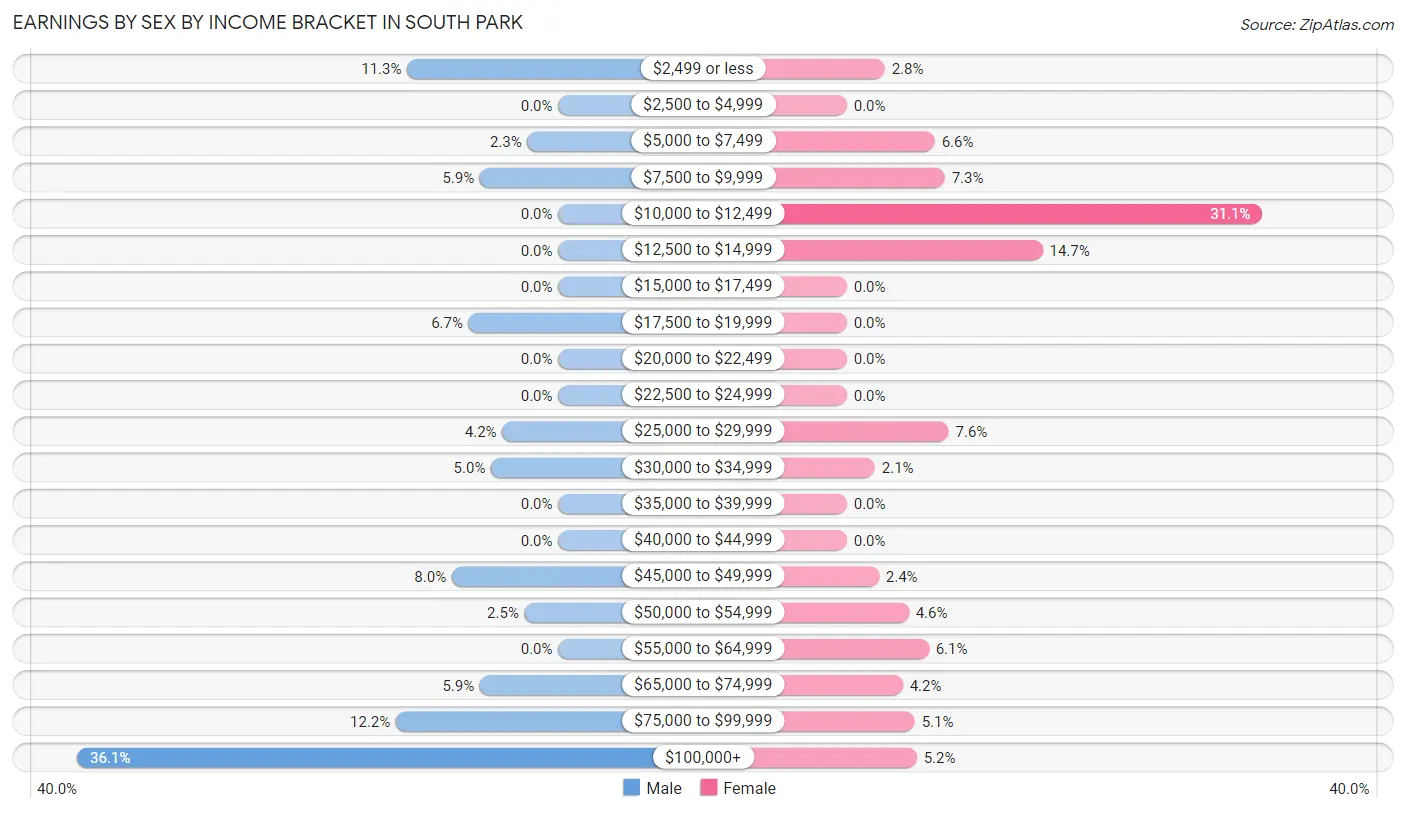
Earnings by Sex by Income Bracket in South Park
The most common earnings brackets in South Park are $100,000+ for men (172 | 36.1%) and $10,000 to $12,499 for women (208 | 31.1%).
| Income | Male | Female |
| $2,499 or less | 54 (11.3%) | 19 (2.8%) |
| $2,500 to $4,999 | 0 (0.0%) | 0 (0.0%) |
| $5,000 to $7,499 | 11 (2.3%) | 44 (6.6%) |
| $7,500 to $9,999 | 28 (5.9%) | 49 (7.3%) |
| $10,000 to $12,499 | 0 (0.0%) | 208 (31.1%) |
| $12,500 to $14,999 | 0 (0.0%) | 98 (14.7%) |
| $15,000 to $17,499 | 0 (0.0%) | 0 (0.0%) |
| $17,500 to $19,999 | 32 (6.7%) | 0 (0.0%) |
| $20,000 to $22,499 | 0 (0.0%) | 0 (0.0%) |
| $22,500 to $24,999 | 0 (0.0%) | 0 (0.0%) |
| $25,000 to $29,999 | 20 (4.2%) | 51 (7.6%) |
| $30,000 to $34,999 | 24 (5.0%) | 14 (2.1%) |
| $35,000 to $39,999 | 0 (0.0%) | 0 (0.0%) |
| $40,000 to $44,999 | 0 (0.0%) | 0 (0.0%) |
| $45,000 to $49,999 | 38 (8.0%) | 16 (2.4%) |
| $50,000 to $54,999 | 12 (2.5%) | 31 (4.6%) |
| $55,000 to $64,999 | 0 (0.0%) | 41 (6.1%) |
| $65,000 to $74,999 | 28 (5.9%) | 28 (4.2%) |
| $75,000 to $99,999 | 58 (12.2%) | 34 (5.1%) |
| $100,000+ | 172 (36.1%) | 35 (5.2%) |
| Total | 477 (100.0%) | 668 (100.0%) |
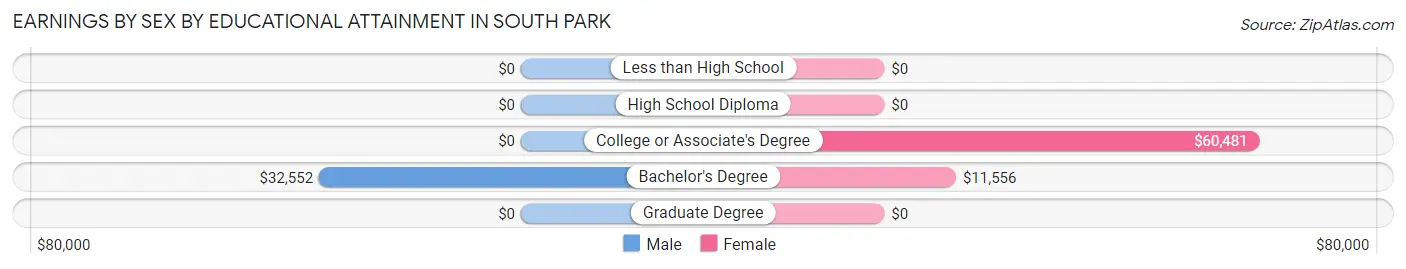
Earnings by Sex by Educational Attainment in South Park
| Educational Attainment | Male Income | Female Income |
| Less than High School | - | - |
| High School Diploma | - | - |
| College or Associate's Degree | - | - |
| Bachelor's Degree | $32,552 | $11,556 |
| Graduate Degree | - | - |
| Total | $90,345 | $0 |
Family Income in South Park
Family Income Brackets in South Park
According to the South Park family income data, there are 207 families falling into the $200,000+ income range, which is the most common income bracket and makes up 34.4% of all families.
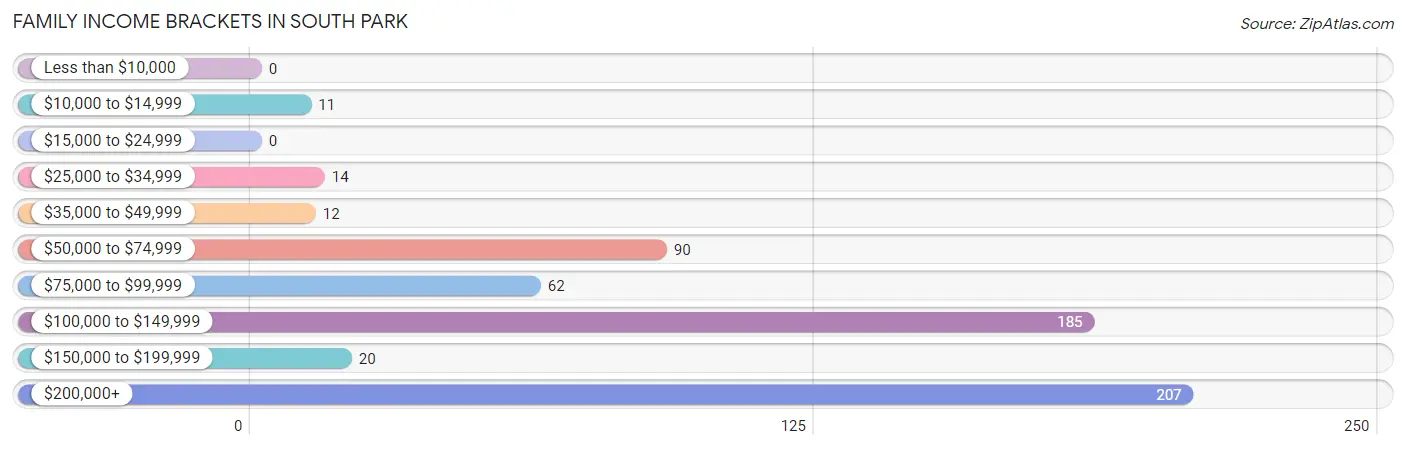
| Income Bracket | # Families | % Families |
| Less than $10,000 | 0 | 0.0% |
| $10,000 to $14,999 | 11 | 1.8% |
| $15,000 to $24,999 | 0 | 0.0% |
| $25,000 to $34,999 | 14 | 2.3% |
| $35,000 to $49,999 | 12 | 2.0% |
| $50,000 to $74,999 | 90 | 15.0% |
| $75,000 to $99,999 | 62 | 10.3% |
| $100,000 to $149,999 | 185 | 30.8% |
| $150,000 to $199,999 | 20 | 3.3% |
| $200,000+ | 207 | 34.4% |
Family Income by Famaliy Size in South Park
4-person families (100 | 16.6%) account for the highest median family income in South Park with $250,001 per family, while 4-person families (100 | 16.6%) have the highest median income of $62,500 per family member.
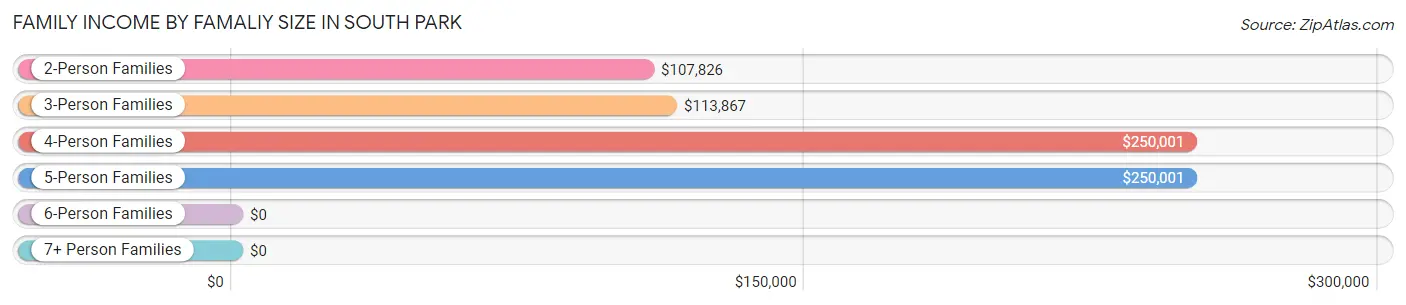
| Income Bracket | # Families | Median Income |
| 2-Person Families | 294 (48.9%) | $107,826 |
| 3-Person Families | 119 (19.8%) | $113,867 |
| 4-Person Families | 100 (16.6%) | $250,001 |
| 5-Person Families | 88 (14.6%) | $250,001 |
| 6-Person Families | 0 (0.0%) | $0 |
| 7+ Person Families | 0 (0.0%) | $0 |
| Total | 601 (100.0%) | $114,492 |
Family Income by Number of Earners in South Park
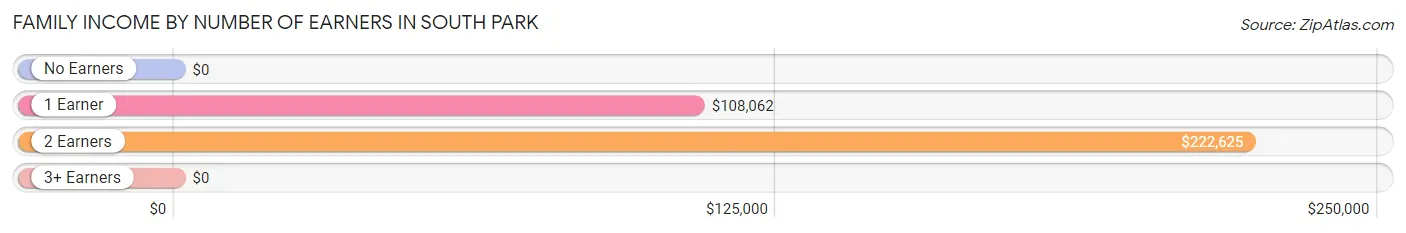
| Number of Earners | # Families | Median Income |
| No Earners | 22 (3.7%) | $0 |
| 1 Earner | 211 (35.1%) | $108,062 |
| 2 Earners | 315 (52.4%) | $222,625 |
| 3+ Earners | 53 (8.8%) | $0 |
| Total | 601 (100.0%) | $114,492 |
Household Income in South Park
Household Income Brackets in South Park
With 234 households falling in the category, the $200,000+ income range is the most frequent in South Park, accounting for 31.7% of all households.
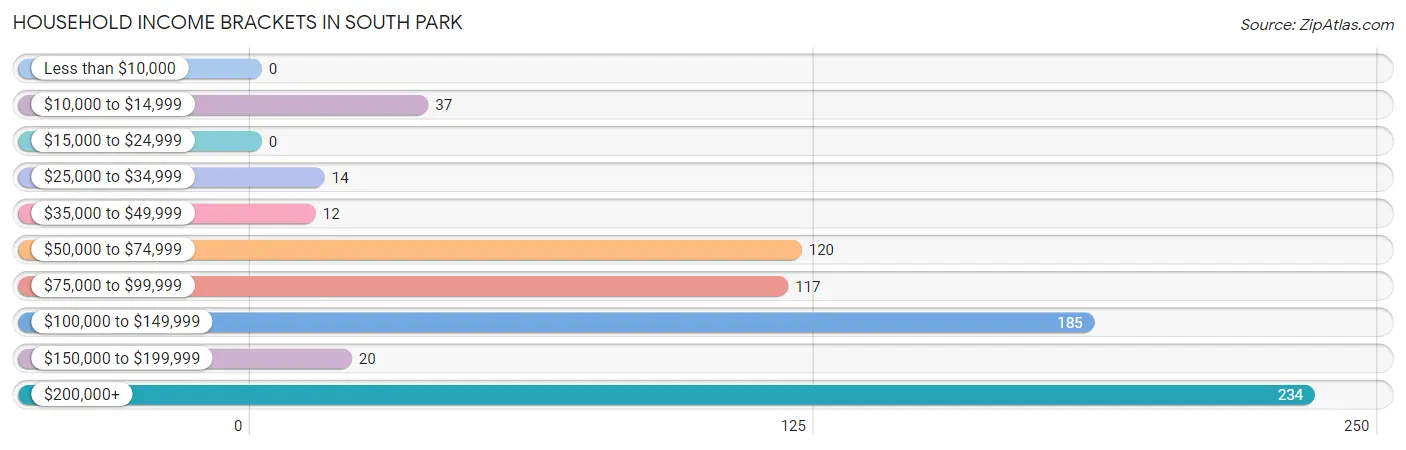
| Income Bracket | # Households | % Households |
| Less than $10,000 | 0 | 0.0% |
| $10,000 to $14,999 | 37 | 5.0% |
| $15,000 to $24,999 | 0 | 0.0% |
| $25,000 to $34,999 | 14 | 1.9% |
| $35,000 to $49,999 | 12 | 1.6% |
| $50,000 to $74,999 | 120 | 16.2% |
| $75,000 to $99,999 | 117 | 15.8% |
| $100,000 to $149,999 | 185 | 25.0% |
| $150,000 to $199,999 | 20 | 2.7% |
| $200,000+ | 234 | 31.7% |
Household Income by Householder Age in South Park
The median household income in South Park is $109,402, with the highest median household income of $108,388 found in the 65+ years age bracket for the primary householder. A total of 265 households (35.9%) fall into this category.
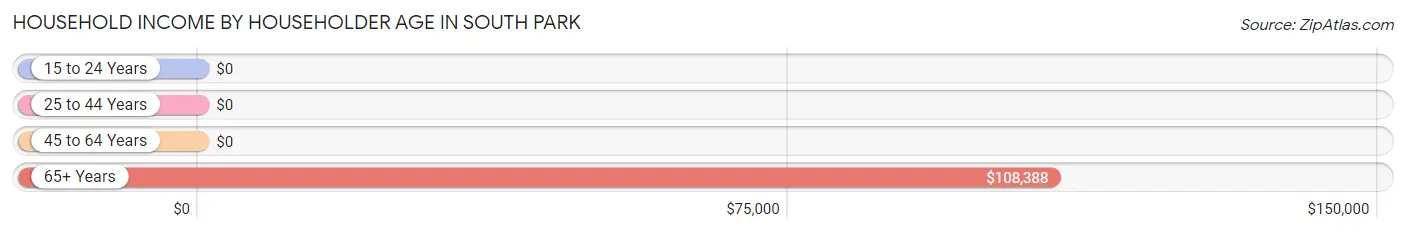
| Income Bracket | # Households | Median Income |
| 15 to 24 Years | 0 (0.0%) | $0 |
| 25 to 44 Years | 70 (9.5%) | $0 |
| 45 to 64 Years | 404 (54.7%) | $0 |
| 65+ Years | 265 (35.9%) | $108,388 |
| Total | 739 (100.0%) | $109,402 |
Poverty in South Park
Income Below Poverty by Sex and Age in South Park
With 1.0% poverty level for males and 3.6% for females among the residents of South Park, 55 to 64 year old males and 45 to 54 year old females are the most vulnerable to poverty, with 9 males (6.7%) and 26 females (12.9%) in their respective age groups living below the poverty level.
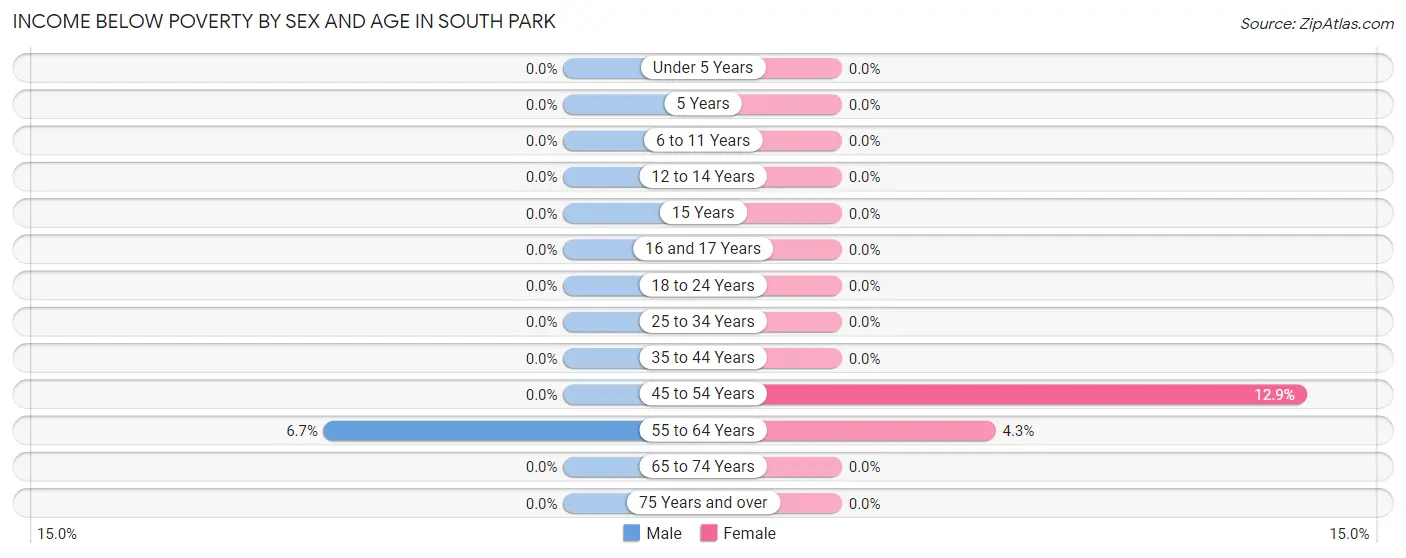
| Age Bracket | Male | Female |
| Under 5 Years | 0 (0.0%) | 0 (0.0%) |
| 5 Years | 0 (0.0%) | 0 (0.0%) |
| 6 to 11 Years | 0 (0.0%) | 0 (0.0%) |
| 12 to 14 Years | 0 (0.0%) | 0 (0.0%) |
| 15 Years | 0 (0.0%) | 0 (0.0%) |
| 16 and 17 Years | 0 (0.0%) | 0 (0.0%) |
| 18 to 24 Years | 0 (0.0%) | 0 (0.0%) |
| 25 to 34 Years | 0 (0.0%) | 0 (0.0%) |
| 35 to 44 Years | 0 (0.0%) | 0 (0.0%) |
| 45 to 54 Years | 0 (0.0%) | 26 (12.9%) |
| 55 to 64 Years | 9 (6.7%) | 11 (4.3%) |
| 65 to 74 Years | 0 (0.0%) | 0 (0.0%) |
| 75 Years and over | 0 (0.0%) | 0 (0.0%) |
| Total | 9 (1.0%) | 37 (3.6%) |
Income Above Poverty by Sex and Age in South Park
According to the poverty statistics in South Park, males aged under 5 years and females aged under 5 years are the age groups that are most secure financially, with 100.0% of males and 100.0% of females in these age groups living above the poverty line.
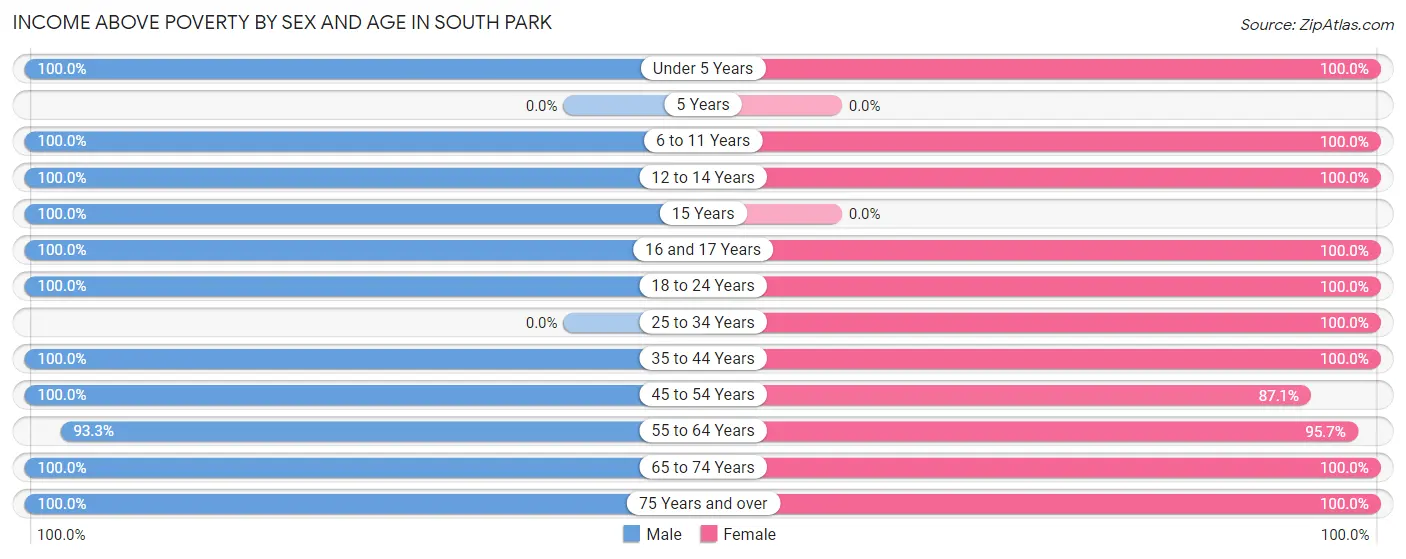
| Age Bracket | Male | Female |
| Under 5 Years | 9 (100.0%) | 28 (100.0%) |
| 5 Years | 0 (0.0%) | 0 (0.0%) |
| 6 to 11 Years | 126 (100.0%) | 75 (100.0%) |
| 12 to 14 Years | 96 (100.0%) | 51 (100.0%) |
| 15 Years | 34 (100.0%) | 0 (0.0%) |
| 16 and 17 Years | 13 (100.0%) | 12 (100.0%) |
| 18 to 24 Years | 12 (100.0%) | 17 (100.0%) |
| 25 to 34 Years | 0 (0.0%) | 65 (100.0%) |
| 35 to 44 Years | 82 (100.0%) | 97 (100.0%) |
| 45 to 54 Years | 195 (100.0%) | 175 (87.1%) |
| 55 to 64 Years | 126 (93.3%) | 246 (95.7%) |
| 65 to 74 Years | 140 (100.0%) | 94 (100.0%) |
| 75 Years and over | 40 (100.0%) | 120 (100.0%) |
| Total | 873 (99.0%) | 980 (96.4%) |
Income Below Poverty Among Married-Couple Families in South Park
The poverty statistics for married-couple families in South Park show that 1.9% or 11 of the total 563 families live below the poverty line. Families with no children have the highest poverty rate of 3.4%, comprising of 11 families. On the other hand, families with 1 or 2 children have the lowest poverty rate of 0.0%, which includes 0 families.
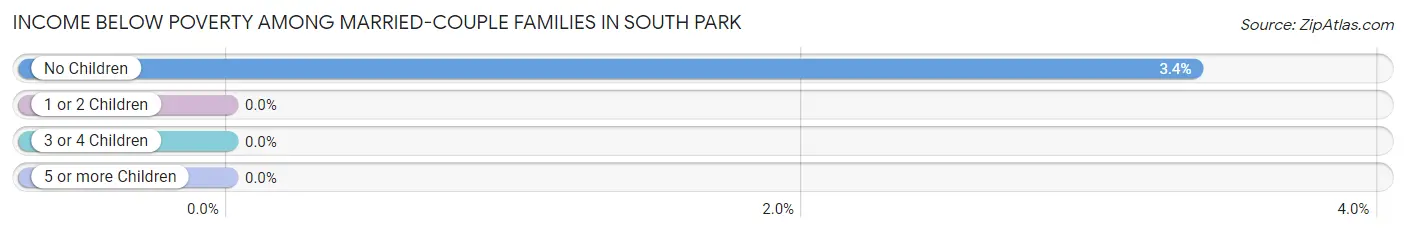
| Children | Above Poverty | Below Poverty |
| No Children | 316 (96.6%) | 11 (3.4%) |
| 1 or 2 Children | 148 (100.0%) | 0 (0.0%) |
| 3 or 4 Children | 88 (100.0%) | 0 (0.0%) |
| 5 or more Children | 0 (0.0%) | 0 (0.0%) |
| Total | 552 (98.1%) | 11 (1.9%) |
Income Below Poverty Among Single-Parent Households in South Park
| Children | Single Father | Single Mother |
| No Children | 0 (0.0%) | 0 (0.0%) |
| 1 or 2 Children | 0 (0.0%) | 0 (0.0%) |
| 3 or 4 Children | 0 (0.0%) | 0 (0.0%) |
| 5 or more Children | 0 (0.0%) | 0 (0.0%) |
| Total | 0 (0.0%) | 0 (0.0%) |
Income Below Poverty Among Married-Couple vs Single-Parent Households in South Park
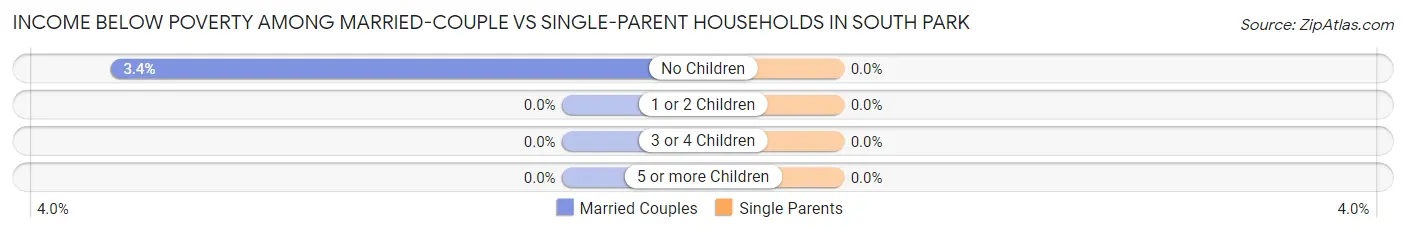
| Children | Married-Couple Families | Single-Parent Households |
| No Children | 11 (3.4%) | 0 (0.0%) |
| 1 or 2 Children | 0 (0.0%) | 0 (0.0%) |
| 3 or 4 Children | 0 (0.0%) | 0 (0.0%) |
| 5 or more Children | 0 (0.0%) | 0 (0.0%) |
| Total | 11 (1.9%) | 0 (0.0%) |
Race in South Park
The most populous races in South Park are White / Caucasian (1,846 | 97.2%), Hispanic or Latino (49 | 2.6%), and Asian (32 | 1.7%).
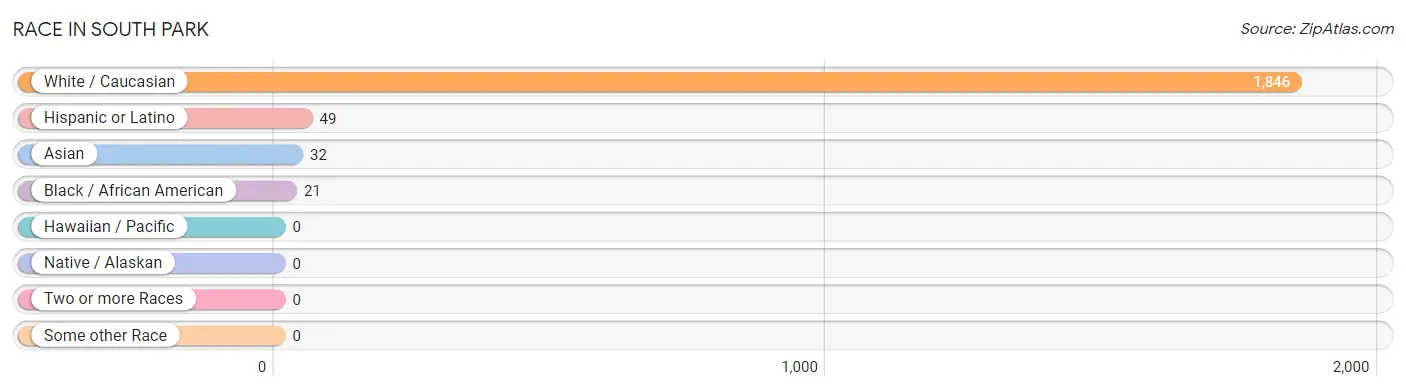
| Race | # Population | % Population |
| Asian | 32 | 1.7% |
| Black / African American | 21 | 1.1% |
| Hawaiian / Pacific | 0 | 0.0% |
| Hispanic or Latino | 49 | 2.6% |
| Native / Alaskan | 0 | 0.0% |
| White / Caucasian | 1,846 | 97.2% |
| Two or more Races | 0 | 0.0% |
| Some other Race | 0 | 0.0% |
| Total | 1,899 | 100.0% |
Ancestry in South Park
The most populous ancestries reported in South Park are Irish (411 | 21.6%), German (325 | 17.1%), Dutch (222 | 11.7%), Scotch-Irish (203 | 10.7%), and English (188 | 9.9%), together accounting for 71.0% of all South Park residents.
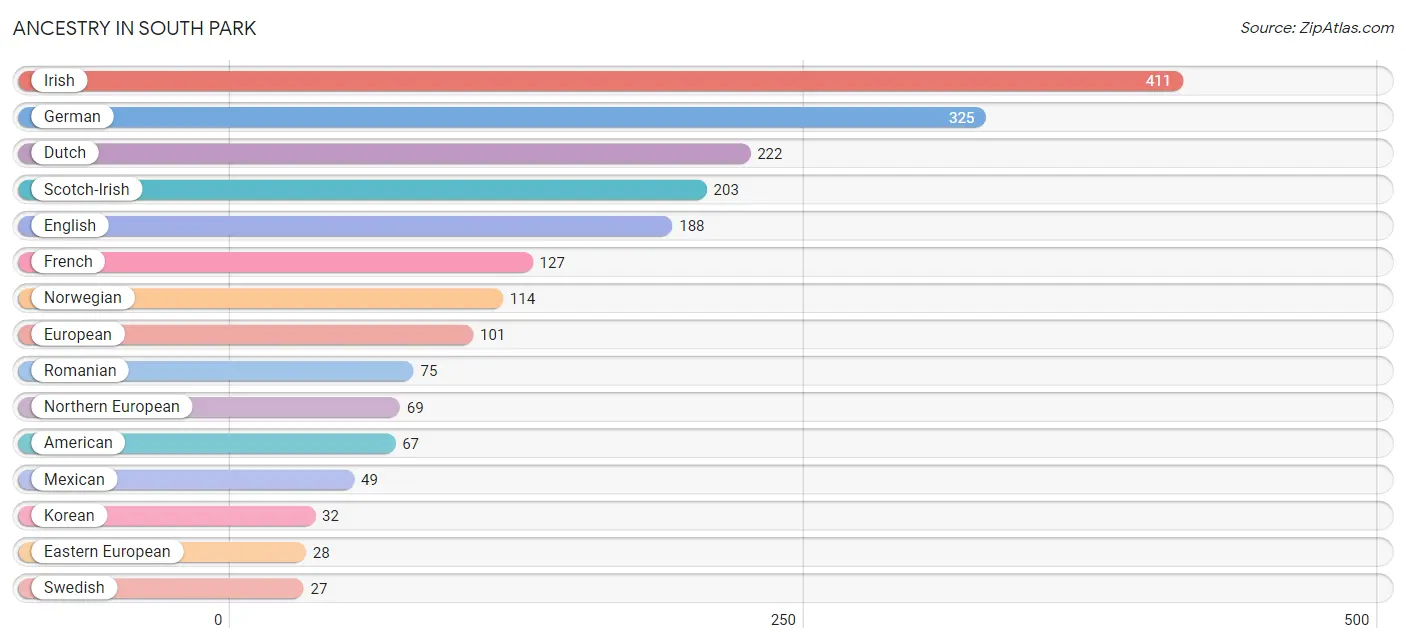
| Ancestry | # Population | % Population |
| American | 67 | 3.5% |
| Belgian | 12 | 0.6% |
| Dutch | 222 | 11.7% |
| Eastern European | 28 | 1.5% |
| English | 188 | 9.9% |
| European | 101 | 5.3% |
| French | 127 | 6.7% |
| German | 325 | 17.1% |
| Irish | 411 | 21.6% |
| Korean | 32 | 1.7% |
| Maltese | 11 | 0.6% |
| Mexican | 49 | 2.6% |
| Northern European | 69 | 3.6% |
| Norwegian | 114 | 6.0% |
| Polish | 20 | 1.1% |
| Portuguese | 26 | 1.4% |
| Romanian | 75 | 4.0% |
| Russian | 23 | 1.2% |
| Scotch-Irish | 203 | 10.7% |
| Scottish | 10 | 0.5% |
| Swedish | 27 | 1.4% |
| Swiss | 14 | 0.7% | View All 22 Rows |
Immigrants in South Park
The most numerous immigrant groups reported in South Park came from Eastern Europe (86 | 4.5%), Europe (86 | 4.5%), Romania (75 | 4.0%), and Poland (11 | 0.6%), together accounting for 13.6% of all South Park residents.
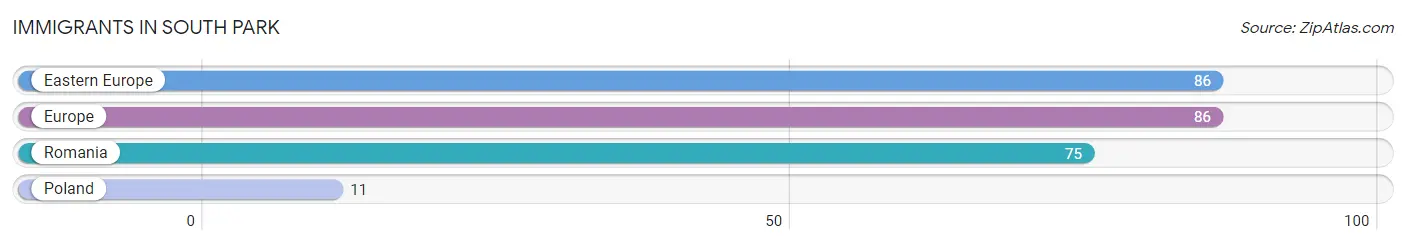
| Immigration Origin | # Population | % Population |
| Eastern Europe | 86 | 4.5% |
| Europe | 86 | 4.5% |
| Poland | 11 | 0.6% |
| Romania | 75 | 4.0% | View All 4 Rows |
Sex and Age in South Park
Sex and Age in South Park
The most populous age groups in South Park are 50 to 54 Years (151 | 17.1%) for men and 60 to 64 Years (221 | 21.7%) for women.
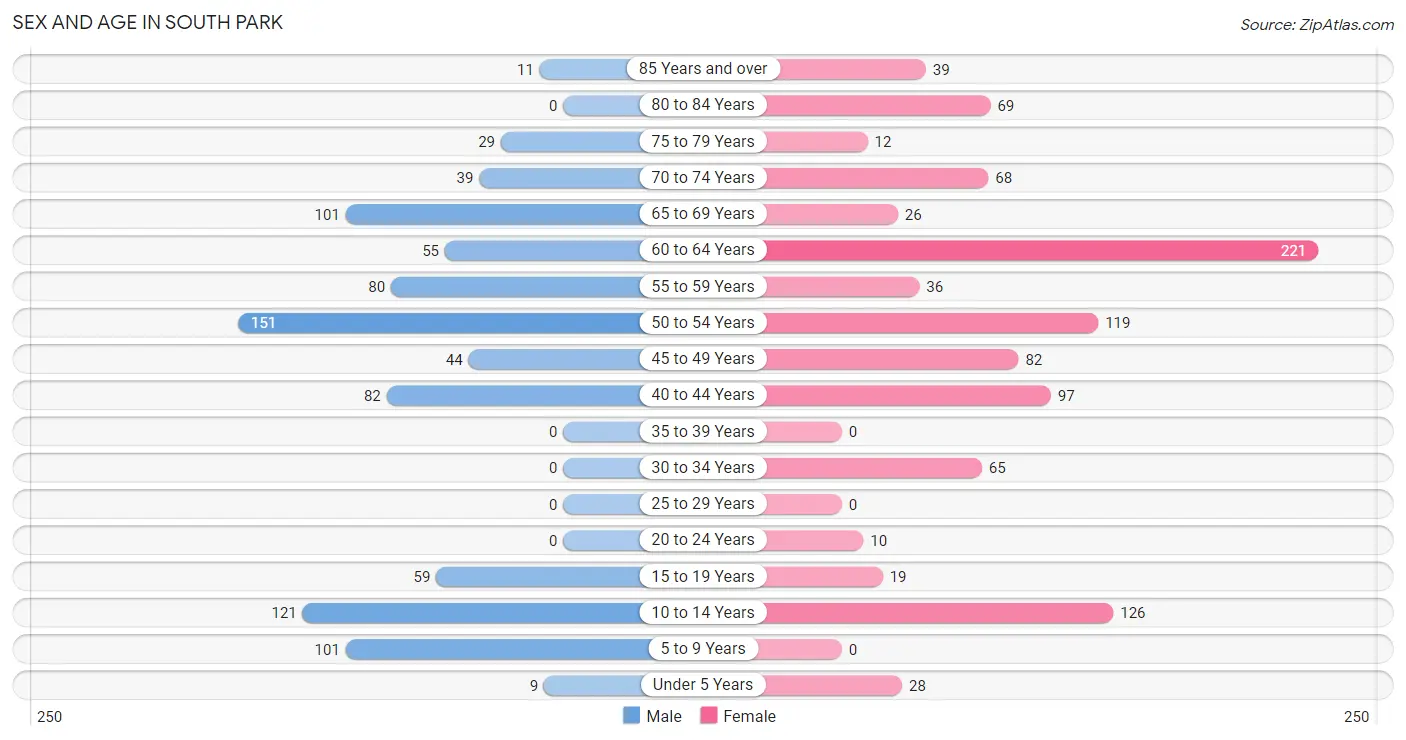
| Age Bracket | Male | Female |
| Under 5 Years | 9 (1.0%) | 28 (2.8%) |
| 5 to 9 Years | 101 (11.5%) | 0 (0.0%) |
| 10 to 14 Years | 121 (13.7%) | 126 (12.4%) |
| 15 to 19 Years | 59 (6.7%) | 19 (1.9%) |
| 20 to 24 Years | 0 (0.0%) | 10 (1.0%) |
| 25 to 29 Years | 0 (0.0%) | 0 (0.0%) |
| 30 to 34 Years | 0 (0.0%) | 65 (6.4%) |
| 35 to 39 Years | 0 (0.0%) | 0 (0.0%) |
| 40 to 44 Years | 82 (9.3%) | 97 (9.5%) |
| 45 to 49 Years | 44 (5.0%) | 82 (8.1%) |
| 50 to 54 Years | 151 (17.1%) | 119 (11.7%) |
| 55 to 59 Years | 80 (9.1%) | 36 (3.5%) |
| 60 to 64 Years | 55 (6.2%) | 221 (21.7%) |
| 65 to 69 Years | 101 (11.5%) | 26 (2.6%) |
| 70 to 74 Years | 39 (4.4%) | 68 (6.7%) |
| 75 to 79 Years | 29 (3.3%) | 12 (1.2%) |
| 80 to 84 Years | 0 (0.0%) | 69 (6.8%) |
| 85 Years and over | 11 (1.3%) | 39 (3.8%) |
| Total | 882 (100.0%) | 1,017 (100.0%) |
Families and Households in South Park
Median Family Size in South Park
The median family size in South Park is 2.89 persons per family, with married-couple families (563 | 93.7%) accounting for the largest median family size of 2.92 persons per family. On the other hand, single male/father families (13 | 2.2%) represent the smallest median family size with 1.62 persons per family.
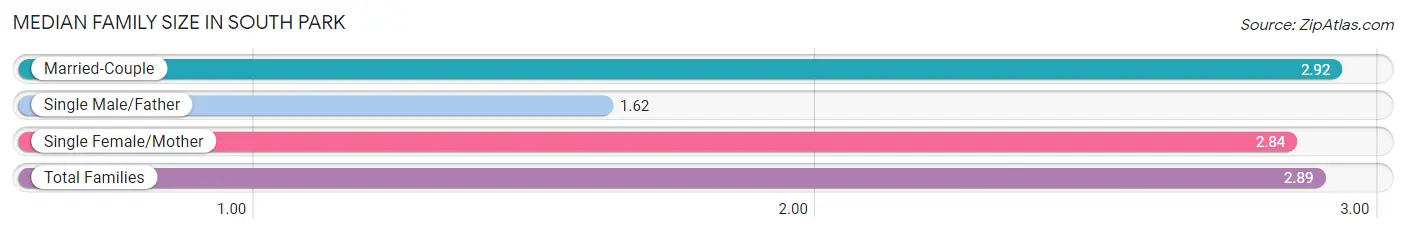
| Family Type | # Families | Family Size |
| Married-Couple | 563 (93.7%) | 2.92 |
| Single Male/Father | 13 (2.2%) | 1.62 |
| Single Female/Mother | 25 (4.2%) | 2.84 |
| Total Families | 601 (100.0%) | 2.89 |
Median Household Size in South Park
The median household size in South Park is 2.57 persons per household, with married-couple households (563 | 76.2%) accounting for the largest median household size of 2.92 persons per household. non-family households (138 | 18.7%) represent the smallest median household size with 1.19 persons per household.
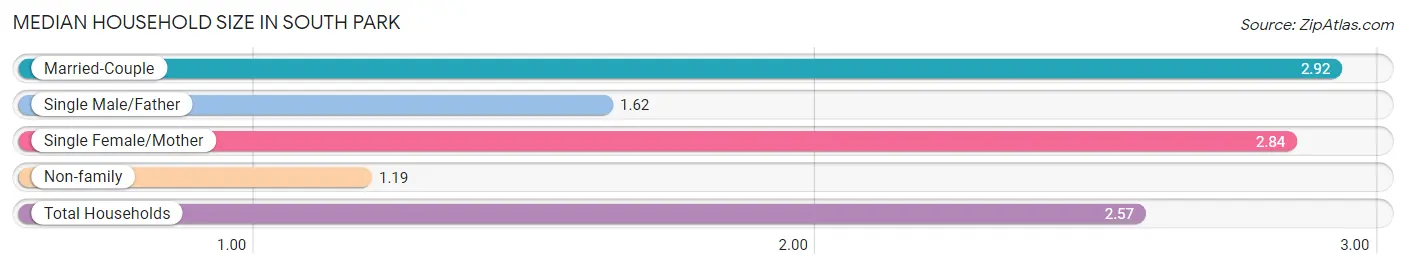
| Household Type | # Households | Household Size |
| Married-Couple | 563 (76.2%) | 2.92 |
| Single Male/Father | 13 (1.8%) | 1.62 |
| Single Female/Mother | 25 (3.4%) | 2.84 |
| Non-family | 138 (18.7%) | 1.19 |
| Total Households | 739 (100.0%) | 2.57 |
Household Size by Marriage Status in South Park
Out of a total of 739 households in South Park, 601 (81.3%) are family households, while 138 (18.7%) are nonfamily households. The most numerous type of family households are 2-person households, comprising 294, and the most common type of nonfamily households are 1-person households, comprising 108.

| Household Size | Family Households | Nonfamily Households |
| 1-Person Households | - | 108 (14.6%) |
| 2-Person Households | 294 (39.8%) | 30 (4.1%) |
| 3-Person Households | 119 (16.1%) | 0 (0.0%) |
| 4-Person Households | 100 (13.5%) | 0 (0.0%) |
| 5-Person Households | 88 (11.9%) | 0 (0.0%) |
| 6-Person Households | 0 (0.0%) | 0 (0.0%) |
| 7+ Person Households | 0 (0.0%) | 0 (0.0%) |
| Total | 601 (81.3%) | 138 (18.7%) |
Female Fertility in South Park
Fertility by Age in South Park
| Age Bracket | Women with Births | Births / 1,000 Women |
| 15 to 19 years | 0 (0.0%) | 0.0 |
| 20 to 34 years | 0 (0.0%) | 0.0 |
| 35 to 50 years | 0 (0.0%) | 0.0 |
| Total | 0 (0.0%) | 0.0 |
Fertility by Age by Marriage Status in South Park
| Age Bracket | Married | Unmarried |
| 15 to 19 years | 0 (0.0%) | 0 (0.0%) |
| 20 to 34 years | 0 (0.0%) | 0 (0.0%) |
| 35 to 50 years | 0 (0.0%) | 0 (0.0%) |
| Total | 0 (0.0%) | 0 (0.0%) |
Fertility by Education in South Park
| Educational Attainment | Women with Births | Births / 1,000 Women |
| Less than High School | 0 (0.0%) | 0.0 |
| High School Diploma | 0 (0.0%) | 0.0 |
| College or Associate's Degree | 0 (0.0%) | 0.0 |
| Bachelor's Degree | 0 (0.0%) | 0.0 |
| Graduate Degree | 0 (0.0%) | 0.0 |
| Total | 0 (0.0%) | 0.0 |
Fertility by Education by Marriage Status in South Park
| Educational Attainment | Married | Unmarried |
| Less than High School | 0 (0.0%) | 0 (0.0%) |
| High School Diploma | 0 (0.0%) | 0 (0.0%) |
| College or Associate's Degree | 0 (0.0%) | 0 (0.0%) |
| Bachelor's Degree | 0 (0.0%) | 0 (0.0%) |
| Graduate Degree | 0 (0.0%) | 0 (0.0%) |
| Total | 0 (0.0%) | 0 (0.0%) |
Employment Characteristics in South Park
Employment by Class of Employer in South Park
Among the 1,040 employed individuals in South Park, private company employees (393 | 37.8%), not-for-profit organizations (260 | 25.0%), and local government employees (140 | 13.5%) make up the most common classes of employment.
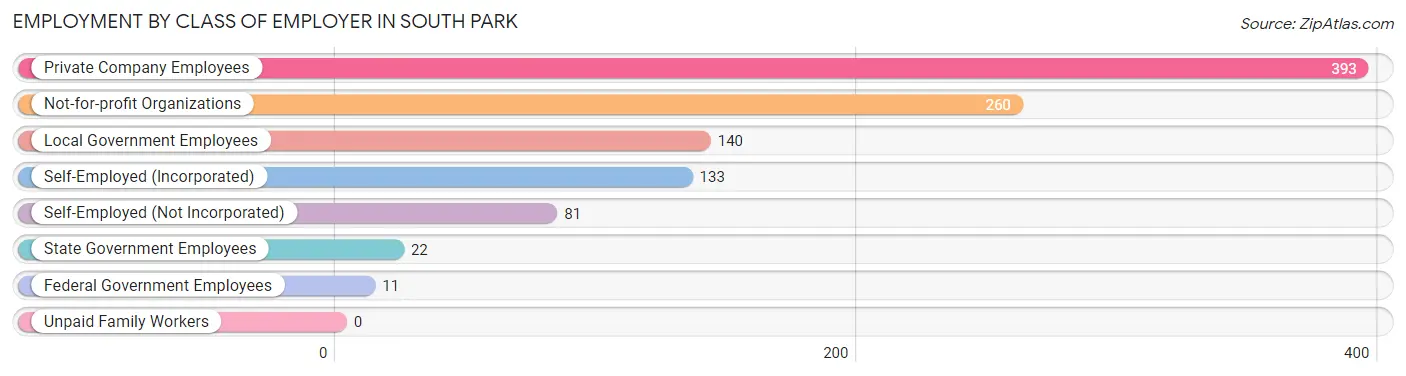
| Employer Class | # Employees | % Employees |
| Private Company Employees | 393 | 37.8% |
| Self-Employed (Incorporated) | 133 | 12.8% |
| Self-Employed (Not Incorporated) | 81 | 7.8% |
| Not-for-profit Organizations | 260 | 25.0% |
| Local Government Employees | 140 | 13.5% |
| State Government Employees | 22 | 2.1% |
| Federal Government Employees | 11 | 1.1% |
| Unpaid Family Workers | 0 | 0.0% |
| Total | 1,040 | 100.0% |
Employment Status by Age in South Park
According to the labor force statistics for South Park, out of the total population over 16 years of age (1,480), 73.9% or 1,094 individuals are in the labor force, with 3.6% or 39 of them unemployed. The age group with the highest labor force participation rate is 30 to 34 years, with 100.0% or 65 individuals in the labor force. Within the labor force, the 45 to 54 years age range has the highest percentage of unemployed individuals, with 11.0% or 39 of them being unemployed.
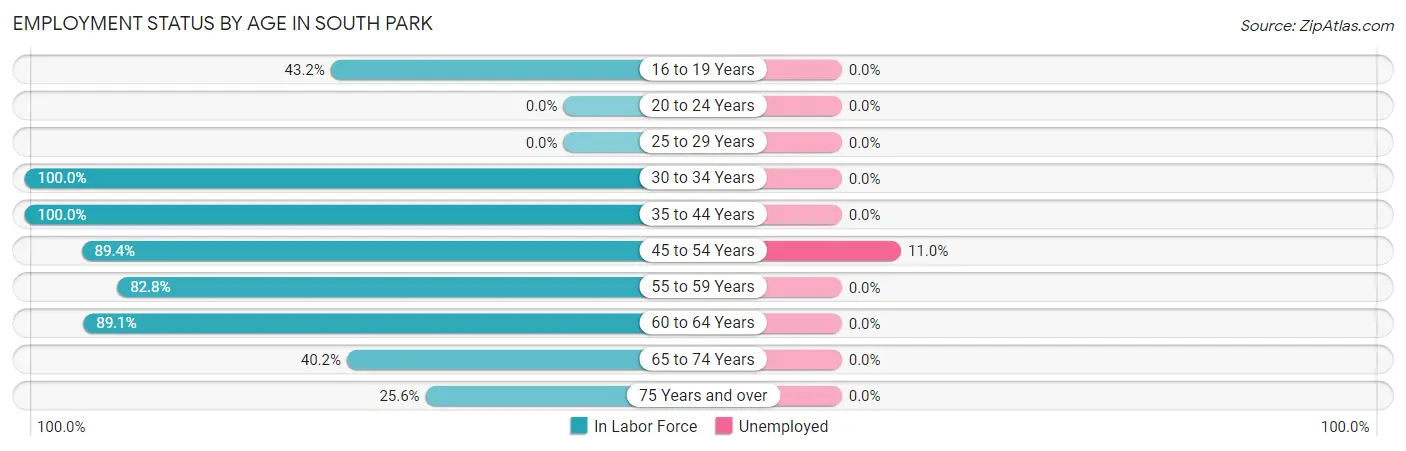
| Age Bracket | In Labor Force | Unemployed |
| 16 to 19 Years | 19 (43.2%) | 0 (0.0%) |
| 20 to 24 Years | 0 (0.0%) | 0 (0.0%) |
| 25 to 29 Years | 0 (0.0%) | 0 (0.0%) |
| 30 to 34 Years | 65 (100.0%) | 0 (0.0%) |
| 35 to 44 Years | 179 (100.0%) | 0 (0.0%) |
| 45 to 54 Years | 354 (89.4%) | 39 (11.0%) |
| 55 to 59 Years | 96 (82.8%) | 0 (0.0%) |
| 60 to 64 Years | 246 (89.1%) | 0 (0.0%) |
| 65 to 74 Years | 94 (40.2%) | 0 (0.0%) |
| 75 Years and over | 41 (25.6%) | 0 (0.0%) |
| Total | 1,094 (73.9%) | 39 (3.6%) |
Employment Status by Educational Attainment in South Park
According to labor force statistics for South Park, 91.1% of individuals (940) out of the total population between 25 and 64 years of age (1,032) are in the labor force, with 4.1% or 39 of them being unemployed. The group with the highest labor force participation rate are those with the educational attainment of high school diploma, with 100.0% or 37 individuals in the labor force. Within the labor force, individuals with bachelor's degree or higher education have the highest percentage of unemployment, with 5.5% or 39 of them being unemployed.
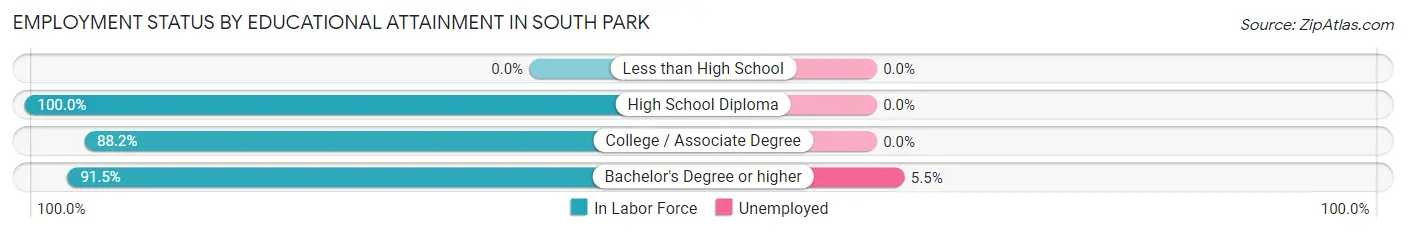
| Educational Attainment | In Labor Force | Unemployed |
| Less than High School | 0 (0.0%) | 0 (0.0%) |
| High School Diploma | 37 (100.0%) | 0 (0.0%) |
| College / Associate Degree | 195 (88.2%) | 0 (0.0%) |
| Bachelor's Degree or higher | 708 (91.5%) | 43 (5.5%) |
| Total | 940 (91.1%) | 42 (4.1%) |
Employment Occupations by Sex in South Park
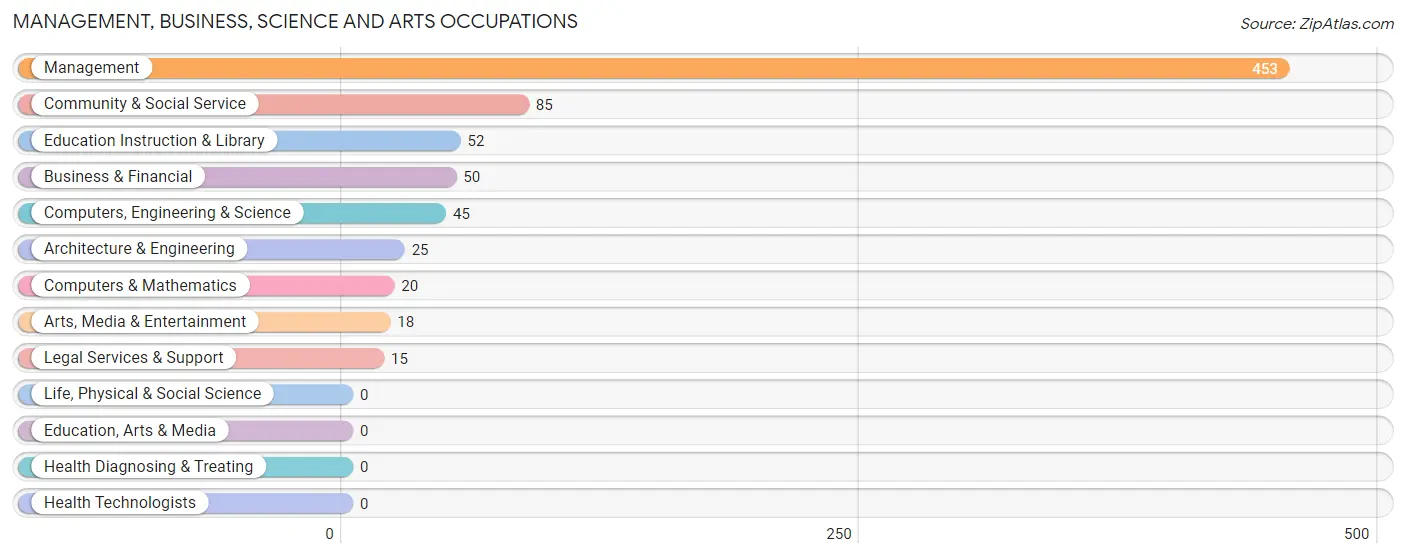
Management, Business, Science and Arts Occupations
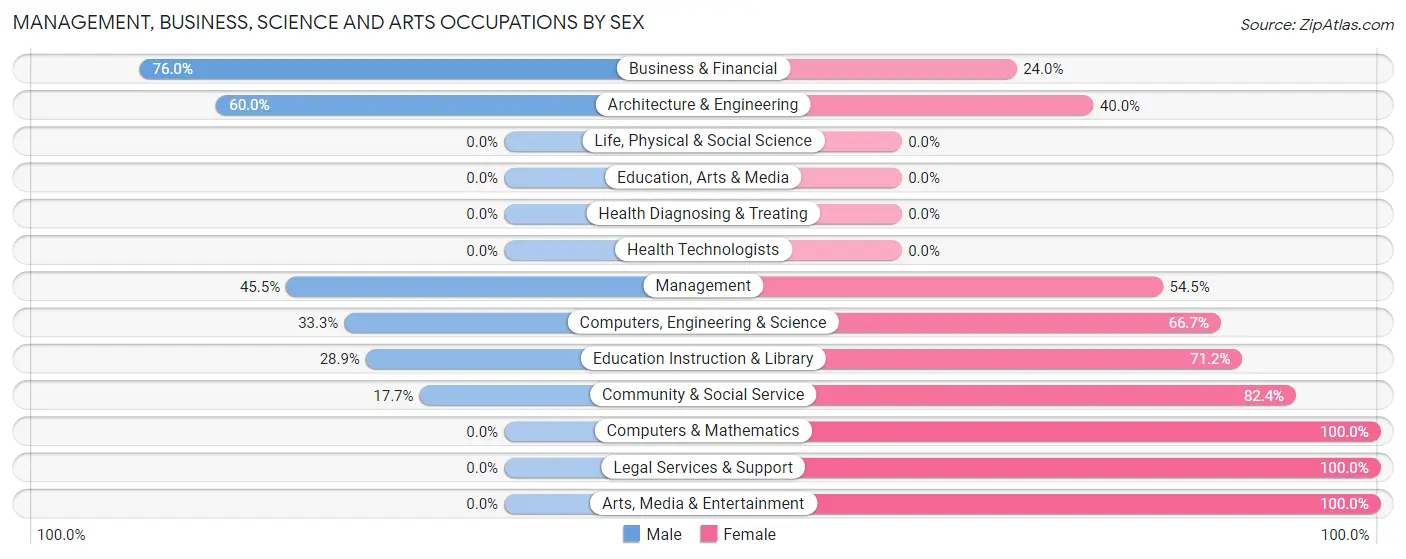
The most common Management, Business, Science and Arts occupations in South Park are Management (453 | 42.9%), Community & Social Service (85 | 8.1%), Education Instruction & Library (52 | 4.9%), Business & Financial (50 | 4.7%), and Computers, Engineering & Science (45 | 4.3%).
Management, Business, Science and Arts Occupations by Sex
Within the Management, Business, Science and Arts occupations in South Park, the most male-oriented occupations are Business & Financial (76.0%), Architecture & Engineering (60.0%), and Management (45.5%), while the most female-oriented occupations are Computers & Mathematics (100.0%), Legal Services & Support (100.0%), and Arts, Media & Entertainment (100.0%).
| Occupation | Male | Female |
| Management | 206 (45.5%) | 247 (54.5%) |
| Business & Financial | 38 (76.0%) | 12 (24.0%) |
| Computers, Engineering & Science | 15 (33.3%) | 30 (66.7%) |
| Computers & Mathematics | 0 (0.0%) | 20 (100.0%) |
| Architecture & Engineering | 15 (60.0%) | 10 (40.0%) |
| Life, Physical & Social Science | 0 (0.0%) | 0 (0.0%) |
| Community & Social Service | 15 (17.6%) | 70 (82.4%) |
| Education, Arts & Media | 0 (0.0%) | 0 (0.0%) |
| Legal Services & Support | 0 (0.0%) | 15 (100.0%) |
| Education Instruction & Library | 15 (28.8%) | 37 (71.2%) |
| Arts, Media & Entertainment | 0 (0.0%) | 18 (100.0%) |
| Health Diagnosing & Treating | 0 (0.0%) | 0 (0.0%) |
| Health Technologists | 0 (0.0%) | 0 (0.0%) |
| Total (Category) | 274 (43.3%) | 359 (56.7%) |
| Total (Overall) | 452 (42.8%) | 603 (57.2%) |
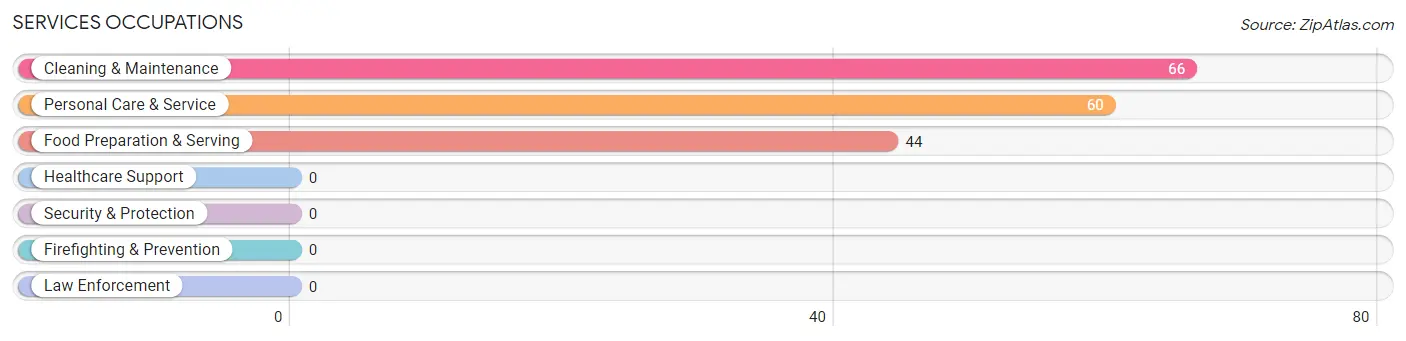
Services Occupations
The most common Services occupations in South Park are Cleaning & Maintenance (66 | 6.3%), Personal Care & Service (60 | 5.7%), and Food Preparation & Serving (44 | 4.2%).
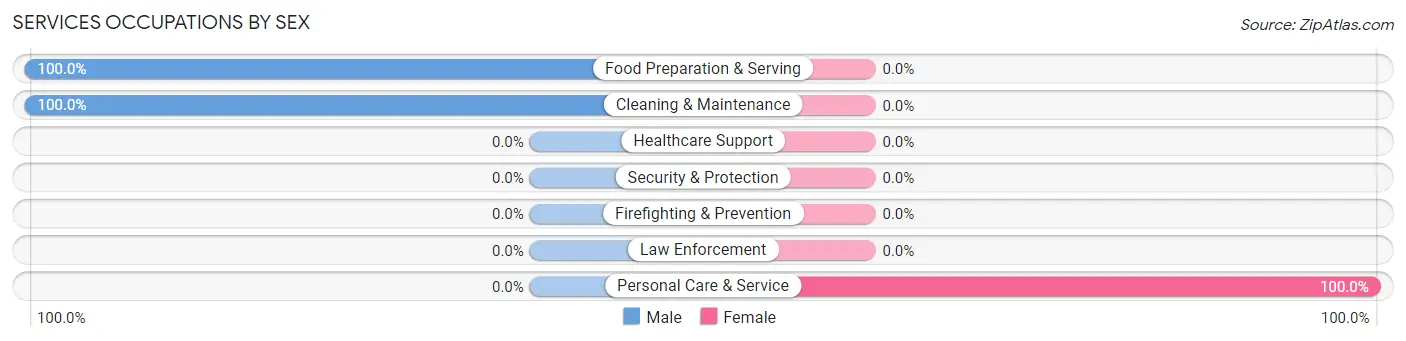
Services Occupations by Sex
| Occupation | Male | Female |
| Healthcare Support | 0 (0.0%) | 0 (0.0%) |
| Security & Protection | 0 (0.0%) | 0 (0.0%) |
| Firefighting & Prevention | 0 (0.0%) | 0 (0.0%) |
| Law Enforcement | 0 (0.0%) | 0 (0.0%) |
| Food Preparation & Serving | 44 (100.0%) | 0 (0.0%) |
| Cleaning & Maintenance | 66 (100.0%) | 0 (0.0%) |
| Personal Care & Service | 0 (0.0%) | 60 (100.0%) |
| Total (Category) | 110 (64.7%) | 60 (35.3%) |
| Total (Overall) | 452 (42.8%) | 603 (57.2%) |
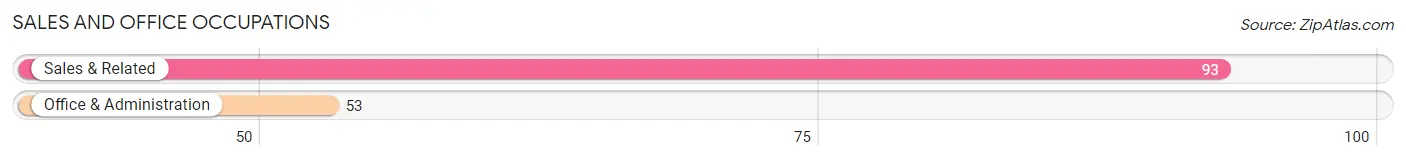
Sales and Office Occupations
The most common Sales and Office occupations in South Park are Sales & Related (93 | 8.8%), and Office & Administration (53 | 5.0%).
Sales and Office Occupations by Sex
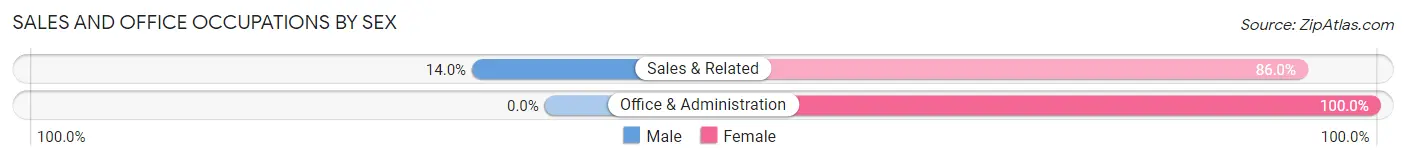
| Occupation | Male | Female |
| Sales & Related | 13 (14.0%) | 80 (86.0%) |
| Office & Administration | 0 (0.0%) | 53 (100.0%) |
| Total (Category) | 13 (8.9%) | 133 (91.1%) |
| Total (Overall) | 452 (42.8%) | 603 (57.2%) |
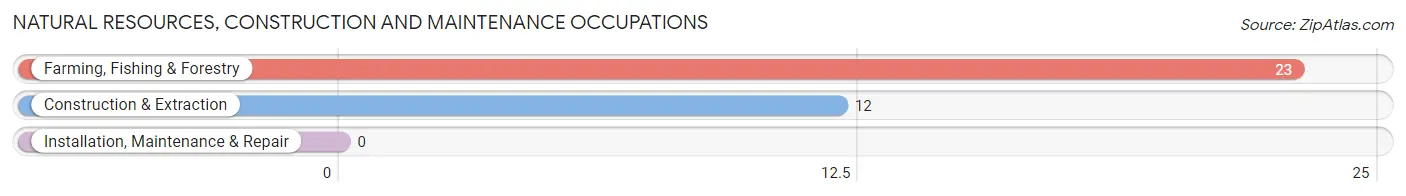
Natural Resources, Construction and Maintenance Occupations
The most common Natural Resources, Construction and Maintenance occupations in South Park are Farming, Fishing & Forestry (23 | 2.2%), and Construction & Extraction (12 | 1.1%).
Natural Resources, Construction and Maintenance Occupations by Sex
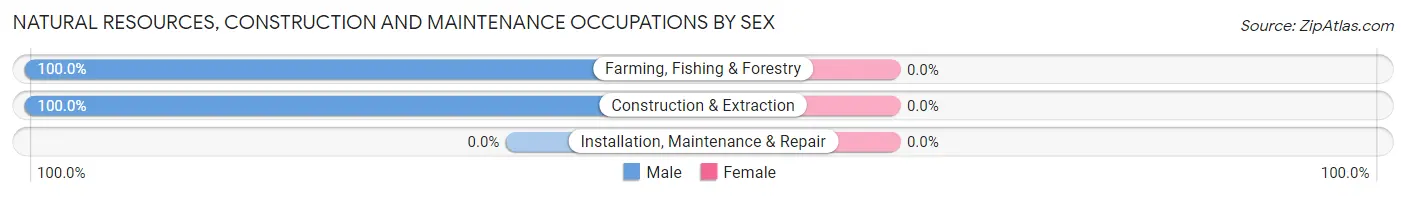
| Occupation | Male | Female |
| Farming, Fishing & Forestry | 23 (100.0%) | 0 (0.0%) |
| Construction & Extraction | 12 (100.0%) | 0 (0.0%) |
| Installation, Maintenance & Repair | 0 (0.0%) | 0 (0.0%) |
| Total (Category) | 35 (100.0%) | 0 (0.0%) |
| Total (Overall) | 452 (42.8%) | 603 (57.2%) |
Production, Transportation and Moving Occupations
The most common Production, Transportation and Moving occupations in South Park are Transportation (51 | 4.8%), and Production (20 | 1.9%).
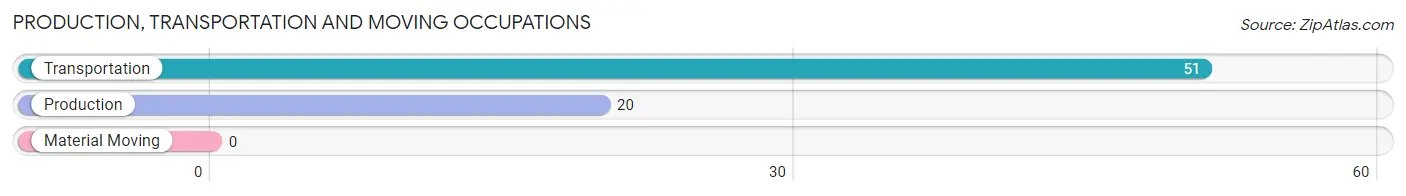
Production, Transportation and Moving Occupations by Sex
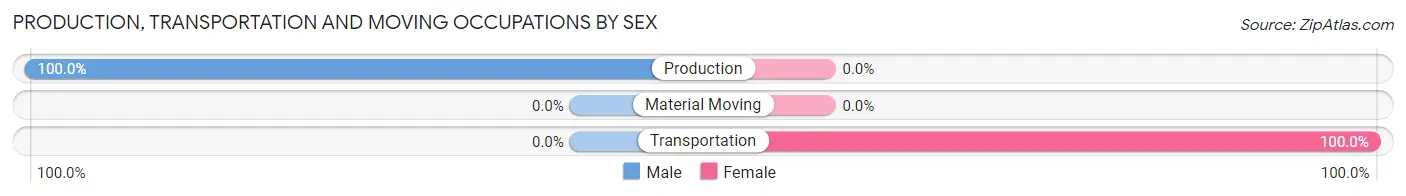
| Occupation | Male | Female |
| Production | 20 (100.0%) | 0 (0.0%) |
| Transportation | 0 (0.0%) | 51 (100.0%) |
| Material Moving | 0 (0.0%) | 0 (0.0%) |
| Total (Category) | 20 (28.2%) | 51 (71.8%) |
| Total (Overall) | 452 (42.8%) | 603 (57.2%) |
Employment Industries by Sex in South Park
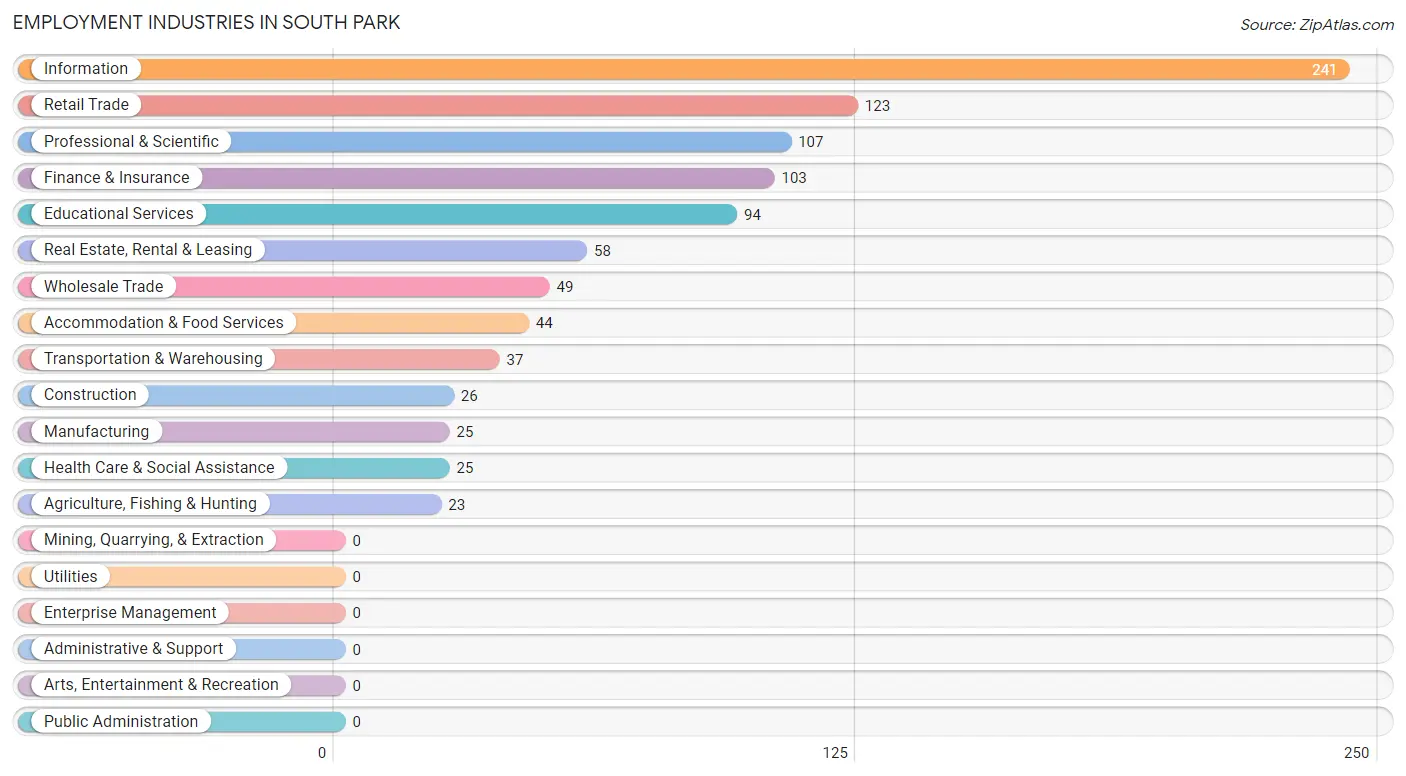
Employment Industries in South Park
The major employment industries in South Park include Information (241 | 22.8%), Retail Trade (123 | 11.7%), Professional & Scientific (107 | 10.1%), Finance & Insurance (103 | 9.8%), and Educational Services (94 | 8.9%).
Employment Industries by Sex in South Park
The South Park industries that see more men than women are Agriculture, Fishing & Hunting (100.0%), Construction (100.0%), and Wholesale Trade (100.0%), whereas the industries that tend to have a higher number of women are Transportation & Warehousing (100.0%), Information (91.7%), and Retail Trade (65.8%).
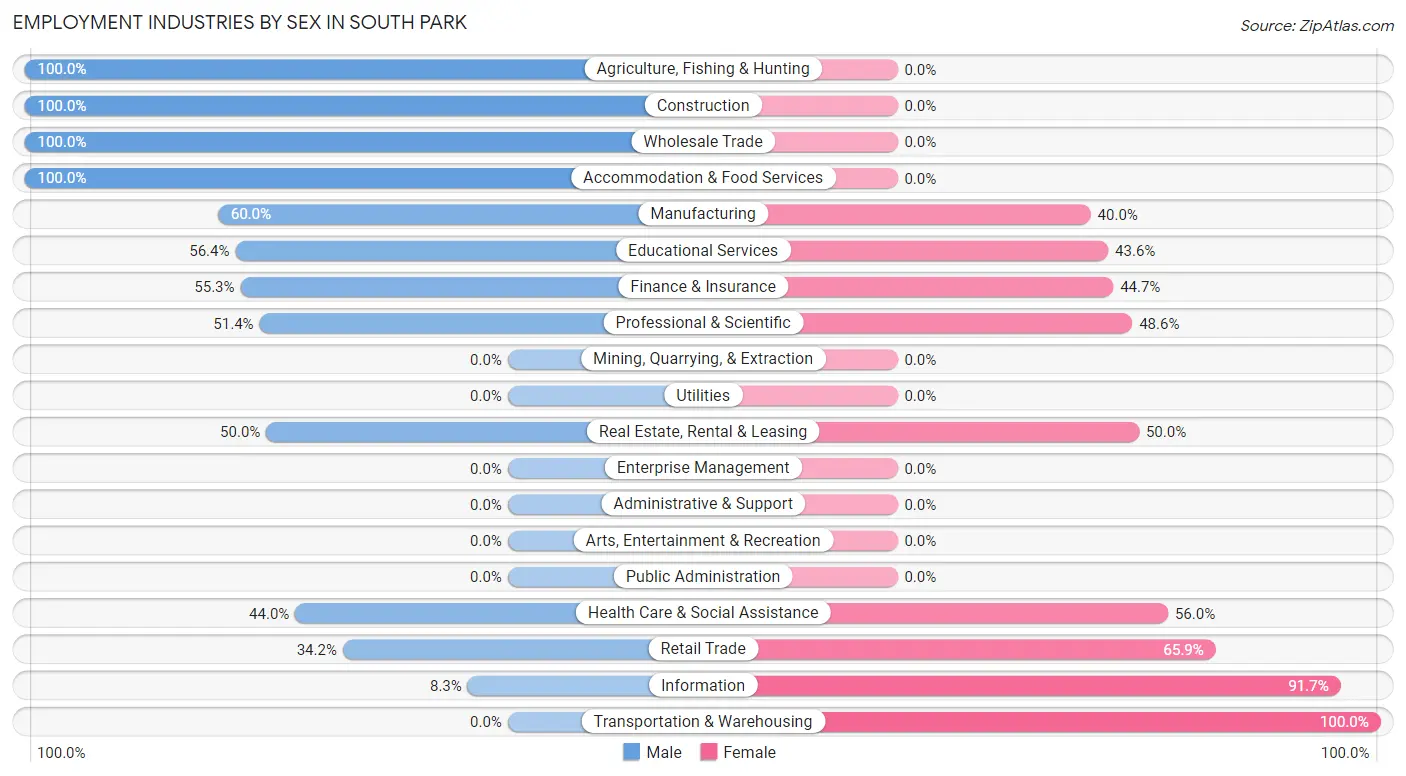
| Industry | Male | Female |
| Agriculture, Fishing & Hunting | 23 (100.0%) | 0 (0.0%) |
| Mining, Quarrying, & Extraction | 0 (0.0%) | 0 (0.0%) |
| Construction | 26 (100.0%) | 0 (0.0%) |
| Manufacturing | 15 (60.0%) | 10 (40.0%) |
| Wholesale Trade | 49 (100.0%) | 0 (0.0%) |
| Retail Trade | 42 (34.2%) | 81 (65.8%) |
| Transportation & Warehousing | 0 (0.0%) | 37 (100.0%) |
| Utilities | 0 (0.0%) | 0 (0.0%) |
| Information | 20 (8.3%) | 221 (91.7%) |
| Finance & Insurance | 57 (55.3%) | 46 (44.7%) |
| Real Estate, Rental & Leasing | 29 (50.0%) | 29 (50.0%) |
| Professional & Scientific | 55 (51.4%) | 52 (48.6%) |
| Enterprise Management | 0 (0.0%) | 0 (0.0%) |
| Administrative & Support | 0 (0.0%) | 0 (0.0%) |
| Educational Services | 53 (56.4%) | 41 (43.6%) |
| Health Care & Social Assistance | 11 (44.0%) | 14 (56.0%) |
| Arts, Entertainment & Recreation | 0 (0.0%) | 0 (0.0%) |
| Accommodation & Food Services | 44 (100.0%) | 0 (0.0%) |
| Public Administration | 0 (0.0%) | 0 (0.0%) |
| Total | 452 (42.8%) | 603 (57.2%) |
Education in South Park
School Enrollment in South Park
The most common levels of schooling among the 760 students in South Park are college / undergraduate (341 | 44.9%), middle school (160 | 21.0%), and elementary school (137 | 18.0%).
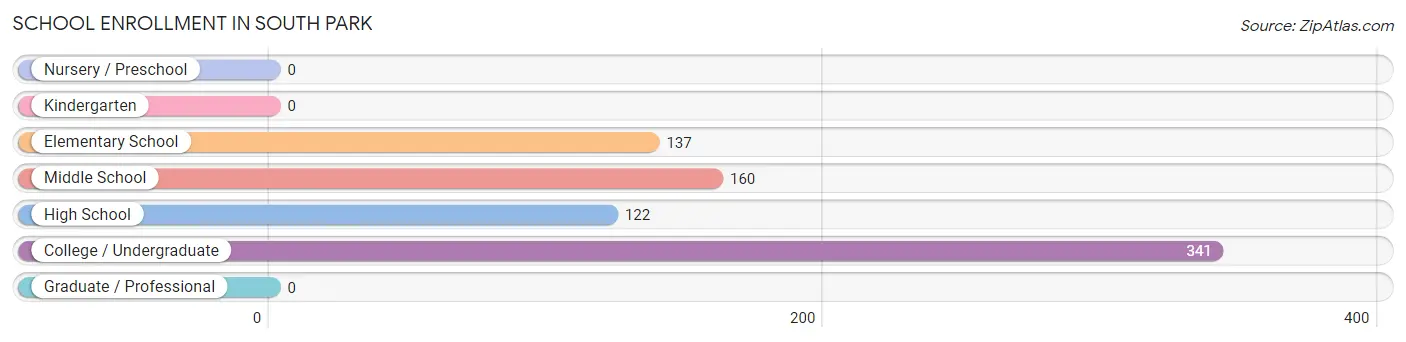
| School Level | # Students | % Students |
| Nursery / Preschool | 0 | 0.0% |
| Kindergarten | 0 | 0.0% |
| Elementary School | 137 | 18.0% |
| Middle School | 160 | 21.0% |
| High School | 122 | 16.1% |
| College / Undergraduate | 341 | 44.9% |
| Graduate / Professional | 0 | 0.0% |
| Total | 760 | 100.0% |
School Enrollment by Age by Funding Source in South Park
Out of a total of 760 students who are enrolled in schools in South Park, 78 (10.3%) attend a private institution, while the remaining 682 (89.7%) are enrolled in public schools. The age group of 5 to 9 year old has the highest likelihood of being enrolled in private schools, with 44 (43.6% in the age bracket) enrolled. Conversely, the age group of 15 to 17 year olds has the lowest likelihood of being enrolled in a private school, with 59 (100.0% in the age bracket) attending a public institution.
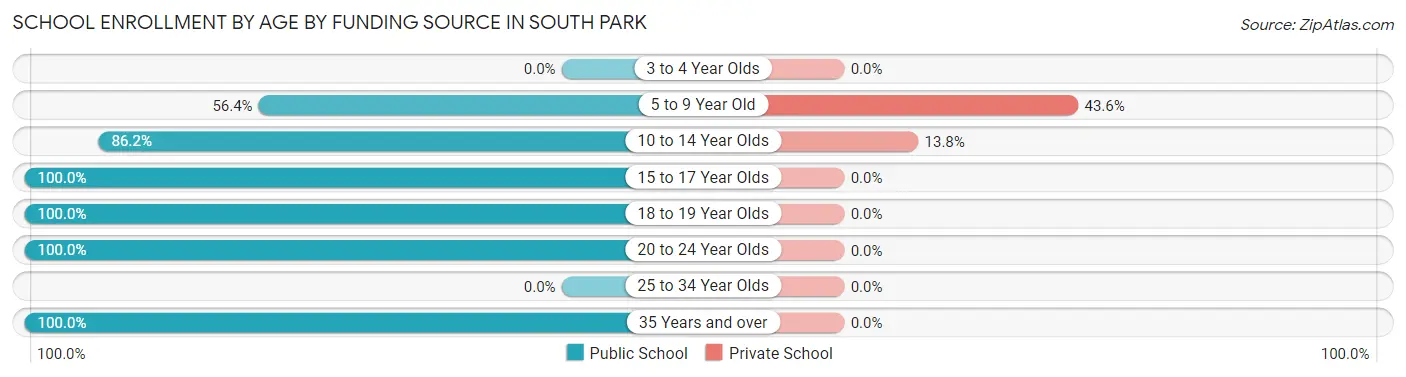
| Age Bracket | Public School | Private School |
| 3 to 4 Year Olds | 0 (0.0%) | 0 (0.0%) |
| 5 to 9 Year Old | 57 (56.4%) | 44 (43.6%) |
| 10 to 14 Year Olds | 213 (86.2%) | 34 (13.8%) |
| 15 to 17 Year Olds | 59 (100.0%) | 0 (0.0%) |
| 18 to 19 Year Olds | 19 (100.0%) | 0 (0.0%) |
| 20 to 24 Year Olds | 10 (100.0%) | 0 (0.0%) |
| 25 to 34 Year Olds | 0 (0.0%) | 0 (0.0%) |
| 35 Years and over | 324 (100.0%) | 0 (0.0%) |
| Total | 682 (89.7%) | 78 (10.3%) |
Educational Attainment by Field of Study in South Park
Business (389 | 34.8%), engineering (140 | 12.5%), social sciences (118 | 10.5%), education (107 | 9.6%), and bio, nature & agricultural (83 | 7.4%) are the most common fields of study among 1,118 individuals in South Park who have obtained a bachelor's degree or higher.
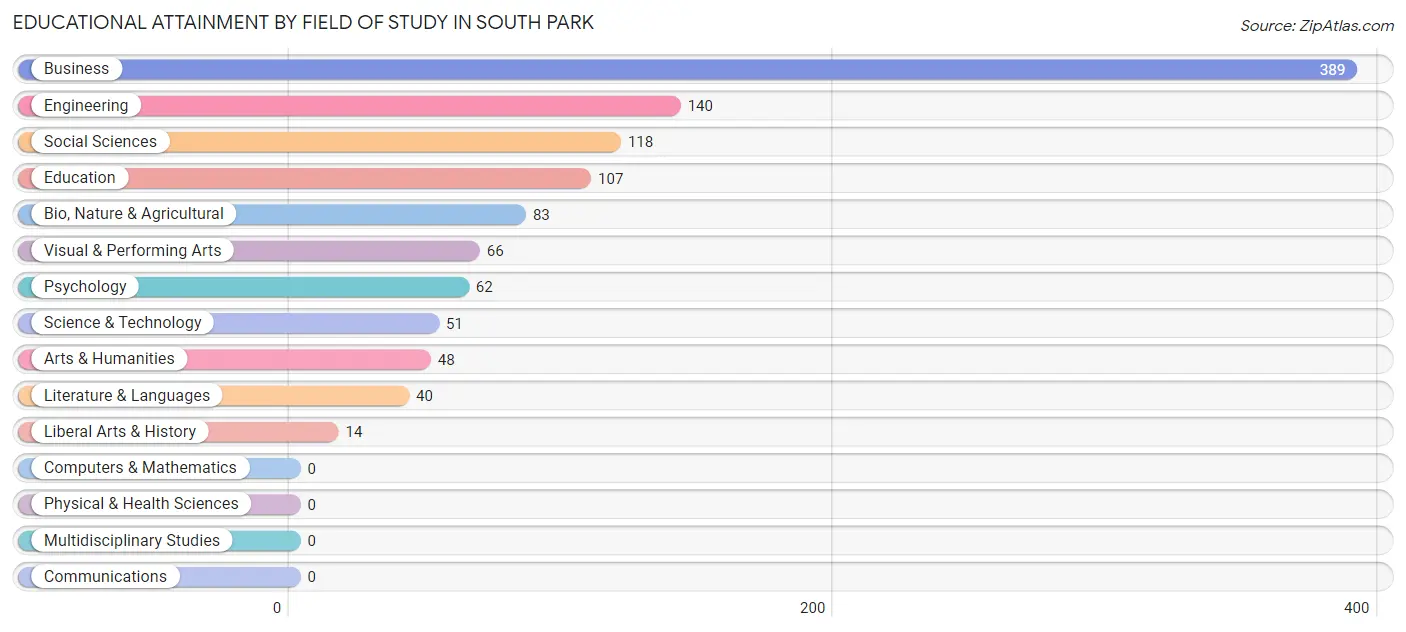
| Field of Study | # Graduates | % Graduates |
| Computers & Mathematics | 0 | 0.0% |
| Bio, Nature & Agricultural | 83 | 7.4% |
| Physical & Health Sciences | 0 | 0.0% |
| Psychology | 62 | 5.6% |
| Social Sciences | 118 | 10.5% |
| Engineering | 140 | 12.5% |
| Multidisciplinary Studies | 0 | 0.0% |
| Science & Technology | 51 | 4.6% |
| Business | 389 | 34.8% |
| Education | 107 | 9.6% |
| Literature & Languages | 40 | 3.6% |
| Liberal Arts & History | 14 | 1.3% |
| Visual & Performing Arts | 66 | 5.9% |
| Communications | 0 | 0.0% |
| Arts & Humanities | 48 | 4.3% |
| Total | 1,118 | 100.0% |
Transportation & Commute in South Park
Vehicle Availability by Sex in South Park
The most prevalent vehicle ownership categories in South Park are males with 2 vehicles (187, accounting for 42.8%) and females with 2 vehicles (132, making up 31.0%).
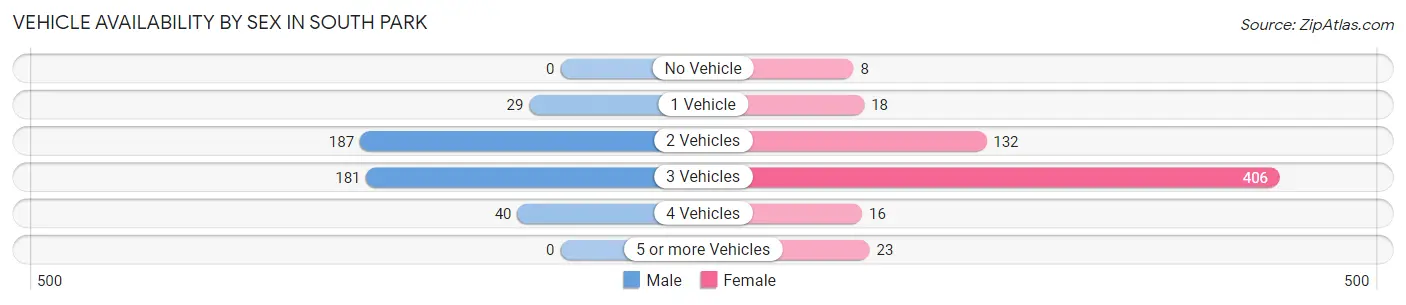
| Vehicles Available | Male | Female |
| No Vehicle | 0 (0.0%) | 8 (1.3%) |
| 1 Vehicle | 29 (6.6%) | 18 (3.0%) |
| 2 Vehicles | 187 (42.8%) | 132 (21.9%) |
| 3 Vehicles | 181 (41.4%) | 406 (67.3%) |
| 4 Vehicles | 40 (9.1%) | 16 (2.6%) |
| 5 or more Vehicles | 0 (0.0%) | 23 (3.8%) |
| Total | 437 (100.0%) | 603 (100.0%) |
Commute Time in South Park
The most frequently occuring commute durations in South Park are 10 to 14 minutes (251 commuters, 35.5%), 20 to 24 minutes (181 commuters, 25.6%), and 15 to 19 minutes (117 commuters, 16.6%).
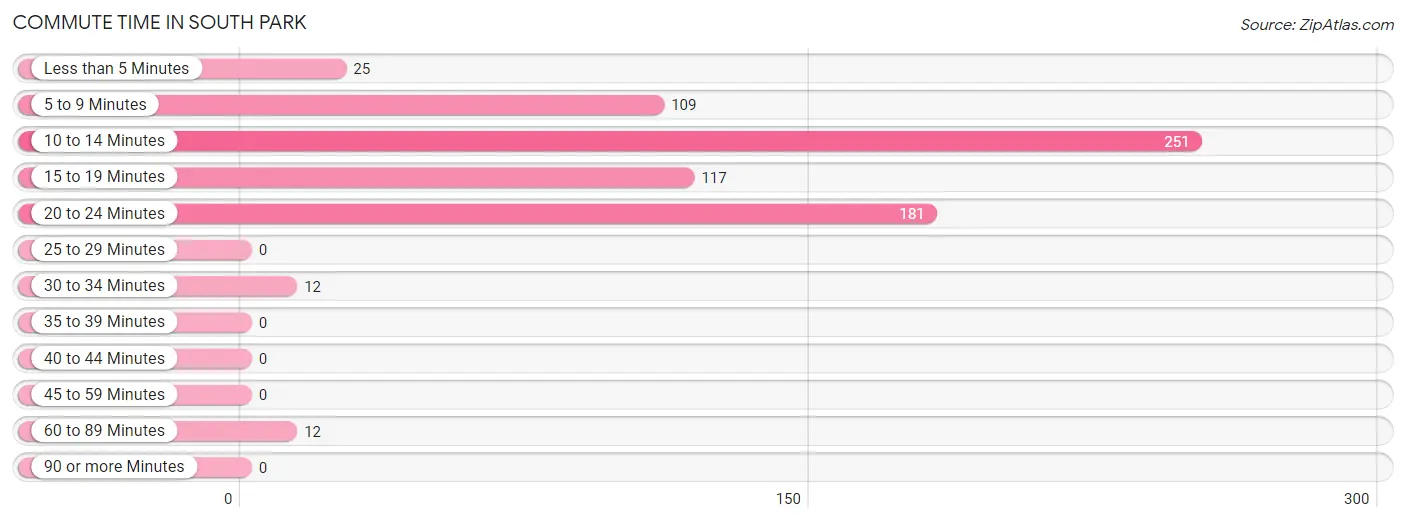
| Commute Time | # Commuters | % Commuters |
| Less than 5 Minutes | 25 | 3.5% |
| 5 to 9 Minutes | 109 | 15.4% |
| 10 to 14 Minutes | 251 | 35.5% |
| 15 to 19 Minutes | 117 | 16.6% |
| 20 to 24 Minutes | 181 | 25.6% |
| 25 to 29 Minutes | 0 | 0.0% |
| 30 to 34 Minutes | 12 | 1.7% |
| 35 to 39 Minutes | 0 | 0.0% |
| 40 to 44 Minutes | 0 | 0.0% |
| 45 to 59 Minutes | 0 | 0.0% |
| 60 to 89 Minutes | 12 | 1.7% |
| 90 or more Minutes | 0 | 0.0% |
Commute Time by Sex in South Park
The most common commute times in South Park are 10 to 14 minutes (110 commuters, 31.2%) for males and 10 to 14 minutes (141 commuters, 39.7%) for females.
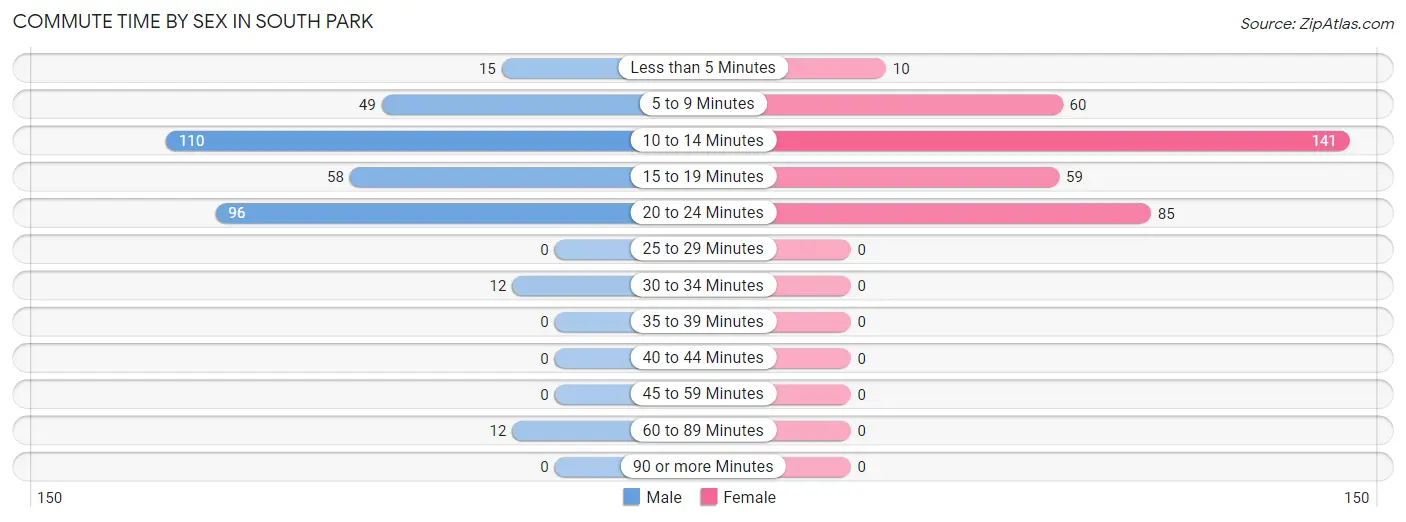
| Commute Time | Male | Female |
| Less than 5 Minutes | 15 (4.3%) | 10 (2.8%) |
| 5 to 9 Minutes | 49 (13.9%) | 60 (16.9%) |
| 10 to 14 Minutes | 110 (31.2%) | 141 (39.7%) |
| 15 to 19 Minutes | 58 (16.5%) | 59 (16.6%) |
| 20 to 24 Minutes | 96 (27.3%) | 85 (23.9%) |
| 25 to 29 Minutes | 0 (0.0%) | 0 (0.0%) |
| 30 to 34 Minutes | 12 (3.4%) | 0 (0.0%) |
| 35 to 39 Minutes | 0 (0.0%) | 0 (0.0%) |
| 40 to 44 Minutes | 0 (0.0%) | 0 (0.0%) |
| 45 to 59 Minutes | 0 (0.0%) | 0 (0.0%) |
| 60 to 89 Minutes | 12 (3.4%) | 0 (0.0%) |
| 90 or more Minutes | 0 (0.0%) | 0 (0.0%) |
Time of Departure to Work by Sex in South Park
The most frequent times of departure to work in South Park are 9:00 AM to 9:59 AM (89, 25.3%) for males and 7:30 AM to 7:59 AM (97, 27.3%) for females.
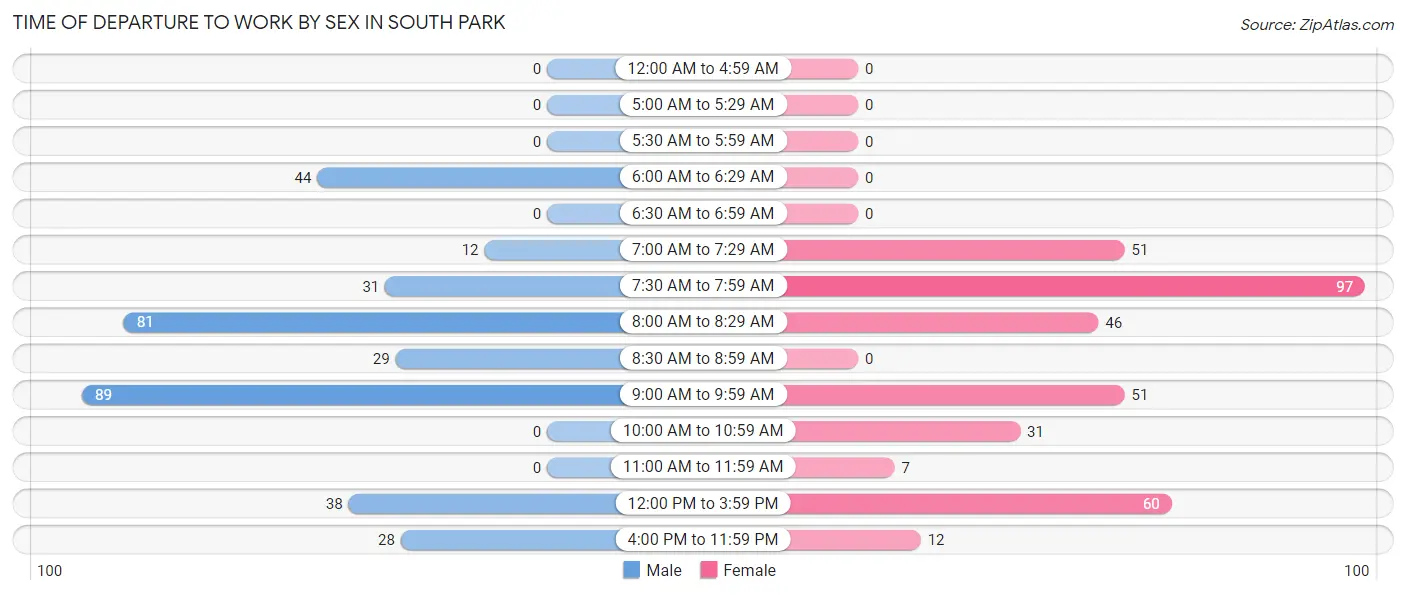
| Time of Departure | Male | Female |
| 12:00 AM to 4:59 AM | 0 (0.0%) | 0 (0.0%) |
| 5:00 AM to 5:29 AM | 0 (0.0%) | 0 (0.0%) |
| 5:30 AM to 5:59 AM | 0 (0.0%) | 0 (0.0%) |
| 6:00 AM to 6:29 AM | 44 (12.5%) | 0 (0.0%) |
| 6:30 AM to 6:59 AM | 0 (0.0%) | 0 (0.0%) |
| 7:00 AM to 7:29 AM | 12 (3.4%) | 51 (14.4%) |
| 7:30 AM to 7:59 AM | 31 (8.8%) | 97 (27.3%) |
| 8:00 AM to 8:29 AM | 81 (23.0%) | 46 (13.0%) |
| 8:30 AM to 8:59 AM | 29 (8.2%) | 0 (0.0%) |
| 9:00 AM to 9:59 AM | 89 (25.3%) | 51 (14.4%) |
| 10:00 AM to 10:59 AM | 0 (0.0%) | 31 (8.7%) |
| 11:00 AM to 11:59 AM | 0 (0.0%) | 7 (2.0%) |
| 12:00 PM to 3:59 PM | 38 (10.8%) | 60 (16.9%) |
| 4:00 PM to 11:59 PM | 28 (8.0%) | 12 (3.4%) |
| Total | 352 (100.0%) | 355 (100.0%) |
Housing Occupancy in South Park
Occupancy by Ownership in South Park
Of the total 739 dwellings in South Park, owner-occupied units account for 739 (100.0%), while renter-occupied units make up 0 (0.0%).
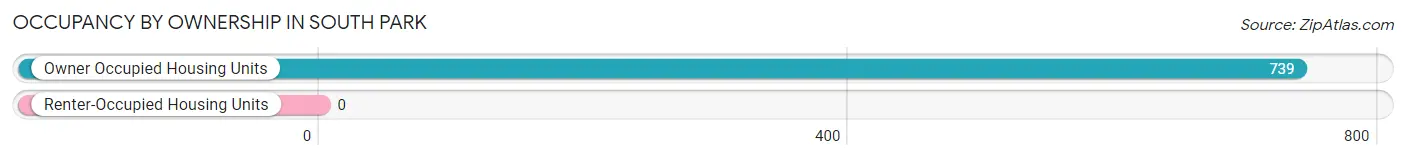
| Occupancy | # Housing Units | % Housing Units |
| Owner Occupied Housing Units | 739 | 100.0% |
| Renter-Occupied Housing Units | 0 | 0.0% |
| Total Occupied Housing Units | 739 | 100.0% |
Occupancy by Household Size in South Park
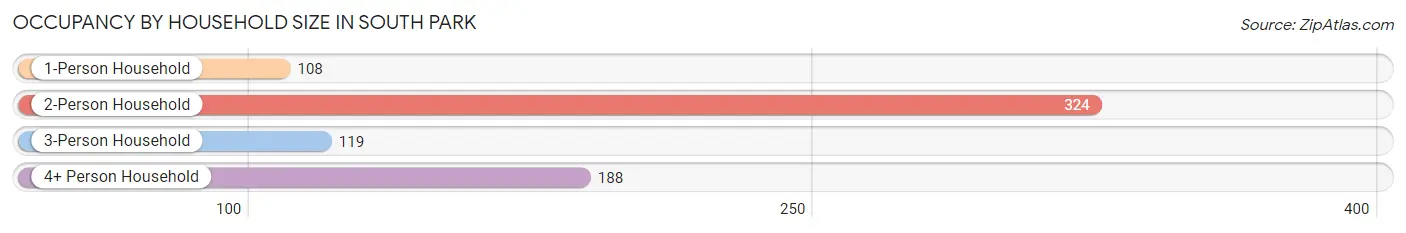
| Household Size | # Housing Units | % Housing Units |
| 1-Person Household | 108 | 14.6% |
| 2-Person Household | 324 | 43.8% |
| 3-Person Household | 119 | 16.1% |
| 4+ Person Household | 188 | 25.4% |
| Total Housing Units | 739 | 100.0% |
Occupancy by Ownership by Household Size in South Park
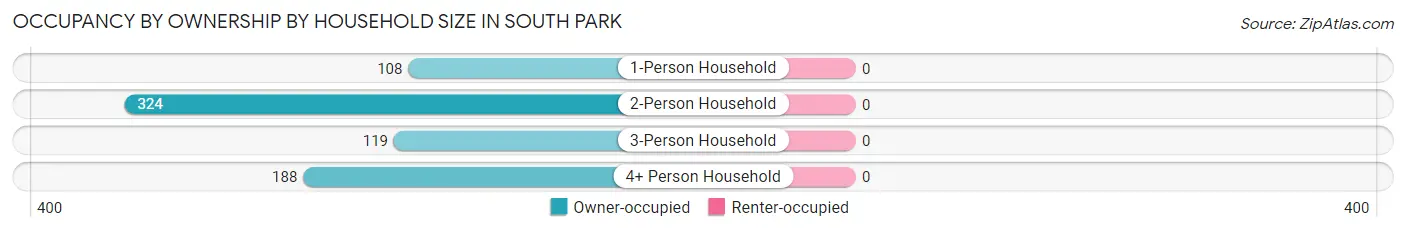
| Household Size | Owner-occupied | Renter-occupied |
| 1-Person Household | 108 (100.0%) | 0 (0.0%) |
| 2-Person Household | 324 (100.0%) | 0 (0.0%) |
| 3-Person Household | 119 (100.0%) | 0 (0.0%) |
| 4+ Person Household | 188 (100.0%) | 0 (0.0%) |
| Total Housing Units | 739 (100.0%) | 0 (0.0%) |
Occupancy by Educational Attainment in South Park
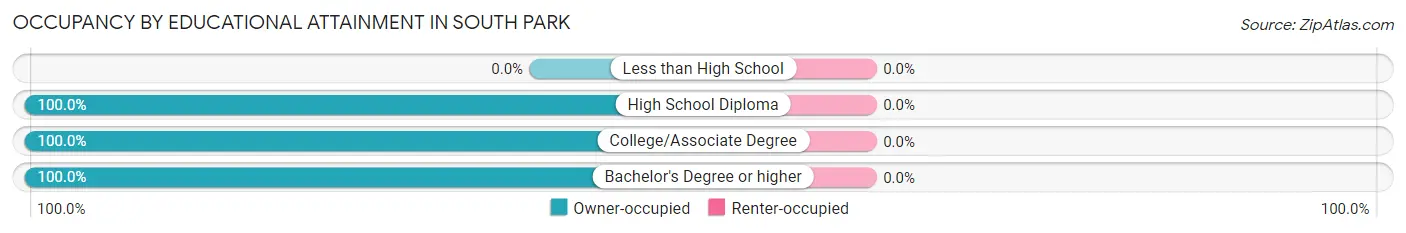
| Household Size | Owner-occupied | Renter-occupied |
| Less than High School | 0 (0.0%) | 0 (0.0%) |
| High School Diploma | 37 (100.0%) | 0 (0.0%) |
| College/Associate Degree | 186 (100.0%) | 0 (0.0%) |
| Bachelor's Degree or higher | 516 (100.0%) | 0 (0.0%) |
Occupancy by Age of Householder in South Park
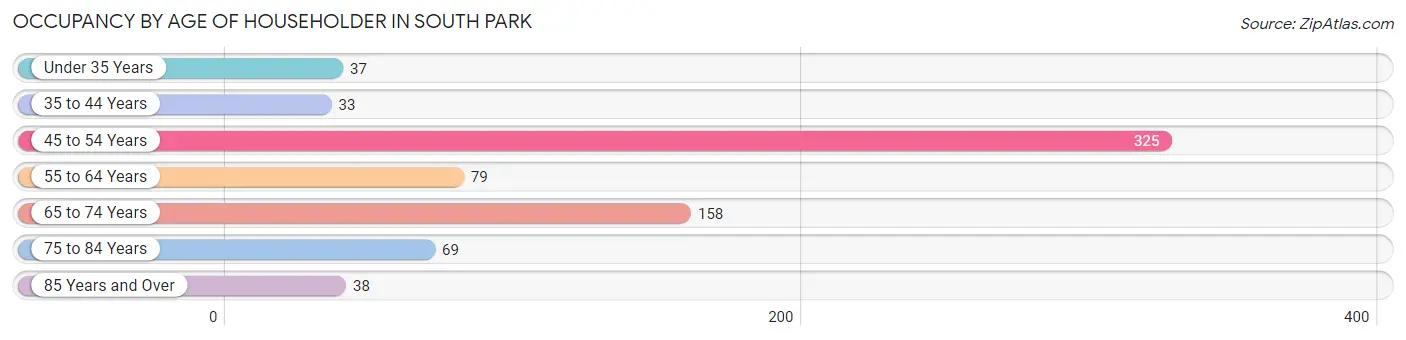
| Age Bracket | # Households | % Households |
| Under 35 Years | 37 | 5.0% |
| 35 to 44 Years | 33 | 4.5% |
| 45 to 54 Years | 325 | 44.0% |
| 55 to 64 Years | 79 | 10.7% |
| 65 to 74 Years | 158 | 21.4% |
| 75 to 84 Years | 69 | 9.3% |
| 85 Years and Over | 38 | 5.1% |
| Total | 739 | 100.0% |
Housing Finances in South Park
Median Income by Occupancy in South Park
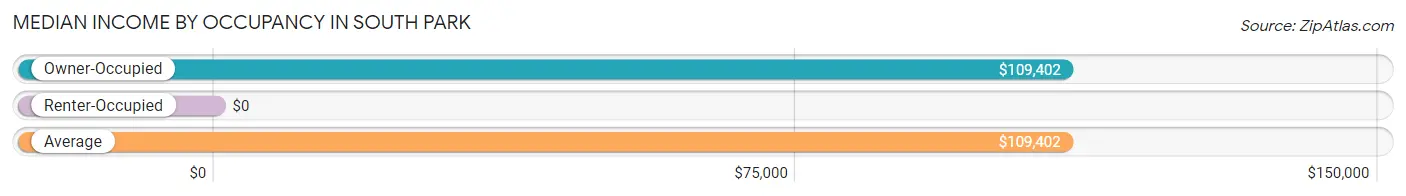
| Occupancy Type | # Households | Median Income |
| Owner-Occupied | 739 (100.0%) | $109,402 |
| Renter-Occupied | 0 (0.0%) | $0 |
| Average | 739 (100.0%) | $109,402 |
Occupancy by Householder Income Bracket in South Park
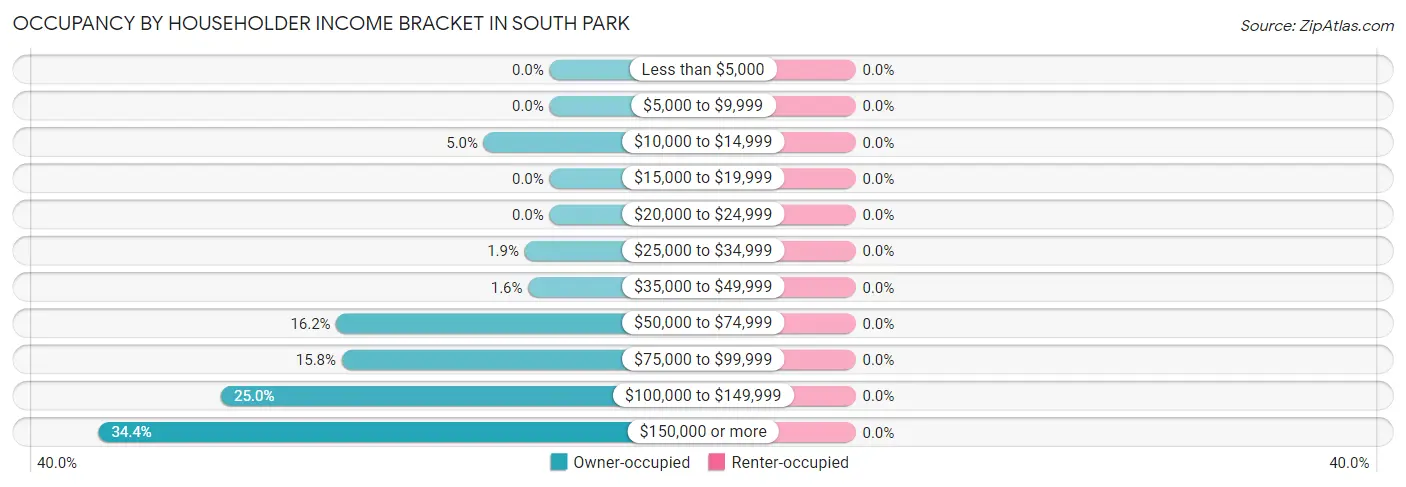
| Income Bracket | Owner-occupied | Renter-occupied |
| Less than $5,000 | 0 (0.0%) | 0 (0.0%) |
| $5,000 to $9,999 | 0 (0.0%) | 0 (0.0%) |
| $10,000 to $14,999 | 37 (5.0%) | 0 (0.0%) |
| $15,000 to $19,999 | 0 (0.0%) | 0 (0.0%) |
| $20,000 to $24,999 | 0 (0.0%) | 0 (0.0%) |
| $25,000 to $34,999 | 14 (1.9%) | 0 (0.0%) |
| $35,000 to $49,999 | 12 (1.6%) | 0 (0.0%) |
| $50,000 to $74,999 | 120 (16.2%) | 0 (0.0%) |
| $75,000 to $99,999 | 117 (15.8%) | 0 (0.0%) |
| $100,000 to $149,999 | 185 (25.0%) | 0 (0.0%) |
| $150,000 or more | 254 (34.4%) | 0 (0.0%) |
| Total | 739 (100.0%) | 0 (0.0%) |
Monthly Housing Cost Tiers in South Park
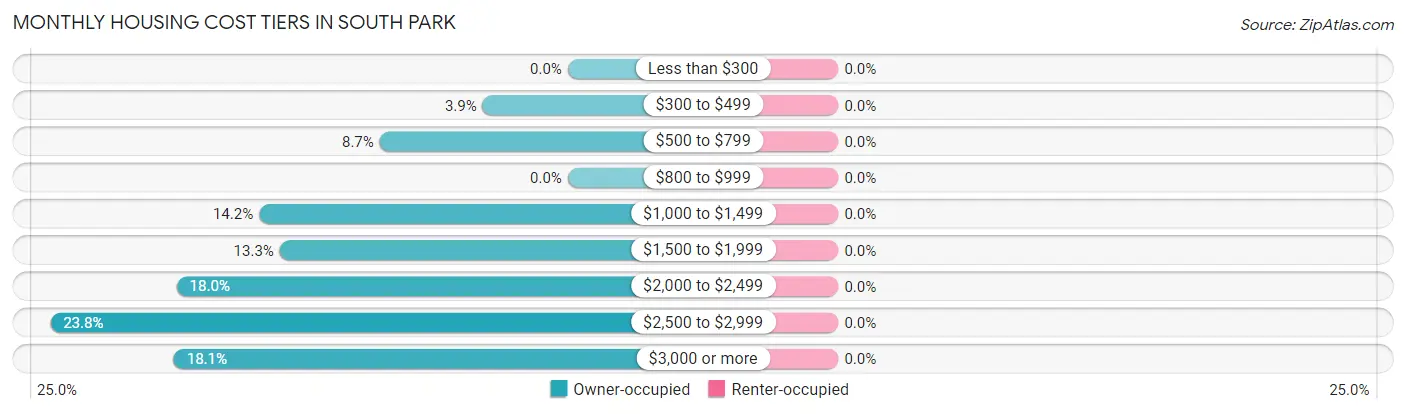
| Monthly Cost | Owner-occupied | Renter-occupied |
| Less than $300 | 0 (0.0%) | 0 (0.0%) |
| $300 to $499 | 29 (3.9%) | 0 (0.0%) |
| $500 to $799 | 64 (8.7%) | 0 (0.0%) |
| $800 to $999 | 0 (0.0%) | 0 (0.0%) |
| $1,000 to $1,499 | 105 (14.2%) | 0 (0.0%) |
| $1,500 to $1,999 | 98 (13.3%) | 0 (0.0%) |
| $2,000 to $2,499 | 133 (18.0%) | 0 (0.0%) |
| $2,500 to $2,999 | 176 (23.8%) | 0 (0.0%) |
| $3,000 or more | 134 (18.1%) | 0 (0.0%) |
| Total | 739 (100.0%) | 0 (0.0%) |
Physical Housing Characteristics in South Park
Housing Structures in South Park
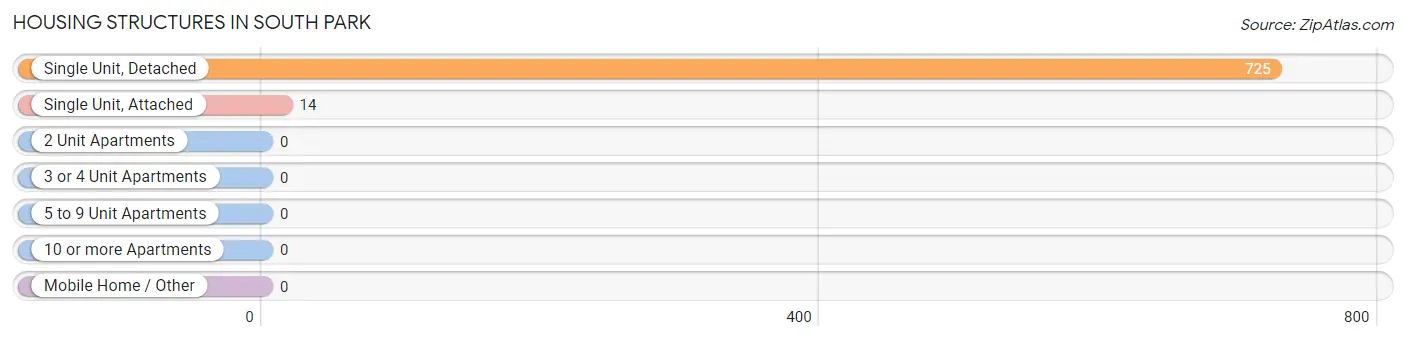
| Structure Type | # Housing Units | % Housing Units |
| Single Unit, Detached | 725 | 98.1% |
| Single Unit, Attached | 14 | 1.9% |
| 2 Unit Apartments | 0 | 0.0% |
| 3 or 4 Unit Apartments | 0 | 0.0% |
| 5 to 9 Unit Apartments | 0 | 0.0% |
| 10 or more Apartments | 0 | 0.0% |
| Mobile Home / Other | 0 | 0.0% |
| Total | 739 | 100.0% |
Housing Structures by Occupancy in South Park
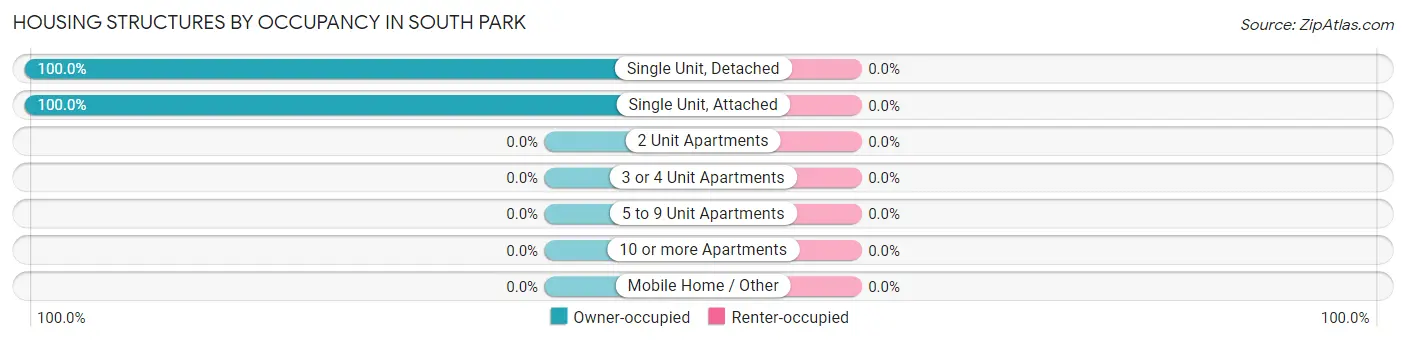
| Structure Type | Owner-occupied | Renter-occupied |
| Single Unit, Detached | 725 (100.0%) | 0 (0.0%) |
| Single Unit, Attached | 14 (100.0%) | 0 (0.0%) |
| 2 Unit Apartments | 0 (0.0%) | 0 (0.0%) |
| 3 or 4 Unit Apartments | 0 (0.0%) | 0 (0.0%) |
| 5 to 9 Unit Apartments | 0 (0.0%) | 0 (0.0%) |
| 10 or more Apartments | 0 (0.0%) | 0 (0.0%) |
| Mobile Home / Other | 0 (0.0%) | 0 (0.0%) |
| Total | 739 (100.0%) | 0 (0.0%) |
Housing Structures by Number of Rooms in South Park
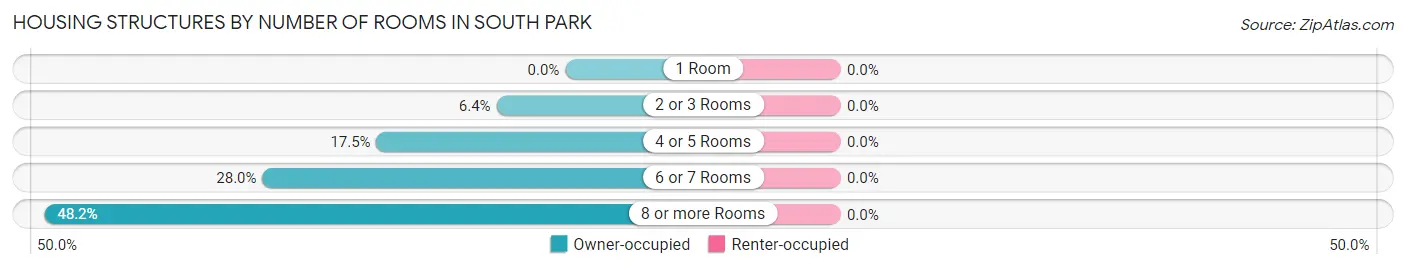
| Number of Rooms | Owner-occupied | Renter-occupied |
| 1 Room | 0 (0.0%) | 0 (0.0%) |
| 2 or 3 Rooms | 47 (6.4%) | 0 (0.0%) |
| 4 or 5 Rooms | 129 (17.5%) | 0 (0.0%) |
| 6 or 7 Rooms | 207 (28.0%) | 0 (0.0%) |
| 8 or more Rooms | 356 (48.2%) | 0 (0.0%) |
| Total | 739 (100.0%) | 0 (0.0%) |
Housing Structure by Heating Type in South Park
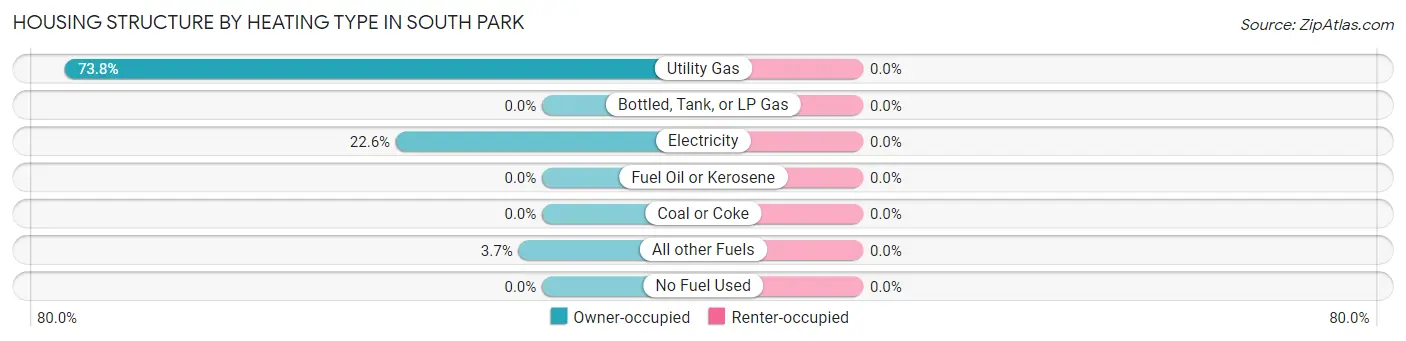
| Heating Type | Owner-occupied | Renter-occupied |
| Utility Gas | 545 (73.8%) | 0 (0.0%) |
| Bottled, Tank, or LP Gas | 0 (0.0%) | 0 (0.0%) |
| Electricity | 167 (22.6%) | 0 (0.0%) |
| Fuel Oil or Kerosene | 0 (0.0%) | 0 (0.0%) |
| Coal or Coke | 0 (0.0%) | 0 (0.0%) |
| All other Fuels | 27 (3.6%) | 0 (0.0%) |
| No Fuel Used | 0 (0.0%) | 0 (0.0%) |
| Total | 739 (100.0%) | 0 (0.0%) |
Household Vehicle Usage in South Park
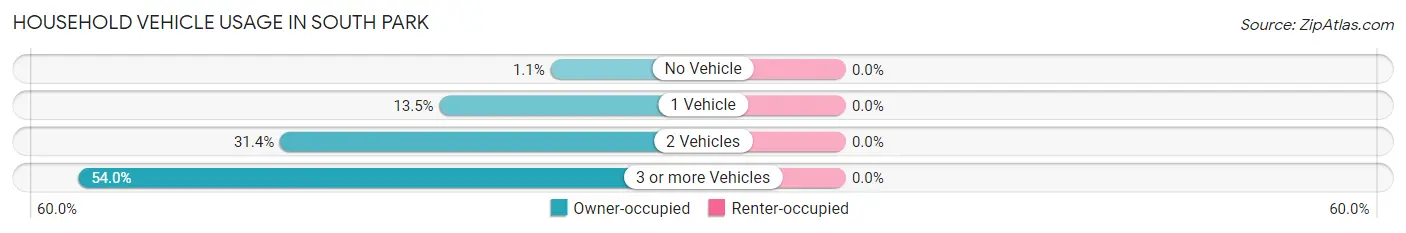
| Vehicles per Household | Owner-occupied | Renter-occupied |
| No Vehicle | 8 (1.1%) | 0 (0.0%) |
| 1 Vehicle | 100 (13.5%) | 0 (0.0%) |
| 2 Vehicles | 232 (31.4%) | 0 (0.0%) |
| 3 or more Vehicles | 399 (54.0%) | 0 (0.0%) |
| Total | 739 (100.0%) | 0 (0.0%) |
Real Estate & Mortgages in South Park
Real Estate and Mortgage Overview in South Park
| Characteristic | Without Mortgage | With Mortgage |
| Housing Units | 184 | 555 |
| Median Property Value | $1,533,300 | $1,262,800 |
| Median Household Income | $124,038 | $195 |
| Monthly Housing Costs | $1,324 | $134 |
| Real Estate Taxes | $8,796 | $0 |
Property Value by Mortgage Status in South Park
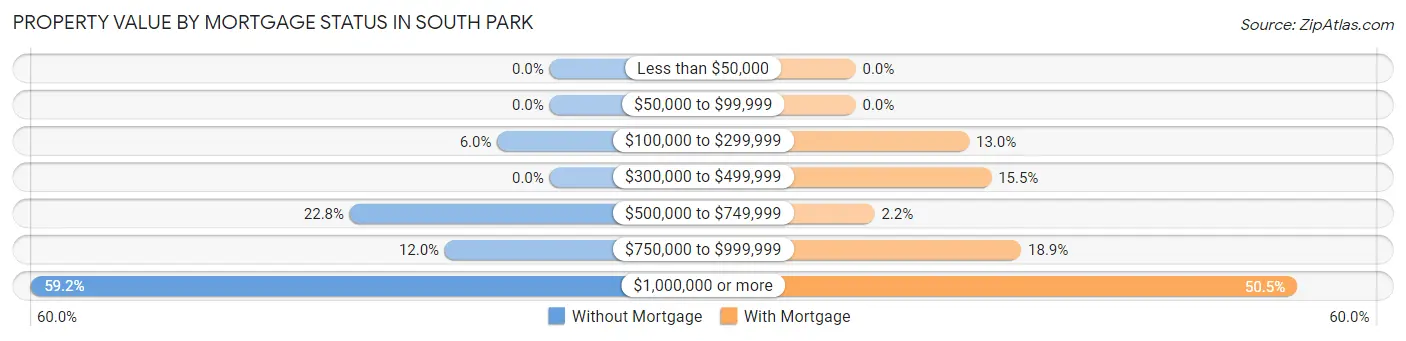
| Property Value | Without Mortgage | With Mortgage |
| Less than $50,000 | 0 (0.0%) | 0 (0.0%) |
| $50,000 to $99,999 | 0 (0.0%) | 0 (0.0%) |
| $100,000 to $299,999 | 11 (6.0%) | 72 (13.0%) |
| $300,000 to $499,999 | 0 (0.0%) | 86 (15.5%) |
| $500,000 to $749,999 | 42 (22.8%) | 12 (2.2%) |
| $750,000 to $999,999 | 22 (12.0%) | 105 (18.9%) |
| $1,000,000 or more | 109 (59.2%) | 280 (50.4%) |
| Total | 184 (100.0%) | 555 (100.0%) |
Household Income by Mortgage Status in South Park
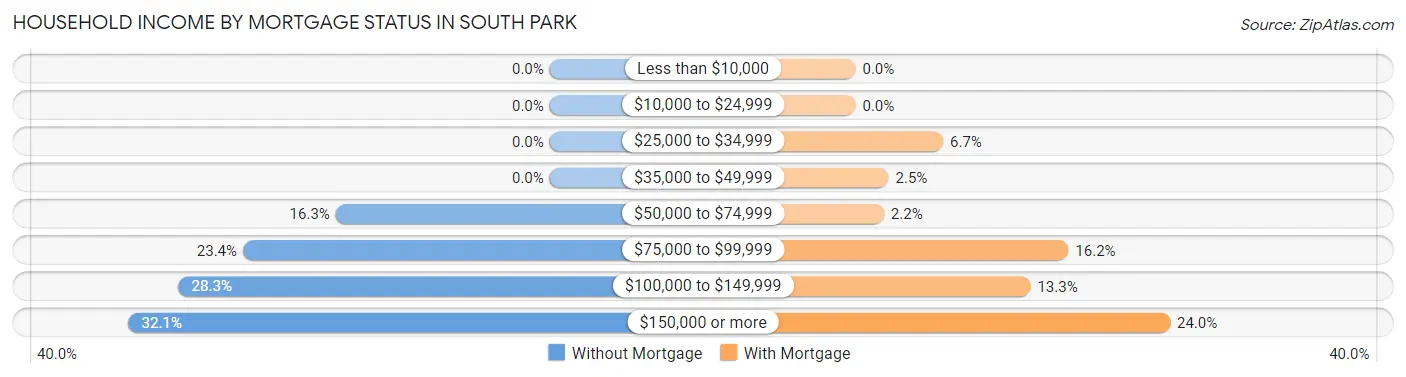
| Household Income | Without Mortgage | With Mortgage |
| Less than $10,000 | 0 (0.0%) | 0 (0.0%) |
| $10,000 to $24,999 | 0 (0.0%) | 0 (0.0%) |
| $25,000 to $34,999 | 0 (0.0%) | 37 (6.7%) |
| $35,000 to $49,999 | 0 (0.0%) | 14 (2.5%) |
| $50,000 to $74,999 | 30 (16.3%) | 12 (2.2%) |
| $75,000 to $99,999 | 43 (23.4%) | 90 (16.2%) |
| $100,000 to $149,999 | 52 (28.3%) | 74 (13.3%) |
| $150,000 or more | 59 (32.1%) | 133 (24.0%) |
| Total | 184 (100.0%) | 555 (100.0%) |
Property Value to Household Income Ratio in South Park
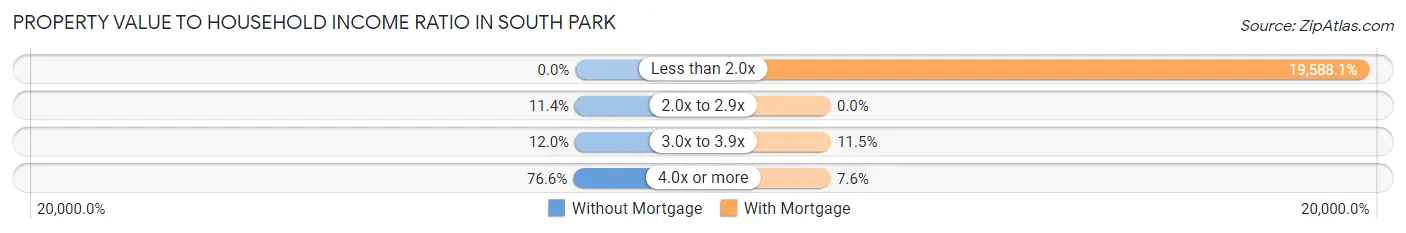
| Value-to-Income Ratio | Without Mortgage | With Mortgage |
| Less than 2.0x | 0 (0.0%) | 108,714 (19,588.1%) |
| 2.0x to 2.9x | 21 (11.4%) | 0 (0.0%) |
| 3.0x to 3.9x | 22 (12.0%) | 64 (11.5%) |
| 4.0x or more | 141 (76.6%) | 42 (7.6%) |
| Total | 184 (100.0%) | 555 (100.0%) |
Real Estate Taxes by Mortgage Status in South Park
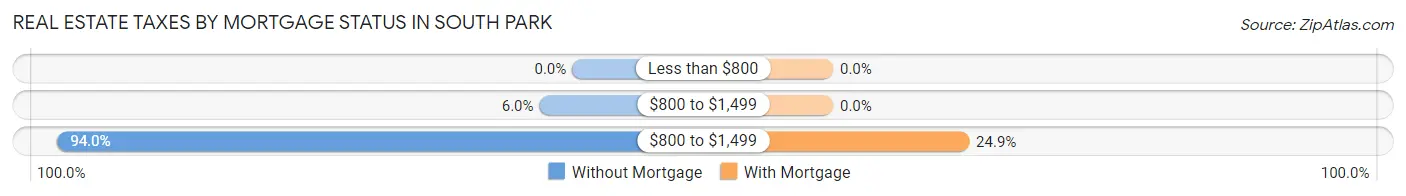
| Property Taxes | Without Mortgage | With Mortgage |
| Less than $800 | 0 (0.0%) | 0 (0.0%) |
| $800 to $1,499 | 11 (6.0%) | 0 (0.0%) |
| $800 to $1,499 | 173 (94.0%) | 138 (24.9%) |
| Total | 184 (100.0%) | 555 (100.0%) |
Health & Disability in South Park
Health Insurance Coverage by Age in South Park
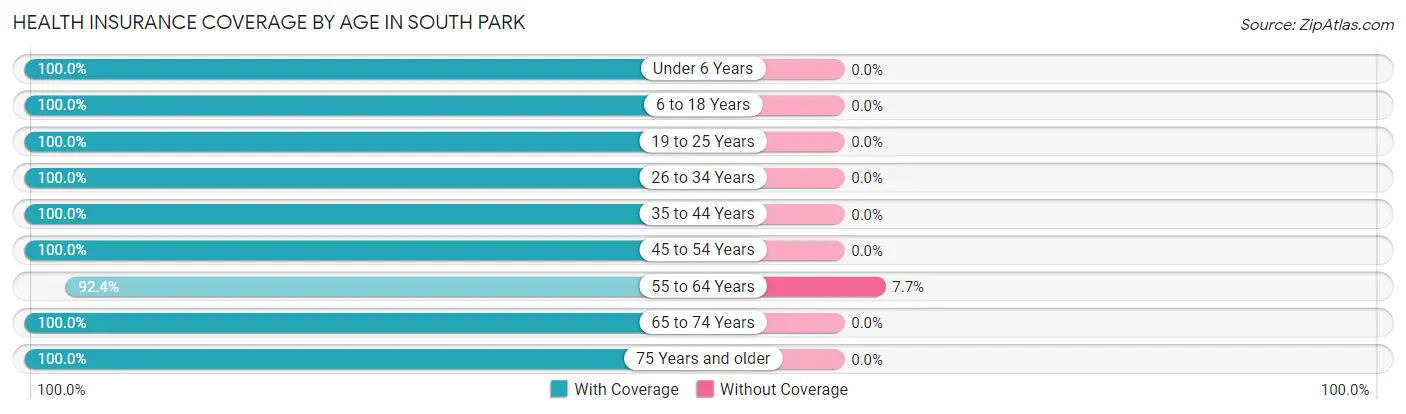
| Age Bracket | With Coverage | Without Coverage |
| Under 6 Years | 37 (100.0%) | 0 (0.0%) |
| 6 to 18 Years | 419 (100.0%) | 0 (0.0%) |
| 19 to 25 Years | 17 (100.0%) | 0 (0.0%) |
| 26 to 34 Years | 65 (100.0%) | 0 (0.0%) |
| 35 to 44 Years | 179 (100.0%) | 0 (0.0%) |
| 45 to 54 Years | 396 (100.0%) | 0 (0.0%) |
| 55 to 64 Years | 362 (92.3%) | 30 (7.6%) |
| 65 to 74 Years | 234 (100.0%) | 0 (0.0%) |
| 75 Years and older | 160 (100.0%) | 0 (0.0%) |
| Total | 1,869 (98.4%) | 30 (1.6%) |
Health Insurance Coverage by Citizenship Status in South Park
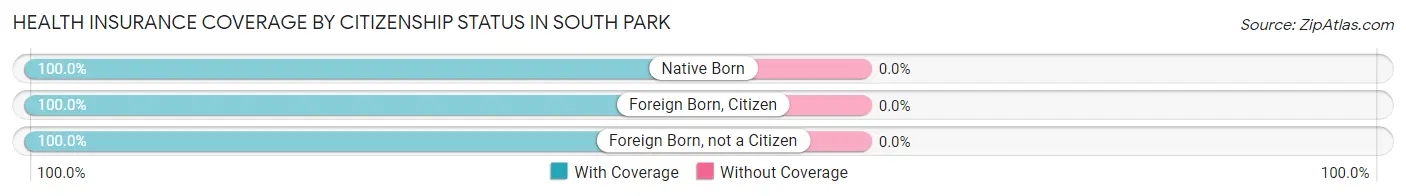
| Citizenship Status | With Coverage | Without Coverage |
| Native Born | 37 (100.0%) | 0 (0.0%) |
| Foreign Born, Citizen | 419 (100.0%) | 0 (0.0%) |
| Foreign Born, not a Citizen | 17 (100.0%) | 0 (0.0%) |
Health Insurance Coverage by Household Income in South Park
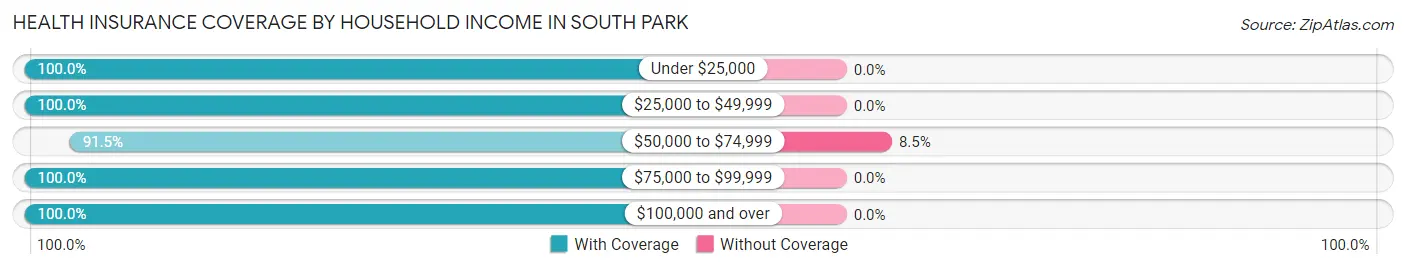
| Household Income | With Coverage | Without Coverage |
| Under $25,000 | 46 (100.0%) | 0 (0.0%) |
| $25,000 to $49,999 | 95 (100.0%) | 0 (0.0%) |
| $50,000 to $74,999 | 324 (91.5%) | 30 (8.5%) |
| $75,000 to $99,999 | 200 (100.0%) | 0 (0.0%) |
| $100,000 and over | 1,204 (100.0%) | 0 (0.0%) |
Public vs Private Health Insurance Coverage by Age in South Park
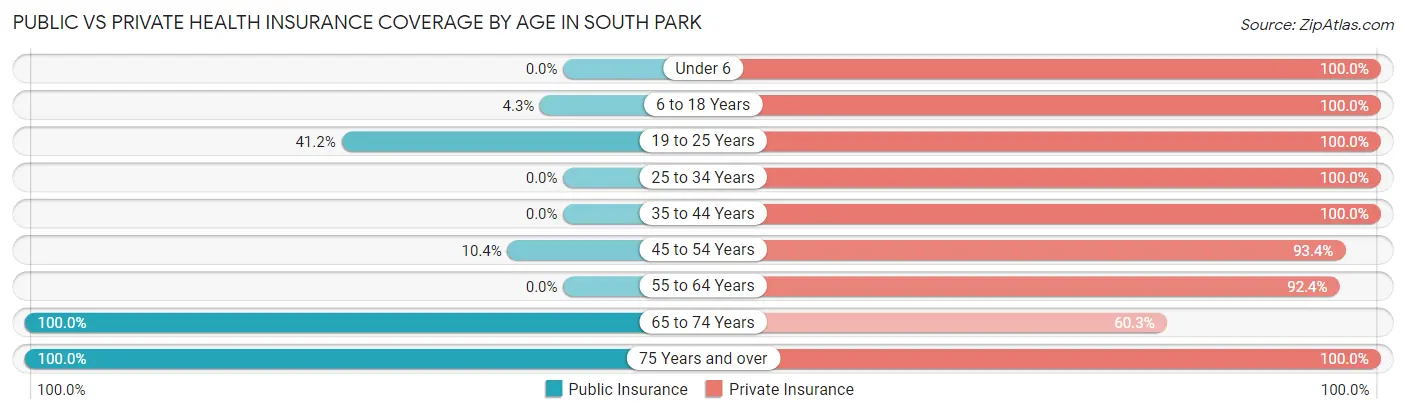
| Age Bracket | Public Insurance | Private Insurance |
| Under 6 | 0 (0.0%) | 37 (100.0%) |
| 6 to 18 Years | 18 (4.3%) | 419 (100.0%) |
| 19 to 25 Years | 7 (41.2%) | 17 (100.0%) |
| 25 to 34 Years | 0 (0.0%) | 65 (100.0%) |
| 35 to 44 Years | 0 (0.0%) | 179 (100.0%) |
| 45 to 54 Years | 41 (10.3%) | 370 (93.4%) |
| 55 to 64 Years | 0 (0.0%) | 362 (92.3%) |
| 65 to 74 Years | 234 (100.0%) | 141 (60.3%) |
| 75 Years and over | 160 (100.0%) | 160 (100.0%) |
| Total | 460 (24.2%) | 1,750 (92.1%) |
Disability Status by Sex by Age in South Park
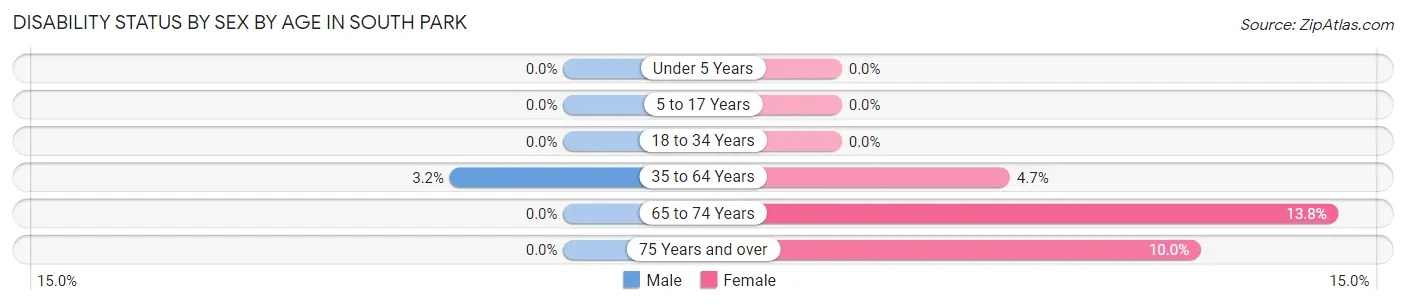
| Age Bracket | Male | Female |
| Under 5 Years | 0 (0.0%) | 0 (0.0%) |
| 5 to 17 Years | 0 (0.0%) | 0 (0.0%) |
| 18 to 34 Years | 0 (0.0%) | 0 (0.0%) |
| 35 to 64 Years | 13 (3.2%) | 26 (4.7%) |
| 65 to 74 Years | 0 (0.0%) | 13 (13.8%) |
| 75 Years and over | 0 (0.0%) | 12 (10.0%) |
Disability Class by Sex by Age in South Park
Disability Class: Hearing Difficulty
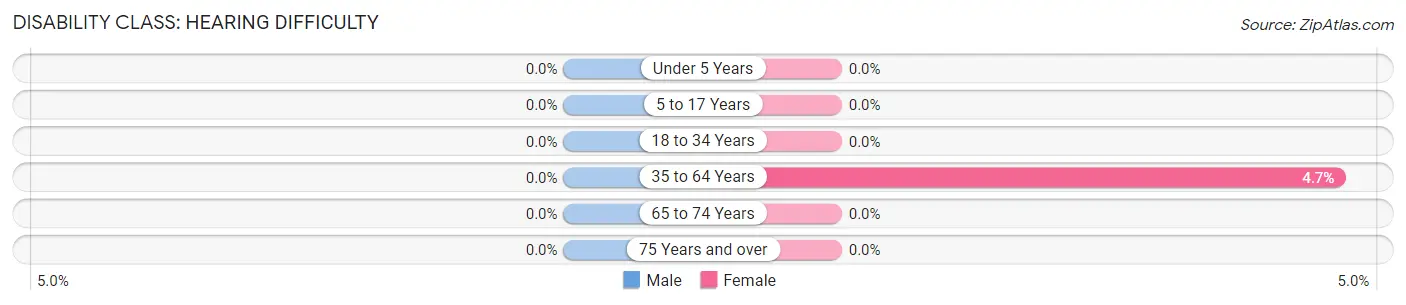
| Age Bracket | Male | Female |
| Under 5 Years | 0 (0.0%) | 0 (0.0%) |
| 5 to 17 Years | 0 (0.0%) | 0 (0.0%) |
| 18 to 34 Years | 0 (0.0%) | 0 (0.0%) |
| 35 to 64 Years | 0 (0.0%) | 26 (4.7%) |
| 65 to 74 Years | 0 (0.0%) | 0 (0.0%) |
| 75 Years and over | 0 (0.0%) | 0 (0.0%) |
Disability Class: Vision Difficulty
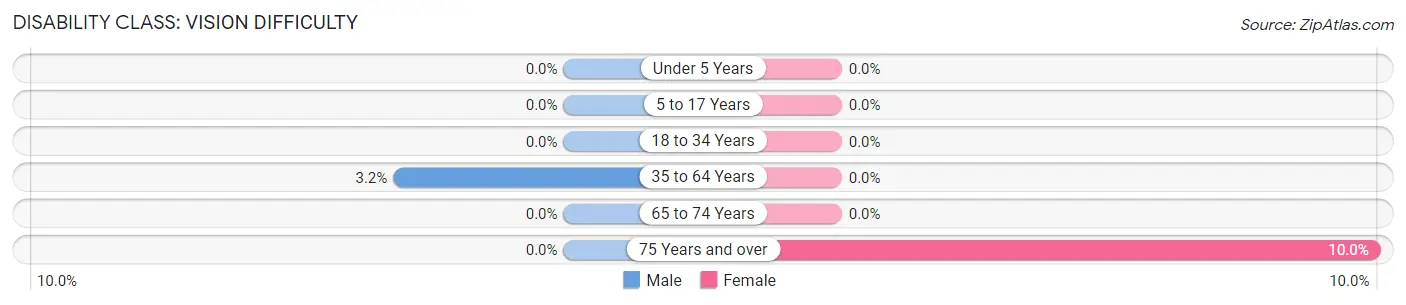
| Age Bracket | Male | Female |
| Under 5 Years | 0 (0.0%) | 0 (0.0%) |
| 5 to 17 Years | 0 (0.0%) | 0 (0.0%) |
| 18 to 34 Years | 0 (0.0%) | 0 (0.0%) |
| 35 to 64 Years | 13 (3.2%) | 0 (0.0%) |
| 65 to 74 Years | 0 (0.0%) | 0 (0.0%) |
| 75 Years and over | 0 (0.0%) | 12 (10.0%) |
Disability Class: Cognitive Difficulty
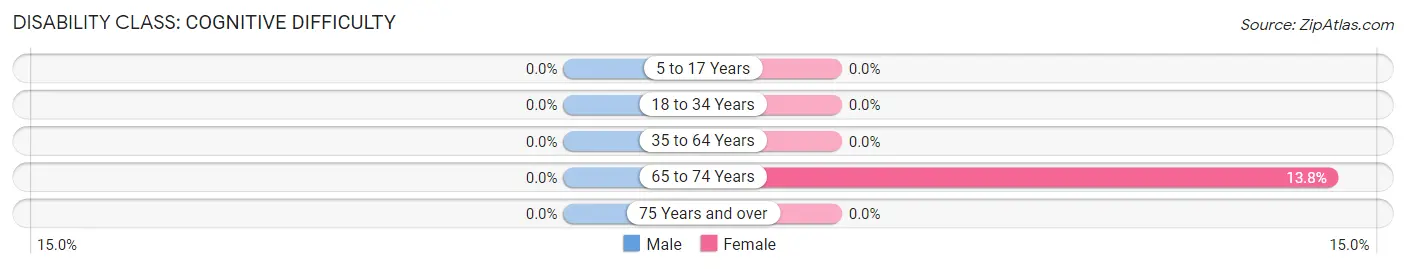
| Age Bracket | Male | Female |
| 5 to 17 Years | 0 (0.0%) | 0 (0.0%) |
| 18 to 34 Years | 0 (0.0%) | 0 (0.0%) |
| 35 to 64 Years | 0 (0.0%) | 0 (0.0%) |
| 65 to 74 Years | 0 (0.0%) | 13 (13.8%) |
| 75 Years and over | 0 (0.0%) | 0 (0.0%) |
Disability Class: Ambulatory Difficulty
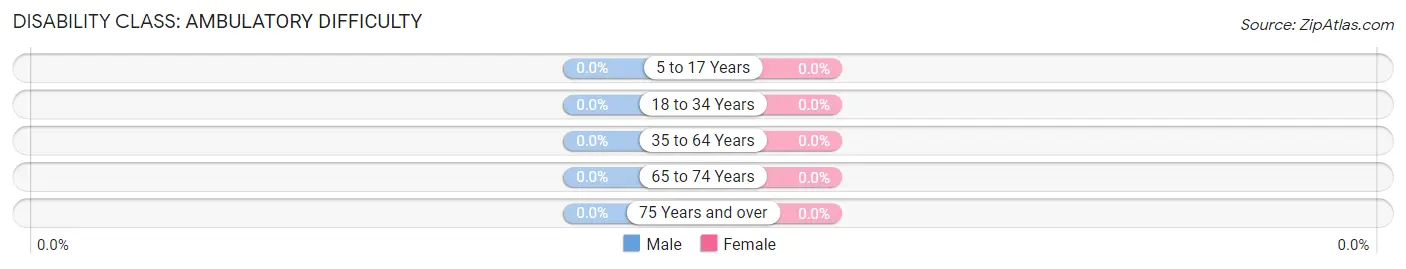
| Age Bracket | Male | Female |
| 5 to 17 Years | 0 (0.0%) | 0 (0.0%) |
| 18 to 34 Years | 0 (0.0%) | 0 (0.0%) |
| 35 to 64 Years | 0 (0.0%) | 0 (0.0%) |
| 65 to 74 Years | 0 (0.0%) | 0 (0.0%) |
| 75 Years and over | 0 (0.0%) | 0 (0.0%) |
Disability Class: Self-Care Difficulty
| Age Bracket | Male | Female |
| 5 to 17 Years | 0 (0.0%) | 0 (0.0%) |
| 18 to 34 Years | 0 (0.0%) | 0 (0.0%) |
| 35 to 64 Years | 0 (0.0%) | 0 (0.0%) |
| 65 to 74 Years | 0 (0.0%) | 0 (0.0%) |
| 75 Years and over | 0 (0.0%) | 0 (0.0%) |
Technology Access in South Park
Computing Device Access in South Park
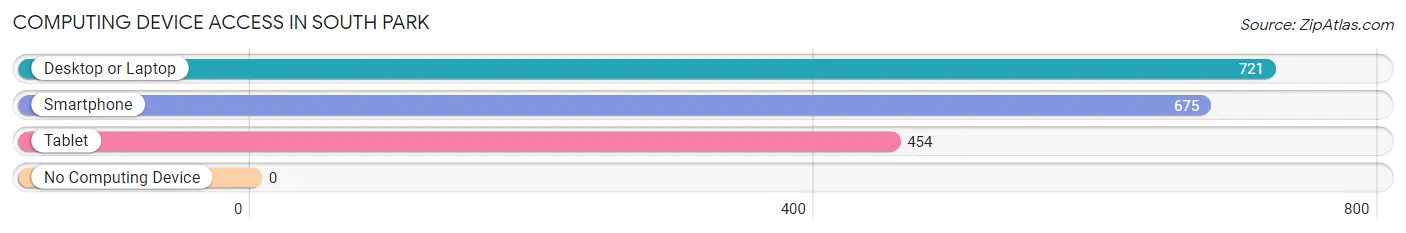
| Device Type | # Households | % Households |
| Desktop or Laptop | 721 | 97.6% |
| Smartphone | 675 | 91.3% |
| Tablet | 454 | 61.4% |
| No Computing Device | 0 | 0.0% |
| Total | 739 | 100.0% |
Internet Access in South Park
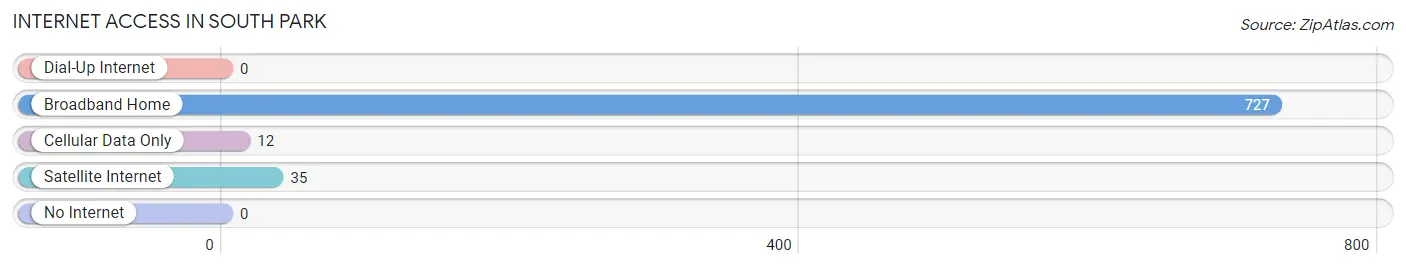
| Internet Type | # Households | % Households |
| Dial-Up Internet | 0 | 0.0% |
| Broadband Home | 727 | 98.4% |
| Cellular Data Only | 12 | 1.6% |
| Satellite Internet | 35 | 4.7% |
| No Internet | 0 | 0.0% |
| Total | 739 | 100.0% |
South Park Summary
South Park is a small town located in the Rocky Mountains of Wyoming. It is situated in the northern part of the state, just south of the Wyoming-Colorado border. The town is named after the nearby South Park, a large, flat, grassy valley surrounded by mountains. South Park is located in Park County, and is the county seat. The town has a population of approximately 1,000 people, and is a popular tourist destination due to its proximity to the Rocky Mountains and its many outdoor activities.
Geography
South Park is located in the northern part of Wyoming, just south of the Wyoming-Colorado border. The town is situated in the South Park Valley, a large, flat, grassy valley surrounded by mountains. The valley is approximately 8,000 feet above sea level, and is home to several small lakes and streams. The town is located in Park County, and is the county seat.
The town is located in a semi-arid climate, with hot summers and cold winters. The average annual temperature is approximately 45 degrees Fahrenheit, and the average annual precipitation is approximately 15 inches.
Economy
The economy of South Park is largely based on tourism. The town is a popular destination for outdoor activities such as fishing, hunting, camping, and hiking. The nearby mountains provide a variety of recreational opportunities, and the town is also home to several ski resorts.
In addition to tourism, the town is also home to several small businesses, including restaurants, shops, and lodging. The town is also home to a small manufacturing plant, which produces a variety of products.
Demographics
As of the 2010 census, the population of South Park was 1,000 people. The racial makeup of the town was 97.2% White, 0.7% Native American, 0.3% Asian, 0.2% from other races, and 1.6% from two or more races. The median age of the population was 43.7 years.
The median household income in South Park was $41,250, and the median family income was $50,000. The per capita income was $20,000. Approximately 10.3% of the population was below the poverty line.
Conclusion
South Park is a small town located in the Rocky Mountains of Wyoming. It is situated in the northern part of the state, just south of the Wyoming-Colorado border. The town is named after the nearby South Park, a large, flat, grassy valley surrounded by mountains. South Park is located in Park County, and is the county seat. The town has a population of approximately 1,000 people, and is a popular tourist destination due to its proximity to the Rocky Mountains and its many outdoor activities. The economy of South Park is largely based on tourism, and the town is also home to several small businesses. The racial makeup of the town is 97.2% White, 0.7% Native American, 0.3% Asian, 0.2% from other races, and 1.6% from two or more races. The median household income in South Park was $41,250, and the median family income was $50,000.
Common Questions
What is Per Capita Income in South Park?
Per Capita income in South Park is $73,113.
What is the Median Family Income in South Park?
Median Family Income in South Park is $114,492.
What is the Median Household income in South Park?
Median Household Income in South Park is $109,402.
What is Inequality or Gini Index in South Park?
Inequality or Gini Index in South Park is 0.45.
What is the Total Population of South Park?
Total Population of South Park is 1,899.
What is the Total Male Population of South Park?
Total Male Population of South Park is 882.
What is the Total Female Population of South Park?
Total Female Population of South Park is 1,017.
What is the Ratio of Males per 100 Females in South Park?
There are 86.73 Males per 100 Females in South Park.
What is the Ratio of Females per 100 Males in South Park?
There are 115.31 Females per 100 Males in South Park.
What is the Median Population Age in South Park?
Median Population Age in South Park is 52.1 Years.
What is the Average Family Size in South Park
Average Family Size in South Park is 2.9 People.
What is the Average Household Size in South Park
Average Household Size in South Park is 2.6 People.
How Large is the Labor Force in South Park?
There are 1,094 People in the Labor Forcein in South Park.
What is the Percentage of People in the Labor Force in South Park?
73.9% of People are in the Labor Force in South Park.
What is the Unemployment Rate in South Park?
Unemployment Rate in South Park is 3.6%.