Corn Creek, SD Map & Demographics
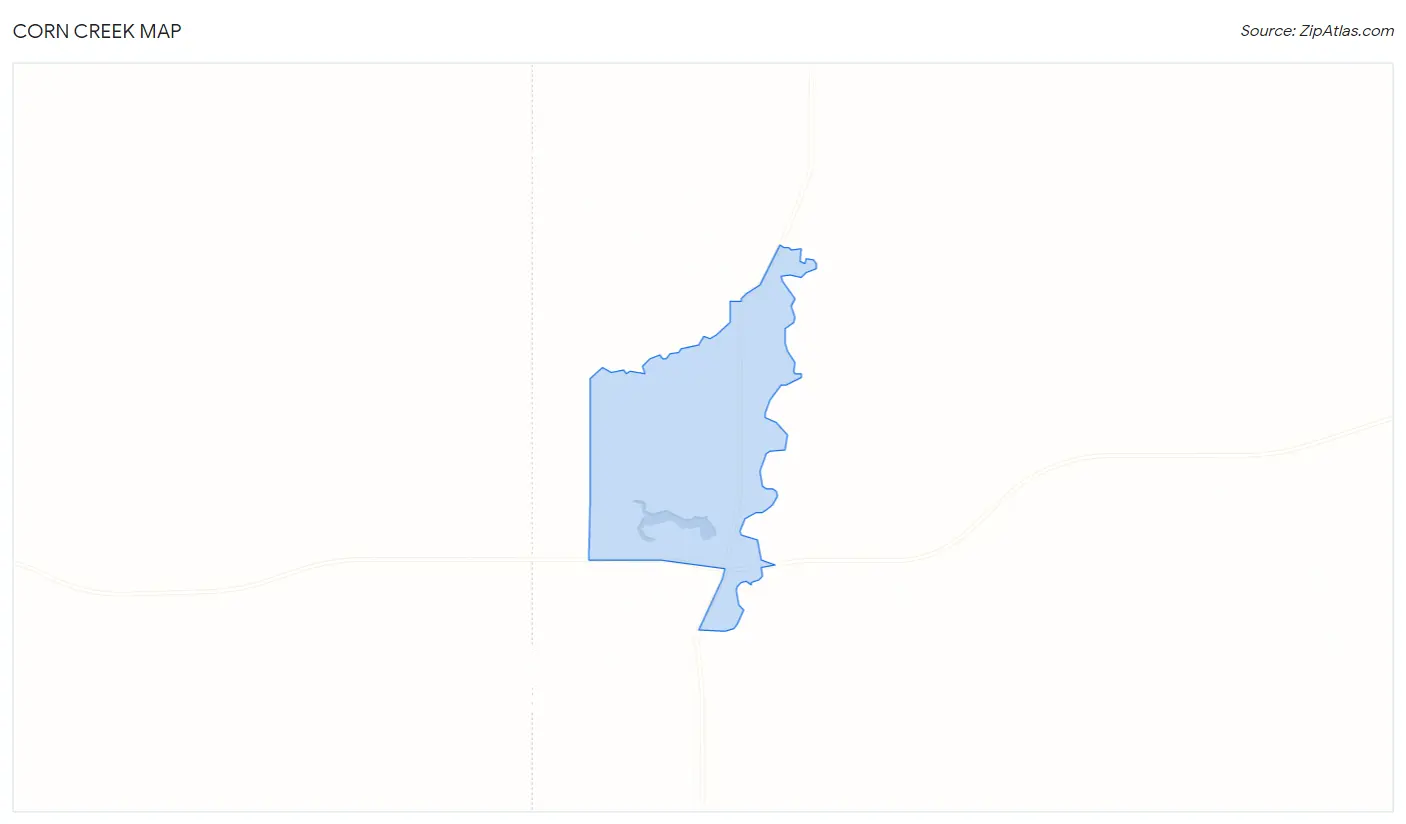
Corn Creek Map
Corn Creek Overview
$2,549
PER CAPITA INCOME
0.69
INEQUALITY / GINI INDEX
183
TOTAL POPULATION
92
MALE POPULATION
91
FEMALE POPULATION
101.10
MALES / 100 FEMALES
98.91
FEMALES / 100 MALES
26.4
MEDIAN AGE
5.7
AVG FAMILY SIZE
5.7
AVG HOUSEHOLD SIZE
17
LABOR FORCE [ PEOPLE ]
14.3%
PERCENT IN LABOR FORCE
41.2%
UNEMPLOYMENT RATE
Income in Corn Creek
Income Overview in Corn Creek
| Characteristic | Number | Measure |
| Per Capita Income | 183 | $2,549 |
| Median Family Income | 32 | $0 |
| Mean Family Income | 32 | $13,253 |
| Median Household Income | 32 | $0 |
| Mean Household Income | 32 | $13,253 |
| Income Deficit | 32 | $0 |
| Wage / Income Gap (%) | 183 | 0.00% |
| Wage / Income Gap ($) | 183 | 100.00¢ per $1 |
| Gini / Inequality Index | 183 | 0.69 |
Earnings by Sex in Corn Creek
| Sex | Number | Average Earnings |
| Male | 15 (100.0%) | $0 |
| Female | 0 (0.0%) | $0 |
| Total | 15 (100.0%) | $0 |
Earnings by Sex by Income Bracket in Corn Creek
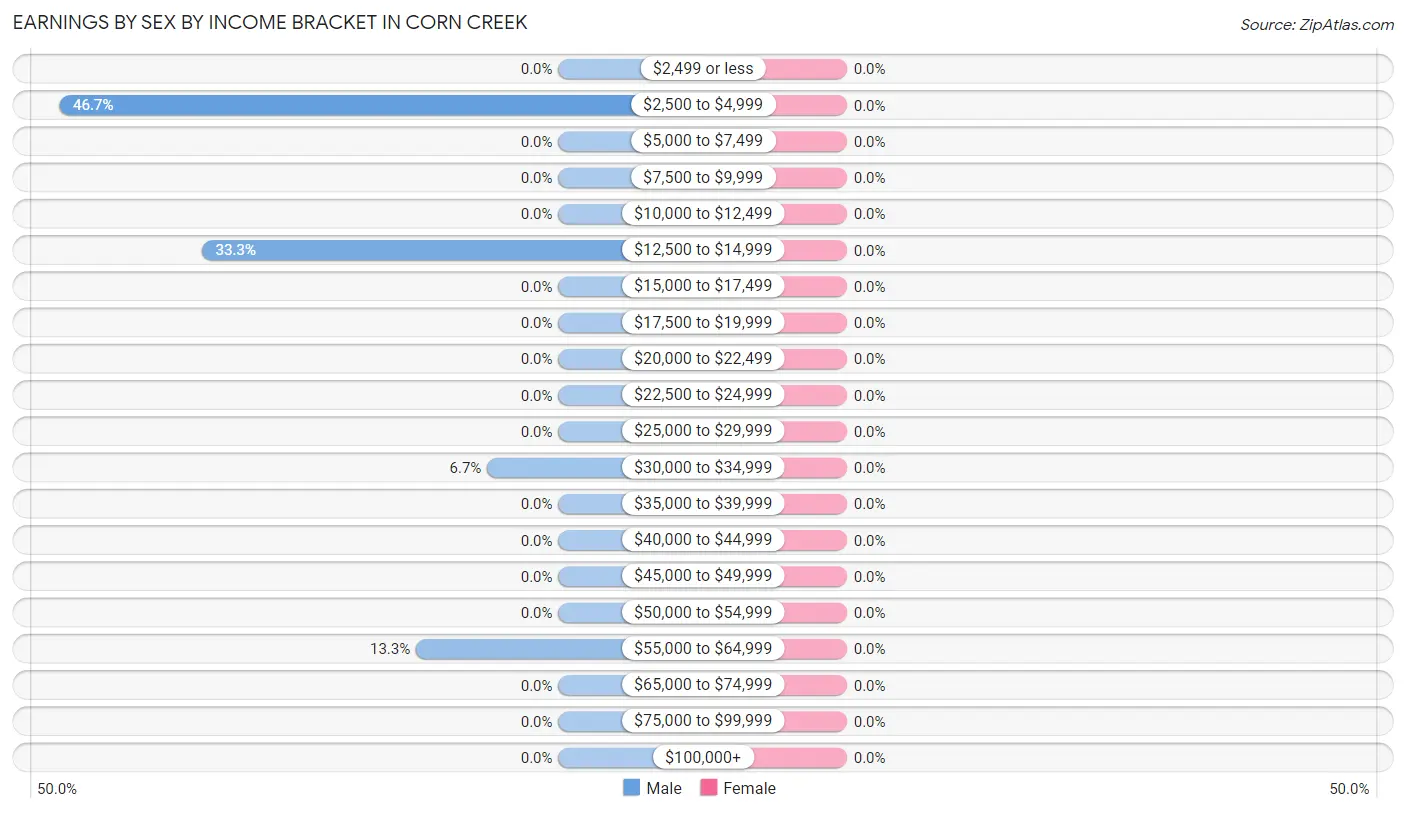
| Income | Male | Female |
| $2,499 or less | 0 (0.0%) | 0 (0.0%) |
| $2,500 to $4,999 | 7 (46.7%) | 0 (0.0%) |
| $5,000 to $7,499 | 0 (0.0%) | 0 (0.0%) |
| $7,500 to $9,999 | 0 (0.0%) | 0 (0.0%) |
| $10,000 to $12,499 | 0 (0.0%) | 0 (0.0%) |
| $12,500 to $14,999 | 5 (33.3%) | 0 (0.0%) |
| $15,000 to $17,499 | 0 (0.0%) | 0 (0.0%) |
| $17,500 to $19,999 | 0 (0.0%) | 0 (0.0%) |
| $20,000 to $22,499 | 0 (0.0%) | 0 (0.0%) |
| $22,500 to $24,999 | 0 (0.0%) | 0 (0.0%) |
| $25,000 to $29,999 | 0 (0.0%) | 0 (0.0%) |
| $30,000 to $34,999 | 1 (6.7%) | 0 (0.0%) |
| $35,000 to $39,999 | 0 (0.0%) | 0 (0.0%) |
| $40,000 to $44,999 | 0 (0.0%) | 0 (0.0%) |
| $45,000 to $49,999 | 0 (0.0%) | 0 (0.0%) |
| $50,000 to $54,999 | 0 (0.0%) | 0 (0.0%) |
| $55,000 to $64,999 | 2 (13.3%) | 0 (0.0%) |
| $65,000 to $74,999 | 0 (0.0%) | 0 (0.0%) |
| $75,000 to $99,999 | 0 (0.0%) | 0 (0.0%) |
| $100,000+ | 0 (0.0%) | 0 (0.0%) |
| Total | 15 (100.0%) | 0 (0.0%) |
Earnings by Sex by Educational Attainment in Corn Creek
| Educational Attainment | Male Income | Female Income |
| Less than High School | - | - |
| High School Diploma | - | - |
| College or Associate's Degree | - | - |
| Bachelor's Degree | - | - |
| Graduate Degree | - | - |
| Total | - | - |
Family Income in Corn Creek
Family Income Brackets in Corn Creek
According to the Corn Creek family income data, there are 17 families falling into the less than $10,000 income range, which is the most common income bracket and makes up 53.1% of all families.
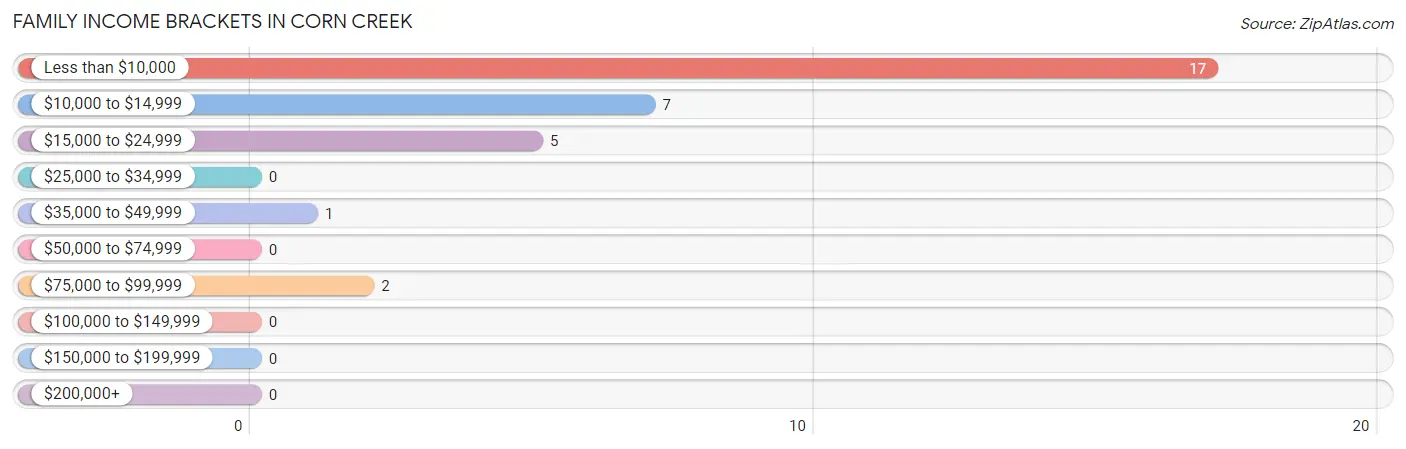
| Income Bracket | # Families | % Families |
| Less than $10,000 | 17 | 53.1% |
| $10,000 to $14,999 | 7 | 21.9% |
| $15,000 to $24,999 | 5 | 15.6% |
| $25,000 to $34,999 | 0 | 0.0% |
| $35,000 to $49,999 | 1 | 3.1% |
| $50,000 to $74,999 | 0 | 0.0% |
| $75,000 to $99,999 | 2 | 6.3% |
| $100,000 to $149,999 | 0 | 0.0% |
| $150,000 to $199,999 | 0 | 0.0% |
| $200,000+ | 0 | 0.0% |
Family Income by Famaliy Size in Corn Creek
2-person families (12 | 37.5%) account for the highest median family income in Corn Creek with $2,499 per family, while 2-person families (12 | 37.5%) have the highest median income of $1,250 per family member.
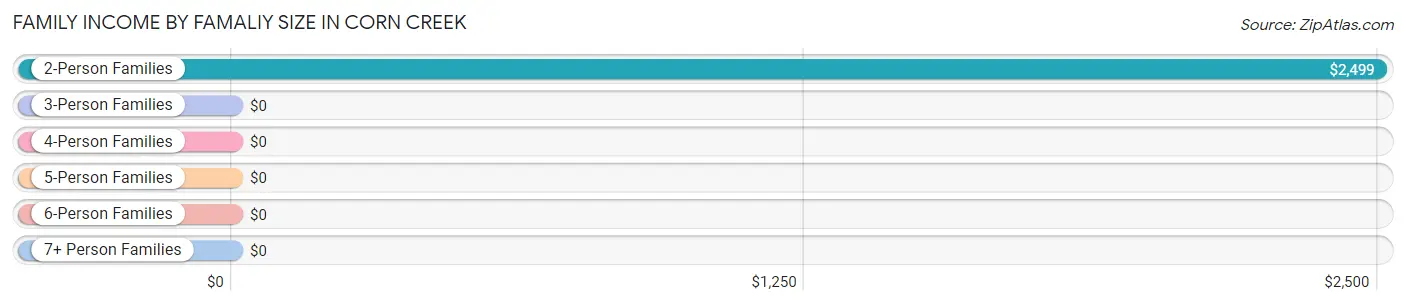
| Income Bracket | # Families | Median Income |
| 2-Person Families | 12 (37.5%) | $2,499 |
| 3-Person Families | 2 (6.2%) | $0 |
| 4-Person Families | 0 (0.0%) | $0 |
| 5-Person Families | 4 (12.5%) | $0 |
| 6-Person Families | 6 (18.8%) | $0 |
| 7+ Person Families | 8 (25.0%) | $0 |
| Total | 32 (100.0%) | $0 |
Family Income by Number of Earners in Corn Creek
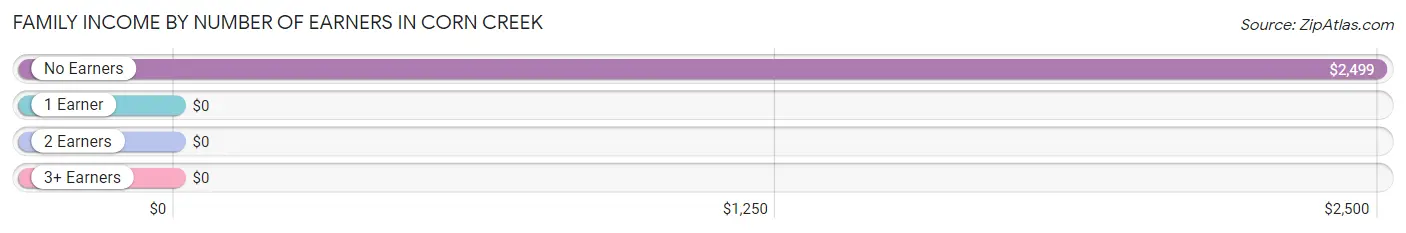
| Number of Earners | # Families | Median Income |
| No Earners | 24 (75.0%) | $2,499 |
| 1 Earner | 7 (21.9%) | $0 |
| 2 Earners | 1 (3.1%) | $0 |
| 3+ Earners | 0 (0.0%) | $0 |
| Total | 32 (100.0%) | $0 |
Household Income in Corn Creek
Household Income Brackets in Corn Creek
With 17 households falling in the category, the less than $10,000 income range is the most frequent in Corn Creek, accounting for 53.1% of all households.
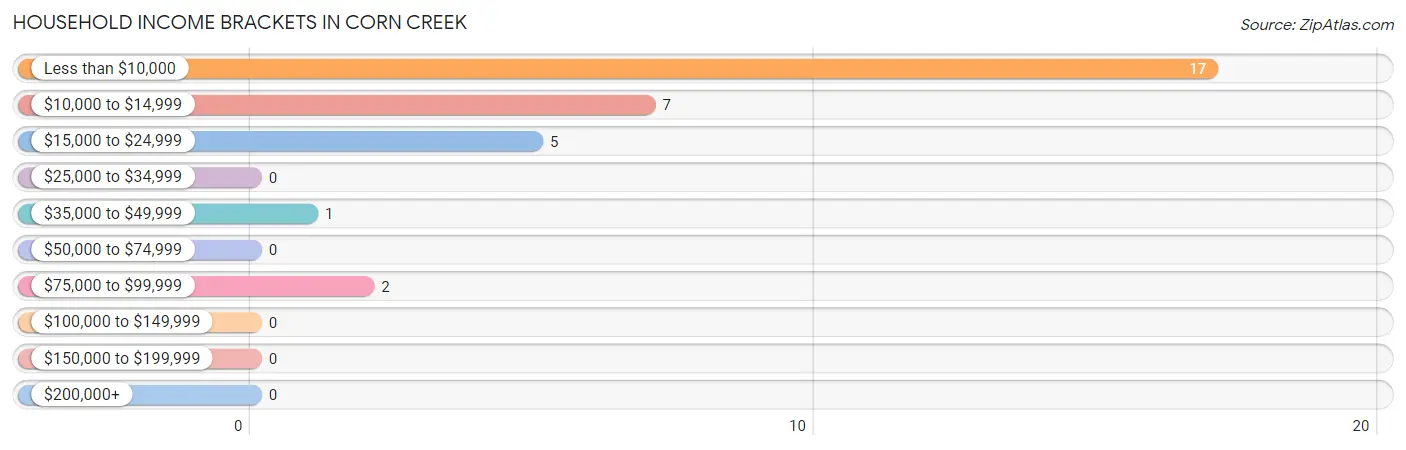
| Income Bracket | # Households | % Households |
| Less than $10,000 | 17 | 53.1% |
| $10,000 to $14,999 | 7 | 21.9% |
| $15,000 to $24,999 | 5 | 15.6% |
| $25,000 to $34,999 | 0 | 0.0% |
| $35,000 to $49,999 | 1 | 3.1% |
| $50,000 to $74,999 | 0 | 0.0% |
| $75,000 to $99,999 | 2 | 6.3% |
| $100,000 to $149,999 | 0 | 0.0% |
| $150,000 to $199,999 | 0 | 0.0% |
| $200,000+ | 0 | 0.0% |
Household Income by Householder Age in Corn Creek
The median household income in Corn Creek is $0, with the highest median household income of $2,499 found in the 45 to 64 years age bracket for the primary householder. A total of 12 households (37.5%) fall into this category.
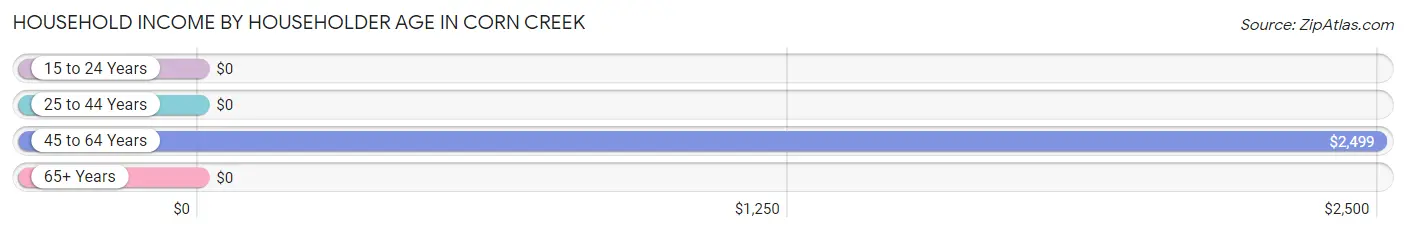
| Income Bracket | # Households | Median Income |
| 15 to 24 Years | 0 (0.0%) | $0 |
| 25 to 44 Years | 11 (34.4%) | $0 |
| 45 to 64 Years | 12 (37.5%) | $2,499 |
| 65+ Years | 9 (28.1%) | $0 |
| Total | 32 (100.0%) | $0 |
Poverty in Corn Creek
Income Below Poverty by Sex and Age in Corn Creek
With 89.1% poverty level for males and 96.7% for females among the residents of Corn Creek, under 5 year old males and under 5 year old females are the most vulnerable to poverty, with 16 males (100.0%) and 8 females (100.0%) in their respective age groups living below the poverty level.
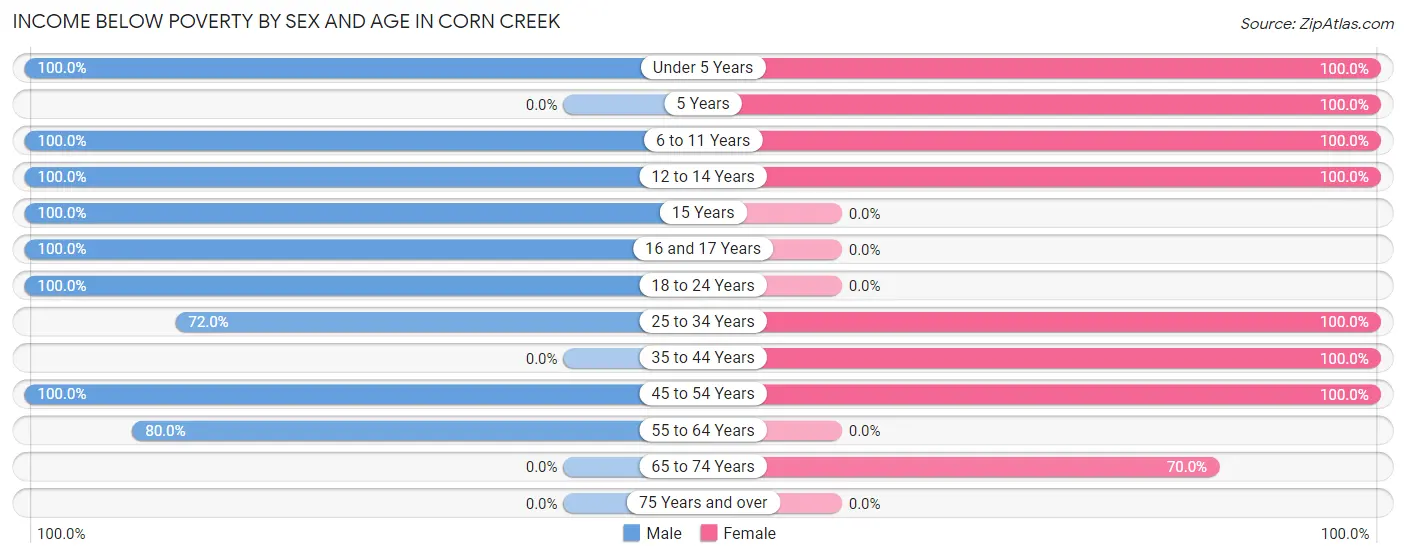
| Age Bracket | Male | Female |
| Under 5 Years | 16 (100.0%) | 8 (100.0%) |
| 5 Years | 0 (0.0%) | 5 (100.0%) |
| 6 to 11 Years | 6 (100.0%) | 8 (100.0%) |
| 12 to 14 Years | 4 (100.0%) | 13 (100.0%) |
| 15 Years | 4 (100.0%) | 0 (0.0%) |
| 16 and 17 Years | 8 (100.0%) | 0 (0.0%) |
| 18 to 24 Years | 10 (100.0%) | 0 (0.0%) |
| 25 to 34 Years | 18 (72.0%) | 6 (100.0%) |
| 35 to 44 Years | 0 (0.0%) | 37 (100.0%) |
| 45 to 54 Years | 12 (100.0%) | 4 (100.0%) |
| 55 to 64 Years | 4 (80.0%) | 0 (0.0%) |
| 65 to 74 Years | 0 (0.0%) | 7 (70.0%) |
| 75 Years and over | 0 (0.0%) | 0 (0.0%) |
| Total | 82 (89.1%) | 88 (96.7%) |
Income Above Poverty by Sex and Age in Corn Creek
According to the poverty statistics in Corn Creek, males aged 65 to 74 years and females aged 65 to 74 years are the age groups that are most secure financially, with 100.0% of males and 30.0% of females in these age groups living above the poverty line.
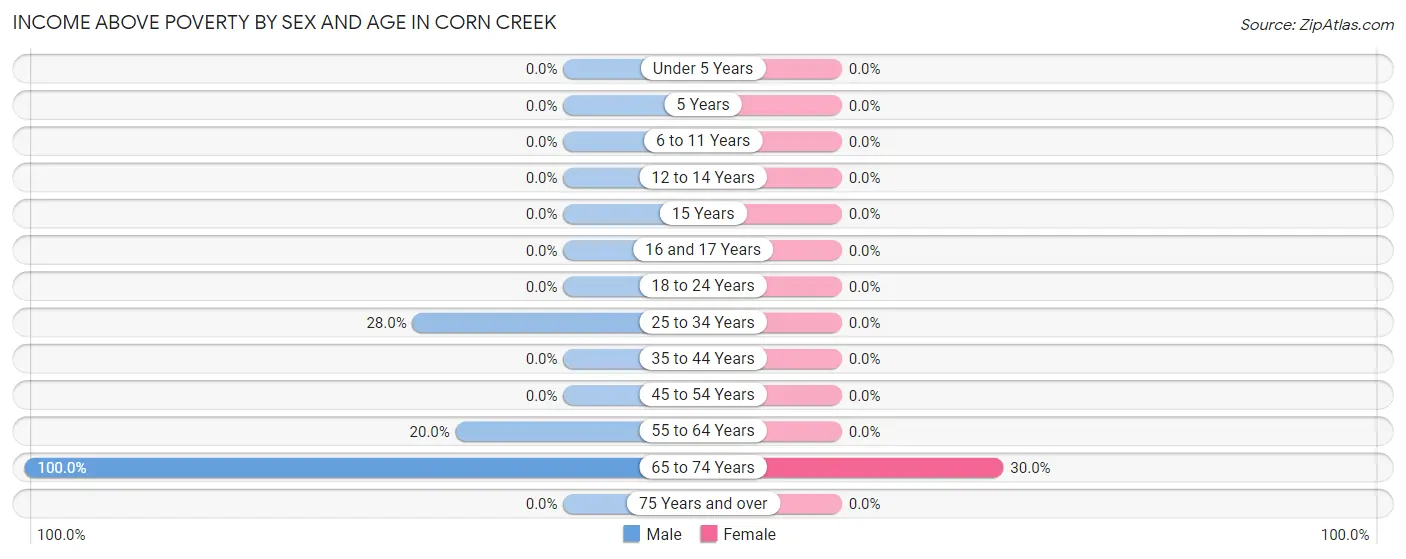
| Age Bracket | Male | Female |
| Under 5 Years | 0 (0.0%) | 0 (0.0%) |
| 5 Years | 0 (0.0%) | 0 (0.0%) |
| 6 to 11 Years | 0 (0.0%) | 0 (0.0%) |
| 12 to 14 Years | 0 (0.0%) | 0 (0.0%) |
| 15 Years | 0 (0.0%) | 0 (0.0%) |
| 16 and 17 Years | 0 (0.0%) | 0 (0.0%) |
| 18 to 24 Years | 0 (0.0%) | 0 (0.0%) |
| 25 to 34 Years | 7 (28.0%) | 0 (0.0%) |
| 35 to 44 Years | 0 (0.0%) | 0 (0.0%) |
| 45 to 54 Years | 0 (0.0%) | 0 (0.0%) |
| 55 to 64 Years | 1 (20.0%) | 0 (0.0%) |
| 65 to 74 Years | 2 (100.0%) | 3 (30.0%) |
| 75 Years and over | 0 (0.0%) | 0 (0.0%) |
| Total | 10 (10.9%) | 3 (3.3%) |
Income Below Poverty Among Married-Couple Families in Corn Creek
The poverty statistics for married-couple families in Corn Creek show that 85.7% or 12 of the total 14 families live below the poverty line. Families with 5 or more children have the highest poverty rate of 100.0%, comprising of 5 families. On the other hand, families with no children have the lowest poverty rate of 77.8%, which includes 7 families.
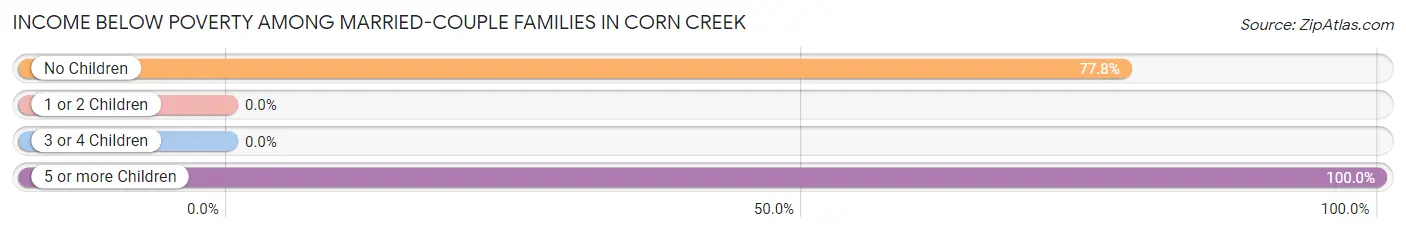
| Children | Above Poverty | Below Poverty |
| No Children | 2 (22.2%) | 7 (77.8%) |
| 1 or 2 Children | 0 (0.0%) | 0 (0.0%) |
| 3 or 4 Children | 0 (0.0%) | 0 (0.0%) |
| 5 or more Children | 0 (0.0%) | 5 (100.0%) |
| Total | 2 (14.3%) | 12 (85.7%) |
Income Below Poverty Among Single-Parent Households in Corn Creek
According to the poverty data in Corn Creek, 80.0% or 4 single-father households and 100.0% or 13 single-mother households are living below the poverty line. Among single-father households, those with no children have the highest poverty rate, with 4 households (80.0%) experiencing poverty. Likewise, among single-mother households, those with 1 or 2 children have the highest poverty rate, with 4 households (100.0%) falling below the poverty line.
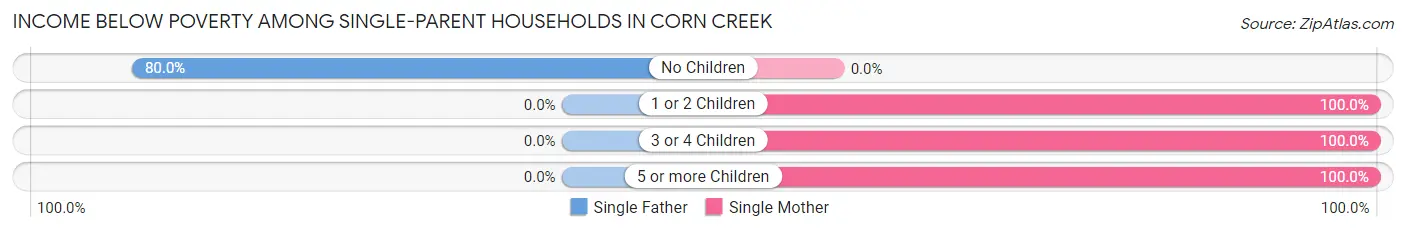
| Children | Single Father | Single Mother |
| No Children | 4 (80.0%) | 0 (0.0%) |
| 1 or 2 Children | 0 (0.0%) | 4 (100.0%) |
| 3 or 4 Children | 0 (0.0%) | 3 (100.0%) |
| 5 or more Children | 0 (0.0%) | 6 (100.0%) |
| Total | 4 (80.0%) | 13 (100.0%) |
Income Below Poverty Among Married-Couple vs Single-Parent Households in Corn Creek
The poverty data for Corn Creek shows that 12 of the married-couple family households (85.7%) and 17 of the single-parent households (94.4%) are living below the poverty level. Within the married-couple family households, those with 5 or more children have the highest poverty rate, with 5 households (100.0%) falling below the poverty line. Among the single-parent households, those with 1 or 2 children have the highest poverty rate, with 4 household (100.0%) living below poverty.
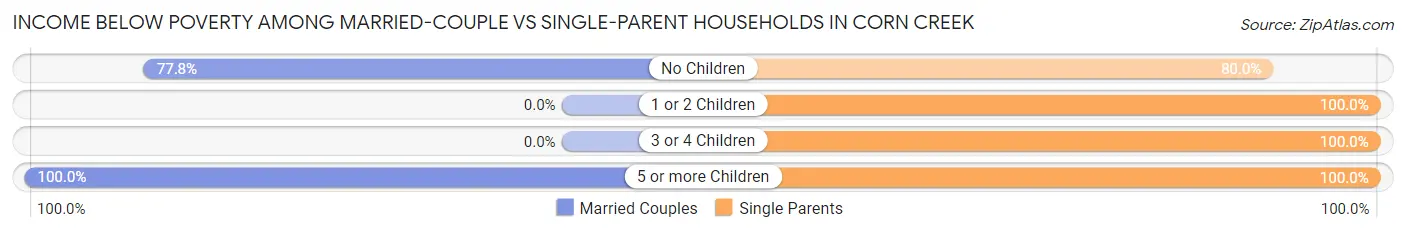
| Children | Married-Couple Families | Single-Parent Households |
| No Children | 7 (77.8%) | 4 (80.0%) |
| 1 or 2 Children | 0 (0.0%) | 4 (100.0%) |
| 3 or 4 Children | 0 (0.0%) | 3 (100.0%) |
| 5 or more Children | 5 (100.0%) | 6 (100.0%) |
| Total | 12 (85.7%) | 17 (94.4%) |
Race in Corn Creek
The most populous races in Corn Creek are Native / Alaskan (178 | 97.3%), and Some other Race (5 | 2.7%).
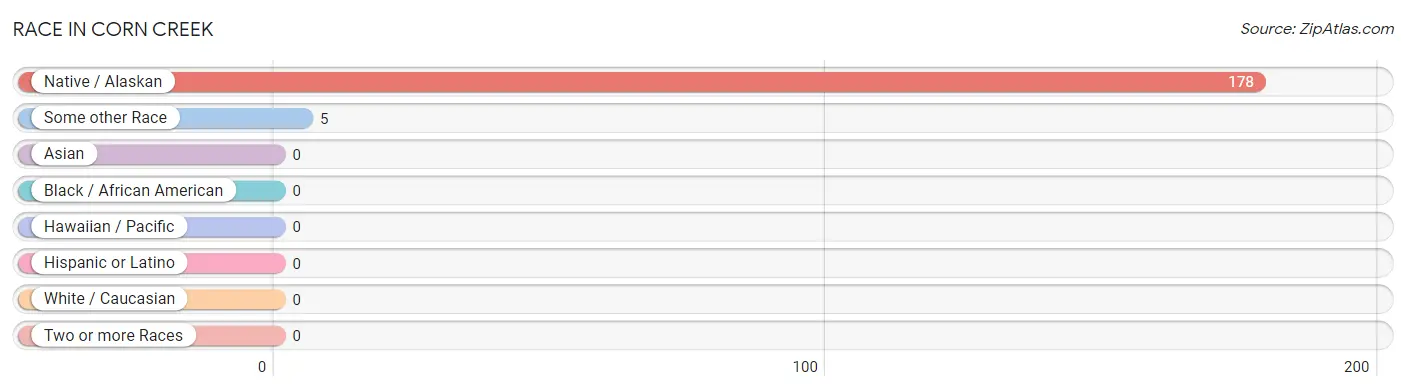
| Race | # Population | % Population |
| Asian | 0 | 0.0% |
| Black / African American | 0 | 0.0% |
| Hawaiian / Pacific | 0 | 0.0% |
| Hispanic or Latino | 0 | 0.0% |
| Native / Alaskan | 178 | 97.3% |
| White / Caucasian | 0 | 0.0% |
| Two or more Races | 0 | 0.0% |
| Some other Race | 5 | 2.7% |
| Total | 183 | 100.0% |
Ancestry in Corn Creek
The most populous ancestries reported in Corn Creek are Sioux (178 | 97.3%), and German (3 | 1.6%), together accounting for 98.9% of all Corn Creek residents.
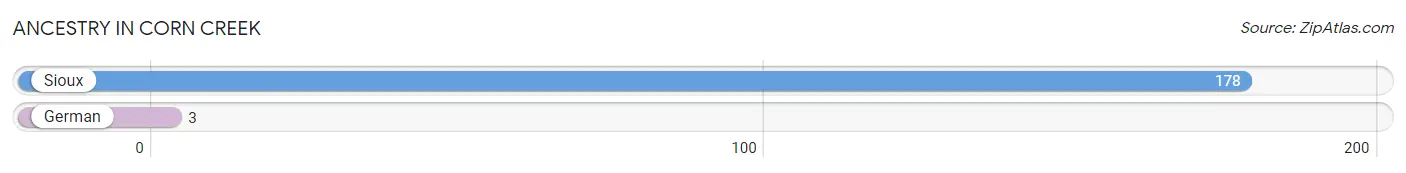
| Ancestry | # Population | % Population |
| German | 3 | 1.6% |
| Sioux | 178 | 97.3% | View All 2 Rows |
Immigrants in Corn Creek

| Immigration Origin | # Population | % Population | View All 0 Rows |
Sex and Age in Corn Creek
Sex and Age in Corn Creek
The most populous age groups in Corn Creek are 25 to 29 Years (19 | 20.6%) for men and 35 to 39 Years (27 | 29.7%) for women.
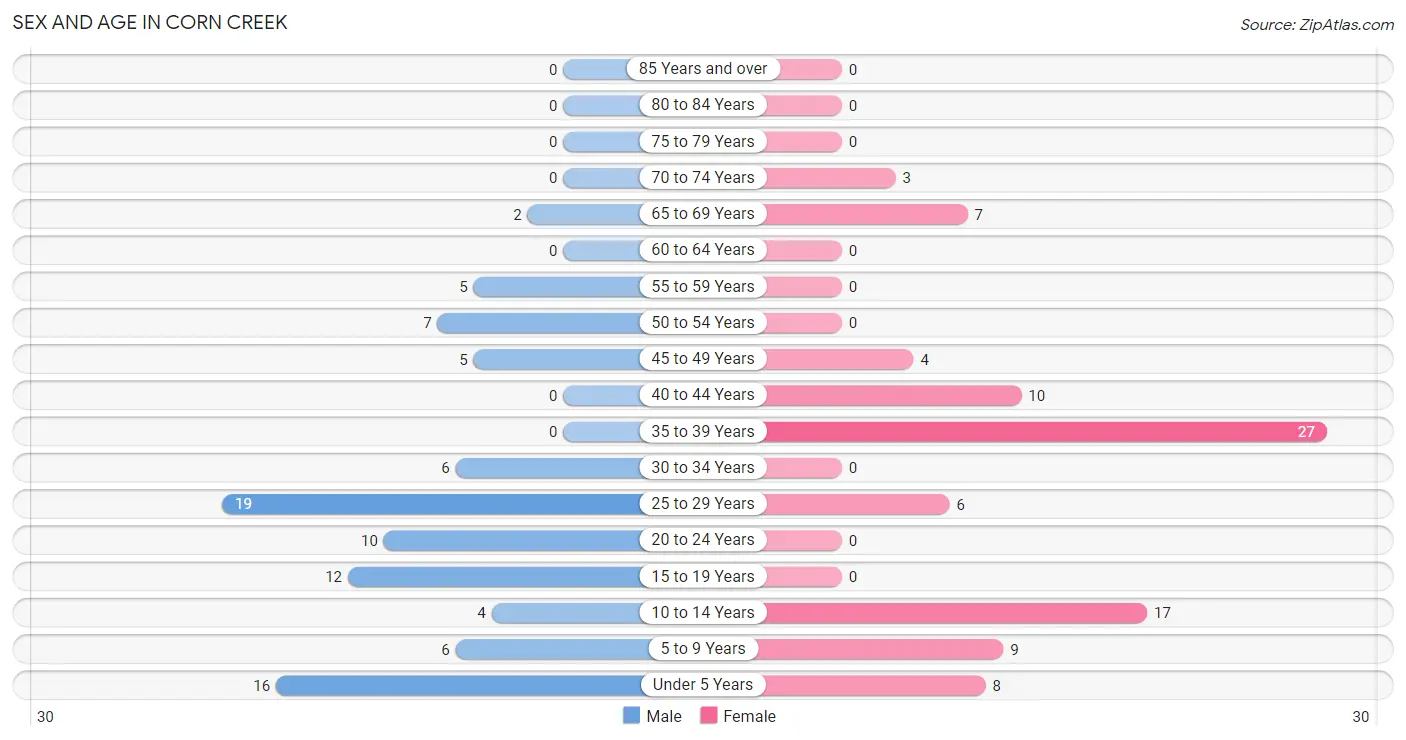
| Age Bracket | Male | Female |
| Under 5 Years | 16 (17.4%) | 8 (8.8%) |
| 5 to 9 Years | 6 (6.5%) | 9 (9.9%) |
| 10 to 14 Years | 4 (4.3%) | 17 (18.7%) |
| 15 to 19 Years | 12 (13.0%) | 0 (0.0%) |
| 20 to 24 Years | 10 (10.9%) | 0 (0.0%) |
| 25 to 29 Years | 19 (20.6%) | 6 (6.6%) |
| 30 to 34 Years | 6 (6.5%) | 0 (0.0%) |
| 35 to 39 Years | 0 (0.0%) | 27 (29.7%) |
| 40 to 44 Years | 0 (0.0%) | 10 (11.0%) |
| 45 to 49 Years | 5 (5.4%) | 4 (4.4%) |
| 50 to 54 Years | 7 (7.6%) | 0 (0.0%) |
| 55 to 59 Years | 5 (5.4%) | 0 (0.0%) |
| 60 to 64 Years | 0 (0.0%) | 0 (0.0%) |
| 65 to 69 Years | 2 (2.2%) | 7 (7.7%) |
| 70 to 74 Years | 0 (0.0%) | 3 (3.3%) |
| 75 to 79 Years | 0 (0.0%) | 0 (0.0%) |
| 80 to 84 Years | 0 (0.0%) | 0 (0.0%) |
| 85 Years and over | 0 (0.0%) | 0 (0.0%) |
| Total | 92 (100.0%) | 91 (100.0%) |
Families and Households in Corn Creek
Median Family Size in Corn Creek
The median family size in Corn Creek is 5.72 persons per family, with single female/mother families (13 | 40.6%) accounting for the largest median family size of 8.62 persons per family. On the other hand, married-couple families (14 | 43.8%) represent the smallest median family size with 3.36 persons per family.
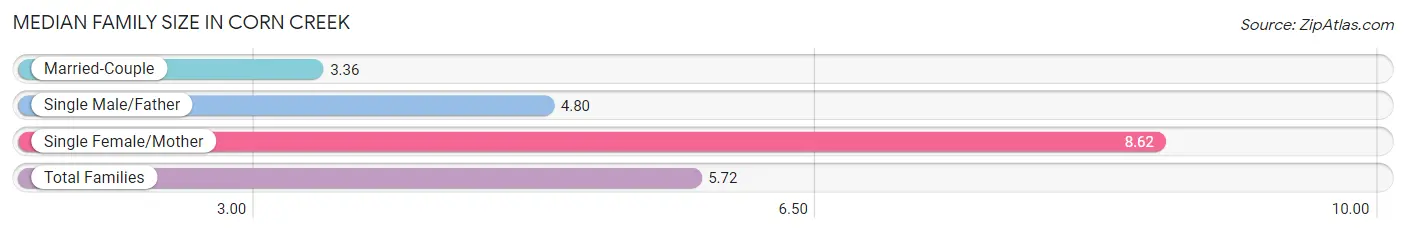
| Family Type | # Families | Family Size |
| Married-Couple | 14 (43.8%) | 3.36 |
| Single Male/Father | 5 (15.6%) | 4.80 |
| Single Female/Mother | 13 (40.6%) | 8.62 |
| Total Families | 32 (100.0%) | 5.72 |
Median Household Size in Corn Creek
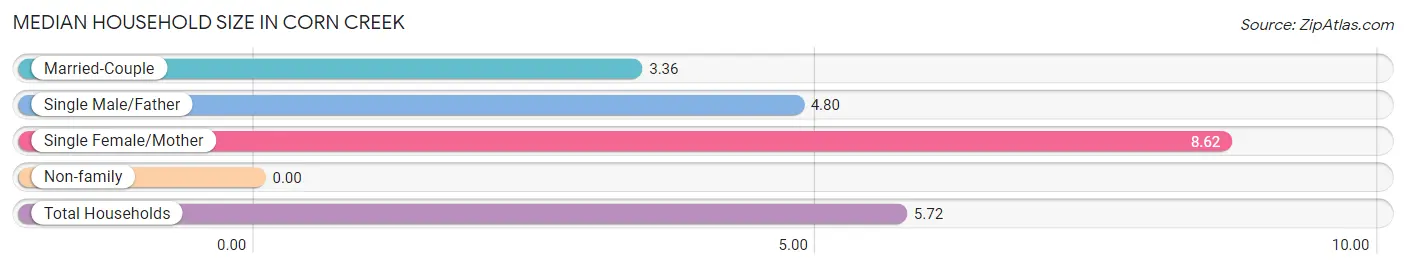
| Household Type | # Households | Household Size |
| Married-Couple | 14 (43.8%) | 3.36 |
| Single Male/Father | 5 (15.6%) | 4.80 |
| Single Female/Mother | 13 (40.6%) | 8.62 |
| Non-family | 0 (0.0%) | - |
| Total Households | 32 (100.0%) | 5.72 |
Household Size by Marriage Status in Corn Creek
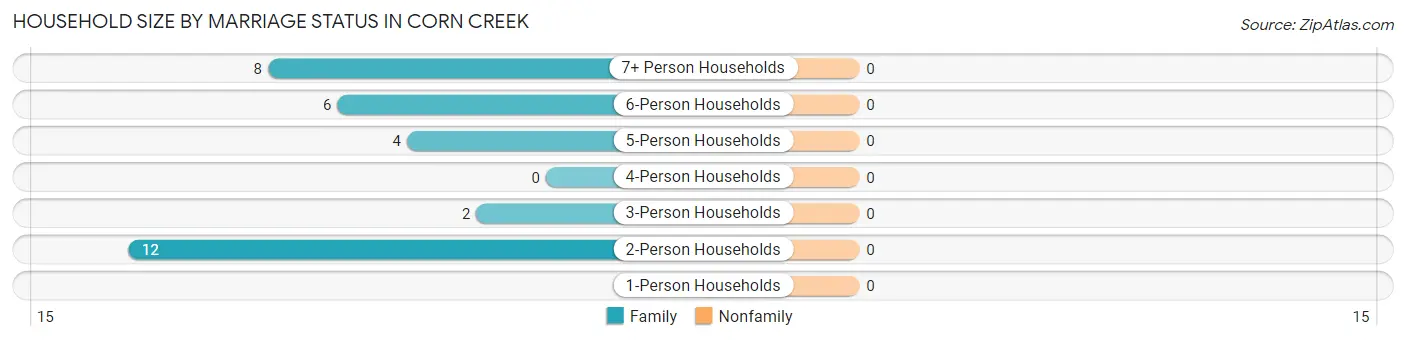
| Household Size | Family Households | Nonfamily Households |
| 1-Person Households | - | 0 (0.0%) |
| 2-Person Households | 12 (37.5%) | 0 (0.0%) |
| 3-Person Households | 2 (6.2%) | 0 (0.0%) |
| 4-Person Households | 0 (0.0%) | 0 (0.0%) |
| 5-Person Households | 4 (12.5%) | 0 (0.0%) |
| 6-Person Households | 6 (18.8%) | 0 (0.0%) |
| 7+ Person Households | 8 (25.0%) | 0 (0.0%) |
| Total | 32 (100.0%) | 0 (0.0%) |
Female Fertility in Corn Creek
Fertility by Age in Corn Creek
Average fertility rate in Corn Creek is 128.0 births per 1,000 women. Women in the age bracket of 20 to 34 years have the highest fertility rate with 1,000.0 births per 1,000 women. Women in the age bracket of 20 to 34 years acount for 100.0% of all women with births.
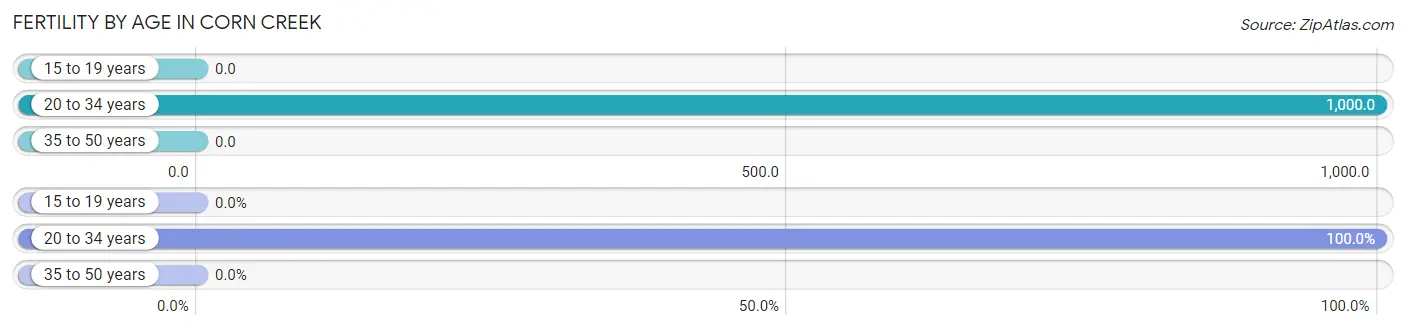
| Age Bracket | Women with Births | Births / 1,000 Women |
| 15 to 19 years | 0 (0.0%) | 0.0 |
| 20 to 34 years | 6 (100.0%) | 1,000.0 |
| 35 to 50 years | 0 (0.0%) | 0.0 |
| Total | 6 (100.0%) | 128.0 |
Fertility by Age by Marriage Status in Corn Creek
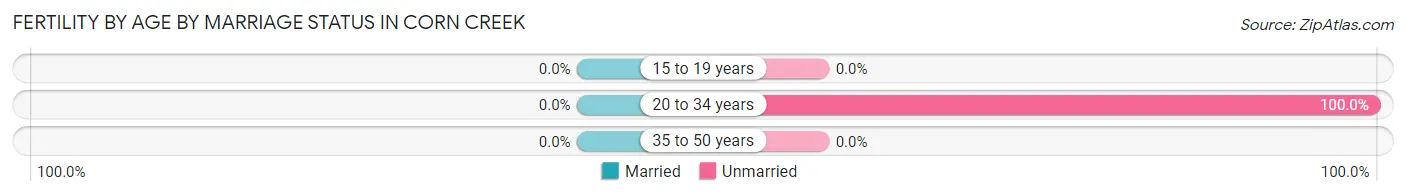
| Age Bracket | Married | Unmarried |
| 15 to 19 years | 0 (0.0%) | 0 (0.0%) |
| 20 to 34 years | 0 (0.0%) | 6 (100.0%) |
| 35 to 50 years | 0 (0.0%) | 0 (0.0%) |
| Total | 0 (0.0%) | 6 (100.0%) |
Fertility by Education in Corn Creek
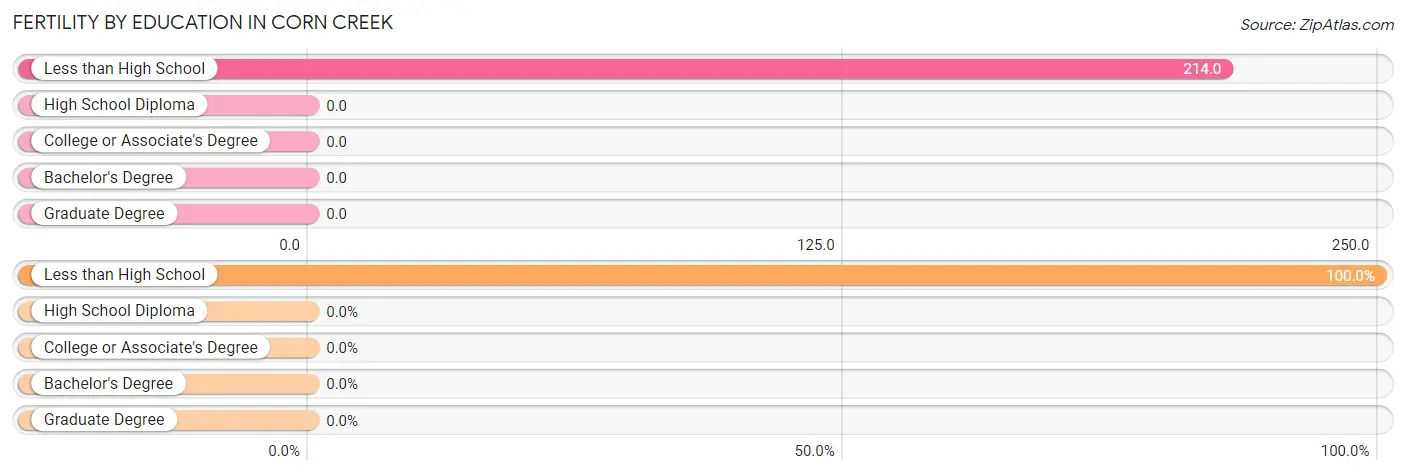
| Educational Attainment | Women with Births | Births / 1,000 Women |
| Less than High School | 6 (100.0%) | 214.0 |
| High School Diploma | 0 (0.0%) | 0.0 |
| College or Associate's Degree | 0 (0.0%) | 0.0 |
| Bachelor's Degree | 0 (0.0%) | 0.0 |
| Graduate Degree | 0 (0.0%) | 0.0 |
| Total | 6 (100.0%) | 128.0 |
Fertility by Education by Marriage Status in Corn Creek
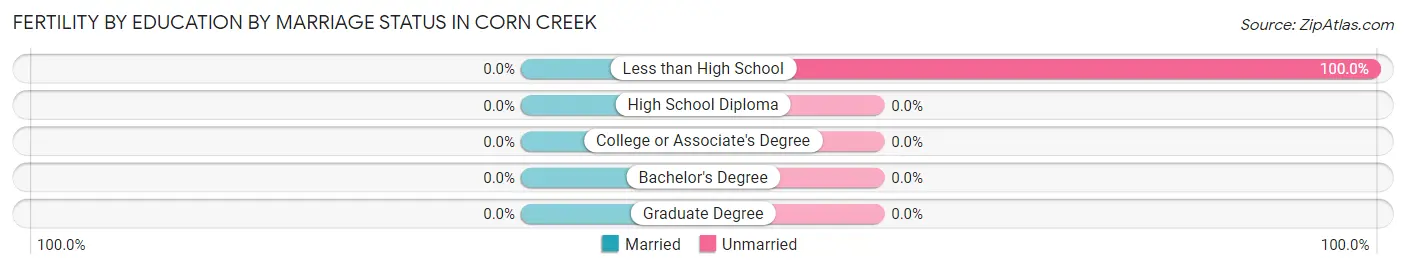
| Educational Attainment | Married | Unmarried |
| Less than High School | 0 (0.0%) | 6 (100.0%) |
| High School Diploma | 0 (0.0%) | 0 (0.0%) |
| College or Associate's Degree | 0 (0.0%) | 0 (0.0%) |
| Bachelor's Degree | 0 (0.0%) | 0 (0.0%) |
| Graduate Degree | 0 (0.0%) | 0 (0.0%) |
| Total | 0 (0.0%) | 6 (100.0%) |
Employment Characteristics in Corn Creek
Employment by Class of Employer in Corn Creek
Among the 10 employed individuals in Corn Creek, not-for-profit organizations (7 | 70.0%), and private company employees (3 | 30.0%) make up the most common classes of employment.
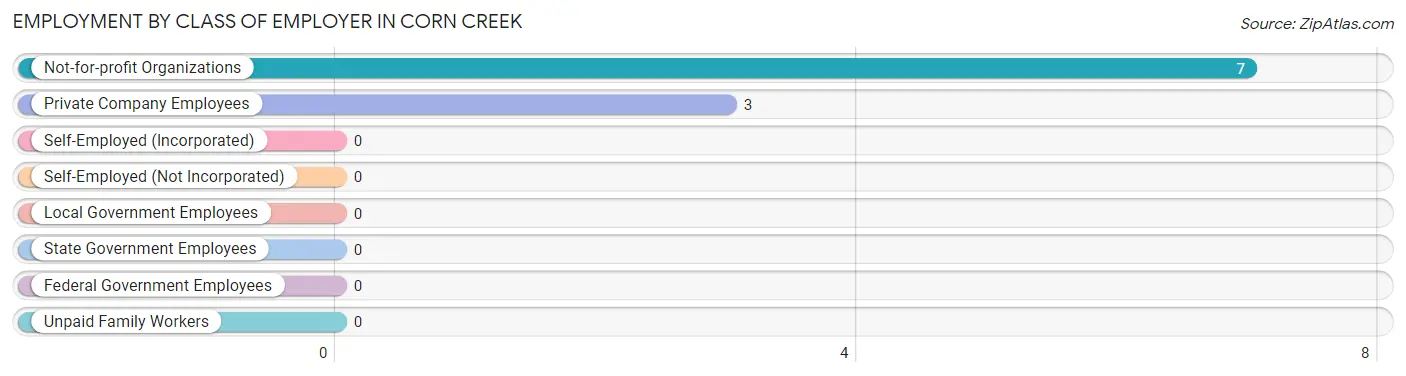
| Employer Class | # Employees | % Employees |
| Private Company Employees | 3 | 30.0% |
| Self-Employed (Incorporated) | 0 | 0.0% |
| Self-Employed (Not Incorporated) | 0 | 0.0% |
| Not-for-profit Organizations | 7 | 70.0% |
| Local Government Employees | 0 | 0.0% |
| State Government Employees | 0 | 0.0% |
| Federal Government Employees | 0 | 0.0% |
| Unpaid Family Workers | 0 | 0.0% |
| Total | 10 | 100.0% |
Employment Status by Age in Corn Creek
According to the labor force statistics for Corn Creek, out of the total population over 16 years of age (119), 14.3% or 17 individuals are in the labor force, with 41.2% or 7 of them unemployed. The age group with the highest labor force participation rate is 55 to 59 years, with 60.0% or 3 individuals in the labor force. Within the labor force, the 45 to 54 years age range has the highest percentage of unemployed individuals, with 100.0% or 5 of them being unemployed.
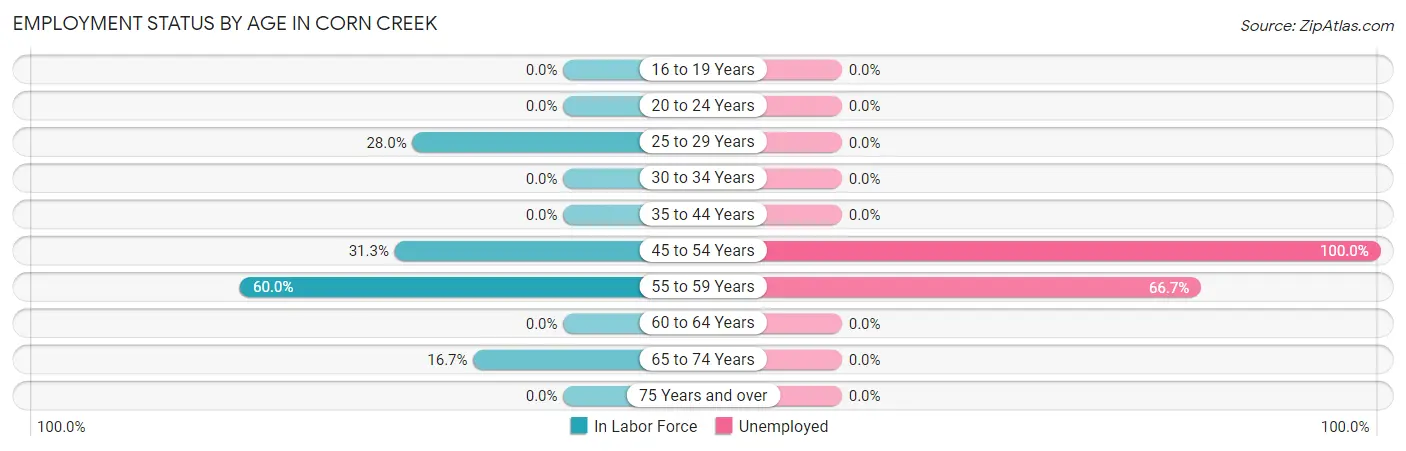
| Age Bracket | In Labor Force | Unemployed |
| 16 to 19 Years | 0 (0.0%) | 0 (0.0%) |
| 20 to 24 Years | 0 (0.0%) | 0 (0.0%) |
| 25 to 29 Years | 7 (28.0%) | 0 (0.0%) |
| 30 to 34 Years | 0 (0.0%) | 0 (0.0%) |
| 35 to 44 Years | 0 (0.0%) | 0 (0.0%) |
| 45 to 54 Years | 5 (31.3%) | 5 (100.0%) |
| 55 to 59 Years | 3 (60.0%) | 2 (66.7%) |
| 60 to 64 Years | 0 (0.0%) | 0 (0.0%) |
| 65 to 74 Years | 2 (16.7%) | 0 (0.0%) |
| 75 Years and over | 0 (0.0%) | 0 (0.0%) |
| Total | 17 (14.3%) | 7 (41.2%) |
Employment Status by Educational Attainment in Corn Creek
According to labor force statistics for Corn Creek, 16.9% of individuals (15) out of the total population between 25 and 64 years of age (89) are in the labor force, with 46.7% or 7 of them being unemployed. The group with the highest labor force participation rate are those with the educational attainment of high school diploma, with 29.4% or 15 individuals in the labor force. Within the labor force, individuals with high school diploma education have the highest percentage of unemployment, with 46.7% or 7 of them being unemployed.
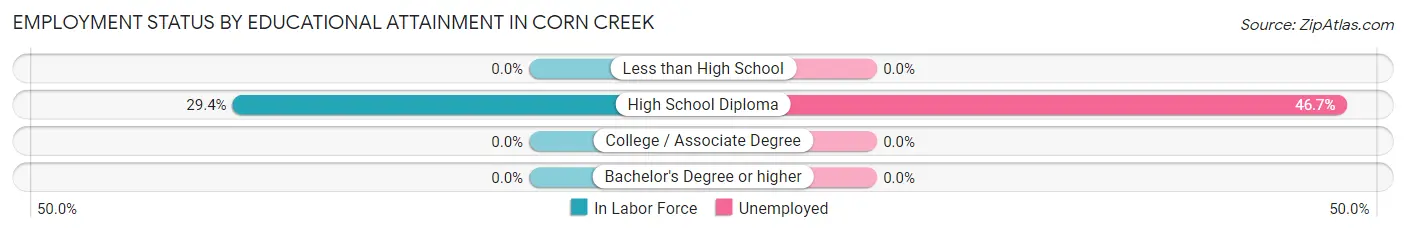
| Educational Attainment | In Labor Force | Unemployed |
| Less than High School | 0 (0.0%) | 0 (0.0%) |
| High School Diploma | 15 (29.4%) | 24 (46.7%) |
| College / Associate Degree | 0 (0.0%) | 0 (0.0%) |
| Bachelor's Degree or higher | 0 (0.0%) | 0 (0.0%) |
| Total | 15 (16.9%) | 42 (46.7%) |
Employment Occupations by Sex in Corn Creek
Management, Business, Science and Arts Occupations
The most common Management, Business, Science and Arts occupations in Corn Creek are Community & Social Service (7 | 70.0%), Arts, Media & Entertainment (7 | 70.0%), and Health Diagnosing & Treating (2 | 20.0%).
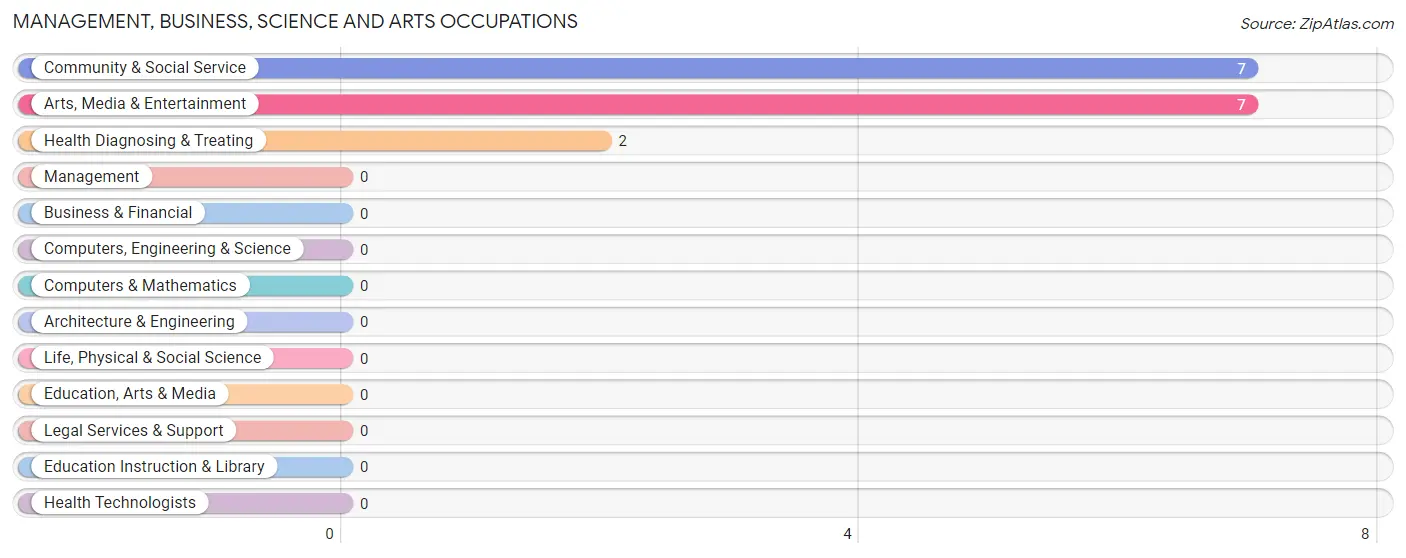
Management, Business, Science and Arts Occupations by Sex
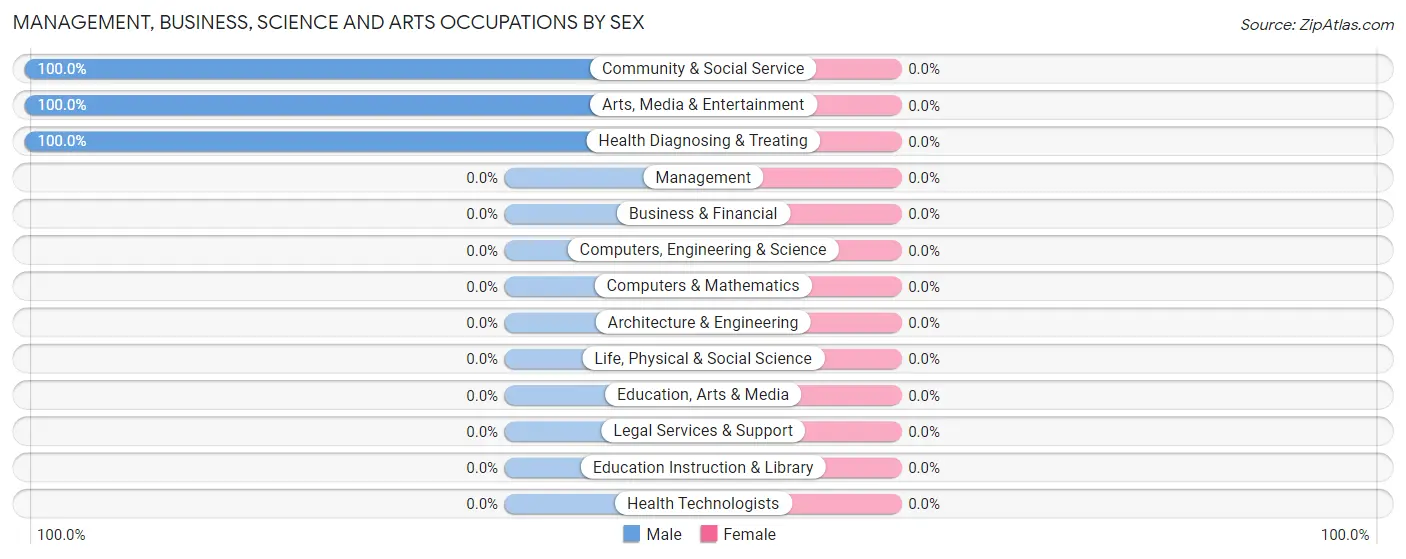
| Occupation | Male | Female |
| Management | 0 (0.0%) | 0 (0.0%) |
| Business & Financial | 0 (0.0%) | 0 (0.0%) |
| Computers, Engineering & Science | 0 (0.0%) | 0 (0.0%) |
| Computers & Mathematics | 0 (0.0%) | 0 (0.0%) |
| Architecture & Engineering | 0 (0.0%) | 0 (0.0%) |
| Life, Physical & Social Science | 0 (0.0%) | 0 (0.0%) |
| Community & Social Service | 7 (100.0%) | 0 (0.0%) |
| Education, Arts & Media | 0 (0.0%) | 0 (0.0%) |
| Legal Services & Support | 0 (0.0%) | 0 (0.0%) |
| Education Instruction & Library | 0 (0.0%) | 0 (0.0%) |
| Arts, Media & Entertainment | 7 (100.0%) | 0 (0.0%) |
| Health Diagnosing & Treating | 2 (100.0%) | 0 (0.0%) |
| Health Technologists | 0 (0.0%) | 0 (0.0%) |
| Total (Category) | 9 (100.0%) | 0 (0.0%) |
| Total (Overall) | 10 (100.0%) | 0 (0.0%) |
Services Occupations
The most common Services occupations in Corn Creek are , and Cleaning & Maintenance (1 | 10.0%).
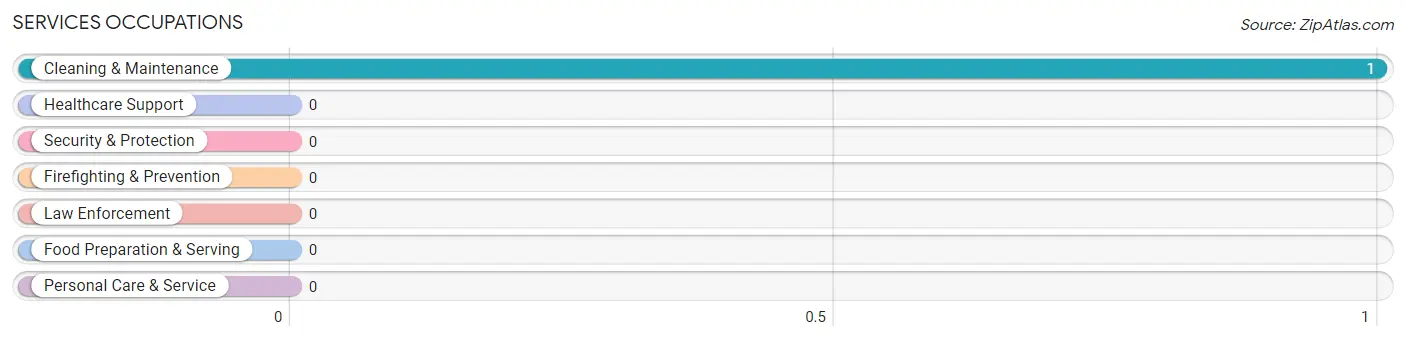
Services Occupations by Sex
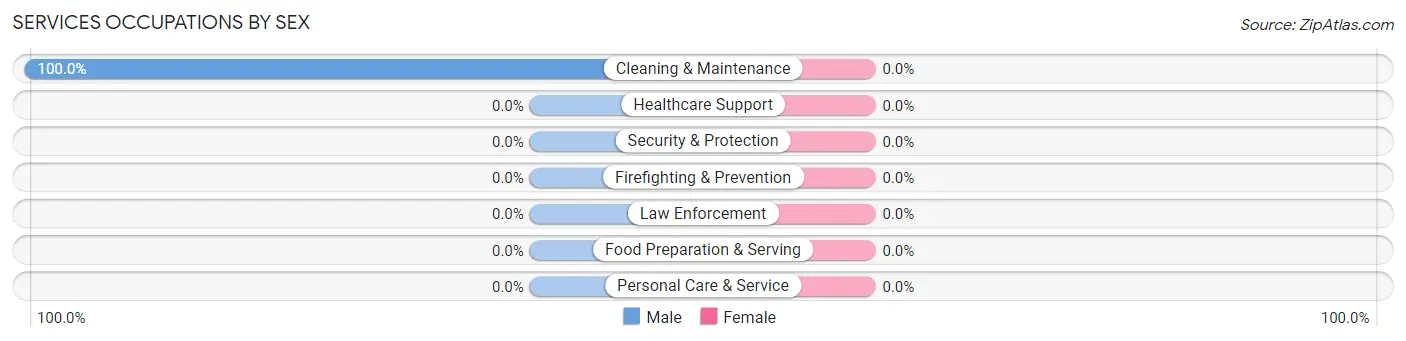
| Occupation | Male | Female |
| Healthcare Support | 0 (0.0%) | 0 (0.0%) |
| Security & Protection | 0 (0.0%) | 0 (0.0%) |
| Firefighting & Prevention | 0 (0.0%) | 0 (0.0%) |
| Law Enforcement | 0 (0.0%) | 0 (0.0%) |
| Food Preparation & Serving | 0 (0.0%) | 0 (0.0%) |
| Cleaning & Maintenance | 1 (100.0%) | 0 (0.0%) |
| Personal Care & Service | 0 (0.0%) | 0 (0.0%) |
| Total (Category) | 1 (100.0%) | 0 (0.0%) |
| Total (Overall) | 10 (100.0%) | 0 (0.0%) |
Sales and Office Occupations

Sales and Office Occupations by Sex
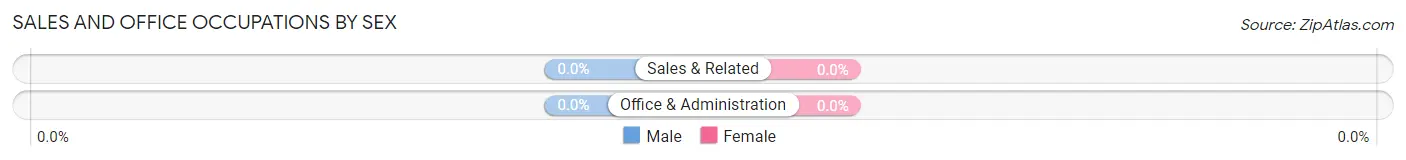
| Occupation | Male | Female |
| Sales & Related | 0 (0.0%) | 0 (0.0%) |
| Office & Administration | 0 (0.0%) | 0 (0.0%) |
| Total (Category) | 0 (0.0%) | 0 (0.0%) |
| Total (Overall) | 10 (100.0%) | 0 (0.0%) |
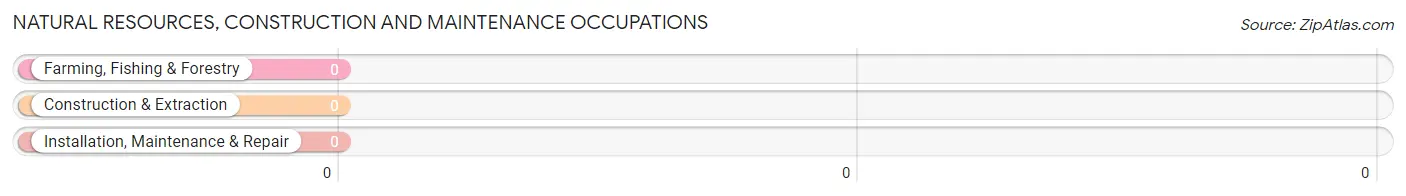
Natural Resources, Construction and Maintenance Occupations
Natural Resources, Construction and Maintenance Occupations by Sex
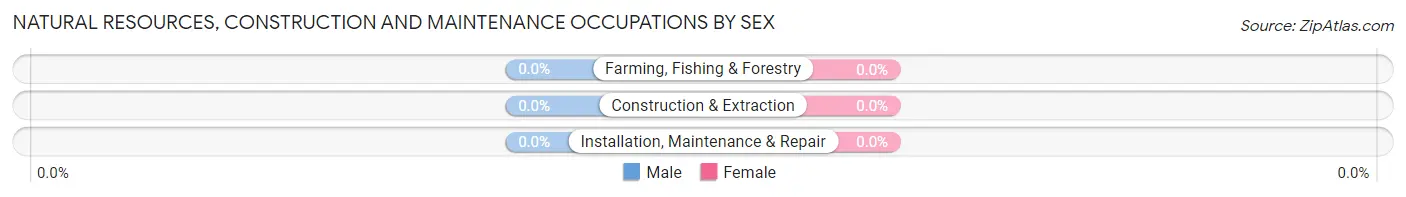
| Occupation | Male | Female |
| Farming, Fishing & Forestry | 0 (0.0%) | 0 (0.0%) |
| Construction & Extraction | 0 (0.0%) | 0 (0.0%) |
| Installation, Maintenance & Repair | 0 (0.0%) | 0 (0.0%) |
| Total (Category) | 0 (0.0%) | 0 (0.0%) |
| Total (Overall) | 10 (100.0%) | 0 (0.0%) |
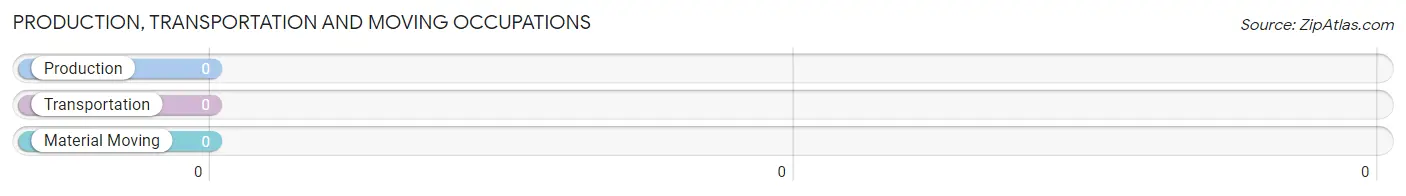
Production, Transportation and Moving Occupations
Production, Transportation and Moving Occupations by Sex
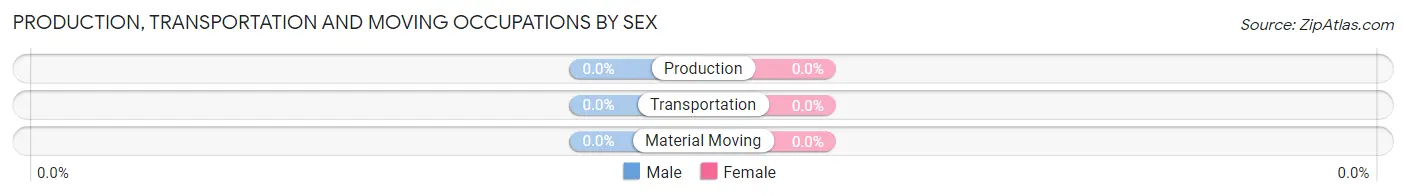
| Occupation | Male | Female |
| Production | 0 (0.0%) | 0 (0.0%) |
| Transportation | 0 (0.0%) | 0 (0.0%) |
| Material Moving | 0 (0.0%) | 0 (0.0%) |
| Total (Category) | 0 (0.0%) | 0 (0.0%) |
| Total (Overall) | 10 (100.0%) | 0 (0.0%) |
Employment Industries by Sex in Corn Creek
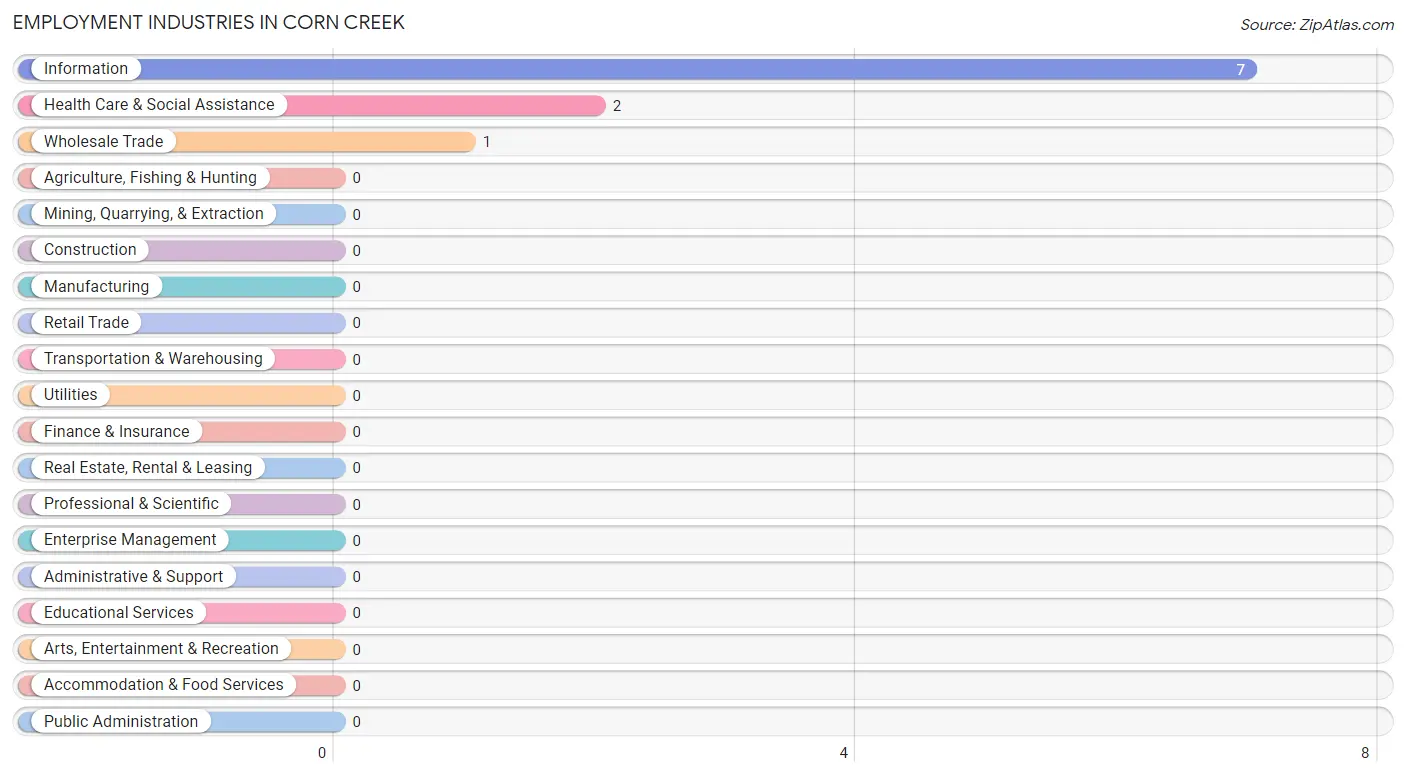
Employment Industries in Corn Creek
The major employment industries in Corn Creek include Information (7 | 70.0%), Health Care & Social Assistance (2 | 20.0%), and Wholesale Trade (1 | 10.0%).
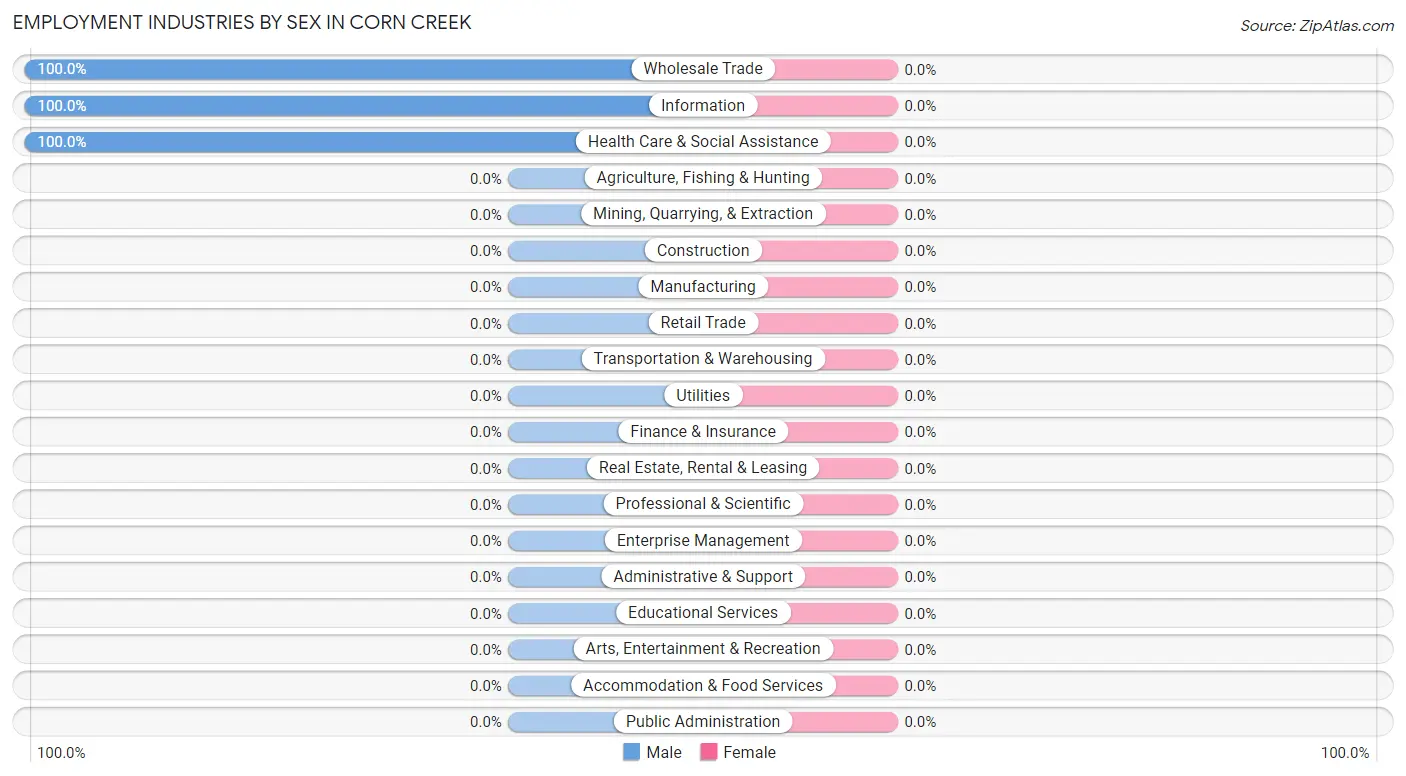
Employment Industries by Sex in Corn Creek
| Industry | Male | Female |
| Agriculture, Fishing & Hunting | 0 (0.0%) | 0 (0.0%) |
| Mining, Quarrying, & Extraction | 0 (0.0%) | 0 (0.0%) |
| Construction | 0 (0.0%) | 0 (0.0%) |
| Manufacturing | 0 (0.0%) | 0 (0.0%) |
| Wholesale Trade | 1 (100.0%) | 0 (0.0%) |
| Retail Trade | 0 (0.0%) | 0 (0.0%) |
| Transportation & Warehousing | 0 (0.0%) | 0 (0.0%) |
| Utilities | 0 (0.0%) | 0 (0.0%) |
| Information | 7 (100.0%) | 0 (0.0%) |
| Finance & Insurance | 0 (0.0%) | 0 (0.0%) |
| Real Estate, Rental & Leasing | 0 (0.0%) | 0 (0.0%) |
| Professional & Scientific | 0 (0.0%) | 0 (0.0%) |
| Enterprise Management | 0 (0.0%) | 0 (0.0%) |
| Administrative & Support | 0 (0.0%) | 0 (0.0%) |
| Educational Services | 0 (0.0%) | 0 (0.0%) |
| Health Care & Social Assistance | 2 (100.0%) | 0 (0.0%) |
| Arts, Entertainment & Recreation | 0 (0.0%) | 0 (0.0%) |
| Accommodation & Food Services | 0 (0.0%) | 0 (0.0%) |
| Public Administration | 0 (0.0%) | 0 (0.0%) |
| Total | 10 (100.0%) | 0 (0.0%) |
Education in Corn Creek
School Enrollment in Corn Creek
The most common levels of schooling among the 48 students in Corn Creek are middle school (21 | 43.8%), high school (12 | 25.0%), and elementary school (10 | 20.8%).
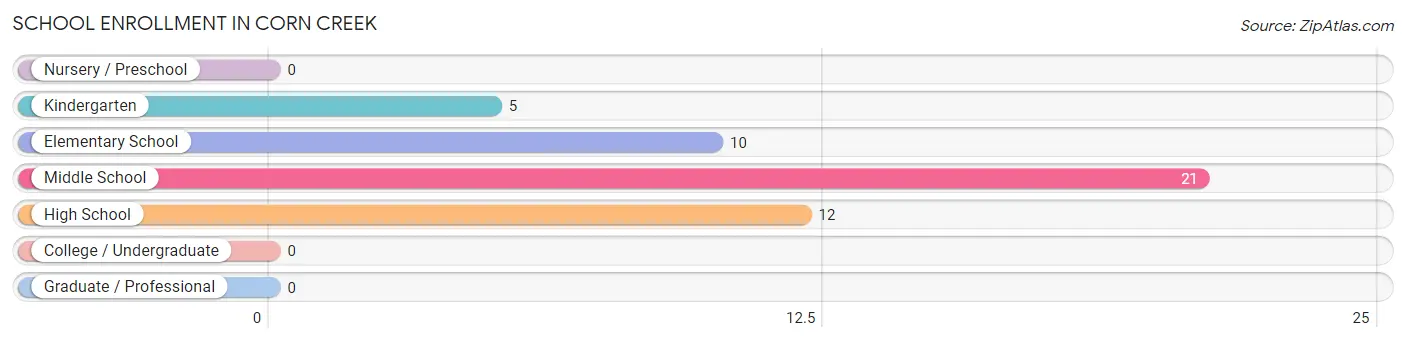
| School Level | # Students | % Students |
| Nursery / Preschool | 0 | 0.0% |
| Kindergarten | 5 | 10.4% |
| Elementary School | 10 | 20.8% |
| Middle School | 21 | 43.8% |
| High School | 12 | 25.0% |
| College / Undergraduate | 0 | 0.0% |
| Graduate / Professional | 0 | 0.0% |
| Total | 48 | 100.0% |
School Enrollment by Age by Funding Source in Corn Creek
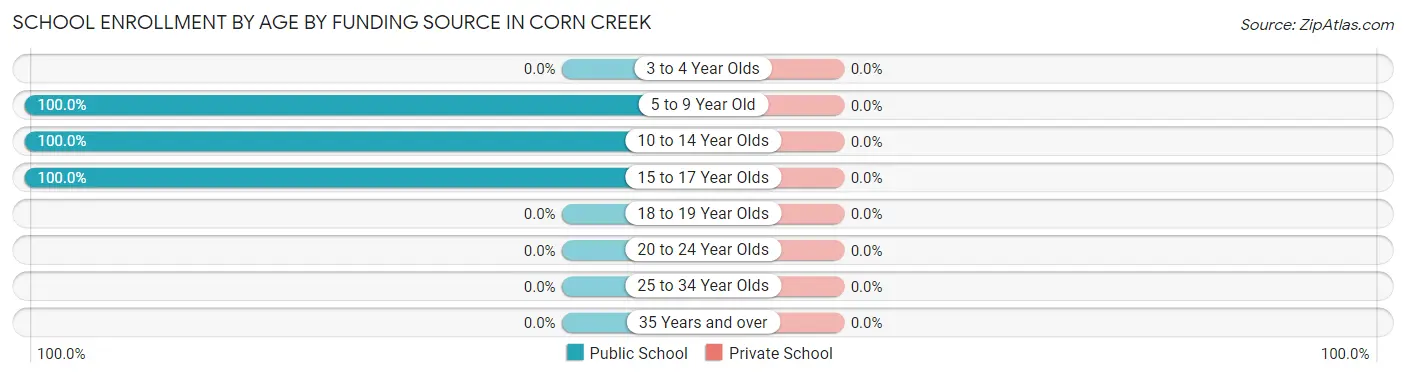
| Age Bracket | Public School | Private School |
| 3 to 4 Year Olds | 0 (0.0%) | 0 (0.0%) |
| 5 to 9 Year Old | 15 (100.0%) | 0 (0.0%) |
| 10 to 14 Year Olds | 21 (100.0%) | 0 (0.0%) |
| 15 to 17 Year Olds | 12 (100.0%) | 0 (0.0%) |
| 18 to 19 Year Olds | 0 (0.0%) | 0 (0.0%) |
| 20 to 24 Year Olds | 0 (0.0%) | 0 (0.0%) |
| 25 to 34 Year Olds | 0 (0.0%) | 0 (0.0%) |
| 35 Years and over | 0 (0.0%) | 0 (0.0%) |
| Total | 48 (100.0%) | 0 (0.0%) |
Educational Attainment by Field of Study in Corn Creek
| Field of Study | # Graduates | % Graduates |
| Computers & Mathematics | 0 | 0.0% |
| Bio, Nature & Agricultural | 0 | 0.0% |
| Physical & Health Sciences | 0 | 0.0% |
| Psychology | 0 | 0.0% |
| Social Sciences | 0 | 0.0% |
| Engineering | 0 | 0.0% |
| Multidisciplinary Studies | 0 | 0.0% |
| Science & Technology | 0 | 0.0% |
| Business | 0 | 0.0% |
| Education | 0 | 0.0% |
| Literature & Languages | 0 | 0.0% |
| Liberal Arts & History | 0 | 0.0% |
| Visual & Performing Arts | 0 | 0.0% |
| Communications | 0 | 0.0% |
| Arts & Humanities | 0 | 0.0% |
| Total | 0 | 0.0% |
Transportation & Commute in Corn Creek
Vehicle Availability by Sex in Corn Creek
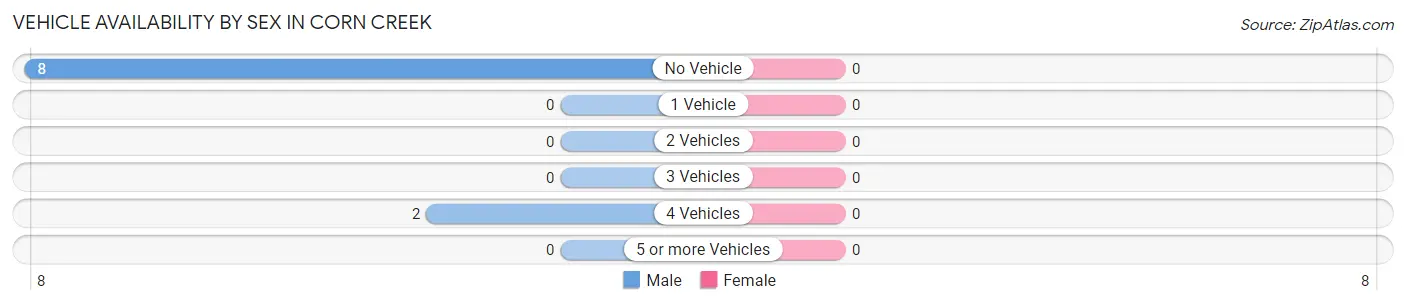
| Vehicles Available | Male | Female |
| No Vehicle | 8 (80.0%) | 0 (0.0%) |
| 1 Vehicle | 0 (0.0%) | 0 (0.0%) |
| 2 Vehicles | 0 (0.0%) | 0 (0.0%) |
| 3 Vehicles | 0 (0.0%) | 0 (0.0%) |
| 4 Vehicles | 2 (20.0%) | 0 (0.0%) |
| 5 or more Vehicles | 0 (0.0%) | 0 (0.0%) |
| Total | 10 (100.0%) | 0 (0.0%) |
Commute Time in Corn Creek
The most frequently occuring commute durations in Corn Creek are 5 to 9 minutes (8 commuters, 80.0%), 90 or more minutes (2 commuters, 20.0%), and less than 5 minutes (0 commuters, 0.0%).
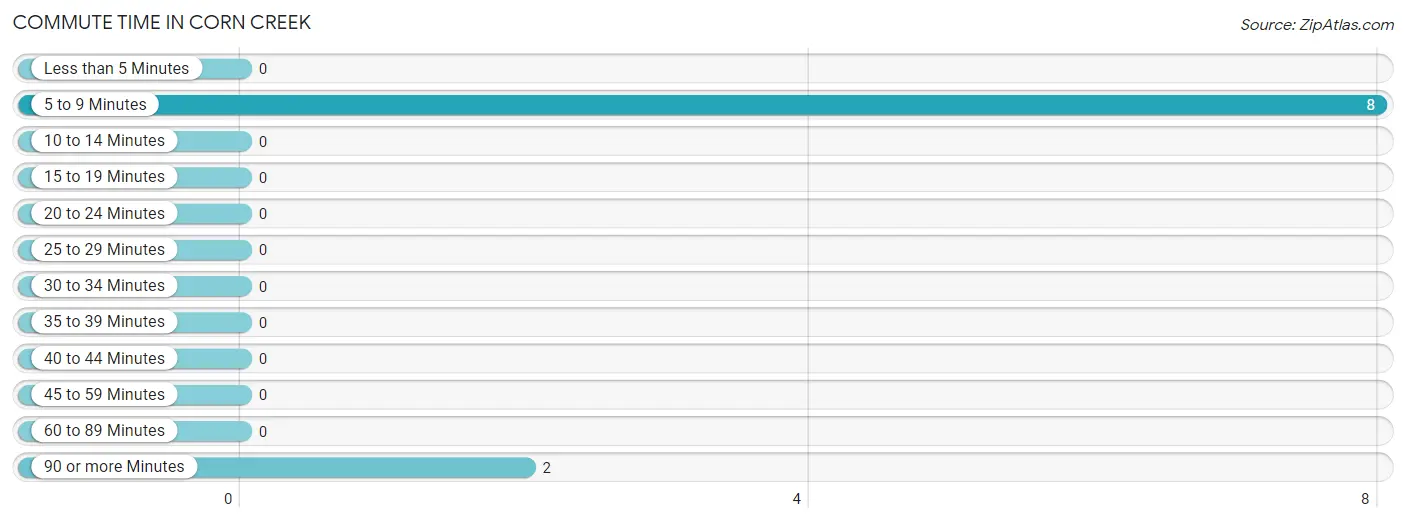
| Commute Time | # Commuters | % Commuters |
| Less than 5 Minutes | 0 | 0.0% |
| 5 to 9 Minutes | 8 | 80.0% |
| 10 to 14 Minutes | 0 | 0.0% |
| 15 to 19 Minutes | 0 | 0.0% |
| 20 to 24 Minutes | 0 | 0.0% |
| 25 to 29 Minutes | 0 | 0.0% |
| 30 to 34 Minutes | 0 | 0.0% |
| 35 to 39 Minutes | 0 | 0.0% |
| 40 to 44 Minutes | 0 | 0.0% |
| 45 to 59 Minutes | 0 | 0.0% |
| 60 to 89 Minutes | 0 | 0.0% |
| 90 or more Minutes | 2 | 20.0% |
Commute Time by Sex in Corn Creek
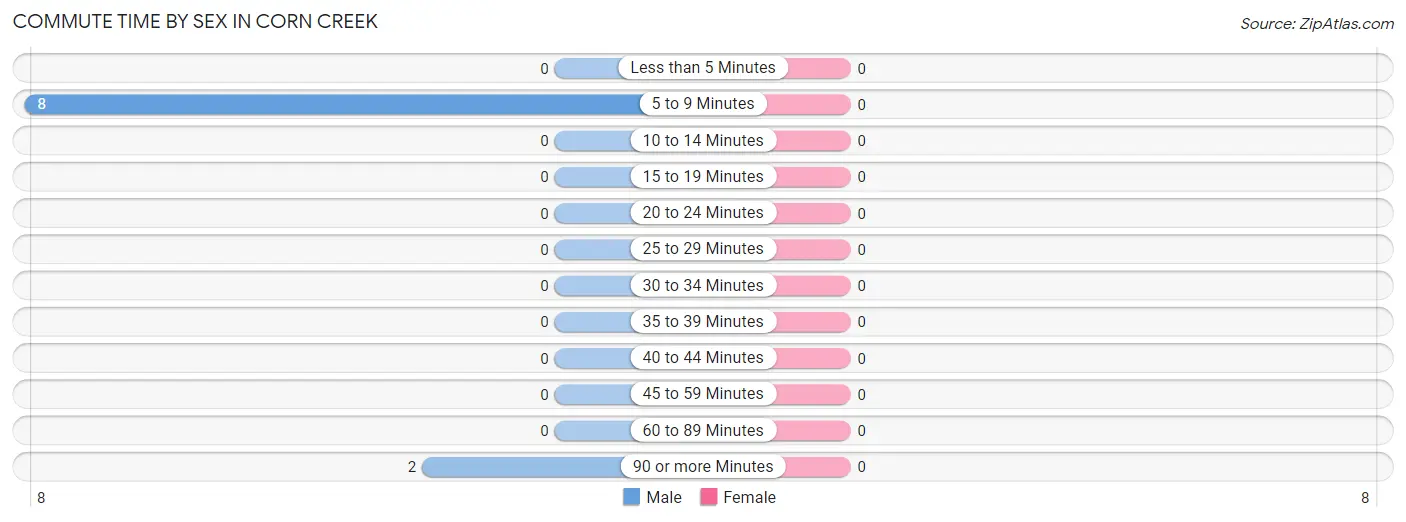
| Commute Time | Male | Female |
| Less than 5 Minutes | 0 (0.0%) | 0 (0.0%) |
| 5 to 9 Minutes | 8 (80.0%) | 0 (0.0%) |
| 10 to 14 Minutes | 0 (0.0%) | 0 (0.0%) |
| 15 to 19 Minutes | 0 (0.0%) | 0 (0.0%) |
| 20 to 24 Minutes | 0 (0.0%) | 0 (0.0%) |
| 25 to 29 Minutes | 0 (0.0%) | 0 (0.0%) |
| 30 to 34 Minutes | 0 (0.0%) | 0 (0.0%) |
| 35 to 39 Minutes | 0 (0.0%) | 0 (0.0%) |
| 40 to 44 Minutes | 0 (0.0%) | 0 (0.0%) |
| 45 to 59 Minutes | 0 (0.0%) | 0 (0.0%) |
| 60 to 89 Minutes | 0 (0.0%) | 0 (0.0%) |
| 90 or more Minutes | 2 (20.0%) | 0 (0.0%) |
Time of Departure to Work by Sex in Corn Creek
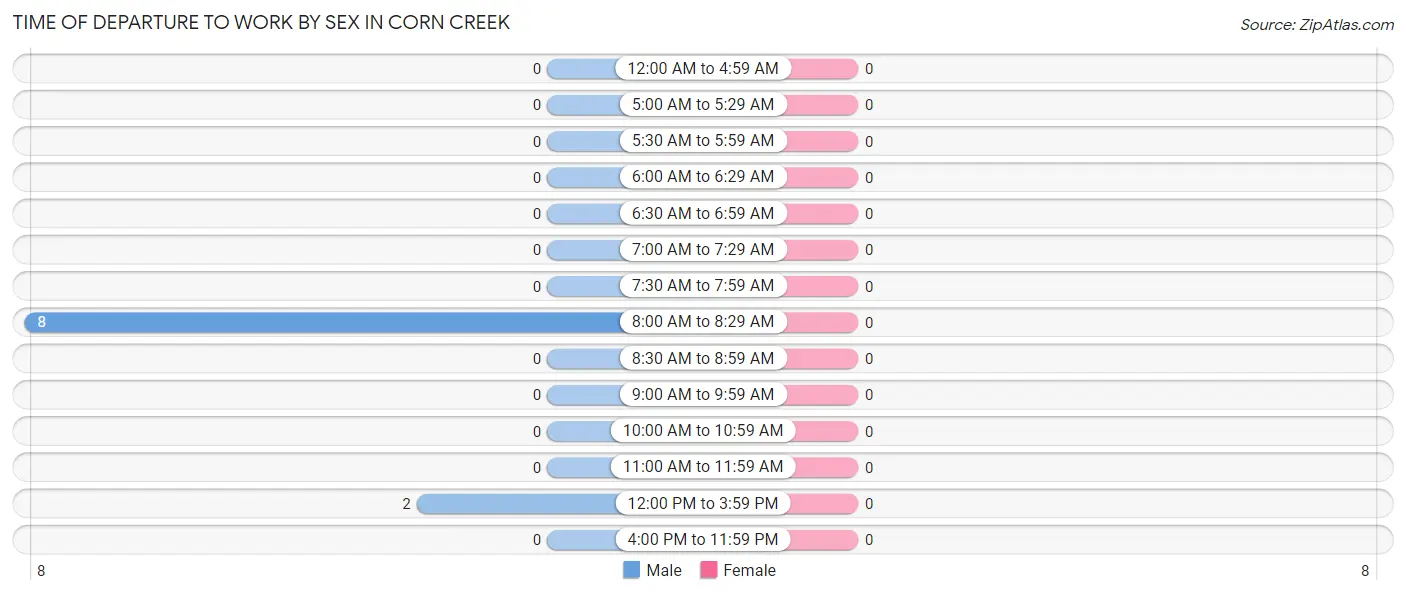
| Time of Departure | Male | Female |
| 12:00 AM to 4:59 AM | 0 (0.0%) | 0 (0.0%) |
| 5:00 AM to 5:29 AM | 0 (0.0%) | 0 (0.0%) |
| 5:30 AM to 5:59 AM | 0 (0.0%) | 0 (0.0%) |
| 6:00 AM to 6:29 AM | 0 (0.0%) | 0 (0.0%) |
| 6:30 AM to 6:59 AM | 0 (0.0%) | 0 (0.0%) |
| 7:00 AM to 7:29 AM | 0 (0.0%) | 0 (0.0%) |
| 7:30 AM to 7:59 AM | 0 (0.0%) | 0 (0.0%) |
| 8:00 AM to 8:29 AM | 8 (80.0%) | 0 (0.0%) |
| 8:30 AM to 8:59 AM | 0 (0.0%) | 0 (0.0%) |
| 9:00 AM to 9:59 AM | 0 (0.0%) | 0 (0.0%) |
| 10:00 AM to 10:59 AM | 0 (0.0%) | 0 (0.0%) |
| 11:00 AM to 11:59 AM | 0 (0.0%) | 0 (0.0%) |
| 12:00 PM to 3:59 PM | 2 (20.0%) | 0 (0.0%) |
| 4:00 PM to 11:59 PM | 0 (0.0%) | 0 (0.0%) |
| Total | 10 (100.0%) | 0 (0.0%) |
Housing Occupancy in Corn Creek
Occupancy by Ownership in Corn Creek
Of the total 32 dwellings in Corn Creek, owner-occupied units account for 9 (28.1%), while renter-occupied units make up 23 (71.9%).
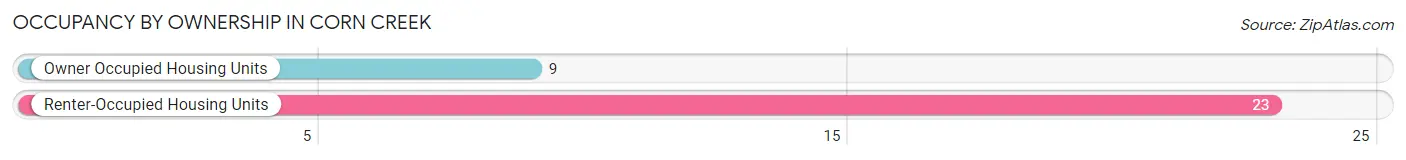
| Occupancy | # Housing Units | % Housing Units |
| Owner Occupied Housing Units | 9 | 28.1% |
| Renter-Occupied Housing Units | 23 | 71.9% |
| Total Occupied Housing Units | 32 | 100.0% |
Occupancy by Household Size in Corn Creek
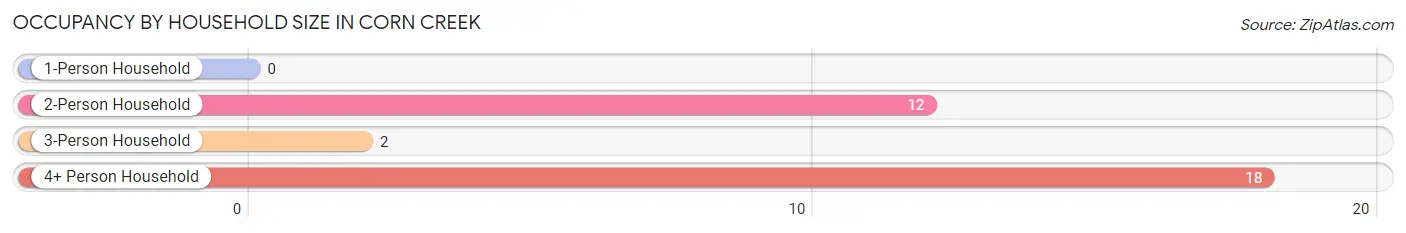
| Household Size | # Housing Units | % Housing Units |
| 1-Person Household | 0 | 0.0% |
| 2-Person Household | 12 | 37.5% |
| 3-Person Household | 2 | 6.2% |
| 4+ Person Household | 18 | 56.2% |
| Total Housing Units | 32 | 100.0% |
Occupancy by Ownership by Household Size in Corn Creek
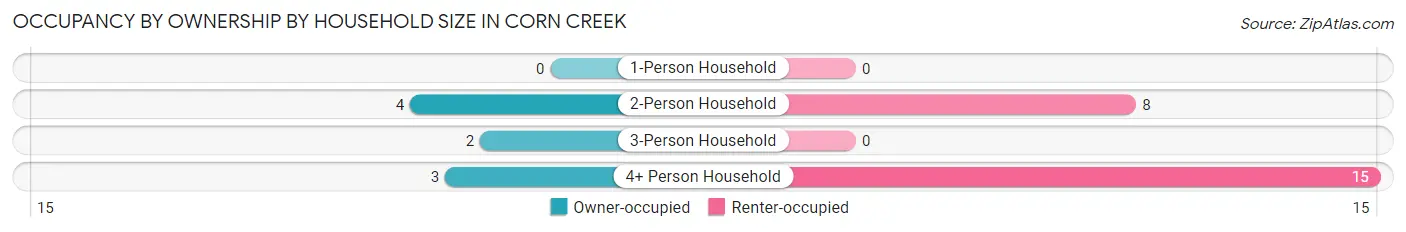
| Household Size | Owner-occupied | Renter-occupied |
| 1-Person Household | 0 (0.0%) | 0 (0.0%) |
| 2-Person Household | 4 (33.3%) | 8 (66.7%) |
| 3-Person Household | 2 (100.0%) | 0 (0.0%) |
| 4+ Person Household | 3 (16.7%) | 15 (83.3%) |
| Total Housing Units | 9 (28.1%) | 23 (71.9%) |
Occupancy by Educational Attainment in Corn Creek
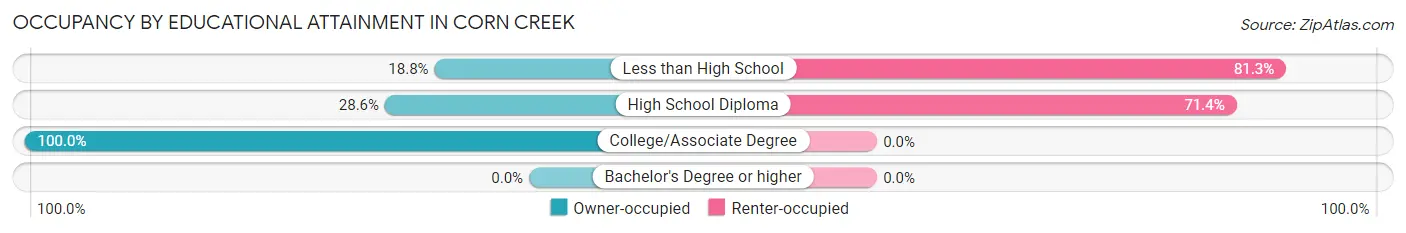
| Household Size | Owner-occupied | Renter-occupied |
| Less than High School | 3 (18.8%) | 13 (81.2%) |
| High School Diploma | 4 (28.6%) | 10 (71.4%) |
| College/Associate Degree | 2 (100.0%) | 0 (0.0%) |
| Bachelor's Degree or higher | 0 (0.0%) | 0 (0.0%) |
Occupancy by Age of Householder in Corn Creek
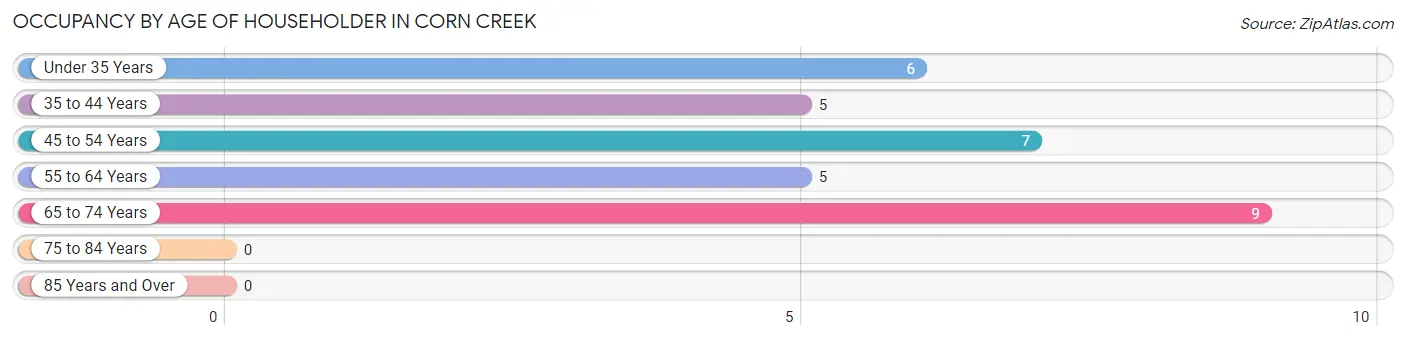
| Age Bracket | # Households | % Households |
| Under 35 Years | 6 | 18.8% |
| 35 to 44 Years | 5 | 15.6% |
| 45 to 54 Years | 7 | 21.9% |
| 55 to 64 Years | 5 | 15.6% |
| 65 to 74 Years | 9 | 28.1% |
| 75 to 84 Years | 0 | 0.0% |
| 85 Years and Over | 0 | 0.0% |
| Total | 32 | 100.0% |
Housing Finances in Corn Creek
Median Income by Occupancy in Corn Creek
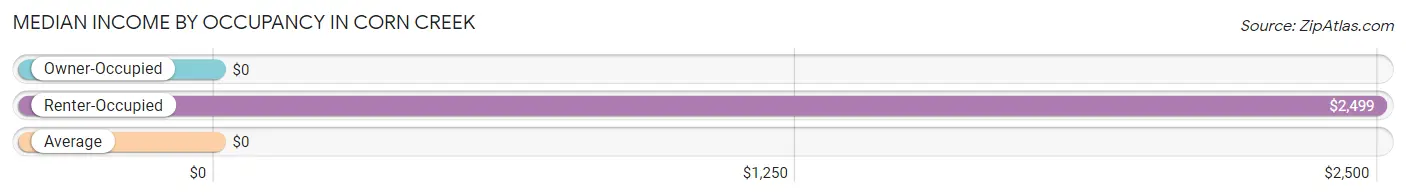
| Occupancy Type | # Households | Median Income |
| Owner-Occupied | 9 (28.1%) | $0 |
| Renter-Occupied | 23 (71.9%) | $2,499 |
| Average | 32 (100.0%) | $0 |
Occupancy by Householder Income Bracket in Corn Creek
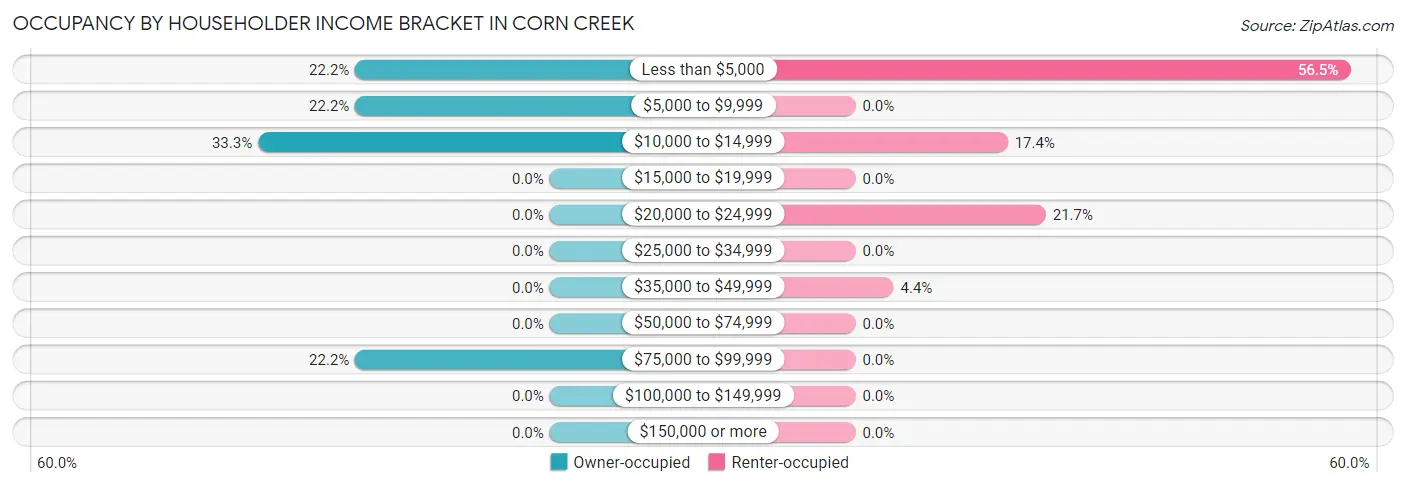
| Income Bracket | Owner-occupied | Renter-occupied |
| Less than $5,000 | 2 (22.2%) | 13 (56.5%) |
| $5,000 to $9,999 | 2 (22.2%) | 0 (0.0%) |
| $10,000 to $14,999 | 3 (33.3%) | 4 (17.4%) |
| $15,000 to $19,999 | 0 (0.0%) | 0 (0.0%) |
| $20,000 to $24,999 | 0 (0.0%) | 5 (21.7%) |
| $25,000 to $34,999 | 0 (0.0%) | 0 (0.0%) |
| $35,000 to $49,999 | 0 (0.0%) | 1 (4.3%) |
| $50,000 to $74,999 | 0 (0.0%) | 0 (0.0%) |
| $75,000 to $99,999 | 2 (22.2%) | 0 (0.0%) |
| $100,000 to $149,999 | 0 (0.0%) | 0 (0.0%) |
| $150,000 or more | 0 (0.0%) | 0 (0.0%) |
| Total | 9 (100.0%) | 23 (100.0%) |
Monthly Housing Cost Tiers in Corn Creek
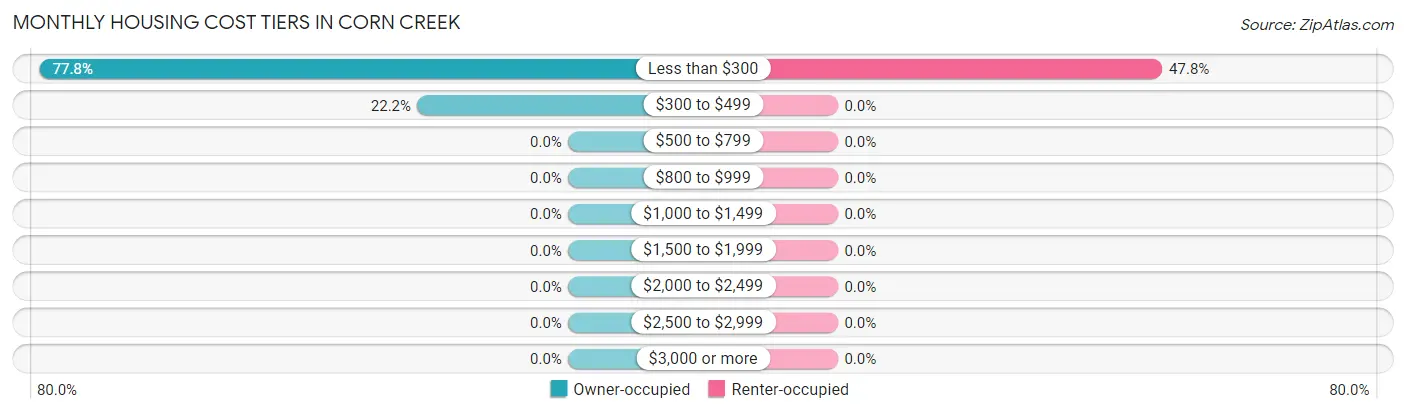
| Monthly Cost | Owner-occupied | Renter-occupied |
| Less than $300 | 7 (77.8%) | 11 (47.8%) |
| $300 to $499 | 2 (22.2%) | 0 (0.0%) |
| $500 to $799 | 0 (0.0%) | 0 (0.0%) |
| $800 to $999 | 0 (0.0%) | 0 (0.0%) |
| $1,000 to $1,499 | 0 (0.0%) | 0 (0.0%) |
| $1,500 to $1,999 | 0 (0.0%) | 0 (0.0%) |
| $2,000 to $2,499 | 0 (0.0%) | 0 (0.0%) |
| $2,500 to $2,999 | 0 (0.0%) | 0 (0.0%) |
| $3,000 or more | 0 (0.0%) | 0 (0.0%) |
| Total | 9 (100.0%) | 23 (100.0%) |
Physical Housing Characteristics in Corn Creek
Housing Structures in Corn Creek
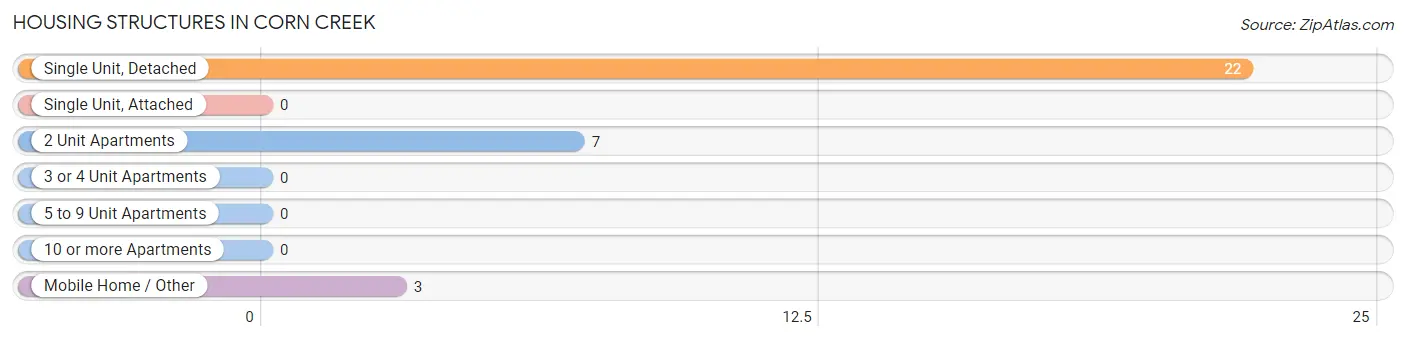
| Structure Type | # Housing Units | % Housing Units |
| Single Unit, Detached | 22 | 68.8% |
| Single Unit, Attached | 0 | 0.0% |
| 2 Unit Apartments | 7 | 21.9% |
| 3 or 4 Unit Apartments | 0 | 0.0% |
| 5 to 9 Unit Apartments | 0 | 0.0% |
| 10 or more Apartments | 0 | 0.0% |
| Mobile Home / Other | 3 | 9.4% |
| Total | 32 | 100.0% |
Housing Structures by Occupancy in Corn Creek
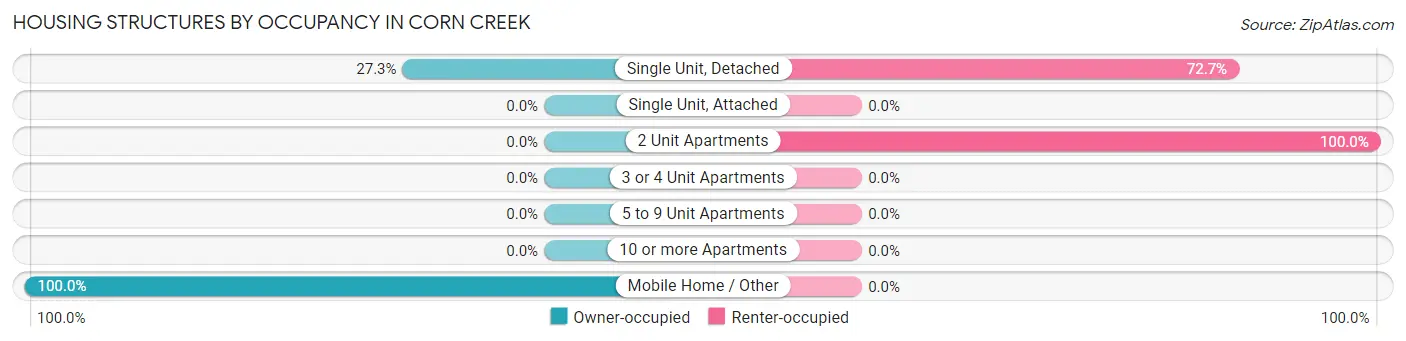
| Structure Type | Owner-occupied | Renter-occupied |
| Single Unit, Detached | 6 (27.3%) | 16 (72.7%) |
| Single Unit, Attached | 0 (0.0%) | 0 (0.0%) |
| 2 Unit Apartments | 0 (0.0%) | 7 (100.0%) |
| 3 or 4 Unit Apartments | 0 (0.0%) | 0 (0.0%) |
| 5 to 9 Unit Apartments | 0 (0.0%) | 0 (0.0%) |
| 10 or more Apartments | 0 (0.0%) | 0 (0.0%) |
| Mobile Home / Other | 3 (100.0%) | 0 (0.0%) |
| Total | 9 (28.1%) | 23 (71.9%) |
Housing Structures by Number of Rooms in Corn Creek
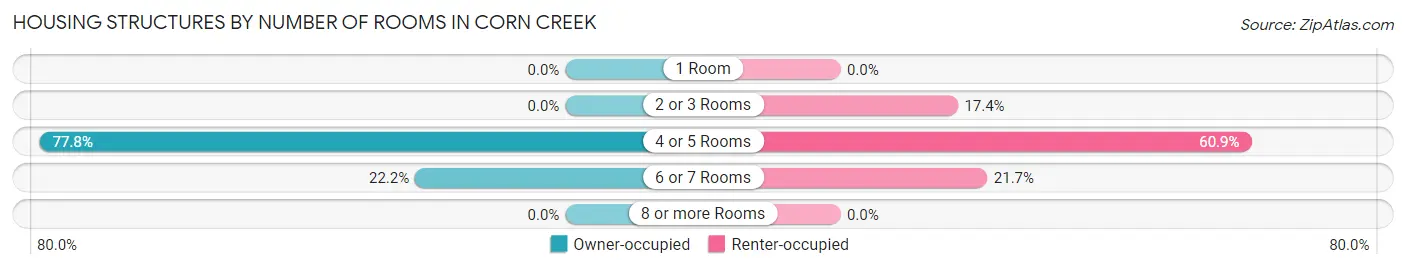
| Number of Rooms | Owner-occupied | Renter-occupied |
| 1 Room | 0 (0.0%) | 0 (0.0%) |
| 2 or 3 Rooms | 0 (0.0%) | 4 (17.4%) |
| 4 or 5 Rooms | 7 (77.8%) | 14 (60.9%) |
| 6 or 7 Rooms | 2 (22.2%) | 5 (21.7%) |
| 8 or more Rooms | 0 (0.0%) | 0 (0.0%) |
| Total | 9 (100.0%) | 23 (100.0%) |
Housing Structure by Heating Type in Corn Creek
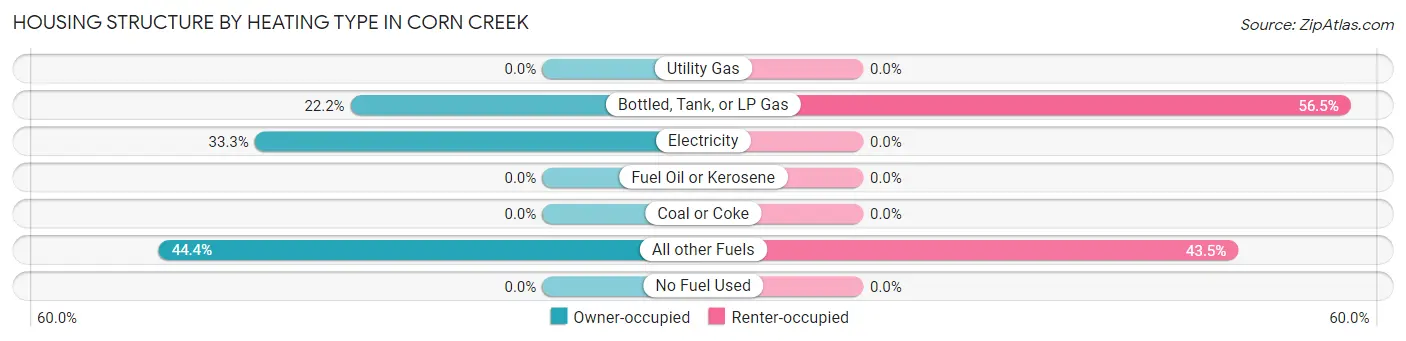
| Heating Type | Owner-occupied | Renter-occupied |
| Utility Gas | 0 (0.0%) | 0 (0.0%) |
| Bottled, Tank, or LP Gas | 2 (22.2%) | 13 (56.5%) |
| Electricity | 3 (33.3%) | 0 (0.0%) |
| Fuel Oil or Kerosene | 0 (0.0%) | 0 (0.0%) |
| Coal or Coke | 0 (0.0%) | 0 (0.0%) |
| All other Fuels | 4 (44.4%) | 10 (43.5%) |
| No Fuel Used | 0 (0.0%) | 0 (0.0%) |
| Total | 9 (100.0%) | 23 (100.0%) |
Household Vehicle Usage in Corn Creek
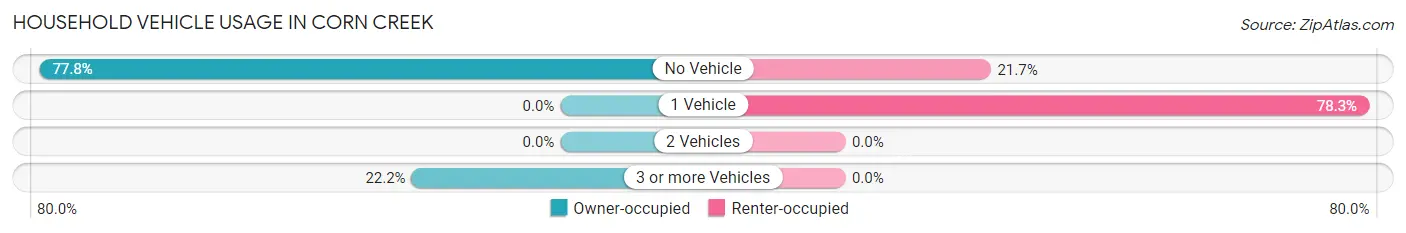
| Vehicles per Household | Owner-occupied | Renter-occupied |
| No Vehicle | 7 (77.8%) | 5 (21.7%) |
| 1 Vehicle | 0 (0.0%) | 18 (78.3%) |
| 2 Vehicles | 0 (0.0%) | 0 (0.0%) |
| 3 or more Vehicles | 2 (22.2%) | 0 (0.0%) |
| Total | 9 (100.0%) | 23 (100.0%) |
Real Estate & Mortgages in Corn Creek
Real Estate and Mortgage Overview in Corn Creek
| Characteristic | Without Mortgage | With Mortgage |
| Housing Units | 9 | 0 |
| Median Property Value | $9,999 | $0 |
| Median Household Income | - | - |
| Monthly Housing Costs | - | - |
| Real Estate Taxes | - | - |
Property Value by Mortgage Status in Corn Creek
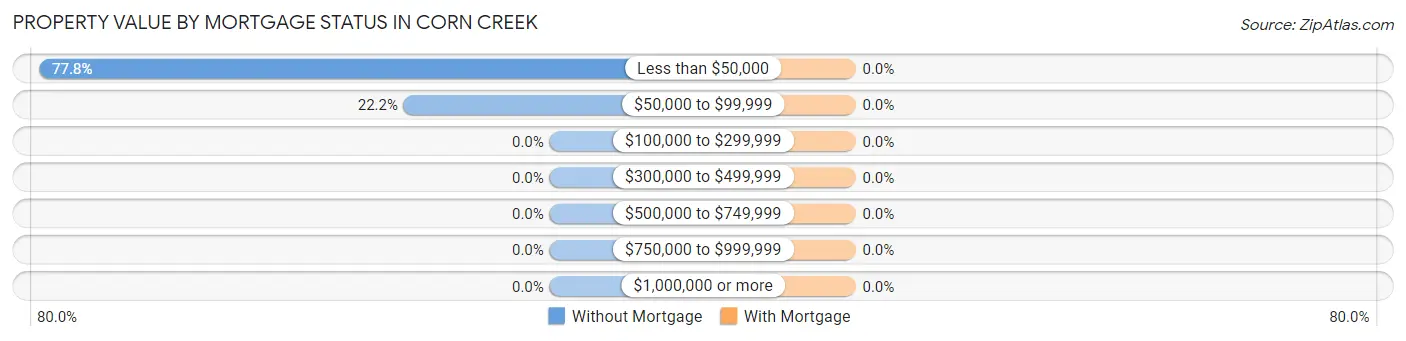
| Property Value | Without Mortgage | With Mortgage |
| Less than $50,000 | 7 (77.8%) | 0 (0.0%) |
| $50,000 to $99,999 | 2 (22.2%) | 0 (0.0%) |
| $100,000 to $299,999 | 0 (0.0%) | 0 (0.0%) |
| $300,000 to $499,999 | 0 (0.0%) | 0 (0.0%) |
| $500,000 to $749,999 | 0 (0.0%) | 0 (0.0%) |
| $750,000 to $999,999 | 0 (0.0%) | 0 (0.0%) |
| $1,000,000 or more | 0 (0.0%) | 0 (0.0%) |
| Total | 9 (100.0%) | 0 (0.0%) |
Household Income by Mortgage Status in Corn Creek
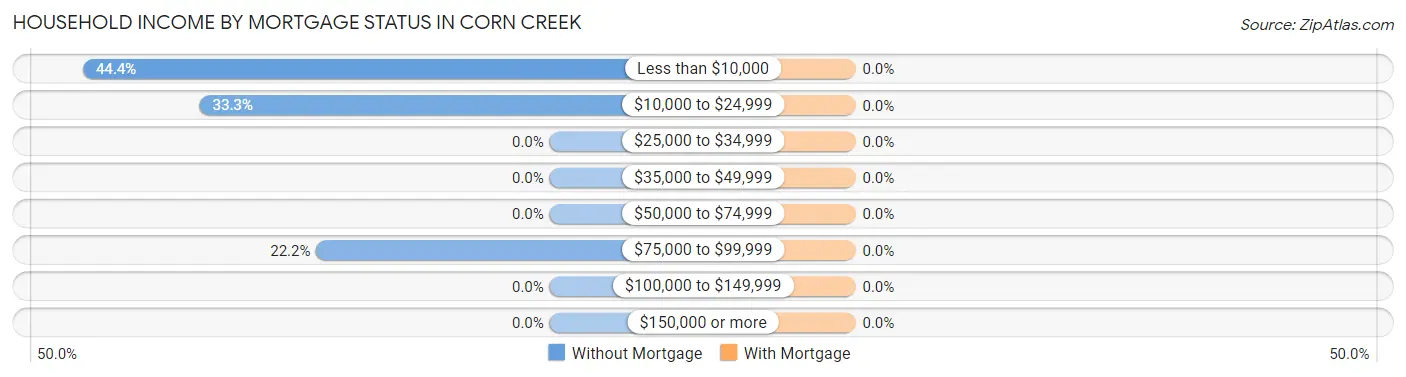
| Household Income | Without Mortgage | With Mortgage |
| Less than $10,000 | 4 (44.4%) | 0 (0.0%) |
| $10,000 to $24,999 | 3 (33.3%) | 0 (0.0%) |
| $25,000 to $34,999 | 0 (0.0%) | 0 (0.0%) |
| $35,000 to $49,999 | 0 (0.0%) | 0 (0.0%) |
| $50,000 to $74,999 | 0 (0.0%) | 0 (0.0%) |
| $75,000 to $99,999 | 2 (22.2%) | 0 (0.0%) |
| $100,000 to $149,999 | 0 (0.0%) | 0 (0.0%) |
| $150,000 or more | 0 (0.0%) | 0 (0.0%) |
| Total | 9 (100.0%) | 0 (0.0%) |
Property Value to Household Income Ratio in Corn Creek
| Value-to-Income Ratio | Without Mortgage | With Mortgage |
| Less than 2.0x | 7 (77.8%) | 0 (0.0%) |
| 2.0x to 2.9x | 0 (0.0%) | 0 (0.0%) |
| 3.0x to 3.9x | 0 (0.0%) | 0 (0.0%) |
| 4.0x or more | 2 (22.2%) | 0 (0.0%) |
| Total | 9 (100.0%) | 0 (0.0%) |
Real Estate Taxes by Mortgage Status in Corn Creek
| Property Taxes | Without Mortgage | With Mortgage |
| Less than $800 | 0 (0.0%) | 0 (0.0%) |
| $800 to $1,499 | 0 (0.0%) | 0 (0.0%) |
| $800 to $1,499 | 0 (0.0%) | 0 (0.0%) |
| Total | 9 (100.0%) | 0 (0.0%) |
Health & Disability in Corn Creek
Health Insurance Coverage by Age in Corn Creek
| Age Bracket | With Coverage | Without Coverage |
| Under 6 Years | 29 (100.0%) | 0 (0.0%) |
| 6 to 18 Years | 39 (90.7%) | 4 (9.3%) |
| 19 to 25 Years | 0 (0.0%) | 13 (100.0%) |
| 26 to 34 Years | 0 (0.0%) | 28 (100.0%) |
| 35 to 44 Years | 5 (13.5%) | 32 (86.5%) |
| 45 to 54 Years | 5 (31.2%) | 11 (68.8%) |
| 55 to 64 Years | 0 (0.0%) | 5 (100.0%) |
| 65 to 74 Years | 12 (100.0%) | 0 (0.0%) |
| 75 Years and older | 0 (0.0%) | 0 (0.0%) |
| Total | 90 (49.2%) | 93 (50.8%) |
Health Insurance Coverage by Citizenship Status in Corn Creek
| Citizenship Status | With Coverage | Without Coverage |
| Native Born | 29 (100.0%) | 0 (0.0%) |
| Foreign Born, Citizen | 39 (90.7%) | 4 (9.3%) |
| Foreign Born, not a Citizen | 0 (0.0%) | 13 (100.0%) |
Health Insurance Coverage by Household Income in Corn Creek
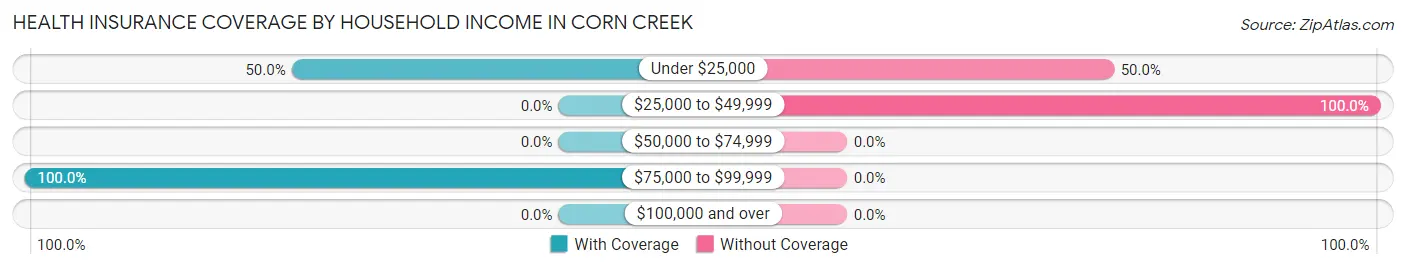
| Household Income | With Coverage | Without Coverage |
| Under $25,000 | 85 (50.0%) | 85 (50.0%) |
| $25,000 to $49,999 | 0 (0.0%) | 8 (100.0%) |
| $50,000 to $74,999 | 0 (0.0%) | 0 (0.0%) |
| $75,000 to $99,999 | 5 (100.0%) | 0 (0.0%) |
| $100,000 and over | 0 (0.0%) | 0 (0.0%) |
Public vs Private Health Insurance Coverage by Age in Corn Creek
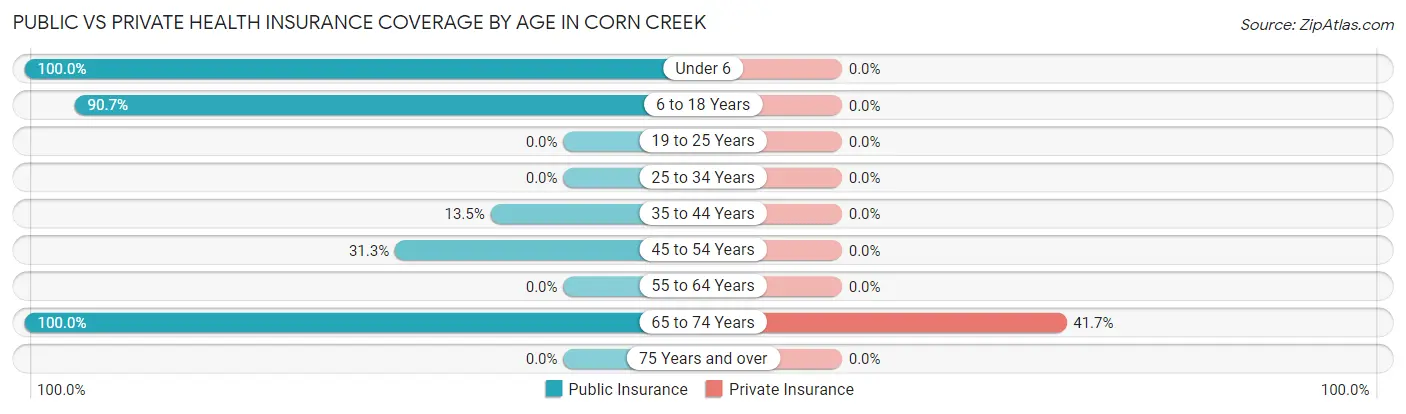
| Age Bracket | Public Insurance | Private Insurance |
| Under 6 | 29 (100.0%) | 0 (0.0%) |
| 6 to 18 Years | 39 (90.7%) | 0 (0.0%) |
| 19 to 25 Years | 0 (0.0%) | 0 (0.0%) |
| 25 to 34 Years | 0 (0.0%) | 0 (0.0%) |
| 35 to 44 Years | 5 (13.5%) | 0 (0.0%) |
| 45 to 54 Years | 5 (31.2%) | 0 (0.0%) |
| 55 to 64 Years | 0 (0.0%) | 0 (0.0%) |
| 65 to 74 Years | 12 (100.0%) | 5 (41.7%) |
| 75 Years and over | 0 (0.0%) | 0 (0.0%) |
| Total | 90 (49.2%) | 5 (2.7%) |
Disability Status by Sex by Age in Corn Creek
| Age Bracket | Male | Female |
| Under 5 Years | 0 (0.0%) | 0 (0.0%) |
| 5 to 17 Years | 0 (0.0%) | 0 (0.0%) |
| 18 to 34 Years | 0 (0.0%) | 0 (0.0%) |
| 35 to 64 Years | 0 (0.0%) | 0 (0.0%) |
| 65 to 74 Years | 0 (0.0%) | 0 (0.0%) |
| 75 Years and over | 0 (0.0%) | 0 (0.0%) |
Disability Class by Sex by Age in Corn Creek
Disability Class: Hearing Difficulty
| Age Bracket | Male | Female |
| Under 5 Years | 0 (0.0%) | 0 (0.0%) |
| 5 to 17 Years | 0 (0.0%) | 0 (0.0%) |
| 18 to 34 Years | 0 (0.0%) | 0 (0.0%) |
| 35 to 64 Years | 0 (0.0%) | 0 (0.0%) |
| 65 to 74 Years | 0 (0.0%) | 0 (0.0%) |
| 75 Years and over | 0 (0.0%) | 0 (0.0%) |
Disability Class: Vision Difficulty
| Age Bracket | Male | Female |
| Under 5 Years | 0 (0.0%) | 0 (0.0%) |
| 5 to 17 Years | 0 (0.0%) | 0 (0.0%) |
| 18 to 34 Years | 0 (0.0%) | 0 (0.0%) |
| 35 to 64 Years | 0 (0.0%) | 0 (0.0%) |
| 65 to 74 Years | 0 (0.0%) | 0 (0.0%) |
| 75 Years and over | 0 (0.0%) | 0 (0.0%) |
Disability Class: Cognitive Difficulty
| Age Bracket | Male | Female |
| 5 to 17 Years | 0 (0.0%) | 0 (0.0%) |
| 18 to 34 Years | 0 (0.0%) | 0 (0.0%) |
| 35 to 64 Years | 0 (0.0%) | 0 (0.0%) |
| 65 to 74 Years | 0 (0.0%) | 0 (0.0%) |
| 75 Years and over | 0 (0.0%) | 0 (0.0%) |
Disability Class: Ambulatory Difficulty
| Age Bracket | Male | Female |
| 5 to 17 Years | 0 (0.0%) | 0 (0.0%) |
| 18 to 34 Years | 0 (0.0%) | 0 (0.0%) |
| 35 to 64 Years | 0 (0.0%) | 0 (0.0%) |
| 65 to 74 Years | 0 (0.0%) | 0 (0.0%) |
| 75 Years and over | 0 (0.0%) | 0 (0.0%) |
Disability Class: Self-Care Difficulty
| Age Bracket | Male | Female |
| 5 to 17 Years | 0 (0.0%) | 0 (0.0%) |
| 18 to 34 Years | 0 (0.0%) | 0 (0.0%) |
| 35 to 64 Years | 0 (0.0%) | 0 (0.0%) |
| 65 to 74 Years | 0 (0.0%) | 0 (0.0%) |
| 75 Years and over | 0 (0.0%) | 0 (0.0%) |
Technology Access in Corn Creek
Computing Device Access in Corn Creek
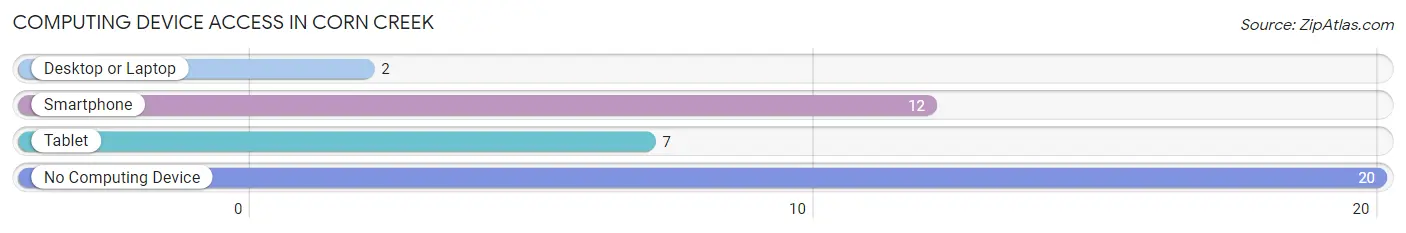
| Device Type | # Households | % Households |
| Desktop or Laptop | 2 | 6.2% |
| Smartphone | 12 | 37.5% |
| Tablet | 7 | 21.9% |
| No Computing Device | 20 | 62.5% |
| Total | 32 | 100.0% |
Internet Access in Corn Creek
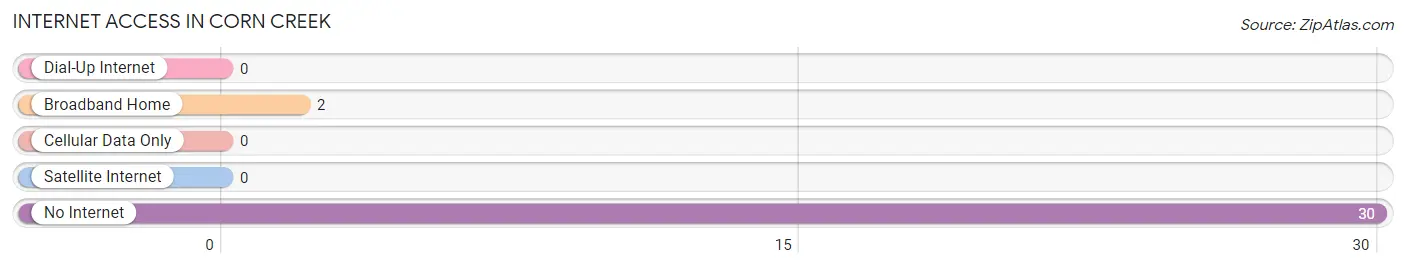
| Internet Type | # Households | % Households |
| Dial-Up Internet | 0 | 0.0% |
| Broadband Home | 2 | 6.2% |
| Cellular Data Only | 0 | 0.0% |
| Satellite Internet | 0 | 0.0% |
| No Internet | 30 | 93.8% |
| Total | 32 | 100.0% |
Corn Creek Summary
Creek Creek, South Dakota is a small town located in the southeastern corner of the state. It is situated in the rolling hills of the Missouri River Valley, and is surrounded by the Black Hills National Forest. The town was founded in 1883 by a group of settlers who were looking for a place to settle and start a new life. The town was named after the nearby creek, which was named after the Native American tribe that once lived in the area.
The town of Creek Creek is located in the county of Lawrence, and is part of the Rapid City, South Dakota metropolitan area. The town has a population of approximately 1,000 people, and is home to a variety of businesses, including a grocery store, a hardware store, a bank, and a post office. The town is also home to a number of churches, including the First Baptist Church, the United Methodist Church, and the Church of Jesus Christ of Latter-day Saints.
The economy of Creek Creek is largely based on agriculture, with the majority of the population employed in farming and ranching. The town is also home to a number of small businesses, including a gas station, a restaurant, and a bar. The town is also home to a number of tourist attractions, including the Black Hills National Forest, the Badlands National Park, and the Crazy Horse Memorial.
The geography of Creek Creek is characterized by rolling hills and valleys, with the town located in the Missouri River Valley. The town is surrounded by the Black Hills National Forest, and is located near the Badlands National Park. The town is also located near the Crazy Horse Memorial, which is a monument to the Native American leader Crazy Horse.
The demographics of Creek Creek are largely white, with the majority of the population being of European descent. The town also has a small population of Native Americans, and a small population of African Americans. The town has a median household income of $37,000, and the median age of the population is 37.
Creek Creek is a small town with a rich history and a vibrant economy. The town is home to a variety of businesses, churches, and tourist attractions, and is surrounded by the beauty of the Black Hills National Forest. The town is also home to a diverse population, with a mix of European, Native American, and African American residents. The town is a great place to live, work, and visit, and is a great example of the beauty and diversity of South Dakota.
Common Questions
What is Per Capita Income in Corn Creek?
Per Capita income in Corn Creek is $2,549.
What is Inequality or Gini Index in Corn Creek?
Inequality or Gini Index in Corn Creek is 0.69.
What is the Total Population of Corn Creek?
Total Population of Corn Creek is 183.
What is the Total Male Population of Corn Creek?
Total Male Population of Corn Creek is 92.
What is the Total Female Population of Corn Creek?
Total Female Population of Corn Creek is 91.
What is the Ratio of Males per 100 Females in Corn Creek?
There are 101.10 Males per 100 Females in Corn Creek.
What is the Ratio of Females per 100 Males in Corn Creek?
There are 98.91 Females per 100 Males in Corn Creek.
What is the Median Population Age in Corn Creek?
Median Population Age in Corn Creek is 26.4 Years.
What is the Average Family Size in Corn Creek
Average Family Size in Corn Creek is 5.7 People.
What is the Average Household Size in Corn Creek
Average Household Size in Corn Creek is 5.7 People.
How Large is the Labor Force in Corn Creek?
There are 17 People in the Labor Forcein in Corn Creek.
What is the Percentage of People in the Labor Force in Corn Creek?
14.3% of People are in the Labor Force in Corn Creek.
What is the Unemployment Rate in Corn Creek?
Unemployment Rate in Corn Creek is 41.2%.