Cobden, MN Map & Demographics
Cobden Map
Cobden Overview
$40,047
PER CAPITA INCOME
0.26
INEQUALITY / GINI INDEX
19
TOTAL POPULATION
10
MALE POPULATION
9
FEMALE POPULATION
111.11
MALES / 100 FEMALES
90.00
FEMALES / 100 MALES
47.5
MEDIAN AGE
2.0
AVG FAMILY SIZE
2.1
AVG HOUSEHOLD SIZE
13
LABOR FORCE [ PEOPLE ]
81.3%
PERCENT IN LABOR FORCE
Cobden Area Codes
Income in Cobden
Income Overview in Cobden
| Characteristic | Number | Measure |
| Per Capita Income | 19 | $40,047 |
| Median Family Income | 7 | $0 |
| Mean Family Income | 7 | $71,300 |
| Median Household Income | 9 | $0 |
| Mean Household Income | 9 | $90,833 |
| Income Deficit | 7 | $0 |
| Wage / Income Gap (%) | 19 | 0.00% |
| Wage / Income Gap ($) | 19 | 100.00¢ per $1 |
| Gini / Inequality Index | 19 | 0.26 |
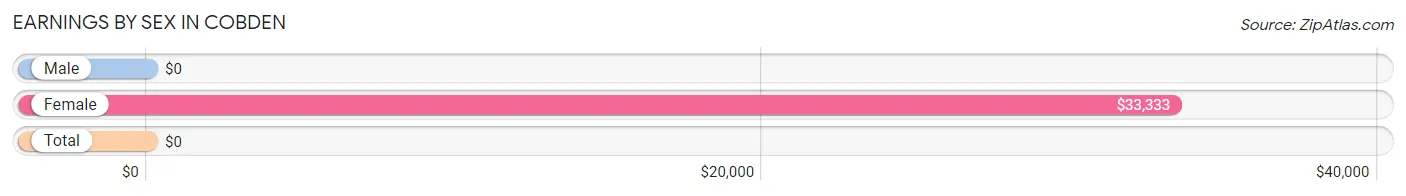
Earnings by Sex in Cobden
| Sex | Number | Average Earnings |
| Male | 7 (53.8%) | $0 |
| Female | 6 (46.2%) | $33,333 |
| Total | 13 (100.0%) | $0 |
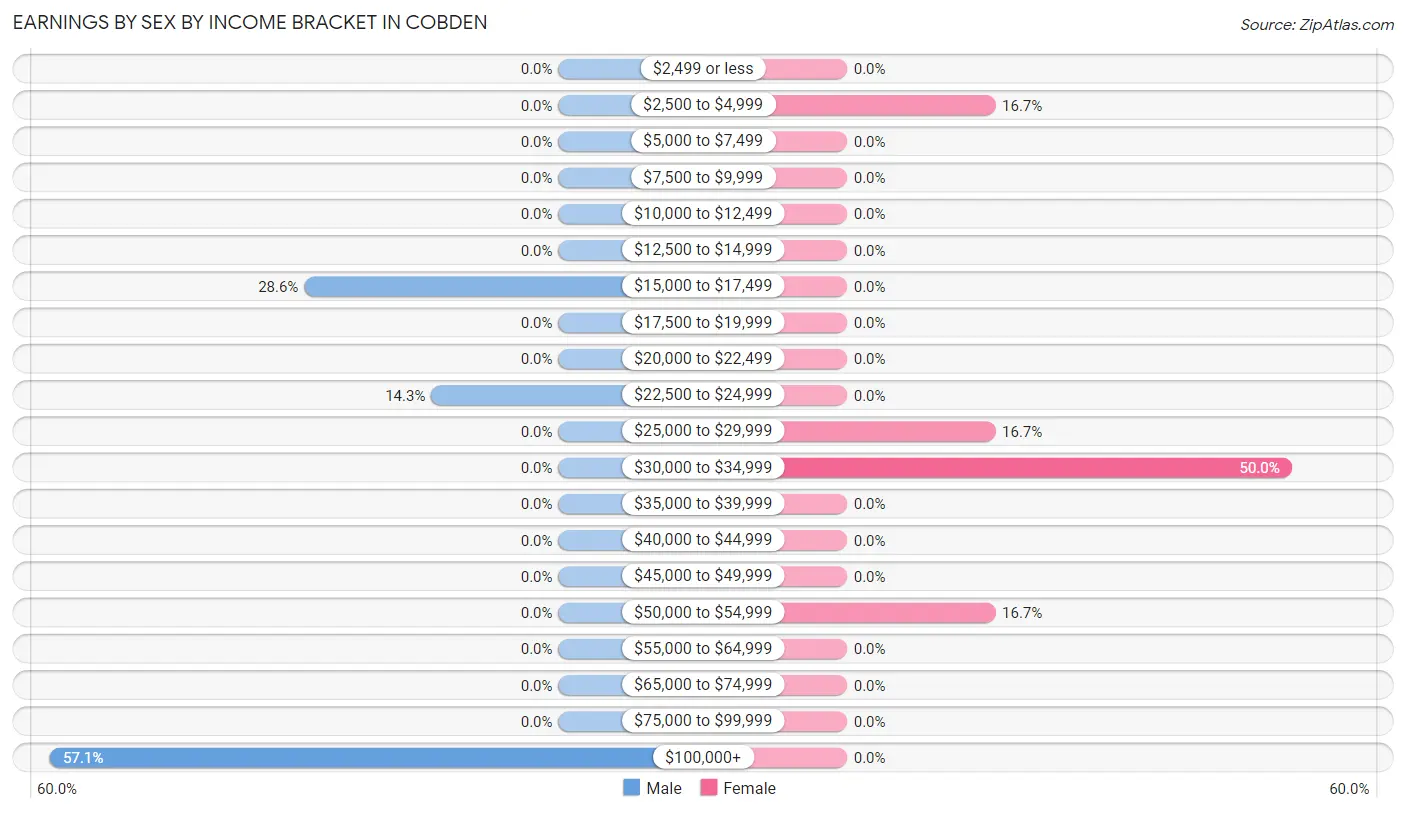
Earnings by Sex by Income Bracket in Cobden
The most common earnings brackets in Cobden are $100,000+ for men (4 | 57.1%) and $30,000 to $34,999 for women (3 | 50.0%).
| Income | Male | Female |
| $2,499 or less | 0 (0.0%) | 0 (0.0%) |
| $2,500 to $4,999 | 0 (0.0%) | 1 (16.7%) |
| $5,000 to $7,499 | 0 (0.0%) | 0 (0.0%) |
| $7,500 to $9,999 | 0 (0.0%) | 0 (0.0%) |
| $10,000 to $12,499 | 0 (0.0%) | 0 (0.0%) |
| $12,500 to $14,999 | 0 (0.0%) | 0 (0.0%) |
| $15,000 to $17,499 | 2 (28.6%) | 0 (0.0%) |
| $17,500 to $19,999 | 0 (0.0%) | 0 (0.0%) |
| $20,000 to $22,499 | 0 (0.0%) | 0 (0.0%) |
| $22,500 to $24,999 | 1 (14.3%) | 0 (0.0%) |
| $25,000 to $29,999 | 0 (0.0%) | 1 (16.7%) |
| $30,000 to $34,999 | 0 (0.0%) | 3 (50.0%) |
| $35,000 to $39,999 | 0 (0.0%) | 0 (0.0%) |
| $40,000 to $44,999 | 0 (0.0%) | 0 (0.0%) |
| $45,000 to $49,999 | 0 (0.0%) | 0 (0.0%) |
| $50,000 to $54,999 | 0 (0.0%) | 1 (16.7%) |
| $55,000 to $64,999 | 0 (0.0%) | 0 (0.0%) |
| $65,000 to $74,999 | 0 (0.0%) | 0 (0.0%) |
| $75,000 to $99,999 | 0 (0.0%) | 0 (0.0%) |
| $100,000+ | 4 (57.1%) | 0 (0.0%) |
| Total | 7 (100.0%) | 6 (100.0%) |
Earnings by Sex by Educational Attainment in Cobden
| Educational Attainment | Male Income | Female Income |
| Less than High School | - | - |
| High School Diploma | - | - |
| College or Associate's Degree | - | - |
| Bachelor's Degree | - | - |
| Graduate Degree | - | - |
| Total | - | - |
Family Income in Cobden
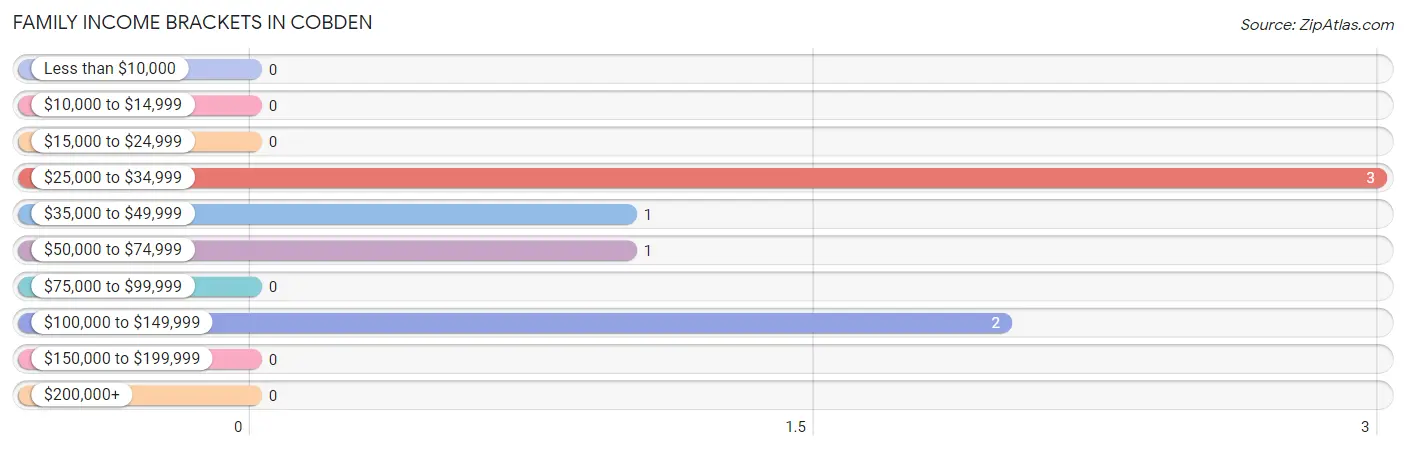
Family Income Brackets in Cobden
According to the Cobden family income data, there are 3 families falling into the $25,000 to $34,999 income range, which is the most common income bracket and makes up 42.9% of all families.
| Income Bracket | # Families | % Families |
| Less than $10,000 | 0 | 0.0% |
| $10,000 to $14,999 | 0 | 0.0% |
| $15,000 to $24,999 | 0 | 0.0% |
| $25,000 to $34,999 | 3 | 42.9% |
| $35,000 to $49,999 | 1 | 14.3% |
| $50,000 to $74,999 | 1 | 14.3% |
| $75,000 to $99,999 | 0 | 0.0% |
| $100,000 to $149,999 | 2 | 28.6% |
| $150,000 to $199,999 | 0 | 0.0% |
| $200,000+ | 0 | 0.0% |
Family Income by Famaliy Size in Cobden
| Income Bracket | # Families | Median Income |
| 2-Person Families | 6 (85.7%) | $0 |
| 3-Person Families | 0 (0.0%) | $0 |
| 4-Person Families | 0 (0.0%) | $0 |
| 5-Person Families | 1 (14.3%) | $0 |
| 6-Person Families | 0 (0.0%) | $0 |
| 7+ Person Families | 0 (0.0%) | $0 |
| Total | 7 (100.0%) | $0 |
Family Income by Number of Earners in Cobden
| Number of Earners | # Families | Median Income |
| No Earners | 0 (0.0%) | $0 |
| 1 Earner | 6 (85.7%) | $0 |
| 2 Earners | 1 (14.3%) | $0 |
| 3+ Earners | 0 (0.0%) | $0 |
| Total | 7 (100.0%) | $0 |
Household Income in Cobden
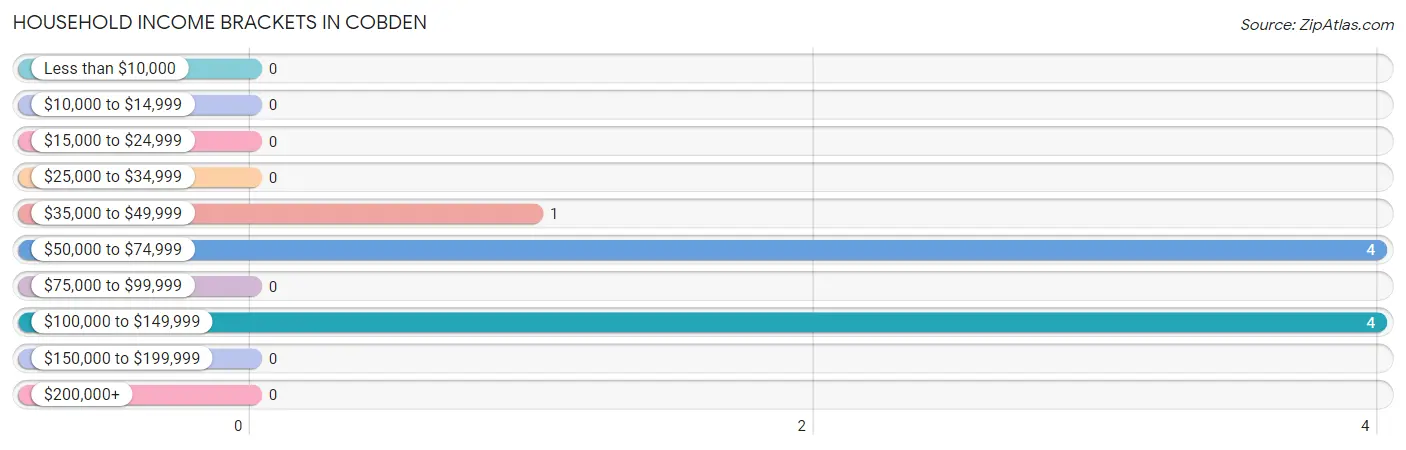
Household Income Brackets in Cobden
With 4 households falling in the category, the $50,000 to $74,999 income range is the most frequent in Cobden, accounting for 44.4% of all households.
| Income Bracket | # Households | % Households |
| Less than $10,000 | 0 | 0.0% |
| $10,000 to $14,999 | 0 | 0.0% |
| $15,000 to $24,999 | 0 | 0.0% |
| $25,000 to $34,999 | 0 | 0.0% |
| $35,000 to $49,999 | 1 | 11.1% |
| $50,000 to $74,999 | 4 | 44.4% |
| $75,000 to $99,999 | 0 | 0.0% |
| $100,000 to $149,999 | 4 | 44.4% |
| $150,000 to $199,999 | 0 | 0.0% |
| $200,000+ | 0 | 0.0% |
Household Income by Householder Age in Cobden
| Income Bracket | # Households | Median Income |
| 15 to 24 Years | 0 (0.0%) | $0 |
| 25 to 44 Years | 1 (11.1%) | $0 |
| 45 to 64 Years | 6 (66.7%) | $0 |
| 65+ Years | 2 (22.2%) | $0 |
| Total | 9 (100.0%) | $0 |
Poverty in Cobden
Income Below Poverty by Sex and Age in Cobden
| Age Bracket | Male | Female |
| Under 5 Years | 0 (0.0%) | 0 (0.0%) |
| 5 Years | 0 (0.0%) | 0 (0.0%) |
| 6 to 11 Years | 0 (0.0%) | 0 (0.0%) |
| 12 to 14 Years | 0 (0.0%) | 0 (0.0%) |
| 15 Years | 0 (0.0%) | 0 (0.0%) |
| 16 and 17 Years | 0 (0.0%) | 0 (0.0%) |
| 18 to 24 Years | 0 (0.0%) | 0 (0.0%) |
| 25 to 34 Years | 0 (0.0%) | 0 (0.0%) |
| 35 to 44 Years | 0 (0.0%) | 0 (0.0%) |
| 45 to 54 Years | 0 (0.0%) | 0 (0.0%) |
| 55 to 64 Years | 0 (0.0%) | 0 (0.0%) |
| 65 to 74 Years | 0 (0.0%) | 0 (0.0%) |
| 75 Years and over | 0 (0.0%) | 0 (0.0%) |
| Total | 0 (0.0%) | 0 (0.0%) |
Income Above Poverty by Sex and Age in Cobden
According to the poverty statistics in Cobden, males aged 12 to 14 years and females aged 6 to 11 years are the age groups that are most secure financially, with 100.0% of males and 100.0% of females in these age groups living above the poverty line.
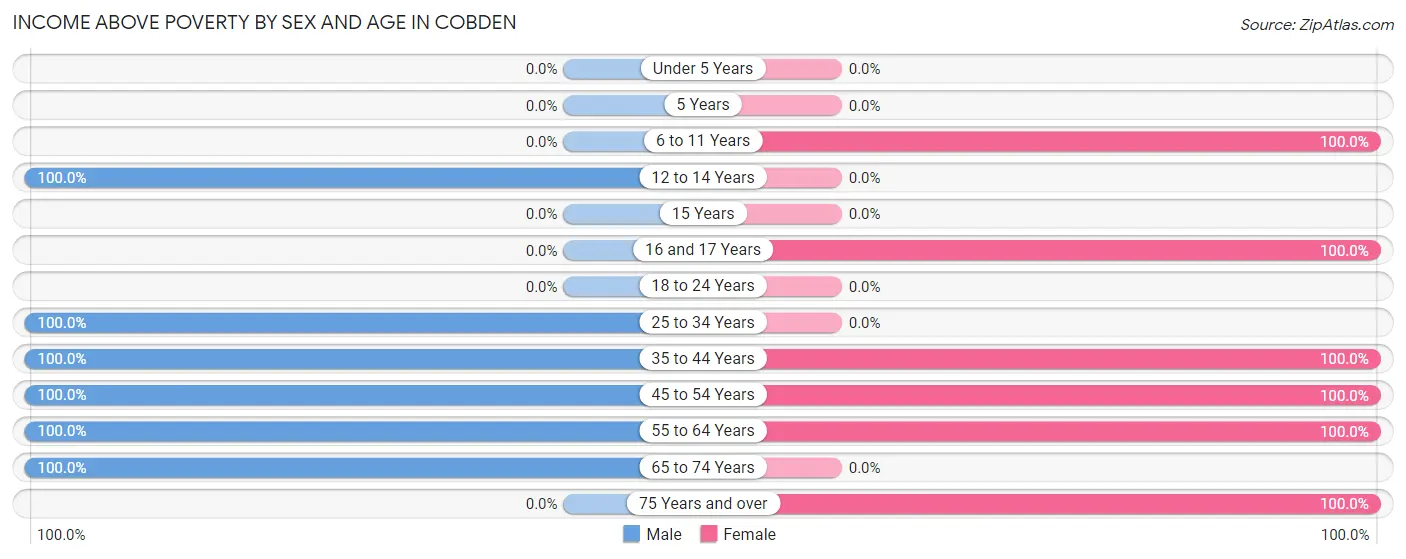
| Age Bracket | Male | Female |
| Under 5 Years | 0 (0.0%) | 0 (0.0%) |
| 5 Years | 0 (0.0%) | 0 (0.0%) |
| 6 to 11 Years | 0 (0.0%) | 1 (100.0%) |
| 12 to 14 Years | 2 (100.0%) | 0 (0.0%) |
| 15 Years | 0 (0.0%) | 0 (0.0%) |
| 16 and 17 Years | 0 (0.0%) | 1 (100.0%) |
| 18 to 24 Years | 0 (0.0%) | 0 (0.0%) |
| 25 to 34 Years | 2 (100.0%) | 0 (0.0%) |
| 35 to 44 Years | 1 (100.0%) | 1 (100.0%) |
| 45 to 54 Years | 2 (100.0%) | 3 (100.0%) |
| 55 to 64 Years | 1 (100.0%) | 2 (100.0%) |
| 65 to 74 Years | 2 (100.0%) | 0 (0.0%) |
| 75 Years and over | 0 (0.0%) | 1 (100.0%) |
| Total | 10 (100.0%) | 9 (100.0%) |
Income Below Poverty Among Married-Couple Families in Cobden
| Children | Above Poverty | Below Poverty |
| No Children | 3 (100.0%) | 0 (0.0%) |
| 1 or 2 Children | 0 (0.0%) | 0 (0.0%) |
| 3 or 4 Children | 1 (100.0%) | 0 (0.0%) |
| 5 or more Children | 0 (0.0%) | 0 (0.0%) |
| Total | 4 (100.0%) | 0 (0.0%) |
Income Below Poverty Among Single-Parent Households in Cobden
| Children | Single Father | Single Mother |
| No Children | 0 (0.0%) | 0 (0.0%) |
| 1 or 2 Children | 0 (0.0%) | 0 (0.0%) |
| 3 or 4 Children | 0 (0.0%) | 0 (0.0%) |
| 5 or more Children | 0 (0.0%) | 0 (0.0%) |
| Total | 0 (0.0%) | 0 (0.0%) |
Income Below Poverty Among Married-Couple vs Single-Parent Households in Cobden
| Children | Married-Couple Families | Single-Parent Households |
| No Children | 0 (0.0%) | 0 (0.0%) |
| 1 or 2 Children | 0 (0.0%) | 0 (0.0%) |
| 3 or 4 Children | 0 (0.0%) | 0 (0.0%) |
| 5 or more Children | 0 (0.0%) | 0 (0.0%) |
| Total | 0 (0.0%) | 0 (0.0%) |
Race in Cobden
The most populous races in Cobden are , and White / Caucasian (19 | 100.0%).
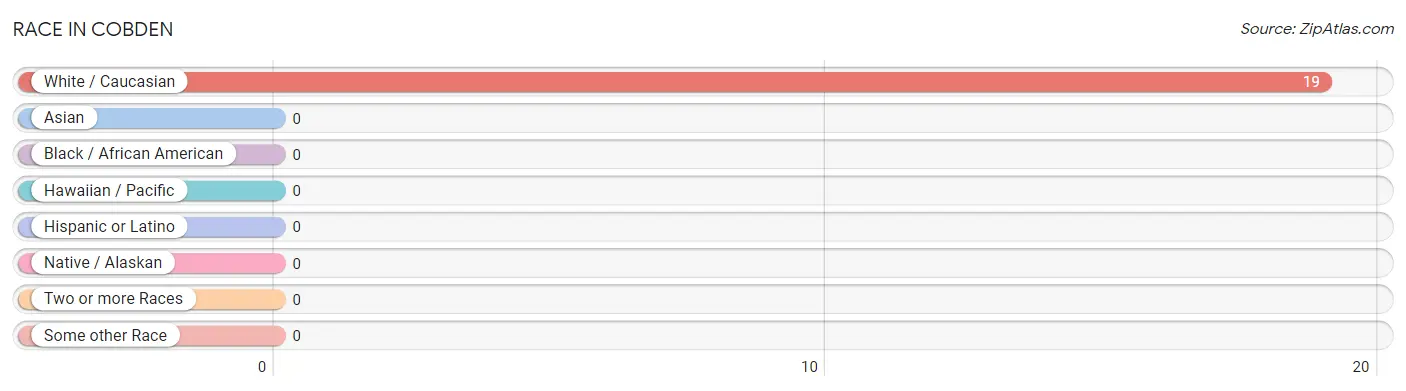
| Race | # Population | % Population |
| Asian | 0 | 0.0% |
| Black / African American | 0 | 0.0% |
| Hawaiian / Pacific | 0 | 0.0% |
| Hispanic or Latino | 0 | 0.0% |
| Native / Alaskan | 0 | 0.0% |
| White / Caucasian | 19 | 100.0% |
| Two or more Races | 0 | 0.0% |
| Some other Race | 0 | 0.0% |
| Total | 19 | 100.0% |
Ancestry in Cobden
The most populous ancestries reported in Cobden are German (15 | 78.9%), Swedish (5 | 26.3%), Irish (3 | 15.8%), Norwegian (3 | 15.8%), and Czech (2 | 10.5%), together accounting for 147.4% of all Cobden residents.
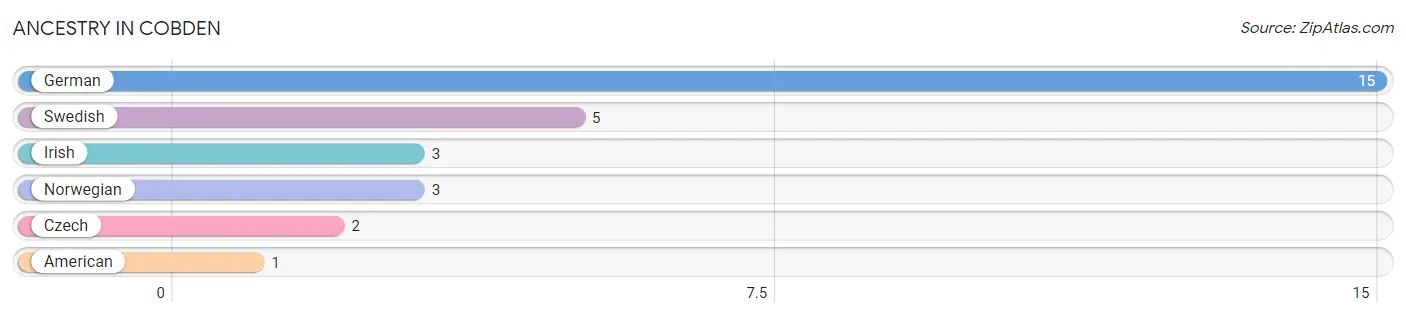
| Ancestry | # Population | % Population |
| American | 1 | 5.3% |
| Czech | 2 | 10.5% |
| German | 15 | 78.9% |
| Irish | 3 | 15.8% |
| Norwegian | 3 | 15.8% |
| Swedish | 5 | 26.3% | View All 6 Rows |
Immigrants in Cobden

| Immigration Origin | # Population | % Population | View All 0 Rows |
Sex and Age in Cobden
Sex and Age in Cobden
The most populous age groups in Cobden are 10 to 14 Years (2 | 20.0%) for men and 45 to 49 Years (3 | 33.3%) for women.
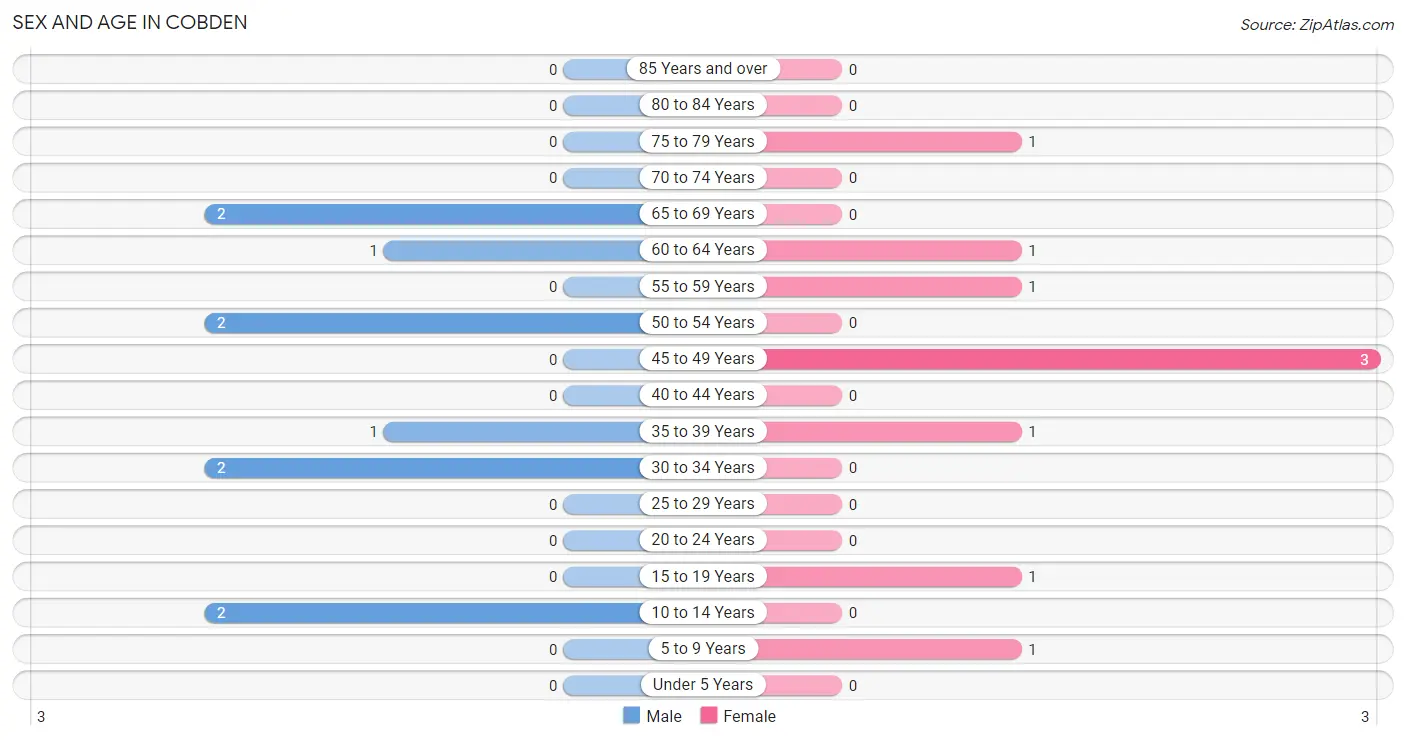
| Age Bracket | Male | Female |
| Under 5 Years | 0 (0.0%) | 0 (0.0%) |
| 5 to 9 Years | 0 (0.0%) | 1 (11.1%) |
| 10 to 14 Years | 2 (20.0%) | 0 (0.0%) |
| 15 to 19 Years | 0 (0.0%) | 1 (11.1%) |
| 20 to 24 Years | 0 (0.0%) | 0 (0.0%) |
| 25 to 29 Years | 0 (0.0%) | 0 (0.0%) |
| 30 to 34 Years | 2 (20.0%) | 0 (0.0%) |
| 35 to 39 Years | 1 (10.0%) | 1 (11.1%) |
| 40 to 44 Years | 0 (0.0%) | 0 (0.0%) |
| 45 to 49 Years | 0 (0.0%) | 3 (33.3%) |
| 50 to 54 Years | 2 (20.0%) | 0 (0.0%) |
| 55 to 59 Years | 0 (0.0%) | 1 (11.1%) |
| 60 to 64 Years | 1 (10.0%) | 1 (11.1%) |
| 65 to 69 Years | 2 (20.0%) | 0 (0.0%) |
| 70 to 74 Years | 0 (0.0%) | 0 (0.0%) |
| 75 to 79 Years | 0 (0.0%) | 1 (11.1%) |
| 80 to 84 Years | 0 (0.0%) | 0 (0.0%) |
| 85 Years and over | 0 (0.0%) | 0 (0.0%) |
| Total | 10 (100.0%) | 9 (100.0%) |
Families and Households in Cobden
Median Family Size in Cobden
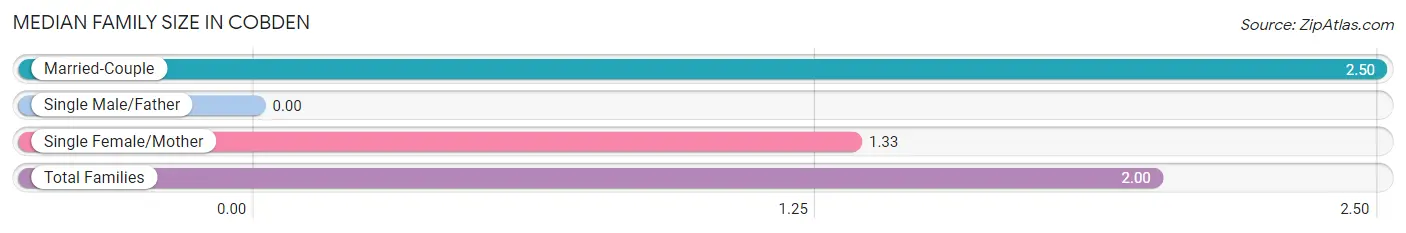
| Family Type | # Families | Family Size |
| Married-Couple | 4 (57.1%) | 2.50 |
| Single Male/Father | 0 (0.0%) | - |
| Single Female/Mother | 3 (42.9%) | 1.33 |
| Total Families | 7 (100.0%) | 2.00 |
Median Household Size in Cobden
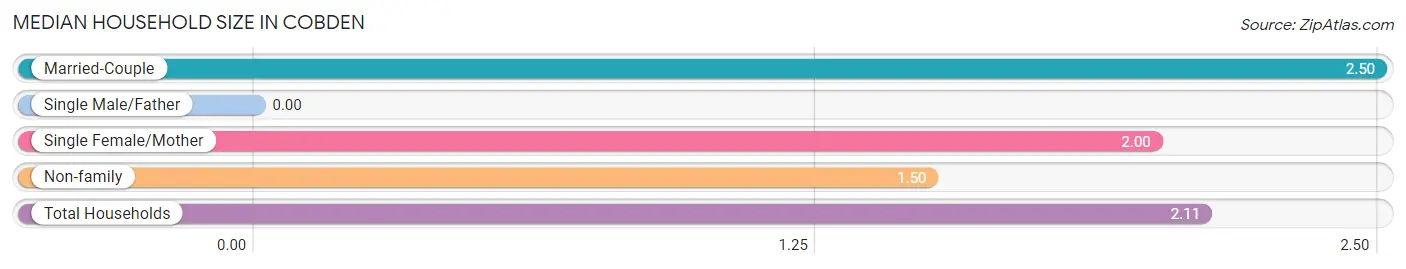
| Household Type | # Households | Household Size |
| Married-Couple | 4 (44.4%) | 2.50 |
| Single Male/Father | 0 (0.0%) | - |
| Single Female/Mother | 3 (33.3%) | 2.00 |
| Non-family | 2 (22.2%) | 1.50 |
| Total Households | 9 (100.0%) | 2.11 |
Household Size by Marriage Status in Cobden
Out of a total of 9 households in Cobden, 7 (77.8%) are family households, while 2 (22.2%) are nonfamily households. The most numerous type of family households are 2-person households, comprising 3, and the most common type of nonfamily households are 2-person households, comprising 2.
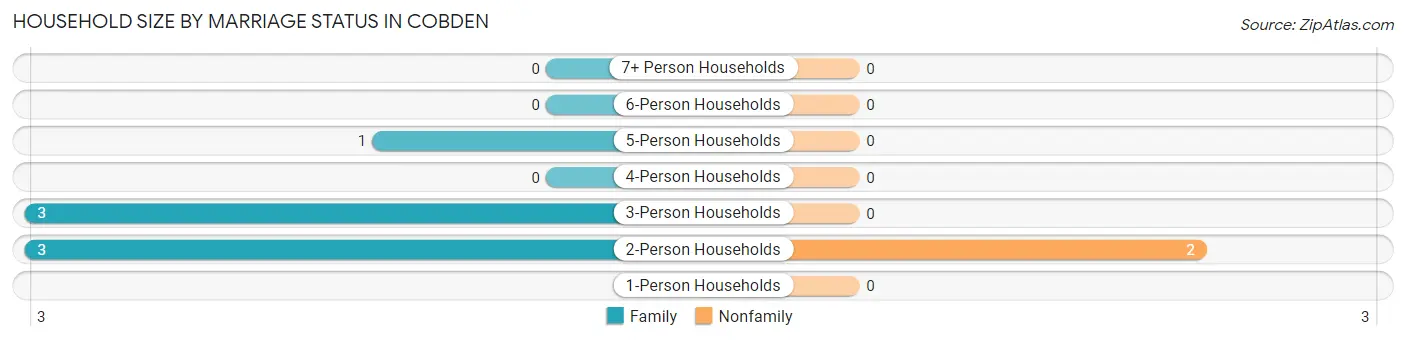
| Household Size | Family Households | Nonfamily Households |
| 1-Person Households | - | 0 (0.0%) |
| 2-Person Households | 3 (33.3%) | 2 (22.2%) |
| 3-Person Households | 3 (33.3%) | 0 (0.0%) |
| 4-Person Households | 0 (0.0%) | 0 (0.0%) |
| 5-Person Households | 1 (11.1%) | 0 (0.0%) |
| 6-Person Households | 0 (0.0%) | 0 (0.0%) |
| 7+ Person Households | 0 (0.0%) | 0 (0.0%) |
| Total | 7 (77.8%) | 2 (22.2%) |
Female Fertility in Cobden
Fertility by Age in Cobden
| Age Bracket | Women with Births | Births / 1,000 Women |
| 15 to 19 years | 0 (0.0%) | 0.0 |
| 20 to 34 years | 0 (0.0%) | 0.0 |
| 35 to 50 years | 0 (0.0%) | 0.0 |
| Total | 0 (0.0%) | 0.0 |
Fertility by Age by Marriage Status in Cobden
| Age Bracket | Married | Unmarried |
| 15 to 19 years | 0 (0.0%) | 0 (0.0%) |
| 20 to 34 years | 0 (0.0%) | 0 (0.0%) |
| 35 to 50 years | 0 (0.0%) | 0 (0.0%) |
| Total | 0 (0.0%) | 0 (0.0%) |
Fertility by Education in Cobden
| Educational Attainment | Women with Births | Births / 1,000 Women |
| Less than High School | 0 (0.0%) | 0.0 |
| High School Diploma | 0 (0.0%) | 0.0 |
| College or Associate's Degree | 0 (0.0%) | 0.0 |
| Bachelor's Degree | 0 (0.0%) | 0.0 |
| Graduate Degree | 0 (0.0%) | 0.0 |
| Total | 0 (0.0%) | 0.0 |
Fertility by Education by Marriage Status in Cobden
| Educational Attainment | Married | Unmarried |
| Less than High School | 0 (0.0%) | 0 (0.0%) |
| High School Diploma | 0 (0.0%) | 0 (0.0%) |
| College or Associate's Degree | 0 (0.0%) | 0 (0.0%) |
| Bachelor's Degree | 0 (0.0%) | 0 (0.0%) |
| Graduate Degree | 0 (0.0%) | 0 (0.0%) |
| Total | 0 (0.0%) | 0 (0.0%) |
Employment Characteristics in Cobden
Employment by Class of Employer in Cobden
Among the 13 employed individuals in Cobden, private company employees (12 | 92.3%), and self-employed (not incorporated) (1 | 7.7%) make up the most common classes of employment.
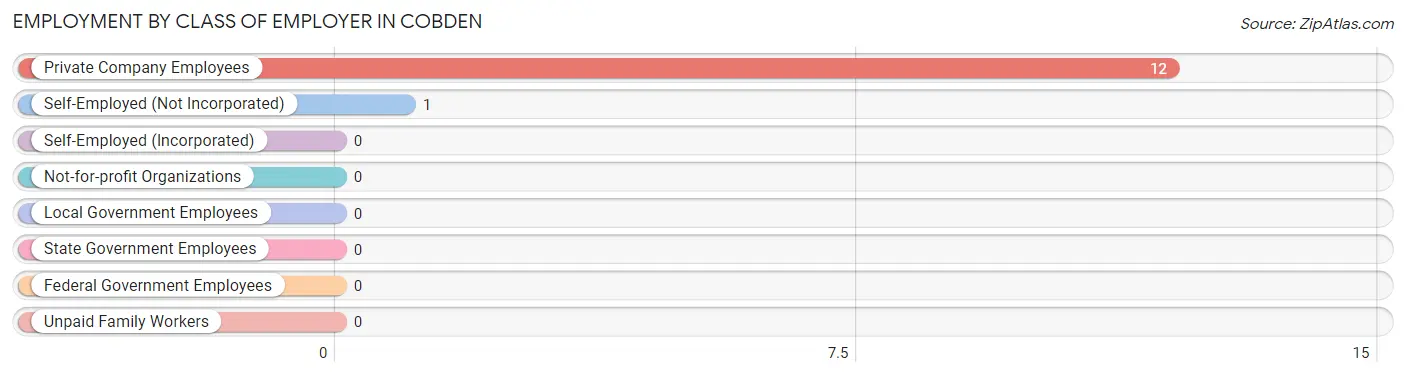
| Employer Class | # Employees | % Employees |
| Private Company Employees | 12 | 92.3% |
| Self-Employed (Incorporated) | 0 | 0.0% |
| Self-Employed (Not Incorporated) | 1 | 7.7% |
| Not-for-profit Organizations | 0 | 0.0% |
| Local Government Employees | 0 | 0.0% |
| State Government Employees | 0 | 0.0% |
| Federal Government Employees | 0 | 0.0% |
| Unpaid Family Workers | 0 | 0.0% |
| Total | 13 | 100.0% |
Employment Status by Age in Cobden
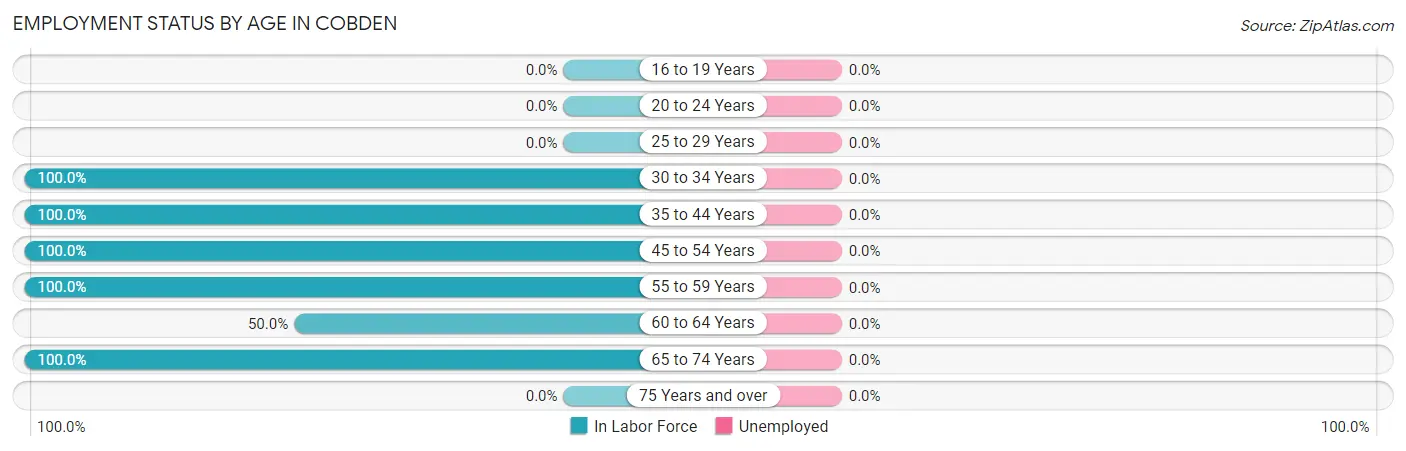
| Age Bracket | In Labor Force | Unemployed |
| 16 to 19 Years | 0 (0.0%) | 0 (0.0%) |
| 20 to 24 Years | 0 (0.0%) | 0 (0.0%) |
| 25 to 29 Years | 0 (0.0%) | 0 (0.0%) |
| 30 to 34 Years | 2 (100.0%) | 0 (0.0%) |
| 35 to 44 Years | 2 (100.0%) | 0 (0.0%) |
| 45 to 54 Years | 5 (100.0%) | 0 (0.0%) |
| 55 to 59 Years | 1 (100.0%) | 0 (0.0%) |
| 60 to 64 Years | 1 (50.0%) | 0 (0.0%) |
| 65 to 74 Years | 2 (100.0%) | 0 (0.0%) |
| 75 Years and over | 0 (0.0%) | 0 (0.0%) |
| Total | 13 (81.3%) | 0 (0.0%) |
Employment Status by Educational Attainment in Cobden
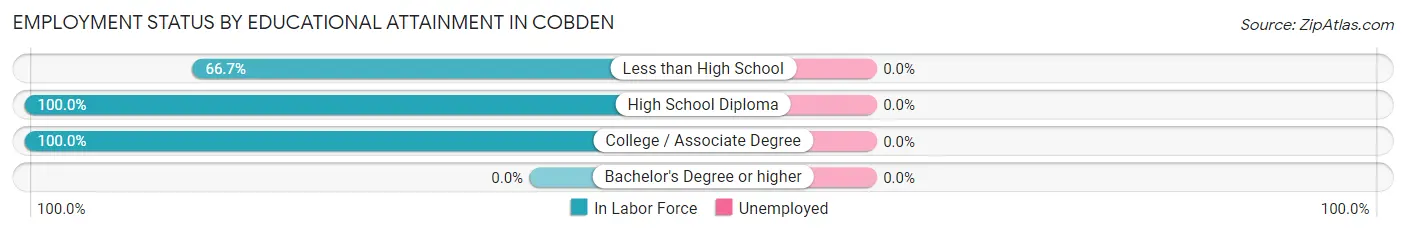
| Educational Attainment | In Labor Force | Unemployed |
| Less than High School | 2 (66.7%) | 0 (0.0%) |
| High School Diploma | 2 (100.0%) | 0 (0.0%) |
| College / Associate Degree | 7 (100.0%) | 0 (0.0%) |
| Bachelor's Degree or higher | 0 (0.0%) | 0 (0.0%) |
| Total | 11 (91.7%) | 0 (0.0%) |
Employment Occupations by Sex in Cobden
Management, Business, Science and Arts Occupations
The most common Management, Business, Science and Arts occupations in Cobden are Computers, Engineering & Science (2 | 15.4%), Life, Physical & Social Science (2 | 15.4%), and Management (1 | 7.7%).
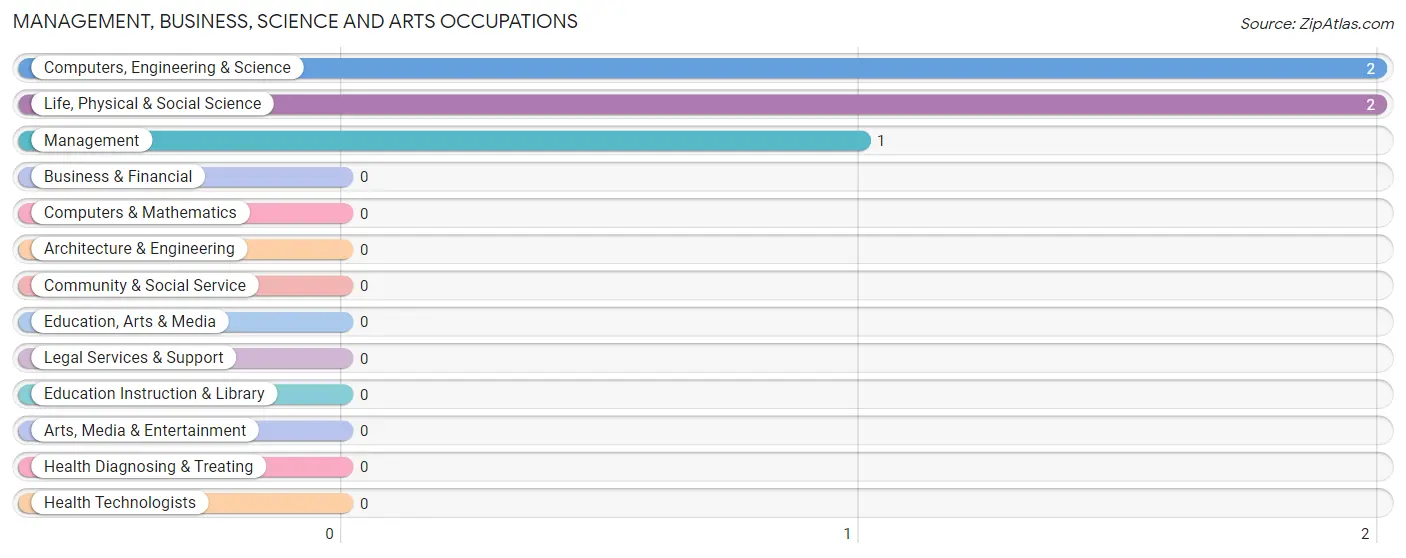
Management, Business, Science and Arts Occupations by Sex
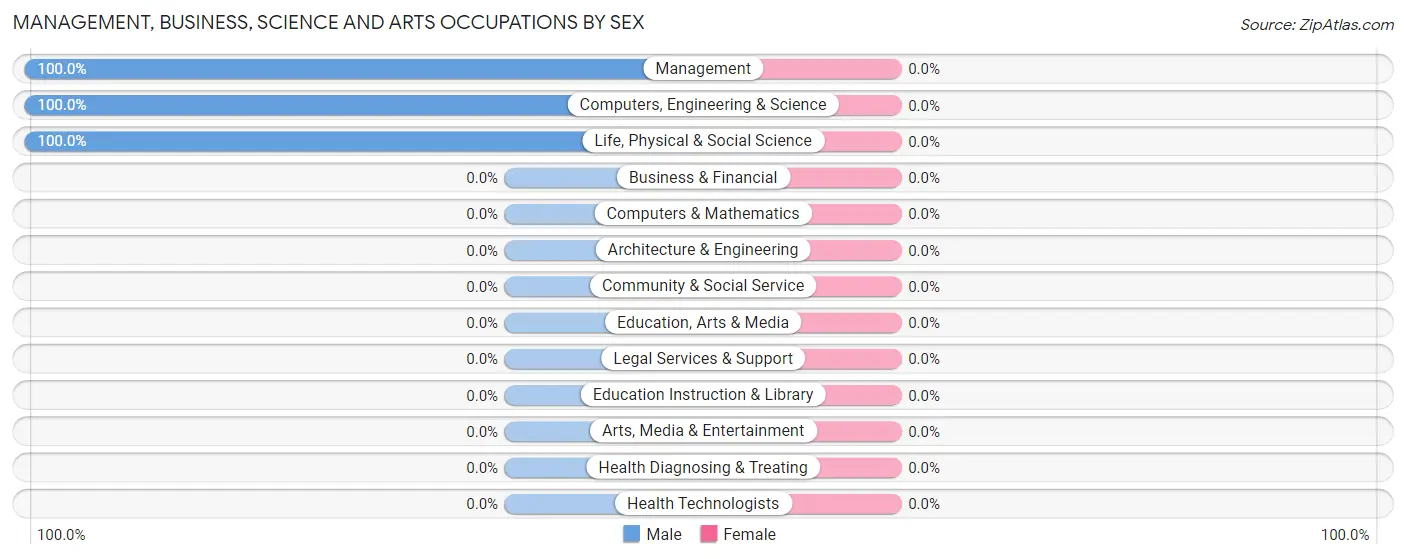
| Occupation | Male | Female |
| Management | 1 (100.0%) | 0 (0.0%) |
| Business & Financial | 0 (0.0%) | 0 (0.0%) |
| Computers, Engineering & Science | 2 (100.0%) | 0 (0.0%) |
| Computers & Mathematics | 0 (0.0%) | 0 (0.0%) |
| Architecture & Engineering | 0 (0.0%) | 0 (0.0%) |
| Life, Physical & Social Science | 2 (100.0%) | 0 (0.0%) |
| Community & Social Service | 0 (0.0%) | 0 (0.0%) |
| Education, Arts & Media | 0 (0.0%) | 0 (0.0%) |
| Legal Services & Support | 0 (0.0%) | 0 (0.0%) |
| Education Instruction & Library | 0 (0.0%) | 0 (0.0%) |
| Arts, Media & Entertainment | 0 (0.0%) | 0 (0.0%) |
| Health Diagnosing & Treating | 0 (0.0%) | 0 (0.0%) |
| Health Technologists | 0 (0.0%) | 0 (0.0%) |
| Total (Category) | 3 (100.0%) | 0 (0.0%) |
| Total (Overall) | 7 (53.8%) | 6 (46.2%) |
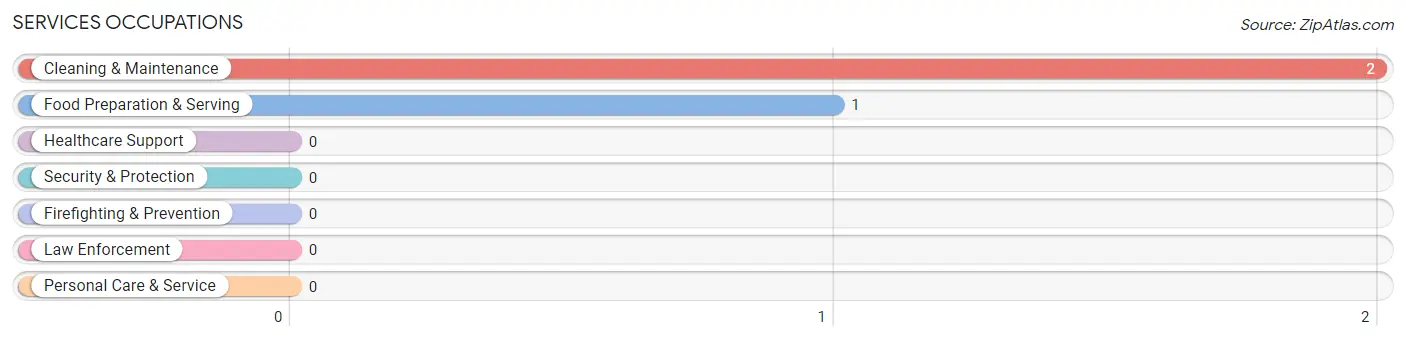
Services Occupations
The most common Services occupations in Cobden are Cleaning & Maintenance (2 | 15.4%), and Food Preparation & Serving (1 | 7.7%).
Services Occupations by Sex
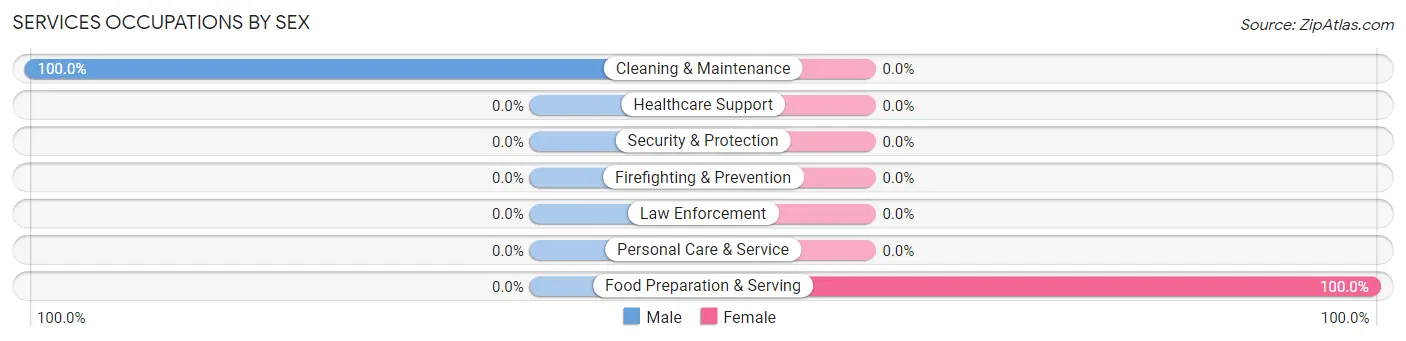
| Occupation | Male | Female |
| Healthcare Support | 0 (0.0%) | 0 (0.0%) |
| Security & Protection | 0 (0.0%) | 0 (0.0%) |
| Firefighting & Prevention | 0 (0.0%) | 0 (0.0%) |
| Law Enforcement | 0 (0.0%) | 0 (0.0%) |
| Food Preparation & Serving | 0 (0.0%) | 1 (100.0%) |
| Cleaning & Maintenance | 2 (100.0%) | 0 (0.0%) |
| Personal Care & Service | 0 (0.0%) | 0 (0.0%) |
| Total (Category) | 2 (66.7%) | 1 (33.3%) |
| Total (Overall) | 7 (53.8%) | 6 (46.2%) |
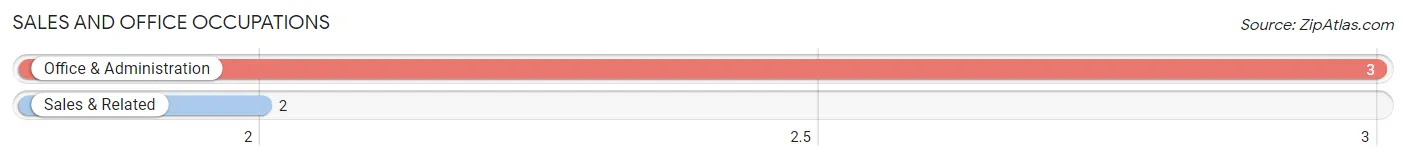
Sales and Office Occupations
The most common Sales and Office occupations in Cobden are Office & Administration (3 | 23.1%), and Sales & Related (2 | 15.4%).
Sales and Office Occupations by Sex
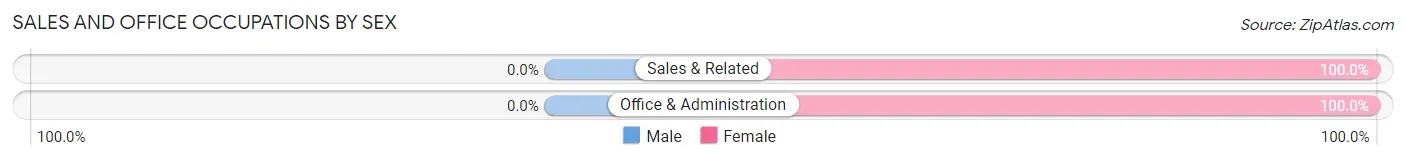
| Occupation | Male | Female |
| Sales & Related | 0 (0.0%) | 2 (100.0%) |
| Office & Administration | 0 (0.0%) | 3 (100.0%) |
| Total (Category) | 0 (0.0%) | 5 (100.0%) |
| Total (Overall) | 7 (53.8%) | 6 (46.2%) |
Natural Resources, Construction and Maintenance Occupations
Natural Resources, Construction and Maintenance Occupations by Sex
| Occupation | Male | Female |
| Farming, Fishing & Forestry | 0 (0.0%) | 0 (0.0%) |
| Construction & Extraction | 0 (0.0%) | 0 (0.0%) |
| Installation, Maintenance & Repair | 0 (0.0%) | 0 (0.0%) |
| Total (Category) | 0 (0.0%) | 0 (0.0%) |
| Total (Overall) | 7 (53.8%) | 6 (46.2%) |
Production, Transportation and Moving Occupations
The most common Production, Transportation and Moving occupations in Cobden are , and Transportation (2 | 15.4%).
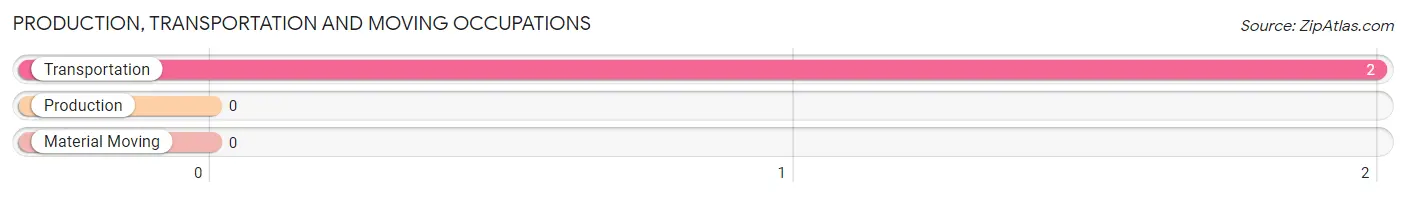
Production, Transportation and Moving Occupations by Sex
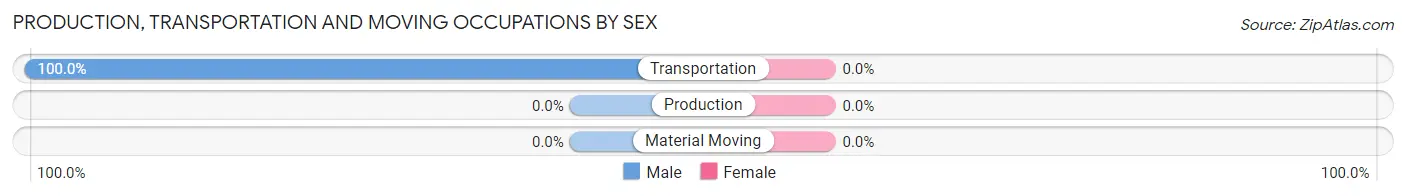
| Occupation | Male | Female |
| Production | 0 (0.0%) | 0 (0.0%) |
| Transportation | 2 (100.0%) | 0 (0.0%) |
| Material Moving | 0 (0.0%) | 0 (0.0%) |
| Total (Category) | 2 (100.0%) | 0 (0.0%) |
| Total (Overall) | 7 (53.8%) | 6 (46.2%) |
Employment Industries by Sex in Cobden
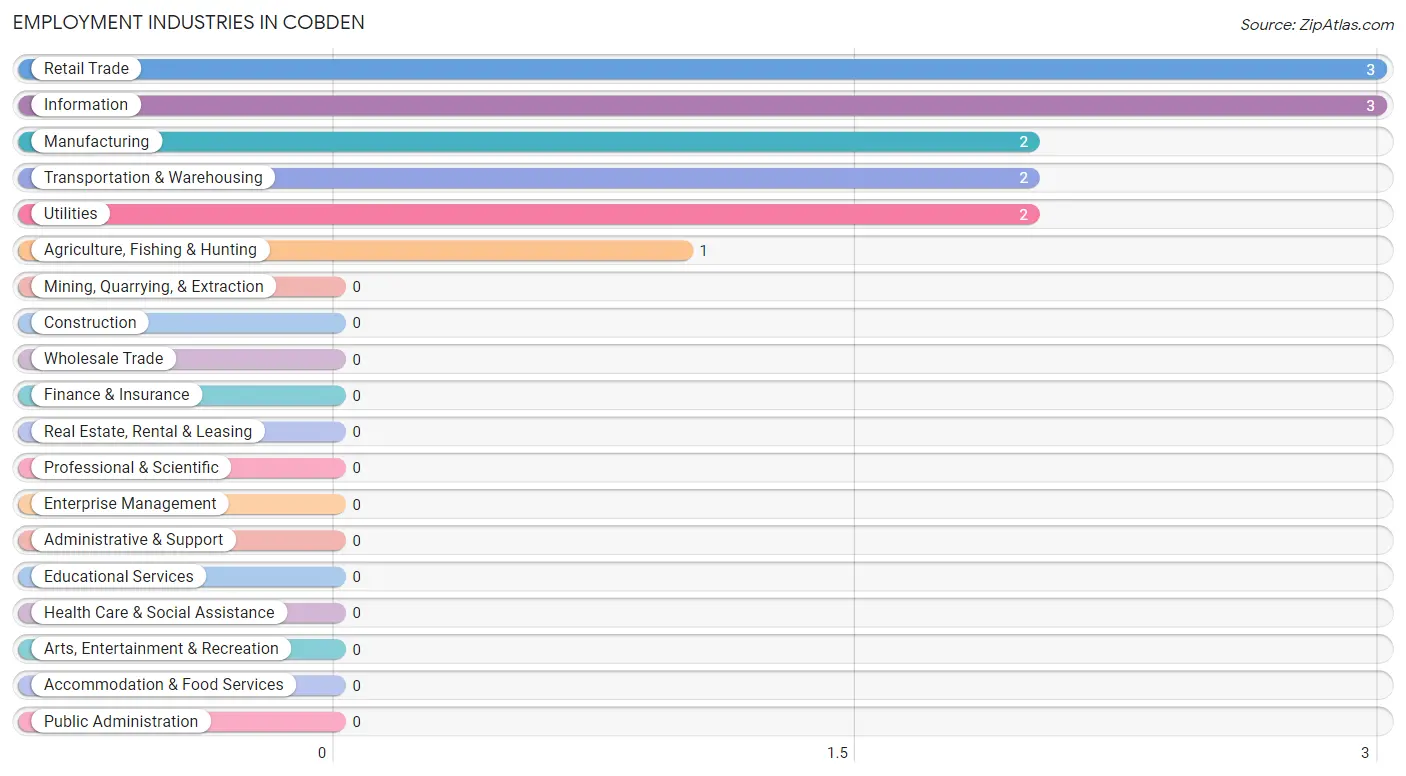
Employment Industries in Cobden
The major employment industries in Cobden include Retail Trade (3 | 23.1%), Information (3 | 23.1%), Manufacturing (2 | 15.4%), Transportation & Warehousing (2 | 15.4%), and Utilities (2 | 15.4%).
Employment Industries by Sex in Cobden
The Cobden industries that see more men than women are Agriculture, Fishing & Hunting (100.0%), Manufacturing (100.0%), and Transportation & Warehousing (100.0%), whereas the industries that tend to have a higher number of women are Retail Trade (100.0%), and Information (100.0%).
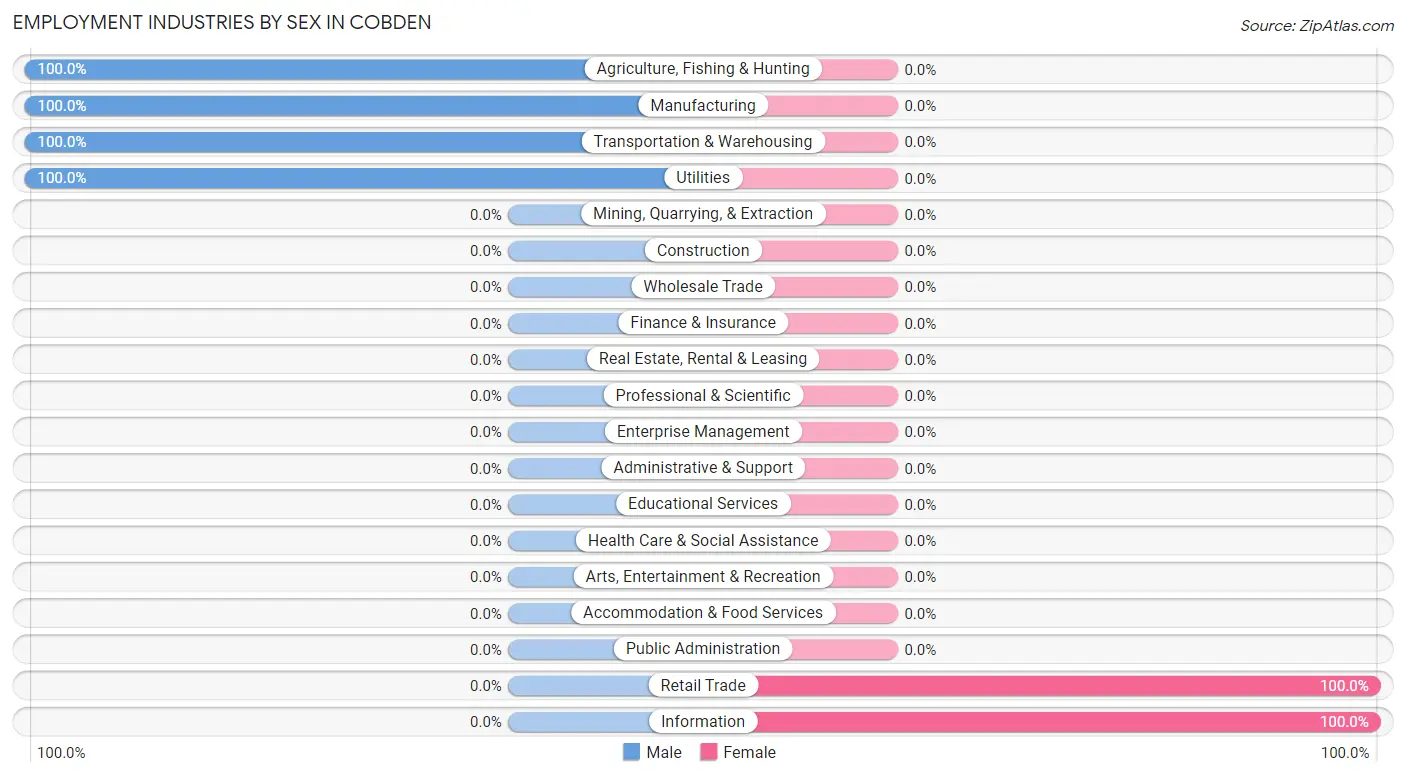
| Industry | Male | Female |
| Agriculture, Fishing & Hunting | 1 (100.0%) | 0 (0.0%) |
| Mining, Quarrying, & Extraction | 0 (0.0%) | 0 (0.0%) |
| Construction | 0 (0.0%) | 0 (0.0%) |
| Manufacturing | 2 (100.0%) | 0 (0.0%) |
| Wholesale Trade | 0 (0.0%) | 0 (0.0%) |
| Retail Trade | 0 (0.0%) | 3 (100.0%) |
| Transportation & Warehousing | 2 (100.0%) | 0 (0.0%) |
| Utilities | 2 (100.0%) | 0 (0.0%) |
| Information | 0 (0.0%) | 3 (100.0%) |
| Finance & Insurance | 0 (0.0%) | 0 (0.0%) |
| Real Estate, Rental & Leasing | 0 (0.0%) | 0 (0.0%) |
| Professional & Scientific | 0 (0.0%) | 0 (0.0%) |
| Enterprise Management | 0 (0.0%) | 0 (0.0%) |
| Administrative & Support | 0 (0.0%) | 0 (0.0%) |
| Educational Services | 0 (0.0%) | 0 (0.0%) |
| Health Care & Social Assistance | 0 (0.0%) | 0 (0.0%) |
| Arts, Entertainment & Recreation | 0 (0.0%) | 0 (0.0%) |
| Accommodation & Food Services | 0 (0.0%) | 0 (0.0%) |
| Public Administration | 0 (0.0%) | 0 (0.0%) |
| Total | 7 (53.8%) | 6 (46.2%) |
Education in Cobden
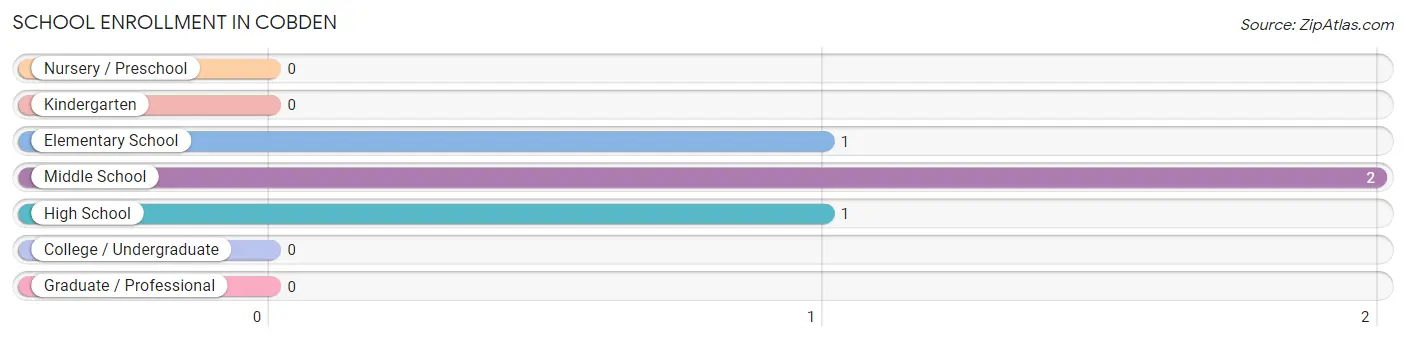
School Enrollment in Cobden
The most common levels of schooling among the 4 students in Cobden are middle school (2 | 50.0%), elementary school (1 | 25.0%), and high school (1 | 25.0%).
| School Level | # Students | % Students |
| Nursery / Preschool | 0 | 0.0% |
| Kindergarten | 0 | 0.0% |
| Elementary School | 1 | 25.0% |
| Middle School | 2 | 50.0% |
| High School | 1 | 25.0% |
| College / Undergraduate | 0 | 0.0% |
| Graduate / Professional | 0 | 0.0% |
| Total | 4 | 100.0% |
School Enrollment by Age by Funding Source in Cobden
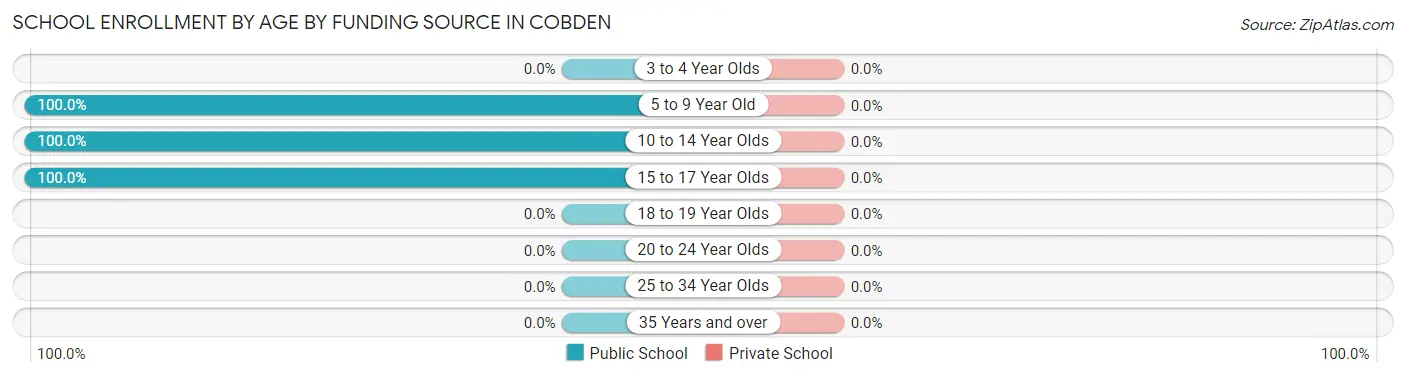
| Age Bracket | Public School | Private School |
| 3 to 4 Year Olds | 0 (0.0%) | 0 (0.0%) |
| 5 to 9 Year Old | 1 (100.0%) | 0 (0.0%) |
| 10 to 14 Year Olds | 2 (100.0%) | 0 (0.0%) |
| 15 to 17 Year Olds | 1 (100.0%) | 0 (0.0%) |
| 18 to 19 Year Olds | 0 (0.0%) | 0 (0.0%) |
| 20 to 24 Year Olds | 0 (0.0%) | 0 (0.0%) |
| 25 to 34 Year Olds | 0 (0.0%) | 0 (0.0%) |
| 35 Years and over | 0 (0.0%) | 0 (0.0%) |
| Total | 4 (100.0%) | 0 (0.0%) |
Educational Attainment by Field of Study in Cobden
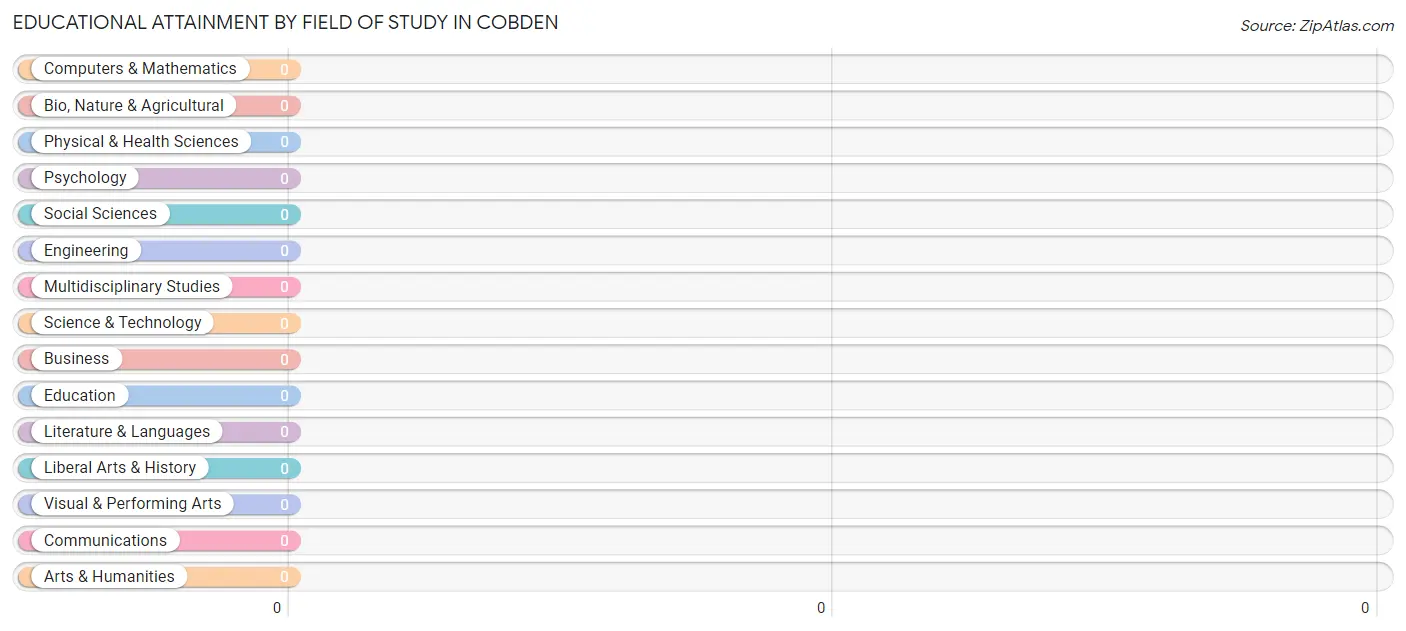
| Field of Study | # Graduates | % Graduates |
| Computers & Mathematics | 0 | 0.0% |
| Bio, Nature & Agricultural | 0 | 0.0% |
| Physical & Health Sciences | 0 | 0.0% |
| Psychology | 0 | 0.0% |
| Social Sciences | 0 | 0.0% |
| Engineering | 0 | 0.0% |
| Multidisciplinary Studies | 0 | 0.0% |
| Science & Technology | 0 | 0.0% |
| Business | 0 | 0.0% |
| Education | 0 | 0.0% |
| Literature & Languages | 0 | 0.0% |
| Liberal Arts & History | 0 | 0.0% |
| Visual & Performing Arts | 0 | 0.0% |
| Communications | 0 | 0.0% |
| Arts & Humanities | 0 | 0.0% |
| Total | 0 | 0.0% |
Transportation & Commute in Cobden
Vehicle Availability by Sex in Cobden
The most prevalent vehicle ownership categories in Cobden are males with 2 vehicles (4, accounting for 57.1%) and females with 2 vehicles (4, making up 66.7%).
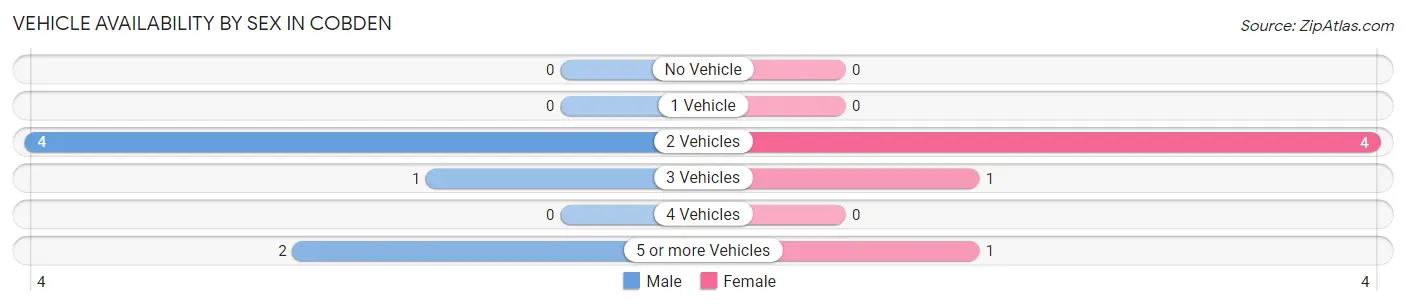
| Vehicles Available | Male | Female |
| No Vehicle | 0 (0.0%) | 0 (0.0%) |
| 1 Vehicle | 0 (0.0%) | 0 (0.0%) |
| 2 Vehicles | 4 (57.1%) | 4 (66.7%) |
| 3 Vehicles | 1 (14.3%) | 1 (16.7%) |
| 4 Vehicles | 0 (0.0%) | 0 (0.0%) |
| 5 or more Vehicles | 2 (28.6%) | 1 (16.7%) |
| Total | 7 (100.0%) | 6 (100.0%) |
Commute Time in Cobden
The most frequently occuring commute durations in Cobden are 10 to 14 minutes (5 commuters, 50.0%), 15 to 19 minutes (3 commuters, 30.0%), and 5 to 9 minutes (1 commuters, 10.0%).
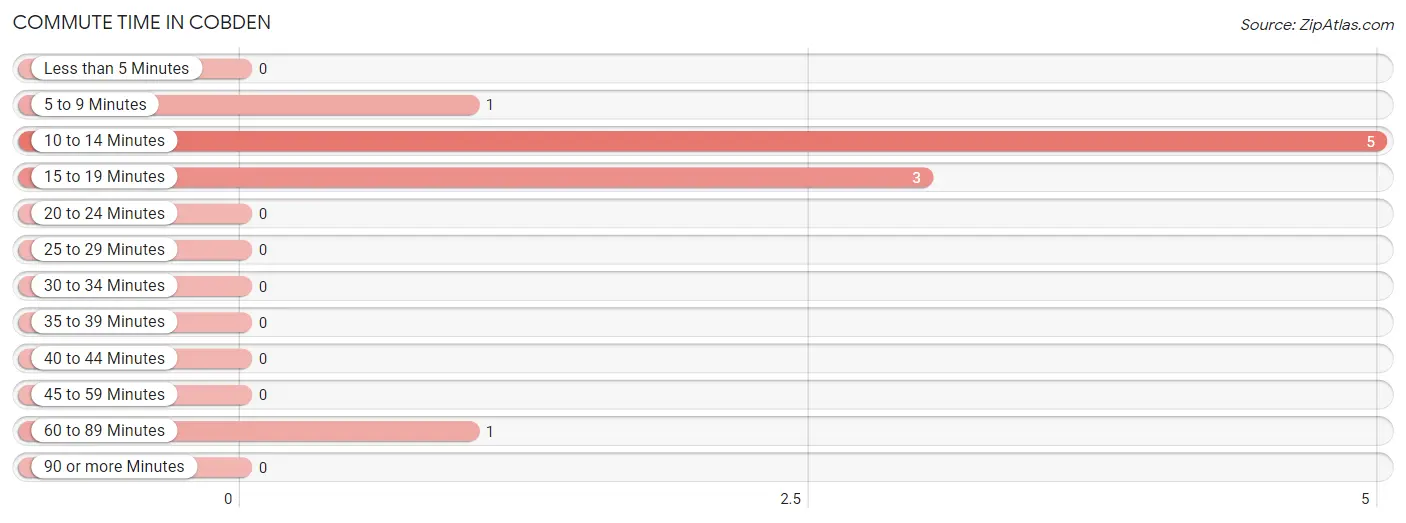
| Commute Time | # Commuters | % Commuters |
| Less than 5 Minutes | 0 | 0.0% |
| 5 to 9 Minutes | 1 | 10.0% |
| 10 to 14 Minutes | 5 | 50.0% |
| 15 to 19 Minutes | 3 | 30.0% |
| 20 to 24 Minutes | 0 | 0.0% |
| 25 to 29 Minutes | 0 | 0.0% |
| 30 to 34 Minutes | 0 | 0.0% |
| 35 to 39 Minutes | 0 | 0.0% |
| 40 to 44 Minutes | 0 | 0.0% |
| 45 to 59 Minutes | 0 | 0.0% |
| 60 to 89 Minutes | 1 | 10.0% |
| 90 or more Minutes | 0 | 0.0% |
Commute Time by Sex in Cobden
The most common commute times in Cobden are 10 to 14 minutes (4 commuters, 57.1%) for males and 5 to 9 minutes (1 commuters, 33.3%) for females.
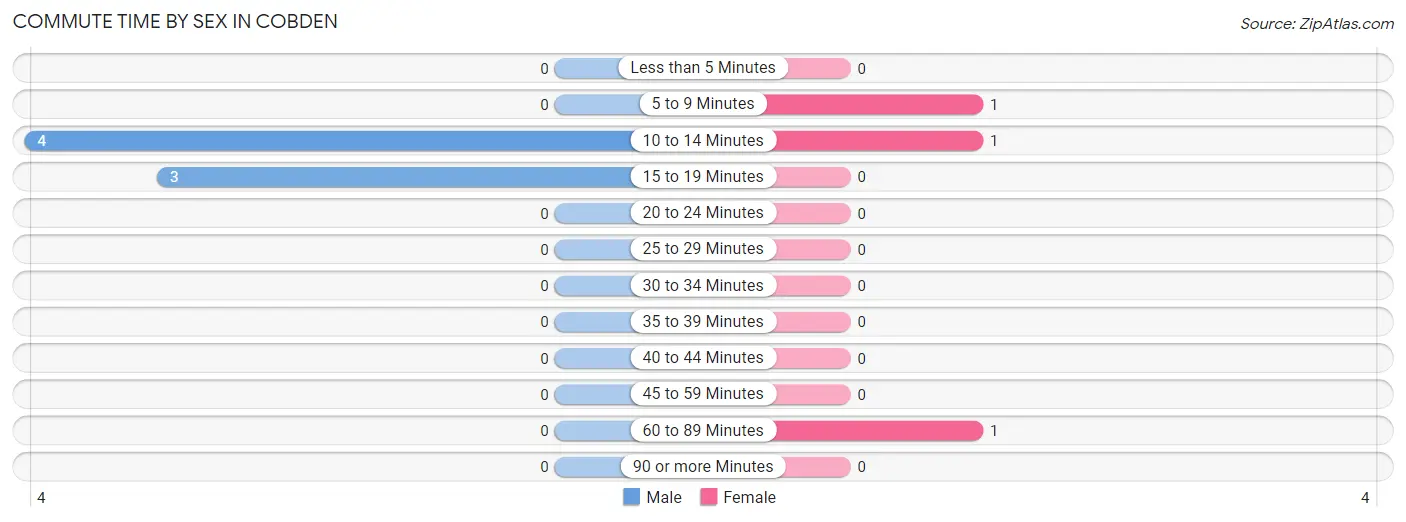
| Commute Time | Male | Female |
| Less than 5 Minutes | 0 (0.0%) | 0 (0.0%) |
| 5 to 9 Minutes | 0 (0.0%) | 1 (33.3%) |
| 10 to 14 Minutes | 4 (57.1%) | 1 (33.3%) |
| 15 to 19 Minutes | 3 (42.9%) | 0 (0.0%) |
| 20 to 24 Minutes | 0 (0.0%) | 0 (0.0%) |
| 25 to 29 Minutes | 0 (0.0%) | 0 (0.0%) |
| 30 to 34 Minutes | 0 (0.0%) | 0 (0.0%) |
| 35 to 39 Minutes | 0 (0.0%) | 0 (0.0%) |
| 40 to 44 Minutes | 0 (0.0%) | 0 (0.0%) |
| 45 to 59 Minutes | 0 (0.0%) | 0 (0.0%) |
| 60 to 89 Minutes | 0 (0.0%) | 1 (33.3%) |
| 90 or more Minutes | 0 (0.0%) | 0 (0.0%) |
Time of Departure to Work by Sex in Cobden
The most frequent times of departure to work in Cobden are 6:00 AM to 6:29 AM (4, 57.1%) for males and 5:00 AM to 5:29 AM (1, 33.3%) for females.
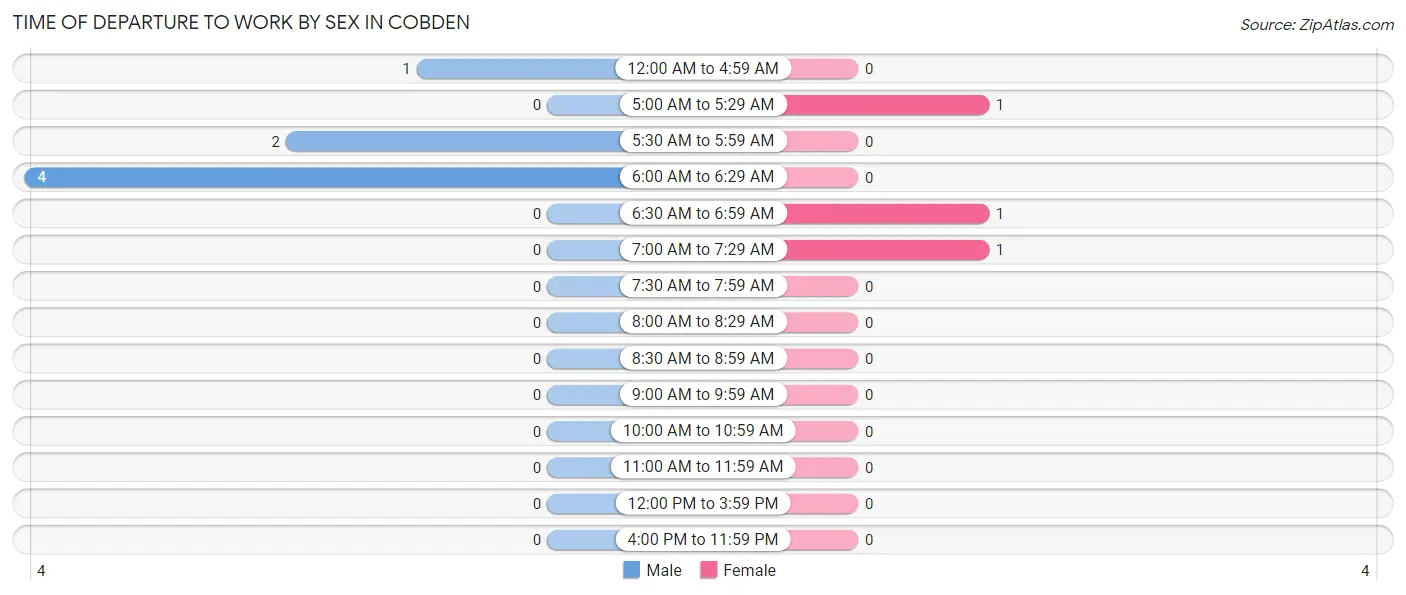
| Time of Departure | Male | Female |
| 12:00 AM to 4:59 AM | 1 (14.3%) | 0 (0.0%) |
| 5:00 AM to 5:29 AM | 0 (0.0%) | 1 (33.3%) |
| 5:30 AM to 5:59 AM | 2 (28.6%) | 0 (0.0%) |
| 6:00 AM to 6:29 AM | 4 (57.1%) | 0 (0.0%) |
| 6:30 AM to 6:59 AM | 0 (0.0%) | 1 (33.3%) |
| 7:00 AM to 7:29 AM | 0 (0.0%) | 1 (33.3%) |
| 7:30 AM to 7:59 AM | 0 (0.0%) | 0 (0.0%) |
| 8:00 AM to 8:29 AM | 0 (0.0%) | 0 (0.0%) |
| 8:30 AM to 8:59 AM | 0 (0.0%) | 0 (0.0%) |
| 9:00 AM to 9:59 AM | 0 (0.0%) | 0 (0.0%) |
| 10:00 AM to 10:59 AM | 0 (0.0%) | 0 (0.0%) |
| 11:00 AM to 11:59 AM | 0 (0.0%) | 0 (0.0%) |
| 12:00 PM to 3:59 PM | 0 (0.0%) | 0 (0.0%) |
| 4:00 PM to 11:59 PM | 0 (0.0%) | 0 (0.0%) |
| Total | 7 (100.0%) | 3 (100.0%) |
Housing Occupancy in Cobden
Occupancy by Ownership in Cobden
Of the total 9 dwellings in Cobden, owner-occupied units account for 8 (88.9%), while renter-occupied units make up 1 (11.1%).
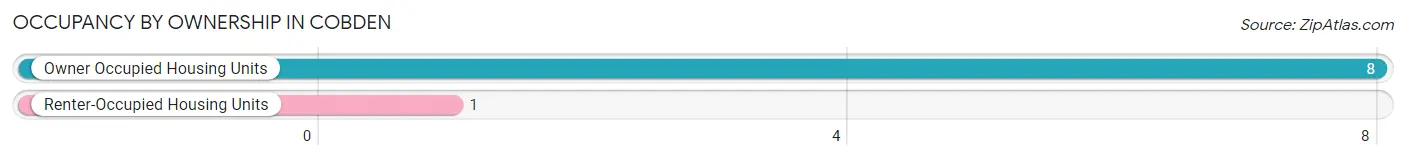
| Occupancy | # Housing Units | % Housing Units |
| Owner Occupied Housing Units | 8 | 88.9% |
| Renter-Occupied Housing Units | 1 | 11.1% |
| Total Occupied Housing Units | 9 | 100.0% |
Occupancy by Household Size in Cobden
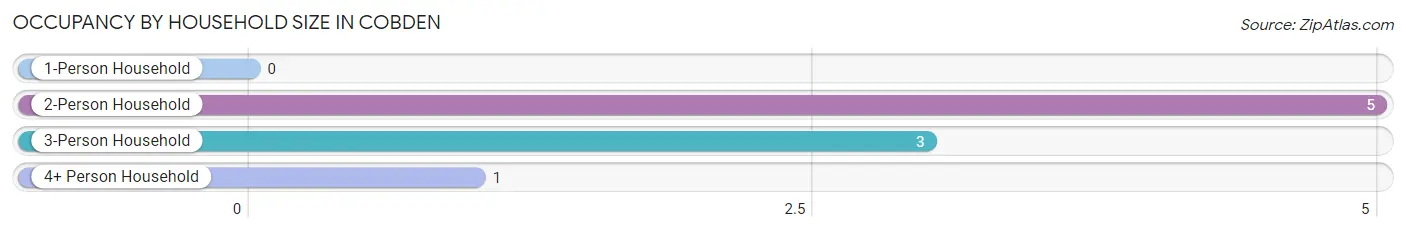
| Household Size | # Housing Units | % Housing Units |
| 1-Person Household | 0 | 0.0% |
| 2-Person Household | 5 | 55.6% |
| 3-Person Household | 3 | 33.3% |
| 4+ Person Household | 1 | 11.1% |
| Total Housing Units | 9 | 100.0% |
Occupancy by Ownership by Household Size in Cobden
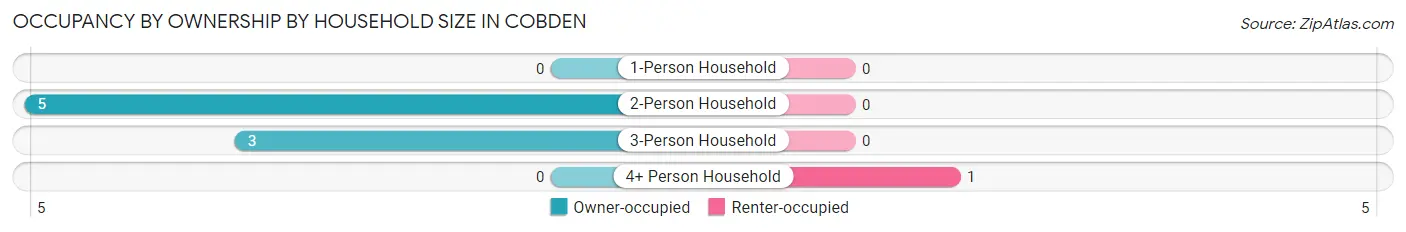
| Household Size | Owner-occupied | Renter-occupied |
| 1-Person Household | 0 (0.0%) | 0 (0.0%) |
| 2-Person Household | 5 (100.0%) | 0 (0.0%) |
| 3-Person Household | 3 (100.0%) | 0 (0.0%) |
| 4+ Person Household | 0 (0.0%) | 1 (100.0%) |
| Total Housing Units | 8 (88.9%) | 1 (11.1%) |
Occupancy by Educational Attainment in Cobden
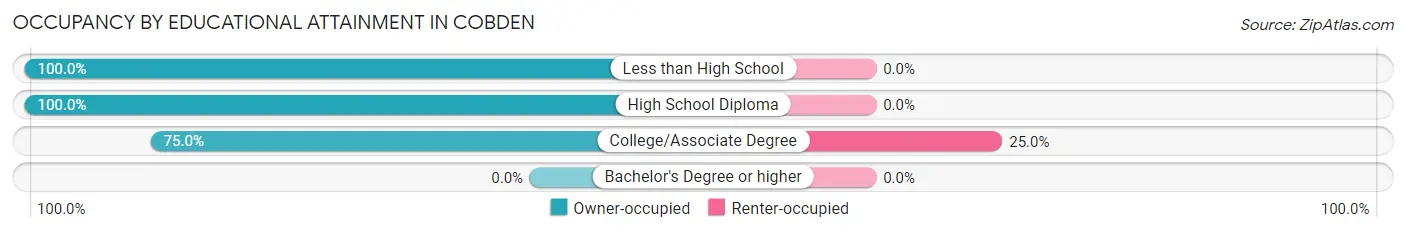
| Household Size | Owner-occupied | Renter-occupied |
| Less than High School | 3 (100.0%) | 0 (0.0%) |
| High School Diploma | 2 (100.0%) | 0 (0.0%) |
| College/Associate Degree | 3 (75.0%) | 1 (25.0%) |
| Bachelor's Degree or higher | 0 (0.0%) | 0 (0.0%) |
Occupancy by Age of Householder in Cobden
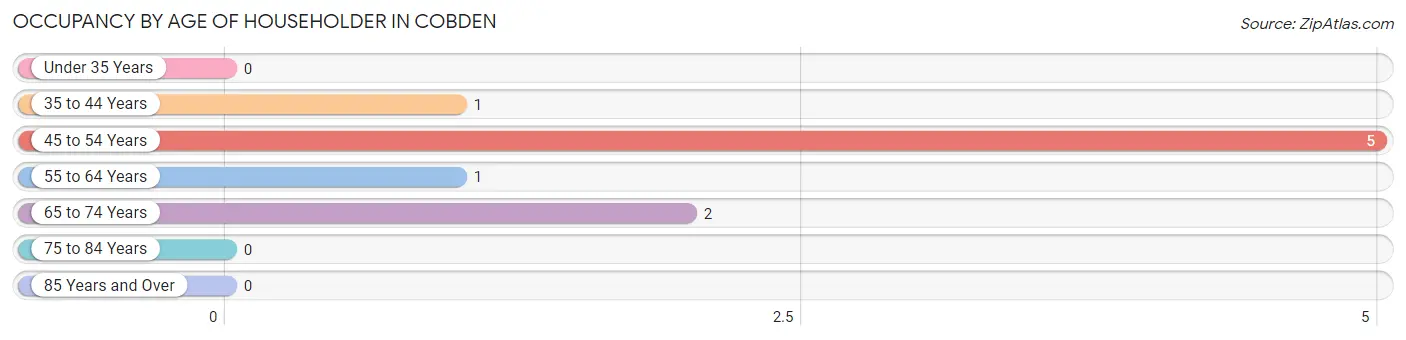
| Age Bracket | # Households | % Households |
| Under 35 Years | 0 | 0.0% |
| 35 to 44 Years | 1 | 11.1% |
| 45 to 54 Years | 5 | 55.6% |
| 55 to 64 Years | 1 | 11.1% |
| 65 to 74 Years | 2 | 22.2% |
| 75 to 84 Years | 0 | 0.0% |
| 85 Years and Over | 0 | 0.0% |
| Total | 9 | 100.0% |
Housing Finances in Cobden
Median Income by Occupancy in Cobden
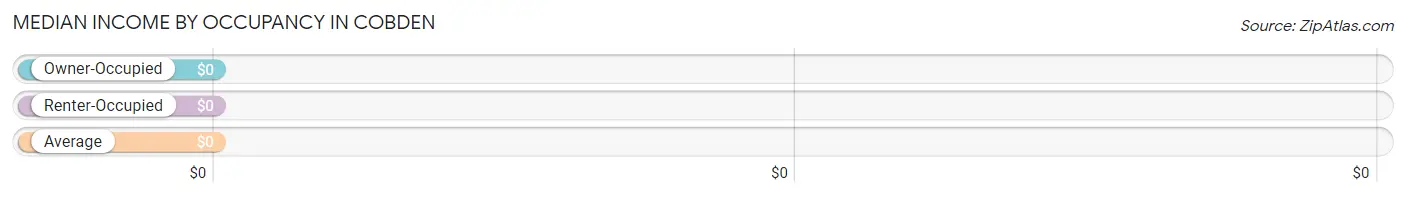
| Occupancy Type | # Households | Median Income |
| Owner-Occupied | 8 (88.9%) | $0 |
| Renter-Occupied | 1 (11.1%) | $0 |
| Average | 9 (100.0%) | $0 |
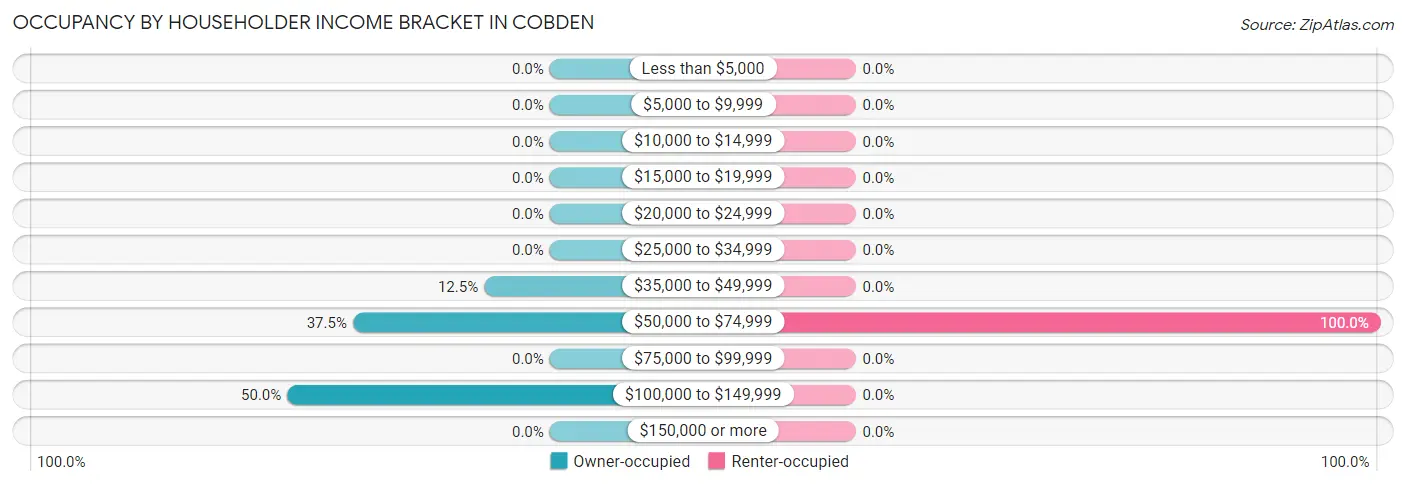
Occupancy by Householder Income Bracket in Cobden
| Income Bracket | Owner-occupied | Renter-occupied |
| Less than $5,000 | 0 (0.0%) | 0 (0.0%) |
| $5,000 to $9,999 | 0 (0.0%) | 0 (0.0%) |
| $10,000 to $14,999 | 0 (0.0%) | 0 (0.0%) |
| $15,000 to $19,999 | 0 (0.0%) | 0 (0.0%) |
| $20,000 to $24,999 | 0 (0.0%) | 0 (0.0%) |
| $25,000 to $34,999 | 0 (0.0%) | 0 (0.0%) |
| $35,000 to $49,999 | 1 (12.5%) | 0 (0.0%) |
| $50,000 to $74,999 | 3 (37.5%) | 1 (100.0%) |
| $75,000 to $99,999 | 0 (0.0%) | 0 (0.0%) |
| $100,000 to $149,999 | 4 (50.0%) | 0 (0.0%) |
| $150,000 or more | 0 (0.0%) | 0 (0.0%) |
| Total | 8 (100.0%) | 1 (100.0%) |
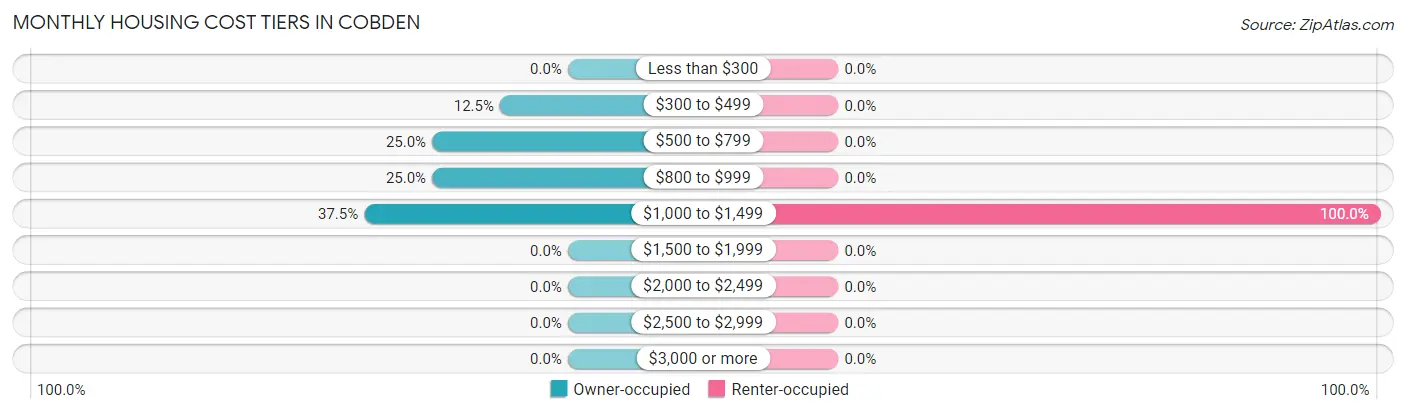
Monthly Housing Cost Tiers in Cobden
| Monthly Cost | Owner-occupied | Renter-occupied |
| Less than $300 | 0 (0.0%) | 0 (0.0%) |
| $300 to $499 | 1 (12.5%) | 0 (0.0%) |
| $500 to $799 | 2 (25.0%) | 0 (0.0%) |
| $800 to $999 | 2 (25.0%) | 0 (0.0%) |
| $1,000 to $1,499 | 3 (37.5%) | 1 (100.0%) |
| $1,500 to $1,999 | 0 (0.0%) | 0 (0.0%) |
| $2,000 to $2,499 | 0 (0.0%) | 0 (0.0%) |
| $2,500 to $2,999 | 0 (0.0%) | 0 (0.0%) |
| $3,000 or more | 0 (0.0%) | 0 (0.0%) |
| Total | 8 (100.0%) | 1 (100.0%) |
Physical Housing Characteristics in Cobden
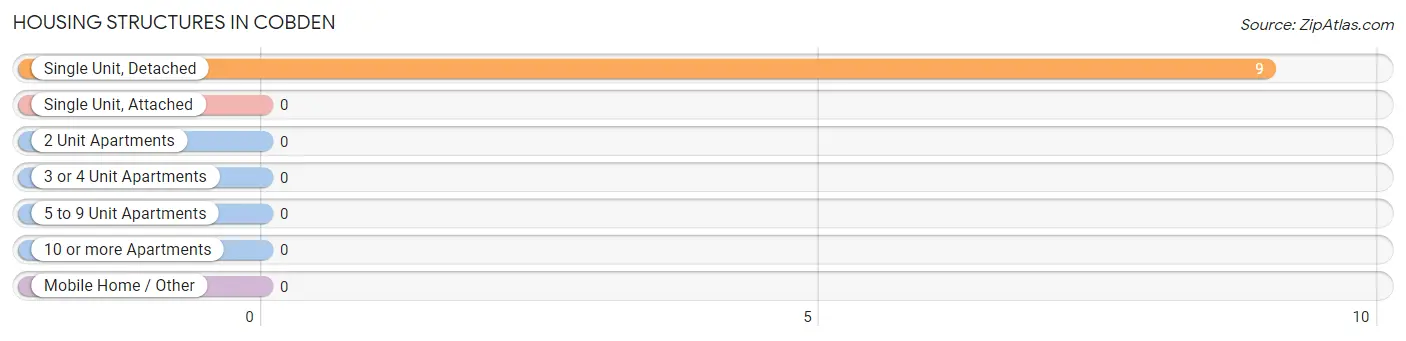
Housing Structures in Cobden
| Structure Type | # Housing Units | % Housing Units |
| Single Unit, Detached | 9 | 100.0% |
| Single Unit, Attached | 0 | 0.0% |
| 2 Unit Apartments | 0 | 0.0% |
| 3 or 4 Unit Apartments | 0 | 0.0% |
| 5 to 9 Unit Apartments | 0 | 0.0% |
| 10 or more Apartments | 0 | 0.0% |
| Mobile Home / Other | 0 | 0.0% |
| Total | 9 | 100.0% |
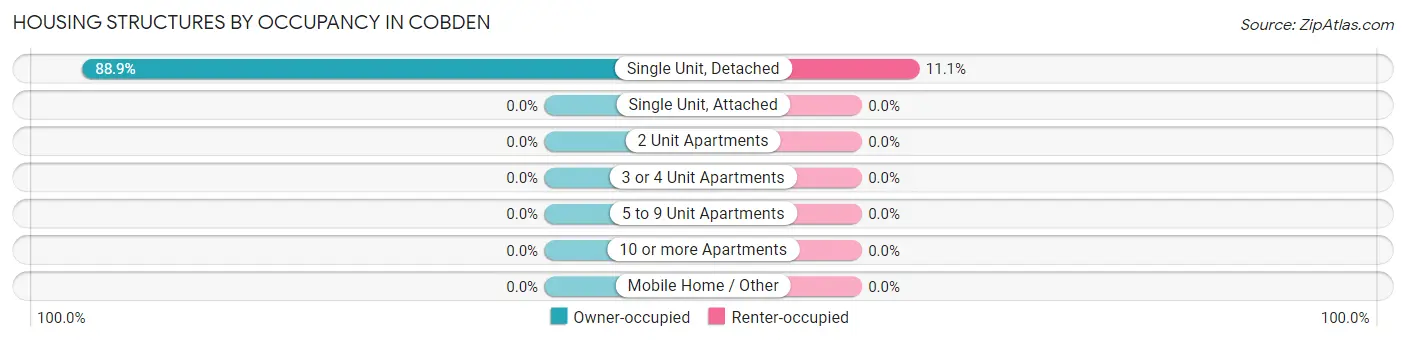
Housing Structures by Occupancy in Cobden
| Structure Type | Owner-occupied | Renter-occupied |
| Single Unit, Detached | 8 (88.9%) | 1 (11.1%) |
| Single Unit, Attached | 0 (0.0%) | 0 (0.0%) |
| 2 Unit Apartments | 0 (0.0%) | 0 (0.0%) |
| 3 or 4 Unit Apartments | 0 (0.0%) | 0 (0.0%) |
| 5 to 9 Unit Apartments | 0 (0.0%) | 0 (0.0%) |
| 10 or more Apartments | 0 (0.0%) | 0 (0.0%) |
| Mobile Home / Other | 0 (0.0%) | 0 (0.0%) |
| Total | 8 (88.9%) | 1 (11.1%) |
Housing Structures by Number of Rooms in Cobden
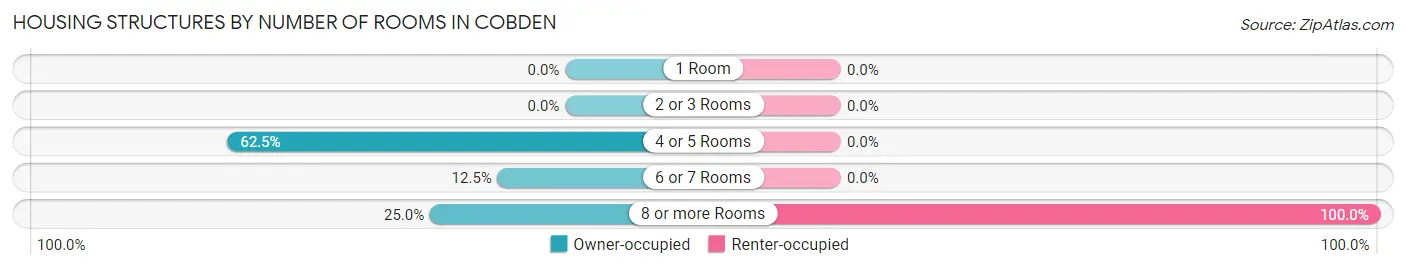
| Number of Rooms | Owner-occupied | Renter-occupied |
| 1 Room | 0 (0.0%) | 0 (0.0%) |
| 2 or 3 Rooms | 0 (0.0%) | 0 (0.0%) |
| 4 or 5 Rooms | 5 (62.5%) | 0 (0.0%) |
| 6 or 7 Rooms | 1 (12.5%) | 0 (0.0%) |
| 8 or more Rooms | 2 (25.0%) | 1 (100.0%) |
| Total | 8 (100.0%) | 1 (100.0%) |
Housing Structure by Heating Type in Cobden
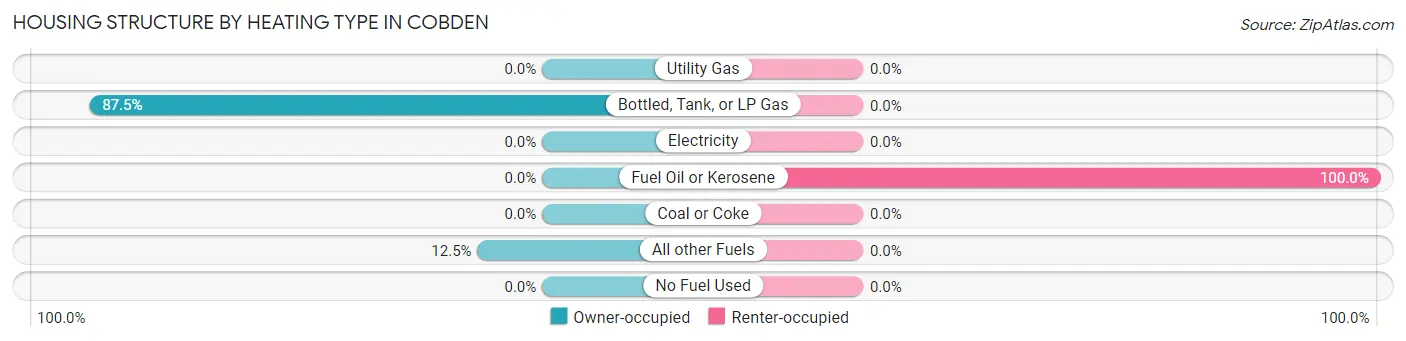
| Heating Type | Owner-occupied | Renter-occupied |
| Utility Gas | 0 (0.0%) | 0 (0.0%) |
| Bottled, Tank, or LP Gas | 7 (87.5%) | 0 (0.0%) |
| Electricity | 0 (0.0%) | 0 (0.0%) |
| Fuel Oil or Kerosene | 0 (0.0%) | 1 (100.0%) |
| Coal or Coke | 0 (0.0%) | 0 (0.0%) |
| All other Fuels | 1 (12.5%) | 0 (0.0%) |
| No Fuel Used | 0 (0.0%) | 0 (0.0%) |
| Total | 8 (100.0%) | 1 (100.0%) |
Household Vehicle Usage in Cobden
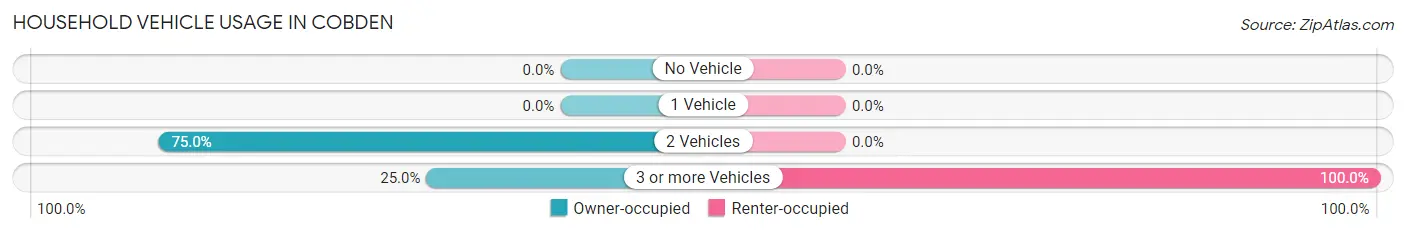
| Vehicles per Household | Owner-occupied | Renter-occupied |
| No Vehicle | 0 (0.0%) | 0 (0.0%) |
| 1 Vehicle | 0 (0.0%) | 0 (0.0%) |
| 2 Vehicles | 6 (75.0%) | 0 (0.0%) |
| 3 or more Vehicles | 2 (25.0%) | 1 (100.0%) |
| Total | 8 (100.0%) | 1 (100.0%) |
Real Estate & Mortgages in Cobden
Real Estate and Mortgage Overview in Cobden
| Characteristic | Without Mortgage | With Mortgage |
| Housing Units | 3 | 5 |
| Median Property Value | - | - |
| Median Household Income | - | - |
| Monthly Housing Costs | - | - |
| Real Estate Taxes | - | - |
Property Value by Mortgage Status in Cobden
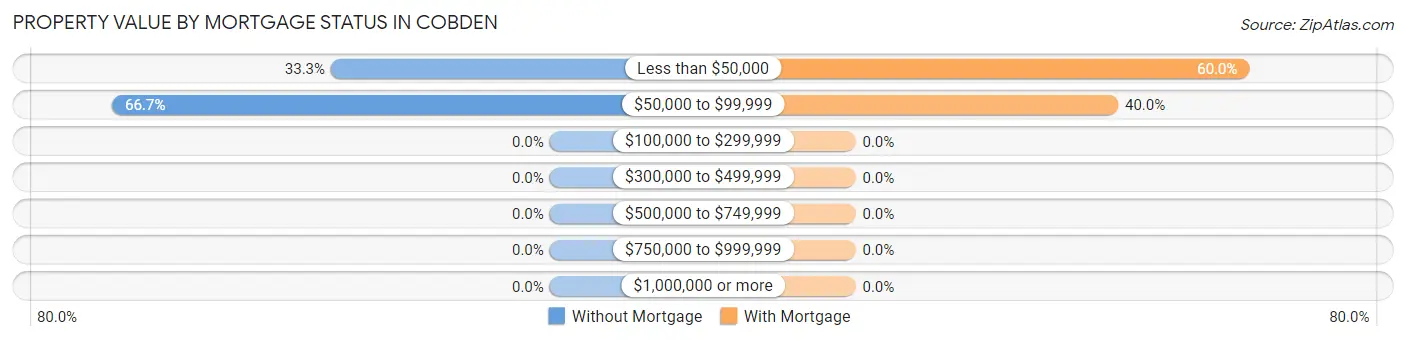
| Property Value | Without Mortgage | With Mortgage |
| Less than $50,000 | 1 (33.3%) | 3 (60.0%) |
| $50,000 to $99,999 | 2 (66.7%) | 2 (40.0%) |
| $100,000 to $299,999 | 0 (0.0%) | 0 (0.0%) |
| $300,000 to $499,999 | 0 (0.0%) | 0 (0.0%) |
| $500,000 to $749,999 | 0 (0.0%) | 0 (0.0%) |
| $750,000 to $999,999 | 0 (0.0%) | 0 (0.0%) |
| $1,000,000 or more | 0 (0.0%) | 0 (0.0%) |
| Total | 3 (100.0%) | 5 (100.0%) |
Household Income by Mortgage Status in Cobden
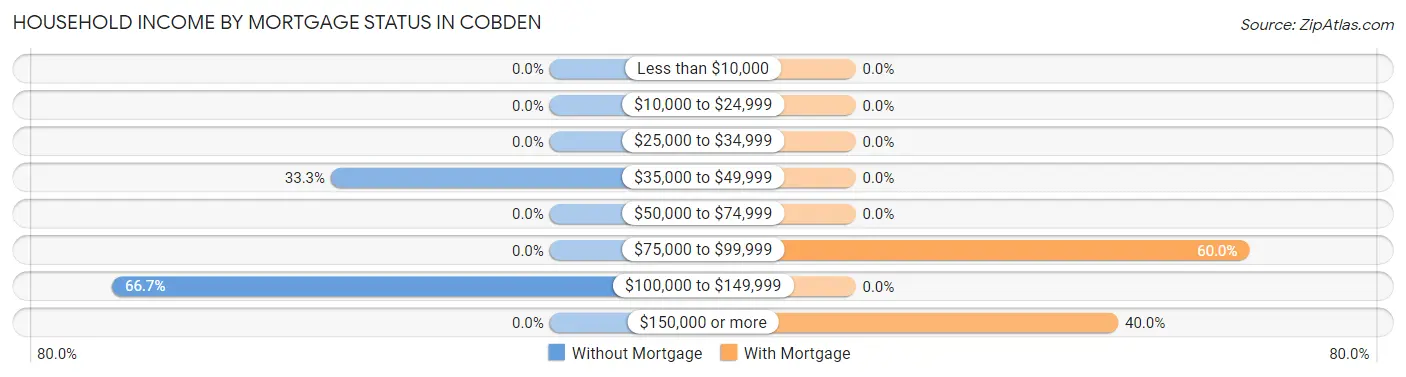
| Household Income | Without Mortgage | With Mortgage |
| Less than $10,000 | 0 (0.0%) | 0 (0.0%) |
| $10,000 to $24,999 | 0 (0.0%) | 0 (0.0%) |
| $25,000 to $34,999 | 0 (0.0%) | 0 (0.0%) |
| $35,000 to $49,999 | 1 (33.3%) | 0 (0.0%) |
| $50,000 to $74,999 | 0 (0.0%) | 0 (0.0%) |
| $75,000 to $99,999 | 0 (0.0%) | 3 (60.0%) |
| $100,000 to $149,999 | 2 (66.7%) | 0 (0.0%) |
| $150,000 or more | 0 (0.0%) | 2 (40.0%) |
| Total | 3 (100.0%) | 5 (100.0%) |
Property Value to Household Income Ratio in Cobden
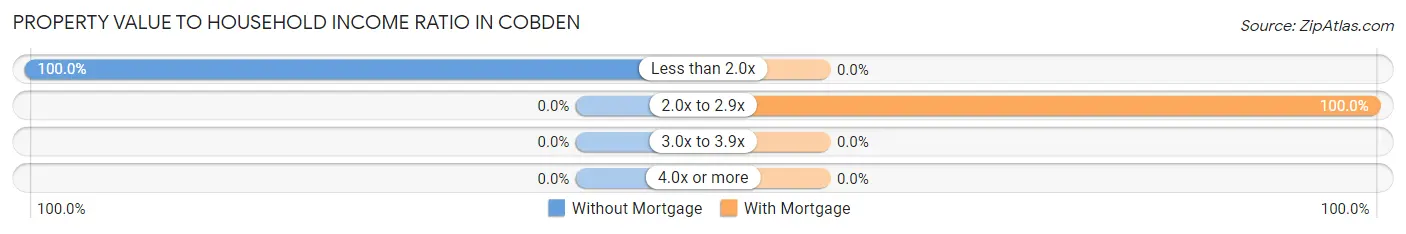
| Value-to-Income Ratio | Without Mortgage | With Mortgage |
| Less than 2.0x | 3 (100.0%) | 0 (0.0%) |
| 2.0x to 2.9x | 0 (0.0%) | 5 (100.0%) |
| 3.0x to 3.9x | 0 (0.0%) | 0 (0.0%) |
| 4.0x or more | 0 (0.0%) | 0 (0.0%) |
| Total | 3 (100.0%) | 5 (100.0%) |
Real Estate Taxes by Mortgage Status in Cobden
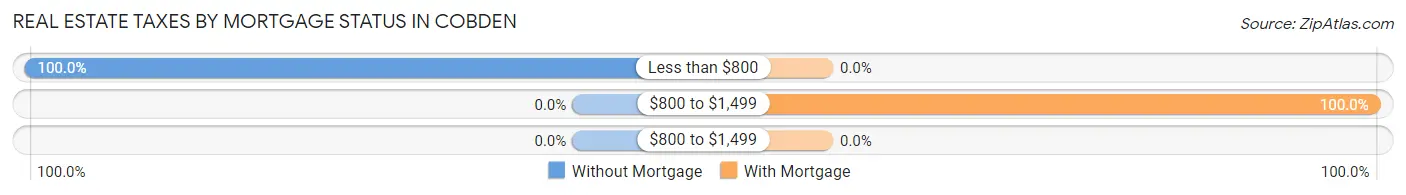
| Property Taxes | Without Mortgage | With Mortgage |
| Less than $800 | 3 (100.0%) | 0 (0.0%) |
| $800 to $1,499 | 0 (0.0%) | 5 (100.0%) |
| $800 to $1,499 | 0 (0.0%) | 0 (0.0%) |
| Total | 3 (100.0%) | 5 (100.0%) |
Health & Disability in Cobden
Health Insurance Coverage by Age in Cobden
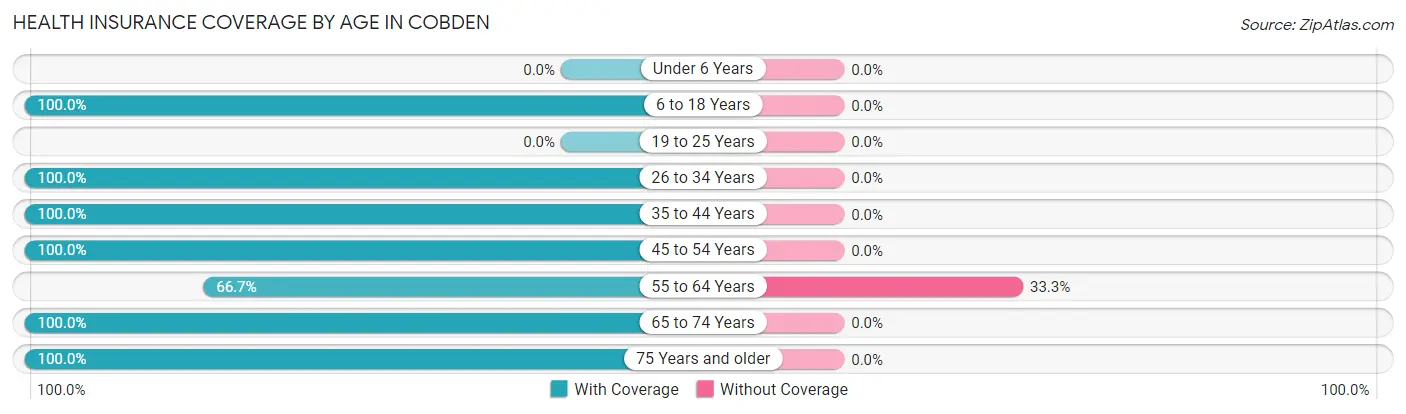
| Age Bracket | With Coverage | Without Coverage |
| Under 6 Years | 0 (0.0%) | 0 (0.0%) |
| 6 to 18 Years | 4 (100.0%) | 0 (0.0%) |
| 19 to 25 Years | 0 (0.0%) | 0 (0.0%) |
| 26 to 34 Years | 2 (100.0%) | 0 (0.0%) |
| 35 to 44 Years | 2 (100.0%) | 0 (0.0%) |
| 45 to 54 Years | 5 (100.0%) | 0 (0.0%) |
| 55 to 64 Years | 2 (66.7%) | 1 (33.3%) |
| 65 to 74 Years | 2 (100.0%) | 0 (0.0%) |
| 75 Years and older | 1 (100.0%) | 0 (0.0%) |
| Total | 18 (94.7%) | 1 (5.3%) |
Health Insurance Coverage by Citizenship Status in Cobden
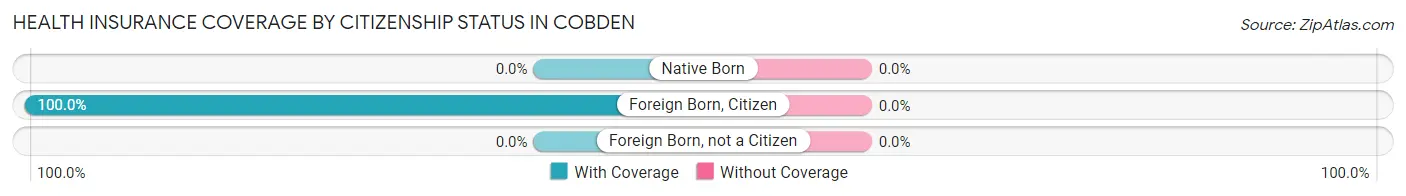
| Citizenship Status | With Coverage | Without Coverage |
| Native Born | 0 (0.0%) | 0 (0.0%) |
| Foreign Born, Citizen | 4 (100.0%) | 0 (0.0%) |
| Foreign Born, not a Citizen | 0 (0.0%) | 0 (0.0%) |
Health Insurance Coverage by Household Income in Cobden
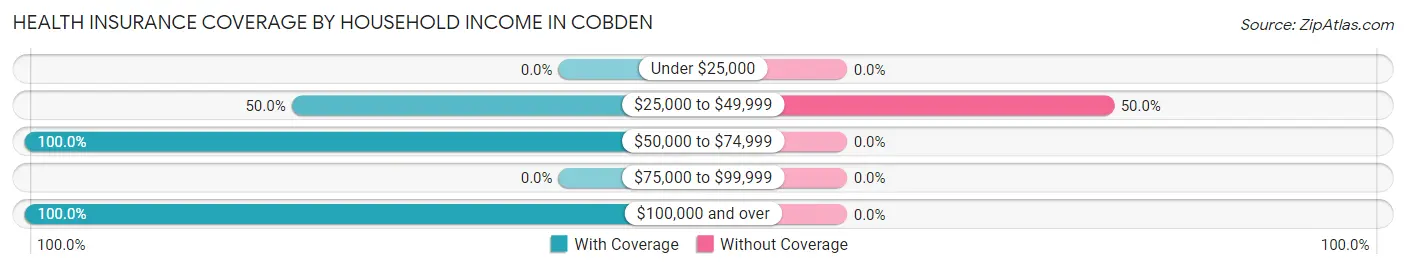
| Household Income | With Coverage | Without Coverage |
| Under $25,000 | 0 (0.0%) | 0 (0.0%) |
| $25,000 to $49,999 | 1 (50.0%) | 1 (50.0%) |
| $50,000 to $74,999 | 11 (100.0%) | 0 (0.0%) |
| $75,000 to $99,999 | 0 (0.0%) | 0 (0.0%) |
| $100,000 and over | 6 (100.0%) | 0 (0.0%) |
Public vs Private Health Insurance Coverage by Age in Cobden
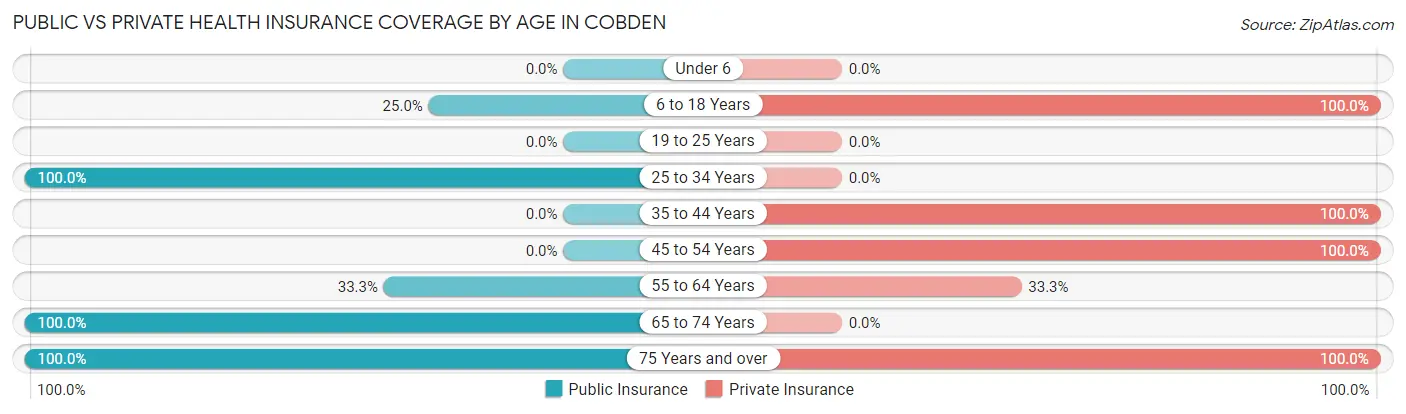
| Age Bracket | Public Insurance | Private Insurance |
| Under 6 | 0 (0.0%) | 0 (0.0%) |
| 6 to 18 Years | 1 (25.0%) | 4 (100.0%) |
| 19 to 25 Years | 0 (0.0%) | 0 (0.0%) |
| 25 to 34 Years | 2 (100.0%) | 0 (0.0%) |
| 35 to 44 Years | 0 (0.0%) | 2 (100.0%) |
| 45 to 54 Years | 0 (0.0%) | 5 (100.0%) |
| 55 to 64 Years | 1 (33.3%) | 1 (33.3%) |
| 65 to 74 Years | 2 (100.0%) | 0 (0.0%) |
| 75 Years and over | 1 (100.0%) | 1 (100.0%) |
| Total | 7 (36.8%) | 13 (68.4%) |
Disability Status by Sex by Age in Cobden
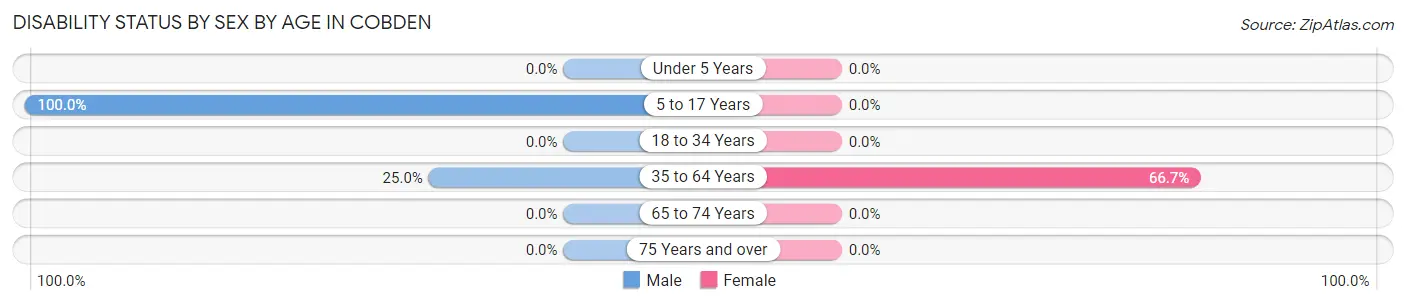
| Age Bracket | Male | Female |
| Under 5 Years | 0 (0.0%) | 0 (0.0%) |
| 5 to 17 Years | 2 (100.0%) | 0 (0.0%) |
| 18 to 34 Years | 0 (0.0%) | 0 (0.0%) |
| 35 to 64 Years | 1 (25.0%) | 4 (66.7%) |
| 65 to 74 Years | 0 (0.0%) | 0 (0.0%) |
| 75 Years and over | 0 (0.0%) | 0 (0.0%) |
Disability Class by Sex by Age in Cobden
Disability Class: Hearing Difficulty
| Age Bracket | Male | Female |
| Under 5 Years | 0 (0.0%) | 0 (0.0%) |
| 5 to 17 Years | 0 (0.0%) | 0 (0.0%) |
| 18 to 34 Years | 0 (0.0%) | 0 (0.0%) |
| 35 to 64 Years | 0 (0.0%) | 0 (0.0%) |
| 65 to 74 Years | 0 (0.0%) | 0 (0.0%) |
| 75 Years and over | 0 (0.0%) | 0 (0.0%) |
Disability Class: Vision Difficulty
| Age Bracket | Male | Female |
| Under 5 Years | 0 (0.0%) | 0 (0.0%) |
| 5 to 17 Years | 0 (0.0%) | 0 (0.0%) |
| 18 to 34 Years | 0 (0.0%) | 0 (0.0%) |
| 35 to 64 Years | 0 (0.0%) | 0 (0.0%) |
| 65 to 74 Years | 0 (0.0%) | 0 (0.0%) |
| 75 Years and over | 0 (0.0%) | 0 (0.0%) |
Disability Class: Cognitive Difficulty
| Age Bracket | Male | Female |
| 5 to 17 Years | 2 (100.0%) | 0 (0.0%) |
| 18 to 34 Years | 0 (0.0%) | 0 (0.0%) |
| 35 to 64 Years | 0 (0.0%) | 1 (16.7%) |
| 65 to 74 Years | 0 (0.0%) | 0 (0.0%) |
| 75 Years and over | 0 (0.0%) | 0 (0.0%) |
Disability Class: Ambulatory Difficulty
| Age Bracket | Male | Female |
| 5 to 17 Years | 0 (0.0%) | 0 (0.0%) |
| 18 to 34 Years | 0 (0.0%) | 0 (0.0%) |
| 35 to 64 Years | 1 (25.0%) | 3 (50.0%) |
| 65 to 74 Years | 0 (0.0%) | 0 (0.0%) |
| 75 Years and over | 0 (0.0%) | 0 (0.0%) |
Disability Class: Self-Care Difficulty
| Age Bracket | Male | Female |
| 5 to 17 Years | 0 (0.0%) | 0 (0.0%) |
| 18 to 34 Years | 0 (0.0%) | 0 (0.0%) |
| 35 to 64 Years | 0 (0.0%) | 0 (0.0%) |
| 65 to 74 Years | 0 (0.0%) | 0 (0.0%) |
| 75 Years and over | 0 (0.0%) | 0 (0.0%) |
Technology Access in Cobden
Computing Device Access in Cobden
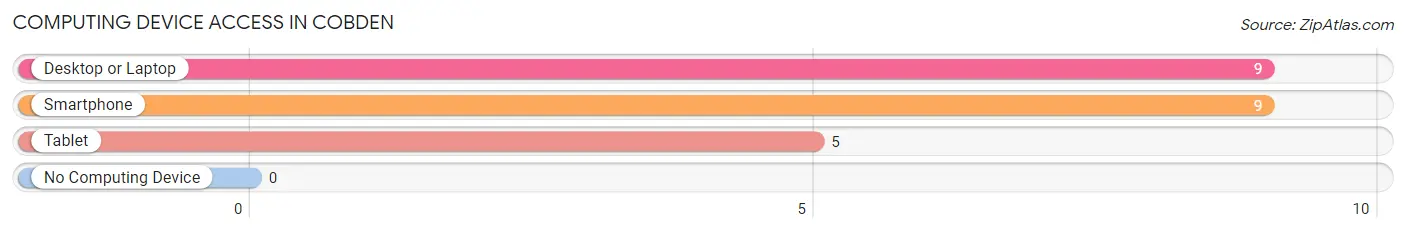
| Device Type | # Households | % Households |
| Desktop or Laptop | 9 | 100.0% |
| Smartphone | 9 | 100.0% |
| Tablet | 5 | 55.6% |
| No Computing Device | 0 | 0.0% |
| Total | 9 | 100.0% |
Internet Access in Cobden
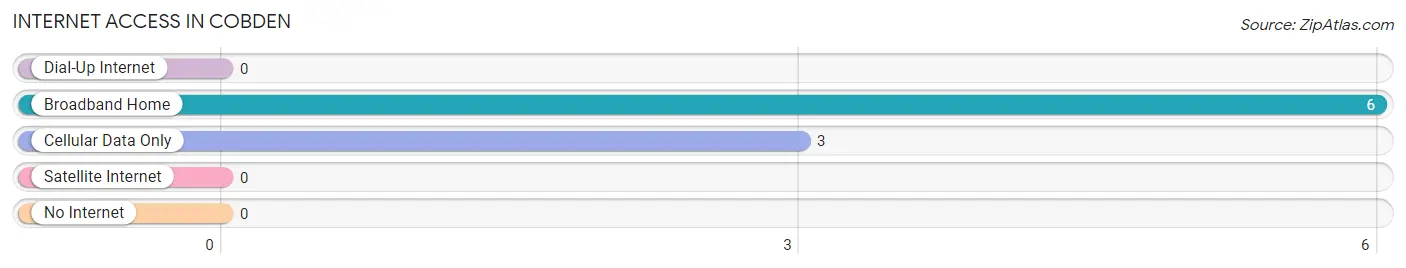
| Internet Type | # Households | % Households |
| Dial-Up Internet | 0 | 0.0% |
| Broadband Home | 6 | 66.7% |
| Cellular Data Only | 3 | 33.3% |
| Satellite Internet | 0 | 0.0% |
| No Internet | 0 | 0.0% |
| Total | 9 | 100.0% |
Cobden Summary
Cobden is a small city located in the state of Minnesota, United States. It is situated in the southeastern part of the state, in the county of Pine. The city has a population of approximately 1,000 people, and is located about 40 miles north of Minneapolis.
History
Cobden was founded in 1887 by a group of settlers from Sweden. The settlers named the city after the English statesman Richard Cobden, who was a leader in the movement for free trade. The city was incorporated in 1891.
In the early years, Cobden was a farming community, with the main crops being wheat, oats, and barley. The city also had a sawmill, a flour mill, and a creamery. In the late 19th century, the city was a major producer of lumber, and the lumber industry was the main source of employment for the residents.
In the early 20th century, Cobden experienced a period of growth and development. The city was connected to the railroad in 1910, and the first telephone service was established in 1911. The city also had a number of businesses, including a bank, a hotel, a general store, and a movie theater.
Geography
Cobden is located in the southeastern part of Minnesota, in the county of Pine. The city is situated on the banks of the Mississippi River, and is surrounded by rolling hills and forests. The city has a total area of 1.2 square miles, and is located about 40 miles north of Minneapolis.
The climate in Cobden is humid continental, with cold winters and warm summers. The average annual temperature is around 40 degrees Fahrenheit, and the average annual precipitation is around 30 inches.
Economy
The economy of Cobden is largely based on agriculture and tourism. The city is home to a number of farms, and the main crops grown in the area are wheat, oats, and barley. The city also has a number of businesses, including a bank, a hotel, a general store, and a movie theater.
Tourism is an important part of the economy of Cobden. The city is home to a number of attractions, including the Pine County Historical Museum, the Cobden State Park, and the Cobden Golf Course. The city also hosts a number of festivals and events throughout the year, including the Cobden Days Festival and the Cobden Harvest Festival.
Demographics
As of the 2010 census, the population of Cobden was 1,000 people. The racial makeup of the city was 97.2% White, 0.7% African American, 0.3% Native American, 0.3% Asian, and 1.5% from other races. The median household income was $41,250, and the median family income was $50,000.
The population of Cobden is largely made up of people of Swedish descent. The city also has a small population of Native Americans, and a small population of African Americans. The city is served by the Pine County School District, and the city has a number of churches, including the First Lutheran Church and the Cobden United Methodist Church.
Common Questions
What is Per Capita Income in Cobden?
Per Capita income in Cobden is $40,047.
What is Inequality or Gini Index in Cobden?
Inequality or Gini Index in Cobden is 0.26.
What is the Total Population of Cobden?
Total Population of Cobden is 19.
What is the Total Male Population of Cobden?
Total Male Population of Cobden is 10.
What is the Total Female Population of Cobden?
Total Female Population of Cobden is 9.
What is the Ratio of Males per 100 Females in Cobden?
There are 111.11 Males per 100 Females in Cobden.
What is the Ratio of Females per 100 Males in Cobden?
There are 90.00 Females per 100 Males in Cobden.
What is the Median Population Age in Cobden?
Median Population Age in Cobden is 47.5 Years.
What is the Average Family Size in Cobden
Average Family Size in Cobden is 2.0 People.
What is the Average Household Size in Cobden
Average Household Size in Cobden is 2.1 People.
How Large is the Labor Force in Cobden?
There are 13 People in the Labor Forcein in Cobden.
What is the Percentage of People in the Labor Force in Cobden?
81.3% of People are in the Labor Force in Cobden.