Arrowhead Springs, WY Map & Demographics
Arrowhead Springs Map
Arrowhead Springs Overview
$40,521
PER CAPITA INCOME
$98,571
AVG FAMILY INCOME
$102,500
AVG HOUSEHOLD INCOME
0.28
INEQUALITY / GINI INDEX
72
TOTAL POPULATION
33
MALE POPULATION
39
FEMALE POPULATION
84.62
MALES / 100 FEMALES
118.18
FEMALES / 100 MALES
53.4
MEDIAN AGE
3.6
AVG FAMILY SIZE
2.8
AVG HOUSEHOLD SIZE
20
LABOR FORCE [ PEOPLE ]
44.4%
PERCENT IN LABOR FORCE
Income in Arrowhead Springs
Income Overview in Arrowhead Springs
Per Capita Income in Arrowhead Springs is $40,521, while median incomes of families and households are $98,571 and $102,500 respectively.
| Characteristic | Number | Measure |
| Per Capita Income | 72 | $40,521 |
| Median Family Income | 18 | $98,571 |
| Mean Family Income | 18 | $77,356 |
| Median Household Income | 26 | $102,500 |
| Mean Household Income | 26 | $109,400 |
| Income Deficit | 18 | $0 |
| Wage / Income Gap (%) | 72 | 0.00% |
| Wage / Income Gap ($) | 72 | 100.00¢ per $1 |
| Gini / Inequality Index | 72 | 0.28 |
Earnings by Sex in Arrowhead Springs
| Sex | Number | Average Earnings |
| Male | 5 (25.0%) | $0 |
| Female | 15 (75.0%) | $0 |
| Total | 20 (100.0%) | $0 |
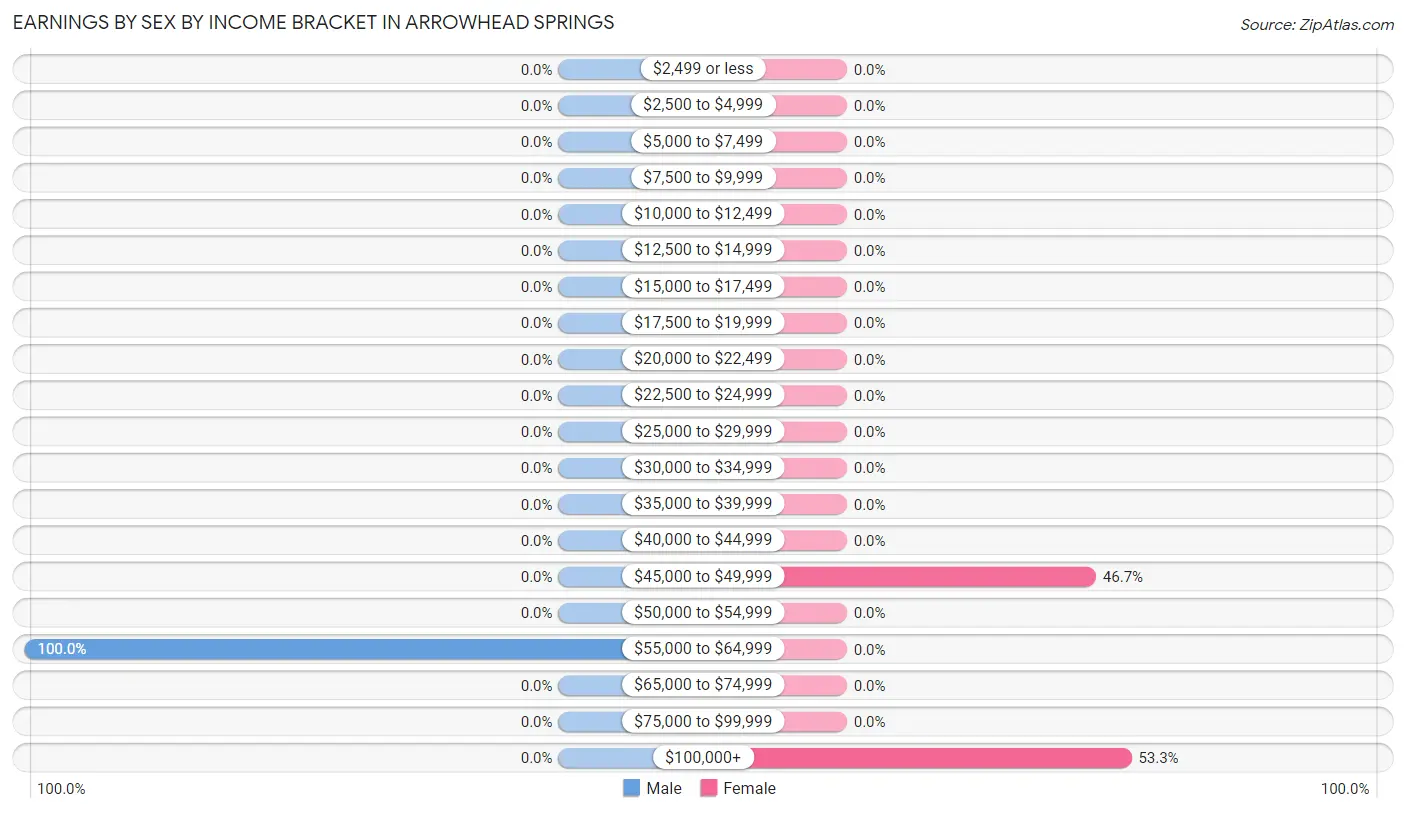
Earnings by Sex by Income Bracket in Arrowhead Springs
The most common earnings brackets in Arrowhead Springs are $55,000 to $64,999 for men (5 | 100.0%) and $100,000+ for women (8 | 53.3%).
| Income | Male | Female |
| $2,499 or less | 0 (0.0%) | 0 (0.0%) |
| $2,500 to $4,999 | 0 (0.0%) | 0 (0.0%) |
| $5,000 to $7,499 | 0 (0.0%) | 0 (0.0%) |
| $7,500 to $9,999 | 0 (0.0%) | 0 (0.0%) |
| $10,000 to $12,499 | 0 (0.0%) | 0 (0.0%) |
| $12,500 to $14,999 | 0 (0.0%) | 0 (0.0%) |
| $15,000 to $17,499 | 0 (0.0%) | 0 (0.0%) |
| $17,500 to $19,999 | 0 (0.0%) | 0 (0.0%) |
| $20,000 to $22,499 | 0 (0.0%) | 0 (0.0%) |
| $22,500 to $24,999 | 0 (0.0%) | 0 (0.0%) |
| $25,000 to $29,999 | 0 (0.0%) | 0 (0.0%) |
| $30,000 to $34,999 | 0 (0.0%) | 0 (0.0%) |
| $35,000 to $39,999 | 0 (0.0%) | 0 (0.0%) |
| $40,000 to $44,999 | 0 (0.0%) | 0 (0.0%) |
| $45,000 to $49,999 | 0 (0.0%) | 7 (46.7%) |
| $50,000 to $54,999 | 0 (0.0%) | 0 (0.0%) |
| $55,000 to $64,999 | 5 (100.0%) | 0 (0.0%) |
| $65,000 to $74,999 | 0 (0.0%) | 0 (0.0%) |
| $75,000 to $99,999 | 0 (0.0%) | 0 (0.0%) |
| $100,000+ | 0 (0.0%) | 8 (53.3%) |
| Total | 5 (100.0%) | 15 (100.0%) |
Earnings by Sex by Educational Attainment in Arrowhead Springs
| Educational Attainment | Male Income | Female Income |
| Less than High School | - | - |
| High School Diploma | - | - |
| College or Associate's Degree | - | - |
| Bachelor's Degree | - | - |
| Graduate Degree | - | - |
| Total | - | - |
Family Income in Arrowhead Springs
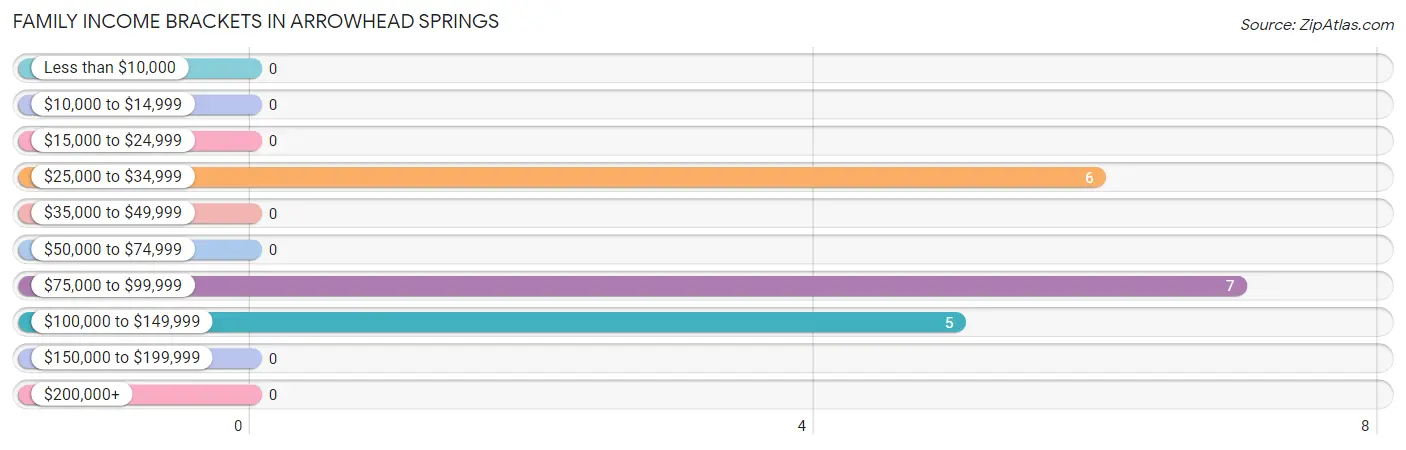
Family Income Brackets in Arrowhead Springs
According to the Arrowhead Springs family income data, there are 7 families falling into the $75,000 to $99,999 income range, which is the most common income bracket and makes up 38.9% of all families.
| Income Bracket | # Families | % Families |
| Less than $10,000 | 0 | 0.0% |
| $10,000 to $14,999 | 0 | 0.0% |
| $15,000 to $24,999 | 0 | 0.0% |
| $25,000 to $34,999 | 6 | 33.3% |
| $35,000 to $49,999 | 0 | 0.0% |
| $50,000 to $74,999 | 0 | 0.0% |
| $75,000 to $99,999 | 7 | 38.9% |
| $100,000 to $149,999 | 5 | 27.8% |
| $150,000 to $199,999 | 0 | 0.0% |
| $200,000+ | 0 | 0.0% |
Family Income by Famaliy Size in Arrowhead Springs
| Income Bracket | # Families | Median Income |
| 2-Person Families | 13 (72.2%) | $0 |
| 3-Person Families | 0 (0.0%) | $0 |
| 4-Person Families | 0 (0.0%) | $0 |
| 5-Person Families | 0 (0.0%) | $0 |
| 6-Person Families | 5 (27.8%) | $0 |
| 7+ Person Families | 0 (0.0%) | $0 |
| Total | 18 (100.0%) | $98,571 |
Family Income by Number of Earners in Arrowhead Springs
| Number of Earners | # Families | Median Income |
| No Earners | 13 (72.2%) | $0 |
| 1 Earner | 0 (0.0%) | $0 |
| 2 Earners | 5 (27.8%) | $0 |
| 3+ Earners | 0 (0.0%) | $0 |
| Total | 18 (100.0%) | $98,571 |
Household Income in Arrowhead Springs
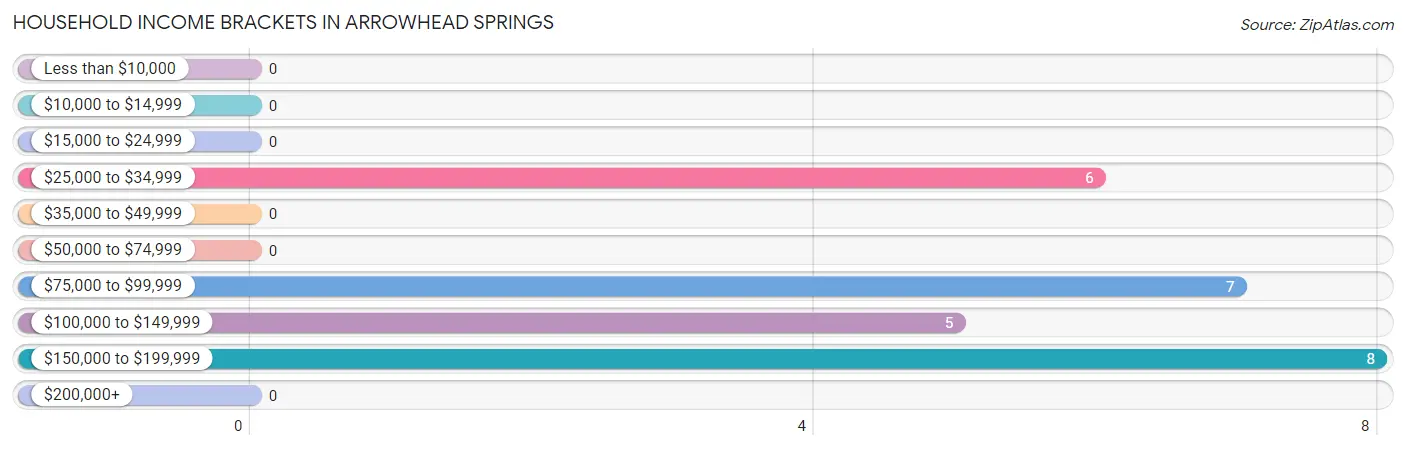
Household Income Brackets in Arrowhead Springs
With 8 households falling in the category, the $150,000 to $199,999 income range is the most frequent in Arrowhead Springs, accounting for 30.8% of all households.
| Income Bracket | # Households | % Households |
| Less than $10,000 | 0 | 0.0% |
| $10,000 to $14,999 | 0 | 0.0% |
| $15,000 to $24,999 | 0 | 0.0% |
| $25,000 to $34,999 | 6 | 23.1% |
| $35,000 to $49,999 | 0 | 0.0% |
| $50,000 to $74,999 | 0 | 0.0% |
| $75,000 to $99,999 | 7 | 26.9% |
| $100,000 to $149,999 | 5 | 19.2% |
| $150,000 to $199,999 | 8 | 30.8% |
| $200,000+ | 0 | 0.0% |
Household Income by Householder Age in Arrowhead Springs
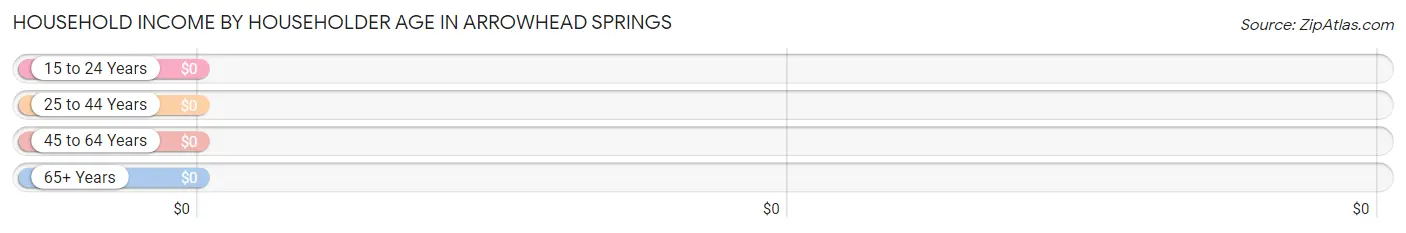
| Income Bracket | # Households | Median Income |
| 15 to 24 Years | 0 (0.0%) | $0 |
| 25 to 44 Years | 0 (0.0%) | $0 |
| 45 to 64 Years | 13 (50.0%) | $0 |
| 65+ Years | 13 (50.0%) | $0 |
| Total | 26 (100.0%) | $102,500 |
Poverty in Arrowhead Springs
Income Below Poverty by Sex and Age in Arrowhead Springs
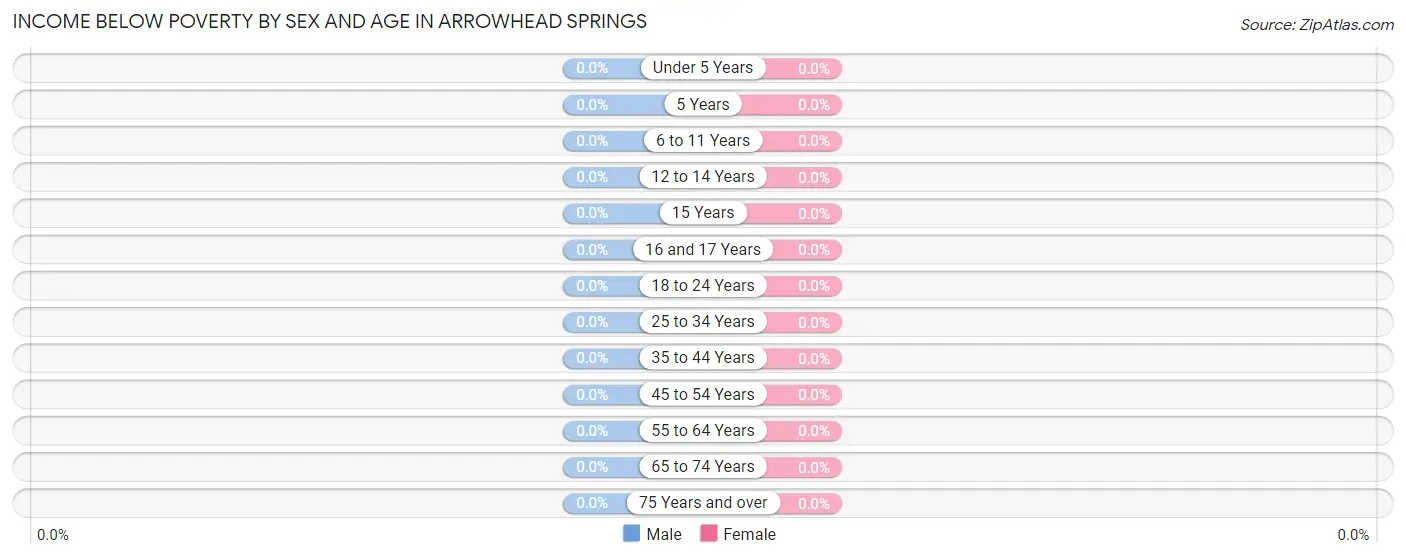
| Age Bracket | Male | Female |
| Under 5 Years | 0 (0.0%) | 0 (0.0%) |
| 5 Years | 0 (0.0%) | 0 (0.0%) |
| 6 to 11 Years | 0 (0.0%) | 0 (0.0%) |
| 12 to 14 Years | 0 (0.0%) | 0 (0.0%) |
| 15 Years | 0 (0.0%) | 0 (0.0%) |
| 16 and 17 Years | 0 (0.0%) | 0 (0.0%) |
| 18 to 24 Years | 0 (0.0%) | 0 (0.0%) |
| 25 to 34 Years | 0 (0.0%) | 0 (0.0%) |
| 35 to 44 Years | 0 (0.0%) | 0 (0.0%) |
| 45 to 54 Years | 0 (0.0%) | 0 (0.0%) |
| 55 to 64 Years | 0 (0.0%) | 0 (0.0%) |
| 65 to 74 Years | 0 (0.0%) | 0 (0.0%) |
| 75 Years and over | 0 (0.0%) | 0 (0.0%) |
| Total | 0 (0.0%) | 0 (0.0%) |
Income Above Poverty by Sex and Age in Arrowhead Springs
According to the poverty statistics in Arrowhead Springs, males aged 6 to 11 years and females aged 6 to 11 years are the age groups that are most secure financially, with 100.0% of males and 100.0% of females in these age groups living above the poverty line.
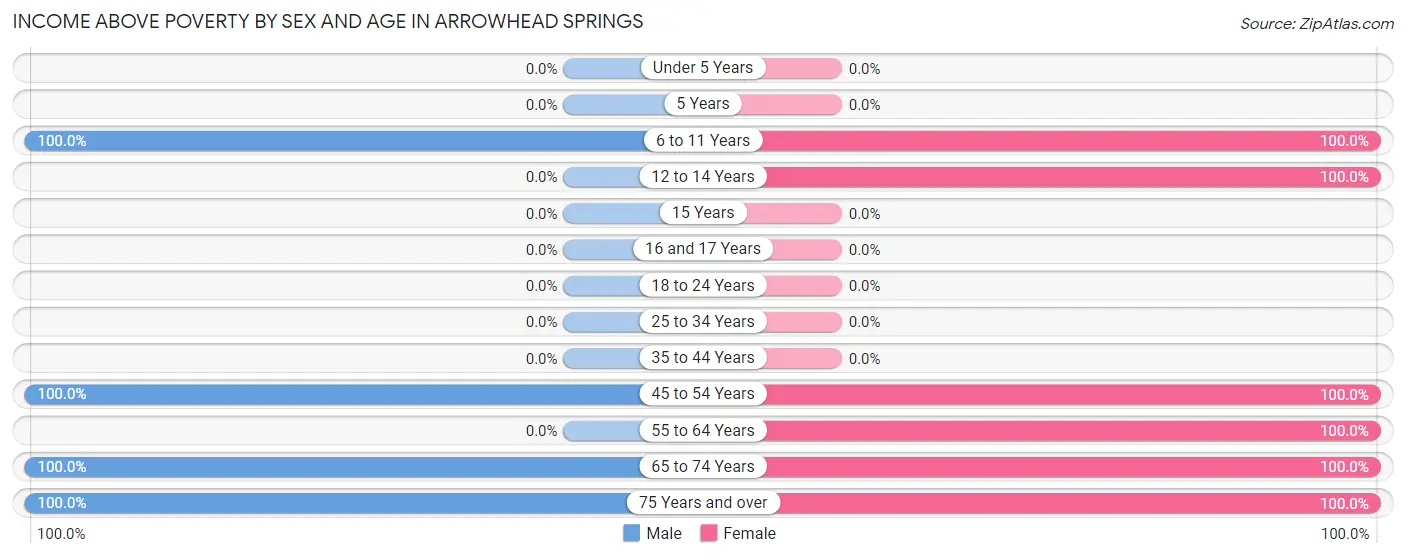
| Age Bracket | Male | Female |
| Under 5 Years | 0 (0.0%) | 0 (0.0%) |
| 5 Years | 0 (0.0%) | 0 (0.0%) |
| 6 to 11 Years | 15 (100.0%) | 6 (100.0%) |
| 12 to 14 Years | 0 (0.0%) | 6 (100.0%) |
| 15 Years | 0 (0.0%) | 0 (0.0%) |
| 16 and 17 Years | 0 (0.0%) | 0 (0.0%) |
| 18 to 24 Years | 0 (0.0%) | 0 (0.0%) |
| 25 to 34 Years | 0 (0.0%) | 0 (0.0%) |
| 35 to 44 Years | 0 (0.0%) | 0 (0.0%) |
| 45 to 54 Years | 5 (100.0%) | 7 (100.0%) |
| 55 to 64 Years | 0 (0.0%) | 8 (100.0%) |
| 65 to 74 Years | 6 (100.0%) | 5 (100.0%) |
| 75 Years and over | 7 (100.0%) | 7 (100.0%) |
| Total | 33 (100.0%) | 39 (100.0%) |
Income Below Poverty Among Married-Couple Families in Arrowhead Springs
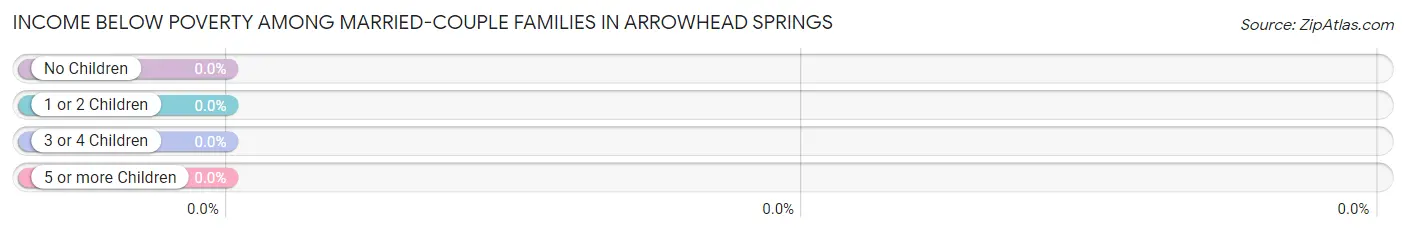
| Children | Above Poverty | Below Poverty |
| No Children | 13 (100.0%) | 0 (0.0%) |
| 1 or 2 Children | 0 (0.0%) | 0 (0.0%) |
| 3 or 4 Children | 5 (100.0%) | 0 (0.0%) |
| 5 or more Children | 0 (0.0%) | 0 (0.0%) |
| Total | 18 (100.0%) | 0 (0.0%) |
Income Below Poverty Among Single-Parent Households in Arrowhead Springs
| Children | Single Father | Single Mother |
| No Children | 0 (0.0%) | 0 (0.0%) |
| 1 or 2 Children | 0 (0.0%) | 0 (0.0%) |
| 3 or 4 Children | 0 (0.0%) | 0 (0.0%) |
| 5 or more Children | 0 (0.0%) | 0 (0.0%) |
| Total | 0 (0.0%) | 0 (0.0%) |
Income Below Poverty Among Married-Couple vs Single-Parent Households in Arrowhead Springs
| Children | Married-Couple Families | Single-Parent Households |
| No Children | 0 (0.0%) | 0 (0.0%) |
| 1 or 2 Children | 0 (0.0%) | 0 (0.0%) |
| 3 or 4 Children | 0 (0.0%) | 0 (0.0%) |
| 5 or more Children | 0 (0.0%) | 0 (0.0%) |
| Total | 0 (0.0%) | 0 (0.0%) |
Race in Arrowhead Springs
The most populous races in Arrowhead Springs are , and White / Caucasian (72 | 100.0%).
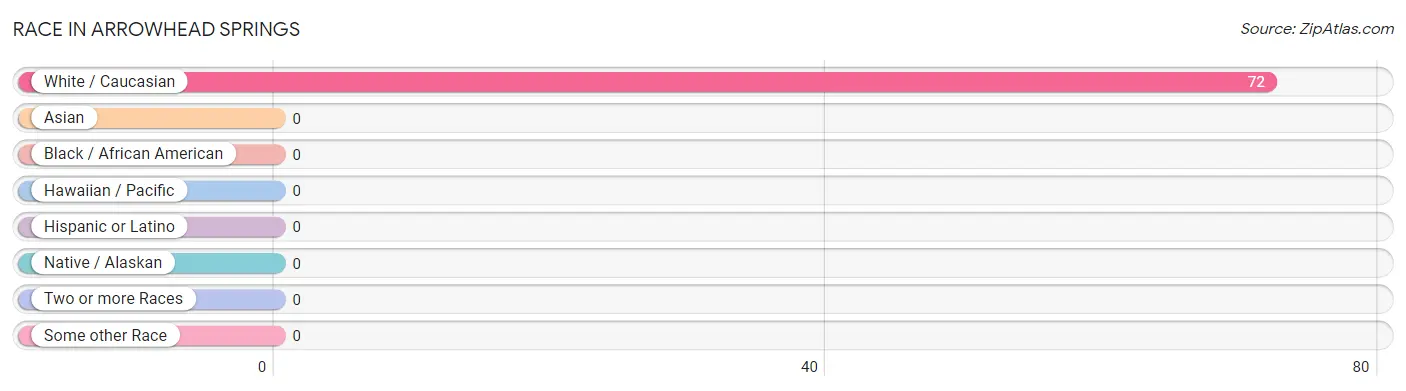
| Race | # Population | % Population |
| Asian | 0 | 0.0% |
| Black / African American | 0 | 0.0% |
| Hawaiian / Pacific | 0 | 0.0% |
| Hispanic or Latino | 0 | 0.0% |
| Native / Alaskan | 0 | 0.0% |
| White / Caucasian | 72 | 100.0% |
| Two or more Races | 0 | 0.0% |
| Some other Race | 0 | 0.0% |
| Total | 72 | 100.0% |
Ancestry in Arrowhead Springs
The most populous ancestries reported in Arrowhead Springs are German (14 | 19.4%), English (13 | 18.1%), Slovene (11 | 15.3%), Dutch (8 | 11.1%), and American (7 | 9.7%), together accounting for 73.6% of all Arrowhead Springs residents.
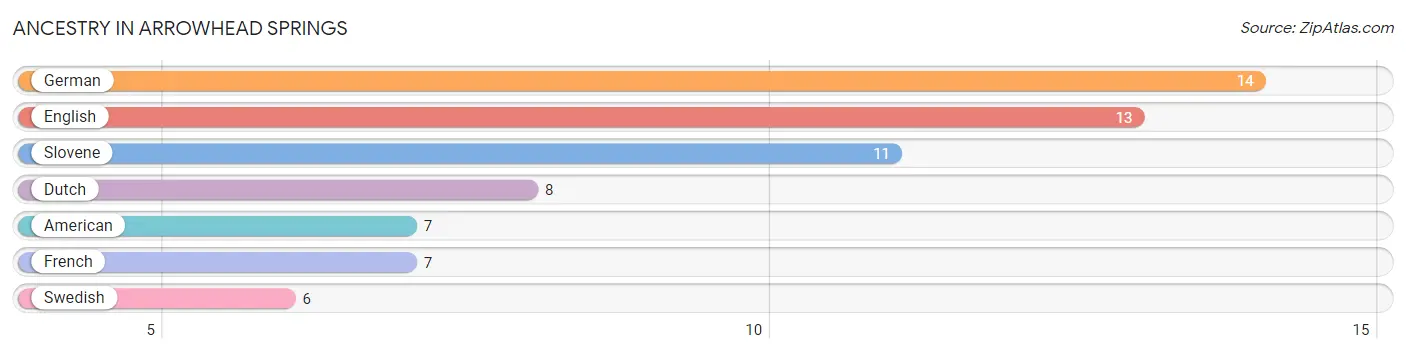
| Ancestry | # Population | % Population |
| American | 7 | 9.7% |
| Dutch | 8 | 11.1% |
| English | 13 | 18.1% |
| French | 7 | 9.7% |
| German | 14 | 19.4% |
| Slovene | 11 | 15.3% |
| Swedish | 6 | 8.3% | View All 7 Rows |
Immigrants in Arrowhead Springs

| Immigration Origin | # Population | % Population | View All 0 Rows |
Sex and Age in Arrowhead Springs
Sex and Age in Arrowhead Springs
The most populous age groups in Arrowhead Springs are 5 to 9 Years (15 | 45.5%) for men and 10 to 14 Years (12 | 30.8%) for women.
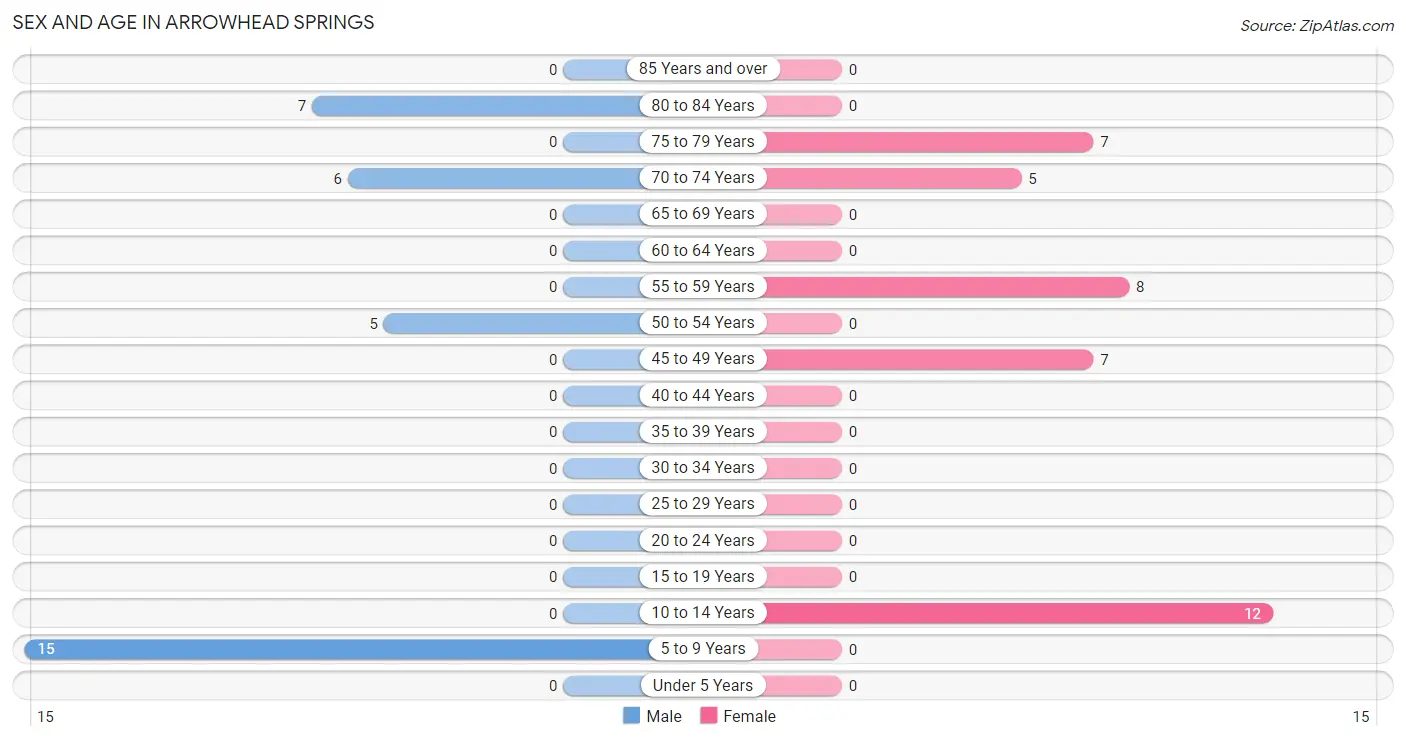
| Age Bracket | Male | Female |
| Under 5 Years | 0 (0.0%) | 0 (0.0%) |
| 5 to 9 Years | 15 (45.5%) | 0 (0.0%) |
| 10 to 14 Years | 0 (0.0%) | 12 (30.8%) |
| 15 to 19 Years | 0 (0.0%) | 0 (0.0%) |
| 20 to 24 Years | 0 (0.0%) | 0 (0.0%) |
| 25 to 29 Years | 0 (0.0%) | 0 (0.0%) |
| 30 to 34 Years | 0 (0.0%) | 0 (0.0%) |
| 35 to 39 Years | 0 (0.0%) | 0 (0.0%) |
| 40 to 44 Years | 0 (0.0%) | 0 (0.0%) |
| 45 to 49 Years | 0 (0.0%) | 7 (17.9%) |
| 50 to 54 Years | 5 (15.1%) | 0 (0.0%) |
| 55 to 59 Years | 0 (0.0%) | 8 (20.5%) |
| 60 to 64 Years | 0 (0.0%) | 0 (0.0%) |
| 65 to 69 Years | 0 (0.0%) | 0 (0.0%) |
| 70 to 74 Years | 6 (18.2%) | 5 (12.8%) |
| 75 to 79 Years | 0 (0.0%) | 7 (17.9%) |
| 80 to 84 Years | 7 (21.2%) | 0 (0.0%) |
| 85 Years and over | 0 (0.0%) | 0 (0.0%) |
| Total | 33 (100.0%) | 39 (100.0%) |
Families and Households in Arrowhead Springs
Median Family Size in Arrowhead Springs
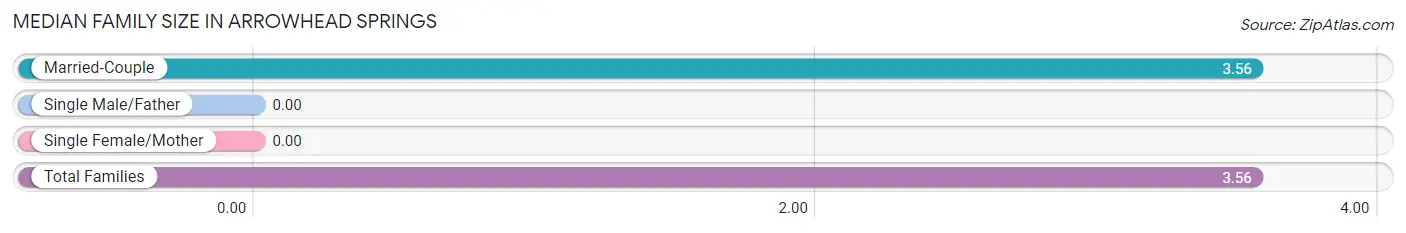
| Family Type | # Families | Family Size |
| Married-Couple | 18 (100.0%) | 3.56 |
| Single Male/Father | 0 (0.0%) | - |
| Single Female/Mother | 0 (0.0%) | - |
| Total Families | 18 (100.0%) | 3.56 |
Median Household Size in Arrowhead Springs
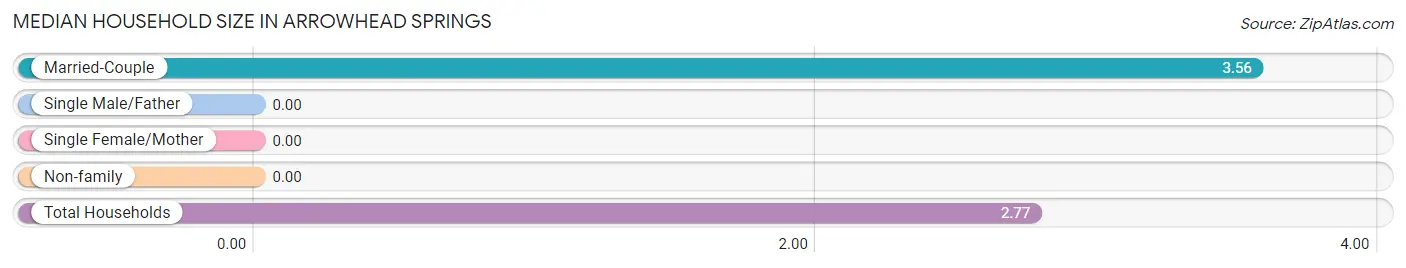
| Household Type | # Households | Household Size |
| Married-Couple | 18 (69.2%) | 3.56 |
| Single Male/Father | 0 (0.0%) | - |
| Single Female/Mother | 0 (0.0%) | - |
| Non-family | 8 (30.8%) | - |
| Total Households | 26 (100.0%) | 2.77 |
Household Size by Marriage Status in Arrowhead Springs
Out of a total of 26 households in Arrowhead Springs, 18 (69.2%) are family households, while 8 (30.8%) are nonfamily households. The most numerous type of family households are 2-person households, comprising 13, and the most common type of nonfamily households are 1-person households, comprising 8.
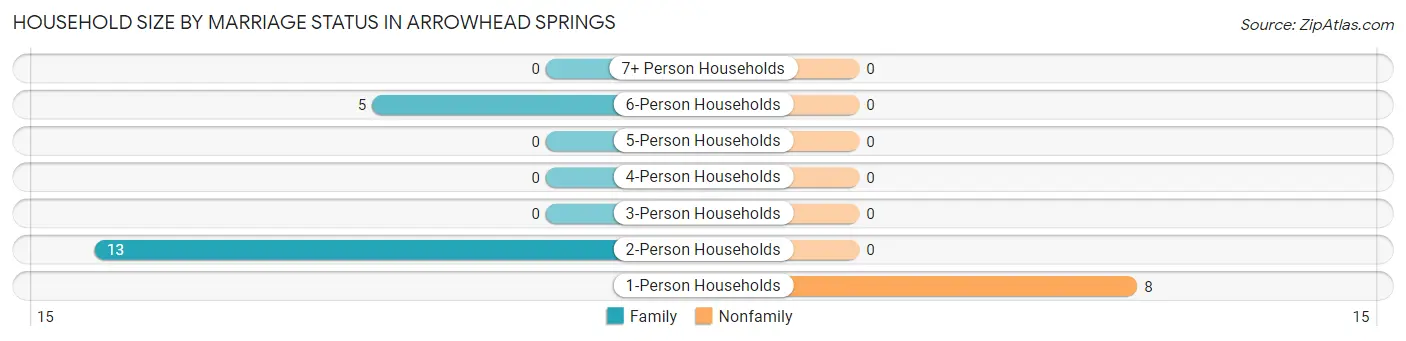
| Household Size | Family Households | Nonfamily Households |
| 1-Person Households | - | 8 (30.8%) |
| 2-Person Households | 13 (50.0%) | 0 (0.0%) |
| 3-Person Households | 0 (0.0%) | 0 (0.0%) |
| 4-Person Households | 0 (0.0%) | 0 (0.0%) |
| 5-Person Households | 0 (0.0%) | 0 (0.0%) |
| 6-Person Households | 5 (19.2%) | 0 (0.0%) |
| 7+ Person Households | 0 (0.0%) | 0 (0.0%) |
| Total | 18 (69.2%) | 8 (30.8%) |
Female Fertility in Arrowhead Springs
Fertility by Age in Arrowhead Springs
| Age Bracket | Women with Births | Births / 1,000 Women |
| 15 to 19 years | 0 (0.0%) | 0.0 |
| 20 to 34 years | 0 (0.0%) | 0.0 |
| 35 to 50 years | 0 (0.0%) | 0.0 |
| Total | 0 (0.0%) | 0.0 |
Fertility by Age by Marriage Status in Arrowhead Springs
| Age Bracket | Married | Unmarried |
| 15 to 19 years | 0 (0.0%) | 0 (0.0%) |
| 20 to 34 years | 0 (0.0%) | 0 (0.0%) |
| 35 to 50 years | 0 (0.0%) | 0 (0.0%) |
| Total | 0 (0.0%) | 0 (0.0%) |
Fertility by Education in Arrowhead Springs
| Educational Attainment | Women with Births | Births / 1,000 Women |
| Less than High School | 0 (0.0%) | 0.0 |
| High School Diploma | 0 (0.0%) | 0.0 |
| College or Associate's Degree | 0 (0.0%) | 0.0 |
| Bachelor's Degree | 0 (0.0%) | 0.0 |
| Graduate Degree | 0 (0.0%) | 0.0 |
| Total | 0 (0.0%) | 0.0 |
Fertility by Education by Marriage Status in Arrowhead Springs
| Educational Attainment | Married | Unmarried |
| Less than High School | 0 (0.0%) | 0 (0.0%) |
| High School Diploma | 0 (0.0%) | 0 (0.0%) |
| College or Associate's Degree | 0 (0.0%) | 0 (0.0%) |
| Bachelor's Degree | 0 (0.0%) | 0 (0.0%) |
| Graduate Degree | 0 (0.0%) | 0 (0.0%) |
| Total | 0 (0.0%) | 0 (0.0%) |
Employment Characteristics in Arrowhead Springs
Employment by Class of Employer in Arrowhead Springs
Among the 13 employed individuals in Arrowhead Springs, self-employed (not incorporated) (8 | 61.5%), and private company employees (5 | 38.5%) make up the most common classes of employment.
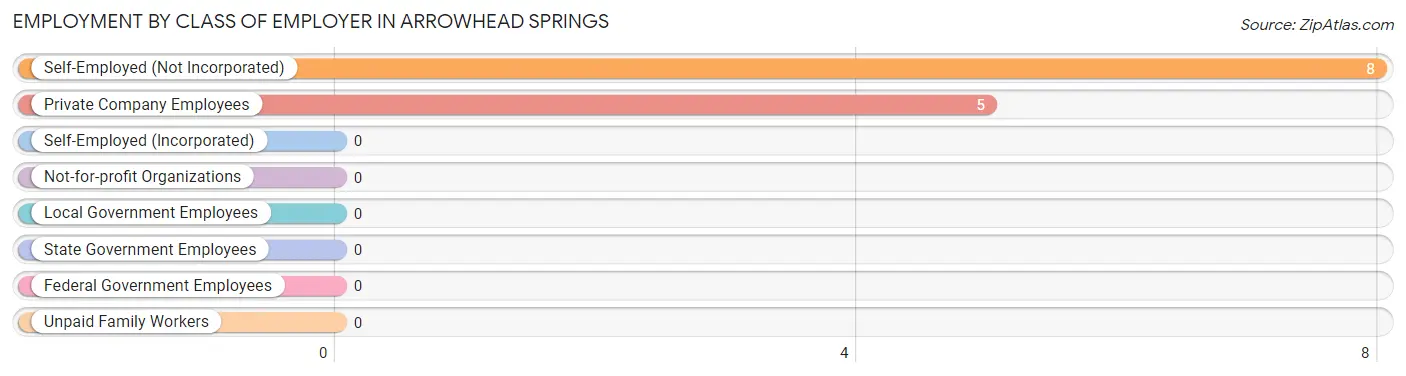
| Employer Class | # Employees | % Employees |
| Private Company Employees | 5 | 38.5% |
| Self-Employed (Incorporated) | 0 | 0.0% |
| Self-Employed (Not Incorporated) | 8 | 61.5% |
| Not-for-profit Organizations | 0 | 0.0% |
| Local Government Employees | 0 | 0.0% |
| State Government Employees | 0 | 0.0% |
| Federal Government Employees | 0 | 0.0% |
| Unpaid Family Workers | 0 | 0.0% |
| Total | 13 | 100.0% |
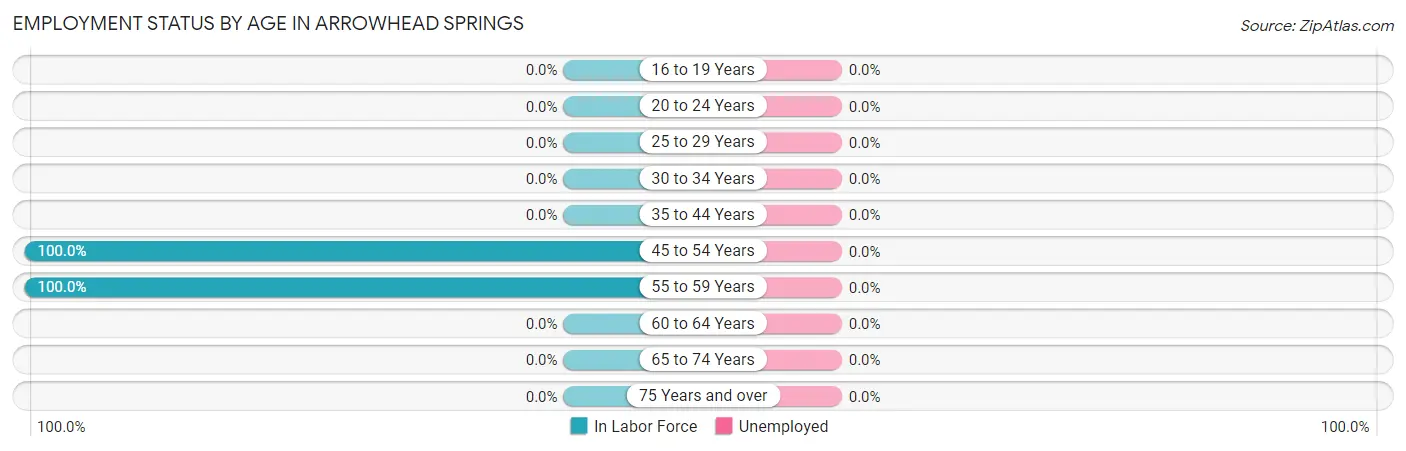
Employment Status by Age in Arrowhead Springs
| Age Bracket | In Labor Force | Unemployed |
| 16 to 19 Years | 0 (0.0%) | 0 (0.0%) |
| 20 to 24 Years | 0 (0.0%) | 0 (0.0%) |
| 25 to 29 Years | 0 (0.0%) | 0 (0.0%) |
| 30 to 34 Years | 0 (0.0%) | 0 (0.0%) |
| 35 to 44 Years | 0 (0.0%) | 0 (0.0%) |
| 45 to 54 Years | 12 (100.0%) | 0 (0.0%) |
| 55 to 59 Years | 8 (100.0%) | 0 (0.0%) |
| 60 to 64 Years | 0 (0.0%) | 0 (0.0%) |
| 65 to 74 Years | 0 (0.0%) | 0 (0.0%) |
| 75 Years and over | 0 (0.0%) | 0 (0.0%) |
| Total | 20 (44.4%) | 0 (0.0%) |
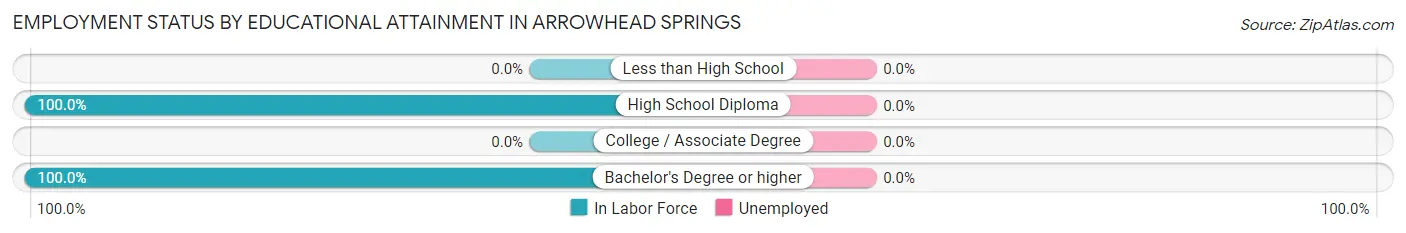
Employment Status by Educational Attainment in Arrowhead Springs
| Educational Attainment | In Labor Force | Unemployed |
| Less than High School | 0 (0.0%) | 0 (0.0%) |
| High School Diploma | 5 (100.0%) | 0 (0.0%) |
| College / Associate Degree | 0 (0.0%) | 0 (0.0%) |
| Bachelor's Degree or higher | 15 (100.0%) | 0 (0.0%) |
| Total | 20 (100.0%) | 0 (0.0%) |
Employment Occupations by Sex in Arrowhead Springs
Management, Business, Science and Arts Occupations
The most common Management, Business, Science and Arts occupations in Arrowhead Springs are Business & Financial (8 | 40.0%), Community & Social Service (7 | 35.0%), and Education Instruction & Library (7 | 35.0%).
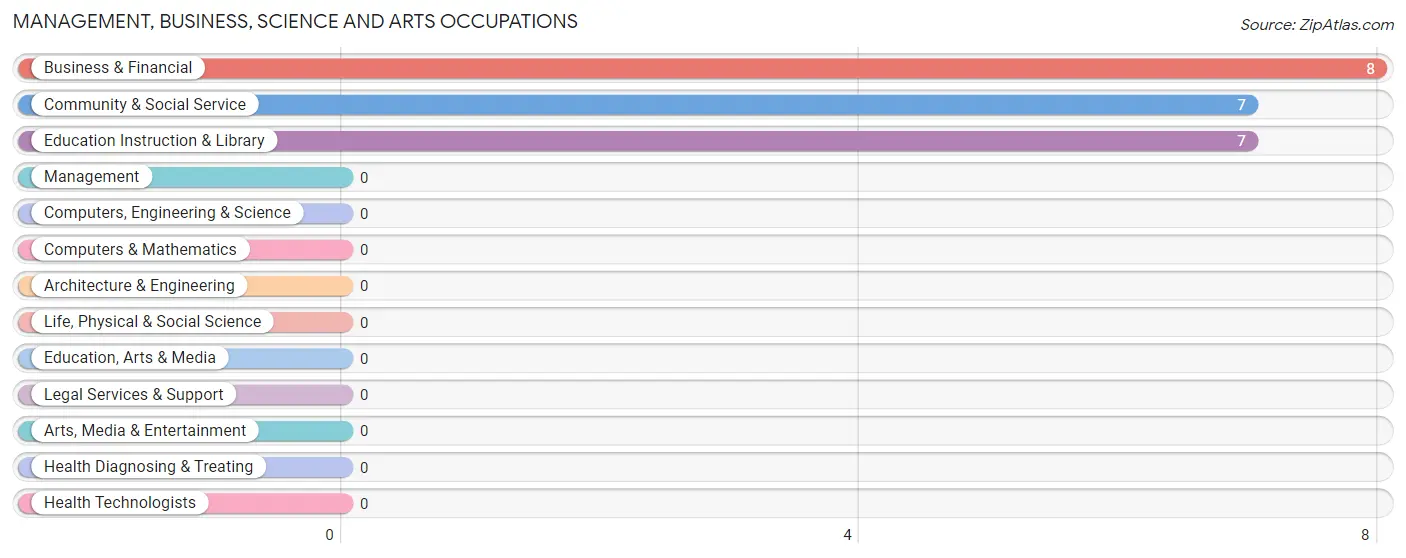
Management, Business, Science and Arts Occupations by Sex
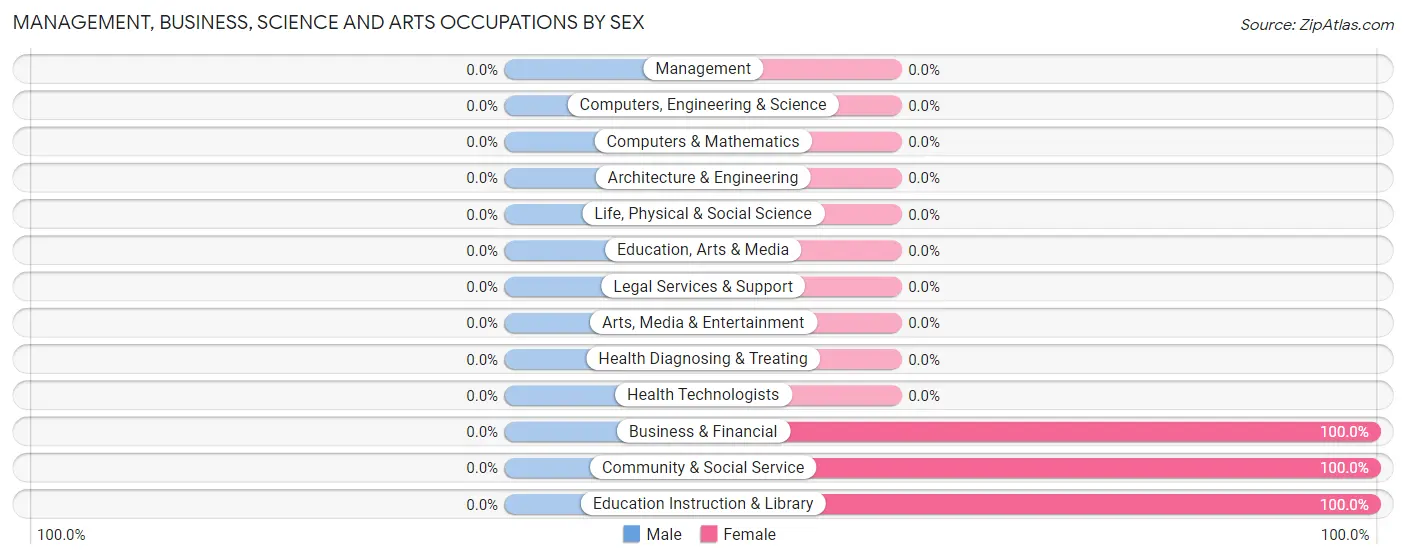
| Occupation | Male | Female |
| Management | 0 (0.0%) | 0 (0.0%) |
| Business & Financial | 0 (0.0%) | 8 (100.0%) |
| Computers, Engineering & Science | 0 (0.0%) | 0 (0.0%) |
| Computers & Mathematics | 0 (0.0%) | 0 (0.0%) |
| Architecture & Engineering | 0 (0.0%) | 0 (0.0%) |
| Life, Physical & Social Science | 0 (0.0%) | 0 (0.0%) |
| Community & Social Service | 0 (0.0%) | 7 (100.0%) |
| Education, Arts & Media | 0 (0.0%) | 0 (0.0%) |
| Legal Services & Support | 0 (0.0%) | 0 (0.0%) |
| Education Instruction & Library | 0 (0.0%) | 7 (100.0%) |
| Arts, Media & Entertainment | 0 (0.0%) | 0 (0.0%) |
| Health Diagnosing & Treating | 0 (0.0%) | 0 (0.0%) |
| Health Technologists | 0 (0.0%) | 0 (0.0%) |
| Total (Category) | 0 (0.0%) | 15 (100.0%) |
| Total (Overall) | 5 (25.0%) | 15 (75.0%) |
Services Occupations
Services Occupations by Sex
| Occupation | Male | Female |
| Healthcare Support | 0 (0.0%) | 0 (0.0%) |
| Security & Protection | 0 (0.0%) | 0 (0.0%) |
| Firefighting & Prevention | 0 (0.0%) | 0 (0.0%) |
| Law Enforcement | 0 (0.0%) | 0 (0.0%) |
| Food Preparation & Serving | 0 (0.0%) | 0 (0.0%) |
| Cleaning & Maintenance | 0 (0.0%) | 0 (0.0%) |
| Personal Care & Service | 0 (0.0%) | 0 (0.0%) |
| Total (Category) | 0 (0.0%) | 0 (0.0%) |
| Total (Overall) | 5 (25.0%) | 15 (75.0%) |
Sales and Office Occupations
Sales and Office Occupations by Sex
| Occupation | Male | Female |
| Sales & Related | 0 (0.0%) | 0 (0.0%) |
| Office & Administration | 0 (0.0%) | 0 (0.0%) |
| Total (Category) | 0 (0.0%) | 0 (0.0%) |
| Total (Overall) | 5 (25.0%) | 15 (75.0%) |
Natural Resources, Construction and Maintenance Occupations
The most common Natural Resources, Construction and Maintenance occupations in Arrowhead Springs are , and Installation, Maintenance & Repair (5 | 25.0%).
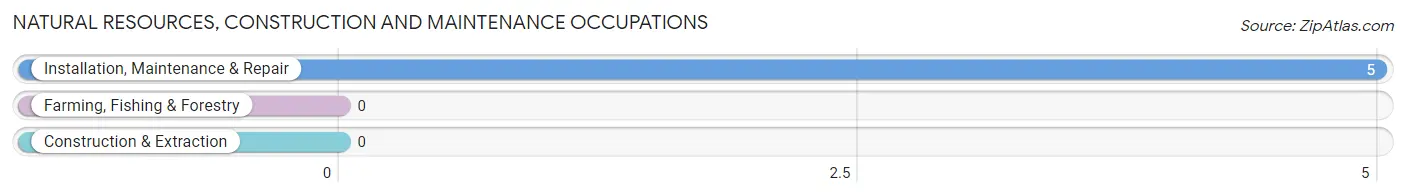
Natural Resources, Construction and Maintenance Occupations by Sex
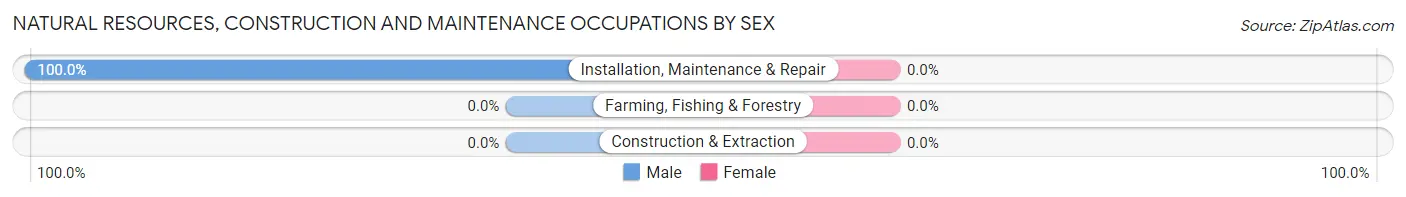
| Occupation | Male | Female |
| Farming, Fishing & Forestry | 0 (0.0%) | 0 (0.0%) |
| Construction & Extraction | 0 (0.0%) | 0 (0.0%) |
| Installation, Maintenance & Repair | 5 (100.0%) | 0 (0.0%) |
| Total (Category) | 5 (100.0%) | 0 (0.0%) |
| Total (Overall) | 5 (25.0%) | 15 (75.0%) |
Production, Transportation and Moving Occupations
Production, Transportation and Moving Occupations by Sex
| Occupation | Male | Female |
| Production | 0 (0.0%) | 0 (0.0%) |
| Transportation | 0 (0.0%) | 0 (0.0%) |
| Material Moving | 0 (0.0%) | 0 (0.0%) |
| Total (Category) | 0 (0.0%) | 0 (0.0%) |
| Total (Overall) | 5 (25.0%) | 15 (75.0%) |
Employment Industries by Sex in Arrowhead Springs
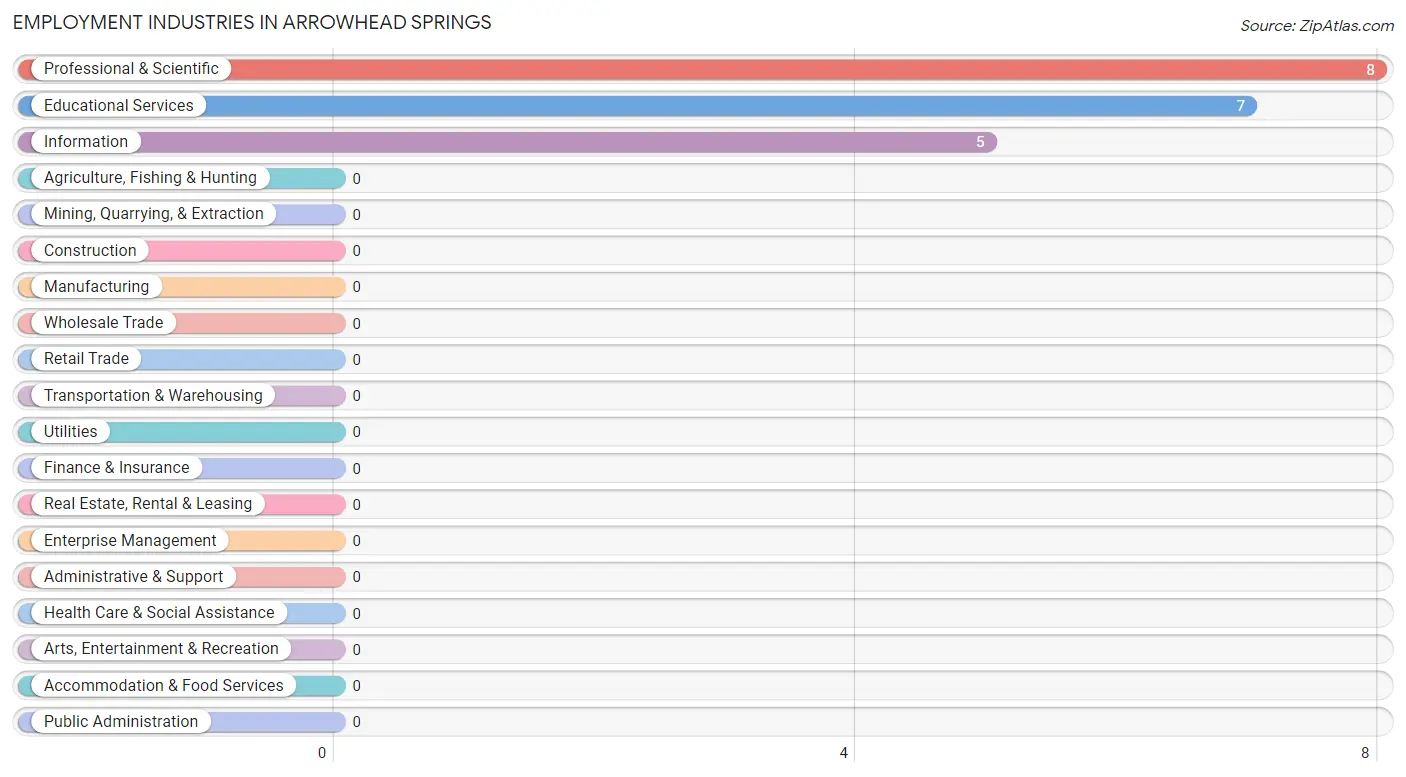
Employment Industries in Arrowhead Springs
The major employment industries in Arrowhead Springs include Professional & Scientific (8 | 40.0%), Educational Services (7 | 35.0%), and Information (5 | 25.0%).
Employment Industries by Sex in Arrowhead Springs
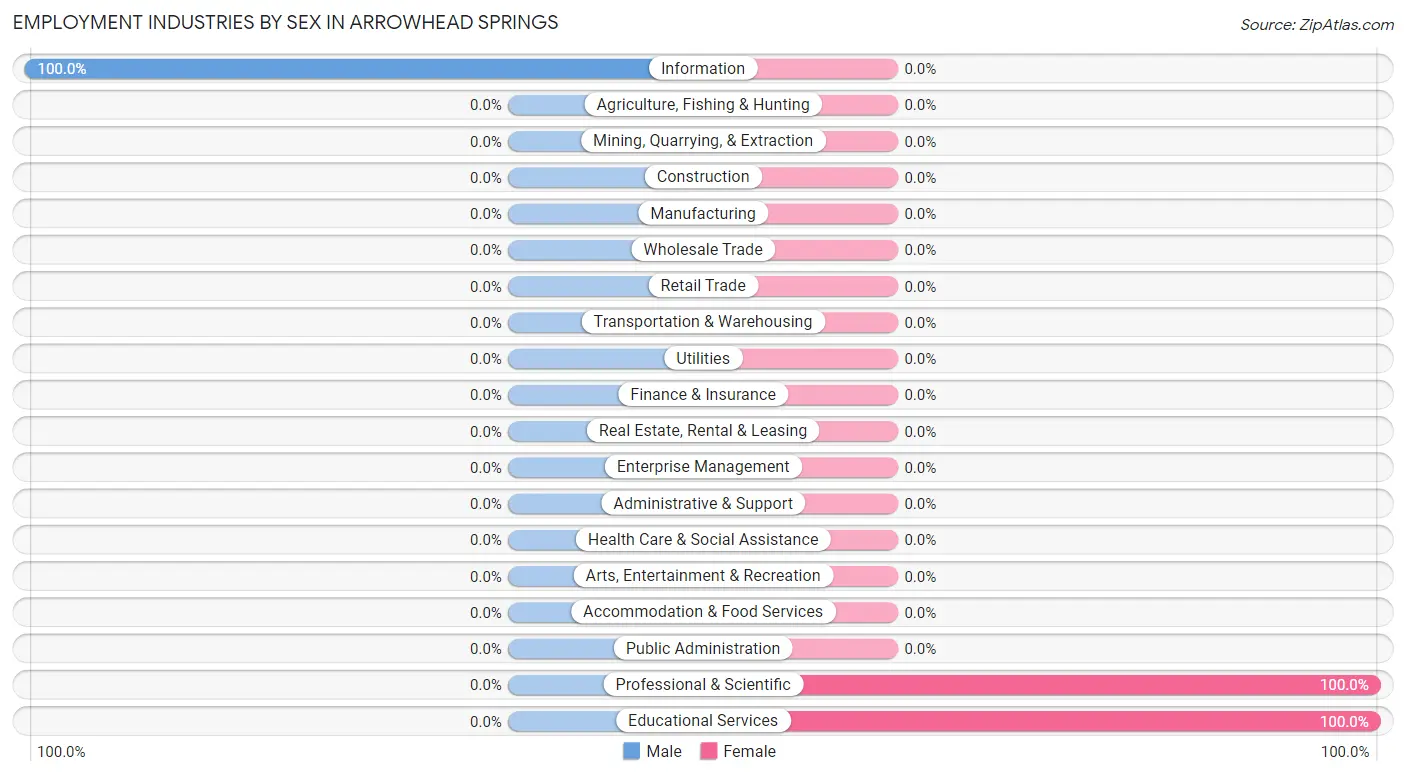
| Industry | Male | Female |
| Agriculture, Fishing & Hunting | 0 (0.0%) | 0 (0.0%) |
| Mining, Quarrying, & Extraction | 0 (0.0%) | 0 (0.0%) |
| Construction | 0 (0.0%) | 0 (0.0%) |
| Manufacturing | 0 (0.0%) | 0 (0.0%) |
| Wholesale Trade | 0 (0.0%) | 0 (0.0%) |
| Retail Trade | 0 (0.0%) | 0 (0.0%) |
| Transportation & Warehousing | 0 (0.0%) | 0 (0.0%) |
| Utilities | 0 (0.0%) | 0 (0.0%) |
| Information | 5 (100.0%) | 0 (0.0%) |
| Finance & Insurance | 0 (0.0%) | 0 (0.0%) |
| Real Estate, Rental & Leasing | 0 (0.0%) | 0 (0.0%) |
| Professional & Scientific | 0 (0.0%) | 8 (100.0%) |
| Enterprise Management | 0 (0.0%) | 0 (0.0%) |
| Administrative & Support | 0 (0.0%) | 0 (0.0%) |
| Educational Services | 0 (0.0%) | 7 (100.0%) |
| Health Care & Social Assistance | 0 (0.0%) | 0 (0.0%) |
| Arts, Entertainment & Recreation | 0 (0.0%) | 0 (0.0%) |
| Accommodation & Food Services | 0 (0.0%) | 0 (0.0%) |
| Public Administration | 0 (0.0%) | 0 (0.0%) |
| Total | 5 (25.0%) | 15 (75.0%) |
Education in Arrowhead Springs
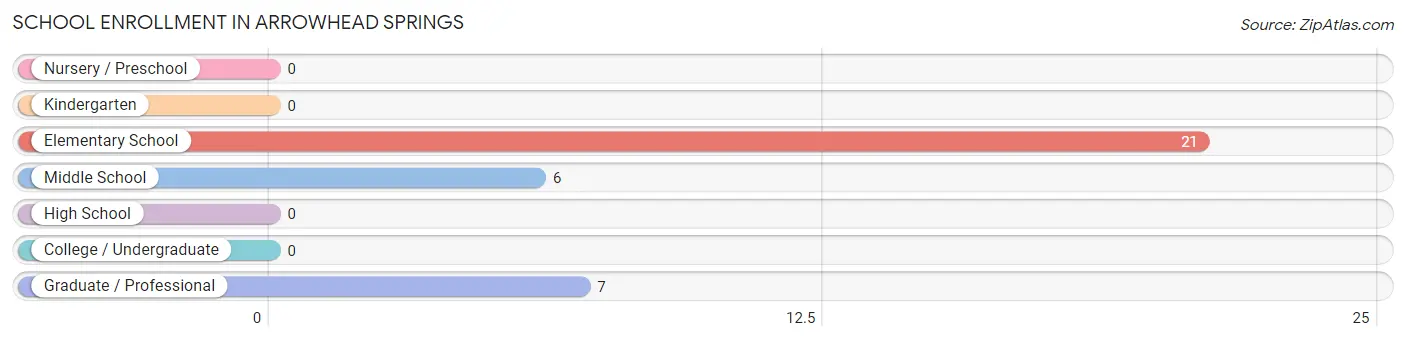
School Enrollment in Arrowhead Springs
The most common levels of schooling among the 34 students in Arrowhead Springs are elementary school (21 | 61.8%), graduate / professional (7 | 20.6%), and middle school (6 | 17.6%).
| School Level | # Students | % Students |
| Nursery / Preschool | 0 | 0.0% |
| Kindergarten | 0 | 0.0% |
| Elementary School | 21 | 61.8% |
| Middle School | 6 | 17.6% |
| High School | 0 | 0.0% |
| College / Undergraduate | 0 | 0.0% |
| Graduate / Professional | 7 | 20.6% |
| Total | 34 | 100.0% |
School Enrollment by Age by Funding Source in Arrowhead Springs
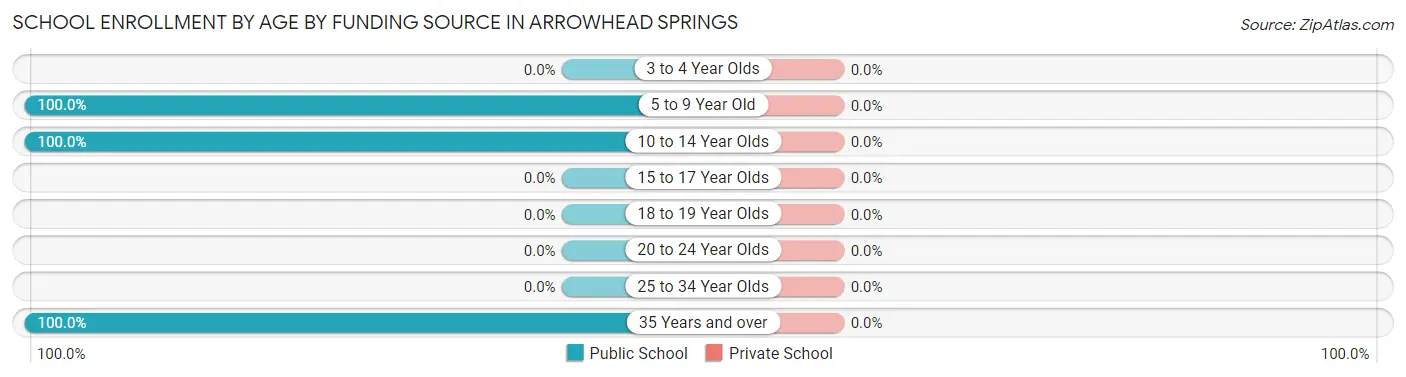
| Age Bracket | Public School | Private School |
| 3 to 4 Year Olds | 0 (0.0%) | 0 (0.0%) |
| 5 to 9 Year Old | 15 (100.0%) | 0 (0.0%) |
| 10 to 14 Year Olds | 12 (100.0%) | 0 (0.0%) |
| 15 to 17 Year Olds | 0 (0.0%) | 0 (0.0%) |
| 18 to 19 Year Olds | 0 (0.0%) | 0 (0.0%) |
| 20 to 24 Year Olds | 0 (0.0%) | 0 (0.0%) |
| 25 to 34 Year Olds | 0 (0.0%) | 0 (0.0%) |
| 35 Years and over | 7 (100.0%) | 0 (0.0%) |
| Total | 34 (100.0%) | 0 (0.0%) |
Educational Attainment by Field of Study in Arrowhead Springs
Education (15 | 51.7%), bio, nature & agricultural (7 | 24.1%), and science & technology (7 | 24.1%) are the most common fields of study among 29 individuals in Arrowhead Springs who have obtained a bachelor's degree or higher.
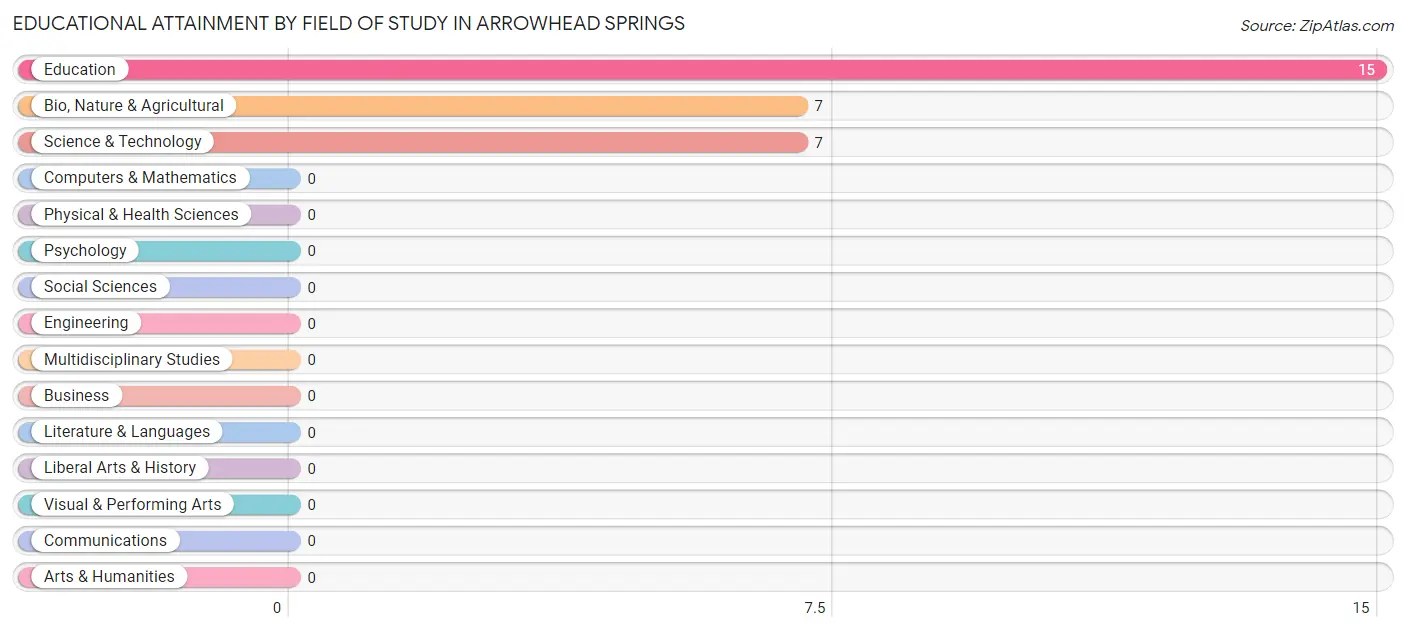
| Field of Study | # Graduates | % Graduates |
| Computers & Mathematics | 0 | 0.0% |
| Bio, Nature & Agricultural | 7 | 24.1% |
| Physical & Health Sciences | 0 | 0.0% |
| Psychology | 0 | 0.0% |
| Social Sciences | 0 | 0.0% |
| Engineering | 0 | 0.0% |
| Multidisciplinary Studies | 0 | 0.0% |
| Science & Technology | 7 | 24.1% |
| Business | 0 | 0.0% |
| Education | 15 | 51.7% |
| Literature & Languages | 0 | 0.0% |
| Liberal Arts & History | 0 | 0.0% |
| Visual & Performing Arts | 0 | 0.0% |
| Communications | 0 | 0.0% |
| Arts & Humanities | 0 | 0.0% |
| Total | 29 | 100.0% |
Transportation & Commute in Arrowhead Springs
Vehicle Availability by Sex in Arrowhead Springs
The most prevalent vehicle ownership categories in Arrowhead Springs are males with 2 vehicles (5, accounting for 100.0%) and females with 2 vehicles (0, making up 62.5%).
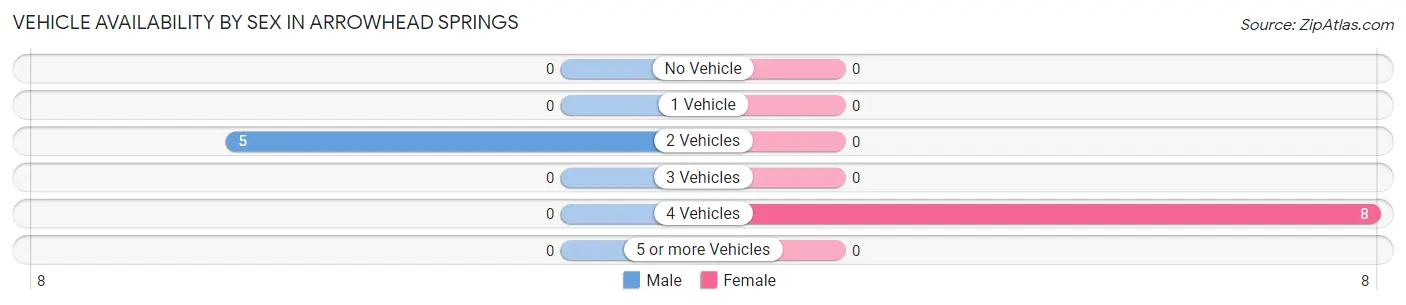
| Vehicles Available | Male | Female |
| No Vehicle | 0 (0.0%) | 0 (0.0%) |
| 1 Vehicle | 0 (0.0%) | 0 (0.0%) |
| 2 Vehicles | 5 (100.0%) | 0 (0.0%) |
| 3 Vehicles | 0 (0.0%) | 0 (0.0%) |
| 4 Vehicles | 0 (0.0%) | 8 (100.0%) |
| 5 or more Vehicles | 0 (0.0%) | 0 (0.0%) |
| Total | 5 (100.0%) | 8 (100.0%) |
Commute Time in Arrowhead Springs
The most frequently occuring commute durations in Arrowhead Springs are 15 to 19 minutes (8 commuters, 61.5%), 10 to 14 minutes (5 commuters, 38.5%), and less than 5 minutes (0 commuters, 0.0%).
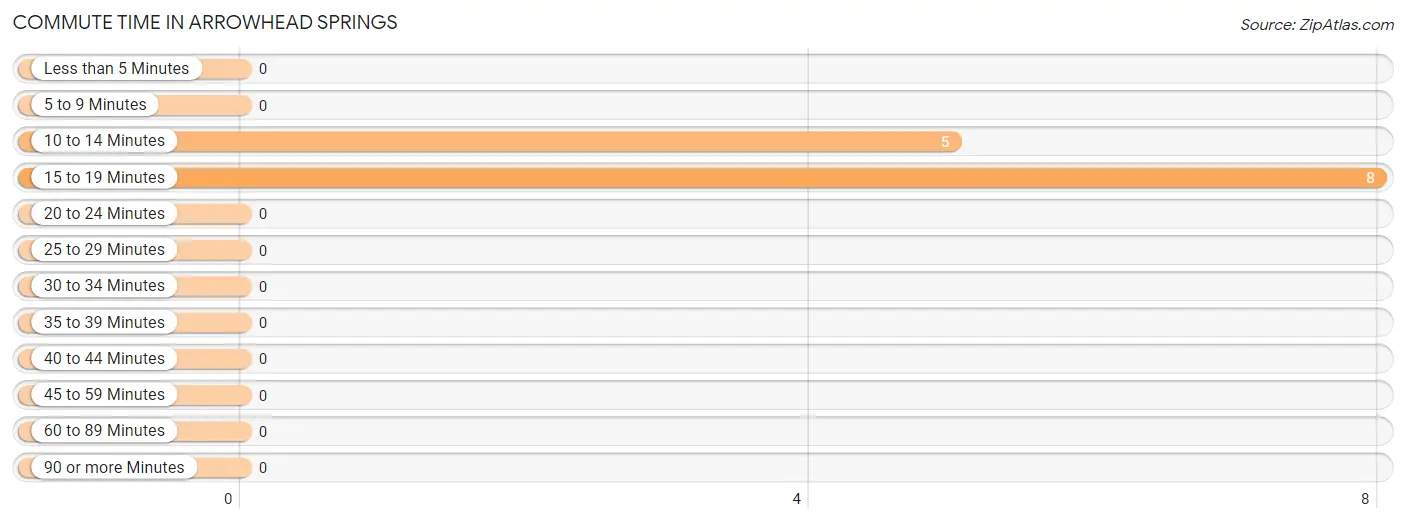
| Commute Time | # Commuters | % Commuters |
| Less than 5 Minutes | 0 | 0.0% |
| 5 to 9 Minutes | 0 | 0.0% |
| 10 to 14 Minutes | 5 | 38.5% |
| 15 to 19 Minutes | 8 | 61.5% |
| 20 to 24 Minutes | 0 | 0.0% |
| 25 to 29 Minutes | 0 | 0.0% |
| 30 to 34 Minutes | 0 | 0.0% |
| 35 to 39 Minutes | 0 | 0.0% |
| 40 to 44 Minutes | 0 | 0.0% |
| 45 to 59 Minutes | 0 | 0.0% |
| 60 to 89 Minutes | 0 | 0.0% |
| 90 or more Minutes | 0 | 0.0% |
Commute Time by Sex in Arrowhead Springs
The most common commute times in Arrowhead Springs are 10 to 14 minutes (5 commuters, 100.0%) for males and 15 to 19 minutes (8 commuters, 100.0%) for females.
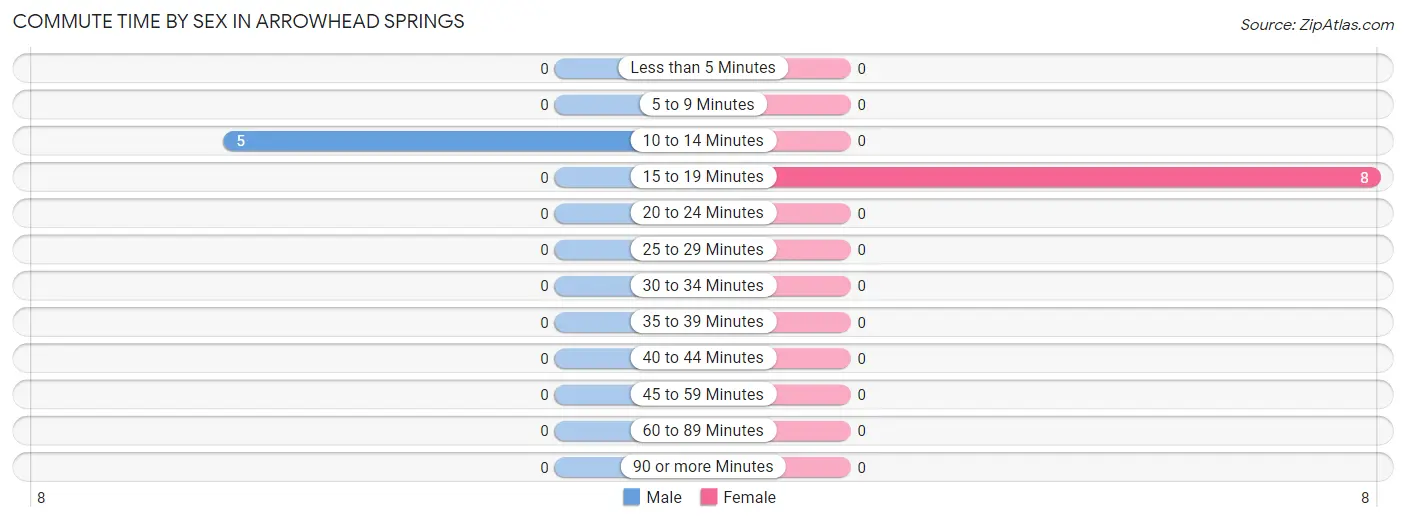
| Commute Time | Male | Female |
| Less than 5 Minutes | 0 (0.0%) | 0 (0.0%) |
| 5 to 9 Minutes | 0 (0.0%) | 0 (0.0%) |
| 10 to 14 Minutes | 5 (100.0%) | 0 (0.0%) |
| 15 to 19 Minutes | 0 (0.0%) | 8 (100.0%) |
| 20 to 24 Minutes | 0 (0.0%) | 0 (0.0%) |
| 25 to 29 Minutes | 0 (0.0%) | 0 (0.0%) |
| 30 to 34 Minutes | 0 (0.0%) | 0 (0.0%) |
| 35 to 39 Minutes | 0 (0.0%) | 0 (0.0%) |
| 40 to 44 Minutes | 0 (0.0%) | 0 (0.0%) |
| 45 to 59 Minutes | 0 (0.0%) | 0 (0.0%) |
| 60 to 89 Minutes | 0 (0.0%) | 0 (0.0%) |
| 90 or more Minutes | 0 (0.0%) | 0 (0.0%) |
Time of Departure to Work by Sex in Arrowhead Springs
The most frequent times of departure to work in Arrowhead Springs are 8:00 AM to 8:29 AM (5, 100.0%) for males and 8:00 AM to 8:29 AM (8, 100.0%) for females.
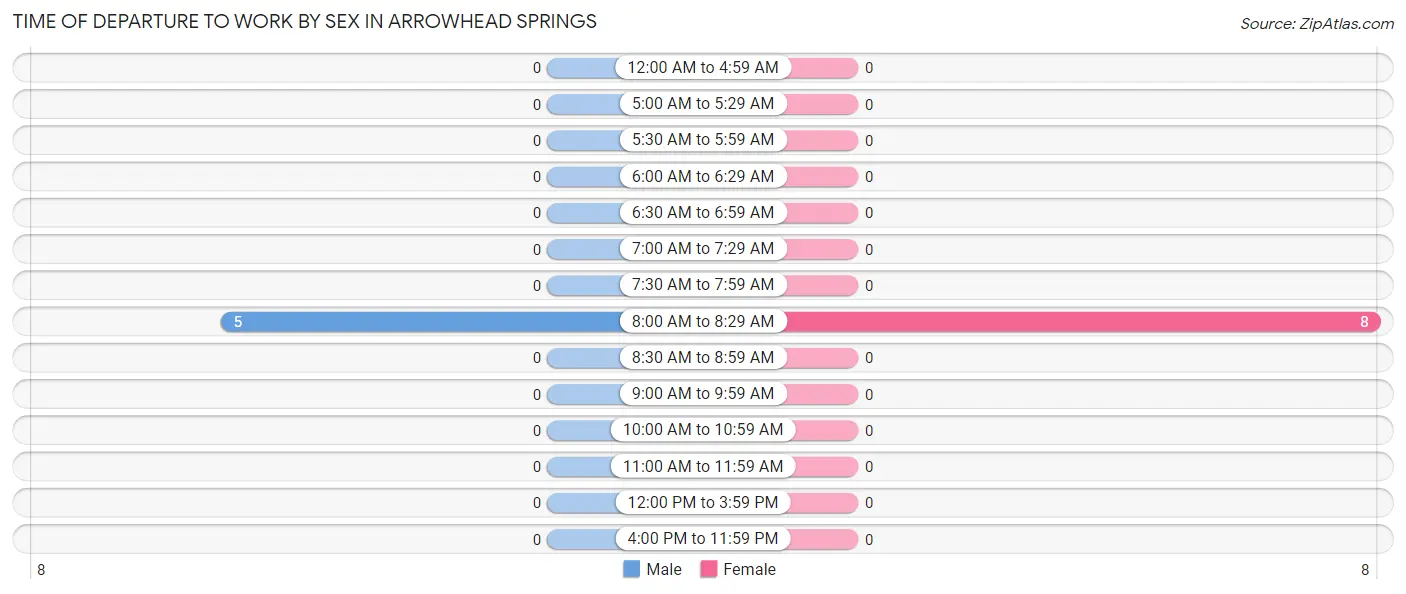
| Time of Departure | Male | Female |
| 12:00 AM to 4:59 AM | 0 (0.0%) | 0 (0.0%) |
| 5:00 AM to 5:29 AM | 0 (0.0%) | 0 (0.0%) |
| 5:30 AM to 5:59 AM | 0 (0.0%) | 0 (0.0%) |
| 6:00 AM to 6:29 AM | 0 (0.0%) | 0 (0.0%) |
| 6:30 AM to 6:59 AM | 0 (0.0%) | 0 (0.0%) |
| 7:00 AM to 7:29 AM | 0 (0.0%) | 0 (0.0%) |
| 7:30 AM to 7:59 AM | 0 (0.0%) | 0 (0.0%) |
| 8:00 AM to 8:29 AM | 5 (100.0%) | 8 (100.0%) |
| 8:30 AM to 8:59 AM | 0 (0.0%) | 0 (0.0%) |
| 9:00 AM to 9:59 AM | 0 (0.0%) | 0 (0.0%) |
| 10:00 AM to 10:59 AM | 0 (0.0%) | 0 (0.0%) |
| 11:00 AM to 11:59 AM | 0 (0.0%) | 0 (0.0%) |
| 12:00 PM to 3:59 PM | 0 (0.0%) | 0 (0.0%) |
| 4:00 PM to 11:59 PM | 0 (0.0%) | 0 (0.0%) |
| Total | 5 (100.0%) | 8 (100.0%) |
Housing Occupancy in Arrowhead Springs
Occupancy by Ownership in Arrowhead Springs
Of the total 26 dwellings in Arrowhead Springs, owner-occupied units account for 26 (100.0%), while renter-occupied units make up 0 (0.0%).
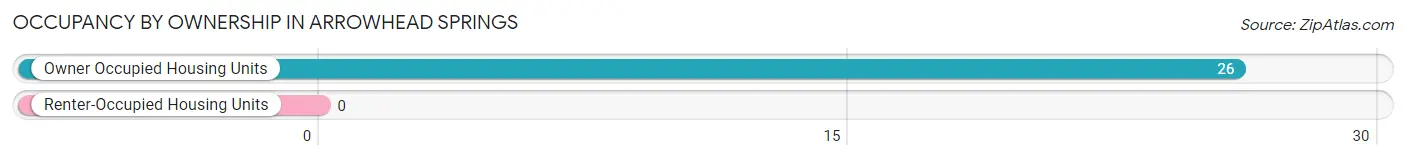
| Occupancy | # Housing Units | % Housing Units |
| Owner Occupied Housing Units | 26 | 100.0% |
| Renter-Occupied Housing Units | 0 | 0.0% |
| Total Occupied Housing Units | 26 | 100.0% |
Occupancy by Household Size in Arrowhead Springs
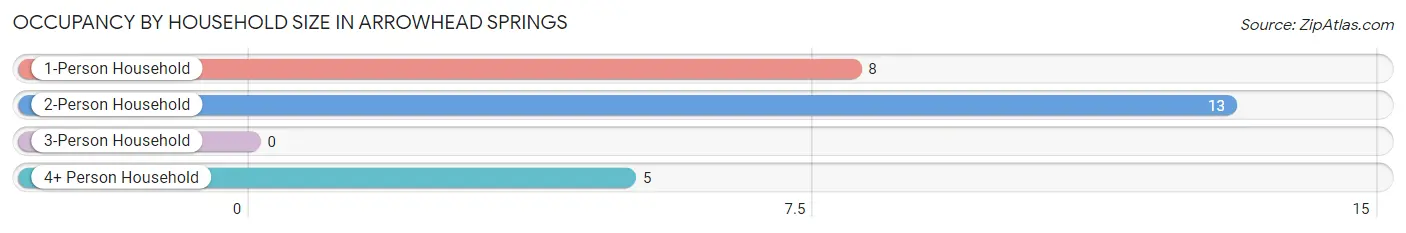
| Household Size | # Housing Units | % Housing Units |
| 1-Person Household | 8 | 30.8% |
| 2-Person Household | 13 | 50.0% |
| 3-Person Household | 0 | 0.0% |
| 4+ Person Household | 5 | 19.2% |
| Total Housing Units | 26 | 100.0% |
Occupancy by Ownership by Household Size in Arrowhead Springs
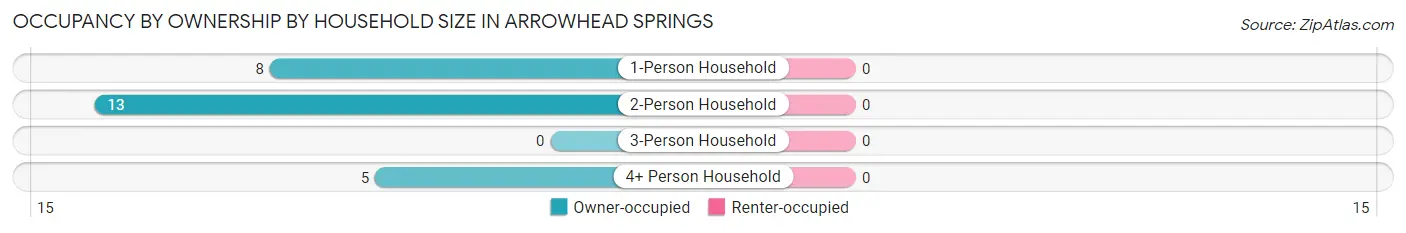
| Household Size | Owner-occupied | Renter-occupied |
| 1-Person Household | 8 (100.0%) | 0 (0.0%) |
| 2-Person Household | 13 (100.0%) | 0 (0.0%) |
| 3-Person Household | 0 (0.0%) | 0 (0.0%) |
| 4+ Person Household | 5 (100.0%) | 0 (0.0%) |
| Total Housing Units | 26 (100.0%) | 0 (0.0%) |
Occupancy by Educational Attainment in Arrowhead Springs
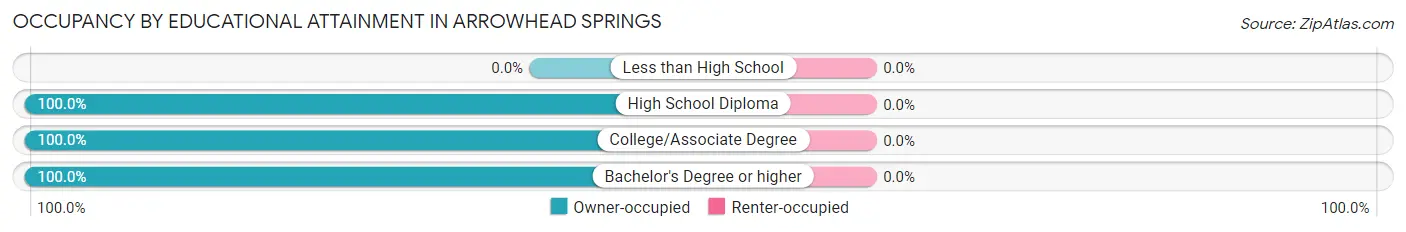
| Household Size | Owner-occupied | Renter-occupied |
| Less than High School | 0 (0.0%) | 0 (0.0%) |
| High School Diploma | 5 (100.0%) | 0 (0.0%) |
| College/Associate Degree | 6 (100.0%) | 0 (0.0%) |
| Bachelor's Degree or higher | 15 (100.0%) | 0 (0.0%) |
Occupancy by Age of Householder in Arrowhead Springs
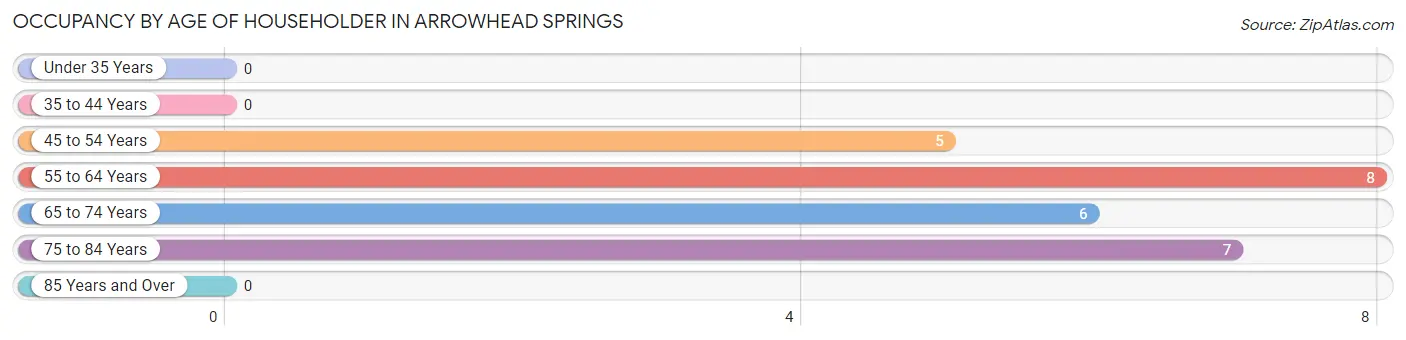
| Age Bracket | # Households | % Households |
| Under 35 Years | 0 | 0.0% |
| 35 to 44 Years | 0 | 0.0% |
| 45 to 54 Years | 5 | 19.2% |
| 55 to 64 Years | 8 | 30.8% |
| 65 to 74 Years | 6 | 23.1% |
| 75 to 84 Years | 7 | 26.9% |
| 85 Years and Over | 0 | 0.0% |
| Total | 26 | 100.0% |
Housing Finances in Arrowhead Springs
Median Income by Occupancy in Arrowhead Springs
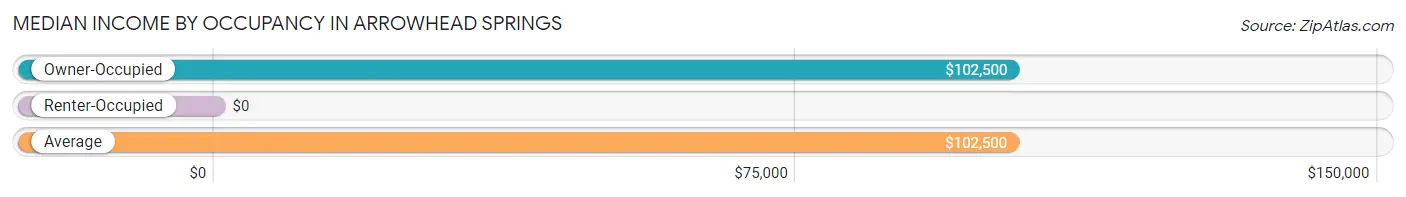
| Occupancy Type | # Households | Median Income |
| Owner-Occupied | 26 (100.0%) | $102,500 |
| Renter-Occupied | 0 (0.0%) | $0 |
| Average | 26 (100.0%) | $102,500 |
Occupancy by Householder Income Bracket in Arrowhead Springs
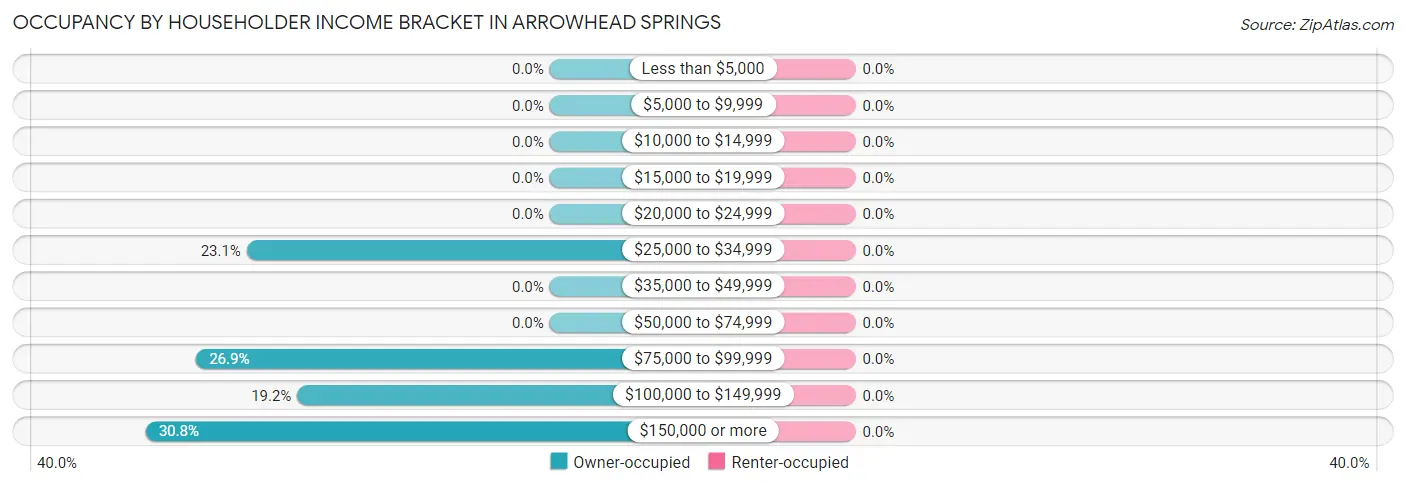
| Income Bracket | Owner-occupied | Renter-occupied |
| Less than $5,000 | 0 (0.0%) | 0 (0.0%) |
| $5,000 to $9,999 | 0 (0.0%) | 0 (0.0%) |
| $10,000 to $14,999 | 0 (0.0%) | 0 (0.0%) |
| $15,000 to $19,999 | 0 (0.0%) | 0 (0.0%) |
| $20,000 to $24,999 | 0 (0.0%) | 0 (0.0%) |
| $25,000 to $34,999 | 6 (23.1%) | 0 (0.0%) |
| $35,000 to $49,999 | 0 (0.0%) | 0 (0.0%) |
| $50,000 to $74,999 | 0 (0.0%) | 0 (0.0%) |
| $75,000 to $99,999 | 7 (26.9%) | 0 (0.0%) |
| $100,000 to $149,999 | 5 (19.2%) | 0 (0.0%) |
| $150,000 or more | 8 (30.8%) | 0 (0.0%) |
| Total | 26 (100.0%) | 0 (0.0%) |
Monthly Housing Cost Tiers in Arrowhead Springs
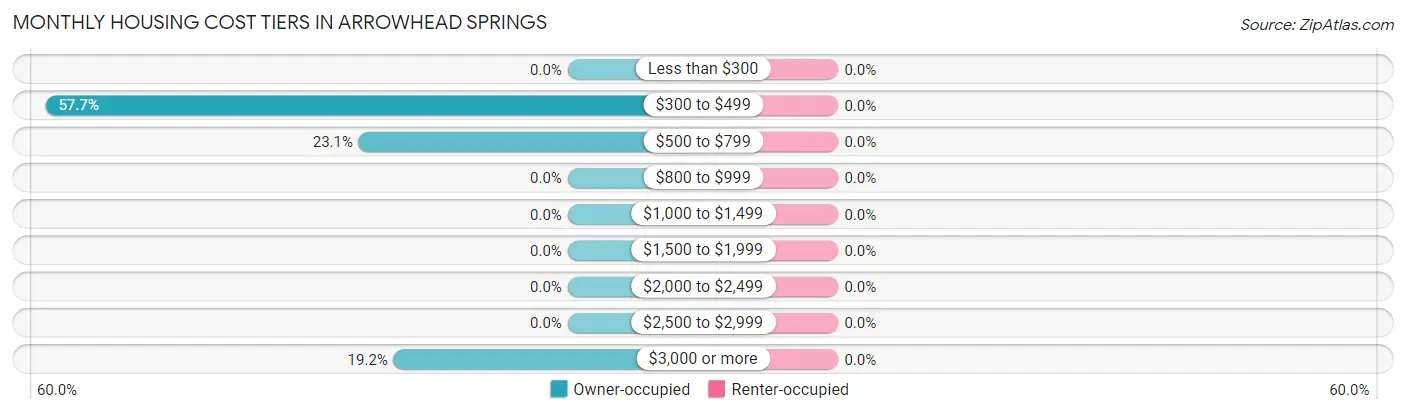
| Monthly Cost | Owner-occupied | Renter-occupied |
| Less than $300 | 0 (0.0%) | 0 (0.0%) |
| $300 to $499 | 15 (57.7%) | 0 (0.0%) |
| $500 to $799 | 6 (23.1%) | 0 (0.0%) |
| $800 to $999 | 0 (0.0%) | 0 (0.0%) |
| $1,000 to $1,499 | 0 (0.0%) | 0 (0.0%) |
| $1,500 to $1,999 | 0 (0.0%) | 0 (0.0%) |
| $2,000 to $2,499 | 0 (0.0%) | 0 (0.0%) |
| $2,500 to $2,999 | 0 (0.0%) | 0 (0.0%) |
| $3,000 or more | 5 (19.2%) | 0 (0.0%) |
| Total | 26 (100.0%) | 0 (0.0%) |
Physical Housing Characteristics in Arrowhead Springs
Housing Structures in Arrowhead Springs
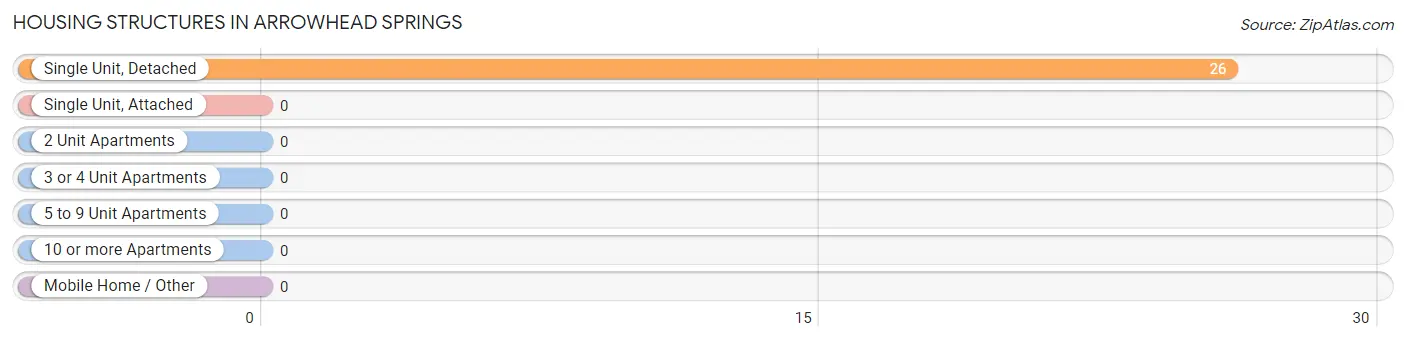
| Structure Type | # Housing Units | % Housing Units |
| Single Unit, Detached | 26 | 100.0% |
| Single Unit, Attached | 0 | 0.0% |
| 2 Unit Apartments | 0 | 0.0% |
| 3 or 4 Unit Apartments | 0 | 0.0% |
| 5 to 9 Unit Apartments | 0 | 0.0% |
| 10 or more Apartments | 0 | 0.0% |
| Mobile Home / Other | 0 | 0.0% |
| Total | 26 | 100.0% |
Housing Structures by Occupancy in Arrowhead Springs
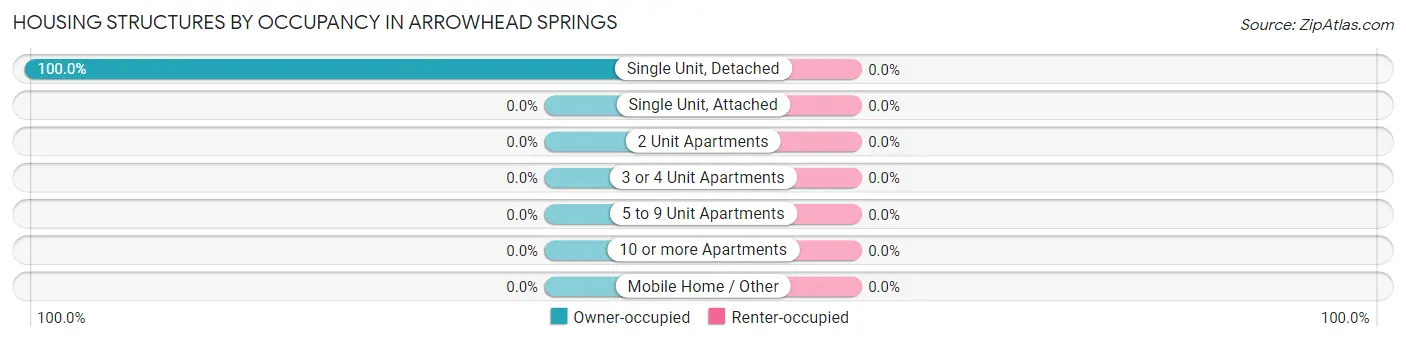
| Structure Type | Owner-occupied | Renter-occupied |
| Single Unit, Detached | 26 (100.0%) | 0 (0.0%) |
| Single Unit, Attached | 0 (0.0%) | 0 (0.0%) |
| 2 Unit Apartments | 0 (0.0%) | 0 (0.0%) |
| 3 or 4 Unit Apartments | 0 (0.0%) | 0 (0.0%) |
| 5 to 9 Unit Apartments | 0 (0.0%) | 0 (0.0%) |
| 10 or more Apartments | 0 (0.0%) | 0 (0.0%) |
| Mobile Home / Other | 0 (0.0%) | 0 (0.0%) |
| Total | 26 (100.0%) | 0 (0.0%) |
Housing Structures by Number of Rooms in Arrowhead Springs
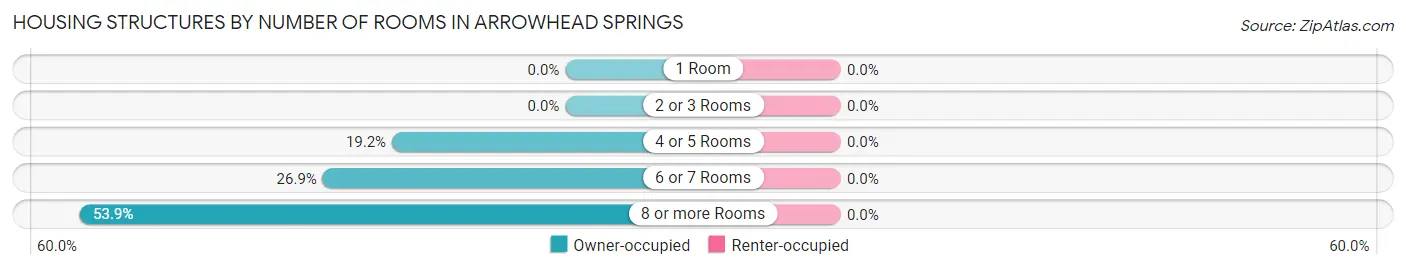
| Number of Rooms | Owner-occupied | Renter-occupied |
| 1 Room | 0 (0.0%) | 0 (0.0%) |
| 2 or 3 Rooms | 0 (0.0%) | 0 (0.0%) |
| 4 or 5 Rooms | 5 (19.2%) | 0 (0.0%) |
| 6 or 7 Rooms | 7 (26.9%) | 0 (0.0%) |
| 8 or more Rooms | 14 (53.8%) | 0 (0.0%) |
| Total | 26 (100.0%) | 0 (0.0%) |
Housing Structure by Heating Type in Arrowhead Springs
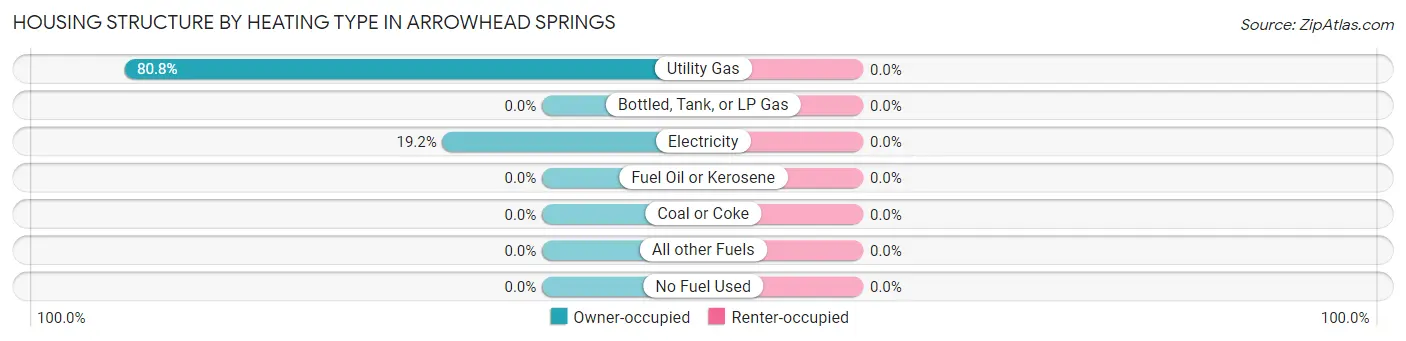
| Heating Type | Owner-occupied | Renter-occupied |
| Utility Gas | 21 (80.8%) | 0 (0.0%) |
| Bottled, Tank, or LP Gas | 0 (0.0%) | 0 (0.0%) |
| Electricity | 5 (19.2%) | 0 (0.0%) |
| Fuel Oil or Kerosene | 0 (0.0%) | 0 (0.0%) |
| Coal or Coke | 0 (0.0%) | 0 (0.0%) |
| All other Fuels | 0 (0.0%) | 0 (0.0%) |
| No Fuel Used | 0 (0.0%) | 0 (0.0%) |
| Total | 26 (100.0%) | 0 (0.0%) |
Household Vehicle Usage in Arrowhead Springs
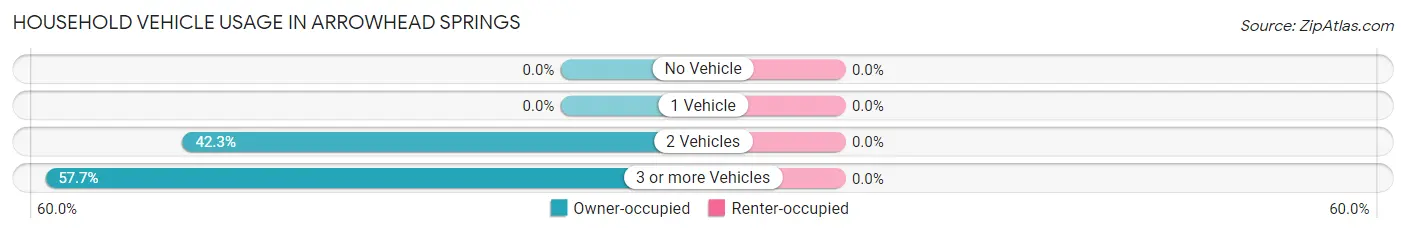
| Vehicles per Household | Owner-occupied | Renter-occupied |
| No Vehicle | 0 (0.0%) | 0 (0.0%) |
| 1 Vehicle | 0 (0.0%) | 0 (0.0%) |
| 2 Vehicles | 11 (42.3%) | 0 (0.0%) |
| 3 or more Vehicles | 15 (57.7%) | 0 (0.0%) |
| Total | 26 (100.0%) | 0 (0.0%) |
Real Estate & Mortgages in Arrowhead Springs
Real Estate and Mortgage Overview in Arrowhead Springs
| Characteristic | Without Mortgage | With Mortgage |
| Housing Units | 21 | 5 |
| Median Property Value | $358,300 | $0 |
| Median Household Income | - | - |
| Monthly Housing Costs | $470 | $5 |
| Real Estate Taxes | $2,700 | $0 |
Property Value by Mortgage Status in Arrowhead Springs
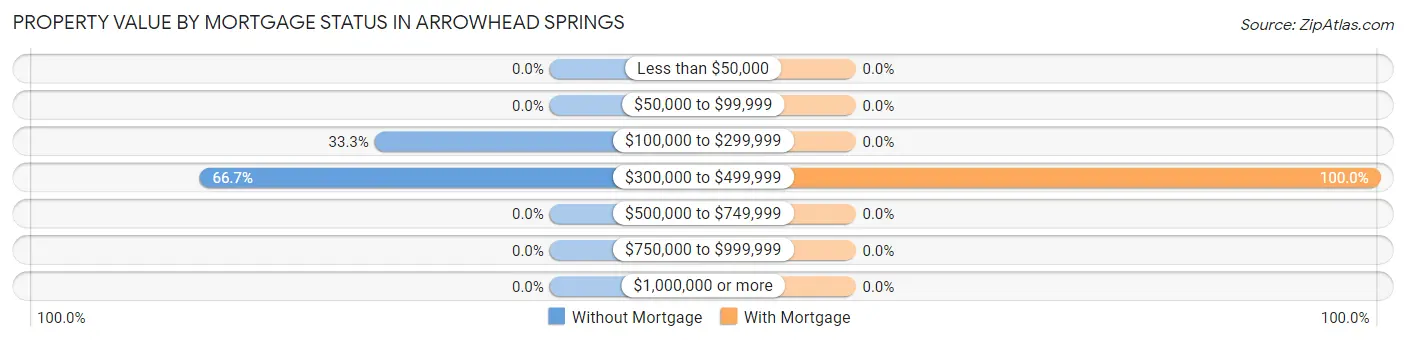
| Property Value | Without Mortgage | With Mortgage |
| Less than $50,000 | 0 (0.0%) | 0 (0.0%) |
| $50,000 to $99,999 | 0 (0.0%) | 0 (0.0%) |
| $100,000 to $299,999 | 7 (33.3%) | 0 (0.0%) |
| $300,000 to $499,999 | 14 (66.7%) | 5 (100.0%) |
| $500,000 to $749,999 | 0 (0.0%) | 0 (0.0%) |
| $750,000 to $999,999 | 0 (0.0%) | 0 (0.0%) |
| $1,000,000 or more | 0 (0.0%) | 0 (0.0%) |
| Total | 21 (100.0%) | 5 (100.0%) |
Household Income by Mortgage Status in Arrowhead Springs
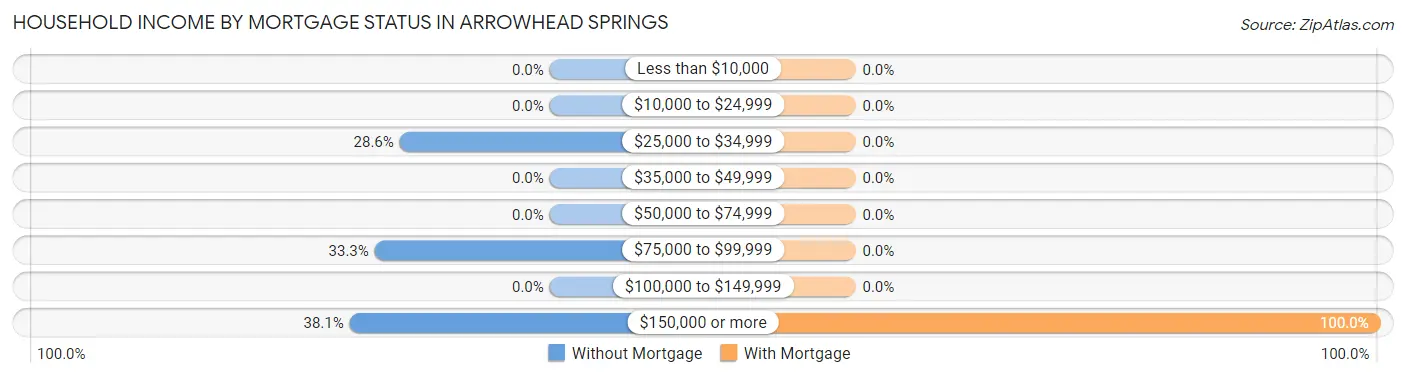
| Household Income | Without Mortgage | With Mortgage |
| Less than $10,000 | 0 (0.0%) | 0 (0.0%) |
| $10,000 to $24,999 | 0 (0.0%) | 0 (0.0%) |
| $25,000 to $34,999 | 6 (28.6%) | 0 (0.0%) |
| $35,000 to $49,999 | 0 (0.0%) | 0 (0.0%) |
| $50,000 to $74,999 | 0 (0.0%) | 0 (0.0%) |
| $75,000 to $99,999 | 7 (33.3%) | 0 (0.0%) |
| $100,000 to $149,999 | 0 (0.0%) | 0 (0.0%) |
| $150,000 or more | 8 (38.1%) | 5 (100.0%) |
| Total | 21 (100.0%) | 5 (100.0%) |
Property Value to Household Income Ratio in Arrowhead Springs
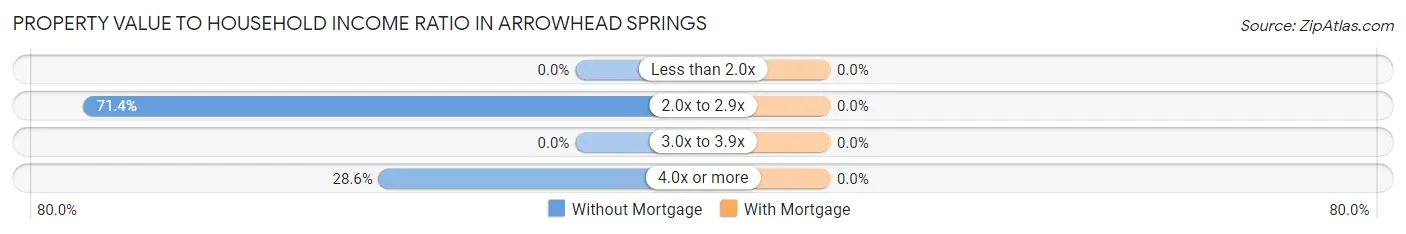
| Value-to-Income Ratio | Without Mortgage | With Mortgage |
| Less than 2.0x | 0 (0.0%) | 0 (0.0%) |
| 2.0x to 2.9x | 15 (71.4%) | 0 (0.0%) |
| 3.0x to 3.9x | 0 (0.0%) | 0 (0.0%) |
| 4.0x or more | 6 (28.6%) | 0 (0.0%) |
| Total | 21 (100.0%) | 5 (100.0%) |
Real Estate Taxes by Mortgage Status in Arrowhead Springs
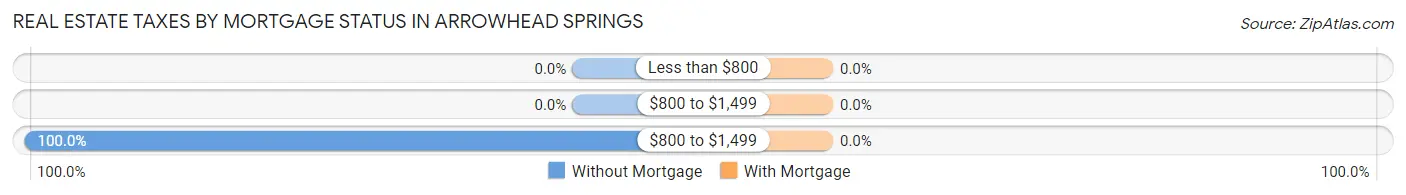
| Property Taxes | Without Mortgage | With Mortgage |
| Less than $800 | 0 (0.0%) | 0 (0.0%) |
| $800 to $1,499 | 0 (0.0%) | 0 (0.0%) |
| $800 to $1,499 | 21 (100.0%) | 0 (0.0%) |
| Total | 21 (100.0%) | 5 (100.0%) |
Health & Disability in Arrowhead Springs
Health Insurance Coverage by Age in Arrowhead Springs
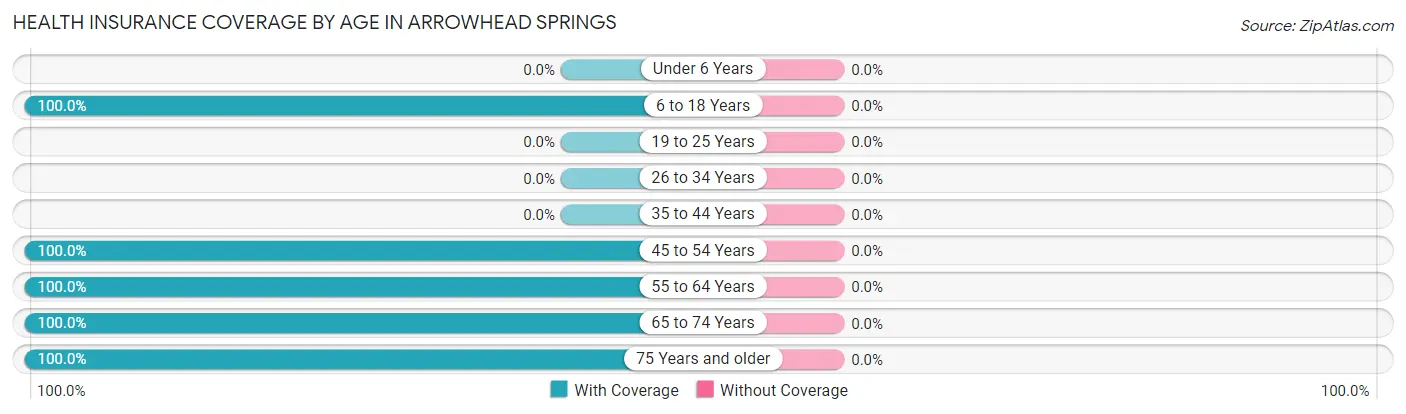
| Age Bracket | With Coverage | Without Coverage |
| Under 6 Years | 0 (0.0%) | 0 (0.0%) |
| 6 to 18 Years | 27 (100.0%) | 0 (0.0%) |
| 19 to 25 Years | 0 (0.0%) | 0 (0.0%) |
| 26 to 34 Years | 0 (0.0%) | 0 (0.0%) |
| 35 to 44 Years | 0 (0.0%) | 0 (0.0%) |
| 45 to 54 Years | 12 (100.0%) | 0 (0.0%) |
| 55 to 64 Years | 8 (100.0%) | 0 (0.0%) |
| 65 to 74 Years | 11 (100.0%) | 0 (0.0%) |
| 75 Years and older | 14 (100.0%) | 0 (0.0%) |
| Total | 72 (100.0%) | 0 (0.0%) |
Health Insurance Coverage by Citizenship Status in Arrowhead Springs
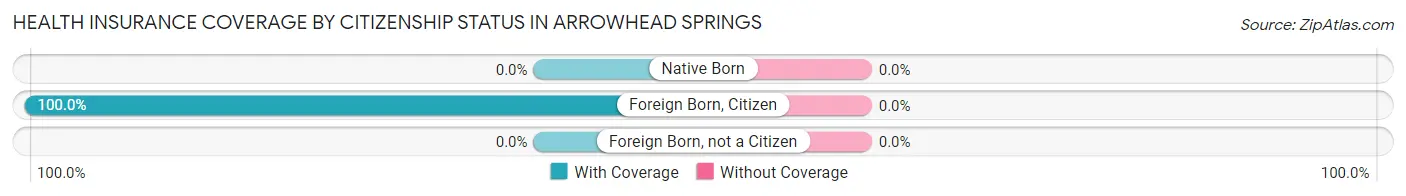
| Citizenship Status | With Coverage | Without Coverage |
| Native Born | 0 (0.0%) | 0 (0.0%) |
| Foreign Born, Citizen | 27 (100.0%) | 0 (0.0%) |
| Foreign Born, not a Citizen | 0 (0.0%) | 0 (0.0%) |
Health Insurance Coverage by Household Income in Arrowhead Springs
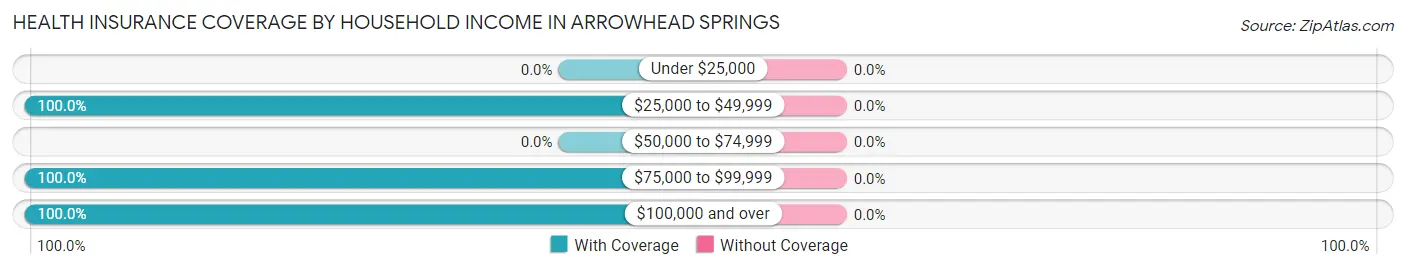
| Household Income | With Coverage | Without Coverage |
| Under $25,000 | 0 (0.0%) | 0 (0.0%) |
| $25,000 to $49,999 | 11 (100.0%) | 0 (0.0%) |
| $50,000 to $74,999 | 0 (0.0%) | 0 (0.0%) |
| $75,000 to $99,999 | 14 (100.0%) | 0 (0.0%) |
| $100,000 and over | 47 (100.0%) | 0 (0.0%) |
Public vs Private Health Insurance Coverage by Age in Arrowhead Springs
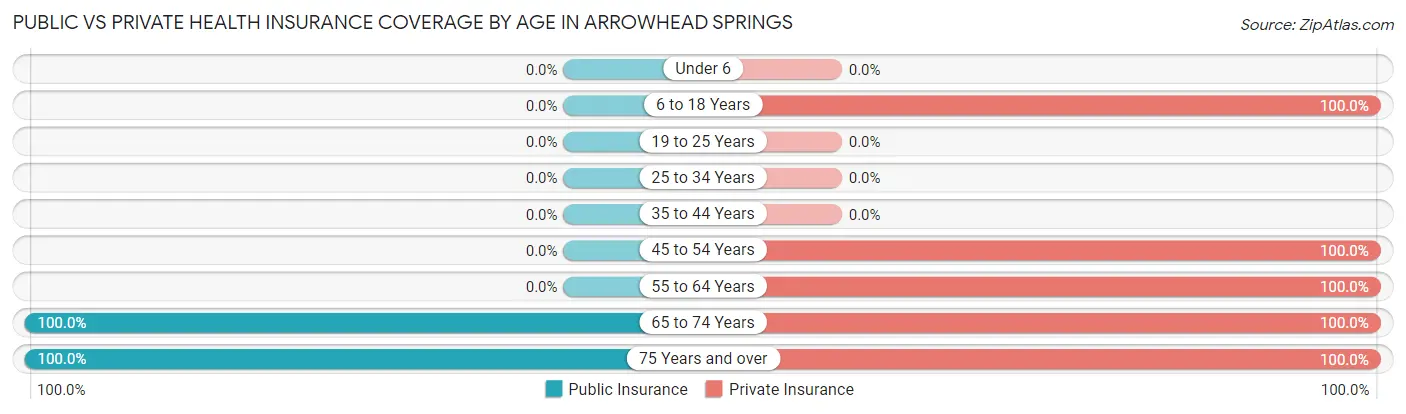
| Age Bracket | Public Insurance | Private Insurance |
| Under 6 | 0 (0.0%) | 0 (0.0%) |
| 6 to 18 Years | 0 (0.0%) | 27 (100.0%) |
| 19 to 25 Years | 0 (0.0%) | 0 (0.0%) |
| 25 to 34 Years | 0 (0.0%) | 0 (0.0%) |
| 35 to 44 Years | 0 (0.0%) | 0 (0.0%) |
| 45 to 54 Years | 0 (0.0%) | 12 (100.0%) |
| 55 to 64 Years | 0 (0.0%) | 8 (100.0%) |
| 65 to 74 Years | 11 (100.0%) | 11 (100.0%) |
| 75 Years and over | 14 (100.0%) | 14 (100.0%) |
| Total | 25 (34.7%) | 72 (100.0%) |
Disability Status by Sex by Age in Arrowhead Springs

| Age Bracket | Male | Female |
| Under 5 Years | 0 (0.0%) | 0 (0.0%) |
| 5 to 17 Years | 0 (0.0%) | 0 (0.0%) |
| 18 to 34 Years | 0 (0.0%) | 0 (0.0%) |
| 35 to 64 Years | 0 (0.0%) | 0 (0.0%) |
| 65 to 74 Years | 6 (100.0%) | 0 (0.0%) |
| 75 Years and over | 7 (100.0%) | 0 (0.0%) |
Disability Class by Sex by Age in Arrowhead Springs
Disability Class: Hearing Difficulty
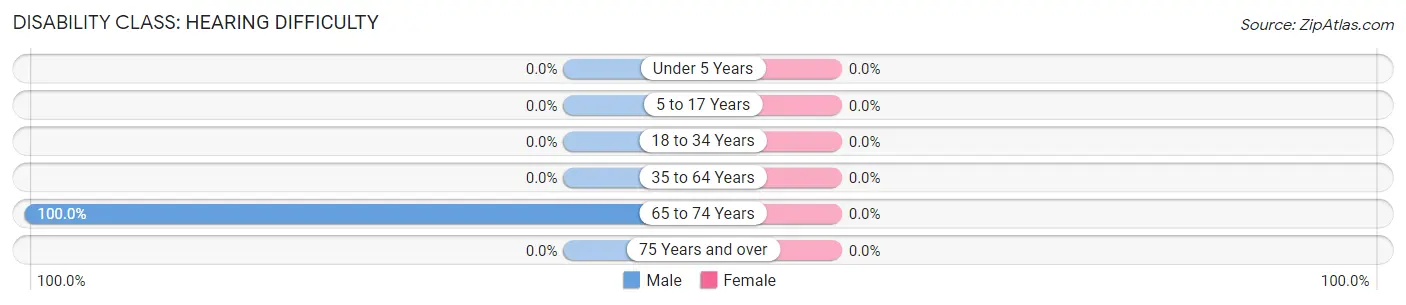
| Age Bracket | Male | Female |
| Under 5 Years | 0 (0.0%) | 0 (0.0%) |
| 5 to 17 Years | 0 (0.0%) | 0 (0.0%) |
| 18 to 34 Years | 0 (0.0%) | 0 (0.0%) |
| 35 to 64 Years | 0 (0.0%) | 0 (0.0%) |
| 65 to 74 Years | 6 (100.0%) | 0 (0.0%) |
| 75 Years and over | 0 (0.0%) | 0 (0.0%) |
Disability Class: Vision Difficulty

| Age Bracket | Male | Female |
| Under 5 Years | 0 (0.0%) | 0 (0.0%) |
| 5 to 17 Years | 0 (0.0%) | 0 (0.0%) |
| 18 to 34 Years | 0 (0.0%) | 0 (0.0%) |
| 35 to 64 Years | 0 (0.0%) | 0 (0.0%) |
| 65 to 74 Years | 6 (100.0%) | 0 (0.0%) |
| 75 Years and over | 0 (0.0%) | 0 (0.0%) |
Disability Class: Cognitive Difficulty
| Age Bracket | Male | Female |
| 5 to 17 Years | 0 (0.0%) | 0 (0.0%) |
| 18 to 34 Years | 0 (0.0%) | 0 (0.0%) |
| 35 to 64 Years | 0 (0.0%) | 0 (0.0%) |
| 65 to 74 Years | 0 (0.0%) | 0 (0.0%) |
| 75 Years and over | 0 (0.0%) | 0 (0.0%) |
Disability Class: Ambulatory Difficulty
| Age Bracket | Male | Female |
| 5 to 17 Years | 0 (0.0%) | 0 (0.0%) |
| 18 to 34 Years | 0 (0.0%) | 0 (0.0%) |
| 35 to 64 Years | 0 (0.0%) | 0 (0.0%) |
| 65 to 74 Years | 0 (0.0%) | 0 (0.0%) |
| 75 Years and over | 7 (100.0%) | 0 (0.0%) |
Disability Class: Self-Care Difficulty
| Age Bracket | Male | Female |
| 5 to 17 Years | 0 (0.0%) | 0 (0.0%) |
| 18 to 34 Years | 0 (0.0%) | 0 (0.0%) |
| 35 to 64 Years | 0 (0.0%) | 0 (0.0%) |
| 65 to 74 Years | 0 (0.0%) | 0 (0.0%) |
| 75 Years and over | 0 (0.0%) | 0 (0.0%) |
Technology Access in Arrowhead Springs
Computing Device Access in Arrowhead Springs
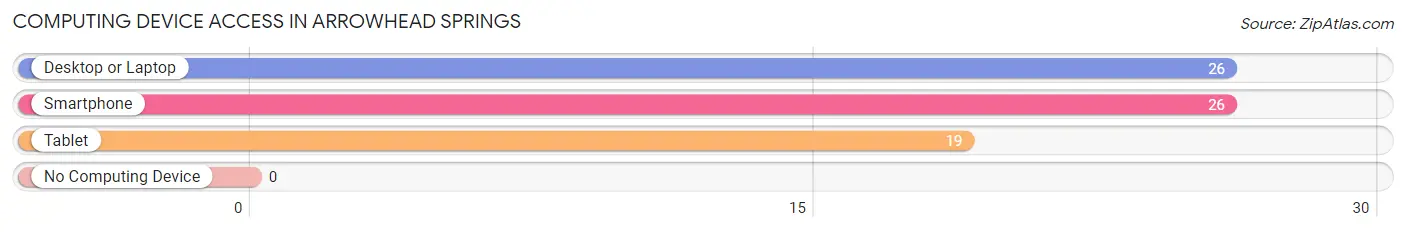
| Device Type | # Households | % Households |
| Desktop or Laptop | 26 | 100.0% |
| Smartphone | 26 | 100.0% |
| Tablet | 19 | 73.1% |
| No Computing Device | 0 | 0.0% |
| Total | 26 | 100.0% |
Internet Access in Arrowhead Springs
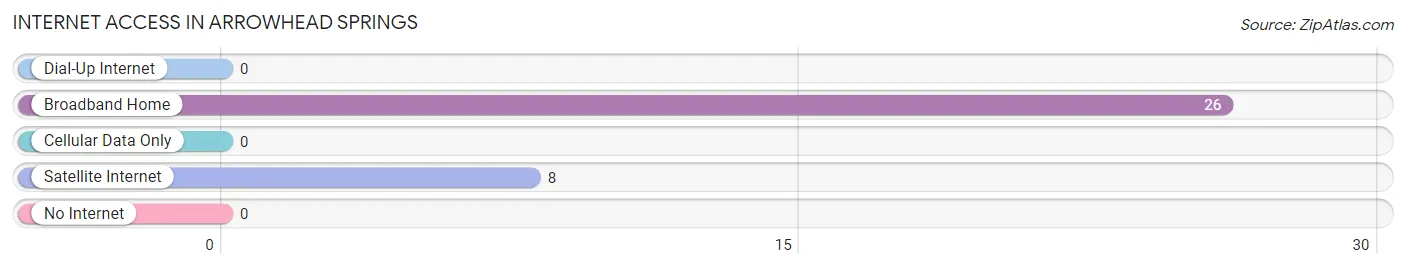
| Internet Type | # Households | % Households |
| Dial-Up Internet | 0 | 0.0% |
| Broadband Home | 26 | 100.0% |
| Cellular Data Only | 0 | 0.0% |
| Satellite Internet | 8 | 30.8% |
| No Internet | 0 | 0.0% |
| Total | 26 | 100.0% |
Arrowhead Springs Summary
Arrowhead Springs is a small unincorporated community located in the Big Horn Basin of Wyoming. It is situated in the northern part of the state, approximately 25 miles south of the Montana border. The community is located in Big Horn County, and is part of the Greybull Micropolitan Statistical Area.
History
Arrowhead Springs was first settled in the late 1800s by homesteaders who were attracted to the area by its abundant natural resources. The community was named after the nearby Arrowhead Springs, which were believed to have healing properties. The springs were a popular destination for travelers and settlers alike, and the area quickly grew into a small community.
In the early 1900s, the community was home to a number of businesses, including a general store, a post office, a blacksmith shop, and a hotel. The town also had a school, which was attended by the children of the homesteaders.
In the 1920s, the town began to decline as the homesteaders moved away in search of better opportunities. By the 1940s, the town was nearly abandoned. However, in the 1950s, the town began to experience a resurgence as new settlers moved in and began to rebuild the community.
Geography
Arrowhead Springs is located in the Big Horn Basin of Wyoming. The community is situated in the northern part of the state, approximately 25 miles south of the Montana border. The area is characterized by rolling hills and wide open spaces. The climate is semi-arid, with hot summers and cold winters.
The community is located in Big Horn County, and is part of the Greybull Micropolitan Statistical Area. The nearest major city is Billings, Montana, which is approximately 100 miles away.
Economy
The economy of Arrowhead Springs is largely based on agriculture and ranching. The area is home to a number of cattle ranches, as well as some small-scale farming operations. The town also has a few small businesses, including a general store and a post office.
Demographics
As of the 2010 census, the population of Arrowhead Springs was 545. The racial makeup of the town was 97.3% White, 0.2% African American, 0.4% Native American, 0.2% Asian, 0.2% from other races, and 1.9% from two or more races. Hispanic or Latino of any race were 1.3% of the population.
The median household income in Arrowhead Springs was $37,500, and the median family income was $41,250. The per capita income for the town was $17,857. About 11.2% of families and 13.2% of the population were below the poverty line, including 16.7% of those under age 18 and 8.3% of those age 65 or over.
Common Questions
What is Per Capita Income in Arrowhead Springs?
Per Capita income in Arrowhead Springs is $40,521.
What is the Median Family Income in Arrowhead Springs?
Median Family Income in Arrowhead Springs is $98,571.
What is the Median Household income in Arrowhead Springs?
Median Household Income in Arrowhead Springs is $102,500.
What is Inequality or Gini Index in Arrowhead Springs?
Inequality or Gini Index in Arrowhead Springs is 0.28.
What is the Total Population of Arrowhead Springs?
Total Population of Arrowhead Springs is 72.
What is the Total Male Population of Arrowhead Springs?
Total Male Population of Arrowhead Springs is 33.
What is the Total Female Population of Arrowhead Springs?
Total Female Population of Arrowhead Springs is 39.
What is the Ratio of Males per 100 Females in Arrowhead Springs?
There are 84.62 Males per 100 Females in Arrowhead Springs.
What is the Ratio of Females per 100 Males in Arrowhead Springs?
There are 118.18 Females per 100 Males in Arrowhead Springs.
What is the Median Population Age in Arrowhead Springs?
Median Population Age in Arrowhead Springs is 53.4 Years.
What is the Average Family Size in Arrowhead Springs
Average Family Size in Arrowhead Springs is 3.6 People.
What is the Average Household Size in Arrowhead Springs
Average Household Size in Arrowhead Springs is 2.8 People.
How Large is the Labor Force in Arrowhead Springs?
There are 20 People in the Labor Forcein in Arrowhead Springs.
What is the Percentage of People in the Labor Force in Arrowhead Springs?
44.4% of People are in the Labor Force in Arrowhead Springs.