Surprise, AZ Map & Demographics
Surprise Map
Surprise Overview
$37,518
PER CAPITA INCOME
$94,426
AVG FAMILY INCOME
$87,756
AVG HOUSEHOLD INCOME
27.5%
WAGE / INCOME GAP [ % ]
72.5¢/ $1
WAGE / INCOME GAP [ $ ]
$12,306
FAMILY INCOME DEFICIT
0.37
INEQUALITY / GINI INDEX
145,591
TOTAL POPULATION
68,779
MALE POPULATION
76,812
FEMALE POPULATION
89.54
MALES / 100 FEMALES
111.68
FEMALES / 100 MALES
41.5
MEDIAN AGE
3.1
AVG FAMILY SIZE
2.7
AVG HOUSEHOLD SIZE
65,972
LABOR FORCE [ PEOPLE ]
57.6%
PERCENT IN LABOR FORCE
4.6%
UNEMPLOYMENT RATE
Surprise Area Codes
Income in Surprise
Income Overview in Surprise
Per Capita Income in Surprise is $37,518, while median incomes of families and households are $94,426 and $87,756 respectively.
| Characteristic | Number | Measure |
| Per Capita Income | 145,591 | $37,518 |
| Median Family Income | 40,052 | $94,426 |
| Mean Family Income | 40,052 | $109,284 |
| Median Household Income | 52,995 | $87,756 |
| Mean Household Income | 52,995 | $101,937 |
| Income Deficit | 40,052 | $12,306 |
| Wage / Income Gap (%) | 145,591 | 27.47% |
| Wage / Income Gap ($) | 145,591 | 72.53¢ per $1 |
| Gini / Inequality Index | 145,591 | 0.37 |
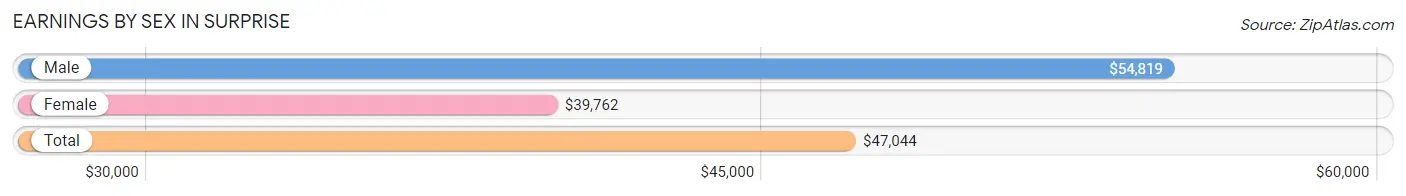
Earnings by Sex in Surprise
Average Earnings in Surprise are $47,044, $54,819 for men and $39,762 for women, a difference of 27.5%.
| Sex | Number | Average Earnings |
| Male | 35,127 (51.3%) | $54,819 |
| Female | 33,299 (48.7%) | $39,762 |
| Total | 68,426 (100.0%) | $47,044 |
Earnings by Sex by Income Bracket in Surprise
The most common earnings brackets in Surprise are $100,000+ for men (5,163 | 14.7%) and $75,000 to $99,999 for women (3,099 | 9.3%).
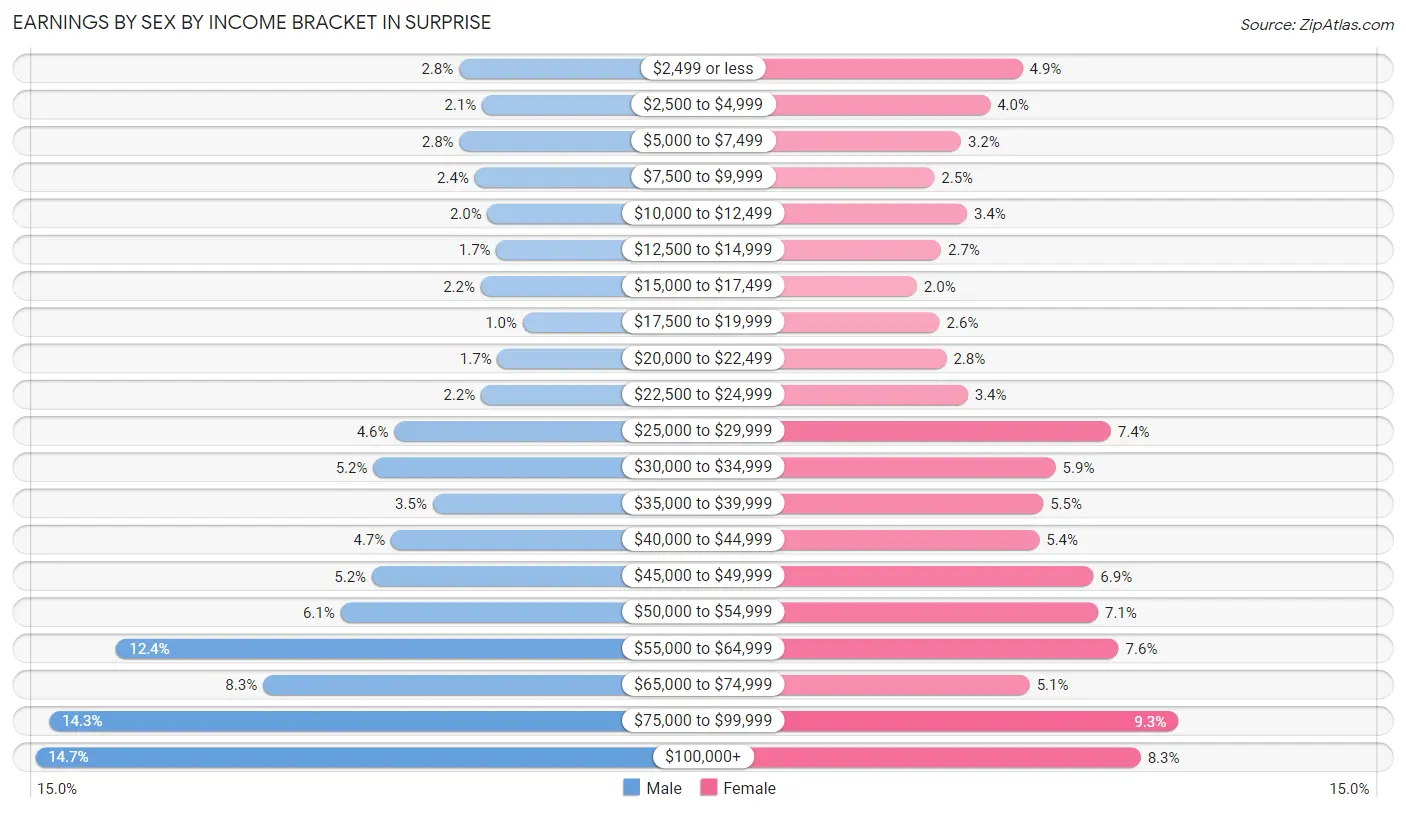
| Income | Male | Female |
| $2,499 or less | 981 (2.8%) | 1,645 (4.9%) |
| $2,500 to $4,999 | 750 (2.1%) | 1,343 (4.0%) |
| $5,000 to $7,499 | 978 (2.8%) | 1,068 (3.2%) |
| $7,500 to $9,999 | 826 (2.4%) | 818 (2.5%) |
| $10,000 to $12,499 | 699 (2.0%) | 1,124 (3.4%) |
| $12,500 to $14,999 | 612 (1.7%) | 882 (2.6%) |
| $15,000 to $17,499 | 765 (2.2%) | 656 (2.0%) |
| $17,500 to $19,999 | 351 (1.0%) | 869 (2.6%) |
| $20,000 to $22,499 | 602 (1.7%) | 934 (2.8%) |
| $22,500 to $24,999 | 761 (2.2%) | 1,132 (3.4%) |
| $25,000 to $29,999 | 1,621 (4.6%) | 2,470 (7.4%) |
| $30,000 to $34,999 | 1,828 (5.2%) | 1,955 (5.9%) |
| $35,000 to $39,999 | 1,241 (3.5%) | 1,837 (5.5%) |
| $40,000 to $44,999 | 1,652 (4.7%) | 1,802 (5.4%) |
| $45,000 to $49,999 | 1,842 (5.2%) | 2,309 (6.9%) |
| $50,000 to $54,999 | 2,150 (6.1%) | 2,351 (7.1%) |
| $55,000 to $64,999 | 4,362 (12.4%) | 2,543 (7.6%) |
| $65,000 to $74,999 | 2,915 (8.3%) | 1,712 (5.1%) |
| $75,000 to $99,999 | 5,028 (14.3%) | 3,099 (9.3%) |
| $100,000+ | 5,163 (14.7%) | 2,750 (8.3%) |
| Total | 35,127 (100.0%) | 33,299 (100.0%) |
Earnings by Sex by Educational Attainment in Surprise
Average earnings in Surprise are $59,732 for men and $44,902 for women, a difference of 24.8%. Men with an educational attainment of graduate degree enjoy the highest average annual earnings of $77,831, while those with high school diploma education earn the least with $52,590. Women with an educational attainment of graduate degree earn the most with the average annual earnings of $65,889, while those with less than high school education have the smallest earnings of $30,602.
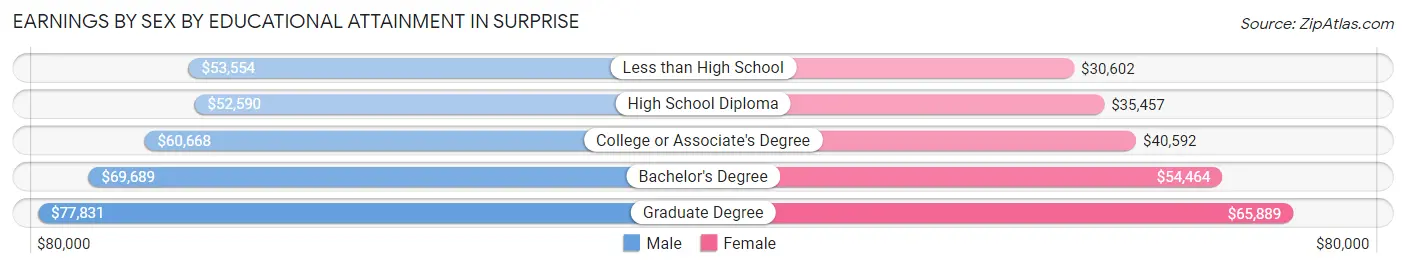
| Educational Attainment | Male Income | Female Income |
| Less than High School | $53,554 | $30,602 |
| High School Diploma | $52,590 | $35,457 |
| College or Associate's Degree | $60,668 | $40,592 |
| Bachelor's Degree | $69,689 | $54,464 |
| Graduate Degree | $77,831 | $65,889 |
| Total | $59,732 | $44,902 |
Family Income in Surprise
Family Income Brackets in Surprise
According to the Surprise family income data, there are 10,574 families falling into the $100,000 to $149,999 income range, which is the most common income bracket and makes up 26.4% of all families. Conversely, the $10,000 to $14,999 income bracket is the least frequent group with only 240 families (0.6%) belonging to this category.
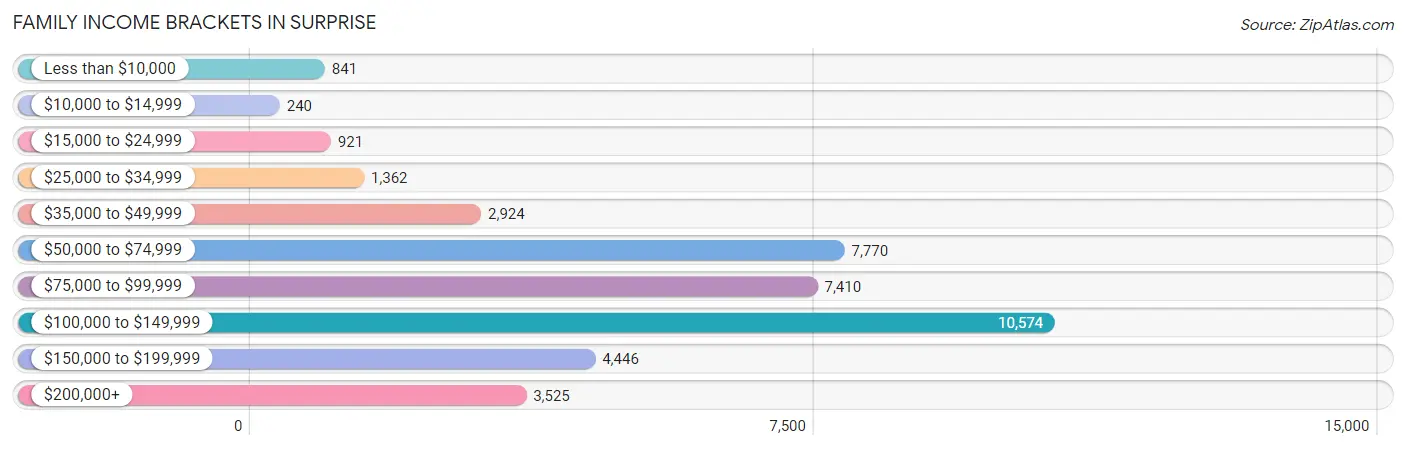
| Income Bracket | # Families | % Families |
| Less than $10,000 | 841 | 2.1% |
| $10,000 to $14,999 | 240 | 0.6% |
| $15,000 to $24,999 | 921 | 2.3% |
| $25,000 to $34,999 | 1,362 | 3.4% |
| $35,000 to $49,999 | 2,924 | 7.3% |
| $50,000 to $74,999 | 7,770 | 19.4% |
| $75,000 to $99,999 | 7,410 | 18.5% |
| $100,000 to $149,999 | 10,574 | 26.4% |
| $150,000 to $199,999 | 4,446 | 11.1% |
| $200,000+ | 3,525 | 8.8% |
Family Income by Famaliy Size in Surprise
5-person families (3,862 | 9.6%) account for the highest median family income in Surprise with $116,151 per family, while 2-person families (19,520 | 48.7%) have the highest median income of $40,942 per family member.
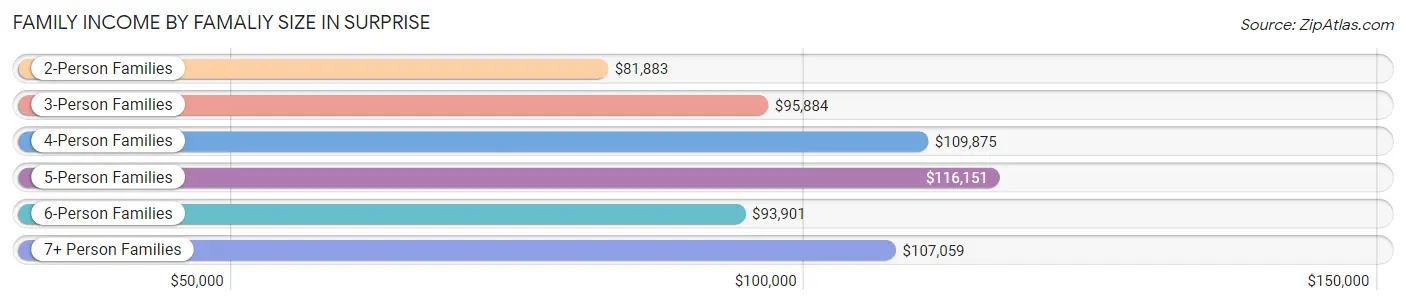
| Income Bracket | # Families | Median Income |
| 2-Person Families | 19,520 (48.7%) | $81,883 |
| 3-Person Families | 6,973 (17.4%) | $95,884 |
| 4-Person Families | 7,311 (18.2%) | $109,875 |
| 5-Person Families | 3,862 (9.6%) | $116,151 |
| 6-Person Families | 1,608 (4.0%) | $93,901 |
| 7+ Person Families | 778 (1.9%) | $107,059 |
| Total | 40,052 (100.0%) | $94,426 |
Family Income by Number of Earners in Surprise
The median family income in Surprise is $94,426, with families comprising 3+ earners (4,789) having the highest median family income of $138,857, while families with no earners (9,672) have the lowest median family income of $69,807, accounting for 12.0% and 24.1% of families, respectively.
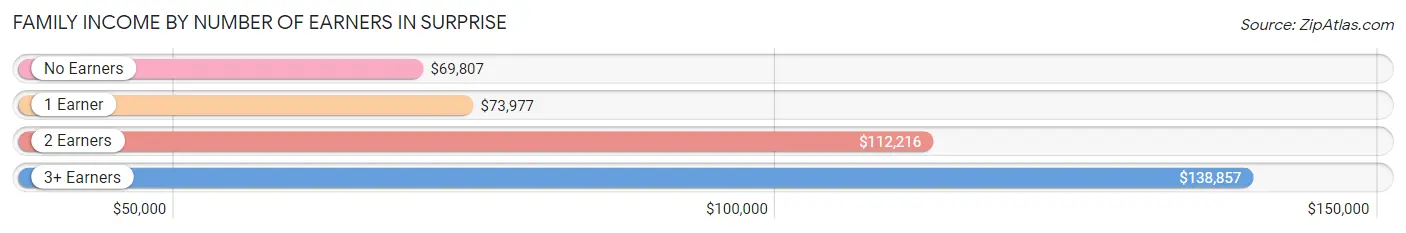
| Number of Earners | # Families | Median Income |
| No Earners | 9,672 (24.1%) | $69,807 |
| 1 Earner | 10,463 (26.1%) | $73,977 |
| 2 Earners | 15,128 (37.8%) | $112,216 |
| 3+ Earners | 4,789 (12.0%) | $138,857 |
| Total | 40,052 (100.0%) | $94,426 |
Household Income in Surprise
Household Income Brackets in Surprise
With 12,825 households falling in the category, the $100,000 to $149,999 income range is the most frequent in Surprise, accounting for 24.2% of all households. In contrast, only 583 households (1.1%) fall into the $10,000 to $14,999 income bracket, making it the least populous group.
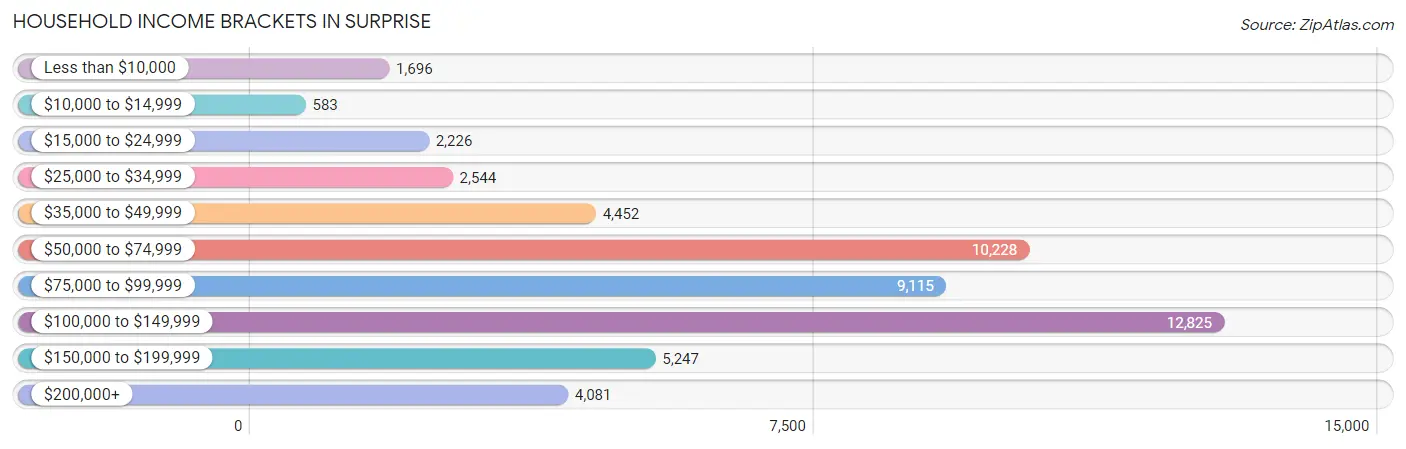
| Income Bracket | # Households | % Households |
| Less than $10,000 | 1,696 | 3.2% |
| $10,000 to $14,999 | 583 | 1.1% |
| $15,000 to $24,999 | 2,226 | 4.2% |
| $25,000 to $34,999 | 2,544 | 4.8% |
| $35,000 to $49,999 | 4,452 | 8.4% |
| $50,000 to $74,999 | 10,228 | 19.3% |
| $75,000 to $99,999 | 9,115 | 17.2% |
| $100,000 to $149,999 | 12,825 | 24.2% |
| $150,000 to $199,999 | 5,247 | 9.9% |
| $200,000+ | 4,081 | 7.7% |
Household Income by Householder Age in Surprise
The median household income in Surprise is $87,756, with the highest median household income of $105,728 found in the 45 to 64 years age bracket for the primary householder. A total of 17,887 households (33.8%) fall into this category. Meanwhile, the 65+ years age bracket for the primary householder has the lowest median household income of $68,336, with 19,309 households (36.4%) in this group.
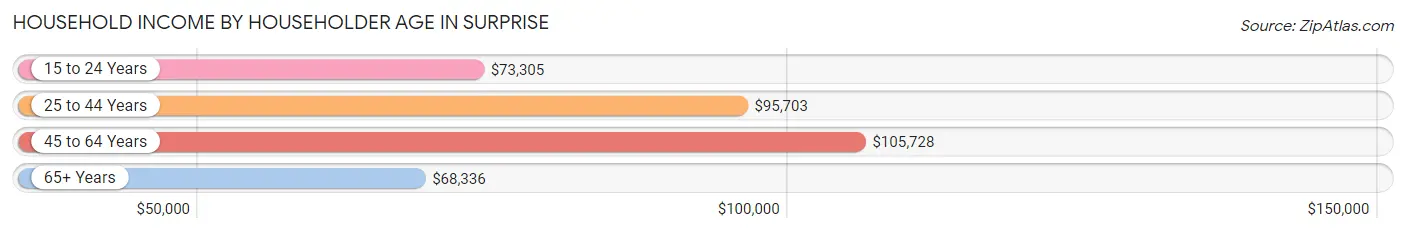
| Income Bracket | # Households | Median Income |
| 15 to 24 Years | 1,194 (2.2%) | $73,305 |
| 25 to 44 Years | 14,605 (27.6%) | $95,703 |
| 45 to 64 Years | 17,887 (33.8%) | $105,728 |
| 65+ Years | 19,309 (36.4%) | $68,336 |
| Total | 52,995 (100.0%) | $87,756 |
Poverty in Surprise
Income Below Poverty by Sex and Age in Surprise
With 5.8% poverty level for males and 7.7% for females among the residents of Surprise, 5 year old males and 15 year old females are the most vulnerable to poverty, with 138 males (20.0%) and 189 females (18.0%) in their respective age groups living below the poverty level.
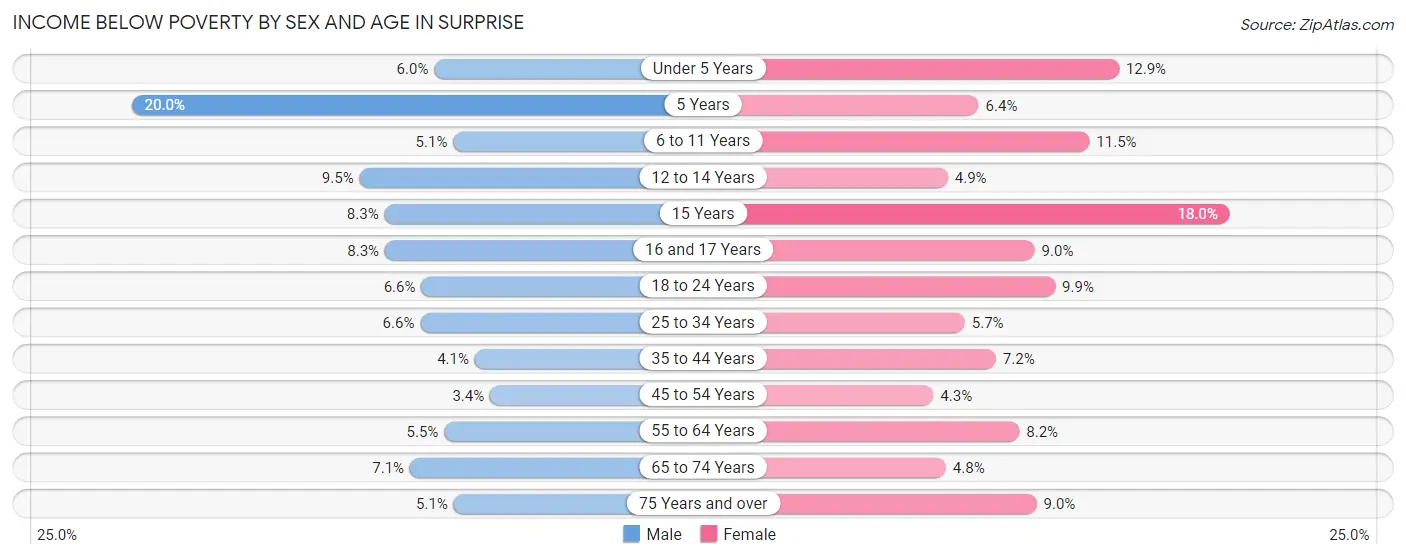
| Age Bracket | Male | Female |
| Under 5 Years | 226 (6.0%) | 500 (12.9%) |
| 5 Years | 138 (20.0%) | 73 (6.4%) |
| 6 to 11 Years | 307 (5.1%) | 770 (11.5%) |
| 12 to 14 Years | 263 (9.5%) | 174 (4.9%) |
| 15 Years | 83 (8.3%) | 189 (18.0%) |
| 16 and 17 Years | 187 (8.3%) | 214 (8.9%) |
| 18 to 24 Years | 374 (6.6%) | 498 (9.9%) |
| 25 to 34 Years | 465 (6.6%) | 444 (5.7%) |
| 35 to 44 Years | 345 (4.1%) | 679 (7.1%) |
| 45 to 54 Years | 311 (3.4%) | 386 (4.3%) |
| 55 to 64 Years | 397 (5.5%) | 674 (8.2%) |
| 65 to 74 Years | 518 (7.1%) | 445 (4.8%) |
| 75 Years and over | 372 (5.1%) | 798 (9.0%) |
| Total | 3,986 (5.8%) | 5,844 (7.7%) |
Income Above Poverty by Sex and Age in Surprise
According to the poverty statistics in Surprise, males aged 45 to 54 years and females aged 45 to 54 years are the age groups that are most secure financially, with 96.6% of males and 95.8% of females in these age groups living above the poverty line.
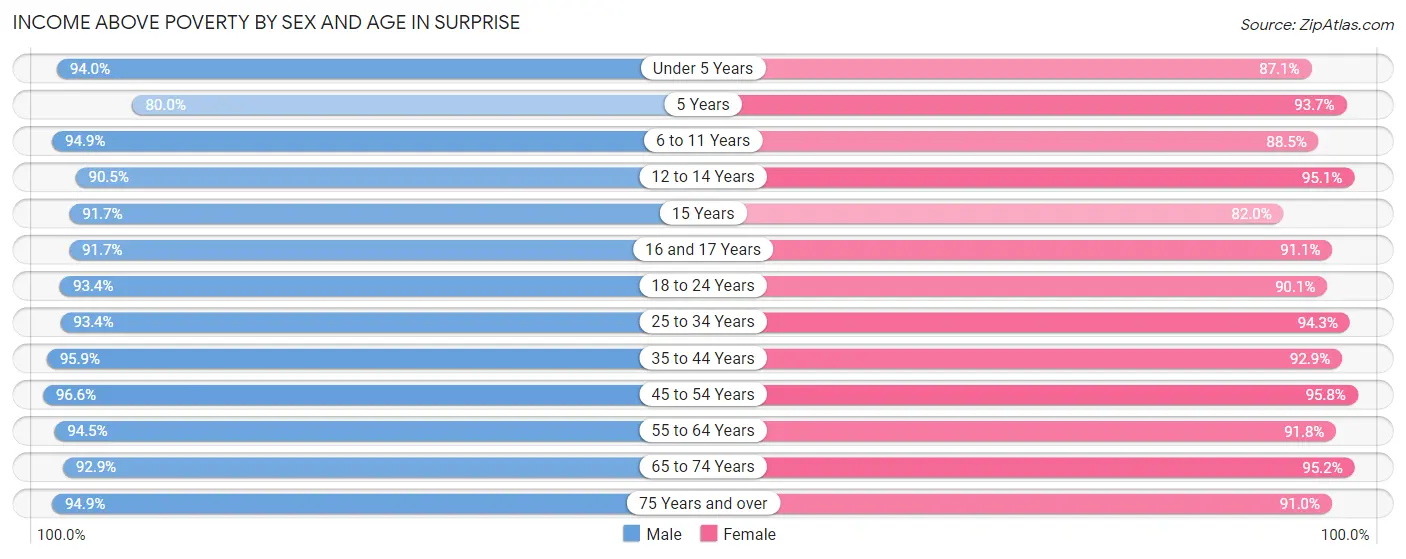
| Age Bracket | Male | Female |
| Under 5 Years | 3,544 (94.0%) | 3,389 (87.1%) |
| 5 Years | 551 (80.0%) | 1,077 (93.6%) |
| 6 to 11 Years | 5,702 (94.9%) | 5,934 (88.5%) |
| 12 to 14 Years | 2,517 (90.5%) | 3,361 (95.1%) |
| 15 Years | 917 (91.7%) | 861 (82.0%) |
| 16 and 17 Years | 2,071 (91.7%) | 2,177 (91.0%) |
| 18 to 24 Years | 5,303 (93.4%) | 4,533 (90.1%) |
| 25 to 34 Years | 6,535 (93.4%) | 7,337 (94.3%) |
| 35 to 44 Years | 8,056 (95.9%) | 8,811 (92.8%) |
| 45 to 54 Years | 8,825 (96.6%) | 8,697 (95.8%) |
| 55 to 64 Years | 6,784 (94.5%) | 7,502 (91.8%) |
| 65 to 74 Years | 6,759 (92.9%) | 8,765 (95.2%) |
| 75 Years and over | 6,933 (94.9%) | 8,028 (91.0%) |
| Total | 64,497 (94.2%) | 70,472 (92.3%) |
Income Below Poverty Among Married-Couple Families in Surprise
The poverty statistics for married-couple families in Surprise show that 2.7% or 868 of the total 32,044 families live below the poverty line. Families with 5 or more children have the highest poverty rate of 23.3%, comprising of 98 families. On the other hand, families with 1 or 2 children have the lowest poverty rate of 1.1%, which includes 103 families.
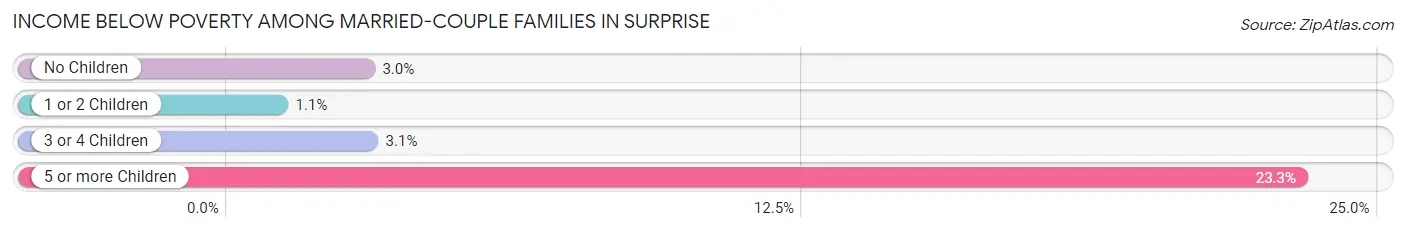
| Children | Above Poverty | Below Poverty |
| No Children | 18,766 (97.0%) | 578 (3.0%) |
| 1 or 2 Children | 9,263 (98.9%) | 103 (1.1%) |
| 3 or 4 Children | 2,824 (96.9%) | 89 (3.1%) |
| 5 or more Children | 323 (76.7%) | 98 (23.3%) |
| Total | 31,176 (97.3%) | 868 (2.7%) |
Income Below Poverty Among Single-Parent Households in Surprise
According to the poverty data in Surprise, 2.2% or 49 single-father households and 15.2% or 877 single-mother households are living below the poverty line. Among single-father households, those with 3 or 4 children have the highest poverty rate, with 10 households (5.5%) experiencing poverty. Likewise, among single-mother households, those with 5 or more children have the highest poverty rate, with 33 households (46.5%) falling below the poverty line.
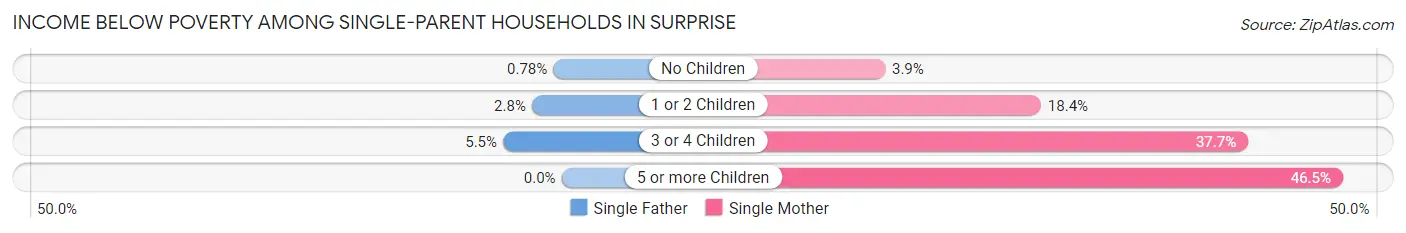
| Children | Single Father | Single Mother |
| No Children | 7 (0.8%) | 82 (3.8%) |
| 1 or 2 Children | 32 (2.8%) | 547 (18.4%) |
| 3 or 4 Children | 10 (5.5%) | 215 (37.7%) |
| 5 or more Children | 0 (0.0%) | 33 (46.5%) |
| Total | 49 (2.2%) | 877 (15.2%) |
Income Below Poverty Among Married-Couple vs Single-Parent Households in Surprise
The poverty data for Surprise shows that 868 of the married-couple family households (2.7%) and 926 of the single-parent households (11.6%) are living below the poverty level. Within the married-couple family households, those with 5 or more children have the highest poverty rate, with 98 households (23.3%) falling below the poverty line. Among the single-parent households, those with 5 or more children have the highest poverty rate, with 33 household (35.5%) living below poverty.
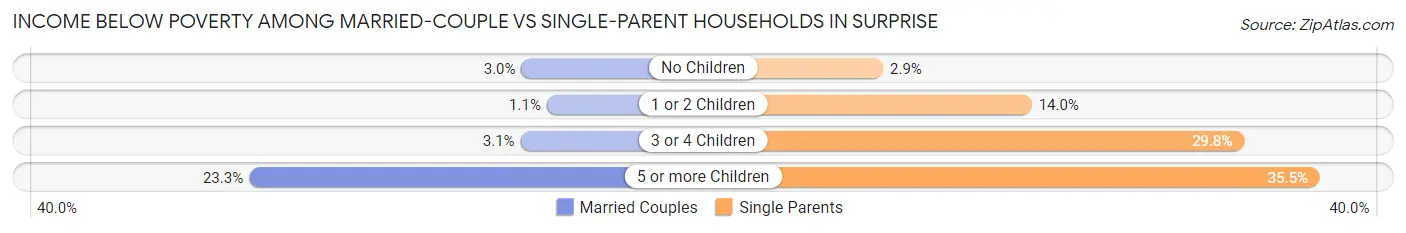
| Children | Married-Couple Families | Single-Parent Households |
| No Children | 578 (3.0%) | 89 (2.9%) |
| 1 or 2 Children | 103 (1.1%) | 579 (14.0%) |
| 3 or 4 Children | 89 (3.1%) | 225 (29.8%) |
| 5 or more Children | 98 (23.3%) | 33 (35.5%) |
| Total | 868 (2.7%) | 926 (11.6%) |
Race in Surprise
The most populous races in Surprise are White / Caucasian (111,923 | 76.9%), Hispanic or Latino (30,439 | 20.9%), and Two or more Races (13,869 | 9.5%).
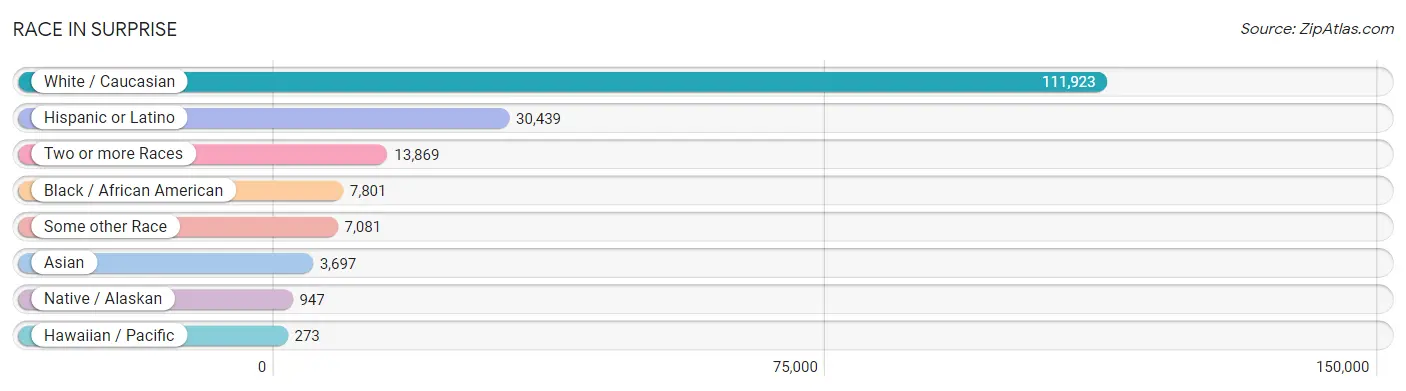
| Race | # Population | % Population |
| Asian | 3,697 | 2.5% |
| Black / African American | 7,801 | 5.4% |
| Hawaiian / Pacific | 273 | 0.2% |
| Hispanic or Latino | 30,439 | 20.9% |
| Native / Alaskan | 947 | 0.6% |
| White / Caucasian | 111,923 | 76.9% |
| Two or more Races | 13,869 | 9.5% |
| Some other Race | 7,081 | 4.9% |
| Total | 145,591 | 100.0% |
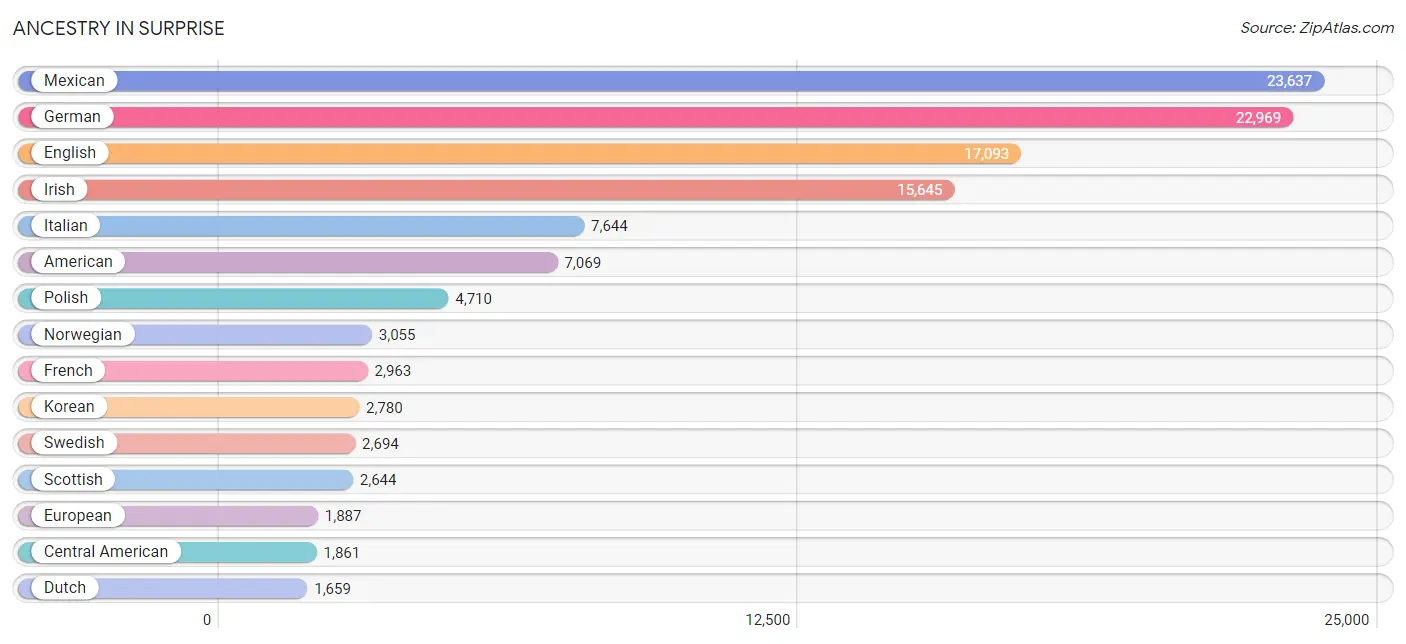
Ancestry in Surprise
The most populous ancestries reported in Surprise are Mexican (23,637 | 16.2%), German (22,969 | 15.8%), English (17,093 | 11.7%), Irish (15,645 | 10.7%), and Italian (7,644 | 5.2%), together accounting for 59.8% of all Surprise residents.
| Ancestry | # Population | % Population |
| African | 527 | 0.4% |
| Albanian | 45 | 0.0% |
| American | 7,069 | 4.9% |
| Apache | 86 | 0.1% |
| Arab | 313 | 0.2% |
| Argentinean | 160 | 0.1% |
| Armenian | 97 | 0.1% |
| Assyrian / Chaldean / Syriac | 263 | 0.2% |
| Australian | 466 | 0.3% |
| Austrian | 274 | 0.2% |
| Belgian | 62 | 0.0% |
| Belizean | 42 | 0.0% |
| Bermudan | 23 | 0.0% |
| Bhutanese | 609 | 0.4% |
| Blackfeet | 15 | 0.0% |
| Bolivian | 30 | 0.0% |
| Brazilian | 40 | 0.0% |
| British | 710 | 0.5% |
| Bulgarian | 88 | 0.1% |
| Burmese | 749 | 0.5% |
| Cajun | 55 | 0.0% |
| Canadian | 431 | 0.3% |
| Celtic | 167 | 0.1% |
| Central American | 1,861 | 1.3% |
| Cherokee | 217 | 0.2% |
| Chickasaw | 92 | 0.1% |
| Chilean | 161 | 0.1% |
| Chippewa | 11 | 0.0% |
| Colombian | 396 | 0.3% |
| Costa Rican | 166 | 0.1% |
| Croatian | 110 | 0.1% |
| Cuban | 789 | 0.5% |
| Czech | 496 | 0.3% |
| Czechoslovakian | 126 | 0.1% |
| Danish | 922 | 0.6% |
| Delaware | 26 | 0.0% |
| Dominican | 137 | 0.1% |
| Dutch | 1,659 | 1.1% |
| Eastern European | 366 | 0.3% |
| Ecuadorian | 9 | 0.0% |
| English | 17,093 | 11.7% |
| Ethiopian | 28 | 0.0% |
| European | 1,887 | 1.3% |
| Filipino | 69 | 0.1% |
| Finnish | 196 | 0.1% |
| French | 2,963 | 2.0% |
| French American Indian | 13 | 0.0% |
| French Canadian | 860 | 0.6% |
| German | 22,969 | 15.8% |
| Greek | 605 | 0.4% |
| Guamanian / Chamorro | 165 | 0.1% |
| Guatemalan | 295 | 0.2% |
| Haitian | 104 | 0.1% |
| Honduran | 40 | 0.0% |
| Hopi | 12 | 0.0% |
| Hungarian | 371 | 0.3% |
| Icelander | 19 | 0.0% |
| Indian (Asian) | 749 | 0.5% |
| Indonesian | 54 | 0.0% |
| Iranian | 12 | 0.0% |
| Iraqi | 190 | 0.1% |
| Irish | 15,645 | 10.7% |
| Iroquois | 10 | 0.0% |
| Italian | 7,644 | 5.2% |
| Jamaican | 219 | 0.2% |
| Japanese | 117 | 0.1% |
| Jordanian | 8 | 0.0% |
| Kenyan | 36 | 0.0% |
| Korean | 2,780 | 1.9% |
| Laotian | 69 | 0.1% |
| Latvian | 37 | 0.0% |
| Lebanese | 70 | 0.1% |
| Lithuanian | 111 | 0.1% |
| Luxembourger | 15 | 0.0% |
| Malaysian | 62 | 0.0% |
| Mexican | 23,637 | 16.2% |
| Mexican American Indian | 287 | 0.2% |
| Native Hawaiian | 250 | 0.2% |
| Navajo | 464 | 0.3% |
| Nicaraguan | 31 | 0.0% |
| Nigerian | 127 | 0.1% |
| Northern European | 416 | 0.3% |
| Norwegian | 3,055 | 2.1% |
| Pakistani | 726 | 0.5% |
| Panamanian | 188 | 0.1% |
| Pennsylvania German | 73 | 0.1% |
| Peruvian | 112 | 0.1% |
| Pima | 533 | 0.4% |
| Polish | 4,710 | 3.2% |
| Portuguese | 605 | 0.4% |
| Pueblo | 34 | 0.0% |
| Puerto Rican | 880 | 0.6% |
| Romanian | 537 | 0.4% |
| Russian | 1,022 | 0.7% |
| Salvadoran | 1,141 | 0.8% |
| Samoan | 161 | 0.1% |
| Scandinavian | 812 | 0.6% |
| Scotch-Irish | 1,085 | 0.7% |
| Scottish | 2,644 | 1.8% |
| Serbian | 41 | 0.0% |
| Sioux | 30 | 0.0% |
| Slavic | 66 | 0.1% |
| Slovak | 222 | 0.2% |
| Slovene | 88 | 0.1% |
| South American | 897 | 0.6% |
| Spaniard | 769 | 0.5% |
| Spanish | 394 | 0.3% |
| Spanish American | 9 | 0.0% |
| Sri Lankan | 677 | 0.5% |
| Subsaharan African | 727 | 0.5% |
| Swedish | 2,694 | 1.8% |
| Swiss | 327 | 0.2% |
| Syrian | 9 | 0.0% |
| Thai | 208 | 0.1% |
| Tlingit-Haida | 65 | 0.0% |
| Tohono O'Odham | 130 | 0.1% |
| Trinidadian and Tobagonian | 83 | 0.1% |
| Turkish | 24 | 0.0% |
| Ukrainian | 243 | 0.2% |
| Ute | 7 | 0.0% |
| Venezuelan | 20 | 0.0% |
| Welsh | 879 | 0.6% |
| West Indian | 142 | 0.1% |
| Yaqui | 11 | 0.0% |
| Yugoslavian | 46 | 0.0% |
| Yup'ik | 9 | 0.0% | View All 126 Rows |
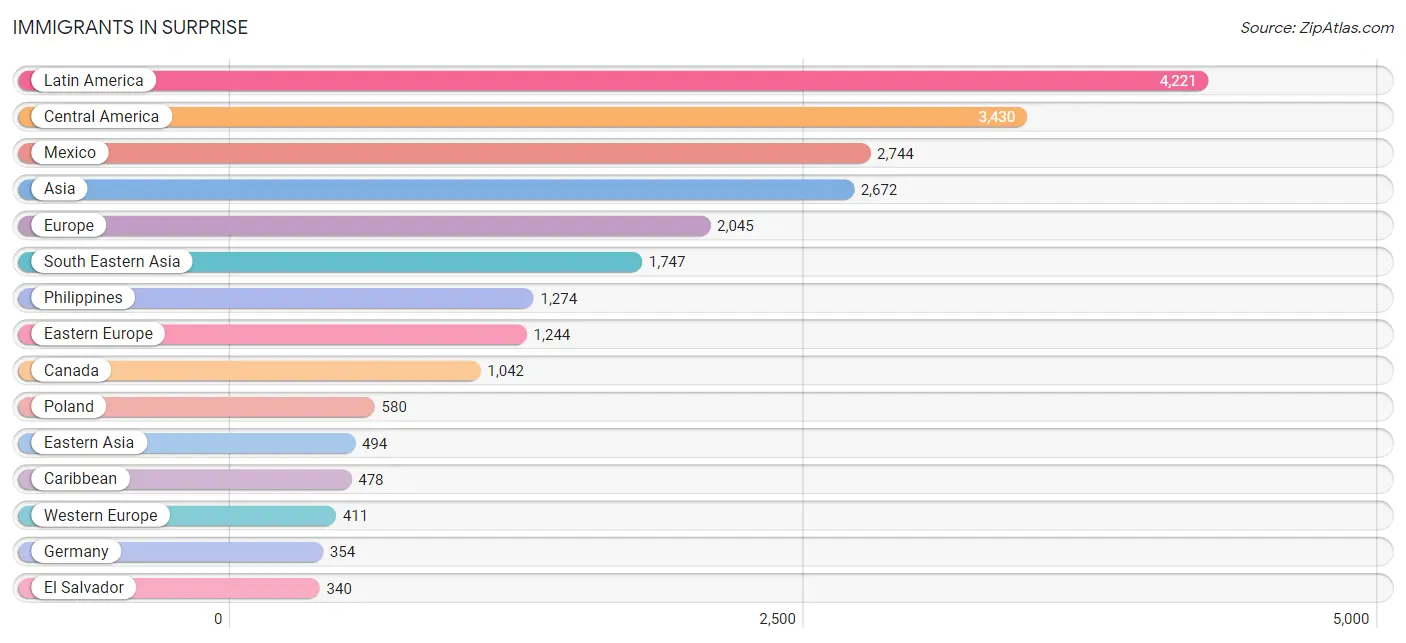
Immigrants in Surprise
The most numerous immigrant groups reported in Surprise came from Latin America (4,221 | 2.9%), Central America (3,430 | 2.4%), Mexico (2,744 | 1.9%), Asia (2,672 | 1.8%), and Europe (2,045 | 1.4%), together accounting for 10.4% of all Surprise residents.
| Immigration Origin | # Population | % Population |
| Africa | 197 | 0.1% |
| Argentina | 18 | 0.0% |
| Armenia | 24 | 0.0% |
| Asia | 2,672 | 1.8% |
| Australia | 57 | 0.0% |
| Austria | 17 | 0.0% |
| Azores | 11 | 0.0% |
| Bangladesh | 5 | 0.0% |
| Belarus | 18 | 0.0% |
| Belgium | 8 | 0.0% |
| Belize | 20 | 0.0% |
| Bolivia | 10 | 0.0% |
| Bosnia and Herzegovina | 46 | 0.0% |
| Brazil | 75 | 0.1% |
| Cambodia | 31 | 0.0% |
| Canada | 1,042 | 0.7% |
| Caribbean | 478 | 0.3% |
| Central America | 3,430 | 2.4% |
| Chile | 34 | 0.0% |
| China | 170 | 0.1% |
| Colombia | 76 | 0.1% |
| Costa Rica | 108 | 0.1% |
| Croatia | 47 | 0.0% |
| Cuba | 245 | 0.2% |
| Czechoslovakia | 26 | 0.0% |
| Denmark | 10 | 0.0% |
| Dominican Republic | 25 | 0.0% |
| Eastern Africa | 28 | 0.0% |
| Eastern Asia | 494 | 0.3% |
| Eastern Europe | 1,244 | 0.9% |
| El Salvador | 340 | 0.2% |
| England | 107 | 0.1% |
| Eritrea | 28 | 0.0% |
| Europe | 2,045 | 1.4% |
| France | 3 | 0.0% |
| Germany | 354 | 0.2% |
| Guatemala | 196 | 0.1% |
| Guyana | 17 | 0.0% |
| Hungary | 93 | 0.1% |
| India | 72 | 0.1% |
| Indonesia | 36 | 0.0% |
| Iran | 12 | 0.0% |
| Iraq | 246 | 0.2% |
| Ireland | 16 | 0.0% |
| Israel | 6 | 0.0% |
| Italy | 91 | 0.1% |
| Jamaica | 170 | 0.1% |
| Japan | 179 | 0.1% |
| Jordan | 15 | 0.0% |
| Korea | 145 | 0.1% |
| Laos | 31 | 0.0% |
| Latin America | 4,221 | 2.9% |
| Mexico | 2,744 | 1.9% |
| Netherlands | 29 | 0.0% |
| Nicaragua | 14 | 0.0% |
| Nigeria | 121 | 0.1% |
| North Macedonia | 12 | 0.0% |
| Northern Africa | 9 | 0.0% |
| Northern Europe | 274 | 0.2% |
| Oceania | 72 | 0.1% |
| Panama | 8 | 0.0% |
| Peru | 83 | 0.1% |
| Philippines | 1,274 | 0.9% |
| Poland | 580 | 0.4% |
| Portugal | 11 | 0.0% |
| Romania | 280 | 0.2% |
| Russia | 58 | 0.0% |
| Saudi Arabia | 8 | 0.0% |
| Scotland | 41 | 0.0% |
| Serbia | 18 | 0.0% |
| South Africa | 39 | 0.0% |
| South America | 313 | 0.2% |
| South Central Asia | 100 | 0.1% |
| South Eastern Asia | 1,747 | 1.2% |
| Southern Europe | 116 | 0.1% |
| Spain | 14 | 0.0% |
| Syria | 24 | 0.0% |
| Taiwan | 63 | 0.0% |
| Thailand | 16 | 0.0% |
| Trinidad and Tobago | 38 | 0.0% |
| Turkey | 8 | 0.0% |
| Vietnam | 338 | 0.2% |
| Western Africa | 121 | 0.1% |
| Western Asia | 331 | 0.2% |
| Western Europe | 411 | 0.3% | View All 85 Rows |
Sex and Age in Surprise
Sex and Age in Surprise
The most populous age groups in Surprise are 10 to 14 Years (5,159 | 7.5%) for men and 10 to 14 Years (6,382 | 8.3%) for women.
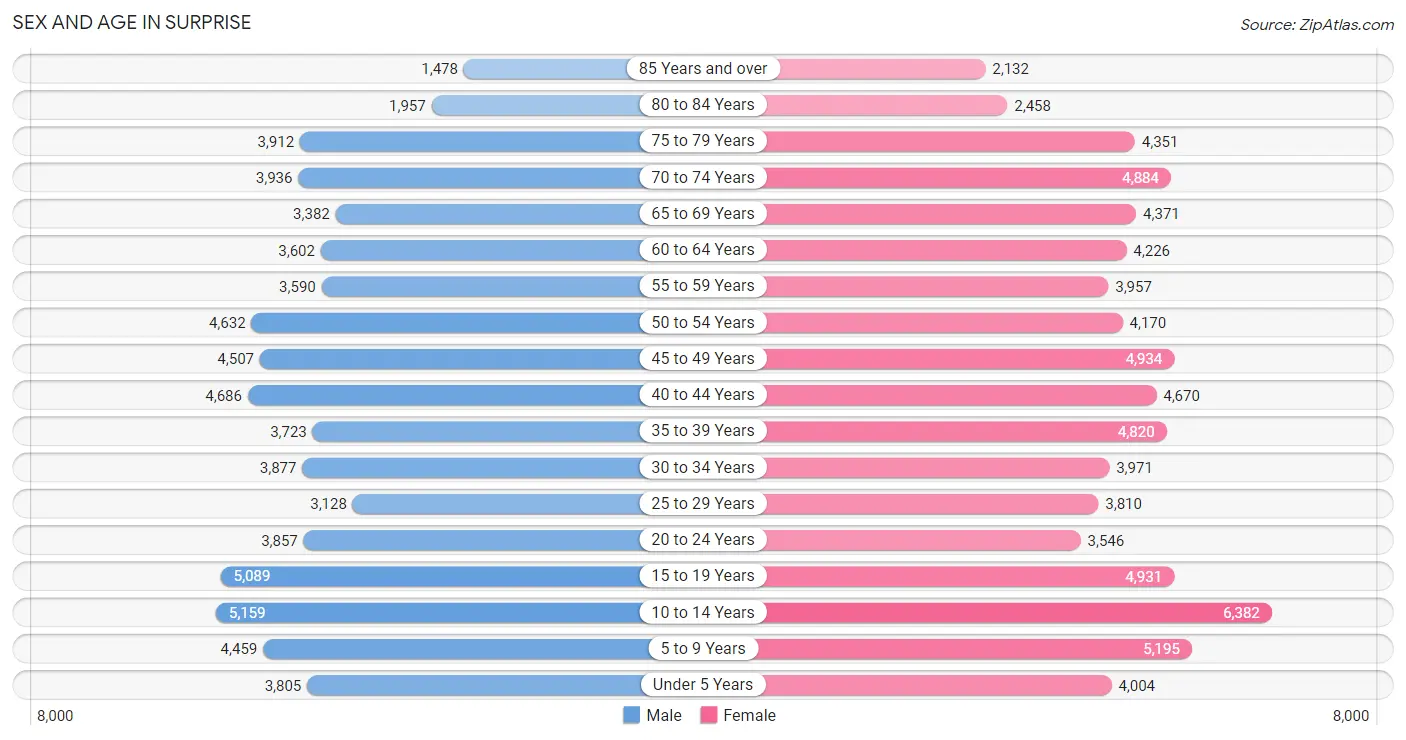
| Age Bracket | Male | Female |
| Under 5 Years | 3,805 (5.5%) | 4,004 (5.2%) |
| 5 to 9 Years | 4,459 (6.5%) | 5,195 (6.8%) |
| 10 to 14 Years | 5,159 (7.5%) | 6,382 (8.3%) |
| 15 to 19 Years | 5,089 (7.4%) | 4,931 (6.4%) |
| 20 to 24 Years | 3,857 (5.6%) | 3,546 (4.6%) |
| 25 to 29 Years | 3,128 (4.5%) | 3,810 (5.0%) |
| 30 to 34 Years | 3,877 (5.6%) | 3,971 (5.2%) |
| 35 to 39 Years | 3,723 (5.4%) | 4,820 (6.3%) |
| 40 to 44 Years | 4,686 (6.8%) | 4,670 (6.1%) |
| 45 to 49 Years | 4,507 (6.6%) | 4,934 (6.4%) |
| 50 to 54 Years | 4,632 (6.7%) | 4,170 (5.4%) |
| 55 to 59 Years | 3,590 (5.2%) | 3,957 (5.1%) |
| 60 to 64 Years | 3,602 (5.2%) | 4,226 (5.5%) |
| 65 to 69 Years | 3,382 (4.9%) | 4,371 (5.7%) |
| 70 to 74 Years | 3,936 (5.7%) | 4,884 (6.4%) |
| 75 to 79 Years | 3,912 (5.7%) | 4,351 (5.7%) |
| 80 to 84 Years | 1,957 (2.9%) | 2,458 (3.2%) |
| 85 Years and over | 1,478 (2.1%) | 2,132 (2.8%) |
| Total | 68,779 (100.0%) | 76,812 (100.0%) |
Families and Households in Surprise
Median Family Size in Surprise
The median family size in Surprise is 3.12 persons per family, with married-couple families (32,044 | 80.0%) accounting for the largest median family size of 3.14 persons per family. On the other hand, single male/father families (2,256 | 5.6%) represent the smallest median family size with 2.93 persons per family.
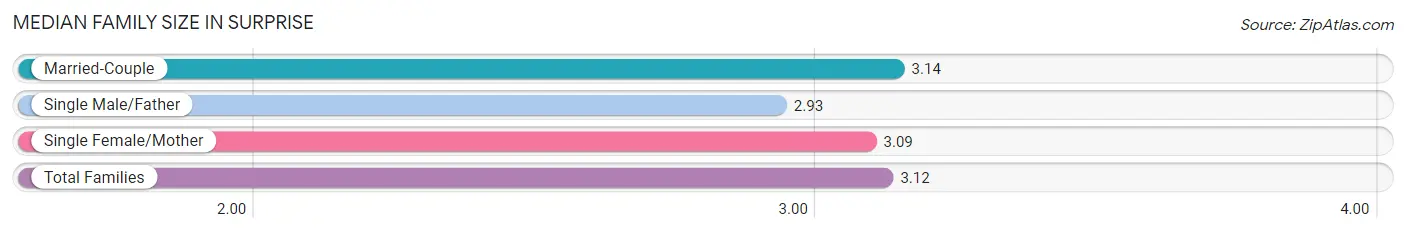
| Family Type | # Families | Family Size |
| Married-Couple | 32,044 (80.0%) | 3.14 |
| Single Male/Father | 2,256 (5.6%) | 2.93 |
| Single Female/Mother | 5,752 (14.4%) | 3.09 |
| Total Families | 40,052 (100.0%) | 3.12 |
Median Household Size in Surprise
The median household size in Surprise is 2.73 persons per household, with single male/father households (2,256 | 4.3%) accounting for the largest median household size of 3.41 persons per household. non-family households (12,943 | 24.4%) represent the smallest median household size with 1.28 persons per household.
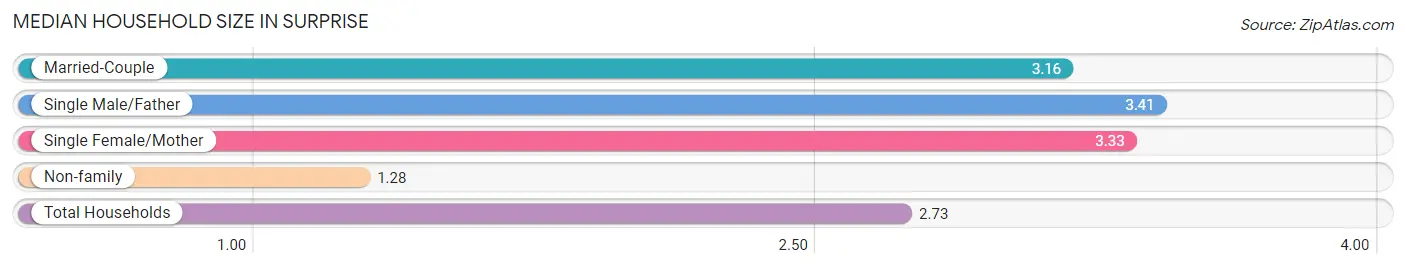
| Household Type | # Households | Household Size |
| Married-Couple | 32,044 (60.5%) | 3.16 |
| Single Male/Father | 2,256 (4.3%) | 3.41 |
| Single Female/Mother | 5,752 (10.8%) | 3.33 |
| Non-family | 12,943 (24.4%) | 1.28 |
| Total Households | 52,995 (100.0%) | 2.73 |
Household Size by Marriage Status in Surprise
Out of a total of 52,995 households in Surprise, 40,052 (75.6%) are family households, while 12,943 (24.4%) are nonfamily households. The most numerous type of family households are 2-person households, comprising 18,643, and the most common type of nonfamily households are 1-person households, comprising 10,137.
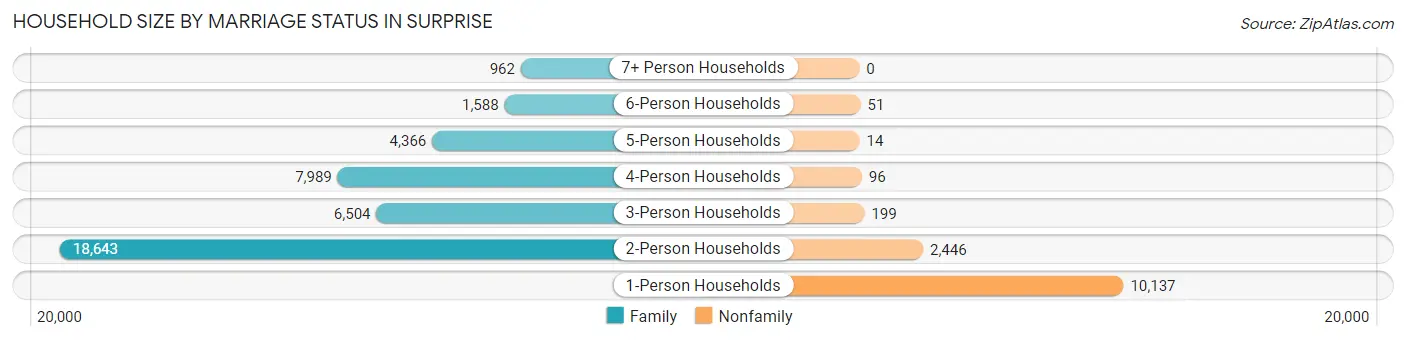
| Household Size | Family Households | Nonfamily Households |
| 1-Person Households | - | 10,137 (19.1%) |
| 2-Person Households | 18,643 (35.2%) | 2,446 (4.6%) |
| 3-Person Households | 6,504 (12.3%) | 199 (0.4%) |
| 4-Person Households | 7,989 (15.1%) | 96 (0.2%) |
| 5-Person Households | 4,366 (8.2%) | 14 (0.0%) |
| 6-Person Households | 1,588 (3.0%) | 51 (0.1%) |
| 7+ Person Households | 962 (1.8%) | 0 (0.0%) |
| Total | 40,052 (75.6%) | 12,943 (24.4%) |
Female Fertility in Surprise
Fertility by Age in Surprise
Average fertility rate in Surprise is 69.0 births per 1,000 women. Women in the age bracket of 20 to 34 years have the highest fertility rate with 121.0 births per 1,000 women. Women in the age bracket of 20 to 34 years acount for 62.2% of all women with births.
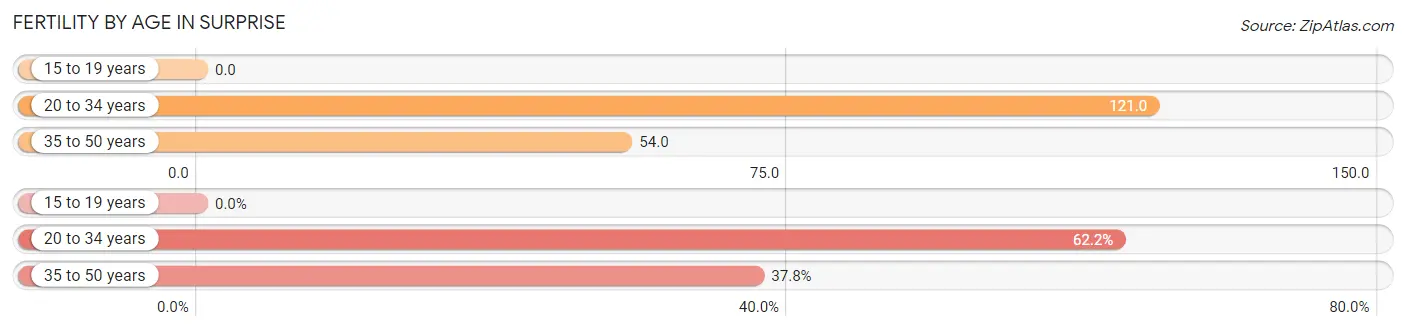
| Age Bracket | Women with Births | Births / 1,000 Women |
| 15 to 19 years | 0 (0.0%) | 0.0 |
| 20 to 34 years | 1,370 (62.2%) | 121.0 |
| 35 to 50 years | 831 (37.8%) | 54.0 |
| Total | 2,201 (100.0%) | 69.0 |
Fertility by Age by Marriage Status in Surprise
85.1% of women with births (2,201) in Surprise are married. The highest percentage of unmarried women with births falls into 20 to 34 years age bracket with 17.4% of them unmarried at the time of birth, while the lowest percentage of unmarried women with births belong to 35 to 50 years age bracket with 10.7% of them unmarried.
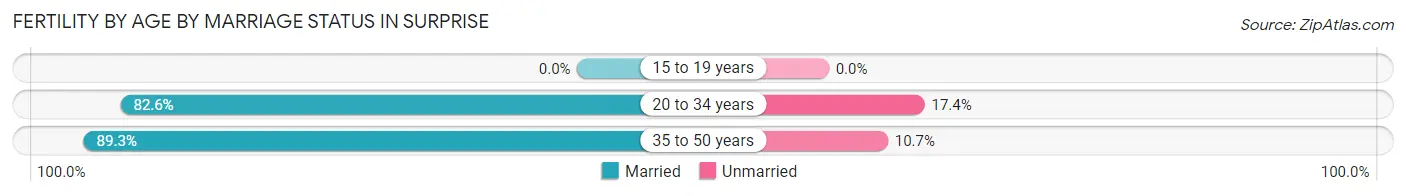
| Age Bracket | Married | Unmarried |
| 15 to 19 years | 0 (0.0%) | 0 (0.0%) |
| 20 to 34 years | 1,132 (82.6%) | 238 (17.4%) |
| 35 to 50 years | 742 (89.3%) | 89 (10.7%) |
| Total | 1,873 (85.1%) | 328 (14.9%) |
Fertility by Education in Surprise
Average fertility rate in Surprise is 69.0 births per 1,000 women. Women with the education attainment of graduate degree have the highest fertility rate of 119.0 births per 1,000 women, while women with the education attainment of less than high school have the lowest fertility at 3.0 births per 1,000 women. Women with the education attainment of college or associate's degree represent 38.2% of all women with births.
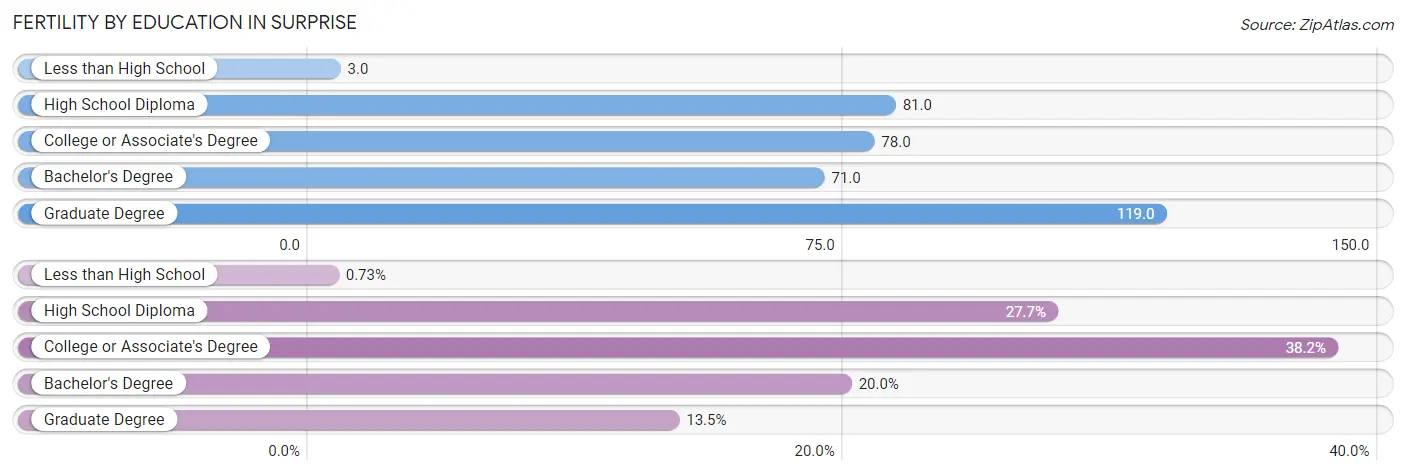
| Educational Attainment | Women with Births | Births / 1,000 Women |
| Less than High School | 16 (0.7%) | 3.0 |
| High School Diploma | 609 (27.7%) | 81.0 |
| College or Associate's Degree | 840 (38.2%) | 78.0 |
| Bachelor's Degree | 439 (20.0%) | 71.0 |
| Graduate Degree | 297 (13.5%) | 119.0 |
| Total | 2,201 (100.0%) | 69.0 |
Fertility by Education by Marriage Status in Surprise
14.9% of women with births in Surprise are unmarried. Women with the educational attainment of bachelor's degree are most likely to be married with 100.0% of them married at childbirth, while women with the educational attainment of less than high school are least likely to be married with 100.0% of them unmarried at childbirth.
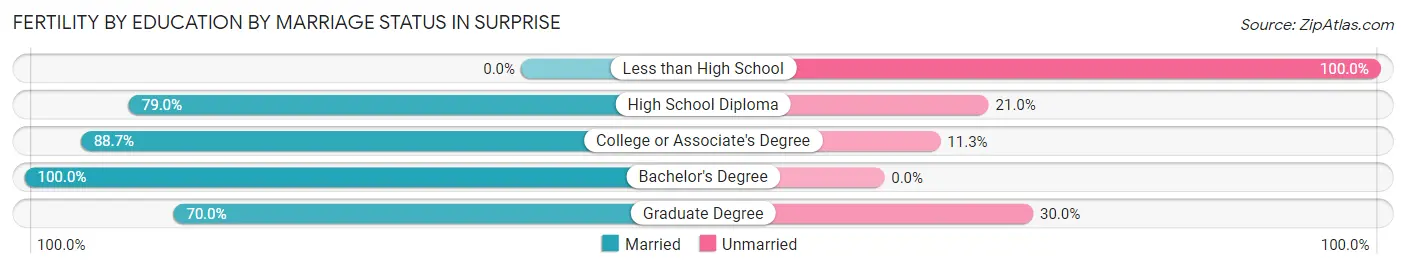
| Educational Attainment | Married | Unmarried |
| Less than High School | 0 (0.0%) | 16 (100.0%) |
| High School Diploma | 481 (79.0%) | 128 (21.0%) |
| College or Associate's Degree | 745 (88.7%) | 95 (11.3%) |
| Bachelor's Degree | 439 (100.0%) | 0 (0.0%) |
| Graduate Degree | 208 (70.0%) | 89 (30.0%) |
| Total | 1,873 (85.1%) | 328 (14.9%) |
Employment Characteristics in Surprise
Employment by Class of Employer in Surprise
Among the 61,685 employed individuals in Surprise, private company employees (42,504 | 68.9%), not-for-profit organizations (5,035 | 8.2%), and local government employees (4,234 | 6.9%) make up the most common classes of employment.
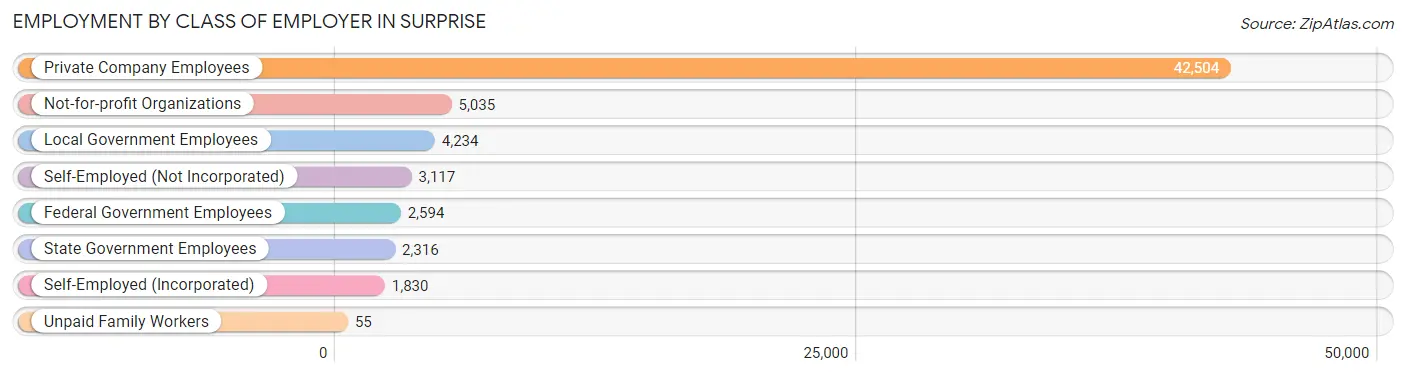
| Employer Class | # Employees | % Employees |
| Private Company Employees | 42,504 | 68.9% |
| Self-Employed (Incorporated) | 1,830 | 3.0% |
| Self-Employed (Not Incorporated) | 3,117 | 5.1% |
| Not-for-profit Organizations | 5,035 | 8.2% |
| Local Government Employees | 4,234 | 6.9% |
| State Government Employees | 2,316 | 3.7% |
| Federal Government Employees | 2,594 | 4.2% |
| Unpaid Family Workers | 55 | 0.1% |
| Total | 61,685 | 100.0% |
Employment Status by Age in Surprise
According to the labor force statistics for Surprise, out of the total population over 16 years of age (114,535), 57.6% or 65,972 individuals are in the labor force, with 4.6% or 3,035 of them unemployed. The age group with the highest labor force participation rate is 25 to 29 years, with 87.0% or 6,036 individuals in the labor force. Within the labor force, the 16 to 19 years age range has the highest percentage of unemployed individuals, with 14.8% or 485 of them being unemployed.
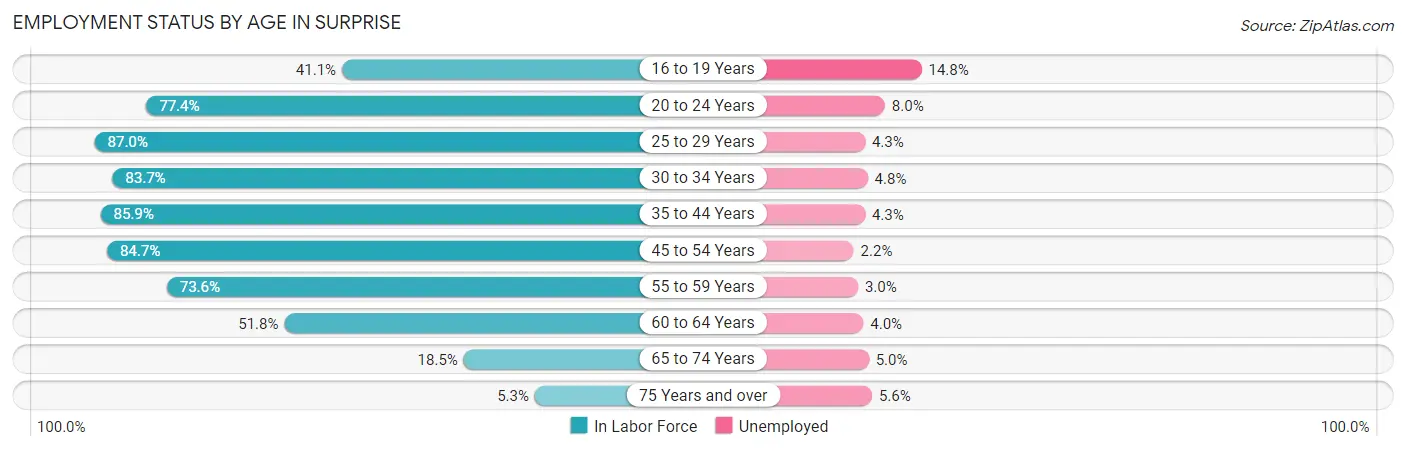
| Age Bracket | In Labor Force | Unemployed |
| 16 to 19 Years | 3,275 (41.1%) | 485 (14.8%) |
| 20 to 24 Years | 5,730 (77.4%) | 458 (8.0%) |
| 25 to 29 Years | 6,036 (87.0%) | 260 (4.3%) |
| 30 to 34 Years | 6,569 (83.7%) | 315 (4.8%) |
| 35 to 44 Years | 15,375 (85.9%) | 661 (4.3%) |
| 45 to 54 Years | 15,452 (84.7%) | 340 (2.2%) |
| 55 to 59 Years | 5,555 (73.6%) | 167 (3.0%) |
| 60 to 64 Years | 4,055 (51.8%) | 162 (4.0%) |
| 65 to 74 Years | 3,066 (18.5%) | 153 (5.0%) |
| 75 Years and over | 863 (5.3%) | 48 (5.6%) |
| Total | 65,972 (57.6%) | 3,035 (4.6%) |
Employment Status by Educational Attainment in Surprise
According to labor force statistics for Surprise, 80.0% of individuals (53,042) out of the total population between 25 and 64 years of age (66,303) are in the labor force, with 3.6% or 1,910 of them being unemployed. The group with the highest labor force participation rate are those with the educational attainment of bachelor's degree or higher, with 84.2% or 16,582 individuals in the labor force. Within the labor force, individuals with high school diploma education have the highest percentage of unemployment, with 5.2% or 660 of them being unemployed.
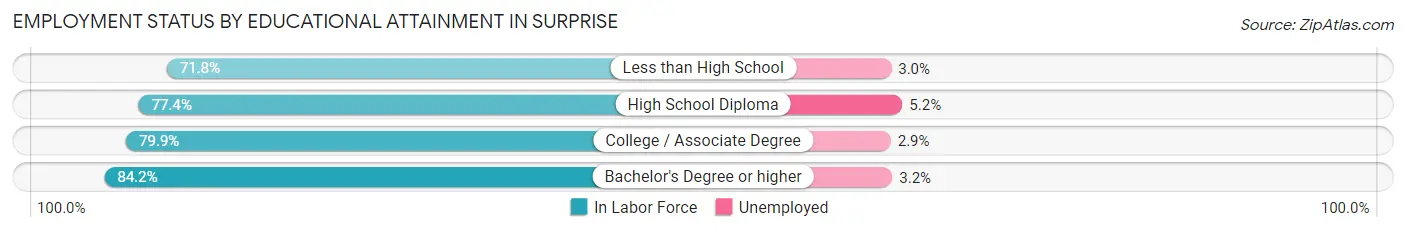
| Educational Attainment | In Labor Force | Unemployed |
| Less than High School | 3,136 (71.8%) | 131 (3.0%) |
| High School Diploma | 12,685 (77.4%) | 852 (5.2%) |
| College / Associate Degree | 20,657 (79.9%) | 750 (2.9%) |
| Bachelor's Degree or higher | 16,582 (84.2%) | 630 (3.2%) |
| Total | 53,042 (80.0%) | 2,387 (3.6%) |
Employment Occupations by Sex in Surprise
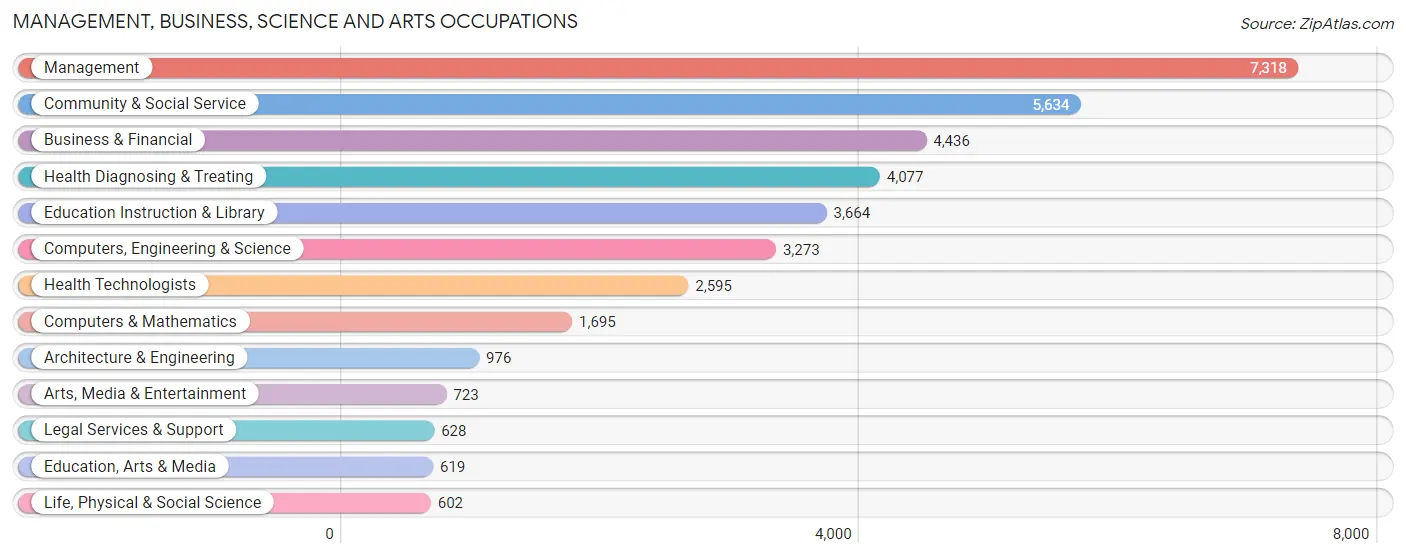
Management, Business, Science and Arts Occupations
The most common Management, Business, Science and Arts occupations in Surprise are Management (7,318 | 11.8%), Community & Social Service (5,634 | 9.1%), Business & Financial (4,436 | 7.2%), Health Diagnosing & Treating (4,077 | 6.6%), and Education Instruction & Library (3,664 | 5.9%).
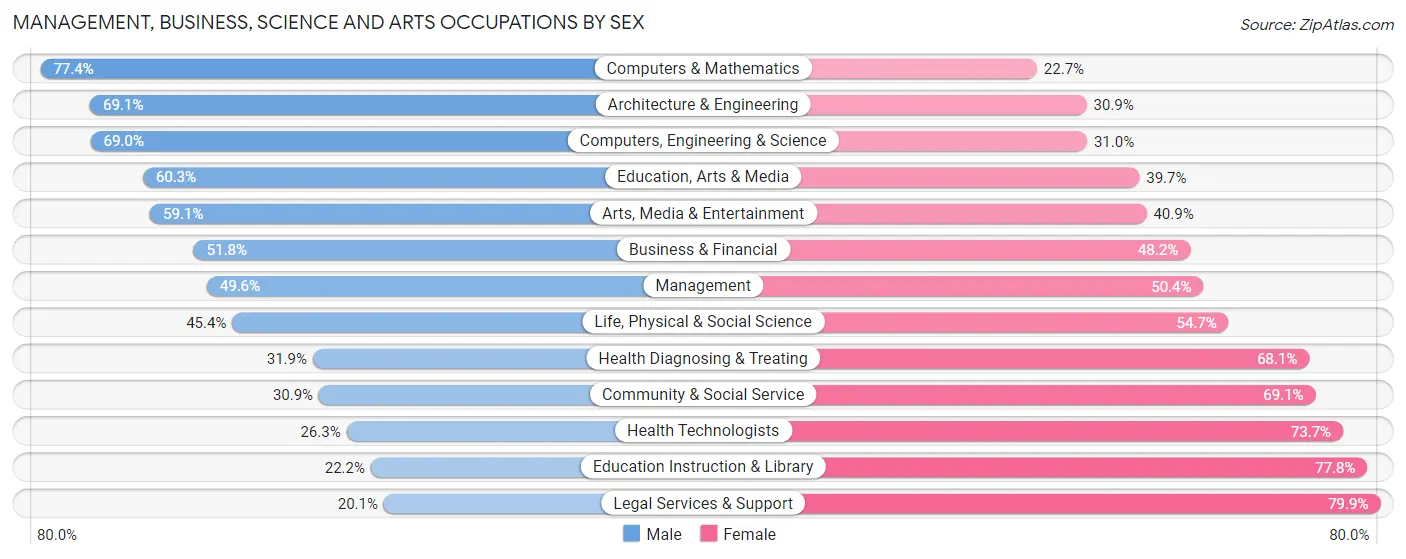
Management, Business, Science and Arts Occupations by Sex
Within the Management, Business, Science and Arts occupations in Surprise, the most male-oriented occupations are Computers & Mathematics (77.3%), Architecture & Engineering (69.1%), and Computers, Engineering & Science (69.0%), while the most female-oriented occupations are Legal Services & Support (79.9%), Education Instruction & Library (77.8%), and Health Technologists (73.7%).
| Occupation | Male | Female |
| Management | 3,628 (49.6%) | 3,690 (50.4%) |
| Business & Financial | 2,297 (51.8%) | 2,139 (48.2%) |
| Computers, Engineering & Science | 2,258 (69.0%) | 1,015 (31.0%) |
| Computers & Mathematics | 1,311 (77.3%) | 384 (22.7%) |
| Architecture & Engineering | 674 (69.1%) | 302 (30.9%) |
| Life, Physical & Social Science | 273 (45.4%) | 329 (54.6%) |
| Community & Social Service | 1,740 (30.9%) | 3,894 (69.1%) |
| Education, Arts & Media | 373 (60.3%) | 246 (39.7%) |
| Legal Services & Support | 126 (20.1%) | 502 (79.9%) |
| Education Instruction & Library | 814 (22.2%) | 2,850 (77.8%) |
| Arts, Media & Entertainment | 427 (59.1%) | 296 (40.9%) |
| Health Diagnosing & Treating | 1,301 (31.9%) | 2,776 (68.1%) |
| Health Technologists | 682 (26.3%) | 1,913 (73.7%) |
| Total (Category) | 11,224 (45.4%) | 13,514 (54.6%) |
| Total (Overall) | 31,765 (51.2%) | 30,223 (48.8%) |
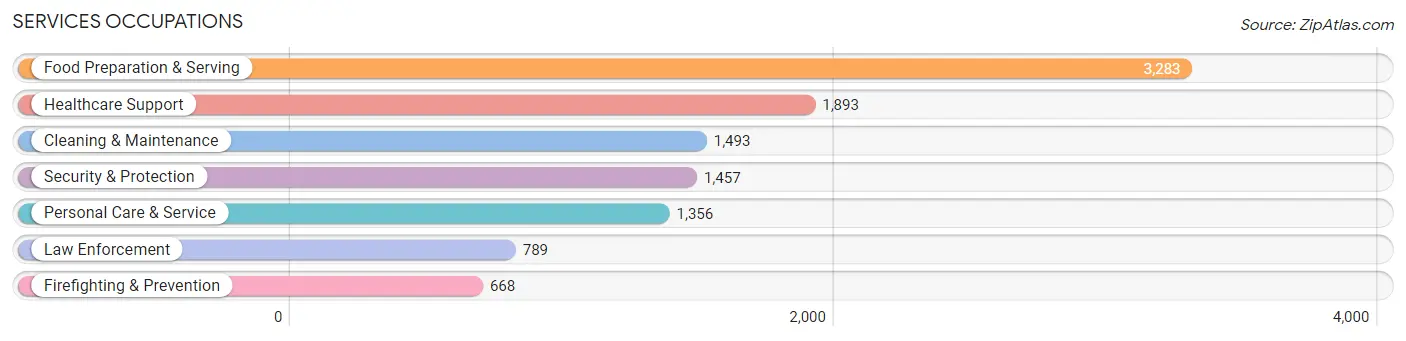
Services Occupations
The most common Services occupations in Surprise are Food Preparation & Serving (3,283 | 5.3%), Healthcare Support (1,893 | 3.0%), Cleaning & Maintenance (1,493 | 2.4%), Security & Protection (1,457 | 2.4%), and Personal Care & Service (1,356 | 2.2%).
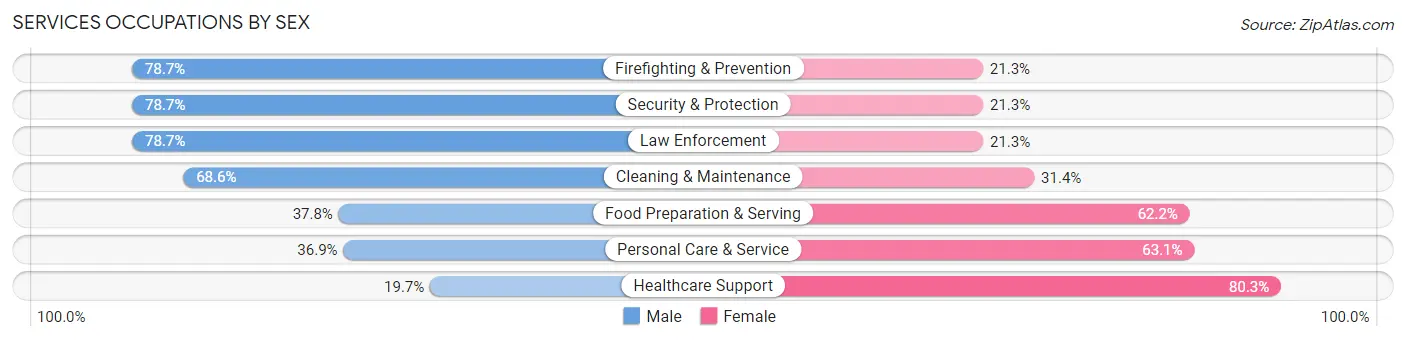
Services Occupations by Sex
Within the Services occupations in Surprise, the most male-oriented occupations are Firefighting & Prevention (78.7%), Security & Protection (78.7%), and Law Enforcement (78.7%), while the most female-oriented occupations are Healthcare Support (80.3%), Personal Care & Service (63.1%), and Food Preparation & Serving (62.2%).
| Occupation | Male | Female |
| Healthcare Support | 373 (19.7%) | 1,520 (80.3%) |
| Security & Protection | 1,147 (78.7%) | 310 (21.3%) |
| Firefighting & Prevention | 526 (78.7%) | 142 (21.3%) |
| Law Enforcement | 621 (78.7%) | 168 (21.3%) |
| Food Preparation & Serving | 1,241 (37.8%) | 2,042 (62.2%) |
| Cleaning & Maintenance | 1,024 (68.6%) | 469 (31.4%) |
| Personal Care & Service | 500 (36.9%) | 856 (63.1%) |
| Total (Category) | 4,285 (45.2%) | 5,197 (54.8%) |
| Total (Overall) | 31,765 (51.2%) | 30,223 (48.8%) |
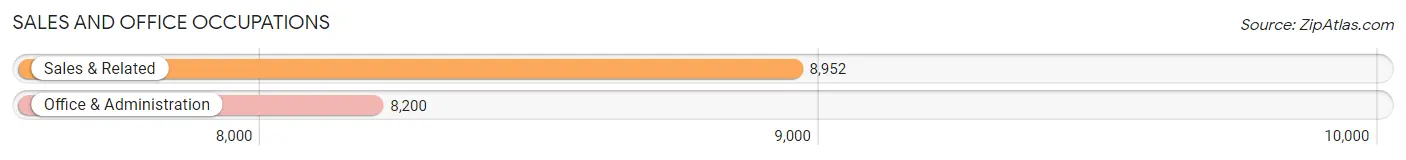
Sales and Office Occupations
The most common Sales and Office occupations in Surprise are Sales & Related (8,952 | 14.4%), and Office & Administration (8,200 | 13.2%).
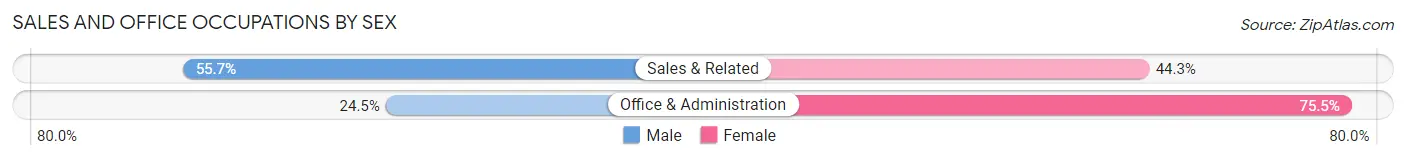
Sales and Office Occupations by Sex
| Occupation | Male | Female |
| Sales & Related | 4,984 (55.7%) | 3,968 (44.3%) |
| Office & Administration | 2,006 (24.5%) | 6,194 (75.5%) |
| Total (Category) | 6,990 (40.7%) | 10,162 (59.3%) |
| Total (Overall) | 31,765 (51.2%) | 30,223 (48.8%) |
Natural Resources, Construction and Maintenance Occupations
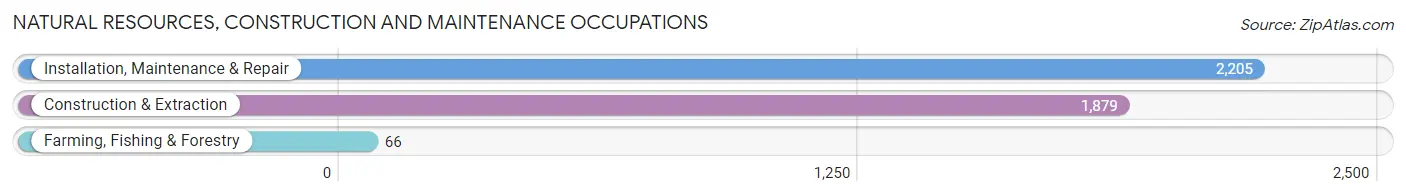
The most common Natural Resources, Construction and Maintenance occupations in Surprise are Installation, Maintenance & Repair (2,205 | 3.6%), Construction & Extraction (1,879 | 3.0%), and Farming, Fishing & Forestry (66 | 0.1%).
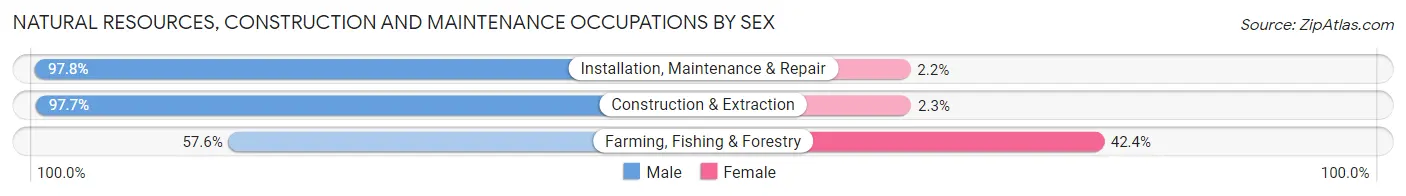
Natural Resources, Construction and Maintenance Occupations by Sex
| Occupation | Male | Female |
| Farming, Fishing & Forestry | 38 (57.6%) | 28 (42.4%) |
| Construction & Extraction | 1,835 (97.7%) | 44 (2.3%) |
| Installation, Maintenance & Repair | 2,157 (97.8%) | 48 (2.2%) |
| Total (Category) | 4,030 (97.1%) | 120 (2.9%) |
| Total (Overall) | 31,765 (51.2%) | 30,223 (48.8%) |
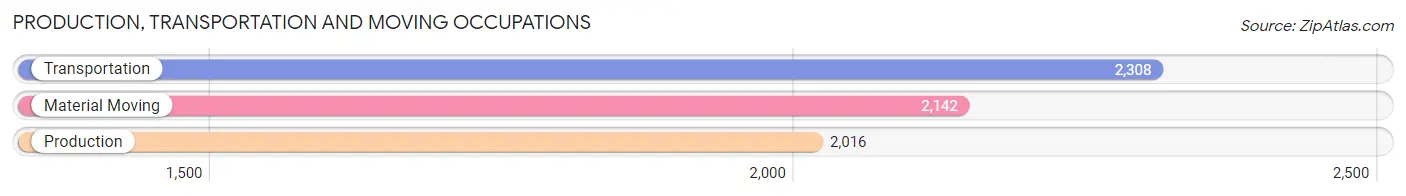
Production, Transportation and Moving Occupations
The most common Production, Transportation and Moving occupations in Surprise are Transportation (2,308 | 3.7%), Material Moving (2,142 | 3.5%), and Production (2,016 | 3.3%).
Production, Transportation and Moving Occupations by Sex
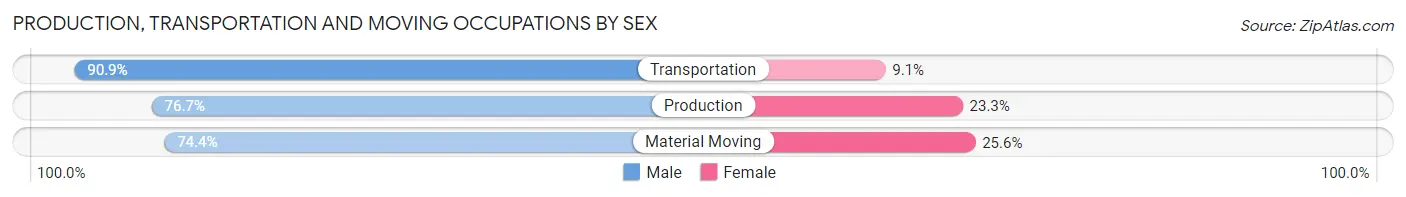
| Occupation | Male | Female |
| Production | 1,546 (76.7%) | 470 (23.3%) |
| Transportation | 2,097 (90.9%) | 211 (9.1%) |
| Material Moving | 1,593 (74.4%) | 549 (25.6%) |
| Total (Category) | 5,236 (81.0%) | 1,230 (19.0%) |
| Total (Overall) | 31,765 (51.2%) | 30,223 (48.8%) |
Employment Industries by Sex in Surprise
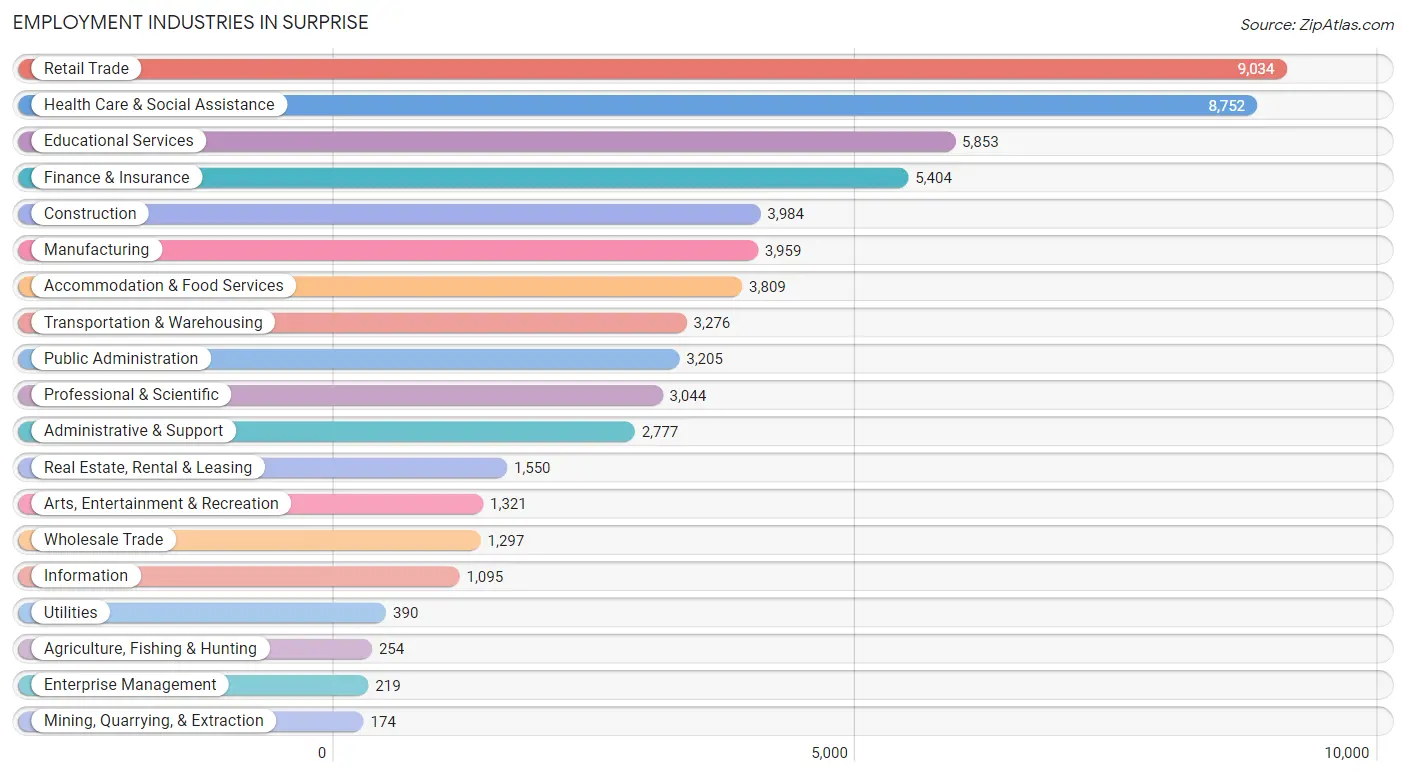
Employment Industries in Surprise
The major employment industries in Surprise include Retail Trade (9,034 | 14.6%), Health Care & Social Assistance (8,752 | 14.1%), Educational Services (5,853 | 9.4%), Finance & Insurance (5,404 | 8.7%), and Construction (3,984 | 6.4%).
Employment Industries by Sex in Surprise
The Surprise industries that see more men than women are Wholesale Trade (87.7%), Construction (85.3%), and Manufacturing (78.5%), whereas the industries that tend to have a higher number of women are Enterprise Management (79.0%), Health Care & Social Assistance (75.5%), and Educational Services (74.8%).
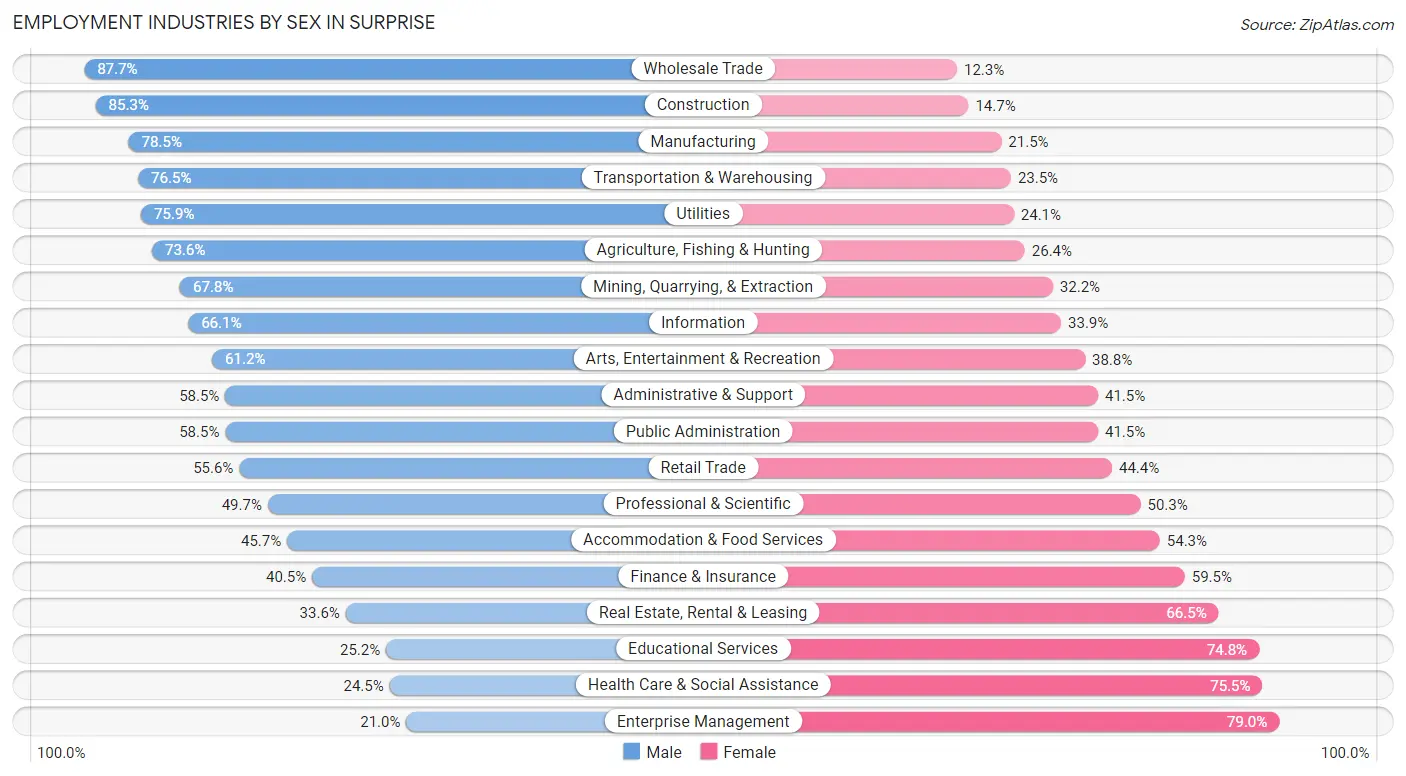
| Industry | Male | Female |
| Agriculture, Fishing & Hunting | 187 (73.6%) | 67 (26.4%) |
| Mining, Quarrying, & Extraction | 118 (67.8%) | 56 (32.2%) |
| Construction | 3,398 (85.3%) | 586 (14.7%) |
| Manufacturing | 3,107 (78.5%) | 852 (21.5%) |
| Wholesale Trade | 1,137 (87.7%) | 160 (12.3%) |
| Retail Trade | 5,021 (55.6%) | 4,013 (44.4%) |
| Transportation & Warehousing | 2,506 (76.5%) | 770 (23.5%) |
| Utilities | 296 (75.9%) | 94 (24.1%) |
| Information | 724 (66.1%) | 371 (33.9%) |
| Finance & Insurance | 2,189 (40.5%) | 3,215 (59.5%) |
| Real Estate, Rental & Leasing | 520 (33.6%) | 1,030 (66.4%) |
| Professional & Scientific | 1,512 (49.7%) | 1,532 (50.3%) |
| Enterprise Management | 46 (21.0%) | 173 (79.0%) |
| Administrative & Support | 1,624 (58.5%) | 1,153 (41.5%) |
| Educational Services | 1,474 (25.2%) | 4,379 (74.8%) |
| Health Care & Social Assistance | 2,142 (24.5%) | 6,610 (75.5%) |
| Arts, Entertainment & Recreation | 808 (61.2%) | 513 (38.8%) |
| Accommodation & Food Services | 1,740 (45.7%) | 2,069 (54.3%) |
| Public Administration | 1,874 (58.5%) | 1,331 (41.5%) |
| Total | 31,765 (51.2%) | 30,223 (48.8%) |
Education in Surprise
School Enrollment in Surprise
The most common levels of schooling among the 35,620 students in Surprise are high school (9,061 | 25.4%), middle school (8,711 | 24.5%), and elementary school (7,833 | 22.0%).
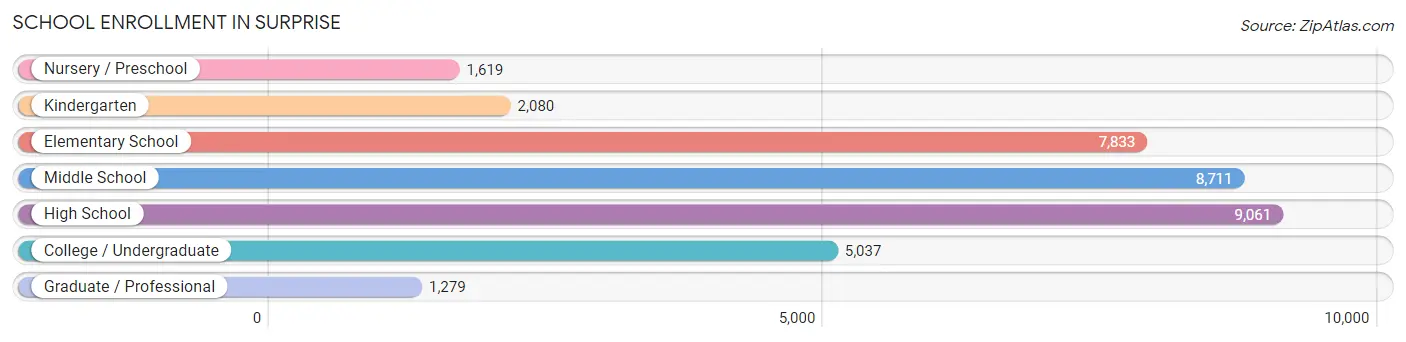
| School Level | # Students | % Students |
| Nursery / Preschool | 1,619 | 4.5% |
| Kindergarten | 2,080 | 5.8% |
| Elementary School | 7,833 | 22.0% |
| Middle School | 8,711 | 24.5% |
| High School | 9,061 | 25.4% |
| College / Undergraduate | 5,037 | 14.1% |
| Graduate / Professional | 1,279 | 3.6% |
| Total | 35,620 | 100.0% |
School Enrollment by Age by Funding Source in Surprise
Out of a total of 35,620 students who are enrolled in schools in Surprise, 4,666 (13.1%) attend a private institution, while the remaining 30,954 (86.9%) are enrolled in public schools. The age group of 3 to 4 year olds has the highest likelihood of being enrolled in private schools, with 502 (38.9% in the age bracket) enrolled. Conversely, the age group of 18 to 19 year olds has the lowest likelihood of being enrolled in a private school, with 1,772 (93.2% in the age bracket) attending a public institution.
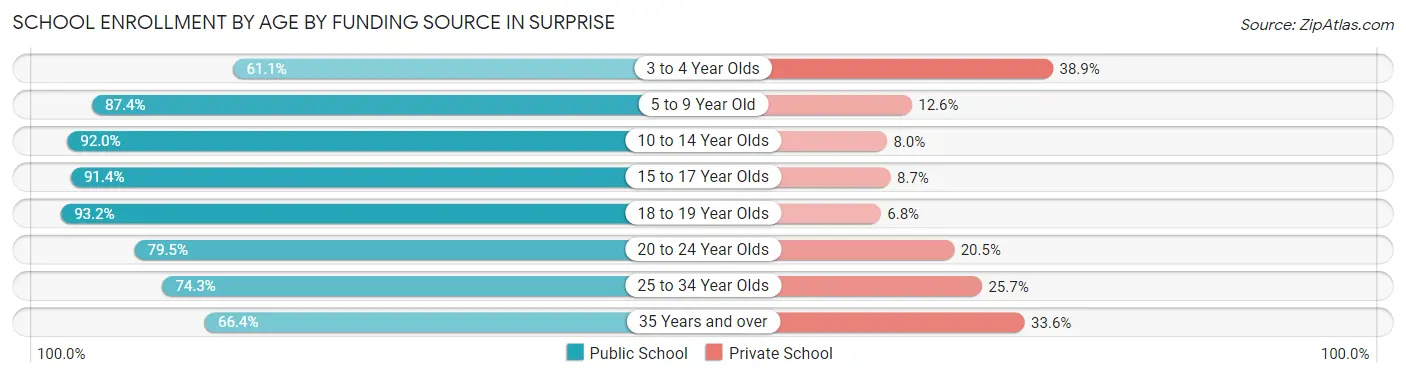
| Age Bracket | Public School | Private School |
| 3 to 4 Year Olds | 788 (61.1%) | 502 (38.9%) |
| 5 to 9 Year Old | 7,902 (87.4%) | 1,138 (12.6%) |
| 10 to 14 Year Olds | 10,376 (92.0%) | 899 (8.0%) |
| 15 to 17 Year Olds | 6,044 (91.3%) | 572 (8.6%) |
| 18 to 19 Year Olds | 1,772 (93.2%) | 130 (6.8%) |
| 20 to 24 Year Olds | 1,986 (79.5%) | 512 (20.5%) |
| 25 to 34 Year Olds | 938 (74.3%) | 324 (25.7%) |
| 35 Years and over | 1,153 (66.4%) | 584 (33.6%) |
| Total | 30,954 (86.9%) | 4,666 (13.1%) |
Educational Attainment by Field of Study in Surprise
Business (7,433 | 22.6%), education (5,388 | 16.4%), science & technology (3,897 | 11.8%), arts & humanities (2,635 | 8.0%), and social sciences (2,078 | 6.3%) are the most common fields of study among 32,878 individuals in Surprise who have obtained a bachelor's degree or higher.
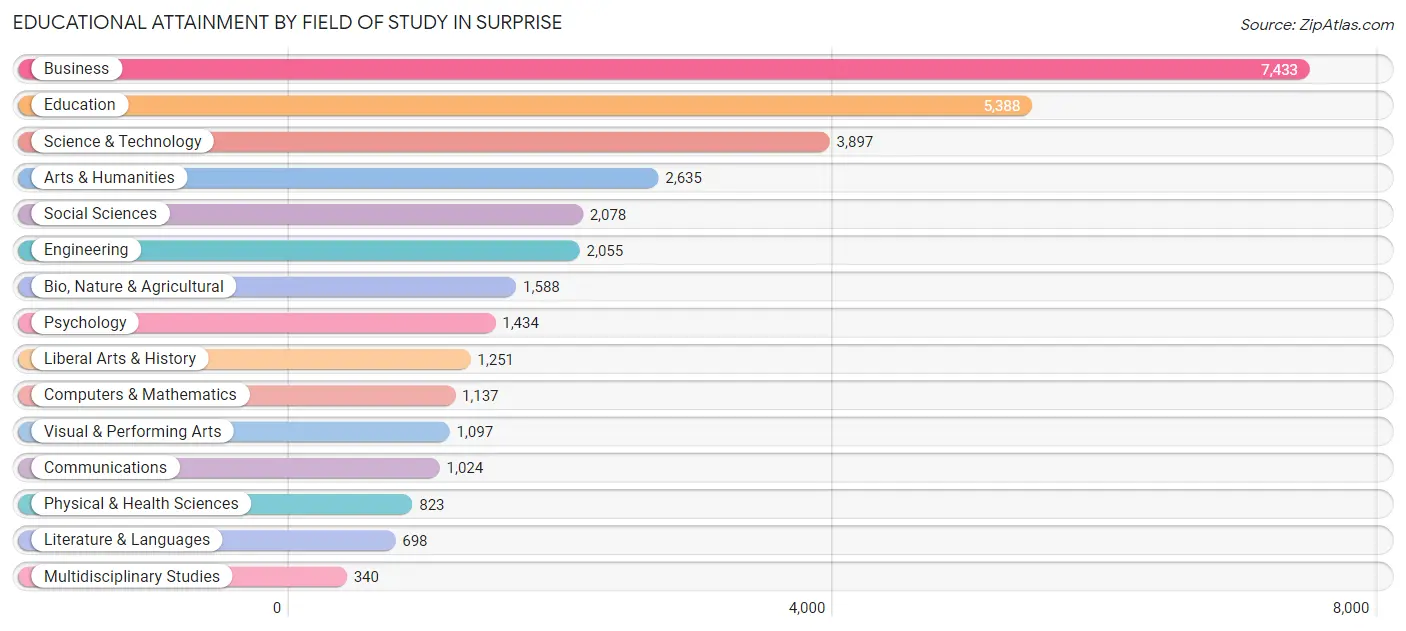
| Field of Study | # Graduates | % Graduates |
| Computers & Mathematics | 1,137 | 3.5% |
| Bio, Nature & Agricultural | 1,588 | 4.8% |
| Physical & Health Sciences | 823 | 2.5% |
| Psychology | 1,434 | 4.4% |
| Social Sciences | 2,078 | 6.3% |
| Engineering | 2,055 | 6.2% |
| Multidisciplinary Studies | 340 | 1.0% |
| Science & Technology | 3,897 | 11.8% |
| Business | 7,433 | 22.6% |
| Education | 5,388 | 16.4% |
| Literature & Languages | 698 | 2.1% |
| Liberal Arts & History | 1,251 | 3.8% |
| Visual & Performing Arts | 1,097 | 3.3% |
| Communications | 1,024 | 3.1% |
| Arts & Humanities | 2,635 | 8.0% |
| Total | 32,878 | 100.0% |
Transportation & Commute in Surprise
Vehicle Availability by Sex in Surprise
The most prevalent vehicle ownership categories in Surprise are males with 2 vehicles (14,763, accounting for 46.1%) and females with 2 vehicles (13,381, making up 50.1%).
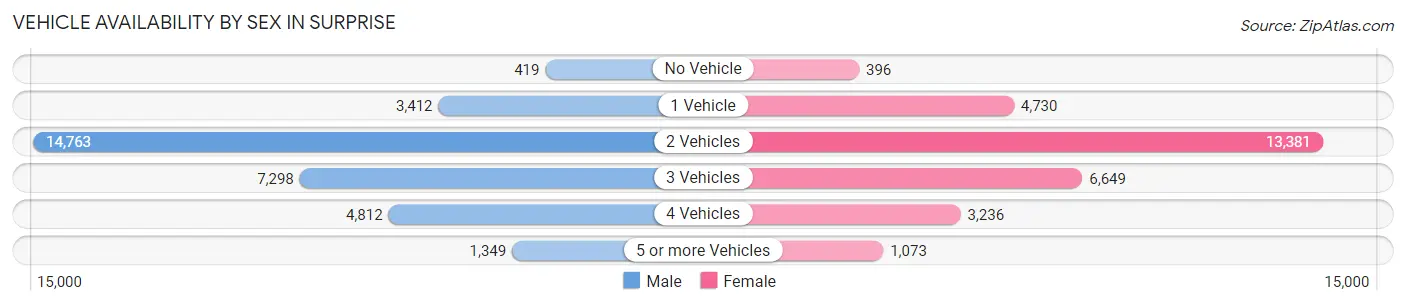
| Vehicles Available | Male | Female |
| No Vehicle | 419 (1.3%) | 396 (1.3%) |
| 1 Vehicle | 3,412 (10.6%) | 4,730 (16.1%) |
| 2 Vehicles | 14,763 (46.1%) | 13,381 (45.4%) |
| 3 Vehicles | 7,298 (22.8%) | 6,649 (22.6%) |
| 4 Vehicles | 4,812 (15.0%) | 3,236 (11.0%) |
| 5 or more Vehicles | 1,349 (4.2%) | 1,073 (3.6%) |
| Total | 32,053 (100.0%) | 29,465 (100.0%) |
Commute Time in Surprise
The most frequently occuring commute durations in Surprise are 30 to 34 minutes (7,127 commuters, 13.6%), 20 to 24 minutes (6,616 commuters, 12.6%), and 45 to 59 minutes (6,050 commuters, 11.5%).
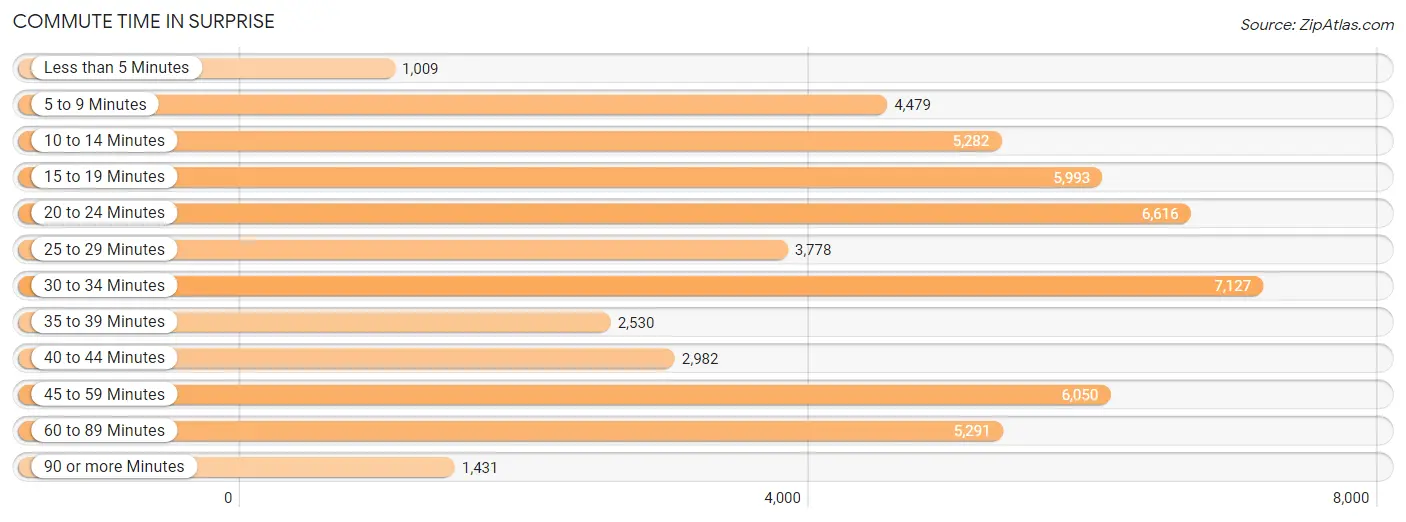
| Commute Time | # Commuters | % Commuters |
| Less than 5 Minutes | 1,009 | 1.9% |
| 5 to 9 Minutes | 4,479 | 8.5% |
| 10 to 14 Minutes | 5,282 | 10.1% |
| 15 to 19 Minutes | 5,993 | 11.4% |
| 20 to 24 Minutes | 6,616 | 12.6% |
| 25 to 29 Minutes | 3,778 | 7.2% |
| 30 to 34 Minutes | 7,127 | 13.6% |
| 35 to 39 Minutes | 2,530 | 4.8% |
| 40 to 44 Minutes | 2,982 | 5.7% |
| 45 to 59 Minutes | 6,050 | 11.5% |
| 60 to 89 Minutes | 5,291 | 10.1% |
| 90 or more Minutes | 1,431 | 2.7% |
Commute Time by Sex in Surprise
The most common commute times in Surprise are 30 to 34 minutes (3,779 commuters, 13.5%) for males and 30 to 34 minutes (3,348 commuters, 13.6%) for females.
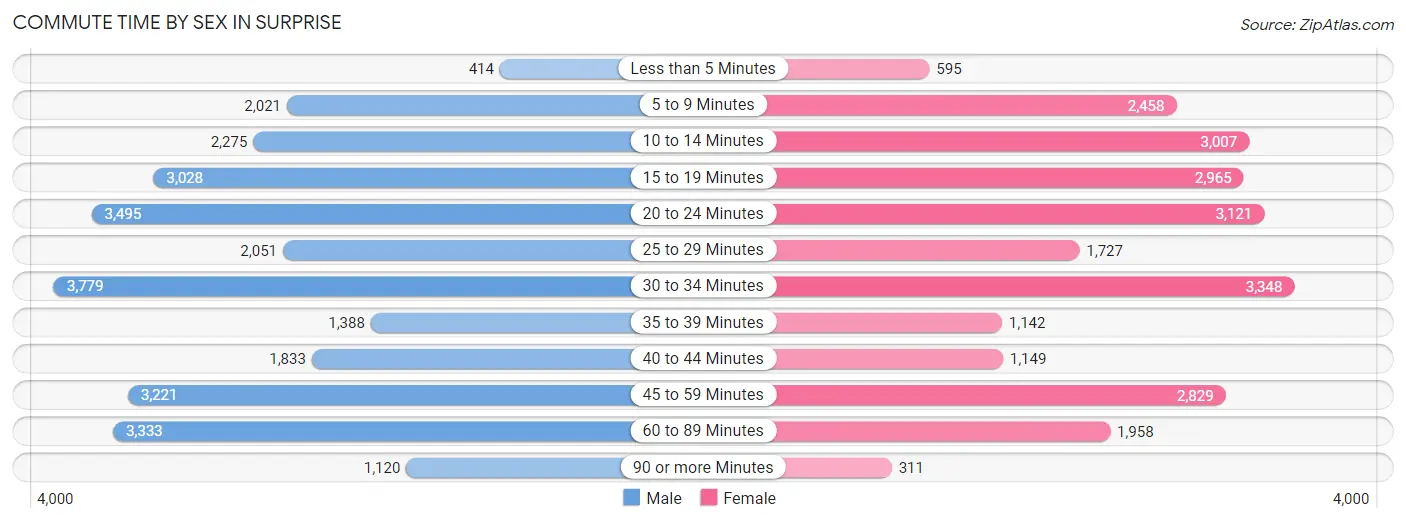
| Commute Time | Male | Female |
| Less than 5 Minutes | 414 (1.5%) | 595 (2.4%) |
| 5 to 9 Minutes | 2,021 (7.2%) | 2,458 (10.0%) |
| 10 to 14 Minutes | 2,275 (8.1%) | 3,007 (12.2%) |
| 15 to 19 Minutes | 3,028 (10.8%) | 2,965 (12.0%) |
| 20 to 24 Minutes | 3,495 (12.5%) | 3,121 (12.7%) |
| 25 to 29 Minutes | 2,051 (7.3%) | 1,727 (7.0%) |
| 30 to 34 Minutes | 3,779 (13.5%) | 3,348 (13.6%) |
| 35 to 39 Minutes | 1,388 (5.0%) | 1,142 (4.6%) |
| 40 to 44 Minutes | 1,833 (6.6%) | 1,149 (4.7%) |
| 45 to 59 Minutes | 3,221 (11.5%) | 2,829 (11.5%) |
| 60 to 89 Minutes | 3,333 (11.9%) | 1,958 (8.0%) |
| 90 or more Minutes | 1,120 (4.0%) | 311 (1.3%) |
Time of Departure to Work by Sex in Surprise
The most frequent times of departure to work in Surprise are 12:00 AM to 4:59 AM (4,140, 14.8%) for males and 7:00 AM to 7:29 AM (3,367, 13.7%) for females.
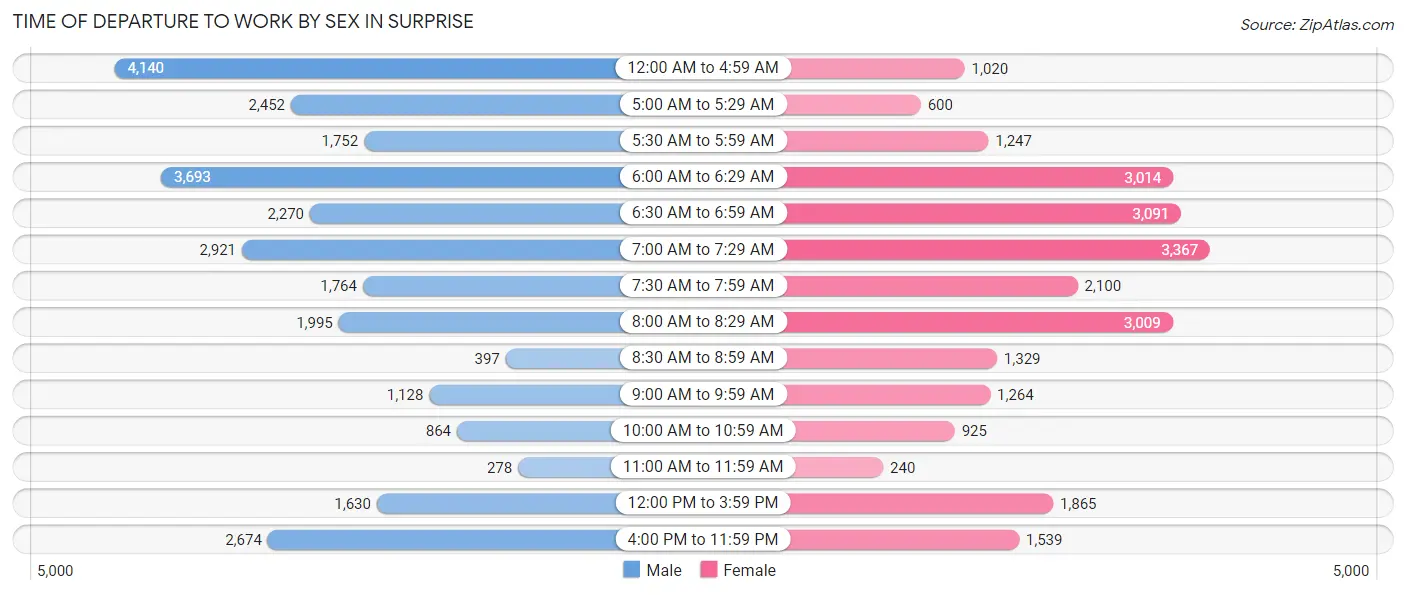
| Time of Departure | Male | Female |
| 12:00 AM to 4:59 AM | 4,140 (14.8%) | 1,020 (4.1%) |
| 5:00 AM to 5:29 AM | 2,452 (8.8%) | 600 (2.4%) |
| 5:30 AM to 5:59 AM | 1,752 (6.3%) | 1,247 (5.1%) |
| 6:00 AM to 6:29 AM | 3,693 (13.2%) | 3,014 (12.2%) |
| 6:30 AM to 6:59 AM | 2,270 (8.1%) | 3,091 (12.6%) |
| 7:00 AM to 7:29 AM | 2,921 (10.4%) | 3,367 (13.7%) |
| 7:30 AM to 7:59 AM | 1,764 (6.3%) | 2,100 (8.5%) |
| 8:00 AM to 8:29 AM | 1,995 (7.1%) | 3,009 (12.2%) |
| 8:30 AM to 8:59 AM | 397 (1.4%) | 1,329 (5.4%) |
| 9:00 AM to 9:59 AM | 1,128 (4.0%) | 1,264 (5.1%) |
| 10:00 AM to 10:59 AM | 864 (3.1%) | 925 (3.8%) |
| 11:00 AM to 11:59 AM | 278 (1.0%) | 240 (1.0%) |
| 12:00 PM to 3:59 PM | 1,630 (5.8%) | 1,865 (7.6%) |
| 4:00 PM to 11:59 PM | 2,674 (9.6%) | 1,539 (6.2%) |
| Total | 27,958 (100.0%) | 24,610 (100.0%) |
Housing Occupancy in Surprise
Occupancy by Ownership in Surprise
Of the total 52,995 dwellings in Surprise, owner-occupied units account for 41,568 (78.4%), while renter-occupied units make up 11,427 (21.6%).
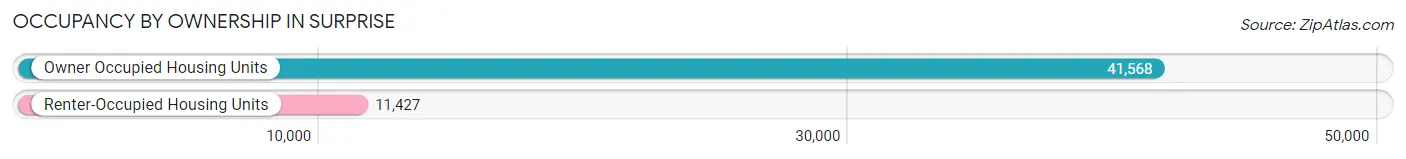
| Occupancy | # Housing Units | % Housing Units |
| Owner Occupied Housing Units | 41,568 | 78.4% |
| Renter-Occupied Housing Units | 11,427 | 21.6% |
| Total Occupied Housing Units | 52,995 | 100.0% |
Occupancy by Household Size in Surprise
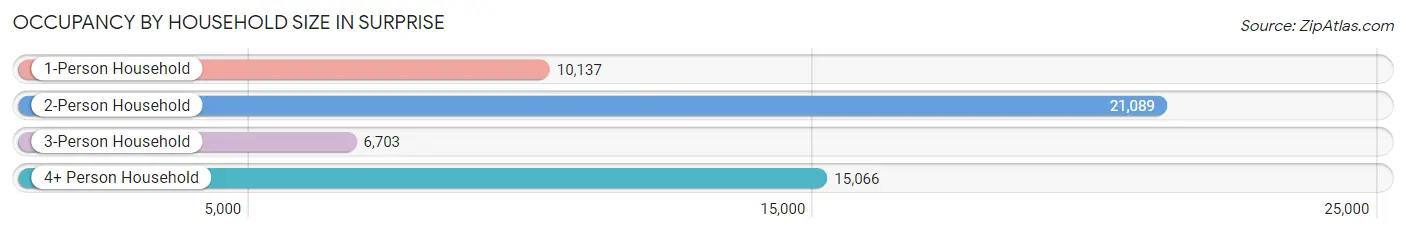
| Household Size | # Housing Units | % Housing Units |
| 1-Person Household | 10,137 | 19.1% |
| 2-Person Household | 21,089 | 39.8% |
| 3-Person Household | 6,703 | 12.7% |
| 4+ Person Household | 15,066 | 28.4% |
| Total Housing Units | 52,995 | 100.0% |
Occupancy by Ownership by Household Size in Surprise
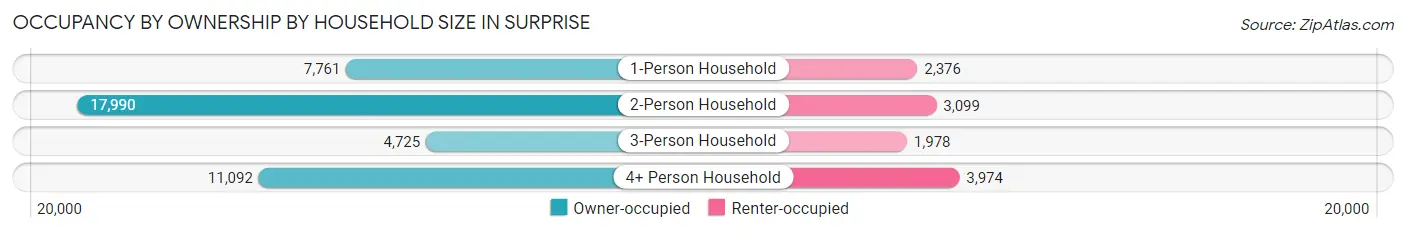
| Household Size | Owner-occupied | Renter-occupied |
| 1-Person Household | 7,761 (76.6%) | 2,376 (23.4%) |
| 2-Person Household | 17,990 (85.3%) | 3,099 (14.7%) |
| 3-Person Household | 4,725 (70.5%) | 1,978 (29.5%) |
| 4+ Person Household | 11,092 (73.6%) | 3,974 (26.4%) |
| Total Housing Units | 41,568 (78.4%) | 11,427 (21.6%) |
Occupancy by Educational Attainment in Surprise
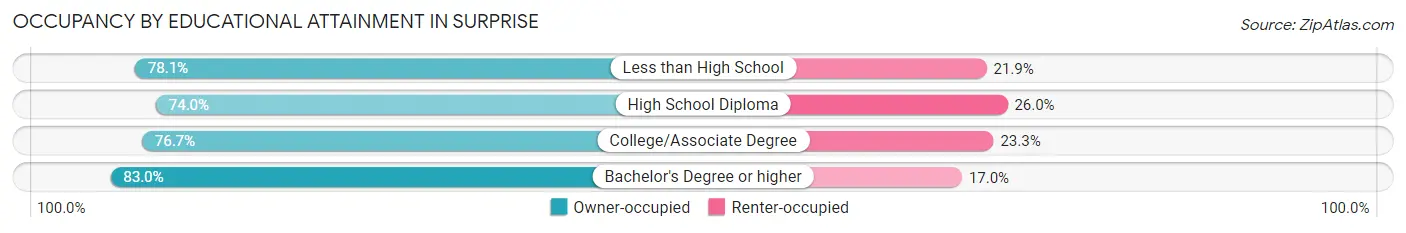
| Household Size | Owner-occupied | Renter-occupied |
| Less than High School | 2,039 (78.1%) | 571 (21.9%) |
| High School Diploma | 7,863 (74.0%) | 2,767 (26.0%) |
| College/Associate Degree | 16,297 (76.7%) | 4,939 (23.3%) |
| Bachelor's Degree or higher | 15,369 (83.0%) | 3,150 (17.0%) |
Occupancy by Age of Householder in Surprise
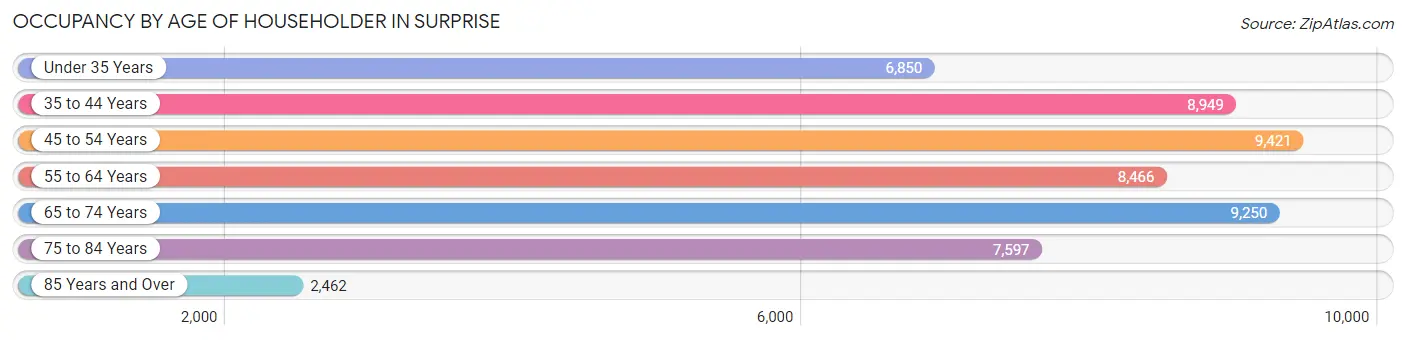
| Age Bracket | # Households | % Households |
| Under 35 Years | 6,850 | 12.9% |
| 35 to 44 Years | 8,949 | 16.9% |
| 45 to 54 Years | 9,421 | 17.8% |
| 55 to 64 Years | 8,466 | 16.0% |
| 65 to 74 Years | 9,250 | 17.4% |
| 75 to 84 Years | 7,597 | 14.3% |
| 85 Years and Over | 2,462 | 4.6% |
| Total | 52,995 | 100.0% |
Housing Finances in Surprise
Median Income by Occupancy in Surprise
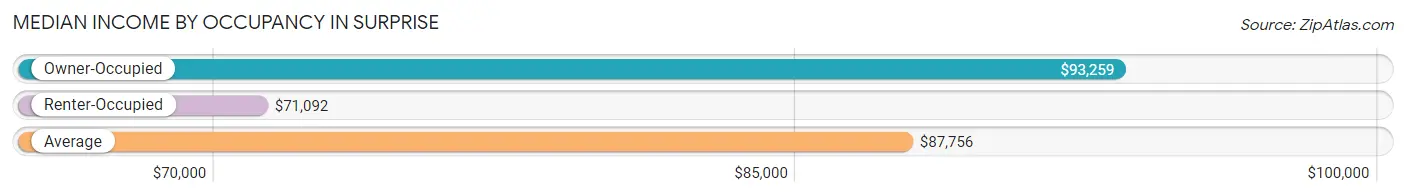
| Occupancy Type | # Households | Median Income |
| Owner-Occupied | 41,568 (78.4%) | $93,259 |
| Renter-Occupied | 11,427 (21.6%) | $71,092 |
| Average | 52,995 (100.0%) | $87,756 |
Occupancy by Householder Income Bracket in Surprise
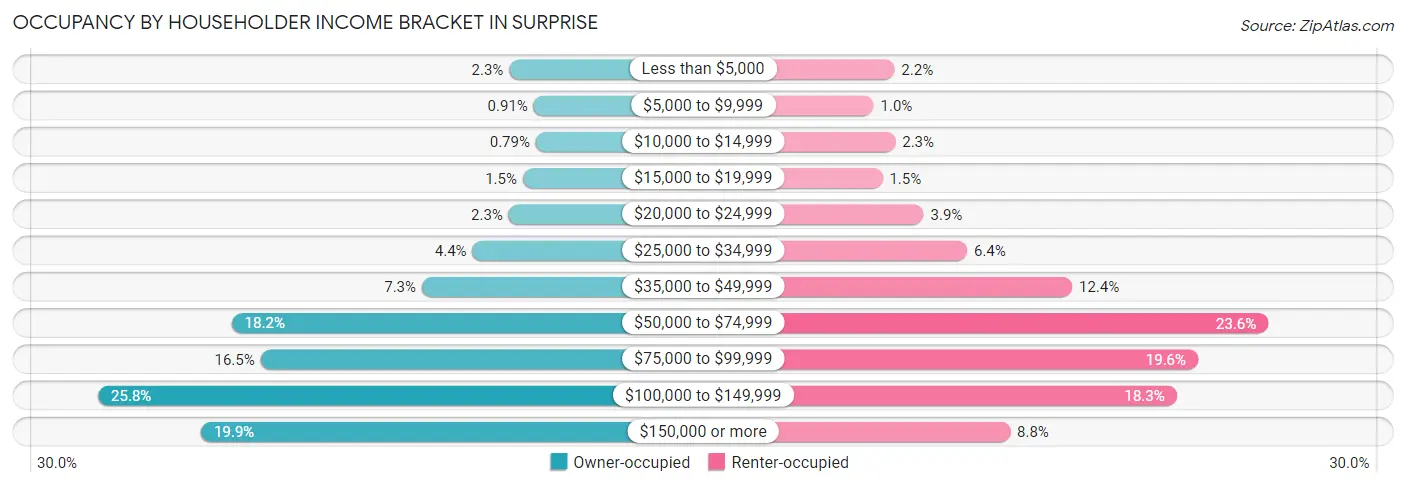
| Income Bracket | Owner-occupied | Renter-occupied |
| Less than $5,000 | 960 (2.3%) | 254 (2.2%) |
| $5,000 to $9,999 | 379 (0.9%) | 118 (1.0%) |
| $10,000 to $14,999 | 328 (0.8%) | 259 (2.3%) |
| $15,000 to $19,999 | 636 (1.5%) | 176 (1.5%) |
| $20,000 to $24,999 | 972 (2.3%) | 445 (3.9%) |
| $25,000 to $34,999 | 1,832 (4.4%) | 728 (6.4%) |
| $35,000 to $49,999 | 3,033 (7.3%) | 1,414 (12.4%) |
| $50,000 to $74,999 | 7,552 (18.2%) | 2,693 (23.6%) |
| $75,000 to $99,999 | 6,869 (16.5%) | 2,235 (19.6%) |
| $100,000 to $149,999 | 10,727 (25.8%) | 2,096 (18.3%) |
| $150,000 or more | 8,280 (19.9%) | 1,009 (8.8%) |
| Total | 41,568 (100.0%) | 11,427 (100.0%) |
Monthly Housing Cost Tiers in Surprise
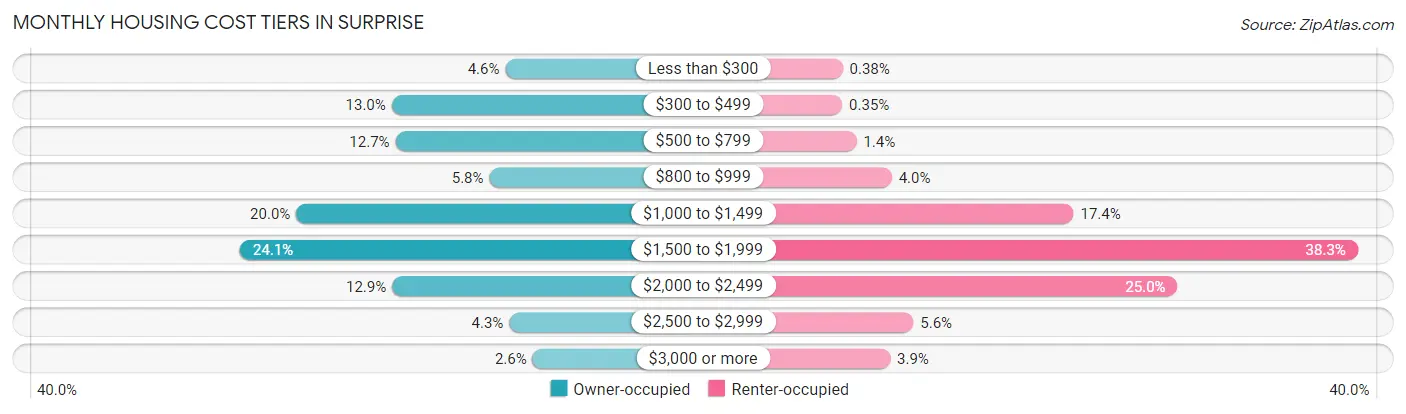
| Monthly Cost | Owner-occupied | Renter-occupied |
| Less than $300 | 1,914 (4.6%) | 43 (0.4%) |
| $300 to $499 | 5,391 (13.0%) | 40 (0.4%) |
| $500 to $799 | 5,274 (12.7%) | 160 (1.4%) |
| $800 to $999 | 2,397 (5.8%) | 457 (4.0%) |
| $1,000 to $1,499 | 8,312 (20.0%) | 1,987 (17.4%) |
| $1,500 to $1,999 | 10,034 (24.1%) | 4,378 (38.3%) |
| $2,000 to $2,499 | 5,377 (12.9%) | 2,861 (25.0%) |
| $2,500 to $2,999 | 1,791 (4.3%) | 639 (5.6%) |
| $3,000 or more | 1,078 (2.6%) | 443 (3.9%) |
| Total | 41,568 (100.0%) | 11,427 (100.0%) |
Physical Housing Characteristics in Surprise
Housing Structures in Surprise
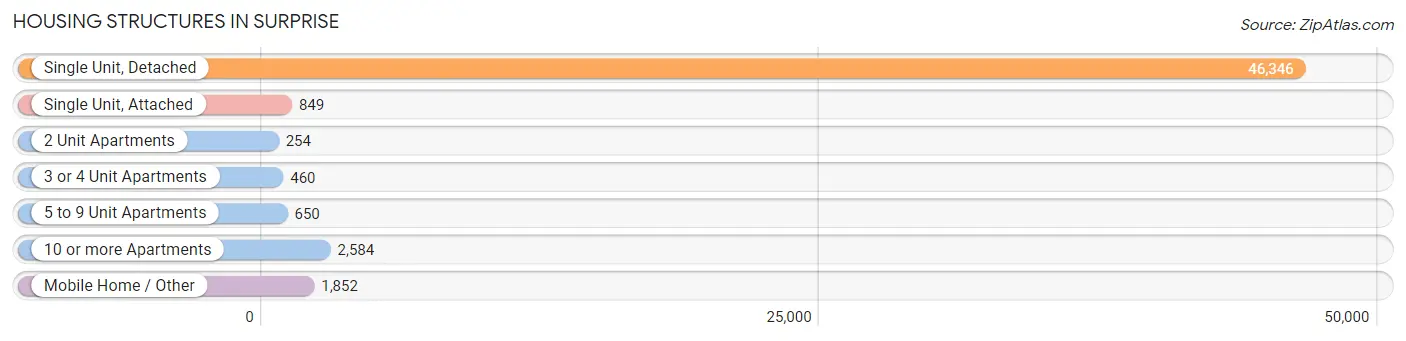
| Structure Type | # Housing Units | % Housing Units |
| Single Unit, Detached | 46,346 | 87.5% |
| Single Unit, Attached | 849 | 1.6% |
| 2 Unit Apartments | 254 | 0.5% |
| 3 or 4 Unit Apartments | 460 | 0.9% |
| 5 to 9 Unit Apartments | 650 | 1.2% |
| 10 or more Apartments | 2,584 | 4.9% |
| Mobile Home / Other | 1,852 | 3.5% |
| Total | 52,995 | 100.0% |
Housing Structures by Occupancy in Surprise
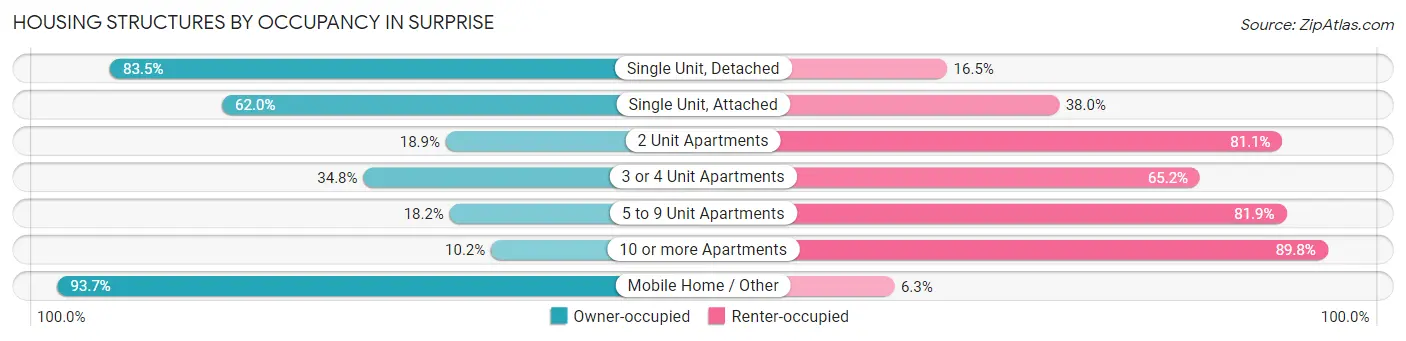
| Structure Type | Owner-occupied | Renter-occupied |
| Single Unit, Detached | 38,718 (83.5%) | 7,628 (16.5%) |
| Single Unit, Attached | 526 (62.0%) | 323 (38.0%) |
| 2 Unit Apartments | 48 (18.9%) | 206 (81.1%) |
| 3 or 4 Unit Apartments | 160 (34.8%) | 300 (65.2%) |
| 5 to 9 Unit Apartments | 118 (18.1%) | 532 (81.9%) |
| 10 or more Apartments | 263 (10.2%) | 2,321 (89.8%) |
| Mobile Home / Other | 1,735 (93.7%) | 117 (6.3%) |
| Total | 41,568 (78.4%) | 11,427 (21.6%) |
Housing Structures by Number of Rooms in Surprise
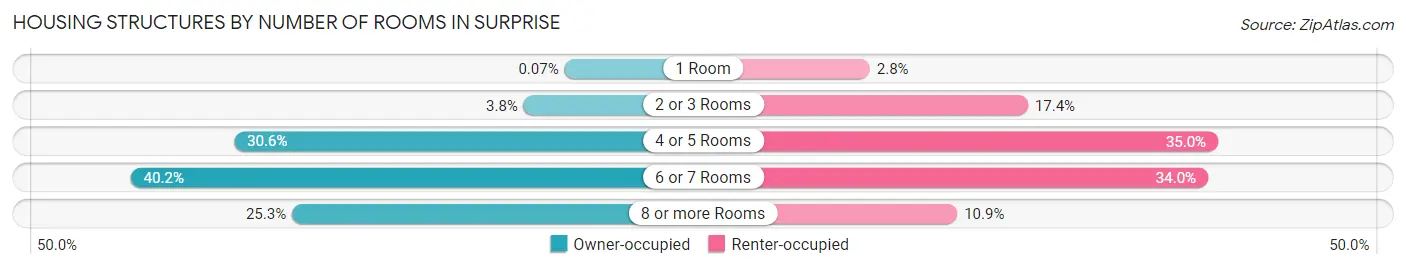
| Number of Rooms | Owner-occupied | Renter-occupied |
| 1 Room | 31 (0.1%) | 316 (2.8%) |
| 2 or 3 Rooms | 1,597 (3.8%) | 1,987 (17.4%) |
| 4 or 5 Rooms | 12,728 (30.6%) | 3,995 (35.0%) |
| 6 or 7 Rooms | 16,706 (40.2%) | 3,889 (34.0%) |
| 8 or more Rooms | 10,506 (25.3%) | 1,240 (10.8%) |
| Total | 41,568 (100.0%) | 11,427 (100.0%) |
Housing Structure by Heating Type in Surprise
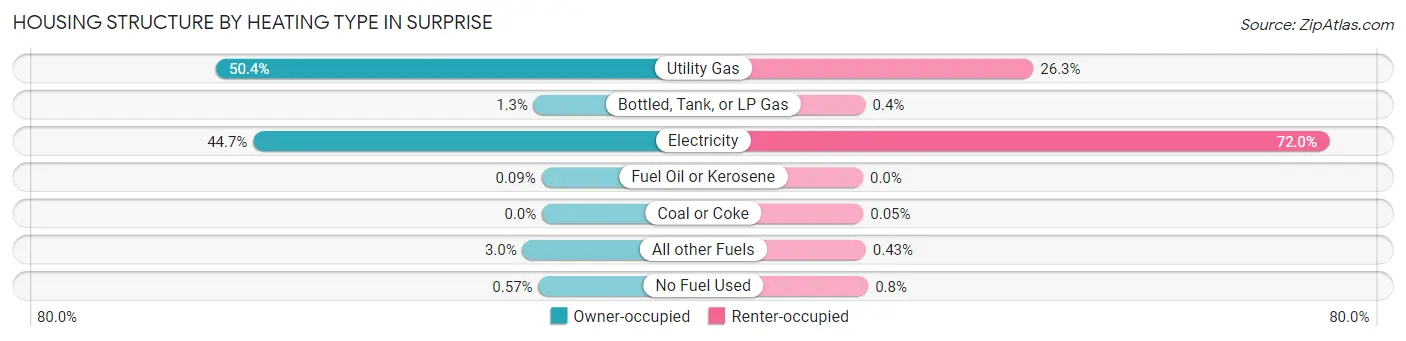
| Heating Type | Owner-occupied | Renter-occupied |
| Utility Gas | 20,949 (50.4%) | 3,009 (26.3%) |
| Bottled, Tank, or LP Gas | 527 (1.3%) | 46 (0.4%) |
| Electricity | 18,563 (44.7%) | 8,226 (72.0%) |
| Fuel Oil or Kerosene | 38 (0.1%) | 0 (0.0%) |
| Coal or Coke | 0 (0.0%) | 6 (0.1%) |
| All other Fuels | 1,254 (3.0%) | 49 (0.4%) |
| No Fuel Used | 237 (0.6%) | 91 (0.8%) |
| Total | 41,568 (100.0%) | 11,427 (100.0%) |
Household Vehicle Usage in Surprise
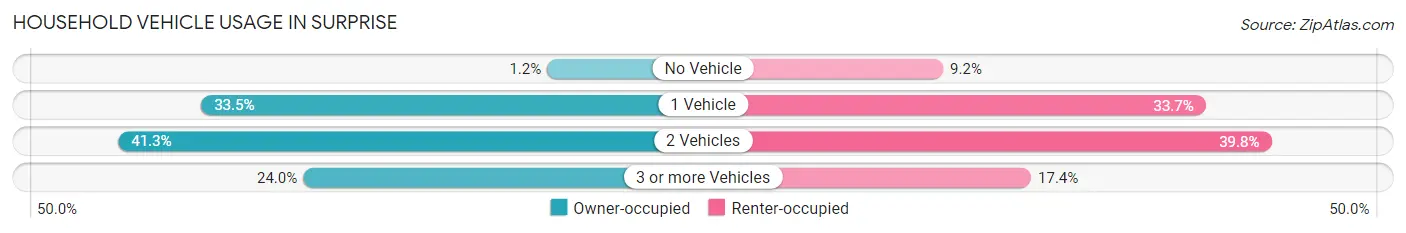
| Vehicles per Household | Owner-occupied | Renter-occupied |
| No Vehicle | 510 (1.2%) | 1,048 (9.2%) |
| 1 Vehicle | 13,931 (33.5%) | 3,846 (33.7%) |
| 2 Vehicles | 17,145 (41.2%) | 4,547 (39.8%) |
| 3 or more Vehicles | 9,982 (24.0%) | 1,986 (17.4%) |
| Total | 41,568 (100.0%) | 11,427 (100.0%) |
Real Estate & Mortgages in Surprise
Real Estate and Mortgage Overview in Surprise
| Characteristic | Without Mortgage | With Mortgage |
| Housing Units | 13,021 | 28,547 |
| Median Property Value | $328,100 | $360,600 |
| Median Household Income | $69,523 | $6,631 |
| Monthly Housing Costs | $479 | $1,006 |
| Real Estate Taxes | $1,754 | $425 |
Property Value by Mortgage Status in Surprise
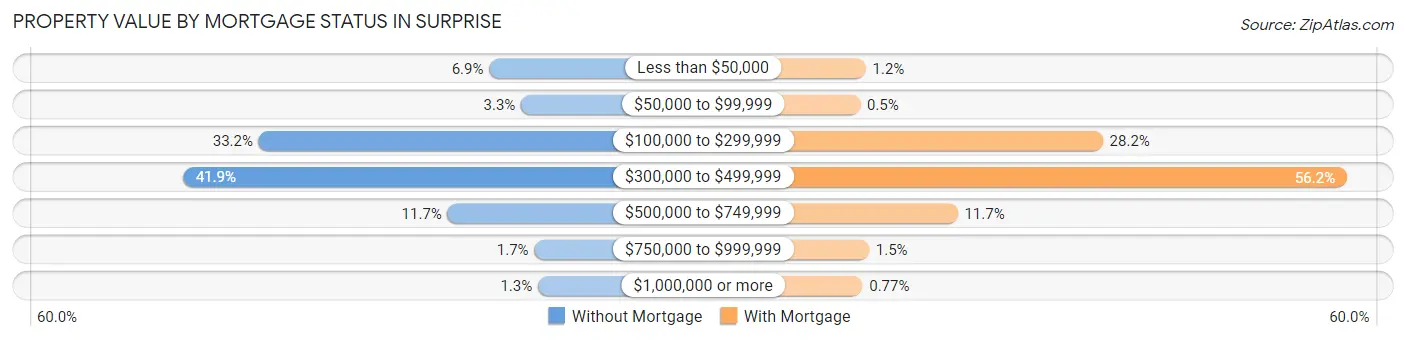
| Property Value | Without Mortgage | With Mortgage |
| Less than $50,000 | 897 (6.9%) | 327 (1.1%) |
| $50,000 to $99,999 | 423 (3.3%) | 144 (0.5%) |
| $100,000 to $299,999 | 4,327 (33.2%) | 8,062 (28.2%) |
| $300,000 to $499,999 | 5,460 (41.9%) | 16,033 (56.2%) |
| $500,000 to $749,999 | 1,517 (11.7%) | 3,327 (11.7%) |
| $750,000 to $999,999 | 225 (1.7%) | 435 (1.5%) |
| $1,000,000 or more | 172 (1.3%) | 219 (0.8%) |
| Total | 13,021 (100.0%) | 28,547 (100.0%) |
Household Income by Mortgage Status in Surprise
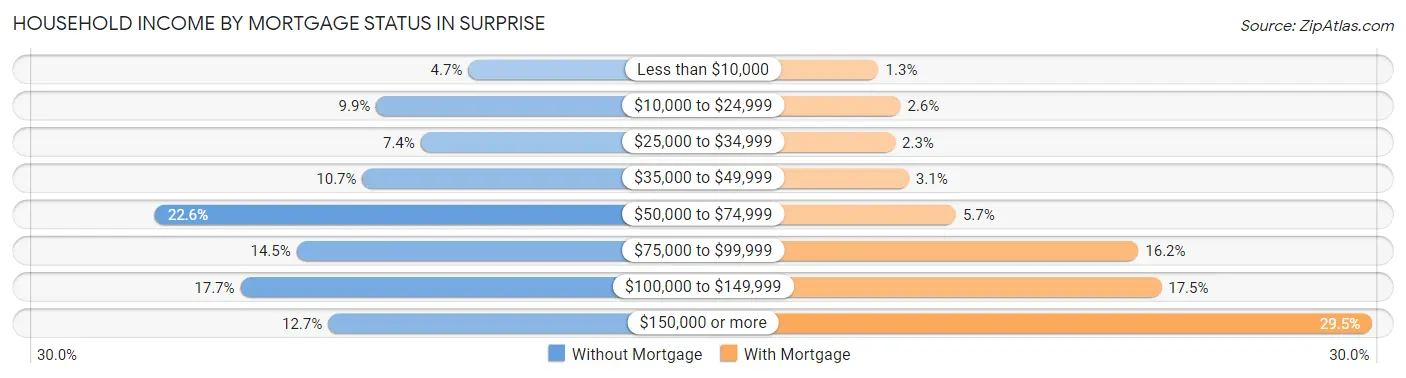
| Household Income | Without Mortgage | With Mortgage |
| Less than $10,000 | 606 (4.6%) | 376 (1.3%) |
| $10,000 to $24,999 | 1,291 (9.9%) | 733 (2.6%) |
| $25,000 to $34,999 | 960 (7.4%) | 645 (2.3%) |
| $35,000 to $49,999 | 1,393 (10.7%) | 872 (3.0%) |
| $50,000 to $74,999 | 2,938 (22.6%) | 1,640 (5.7%) |
| $75,000 to $99,999 | 1,883 (14.5%) | 4,614 (16.2%) |
| $100,000 to $149,999 | 2,301 (17.7%) | 4,986 (17.5%) |
| $150,000 or more | 1,649 (12.7%) | 8,426 (29.5%) |
| Total | 13,021 (100.0%) | 28,547 (100.0%) |
Property Value to Household Income Ratio in Surprise
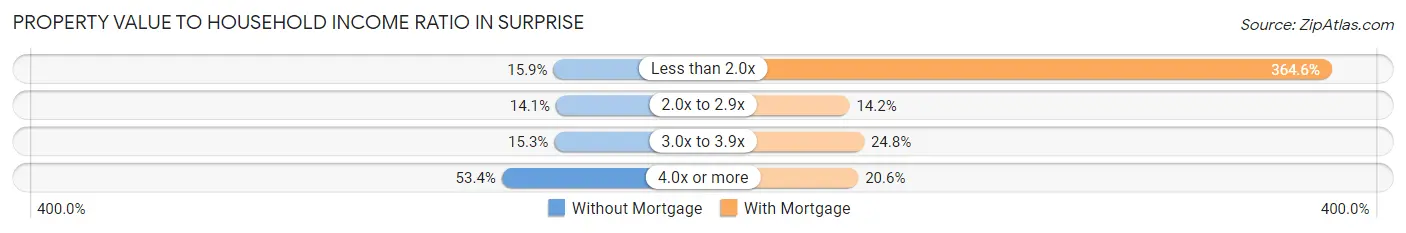
| Value-to-Income Ratio | Without Mortgage | With Mortgage |
| Less than 2.0x | 2,070 (15.9%) | 104,075 (364.6%) |
| 2.0x to 2.9x | 1,829 (14.1%) | 4,063 (14.2%) |
| 3.0x to 3.9x | 1,993 (15.3%) | 7,065 (24.7%) |
| 4.0x or more | 6,958 (53.4%) | 5,870 (20.6%) |
| Total | 13,021 (100.0%) | 28,547 (100.0%) |
Real Estate Taxes by Mortgage Status in Surprise
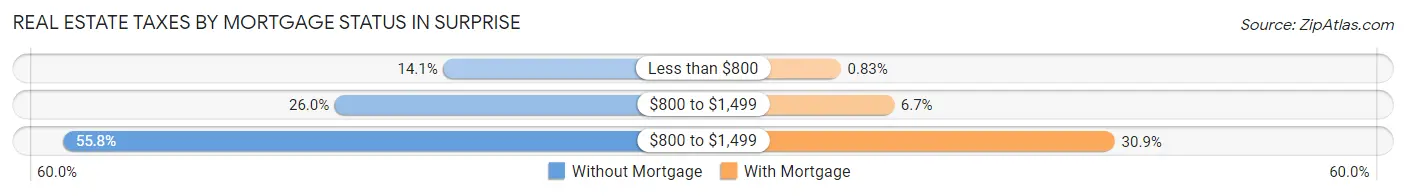
| Property Taxes | Without Mortgage | With Mortgage |
| Less than $800 | 1,835 (14.1%) | 236 (0.8%) |
| $800 to $1,499 | 3,383 (26.0%) | 1,902 (6.7%) |
| $800 to $1,499 | 7,267 (55.8%) | 8,811 (30.9%) |
| Total | 13,021 (100.0%) | 28,547 (100.0%) |
Health & Disability in Surprise
Health Insurance Coverage by Age in Surprise
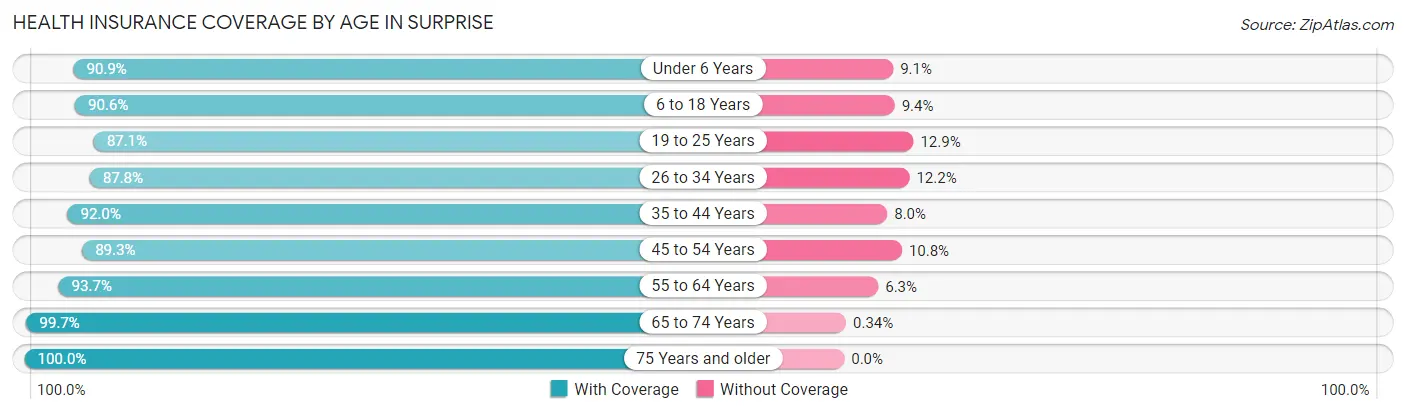
| Age Bracket | With Coverage | Without Coverage |
| Under 6 Years | 8,839 (90.9%) | 887 (9.1%) |
| 6 to 18 Years | 25,035 (90.6%) | 2,600 (9.4%) |
| 19 to 25 Years | 8,926 (87.1%) | 1,322 (12.9%) |
| 26 to 34 Years | 11,462 (87.8%) | 1,586 (12.2%) |
| 35 to 44 Years | 16,178 (92.0%) | 1,410 (8.0%) |
| 45 to 54 Years | 16,133 (89.2%) | 1,943 (10.7%) |
| 55 to 64 Years | 14,368 (93.7%) | 973 (6.3%) |
| 65 to 74 Years | 16,431 (99.7%) | 56 (0.3%) |
| 75 Years and older | 16,131 (100.0%) | 0 (0.0%) |
| Total | 133,503 (92.5%) | 10,777 (7.5%) |
Health Insurance Coverage by Citizenship Status in Surprise
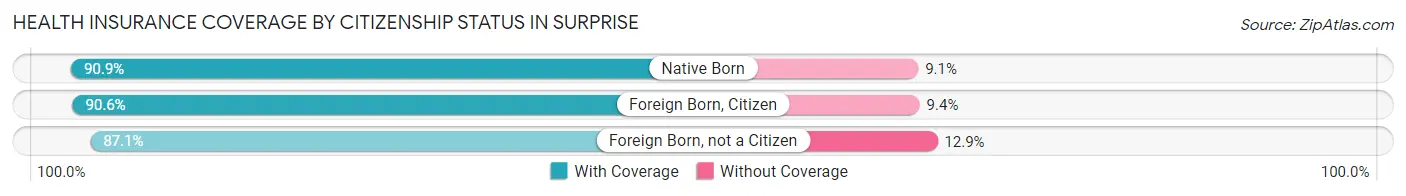
| Citizenship Status | With Coverage | Without Coverage |
| Native Born | 8,839 (90.9%) | 887 (9.1%) |
| Foreign Born, Citizen | 25,035 (90.6%) | 2,600 (9.4%) |
| Foreign Born, not a Citizen | 8,926 (87.1%) | 1,322 (12.9%) |
Health Insurance Coverage by Household Income in Surprise
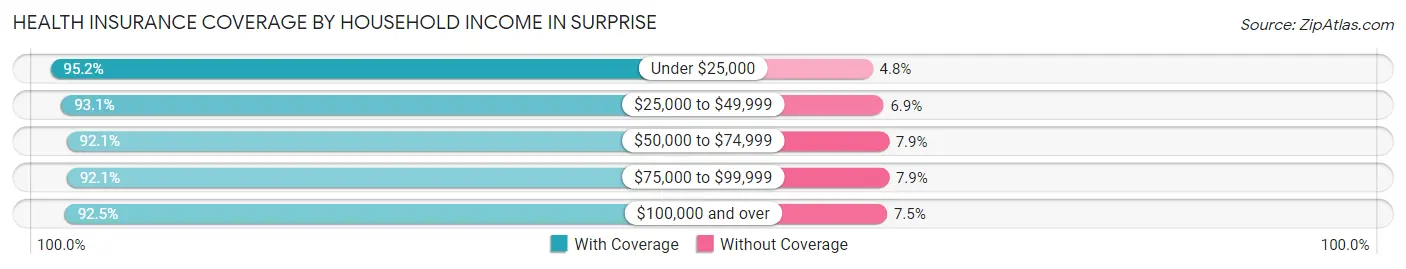
| Household Income | With Coverage | Without Coverage |
| Under $25,000 | 7,048 (95.2%) | 358 (4.8%) |
| $25,000 to $49,999 | 14,214 (93.1%) | 1,049 (6.9%) |
| $50,000 to $74,999 | 23,278 (92.1%) | 1,985 (7.9%) |
| $75,000 to $99,999 | 22,912 (92.1%) | 1,965 (7.9%) |
| $100,000 and over | 65,619 (92.5%) | 5,346 (7.5%) |
Public vs Private Health Insurance Coverage by Age in Surprise
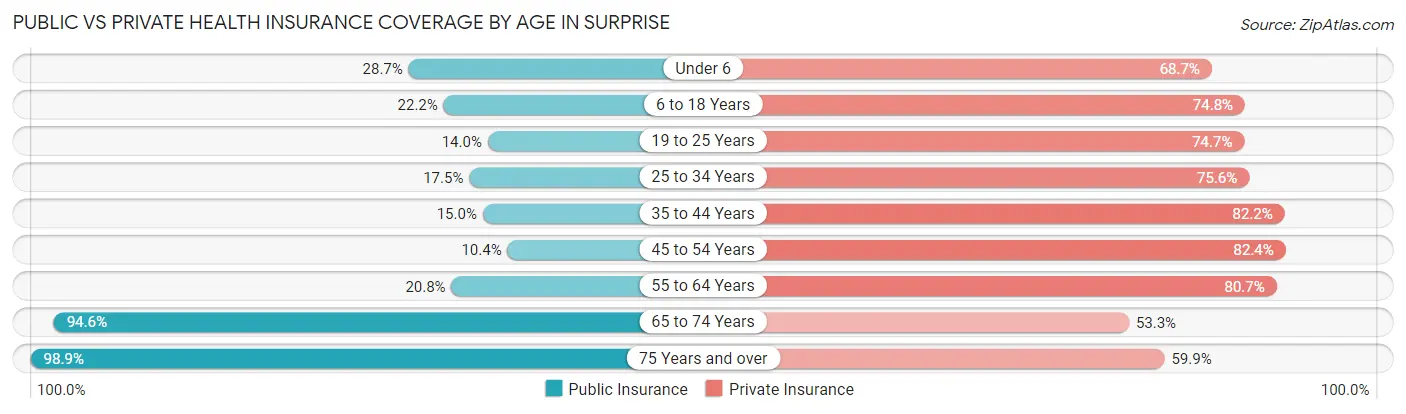
| Age Bracket | Public Insurance | Private Insurance |
| Under 6 | 2,793 (28.7%) | 6,677 (68.6%) |
| 6 to 18 Years | 6,141 (22.2%) | 20,677 (74.8%) |
| 19 to 25 Years | 1,439 (14.0%) | 7,654 (74.7%) |
| 25 to 34 Years | 2,280 (17.5%) | 9,864 (75.6%) |
| 35 to 44 Years | 2,631 (15.0%) | 14,456 (82.2%) |
| 45 to 54 Years | 1,874 (10.4%) | 14,889 (82.4%) |
| 55 to 64 Years | 3,187 (20.8%) | 12,379 (80.7%) |
| 65 to 74 Years | 15,595 (94.6%) | 8,787 (53.3%) |
| 75 Years and over | 15,951 (98.9%) | 9,662 (59.9%) |
| Total | 51,891 (36.0%) | 105,045 (72.8%) |
Disability Status by Sex by Age in Surprise
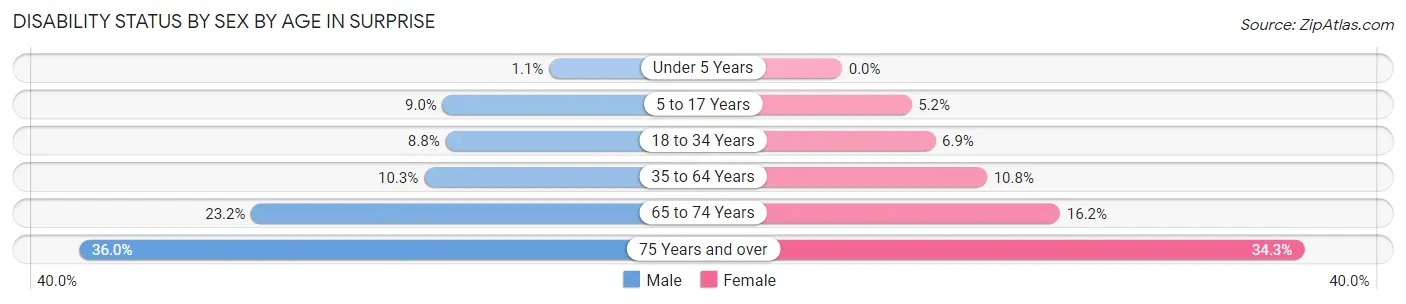
| Age Bracket | Male | Female |
| Under 5 Years | 40 (1.1%) | 0 (0.0%) |
| 5 to 17 Years | 1,154 (9.0%) | 775 (5.2%) |
| 18 to 34 Years | 1,070 (8.7%) | 882 (6.9%) |
| 35 to 64 Years | 2,522 (10.3%) | 2,866 (10.8%) |
| 65 to 74 Years | 1,686 (23.2%) | 1,491 (16.2%) |
| 75 Years and over | 2,626 (35.9%) | 3,029 (34.3%) |
Disability Class by Sex by Age in Surprise
Disability Class: Hearing Difficulty
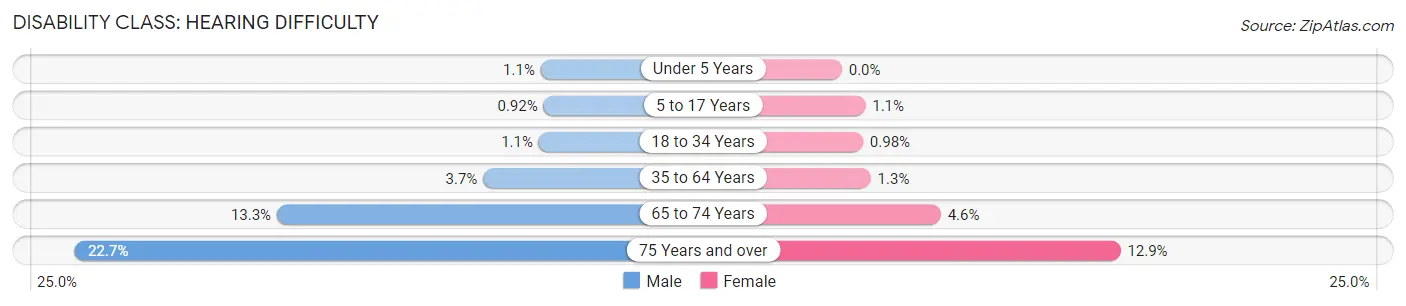
| Age Bracket | Male | Female |
| Under 5 Years | 40 (1.1%) | 0 (0.0%) |
| 5 to 17 Years | 119 (0.9%) | 164 (1.1%) |
| 18 to 34 Years | 139 (1.1%) | 125 (1.0%) |
| 35 to 64 Years | 908 (3.7%) | 358 (1.3%) |
| 65 to 74 Years | 967 (13.3%) | 423 (4.6%) |
| 75 Years and over | 1,655 (22.7%) | 1,141 (12.9%) |
Disability Class: Vision Difficulty
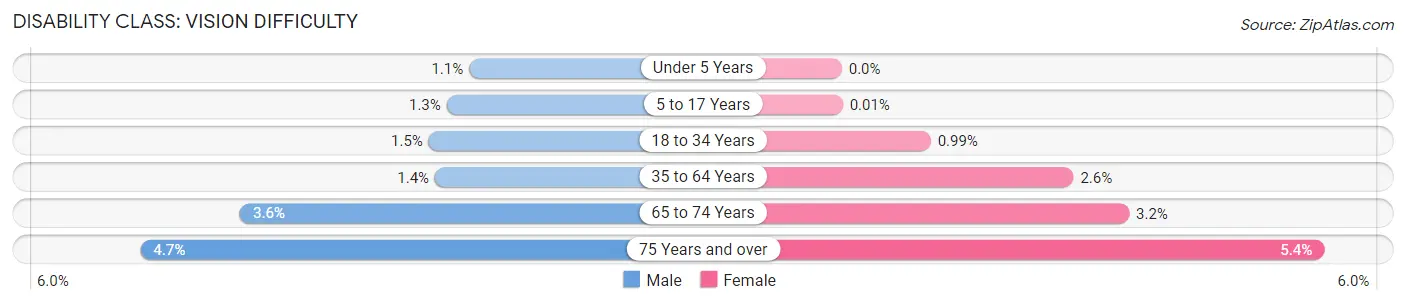
| Age Bracket | Male | Female |
| Under 5 Years | 40 (1.1%) | 0 (0.0%) |
| 5 to 17 Years | 167 (1.3%) | 1 (0.0%) |
| 18 to 34 Years | 183 (1.5%) | 126 (1.0%) |
| 35 to 64 Years | 348 (1.4%) | 686 (2.6%) |
| 65 to 74 Years | 262 (3.6%) | 295 (3.2%) |
| 75 Years and over | 344 (4.7%) | 474 (5.4%) |
Disability Class: Cognitive Difficulty
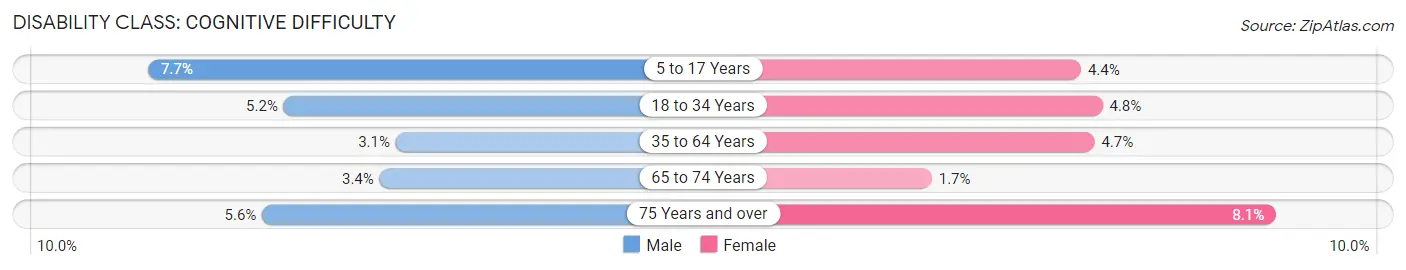
| Age Bracket | Male | Female |
| 5 to 17 Years | 993 (7.7%) | 667 (4.4%) |
| 18 to 34 Years | 635 (5.2%) | 616 (4.8%) |
| 35 to 64 Years | 758 (3.1%) | 1,250 (4.7%) |
| 65 to 74 Years | 248 (3.4%) | 154 (1.7%) |
| 75 Years and over | 408 (5.6%) | 711 (8.1%) |
Disability Class: Ambulatory Difficulty
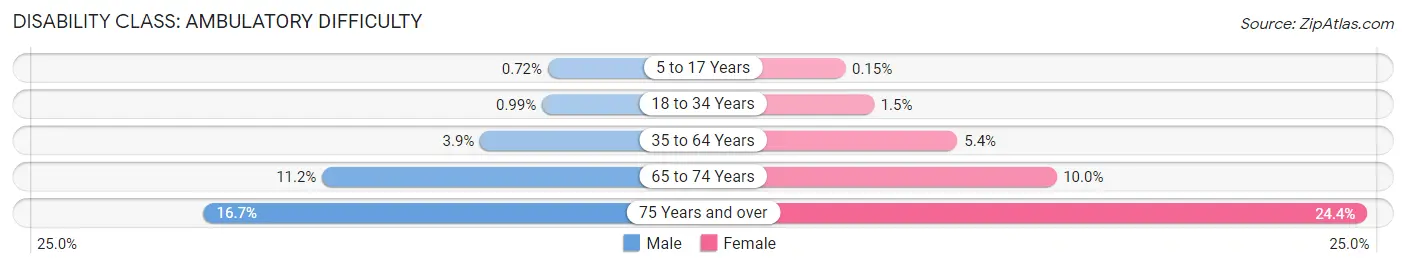
| Age Bracket | Male | Female |
| 5 to 17 Years | 93 (0.7%) | 22 (0.2%) |
| 18 to 34 Years | 121 (1.0%) | 189 (1.5%) |
| 35 to 64 Years | 940 (3.9%) | 1,427 (5.4%) |
| 65 to 74 Years | 814 (11.2%) | 916 (10.0%) |
| 75 Years and over | 1,219 (16.7%) | 2,152 (24.4%) |
Disability Class: Self-Care Difficulty
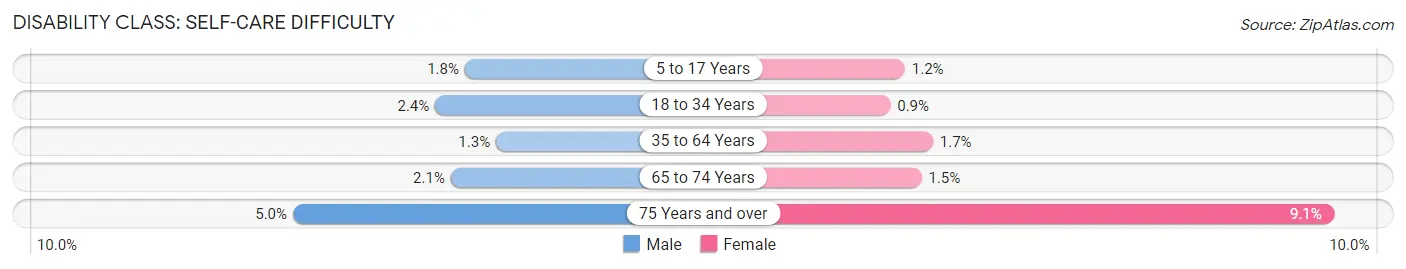
| Age Bracket | Male | Female |
| 5 to 17 Years | 235 (1.8%) | 176 (1.2%) |
| 18 to 34 Years | 291 (2.4%) | 115 (0.9%) |
| 35 to 64 Years | 304 (1.3%) | 451 (1.7%) |
| 65 to 74 Years | 152 (2.1%) | 136 (1.5%) |
| 75 Years and over | 367 (5.0%) | 806 (9.1%) |
Technology Access in Surprise
Computing Device Access in Surprise
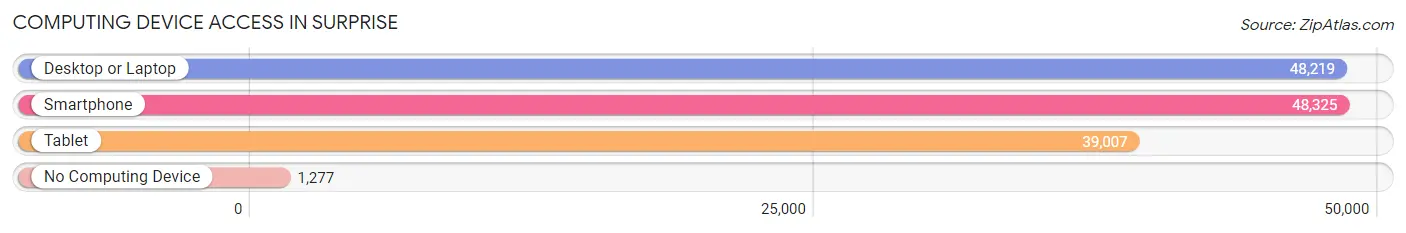
| Device Type | # Households | % Households |
| Desktop or Laptop | 48,219 | 91.0% |
| Smartphone | 48,325 | 91.2% |
| Tablet | 39,007 | 73.6% |
| No Computing Device | 1,277 | 2.4% |
| Total | 52,995 | 100.0% |
Internet Access in Surprise
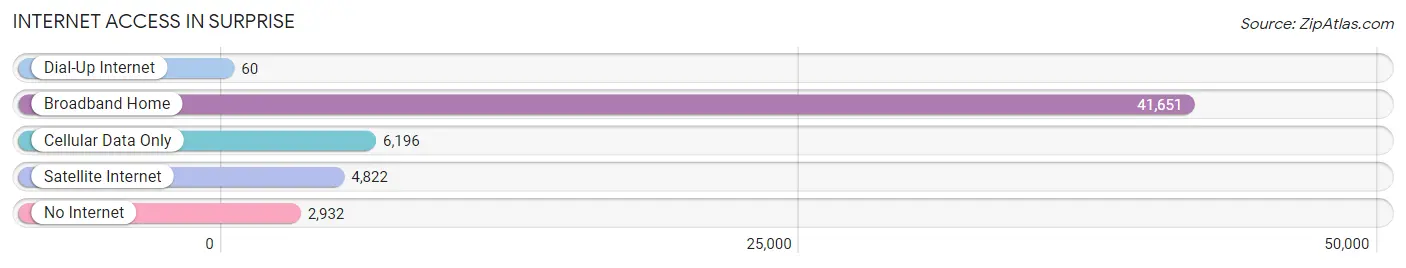
| Internet Type | # Households | % Households |
| Dial-Up Internet | 60 | 0.1% |
| Broadband Home | 41,651 | 78.6% |
| Cellular Data Only | 6,196 | 11.7% |
| Satellite Internet | 4,822 | 9.1% |
| No Internet | 2,932 | 5.5% |
| Total | 52,995 | 100.0% |
Surprise Summary
Surprise, Arizona is a city located in Maricopa County, Arizona, United States. It is a suburb of Phoenix and is located approximately 45 miles northwest of downtown Phoenix. As of the 2010 census, the population of Surprise was 117,517, making it the second-fastest-growing municipality in the greater Phoenix metropolitan area.
Geography
Surprise is located in the northwest corner of Maricopa County, Arizona, at 33°37'N 112°21'W. It is bordered by the cities of El Mirage and Sun City West to the west, Sun City to the south, and Youngtown to the east. The city is located approximately 45 miles northwest of downtown Phoenix. The city covers an area of approximately 116 square miles, with an elevation of 1,086 feet.
Climate
Surprise has a hot desert climate, with hot summers and mild winters. The average high temperature in the summer is around 100°F, while the average low temperature in the winter is around 50°F. The city receives an average of 8.5 inches of precipitation per year, with most of it occurring in the summer months.
Demographics
As of the 2010 census, the population of Surprise was 117,517, with a population density of 1,037 people per square mile. The racial makeup of the city was 79.2% White, 4.2% African American, 1.2% Native American, 2.7% Asian, 0.2% Pacific Islander, 8.7% from other races, and 3.8% from two or more races. Hispanic or Latino of any race were 24.2% of the population.
Economy
Surprise is home to a variety of businesses, including retail, manufacturing, and healthcare. The city is home to several major employers, including Banner Health, Walmart, and Amazon. The city also has a growing tourism industry, with attractions such as the Surprise Stadium, the Surprise Aquatic Center, and the Surprise Tennis and Racquet Complex.
History
Surprise was founded in 1938 by Flora Mae Statler, who named the city after her surprise visit to the area. The city was incorporated in 1960, and has since grown to become the second-fastest-growing municipality in the greater Phoenix metropolitan area. In the early 2000s, the city experienced a population boom, with the population increasing from 30,000 in 2000 to 117,517 in 2010.
Conclusion
Surprise, Arizona is a city located in Maricopa County, Arizona, United States. It is a suburb of Phoenix and is located approximately 45 miles northwest of downtown Phoenix. As of the 2010 census, the population of Surprise was 117,517, making it the second-fastest-growing municipality in the greater Phoenix metropolitan area. The city has a hot desert climate, with hot summers and mild winters. The city is home to a variety of businesses, including retail, manufacturing, and healthcare. The city also has a growing tourism industry, with attractions such as the Surprise Stadium, the Surprise Aquatic Center, and the Surprise Tennis and Racquet Complex. Surprise was founded in 1938 by Flora Mae Statler, and has since grown to become the second-fastest-growing municipality in the greater Phoenix metropolitan area.
Common Questions
What is Per Capita Income in Surprise?
Per Capita income in Surprise is $37,518.
What is the Median Family Income in Surprise?
Median Family Income in Surprise is $94,426.
What is the Median Household income in Surprise?
Median Household Income in Surprise is $87,756.
What is Income or Wage Gap in Surprise?
Income or Wage Gap in Surprise is 27.5%.
Women in Surprise earn 72.5 cents for every dollar earned by a man.
What is Family Income Deficit in Surprise?
Family Income Deficit in Surprise is $12,306.
Families that are below poverty line in Surprise earn $12,306 less on average than the poverty threshold level.
What is Inequality or Gini Index in Surprise?
Inequality or Gini Index in Surprise is 0.37.
What is the Total Population of Surprise?
Total Population of Surprise is 145,591.
What is the Total Male Population of Surprise?
Total Male Population of Surprise is 68,779.
What is the Total Female Population of Surprise?
Total Female Population of Surprise is 76,812.
What is the Ratio of Males per 100 Females in Surprise?
There are 89.54 Males per 100 Females in Surprise.
What is the Ratio of Females per 100 Males in Surprise?
There are 111.68 Females per 100 Males in Surprise.
What is the Median Population Age in Surprise?
Median Population Age in Surprise is 41.5 Years.
What is the Average Family Size in Surprise
Average Family Size in Surprise is 3.1 People.
What is the Average Household Size in Surprise
Average Household Size in Surprise is 2.7 People.
How Large is the Labor Force in Surprise?
There are 65,972 People in the Labor Forcein in Surprise.
What is the Percentage of People in the Labor Force in Surprise?
57.6% of People are in the Labor Force in Surprise.
What is the Unemployment Rate in Surprise?
Unemployment Rate in Surprise is 4.6%.