Wauwatosa, WI Map & Demographics
Wauwatosa Map
Wauwatosa Overview
$53,803
PER CAPITA INCOME
$123,118
AVG FAMILY INCOME
$93,812
AVG HOUSEHOLD INCOME
22.9%
WAGE / INCOME GAP [ % ]
77.1¢/ $1
WAGE / INCOME GAP [ $ ]
0.44
INEQUALITY / GINI INDEX
47,919
TOTAL POPULATION
22,729
MALE POPULATION
25,190
FEMALE POPULATION
90.23
MALES / 100 FEMALES
110.83
FEMALES / 100 MALES
38.4
MEDIAN AGE
2.9
AVG FAMILY SIZE
2.2
AVG HOUSEHOLD SIZE
26,012
LABOR FORCE [ PEOPLE ]
67.2%
PERCENT IN LABOR FORCE
2.2%
UNEMPLOYMENT RATE
Income in Wauwatosa
Income Overview in Wauwatosa
Per Capita Income in Wauwatosa is $53,803, while median incomes of families and households are $123,118 and $93,812 respectively.
| Characteristic | Number | Measure |
| Per Capita Income | 47,919 | $53,803 |
| Median Family Income | 12,191 | $123,118 |
| Mean Family Income | 12,191 | $156,097 |
| Median Household Income | 21,263 | $93,812 |
| Mean Household Income | 21,263 | $120,529 |
| Income Deficit | 12,191 | $0 |
| Wage / Income Gap (%) | 47,919 | 22.85% |
| Wage / Income Gap ($) | 47,919 | 77.15¢ per $1 |
| Gini / Inequality Index | 47,919 | 0.44 |
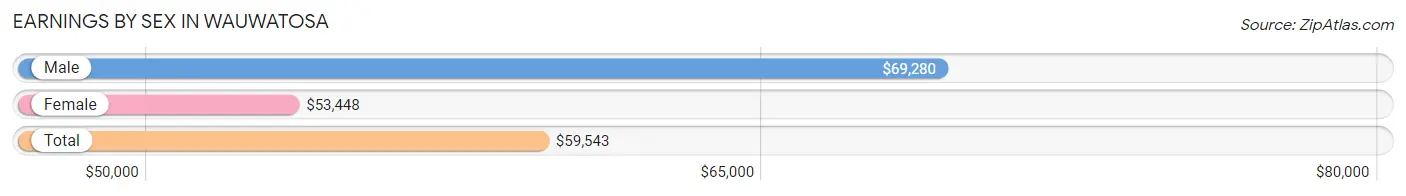
Earnings by Sex in Wauwatosa
Average Earnings in Wauwatosa are $59,543, $69,280 for men and $53,448 for women, a difference of 22.9%.
| Sex | Number | Average Earnings |
| Male | 13,360 (48.6%) | $69,280 |
| Female | 14,105 (51.4%) | $53,448 |
| Total | 27,465 (100.0%) | $59,543 |
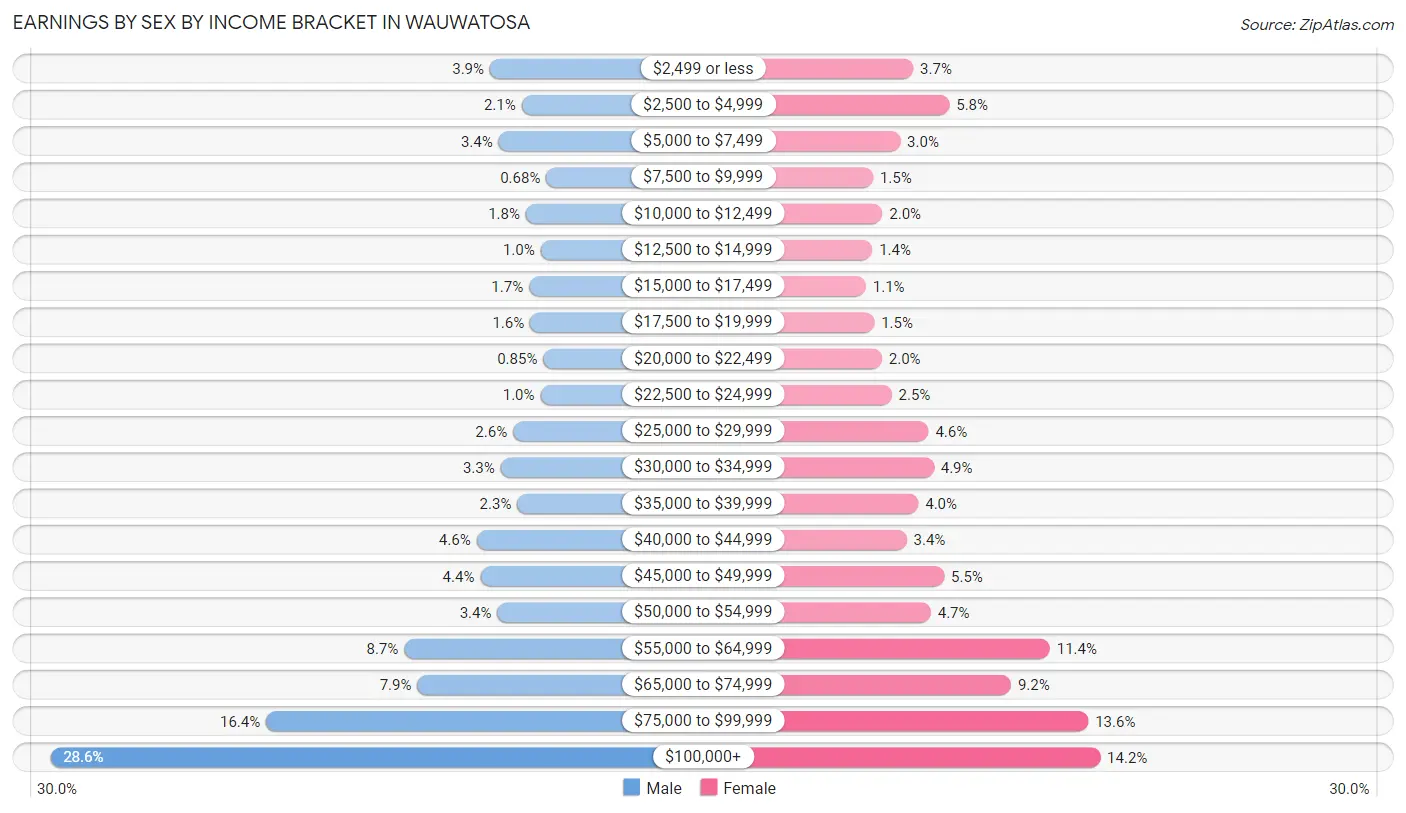
Earnings by Sex by Income Bracket in Wauwatosa
The most common earnings brackets in Wauwatosa are $100,000+ for men (3,816 | 28.6%) and $100,000+ for women (2,008 | 14.2%).
| Income | Male | Female |
| $2,499 or less | 514 (3.8%) | 526 (3.7%) |
| $2,500 to $4,999 | 276 (2.1%) | 813 (5.8%) |
| $5,000 to $7,499 | 449 (3.4%) | 423 (3.0%) |
| $7,500 to $9,999 | 91 (0.7%) | 208 (1.5%) |
| $10,000 to $12,499 | 244 (1.8%) | 282 (2.0%) |
| $12,500 to $14,999 | 134 (1.0%) | 201 (1.4%) |
| $15,000 to $17,499 | 221 (1.7%) | 151 (1.1%) |
| $17,500 to $19,999 | 212 (1.6%) | 217 (1.5%) |
| $20,000 to $22,499 | 113 (0.9%) | 278 (2.0%) |
| $22,500 to $24,999 | 135 (1.0%) | 355 (2.5%) |
| $25,000 to $29,999 | 341 (2.5%) | 648 (4.6%) |
| $30,000 to $34,999 | 434 (3.3%) | 690 (4.9%) |
| $35,000 to $39,999 | 309 (2.3%) | 567 (4.0%) |
| $40,000 to $44,999 | 614 (4.6%) | 474 (3.4%) |
| $45,000 to $49,999 | 587 (4.4%) | 772 (5.5%) |
| $50,000 to $54,999 | 458 (3.4%) | 666 (4.7%) |
| $55,000 to $64,999 | 1,158 (8.7%) | 1,610 (11.4%) |
| $65,000 to $74,999 | 1,059 (7.9%) | 1,302 (9.2%) |
| $75,000 to $99,999 | 2,195 (16.4%) | 1,914 (13.6%) |
| $100,000+ | 3,816 (28.6%) | 2,008 (14.2%) |
| Total | 13,360 (100.0%) | 14,105 (100.0%) |
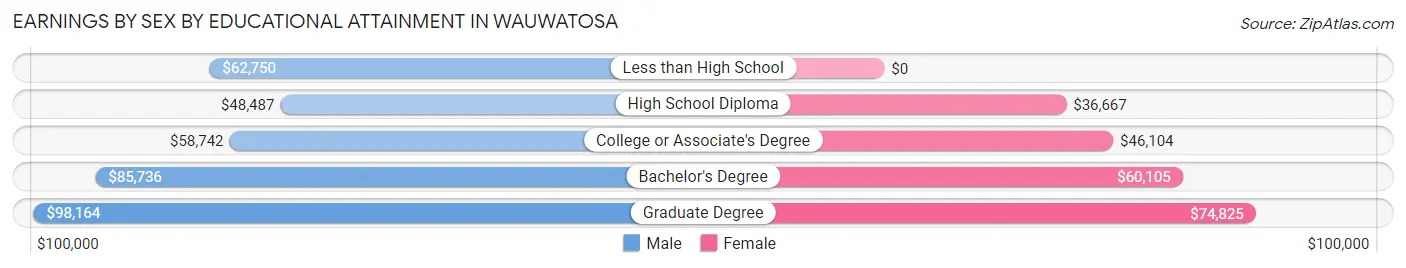
Earnings by Sex by Educational Attainment in Wauwatosa
Average earnings in Wauwatosa are $74,549 for men and $57,425 for women, a difference of 23.0%. Men with an educational attainment of graduate degree enjoy the highest average annual earnings of $98,164, while those with high school diploma education earn the least with $48,487. Women with an educational attainment of graduate degree earn the most with the average annual earnings of $74,825, while those with high school diploma education have the smallest earnings of $36,667.
| Educational Attainment | Male Income | Female Income |
| Less than High School | $62,750 | $0 |
| High School Diploma | $48,487 | $36,667 |
| College or Associate's Degree | $58,742 | $46,104 |
| Bachelor's Degree | $85,736 | $60,105 |
| Graduate Degree | $98,164 | $74,825 |
| Total | $74,549 | $57,425 |
Family Income in Wauwatosa
Family Income Brackets in Wauwatosa
According to the Wauwatosa family income data, there are 3,292 families falling into the $100,000 to $149,999 income range, which is the most common income bracket and makes up 27.0% of all families. Conversely, the $10,000 to $14,999 income bracket is the least frequent group with only 37 families (0.3%) belonging to this category.
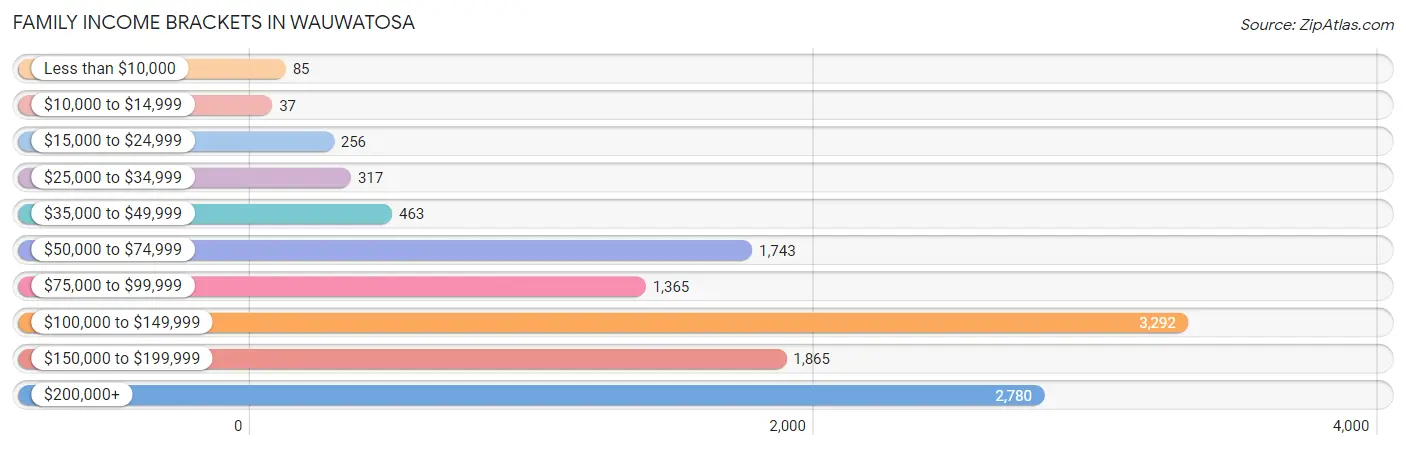
| Income Bracket | # Families | % Families |
| Less than $10,000 | 85 | 0.7% |
| $10,000 to $14,999 | 37 | 0.3% |
| $15,000 to $24,999 | 256 | 2.1% |
| $25,000 to $34,999 | 317 | 2.6% |
| $35,000 to $49,999 | 463 | 3.8% |
| $50,000 to $74,999 | 1,743 | 14.3% |
| $75,000 to $99,999 | 1,365 | 11.2% |
| $100,000 to $149,999 | 3,292 | 27.0% |
| $150,000 to $199,999 | 1,865 | 15.3% |
| $200,000+ | 2,780 | 22.8% |
Family Income by Famaliy Size in Wauwatosa
5-person families (648 | 5.3%) account for the highest median family income in Wauwatosa with $183,750 per family, while 2-person families (5,984 | 49.1%) have the highest median income of $57,318 per family member.
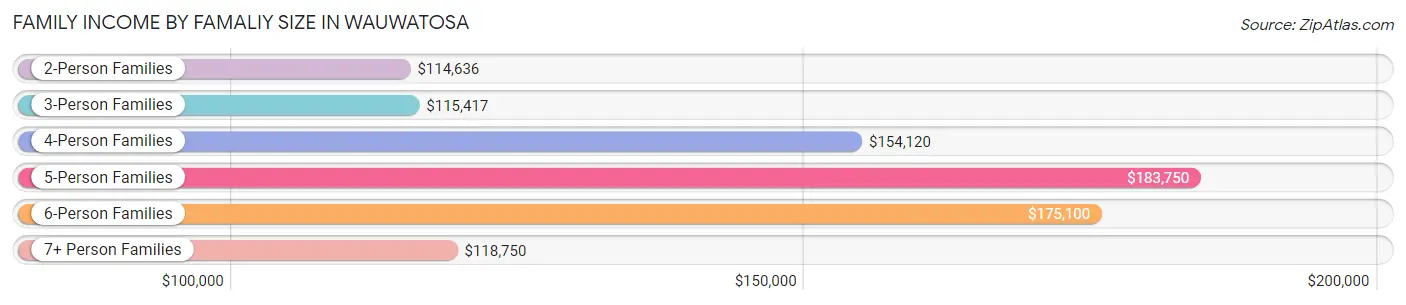
| Income Bracket | # Families | Median Income |
| 2-Person Families | 5,984 (49.1%) | $114,636 |
| 3-Person Families | 3,091 (25.4%) | $115,417 |
| 4-Person Families | 2,048 (16.8%) | $154,120 |
| 5-Person Families | 648 (5.3%) | $183,750 |
| 6-Person Families | 352 (2.9%) | $175,100 |
| 7+ Person Families | 68 (0.6%) | $118,750 |
| Total | 12,191 (100.0%) | $123,118 |
Family Income by Number of Earners in Wauwatosa
The median family income in Wauwatosa is $123,118, with families comprising 3+ earners (1,066) having the highest median family income of $168,750, while families with 1 earner (3,511) have the lowest median family income of $87,734, accounting for 8.7% and 28.8% of families, respectively.
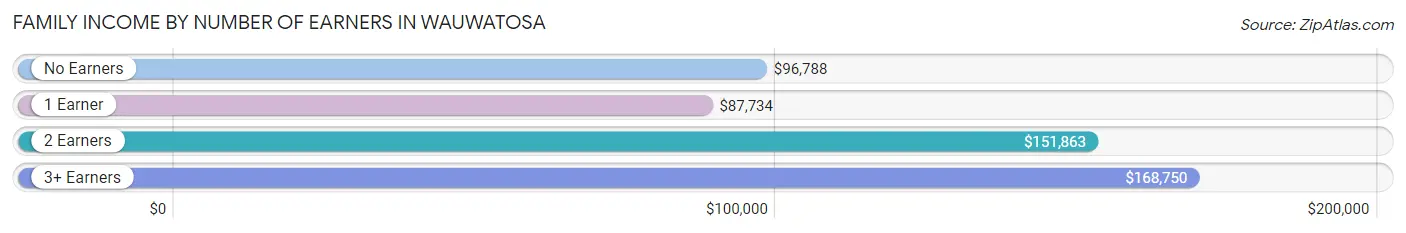
| Number of Earners | # Families | Median Income |
| No Earners | 1,281 (10.5%) | $96,788 |
| 1 Earner | 3,511 (28.8%) | $87,734 |
| 2 Earners | 6,333 (51.9%) | $151,863 |
| 3+ Earners | 1,066 (8.7%) | $168,750 |
| Total | 12,191 (100.0%) | $123,118 |
Household Income in Wauwatosa
Household Income Brackets in Wauwatosa
With 4,444 households falling in the category, the $100,000 to $149,999 income range is the most frequent in Wauwatosa, accounting for 20.9% of all households. In contrast, only 404 households (1.9%) fall into the $10,000 to $14,999 income bracket, making it the least populous group.
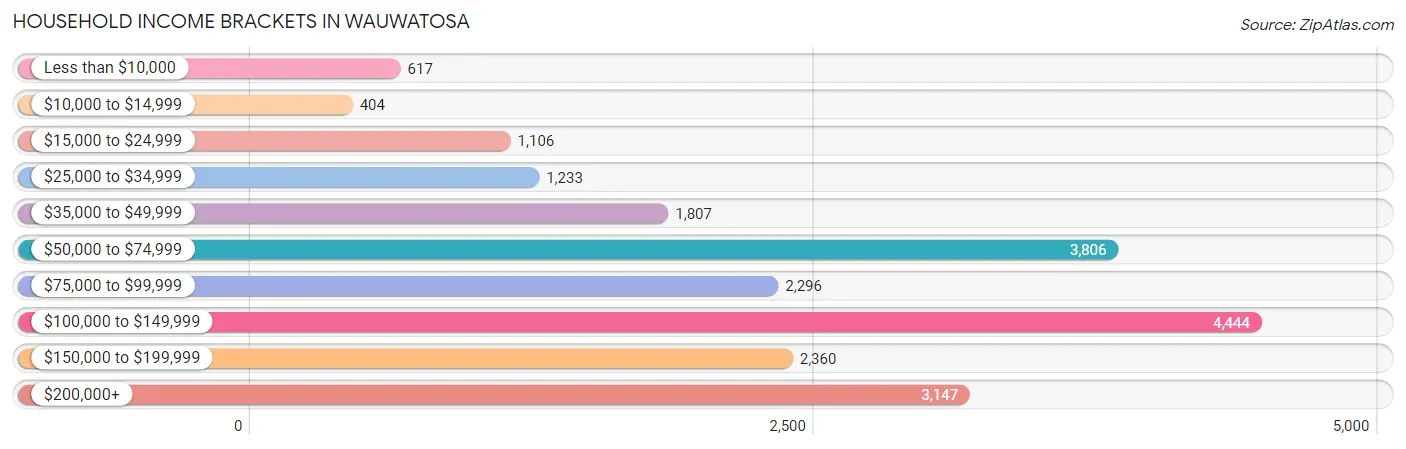
| Income Bracket | # Households | % Households |
| Less than $10,000 | 617 | 2.9% |
| $10,000 to $14,999 | 404 | 1.9% |
| $15,000 to $24,999 | 1,106 | 5.2% |
| $25,000 to $34,999 | 1,233 | 5.8% |
| $35,000 to $49,999 | 1,807 | 8.5% |
| $50,000 to $74,999 | 3,806 | 17.9% |
| $75,000 to $99,999 | 2,296 | 10.8% |
| $100,000 to $149,999 | 4,444 | 20.9% |
| $150,000 to $199,999 | 2,360 | 11.1% |
| $200,000+ | 3,147 | 14.8% |
Household Income by Householder Age in Wauwatosa
The median household income in Wauwatosa is $93,812, with the highest median household income of $108,940 found in the 45 to 64 years age bracket for the primary householder. A total of 6,606 households (31.1%) fall into this category. Meanwhile, the 15 to 24 years age bracket for the primary householder has the lowest median household income of $43,901, with 623 households (2.9%) in this group.
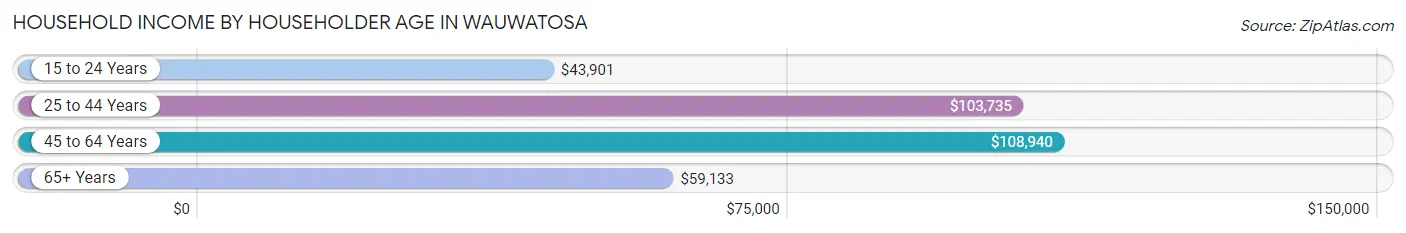
| Income Bracket | # Households | Median Income |
| 15 to 24 Years | 623 (2.9%) | $43,901 |
| 25 to 44 Years | 8,305 (39.1%) | $103,735 |
| 45 to 64 Years | 6,606 (31.1%) | $108,940 |
| 65+ Years | 5,729 (26.9%) | $59,133 |
| Total | 21,263 (100.0%) | $93,812 |
Poverty in Wauwatosa
Income Below Poverty by Sex and Age in Wauwatosa
With 5.6% poverty level for males and 5.9% for females among the residents of Wauwatosa, 18 to 24 year old males and 18 to 24 year old females are the most vulnerable to poverty, with 244 males (17.3%) and 211 females (14.4%) in their respective age groups living below the poverty level.
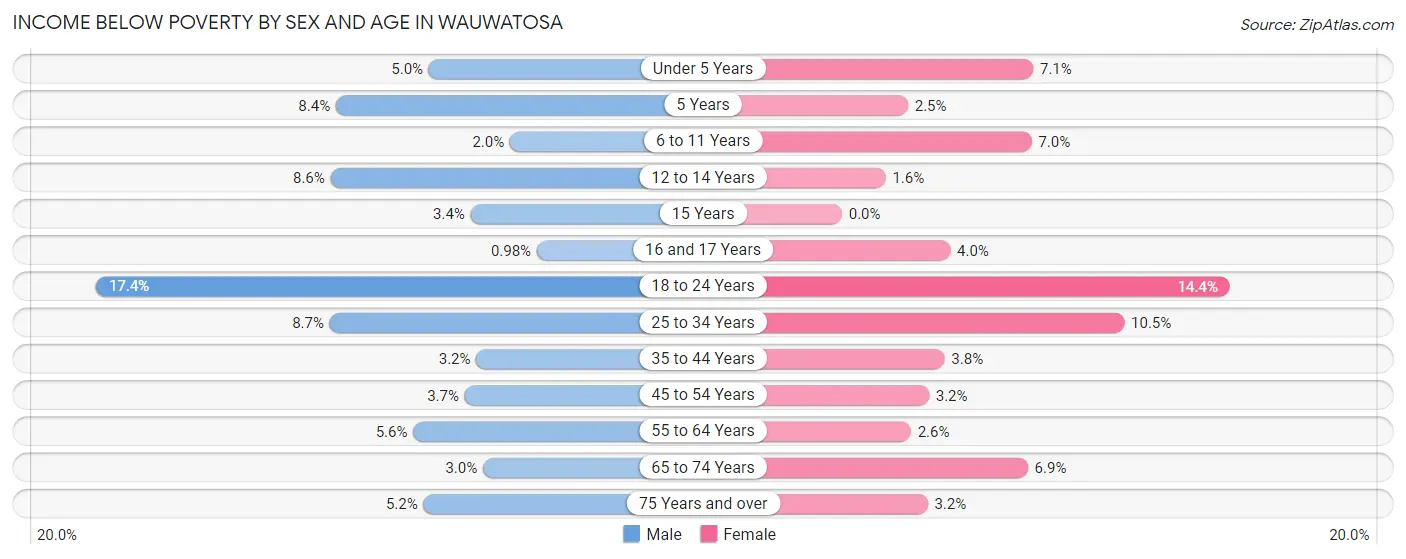
| Age Bracket | Male | Female |
| Under 5 Years | 68 (5.0%) | 105 (7.1%) |
| 5 Years | 27 (8.4%) | 5 (2.5%) |
| 6 to 11 Years | 36 (2.0%) | 106 (7.0%) |
| 12 to 14 Years | 68 (8.6%) | 16 (1.6%) |
| 15 Years | 12 (3.4%) | 0 (0.0%) |
| 16 and 17 Years | 7 (1.0%) | 26 (4.0%) |
| 18 to 24 Years | 244 (17.3%) | 211 (14.4%) |
| 25 to 34 Years | 323 (8.7%) | 466 (10.5%) |
| 35 to 44 Years | 107 (3.2%) | 131 (3.8%) |
| 45 to 54 Years | 103 (3.7%) | 92 (3.2%) |
| 55 to 64 Years | 143 (5.6%) | 73 (2.6%) |
| 65 to 74 Years | 62 (3.0%) | 162 (6.9%) |
| 75 Years and over | 67 (5.2%) | 72 (3.2%) |
| Total | 1,267 (5.6%) | 1,465 (5.9%) |
Income Above Poverty by Sex and Age in Wauwatosa
According to the poverty statistics in Wauwatosa, males aged 16 and 17 years and females aged 15 years are the age groups that are most secure financially, with 99.0% of males and 100.0% of females in these age groups living above the poverty line.
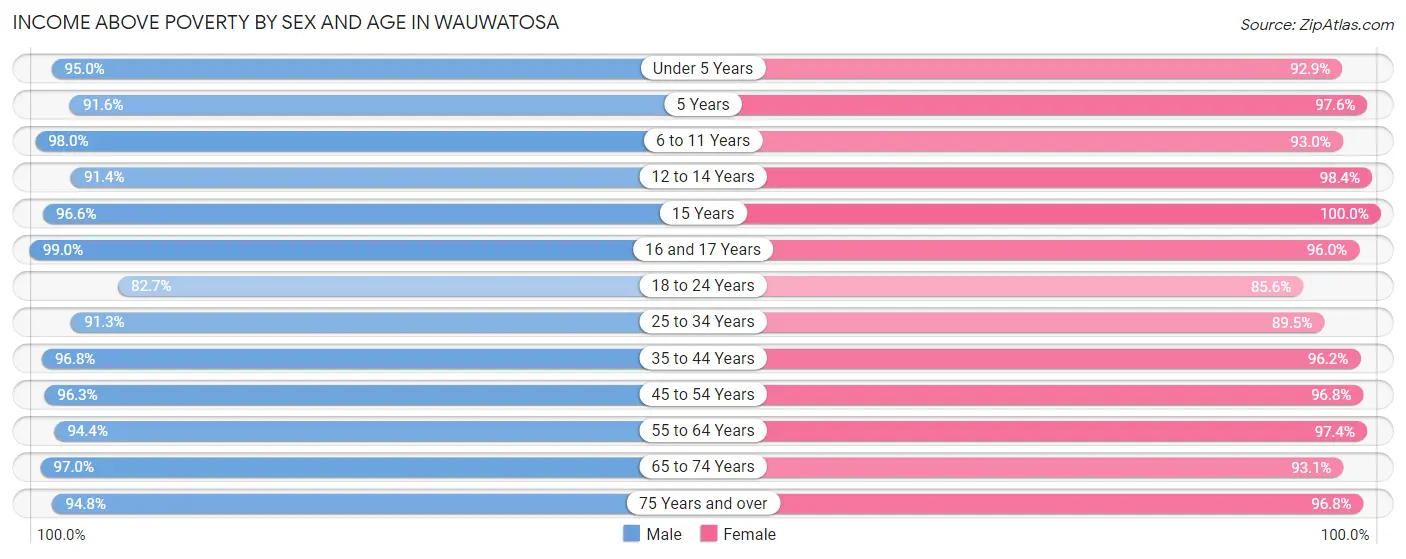
| Age Bracket | Male | Female |
| Under 5 Years | 1,295 (95.0%) | 1,373 (92.9%) |
| 5 Years | 293 (91.6%) | 199 (97.6%) |
| 6 to 11 Years | 1,779 (98.0%) | 1,399 (93.0%) |
| 12 to 14 Years | 719 (91.4%) | 972 (98.4%) |
| 15 Years | 337 (96.6%) | 310 (100.0%) |
| 16 and 17 Years | 704 (99.0%) | 621 (96.0%) |
| 18 to 24 Years | 1,162 (82.7%) | 1,254 (85.6%) |
| 25 to 34 Years | 3,402 (91.3%) | 3,979 (89.5%) |
| 35 to 44 Years | 3,207 (96.8%) | 3,303 (96.2%) |
| 45 to 54 Years | 2,709 (96.3%) | 2,759 (96.8%) |
| 55 to 64 Years | 2,425 (94.4%) | 2,777 (97.4%) |
| 65 to 74 Years | 2,022 (97.0%) | 2,185 (93.1%) |
| 75 Years and over | 1,224 (94.8%) | 2,191 (96.8%) |
| Total | 21,278 (94.4%) | 23,322 (94.1%) |
Income Below Poverty Among Married-Couple Families in Wauwatosa
The poverty statistics for married-couple families in Wauwatosa show that 0.8% or 72 of the total 9,324 families live below the poverty line. Families with 1 or 2 children have the highest poverty rate of 1.4%, comprising of 49 families. On the other hand, families with 5 or more children have the lowest poverty rate of 0.0%, which includes 0 families.
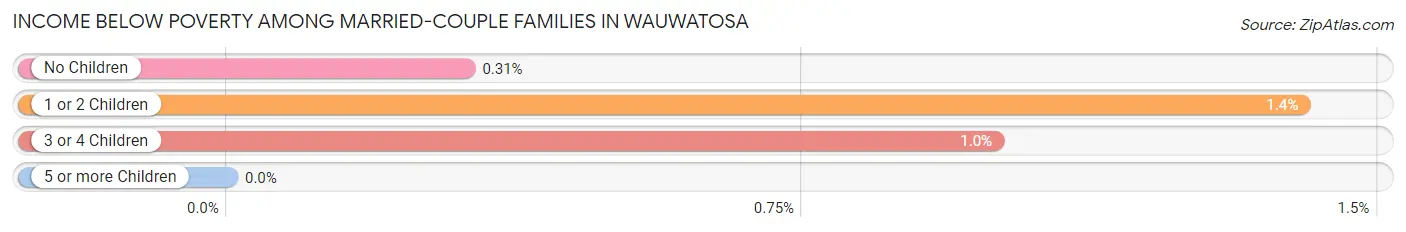
| Children | Above Poverty | Below Poverty |
| No Children | 5,082 (99.7%) | 16 (0.3%) |
| 1 or 2 Children | 3,443 (98.6%) | 49 (1.4%) |
| 3 or 4 Children | 696 (99.0%) | 7 (1.0%) |
| 5 or more Children | 31 (100.0%) | 0 (0.0%) |
| Total | 9,252 (99.2%) | 72 (0.8%) |
Income Below Poverty Among Single-Parent Households in Wauwatosa
According to the poverty data in Wauwatosa, 2.2% or 20 single-father households and 10.0% or 194 single-mother households are living below the poverty line. Among single-father households, those with 1 or 2 children have the highest poverty rate, with 20 households (3.4%) experiencing poverty. Likewise, among single-mother households, those with 3 or 4 children have the highest poverty rate, with 27 households (48.2%) falling below the poverty line.
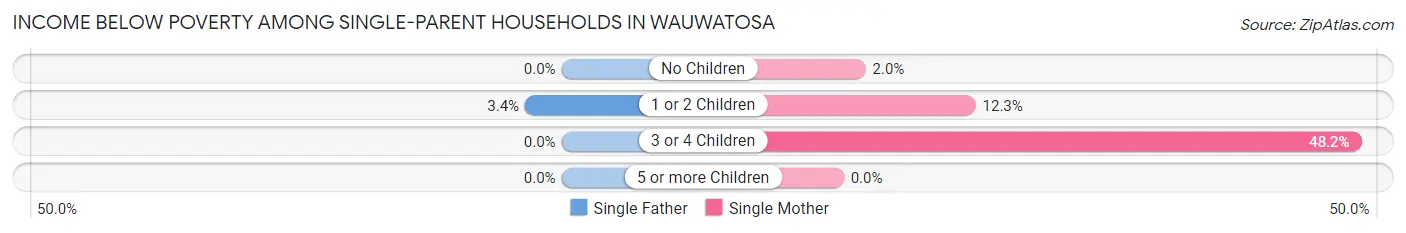
| Children | Single Father | Single Mother |
| No Children | 0 (0.0%) | 13 (2.0%) |
| 1 or 2 Children | 20 (3.4%) | 154 (12.3%) |
| 3 or 4 Children | 0 (0.0%) | 27 (48.2%) |
| 5 or more Children | 0 (0.0%) | 0 (0.0%) |
| Total | 20 (2.2%) | 194 (10.0%) |
Income Below Poverty Among Married-Couple vs Single-Parent Households in Wauwatosa
The poverty data for Wauwatosa shows that 72 of the married-couple family households (0.8%) and 214 of the single-parent households (7.5%) are living below the poverty level. Within the married-couple family households, those with 1 or 2 children have the highest poverty rate, with 49 households (1.4%) falling below the poverty line. Among the single-parent households, those with 3 or 4 children have the highest poverty rate, with 27 household (23.1%) living below poverty.
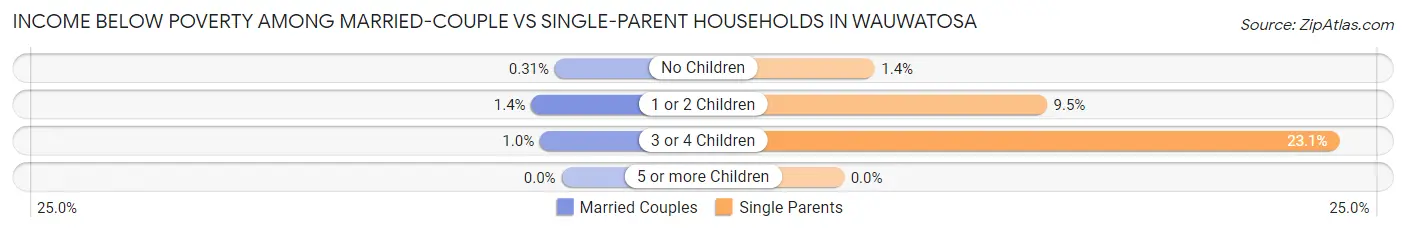
| Children | Married-Couple Families | Single-Parent Households |
| No Children | 16 (0.3%) | 13 (1.4%) |
| 1 or 2 Children | 49 (1.4%) | 174 (9.5%) |
| 3 or 4 Children | 7 (1.0%) | 27 (23.1%) |
| 5 or more Children | 0 (0.0%) | 0 (0.0%) |
| Total | 72 (0.8%) | 214 (7.5%) |
Race in Wauwatosa
The most populous races in Wauwatosa are White / Caucasian (38,755 | 80.9%), Black / African American (3,586 | 7.5%), and Two or more Races (2,392 | 5.0%).
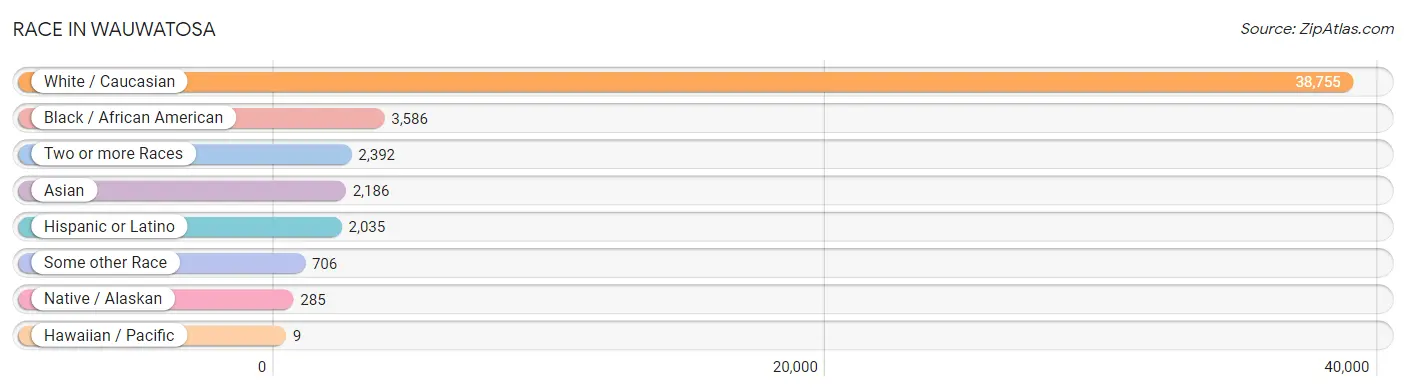
| Race | # Population | % Population |
| Asian | 2,186 | 4.6% |
| Black / African American | 3,586 | 7.5% |
| Hawaiian / Pacific | 9 | 0.0% |
| Hispanic or Latino | 2,035 | 4.3% |
| Native / Alaskan | 285 | 0.6% |
| White / Caucasian | 38,755 | 80.9% |
| Two or more Races | 2,392 | 5.0% |
| Some other Race | 706 | 1.5% |
| Total | 47,919 | 100.0% |
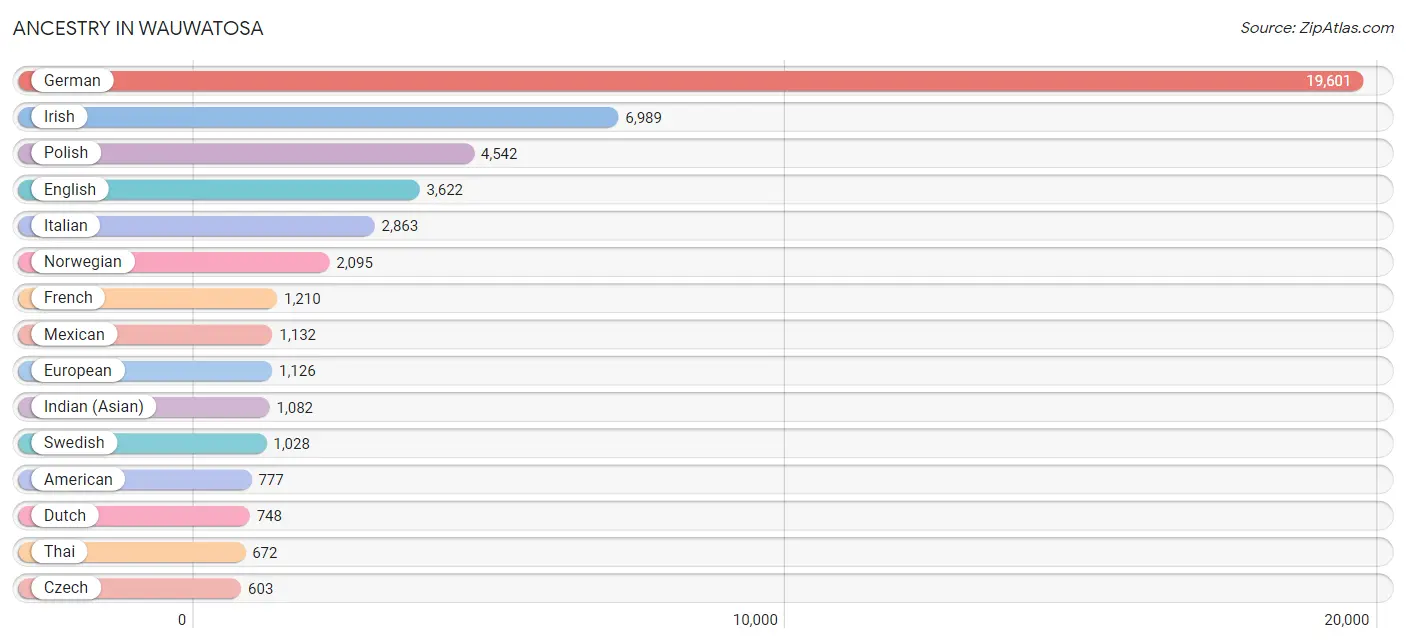
Ancestry in Wauwatosa
The most populous ancestries reported in Wauwatosa are German (19,601 | 40.9%), Irish (6,989 | 14.6%), Polish (4,542 | 9.5%), English (3,622 | 7.6%), and Italian (2,863 | 6.0%), together accounting for 78.5% of all Wauwatosa residents.
| Ancestry | # Population | % Population |
| African | 141 | 0.3% |
| Albanian | 7 | 0.0% |
| American | 777 | 1.6% |
| Arab | 190 | 0.4% |
| Armenian | 78 | 0.2% |
| Assyrian / Chaldean / Syriac | 91 | 0.2% |
| Australian | 39 | 0.1% |
| Austrian | 359 | 0.7% |
| Bangladeshi | 149 | 0.3% |
| Belgian | 165 | 0.3% |
| Bhutanese | 158 | 0.3% |
| Blackfeet | 14 | 0.0% |
| Brazilian | 2 | 0.0% |
| British | 244 | 0.5% |
| Burmese | 309 | 0.6% |
| Canadian | 116 | 0.2% |
| Central American | 132 | 0.3% |
| Central American Indian | 30 | 0.1% |
| Cherokee | 38 | 0.1% |
| Chilean | 36 | 0.1% |
| Chippewa | 147 | 0.3% |
| Colombian | 1 | 0.0% |
| Cree | 83 | 0.2% |
| Creek | 1 | 0.0% |
| Croatian | 282 | 0.6% |
| Czech | 603 | 1.3% |
| Czechoslovakian | 74 | 0.2% |
| Danish | 306 | 0.6% |
| Dominican | 223 | 0.5% |
| Dutch | 748 | 1.6% |
| Eastern European | 118 | 0.3% |
| Ecuadorian | 2 | 0.0% |
| Egyptian | 43 | 0.1% |
| English | 3,622 | 7.6% |
| Estonian | 2 | 0.0% |
| European | 1,126 | 2.4% |
| Fijian | 13 | 0.0% |
| Filipino | 56 | 0.1% |
| Finnish | 174 | 0.4% |
| French | 1,210 | 2.5% |
| French Canadian | 313 | 0.6% |
| German | 19,601 | 40.9% |
| German Russian | 12 | 0.0% |
| Ghanaian | 32 | 0.1% |
| Greek | 246 | 0.5% |
| Guatemalan | 61 | 0.1% |
| Haitian | 12 | 0.0% |
| Hungarian | 276 | 0.6% |
| Indian (Asian) | 1,082 | 2.3% |
| Indonesian | 16 | 0.0% |
| Iranian | 51 | 0.1% |
| Iraqi | 7 | 0.0% |
| Irish | 6,989 | 14.6% |
| Iroquois | 36 | 0.1% |
| Italian | 2,863 | 6.0% |
| Jamaican | 20 | 0.0% |
| Korean | 171 | 0.4% |
| Laotian | 103 | 0.2% |
| Latvian | 38 | 0.1% |
| Lebanese | 6 | 0.0% |
| Lithuanian | 251 | 0.5% |
| Luxembourger | 108 | 0.2% |
| Malaysian | 25 | 0.1% |
| Menominee | 42 | 0.1% |
| Mexican | 1,132 | 2.4% |
| Mexican American Indian | 48 | 0.1% |
| Native Hawaiian | 74 | 0.2% |
| Nicaraguan | 19 | 0.0% |
| Nigerian | 85 | 0.2% |
| Northern European | 122 | 0.3% |
| Norwegian | 2,095 | 4.4% |
| Pakistani | 73 | 0.2% |
| Palestinian | 7 | 0.0% |
| Panamanian | 52 | 0.1% |
| Pennsylvania German | 6 | 0.0% |
| Peruvian | 34 | 0.1% |
| Polish | 4,542 | 9.5% |
| Portuguese | 70 | 0.2% |
| Potawatomi | 58 | 0.1% |
| Puerto Rican | 346 | 0.7% |
| Romanian | 9 | 0.0% |
| Russian | 470 | 1.0% |
| Scandinavian | 242 | 0.5% |
| Scotch-Irish | 149 | 0.3% |
| Scottish | 556 | 1.2% |
| Serbian | 141 | 0.3% |
| Slavic | 19 | 0.0% |
| Slovak | 140 | 0.3% |
| Slovene | 204 | 0.4% |
| South American | 73 | 0.2% |
| Spaniard | 75 | 0.2% |
| Spanish | 27 | 0.1% |
| Sri Lankan | 51 | 0.1% |
| Subsaharan African | 264 | 0.5% |
| Swedish | 1,028 | 2.1% |
| Swiss | 366 | 0.8% |
| Syrian | 39 | 0.1% |
| Thai | 672 | 1.4% |
| Turkish | 28 | 0.1% |
| Ukrainian | 78 | 0.2% |
| Welsh | 244 | 0.5% |
| West Indian | 21 | 0.0% |
| Yugoslavian | 23 | 0.1% | View All 103 Rows |
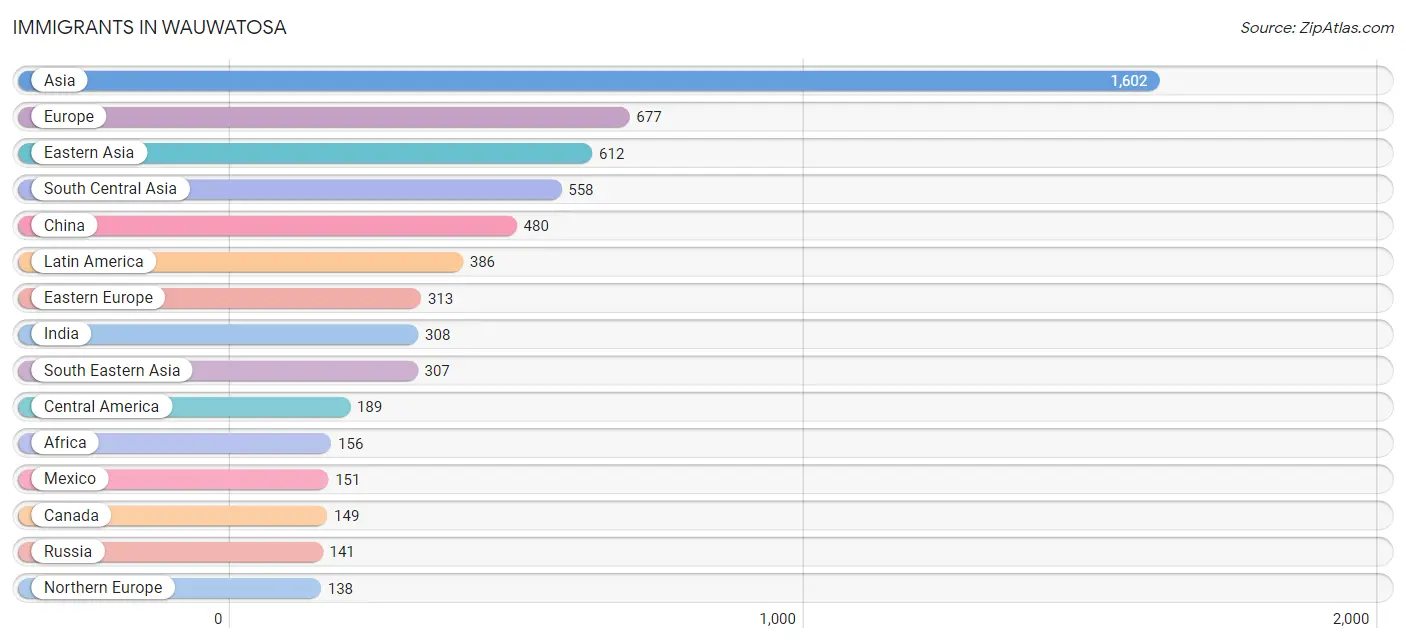
Immigrants in Wauwatosa
The most numerous immigrant groups reported in Wauwatosa came from Asia (1,602 | 3.3%), Europe (677 | 1.4%), Eastern Asia (612 | 1.3%), South Central Asia (558 | 1.2%), and China (480 | 1.0%), together accounting for 8.2% of all Wauwatosa residents.
| Immigration Origin | # Population | % Population |
| Africa | 156 | 0.3% |
| Asia | 1,602 | 3.3% |
| Australia | 22 | 0.1% |
| Austria | 18 | 0.0% |
| Bangladesh | 10 | 0.0% |
| Bosnia and Herzegovina | 47 | 0.1% |
| Canada | 149 | 0.3% |
| Caribbean | 112 | 0.2% |
| Central America | 189 | 0.4% |
| Chile | 36 | 0.1% |
| China | 480 | 1.0% |
| Colombia | 1 | 0.0% |
| Congo | 51 | 0.1% |
| Croatia | 56 | 0.1% |
| Czechoslovakia | 6 | 0.0% |
| Denmark | 7 | 0.0% |
| Dominican Republic | 78 | 0.2% |
| Eastern Africa | 9 | 0.0% |
| Eastern Asia | 612 | 1.3% |
| Eastern Europe | 313 | 0.6% |
| Ecuador | 2 | 0.0% |
| Egypt | 16 | 0.0% |
| England | 100 | 0.2% |
| Ethiopia | 7 | 0.0% |
| Europe | 677 | 1.4% |
| Germany | 98 | 0.2% |
| Ghana | 33 | 0.1% |
| Greece | 60 | 0.1% |
| Guatemala | 20 | 0.0% |
| Hong Kong | 15 | 0.0% |
| Hungary | 9 | 0.0% |
| India | 308 | 0.6% |
| Indonesia | 103 | 0.2% |
| Iran | 37 | 0.1% |
| Iraq | 61 | 0.1% |
| Ireland | 19 | 0.0% |
| Italy | 8 | 0.0% |
| Japan | 28 | 0.1% |
| Korea | 104 | 0.2% |
| Laos | 63 | 0.1% |
| Latin America | 386 | 0.8% |
| Lithuania | 8 | 0.0% |
| Malaysia | 7 | 0.0% |
| Mexico | 151 | 0.3% |
| Middle Africa | 51 | 0.1% |
| Nepal | 113 | 0.2% |
| Netherlands | 7 | 0.0% |
| Nicaragua | 18 | 0.0% |
| Nigeria | 28 | 0.1% |
| Northern Africa | 22 | 0.1% |
| Northern Europe | 138 | 0.3% |
| Oceania | 22 | 0.1% |
| Pakistan | 90 | 0.2% |
| Peru | 34 | 0.1% |
| Philippines | 70 | 0.2% |
| Poland | 19 | 0.0% |
| Russia | 141 | 0.3% |
| Saudi Arabia | 15 | 0.0% |
| Senegal | 6 | 0.0% |
| Sierra Leone | 7 | 0.0% |
| South America | 85 | 0.2% |
| South Central Asia | 558 | 1.2% |
| South Eastern Asia | 307 | 0.6% |
| Southern Europe | 97 | 0.2% |
| Spain | 29 | 0.1% |
| Taiwan | 47 | 0.1% |
| Thailand | 31 | 0.1% |
| Trinidad and Tobago | 34 | 0.1% |
| Turkey | 42 | 0.1% |
| Uganda | 2 | 0.0% |
| Ukraine | 15 | 0.0% |
| Venezuela | 5 | 0.0% |
| Vietnam | 17 | 0.0% |
| Western Africa | 74 | 0.2% |
| Western Asia | 118 | 0.3% |
| Western Europe | 123 | 0.3% | View All 76 Rows |
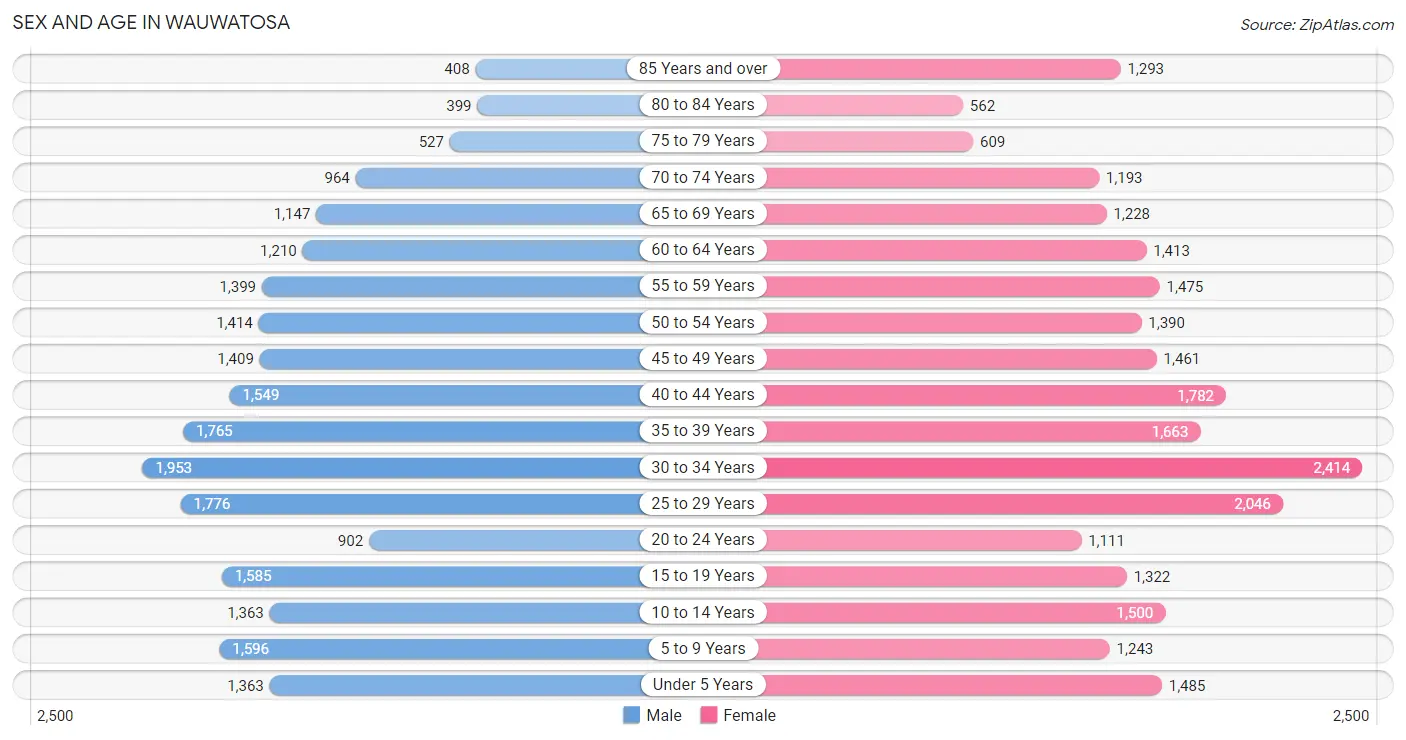
Sex and Age in Wauwatosa
Sex and Age in Wauwatosa
The most populous age groups in Wauwatosa are 30 to 34 Years (1,953 | 8.6%) for men and 30 to 34 Years (2,414 | 9.6%) for women.
| Age Bracket | Male | Female |
| Under 5 Years | 1,363 (6.0%) | 1,485 (5.9%) |
| 5 to 9 Years | 1,596 (7.0%) | 1,243 (4.9%) |
| 10 to 14 Years | 1,363 (6.0%) | 1,500 (5.9%) |
| 15 to 19 Years | 1,585 (7.0%) | 1,322 (5.2%) |
| 20 to 24 Years | 902 (4.0%) | 1,111 (4.4%) |
| 25 to 29 Years | 1,776 (7.8%) | 2,046 (8.1%) |
| 30 to 34 Years | 1,953 (8.6%) | 2,414 (9.6%) |
| 35 to 39 Years | 1,765 (7.8%) | 1,663 (6.6%) |
| 40 to 44 Years | 1,549 (6.8%) | 1,782 (7.1%) |
| 45 to 49 Years | 1,409 (6.2%) | 1,461 (5.8%) |
| 50 to 54 Years | 1,414 (6.2%) | 1,390 (5.5%) |
| 55 to 59 Years | 1,399 (6.2%) | 1,475 (5.9%) |
| 60 to 64 Years | 1,210 (5.3%) | 1,413 (5.6%) |
| 65 to 69 Years | 1,147 (5.1%) | 1,228 (4.9%) |
| 70 to 74 Years | 964 (4.2%) | 1,193 (4.7%) |
| 75 to 79 Years | 527 (2.3%) | 609 (2.4%) |
| 80 to 84 Years | 399 (1.8%) | 562 (2.2%) |
| 85 Years and over | 408 (1.8%) | 1,293 (5.1%) |
| Total | 22,729 (100.0%) | 25,190 (100.0%) |
Families and Households in Wauwatosa
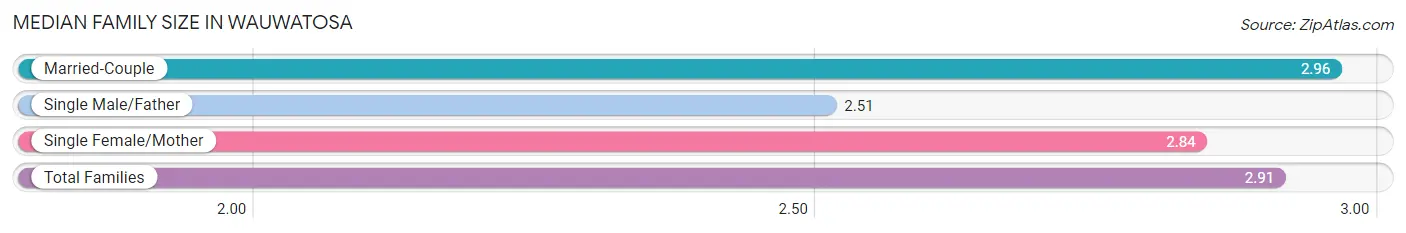
Median Family Size in Wauwatosa
The median family size in Wauwatosa is 2.91 persons per family, with married-couple families (9,324 | 76.5%) accounting for the largest median family size of 2.96 persons per family. On the other hand, single male/father families (921 | 7.5%) represent the smallest median family size with 2.51 persons per family.
| Family Type | # Families | Family Size |
| Married-Couple | 9,324 (76.5%) | 2.96 |
| Single Male/Father | 921 (7.5%) | 2.51 |
| Single Female/Mother | 1,946 (16.0%) | 2.84 |
| Total Families | 12,191 (100.0%) | 2.91 |
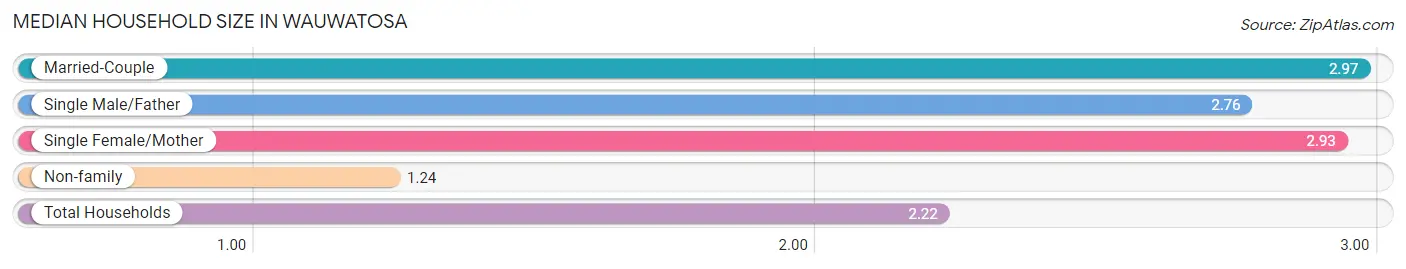
Median Household Size in Wauwatosa
The median household size in Wauwatosa is 2.22 persons per household, with married-couple households (9,324 | 43.9%) accounting for the largest median household size of 2.97 persons per household. non-family households (9,072 | 42.7%) represent the smallest median household size with 1.24 persons per household.
| Household Type | # Households | Household Size |
| Married-Couple | 9,324 (43.9%) | 2.97 |
| Single Male/Father | 921 (4.3%) | 2.76 |
| Single Female/Mother | 1,946 (9.1%) | 2.93 |
| Non-family | 9,072 (42.7%) | 1.24 |
| Total Households | 21,263 (100.0%) | 2.22 |
Household Size by Marriage Status in Wauwatosa
Out of a total of 21,263 households in Wauwatosa, 12,191 (57.3%) are family households, while 9,072 (42.7%) are nonfamily households. The most numerous type of family households are 2-person households, comprising 5,743, and the most common type of nonfamily households are 1-person households, comprising 7,170.
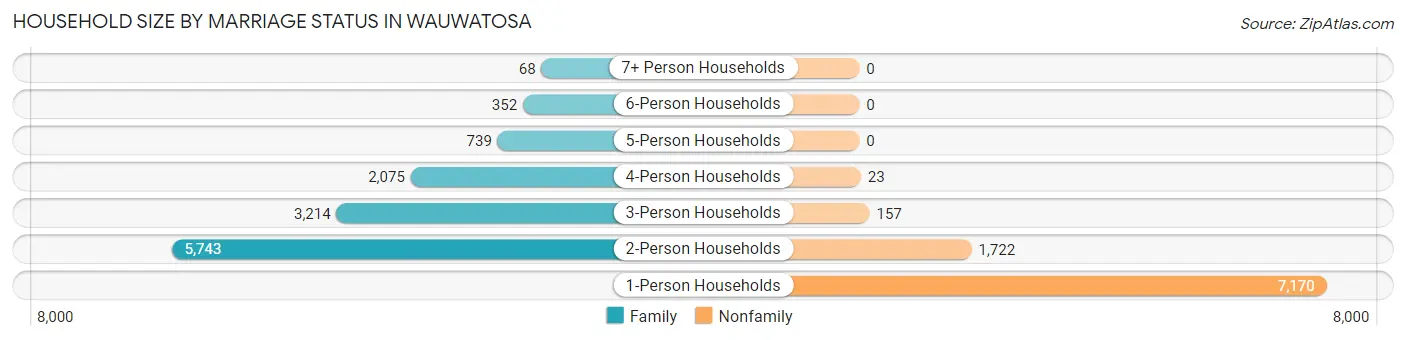
| Household Size | Family Households | Nonfamily Households |
| 1-Person Households | - | 7,170 (33.7%) |
| 2-Person Households | 5,743 (27.0%) | 1,722 (8.1%) |
| 3-Person Households | 3,214 (15.1%) | 157 (0.7%) |
| 4-Person Households | 2,075 (9.8%) | 23 (0.1%) |
| 5-Person Households | 739 (3.5%) | 0 (0.0%) |
| 6-Person Households | 352 (1.7%) | 0 (0.0%) |
| 7+ Person Households | 68 (0.3%) | 0 (0.0%) |
| Total | 12,191 (57.3%) | 9,072 (42.7%) |
Female Fertility in Wauwatosa
Fertility by Age in Wauwatosa
Average fertility rate in Wauwatosa is 45.0 births per 1,000 women. Women in the age bracket of 20 to 34 years have the highest fertility rate with 67.0 births per 1,000 women. Women in the age bracket of 20 to 34 years acount for 68.2% of all women with births.
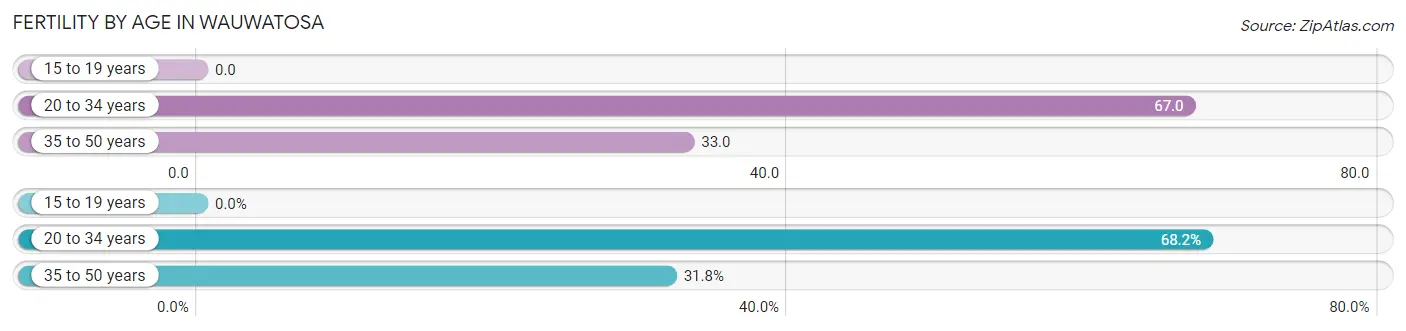
| Age Bracket | Women with Births | Births / 1,000 Women |
| 15 to 19 years | 0 (0.0%) | 0.0 |
| 20 to 34 years | 373 (68.2%) | 67.0 |
| 35 to 50 years | 174 (31.8%) | 33.0 |
| Total | 547 (100.0%) | 45.0 |
Fertility by Age by Marriage Status in Wauwatosa
93.6% of women with births (547) in Wauwatosa are married. The highest percentage of unmarried women with births falls into 35 to 50 years age bracket with 19.5% of them unmarried at the time of birth, while the lowest percentage of unmarried women with births belong to 20 to 34 years age bracket with 0.3% of them unmarried.
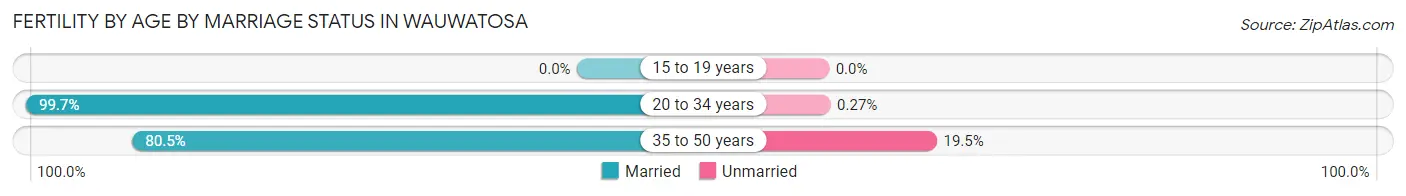
| Age Bracket | Married | Unmarried |
| 15 to 19 years | 0 (0.0%) | 0 (0.0%) |
| 20 to 34 years | 372 (99.7%) | 1 (0.3%) |
| 35 to 50 years | 140 (80.5%) | 34 (19.5%) |
| Total | 512 (93.6%) | 35 (6.4%) |
Fertility by Education in Wauwatosa
Average fertility rate in Wauwatosa is 45.0 births per 1,000 women. Women with the education attainment of graduate degree have the highest fertility rate of 72.0 births per 1,000 women, while women with the education attainment of less than high school have the lowest fertility at 1.0 births per 1,000 women. Women with the education attainment of bachelor's degree represent 41.1% of all women with births.
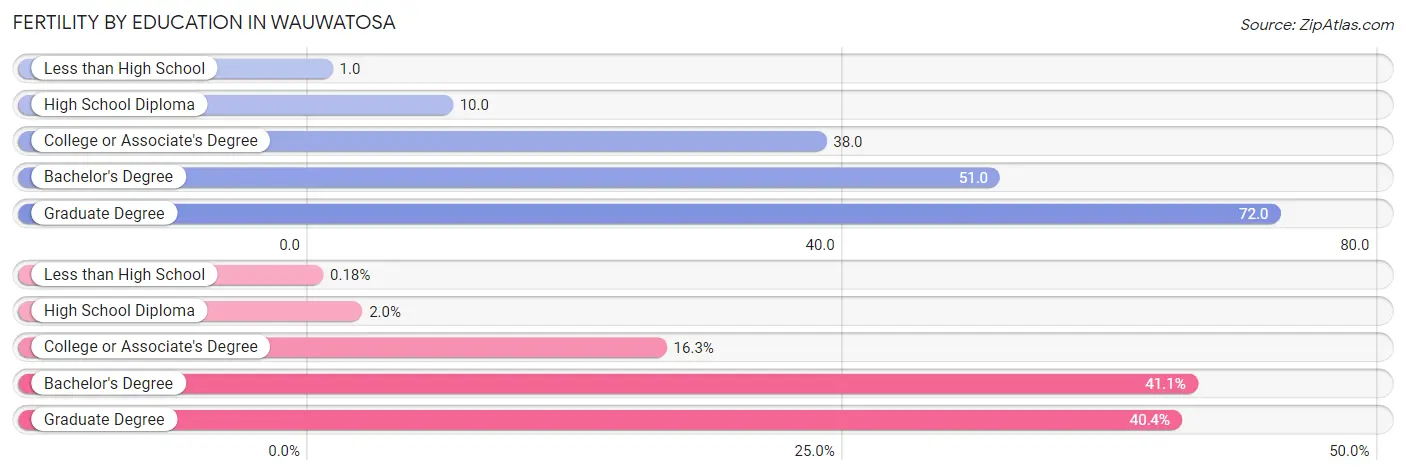
| Educational Attainment | Women with Births | Births / 1,000 Women |
| Less than High School | 1 (0.2%) | 1.0 |
| High School Diploma | 11 (2.0%) | 10.0 |
| College or Associate's Degree | 89 (16.3%) | 38.0 |
| Bachelor's Degree | 225 (41.1%) | 51.0 |
| Graduate Degree | 221 (40.4%) | 72.0 |
| Total | 547 (100.0%) | 45.0 |
Fertility by Education by Marriage Status in Wauwatosa
6.4% of women with births in Wauwatosa are unmarried. Women with the educational attainment of high school diploma are most likely to be married with 100.0% of them married at childbirth, while women with the educational attainment of less than high school are least likely to be married with 100.0% of them unmarried at childbirth.
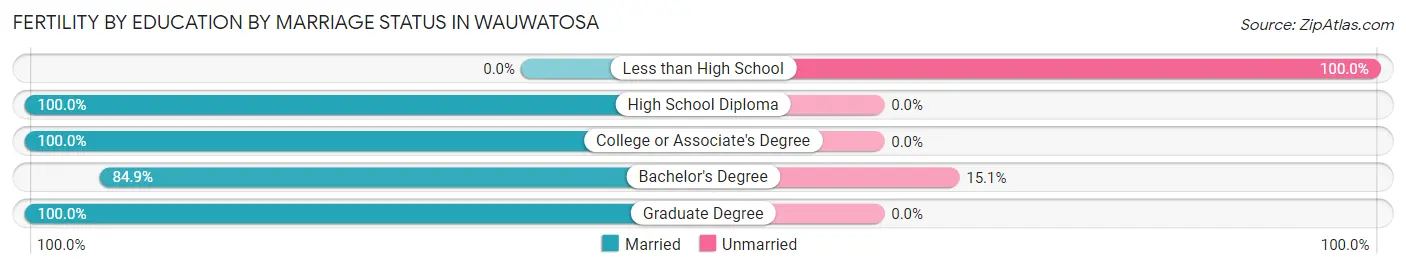
| Educational Attainment | Married | Unmarried |
| Less than High School | 0 (0.0%) | 1 (100.0%) |
| High School Diploma | 11 (100.0%) | 0 (0.0%) |
| College or Associate's Degree | 89 (100.0%) | 0 (0.0%) |
| Bachelor's Degree | 191 (84.9%) | 34 (15.1%) |
| Graduate Degree | 221 (100.0%) | 0 (0.0%) |
| Total | 512 (93.6%) | 35 (6.4%) |
Employment Characteristics in Wauwatosa
Employment by Class of Employer in Wauwatosa
Among the 25,221 employed individuals in Wauwatosa, private company employees (15,864 | 62.9%), not-for-profit organizations (4,793 | 19.0%), and local government employees (1,548 | 6.1%) make up the most common classes of employment.
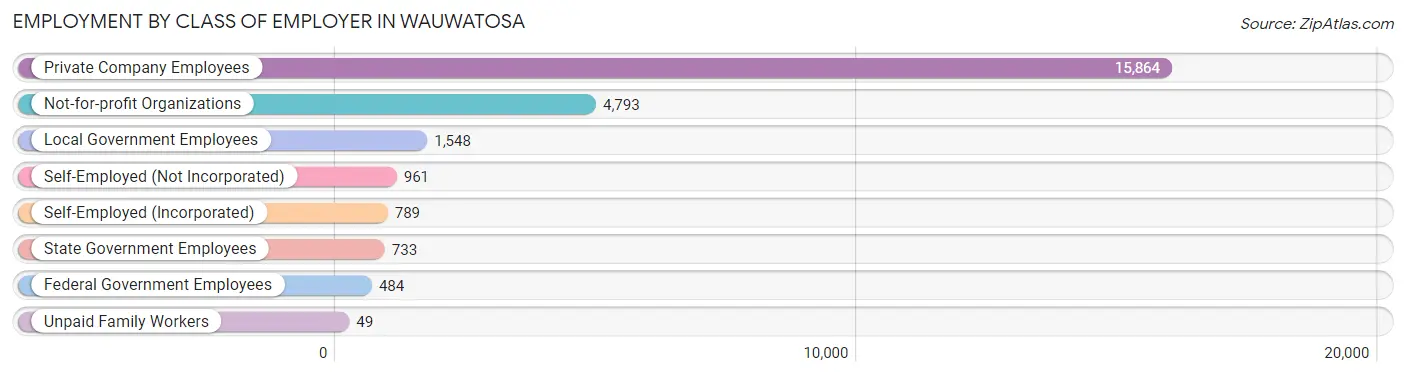
| Employer Class | # Employees | % Employees |
| Private Company Employees | 15,864 | 62.9% |
| Self-Employed (Incorporated) | 789 | 3.1% |
| Self-Employed (Not Incorporated) | 961 | 3.8% |
| Not-for-profit Organizations | 4,793 | 19.0% |
| Local Government Employees | 1,548 | 6.1% |
| State Government Employees | 733 | 2.9% |
| Federal Government Employees | 484 | 1.9% |
| Unpaid Family Workers | 49 | 0.2% |
| Total | 25,221 | 100.0% |
Employment Status by Age in Wauwatosa
According to the labor force statistics for Wauwatosa, out of the total population over 16 years of age (38,709), 67.2% or 26,012 individuals are in the labor force, with 2.2% or 572 of them unemployed. The age group with the highest labor force participation rate is 30 to 34 years, with 93.7% or 4,092 individuals in the labor force. Within the labor force, the 16 to 19 years age range has the highest percentage of unemployed individuals, with 17.1% or 130 of them being unemployed.
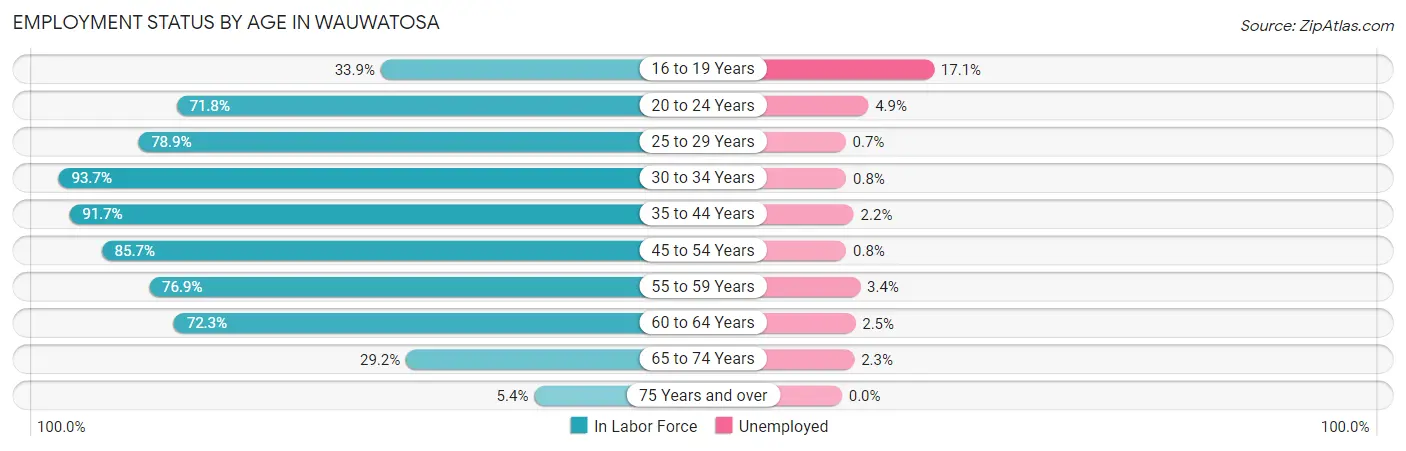
| Age Bracket | In Labor Force | Unemployed |
| 16 to 19 Years | 762 (33.9%) | 130 (17.1%) |
| 20 to 24 Years | 1,445 (71.8%) | 71 (4.9%) |
| 25 to 29 Years | 3,016 (78.9%) | 21 (0.7%) |
| 30 to 34 Years | 4,092 (93.7%) | 33 (0.8%) |
| 35 to 44 Years | 6,198 (91.7%) | 136 (2.2%) |
| 45 to 54 Years | 4,863 (85.7%) | 39 (0.8%) |
| 55 to 59 Years | 2,210 (76.9%) | 75 (3.4%) |
| 60 to 64 Years | 1,896 (72.3%) | 47 (2.5%) |
| 65 to 74 Years | 1,323 (29.2%) | 30 (2.3%) |
| 75 Years and over | 205 (5.4%) | 0 (0.0%) |
| Total | 26,012 (67.2%) | 572 (2.2%) |
Employment Status by Educational Attainment in Wauwatosa
According to labor force statistics for Wauwatosa, 85.3% of individuals (22,280) out of the total population between 25 and 64 years of age (26,119) are in the labor force, with 1.6% or 356 of them being unemployed. The group with the highest labor force participation rate are those with the educational attainment of bachelor's degree or higher, with 86.8% or 14,733 individuals in the labor force. Within the labor force, individuals with high school diploma education have the highest percentage of unemployment, with 2.9% or 70 of them being unemployed.
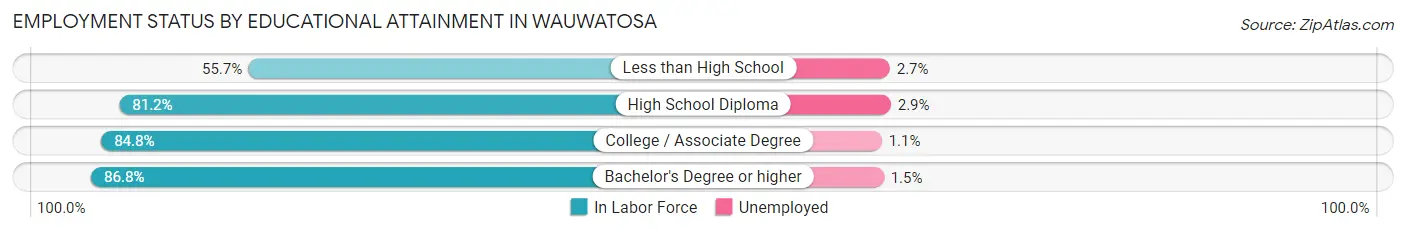
| Educational Attainment | In Labor Force | Unemployed |
| Less than High School | 221 (55.7%) | 11 (2.7%) |
| High School Diploma | 2,427 (81.2%) | 87 (2.9%) |
| College / Associate Degree | 4,884 (84.8%) | 63 (1.1%) |
| Bachelor's Degree or higher | 14,733 (86.8%) | 255 (1.5%) |
| Total | 22,280 (85.3%) | 418 (1.6%) |
Employment Occupations by Sex in Wauwatosa
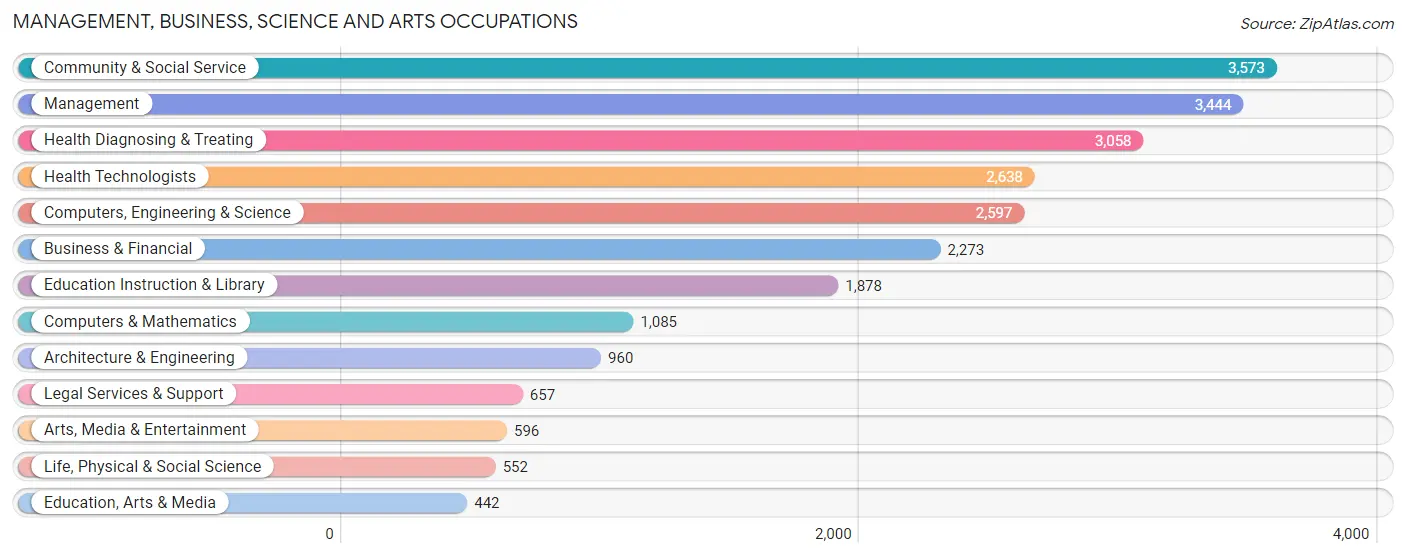
Management, Business, Science and Arts Occupations
The most common Management, Business, Science and Arts occupations in Wauwatosa are Community & Social Service (3,573 | 14.1%), Management (3,444 | 13.6%), Health Diagnosing & Treating (3,058 | 12.0%), Health Technologists (2,638 | 10.4%), and Computers, Engineering & Science (2,597 | 10.2%).
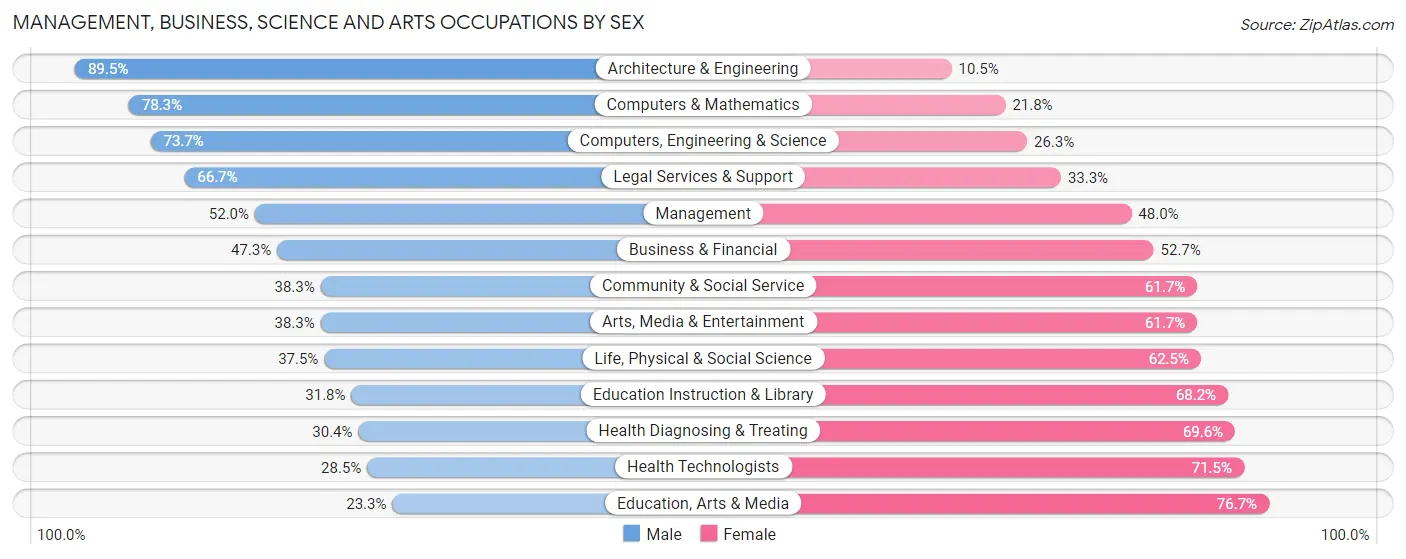
Management, Business, Science and Arts Occupations by Sex
Within the Management, Business, Science and Arts occupations in Wauwatosa, the most male-oriented occupations are Architecture & Engineering (89.5%), Computers & Mathematics (78.2%), and Computers, Engineering & Science (73.7%), while the most female-oriented occupations are Education, Arts & Media (76.7%), Health Technologists (71.5%), and Health Diagnosing & Treating (69.6%).
| Occupation | Male | Female |
| Management | 1,790 (52.0%) | 1,654 (48.0%) |
| Business & Financial | 1,076 (47.3%) | 1,197 (52.7%) |
| Computers, Engineering & Science | 1,915 (73.7%) | 682 (26.3%) |
| Computers & Mathematics | 849 (78.2%) | 236 (21.7%) |
| Architecture & Engineering | 859 (89.5%) | 101 (10.5%) |
| Life, Physical & Social Science | 207 (37.5%) | 345 (62.5%) |
| Community & Social Service | 1,367 (38.3%) | 2,206 (61.7%) |
| Education, Arts & Media | 103 (23.3%) | 339 (76.7%) |
| Legal Services & Support | 438 (66.7%) | 219 (33.3%) |
| Education Instruction & Library | 598 (31.8%) | 1,280 (68.2%) |
| Arts, Media & Entertainment | 228 (38.3%) | 368 (61.7%) |
| Health Diagnosing & Treating | 929 (30.4%) | 2,129 (69.6%) |
| Health Technologists | 753 (28.5%) | 1,885 (71.5%) |
| Total (Category) | 7,077 (47.3%) | 7,868 (52.6%) |
| Total (Overall) | 12,429 (48.9%) | 12,968 (51.1%) |
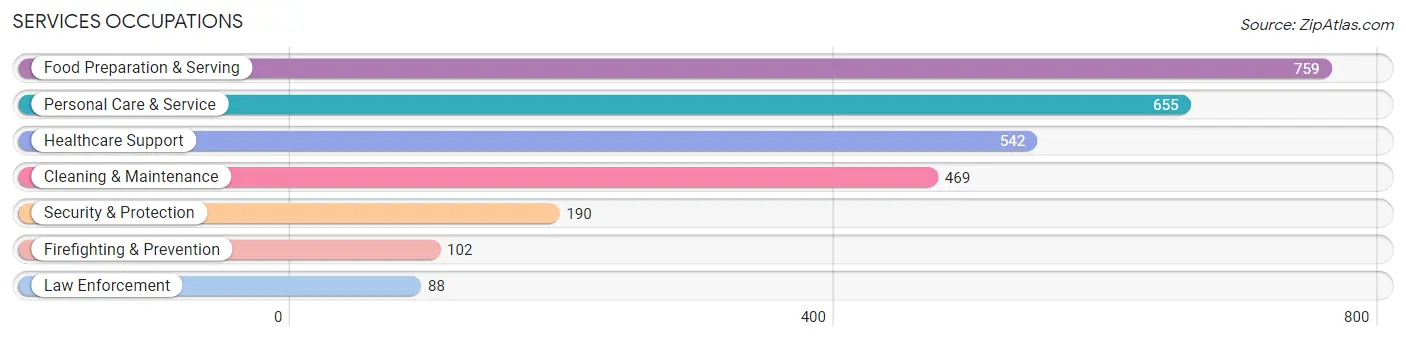
Services Occupations
The most common Services occupations in Wauwatosa are Food Preparation & Serving (759 | 3.0%), Personal Care & Service (655 | 2.6%), Healthcare Support (542 | 2.1%), Cleaning & Maintenance (469 | 1.8%), and Security & Protection (190 | 0.7%).
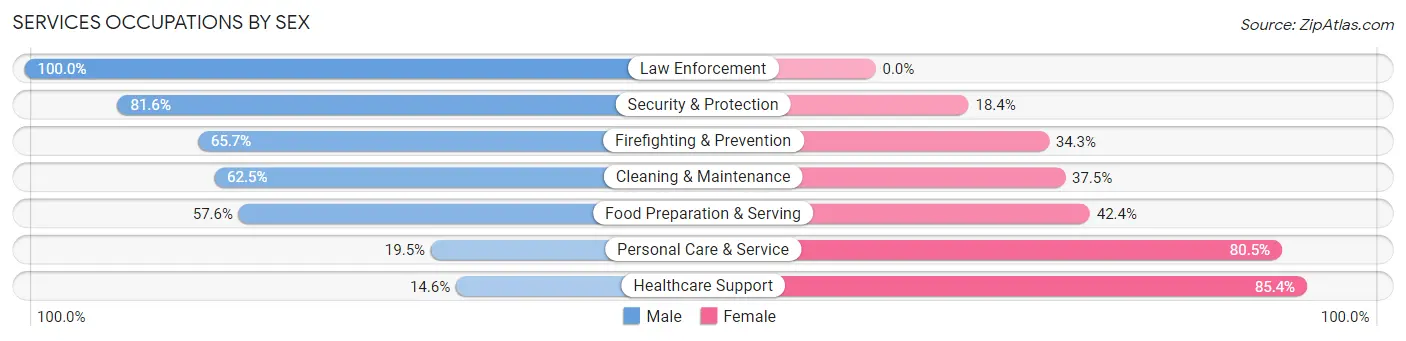
Services Occupations by Sex
Within the Services occupations in Wauwatosa, the most male-oriented occupations are Law Enforcement (100.0%), Security & Protection (81.6%), and Firefighting & Prevention (65.7%), while the most female-oriented occupations are Healthcare Support (85.4%), Personal Care & Service (80.5%), and Food Preparation & Serving (42.4%).
| Occupation | Male | Female |
| Healthcare Support | 79 (14.6%) | 463 (85.4%) |
| Security & Protection | 155 (81.6%) | 35 (18.4%) |
| Firefighting & Prevention | 67 (65.7%) | 35 (34.3%) |
| Law Enforcement | 88 (100.0%) | 0 (0.0%) |
| Food Preparation & Serving | 437 (57.6%) | 322 (42.4%) |
| Cleaning & Maintenance | 293 (62.5%) | 176 (37.5%) |
| Personal Care & Service | 128 (19.5%) | 527 (80.5%) |
| Total (Category) | 1,092 (41.8%) | 1,523 (58.2%) |
| Total (Overall) | 12,429 (48.9%) | 12,968 (51.1%) |
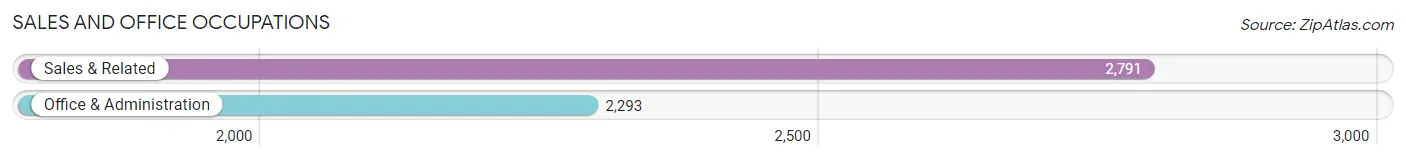
Sales and Office Occupations
The most common Sales and Office occupations in Wauwatosa are Sales & Related (2,791 | 11.0%), and Office & Administration (2,293 | 9.0%).
Sales and Office Occupations by Sex
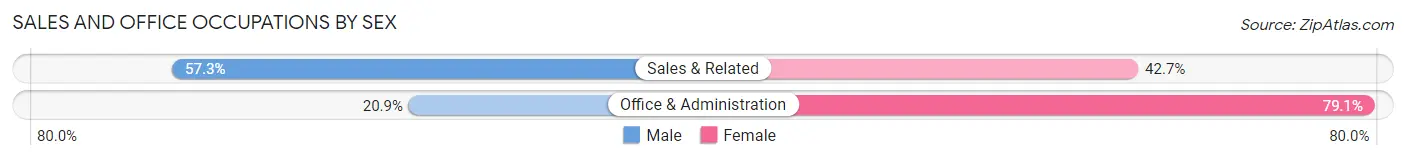
| Occupation | Male | Female |
| Sales & Related | 1,599 (57.3%) | 1,192 (42.7%) |
| Office & Administration | 479 (20.9%) | 1,814 (79.1%) |
| Total (Category) | 2,078 (40.9%) | 3,006 (59.1%) |
| Total (Overall) | 12,429 (48.9%) | 12,968 (51.1%) |
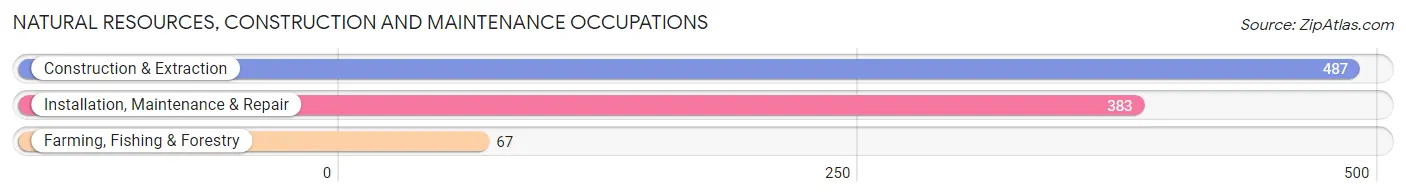
Natural Resources, Construction and Maintenance Occupations
The most common Natural Resources, Construction and Maintenance occupations in Wauwatosa are Construction & Extraction (487 | 1.9%), Installation, Maintenance & Repair (383 | 1.5%), and Farming, Fishing & Forestry (67 | 0.3%).
Natural Resources, Construction and Maintenance Occupations by Sex
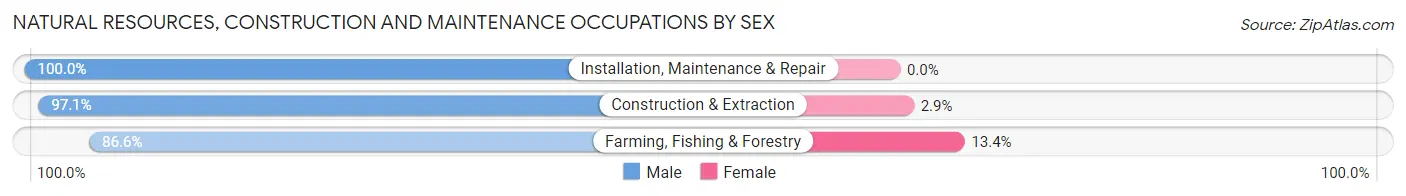
| Occupation | Male | Female |
| Farming, Fishing & Forestry | 58 (86.6%) | 9 (13.4%) |
| Construction & Extraction | 473 (97.1%) | 14 (2.9%) |
| Installation, Maintenance & Repair | 383 (100.0%) | 0 (0.0%) |
| Total (Category) | 914 (97.6%) | 23 (2.5%) |
| Total (Overall) | 12,429 (48.9%) | 12,968 (51.1%) |
Production, Transportation and Moving Occupations
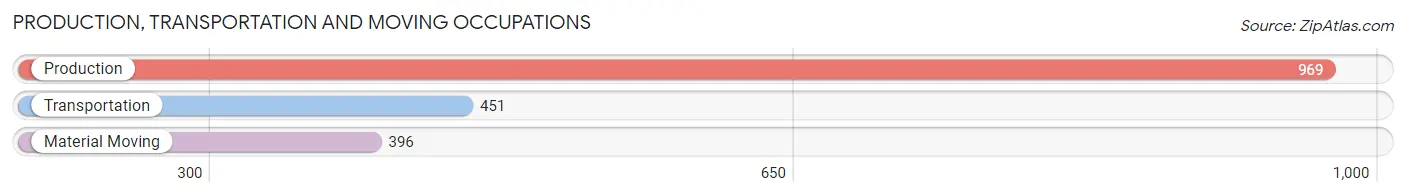
The most common Production, Transportation and Moving occupations in Wauwatosa are Production (969 | 3.8%), Transportation (451 | 1.8%), and Material Moving (396 | 1.6%).
Production, Transportation and Moving Occupations by Sex
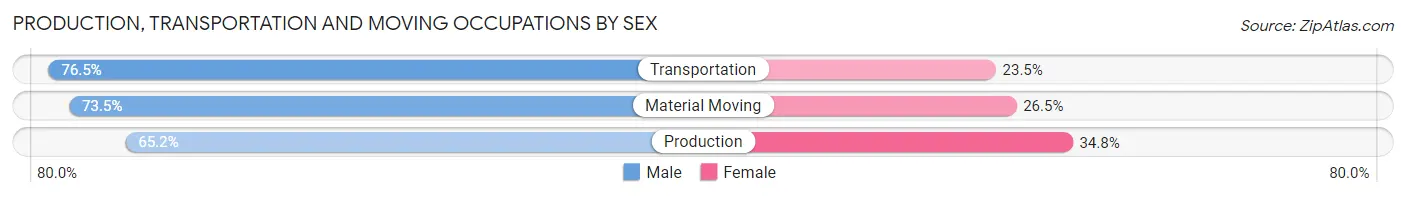
| Occupation | Male | Female |
| Production | 632 (65.2%) | 337 (34.8%) |
| Transportation | 345 (76.5%) | 106 (23.5%) |
| Material Moving | 291 (73.5%) | 105 (26.5%) |
| Total (Category) | 1,268 (69.8%) | 548 (30.2%) |
| Total (Overall) | 12,429 (48.9%) | 12,968 (51.1%) |
Employment Industries by Sex in Wauwatosa
Employment Industries in Wauwatosa
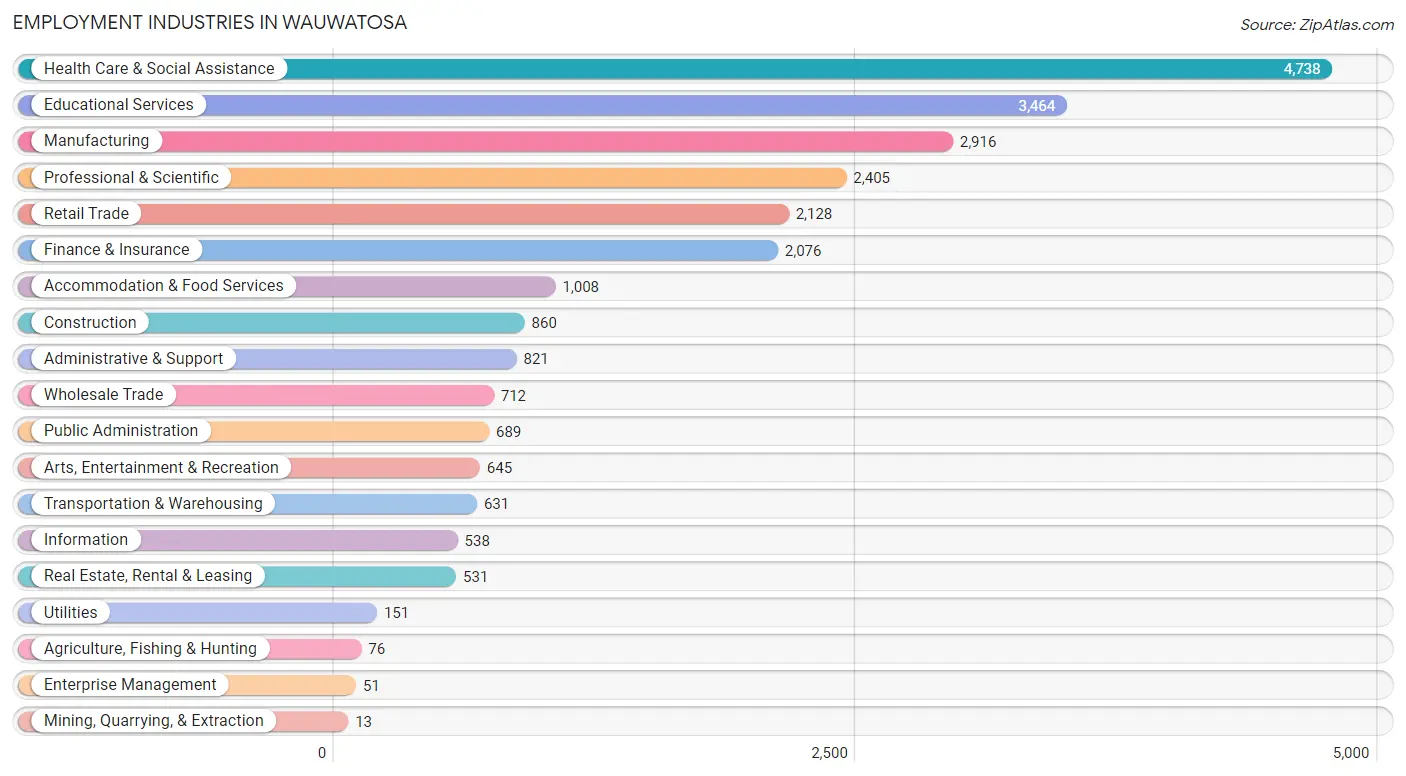
The major employment industries in Wauwatosa include Health Care & Social Assistance (4,738 | 18.7%), Educational Services (3,464 | 13.6%), Manufacturing (2,916 | 11.5%), Professional & Scientific (2,405 | 9.5%), and Retail Trade (2,128 | 8.4%).
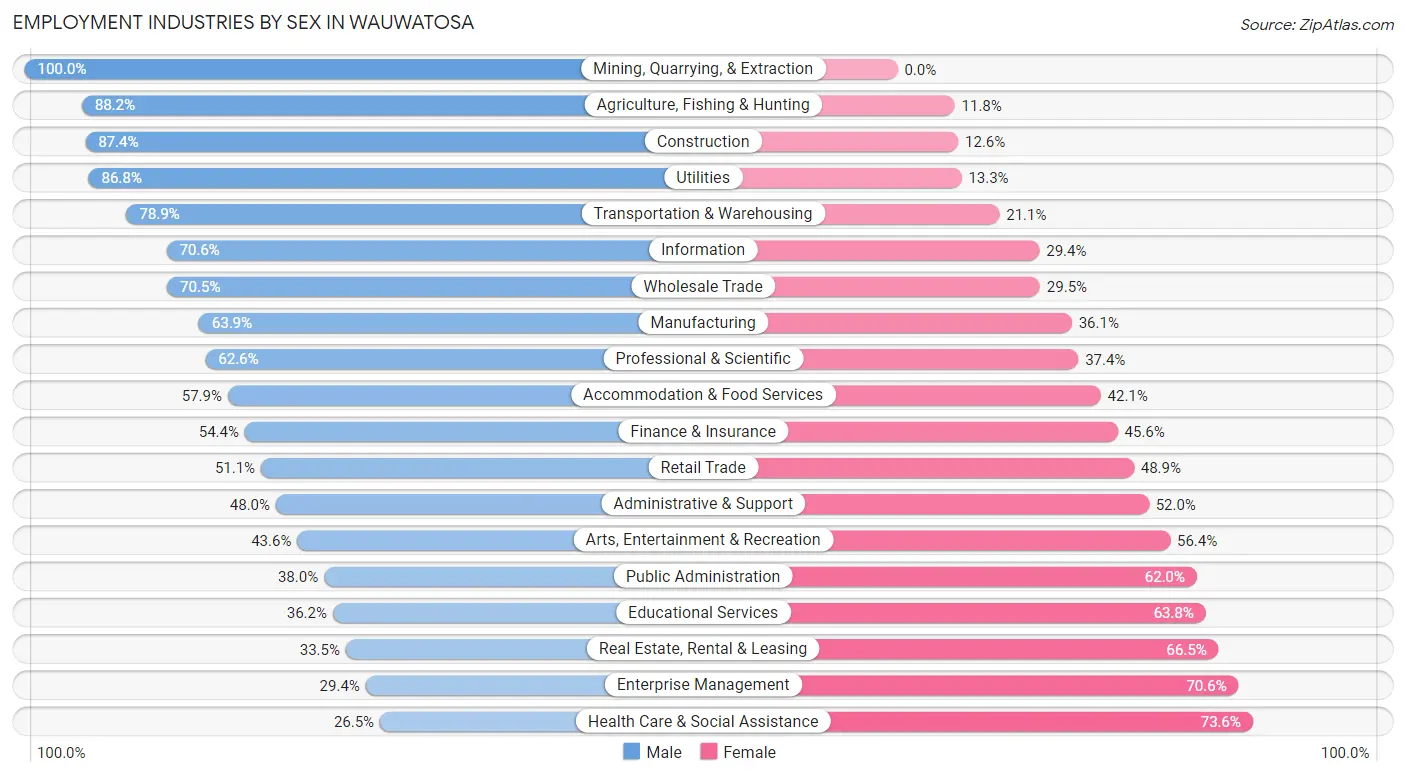
Employment Industries by Sex in Wauwatosa
The Wauwatosa industries that see more men than women are Mining, Quarrying, & Extraction (100.0%), Agriculture, Fishing & Hunting (88.2%), and Construction (87.4%), whereas the industries that tend to have a higher number of women are Health Care & Social Assistance (73.6%), Enterprise Management (70.6%), and Real Estate, Rental & Leasing (66.5%).
| Industry | Male | Female |
| Agriculture, Fishing & Hunting | 67 (88.2%) | 9 (11.8%) |
| Mining, Quarrying, & Extraction | 13 (100.0%) | 0 (0.0%) |
| Construction | 752 (87.4%) | 108 (12.6%) |
| Manufacturing | 1,864 (63.9%) | 1,052 (36.1%) |
| Wholesale Trade | 502 (70.5%) | 210 (29.5%) |
| Retail Trade | 1,087 (51.1%) | 1,041 (48.9%) |
| Transportation & Warehousing | 498 (78.9%) | 133 (21.1%) |
| Utilities | 131 (86.8%) | 20 (13.3%) |
| Information | 380 (70.6%) | 158 (29.4%) |
| Finance & Insurance | 1,130 (54.4%) | 946 (45.6%) |
| Real Estate, Rental & Leasing | 178 (33.5%) | 353 (66.5%) |
| Professional & Scientific | 1,505 (62.6%) | 900 (37.4%) |
| Enterprise Management | 15 (29.4%) | 36 (70.6%) |
| Administrative & Support | 394 (48.0%) | 427 (52.0%) |
| Educational Services | 1,254 (36.2%) | 2,210 (63.8%) |
| Health Care & Social Assistance | 1,253 (26.5%) | 3,485 (73.6%) |
| Arts, Entertainment & Recreation | 281 (43.6%) | 364 (56.4%) |
| Accommodation & Food Services | 584 (57.9%) | 424 (42.1%) |
| Public Administration | 262 (38.0%) | 427 (62.0%) |
| Total | 12,429 (48.9%) | 12,968 (51.1%) |
Education in Wauwatosa
School Enrollment in Wauwatosa
The most common levels of schooling among the 11,799 students in Wauwatosa are high school (3,110 | 26.4%), elementary school (2,159 | 18.3%), and middle school (2,014 | 17.1%).
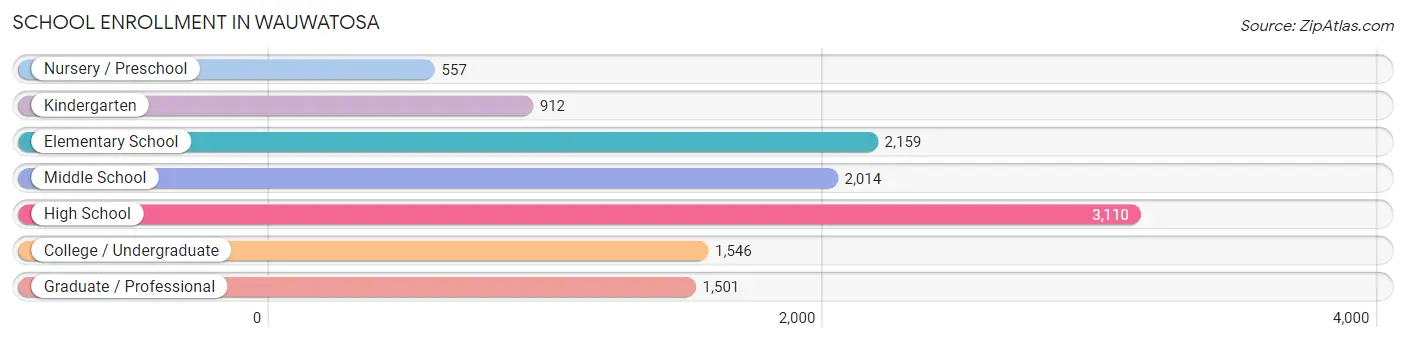
| School Level | # Students | % Students |
| Nursery / Preschool | 557 | 4.7% |
| Kindergarten | 912 | 7.7% |
| Elementary School | 2,159 | 18.3% |
| Middle School | 2,014 | 17.1% |
| High School | 3,110 | 26.4% |
| College / Undergraduate | 1,546 | 13.1% |
| Graduate / Professional | 1,501 | 12.7% |
| Total | 11,799 | 100.0% |
School Enrollment by Age by Funding Source in Wauwatosa
Out of a total of 11,799 students who are enrolled in schools in Wauwatosa, 3,032 (25.7%) attend a private institution, while the remaining 8,767 (74.3%) are enrolled in public schools. The age group of 20 to 24 year olds has the highest likelihood of being enrolled in private schools, with 462 (52.9% in the age bracket) enrolled. Conversely, the age group of 5 to 9 year old has the lowest likelihood of being enrolled in a private school, with 2,422 (87.0% in the age bracket) attending a public institution.
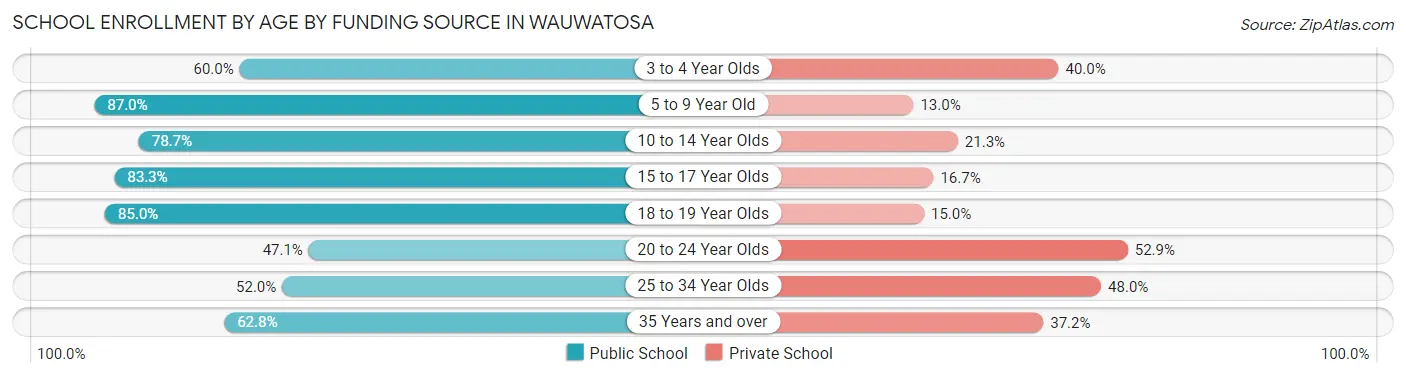
| Age Bracket | Public School | Private School |
| 3 to 4 Year Olds | 370 (60.0%) | 247 (40.0%) |
| 5 to 9 Year Old | 2,422 (87.0%) | 362 (13.0%) |
| 10 to 14 Year Olds | 2,183 (78.7%) | 590 (21.3%) |
| 15 to 17 Year Olds | 1,648 (83.3%) | 331 (16.7%) |
| 18 to 19 Year Olds | 619 (85.0%) | 109 (15.0%) |
| 20 to 24 Year Olds | 411 (47.1%) | 462 (52.9%) |
| 25 to 34 Year Olds | 853 (52.0%) | 786 (48.0%) |
| 35 Years and over | 255 (62.8%) | 151 (37.2%) |
| Total | 8,767 (74.3%) | 3,032 (25.7%) |
Educational Attainment by Field of Study in Wauwatosa
Business (4,201 | 17.9%), science & technology (2,617 | 11.2%), social sciences (2,144 | 9.1%), education (2,097 | 8.9%), and engineering (1,687 | 7.2%) are the most common fields of study among 23,481 individuals in Wauwatosa who have obtained a bachelor's degree or higher.
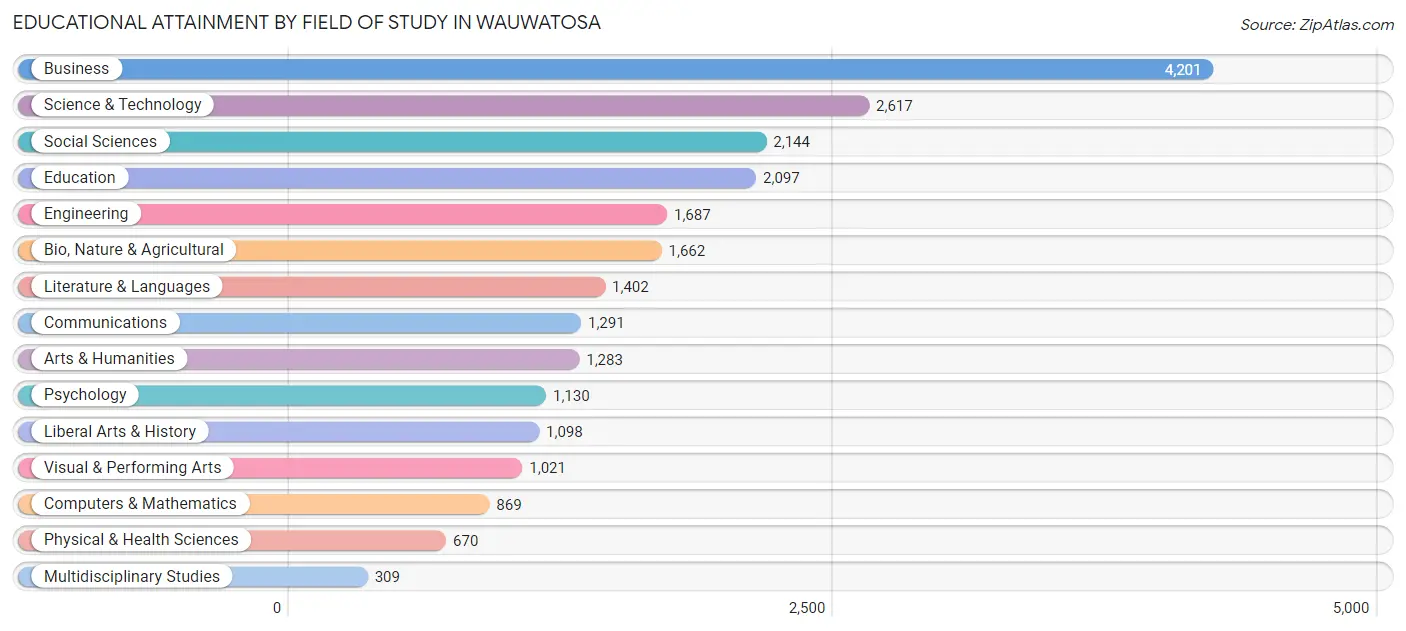
| Field of Study | # Graduates | % Graduates |
| Computers & Mathematics | 869 | 3.7% |
| Bio, Nature & Agricultural | 1,662 | 7.1% |
| Physical & Health Sciences | 670 | 2.9% |
| Psychology | 1,130 | 4.8% |
| Social Sciences | 2,144 | 9.1% |
| Engineering | 1,687 | 7.2% |
| Multidisciplinary Studies | 309 | 1.3% |
| Science & Technology | 2,617 | 11.2% |
| Business | 4,201 | 17.9% |
| Education | 2,097 | 8.9% |
| Literature & Languages | 1,402 | 6.0% |
| Liberal Arts & History | 1,098 | 4.7% |
| Visual & Performing Arts | 1,021 | 4.3% |
| Communications | 1,291 | 5.5% |
| Arts & Humanities | 1,283 | 5.5% |
| Total | 23,481 | 100.0% |
Transportation & Commute in Wauwatosa
Vehicle Availability by Sex in Wauwatosa
The most prevalent vehicle ownership categories in Wauwatosa are males with 2 vehicles (7,450, accounting for 60.3%) and females with 2 vehicles (7,182, making up 58.2%).
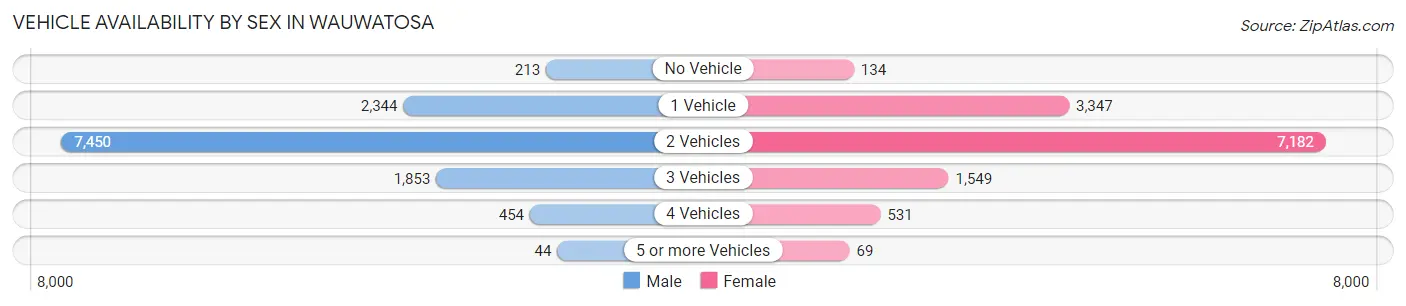
| Vehicles Available | Male | Female |
| No Vehicle | 213 (1.7%) | 134 (1.1%) |
| 1 Vehicle | 2,344 (19.0%) | 3,347 (26.1%) |
| 2 Vehicles | 7,450 (60.3%) | 7,182 (56.1%) |
| 3 Vehicles | 1,853 (15.0%) | 1,549 (12.1%) |
| 4 Vehicles | 454 (3.7%) | 531 (4.1%) |
| 5 or more Vehicles | 44 (0.4%) | 69 (0.5%) |
| Total | 12,358 (100.0%) | 12,812 (100.0%) |
Commute Time in Wauwatosa
The most frequently occuring commute durations in Wauwatosa are 20 to 24 minutes (4,803 commuters, 22.4%), 15 to 19 minutes (4,236 commuters, 19.8%), and 10 to 14 minutes (3,977 commuters, 18.6%).
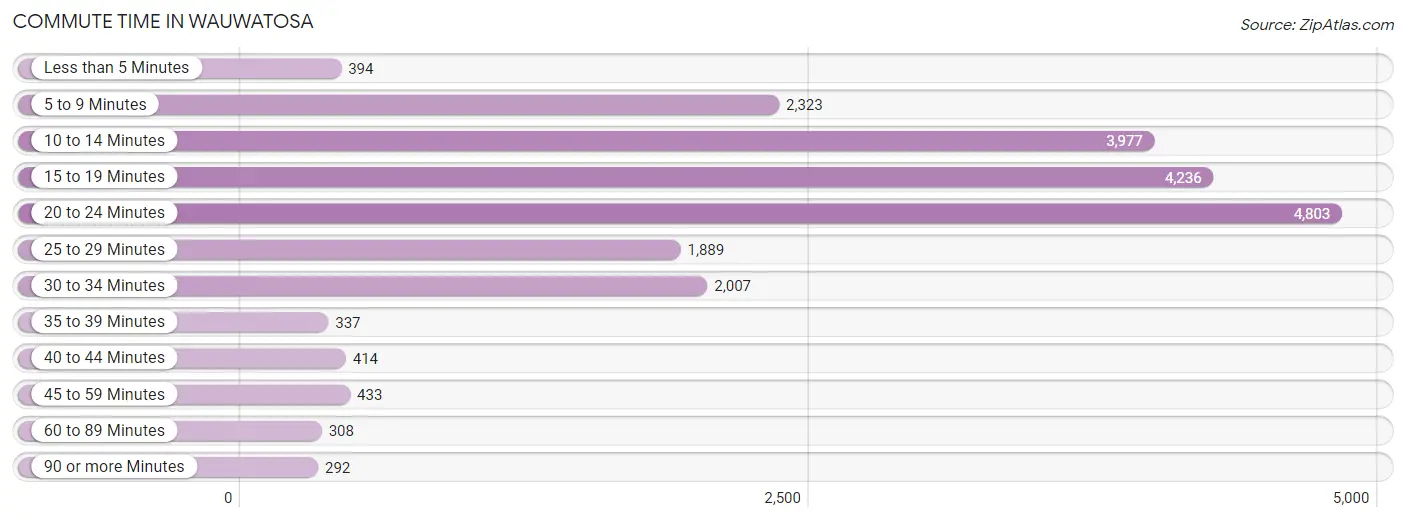
| Commute Time | # Commuters | % Commuters |
| Less than 5 Minutes | 394 | 1.8% |
| 5 to 9 Minutes | 2,323 | 10.8% |
| 10 to 14 Minutes | 3,977 | 18.6% |
| 15 to 19 Minutes | 4,236 | 19.8% |
| 20 to 24 Minutes | 4,803 | 22.4% |
| 25 to 29 Minutes | 1,889 | 8.8% |
| 30 to 34 Minutes | 2,007 | 9.4% |
| 35 to 39 Minutes | 337 | 1.6% |
| 40 to 44 Minutes | 414 | 1.9% |
| 45 to 59 Minutes | 433 | 2.0% |
| 60 to 89 Minutes | 308 | 1.4% |
| 90 or more Minutes | 292 | 1.4% |
Commute Time by Sex in Wauwatosa
The most common commute times in Wauwatosa are 20 to 24 minutes (2,569 commuters, 24.1%) for males and 20 to 24 minutes (2,234 commuters, 20.8%) for females.
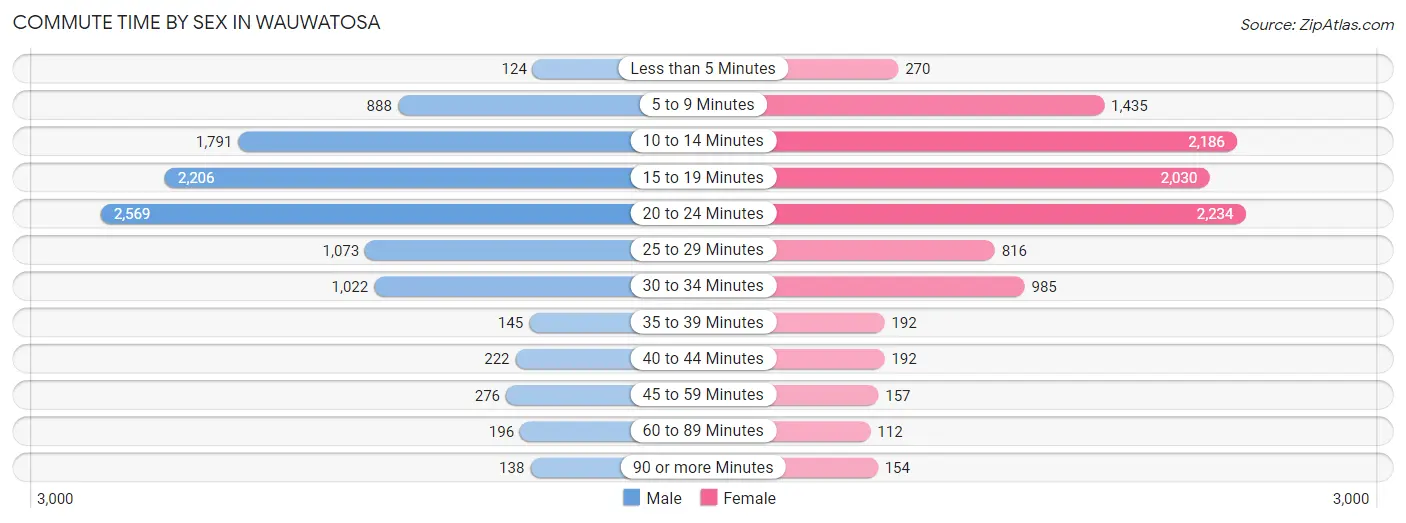
| Commute Time | Male | Female |
| Less than 5 Minutes | 124 (1.2%) | 270 (2.5%) |
| 5 to 9 Minutes | 888 (8.3%) | 1,435 (13.3%) |
| 10 to 14 Minutes | 1,791 (16.8%) | 2,186 (20.3%) |
| 15 to 19 Minutes | 2,206 (20.7%) | 2,030 (18.9%) |
| 20 to 24 Minutes | 2,569 (24.1%) | 2,234 (20.8%) |
| 25 to 29 Minutes | 1,073 (10.1%) | 816 (7.6%) |
| 30 to 34 Minutes | 1,022 (9.6%) | 985 (9.1%) |
| 35 to 39 Minutes | 145 (1.4%) | 192 (1.8%) |
| 40 to 44 Minutes | 222 (2.1%) | 192 (1.8%) |
| 45 to 59 Minutes | 276 (2.6%) | 157 (1.5%) |
| 60 to 89 Minutes | 196 (1.8%) | 112 (1.0%) |
| 90 or more Minutes | 138 (1.3%) | 154 (1.4%) |
Time of Departure to Work by Sex in Wauwatosa
The most frequent times of departure to work in Wauwatosa are 7:30 AM to 7:59 AM (1,644, 15.4%) for males and 7:30 AM to 7:59 AM (2,052, 19.1%) for females.
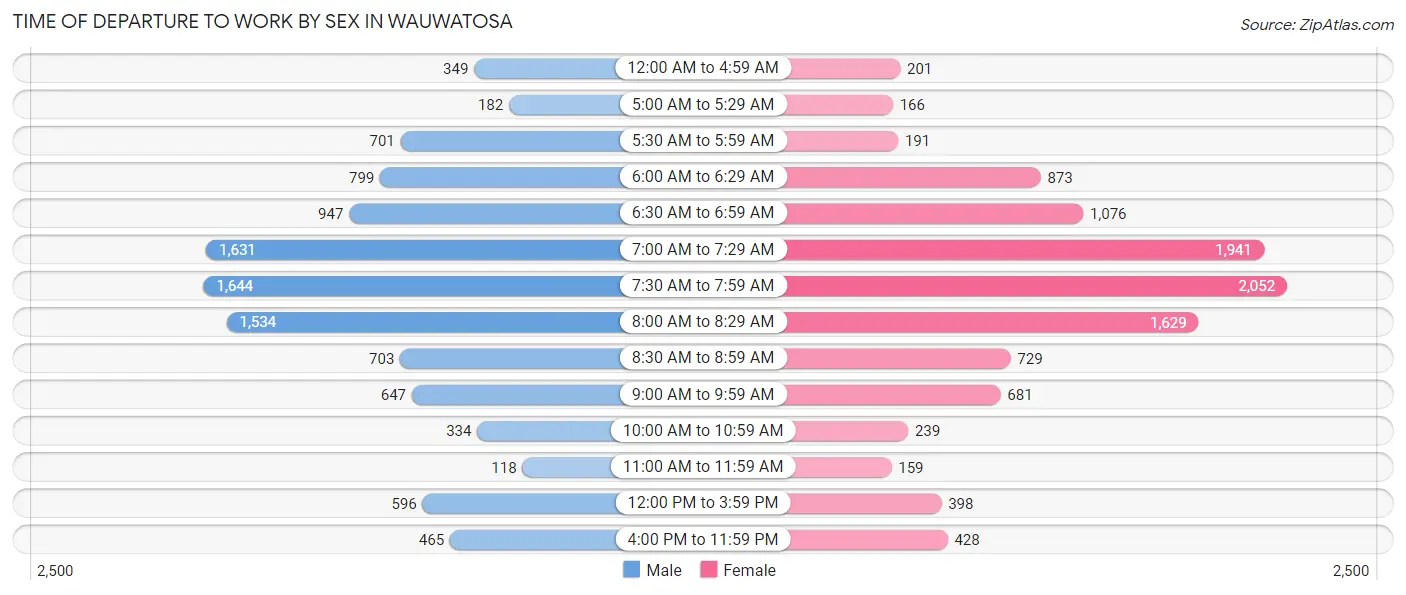
| Time of Departure | Male | Female |
| 12:00 AM to 4:59 AM | 349 (3.3%) | 201 (1.9%) |
| 5:00 AM to 5:29 AM | 182 (1.7%) | 166 (1.5%) |
| 5:30 AM to 5:59 AM | 701 (6.6%) | 191 (1.8%) |
| 6:00 AM to 6:29 AM | 799 (7.5%) | 873 (8.1%) |
| 6:30 AM to 6:59 AM | 947 (8.9%) | 1,076 (10.0%) |
| 7:00 AM to 7:29 AM | 1,631 (15.3%) | 1,941 (18.0%) |
| 7:30 AM to 7:59 AM | 1,644 (15.4%) | 2,052 (19.1%) |
| 8:00 AM to 8:29 AM | 1,534 (14.4%) | 1,629 (15.1%) |
| 8:30 AM to 8:59 AM | 703 (6.6%) | 729 (6.8%) |
| 9:00 AM to 9:59 AM | 647 (6.1%) | 681 (6.3%) |
| 10:00 AM to 10:59 AM | 334 (3.1%) | 239 (2.2%) |
| 11:00 AM to 11:59 AM | 118 (1.1%) | 159 (1.5%) |
| 12:00 PM to 3:59 PM | 596 (5.6%) | 398 (3.7%) |
| 4:00 PM to 11:59 PM | 465 (4.4%) | 428 (4.0%) |
| Total | 10,650 (100.0%) | 10,763 (100.0%) |
Housing Occupancy in Wauwatosa
Occupancy by Ownership in Wauwatosa
Of the total 21,263 dwellings in Wauwatosa, owner-occupied units account for 13,166 (61.9%), while renter-occupied units make up 8,097 (38.1%).
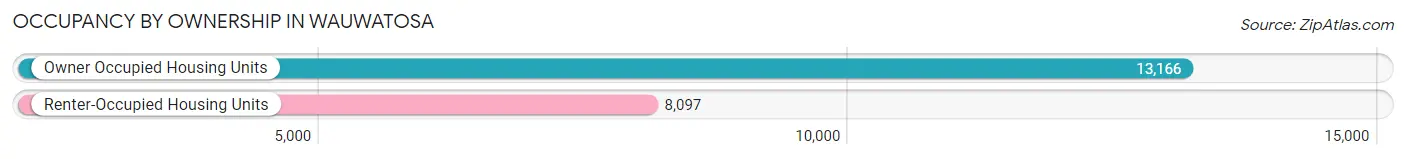
| Occupancy | # Housing Units | % Housing Units |
| Owner Occupied Housing Units | 13,166 | 61.9% |
| Renter-Occupied Housing Units | 8,097 | 38.1% |
| Total Occupied Housing Units | 21,263 | 100.0% |
Occupancy by Household Size in Wauwatosa
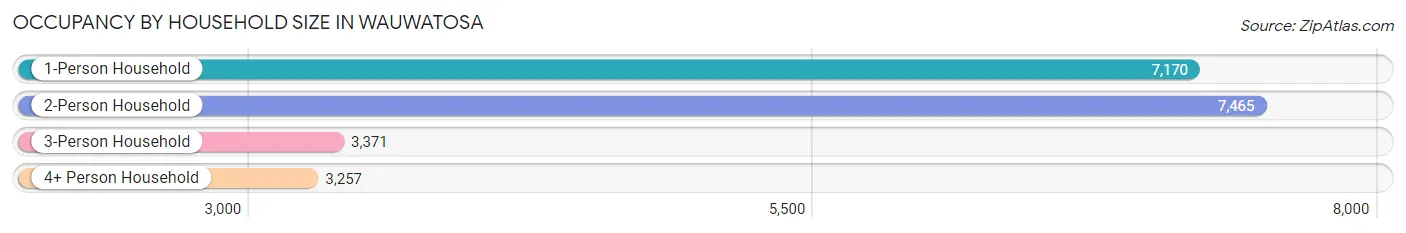
| Household Size | # Housing Units | % Housing Units |
| 1-Person Household | 7,170 | 33.7% |
| 2-Person Household | 7,465 | 35.1% |
| 3-Person Household | 3,371 | 15.9% |
| 4+ Person Household | 3,257 | 15.3% |
| Total Housing Units | 21,263 | 100.0% |
Occupancy by Ownership by Household Size in Wauwatosa
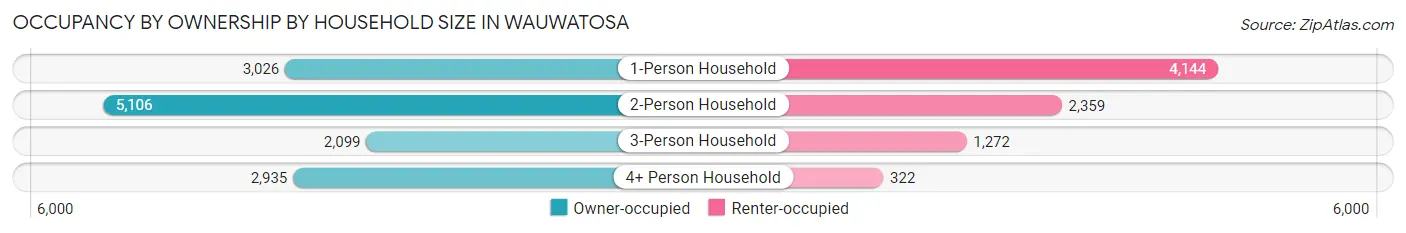
| Household Size | Owner-occupied | Renter-occupied |
| 1-Person Household | 3,026 (42.2%) | 4,144 (57.8%) |
| 2-Person Household | 5,106 (68.4%) | 2,359 (31.6%) |
| 3-Person Household | 2,099 (62.3%) | 1,272 (37.7%) |
| 4+ Person Household | 2,935 (90.1%) | 322 (9.9%) |
| Total Housing Units | 13,166 (61.9%) | 8,097 (38.1%) |
Occupancy by Educational Attainment in Wauwatosa
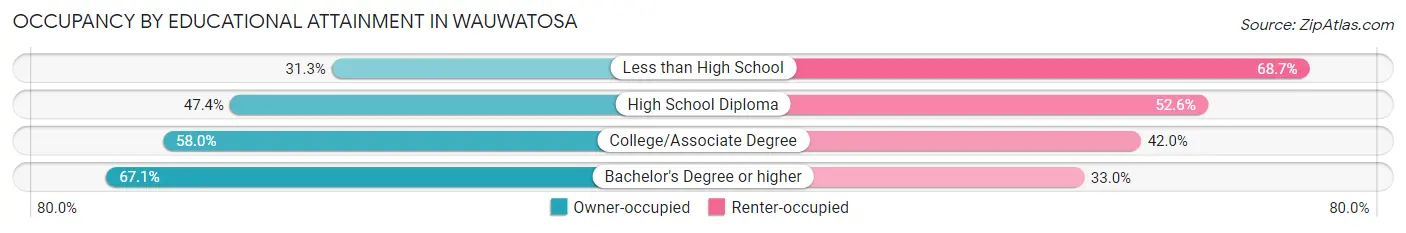
| Household Size | Owner-occupied | Renter-occupied |
| Less than High School | 72 (31.3%) | 158 (68.7%) |
| High School Diploma | 1,308 (47.4%) | 1,449 (52.6%) |
| College/Associate Degree | 3,013 (58.0%) | 2,178 (42.0%) |
| Bachelor's Degree or higher | 8,773 (67.0%) | 4,312 (33.0%) |
Occupancy by Age of Householder in Wauwatosa
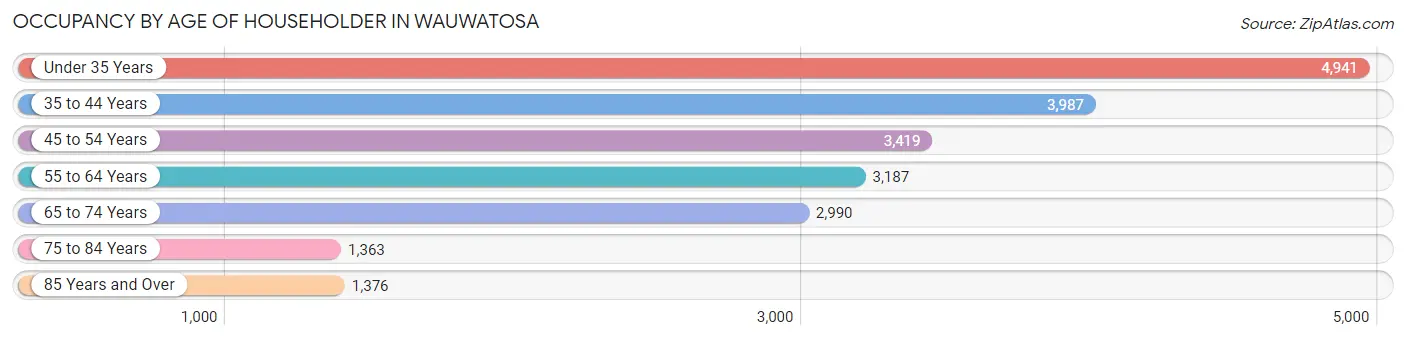
| Age Bracket | # Households | % Households |
| Under 35 Years | 4,941 | 23.2% |
| 35 to 44 Years | 3,987 | 18.8% |
| 45 to 54 Years | 3,419 | 16.1% |
| 55 to 64 Years | 3,187 | 15.0% |
| 65 to 74 Years | 2,990 | 14.1% |
| 75 to 84 Years | 1,363 | 6.4% |
| 85 Years and Over | 1,376 | 6.5% |
| Total | 21,263 | 100.0% |
Housing Finances in Wauwatosa
Median Income by Occupancy in Wauwatosa
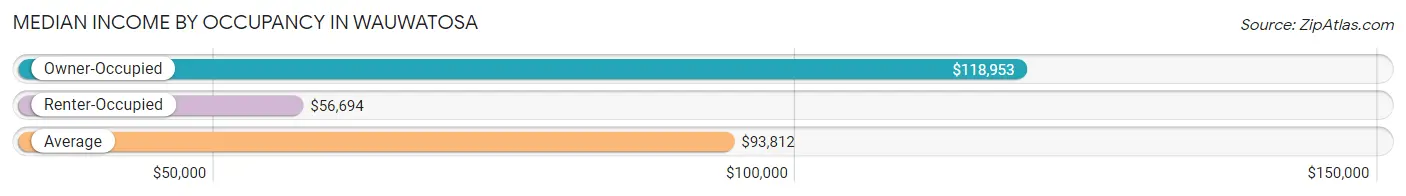
| Occupancy Type | # Households | Median Income |
| Owner-Occupied | 13,166 (61.9%) | $118,953 |
| Renter-Occupied | 8,097 (38.1%) | $56,694 |
| Average | 21,263 (100.0%) | $93,812 |
Occupancy by Householder Income Bracket in Wauwatosa
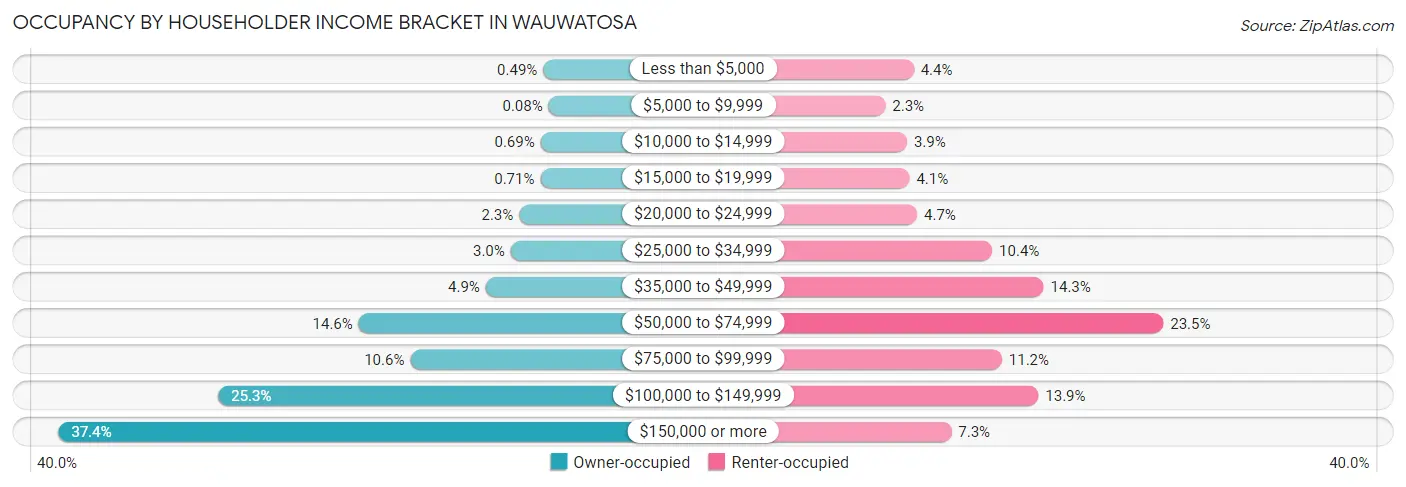
| Income Bracket | Owner-occupied | Renter-occupied |
| Less than $5,000 | 64 (0.5%) | 359 (4.4%) |
| $5,000 to $9,999 | 11 (0.1%) | 184 (2.3%) |
| $10,000 to $14,999 | 91 (0.7%) | 317 (3.9%) |
| $15,000 to $19,999 | 94 (0.7%) | 333 (4.1%) |
| $20,000 to $24,999 | 306 (2.3%) | 380 (4.7%) |
| $25,000 to $34,999 | 391 (3.0%) | 843 (10.4%) |
| $35,000 to $49,999 | 641 (4.9%) | 1,160 (14.3%) |
| $50,000 to $74,999 | 1,916 (14.5%) | 1,899 (23.4%) |
| $75,000 to $99,999 | 1,398 (10.6%) | 903 (11.2%) |
| $100,000 to $149,999 | 3,326 (25.3%) | 1,128 (13.9%) |
| $150,000 or more | 4,928 (37.4%) | 591 (7.3%) |
| Total | 13,166 (100.0%) | 8,097 (100.0%) |
Monthly Housing Cost Tiers in Wauwatosa
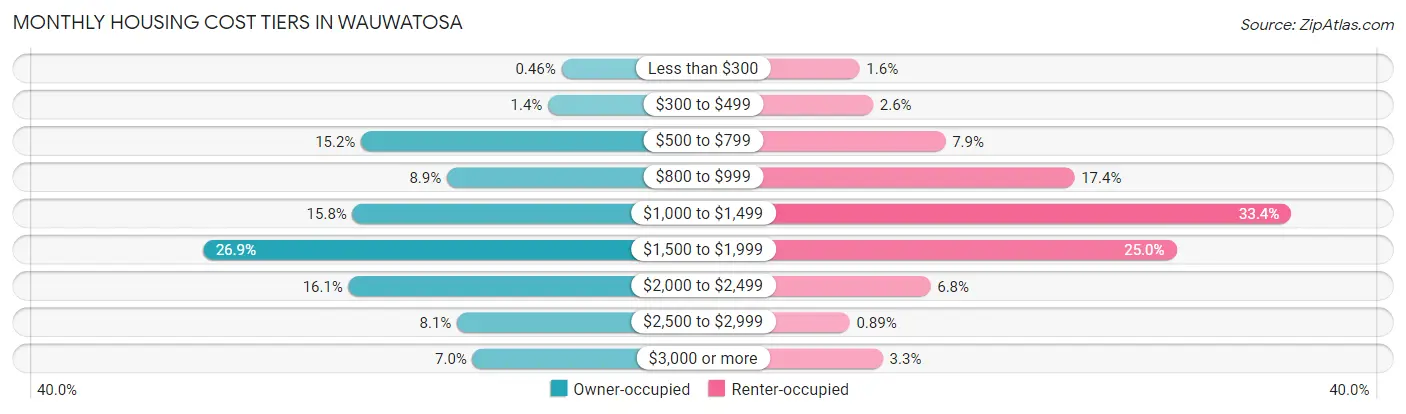
| Monthly Cost | Owner-occupied | Renter-occupied |
| Less than $300 | 61 (0.5%) | 131 (1.6%) |
| $300 to $499 | 190 (1.4%) | 211 (2.6%) |
| $500 to $799 | 2,002 (15.2%) | 643 (7.9%) |
| $800 to $999 | 1,171 (8.9%) | 1,412 (17.4%) |
| $1,000 to $1,499 | 2,086 (15.8%) | 2,705 (33.4%) |
| $1,500 to $1,999 | 3,539 (26.9%) | 2,021 (25.0%) |
| $2,000 to $2,499 | 2,124 (16.1%) | 554 (6.8%) |
| $2,500 to $2,999 | 1,072 (8.1%) | 72 (0.9%) |
| $3,000 or more | 921 (7.0%) | 270 (3.3%) |
| Total | 13,166 (100.0%) | 8,097 (100.0%) |
Physical Housing Characteristics in Wauwatosa
Housing Structures in Wauwatosa
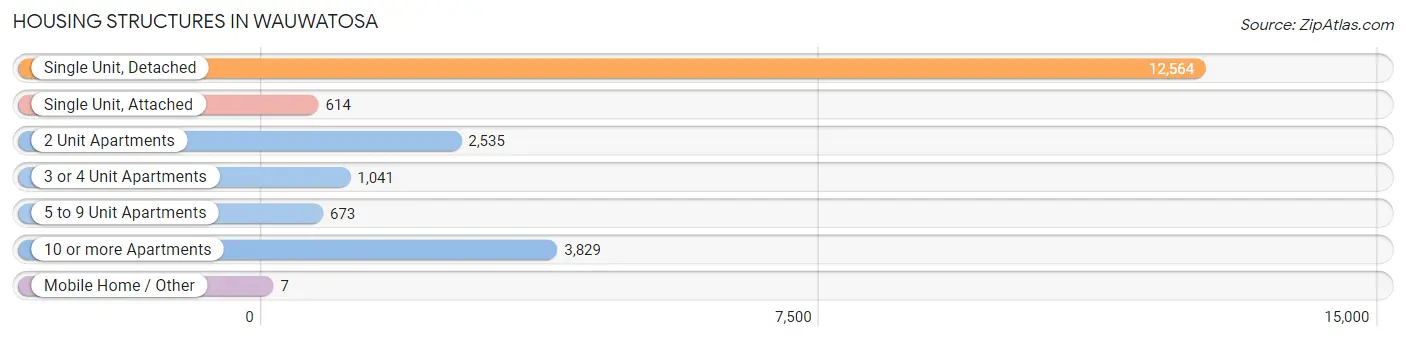
| Structure Type | # Housing Units | % Housing Units |
| Single Unit, Detached | 12,564 | 59.1% |
| Single Unit, Attached | 614 | 2.9% |
| 2 Unit Apartments | 2,535 | 11.9% |
| 3 or 4 Unit Apartments | 1,041 | 4.9% |
| 5 to 9 Unit Apartments | 673 | 3.2% |
| 10 or more Apartments | 3,829 | 18.0% |
| Mobile Home / Other | 7 | 0.0% |
| Total | 21,263 | 100.0% |
Housing Structures by Occupancy in Wauwatosa
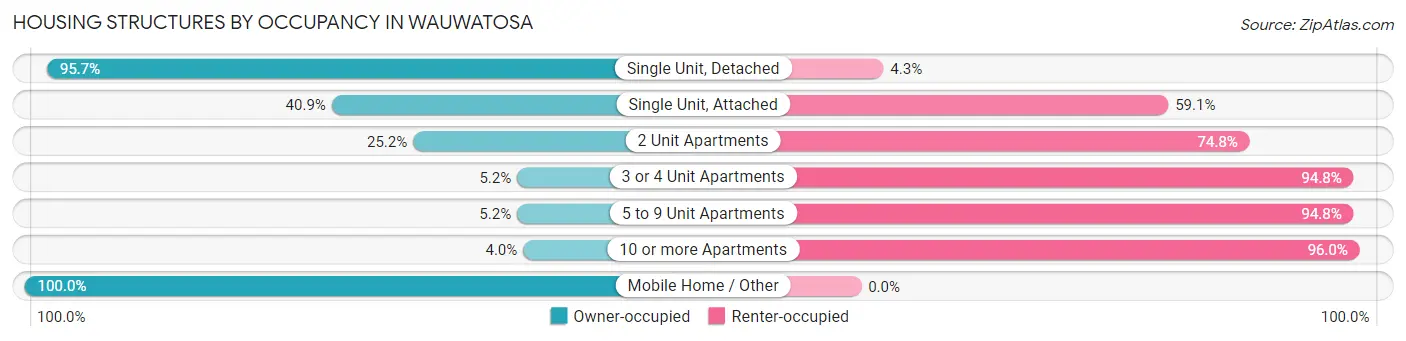
| Structure Type | Owner-occupied | Renter-occupied |
| Single Unit, Detached | 12,026 (95.7%) | 538 (4.3%) |
| Single Unit, Attached | 251 (40.9%) | 363 (59.1%) |
| 2 Unit Apartments | 639 (25.2%) | 1,896 (74.8%) |
| 3 or 4 Unit Apartments | 54 (5.2%) | 987 (94.8%) |
| 5 to 9 Unit Apartments | 35 (5.2%) | 638 (94.8%) |
| 10 or more Apartments | 154 (4.0%) | 3,675 (96.0%) |
| Mobile Home / Other | 7 (100.0%) | 0 (0.0%) |
| Total | 13,166 (61.9%) | 8,097 (38.1%) |
Housing Structures by Number of Rooms in Wauwatosa
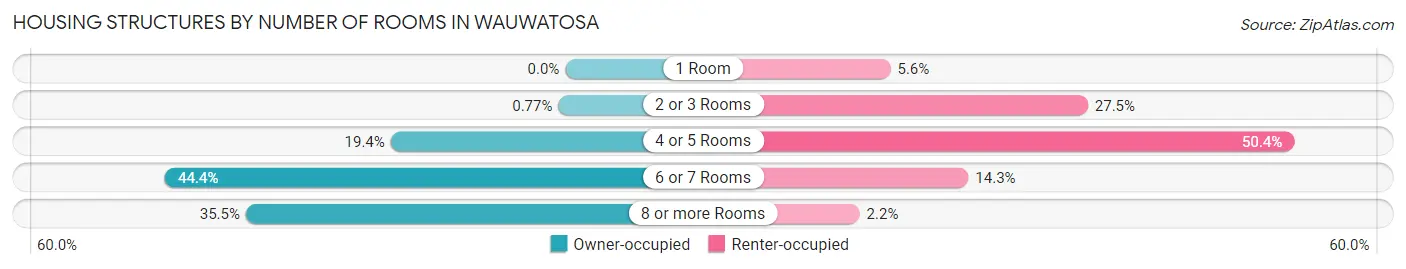
| Number of Rooms | Owner-occupied | Renter-occupied |
| 1 Room | 0 (0.0%) | 455 (5.6%) |
| 2 or 3 Rooms | 101 (0.8%) | 2,228 (27.5%) |
| 4 or 5 Rooms | 2,551 (19.4%) | 4,082 (50.4%) |
| 6 or 7 Rooms | 5,847 (44.4%) | 1,155 (14.3%) |
| 8 or more Rooms | 4,667 (35.4%) | 177 (2.2%) |
| Total | 13,166 (100.0%) | 8,097 (100.0%) |
Housing Structure by Heating Type in Wauwatosa
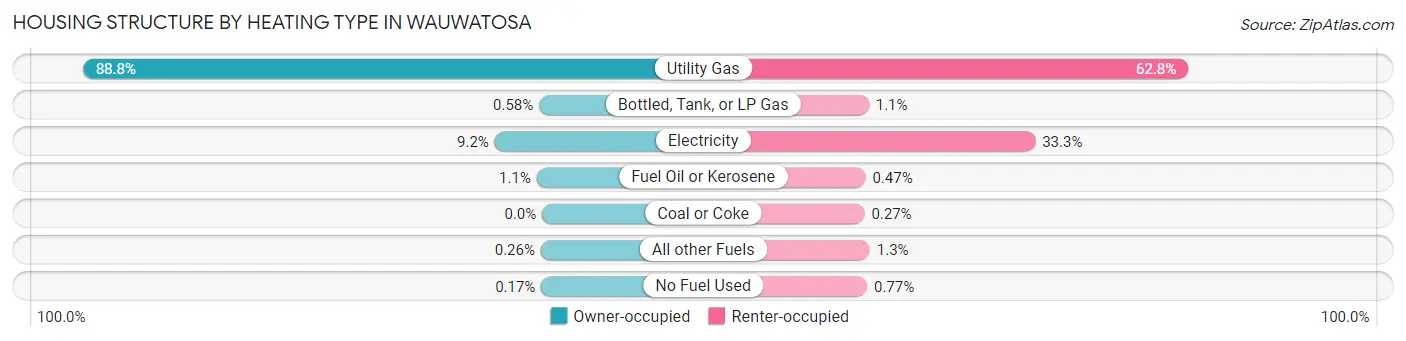
| Heating Type | Owner-occupied | Renter-occupied |
| Utility Gas | 11,688 (88.8%) | 5,084 (62.8%) |
| Bottled, Tank, or LP Gas | 76 (0.6%) | 90 (1.1%) |
| Electricity | 1,207 (9.2%) | 2,694 (33.3%) |
| Fuel Oil or Kerosene | 138 (1.1%) | 38 (0.5%) |
| Coal or Coke | 0 (0.0%) | 22 (0.3%) |
| All other Fuels | 34 (0.3%) | 107 (1.3%) |
| No Fuel Used | 23 (0.2%) | 62 (0.8%) |
| Total | 13,166 (100.0%) | 8,097 (100.0%) |
Household Vehicle Usage in Wauwatosa
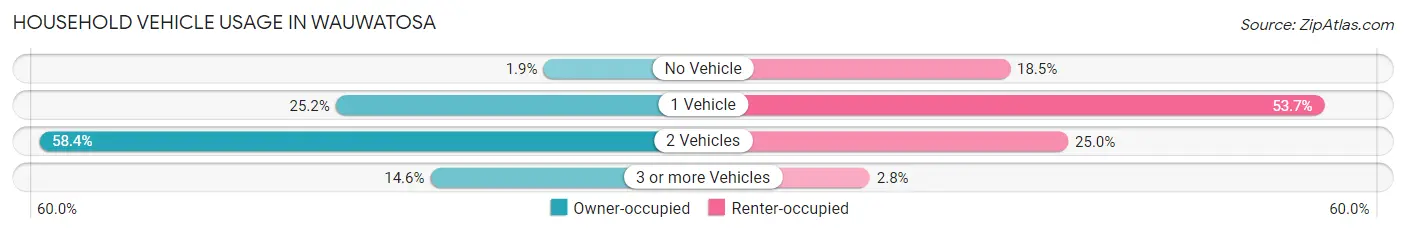
| Vehicles per Household | Owner-occupied | Renter-occupied |
| No Vehicle | 250 (1.9%) | 1,498 (18.5%) |
| 1 Vehicle | 3,314 (25.2%) | 4,349 (53.7%) |
| 2 Vehicles | 7,686 (58.4%) | 2,024 (25.0%) |
| 3 or more Vehicles | 1,916 (14.5%) | 226 (2.8%) |
| Total | 13,166 (100.0%) | 8,097 (100.0%) |
Real Estate & Mortgages in Wauwatosa
Real Estate and Mortgage Overview in Wauwatosa
| Characteristic | Without Mortgage | With Mortgage |
| Housing Units | 4,261 | 8,905 |
| Median Property Value | $278,000 | $297,100 |
| Median Household Income | $79,780 | $3,891 |
| Monthly Housing Costs | $788 | $921 |
| Real Estate Taxes | $5,489 | $101 |
Property Value by Mortgage Status in Wauwatosa
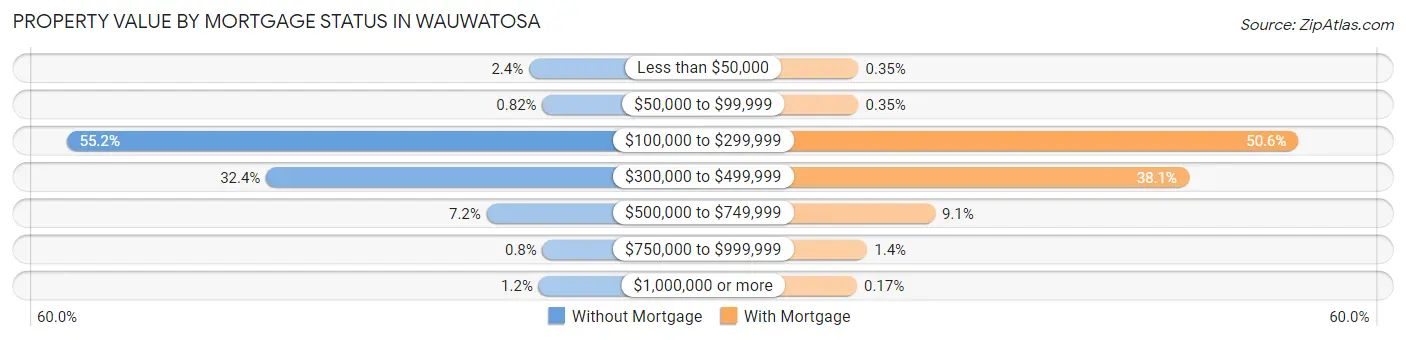
| Property Value | Without Mortgage | With Mortgage |
| Less than $50,000 | 100 (2.4%) | 31 (0.4%) |
| $50,000 to $99,999 | 35 (0.8%) | 31 (0.4%) |
| $100,000 to $299,999 | 2,352 (55.2%) | 4,506 (50.6%) |
| $300,000 to $499,999 | 1,380 (32.4%) | 3,393 (38.1%) |
| $500,000 to $749,999 | 307 (7.2%) | 809 (9.1%) |
| $750,000 to $999,999 | 34 (0.8%) | 120 (1.3%) |
| $1,000,000 or more | 53 (1.2%) | 15 (0.2%) |
| Total | 4,261 (100.0%) | 8,905 (100.0%) |
Household Income by Mortgage Status in Wauwatosa
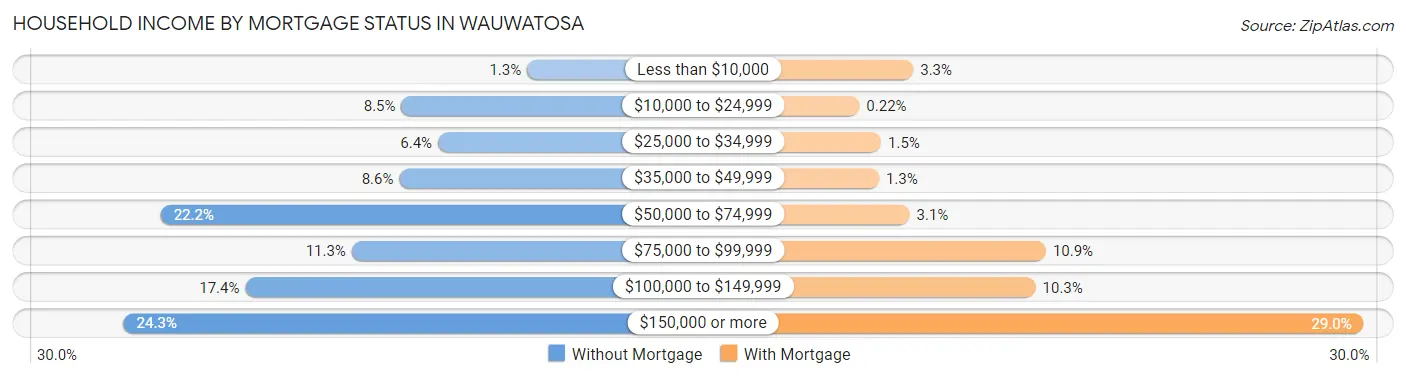
| Household Income | Without Mortgage | With Mortgage |
| Less than $10,000 | 55 (1.3%) | 294 (3.3%) |
| $10,000 to $24,999 | 361 (8.5%) | 20 (0.2%) |
| $25,000 to $34,999 | 272 (6.4%) | 130 (1.5%) |
| $35,000 to $49,999 | 366 (8.6%) | 119 (1.3%) |
| $50,000 to $74,999 | 947 (22.2%) | 275 (3.1%) |
| $75,000 to $99,999 | 482 (11.3%) | 969 (10.9%) |
| $100,000 to $149,999 | 741 (17.4%) | 916 (10.3%) |
| $150,000 or more | 1,037 (24.3%) | 2,585 (29.0%) |
| Total | 4,261 (100.0%) | 8,905 (100.0%) |
Property Value to Household Income Ratio in Wauwatosa
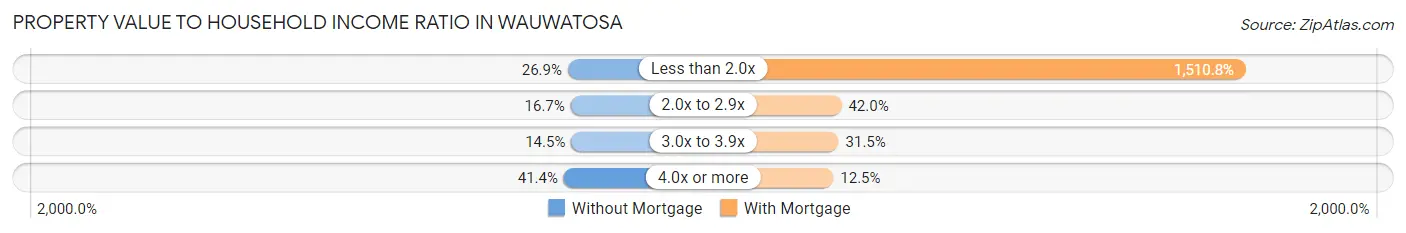
| Value-to-Income Ratio | Without Mortgage | With Mortgage |
| Less than 2.0x | 1,147 (26.9%) | 134,533 (1,510.8%) |
| 2.0x to 2.9x | 711 (16.7%) | 3,743 (42.0%) |
| 3.0x to 3.9x | 619 (14.5%) | 2,808 (31.5%) |
| 4.0x or more | 1,763 (41.4%) | 1,114 (12.5%) |
| Total | 4,261 (100.0%) | 8,905 (100.0%) |
Real Estate Taxes by Mortgage Status in Wauwatosa
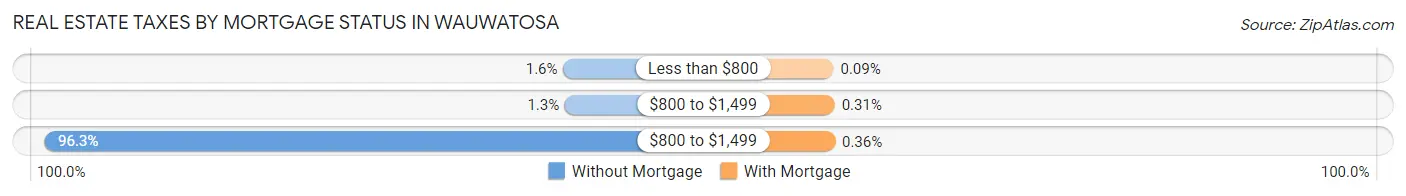
| Property Taxes | Without Mortgage | With Mortgage |
| Less than $800 | 68 (1.6%) | 8 (0.1%) |
| $800 to $1,499 | 55 (1.3%) | 28 (0.3%) |
| $800 to $1,499 | 4,101 (96.3%) | 32 (0.4%) |
| Total | 4,261 (100.0%) | 8,905 (100.0%) |
Health & Disability in Wauwatosa
Health Insurance Coverage by Age in Wauwatosa
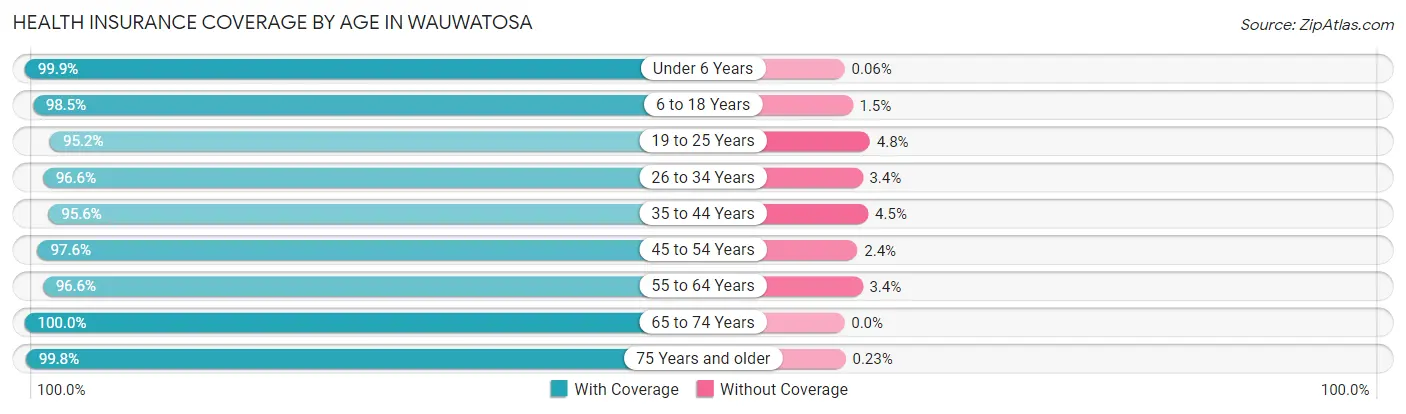
| Age Bracket | With Coverage | Without Coverage |
| Under 6 Years | 3,370 (99.9%) | 2 (0.1%) |
| 6 to 18 Years | 7,632 (98.5%) | 119 (1.5%) |
| 19 to 25 Years | 2,924 (95.2%) | 146 (4.8%) |
| 26 to 34 Years | 7,134 (96.6%) | 250 (3.4%) |
| 35 to 44 Years | 6,448 (95.6%) | 300 (4.4%) |
| 45 to 54 Years | 5,525 (97.6%) | 138 (2.4%) |
| 55 to 64 Years | 5,235 (96.6%) | 183 (3.4%) |
| 65 to 74 Years | 4,431 (100.0%) | 0 (0.0%) |
| 75 Years and older | 3,546 (99.8%) | 8 (0.2%) |
| Total | 46,245 (97.6%) | 1,146 (2.4%) |
Health Insurance Coverage by Citizenship Status in Wauwatosa
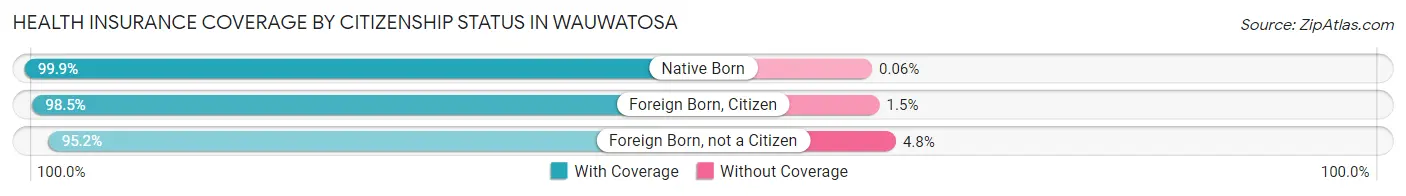
| Citizenship Status | With Coverage | Without Coverage |
| Native Born | 3,370 (99.9%) | 2 (0.1%) |
| Foreign Born, Citizen | 7,632 (98.5%) | 119 (1.5%) |
| Foreign Born, not a Citizen | 2,924 (95.2%) | 146 (4.8%) |
Health Insurance Coverage by Household Income in Wauwatosa
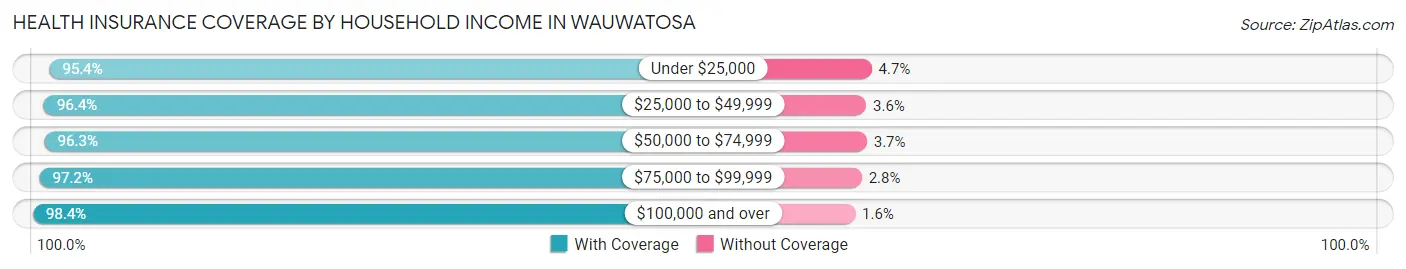
| Household Income | With Coverage | Without Coverage |
| Under $25,000 | 2,766 (95.4%) | 135 (4.6%) |
| $25,000 to $49,999 | 4,311 (96.4%) | 162 (3.6%) |
| $50,000 to $74,999 | 6,941 (96.3%) | 270 (3.7%) |
| $75,000 to $99,999 | 4,865 (97.2%) | 140 (2.8%) |
| $100,000 and over | 27,130 (98.4%) | 430 (1.6%) |
Public vs Private Health Insurance Coverage by Age in Wauwatosa
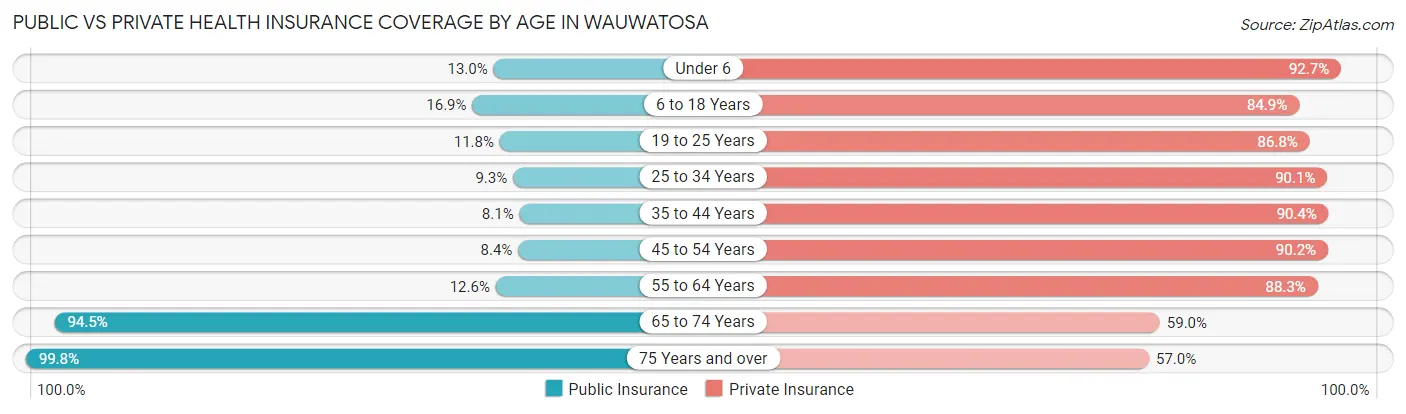
| Age Bracket | Public Insurance | Private Insurance |
| Under 6 | 437 (13.0%) | 3,124 (92.6%) |
| 6 to 18 Years | 1,309 (16.9%) | 6,578 (84.9%) |
| 19 to 25 Years | 362 (11.8%) | 2,666 (86.8%) |
| 25 to 34 Years | 690 (9.3%) | 6,653 (90.1%) |
| 35 to 44 Years | 549 (8.1%) | 6,098 (90.4%) |
| 45 to 54 Years | 475 (8.4%) | 5,109 (90.2%) |
| 55 to 64 Years | 680 (12.6%) | 4,785 (88.3%) |
| 65 to 74 Years | 4,185 (94.5%) | 2,616 (59.0%) |
| 75 Years and over | 3,546 (99.8%) | 2,027 (57.0%) |
| Total | 12,233 (25.8%) | 39,656 (83.7%) |
Disability Status by Sex by Age in Wauwatosa
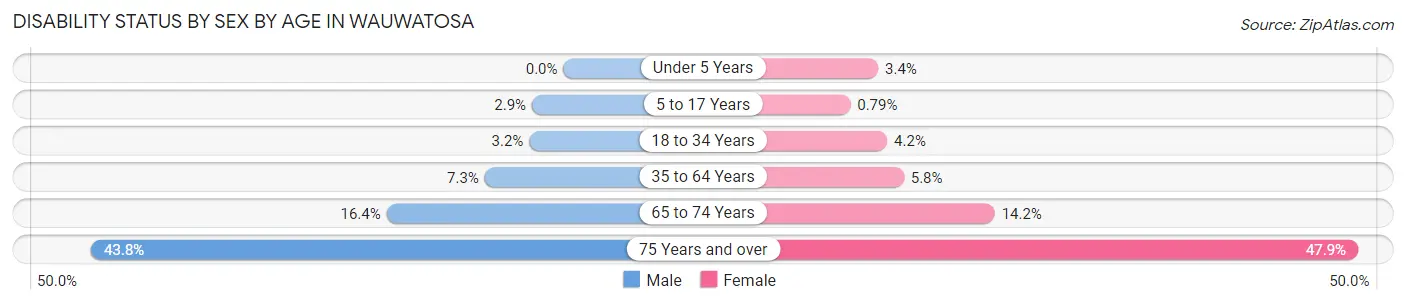
| Age Bracket | Male | Female |
| Under 5 Years | 0 (0.0%) | 50 (3.4%) |
| 5 to 17 Years | 117 (2.9%) | 29 (0.8%) |
| 18 to 34 Years | 162 (3.2%) | 249 (4.2%) |
| 35 to 64 Years | 635 (7.3%) | 525 (5.8%) |
| 65 to 74 Years | 342 (16.4%) | 333 (14.2%) |
| 75 Years and over | 566 (43.8%) | 1,084 (47.9%) |
Disability Class by Sex by Age in Wauwatosa
Disability Class: Hearing Difficulty
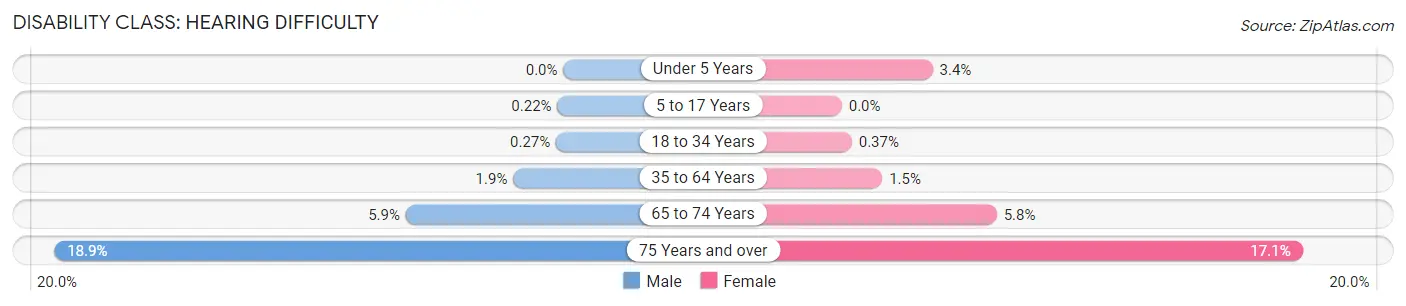
| Age Bracket | Male | Female |
| Under 5 Years | 0 (0.0%) | 50 (3.4%) |
| 5 to 17 Years | 9 (0.2%) | 0 (0.0%) |
| 18 to 34 Years | 14 (0.3%) | 22 (0.4%) |
| 35 to 64 Years | 162 (1.9%) | 137 (1.5%) |
| 65 to 74 Years | 122 (5.9%) | 135 (5.8%) |
| 75 Years and over | 244 (18.9%) | 387 (17.1%) |
Disability Class: Vision Difficulty
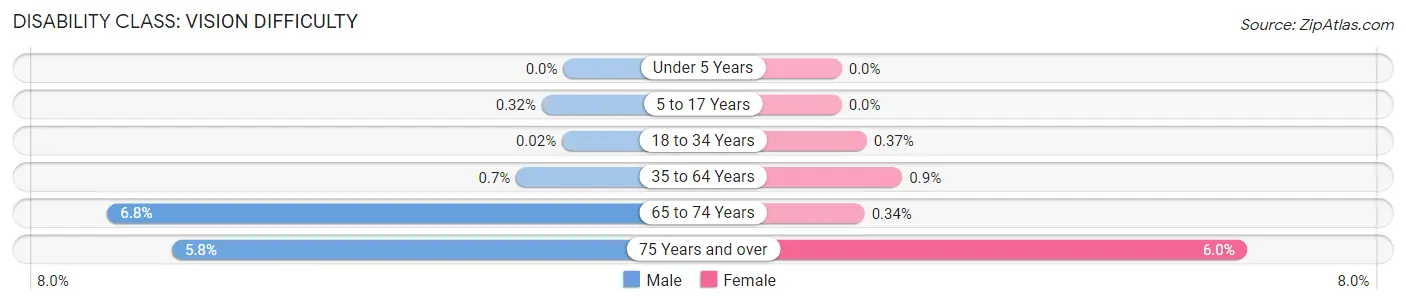
| Age Bracket | Male | Female |
| Under 5 Years | 0 (0.0%) | 0 (0.0%) |
| 5 to 17 Years | 13 (0.3%) | 0 (0.0%) |
| 18 to 34 Years | 1 (0.0%) | 22 (0.4%) |
| 35 to 64 Years | 61 (0.7%) | 82 (0.9%) |
| 65 to 74 Years | 141 (6.8%) | 8 (0.3%) |
| 75 Years and over | 75 (5.8%) | 136 (6.0%) |
Disability Class: Cognitive Difficulty
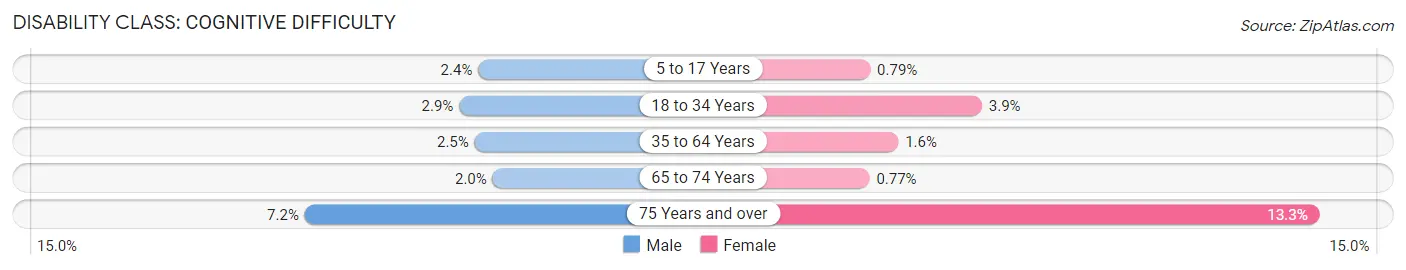
| Age Bracket | Male | Female |
| 5 to 17 Years | 95 (2.4%) | 29 (0.8%) |
| 18 to 34 Years | 148 (2.9%) | 231 (3.9%) |
| 35 to 64 Years | 215 (2.5%) | 143 (1.6%) |
| 65 to 74 Years | 41 (2.0%) | 18 (0.8%) |
| 75 Years and over | 93 (7.2%) | 301 (13.3%) |
Disability Class: Ambulatory Difficulty
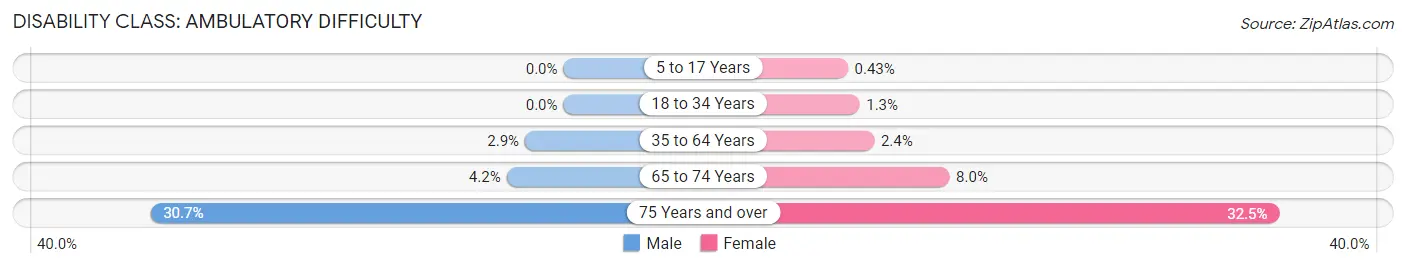
| Age Bracket | Male | Female |
| 5 to 17 Years | 0 (0.0%) | 16 (0.4%) |
| 18 to 34 Years | 0 (0.0%) | 77 (1.3%) |
| 35 to 64 Years | 248 (2.9%) | 218 (2.4%) |
| 65 to 74 Years | 88 (4.2%) | 187 (8.0%) |
| 75 Years and over | 396 (30.7%) | 735 (32.5%) |
Disability Class: Self-Care Difficulty
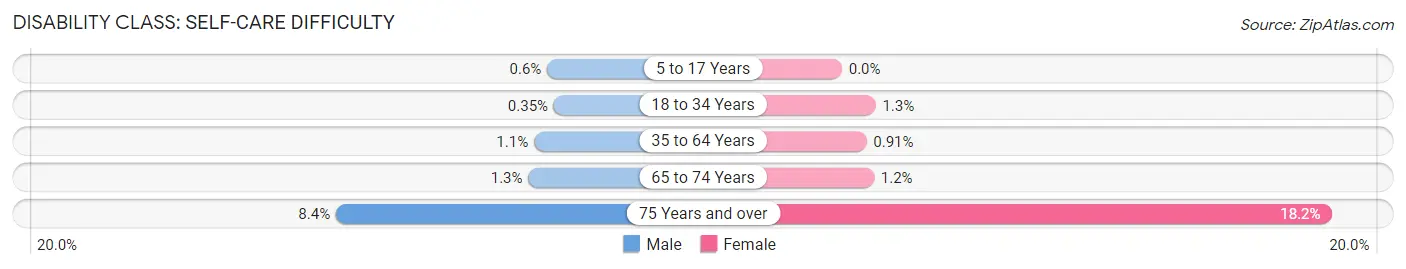
| Age Bracket | Male | Female |
| 5 to 17 Years | 24 (0.6%) | 0 (0.0%) |
| 18 to 34 Years | 18 (0.4%) | 74 (1.3%) |
| 35 to 64 Years | 95 (1.1%) | 83 (0.9%) |
| 65 to 74 Years | 27 (1.3%) | 28 (1.2%) |
| 75 Years and over | 109 (8.4%) | 412 (18.2%) |
Technology Access in Wauwatosa
Computing Device Access in Wauwatosa
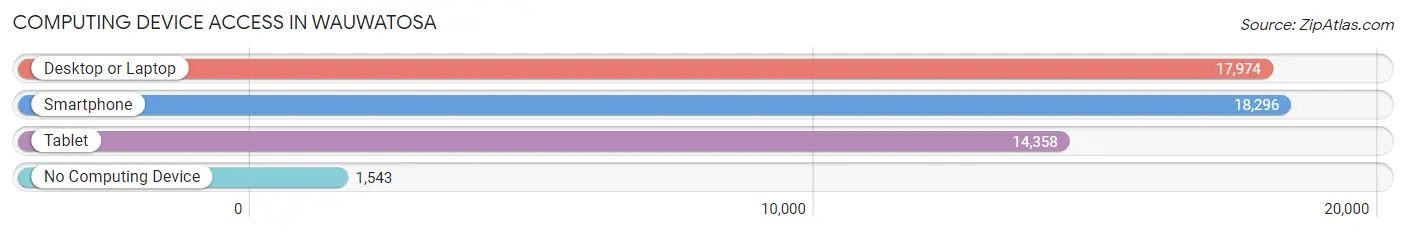
| Device Type | # Households | % Households |
| Desktop or Laptop | 17,974 | 84.5% |
| Smartphone | 18,296 | 86.1% |
| Tablet | 14,358 | 67.5% |
| No Computing Device | 1,543 | 7.3% |
| Total | 21,263 | 100.0% |
Internet Access in Wauwatosa
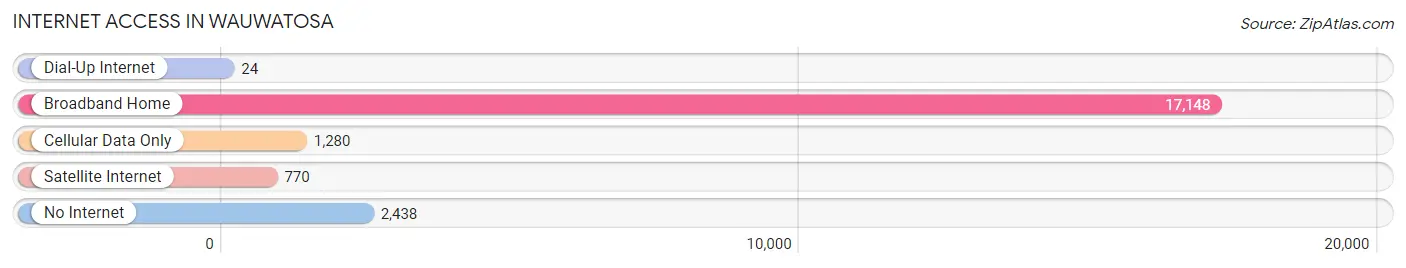
| Internet Type | # Households | % Households |
| Dial-Up Internet | 24 | 0.1% |
| Broadband Home | 17,148 | 80.6% |
| Cellular Data Only | 1,280 | 6.0% |
| Satellite Internet | 770 | 3.6% |
| No Internet | 2,438 | 11.5% |
| Total | 21,263 | 100.0% |
Wauwatosa Summary
Wauwatosa, Wisconsin is a city located in Milwaukee County, Wisconsin, United States. It is a suburb of Milwaukee and is located approximately 6 miles west of downtown Milwaukee. As of the 2010 census, the city had a population of 46,396.
History
The area that is now Wauwatosa was originally inhabited by the Potawatomi people. The first known white settler in the area was Solomon Juneau, who arrived in 1835. The area was originally known as "Hoyt's Woods" and was later renamed "Wau-wau-too-sa" after the Potawatomi word for "firefly". The city was officially incorporated in 1892.
In the early 20th century, Wauwatosa was a popular destination for wealthy Milwaukeeans who wanted to escape the city and enjoy the rural atmosphere. The city was home to several large estates, including the Charles Allis estate, which is now the Charles Allis Art Museum.
Geography
Wauwatosa is located at 43°04′N 88°02′W (43.07, -88.03). According to the United States Census Bureau, the city has a total area of 10.7 square miles (27.7 km2), of which 10.6 square miles (27.5 km2) is land and 0.1 square miles (0.2 km2) is water.
The city is located on the Menomonee River, which flows through the city from east to west. The city is bordered by the cities of Brookfield to the north, West Allis to the east, Milwaukee to the southeast, and West Milwaukee to the south.
Economy
Wauwatosa is home to several large employers, including the medical device manufacturer GE Healthcare, the medical technology company Epic Systems, and the medical research firm Froedtert & the Medical College of Wisconsin. The city is also home to several retail and restaurant chains, including Target, Kohl's, and Applebee's.
Demographics
As of the 2010 census, there were 46,396 people, 20,717 households, and 11,845 families residing in the city. The population density was 4,346.2 people per square mile (1,675.7/km2). There were 21,845 housing units at an average density of 2,053.2 per square mile (792.2/km2). The racial makeup of the city was 84.2% White, 8.3% African American, 0.3% Native American, 4.3% Asian, 0.1% Pacific Islander, 1.2% from other races, and 1.6% from two or more races. Hispanic or Latino of any race were 4.2% of the population.
There were 20,717 households, out of which 25.2% had children under the age of 18 living with them, 43.2% were married couples living together, 10.2% had a female householder with no husband present, and 42.7% were non-families. 34.3% of all households were made up of individuals, and 10.2% had someone living alone who was 65 years of age or older. The average household size was 2.22 and the average family size was 2.90.
In the city, the population was spread out, with 21.2% under the age of 18, 8.2% from 18 to 24, 30.2% from 25 to 44, 25.2% from 45 to 64, and 15.2% who were 65 years of age or older. The median age was 38 years. For every 100 females, there were 91.2 males. For every 100 females age 18 and over, there were 88.2 males.
The median income for a household in the city was $54,890, and the median income for a family was $71,890. Males had a median income of $48,890 versus $37,890 for females. The per capita income for the city was $31,890. About 4.2% of families and 6.7% of the population were below the poverty line, including 8.2% of those under age 18 and 5.2% of those age 65 or over.
Common Questions
What is Per Capita Income in Wauwatosa?
Per Capita income in Wauwatosa is $53,803.
What is the Median Family Income in Wauwatosa?
Median Family Income in Wauwatosa is $123,118.
What is the Median Household income in Wauwatosa?
Median Household Income in Wauwatosa is $93,812.
What is Income or Wage Gap in Wauwatosa?
Income or Wage Gap in Wauwatosa is 22.9%.
Women in Wauwatosa earn 77.1 cents for every dollar earned by a man.
What is Inequality or Gini Index in Wauwatosa?
Inequality or Gini Index in Wauwatosa is 0.44.
What is the Total Population of Wauwatosa?
Total Population of Wauwatosa is 47,919.
What is the Total Male Population of Wauwatosa?
Total Male Population of Wauwatosa is 22,729.
What is the Total Female Population of Wauwatosa?
Total Female Population of Wauwatosa is 25,190.
What is the Ratio of Males per 100 Females in Wauwatosa?
There are 90.23 Males per 100 Females in Wauwatosa.
What is the Ratio of Females per 100 Males in Wauwatosa?
There are 110.83 Females per 100 Males in Wauwatosa.
What is the Median Population Age in Wauwatosa?
Median Population Age in Wauwatosa is 38.4 Years.
What is the Average Family Size in Wauwatosa
Average Family Size in Wauwatosa is 2.9 People.
What is the Average Household Size in Wauwatosa
Average Household Size in Wauwatosa is 2.2 People.
How Large is the Labor Force in Wauwatosa?
There are 26,012 People in the Labor Forcein in Wauwatosa.
What is the Percentage of People in the Labor Force in Wauwatosa?
67.2% of People are in the Labor Force in Wauwatosa.
What is the Unemployment Rate in Wauwatosa?
Unemployment Rate in Wauwatosa is 2.2%.