Richmond County, NY Map & Demographics
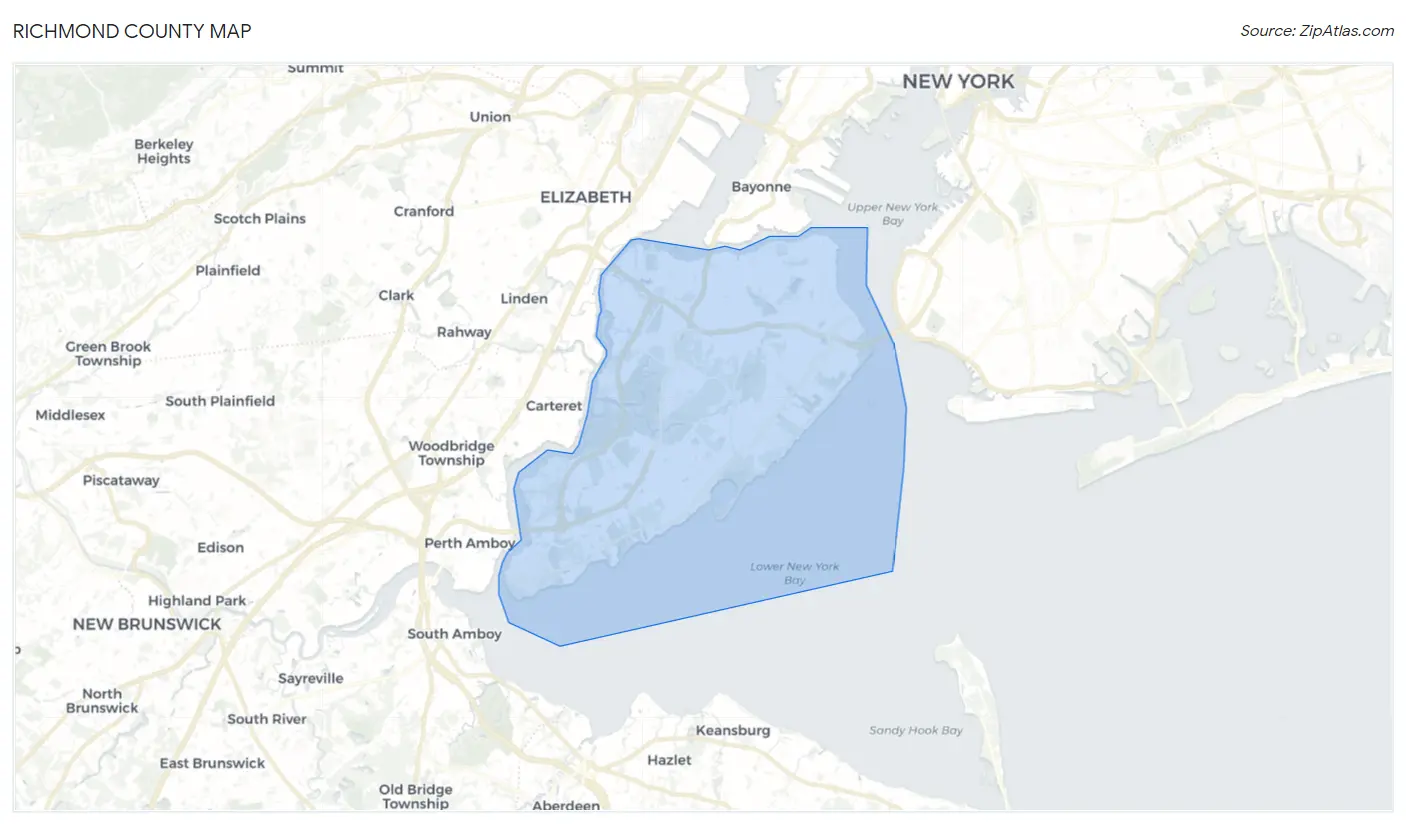
Richmond County Map
Richmond County Overview
$43,199
PER CAPITA INCOME
$116,052
AVG FAMILY INCOME
$96,185
AVG HOUSEHOLD INCOME
21.4%
WAGE / INCOME GAP [ % ]
78.6¢/ $1
WAGE / INCOME GAP [ $ ]
$12,231
FAMILY INCOME DEFICIT
0.45
INEQUALITY / GINI INDEX
492,925
TOTAL POPULATION
241,783
MALE POPULATION
251,142
FEMALE POPULATION
96.27
MALES / 100 FEMALES
103.87
FEMALES / 100 MALES
40.3
MEDIAN AGE
3.4
AVG FAMILY SIZE
2.9
AVG HOUSEHOLD SIZE
239,566
LABOR FORCE [ PEOPLE ]
60.0%
PERCENT IN LABOR FORCE
5.4%
UNEMPLOYMENT RATE
Income in Richmond County
Income Overview in Richmond County
Per Capita Income in Richmond County is $43,199, while median incomes of families and households are $116,052 and $96,185 respectively.
| Characteristic | Number | Measure |
| Per Capita Income | 492,925 | $43,199 |
| Median Family Income | 123,671 | $116,052 |
| Mean Family Income | 123,671 | $139,867 |
| Median Household Income | 170,000 | $96,185 |
| Mean Household Income | 170,000 | $122,431 |
| Income Deficit | 123,671 | $12,231 |
| Wage / Income Gap (%) | 492,925 | 21.36% |
| Wage / Income Gap ($) | 492,925 | 78.64¢ per $1 |
| Gini / Inequality Index | 492,925 | 0.45 |
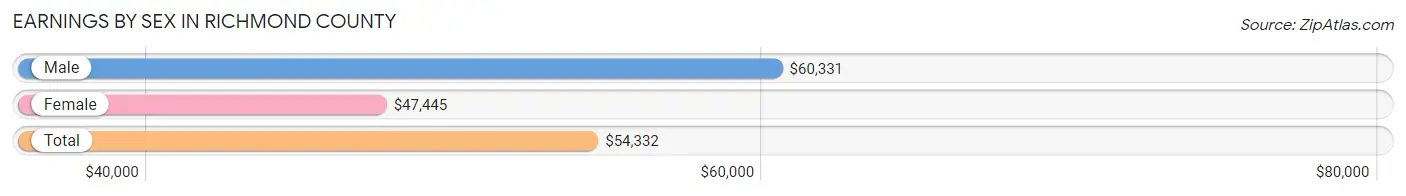
Earnings by Sex in Richmond County
Average Earnings in Richmond County are $54,332, $60,331 for men and $47,445 for women, a difference of 21.4%.
| Sex | Number | Average Earnings |
| Male | 129,130 (52.8%) | $60,331 |
| Female | 115,342 (47.2%) | $47,445 |
| Total | 244,472 (100.0%) | $54,332 |
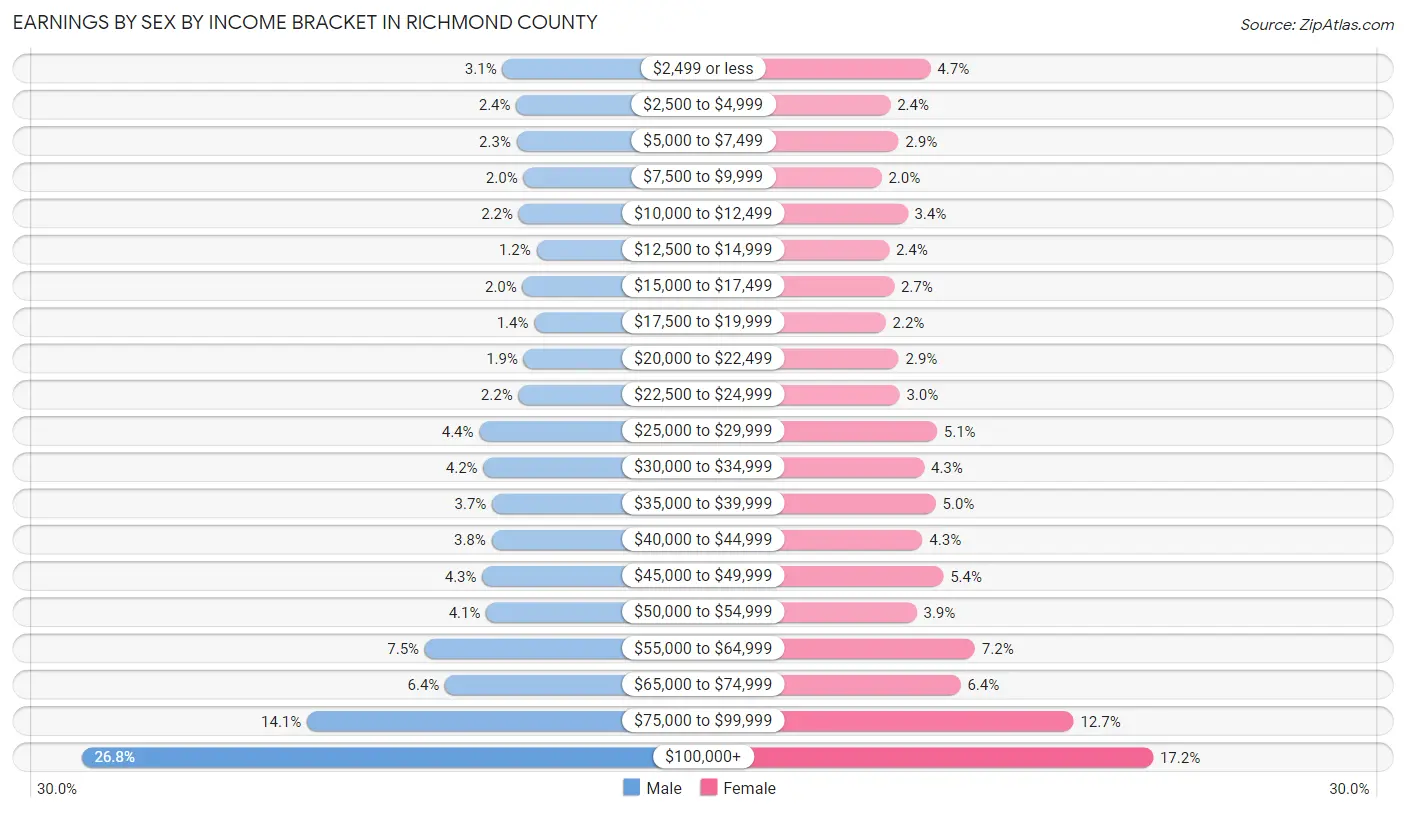
Earnings by Sex by Income Bracket in Richmond County
The most common earnings brackets in Richmond County are $100,000+ for men (34,601 | 26.8%) and $100,000+ for women (19,850 | 17.2%).
| Income | Male | Female |
| $2,499 or less | 4,049 (3.1%) | 5,426 (4.7%) |
| $2,500 to $4,999 | 3,051 (2.4%) | 2,814 (2.4%) |
| $5,000 to $7,499 | 3,025 (2.3%) | 3,344 (2.9%) |
| $7,500 to $9,999 | 2,534 (2.0%) | 2,251 (1.9%) |
| $10,000 to $12,499 | 2,873 (2.2%) | 3,929 (3.4%) |
| $12,500 to $14,999 | 1,570 (1.2%) | 2,736 (2.4%) |
| $15,000 to $17,499 | 2,596 (2.0%) | 3,058 (2.6%) |
| $17,500 to $19,999 | 1,738 (1.3%) | 2,517 (2.2%) |
| $20,000 to $22,499 | 2,502 (1.9%) | 3,356 (2.9%) |
| $22,500 to $24,999 | 2,890 (2.2%) | 3,416 (3.0%) |
| $25,000 to $29,999 | 5,728 (4.4%) | 5,839 (5.1%) |
| $30,000 to $34,999 | 5,437 (4.2%) | 5,001 (4.3%) |
| $35,000 to $39,999 | 4,808 (3.7%) | 5,761 (5.0%) |
| $40,000 to $44,999 | 4,841 (3.7%) | 4,899 (4.3%) |
| $45,000 to $49,999 | 5,520 (4.3%) | 6,256 (5.4%) |
| $50,000 to $54,999 | 5,230 (4.1%) | 4,516 (3.9%) |
| $55,000 to $64,999 | 9,685 (7.5%) | 8,309 (7.2%) |
| $65,000 to $74,999 | 8,217 (6.4%) | 7,371 (6.4%) |
| $75,000 to $99,999 | 18,235 (14.1%) | 14,693 (12.7%) |
| $100,000+ | 34,601 (26.8%) | 19,850 (17.2%) |
| Total | 129,130 (100.0%) | 115,342 (100.0%) |
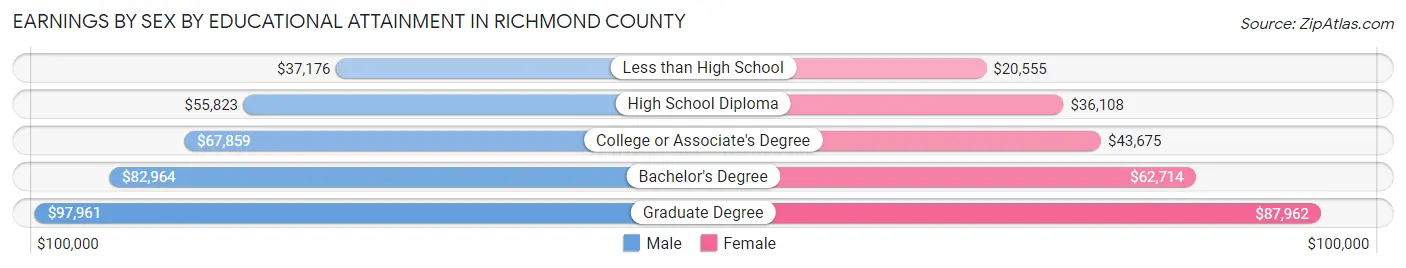
Earnings by Sex by Educational Attainment in Richmond County
Average earnings in Richmond County are $67,908 for men and $52,466 for women, a difference of 22.7%. Men with an educational attainment of graduate degree enjoy the highest average annual earnings of $97,961, while those with less than high school education earn the least with $37,176. Women with an educational attainment of graduate degree earn the most with the average annual earnings of $87,962, while those with less than high school education have the smallest earnings of $20,555.
| Educational Attainment | Male Income | Female Income |
| Less than High School | $37,176 | $20,555 |
| High School Diploma | $55,823 | $36,108 |
| College or Associate's Degree | $67,859 | $43,675 |
| Bachelor's Degree | $82,964 | $62,714 |
| Graduate Degree | $97,961 | $87,962 |
| Total | $67,908 | $52,466 |
Family Income in Richmond County
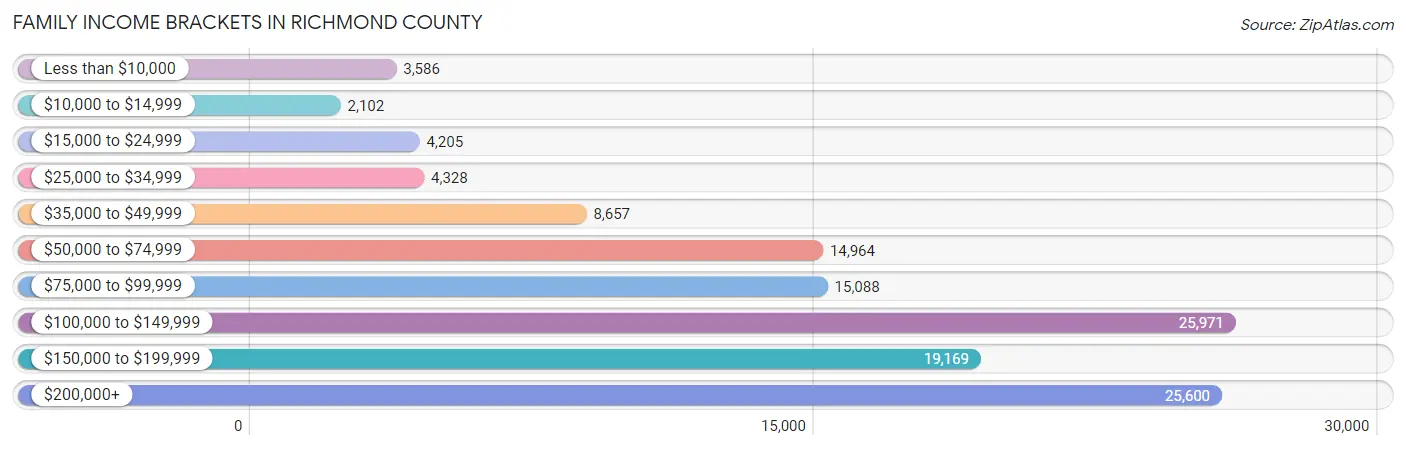
Family Income Brackets in Richmond County
According to the Richmond County family income data, there are 25,971 families falling into the $100,000 to $149,999 income range, which is the most common income bracket and makes up 21.0% of all families. Conversely, the $10,000 to $14,999 income bracket is the least frequent group with only 2,102 families (1.7%) belonging to this category.
| Income Bracket | # Families | % Families |
| Less than $10,000 | 3,586 | 2.9% |
| $10,000 to $14,999 | 2,102 | 1.7% |
| $15,000 to $24,999 | 4,205 | 3.4% |
| $25,000 to $34,999 | 4,328 | 3.5% |
| $35,000 to $49,999 | 8,657 | 7.0% |
| $50,000 to $74,999 | 14,964 | 12.1% |
| $75,000 to $99,999 | 15,088 | 12.2% |
| $100,000 to $149,999 | 25,971 | 21.0% |
| $150,000 to $199,999 | 19,169 | 15.5% |
| $200,000+ | 25,600 | 20.7% |
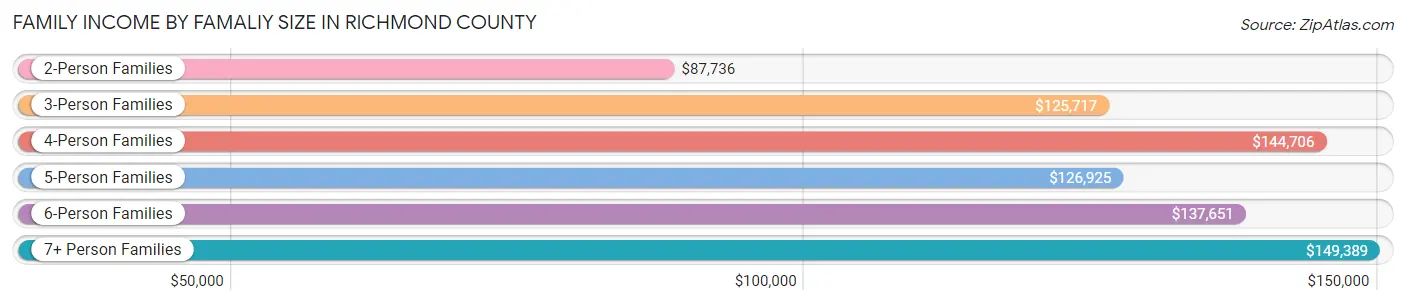
Family Income by Famaliy Size in Richmond County
7+ person families (2,888 | 2.3%) account for the highest median family income in Richmond County with $149,389 per family, while 2-person families (44,336 | 35.8%) have the highest median income of $43,868 per family member.
| Income Bracket | # Families | Median Income |
| 2-Person Families | 44,336 (35.8%) | $87,736 |
| 3-Person Families | 28,171 (22.8%) | $125,717 |
| 4-Person Families | 28,742 (23.2%) | $144,706 |
| 5-Person Families | 13,745 (11.1%) | $126,925 |
| 6-Person Families | 5,789 (4.7%) | $137,651 |
| 7+ Person Families | 2,888 (2.3%) | $149,389 |
| Total | 123,671 (100.0%) | $116,052 |
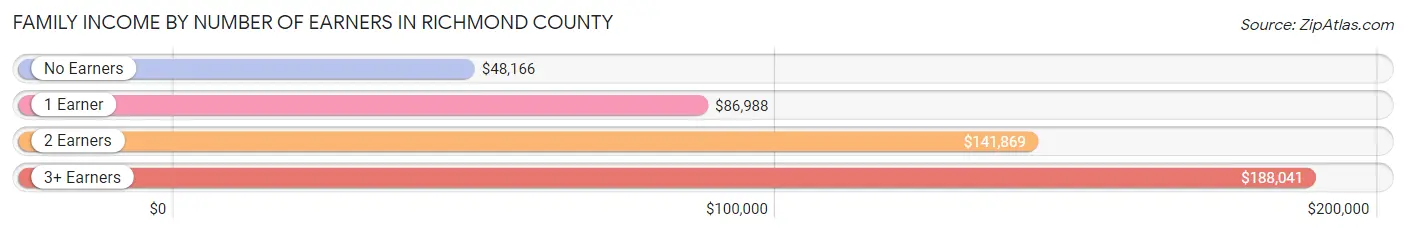
Family Income by Number of Earners in Richmond County
The median family income in Richmond County is $116,052, with families comprising 3+ earners (20,248) having the highest median family income of $188,041, while families with no earners (17,317) have the lowest median family income of $48,166, accounting for 16.4% and 14.0% of families, respectively.
| Number of Earners | # Families | Median Income |
| No Earners | 17,317 (14.0%) | $48,166 |
| 1 Earner | 37,998 (30.7%) | $86,988 |
| 2 Earners | 48,108 (38.9%) | $141,869 |
| 3+ Earners | 20,248 (16.4%) | $188,041 |
| Total | 123,671 (100.0%) | $116,052 |
Household Income in Richmond County
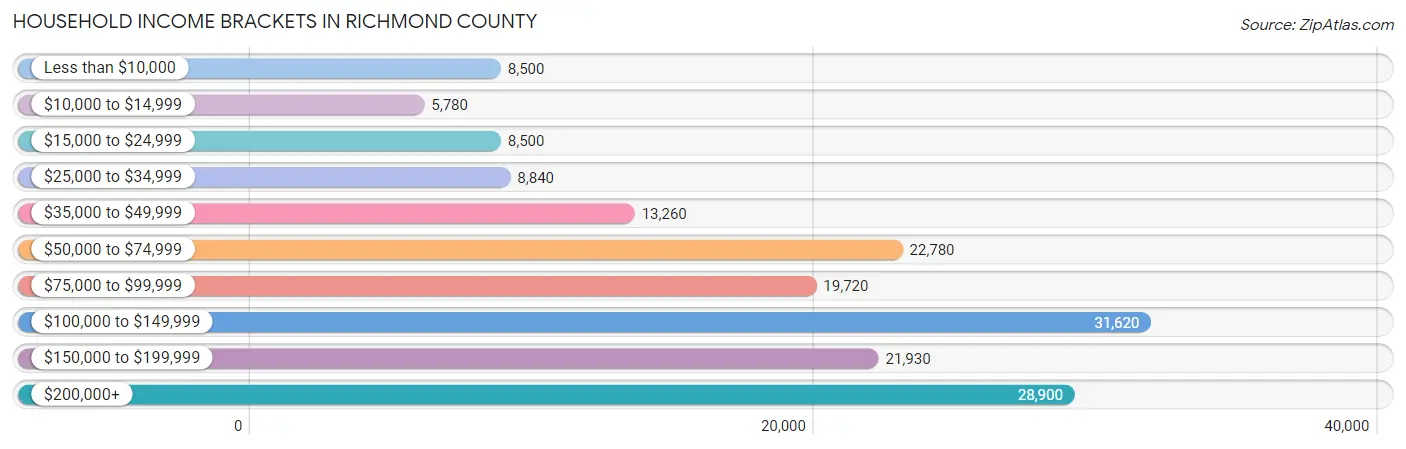
Household Income Brackets in Richmond County
With 31,620 households falling in the category, the $100,000 to $149,999 income range is the most frequent in Richmond County, accounting for 18.6% of all households. In contrast, only 5,780 households (3.4%) fall into the $10,000 to $14,999 income bracket, making it the least populous group.
| Income Bracket | # Households | % Households |
| Less than $10,000 | 8,500 | 5.0% |
| $10,000 to $14,999 | 5,780 | 3.4% |
| $15,000 to $24,999 | 8,500 | 5.0% |
| $25,000 to $34,999 | 8,840 | 5.2% |
| $35,000 to $49,999 | 13,260 | 7.8% |
| $50,000 to $74,999 | 22,780 | 13.4% |
| $75,000 to $99,999 | 19,720 | 11.6% |
| $100,000 to $149,999 | 31,620 | 18.6% |
| $150,000 to $199,999 | 21,930 | 12.9% |
| $200,000+ | 28,900 | 17.0% |
Household Income by Householder Age in Richmond County
The median household income in Richmond County is $96,185, with the highest median household income of $116,155 found in the 45 to 64 years age bracket for the primary householder. A total of 72,813 households (42.8%) fall into this category. Meanwhile, the 15 to 24 years age bracket for the primary householder has the lowest median household income of $44,775, with 1,992 households (1.2%) in this group.
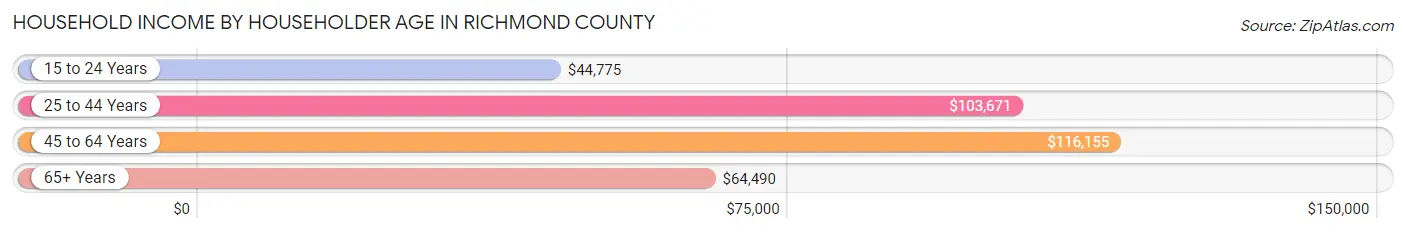
| Income Bracket | # Households | Median Income |
| 15 to 24 Years | 1,992 (1.2%) | $44,775 |
| 25 to 44 Years | 47,907 (28.2%) | $103,671 |
| 45 to 64 Years | 72,813 (42.8%) | $116,155 |
| 65+ Years | 47,288 (27.8%) | $64,490 |
| Total | 170,000 (100.0%) | $96,185 |
Poverty in Richmond County
Income Below Poverty by Sex and Age in Richmond County
With 9.3% poverty level for males and 11.4% for females among the residents of Richmond County, 15 year old males and 15 year old females are the most vulnerable to poverty, with 469 males (14.5%) and 645 females (21.2%) in their respective age groups living below the poverty level.
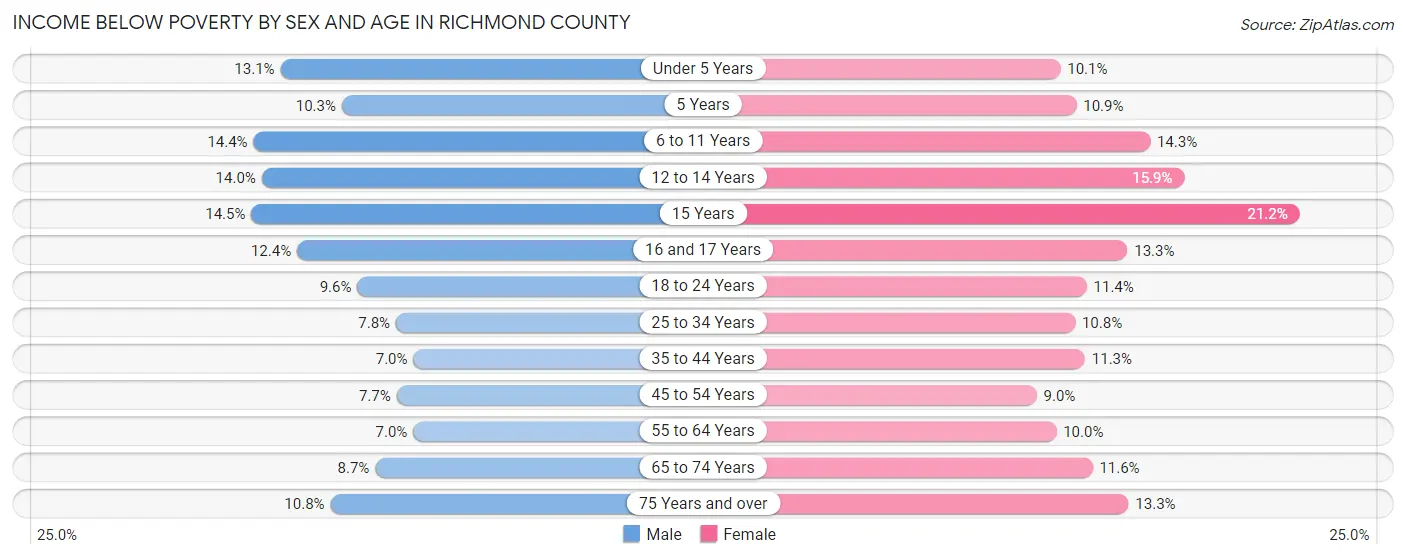
| Age Bracket | Male | Female |
| Under 5 Years | 1,821 (13.1%) | 1,301 (10.1%) |
| 5 Years | 258 (10.3%) | 298 (10.9%) |
| 6 to 11 Years | 2,679 (14.4%) | 2,446 (14.3%) |
| 12 to 14 Years | 1,335 (14.0%) | 1,447 (15.9%) |
| 15 Years | 469 (14.5%) | 645 (21.2%) |
| 16 and 17 Years | 820 (12.4%) | 849 (13.3%) |
| 18 to 24 Years | 1,997 (9.6%) | 2,232 (11.4%) |
| 25 to 34 Years | 2,592 (7.8%) | 3,509 (10.8%) |
| 35 to 44 Years | 2,133 (7.0%) | 3,539 (11.3%) |
| 45 to 54 Years | 2,499 (7.7%) | 3,055 (9.0%) |
| 55 to 64 Years | 2,297 (7.0%) | 3,502 (10.0%) |
| 65 to 74 Years | 1,941 (8.7%) | 3,014 (11.6%) |
| 75 Years and over | 1,375 (10.8%) | 2,503 (13.3%) |
| Total | 22,216 (9.3%) | 28,340 (11.4%) |
Income Above Poverty by Sex and Age in Richmond County
According to the poverty statistics in Richmond County, males aged 35 to 44 years and females aged 45 to 54 years are the age groups that are most secure financially, with 93.0% of males and 91.0% of females in these age groups living above the poverty line.
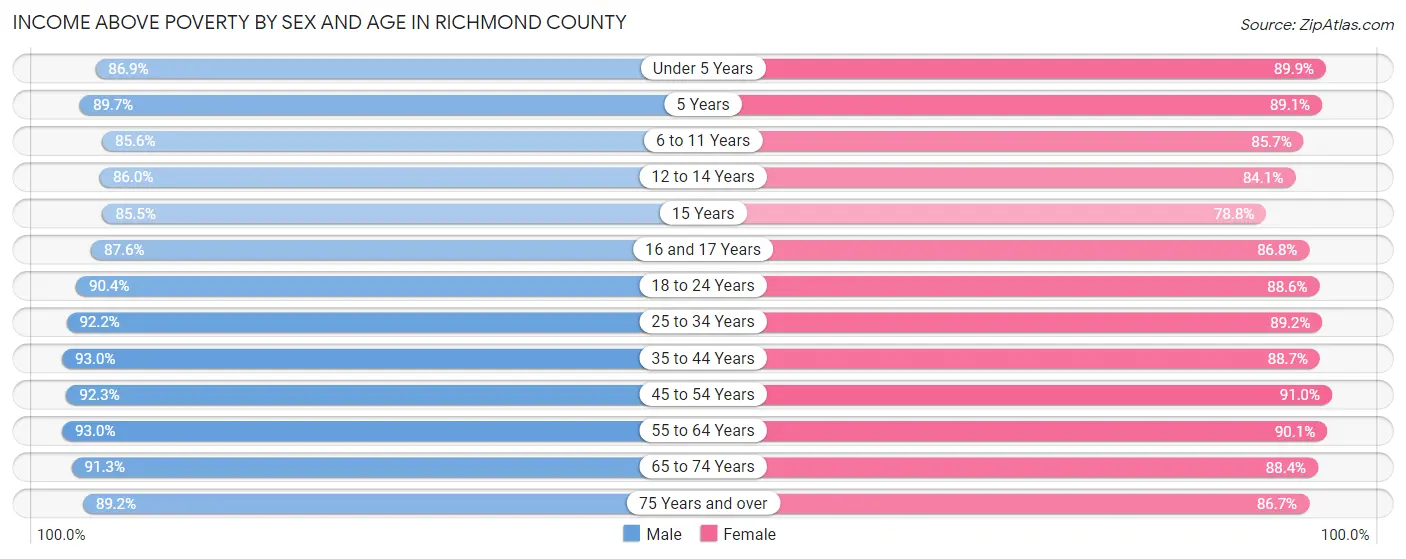
| Age Bracket | Male | Female |
| Under 5 Years | 12,046 (86.9%) | 11,526 (89.9%) |
| 5 Years | 2,251 (89.7%) | 2,440 (89.1%) |
| 6 to 11 Years | 15,957 (85.6%) | 14,661 (85.7%) |
| 12 to 14 Years | 8,198 (86.0%) | 7,659 (84.1%) |
| 15 Years | 2,771 (85.5%) | 2,392 (78.8%) |
| 16 and 17 Years | 5,814 (87.6%) | 5,558 (86.8%) |
| 18 to 24 Years | 18,884 (90.4%) | 17,410 (88.6%) |
| 25 to 34 Years | 30,772 (92.2%) | 28,916 (89.2%) |
| 35 to 44 Years | 28,520 (93.0%) | 27,823 (88.7%) |
| 45 to 54 Years | 29,767 (92.3%) | 30,734 (91.0%) |
| 55 to 64 Years | 30,660 (93.0%) | 31,682 (90.0%) |
| 65 to 74 Years | 20,295 (91.3%) | 22,905 (88.4%) |
| 75 Years and over | 11,340 (89.2%) | 16,312 (86.7%) |
| Total | 217,275 (90.7%) | 220,018 (88.6%) |
Income Below Poverty Among Married-Couple Families in Richmond County
The poverty statistics for married-couple families in Richmond County show that 4.5% or 4,112 of the total 90,492 families live below the poverty line. Families with 5 or more children have the highest poverty rate of 32.0%, comprising of 227 families. On the other hand, families with no children have the lowest poverty rate of 3.7%, which includes 1,833 families.
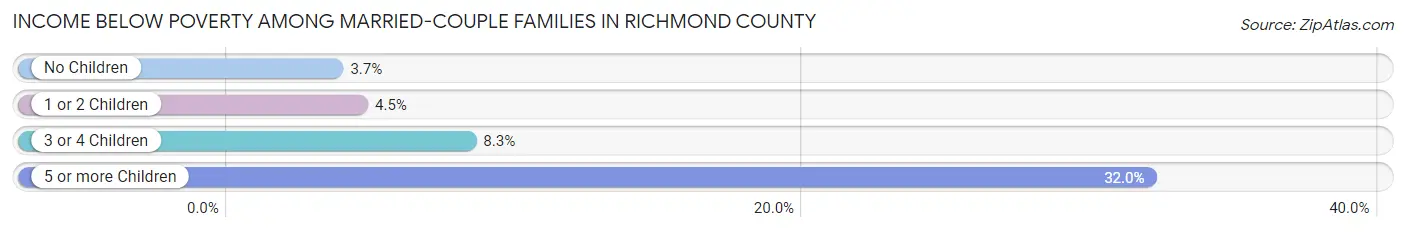
| Children | Above Poverty | Below Poverty |
| No Children | 48,093 (96.3%) | 1,833 (3.7%) |
| 1 or 2 Children | 31,772 (95.5%) | 1,506 (4.5%) |
| 3 or 4 Children | 6,032 (91.7%) | 546 (8.3%) |
| 5 or more Children | 483 (68.0%) | 227 (32.0%) |
| Total | 86,380 (95.5%) | 4,112 (4.5%) |
Income Below Poverty Among Single-Parent Households in Richmond County
According to the poverty data in Richmond County, 9.5% or 834 single-father households and 18.4% or 4,506 single-mother households are living below the poverty line. Among single-father households, those with 3 or 4 children have the highest poverty rate, with 63 households (20.1%) experiencing poverty. Likewise, among single-mother households, those with 5 or more children have the highest poverty rate, with 97 households (75.2%) falling below the poverty line.
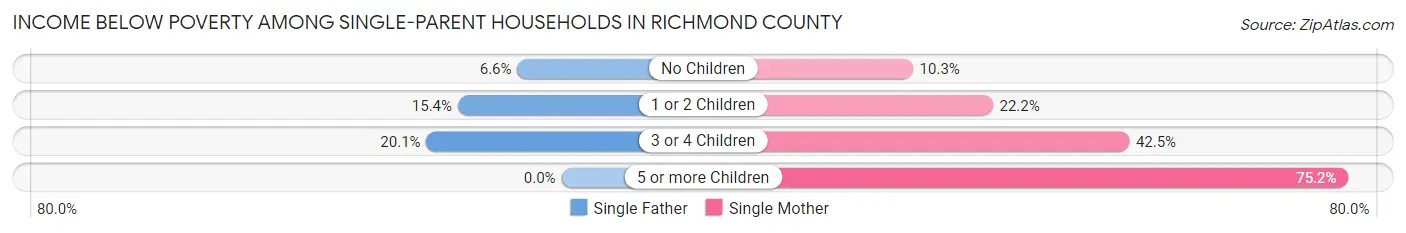
| Children | Single Father | Single Mother |
| No Children | 391 (6.6%) | 1,209 (10.3%) |
| 1 or 2 Children | 380 (15.4%) | 2,326 (22.2%) |
| 3 or 4 Children | 63 (20.1%) | 874 (42.5%) |
| 5 or more Children | 0 (0.0%) | 97 (75.2%) |
| Total | 834 (9.5%) | 4,506 (18.4%) |
Income Below Poverty Among Married-Couple vs Single-Parent Households in Richmond County
The poverty data for Richmond County shows that 4,112 of the married-couple family households (4.5%) and 5,340 of the single-parent households (16.1%) are living below the poverty level. Within the married-couple family households, those with 5 or more children have the highest poverty rate, with 227 households (32.0%) falling below the poverty line. Among the single-parent households, those with 5 or more children have the highest poverty rate, with 97 household (64.7%) living below poverty.
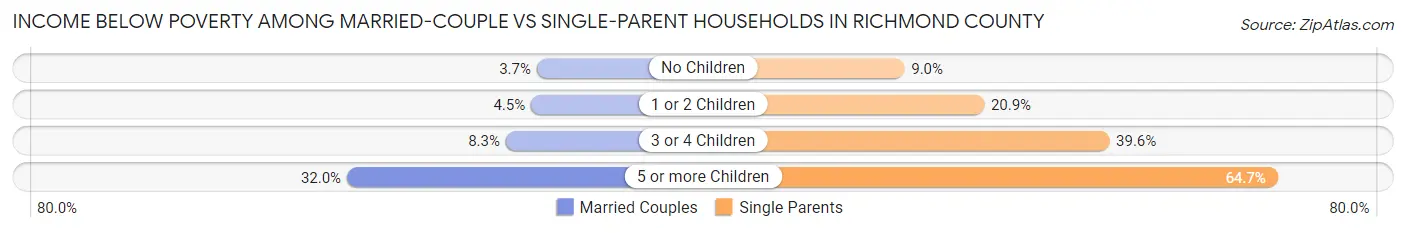
| Children | Married-Couple Families | Single-Parent Households |
| No Children | 1,833 (3.7%) | 1,600 (9.0%) |
| 1 or 2 Children | 1,506 (4.5%) | 2,706 (20.9%) |
| 3 or 4 Children | 546 (8.3%) | 937 (39.6%) |
| 5 or more Children | 227 (32.0%) | 97 (64.7%) |
| Total | 4,112 (4.5%) | 5,340 (16.1%) |
Race in Richmond County
The most populous races in Richmond County are White / Caucasian (326,334 | 66.2%), Hispanic or Latino (92,411 | 18.8%), and Asian (56,516 | 11.5%).
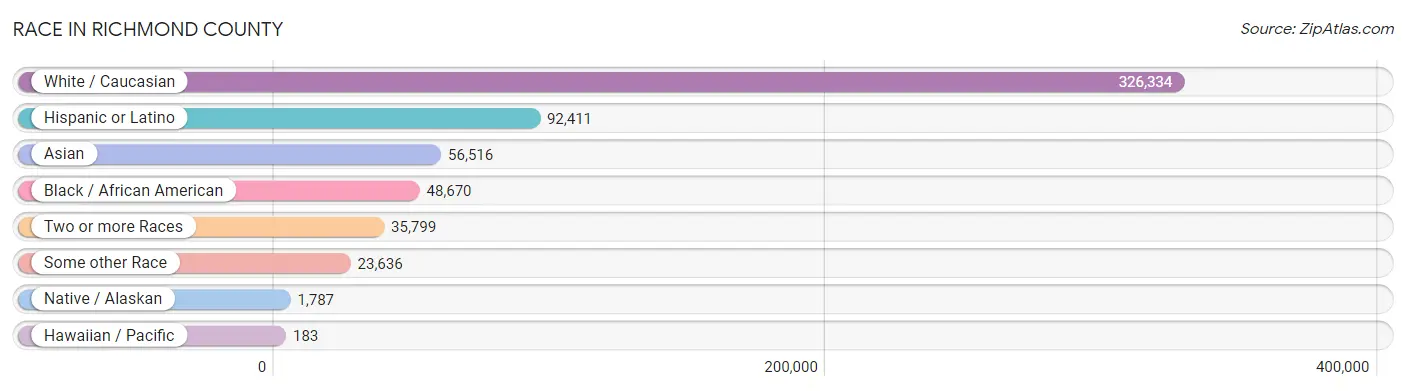
| Race | # Population | % Population |
| Asian | 56,516 | 11.5% |
| Black / African American | 48,670 | 9.9% |
| Hawaiian / Pacific | 183 | 0.0% |
| Hispanic or Latino | 92,411 | 18.8% |
| Native / Alaskan | 1,787 | 0.4% |
| White / Caucasian | 326,334 | 66.2% |
| Two or more Races | 35,799 | 7.3% |
| Some other Race | 23,636 | 4.8% |
| Total | 492,925 | 100.0% |
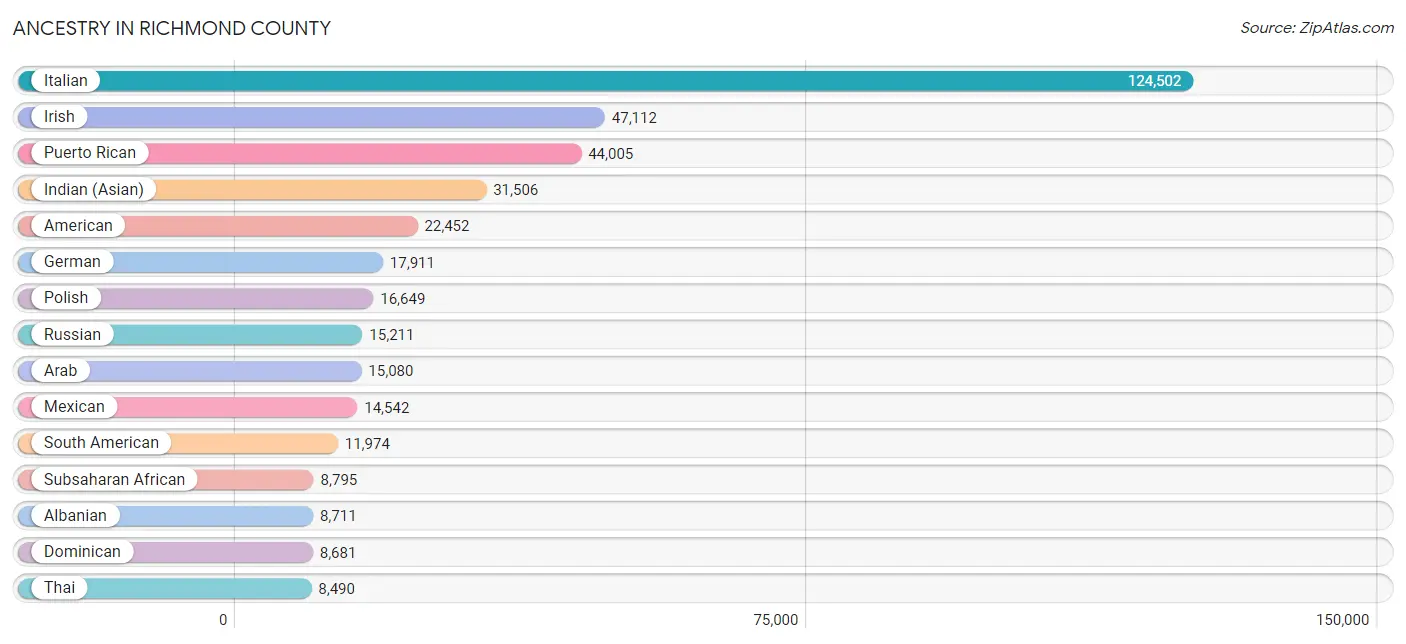
Ancestry in Richmond County
The most populous ancestries reported in Richmond County are Italian (124,502 | 25.3%), Irish (47,112 | 9.6%), Puerto Rican (44,005 | 8.9%), Indian (Asian) (31,506 | 6.4%), and American (22,452 | 4.5%), together accounting for 54.7% of all Richmond County residents.
| Ancestry | # Population | % Population |
| African | 3,243 | 0.7% |
| Albanian | 8,711 | 1.8% |
| American | 22,452 | 4.5% |
| Arab | 15,080 | 3.1% |
| Argentinean | 666 | 0.1% |
| Armenian | 616 | 0.1% |
| Australian | 16 | 0.0% |
| Austrian | 1,166 | 0.2% |
| Bahamian | 35 | 0.0% |
| Barbadian | 277 | 0.1% |
| Basque | 116 | 0.0% |
| Belgian | 79 | 0.0% |
| Belizean | 347 | 0.1% |
| Bermudan | 54 | 0.0% |
| Bhutanese | 426 | 0.1% |
| Blackfeet | 13 | 0.0% |
| Bolivian | 53 | 0.0% |
| Brazilian | 192 | 0.0% |
| British | 576 | 0.1% |
| British West Indian | 493 | 0.1% |
| Bulgarian | 115 | 0.0% |
| Burmese | 3,002 | 0.6% |
| Cajun | 20 | 0.0% |
| Cambodian | 68 | 0.0% |
| Canadian | 552 | 0.1% |
| Carpatho Rusyn | 28 | 0.0% |
| Celtic | 84 | 0.0% |
| Central American | 6,020 | 1.2% |
| Central American Indian | 827 | 0.2% |
| Cherokee | 213 | 0.0% |
| Chilean | 400 | 0.1% |
| Chippewa | 50 | 0.0% |
| Colombian | 4,551 | 0.9% |
| Costa Rican | 483 | 0.1% |
| Croatian | 346 | 0.1% |
| Cuban | 2,317 | 0.5% |
| Cypriot | 35 | 0.0% |
| Czech | 714 | 0.1% |
| Czechoslovakian | 406 | 0.1% |
| Danish | 484 | 0.1% |
| Delaware | 67 | 0.0% |
| Dominican | 8,681 | 1.8% |
| Dutch | 857 | 0.2% |
| Dutch West Indian | 45 | 0.0% |
| Eastern European | 2,659 | 0.5% |
| Ecuadorian | 4,000 | 0.8% |
| Egyptian | 7,155 | 1.5% |
| English | 7,387 | 1.5% |
| Estonian | 45 | 0.0% |
| Ethiopian | 206 | 0.0% |
| European | 2,025 | 0.4% |
| Filipino | 83 | 0.0% |
| Finnish | 235 | 0.1% |
| French | 2,486 | 0.5% |
| French Canadian | 766 | 0.2% |
| German | 17,911 | 3.6% |
| Ghanaian | 563 | 0.1% |
| Greek | 3,484 | 0.7% |
| Guamanian / Chamorro | 28 | 0.0% |
| Guatemalan | 1,471 | 0.3% |
| Guyanese | 412 | 0.1% |
| Haitian | 1,188 | 0.2% |
| Honduran | 2,110 | 0.4% |
| Hungarian | 1,605 | 0.3% |
| Indian (Asian) | 31,506 | 6.4% |
| Indonesian | 229 | 0.1% |
| Iranian | 473 | 0.1% |
| Iraqi | 9 | 0.0% |
| Irish | 47,112 | 9.6% |
| Iroquois | 140 | 0.0% |
| Israeli | 2,488 | 0.5% |
| Italian | 124,502 | 25.3% |
| Jamaican | 2,554 | 0.5% |
| Japanese | 300 | 0.1% |
| Jordanian | 306 | 0.1% |
| Korean | 6,196 | 1.3% |
| Laotian | 49 | 0.0% |
| Latvian | 621 | 0.1% |
| Lebanese | 1,631 | 0.3% |
| Liberian | 1,598 | 0.3% |
| Lithuanian | 484 | 0.1% |
| Macedonian | 815 | 0.2% |
| Maltese | 130 | 0.0% |
| Mexican | 14,542 | 2.9% |
| Mexican American Indian | 542 | 0.1% |
| Mongolian | 34 | 0.0% |
| Moroccan | 959 | 0.2% |
| Native Hawaiian | 170 | 0.0% |
| Navajo | 8 | 0.0% |
| New Zealander | 10 | 0.0% |
| Nicaraguan | 109 | 0.0% |
| Nigerian | 2,165 | 0.4% |
| Northern European | 112 | 0.0% |
| Norwegian | 3,426 | 0.7% |
| Okinawan | 430 | 0.1% |
| Osage | 32 | 0.0% |
| Pakistani | 339 | 0.1% |
| Palestinian | 1,339 | 0.3% |
| Panamanian | 546 | 0.1% |
| Paraguayan | 49 | 0.0% |
| Peruvian | 1,734 | 0.4% |
| Polish | 16,649 | 3.4% |
| Portuguese | 855 | 0.2% |
| Puerto Rican | 44,005 | 8.9% |
| Romanian | 800 | 0.2% |
| Russian | 15,211 | 3.1% |
| Salvadoran | 1,301 | 0.3% |
| Scandinavian | 141 | 0.0% |
| Scotch-Irish | 433 | 0.1% |
| Scottish | 1,849 | 0.4% |
| Senegalese | 145 | 0.0% |
| Serbian | 25 | 0.0% |
| Sierra Leonean | 232 | 0.1% |
| Slavic | 228 | 0.1% |
| Slovak | 512 | 0.1% |
| Slovene | 14 | 0.0% |
| Somali | 31 | 0.0% |
| South African | 9 | 0.0% |
| South American | 11,974 | 2.4% |
| South American Indian | 125 | 0.0% |
| Soviet Union | 73 | 0.0% |
| Spaniard | 1,766 | 0.4% |
| Spanish | 511 | 0.1% |
| Spanish American Indian | 12 | 0.0% |
| Sri Lankan | 383 | 0.1% |
| Subsaharan African | 8,795 | 1.8% |
| Sudanese | 55 | 0.0% |
| Swedish | 1,726 | 0.4% |
| Swiss | 89 | 0.0% |
| Syrian | 1,004 | 0.2% |
| Thai | 8,490 | 1.7% |
| Trinidadian and Tobagonian | 1,980 | 0.4% |
| Turkish | 1,449 | 0.3% |
| U.S. Virgin Islander | 144 | 0.0% |
| Ugandan | 39 | 0.0% |
| Ukrainian | 7,271 | 1.5% |
| Uruguayan | 73 | 0.0% |
| Ute | 9 | 0.0% |
| Venezuelan | 412 | 0.1% |
| Vietnamese | 640 | 0.1% |
| Welsh | 330 | 0.1% |
| West Indian | 1,806 | 0.4% |
| Yugoslavian | 274 | 0.1% |
| Yuman | 32 | 0.0% | View All 144 Rows |
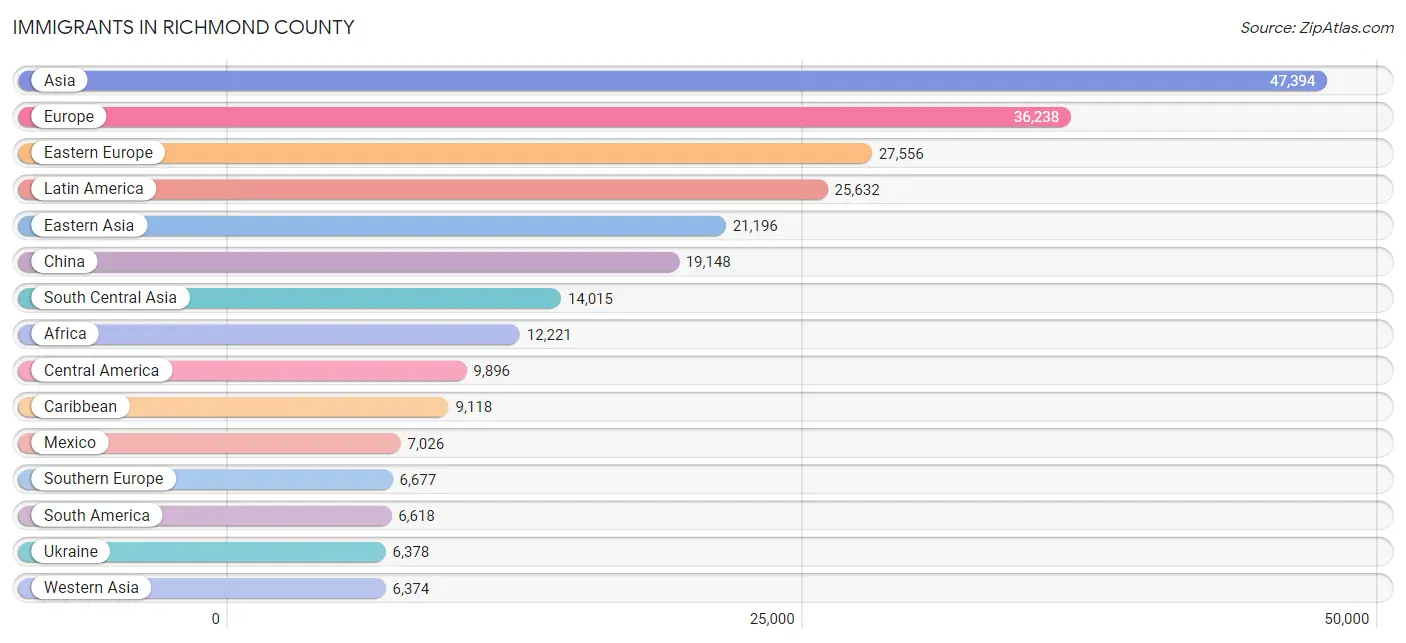
Immigrants in Richmond County
The most numerous immigrant groups reported in Richmond County came from Asia (47,394 | 9.6%), Europe (36,238 | 7.3%), Eastern Europe (27,556 | 5.6%), Latin America (25,632 | 5.2%), and Eastern Asia (21,196 | 4.3%), together accounting for 32.1% of all Richmond County residents.
| Immigration Origin | # Population | % Population |
| Africa | 12,221 | 2.5% |
| Albania | 3,375 | 0.7% |
| Argentina | 275 | 0.1% |
| Armenia | 275 | 0.1% |
| Asia | 47,394 | 9.6% |
| Australia | 96 | 0.0% |
| Austria | 156 | 0.0% |
| Bahamas | 122 | 0.0% |
| Bangladesh | 908 | 0.2% |
| Barbados | 386 | 0.1% |
| Belarus | 1,715 | 0.4% |
| Belize | 196 | 0.0% |
| Bolivia | 1 | 0.0% |
| Bosnia and Herzegovina | 17 | 0.0% |
| Brazil | 174 | 0.0% |
| Bulgaria | 158 | 0.0% |
| Cambodia | 85 | 0.0% |
| Cameroon | 20 | 0.0% |
| Canada | 845 | 0.2% |
| Caribbean | 9,118 | 1.8% |
| Central America | 9,896 | 2.0% |
| Chile | 220 | 0.0% |
| China | 19,148 | 3.9% |
| Colombia | 2,248 | 0.5% |
| Costa Rica | 150 | 0.0% |
| Croatia | 70 | 0.0% |
| Cuba | 363 | 0.1% |
| Czechoslovakia | 293 | 0.1% |
| Dominica | 76 | 0.0% |
| Dominican Republic | 3,425 | 0.7% |
| Eastern Africa | 111 | 0.0% |
| Eastern Asia | 21,196 | 4.3% |
| Eastern Europe | 27,556 | 5.6% |
| Ecuador | 1,824 | 0.4% |
| Egypt | 4,806 | 1.0% |
| El Salvador | 587 | 0.1% |
| England | 212 | 0.0% |
| Ethiopia | 83 | 0.0% |
| Europe | 36,238 | 7.3% |
| France | 162 | 0.0% |
| Germany | 472 | 0.1% |
| Ghana | 548 | 0.1% |
| Greece | 680 | 0.1% |
| Grenada | 246 | 0.1% |
| Guatemala | 569 | 0.1% |
| Guyana | 504 | 0.1% |
| Haiti | 628 | 0.1% |
| Honduras | 1,130 | 0.2% |
| Hong Kong | 1,653 | 0.3% |
| Hungary | 124 | 0.0% |
| India | 4,429 | 0.9% |
| Indonesia | 63 | 0.0% |
| Iran | 351 | 0.1% |
| Ireland | 205 | 0.0% |
| Israel | 1,421 | 0.3% |
| Italy | 5,711 | 1.2% |
| Jamaica | 1,534 | 0.3% |
| Japan | 119 | 0.0% |
| Jordan | 276 | 0.1% |
| Kazakhstan | 570 | 0.1% |
| Korea | 1,929 | 0.4% |
| Kuwait | 94 | 0.0% |
| Latin America | 25,632 | 5.2% |
| Latvia | 332 | 0.1% |
| Lebanon | 946 | 0.2% |
| Liberia | 1,307 | 0.3% |
| Lithuania | 25 | 0.0% |
| Malaysia | 484 | 0.1% |
| Mexico | 7,026 | 1.4% |
| Middle Africa | 30 | 0.0% |
| Moldova | 311 | 0.1% |
| Morocco | 578 | 0.1% |
| Nepal | 63 | 0.0% |
| Netherlands | 121 | 0.0% |
| Nicaragua | 25 | 0.0% |
| Nigeria | 2,103 | 0.4% |
| North Macedonia | 698 | 0.1% |
| Northern Africa | 5,624 | 1.1% |
| Northern Europe | 963 | 0.2% |
| Norway | 97 | 0.0% |
| Oceania | 96 | 0.0% |
| Pakistan | 2,929 | 0.6% |
| Panama | 213 | 0.0% |
| Peru | 923 | 0.2% |
| Philippines | 3,482 | 0.7% |
| Poland | 4,121 | 0.8% |
| Portugal | 120 | 0.0% |
| Romania | 136 | 0.0% |
| Russia | 5,966 | 1.2% |
| Saudi Arabia | 35 | 0.0% |
| Scotland | 52 | 0.0% |
| Senegal | 286 | 0.1% |
| Serbia | 125 | 0.0% |
| Sierra Leone | 187 | 0.0% |
| Singapore | 385 | 0.1% |
| South Africa | 33 | 0.0% |
| South America | 6,618 | 1.3% |
| South Central Asia | 14,015 | 2.8% |
| South Eastern Asia | 5,695 | 1.2% |
| Southern Europe | 6,677 | 1.3% |
| Spain | 157 | 0.0% |
| Sri Lanka | 2,996 | 0.6% |
| St. Vincent and the Grenadines | 100 | 0.0% |
| Sudan | 21 | 0.0% |
| Sweden | 16 | 0.0% |
| Syria | 573 | 0.1% |
| Taiwan | 321 | 0.1% |
| Thailand | 268 | 0.1% |
| Trinidad and Tobago | 1,802 | 0.4% |
| Turkey | 739 | 0.2% |
| Ukraine | 6,378 | 1.3% |
| Uruguay | 57 | 0.0% |
| Uzbekistan | 1,418 | 0.3% |
| Venezuela | 338 | 0.1% |
| Vietnam | 482 | 0.1% |
| West Indies | 2 | 0.0% |
| Western Africa | 5,379 | 1.1% |
| Western Asia | 6,374 | 1.3% |
| Western Europe | 911 | 0.2% |
| Yemen | 662 | 0.1% |
| Zaire | 10 | 0.0% | View All 121 Rows |
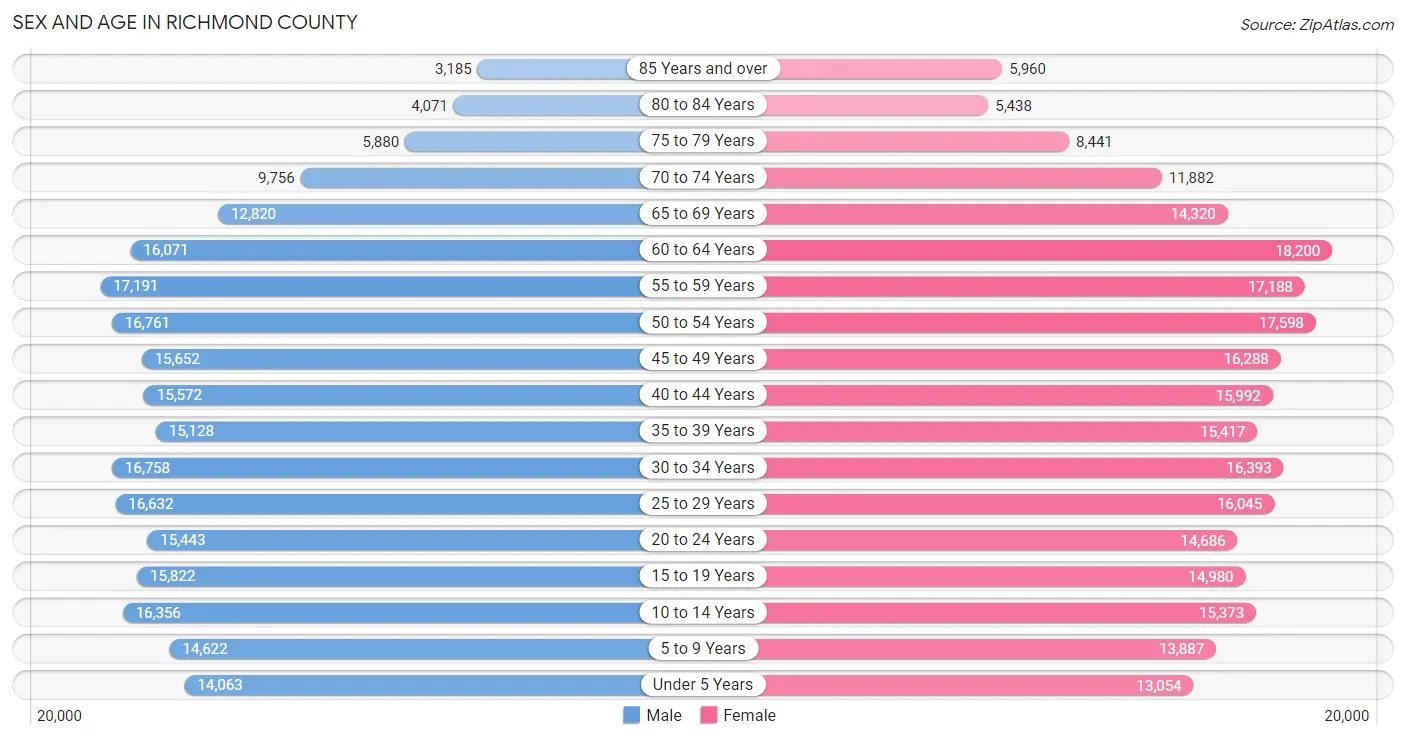
Sex and Age in Richmond County
Sex and Age in Richmond County
The most populous age groups in Richmond County are 55 to 59 Years (17,191 | 7.1%) for men and 60 to 64 Years (18,200 | 7.2%) for women.
| Age Bracket | Male | Female |
| Under 5 Years | 14,063 (5.8%) | 13,054 (5.2%) |
| 5 to 9 Years | 14,622 (6.0%) | 13,887 (5.5%) |
| 10 to 14 Years | 16,356 (6.8%) | 15,373 (6.1%) |
| 15 to 19 Years | 15,822 (6.5%) | 14,980 (6.0%) |
| 20 to 24 Years | 15,443 (6.4%) | 14,686 (5.9%) |
| 25 to 29 Years | 16,632 (6.9%) | 16,045 (6.4%) |
| 30 to 34 Years | 16,758 (6.9%) | 16,393 (6.5%) |
| 35 to 39 Years | 15,128 (6.3%) | 15,417 (6.1%) |
| 40 to 44 Years | 15,572 (6.4%) | 15,992 (6.4%) |
| 45 to 49 Years | 15,652 (6.5%) | 16,288 (6.5%) |
| 50 to 54 Years | 16,761 (6.9%) | 17,598 (7.0%) |
| 55 to 59 Years | 17,191 (7.1%) | 17,188 (6.8%) |
| 60 to 64 Years | 16,071 (6.7%) | 18,200 (7.2%) |
| 65 to 69 Years | 12,820 (5.3%) | 14,320 (5.7%) |
| 70 to 74 Years | 9,756 (4.0%) | 11,882 (4.7%) |
| 75 to 79 Years | 5,880 (2.4%) | 8,441 (3.4%) |
| 80 to 84 Years | 4,071 (1.7%) | 5,438 (2.2%) |
| 85 Years and over | 3,185 (1.3%) | 5,960 (2.4%) |
| Total | 241,783 (100.0%) | 251,142 (100.0%) |
Families and Households in Richmond County
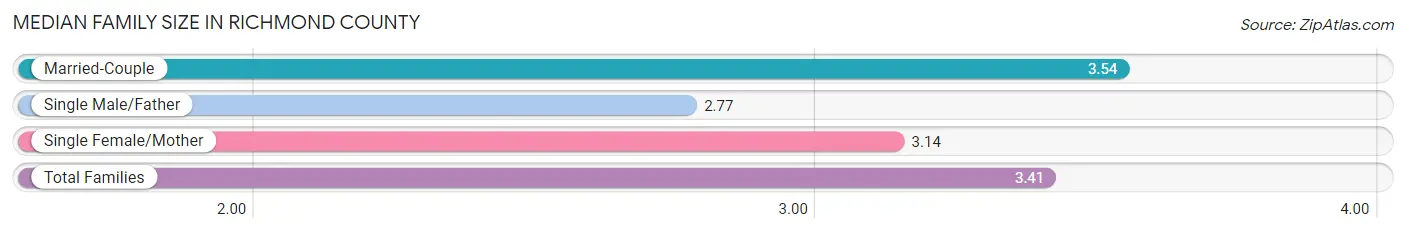
Median Family Size in Richmond County
The median family size in Richmond County is 3.41 persons per family, with married-couple families (90,492 | 73.2%) accounting for the largest median family size of 3.54 persons per family. On the other hand, single male/father families (8,750 | 7.1%) represent the smallest median family size with 2.77 persons per family.
| Family Type | # Families | Family Size |
| Married-Couple | 90,492 (73.2%) | 3.54 |
| Single Male/Father | 8,750 (7.1%) | 2.77 |
| Single Female/Mother | 24,429 (19.8%) | 3.14 |
| Total Families | 123,671 (100.0%) | 3.41 |
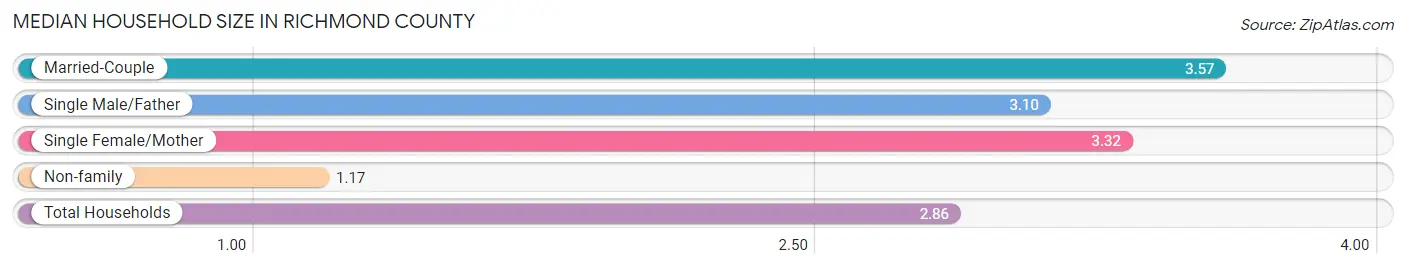
Median Household Size in Richmond County
The median household size in Richmond County is 2.86 persons per household, with married-couple households (90,492 | 53.2%) accounting for the largest median household size of 3.57 persons per household. non-family households (46,329 | 27.3%) represent the smallest median household size with 1.17 persons per household.
| Household Type | # Households | Household Size |
| Married-Couple | 90,492 (53.2%) | 3.57 |
| Single Male/Father | 8,750 (5.1%) | 3.10 |
| Single Female/Mother | 24,429 (14.4%) | 3.32 |
| Non-family | 46,329 (27.3%) | 1.17 |
| Total Households | 170,000 (100.0%) | 2.86 |
Household Size by Marriage Status in Richmond County
Out of a total of 170,000 households in Richmond County, 123,671 (72.8%) are family households, while 46,329 (27.3%) are nonfamily households. The most numerous type of family households are 2-person households, comprising 40,865, and the most common type of nonfamily households are 1-person households, comprising 39,652.
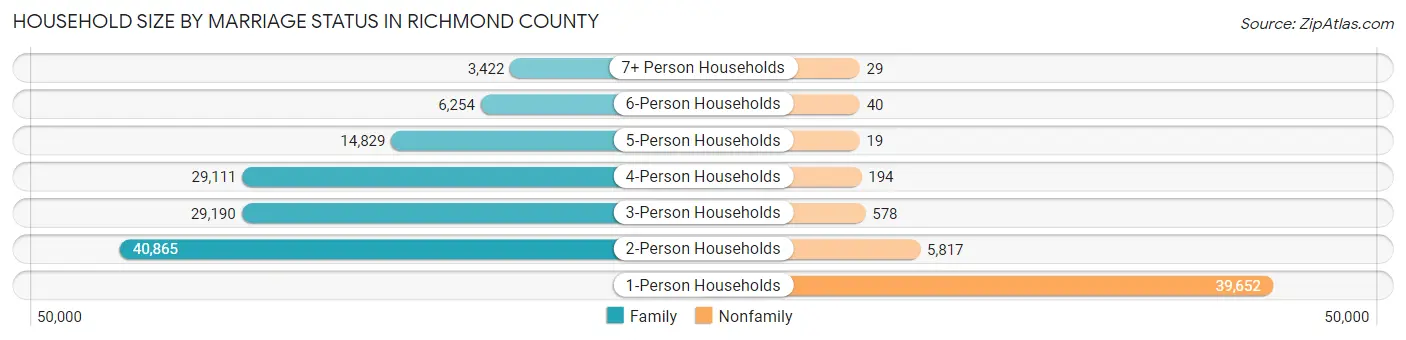
| Household Size | Family Households | Nonfamily Households |
| 1-Person Households | - | 39,652 (23.3%) |
| 2-Person Households | 40,865 (24.0%) | 5,817 (3.4%) |
| 3-Person Households | 29,190 (17.2%) | 578 (0.3%) |
| 4-Person Households | 29,111 (17.1%) | 194 (0.1%) |
| 5-Person Households | 14,829 (8.7%) | 19 (0.0%) |
| 6-Person Households | 6,254 (3.7%) | 40 (0.0%) |
| 7+ Person Households | 3,422 (2.0%) | 29 (0.0%) |
| Total | 123,671 (72.8%) | 46,329 (27.3%) |
Female Fertility in Richmond County
Fertility by Age in Richmond County
Average fertility rate in Richmond County is 50.0 births per 1,000 women. Women in the age bracket of 20 to 34 years have the highest fertility rate with 78.0 births per 1,000 women. Women in the age bracket of 20 to 34 years acount for 64.6% of all women with births.
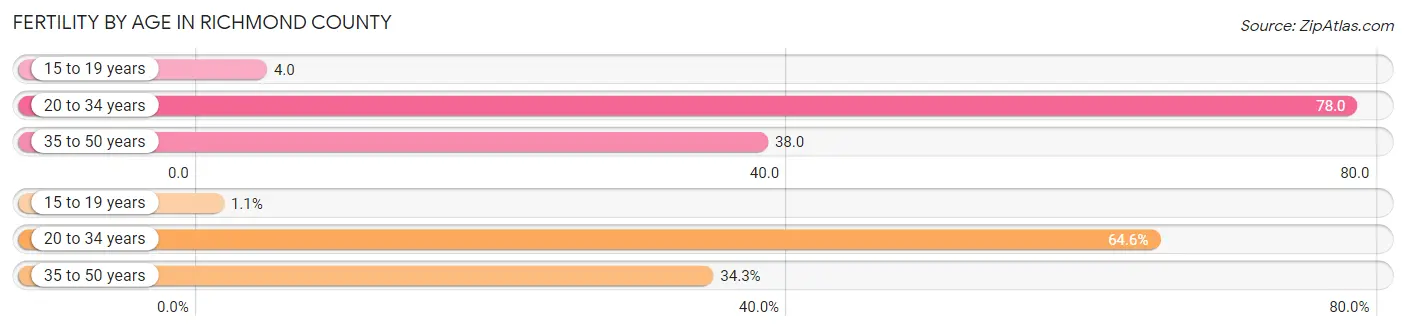
| Age Bracket | Women with Births | Births / 1,000 Women |
| 15 to 19 years | 62 (1.1%) | 4.0 |
| 20 to 34 years | 3,696 (64.6%) | 78.0 |
| 35 to 50 years | 1,962 (34.3%) | 38.0 |
| Total | 5,720 (100.0%) | 50.0 |
Fertility by Age by Marriage Status in Richmond County
71.5% of women with births (5,720) in Richmond County are married. The highest percentage of unmarried women with births falls into 15 to 19 years age bracket with 100.0% of them unmarried at the time of birth, while the lowest percentage of unmarried women with births belong to 35 to 50 years age bracket with 18.0% of them unmarried.
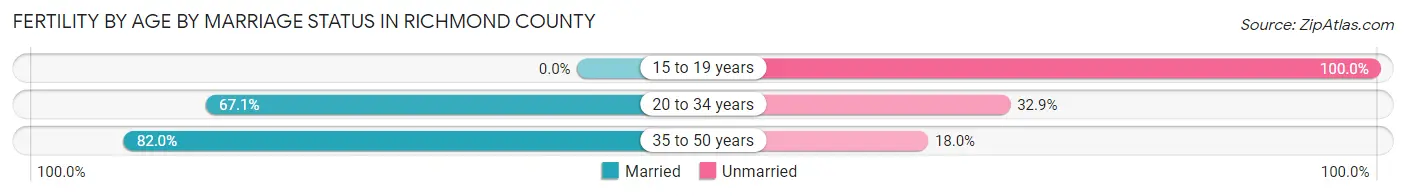
| Age Bracket | Married | Unmarried |
| 15 to 19 years | 0 (0.0%) | 62 (100.0%) |
| 20 to 34 years | 2,480 (67.1%) | 1,216 (32.9%) |
| 35 to 50 years | 1,609 (82.0%) | 353 (18.0%) |
| Total | 4,090 (71.5%) | 1,630 (28.5%) |
Fertility by Education in Richmond County
Average fertility rate in Richmond County is 50.0 births per 1,000 women. Women with the education attainment of high school diploma have the highest fertility rate of 64.0 births per 1,000 women, while women with the education attainment of less than high school have the lowest fertility at 24.0 births per 1,000 women. Women with the education attainment of bachelor's degree represent 29.8% of all women with births.
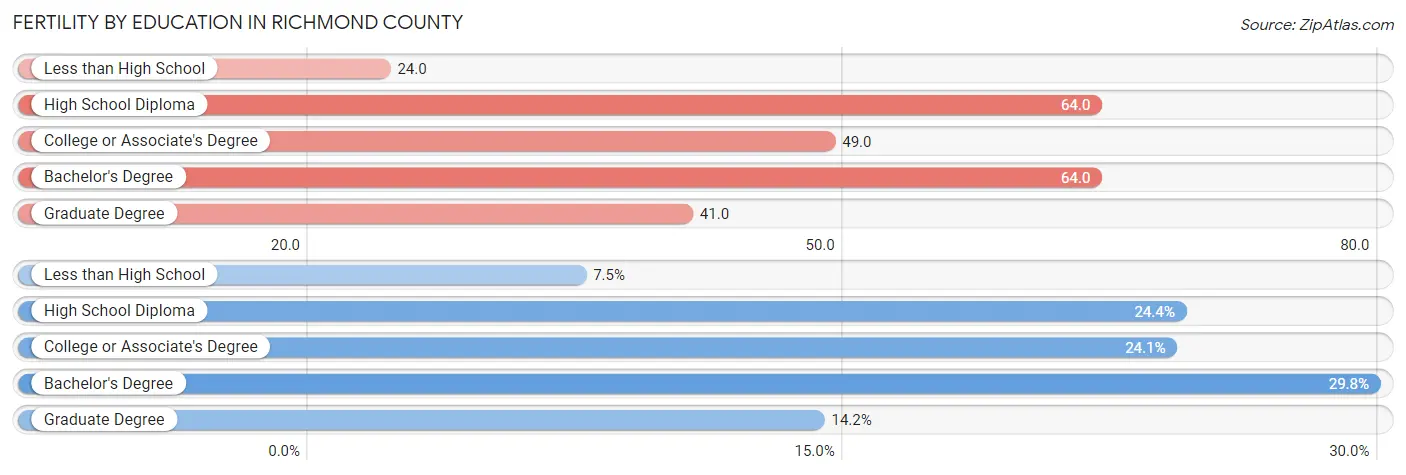
| Educational Attainment | Women with Births | Births / 1,000 Women |
| Less than High School | 429 (7.5%) | 24.0 |
| High School Diploma | 1,394 (24.4%) | 64.0 |
| College or Associate's Degree | 1,379 (24.1%) | 49.0 |
| Bachelor's Degree | 1,706 (29.8%) | 64.0 |
| Graduate Degree | 812 (14.2%) | 41.0 |
| Total | 5,720 (100.0%) | 50.0 |
Fertility by Education by Marriage Status in Richmond County
28.5% of women with births in Richmond County are unmarried. Women with the educational attainment of graduate degree are most likely to be married with 89.4% of them married at childbirth, while women with the educational attainment of high school diploma are least likely to be married with 43.6% of them unmarried at childbirth.
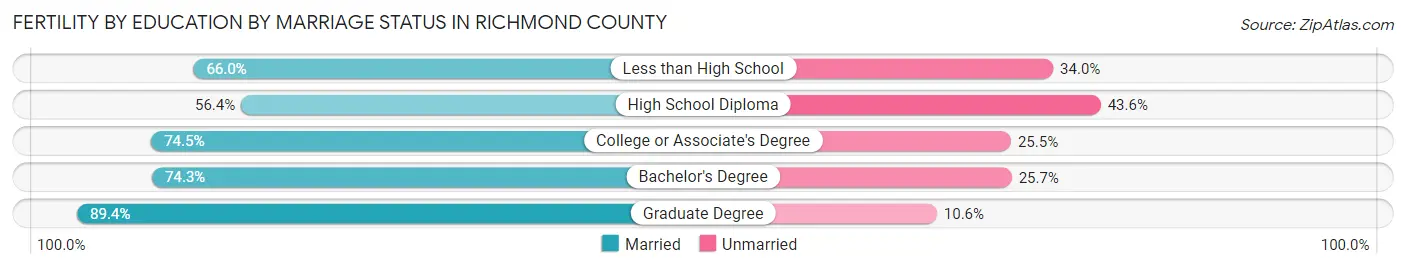
| Educational Attainment | Married | Unmarried |
| Less than High School | 283 (66.0%) | 146 (34.0%) |
| High School Diploma | 786 (56.4%) | 608 (43.6%) |
| College or Associate's Degree | 1,027 (74.5%) | 352 (25.5%) |
| Bachelor's Degree | 1,268 (74.3%) | 438 (25.7%) |
| Graduate Degree | 726 (89.4%) | 86 (10.6%) |
| Total | 4,090 (71.5%) | 1,630 (28.5%) |
Employment Characteristics in Richmond County
Employment by Class of Employer in Richmond County
Among the 221,119 employed individuals in Richmond County, private company employees (137,543 | 62.2%), local government employees (36,290 | 16.4%), and not-for-profit organizations (18,756 | 8.5%) make up the most common classes of employment.
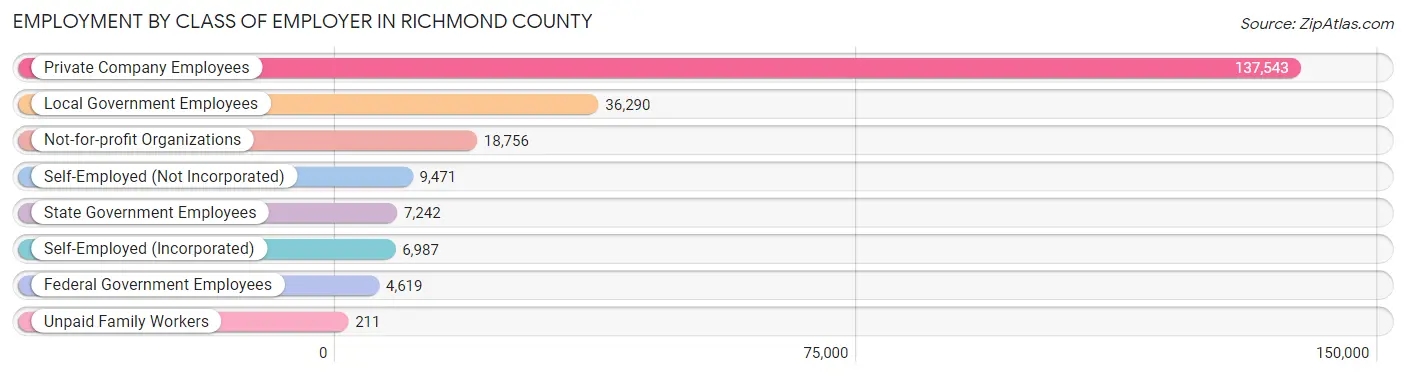
| Employer Class | # Employees | % Employees |
| Private Company Employees | 137,543 | 62.2% |
| Self-Employed (Incorporated) | 6,987 | 3.2% |
| Self-Employed (Not Incorporated) | 9,471 | 4.3% |
| Not-for-profit Organizations | 18,756 | 8.5% |
| Local Government Employees | 36,290 | 16.4% |
| State Government Employees | 7,242 | 3.3% |
| Federal Government Employees | 4,619 | 2.1% |
| Unpaid Family Workers | 211 | 0.1% |
| Total | 221,119 | 100.0% |
Employment Status by Age in Richmond County
According to the labor force statistics for Richmond County, out of the total population over 16 years of age (399,277), 60.0% or 239,566 individuals are in the labor force, with 5.4% or 12,937 of them unemployed. The age group with the highest labor force participation rate is 30 to 34 years, with 82.5% or 27,350 individuals in the labor force. Within the labor force, the 16 to 19 years age range has the highest percentage of unemployed individuals, with 19.2% or 1,030 of them being unemployed.
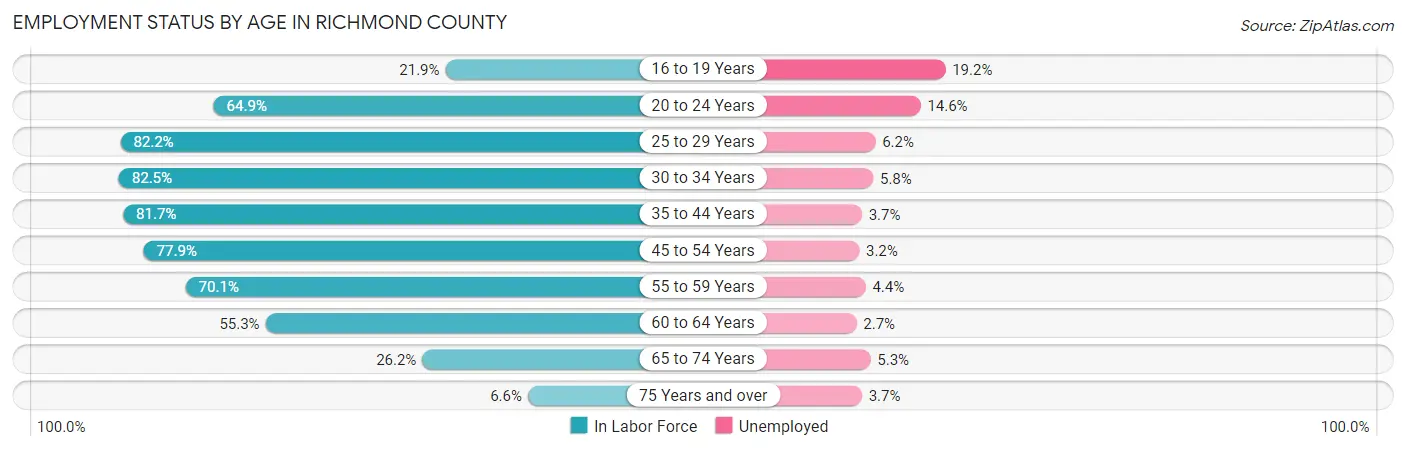
| Age Bracket | In Labor Force | Unemployed |
| 16 to 19 Years | 5,367 (21.9%) | 1,030 (19.2%) |
| 20 to 24 Years | 19,554 (64.9%) | 2,855 (14.6%) |
| 25 to 29 Years | 26,860 (82.2%) | 1,665 (6.2%) |
| 30 to 34 Years | 27,350 (82.5%) | 1,586 (5.8%) |
| 35 to 44 Years | 50,743 (81.7%) | 1,877 (3.7%) |
| 45 to 54 Years | 51,647 (77.9%) | 1,653 (3.2%) |
| 55 to 59 Years | 24,100 (70.1%) | 1,060 (4.4%) |
| 60 to 64 Years | 18,952 (55.3%) | 512 (2.7%) |
| 65 to 74 Years | 12,780 (26.2%) | 677 (5.3%) |
| 75 Years and over | 2,176 (6.6%) | 81 (3.7%) |
| Total | 239,566 (60.0%) | 12,937 (5.4%) |
Employment Status by Educational Attainment in Richmond County
According to labor force statistics for Richmond County, 76.0% of individuals (199,793) out of the total population between 25 and 64 years of age (262,886) are in the labor force, with 4.2% or 8,391 of them being unemployed. The group with the highest labor force participation rate are those with the educational attainment of bachelor's degree or higher, with 86.3% or 87,808 individuals in the labor force. Within the labor force, individuals with less than high school education have the highest percentage of unemployment, with 9.6% or 1,443 of them being unemployed.
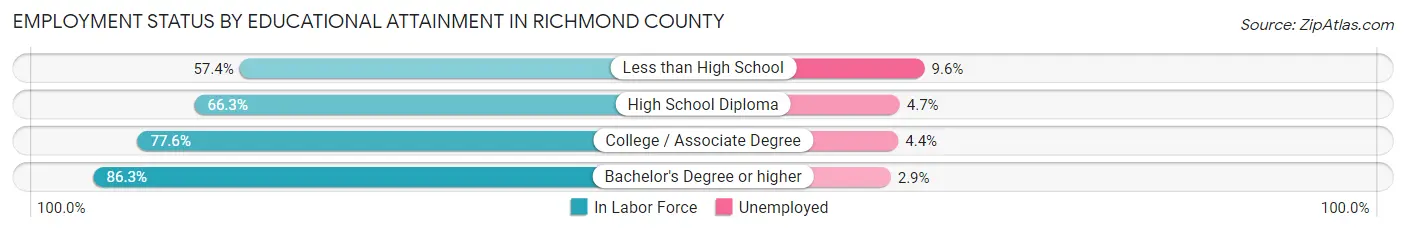
| Educational Attainment | In Labor Force | Unemployed |
| Less than High School | 15,027 (57.4%) | 2,513 (9.6%) |
| High School Diploma | 46,518 (66.3%) | 3,298 (4.7%) |
| College / Associate Degree | 50,282 (77.6%) | 2,851 (4.4%) |
| Bachelor's Degree or higher | 87,808 (86.3%) | 2,951 (2.9%) |
| Total | 199,793 (76.0%) | 11,041 (4.2%) |
Employment Occupations by Sex in Richmond County
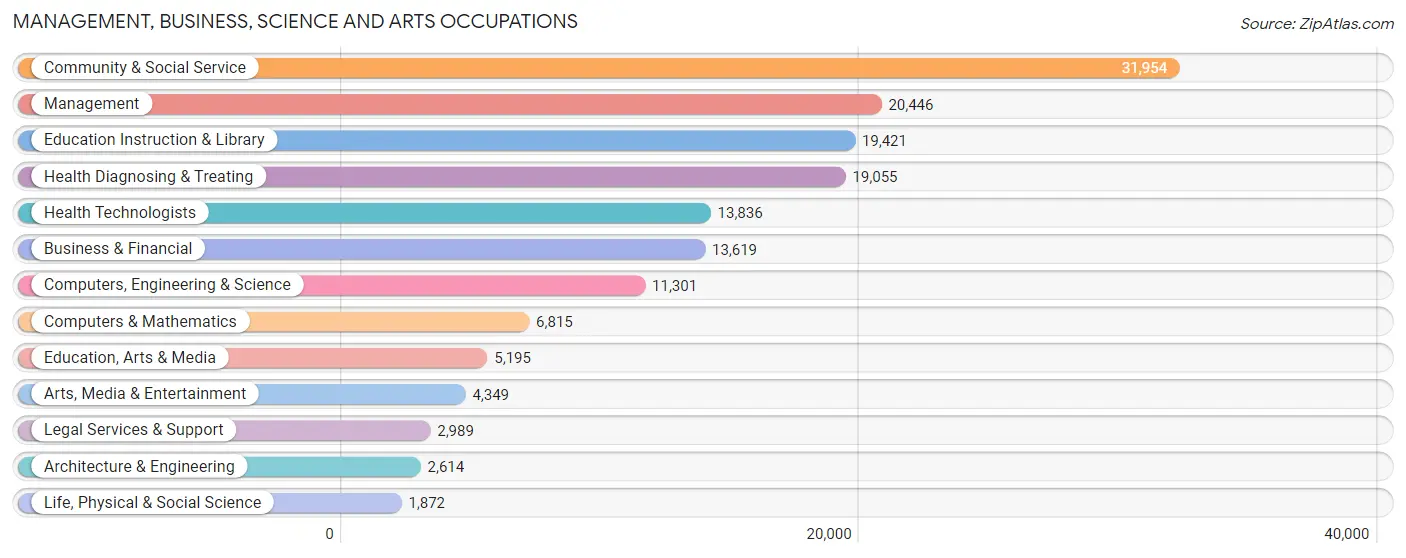
Management, Business, Science and Arts Occupations
The most common Management, Business, Science and Arts occupations in Richmond County are Community & Social Service (31,954 | 14.1%), Management (20,446 | 9.0%), Education Instruction & Library (19,421 | 8.6%), Health Diagnosing & Treating (19,055 | 8.4%), and Health Technologists (13,836 | 6.1%).
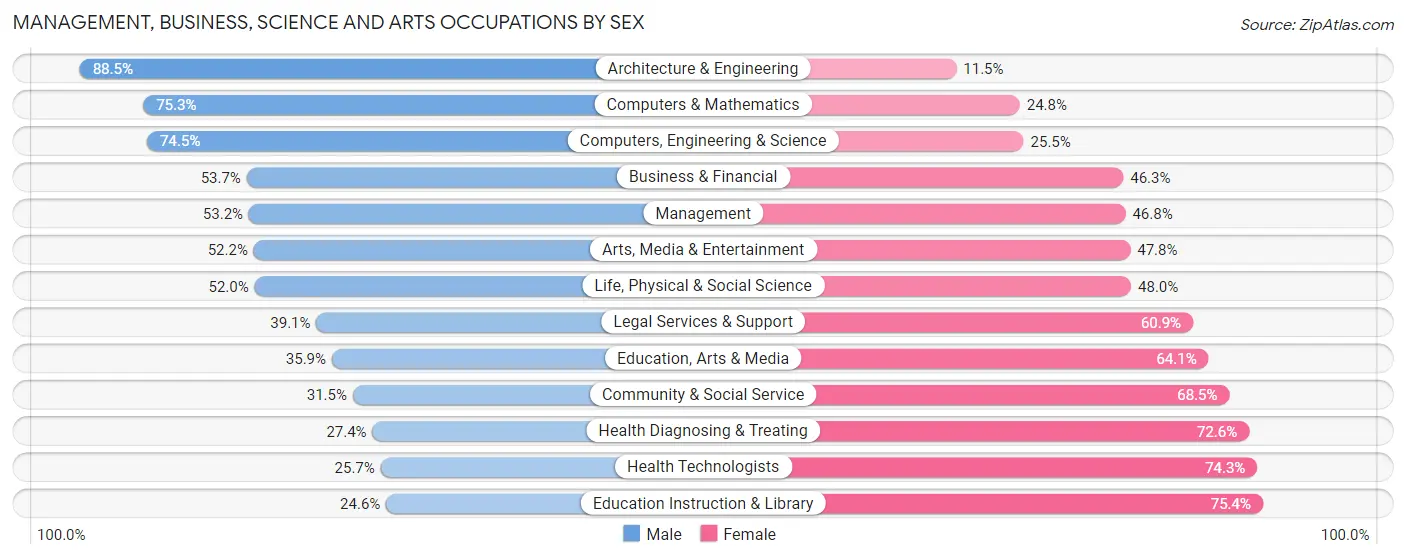
Management, Business, Science and Arts Occupations by Sex
Within the Management, Business, Science and Arts occupations in Richmond County, the most male-oriented occupations are Architecture & Engineering (88.5%), Computers & Mathematics (75.2%), and Computers, Engineering & Science (74.5%), while the most female-oriented occupations are Education Instruction & Library (75.4%), Health Technologists (74.3%), and Health Diagnosing & Treating (72.6%).
| Occupation | Male | Female |
| Management | 10,880 (53.2%) | 9,566 (46.8%) |
| Business & Financial | 7,309 (53.7%) | 6,310 (46.3%) |
| Computers, Engineering & Science | 8,415 (74.5%) | 2,886 (25.5%) |
| Computers & Mathematics | 5,128 (75.2%) | 1,687 (24.7%) |
| Architecture & Engineering | 2,313 (88.5%) | 301 (11.5%) |
| Life, Physical & Social Science | 974 (52.0%) | 898 (48.0%) |
| Community & Social Service | 10,079 (31.5%) | 21,875 (68.5%) |
| Education, Arts & Media | 1,865 (35.9%) | 3,330 (64.1%) |
| Legal Services & Support | 1,170 (39.1%) | 1,819 (60.9%) |
| Education Instruction & Library | 4,774 (24.6%) | 14,647 (75.4%) |
| Arts, Media & Entertainment | 2,270 (52.2%) | 2,079 (47.8%) |
| Health Diagnosing & Treating | 5,229 (27.4%) | 13,826 (72.6%) |
| Health Technologists | 3,561 (25.7%) | 10,275 (74.3%) |
| Total (Category) | 41,912 (43.5%) | 54,463 (56.5%) |
| Total (Overall) | 118,906 (52.6%) | 107,284 (47.4%) |
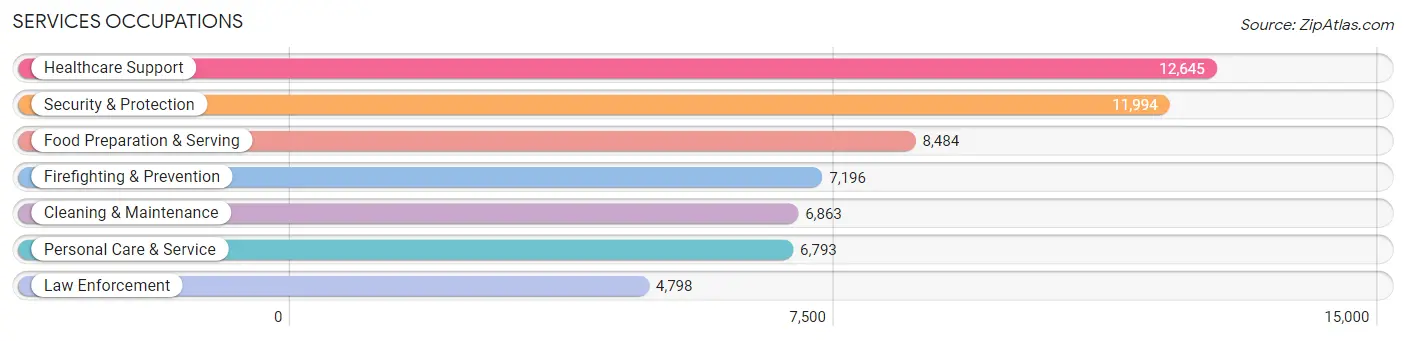
Services Occupations
The most common Services occupations in Richmond County are Healthcare Support (12,645 | 5.6%), Security & Protection (11,994 | 5.3%), Food Preparation & Serving (8,484 | 3.7%), Firefighting & Prevention (7,196 | 3.2%), and Cleaning & Maintenance (6,863 | 3.0%).
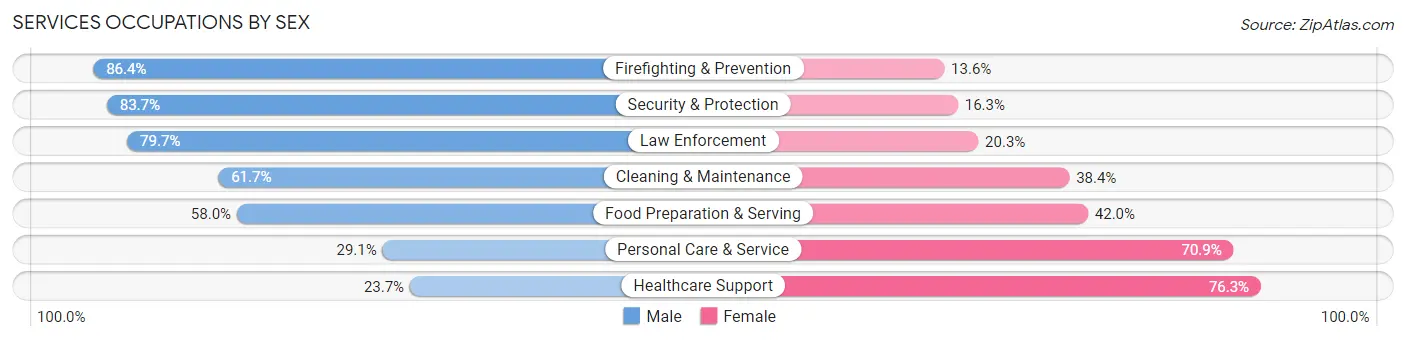
Services Occupations by Sex
Within the Services occupations in Richmond County, the most male-oriented occupations are Firefighting & Prevention (86.4%), Security & Protection (83.7%), and Law Enforcement (79.7%), while the most female-oriented occupations are Healthcare Support (76.3%), Personal Care & Service (70.9%), and Food Preparation & Serving (42.0%).
| Occupation | Male | Female |
| Healthcare Support | 2,996 (23.7%) | 9,649 (76.3%) |
| Security & Protection | 10,041 (83.7%) | 1,953 (16.3%) |
| Firefighting & Prevention | 6,218 (86.4%) | 978 (13.6%) |
| Law Enforcement | 3,823 (79.7%) | 975 (20.3%) |
| Food Preparation & Serving | 4,917 (58.0%) | 3,567 (42.0%) |
| Cleaning & Maintenance | 4,231 (61.7%) | 2,632 (38.4%) |
| Personal Care & Service | 1,978 (29.1%) | 4,815 (70.9%) |
| Total (Category) | 24,163 (51.6%) | 22,616 (48.3%) |
| Total (Overall) | 118,906 (52.6%) | 107,284 (47.4%) |
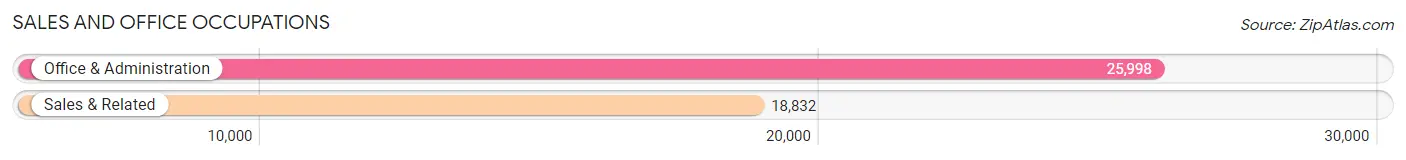
Sales and Office Occupations
The most common Sales and Office occupations in Richmond County are Office & Administration (25,998 | 11.5%), and Sales & Related (18,832 | 8.3%).
Sales and Office Occupations by Sex
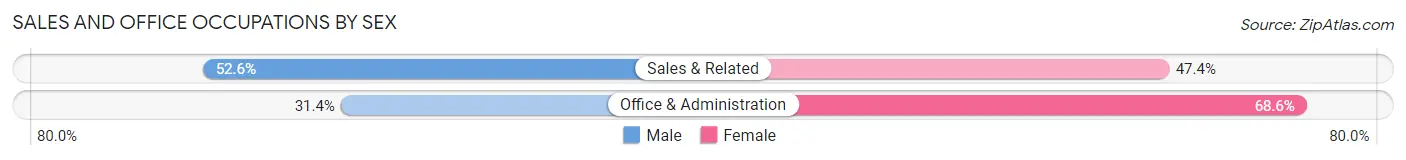
| Occupation | Male | Female |
| Sales & Related | 9,903 (52.6%) | 8,929 (47.4%) |
| Office & Administration | 8,155 (31.4%) | 17,843 (68.6%) |
| Total (Category) | 18,058 (40.3%) | 26,772 (59.7%) |
| Total (Overall) | 118,906 (52.6%) | 107,284 (47.4%) |
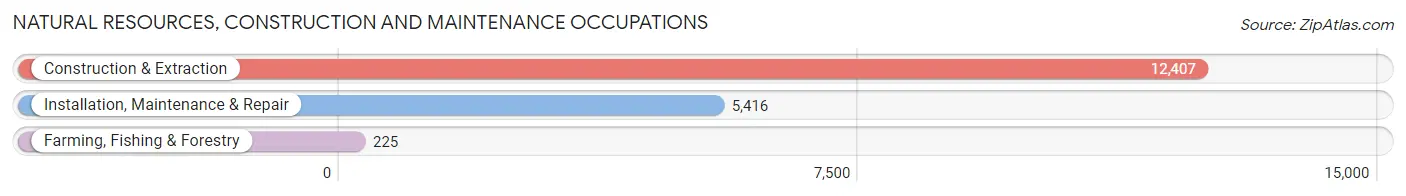
Natural Resources, Construction and Maintenance Occupations
The most common Natural Resources, Construction and Maintenance occupations in Richmond County are Construction & Extraction (12,407 | 5.5%), Installation, Maintenance & Repair (5,416 | 2.4%), and Farming, Fishing & Forestry (225 | 0.1%).
Natural Resources, Construction and Maintenance Occupations by Sex
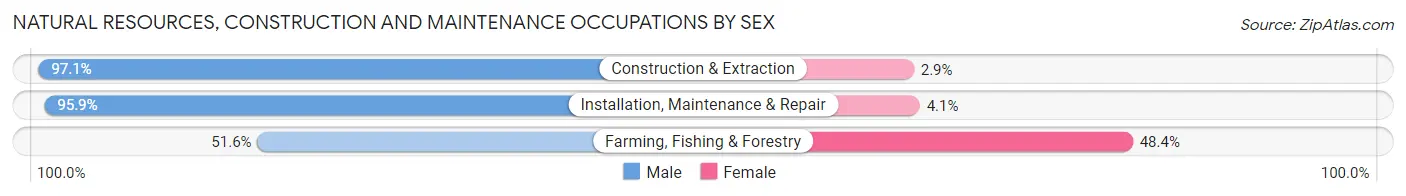
| Occupation | Male | Female |
| Farming, Fishing & Forestry | 116 (51.6%) | 109 (48.4%) |
| Construction & Extraction | 12,050 (97.1%) | 357 (2.9%) |
| Installation, Maintenance & Repair | 5,193 (95.9%) | 223 (4.1%) |
| Total (Category) | 17,359 (96.2%) | 689 (3.8%) |
| Total (Overall) | 118,906 (52.6%) | 107,284 (47.4%) |
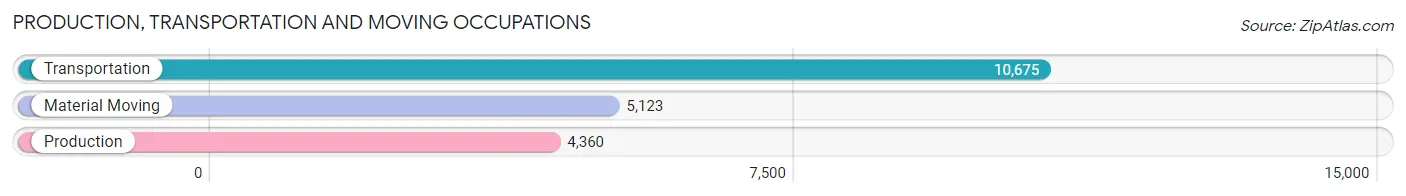
Production, Transportation and Moving Occupations
The most common Production, Transportation and Moving occupations in Richmond County are Transportation (10,675 | 4.7%), Material Moving (5,123 | 2.3%), and Production (4,360 | 1.9%).
Production, Transportation and Moving Occupations by Sex
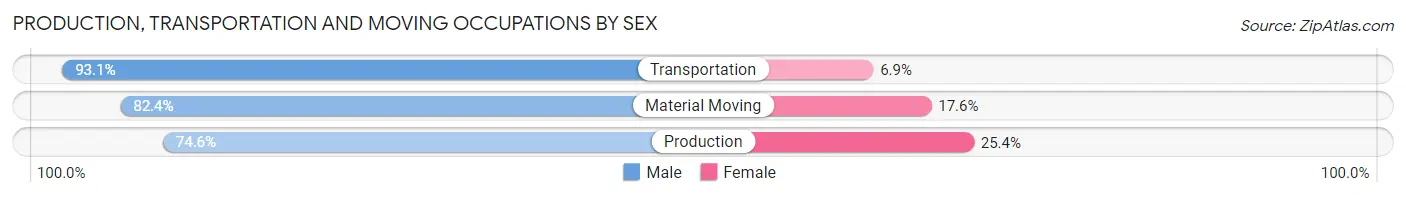
| Occupation | Male | Female |
| Production | 3,254 (74.6%) | 1,106 (25.4%) |
| Transportation | 9,937 (93.1%) | 738 (6.9%) |
| Material Moving | 4,223 (82.4%) | 900 (17.6%) |
| Total (Category) | 17,414 (86.4%) | 2,744 (13.6%) |
| Total (Overall) | 118,906 (52.6%) | 107,284 (47.4%) |
Employment Industries by Sex in Richmond County
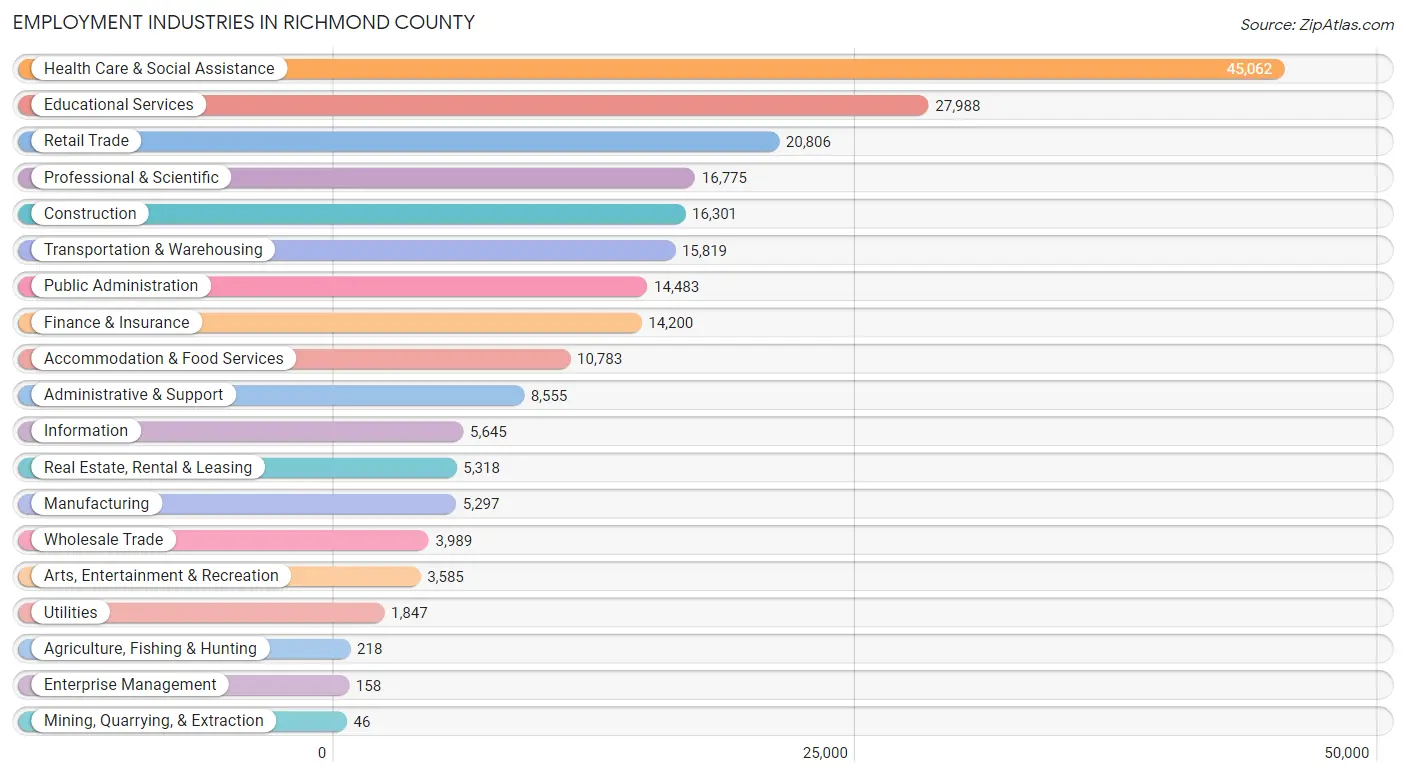
Employment Industries in Richmond County
The major employment industries in Richmond County include Health Care & Social Assistance (45,062 | 19.9%), Educational Services (27,988 | 12.4%), Retail Trade (20,806 | 9.2%), Professional & Scientific (16,775 | 7.4%), and Construction (16,301 | 7.2%).
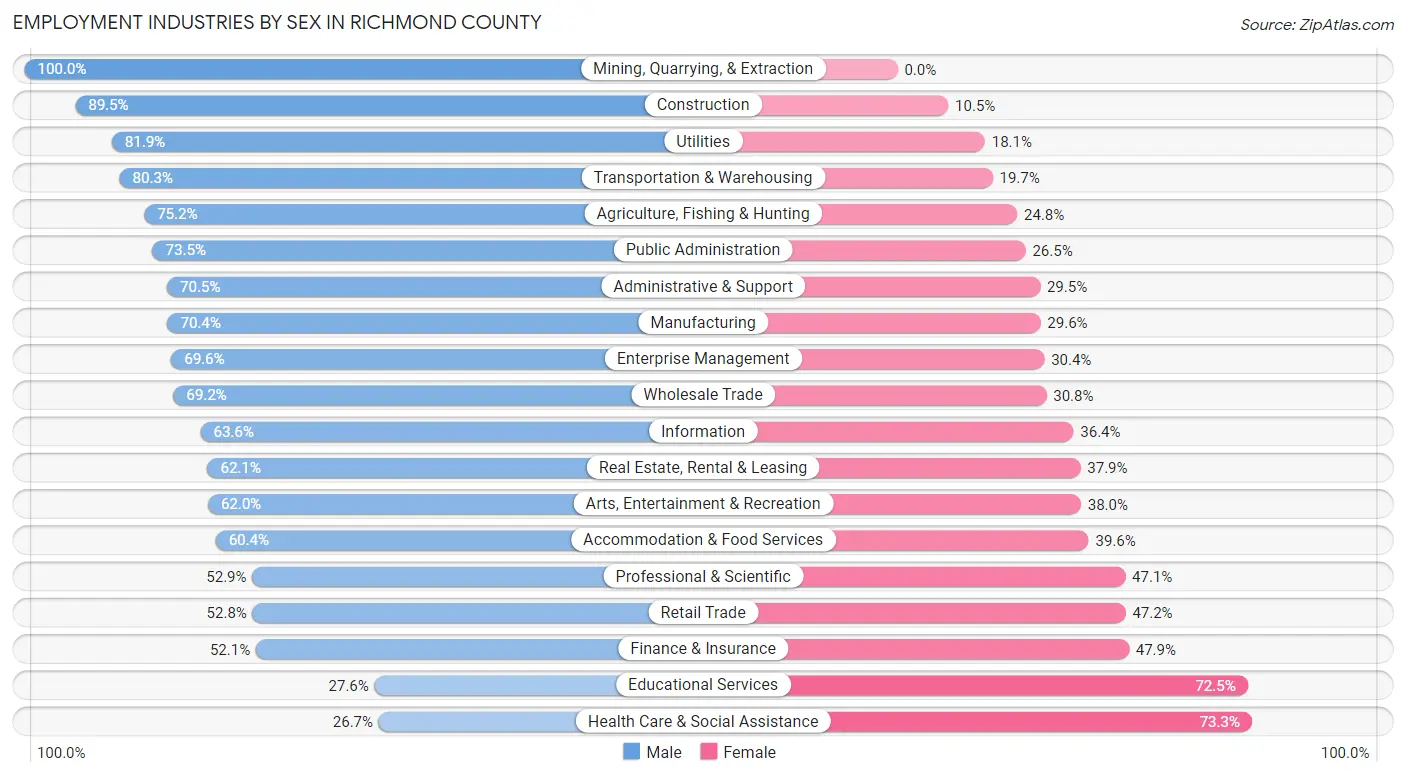
Employment Industries by Sex in Richmond County
The Richmond County industries that see more men than women are Mining, Quarrying, & Extraction (100.0%), Construction (89.5%), and Utilities (81.9%), whereas the industries that tend to have a higher number of women are Health Care & Social Assistance (73.3%), Educational Services (72.5%), and Finance & Insurance (47.9%).
| Industry | Male | Female |
| Agriculture, Fishing & Hunting | 164 (75.2%) | 54 (24.8%) |
| Mining, Quarrying, & Extraction | 46 (100.0%) | 0 (0.0%) |
| Construction | 14,589 (89.5%) | 1,712 (10.5%) |
| Manufacturing | 3,729 (70.4%) | 1,568 (29.6%) |
| Wholesale Trade | 2,760 (69.2%) | 1,229 (30.8%) |
| Retail Trade | 10,986 (52.8%) | 9,820 (47.2%) |
| Transportation & Warehousing | 12,706 (80.3%) | 3,113 (19.7%) |
| Utilities | 1,513 (81.9%) | 334 (18.1%) |
| Information | 3,589 (63.6%) | 2,056 (36.4%) |
| Finance & Insurance | 7,400 (52.1%) | 6,800 (47.9%) |
| Real Estate, Rental & Leasing | 3,304 (62.1%) | 2,014 (37.9%) |
| Professional & Scientific | 8,868 (52.9%) | 7,907 (47.1%) |
| Enterprise Management | 110 (69.6%) | 48 (30.4%) |
| Administrative & Support | 6,030 (70.5%) | 2,525 (29.5%) |
| Educational Services | 7,712 (27.6%) | 20,276 (72.5%) |
| Health Care & Social Assistance | 12,018 (26.7%) | 33,044 (73.3%) |
| Arts, Entertainment & Recreation | 2,224 (62.0%) | 1,361 (38.0%) |
| Accommodation & Food Services | 6,517 (60.4%) | 4,266 (39.6%) |
| Public Administration | 10,643 (73.5%) | 3,840 (26.5%) |
| Total | 118,906 (52.6%) | 107,284 (47.4%) |
Education in Richmond County
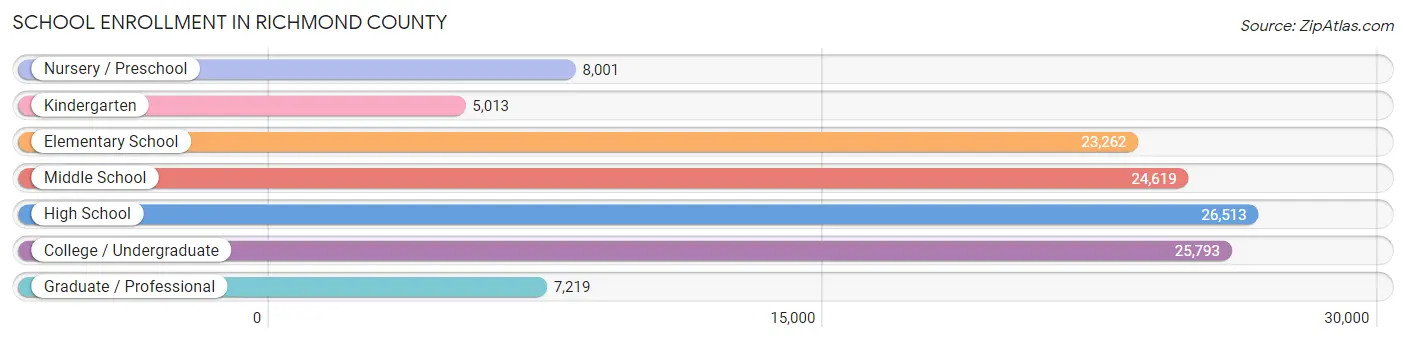
School Enrollment in Richmond County
The most common levels of schooling among the 120,420 students in Richmond County are high school (26,513 | 22.0%), college / undergraduate (25,793 | 21.4%), and middle school (24,619 | 20.4%).
| School Level | # Students | % Students |
| Nursery / Preschool | 8,001 | 6.6% |
| Kindergarten | 5,013 | 4.2% |
| Elementary School | 23,262 | 19.3% |
| Middle School | 24,619 | 20.4% |
| High School | 26,513 | 22.0% |
| College / Undergraduate | 25,793 | 21.4% |
| Graduate / Professional | 7,219 | 6.0% |
| Total | 120,420 | 100.0% |
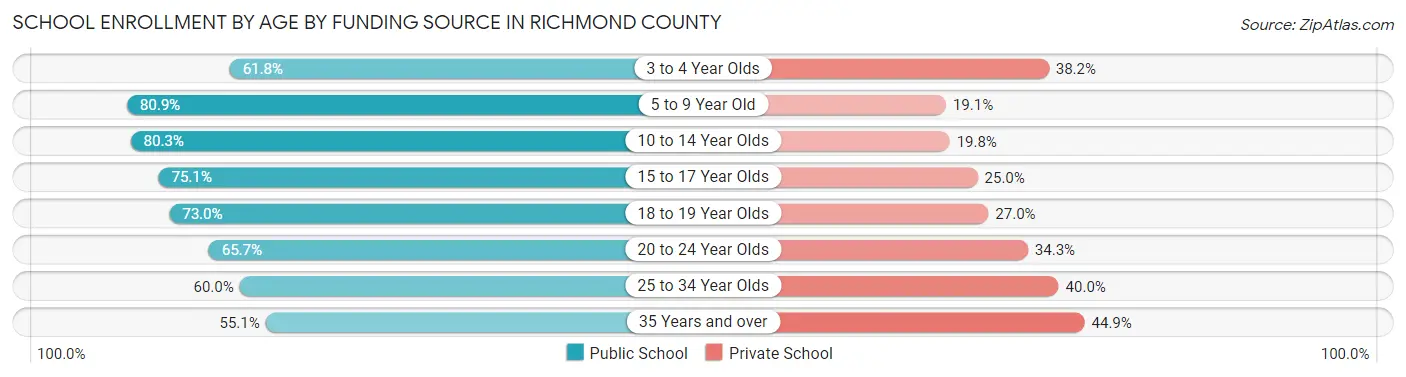
School Enrollment by Age by Funding Source in Richmond County
Out of a total of 120,420 students who are enrolled in schools in Richmond County, 31,430 (26.1%) attend a private institution, while the remaining 88,990 (73.9%) are enrolled in public schools. The age group of 35 years and over has the highest likelihood of being enrolled in private schools, with 2,200 (44.9% in the age bracket) enrolled. Conversely, the age group of 5 to 9 year old has the lowest likelihood of being enrolled in a private school, with 22,133 (80.9% in the age bracket) attending a public institution.
| Age Bracket | Public School | Private School |
| 3 to 4 Year Olds | 4,597 (61.8%) | 2,843 (38.2%) |
| 5 to 9 Year Old | 22,133 (80.9%) | 5,211 (19.1%) |
| 10 to 14 Year Olds | 24,569 (80.2%) | 6,046 (19.8%) |
| 15 to 17 Year Olds | 14,129 (75.0%) | 4,697 (24.9%) |
| 18 to 19 Year Olds | 6,962 (73.0%) | 2,570 (27.0%) |
| 20 to 24 Year Olds | 9,971 (65.7%) | 5,211 (34.3%) |
| 25 to 34 Year Olds | 3,945 (60.0%) | 2,634 (40.0%) |
| 35 Years and over | 2,702 (55.1%) | 2,200 (44.9%) |
| Total | 88,990 (73.9%) | 31,430 (26.1%) |
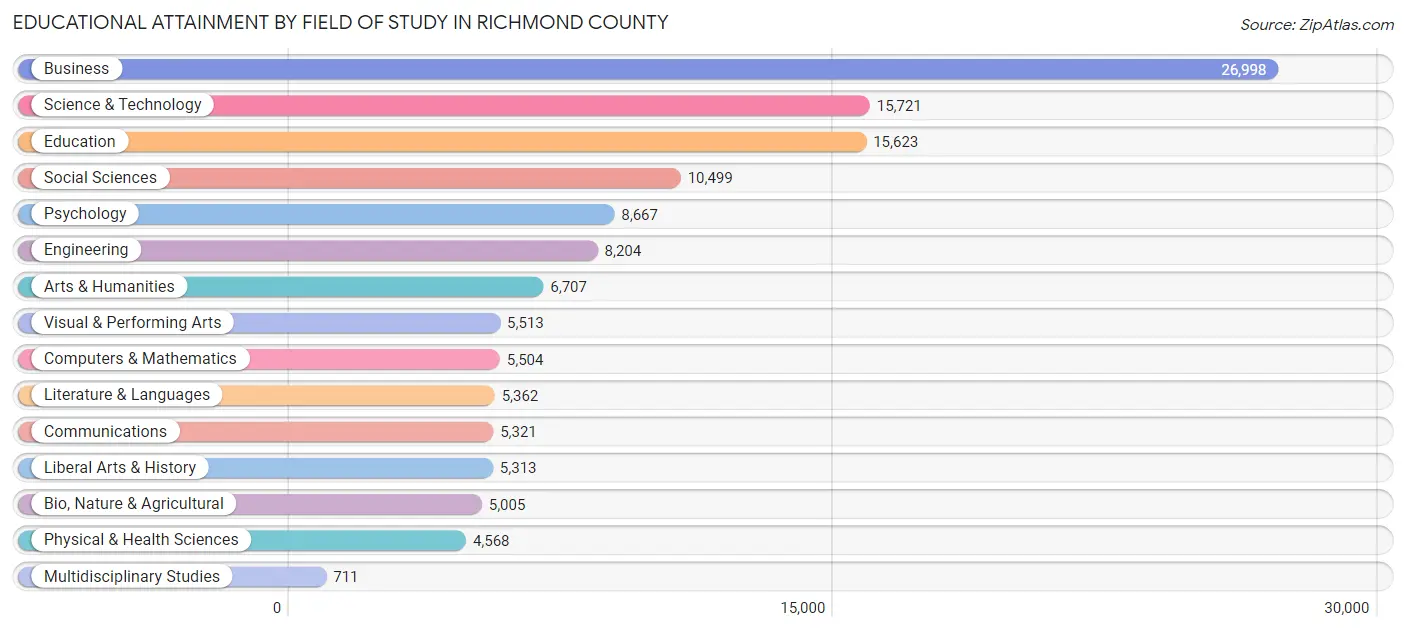
Educational Attainment by Field of Study in Richmond County
Business (26,998 | 20.8%), science & technology (15,721 | 12.1%), education (15,623 | 12.0%), social sciences (10,499 | 8.1%), and psychology (8,667 | 6.7%) are the most common fields of study among 129,716 individuals in Richmond County who have obtained a bachelor's degree or higher.
| Field of Study | # Graduates | % Graduates |
| Computers & Mathematics | 5,504 | 4.2% |
| Bio, Nature & Agricultural | 5,005 | 3.9% |
| Physical & Health Sciences | 4,568 | 3.5% |
| Psychology | 8,667 | 6.7% |
| Social Sciences | 10,499 | 8.1% |
| Engineering | 8,204 | 6.3% |
| Multidisciplinary Studies | 711 | 0.5% |
| Science & Technology | 15,721 | 12.1% |
| Business | 26,998 | 20.8% |
| Education | 15,623 | 12.0% |
| Literature & Languages | 5,362 | 4.1% |
| Liberal Arts & History | 5,313 | 4.1% |
| Visual & Performing Arts | 5,513 | 4.3% |
| Communications | 5,321 | 4.1% |
| Arts & Humanities | 6,707 | 5.2% |
| Total | 129,716 | 100.0% |
Transportation & Commute in Richmond County
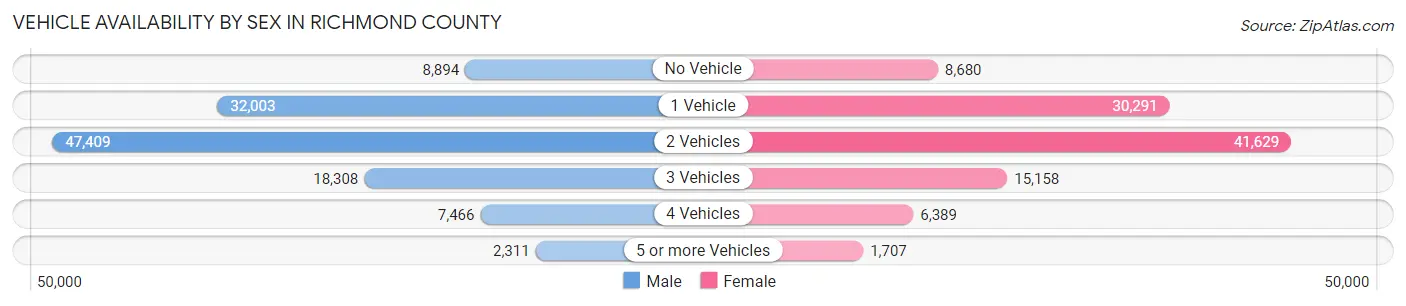
Vehicle Availability by Sex in Richmond County
The most prevalent vehicle ownership categories in Richmond County are males with 2 vehicles (47,409, accounting for 40.7%) and females with 2 vehicles (41,629, making up 45.7%).
| Vehicles Available | Male | Female |
| No Vehicle | 8,894 (7.6%) | 8,680 (8.4%) |
| 1 Vehicle | 32,003 (27.5%) | 30,291 (29.2%) |
| 2 Vehicles | 47,409 (40.7%) | 41,629 (40.1%) |
| 3 Vehicles | 18,308 (15.7%) | 15,158 (14.6%) |
| 4 Vehicles | 7,466 (6.4%) | 6,389 (6.1%) |
| 5 or more Vehicles | 2,311 (2.0%) | 1,707 (1.6%) |
| Total | 116,391 (100.0%) | 103,854 (100.0%) |
Commute Time in Richmond County
The most frequently occuring commute durations in Richmond County are 60 to 89 minutes (41,033 commuters, 20.3%), 90 or more minutes (27,308 commuters, 13.5%), and 30 to 34 minutes (23,459 commuters, 11.6%).
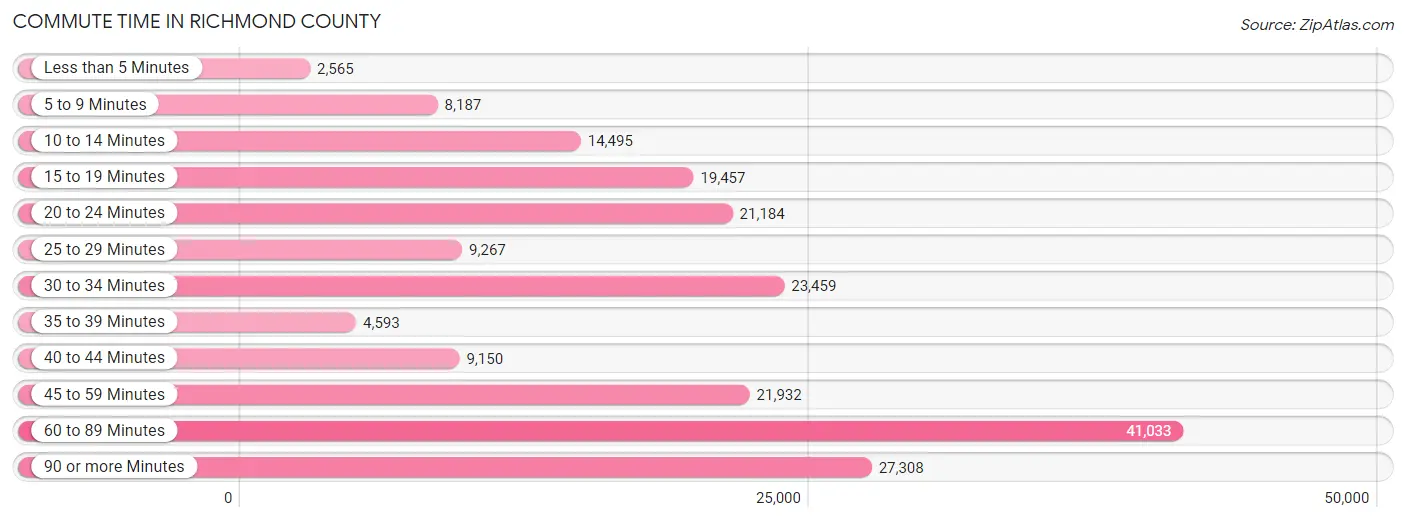
| Commute Time | # Commuters | % Commuters |
| Less than 5 Minutes | 2,565 | 1.3% |
| 5 to 9 Minutes | 8,187 | 4.0% |
| 10 to 14 Minutes | 14,495 | 7.1% |
| 15 to 19 Minutes | 19,457 | 9.6% |
| 20 to 24 Minutes | 21,184 | 10.4% |
| 25 to 29 Minutes | 9,267 | 4.6% |
| 30 to 34 Minutes | 23,459 | 11.6% |
| 35 to 39 Minutes | 4,593 | 2.3% |
| 40 to 44 Minutes | 9,150 | 4.5% |
| 45 to 59 Minutes | 21,932 | 10.8% |
| 60 to 89 Minutes | 41,033 | 20.3% |
| 90 or more Minutes | 27,308 | 13.5% |
Commute Time by Sex in Richmond County
The most common commute times in Richmond County are 60 to 89 minutes (24,886 commuters, 23.1%) for males and 60 to 89 minutes (16,147 commuters, 17.0%) for females.
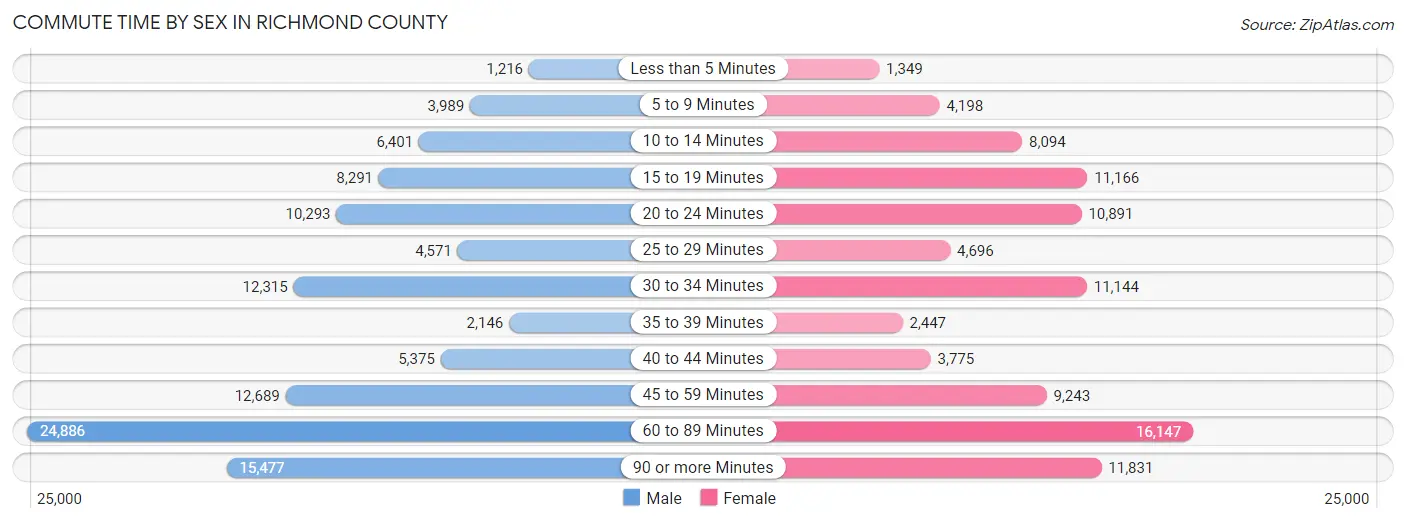
| Commute Time | Male | Female |
| Less than 5 Minutes | 1,216 (1.1%) | 1,349 (1.4%) |
| 5 to 9 Minutes | 3,989 (3.7%) | 4,198 (4.4%) |
| 10 to 14 Minutes | 6,401 (5.9%) | 8,094 (8.5%) |
| 15 to 19 Minutes | 8,291 (7.7%) | 11,166 (11.8%) |
| 20 to 24 Minutes | 10,293 (9.6%) | 10,891 (11.5%) |
| 25 to 29 Minutes | 4,571 (4.3%) | 4,696 (4.9%) |
| 30 to 34 Minutes | 12,315 (11.4%) | 11,144 (11.7%) |
| 35 to 39 Minutes | 2,146 (2.0%) | 2,447 (2.6%) |
| 40 to 44 Minutes | 5,375 (5.0%) | 3,775 (4.0%) |
| 45 to 59 Minutes | 12,689 (11.8%) | 9,243 (9.7%) |
| 60 to 89 Minutes | 24,886 (23.1%) | 16,147 (17.0%) |
| 90 or more Minutes | 15,477 (14.4%) | 11,831 (12.5%) |
Time of Departure to Work by Sex in Richmond County
The most frequent times of departure to work in Richmond County are 7:00 AM to 7:29 AM (15,929, 14.8%) for males and 7:00 AM to 7:29 AM (18,274, 19.2%) for females.
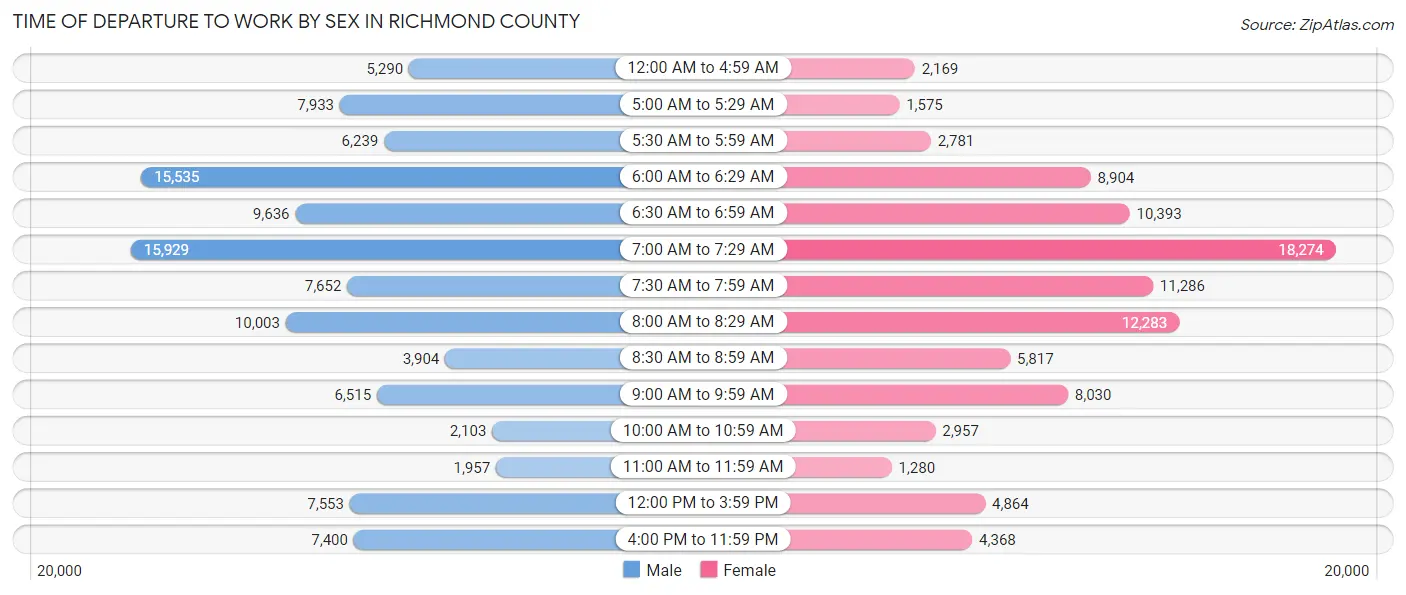
| Time of Departure | Male | Female |
| 12:00 AM to 4:59 AM | 5,290 (4.9%) | 2,169 (2.3%) |
| 5:00 AM to 5:29 AM | 7,933 (7.4%) | 1,575 (1.7%) |
| 5:30 AM to 5:59 AM | 6,239 (5.8%) | 2,781 (2.9%) |
| 6:00 AM to 6:29 AM | 15,535 (14.4%) | 8,904 (9.4%) |
| 6:30 AM to 6:59 AM | 9,636 (8.9%) | 10,393 (10.9%) |
| 7:00 AM to 7:29 AM | 15,929 (14.8%) | 18,274 (19.2%) |
| 7:30 AM to 7:59 AM | 7,652 (7.1%) | 11,286 (11.9%) |
| 8:00 AM to 8:29 AM | 10,003 (9.3%) | 12,283 (12.9%) |
| 8:30 AM to 8:59 AM | 3,904 (3.6%) | 5,817 (6.1%) |
| 9:00 AM to 9:59 AM | 6,515 (6.0%) | 8,030 (8.5%) |
| 10:00 AM to 10:59 AM | 2,103 (1.9%) | 2,957 (3.1%) |
| 11:00 AM to 11:59 AM | 1,957 (1.8%) | 1,280 (1.3%) |
| 12:00 PM to 3:59 PM | 7,553 (7.0%) | 4,864 (5.1%) |
| 4:00 PM to 11:59 PM | 7,400 (6.9%) | 4,368 (4.6%) |
| Total | 107,649 (100.0%) | 94,981 (100.0%) |
Housing Occupancy in Richmond County
Occupancy by Ownership in Richmond County
Of the total 170,000 dwellings in Richmond County, owner-occupied units account for 116,662 (68.6%), while renter-occupied units make up 53,338 (31.4%).
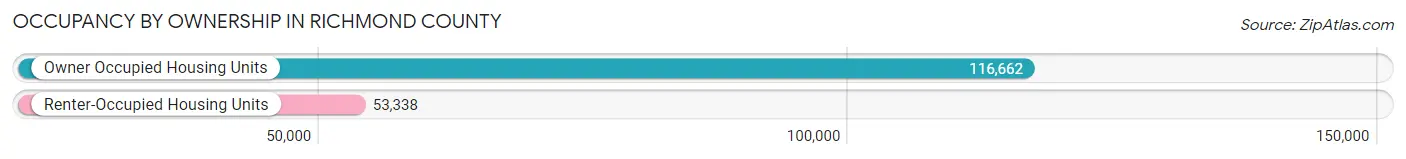
| Occupancy | # Housing Units | % Housing Units |
| Owner Occupied Housing Units | 116,662 | 68.6% |
| Renter-Occupied Housing Units | 53,338 | 31.4% |
| Total Occupied Housing Units | 170,000 | 100.0% |
Occupancy by Household Size in Richmond County
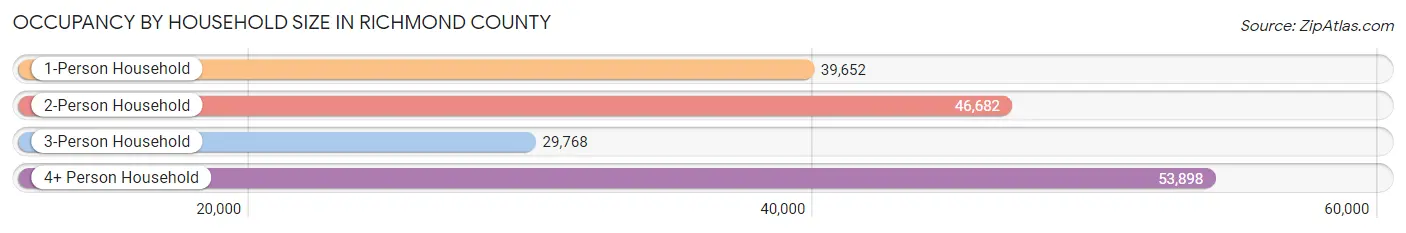
| Household Size | # Housing Units | % Housing Units |
| 1-Person Household | 39,652 | 23.3% |
| 2-Person Household | 46,682 | 27.5% |
| 3-Person Household | 29,768 | 17.5% |
| 4+ Person Household | 53,898 | 31.7% |
| Total Housing Units | 170,000 | 100.0% |
Occupancy by Ownership by Household Size in Richmond County
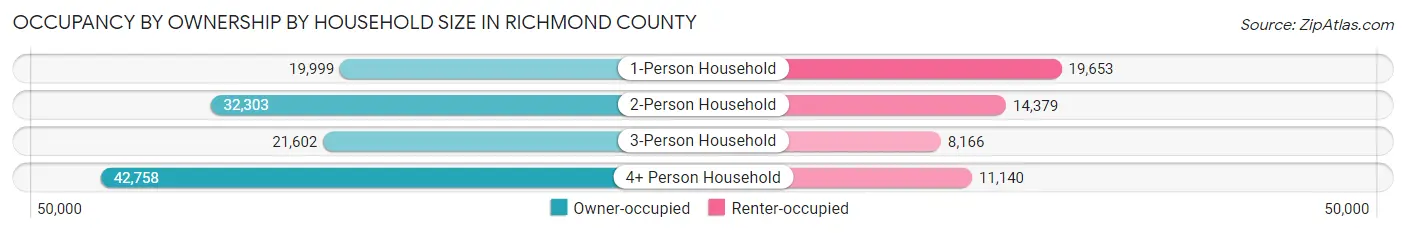
| Household Size | Owner-occupied | Renter-occupied |
| 1-Person Household | 19,999 (50.4%) | 19,653 (49.6%) |
| 2-Person Household | 32,303 (69.2%) | 14,379 (30.8%) |
| 3-Person Household | 21,602 (72.6%) | 8,166 (27.4%) |
| 4+ Person Household | 42,758 (79.3%) | 11,140 (20.7%) |
| Total Housing Units | 116,662 (68.6%) | 53,338 (31.4%) |
Occupancy by Educational Attainment in Richmond County
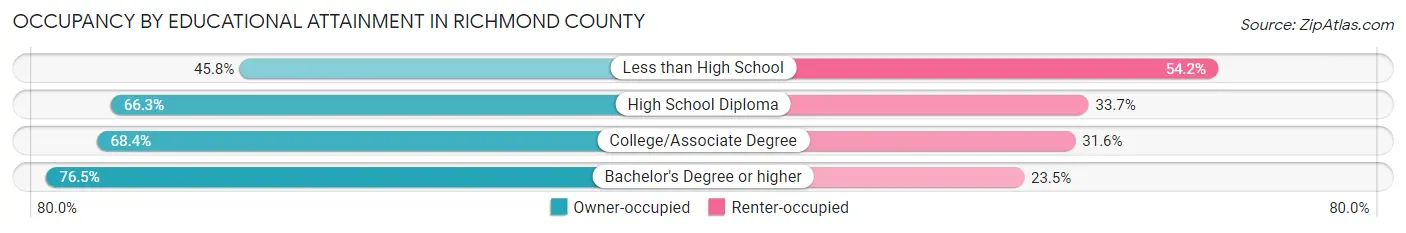
| Household Size | Owner-occupied | Renter-occupied |
| Less than High School | 7,490 (45.8%) | 8,857 (54.2%) |
| High School Diploma | 31,316 (66.3%) | 15,913 (33.7%) |
| College/Associate Degree | 30,266 (68.4%) | 13,978 (31.6%) |
| Bachelor's Degree or higher | 47,590 (76.5%) | 14,590 (23.5%) |
Occupancy by Age of Householder in Richmond County
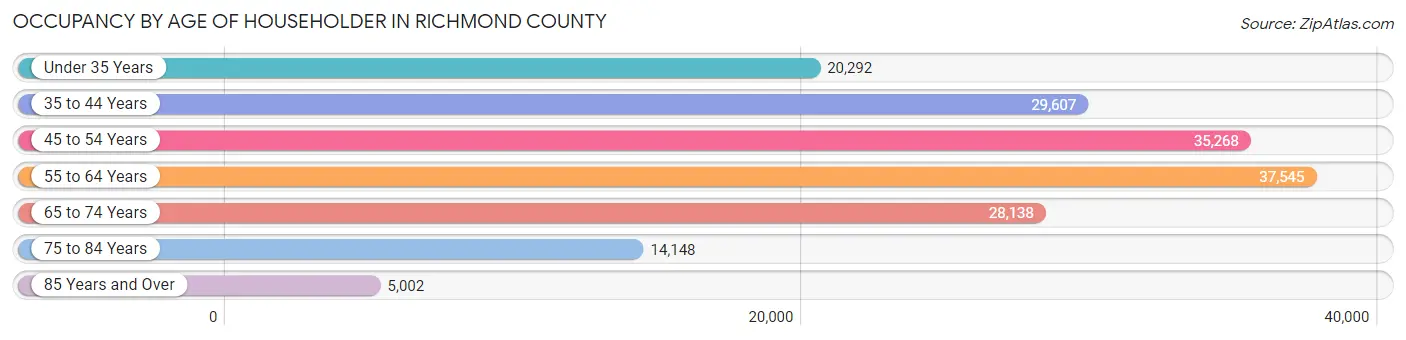
| Age Bracket | # Households | % Households |
| Under 35 Years | 20,292 | 11.9% |
| 35 to 44 Years | 29,607 | 17.4% |
| 45 to 54 Years | 35,268 | 20.7% |
| 55 to 64 Years | 37,545 | 22.1% |
| 65 to 74 Years | 28,138 | 16.6% |
| 75 to 84 Years | 14,148 | 8.3% |
| 85 Years and Over | 5,002 | 2.9% |
| Total | 170,000 | 100.0% |
Housing Finances in Richmond County
Median Income by Occupancy in Richmond County
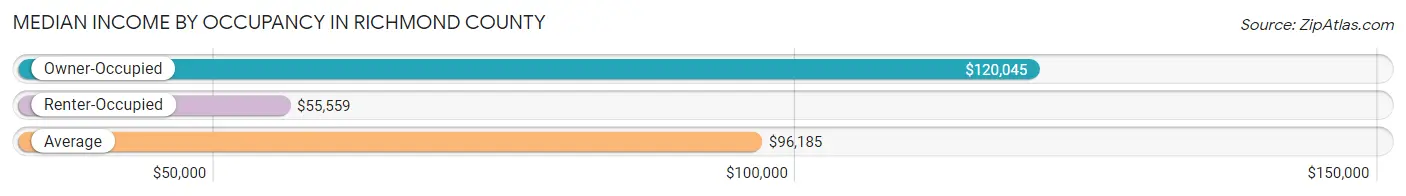
| Occupancy Type | # Households | Median Income |
| Owner-Occupied | 116,662 (68.6%) | $120,045 |
| Renter-Occupied | 53,338 (31.4%) | $55,559 |
| Average | 170,000 (100.0%) | $96,185 |
Occupancy by Householder Income Bracket in Richmond County
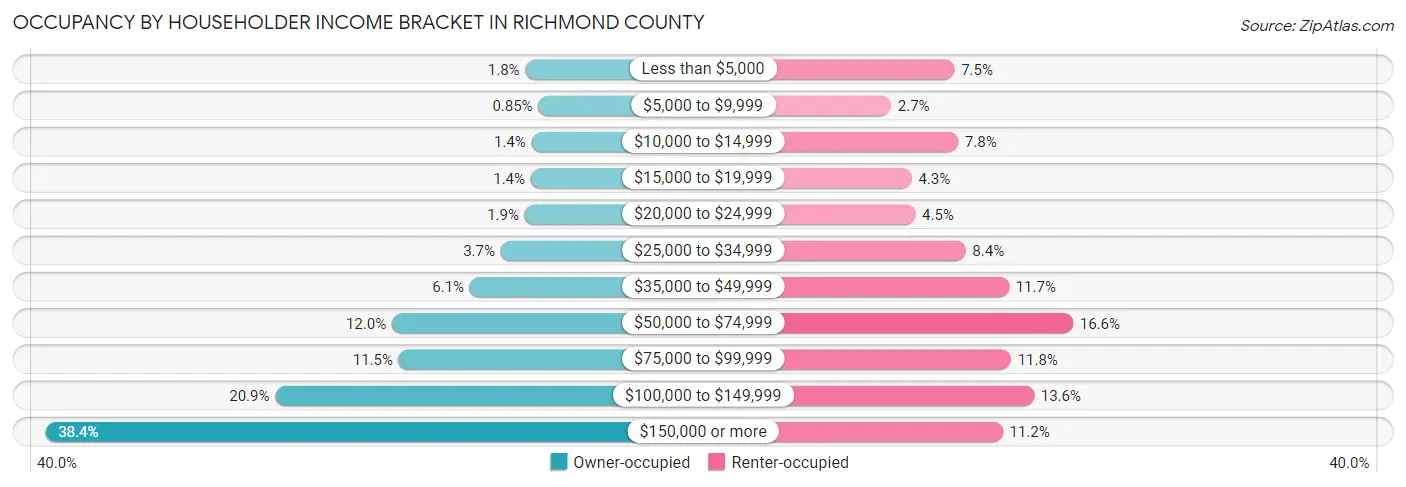
| Income Bracket | Owner-occupied | Renter-occupied |
| Less than $5,000 | 2,145 (1.8%) | 4,010 (7.5%) |
| $5,000 to $9,999 | 992 (0.9%) | 1,436 (2.7%) |
| $10,000 to $14,999 | 1,599 (1.4%) | 4,163 (7.8%) |
| $15,000 to $19,999 | 1,671 (1.4%) | 2,270 (4.3%) |
| $20,000 to $24,999 | 2,207 (1.9%) | 2,423 (4.5%) |
| $25,000 to $34,999 | 4,342 (3.7%) | 4,462 (8.4%) |
| $35,000 to $49,999 | 7,086 (6.1%) | 6,222 (11.7%) |
| $50,000 to $74,999 | 14,006 (12.0%) | 8,829 (16.6%) |
| $75,000 to $99,999 | 13,400 (11.5%) | 6,306 (11.8%) |
| $100,000 to $149,999 | 24,384 (20.9%) | 7,244 (13.6%) |
| $150,000 or more | 44,830 (38.4%) | 5,973 (11.2%) |
| Total | 116,662 (100.0%) | 53,338 (100.0%) |
Monthly Housing Cost Tiers in Richmond County
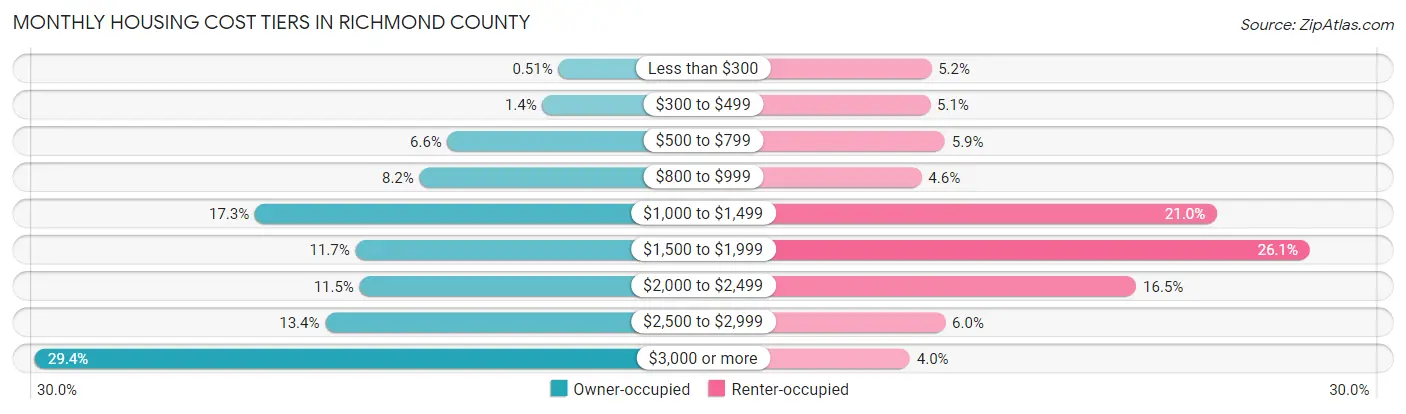
| Monthly Cost | Owner-occupied | Renter-occupied |
| Less than $300 | 598 (0.5%) | 2,761 (5.2%) |
| $300 to $499 | 1,616 (1.4%) | 2,732 (5.1%) |
| $500 to $799 | 7,733 (6.6%) | 3,162 (5.9%) |
| $800 to $999 | 9,540 (8.2%) | 2,474 (4.6%) |
| $1,000 to $1,499 | 20,145 (17.3%) | 11,186 (21.0%) |
| $1,500 to $1,999 | 13,673 (11.7%) | 13,916 (26.1%) |
| $2,000 to $2,499 | 13,406 (11.5%) | 8,799 (16.5%) |
| $2,500 to $2,999 | 15,617 (13.4%) | 3,174 (5.9%) |
| $3,000 or more | 34,334 (29.4%) | 2,131 (4.0%) |
| Total | 116,662 (100.0%) | 53,338 (100.0%) |
Physical Housing Characteristics in Richmond County
Housing Structures in Richmond County
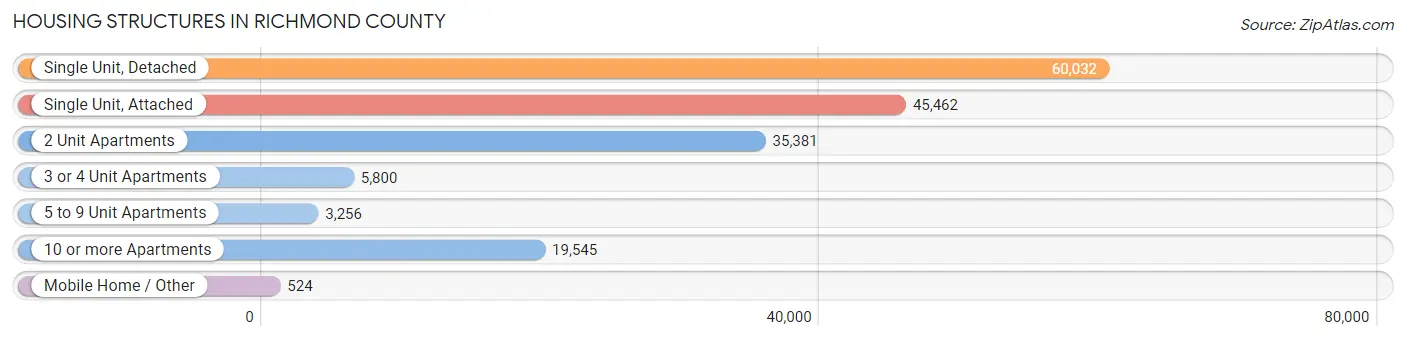
| Structure Type | # Housing Units | % Housing Units |
| Single Unit, Detached | 60,032 | 35.3% |
| Single Unit, Attached | 45,462 | 26.7% |
| 2 Unit Apartments | 35,381 | 20.8% |
| 3 or 4 Unit Apartments | 5,800 | 3.4% |
| 5 to 9 Unit Apartments | 3,256 | 1.9% |
| 10 or more Apartments | 19,545 | 11.5% |
| Mobile Home / Other | 524 | 0.3% |
| Total | 170,000 | 100.0% |
Housing Structures by Occupancy in Richmond County
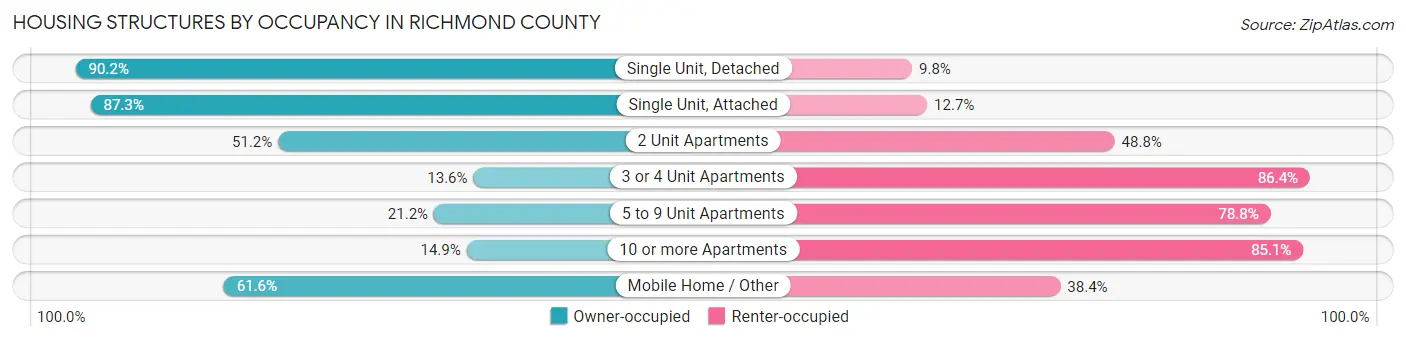
| Structure Type | Owner-occupied | Renter-occupied |
| Single Unit, Detached | 54,149 (90.2%) | 5,883 (9.8%) |
| Single Unit, Attached | 39,686 (87.3%) | 5,776 (12.7%) |
| 2 Unit Apartments | 18,112 (51.2%) | 17,269 (48.8%) |
| 3 or 4 Unit Apartments | 789 (13.6%) | 5,011 (86.4%) |
| 5 to 9 Unit Apartments | 690 (21.2%) | 2,566 (78.8%) |
| 10 or more Apartments | 2,913 (14.9%) | 16,632 (85.1%) |
| Mobile Home / Other | 323 (61.6%) | 201 (38.4%) |
| Total | 116,662 (68.6%) | 53,338 (31.4%) |
Housing Structures by Number of Rooms in Richmond County
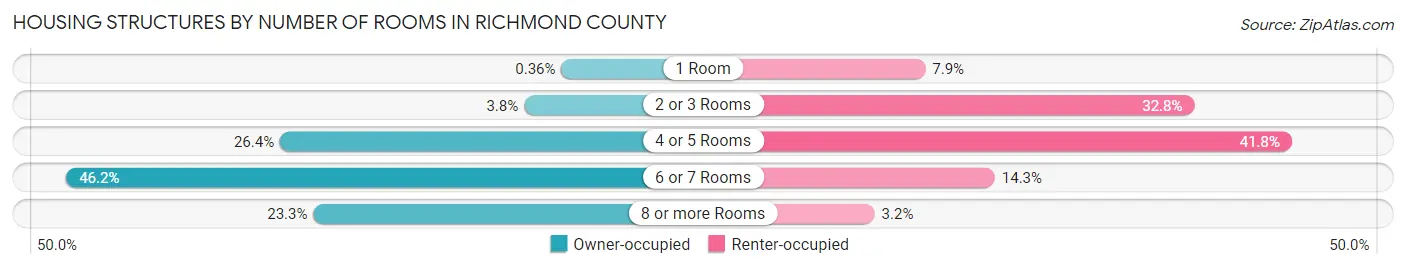
| Number of Rooms | Owner-occupied | Renter-occupied |
| 1 Room | 418 (0.4%) | 4,212 (7.9%) |
| 2 or 3 Rooms | 4,445 (3.8%) | 17,478 (32.8%) |
| 4 or 5 Rooms | 30,776 (26.4%) | 22,291 (41.8%) |
| 6 or 7 Rooms | 53,837 (46.2%) | 7,645 (14.3%) |
| 8 or more Rooms | 27,186 (23.3%) | 1,712 (3.2%) |
| Total | 116,662 (100.0%) | 53,338 (100.0%) |
Housing Structure by Heating Type in Richmond County
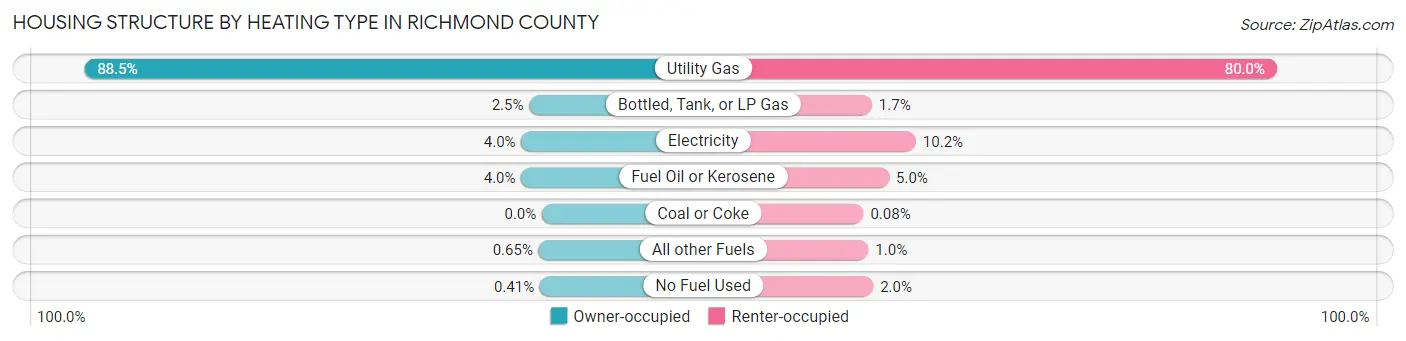
| Heating Type | Owner-occupied | Renter-occupied |
| Utility Gas | 103,210 (88.5%) | 42,646 (79.9%) |
| Bottled, Tank, or LP Gas | 2,877 (2.5%) | 913 (1.7%) |
| Electricity | 4,657 (4.0%) | 5,444 (10.2%) |
| Fuel Oil or Kerosene | 4,679 (4.0%) | 2,689 (5.0%) |
| Coal or Coke | 0 (0.0%) | 41 (0.1%) |
| All other Fuels | 763 (0.6%) | 553 (1.0%) |
| No Fuel Used | 476 (0.4%) | 1,052 (2.0%) |
| Total | 116,662 (100.0%) | 53,338 (100.0%) |
Household Vehicle Usage in Richmond County
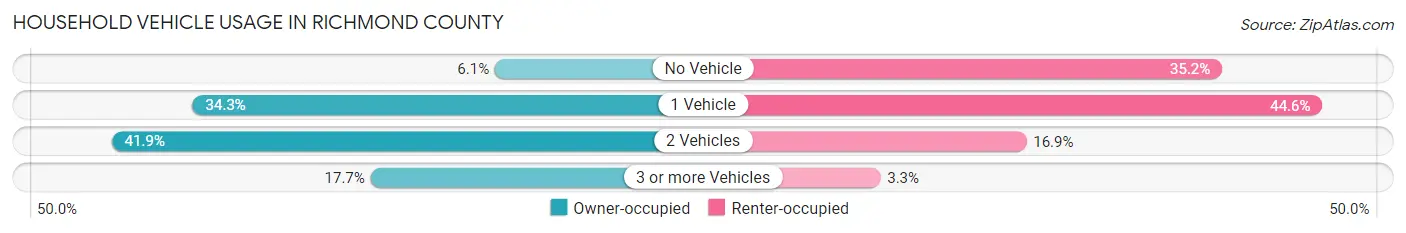
| Vehicles per Household | Owner-occupied | Renter-occupied |
| No Vehicle | 7,103 (6.1%) | 18,781 (35.2%) |
| 1 Vehicle | 40,053 (34.3%) | 23,767 (44.6%) |
| 2 Vehicles | 48,861 (41.9%) | 9,031 (16.9%) |
| 3 or more Vehicles | 20,645 (17.7%) | 1,759 (3.3%) |
| Total | 116,662 (100.0%) | 53,338 (100.0%) |
Real Estate & Mortgages in Richmond County
Real Estate and Mortgage Overview in Richmond County
| Characteristic | Without Mortgage | With Mortgage |
| Housing Units | 40,307 | 76,355 |
| Median Property Value | $640,100 | $635,500 |
| Median Household Income | $89,587 | $33,446 |
| Monthly Housing Costs | $1,049 | $34,072 |
| Real Estate Taxes | $5,875 | $1,719 |
Property Value by Mortgage Status in Richmond County
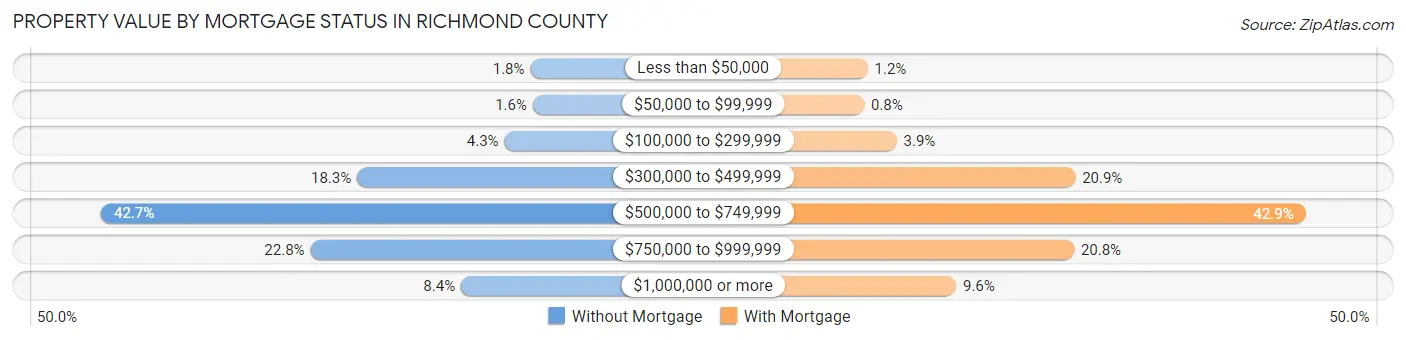
| Property Value | Without Mortgage | With Mortgage |
| Less than $50,000 | 736 (1.8%) | 881 (1.1%) |
| $50,000 to $99,999 | 645 (1.6%) | 608 (0.8%) |
| $100,000 to $299,999 | 1,735 (4.3%) | 2,989 (3.9%) |
| $300,000 to $499,999 | 7,392 (18.3%) | 15,970 (20.9%) |
| $500,000 to $749,999 | 17,216 (42.7%) | 32,716 (42.8%) |
| $750,000 to $999,999 | 9,180 (22.8%) | 15,883 (20.8%) |
| $1,000,000 or more | 3,403 (8.4%) | 7,308 (9.6%) |
| Total | 40,307 (100.0%) | 76,355 (100.0%) |
Household Income by Mortgage Status in Richmond County
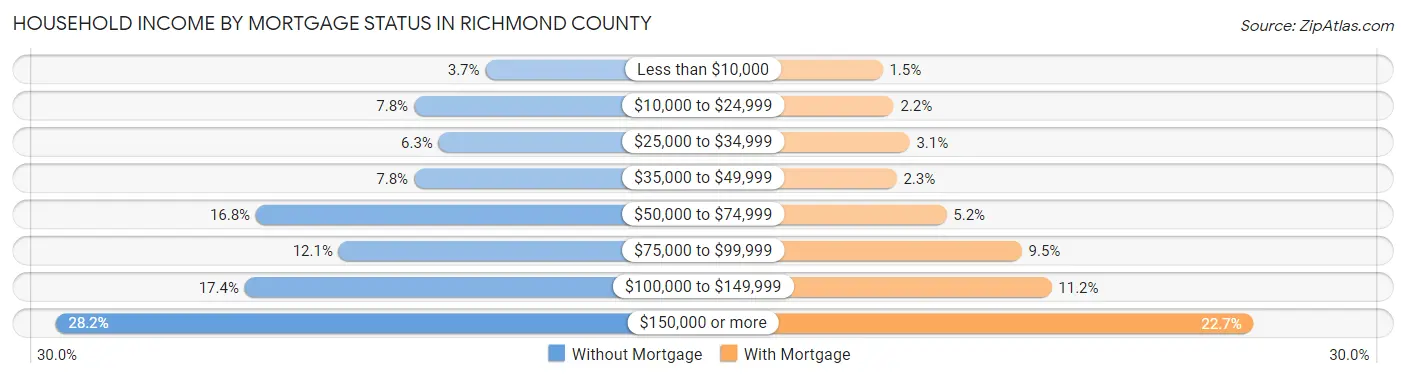
| Household Income | Without Mortgage | With Mortgage |
| Less than $10,000 | 1,480 (3.7%) | 1,178 (1.5%) |
| $10,000 to $24,999 | 3,124 (7.7%) | 1,657 (2.2%) |
| $25,000 to $34,999 | 2,554 (6.3%) | 2,353 (3.1%) |
| $35,000 to $49,999 | 3,124 (7.7%) | 1,788 (2.3%) |
| $50,000 to $74,999 | 6,763 (16.8%) | 3,962 (5.2%) |
| $75,000 to $99,999 | 4,855 (12.0%) | 7,243 (9.5%) |
| $100,000 to $149,999 | 7,023 (17.4%) | 8,545 (11.2%) |
| $150,000 or more | 11,384 (28.2%) | 17,361 (22.7%) |
| Total | 40,307 (100.0%) | 76,355 (100.0%) |
Property Value to Household Income Ratio in Richmond County
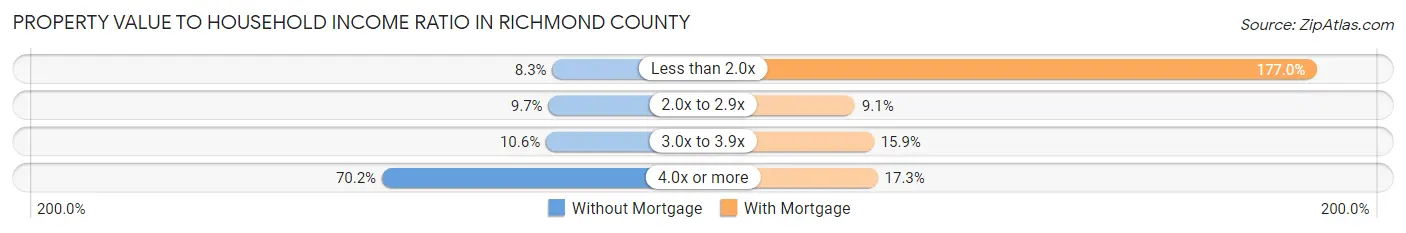
| Value-to-Income Ratio | Without Mortgage | With Mortgage |
| Less than 2.0x | 3,332 (8.3%) | 135,132 (177.0%) |
| 2.0x to 2.9x | 3,917 (9.7%) | 6,922 (9.1%) |
| 3.0x to 3.9x | 4,279 (10.6%) | 12,142 (15.9%) |
| 4.0x or more | 28,294 (70.2%) | 13,227 (17.3%) |
| Total | 40,307 (100.0%) | 76,355 (100.0%) |
Real Estate Taxes by Mortgage Status in Richmond County
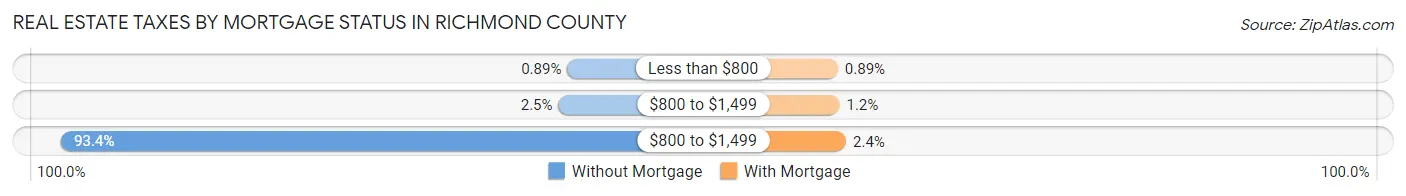
| Property Taxes | Without Mortgage | With Mortgage |
| Less than $800 | 357 (0.9%) | 680 (0.9%) |
| $800 to $1,499 | 1,013 (2.5%) | 905 (1.2%) |
| $800 to $1,499 | 37,627 (93.3%) | 1,827 (2.4%) |
| Total | 40,307 (100.0%) | 76,355 (100.0%) |
Health & Disability in Richmond County
Health Insurance Coverage by Age in Richmond County
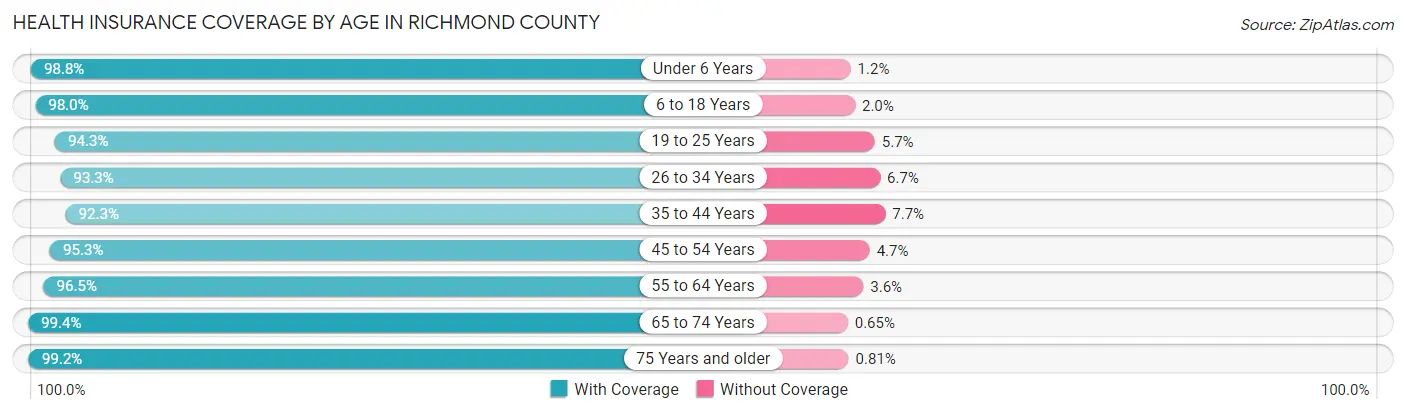
| Age Bracket | With Coverage | Without Coverage |
| Under 6 Years | 32,003 (98.8%) | 385 (1.2%) |
| 6 to 18 Years | 78,787 (98.0%) | 1,604 (2.0%) |
| 19 to 25 Years | 38,421 (94.3%) | 2,316 (5.7%) |
| 26 to 34 Years | 56,126 (93.3%) | 4,009 (6.7%) |
| 35 to 44 Years | 57,159 (92.3%) | 4,744 (7.7%) |
| 45 to 54 Years | 62,911 (95.3%) | 3,132 (4.7%) |
| 55 to 64 Years | 65,722 (96.5%) | 2,419 (3.5%) |
| 65 to 74 Years | 47,840 (99.4%) | 315 (0.6%) |
| 75 Years and older | 31,275 (99.2%) | 255 (0.8%) |
| Total | 470,244 (96.1%) | 19,179 (3.9%) |
Health Insurance Coverage by Citizenship Status in Richmond County
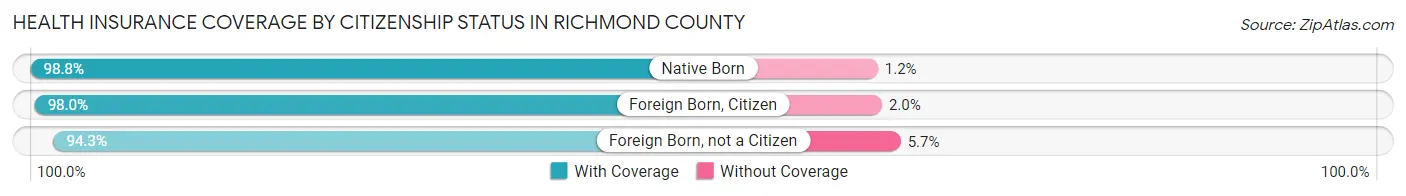
| Citizenship Status | With Coverage | Without Coverage |
| Native Born | 32,003 (98.8%) | 385 (1.2%) |
| Foreign Born, Citizen | 78,787 (98.0%) | 1,604 (2.0%) |
| Foreign Born, not a Citizen | 38,421 (94.3%) | 2,316 (5.7%) |
Health Insurance Coverage by Household Income in Richmond County
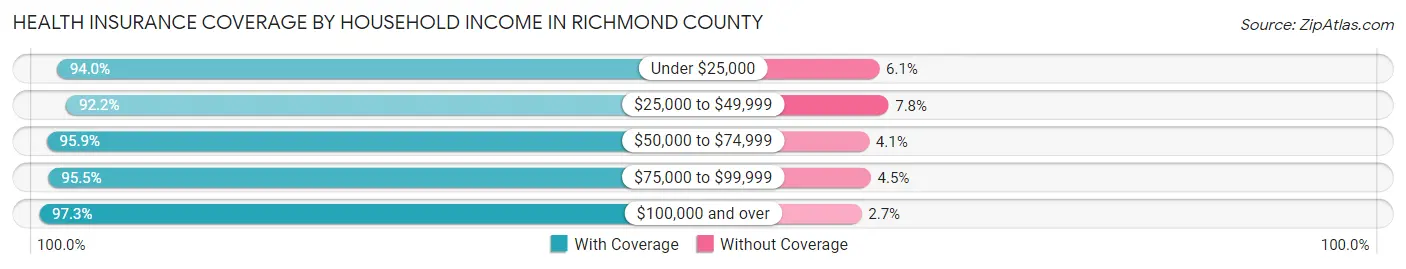
| Household Income | With Coverage | Without Coverage |
| Under $25,000 | 39,895 (94.0%) | 2,569 (6.0%) |
| $25,000 to $49,999 | 47,962 (92.2%) | 4,039 (7.8%) |
| $50,000 to $74,999 | 54,318 (95.9%) | 2,347 (4.1%) |
| $75,000 to $99,999 | 52,815 (95.5%) | 2,467 (4.5%) |
| $100,000 and over | 271,467 (97.3%) | 7,591 (2.7%) |
Public vs Private Health Insurance Coverage by Age in Richmond County
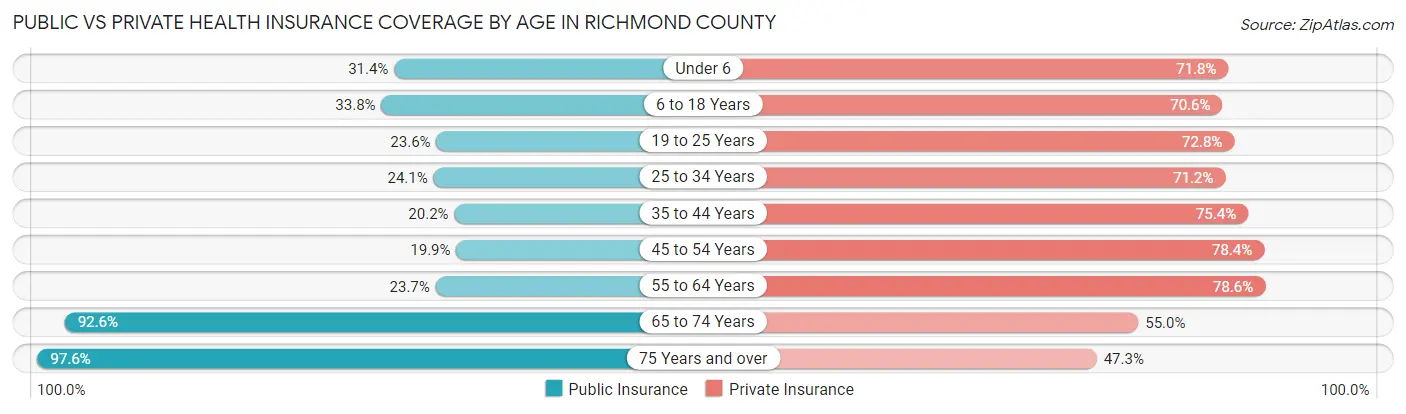
| Age Bracket | Public Insurance | Private Insurance |
| Under 6 | 10,169 (31.4%) | 23,240 (71.8%) |
| 6 to 18 Years | 27,147 (33.8%) | 56,778 (70.6%) |
| 19 to 25 Years | 9,598 (23.6%) | 29,664 (72.8%) |
| 25 to 34 Years | 14,484 (24.1%) | 42,802 (71.2%) |
| 35 to 44 Years | 12,514 (20.2%) | 46,669 (75.4%) |
| 45 to 54 Years | 13,118 (19.9%) | 51,756 (78.4%) |
| 55 to 64 Years | 16,156 (23.7%) | 53,531 (78.6%) |
| 65 to 74 Years | 44,567 (92.5%) | 26,500 (55.0%) |
| 75 Years and over | 30,780 (97.6%) | 14,920 (47.3%) |
| Total | 178,533 (36.5%) | 345,860 (70.7%) |
Disability Status by Sex by Age in Richmond County
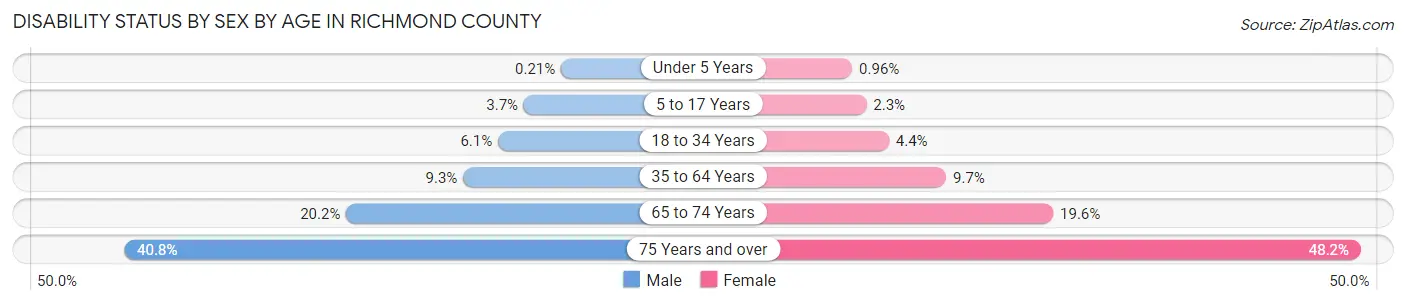
| Age Bracket | Male | Female |
| Under 5 Years | 30 (0.2%) | 125 (1.0%) |
| 5 to 17 Years | 1,493 (3.7%) | 881 (2.3%) |
| 18 to 34 Years | 3,301 (6.1%) | 2,294 (4.4%) |
| 35 to 64 Years | 8,912 (9.3%) | 9,703 (9.7%) |
| 65 to 74 Years | 4,481 (20.2%) | 5,082 (19.6%) |
| 75 Years and over | 5,183 (40.8%) | 9,063 (48.2%) |
Disability Class by Sex by Age in Richmond County
Disability Class: Hearing Difficulty
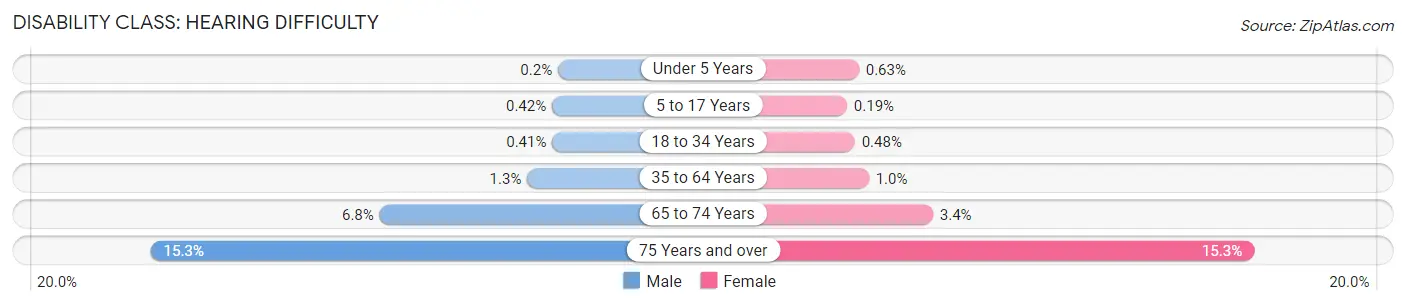
| Age Bracket | Male | Female |
| Under 5 Years | 28 (0.2%) | 82 (0.6%) |
| 5 to 17 Years | 173 (0.4%) | 74 (0.2%) |
| 18 to 34 Years | 226 (0.4%) | 254 (0.5%) |
| 35 to 64 Years | 1,287 (1.3%) | 1,005 (1.0%) |
| 65 to 74 Years | 1,516 (6.8%) | 877 (3.4%) |
| 75 Years and over | 1,948 (15.3%) | 2,879 (15.3%) |
Disability Class: Vision Difficulty
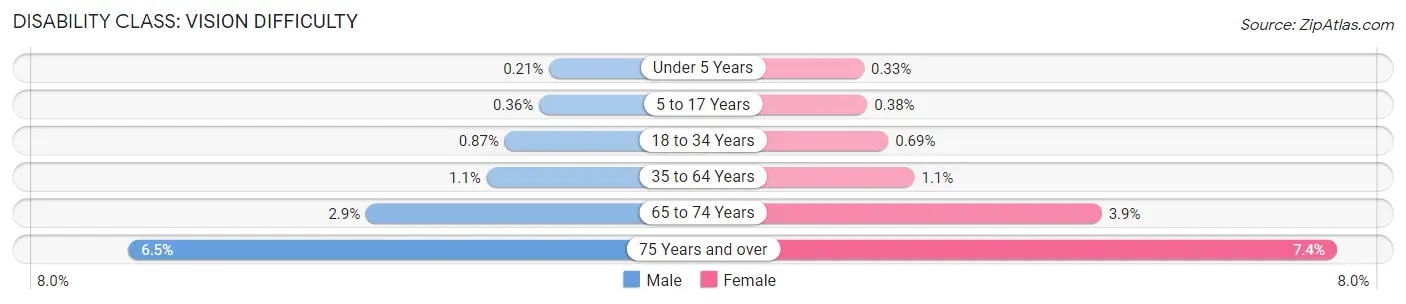
| Age Bracket | Male | Female |
| Under 5 Years | 30 (0.2%) | 43 (0.3%) |
| 5 to 17 Years | 149 (0.4%) | 146 (0.4%) |
| 18 to 34 Years | 476 (0.9%) | 360 (0.7%) |
| 35 to 64 Years | 1,088 (1.1%) | 1,087 (1.1%) |
| 65 to 74 Years | 651 (2.9%) | 1,001 (3.9%) |
| 75 Years and over | 821 (6.5%) | 1,383 (7.3%) |
Disability Class: Cognitive Difficulty
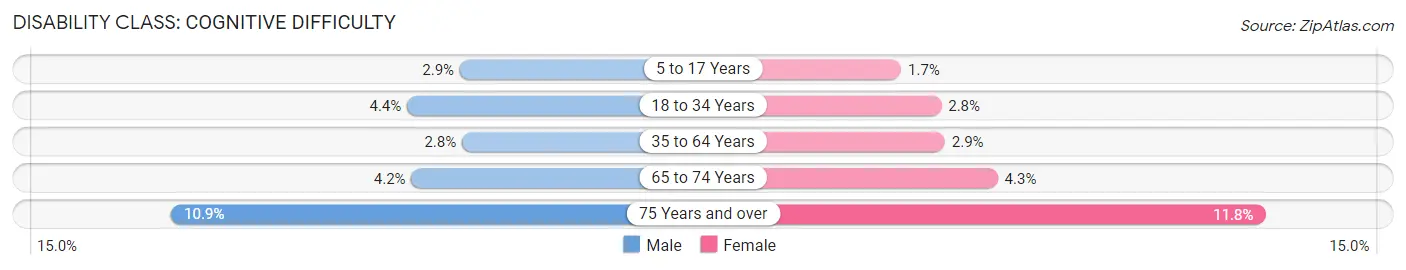
| Age Bracket | Male | Female |
| 5 to 17 Years | 1,176 (2.9%) | 637 (1.7%) |
| 18 to 34 Years | 2,370 (4.3%) | 1,455 (2.8%) |
| 35 to 64 Years | 2,702 (2.8%) | 2,876 (2.9%) |
| 65 to 74 Years | 941 (4.2%) | 1,126 (4.3%) |
| 75 Years and over | 1,388 (10.9%) | 2,219 (11.8%) |
Disability Class: Ambulatory Difficulty
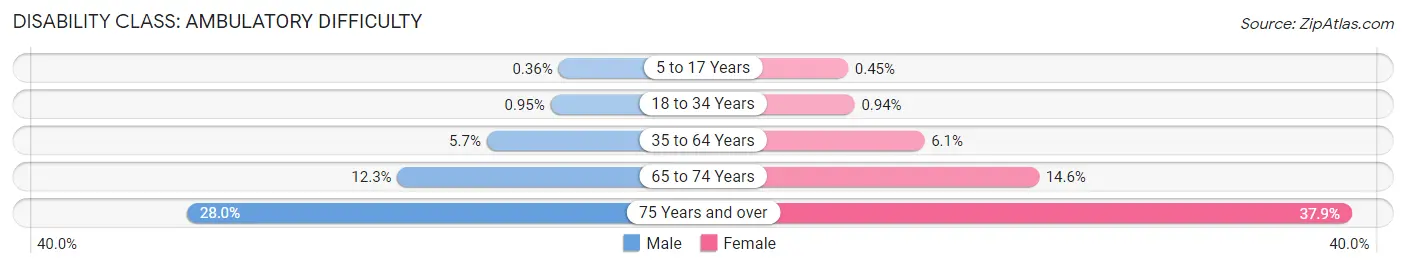
| Age Bracket | Male | Female |
| 5 to 17 Years | 149 (0.4%) | 173 (0.4%) |
| 18 to 34 Years | 519 (0.9%) | 496 (0.9%) |
| 35 to 64 Years | 5,449 (5.7%) | 6,134 (6.1%) |
| 65 to 74 Years | 2,739 (12.3%) | 3,789 (14.6%) |
| 75 Years and over | 3,554 (28.0%) | 7,124 (37.9%) |
Disability Class: Self-Care Difficulty
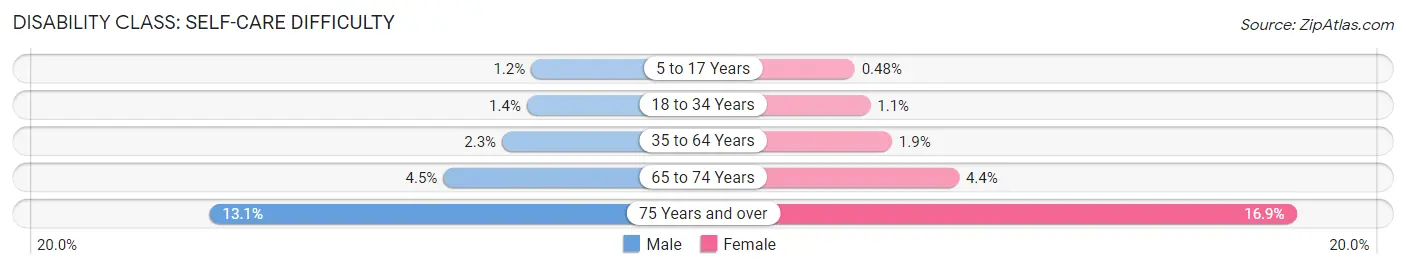
| Age Bracket | Male | Female |
| 5 to 17 Years | 492 (1.2%) | 184 (0.5%) |
| 18 to 34 Years | 742 (1.4%) | 555 (1.1%) |
| 35 to 64 Years | 2,188 (2.3%) | 1,861 (1.9%) |
| 65 to 74 Years | 992 (4.5%) | 1,127 (4.3%) |
| 75 Years and over | 1,670 (13.1%) | 3,175 (16.9%) |
Technology Access in Richmond County
Computing Device Access in Richmond County
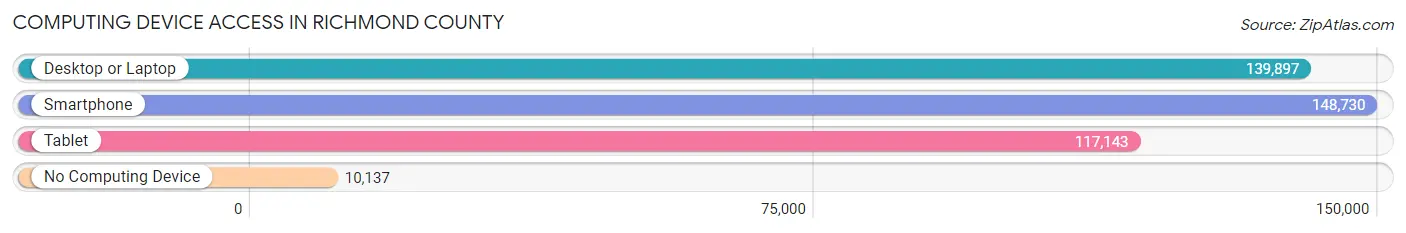
| Device Type | # Households | % Households |
| Desktop or Laptop | 139,897 | 82.3% |
| Smartphone | 148,730 | 87.5% |
| Tablet | 117,143 | 68.9% |
| No Computing Device | 10,137 | 6.0% |
| Total | 170,000 | 100.0% |
Internet Access in Richmond County
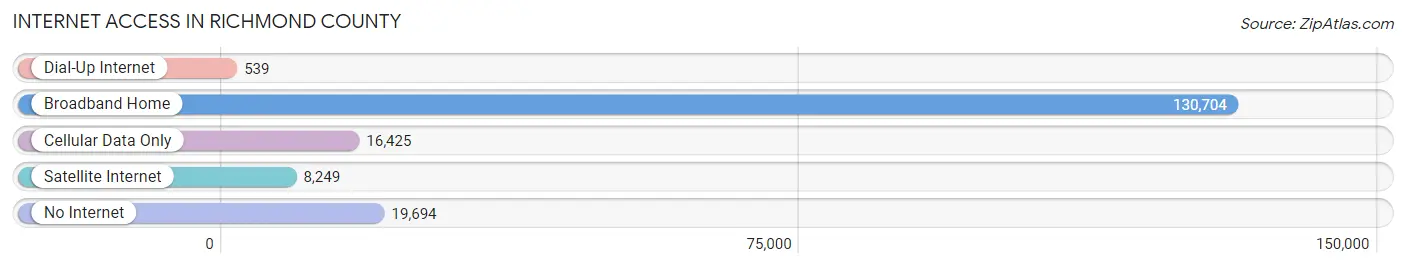
| Internet Type | # Households | % Households |
| Dial-Up Internet | 539 | 0.3% |
| Broadband Home | 130,704 | 76.9% |
| Cellular Data Only | 16,425 | 9.7% |
| Satellite Internet | 8,249 | 4.9% |
| No Internet | 19,694 | 11.6% |
| Total | 170,000 | 100.0% |
Richmond County Summary
Richmond County, New York is located in the southeastern corner of the state, on the western shore of Staten Island. It is one of the five boroughs of New York City, and is the most southern and least populated of the five. Richmond County is bordered by the Hudson River to the west, the Atlantic Ocean to the south, and the New York Bay to the east.
History
The area that is now Richmond County was originally inhabited by the Lenape Native Americans. The first Europeans to settle in the area were the Dutch, who established a trading post in 1630. The area was then part of the Province of New York, and was known as Richmond County in 1683. The county was named after Charles Lennox, the Duke of Richmond.
In the late 1700s, Richmond County was the site of several battles during the American Revolutionary War. The British occupied the area from 1776 to 1783, and the area was the site of the Battle of Staten Island in 1777.
In 1898, Richmond County became part of the City of Greater New York, which included the five boroughs of Manhattan, Brooklyn, Queens, the Bronx, and Staten Island. The county was then known as Richmond Borough, and was the least populated of the five boroughs.
Geography
Richmond County covers an area of 58 square miles, making it the smallest of the five boroughs of New York City. The county is located on the western shore of Staten Island, and is bordered by the Hudson River to the west, the Atlantic Ocean to the south, and the New York Bay to the east.
The terrain of Richmond County is mostly flat, with some hills in the northern part of the county. The highest point in the county is Todt Hill, which has an elevation of 409 feet. The county is home to several parks, including Clove Lakes Park, Silver Lake Park, and Wolfe’s Pond Park.
Economy
Richmond County has a diverse economy, with a mix of manufacturing, retail, and service industries. The county is home to several large employers, including the Staten Island Mall, the Staten Island Ferry, and the Richmond County Bank Ballpark.
The county is also home to several major corporations, including the Bank of New York Mellon, Citigroup, and Verizon. The county is also home to several universities, including the College of Staten Island, Wagner College, and St. John’s University.
Demographics
As of the 2010 census, Richmond County had a population of 468,730. The population is mostly white (64.3%), followed by African American (13.3%), Asian (11.2%), and Hispanic or Latino (9.7%). The median household income in the county is $71,817, and the median home value is $440,000.
Conclusion
Richmond County, New York is located in the southeastern corner of the state, on the western shore of Staten Island. It is one of the five boroughs of New York City, and is the most southern and least populated of the five. Richmond County has a diverse economy, with a mix of manufacturing, retail, and service industries. The population is mostly white, followed by African American, Asian, and Hispanic or Latino. The median household income in the county is $71,817, and the median home value is $440,000.
Common Questions
What is Per Capita Income in Richmond County?
Per Capita income in Richmond County is $43,199.
What is the Median Family Income in Richmond County?
Median Family Income in Richmond County is $116,052.
What is the Median Household income in Richmond County?
Median Household Income in Richmond County is $96,185.
What is Income or Wage Gap in Richmond County?
Income or Wage Gap in Richmond County is 21.4%.
Women in Richmond County earn 78.6 cents for every dollar earned by a man.
What is Family Income Deficit in Richmond County?
Family Income Deficit in Richmond County is $12,231.
Families that are below poverty line in Richmond County earn $12,231 less on average than the poverty threshold level.
What is Inequality or Gini Index in Richmond County?
Inequality or Gini Index in Richmond County is 0.45.
What is the Total Population of Richmond County?
Total Population of Richmond County is 492,925.
What is the Total Male Population of Richmond County?
Total Male Population of Richmond County is 241,783.
What is the Total Female Population of Richmond County?
Total Female Population of Richmond County is 251,142.
What is the Ratio of Males per 100 Females in Richmond County?
There are 96.27 Males per 100 Females in Richmond County.
What is the Ratio of Females per 100 Males in Richmond County?
There are 103.87 Females per 100 Males in Richmond County.
What is the Median Population Age in Richmond County?
Median Population Age in Richmond County is 40.3 Years.
What is the Average Family Size in Richmond County
Average Family Size in Richmond County is 3.4 People.
What is the Average Household Size in Richmond County
Average Household Size in Richmond County is 2.9 People.
How Large is the Labor Force in Richmond County?
There are 239,566 People in the Labor Forcein in Richmond County.
What is the Percentage of People in the Labor Force in Richmond County?
60.0% of People are in the Labor Force in Richmond County.
What is the Unemployment Rate in Richmond County?
Unemployment Rate in Richmond County is 5.4%.