Cities with the Most Immigrants from Eastern Asia in Iowa
RELATED REPORTS & OPTIONS
Eastern Asia
Iowa
Compare Cities
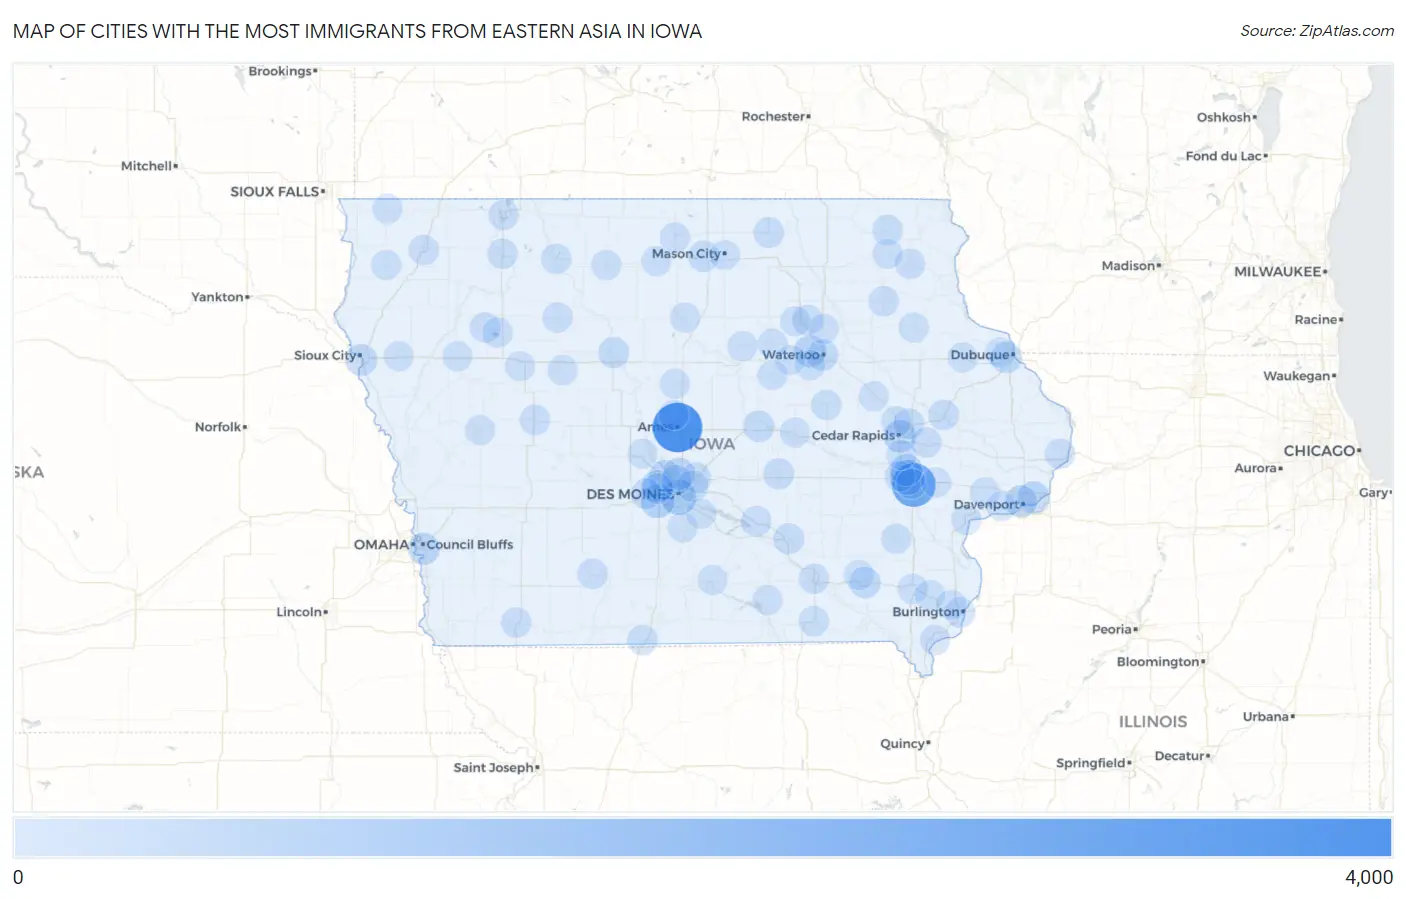
Map of Cities with the Most Immigrants from Eastern Asia in Iowa
0
4,000
Cities with the Most Immigrants from Eastern Asia in Iowa
| City | Eastern Asia | vs State | vs National | |
| 1. | Ames | 3,076 | 15,197(20.24%)#1 | 4,223,726(0.07%)#187 |
| 2. | Iowa City | 2,139 | 15,197(14.08%)#2 | 4,223,726(0.05%)#267 |
| 3. | Des Moines | 746 | 15,197(4.91%)#3 | 4,223,726(0.02%)#679 |
| 4. | Coralville | 721 | 15,197(4.74%)#4 | 4,223,726(0.02%)#696 |
| 5. | West Des Moines | 542 | 15,197(3.57%)#5 | 4,223,726(0.01%)#893 |
| 6. | Cedar Rapids | 360 | 15,197(2.37%)#6 | 4,223,726(0.01%)#1,217 |
| 7. | Bettendorf | 358 | 15,197(2.36%)#7 | 4,223,726(0.01%)#1,232 |
| 8. | Cedar Falls | 328 | 15,197(2.16%)#8 | 4,223,726(0.01%)#1,318 |
| 9. | Johnston | 324 | 15,197(2.13%)#9 | 4,223,726(0.01%)#1,329 |
| 10. | North Liberty | 320 | 15,197(2.11%)#10 | 4,223,726(0.01%)#1,339 |
| 11. | Urbandale | 310 | 15,197(2.04%)#11 | 4,223,726(0.01%)#1,366 |
| 12. | Ankeny | 303 | 15,197(1.99%)#12 | 4,223,726(0.01%)#1,383 |
| 13. | Davenport | 292 | 15,197(1.92%)#13 | 4,223,726(0.01%)#1,418 |
| 14. | Council Bluffs | 286 | 15,197(1.88%)#14 | 4,223,726(0.01%)#1,439 |
| 15. | Sioux City | 245 | 15,197(1.61%)#15 | 4,223,726(0.01%)#1,596 |
| 16. | Dubuque | 227 | 15,197(1.49%)#16 | 4,223,726(0.01%)#1,684 |
| 17. | Waterloo | 203 | 15,197(1.34%)#17 | 4,223,726(0.00%)#1,812 |
| 18. | Fairfield | 181 | 15,197(1.19%)#18 | 4,223,726(0.00%)#1,942 |
| 19. | Marshalltown | 177 | 15,197(1.16%)#19 | 4,223,726(0.00%)#1,971 |
| 20. | Clear Lake | 170 | 15,197(1.12%)#20 | 4,223,726(0.00%)#2,028 |
| 21. | Altoona | 168 | 15,197(1.11%)#21 | 4,223,726(0.00%)#2,040 |
| 22. | Fort Dodge | 152 | 15,197(1.00%)#22 | 4,223,726(0.00%)#2,184 |
| 23. | Clive | 139 | 15,197(0.91%)#23 | 4,223,726(0.00%)#2,304 |
| 24. | Grinnell | 124 | 15,197(0.82%)#24 | 4,223,726(0.00%)#2,453 |
| 25. | Marion | 113 | 15,197(0.74%)#25 | 4,223,726(0.00%)#2,560 |
| 26. | Oskaloosa | 111 | 15,197(0.73%)#26 | 4,223,726(0.00%)#2,602 |
| 27. | Osage | 86 | 15,197(0.57%)#27 | 4,223,726(0.00%)#3,002 |
| 28. | Waukee | 84 | 15,197(0.55%)#28 | 4,223,726(0.00%)#3,022 |
| 29. | Waverly | 82 | 15,197(0.54%)#29 | 4,223,726(0.00%)#3,063 |
| 30. | Anamosa | 80 | 15,197(0.53%)#30 | 4,223,726(0.00%)#3,112 |
| 31. | Creston | 76 | 15,197(0.50%)#31 | 4,223,726(0.00%)#3,197 |
| 32. | Carroll | 67 | 15,197(0.44%)#32 | 4,223,726(0.00%)#3,408 |
| 33. | Burlington | 62 | 15,197(0.41%)#33 | 4,223,726(0.00%)#3,530 |
| 34. | Tiffin | 62 | 15,197(0.41%)#34 | 4,223,726(0.00%)#3,544 |
| 35. | Alta | 59 | 15,197(0.39%)#35 | 4,223,726(0.00%)#3,626 |
| 36. | Decorah | 57 | 15,197(0.38%)#36 | 4,223,726(0.00%)#3,679 |
| 37. | Pella | 56 | 15,197(0.37%)#37 | 4,223,726(0.00%)#3,703 |
| 38. | Mount Vernon | 56 | 15,197(0.37%)#38 | 4,223,726(0.00%)#3,713 |
| 39. | Fayette | 54 | 15,197(0.36%)#39 | 4,223,726(0.00%)#3,786 |
| 40. | Ottumwa | 53 | 15,197(0.35%)#40 | 4,223,726(0.00%)#3,792 |
| 41. | Clarinda | 53 | 15,197(0.35%)#41 | 4,223,726(0.00%)#3,814 |
| 42. | University Heights | 48 | 15,197(0.32%)#42 | 4,223,726(0.00%)#4,006 |
| 43. | Storm Lake | 47 | 15,197(0.31%)#43 | 4,223,726(0.00%)#4,022 |
| 44. | Sheldon | 47 | 15,197(0.31%)#44 | 4,223,726(0.00%)#4,033 |
| 45. | Lamoni | 42 | 15,197(0.28%)#45 | 4,223,726(0.00%)#4,226 |
| 46. | Spencer | 41 | 15,197(0.27%)#46 | 4,223,726(0.00%)#4,245 |
| 47. | Emmetsburg | 41 | 15,197(0.27%)#47 | 4,223,726(0.00%)#4,267 |
| 48. | Dysart | 39 | 15,197(0.26%)#48 | 4,223,726(0.00%)#4,364 |
| 49. | Clinton | 38 | 15,197(0.25%)#49 | 4,223,726(0.00%)#4,369 |
| 50. | Bondurant | 38 | 15,197(0.25%)#50 | 4,223,726(0.00%)#4,381 |
| 51. | Washington | 37 | 15,197(0.24%)#51 | 4,223,726(0.00%)#4,434 |
| 52. | Hiawatha | 37 | 15,197(0.24%)#52 | 4,223,726(0.00%)#4,435 |
| 53. | Pocahontas | 37 | 15,197(0.24%)#53 | 4,223,726(0.00%)#4,462 |
| 54. | Saylorville | 33 | 15,197(0.22%)#54 | 4,223,726(0.00%)#4,672 |
| 55. | Postville | 33 | 15,197(0.22%)#55 | 4,223,726(0.00%)#4,674 |
| 56. | Fort Madison | 28 | 15,197(0.18%)#56 | 4,223,726(0.00%)#4,955 |
| 57. | Forest City | 27 | 15,197(0.18%)#57 | 4,223,726(0.00%)#5,045 |
| 58. | Bloomfield | 26 | 15,197(0.17%)#58 | 4,223,726(0.00%)#5,117 |
| 59. | Okoboji | 25 | 15,197(0.16%)#59 | 4,223,726(0.00%)#5,191 |
| 60. | Durant | 24 | 15,197(0.16%)#60 | 4,223,726(0.00%)#5,261 |
| 61. | Jewell Junction | 24 | 15,197(0.16%)#61 | 4,223,726(0.00%)#5,263 |
| 62. | Dyersville | 21 | 15,197(0.14%)#62 | 4,223,726(0.00%)#5,466 |
| 63. | Hudson | 21 | 15,197(0.14%)#63 | 4,223,726(0.00%)#5,480 |
| 64. | Denison | 20 | 15,197(0.13%)#64 | 4,223,726(0.00%)#5,528 |
| 65. | Algona | 19 | 15,197(0.13%)#65 | 4,223,726(0.00%)#5,634 |
| 66. | Maharishi Vedic City | 18 | 15,197(0.12%)#66 | 4,223,726(0.00%)#5,777 |
| 67. | Indianola | 17 | 15,197(0.11%)#67 | 4,223,726(0.00%)#5,788 |
| 68. | Moravia | 17 | 15,197(0.11%)#68 | 4,223,726(0.00%)#5,882 |
| 69. | Asbury | 15 | 15,197(0.10%)#69 | 4,223,726(0.00%)#6,059 |
| 70. | Rockwell City | 15 | 15,197(0.10%)#70 | 4,223,726(0.00%)#6,106 |
| 71. | Sioux Center | 12 | 15,197(0.08%)#71 | 4,223,726(0.00%)#6,446 |
| 72. | Parkersburg | 12 | 15,197(0.08%)#72 | 4,223,726(0.00%)#6,524 |
| 73. | Ackley | 12 | 15,197(0.08%)#73 | 4,223,726(0.00%)#6,527 |
| 74. | Gilbert | 12 | 15,197(0.08%)#74 | 4,223,726(0.00%)#6,540 |
| 75. | Muscatine | 11 | 15,197(0.07%)#75 | 4,223,726(0.00%)#6,562 |
| 76. | Shueyville | 11 | 15,197(0.07%)#76 | 4,223,726(0.00%)#6,672 |
| 77. | Chariton | 10 | 15,197(0.07%)#77 | 4,223,726(0.00%)#6,759 |
| 78. | Rock Rapids | 10 | 15,197(0.07%)#78 | 4,223,726(0.00%)#6,792 |
| 79. | Mount Pleasant | 9 | 15,197(0.06%)#79 | 4,223,726(0.00%)#6,892 |
| 80. | Moville | 9 | 15,197(0.06%)#80 | 4,223,726(0.00%)#6,982 |
| 81. | Oak Hills | 9 | 15,197(0.06%)#81 | 4,223,726(0.00%)#7,043 |
| 82. | West Branch | 8 | 15,197(0.05%)#82 | 4,223,726(0.00%)#7,137 |
| 83. | Denver | 8 | 15,197(0.05%)#83 | 4,223,726(0.00%)#7,154 |
| 84. | Holstein | 8 | 15,197(0.05%)#84 | 4,223,726(0.00%)#7,170 |
| 85. | Hartford | 8 | 15,197(0.05%)#85 | 4,223,726(0.00%)#7,207 |
| 86. | Urbana | 7 | 15,197(0.05%)#86 | 4,223,726(0.00%)#7,349 |
| 87. | Shell Rock | 7 | 15,197(0.05%)#87 | 4,223,726(0.00%)#7,350 |
| 88. | Strawberry Point | 7 | 15,197(0.05%)#88 | 4,223,726(0.00%)#7,354 |
| 89. | Woodward | 7 | 15,197(0.05%)#89 | 4,223,726(0.00%)#7,379 |
| 90. | Ossian | 7 | 15,197(0.05%)#90 | 4,223,726(0.00%)#7,385 |
| 91. | Rowan | 7 | 15,197(0.05%)#91 | 4,223,726(0.00%)#7,415 |
| 92. | Mason City | 6 | 15,197(0.04%)#92 | 4,223,726(0.00%)#7,420 |
| 93. | Grundy Center | 6 | 15,197(0.04%)#93 | 4,223,726(0.00%)#7,494 |
| 94. | Dike | 6 | 15,197(0.04%)#94 | 4,223,726(0.00%)#7,569 |
| 95. | Beaverdale | 6 | 15,197(0.04%)#95 | 4,223,726(0.00%)#7,614 |
| 96. | New London | 5 | 15,197(0.03%)#96 | 4,223,726(0.00%)#7,716 |
| 97. | Toledo | 5 | 15,197(0.03%)#97 | 4,223,726(0.00%)#7,739 |
| 98. | Britt | 5 | 15,197(0.03%)#98 | 4,223,726(0.00%)#7,747 |
| 99. | Blue Grass | 5 | 15,197(0.03%)#99 | 4,223,726(0.00%)#7,749 |
| 100. | Sac City | 5 | 15,197(0.03%)#100 | 4,223,726(0.00%)#7,752 |
Common Questions
What are the Top 10 Cities with the Most Immigrants from Eastern Asia in Iowa?
Top 10 Cities with the Most Immigrants from Eastern Asia in Iowa are:
#1
3,076
#2
2,139
#3
746
#4
721
#5
542
#6
360
#7
358
#8
328
#9
324
#10
320
What city has the Most Immigrants from Eastern Asia in Iowa?
Ames has the Most Immigrants from Eastern Asia in Iowa with 3,076.
What is the Total Immigrants from Eastern Asia in the State of Iowa?
Total Immigrants from Eastern Asia in Iowa is 15,197.
What is the Total Immigrants from Eastern Asia in the United States?
Total Immigrants from Eastern Asia in the United States is 4,223,726.