Manvel, TX Map & Demographics
Manvel Map
Manvel Overview
$41,747
PER CAPITA INCOME
$124,750
AVG FAMILY INCOME
$105,188
AVG HOUSEHOLD INCOME
30.3%
WAGE / INCOME GAP [ % ]
69.7¢/ $1
WAGE / INCOME GAP [ $ ]
0.37
INEQUALITY / GINI INDEX
11,265
TOTAL POPULATION
5,672
MALE POPULATION
5,593
FEMALE POPULATION
101.41
MALES / 100 FEMALES
98.61
FEMALES / 100 MALES
35.7
MEDIAN AGE
3.6
AVG FAMILY SIZE
3.0
AVG HOUSEHOLD SIZE
5,569
LABOR FORCE [ PEOPLE ]
64.0%
PERCENT IN LABOR FORCE
2.6%
UNEMPLOYMENT RATE
Manvel Zip Codes
Income in Manvel
Income Overview in Manvel
Per Capita Income in Manvel is $41,747, while median incomes of families and households are $124,750 and $105,188 respectively.
| Characteristic | Number | Measure |
| Per Capita Income | 11,265 | $41,747 |
| Median Family Income | 2,830 | $124,750 |
| Mean Family Income | 2,830 | $133,811 |
| Median Household Income | 3,789 | $105,188 |
| Mean Household Income | 3,789 | $124,032 |
| Income Deficit | 2,830 | $0 |
| Wage / Income Gap (%) | 11,265 | 30.33% |
| Wage / Income Gap ($) | 11,265 | 69.67¢ per $1 |
| Gini / Inequality Index | 11,265 | 0.37 |
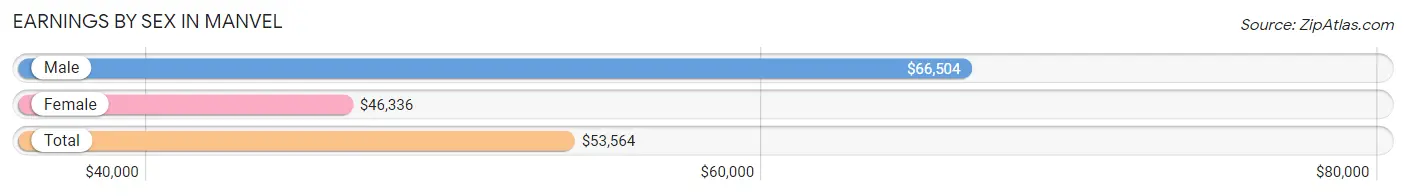
Earnings by Sex in Manvel
Average Earnings in Manvel are $53,564, $66,504 for men and $46,336 for women, a difference of 30.3%.
| Sex | Number | Average Earnings |
| Male | 2,971 (49.8%) | $66,504 |
| Female | 2,997 (50.2%) | $46,336 |
| Total | 5,968 (100.0%) | $53,564 |
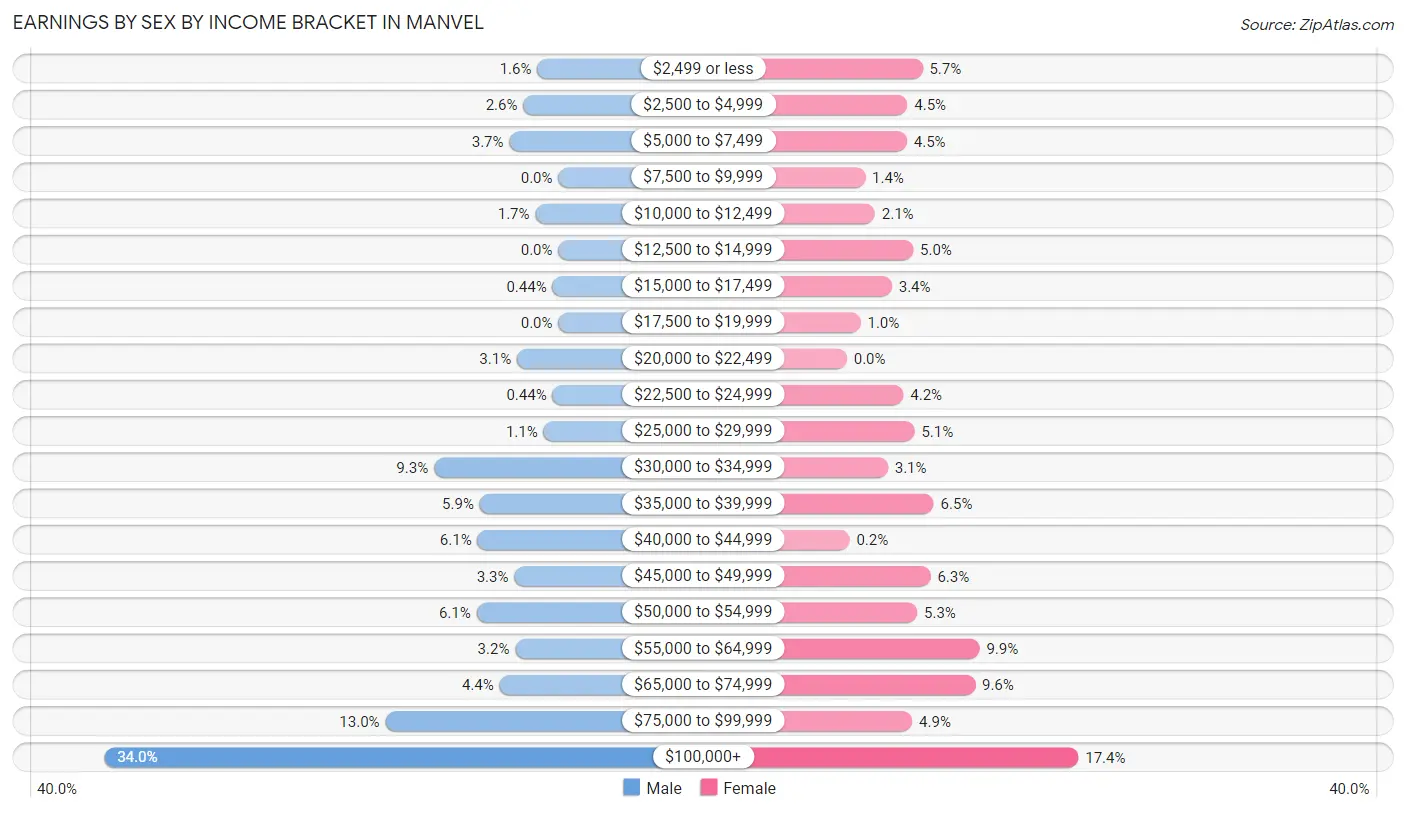
Earnings by Sex by Income Bracket in Manvel
The most common earnings brackets in Manvel are $100,000+ for men (1,011 | 34.0%) and $100,000+ for women (520 | 17.3%).
| Income | Male | Female |
| $2,499 or less | 47 (1.6%) | 170 (5.7%) |
| $2,500 to $4,999 | 78 (2.6%) | 136 (4.5%) |
| $5,000 to $7,499 | 109 (3.7%) | 135 (4.5%) |
| $7,500 to $9,999 | 0 (0.0%) | 41 (1.4%) |
| $10,000 to $12,499 | 51 (1.7%) | 63 (2.1%) |
| $12,500 to $14,999 | 0 (0.0%) | 149 (5.0%) |
| $15,000 to $17,499 | 13 (0.4%) | 101 (3.4%) |
| $17,500 to $19,999 | 0 (0.0%) | 31 (1.0%) |
| $20,000 to $22,499 | 92 (3.1%) | 0 (0.0%) |
| $22,500 to $24,999 | 13 (0.4%) | 127 (4.2%) |
| $25,000 to $29,999 | 33 (1.1%) | 152 (5.1%) |
| $30,000 to $34,999 | 277 (9.3%) | 92 (3.1%) |
| $35,000 to $39,999 | 175 (5.9%) | 195 (6.5%) |
| $40,000 to $44,999 | 180 (6.1%) | 6 (0.2%) |
| $45,000 to $49,999 | 98 (3.3%) | 188 (6.3%) |
| $50,000 to $54,999 | 182 (6.1%) | 158 (5.3%) |
| $55,000 to $64,999 | 96 (3.2%) | 298 (9.9%) |
| $65,000 to $74,999 | 131 (4.4%) | 288 (9.6%) |
| $75,000 to $99,999 | 385 (13.0%) | 147 (4.9%) |
| $100,000+ | 1,011 (34.0%) | 520 (17.3%) |
| Total | 2,971 (100.0%) | 2,997 (100.0%) |
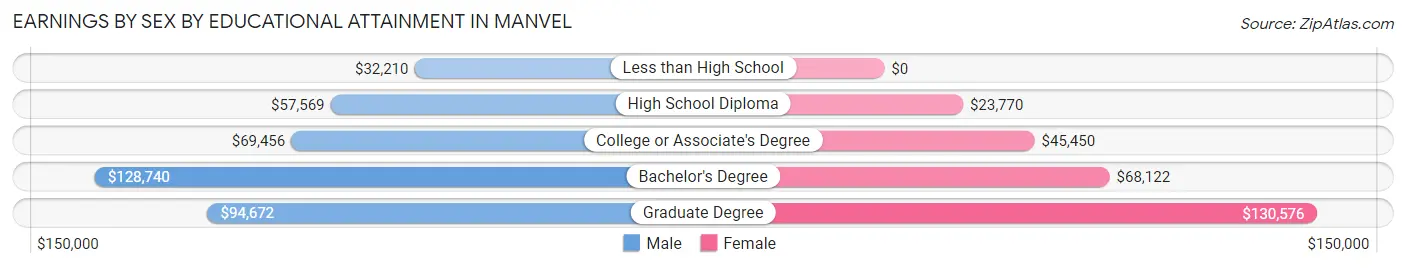
Earnings by Sex by Educational Attainment in Manvel
Average earnings in Manvel are $85,839 for men and $53,167 for women, a difference of 38.1%. Men with an educational attainment of bachelor's degree enjoy the highest average annual earnings of $128,740, while those with less than high school education earn the least with $32,210. Women with an educational attainment of graduate degree earn the most with the average annual earnings of $130,576, while those with high school diploma education have the smallest earnings of $23,770.
| Educational Attainment | Male Income | Female Income |
| Less than High School | $32,210 | $0 |
| High School Diploma | $57,569 | $23,770 |
| College or Associate's Degree | $69,456 | $45,450 |
| Bachelor's Degree | $128,740 | $68,122 |
| Graduate Degree | $94,672 | $130,576 |
| Total | $85,839 | $53,167 |
Family Income in Manvel
Family Income Brackets in Manvel
According to the Manvel family income data, there are 773 families falling into the $100,000 to $149,999 income range, which is the most common income bracket and makes up 27.3% of all families. Conversely, the $10,000 to $14,999 income bracket is the least frequent group with only 11 families (0.4%) belonging to this category.
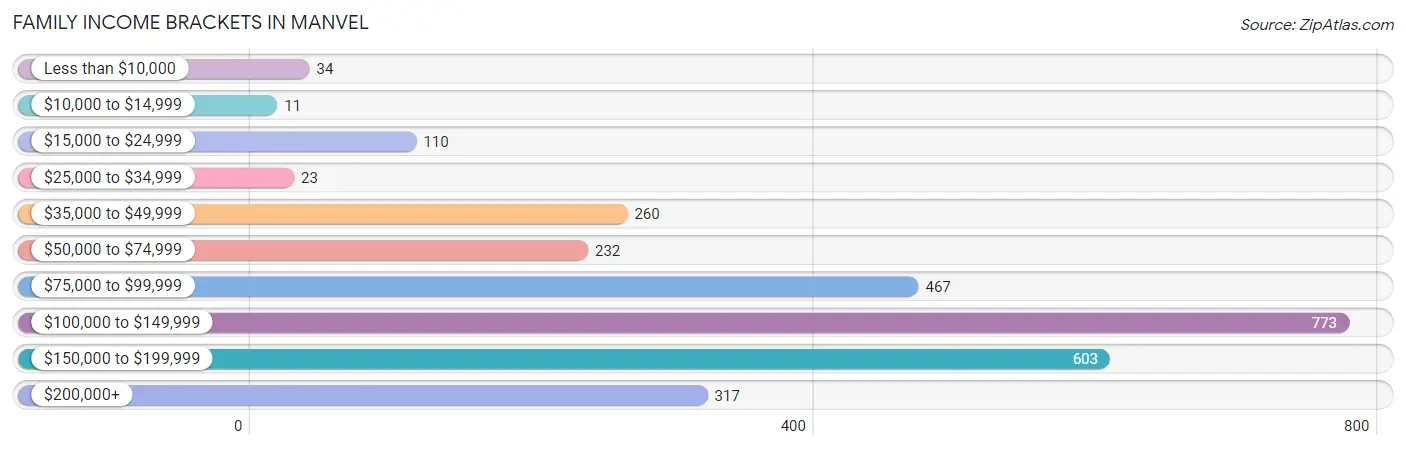
| Income Bracket | # Families | % Families |
| Less than $10,000 | 34 | 1.2% |
| $10,000 to $14,999 | 11 | 0.4% |
| $15,000 to $24,999 | 110 | 3.9% |
| $25,000 to $34,999 | 23 | 0.8% |
| $35,000 to $49,999 | 260 | 9.2% |
| $50,000 to $74,999 | 232 | 8.2% |
| $75,000 to $99,999 | 467 | 16.5% |
| $100,000 to $149,999 | 773 | 27.3% |
| $150,000 to $199,999 | 603 | 21.3% |
| $200,000+ | 317 | 11.2% |
Family Income by Famaliy Size in Manvel
4-person families (590 | 20.8%) account for the highest median family income in Manvel with $145,288 per family, while 3-person families (775 | 27.4%) have the highest median income of $47,558 per family member.
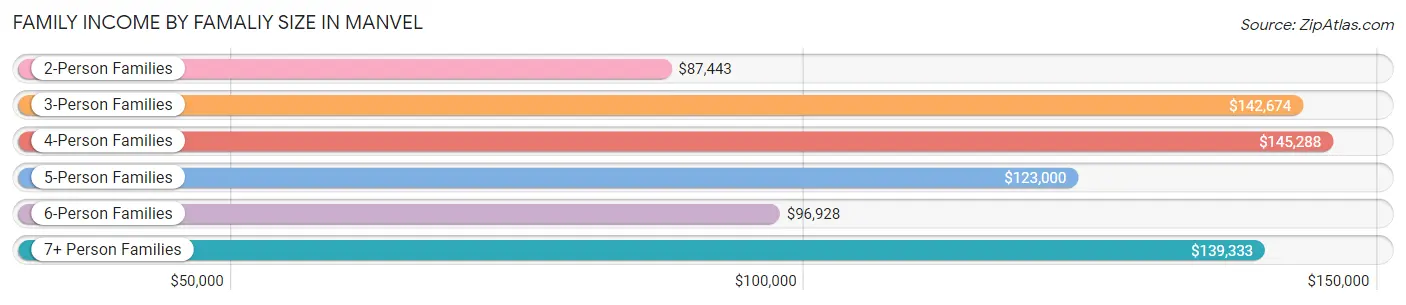
| Income Bracket | # Families | Median Income |
| 2-Person Families | 959 (33.9%) | $87,443 |
| 3-Person Families | 775 (27.4%) | $142,674 |
| 4-Person Families | 590 (20.8%) | $145,288 |
| 5-Person Families | 220 (7.8%) | $123,000 |
| 6-Person Families | 182 (6.4%) | $96,928 |
| 7+ Person Families | 104 (3.7%) | $139,333 |
| Total | 2,830 (100.0%) | $124,750 |
Family Income by Number of Earners in Manvel
The median family income in Manvel is $124,750, with families comprising 3+ earners (414) having the highest median family income of $143,958, while families with no earners (169) have the lowest median family income of $23,614, accounting for 14.6% and 6.0% of families, respectively.
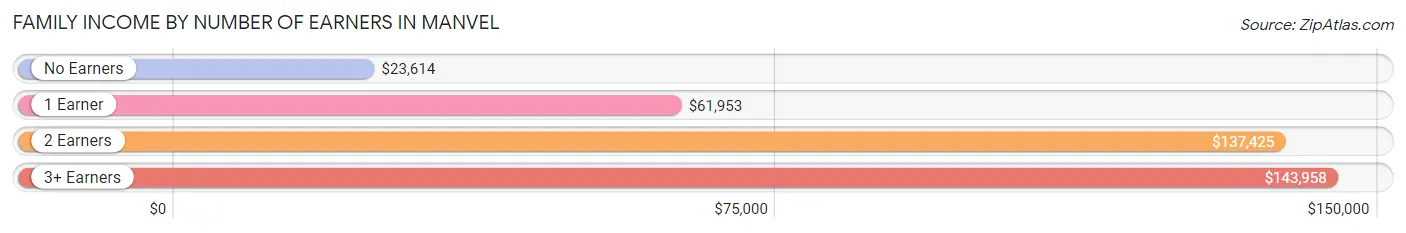
| Number of Earners | # Families | Median Income |
| No Earners | 169 (6.0%) | $23,614 |
| 1 Earner | 727 (25.7%) | $61,953 |
| 2 Earners | 1,520 (53.7%) | $137,425 |
| 3+ Earners | 414 (14.6%) | $143,958 |
| Total | 2,830 (100.0%) | $124,750 |
Household Income in Manvel
Household Income Brackets in Manvel
With 1,053 households falling in the category, the $100,000 to $149,999 income range is the most frequent in Manvel, accounting for 27.8% of all households. In contrast, only 11 households (0.3%) fall into the $10,000 to $14,999 income bracket, making it the least populous group.
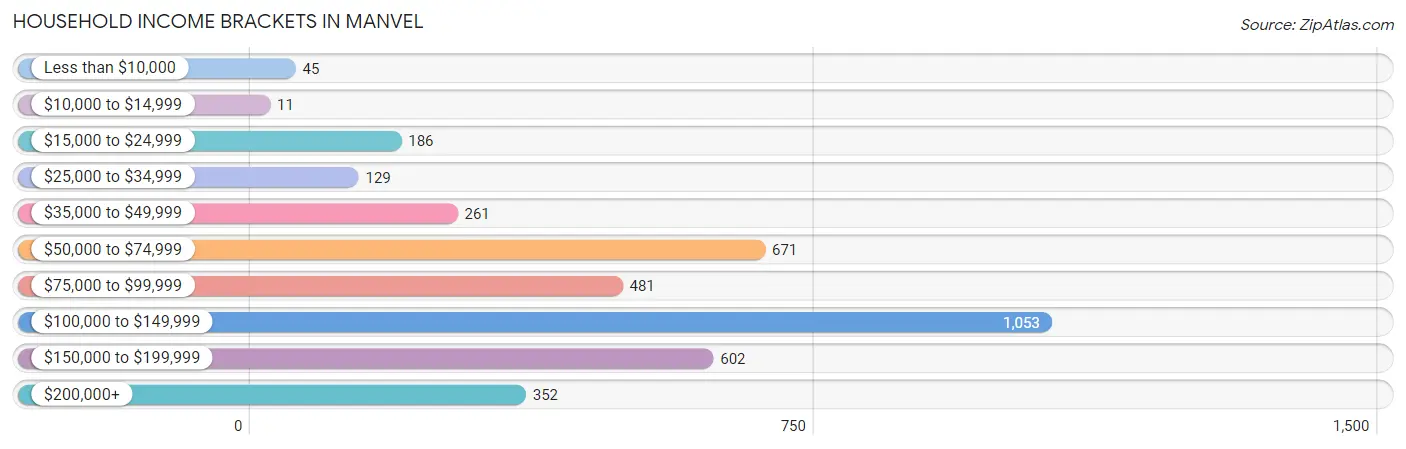
| Income Bracket | # Households | % Households |
| Less than $10,000 | 45 | 1.2% |
| $10,000 to $14,999 | 11 | 0.3% |
| $15,000 to $24,999 | 186 | 4.9% |
| $25,000 to $34,999 | 129 | 3.4% |
| $35,000 to $49,999 | 261 | 6.9% |
| $50,000 to $74,999 | 671 | 17.7% |
| $75,000 to $99,999 | 481 | 12.7% |
| $100,000 to $149,999 | 1,053 | 27.8% |
| $150,000 to $199,999 | 602 | 15.9% |
| $200,000+ | 352 | 9.3% |
Household Income by Householder Age in Manvel
The median household income in Manvel is $105,188, with the highest median household income of $132,341 found in the 45 to 64 years age bracket for the primary householder. A total of 1,410 households (37.2%) fall into this category. Meanwhile, the 15 to 24 years age bracket for the primary householder has the lowest median household income of $0, with 12 households (0.3%) in this group.
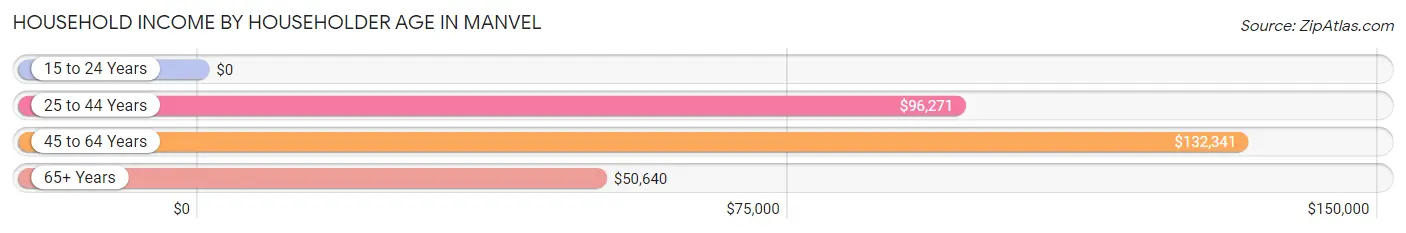
| Income Bracket | # Households | Median Income |
| 15 to 24 Years | 12 (0.3%) | $0 |
| 25 to 44 Years | 1,900 (50.1%) | $96,271 |
| 45 to 64 Years | 1,410 (37.2%) | $132,341 |
| 65+ Years | 467 (12.3%) | $50,640 |
| Total | 3,789 (100.0%) | $105,188 |
Poverty in Manvel
Income Below Poverty by Sex and Age in Manvel
With 5.8% poverty level for males and 4.1% for females among the residents of Manvel, 18 to 24 year old males and 65 to 74 year old females are the most vulnerable to poverty, with 185 males (27.4%) and 166 females (33.3%) in their respective age groups living below the poverty level.
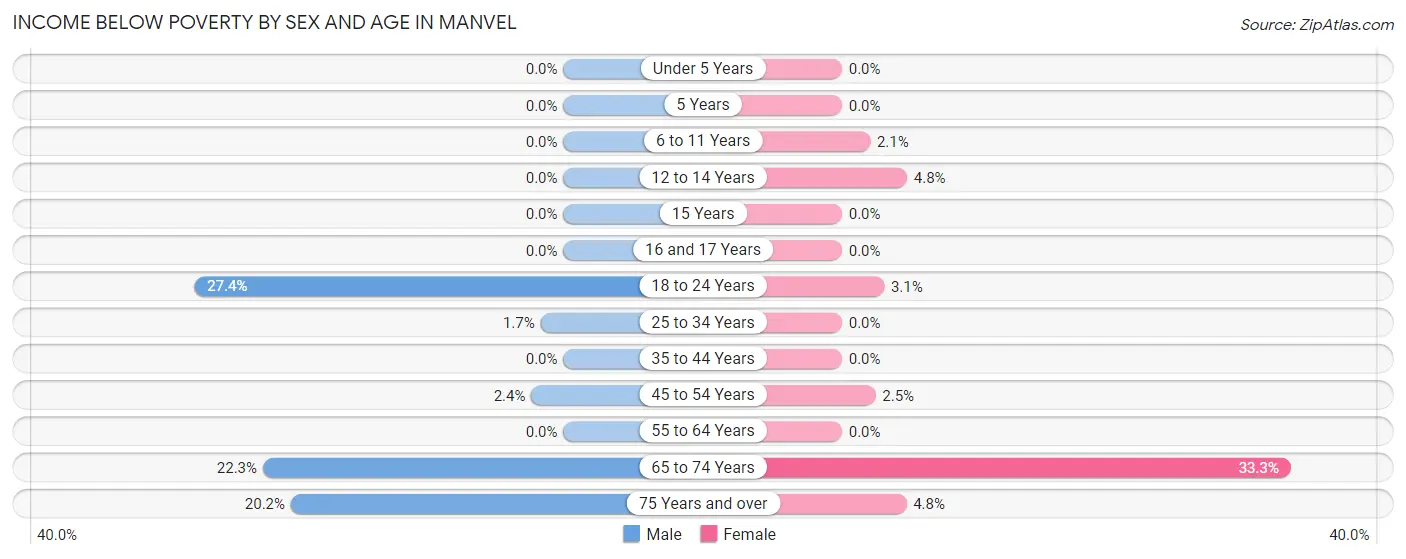
| Age Bracket | Male | Female |
| Under 5 Years | 0 (0.0%) | 0 (0.0%) |
| 5 Years | 0 (0.0%) | 0 (0.0%) |
| 6 to 11 Years | 0 (0.0%) | 12 (2.1%) |
| 12 to 14 Years | 0 (0.0%) | 10 (4.8%) |
| 15 Years | 0 (0.0%) | 0 (0.0%) |
| 16 and 17 Years | 0 (0.0%) | 0 (0.0%) |
| 18 to 24 Years | 185 (27.4%) | 13 (3.1%) |
| 25 to 34 Years | 10 (1.7%) | 0 (0.0%) |
| 35 to 44 Years | 0 (0.0%) | 0 (0.0%) |
| 45 to 54 Years | 13 (2.4%) | 20 (2.5%) |
| 55 to 64 Years | 0 (0.0%) | 0 (0.0%) |
| 65 to 74 Years | 83 (22.3%) | 166 (33.3%) |
| 75 Years and over | 35 (20.2%) | 10 (4.8%) |
| Total | 326 (5.8%) | 231 (4.1%) |
Income Above Poverty by Sex and Age in Manvel
According to the poverty statistics in Manvel, males aged under 5 years and females aged under 5 years are the age groups that are most secure financially, with 100.0% of males and 100.0% of females in these age groups living above the poverty line.
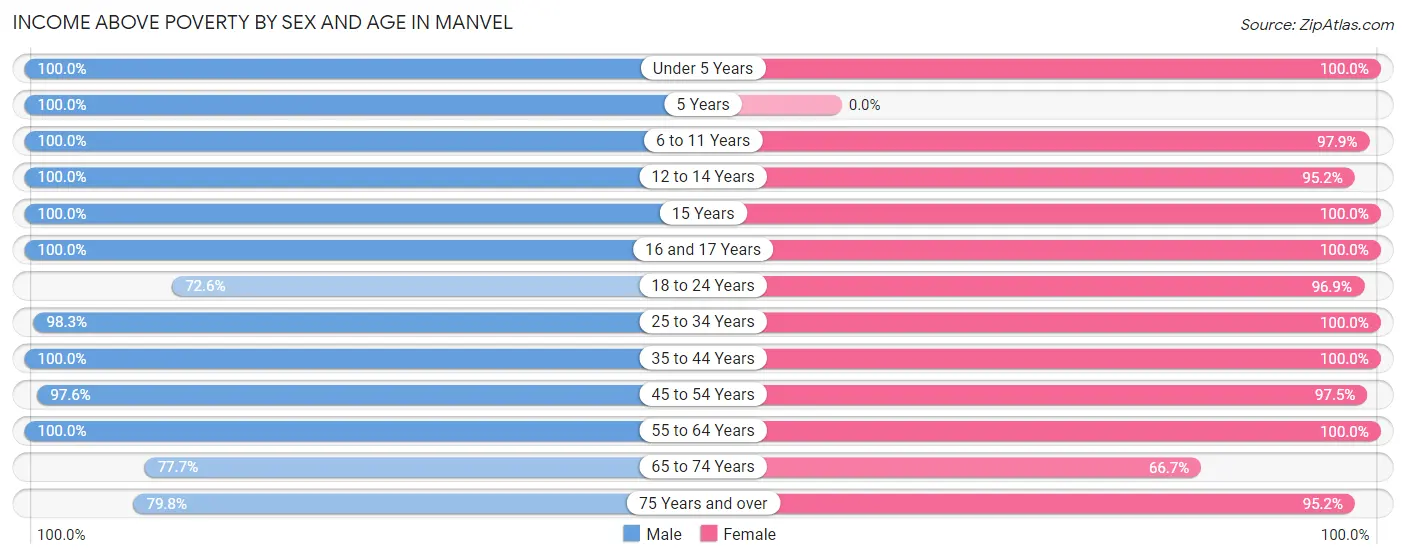
| Age Bracket | Male | Female |
| Under 5 Years | 383 (100.0%) | 200 (100.0%) |
| 5 Years | 160 (100.0%) | 0 (0.0%) |
| 6 to 11 Years | 511 (100.0%) | 562 (97.9%) |
| 12 to 14 Years | 188 (100.0%) | 197 (95.2%) |
| 15 Years | 160 (100.0%) | 127 (100.0%) |
| 16 and 17 Years | 146 (100.0%) | 271 (100.0%) |
| 18 to 24 Years | 490 (72.6%) | 402 (96.9%) |
| 25 to 34 Years | 581 (98.3%) | 740 (100.0%) |
| 35 to 44 Years | 1,286 (100.0%) | 1,134 (100.0%) |
| 45 to 54 Years | 534 (97.6%) | 784 (97.5%) |
| 55 to 64 Years | 426 (100.0%) | 414 (100.0%) |
| 65 to 74 Years | 289 (77.7%) | 332 (66.7%) |
| 75 Years and over | 138 (79.8%) | 199 (95.2%) |
| Total | 5,292 (94.2%) | 5,362 (95.9%) |
Income Below Poverty Among Married-Couple Families in Manvel
The poverty statistics for married-couple families in Manvel show that 4.3% or 99 of the total 2,325 families live below the poverty line. Families with no children have the highest poverty rate of 8.6%, comprising of 99 families. On the other hand, families with 1 or 2 children have the lowest poverty rate of 0.0%, which includes 0 families.
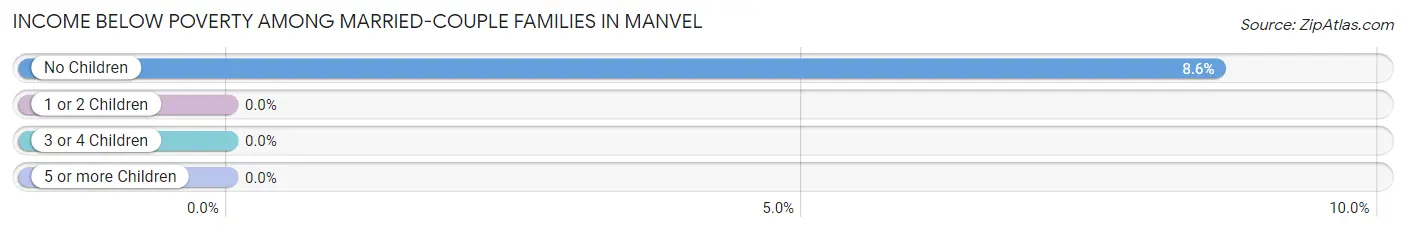
| Children | Above Poverty | Below Poverty |
| No Children | 1,052 (91.4%) | 99 (8.6%) |
| 1 or 2 Children | 857 (100.0%) | 0 (0.0%) |
| 3 or 4 Children | 292 (100.0%) | 0 (0.0%) |
| 5 or more Children | 25 (100.0%) | 0 (0.0%) |
| Total | 2,226 (95.7%) | 99 (4.3%) |
Income Below Poverty Among Single-Parent Households in Manvel
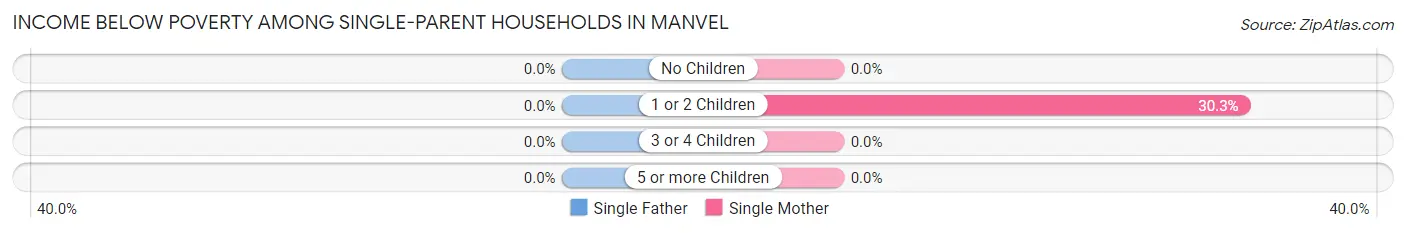
| Children | Single Father | Single Mother |
| No Children | 0 (0.0%) | 0 (0.0%) |
| 1 or 2 Children | 0 (0.0%) | 20 (30.3%) |
| 3 or 4 Children | 0 (0.0%) | 0 (0.0%) |
| 5 or more Children | 0 (0.0%) | 0 (0.0%) |
| Total | 0 (0.0%) | 20 (12.7%) |
Income Below Poverty Among Married-Couple vs Single-Parent Households in Manvel
The poverty data for Manvel shows that 99 of the married-couple family households (4.3%) and 20 of the single-parent households (4.0%) are living below the poverty level. Within the married-couple family households, those with no children have the highest poverty rate, with 99 households (8.6%) falling below the poverty line. Among the single-parent households, those with 1 or 2 children have the highest poverty rate, with 20 household (6.1%) living below poverty.
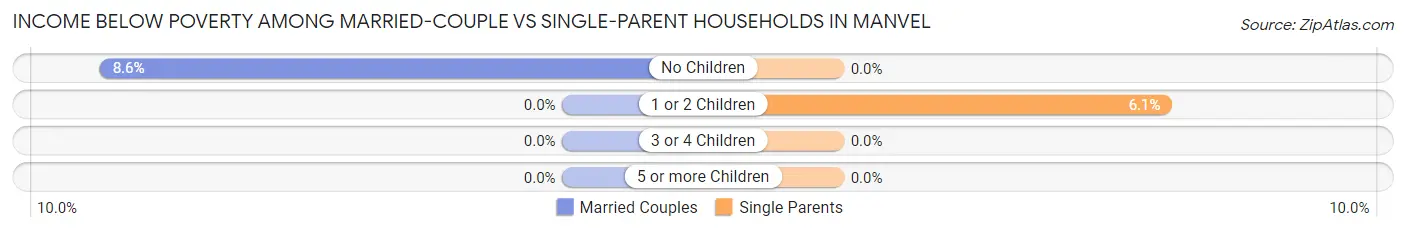
| Children | Married-Couple Families | Single-Parent Households |
| No Children | 99 (8.6%) | 0 (0.0%) |
| 1 or 2 Children | 0 (0.0%) | 20 (6.1%) |
| 3 or 4 Children | 0 (0.0%) | 0 (0.0%) |
| 5 or more Children | 0 (0.0%) | 0 (0.0%) |
| Total | 99 (4.3%) | 20 (4.0%) |
Race in Manvel
The most populous races in Manvel are White / Caucasian (5,504 | 48.9%), Black / African American (2,946 | 26.2%), and Hispanic or Latino (2,832 | 25.1%).
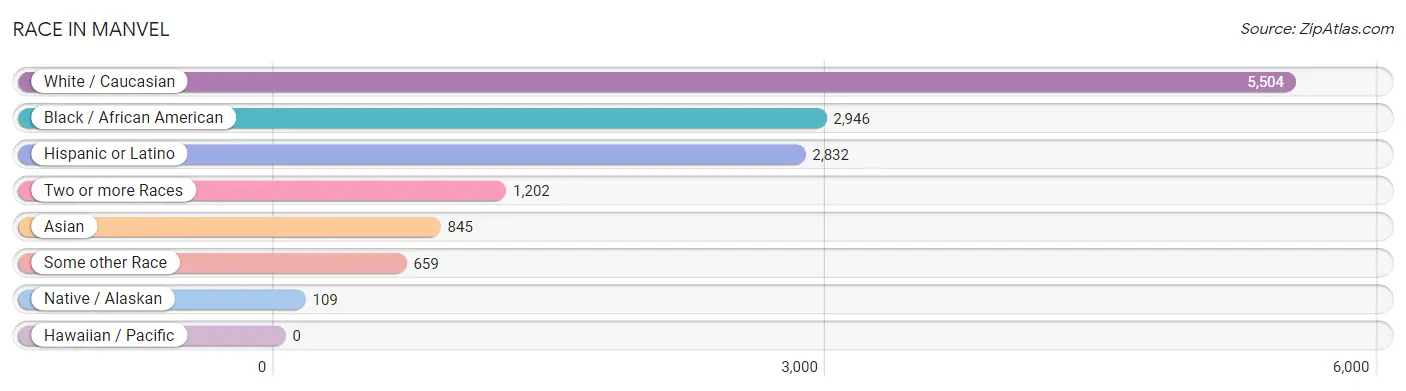
| Race | # Population | % Population |
| Asian | 845 | 7.5% |
| Black / African American | 2,946 | 26.2% |
| Hawaiian / Pacific | 0 | 0.0% |
| Hispanic or Latino | 2,832 | 25.1% |
| Native / Alaskan | 109 | 1.0% |
| White / Caucasian | 5,504 | 48.9% |
| Two or more Races | 1,202 | 10.7% |
| Some other Race | 659 | 5.9% |
| Total | 11,265 | 100.0% |
Ancestry in Manvel
The most populous ancestries reported in Manvel are Mexican (2,581 | 22.9%), German (957 | 8.5%), Irish (672 | 6.0%), English (516 | 4.6%), and Korean (515 | 4.6%), together accounting for 46.5% of all Manvel residents.
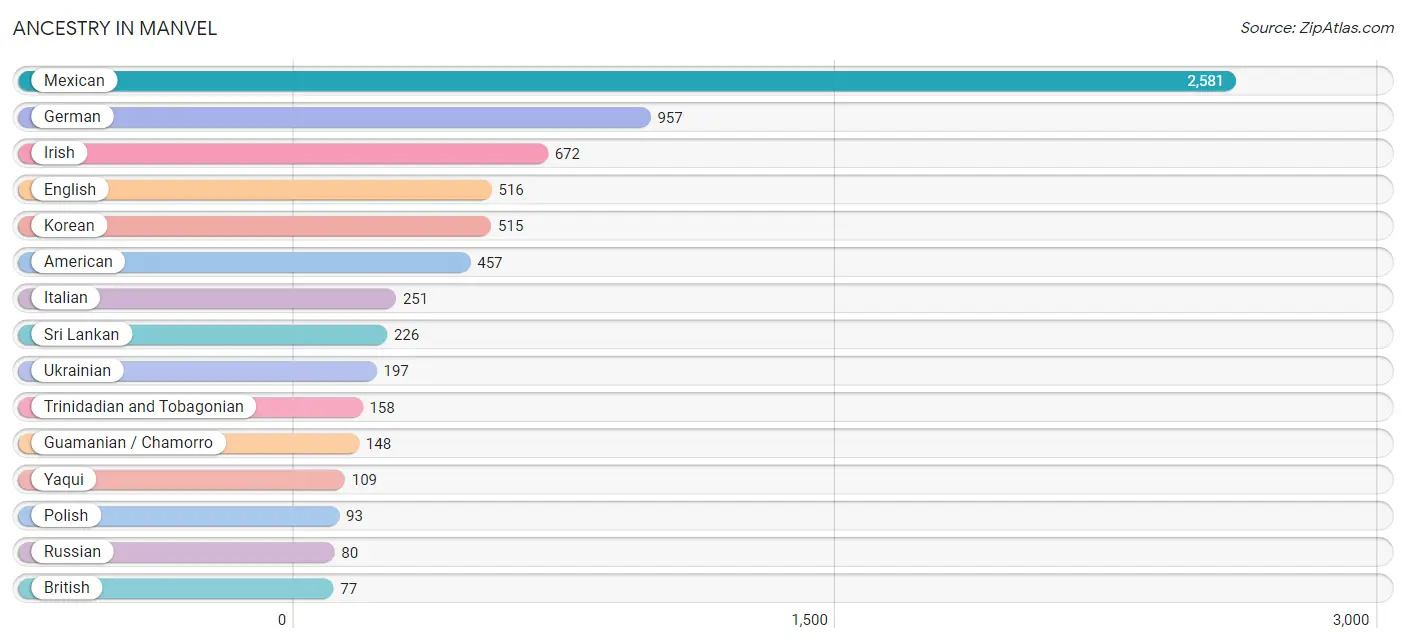
| Ancestry | # Population | % Population |
| American | 457 | 4.1% |
| British | 77 | 0.7% |
| Burmese | 57 | 0.5% |
| Canadian | 13 | 0.1% |
| Cherokee | 16 | 0.1% |
| Cuban | 49 | 0.4% |
| Czech | 69 | 0.6% |
| English | 516 | 4.6% |
| European | 77 | 0.7% |
| French | 47 | 0.4% |
| German | 957 | 8.5% |
| Guamanian / Chamorro | 148 | 1.3% |
| Hungarian | 11 | 0.1% |
| Indian (Asian) | 9 | 0.1% |
| Irish | 672 | 6.0% |
| Italian | 251 | 2.2% |
| Korean | 515 | 4.6% |
| Mexican | 2,581 | 22.9% |
| Nigerian | 41 | 0.4% |
| Northern European | 36 | 0.3% |
| Norwegian | 72 | 0.6% |
| Paraguayan | 46 | 0.4% |
| Polish | 93 | 0.8% |
| Puerto Rican | 38 | 0.3% |
| Romanian | 20 | 0.2% |
| Russian | 80 | 0.7% |
| Scandinavian | 12 | 0.1% |
| Scotch-Irish | 15 | 0.1% |
| South American | 46 | 0.4% |
| Spaniard | 20 | 0.2% |
| Sri Lankan | 226 | 2.0% |
| Subsaharan African | 41 | 0.4% |
| Swedish | 7 | 0.1% |
| Swiss | 18 | 0.2% |
| Thai | 47 | 0.4% |
| Trinidadian and Tobagonian | 158 | 1.4% |
| Ukrainian | 197 | 1.8% |
| Welsh | 33 | 0.3% |
| Yaqui | 109 | 1.0% | View All 39 Rows |
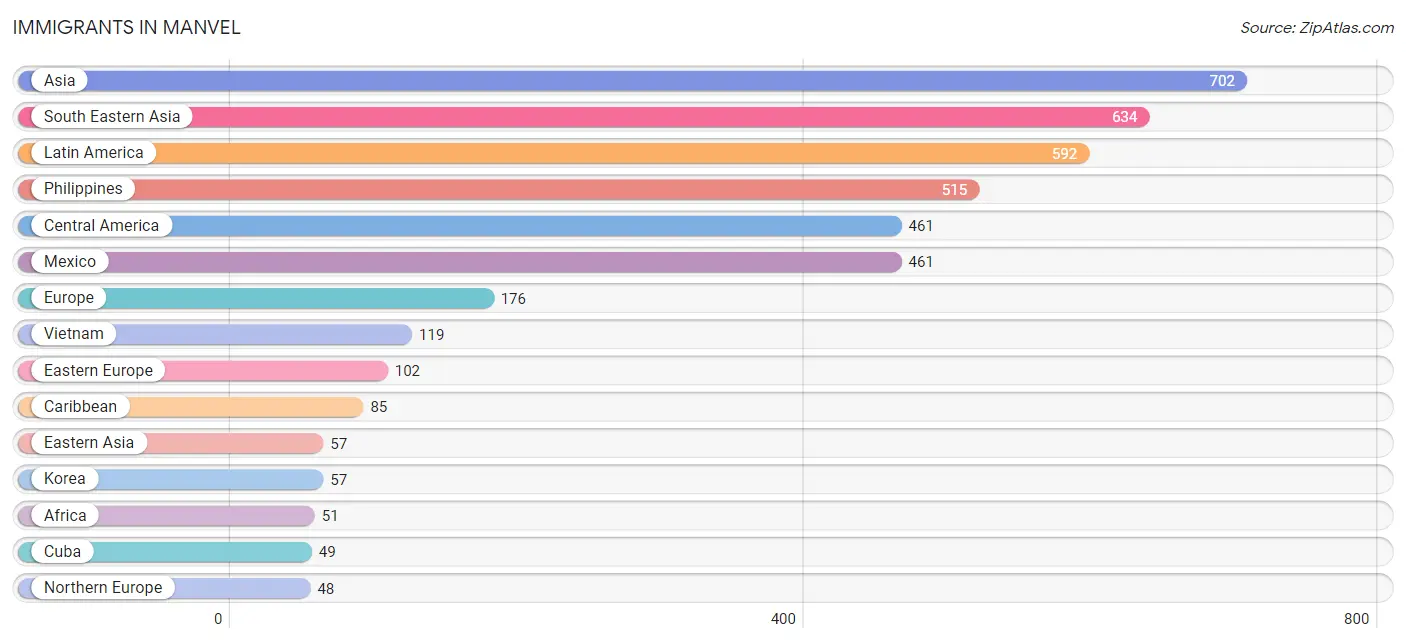
Immigrants in Manvel
The most numerous immigrant groups reported in Manvel came from Asia (702 | 6.2%), South Eastern Asia (634 | 5.6%), Latin America (592 | 5.3%), Philippines (515 | 4.6%), and Central America (461 | 4.1%), together accounting for 25.8% of all Manvel residents.
| Immigration Origin | # Population | % Population |
| Africa | 51 | 0.4% |
| Asia | 702 | 6.2% |
| Caribbean | 85 | 0.7% |
| Central America | 461 | 4.1% |
| Cuba | 49 | 0.4% |
| Eastern Africa | 10 | 0.1% |
| Eastern Asia | 57 | 0.5% |
| Eastern Europe | 102 | 0.9% |
| Ethiopia | 10 | 0.1% |
| Europe | 176 | 1.6% |
| India | 11 | 0.1% |
| Korea | 57 | 0.5% |
| Latin America | 592 | 5.3% |
| Mexico | 461 | 4.1% |
| Nigeria | 41 | 0.4% |
| Northern Europe | 48 | 0.4% |
| Philippines | 515 | 4.6% |
| Poland | 14 | 0.1% |
| Romania | 11 | 0.1% |
| Russia | 40 | 0.4% |
| South America | 46 | 0.4% |
| South Central Asia | 11 | 0.1% |
| South Eastern Asia | 634 | 5.6% |
| Ukraine | 37 | 0.3% |
| Vietnam | 119 | 1.1% |
| West Indies | 36 | 0.3% |
| Western Africa | 41 | 0.4% | View All 27 Rows |
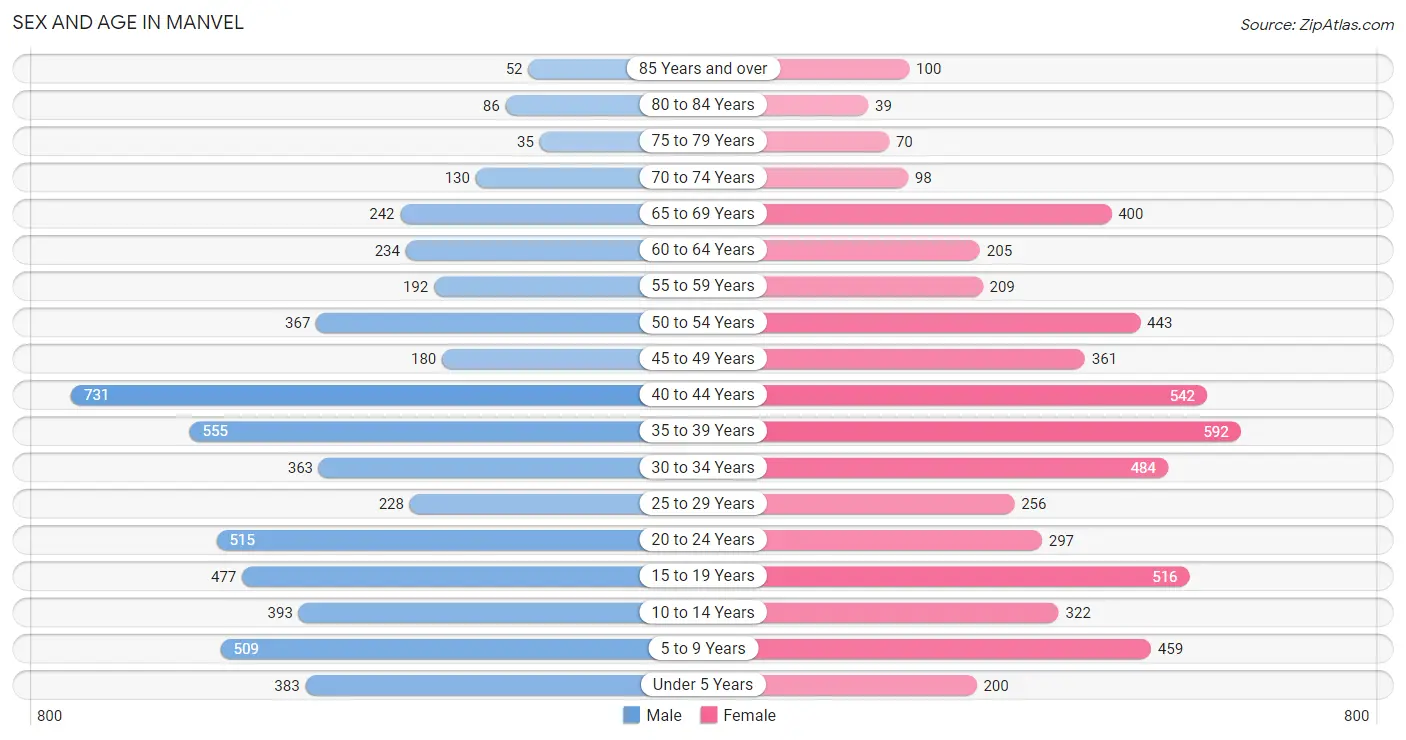
Sex and Age in Manvel
Sex and Age in Manvel
The most populous age groups in Manvel are 40 to 44 Years (731 | 12.9%) for men and 35 to 39 Years (592 | 10.6%) for women.
| Age Bracket | Male | Female |
| Under 5 Years | 383 (6.8%) | 200 (3.6%) |
| 5 to 9 Years | 509 (9.0%) | 459 (8.2%) |
| 10 to 14 Years | 393 (6.9%) | 322 (5.8%) |
| 15 to 19 Years | 477 (8.4%) | 516 (9.2%) |
| 20 to 24 Years | 515 (9.1%) | 297 (5.3%) |
| 25 to 29 Years | 228 (4.0%) | 256 (4.6%) |
| 30 to 34 Years | 363 (6.4%) | 484 (8.6%) |
| 35 to 39 Years | 555 (9.8%) | 592 (10.6%) |
| 40 to 44 Years | 731 (12.9%) | 542 (9.7%) |
| 45 to 49 Years | 180 (3.2%) | 361 (6.5%) |
| 50 to 54 Years | 367 (6.5%) | 443 (7.9%) |
| 55 to 59 Years | 192 (3.4%) | 209 (3.7%) |
| 60 to 64 Years | 234 (4.1%) | 205 (3.7%) |
| 65 to 69 Years | 242 (4.3%) | 400 (7.1%) |
| 70 to 74 Years | 130 (2.3%) | 98 (1.8%) |
| 75 to 79 Years | 35 (0.6%) | 70 (1.3%) |
| 80 to 84 Years | 86 (1.5%) | 39 (0.7%) |
| 85 Years and over | 52 (0.9%) | 100 (1.8%) |
| Total | 5,672 (100.0%) | 5,593 (100.0%) |
Families and Households in Manvel
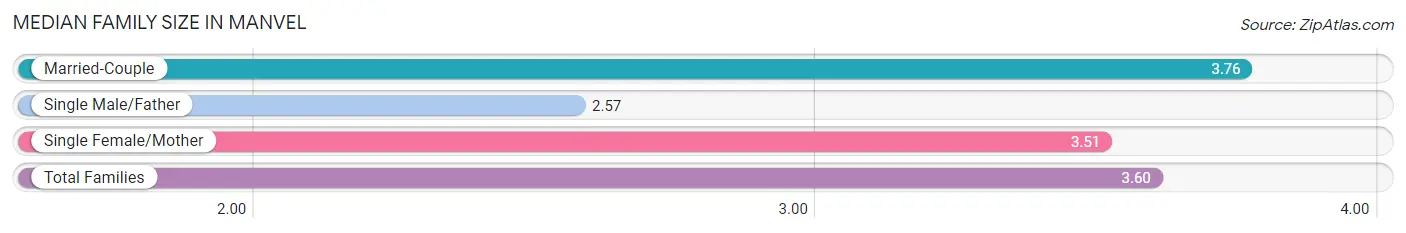
Median Family Size in Manvel
The median family size in Manvel is 3.60 persons per family, with married-couple families (2,325 | 82.2%) accounting for the largest median family size of 3.76 persons per family. On the other hand, single male/father families (347 | 12.3%) represent the smallest median family size with 2.57 persons per family.
| Family Type | # Families | Family Size |
| Married-Couple | 2,325 (82.2%) | 3.76 |
| Single Male/Father | 347 (12.3%) | 2.57 |
| Single Female/Mother | 158 (5.6%) | 3.51 |
| Total Families | 2,830 (100.0%) | 3.60 |
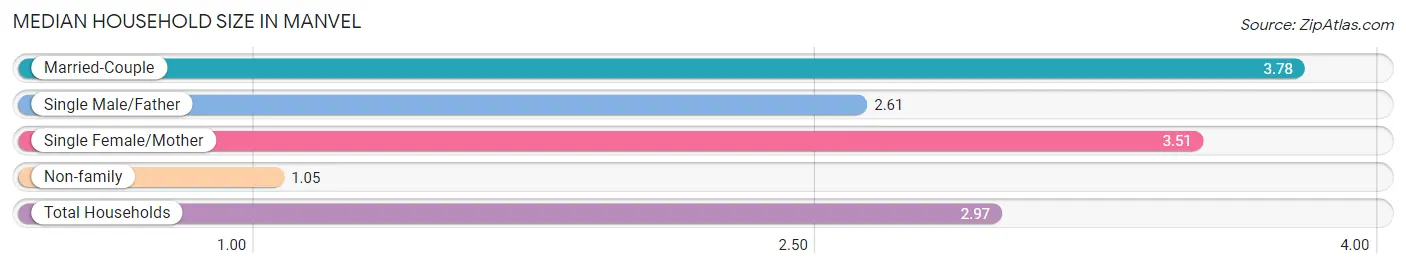
Median Household Size in Manvel
The median household size in Manvel is 2.97 persons per household, with married-couple households (2,325 | 61.4%) accounting for the largest median household size of 3.78 persons per household. non-family households (959 | 25.3%) represent the smallest median household size with 1.05 persons per household.
| Household Type | # Households | Household Size |
| Married-Couple | 2,325 (61.4%) | 3.78 |
| Single Male/Father | 347 (9.2%) | 2.61 |
| Single Female/Mother | 158 (4.2%) | 3.51 |
| Non-family | 959 (25.3%) | 1.05 |
| Total Households | 3,789 (100.0%) | 2.97 |
Household Size by Marriage Status in Manvel
Out of a total of 3,789 households in Manvel, 2,830 (74.7%) are family households, while 959 (25.3%) are nonfamily households. The most numerous type of family households are 2-person households, comprising 959, and the most common type of nonfamily households are 1-person households, comprising 918.
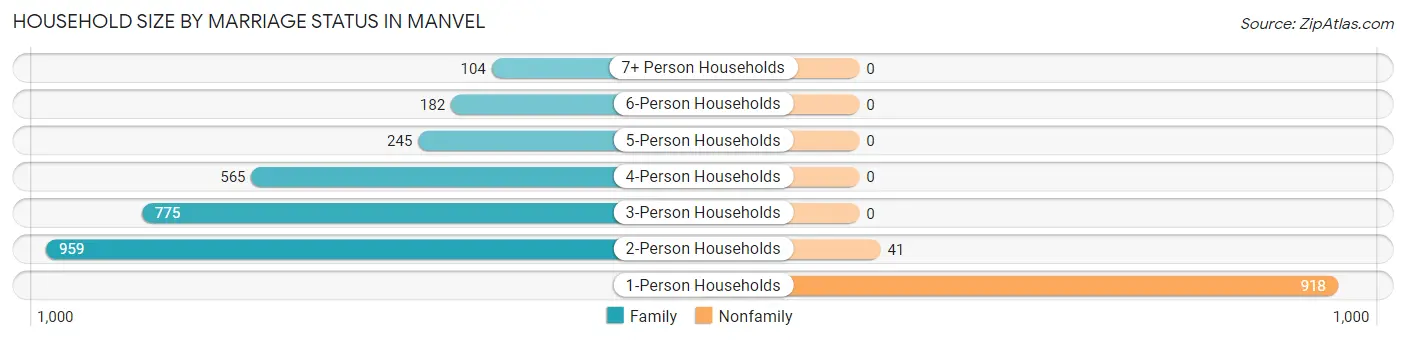
| Household Size | Family Households | Nonfamily Households |
| 1-Person Households | - | 918 (24.2%) |
| 2-Person Households | 959 (25.3%) | 41 (1.1%) |
| 3-Person Households | 775 (20.4%) | 0 (0.0%) |
| 4-Person Households | 565 (14.9%) | 0 (0.0%) |
| 5-Person Households | 245 (6.5%) | 0 (0.0%) |
| 6-Person Households | 182 (4.8%) | 0 (0.0%) |
| 7+ Person Households | 104 (2.7%) | 0 (0.0%) |
| Total | 2,830 (74.7%) | 959 (25.3%) |
Female Fertility in Manvel
Fertility by Age in Manvel
Average fertility rate in Manvel is 35.0 births per 1,000 women. Women in the age bracket of 35 to 50 years have the highest fertility rate with 43.0 births per 1,000 women. Women in the age bracket of 35 to 50 years acount for 63.3% of all women with births.
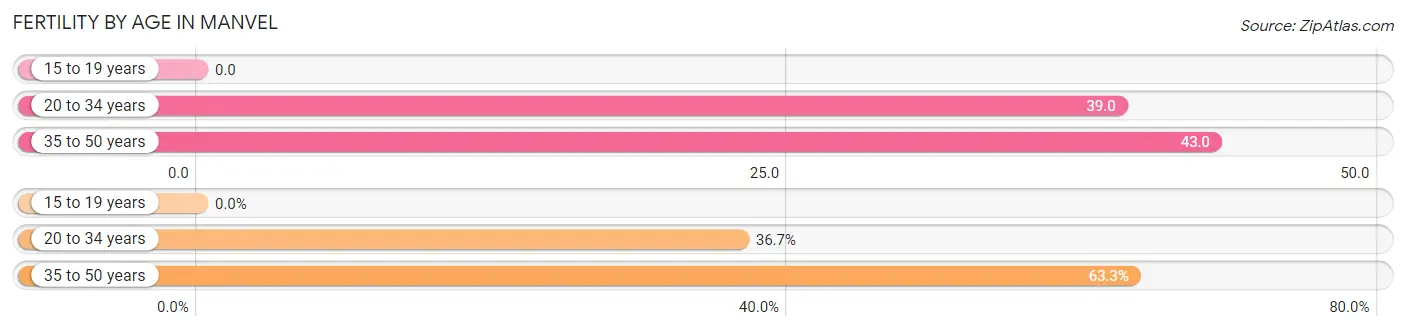
| Age Bracket | Women with Births | Births / 1,000 Women |
| 15 to 19 years | 0 (0.0%) | 0.0 |
| 20 to 34 years | 40 (36.7%) | 39.0 |
| 35 to 50 years | 69 (63.3%) | 43.0 |
| Total | 109 (100.0%) | 35.0 |
Fertility by Age by Marriage Status in Manvel
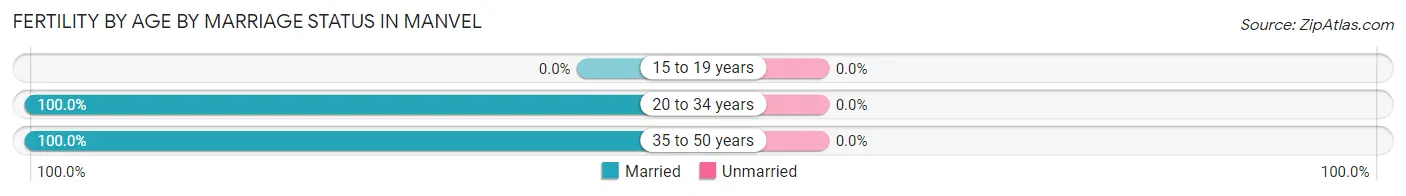
| Age Bracket | Married | Unmarried |
| 15 to 19 years | 0 (0.0%) | 0 (0.0%) |
| 20 to 34 years | 40 (100.0%) | 0 (0.0%) |
| 35 to 50 years | 69 (100.0%) | 0 (0.0%) |
| Total | 109 (100.0%) | 0 (0.0%) |
Fertility by Education in Manvel
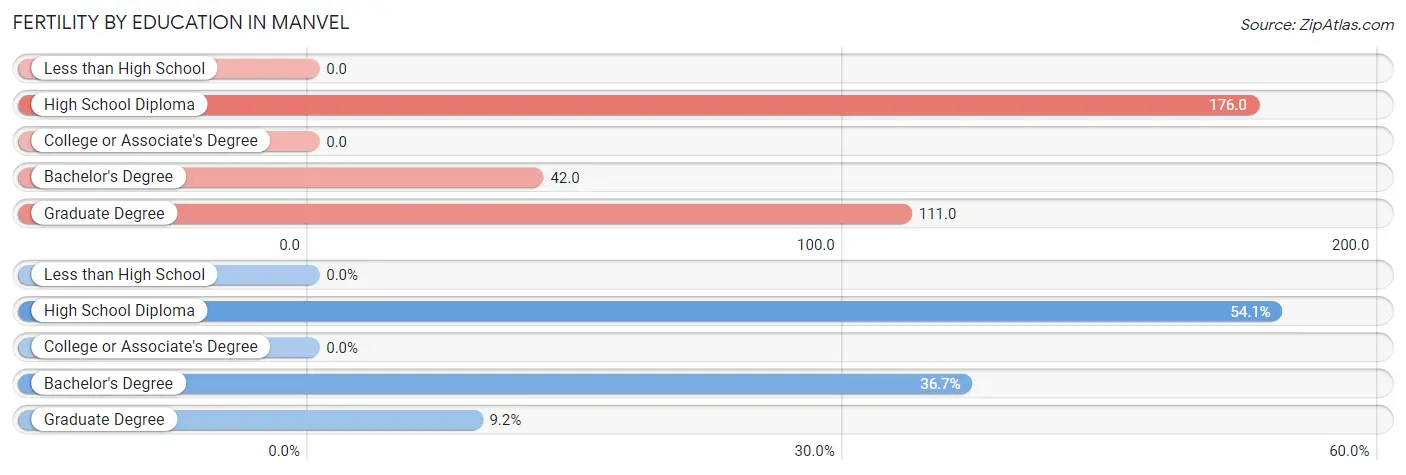
| Educational Attainment | Women with Births | Births / 1,000 Women |
| Less than High School | 0 (0.0%) | 0.0 |
| High School Diploma | 59 (54.1%) | 176.0 |
| College or Associate's Degree | 0 (0.0%) | 0.0 |
| Bachelor's Degree | 40 (36.7%) | 42.0 |
| Graduate Degree | 10 (9.2%) | 111.0 |
| Total | 109 (100.0%) | 35.0 |
Fertility by Education by Marriage Status in Manvel
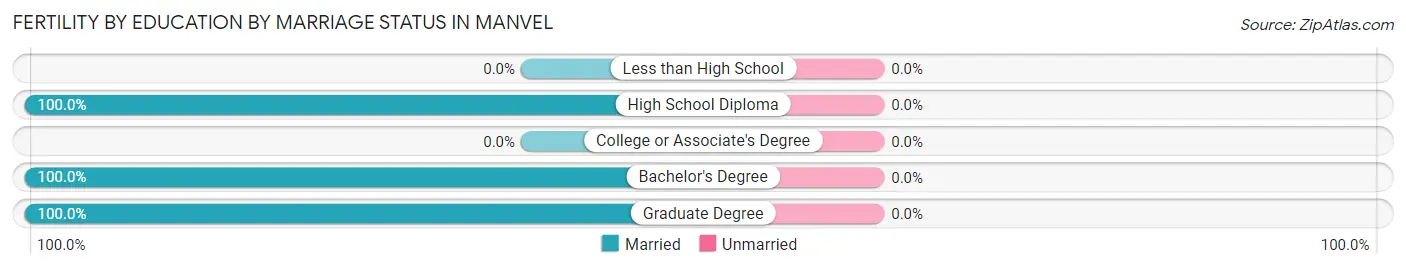
| Educational Attainment | Married | Unmarried |
| Less than High School | 0 (0.0%) | 0 (0.0%) |
| High School Diploma | 59 (100.0%) | 0 (0.0%) |
| College or Associate's Degree | 0 (0.0%) | 0 (0.0%) |
| Bachelor's Degree | 40 (100.0%) | 0 (0.0%) |
| Graduate Degree | 10 (100.0%) | 0 (0.0%) |
| Total | 109 (100.0%) | 0 (0.0%) |
Employment Characteristics in Manvel
Employment by Class of Employer in Manvel
Among the 5,239 employed individuals in Manvel, private company employees (3,422 | 65.3%), local government employees (784 | 15.0%), and not-for-profit organizations (308 | 5.9%) make up the most common classes of employment.
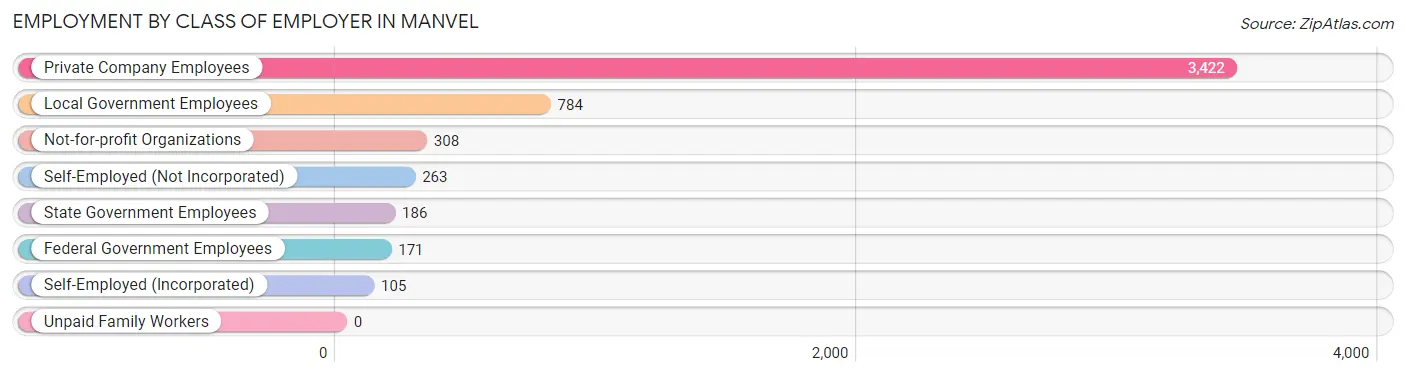
| Employer Class | # Employees | % Employees |
| Private Company Employees | 3,422 | 65.3% |
| Self-Employed (Incorporated) | 105 | 2.0% |
| Self-Employed (Not Incorporated) | 263 | 5.0% |
| Not-for-profit Organizations | 308 | 5.9% |
| Local Government Employees | 784 | 15.0% |
| State Government Employees | 186 | 3.5% |
| Federal Government Employees | 171 | 3.3% |
| Unpaid Family Workers | 0 | 0.0% |
| Total | 5,239 | 100.0% |
Employment Status by Age in Manvel
According to the labor force statistics for Manvel, out of the total population over 16 years of age (8,701), 64.0% or 5,569 individuals are in the labor force, with 2.6% or 145 of them unemployed. The age group with the highest labor force participation rate is 30 to 34 years, with 90.2% or 764 individuals in the labor force. Within the labor force, the 20 to 24 years age range has the highest percentage of unemployed individuals, with 10.1% or 54 of them being unemployed.
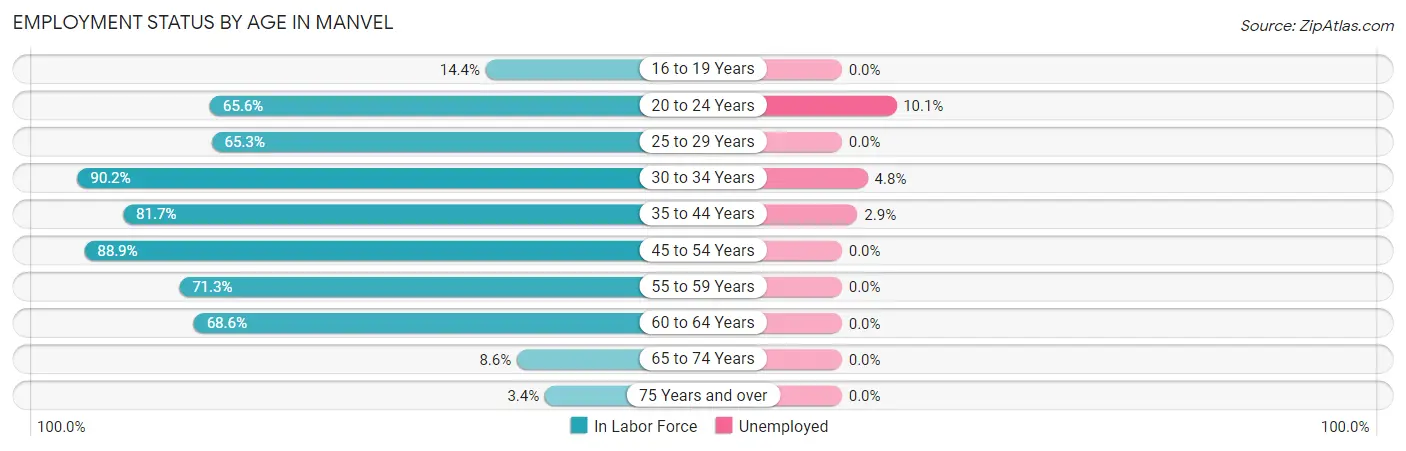
| Age Bracket | In Labor Force | Unemployed |
| 16 to 19 Years | 100 (14.4%) | 0 (0.0%) |
| 20 to 24 Years | 533 (65.6%) | 54 (10.1%) |
| 25 to 29 Years | 316 (65.3%) | 0 (0.0%) |
| 30 to 34 Years | 764 (90.2%) | 37 (4.8%) |
| 35 to 44 Years | 1,977 (81.7%) | 57 (2.9%) |
| 45 to 54 Years | 1,201 (88.9%) | 0 (0.0%) |
| 55 to 59 Years | 286 (71.3%) | 0 (0.0%) |
| 60 to 64 Years | 301 (68.6%) | 0 (0.0%) |
| 65 to 74 Years | 75 (8.6%) | 0 (0.0%) |
| 75 Years and over | 13 (3.4%) | 0 (0.0%) |
| Total | 5,569 (64.0%) | 145 (2.6%) |
Employment Status by Educational Attainment in Manvel
According to labor force statistics for Manvel, 81.5% of individuals (4,843) out of the total population between 25 and 64 years of age (5,942) are in the labor force, with 1.9% or 92 of them being unemployed. The group with the highest labor force participation rate are those with the educational attainment of bachelor's degree or higher, with 96.8% or 2,169 individuals in the labor force. Within the labor force, individuals with college / associate degree education have the highest percentage of unemployment, with 3.3% or 57 of them being unemployed.
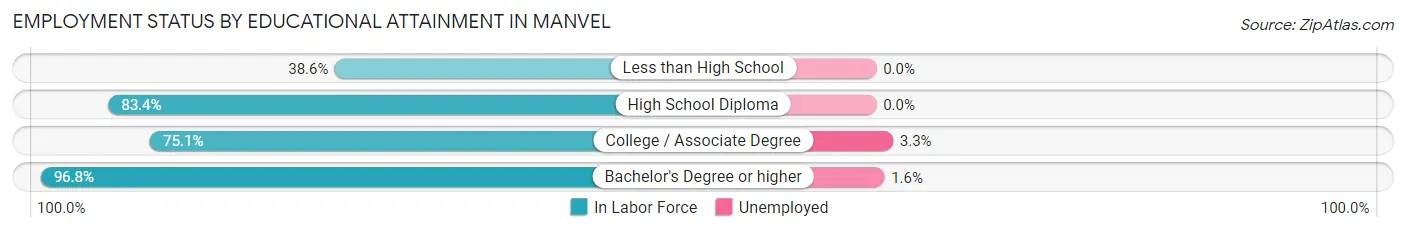
| Educational Attainment | In Labor Force | Unemployed |
| Less than High School | 191 (38.6%) | 0 (0.0%) |
| High School Diploma | 758 (83.4%) | 0 (0.0%) |
| College / Associate Degree | 1,725 (75.1%) | 76 (3.3%) |
| Bachelor's Degree or higher | 2,169 (96.8%) | 36 (1.6%) |
| Total | 4,843 (81.5%) | 113 (1.9%) |
Employment Occupations by Sex in Manvel
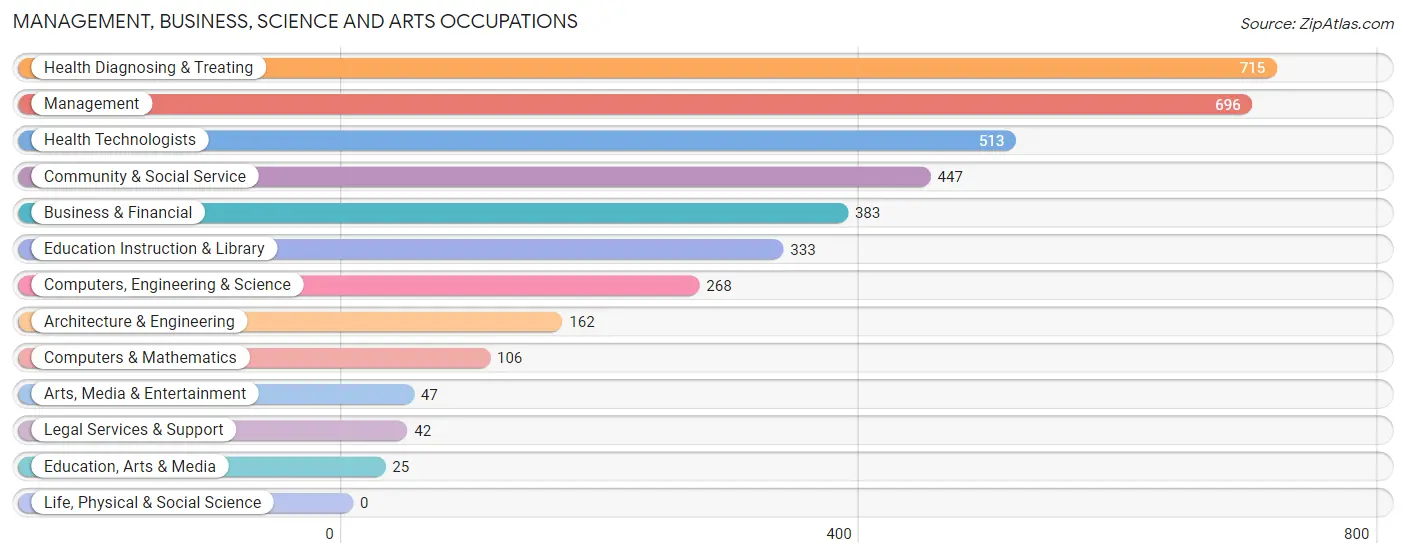
Management, Business, Science and Arts Occupations
The most common Management, Business, Science and Arts occupations in Manvel are Health Diagnosing & Treating (715 | 13.3%), Management (696 | 12.9%), Health Technologists (513 | 9.5%), Community & Social Service (447 | 8.3%), and Business & Financial (383 | 7.1%).
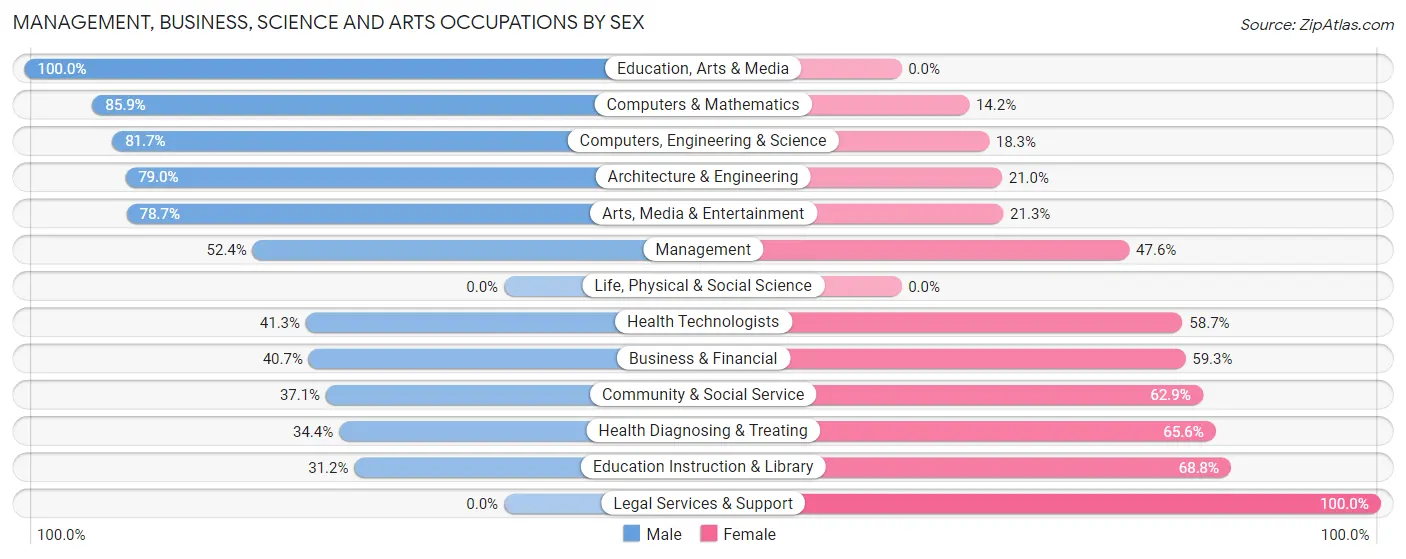
Management, Business, Science and Arts Occupations by Sex
Within the Management, Business, Science and Arts occupations in Manvel, the most male-oriented occupations are Education, Arts & Media (100.0%), Computers & Mathematics (85.9%), and Computers, Engineering & Science (81.7%), while the most female-oriented occupations are Legal Services & Support (100.0%), Education Instruction & Library (68.8%), and Health Diagnosing & Treating (65.6%).
| Occupation | Male | Female |
| Management | 365 (52.4%) | 331 (47.6%) |
| Business & Financial | 156 (40.7%) | 227 (59.3%) |
| Computers, Engineering & Science | 219 (81.7%) | 49 (18.3%) |
| Computers & Mathematics | 91 (85.9%) | 15 (14.1%) |
| Architecture & Engineering | 128 (79.0%) | 34 (21.0%) |
| Life, Physical & Social Science | 0 (0.0%) | 0 (0.0%) |
| Community & Social Service | 166 (37.1%) | 281 (62.9%) |
| Education, Arts & Media | 25 (100.0%) | 0 (0.0%) |
| Legal Services & Support | 0 (0.0%) | 42 (100.0%) |
| Education Instruction & Library | 104 (31.2%) | 229 (68.8%) |
| Arts, Media & Entertainment | 37 (78.7%) | 10 (21.3%) |
| Health Diagnosing & Treating | 246 (34.4%) | 469 (65.6%) |
| Health Technologists | 212 (41.3%) | 301 (58.7%) |
| Total (Category) | 1,152 (45.9%) | 1,357 (54.1%) |
| Total (Overall) | 2,669 (49.6%) | 2,709 (50.4%) |
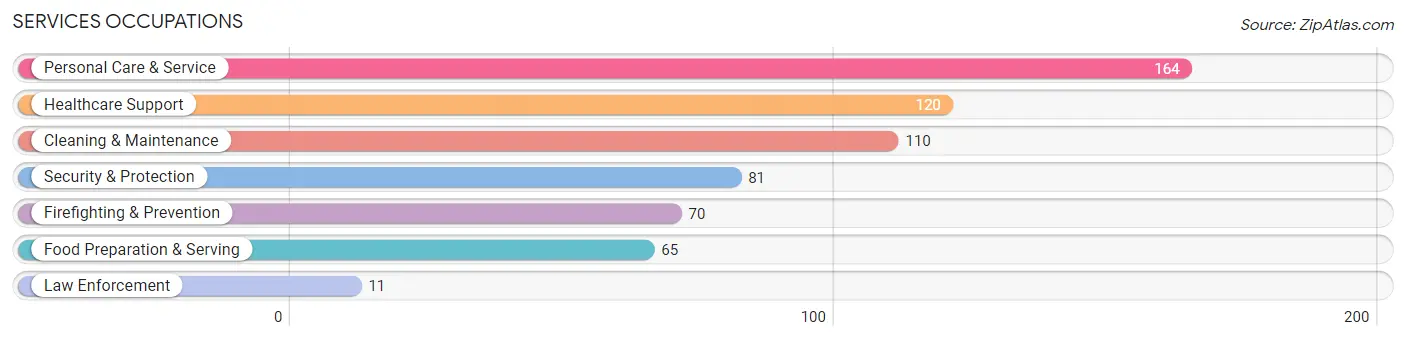
Services Occupations
The most common Services occupations in Manvel are Personal Care & Service (164 | 3.0%), Healthcare Support (120 | 2.2%), Cleaning & Maintenance (110 | 2.1%), Security & Protection (81 | 1.5%), and Firefighting & Prevention (70 | 1.3%).
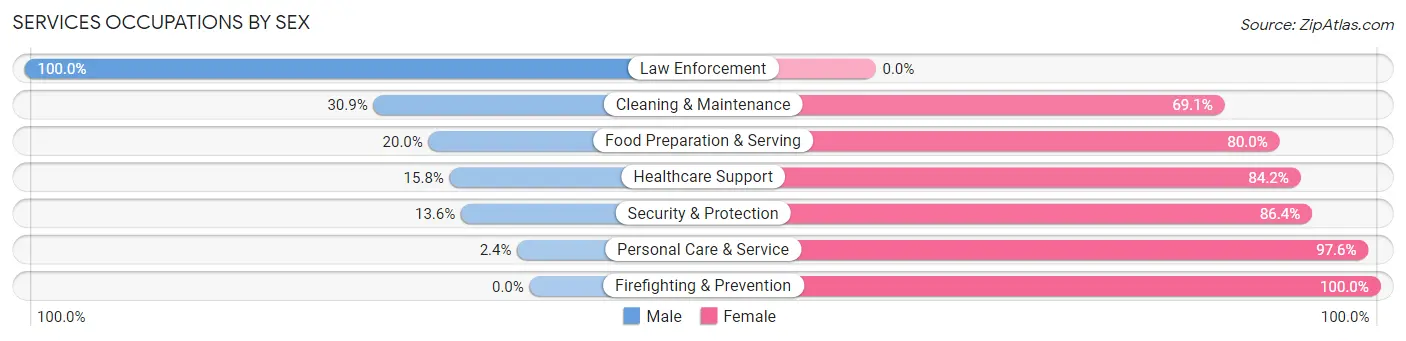
Services Occupations by Sex
Within the Services occupations in Manvel, the most male-oriented occupations are Law Enforcement (100.0%), Cleaning & Maintenance (30.9%), and Food Preparation & Serving (20.0%), while the most female-oriented occupations are Firefighting & Prevention (100.0%), Personal Care & Service (97.6%), and Security & Protection (86.4%).
| Occupation | Male | Female |
| Healthcare Support | 19 (15.8%) | 101 (84.2%) |
| Security & Protection | 11 (13.6%) | 70 (86.4%) |
| Firefighting & Prevention | 0 (0.0%) | 70 (100.0%) |
| Law Enforcement | 11 (100.0%) | 0 (0.0%) |
| Food Preparation & Serving | 13 (20.0%) | 52 (80.0%) |
| Cleaning & Maintenance | 34 (30.9%) | 76 (69.1%) |
| Personal Care & Service | 4 (2.4%) | 160 (97.6%) |
| Total (Category) | 81 (15.0%) | 459 (85.0%) |
| Total (Overall) | 2,669 (49.6%) | 2,709 (50.4%) |
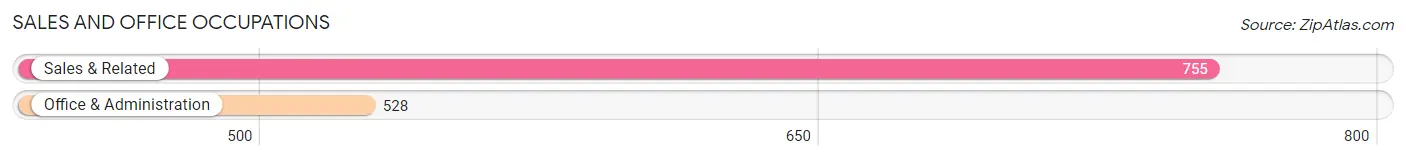
Sales and Office Occupations
The most common Sales and Office occupations in Manvel are Sales & Related (755 | 14.0%), and Office & Administration (528 | 9.8%).
Sales and Office Occupations by Sex
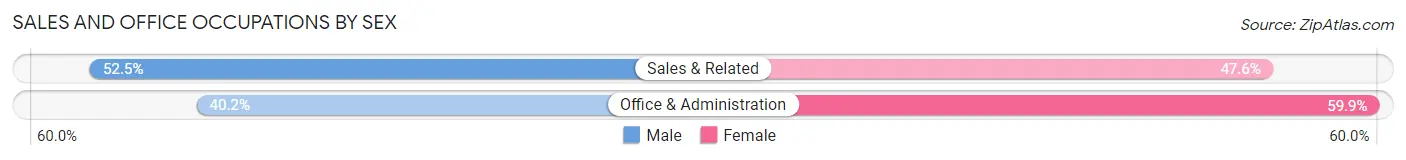
| Occupation | Male | Female |
| Sales & Related | 396 (52.4%) | 359 (47.5%) |
| Office & Administration | 212 (40.2%) | 316 (59.9%) |
| Total (Category) | 608 (47.4%) | 675 (52.6%) |
| Total (Overall) | 2,669 (49.6%) | 2,709 (50.4%) |
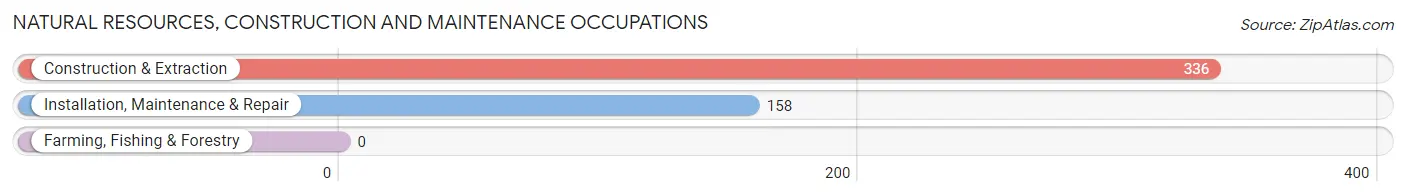
Natural Resources, Construction and Maintenance Occupations
The most common Natural Resources, Construction and Maintenance occupations in Manvel are Construction & Extraction (336 | 6.2%), and Installation, Maintenance & Repair (158 | 2.9%).
Natural Resources, Construction and Maintenance Occupations by Sex
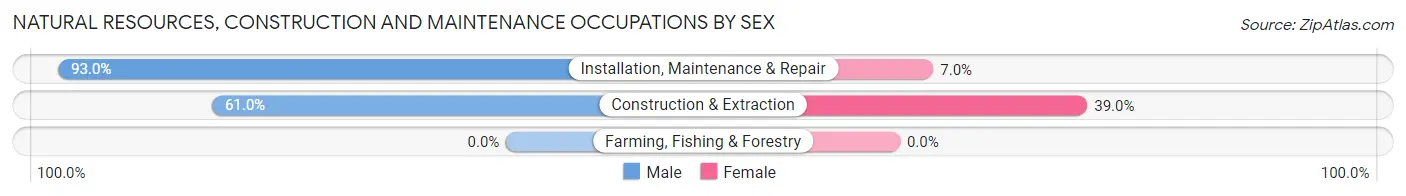
| Occupation | Male | Female |
| Farming, Fishing & Forestry | 0 (0.0%) | 0 (0.0%) |
| Construction & Extraction | 205 (61.0%) | 131 (39.0%) |
| Installation, Maintenance & Repair | 147 (93.0%) | 11 (7.0%) |
| Total (Category) | 352 (71.3%) | 142 (28.7%) |
| Total (Overall) | 2,669 (49.6%) | 2,709 (50.4%) |
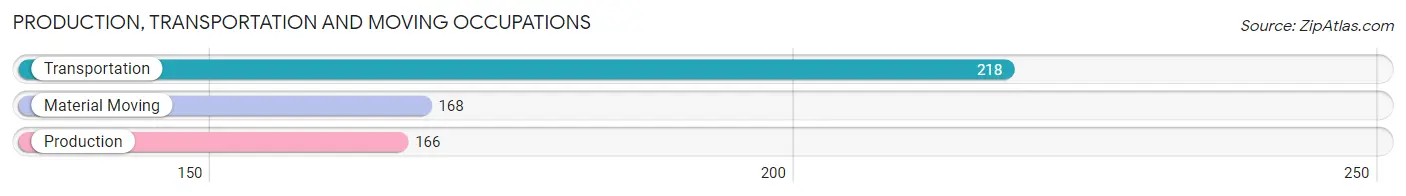
Production, Transportation and Moving Occupations
The most common Production, Transportation and Moving occupations in Manvel are Transportation (218 | 4.1%), Material Moving (168 | 3.1%), and Production (166 | 3.1%).
Production, Transportation and Moving Occupations by Sex
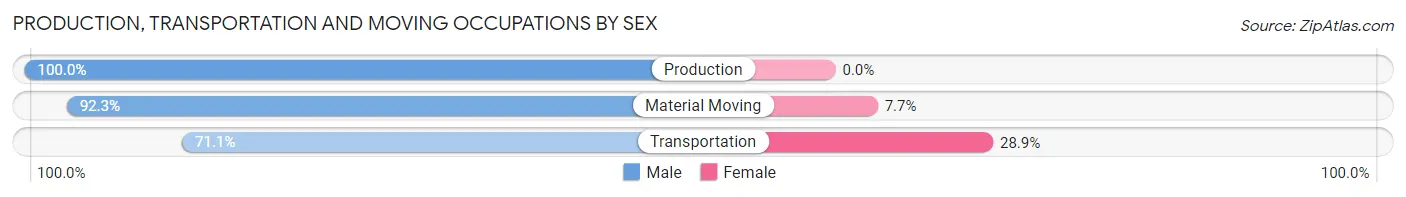
| Occupation | Male | Female |
| Production | 166 (100.0%) | 0 (0.0%) |
| Transportation | 155 (71.1%) | 63 (28.9%) |
| Material Moving | 155 (92.3%) | 13 (7.7%) |
| Total (Category) | 476 (86.2%) | 76 (13.8%) |
| Total (Overall) | 2,669 (49.6%) | 2,709 (50.4%) |
Employment Industries by Sex in Manvel
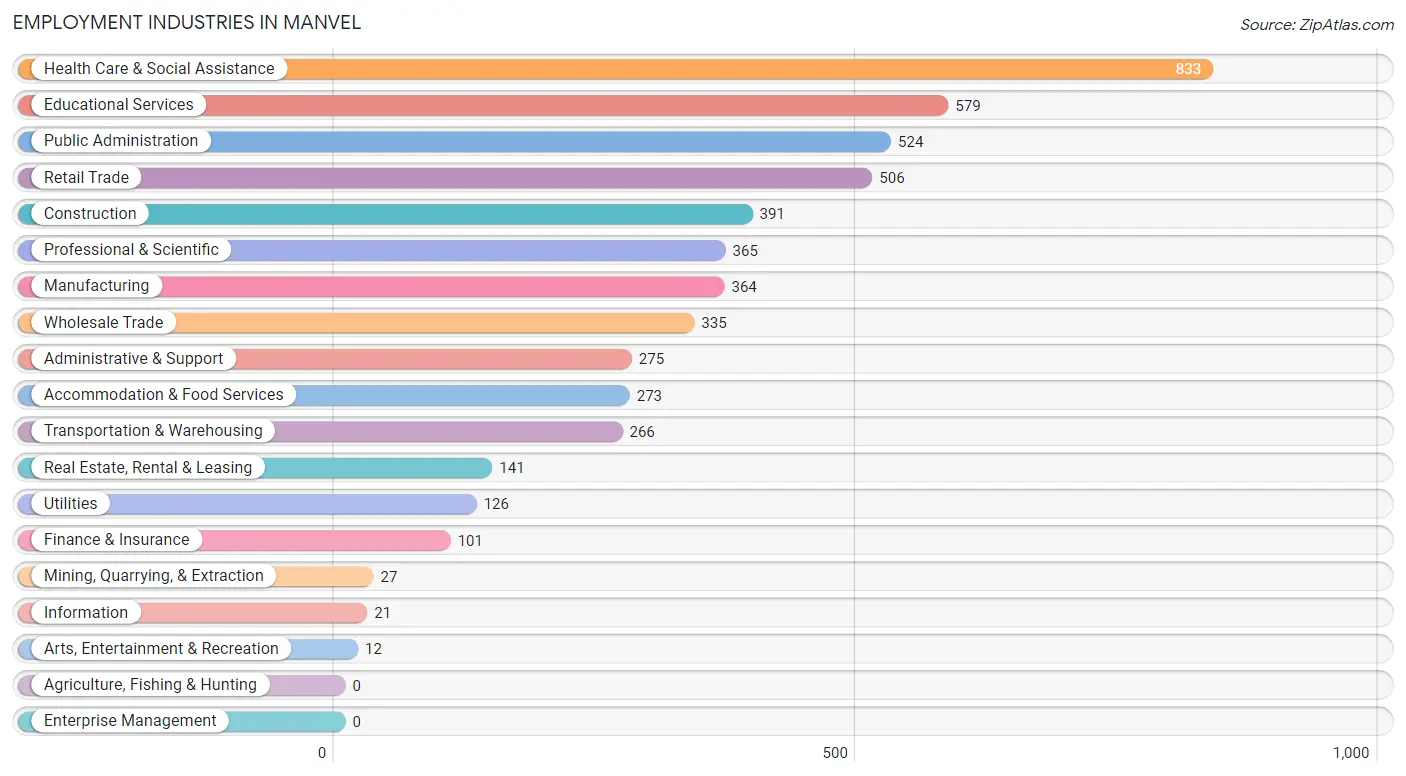
Employment Industries in Manvel
The major employment industries in Manvel include Health Care & Social Assistance (833 | 15.5%), Educational Services (579 | 10.8%), Public Administration (524 | 9.7%), Retail Trade (506 | 9.4%), and Construction (391 | 7.3%).
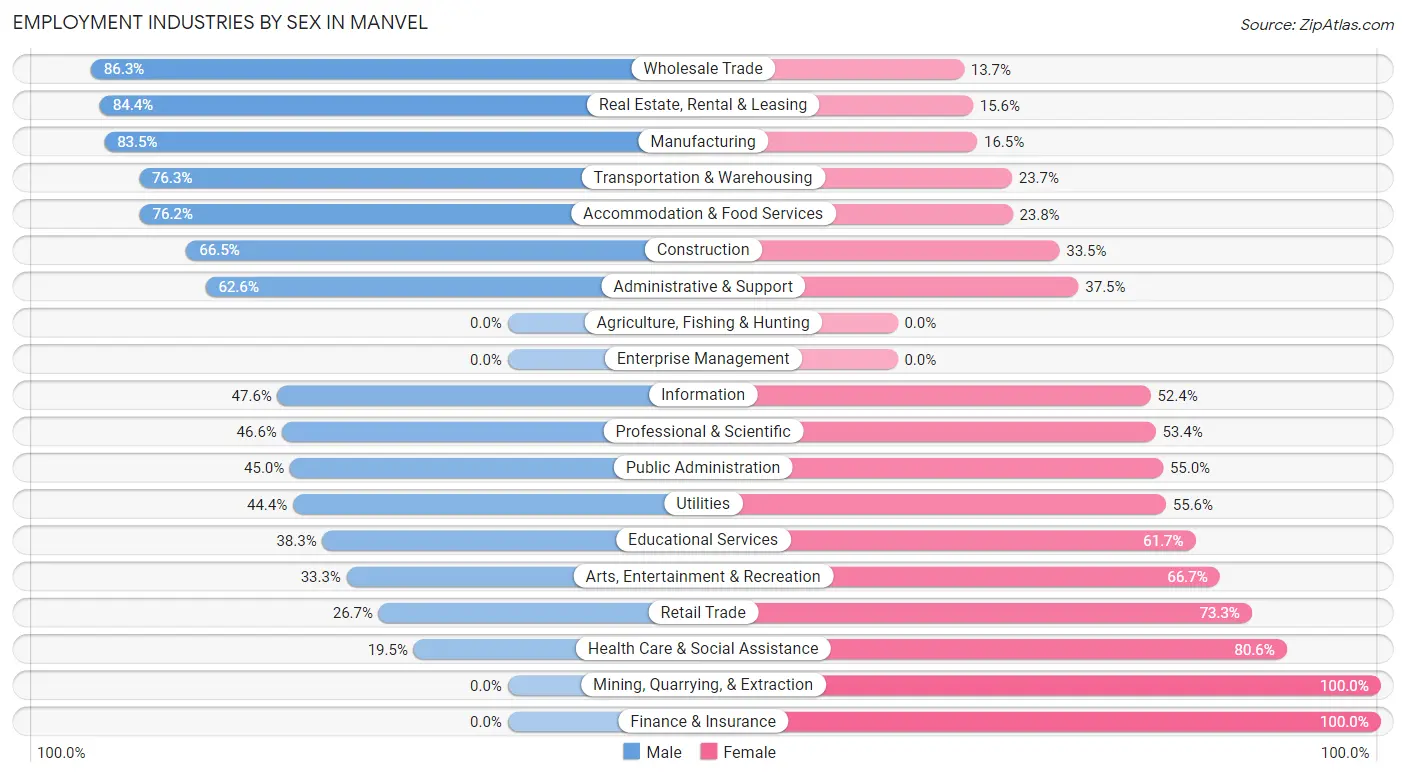
Employment Industries by Sex in Manvel
The Manvel industries that see more men than women are Wholesale Trade (86.3%), Real Estate, Rental & Leasing (84.4%), and Manufacturing (83.5%), whereas the industries that tend to have a higher number of women are Mining, Quarrying, & Extraction (100.0%), Finance & Insurance (100.0%), and Health Care & Social Assistance (80.5%).
| Industry | Male | Female |
| Agriculture, Fishing & Hunting | 0 (0.0%) | 0 (0.0%) |
| Mining, Quarrying, & Extraction | 0 (0.0%) | 27 (100.0%) |
| Construction | 260 (66.5%) | 131 (33.5%) |
| Manufacturing | 304 (83.5%) | 60 (16.5%) |
| Wholesale Trade | 289 (86.3%) | 46 (13.7%) |
| Retail Trade | 135 (26.7%) | 371 (73.3%) |
| Transportation & Warehousing | 203 (76.3%) | 63 (23.7%) |
| Utilities | 56 (44.4%) | 70 (55.6%) |
| Information | 10 (47.6%) | 11 (52.4%) |
| Finance & Insurance | 0 (0.0%) | 101 (100.0%) |
| Real Estate, Rental & Leasing | 119 (84.4%) | 22 (15.6%) |
| Professional & Scientific | 170 (46.6%) | 195 (53.4%) |
| Enterprise Management | 0 (0.0%) | 0 (0.0%) |
| Administrative & Support | 172 (62.5%) | 103 (37.4%) |
| Educational Services | 222 (38.3%) | 357 (61.7%) |
| Health Care & Social Assistance | 162 (19.5%) | 671 (80.5%) |
| Arts, Entertainment & Recreation | 4 (33.3%) | 8 (66.7%) |
| Accommodation & Food Services | 208 (76.2%) | 65 (23.8%) |
| Public Administration | 236 (45.0%) | 288 (55.0%) |
| Total | 2,669 (49.6%) | 2,709 (50.4%) |
Education in Manvel
School Enrollment in Manvel
The most common levels of schooling among the 3,387 students in Manvel are high school (832 | 24.6%), elementary school (801 | 23.6%), and middle school (741 | 21.9%).
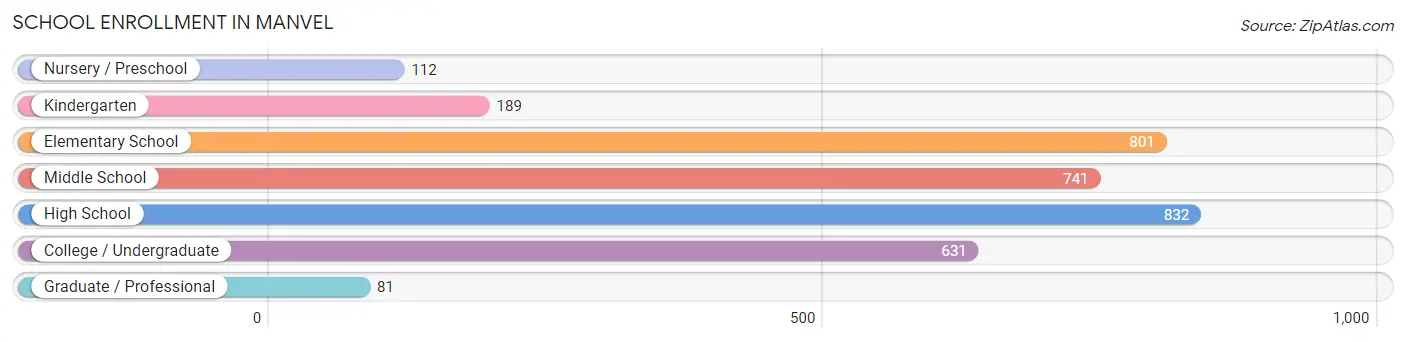
| School Level | # Students | % Students |
| Nursery / Preschool | 112 | 3.3% |
| Kindergarten | 189 | 5.6% |
| Elementary School | 801 | 23.6% |
| Middle School | 741 | 21.9% |
| High School | 832 | 24.6% |
| College / Undergraduate | 631 | 18.6% |
| Graduate / Professional | 81 | 2.4% |
| Total | 3,387 | 100.0% |
School Enrollment by Age by Funding Source in Manvel
Out of a total of 3,387 students who are enrolled in schools in Manvel, 522 (15.4%) attend a private institution, while the remaining 2,865 (84.6%) are enrolled in public schools. The age group of 3 to 4 year olds has the highest likelihood of being enrolled in private schools, with 90 (88.2% in the age bracket) enrolled. Conversely, the age group of 25 to 34 year olds has the lowest likelihood of being enrolled in a private school, with 182 (100.0% in the age bracket) attending a public institution.
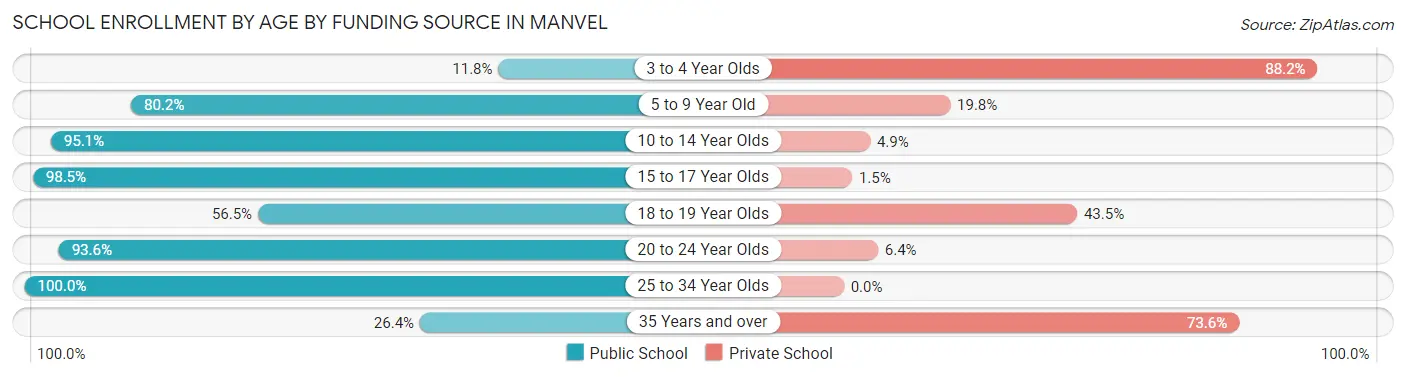
| Age Bracket | Public School | Private School |
| 3 to 4 Year Olds | 12 (11.8%) | 90 (88.2%) |
| 5 to 9 Year Old | 776 (80.2%) | 192 (19.8%) |
| 10 to 14 Year Olds | 680 (95.1%) | 35 (4.9%) |
| 15 to 17 Year Olds | 704 (98.5%) | 11 (1.5%) |
| 18 to 19 Year Olds | 134 (56.5%) | 103 (43.5%) |
| 20 to 24 Year Olds | 353 (93.6%) | 24 (6.4%) |
| 25 to 34 Year Olds | 182 (100.0%) | 0 (0.0%) |
| 35 Years and over | 24 (26.4%) | 67 (73.6%) |
| Total | 2,865 (84.6%) | 522 (15.4%) |
Educational Attainment by Field of Study in Manvel
Business (1,110 | 42.9%), engineering (339 | 13.1%), science & technology (323 | 12.5%), arts & humanities (176 | 6.8%), and bio, nature & agricultural (158 | 6.1%) are the most common fields of study among 2,590 individuals in Manvel who have obtained a bachelor's degree or higher.
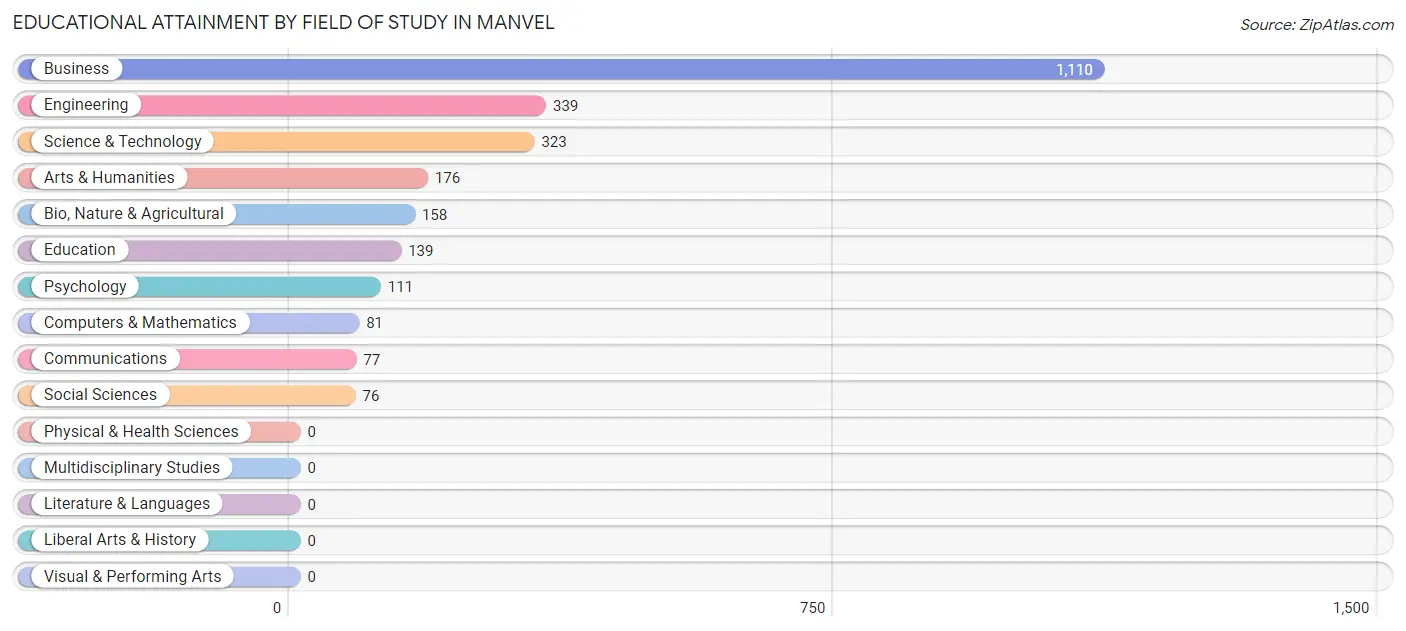
| Field of Study | # Graduates | % Graduates |
| Computers & Mathematics | 81 | 3.1% |
| Bio, Nature & Agricultural | 158 | 6.1% |
| Physical & Health Sciences | 0 | 0.0% |
| Psychology | 111 | 4.3% |
| Social Sciences | 76 | 2.9% |
| Engineering | 339 | 13.1% |
| Multidisciplinary Studies | 0 | 0.0% |
| Science & Technology | 323 | 12.5% |
| Business | 1,110 | 42.9% |
| Education | 139 | 5.4% |
| Literature & Languages | 0 | 0.0% |
| Liberal Arts & History | 0 | 0.0% |
| Visual & Performing Arts | 0 | 0.0% |
| Communications | 77 | 3.0% |
| Arts & Humanities | 176 | 6.8% |
| Total | 2,590 | 100.0% |
Transportation & Commute in Manvel
Vehicle Availability by Sex in Manvel
The most prevalent vehicle ownership categories in Manvel are males with 3 vehicles (1,132, accounting for 43.8%) and females with 3 vehicles (844, making up 42.6%).
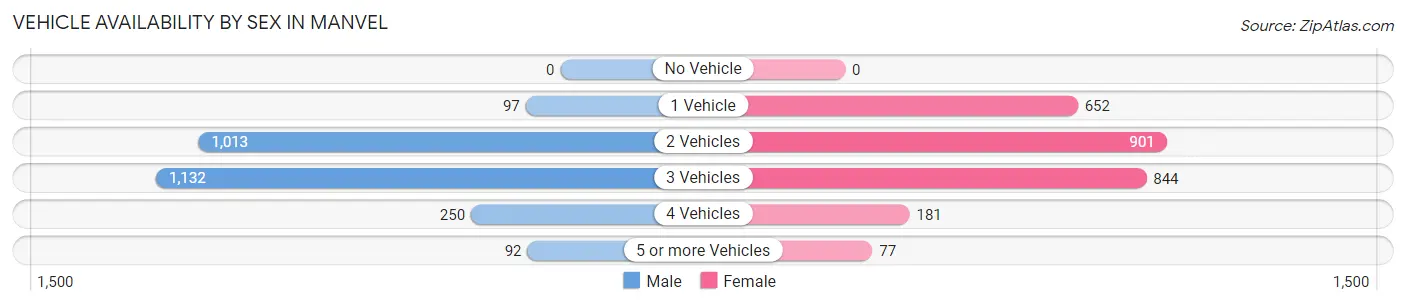
| Vehicles Available | Male | Female |
| No Vehicle | 0 (0.0%) | 0 (0.0%) |
| 1 Vehicle | 97 (3.7%) | 652 (24.6%) |
| 2 Vehicles | 1,013 (39.2%) | 901 (33.9%) |
| 3 Vehicles | 1,132 (43.8%) | 844 (31.8%) |
| 4 Vehicles | 250 (9.7%) | 181 (6.8%) |
| 5 or more Vehicles | 92 (3.6%) | 77 (2.9%) |
| Total | 2,584 (100.0%) | 2,655 (100.0%) |
Commute Time in Manvel
The most frequently occuring commute durations in Manvel are 45 to 59 minutes (1,198 commuters, 26.5%), 30 to 34 minutes (698 commuters, 15.4%), and 40 to 44 minutes (523 commuters, 11.6%).
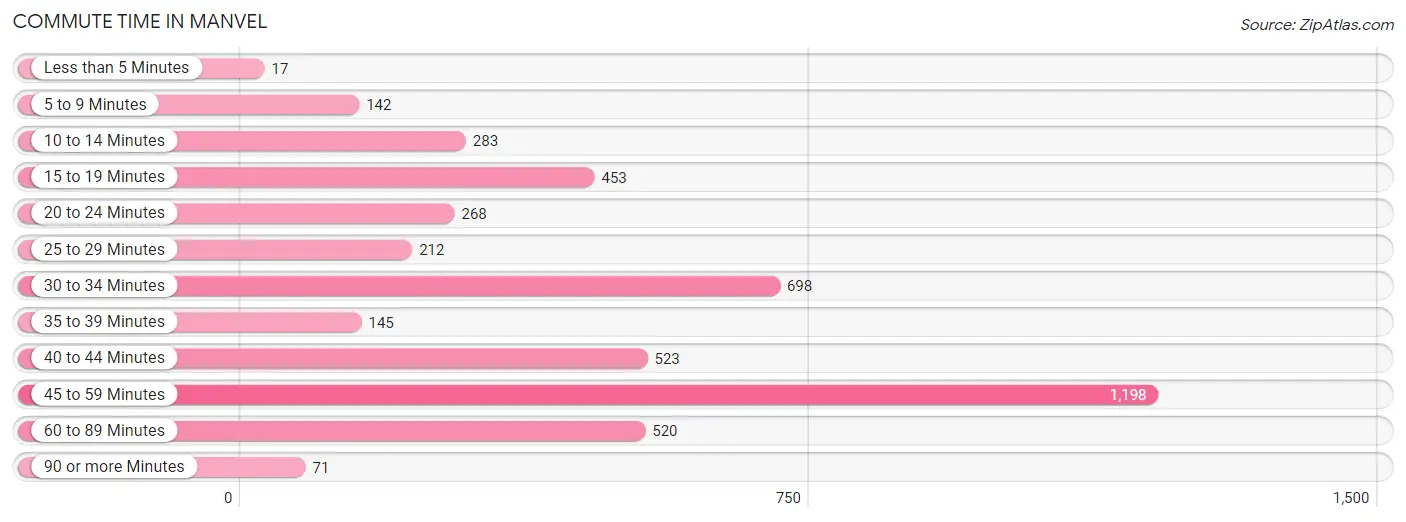
| Commute Time | # Commuters | % Commuters |
| Less than 5 Minutes | 17 | 0.4% |
| 5 to 9 Minutes | 142 | 3.1% |
| 10 to 14 Minutes | 283 | 6.2% |
| 15 to 19 Minutes | 453 | 10.0% |
| 20 to 24 Minutes | 268 | 5.9% |
| 25 to 29 Minutes | 212 | 4.7% |
| 30 to 34 Minutes | 698 | 15.4% |
| 35 to 39 Minutes | 145 | 3.2% |
| 40 to 44 Minutes | 523 | 11.6% |
| 45 to 59 Minutes | 1,198 | 26.5% |
| 60 to 89 Minutes | 520 | 11.5% |
| 90 or more Minutes | 71 | 1.6% |
Commute Time by Sex in Manvel
The most common commute times in Manvel are 45 to 59 minutes (749 commuters, 32.9%) for males and 30 to 34 minutes (493 commuters, 21.8%) for females.
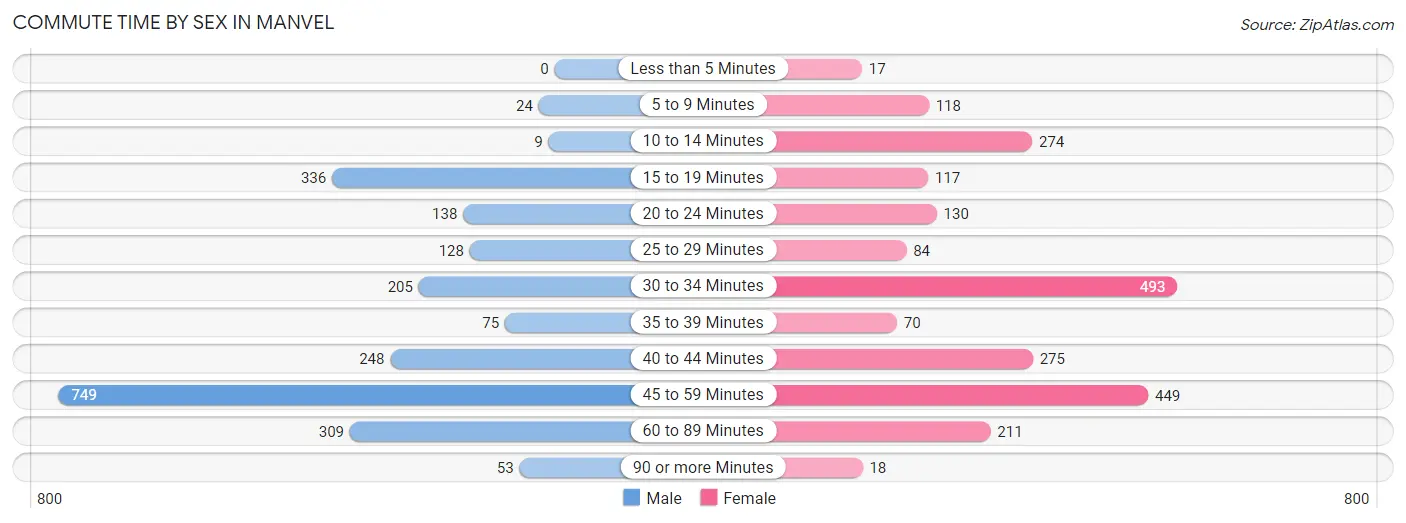
| Commute Time | Male | Female |
| Less than 5 Minutes | 0 (0.0%) | 17 (0.7%) |
| 5 to 9 Minutes | 24 (1.1%) | 118 (5.2%) |
| 10 to 14 Minutes | 9 (0.4%) | 274 (12.1%) |
| 15 to 19 Minutes | 336 (14.8%) | 117 (5.2%) |
| 20 to 24 Minutes | 138 (6.1%) | 130 (5.8%) |
| 25 to 29 Minutes | 128 (5.6%) | 84 (3.7%) |
| 30 to 34 Minutes | 205 (9.0%) | 493 (21.8%) |
| 35 to 39 Minutes | 75 (3.3%) | 70 (3.1%) |
| 40 to 44 Minutes | 248 (10.9%) | 275 (12.2%) |
| 45 to 59 Minutes | 749 (32.9%) | 449 (19.9%) |
| 60 to 89 Minutes | 309 (13.6%) | 211 (9.3%) |
| 90 or more Minutes | 53 (2.3%) | 18 (0.8%) |
Time of Departure to Work by Sex in Manvel
The most frequent times of departure to work in Manvel are 6:00 AM to 6:29 AM (846, 37.2%) for males and 6:30 AM to 6:59 AM (484, 21.4%) for females.
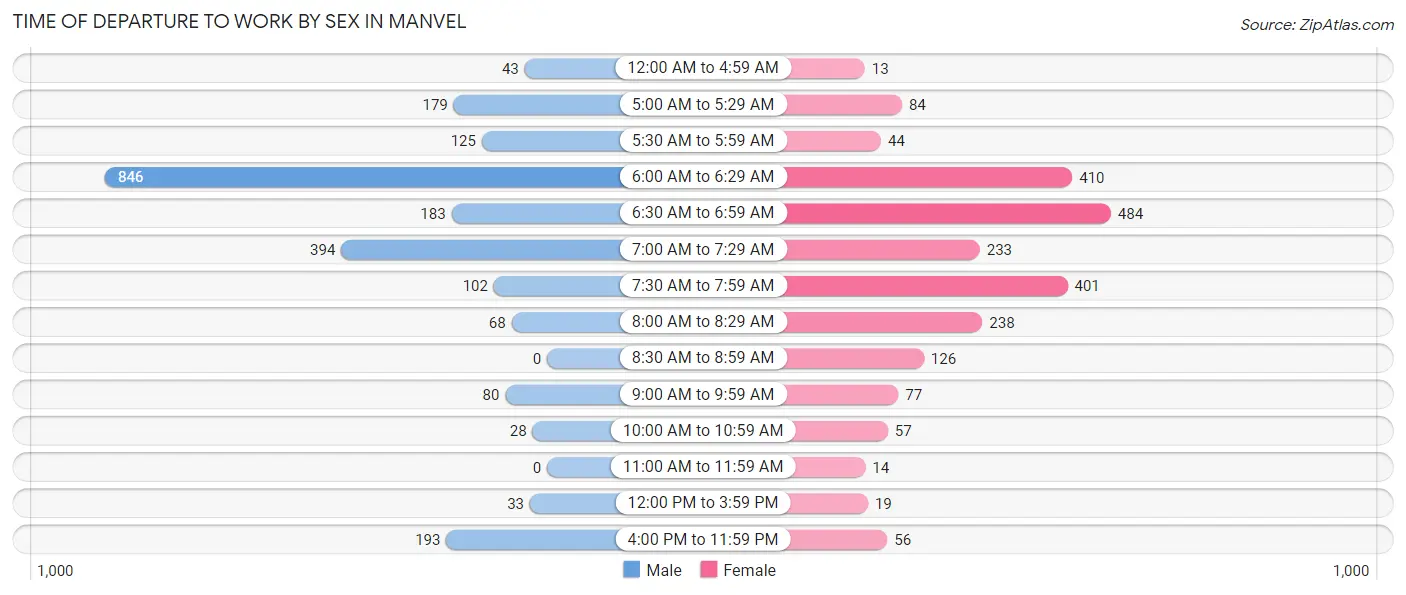
| Time of Departure | Male | Female |
| 12:00 AM to 4:59 AM | 43 (1.9%) | 13 (0.6%) |
| 5:00 AM to 5:29 AM | 179 (7.9%) | 84 (3.7%) |
| 5:30 AM to 5:59 AM | 125 (5.5%) | 44 (1.9%) |
| 6:00 AM to 6:29 AM | 846 (37.2%) | 410 (18.2%) |
| 6:30 AM to 6:59 AM | 183 (8.1%) | 484 (21.4%) |
| 7:00 AM to 7:29 AM | 394 (17.3%) | 233 (10.3%) |
| 7:30 AM to 7:59 AM | 102 (4.5%) | 401 (17.8%) |
| 8:00 AM to 8:29 AM | 68 (3.0%) | 238 (10.5%) |
| 8:30 AM to 8:59 AM | 0 (0.0%) | 126 (5.6%) |
| 9:00 AM to 9:59 AM | 80 (3.5%) | 77 (3.4%) |
| 10:00 AM to 10:59 AM | 28 (1.2%) | 57 (2.5%) |
| 11:00 AM to 11:59 AM | 0 (0.0%) | 14 (0.6%) |
| 12:00 PM to 3:59 PM | 33 (1.5%) | 19 (0.8%) |
| 4:00 PM to 11:59 PM | 193 (8.5%) | 56 (2.5%) |
| Total | 2,274 (100.0%) | 2,256 (100.0%) |
Housing Occupancy in Manvel
Occupancy by Ownership in Manvel
Of the total 3,789 dwellings in Manvel, owner-occupied units account for 3,123 (82.4%), while renter-occupied units make up 666 (17.6%).
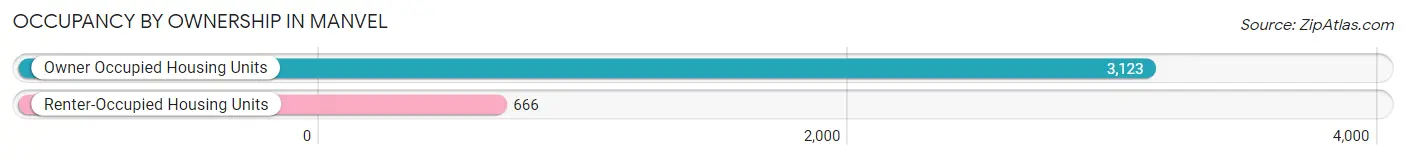
| Occupancy | # Housing Units | % Housing Units |
| Owner Occupied Housing Units | 3,123 | 82.4% |
| Renter-Occupied Housing Units | 666 | 17.6% |
| Total Occupied Housing Units | 3,789 | 100.0% |
Occupancy by Household Size in Manvel
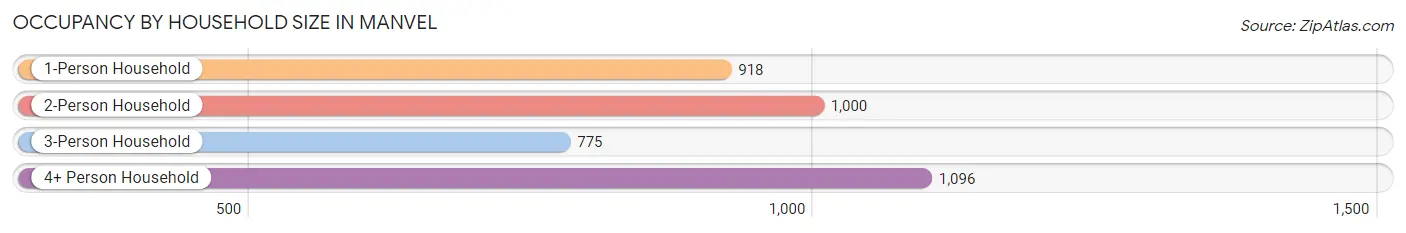
| Household Size | # Housing Units | % Housing Units |
| 1-Person Household | 918 | 24.2% |
| 2-Person Household | 1,000 | 26.4% |
| 3-Person Household | 775 | 20.4% |
| 4+ Person Household | 1,096 | 28.9% |
| Total Housing Units | 3,789 | 100.0% |
Occupancy by Ownership by Household Size in Manvel
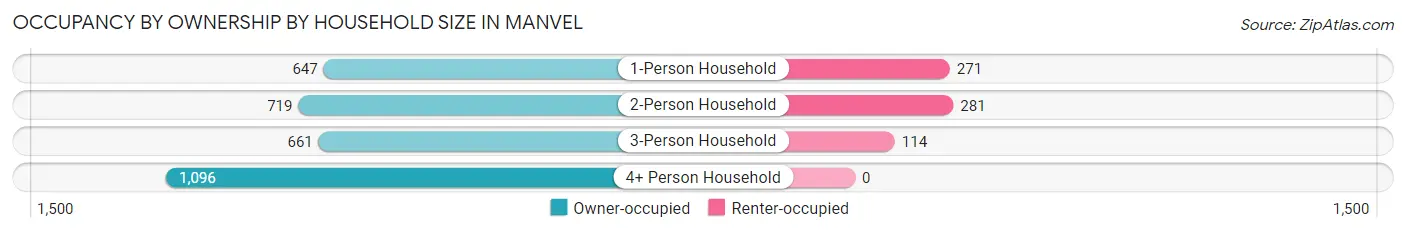
| Household Size | Owner-occupied | Renter-occupied |
| 1-Person Household | 647 (70.5%) | 271 (29.5%) |
| 2-Person Household | 719 (71.9%) | 281 (28.1%) |
| 3-Person Household | 661 (85.3%) | 114 (14.7%) |
| 4+ Person Household | 1,096 (100.0%) | 0 (0.0%) |
| Total Housing Units | 3,123 (82.4%) | 666 (17.6%) |
Occupancy by Educational Attainment in Manvel
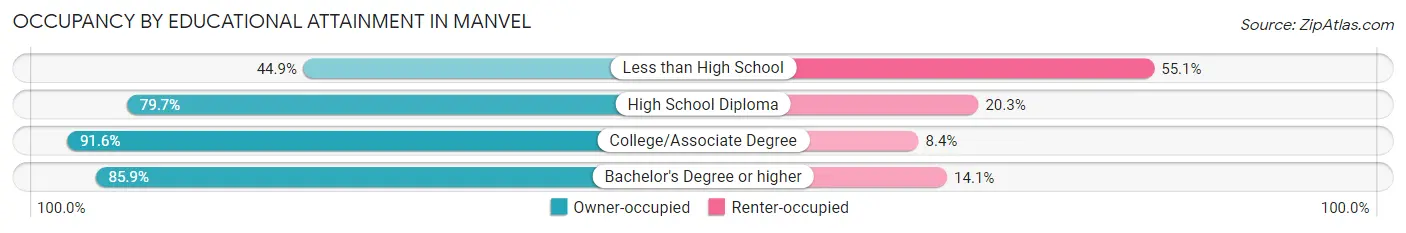
| Household Size | Owner-occupied | Renter-occupied |
| Less than High School | 179 (44.9%) | 220 (55.1%) |
| High School Diploma | 448 (79.7%) | 114 (20.3%) |
| College/Associate Degree | 1,067 (91.6%) | 98 (8.4%) |
| Bachelor's Degree or higher | 1,429 (85.9%) | 234 (14.1%) |
Occupancy by Age of Householder in Manvel
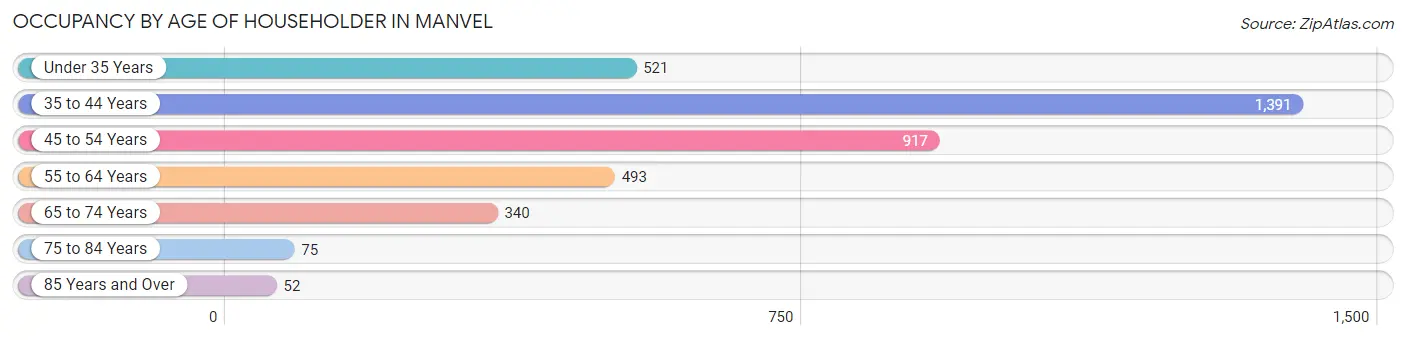
| Age Bracket | # Households | % Households |
| Under 35 Years | 521 | 13.8% |
| 35 to 44 Years | 1,391 | 36.7% |
| 45 to 54 Years | 917 | 24.2% |
| 55 to 64 Years | 493 | 13.0% |
| 65 to 74 Years | 340 | 9.0% |
| 75 to 84 Years | 75 | 2.0% |
| 85 Years and Over | 52 | 1.4% |
| Total | 3,789 | 100.0% |
Housing Finances in Manvel
Median Income by Occupancy in Manvel
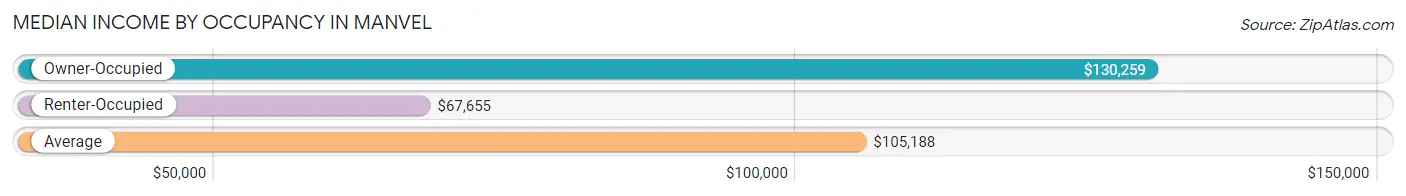
| Occupancy Type | # Households | Median Income |
| Owner-Occupied | 3,123 (82.4%) | $130,259 |
| Renter-Occupied | 666 (17.6%) | $67,655 |
| Average | 3,789 (100.0%) | $105,188 |
Occupancy by Householder Income Bracket in Manvel
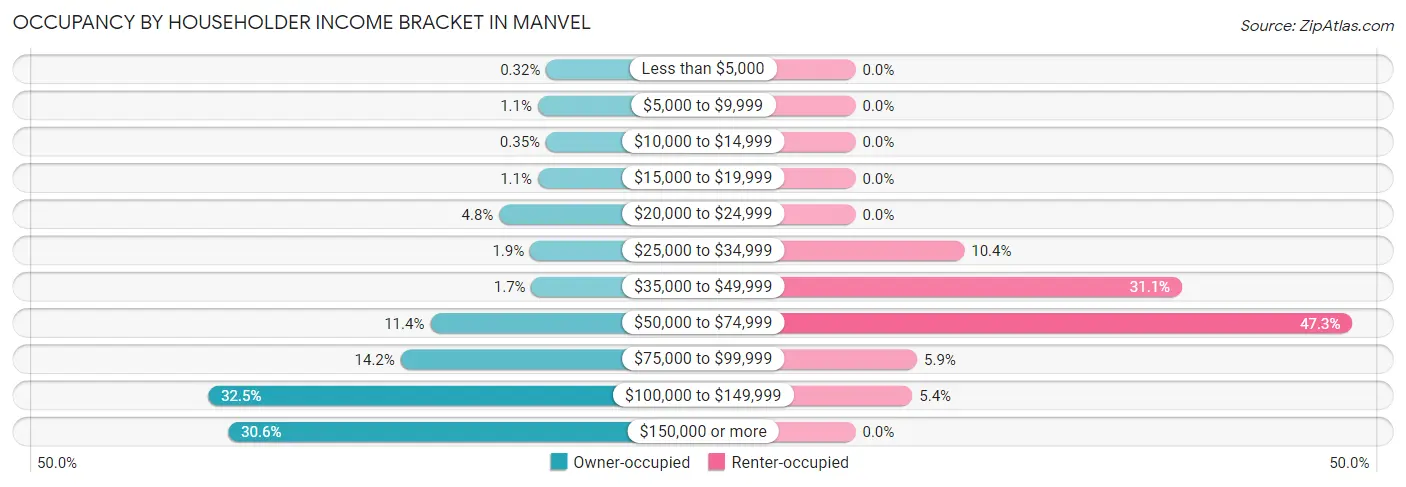
| Income Bracket | Owner-occupied | Renter-occupied |
| Less than $5,000 | 10 (0.3%) | 0 (0.0%) |
| $5,000 to $9,999 | 35 (1.1%) | 0 (0.0%) |
| $10,000 to $14,999 | 11 (0.4%) | 0 (0.0%) |
| $15,000 to $19,999 | 35 (1.1%) | 0 (0.0%) |
| $20,000 to $24,999 | 150 (4.8%) | 0 (0.0%) |
| $25,000 to $34,999 | 58 (1.9%) | 69 (10.4%) |
| $35,000 to $49,999 | 54 (1.7%) | 207 (31.1%) |
| $50,000 to $74,999 | 355 (11.4%) | 315 (47.3%) |
| $75,000 to $99,999 | 443 (14.2%) | 39 (5.9%) |
| $100,000 to $149,999 | 1,016 (32.5%) | 36 (5.4%) |
| $150,000 or more | 956 (30.6%) | 0 (0.0%) |
| Total | 3,123 (100.0%) | 666 (100.0%) |
Monthly Housing Cost Tiers in Manvel
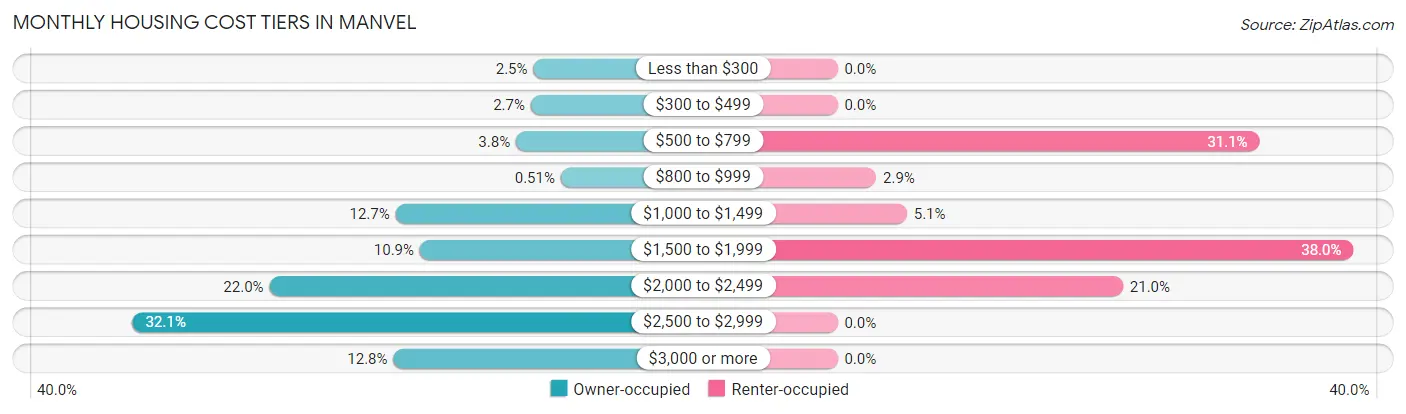
| Monthly Cost | Owner-occupied | Renter-occupied |
| Less than $300 | 79 (2.5%) | 0 (0.0%) |
| $300 to $499 | 85 (2.7%) | 0 (0.0%) |
| $500 to $799 | 119 (3.8%) | 207 (31.1%) |
| $800 to $999 | 16 (0.5%) | 19 (2.9%) |
| $1,000 to $1,499 | 396 (12.7%) | 34 (5.1%) |
| $1,500 to $1,999 | 340 (10.9%) | 253 (38.0%) |
| $2,000 to $2,499 | 686 (22.0%) | 140 (21.0%) |
| $2,500 to $2,999 | 1,001 (32.1%) | 0 (0.0%) |
| $3,000 or more | 401 (12.8%) | 0 (0.0%) |
| Total | 3,123 (100.0%) | 666 (100.0%) |
Physical Housing Characteristics in Manvel
Housing Structures in Manvel
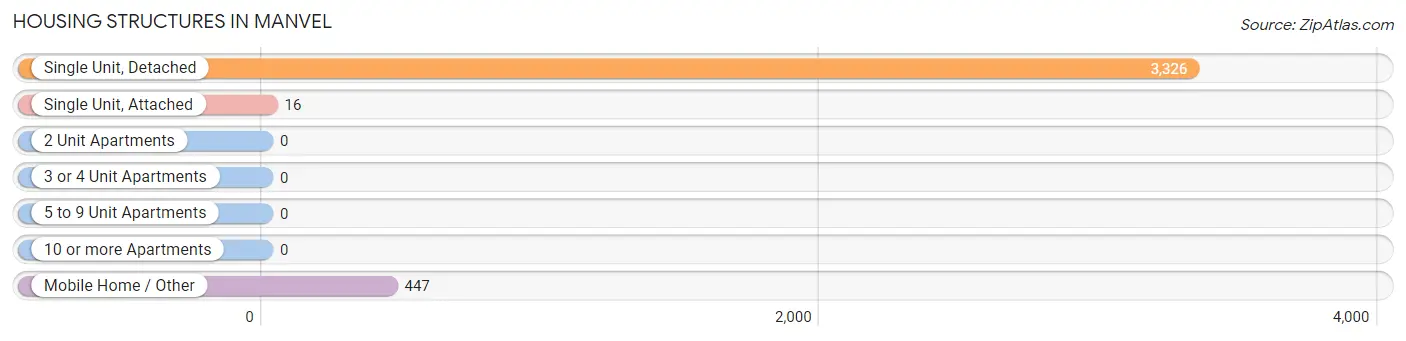
| Structure Type | # Housing Units | % Housing Units |
| Single Unit, Detached | 3,326 | 87.8% |
| Single Unit, Attached | 16 | 0.4% |
| 2 Unit Apartments | 0 | 0.0% |
| 3 or 4 Unit Apartments | 0 | 0.0% |
| 5 to 9 Unit Apartments | 0 | 0.0% |
| 10 or more Apartments | 0 | 0.0% |
| Mobile Home / Other | 447 | 11.8% |
| Total | 3,789 | 100.0% |
Housing Structures by Occupancy in Manvel
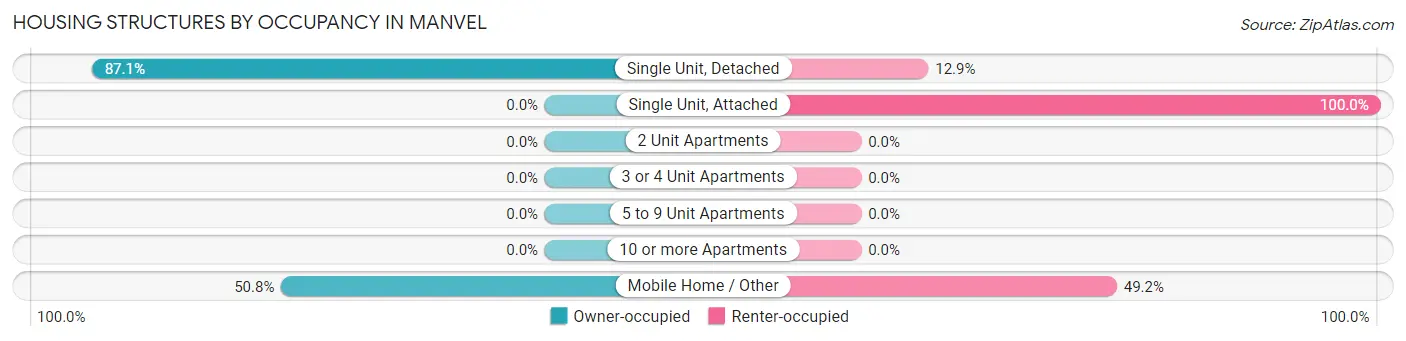
| Structure Type | Owner-occupied | Renter-occupied |
| Single Unit, Detached | 2,896 (87.1%) | 430 (12.9%) |
| Single Unit, Attached | 0 (0.0%) | 16 (100.0%) |
| 2 Unit Apartments | 0 (0.0%) | 0 (0.0%) |
| 3 or 4 Unit Apartments | 0 (0.0%) | 0 (0.0%) |
| 5 to 9 Unit Apartments | 0 (0.0%) | 0 (0.0%) |
| 10 or more Apartments | 0 (0.0%) | 0 (0.0%) |
| Mobile Home / Other | 227 (50.8%) | 220 (49.2%) |
| Total | 3,123 (82.4%) | 666 (17.6%) |
Housing Structures by Number of Rooms in Manvel
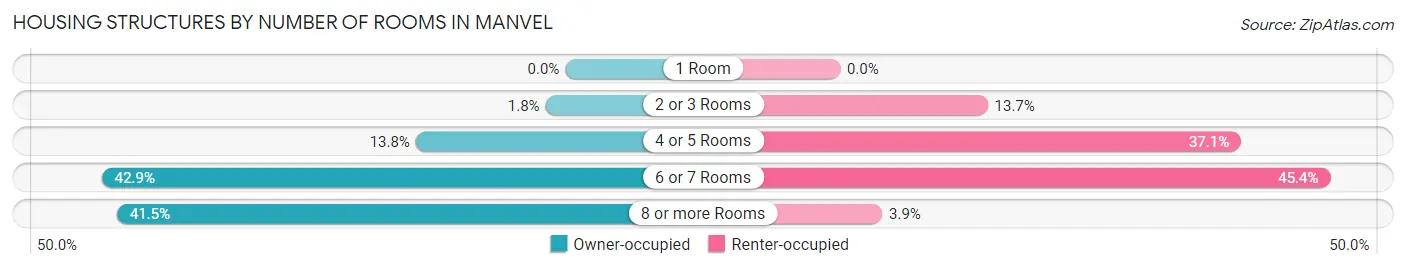
| Number of Rooms | Owner-occupied | Renter-occupied |
| 1 Room | 0 (0.0%) | 0 (0.0%) |
| 2 or 3 Rooms | 57 (1.8%) | 91 (13.7%) |
| 4 or 5 Rooms | 432 (13.8%) | 247 (37.1%) |
| 6 or 7 Rooms | 1,339 (42.9%) | 302 (45.4%) |
| 8 or more Rooms | 1,295 (41.5%) | 26 (3.9%) |
| Total | 3,123 (100.0%) | 666 (100.0%) |
Housing Structure by Heating Type in Manvel
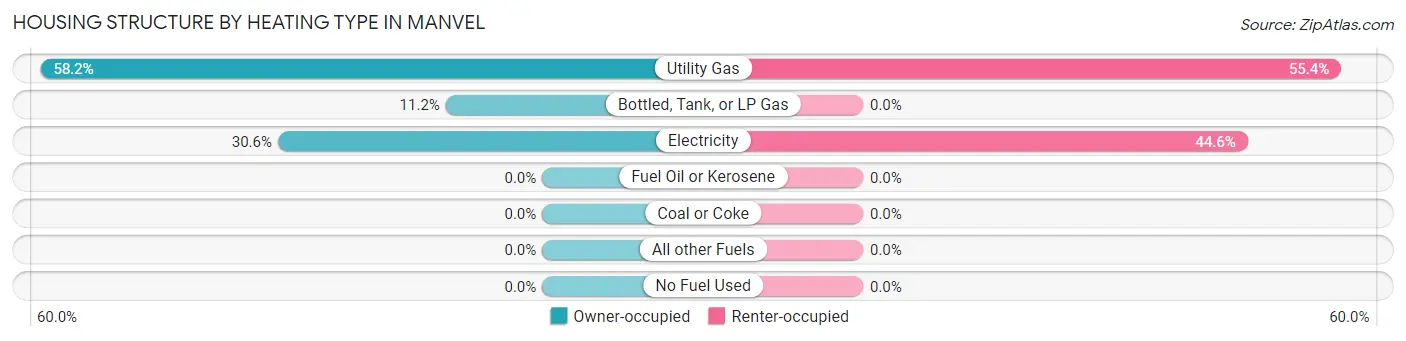
| Heating Type | Owner-occupied | Renter-occupied |
| Utility Gas | 1,817 (58.2%) | 369 (55.4%) |
| Bottled, Tank, or LP Gas | 349 (11.2%) | 0 (0.0%) |
| Electricity | 957 (30.6%) | 297 (44.6%) |
| Fuel Oil or Kerosene | 0 (0.0%) | 0 (0.0%) |
| Coal or Coke | 0 (0.0%) | 0 (0.0%) |
| All other Fuels | 0 (0.0%) | 0 (0.0%) |
| No Fuel Used | 0 (0.0%) | 0 (0.0%) |
| Total | 3,123 (100.0%) | 666 (100.0%) |
Household Vehicle Usage in Manvel
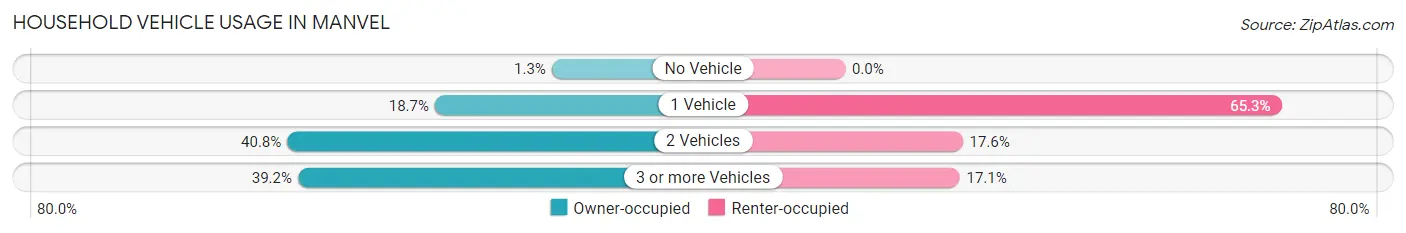
| Vehicles per Household | Owner-occupied | Renter-occupied |
| No Vehicle | 40 (1.3%) | 0 (0.0%) |
| 1 Vehicle | 585 (18.7%) | 435 (65.3%) |
| 2 Vehicles | 1,274 (40.8%) | 117 (17.6%) |
| 3 or more Vehicles | 1,224 (39.2%) | 114 (17.1%) |
| Total | 3,123 (100.0%) | 666 (100.0%) |
Real Estate & Mortgages in Manvel
Real Estate and Mortgage Overview in Manvel
| Characteristic | Without Mortgage | With Mortgage |
| Housing Units | 444 | 2,679 |
| Median Property Value | $256,900 | $303,500 |
| Median Household Income | - | - |
| Monthly Housing Costs | $681 | $401 |
| Real Estate Taxes | - | - |
Property Value by Mortgage Status in Manvel
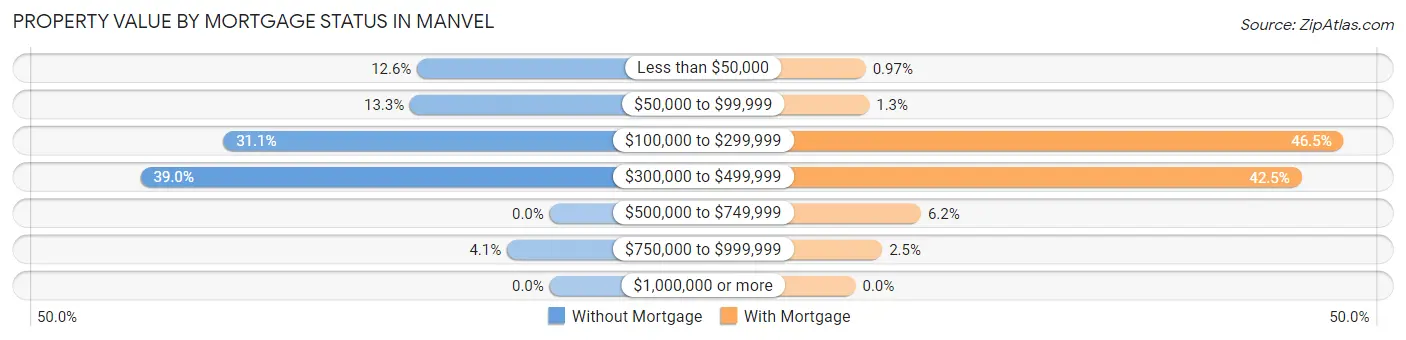
| Property Value | Without Mortgage | With Mortgage |
| Less than $50,000 | 56 (12.6%) | 26 (1.0%) |
| $50,000 to $99,999 | 59 (13.3%) | 35 (1.3%) |
| $100,000 to $299,999 | 138 (31.1%) | 1,245 (46.5%) |
| $300,000 to $499,999 | 173 (39.0%) | 1,138 (42.5%) |
| $500,000 to $749,999 | 0 (0.0%) | 167 (6.2%) |
| $750,000 to $999,999 | 18 (4.1%) | 68 (2.5%) |
| $1,000,000 or more | 0 (0.0%) | 0 (0.0%) |
| Total | 444 (100.0%) | 2,679 (100.0%) |
Household Income by Mortgage Status in Manvel
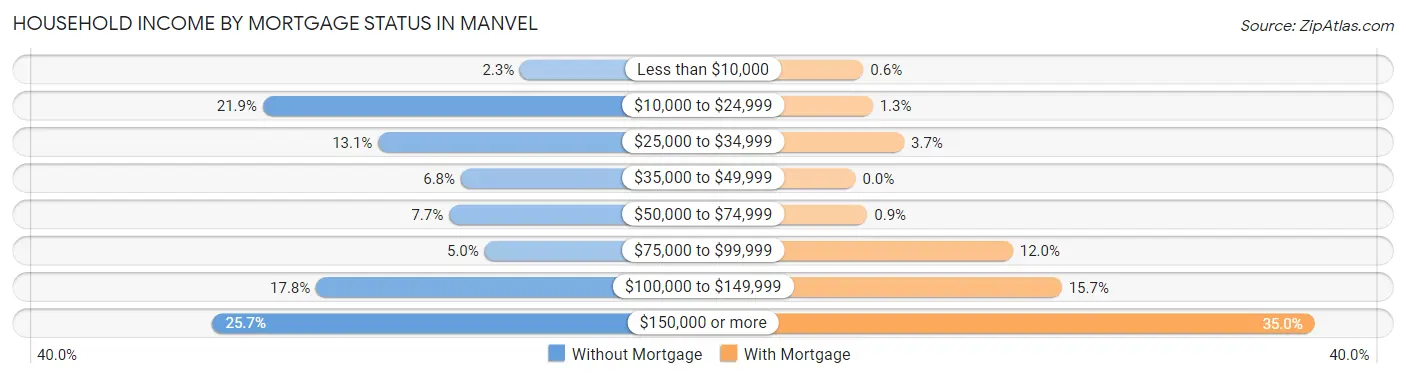
| Household Income | Without Mortgage | With Mortgage |
| Less than $10,000 | 10 (2.2%) | 16 (0.6%) |
| $10,000 to $24,999 | 97 (21.8%) | 35 (1.3%) |
| $25,000 to $34,999 | 58 (13.1%) | 99 (3.7%) |
| $35,000 to $49,999 | 30 (6.8%) | 0 (0.0%) |
| $50,000 to $74,999 | 34 (7.7%) | 24 (0.9%) |
| $75,000 to $99,999 | 22 (5.0%) | 321 (12.0%) |
| $100,000 to $149,999 | 79 (17.8%) | 421 (15.7%) |
| $150,000 or more | 114 (25.7%) | 937 (35.0%) |
| Total | 444 (100.0%) | 2,679 (100.0%) |
Property Value to Household Income Ratio in Manvel
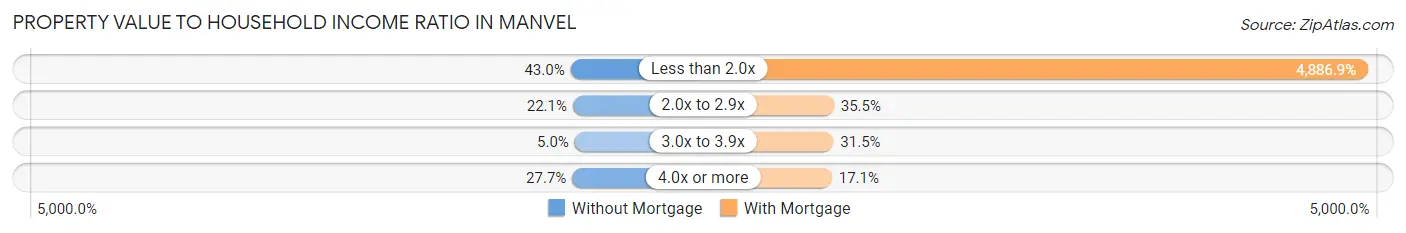
| Value-to-Income Ratio | Without Mortgage | With Mortgage |
| Less than 2.0x | 191 (43.0%) | 130,920 (4,886.9%) |
| 2.0x to 2.9x | 98 (22.1%) | 950 (35.5%) |
| 3.0x to 3.9x | 22 (5.0%) | 845 (31.5%) |
| 4.0x or more | 123 (27.7%) | 457 (17.1%) |
| Total | 444 (100.0%) | 2,679 (100.0%) |
Real Estate Taxes by Mortgage Status in Manvel
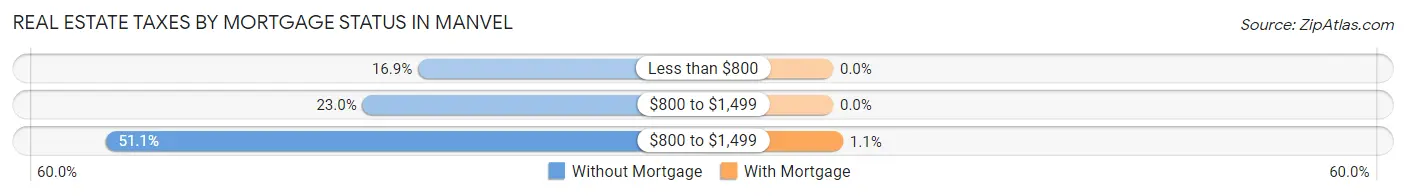
| Property Taxes | Without Mortgage | With Mortgage |
| Less than $800 | 75 (16.9%) | 0 (0.0%) |
| $800 to $1,499 | 102 (23.0%) | 0 (0.0%) |
| $800 to $1,499 | 227 (51.1%) | 29 (1.1%) |
| Total | 444 (100.0%) | 2,679 (100.0%) |
Health & Disability in Manvel
Health Insurance Coverage by Age in Manvel
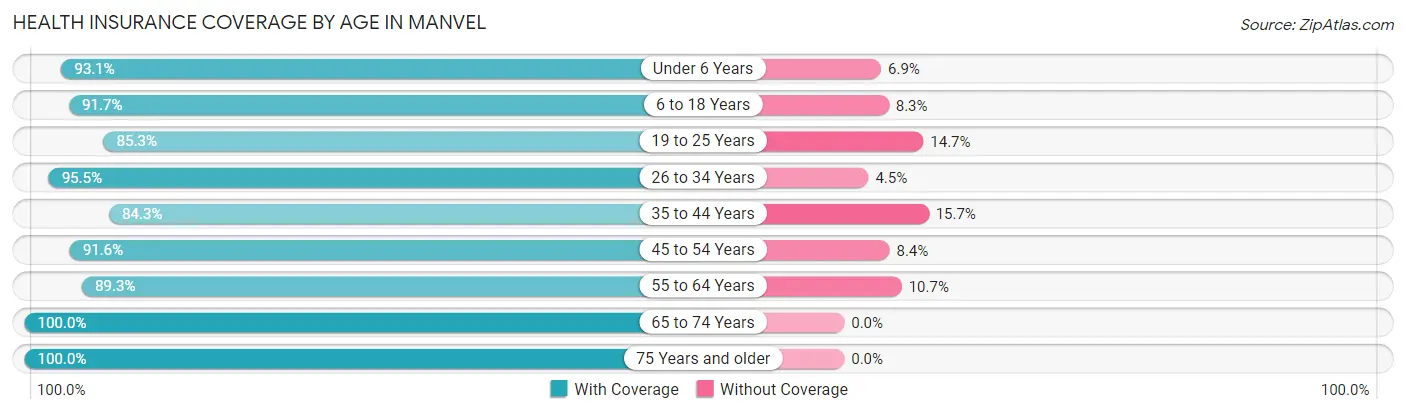
| Age Bracket | With Coverage | Without Coverage |
| Under 6 Years | 692 (93.1%) | 51 (6.9%) |
| 6 to 18 Years | 2,222 (91.7%) | 201 (8.3%) |
| 19 to 25 Years | 908 (85.3%) | 157 (14.7%) |
| 26 to 34 Years | 1,058 (95.5%) | 50 (4.5%) |
| 35 to 44 Years | 2,039 (84.3%) | 381 (15.7%) |
| 45 to 54 Years | 1,237 (91.6%) | 114 (8.4%) |
| 55 to 64 Years | 750 (89.3%) | 90 (10.7%) |
| 65 to 74 Years | 870 (100.0%) | 0 (0.0%) |
| 75 Years and older | 382 (100.0%) | 0 (0.0%) |
| Total | 10,158 (90.7%) | 1,044 (9.3%) |
Health Insurance Coverage by Citizenship Status in Manvel
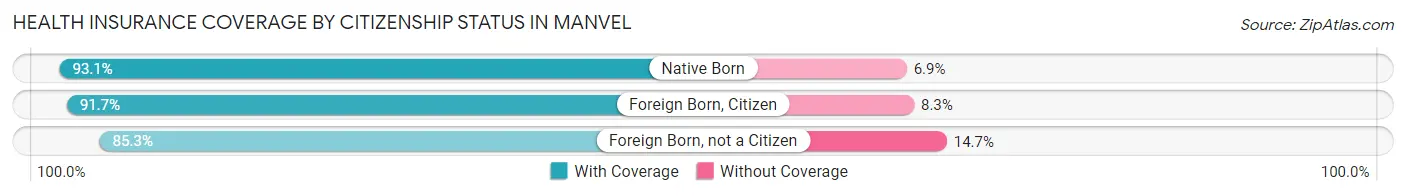
| Citizenship Status | With Coverage | Without Coverage |
| Native Born | 692 (93.1%) | 51 (6.9%) |
| Foreign Born, Citizen | 2,222 (91.7%) | 201 (8.3%) |
| Foreign Born, not a Citizen | 908 (85.3%) | 157 (14.7%) |
Health Insurance Coverage by Household Income in Manvel
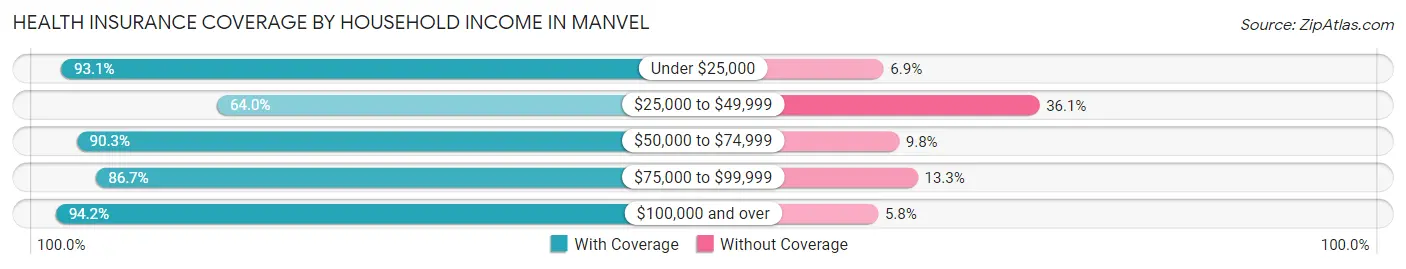
| Household Income | With Coverage | Without Coverage |
| Under $25,000 | 625 (93.1%) | 46 (6.9%) |
| $25,000 to $49,999 | 424 (63.9%) | 239 (36.0%) |
| $50,000 to $74,999 | 1,185 (90.2%) | 128 (9.8%) |
| $75,000 to $99,999 | 1,537 (86.7%) | 235 (13.3%) |
| $100,000 and over | 6,387 (94.2%) | 396 (5.8%) |
Public vs Private Health Insurance Coverage by Age in Manvel
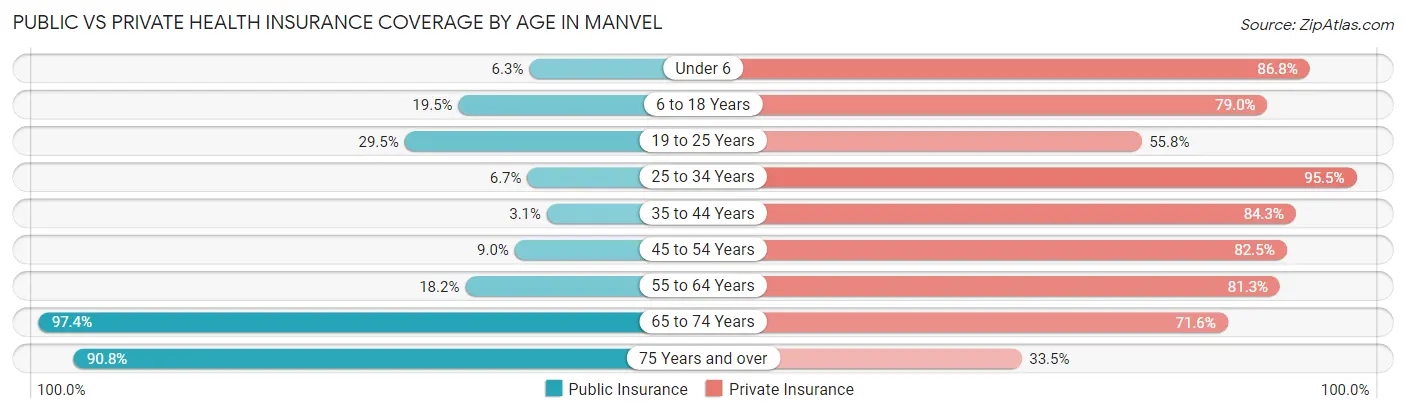
| Age Bracket | Public Insurance | Private Insurance |
| Under 6 | 47 (6.3%) | 645 (86.8%) |
| 6 to 18 Years | 472 (19.5%) | 1,914 (79.0%) |
| 19 to 25 Years | 314 (29.5%) | 594 (55.8%) |
| 25 to 34 Years | 74 (6.7%) | 1,058 (95.5%) |
| 35 to 44 Years | 74 (3.1%) | 2,039 (84.3%) |
| 45 to 54 Years | 122 (9.0%) | 1,115 (82.5%) |
| 55 to 64 Years | 153 (18.2%) | 683 (81.3%) |
| 65 to 74 Years | 847 (97.4%) | 623 (71.6%) |
| 75 Years and over | 347 (90.8%) | 128 (33.5%) |
| Total | 2,450 (21.9%) | 8,799 (78.5%) |
Disability Status by Sex by Age in Manvel
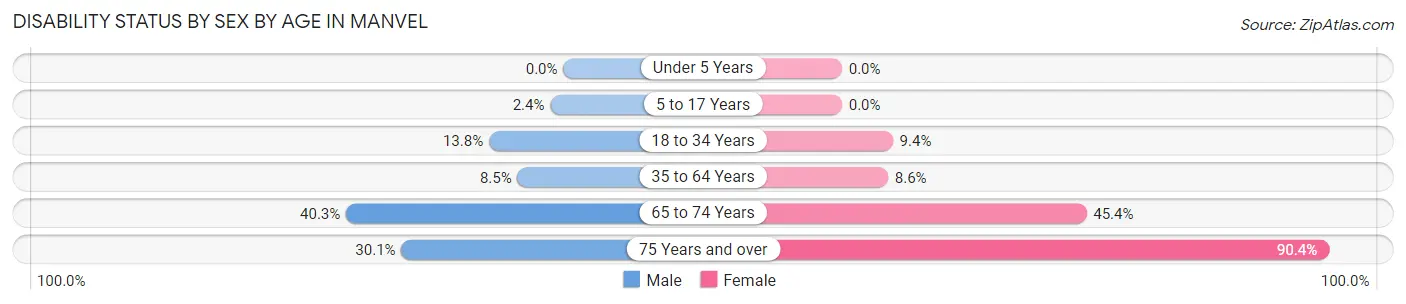
| Age Bracket | Male | Female |
| Under 5 Years | 0 (0.0%) | 0 (0.0%) |
| 5 to 17 Years | 29 (2.4%) | 0 (0.0%) |
| 18 to 34 Years | 169 (13.8%) | 109 (9.4%) |
| 35 to 64 Years | 192 (8.5%) | 201 (8.6%) |
| 65 to 74 Years | 150 (40.3%) | 226 (45.4%) |
| 75 Years and over | 52 (30.1%) | 189 (90.4%) |
Disability Class by Sex by Age in Manvel
Disability Class: Hearing Difficulty
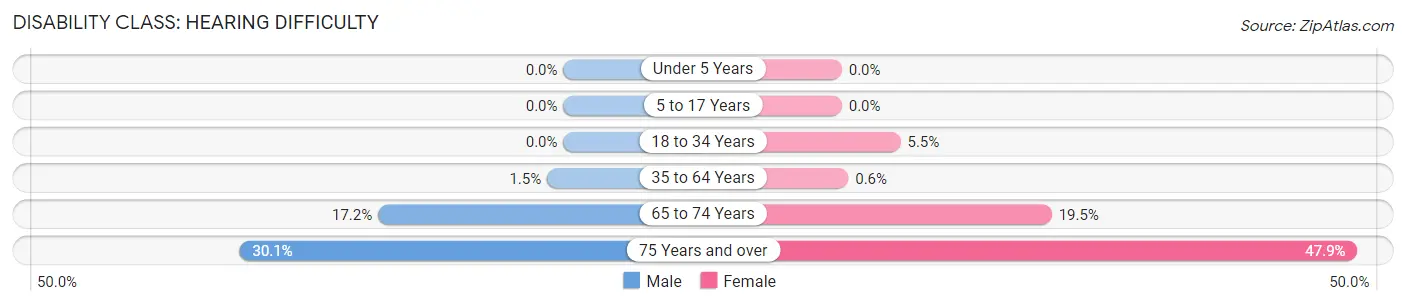
| Age Bracket | Male | Female |
| Under 5 Years | 0 (0.0%) | 0 (0.0%) |
| 5 to 17 Years | 0 (0.0%) | 0 (0.0%) |
| 18 to 34 Years | 0 (0.0%) | 63 (5.4%) |
| 35 to 64 Years | 34 (1.5%) | 14 (0.6%) |
| 65 to 74 Years | 64 (17.2%) | 97 (19.5%) |
| 75 Years and over | 52 (30.1%) | 100 (47.8%) |
Disability Class: Vision Difficulty
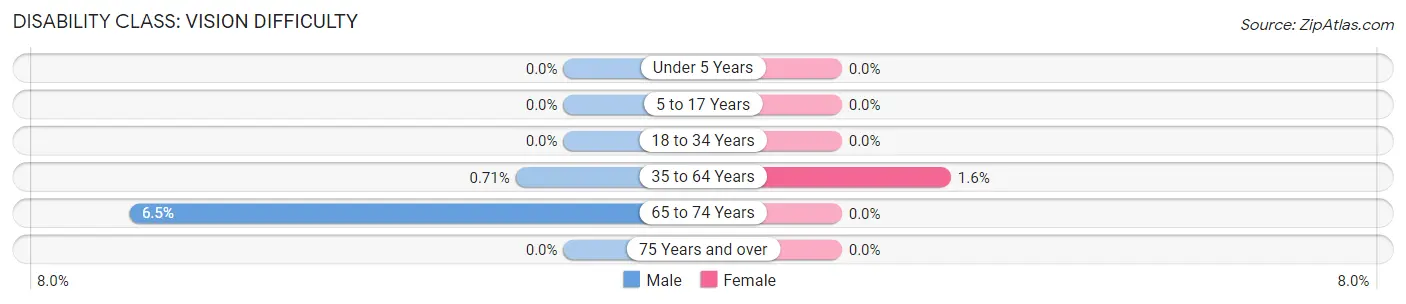
| Age Bracket | Male | Female |
| Under 5 Years | 0 (0.0%) | 0 (0.0%) |
| 5 to 17 Years | 0 (0.0%) | 0 (0.0%) |
| 18 to 34 Years | 0 (0.0%) | 0 (0.0%) |
| 35 to 64 Years | 16 (0.7%) | 38 (1.6%) |
| 65 to 74 Years | 24 (6.5%) | 0 (0.0%) |
| 75 Years and over | 0 (0.0%) | 0 (0.0%) |
Disability Class: Cognitive Difficulty
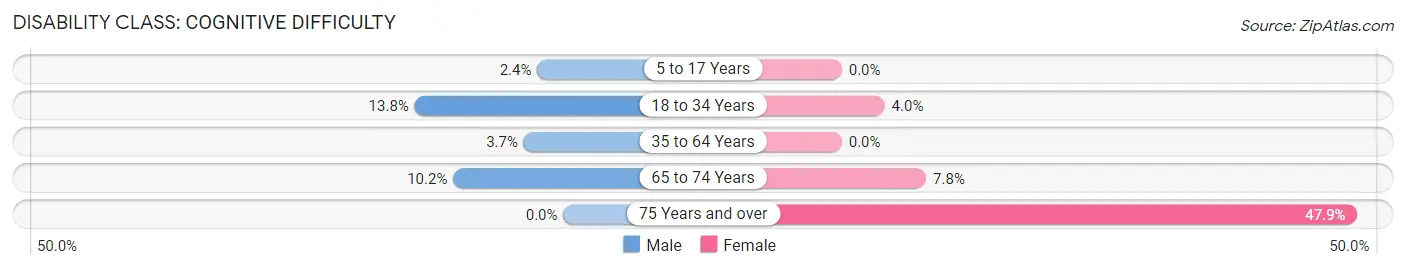
| Age Bracket | Male | Female |
| 5 to 17 Years | 29 (2.4%) | 0 (0.0%) |
| 18 to 34 Years | 169 (13.8%) | 46 (4.0%) |
| 35 to 64 Years | 83 (3.7%) | 0 (0.0%) |
| 65 to 74 Years | 38 (10.2%) | 39 (7.8%) |
| 75 Years and over | 0 (0.0%) | 100 (47.8%) |
Disability Class: Ambulatory Difficulty
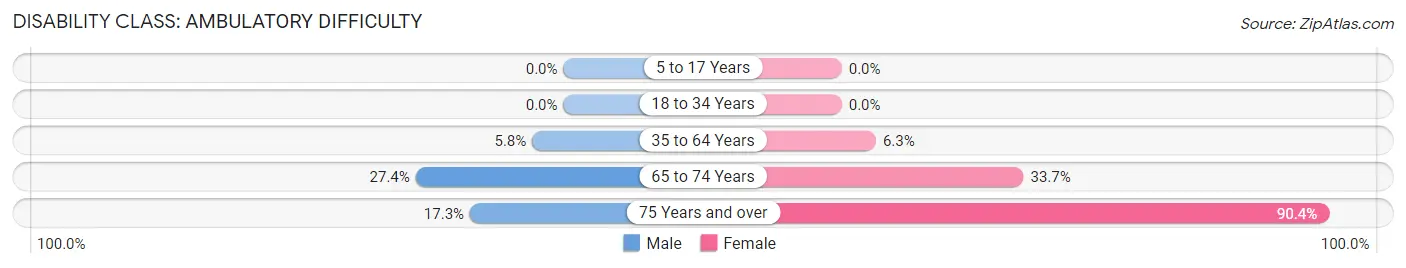
| Age Bracket | Male | Female |
| 5 to 17 Years | 0 (0.0%) | 0 (0.0%) |
| 18 to 34 Years | 0 (0.0%) | 0 (0.0%) |
| 35 to 64 Years | 131 (5.8%) | 149 (6.3%) |
| 65 to 74 Years | 102 (27.4%) | 168 (33.7%) |
| 75 Years and over | 30 (17.3%) | 189 (90.4%) |
Disability Class: Self-Care Difficulty
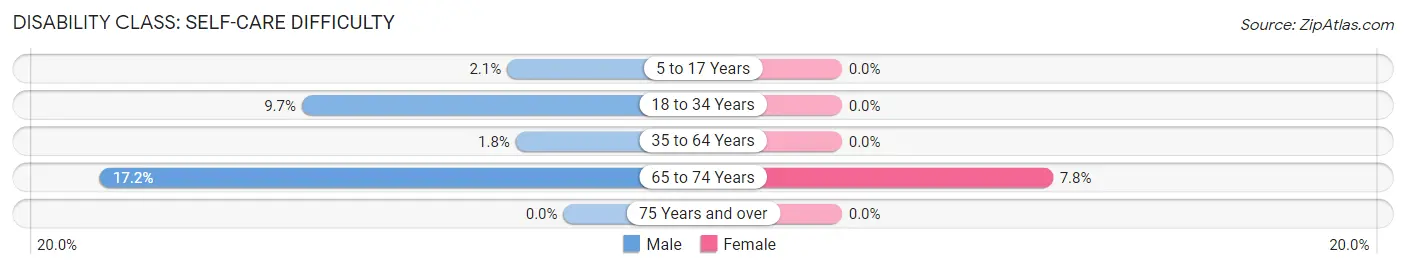
| Age Bracket | Male | Female |
| 5 to 17 Years | 25 (2.1%) | 0 (0.0%) |
| 18 to 34 Years | 119 (9.7%) | 0 (0.0%) |
| 35 to 64 Years | 40 (1.8%) | 0 (0.0%) |
| 65 to 74 Years | 64 (17.2%) | 39 (7.8%) |
| 75 Years and over | 0 (0.0%) | 0 (0.0%) |
Technology Access in Manvel
Computing Device Access in Manvel
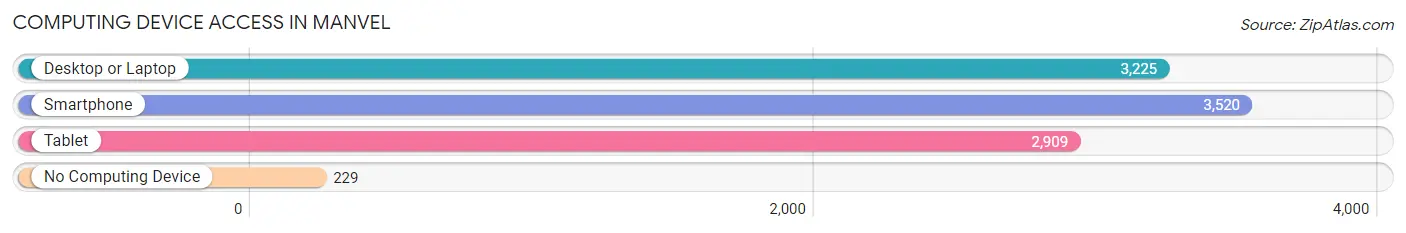
| Device Type | # Households | % Households |
| Desktop or Laptop | 3,225 | 85.1% |
| Smartphone | 3,520 | 92.9% |
| Tablet | 2,909 | 76.8% |
| No Computing Device | 229 | 6.0% |
| Total | 3,789 | 100.0% |
Internet Access in Manvel
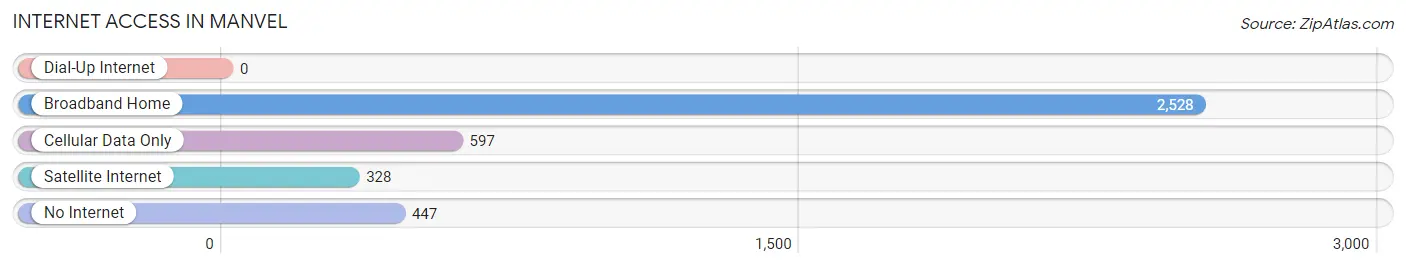
| Internet Type | # Households | % Households |
| Dial-Up Internet | 0 | 0.0% |
| Broadband Home | 2,528 | 66.7% |
| Cellular Data Only | 597 | 15.8% |
| Satellite Internet | 328 | 8.7% |
| No Internet | 447 | 11.8% |
| Total | 3,789 | 100.0% |
Manvel Summary
Manvel, Texas is a small city located in Brazoria County, Texas, United States. It is situated about 25 miles south of Houston and is part of the Houston–The Woodlands–Sugar Land metropolitan area. The city was founded in 1891 and incorporated in 1965. As of the 2010 census, the population of Manvel was 5,179.
History
Manvel was founded in 1891 by a group of settlers from Missouri. The town was named after a local rancher, Thomas Manvel. The town was originally located on the banks of the Brazos River, but was moved to its current location in the early 1900s due to flooding.
In the early 1900s, Manvel was a small farming community. The town was home to a cotton gin, a blacksmith shop, a general store, and a post office. The town also had a school, which was built in 1910.
In the 1950s, Manvel began to experience rapid growth due to the development of the Houston Ship Channel and the growth of the Houston metropolitan area. The population of Manvel increased from 1,000 in 1950 to 5,179 in 2010.
Geography
Manvel is located in Brazoria County, Texas, United States. It is situated about 25 miles south of Houston and is part of the Houston–The Woodlands–Sugar Land metropolitan area. The city has a total area of 8.3 square miles, all of which is land.
The city is located on the banks of the Brazos River. The climate in Manvel is humid subtropical, with hot summers and mild winters. The average annual temperature is 68°F.
Economy
Manvel’s economy is largely based on the oil and gas industry. The city is home to several oil and gas companies, including Chevron, Shell, and ExxonMobil. The city is also home to several manufacturing companies, including a plastics manufacturer and a metal fabrication company.
The city is also home to several retail stores, restaurants, and other businesses. The city is served by the Alvin Community College, which offers a variety of educational programs.
Demographics
As of the 2010 census, the population of Manvel was 5,179. The racial makeup of the city was 79.2% White, 11.2% African American, 0.7% Native American, 0.7% Asian, 0.1% Pacific Islander, 6.2% from other races, and 2.0% from two or more races. Hispanic or Latino of any race were 18.2% of the population.
The median income for a household in Manvel was $60,938, and the median income for a family was $68,938. The per capita income for the city was $25,938. About 8.2% of families and 10.2% of the population were below the poverty line, including 14.2% of those under age 18 and 6.2% of those age 65 or over.
Common Questions
What is Per Capita Income in Manvel?
Per Capita income in Manvel is $41,747.
What is the Median Family Income in Manvel?
Median Family Income in Manvel is $124,750.
What is the Median Household income in Manvel?
Median Household Income in Manvel is $105,188.
What is Income or Wage Gap in Manvel?
Income or Wage Gap in Manvel is 30.3%.
Women in Manvel earn 69.7 cents for every dollar earned by a man.
What is Inequality or Gini Index in Manvel?
Inequality or Gini Index in Manvel is 0.37.
What is the Total Population of Manvel?
Total Population of Manvel is 11,265.
What is the Total Male Population of Manvel?
Total Male Population of Manvel is 5,672.
What is the Total Female Population of Manvel?
Total Female Population of Manvel is 5,593.
What is the Ratio of Males per 100 Females in Manvel?
There are 101.41 Males per 100 Females in Manvel.
What is the Ratio of Females per 100 Males in Manvel?
There are 98.61 Females per 100 Males in Manvel.
What is the Median Population Age in Manvel?
Median Population Age in Manvel is 35.7 Years.
What is the Average Family Size in Manvel
Average Family Size in Manvel is 3.6 People.
What is the Average Household Size in Manvel
Average Household Size in Manvel is 3.0 People.
How Large is the Labor Force in Manvel?
There are 5,569 People in the Labor Forcein in Manvel.
What is the Percentage of People in the Labor Force in Manvel?
64.0% of People are in the Labor Force in Manvel.
What is the Unemployment Rate in Manvel?
Unemployment Rate in Manvel is 2.6%.