Pioneer Village, KY Map & Demographics
Pioneer Village Map
Pioneer Village Overview
$37,129
PER CAPITA INCOME
$91,406
AVG FAMILY INCOME
$76,996
AVG HOUSEHOLD INCOME
26.9%
WAGE / INCOME GAP [ % ]
73.1¢/ $1
WAGE / INCOME GAP [ $ ]
0.33
INEQUALITY / GINI INDEX
2,687
TOTAL POPULATION
1,311
MALE POPULATION
1,376
FEMALE POPULATION
95.28
MALES / 100 FEMALES
104.96
FEMALES / 100 MALES
53.5
MEDIAN AGE
3.0
AVG FAMILY SIZE
2.6
AVG HOUSEHOLD SIZE
1,328
LABOR FORCE [ PEOPLE ]
56.4%
PERCENT IN LABOR FORCE
1.9%
UNEMPLOYMENT RATE
Pioneer Village Area Codes
Income in Pioneer Village
Income Overview in Pioneer Village
Per Capita Income in Pioneer Village is $37,129, while median incomes of families and households are $91,406 and $76,996 respectively.
| Characteristic | Number | Measure |
| Per Capita Income | 2,687 | $37,129 |
| Median Family Income | 785 | $91,406 |
| Mean Family Income | 785 | $94,634 |
| Median Household Income | 1,035 | $76,996 |
| Mean Household Income | 1,035 | $87,182 |
| Income Deficit | 785 | $0 |
| Wage / Income Gap (%) | 2,687 | 26.92% |
| Wage / Income Gap ($) | 2,687 | 73.08¢ per $1 |
| Gini / Inequality Index | 2,687 | 0.33 |
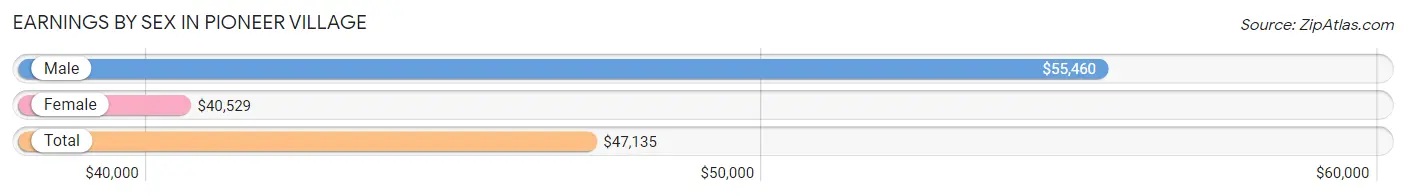
Earnings by Sex in Pioneer Village
Average Earnings in Pioneer Village are $47,135, $55,460 for men and $40,529 for women, a difference of 26.9%.
| Sex | Number | Average Earnings |
| Male | 710 (53.0%) | $55,460 |
| Female | 629 (47.0%) | $40,529 |
| Total | 1,339 (100.0%) | $47,135 |
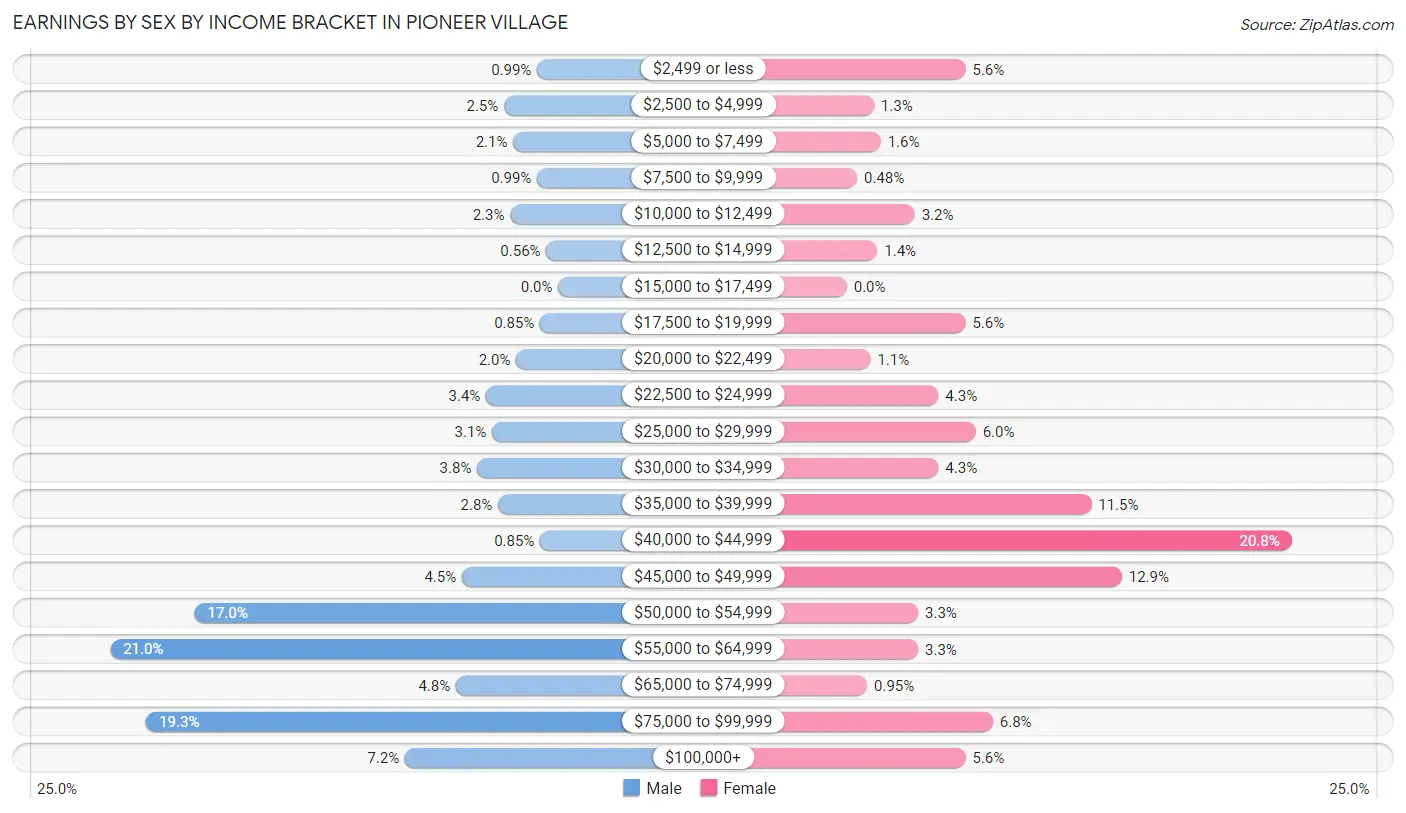
Earnings by Sex by Income Bracket in Pioneer Village
The most common earnings brackets in Pioneer Village are $55,000 to $64,999 for men (149 | 21.0%) and $40,000 to $44,999 for women (131 | 20.8%).
| Income | Male | Female |
| $2,499 or less | 7 (1.0%) | 35 (5.6%) |
| $2,500 to $4,999 | 18 (2.5%) | 8 (1.3%) |
| $5,000 to $7,499 | 15 (2.1%) | 10 (1.6%) |
| $7,500 to $9,999 | 7 (1.0%) | 3 (0.5%) |
| $10,000 to $12,499 | 16 (2.2%) | 20 (3.2%) |
| $12,500 to $14,999 | 4 (0.6%) | 9 (1.4%) |
| $15,000 to $17,499 | 0 (0.0%) | 0 (0.0%) |
| $17,500 to $19,999 | 6 (0.9%) | 35 (5.6%) |
| $20,000 to $22,499 | 14 (2.0%) | 7 (1.1%) |
| $22,500 to $24,999 | 24 (3.4%) | 27 (4.3%) |
| $25,000 to $29,999 | 22 (3.1%) | 38 (6.0%) |
| $30,000 to $34,999 | 27 (3.8%) | 27 (4.3%) |
| $35,000 to $39,999 | 20 (2.8%) | 72 (11.5%) |
| $40,000 to $44,999 | 6 (0.9%) | 131 (20.8%) |
| $45,000 to $49,999 | 32 (4.5%) | 81 (12.9%) |
| $50,000 to $54,999 | 121 (17.0%) | 21 (3.3%) |
| $55,000 to $64,999 | 149 (21.0%) | 21 (3.3%) |
| $65,000 to $74,999 | 34 (4.8%) | 6 (0.9%) |
| $75,000 to $99,999 | 137 (19.3%) | 43 (6.8%) |
| $100,000+ | 51 (7.2%) | 35 (5.6%) |
| Total | 710 (100.0%) | 629 (100.0%) |
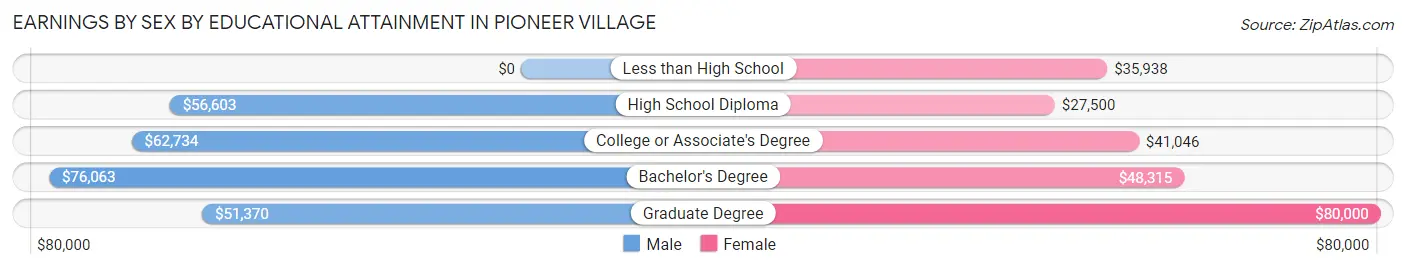
Earnings by Sex by Educational Attainment in Pioneer Village
Average earnings in Pioneer Village are $56,092 for men and $40,888 for women, a difference of 27.1%. Men with an educational attainment of bachelor's degree enjoy the highest average annual earnings of $76,063, while those with graduate degree education earn the least with $51,370. Women with an educational attainment of graduate degree earn the most with the average annual earnings of $80,000, while those with high school diploma education have the smallest earnings of $27,500.
| Educational Attainment | Male Income | Female Income |
| Less than High School | - | - |
| High School Diploma | $56,603 | $27,500 |
| College or Associate's Degree | $62,734 | $41,046 |
| Bachelor's Degree | $76,063 | $48,315 |
| Graduate Degree | $51,370 | $80,000 |
| Total | $56,092 | $40,888 |
Family Income in Pioneer Village
Family Income Brackets in Pioneer Village
According to the Pioneer Village family income data, there are 239 families falling into the $100,000 to $149,999 income range, which is the most common income bracket and makes up 30.4% of all families.
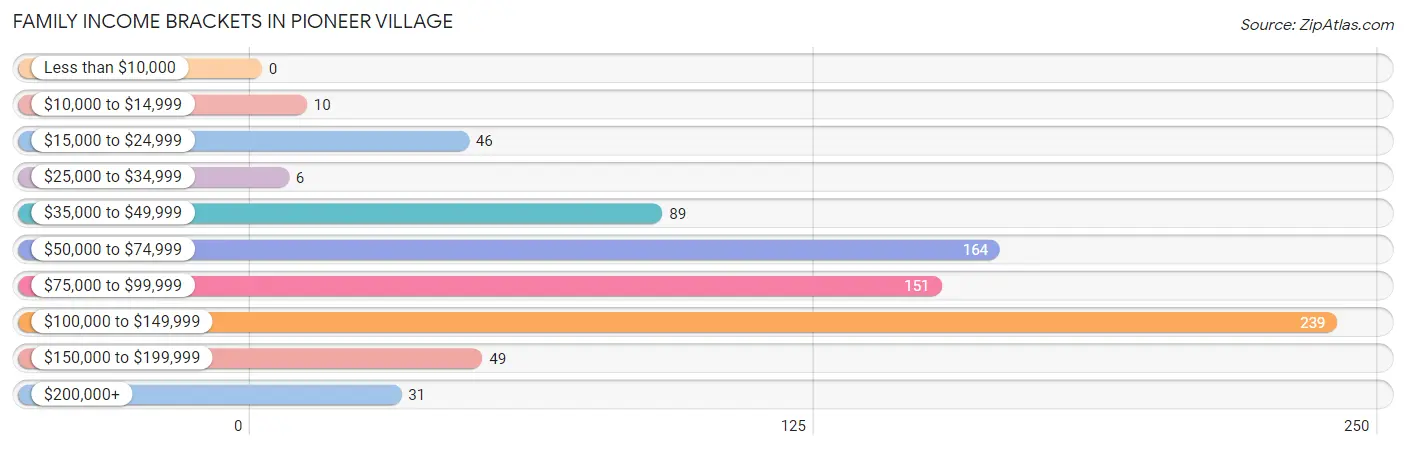
| Income Bracket | # Families | % Families |
| Less than $10,000 | 0 | 0.0% |
| $10,000 to $14,999 | 10 | 1.3% |
| $15,000 to $24,999 | 46 | 5.9% |
| $25,000 to $34,999 | 6 | 0.8% |
| $35,000 to $49,999 | 89 | 11.3% |
| $50,000 to $74,999 | 164 | 20.9% |
| $75,000 to $99,999 | 151 | 19.2% |
| $100,000 to $149,999 | 239 | 30.4% |
| $150,000 to $199,999 | 49 | 6.2% |
| $200,000+ | 31 | 3.9% |
Family Income by Famaliy Size in Pioneer Village
3-person families (223 | 28.4%) account for the highest median family income in Pioneer Village with $122,939 per family, while 3-person families (223 | 28.4%) have the highest median income of $40,980 per family member.
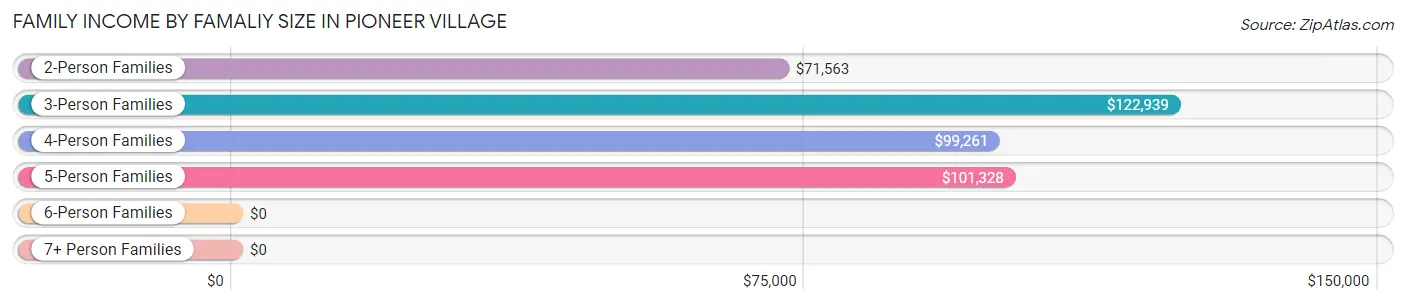
| Income Bracket | # Families | Median Income |
| 2-Person Families | 428 (54.5%) | $71,563 |
| 3-Person Families | 223 (28.4%) | $122,939 |
| 4-Person Families | 89 (11.3%) | $99,261 |
| 5-Person Families | 29 (3.7%) | $101,328 |
| 6-Person Families | 14 (1.8%) | $0 |
| 7+ Person Families | 2 (0.3%) | $0 |
| Total | 785 (100.0%) | $91,406 |
Family Income by Number of Earners in Pioneer Village
The median family income in Pioneer Village is $91,406, with families comprising 3+ earners (43) having the highest median family income of $115,250, while families with no earners (177) have the lowest median family income of $58,542, accounting for 5.5% and 22.6% of families, respectively.
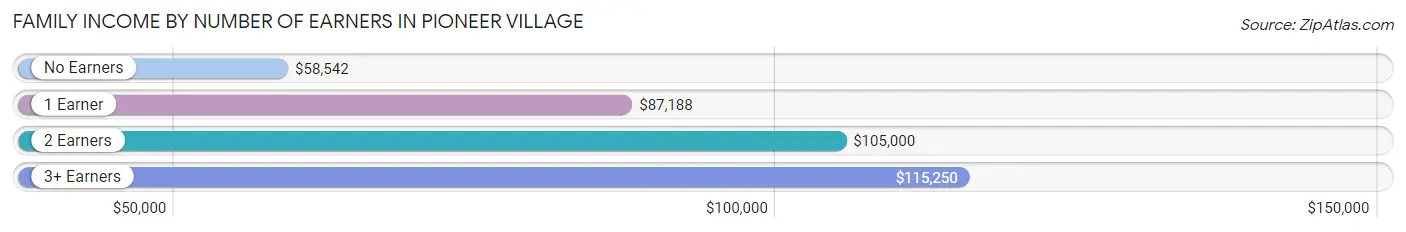
| Number of Earners | # Families | Median Income |
| No Earners | 177 (22.6%) | $58,542 |
| 1 Earner | 277 (35.3%) | $87,188 |
| 2 Earners | 288 (36.7%) | $105,000 |
| 3+ Earners | 43 (5.5%) | $115,250 |
| Total | 785 (100.0%) | $91,406 |
Household Income in Pioneer Village
Household Income Brackets in Pioneer Village
With 269 households falling in the category, the $100,000 to $149,999 income range is the most frequent in Pioneer Village, accounting for 26.0% of all households. In contrast, only 16 households (1.5%) fall into the $25,000 to $34,999 income bracket, making it the least populous group.
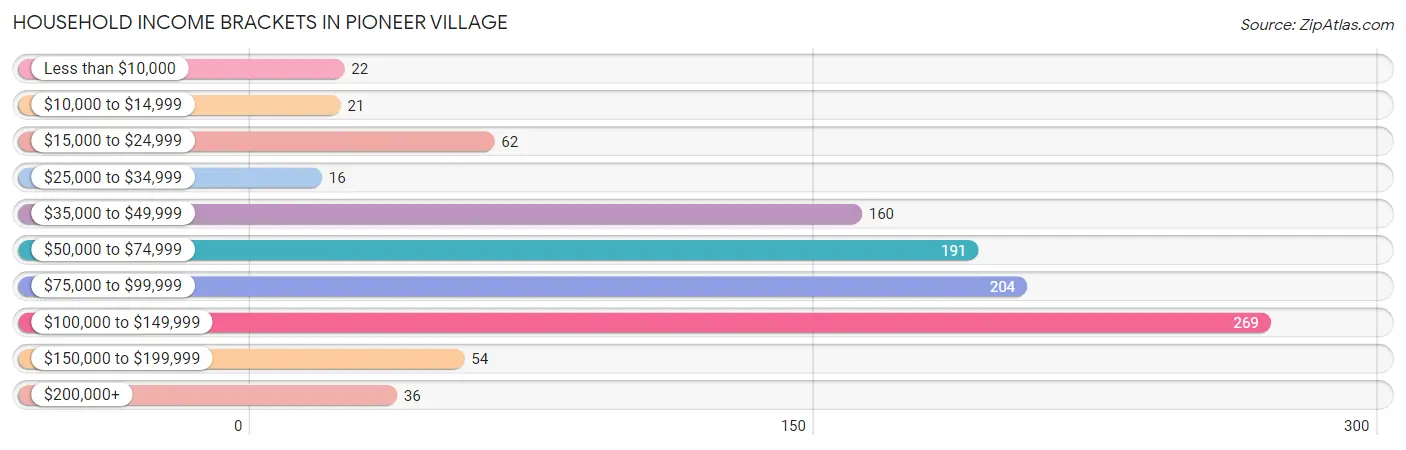
| Income Bracket | # Households | % Households |
| Less than $10,000 | 22 | 2.1% |
| $10,000 to $14,999 | 21 | 2.0% |
| $15,000 to $24,999 | 62 | 6.0% |
| $25,000 to $34,999 | 16 | 1.5% |
| $35,000 to $49,999 | 160 | 15.5% |
| $50,000 to $74,999 | 191 | 18.5% |
| $75,000 to $99,999 | 204 | 19.7% |
| $100,000 to $149,999 | 269 | 26.0% |
| $150,000 to $199,999 | 54 | 5.2% |
| $200,000+ | 36 | 3.5% |
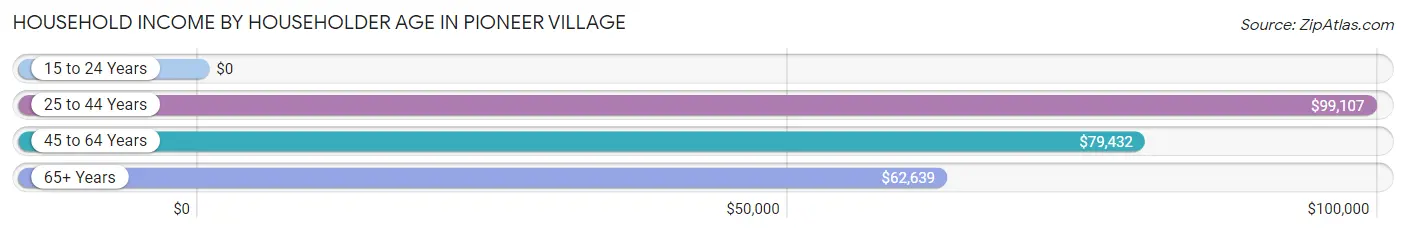
Household Income by Householder Age in Pioneer Village
The median household income in Pioneer Village is $76,996, with the highest median household income of $99,107 found in the 25 to 44 years age bracket for the primary householder. A total of 278 households (26.9%) fall into this category. Meanwhile, the 15 to 24 years age bracket for the primary householder has the lowest median household income of $0, with 6 households (0.6%) in this group.
| Income Bracket | # Households | Median Income |
| 15 to 24 Years | 6 (0.6%) | $0 |
| 25 to 44 Years | 278 (26.9%) | $99,107 |
| 45 to 64 Years | 310 (29.9%) | $79,432 |
| 65+ Years | 441 (42.6%) | $62,639 |
| Total | 1,035 (100.0%) | $76,996 |
Poverty in Pioneer Village
Income Below Poverty by Sex and Age in Pioneer Village
With 7.7% poverty level for males and 7.8% for females among the residents of Pioneer Village, under 5 year old males and 18 to 24 year old females are the most vulnerable to poverty, with 44 males (54.3%) and 11 females (23.4%) in their respective age groups living below the poverty level.
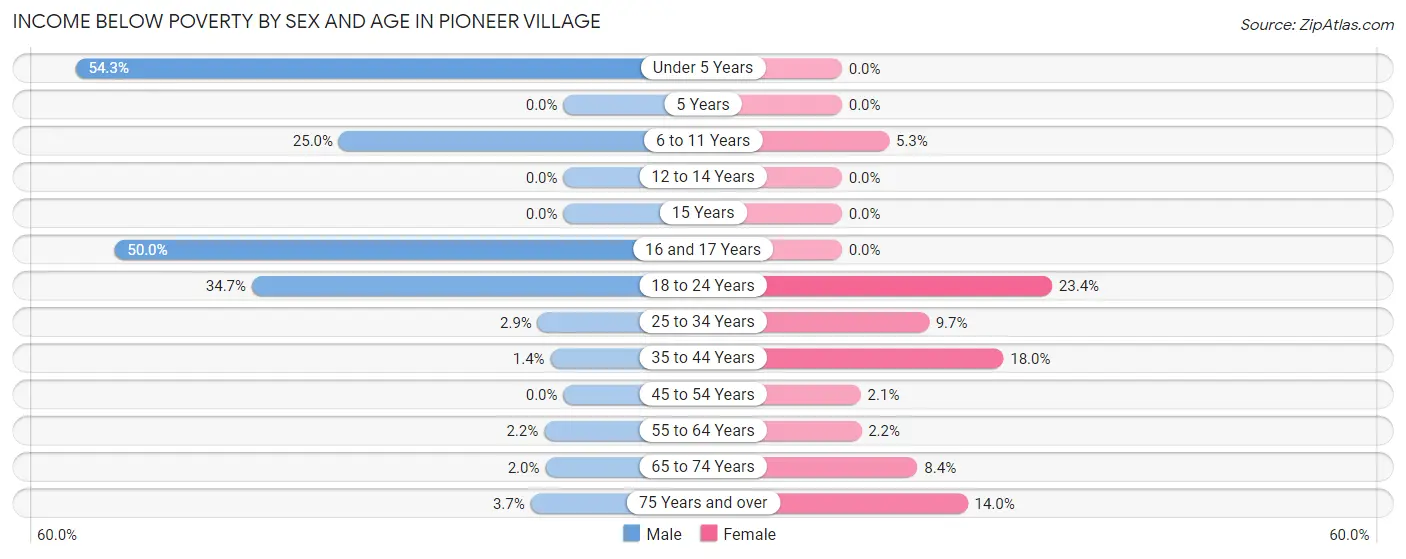
| Age Bracket | Male | Female |
| Under 5 Years | 44 (54.3%) | 0 (0.0%) |
| 5 Years | 0 (0.0%) | 0 (0.0%) |
| 6 to 11 Years | 12 (25.0%) | 4 (5.3%) |
| 12 to 14 Years | 0 (0.0%) | 0 (0.0%) |
| 15 Years | 0 (0.0%) | 0 (0.0%) |
| 16 and 17 Years | 7 (50.0%) | 0 (0.0%) |
| 18 to 24 Years | 17 (34.7%) | 11 (23.4%) |
| 25 to 34 Years | 4 (2.9%) | 12 (9.7%) |
| 35 to 44 Years | 3 (1.4%) | 25 (18.0%) |
| 45 to 54 Years | 0 (0.0%) | 5 (2.1%) |
| 55 to 64 Years | 5 (2.1%) | 5 (2.2%) |
| 65 to 74 Years | 4 (2.0%) | 24 (8.4%) |
| 75 Years and over | 5 (3.6%) | 21 (14.0%) |
| Total | 101 (7.7%) | 107 (7.8%) |
Income Above Poverty by Sex and Age in Pioneer Village
According to the poverty statistics in Pioneer Village, males aged 5 years and females aged under 5 years are the age groups that are most secure financially, with 100.0% of males and 100.0% of females in these age groups living above the poverty line.
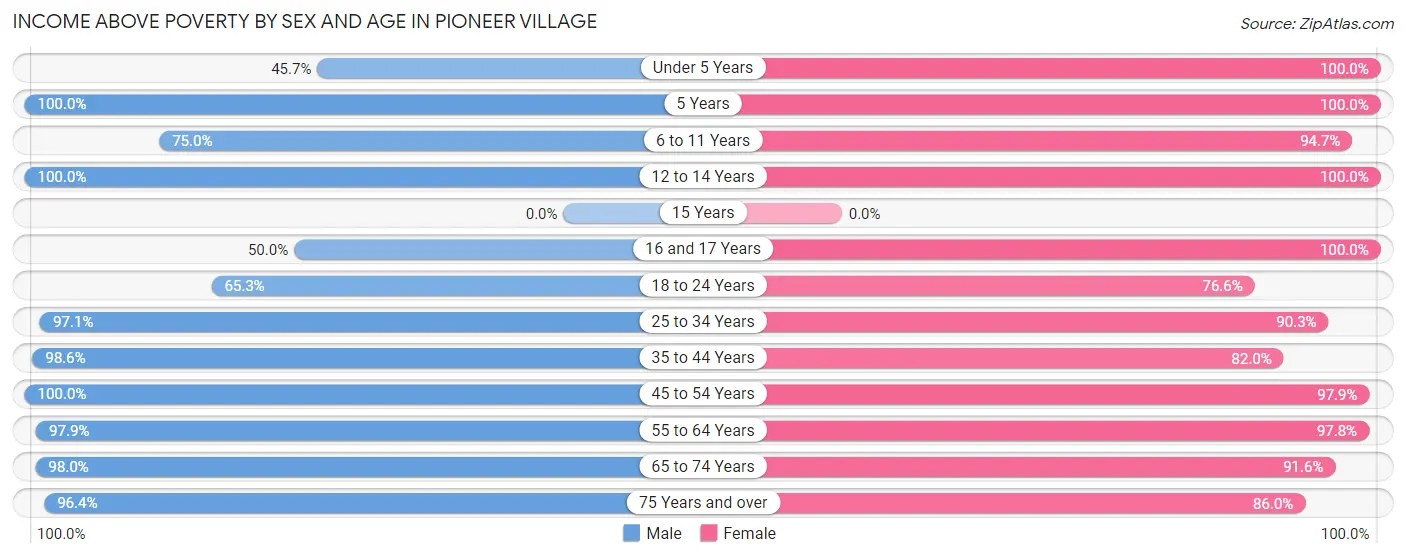
| Age Bracket | Male | Female |
| Under 5 Years | 37 (45.7%) | 32 (100.0%) |
| 5 Years | 6 (100.0%) | 15 (100.0%) |
| 6 to 11 Years | 36 (75.0%) | 72 (94.7%) |
| 12 to 14 Years | 51 (100.0%) | 23 (100.0%) |
| 15 Years | 0 (0.0%) | 0 (0.0%) |
| 16 and 17 Years | 7 (50.0%) | 15 (100.0%) |
| 18 to 24 Years | 32 (65.3%) | 36 (76.6%) |
| 25 to 34 Years | 136 (97.1%) | 112 (90.3%) |
| 35 to 44 Years | 206 (98.6%) | 114 (82.0%) |
| 45 to 54 Years | 144 (100.0%) | 233 (97.9%) |
| 55 to 64 Years | 228 (97.9%) | 227 (97.8%) |
| 65 to 74 Years | 195 (98.0%) | 261 (91.6%) |
| 75 Years and over | 132 (96.4%) | 129 (86.0%) |
| Total | 1,210 (92.3%) | 1,269 (92.2%) |
Income Below Poverty Among Married-Couple Families in Pioneer Village
The poverty statistics for married-couple families in Pioneer Village show that 2.8% or 17 of the total 602 families live below the poverty line. Families with 3 or 4 children have the highest poverty rate of 15.0%, comprising of 3 families. On the other hand, families with no children have the lowest poverty rate of 2.0%, which includes 9 families.
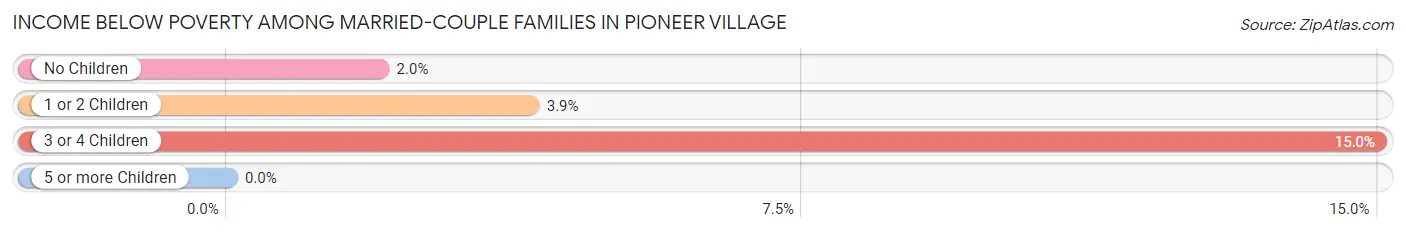
| Children | Above Poverty | Below Poverty |
| No Children | 446 (98.0%) | 9 (2.0%) |
| 1 or 2 Children | 122 (96.1%) | 5 (3.9%) |
| 3 or 4 Children | 17 (85.0%) | 3 (15.0%) |
| 5 or more Children | 0 (0.0%) | 0 (0.0%) |
| Total | 585 (97.2%) | 17 (2.8%) |
Income Below Poverty Among Single-Parent Households in Pioneer Village
According to the poverty data in Pioneer Village, 7.9% or 5 single-father households and 14.2% or 17 single-mother households are living below the poverty line. Among single-father households, those with no children have the highest poverty rate, with 5 households (9.6%) experiencing poverty. Likewise, among single-mother households, those with 3 or 4 children have the highest poverty rate, with 12 households (66.7%) falling below the poverty line.
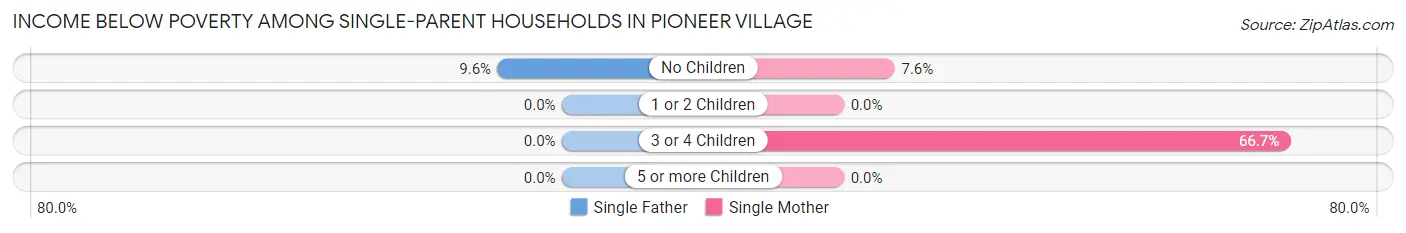
| Children | Single Father | Single Mother |
| No Children | 5 (9.6%) | 5 (7.6%) |
| 1 or 2 Children | 0 (0.0%) | 0 (0.0%) |
| 3 or 4 Children | 0 (0.0%) | 12 (66.7%) |
| 5 or more Children | 0 (0.0%) | 0 (0.0%) |
| Total | 5 (7.9%) | 17 (14.2%) |
Income Below Poverty Among Married-Couple vs Single-Parent Households in Pioneer Village
The poverty data for Pioneer Village shows that 17 of the married-couple family households (2.8%) and 22 of the single-parent households (12.0%) are living below the poverty level. Within the married-couple family households, those with 3 or 4 children have the highest poverty rate, with 3 households (15.0%) falling below the poverty line. Among the single-parent households, those with 3 or 4 children have the highest poverty rate, with 12 household (66.7%) living below poverty.
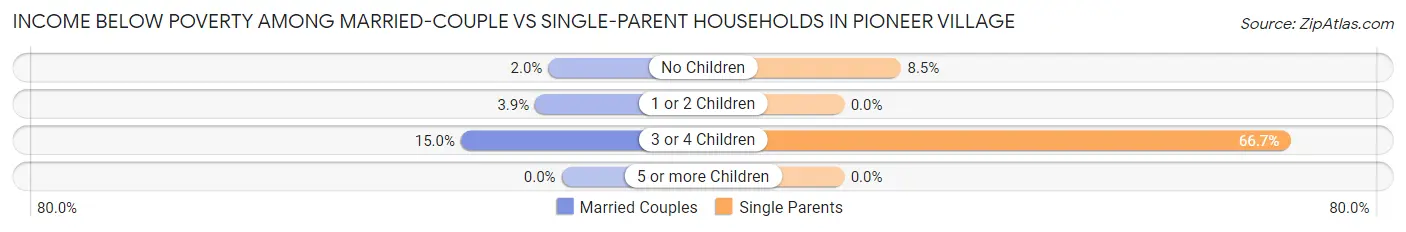
| Children | Married-Couple Families | Single-Parent Households |
| No Children | 9 (2.0%) | 10 (8.5%) |
| 1 or 2 Children | 5 (3.9%) | 0 (0.0%) |
| 3 or 4 Children | 3 (15.0%) | 12 (66.7%) |
| 5 or more Children | 0 (0.0%) | 0 (0.0%) |
| Total | 17 (2.8%) | 22 (12.0%) |
Race in Pioneer Village
The most populous races in Pioneer Village are White / Caucasian (2,565 | 95.5%), Two or more Races (63 | 2.3%), and Hispanic or Latino (35 | 1.3%).
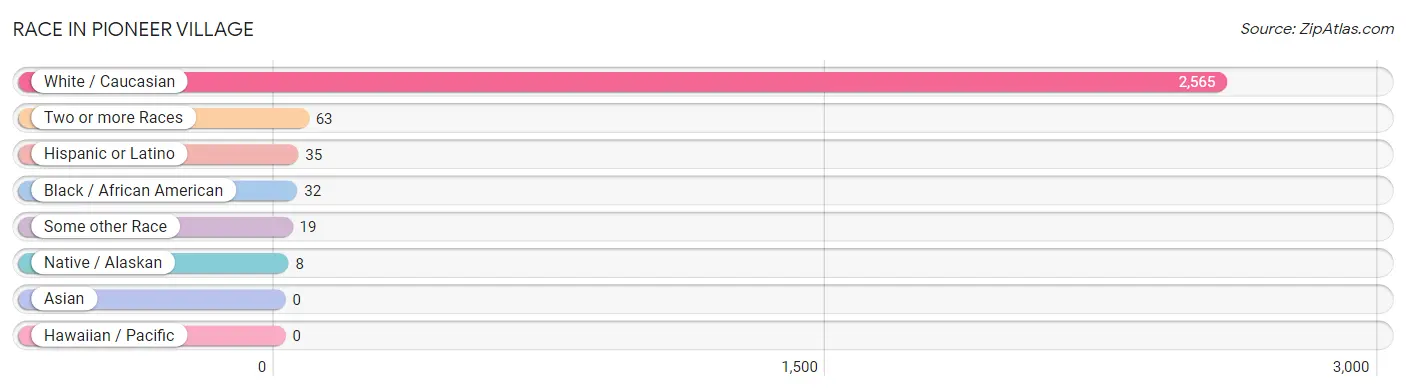
| Race | # Population | % Population |
| Asian | 0 | 0.0% |
| Black / African American | 32 | 1.2% |
| Hawaiian / Pacific | 0 | 0.0% |
| Hispanic or Latino | 35 | 1.3% |
| Native / Alaskan | 8 | 0.3% |
| White / Caucasian | 2,565 | 95.5% |
| Two or more Races | 63 | 2.3% |
| Some other Race | 19 | 0.7% |
| Total | 2,687 | 100.0% |
Ancestry in Pioneer Village
The most populous ancestries reported in Pioneer Village are German (658 | 24.5%), Irish (481 | 17.9%), English (400 | 14.9%), American (204 | 7.6%), and Italian (72 | 2.7%), together accounting for 67.5% of all Pioneer Village residents.
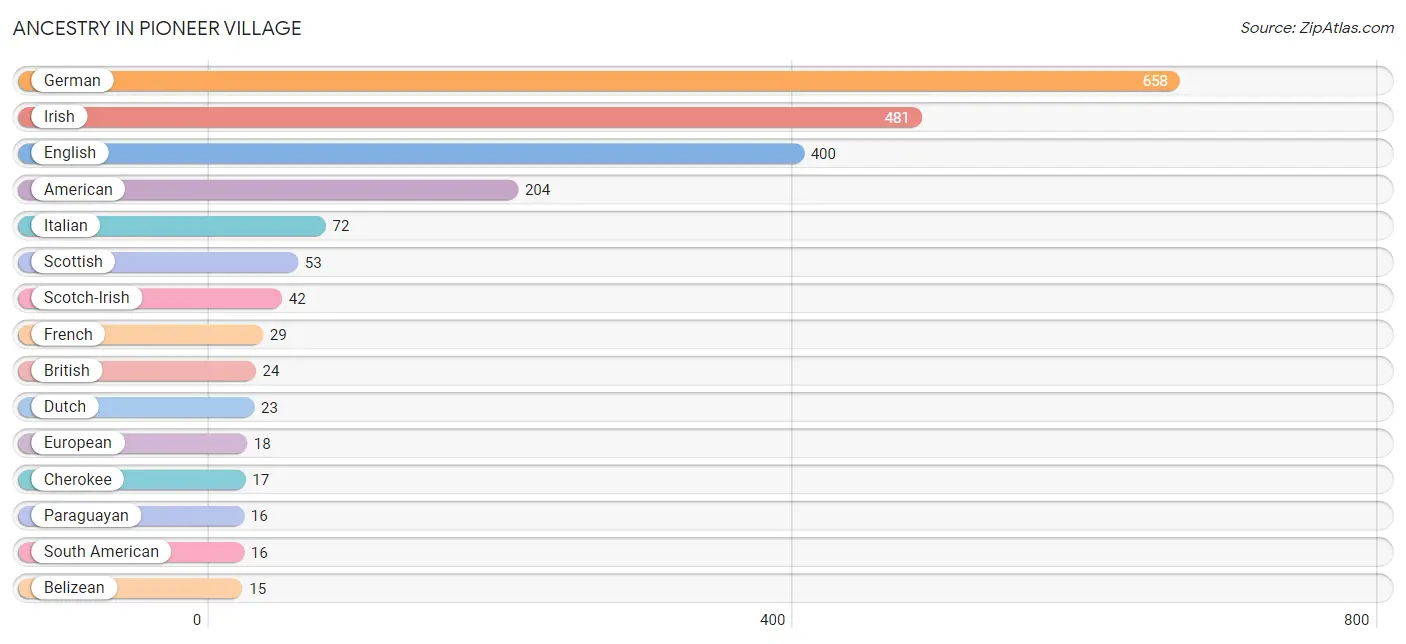
| Ancestry | # Population | % Population |
| American | 204 | 7.6% |
| Belizean | 15 | 0.6% |
| Blackfeet | 4 | 0.2% |
| British | 24 | 0.9% |
| Cherokee | 17 | 0.6% |
| Cuban | 4 | 0.2% |
| Dutch | 23 | 0.9% |
| Eastern European | 4 | 0.2% |
| English | 400 | 14.9% |
| European | 18 | 0.7% |
| French | 29 | 1.1% |
| German | 658 | 24.5% |
| Irish | 481 | 17.9% |
| Italian | 72 | 2.7% |
| Mexican | 12 | 0.4% |
| Norwegian | 8 | 0.3% |
| Paraguayan | 16 | 0.6% |
| Polish | 13 | 0.5% |
| Puerto Rican | 3 | 0.1% |
| Scandinavian | 8 | 0.3% |
| Scotch-Irish | 42 | 1.6% |
| Scottish | 53 | 2.0% |
| Slovak | 14 | 0.5% |
| South American | 16 | 0.6% |
| Thai | 15 | 0.6% |
| Welsh | 5 | 0.2% | View All 26 Rows |
Immigrants in Pioneer Village
The most numerous immigrant groups reported in Pioneer Village came from Latin America (25 | 0.9%), Central America (20 | 0.7%), Belize (15 | 0.6%), Caribbean (5 | 0.2%), and Cuba (5 | 0.2%), together accounting for 2.6% of all Pioneer Village residents.
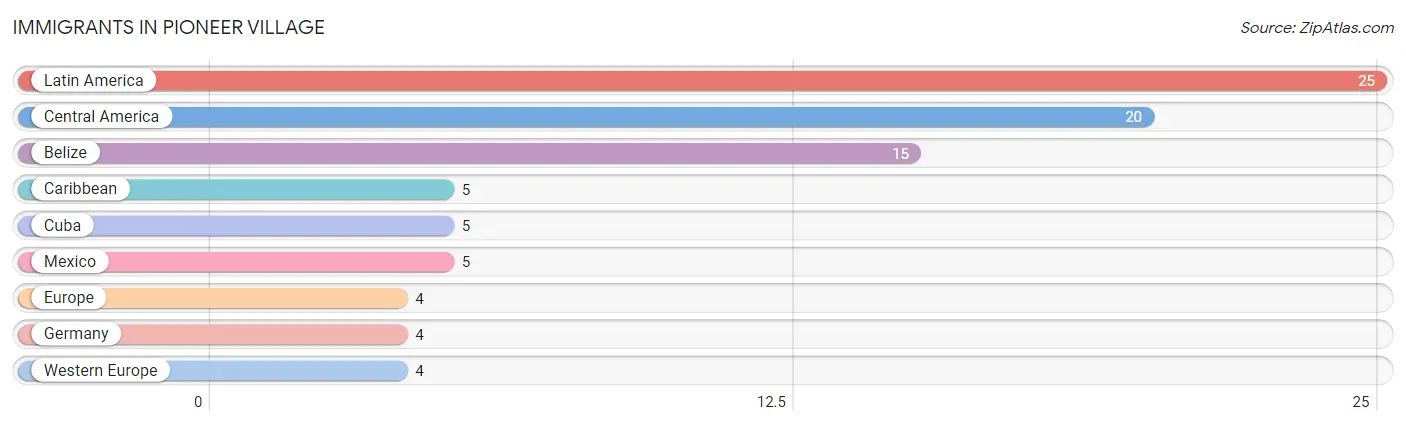
| Immigration Origin | # Population | % Population |
| Belize | 15 | 0.6% |
| Caribbean | 5 | 0.2% |
| Central America | 20 | 0.7% |
| Cuba | 5 | 0.2% |
| Europe | 4 | 0.2% |
| Germany | 4 | 0.2% |
| Latin America | 25 | 0.9% |
| Mexico | 5 | 0.2% |
| Western Europe | 4 | 0.2% | View All 9 Rows |
Sex and Age in Pioneer Village
Sex and Age in Pioneer Village
The most populous age groups in Pioneer Village are 35 to 39 Years (154 | 11.7%) for men and 50 to 54 Years (150 | 10.9%) for women.
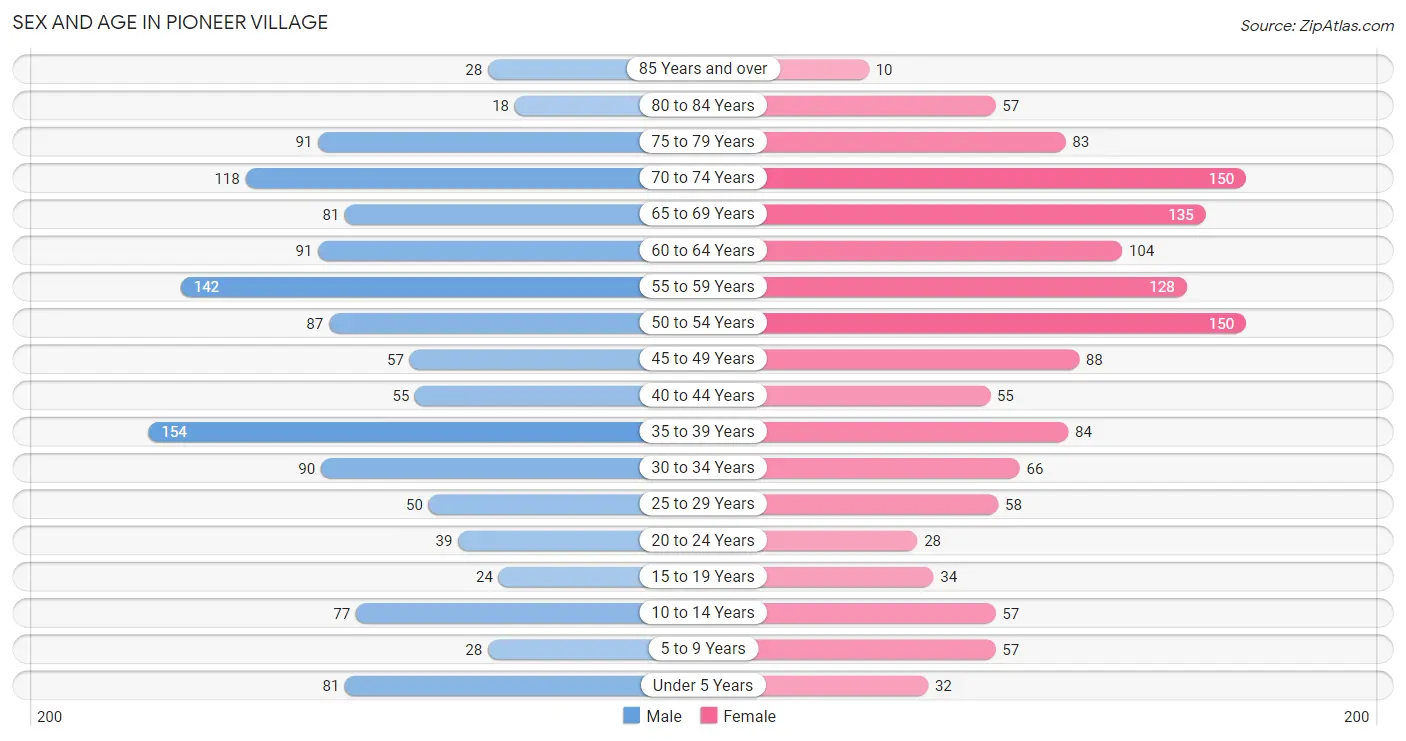
| Age Bracket | Male | Female |
| Under 5 Years | 81 (6.2%) | 32 (2.3%) |
| 5 to 9 Years | 28 (2.1%) | 57 (4.1%) |
| 10 to 14 Years | 77 (5.9%) | 57 (4.1%) |
| 15 to 19 Years | 24 (1.8%) | 34 (2.5%) |
| 20 to 24 Years | 39 (3.0%) | 28 (2.0%) |
| 25 to 29 Years | 50 (3.8%) | 58 (4.2%) |
| 30 to 34 Years | 90 (6.9%) | 66 (4.8%) |
| 35 to 39 Years | 154 (11.7%) | 84 (6.1%) |
| 40 to 44 Years | 55 (4.2%) | 55 (4.0%) |
| 45 to 49 Years | 57 (4.3%) | 88 (6.4%) |
| 50 to 54 Years | 87 (6.6%) | 150 (10.9%) |
| 55 to 59 Years | 142 (10.8%) | 128 (9.3%) |
| 60 to 64 Years | 91 (6.9%) | 104 (7.6%) |
| 65 to 69 Years | 81 (6.2%) | 135 (9.8%) |
| 70 to 74 Years | 118 (9.0%) | 150 (10.9%) |
| 75 to 79 Years | 91 (6.9%) | 83 (6.0%) |
| 80 to 84 Years | 18 (1.4%) | 57 (4.1%) |
| 85 Years and over | 28 (2.1%) | 10 (0.7%) |
| Total | 1,311 (100.0%) | 1,376 (100.0%) |
Families and Households in Pioneer Village
Median Family Size in Pioneer Village
The median family size in Pioneer Village is 3.00 persons per family, with single male/father families (63 | 8.0%) accounting for the largest median family size of 3.9 persons per family. On the other hand, married-couple families (602 | 76.7%) represent the smallest median family size with 2.82 persons per family.
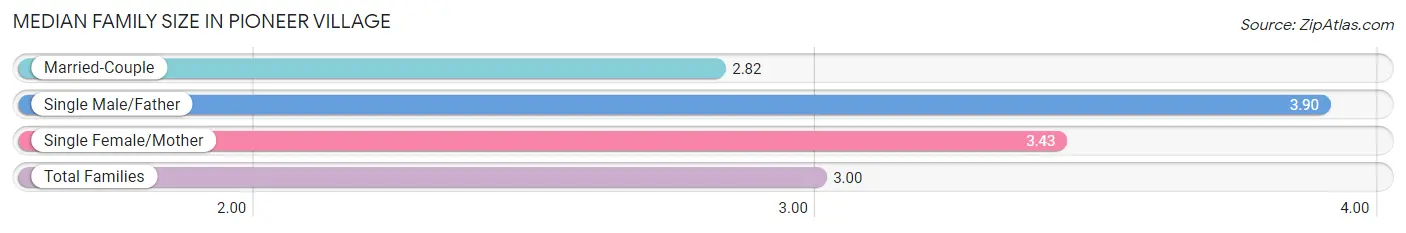
| Family Type | # Families | Family Size |
| Married-Couple | 602 (76.7%) | 2.82 |
| Single Male/Father | 63 (8.0%) | 3.90 |
| Single Female/Mother | 120 (15.3%) | 3.43 |
| Total Families | 785 (100.0%) | 3.00 |
Median Household Size in Pioneer Village
The median household size in Pioneer Village is 2.60 persons per household, with single male/father households (63 | 6.1%) accounting for the largest median household size of 3.97 persons per household. non-family households (250 | 24.1%) represent the smallest median household size with 1.22 persons per household.
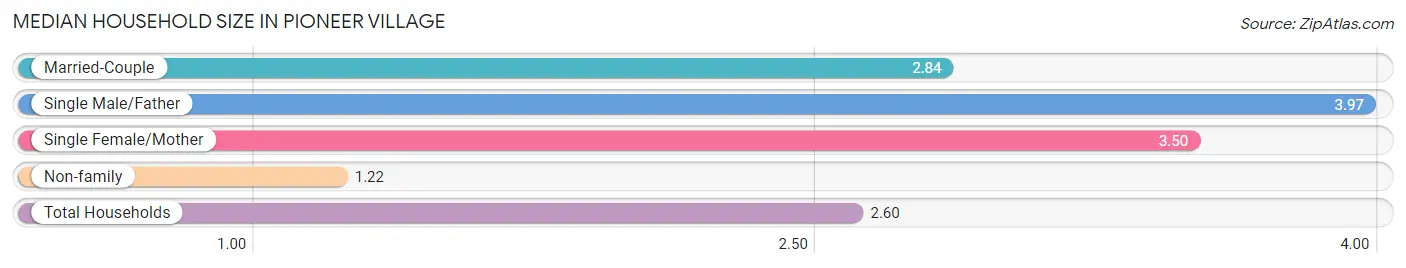
| Household Type | # Households | Household Size |
| Married-Couple | 602 (58.2%) | 2.84 |
| Single Male/Father | 63 (6.1%) | 3.97 |
| Single Female/Mother | 120 (11.6%) | 3.50 |
| Non-family | 250 (24.1%) | 1.22 |
| Total Households | 1,035 (100.0%) | 2.60 |
Household Size by Marriage Status in Pioneer Village
Out of a total of 1,035 households in Pioneer Village, 785 (75.8%) are family households, while 250 (24.1%) are nonfamily households. The most numerous type of family households are 2-person households, comprising 423, and the most common type of nonfamily households are 1-person households, comprising 208.
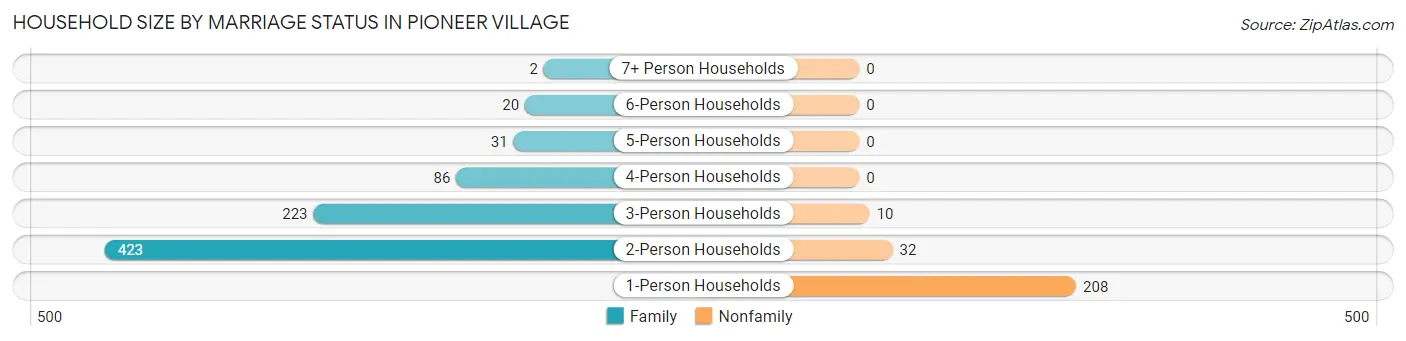
| Household Size | Family Households | Nonfamily Households |
| 1-Person Households | - | 208 (20.1%) |
| 2-Person Households | 423 (40.9%) | 32 (3.1%) |
| 3-Person Households | 223 (21.5%) | 10 (1.0%) |
| 4-Person Households | 86 (8.3%) | 0 (0.0%) |
| 5-Person Households | 31 (3.0%) | 0 (0.0%) |
| 6-Person Households | 20 (1.9%) | 0 (0.0%) |
| 7+ Person Households | 2 (0.2%) | 0 (0.0%) |
| Total | 785 (75.8%) | 250 (24.1%) |
Female Fertility in Pioneer Village
Fertility by Age in Pioneer Village
Average fertility rate in Pioneer Village is 42.0 births per 1,000 women. Women in the age bracket of 20 to 34 years have the highest fertility rate with 118.0 births per 1,000 women. Women in the age bracket of 20 to 34 years acount for 100.0% of all women with births.
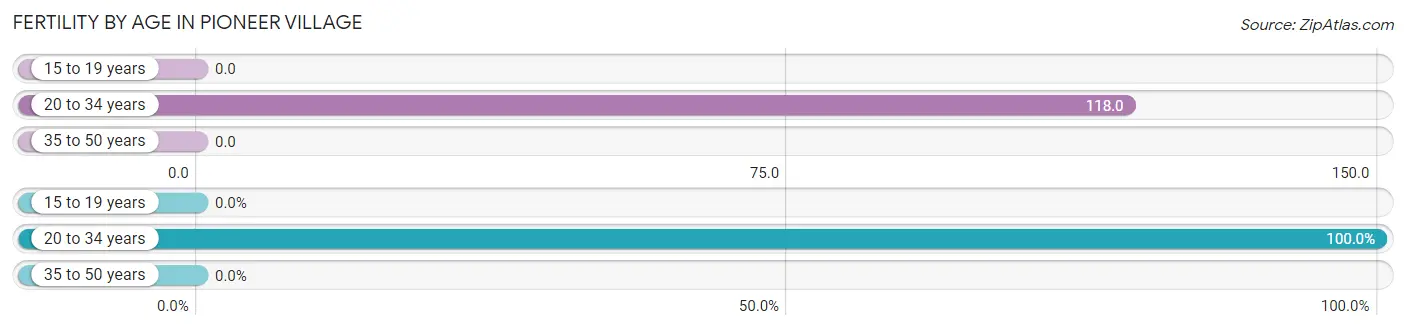
| Age Bracket | Women with Births | Births / 1,000 Women |
| 15 to 19 years | 0 (0.0%) | 0.0 |
| 20 to 34 years | 18 (100.0%) | 118.0 |
| 35 to 50 years | 0 (0.0%) | 0.0 |
| Total | 18 (100.0%) | 42.0 |
Fertility by Age by Marriage Status in Pioneer Village
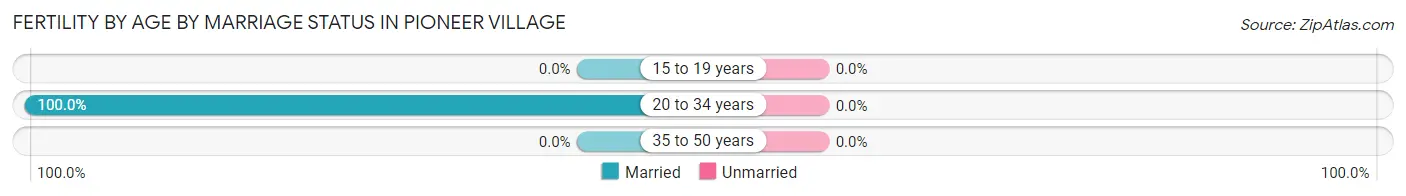
| Age Bracket | Married | Unmarried |
| 15 to 19 years | 0 (0.0%) | 0 (0.0%) |
| 20 to 34 years | 18 (100.0%) | 0 (0.0%) |
| 35 to 50 years | 0 (0.0%) | 0 (0.0%) |
| Total | 18 (100.0%) | 0 (0.0%) |
Fertility by Education in Pioneer Village
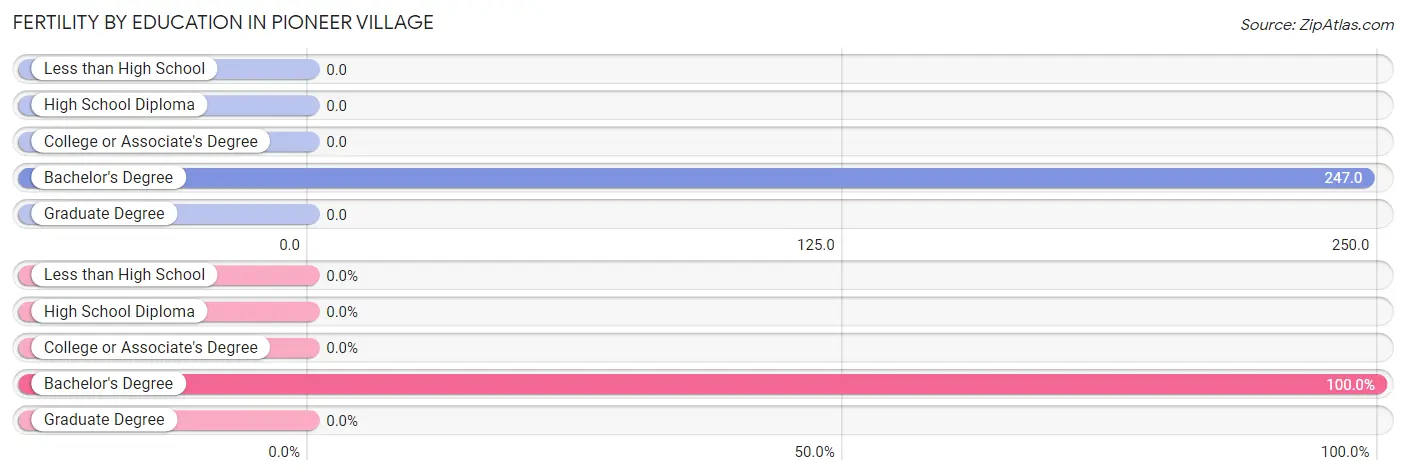
| Educational Attainment | Women with Births | Births / 1,000 Women |
| Less than High School | 0 (0.0%) | 0.0 |
| High School Diploma | 0 (0.0%) | 0.0 |
| College or Associate's Degree | 0 (0.0%) | 0.0 |
| Bachelor's Degree | 18 (100.0%) | 247.0 |
| Graduate Degree | 0 (0.0%) | 0.0 |
| Total | 18 (100.0%) | 42.0 |
Fertility by Education by Marriage Status in Pioneer Village
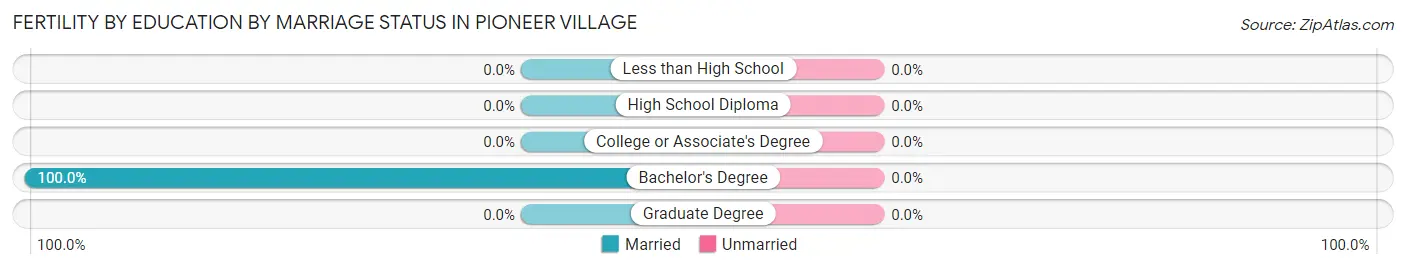
| Educational Attainment | Married | Unmarried |
| Less than High School | 0 (0.0%) | 0 (0.0%) |
| High School Diploma | 0 (0.0%) | 0 (0.0%) |
| College or Associate's Degree | 0 (0.0%) | 0 (0.0%) |
| Bachelor's Degree | 18 (100.0%) | 0 (0.0%) |
| Graduate Degree | 0 (0.0%) | 0 (0.0%) |
| Total | 18 (100.0%) | 0 (0.0%) |
Employment Characteristics in Pioneer Village
Employment by Class of Employer in Pioneer Village
Among the 1,183 employed individuals in Pioneer Village, private company employees (870 | 73.5%), local government employees (130 | 11.0%), and not-for-profit organizations (71 | 6.0%) make up the most common classes of employment.
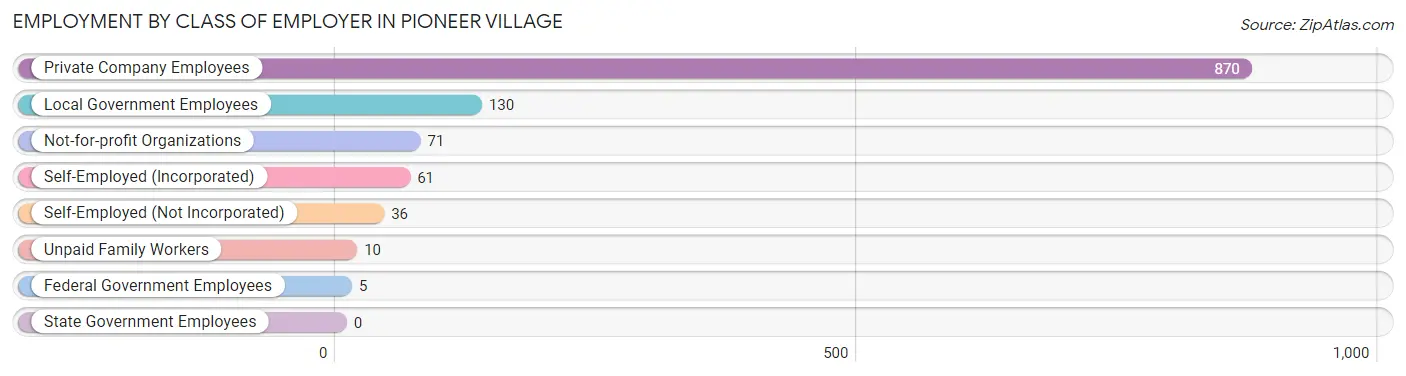
| Employer Class | # Employees | % Employees |
| Private Company Employees | 870 | 73.5% |
| Self-Employed (Incorporated) | 61 | 5.2% |
| Self-Employed (Not Incorporated) | 36 | 3.0% |
| Not-for-profit Organizations | 71 | 6.0% |
| Local Government Employees | 130 | 11.0% |
| State Government Employees | 0 | 0.0% |
| Federal Government Employees | 5 | 0.4% |
| Unpaid Family Workers | 10 | 0.9% |
| Total | 1,183 | 100.0% |
Employment Status by Age in Pioneer Village
According to the labor force statistics for Pioneer Village, out of the total population over 16 years of age (2,355), 56.4% or 1,328 individuals are in the labor force, with 1.9% or 25 of them unemployed. The age group with the highest labor force participation rate is 35 to 44 years, with 96.8% or 337 individuals in the labor force. Within the labor force, the 16 to 19 years age range has the highest percentage of unemployed individuals, with 43.8% or 7 of them being unemployed.
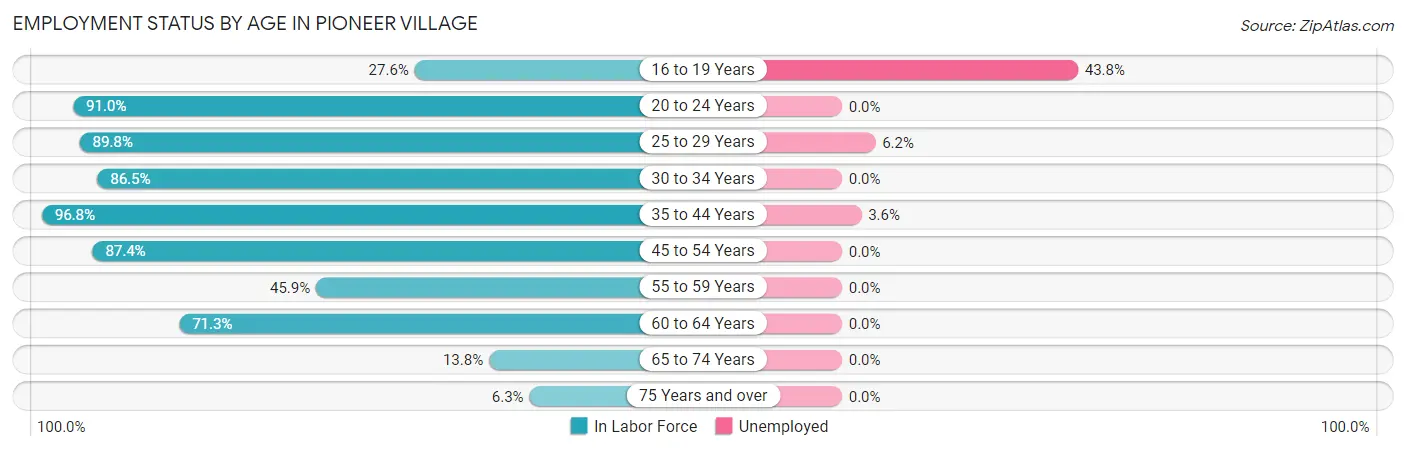
| Age Bracket | In Labor Force | Unemployed |
| 16 to 19 Years | 16 (27.6%) | 7 (43.8%) |
| 20 to 24 Years | 61 (91.0%) | 0 (0.0%) |
| 25 to 29 Years | 97 (89.8%) | 6 (6.2%) |
| 30 to 34 Years | 135 (86.5%) | 0 (0.0%) |
| 35 to 44 Years | 337 (96.8%) | 12 (3.6%) |
| 45 to 54 Years | 334 (87.4%) | 0 (0.0%) |
| 55 to 59 Years | 124 (45.9%) | 0 (0.0%) |
| 60 to 64 Years | 139 (71.3%) | 0 (0.0%) |
| 65 to 74 Years | 67 (13.8%) | 0 (0.0%) |
| 75 Years and over | 18 (6.3%) | 0 (0.0%) |
| Total | 1,328 (56.4%) | 25 (1.9%) |
Employment Status by Educational Attainment in Pioneer Village
According to labor force statistics for Pioneer Village, 79.9% of individuals (1,166) out of the total population between 25 and 64 years of age (1,459) are in the labor force, with 1.5% or 17 of them being unemployed. The group with the highest labor force participation rate are those with the educational attainment of bachelor's degree or higher, with 95.5% or 278 individuals in the labor force. Within the labor force, individuals with high school diploma education have the highest percentage of unemployment, with 2.8% or 12 of them being unemployed.
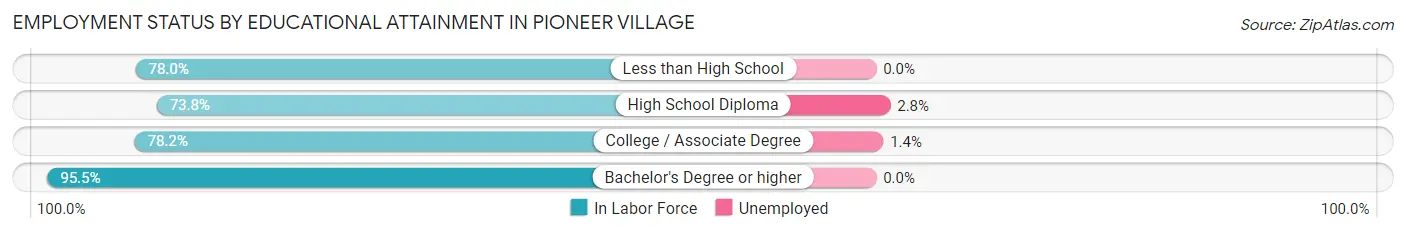
| Educational Attainment | In Labor Force | Unemployed |
| Less than High School | 39 (78.0%) | 0 (0.0%) |
| High School Diploma | 423 (73.8%) | 16 (2.8%) |
| College / Associate Degree | 426 (78.2%) | 8 (1.4%) |
| Bachelor's Degree or higher | 278 (95.5%) | 0 (0.0%) |
| Total | 1,166 (79.9%) | 22 (1.5%) |
Employment Occupations by Sex in Pioneer Village
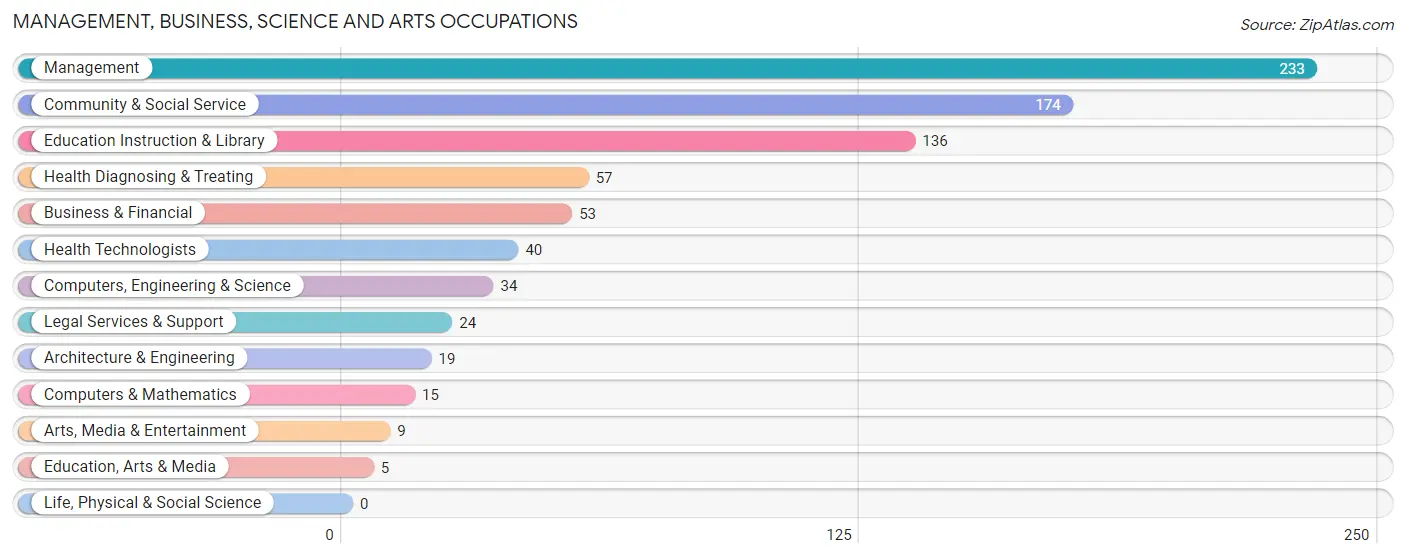
Management, Business, Science and Arts Occupations
The most common Management, Business, Science and Arts occupations in Pioneer Village are Management (233 | 17.9%), Community & Social Service (174 | 13.4%), Education Instruction & Library (136 | 10.4%), Health Diagnosing & Treating (57 | 4.4%), and Business & Financial (53 | 4.1%).
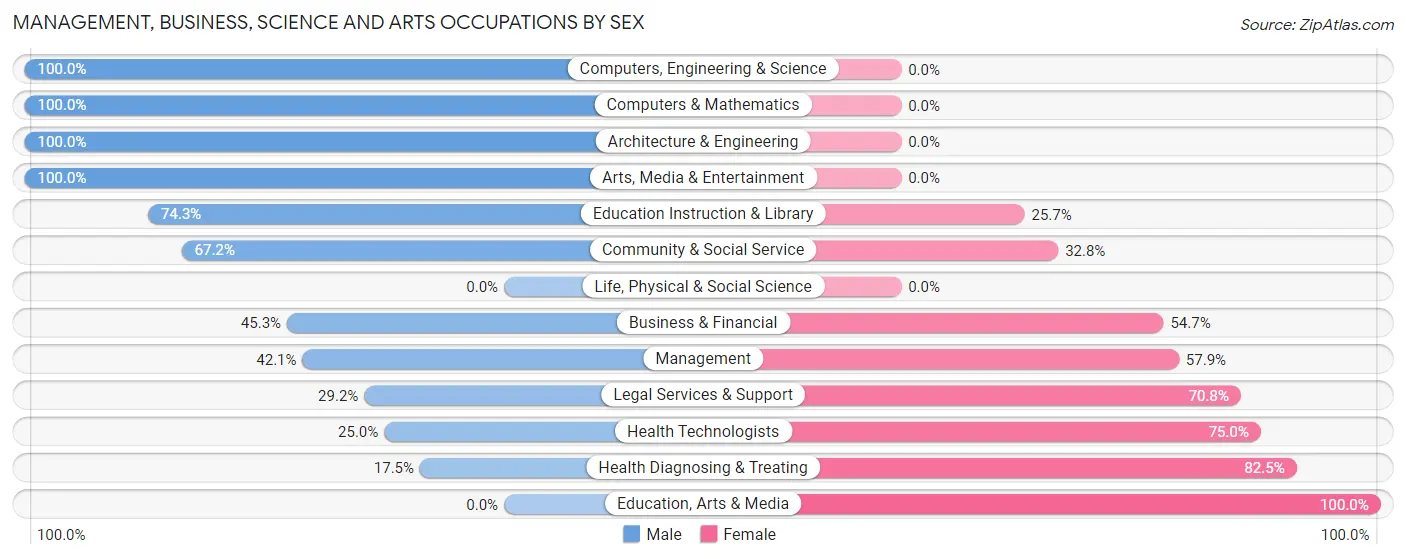
Management, Business, Science and Arts Occupations by Sex
Within the Management, Business, Science and Arts occupations in Pioneer Village, the most male-oriented occupations are Computers, Engineering & Science (100.0%), Computers & Mathematics (100.0%), and Architecture & Engineering (100.0%), while the most female-oriented occupations are Education, Arts & Media (100.0%), Health Diagnosing & Treating (82.5%), and Health Technologists (75.0%).
| Occupation | Male | Female |
| Management | 98 (42.1%) | 135 (57.9%) |
| Business & Financial | 24 (45.3%) | 29 (54.7%) |
| Computers, Engineering & Science | 34 (100.0%) | 0 (0.0%) |
| Computers & Mathematics | 15 (100.0%) | 0 (0.0%) |
| Architecture & Engineering | 19 (100.0%) | 0 (0.0%) |
| Life, Physical & Social Science | 0 (0.0%) | 0 (0.0%) |
| Community & Social Service | 117 (67.2%) | 57 (32.8%) |
| Education, Arts & Media | 0 (0.0%) | 5 (100.0%) |
| Legal Services & Support | 7 (29.2%) | 17 (70.8%) |
| Education Instruction & Library | 101 (74.3%) | 35 (25.7%) |
| Arts, Media & Entertainment | 9 (100.0%) | 0 (0.0%) |
| Health Diagnosing & Treating | 10 (17.5%) | 47 (82.5%) |
| Health Technologists | 10 (25.0%) | 30 (75.0%) |
| Total (Category) | 283 (51.4%) | 268 (48.6%) |
| Total (Overall) | 686 (52.6%) | 617 (47.3%) |
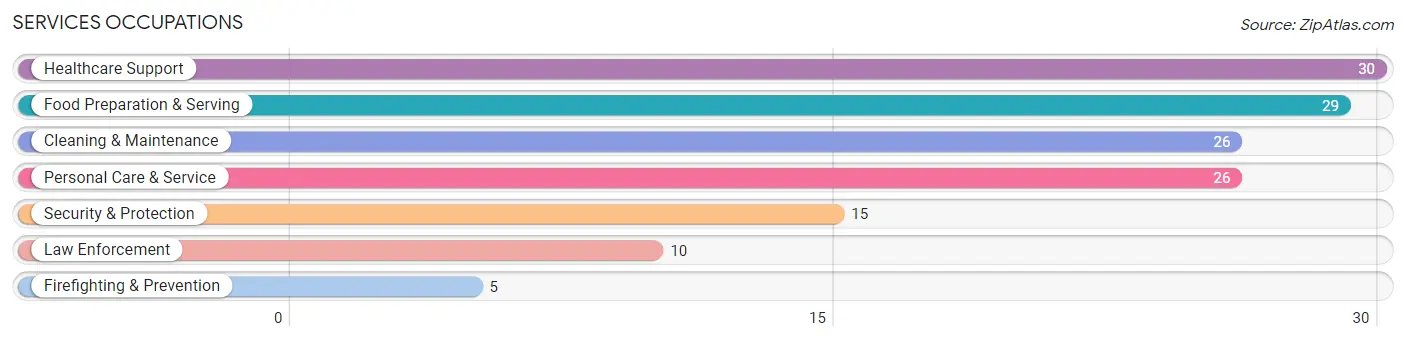
Services Occupations
The most common Services occupations in Pioneer Village are Healthcare Support (30 | 2.3%), Food Preparation & Serving (29 | 2.2%), Cleaning & Maintenance (26 | 2.0%), Personal Care & Service (26 | 2.0%), and Security & Protection (15 | 1.1%).
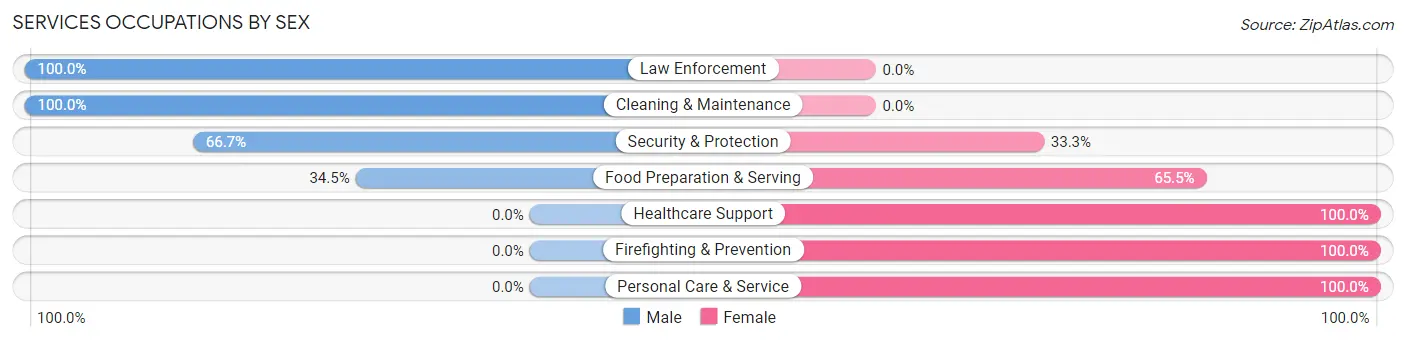
Services Occupations by Sex
Within the Services occupations in Pioneer Village, the most male-oriented occupations are Law Enforcement (100.0%), Cleaning & Maintenance (100.0%), and Security & Protection (66.7%), while the most female-oriented occupations are Healthcare Support (100.0%), Firefighting & Prevention (100.0%), and Personal Care & Service (100.0%).
| Occupation | Male | Female |
| Healthcare Support | 0 (0.0%) | 30 (100.0%) |
| Security & Protection | 10 (66.7%) | 5 (33.3%) |
| Firefighting & Prevention | 0 (0.0%) | 5 (100.0%) |
| Law Enforcement | 10 (100.0%) | 0 (0.0%) |
| Food Preparation & Serving | 10 (34.5%) | 19 (65.5%) |
| Cleaning & Maintenance | 26 (100.0%) | 0 (0.0%) |
| Personal Care & Service | 0 (0.0%) | 26 (100.0%) |
| Total (Category) | 46 (36.5%) | 80 (63.5%) |
| Total (Overall) | 686 (52.6%) | 617 (47.3%) |
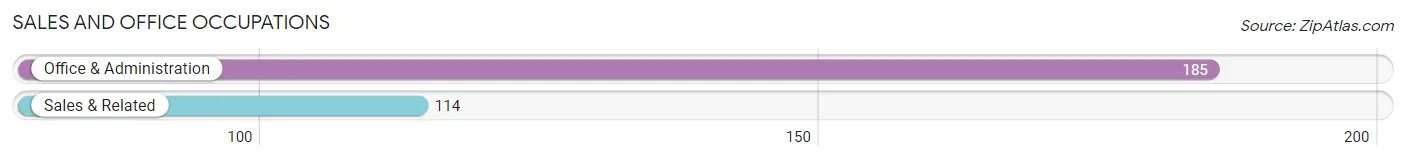
Sales and Office Occupations
The most common Sales and Office occupations in Pioneer Village are Office & Administration (185 | 14.2%), and Sales & Related (114 | 8.7%).
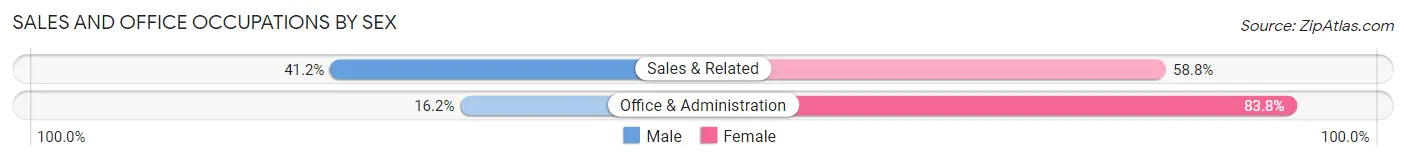
Sales and Office Occupations by Sex
| Occupation | Male | Female |
| Sales & Related | 47 (41.2%) | 67 (58.8%) |
| Office & Administration | 30 (16.2%) | 155 (83.8%) |
| Total (Category) | 77 (25.8%) | 222 (74.3%) |
| Total (Overall) | 686 (52.6%) | 617 (47.3%) |
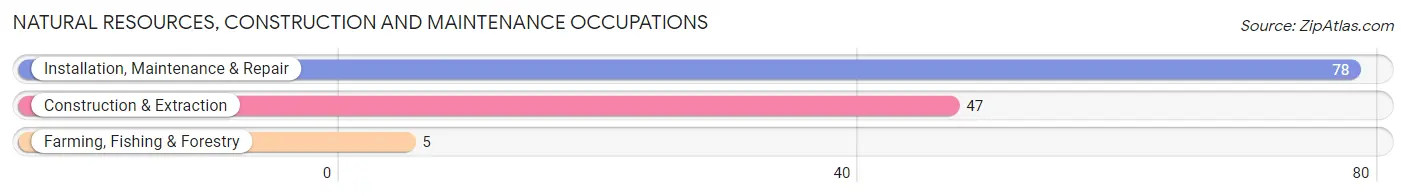
Natural Resources, Construction and Maintenance Occupations
The most common Natural Resources, Construction and Maintenance occupations in Pioneer Village are Installation, Maintenance & Repair (78 | 6.0%), Construction & Extraction (47 | 3.6%), and Farming, Fishing & Forestry (5 | 0.4%).
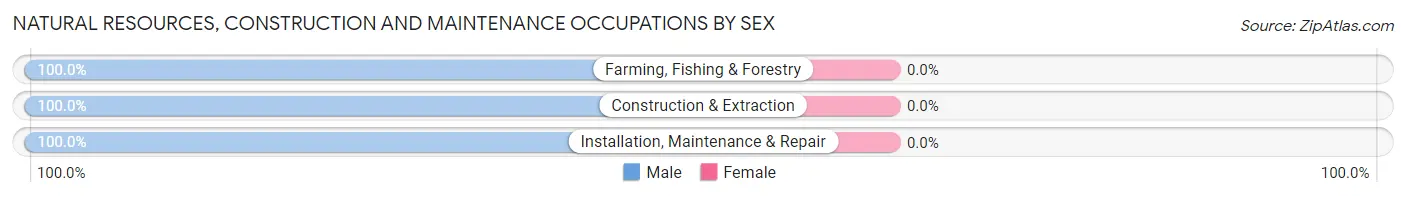
Natural Resources, Construction and Maintenance Occupations by Sex
| Occupation | Male | Female |
| Farming, Fishing & Forestry | 5 (100.0%) | 0 (0.0%) |
| Construction & Extraction | 47 (100.0%) | 0 (0.0%) |
| Installation, Maintenance & Repair | 78 (100.0%) | 0 (0.0%) |
| Total (Category) | 130 (100.0%) | 0 (0.0%) |
| Total (Overall) | 686 (52.6%) | 617 (47.3%) |
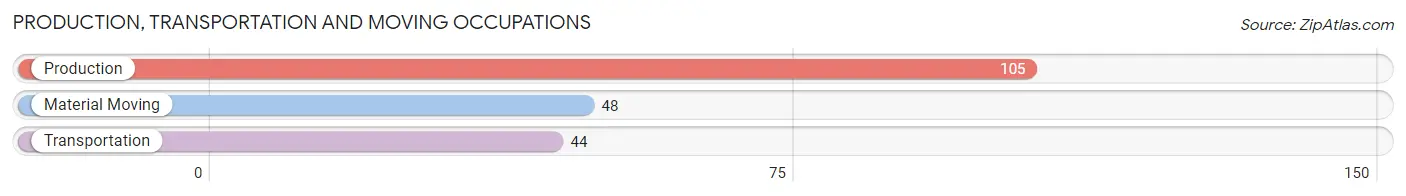
Production, Transportation and Moving Occupations
The most common Production, Transportation and Moving occupations in Pioneer Village are Production (105 | 8.1%), Material Moving (48 | 3.7%), and Transportation (44 | 3.4%).
Production, Transportation and Moving Occupations by Sex
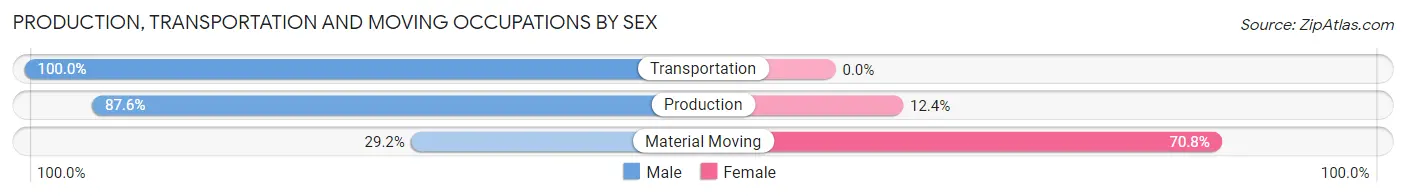
| Occupation | Male | Female |
| Production | 92 (87.6%) | 13 (12.4%) |
| Transportation | 44 (100.0%) | 0 (0.0%) |
| Material Moving | 14 (29.2%) | 34 (70.8%) |
| Total (Category) | 150 (76.1%) | 47 (23.9%) |
| Total (Overall) | 686 (52.6%) | 617 (47.3%) |
Employment Industries by Sex in Pioneer Village
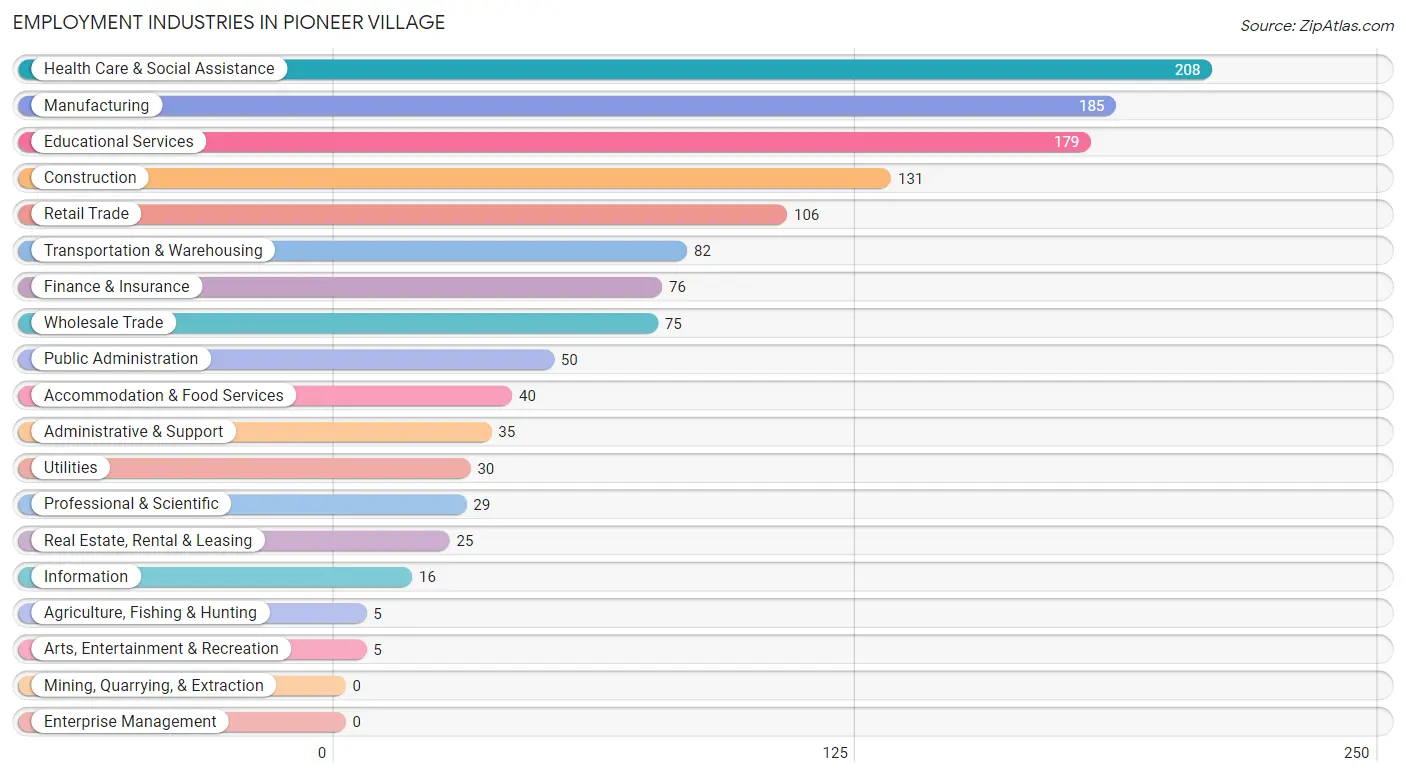
Employment Industries in Pioneer Village
The major employment industries in Pioneer Village include Health Care & Social Assistance (208 | 16.0%), Manufacturing (185 | 14.2%), Educational Services (179 | 13.7%), Construction (131 | 10.1%), and Retail Trade (106 | 8.1%).
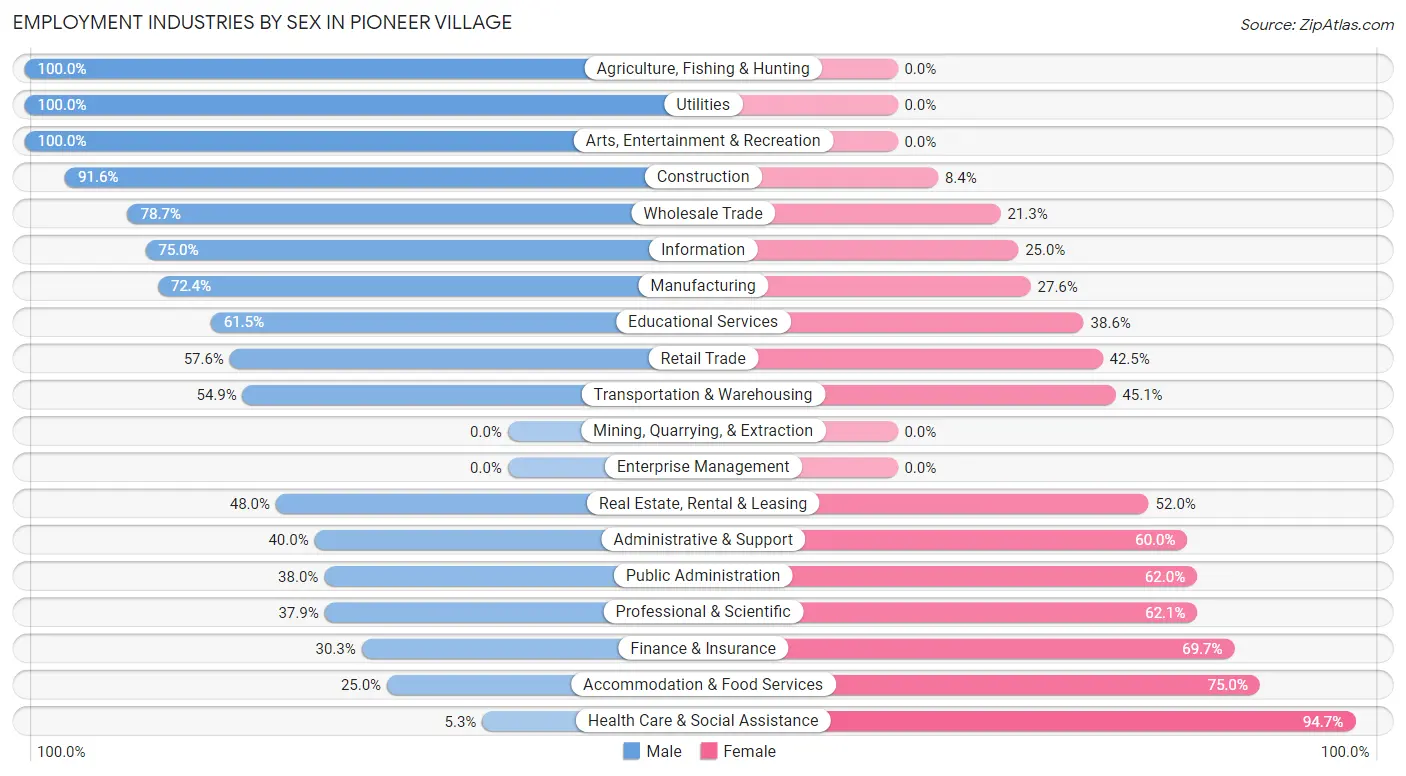
Employment Industries by Sex in Pioneer Village
The Pioneer Village industries that see more men than women are Agriculture, Fishing & Hunting (100.0%), Utilities (100.0%), and Arts, Entertainment & Recreation (100.0%), whereas the industries that tend to have a higher number of women are Health Care & Social Assistance (94.7%), Accommodation & Food Services (75.0%), and Finance & Insurance (69.7%).
| Industry | Male | Female |
| Agriculture, Fishing & Hunting | 5 (100.0%) | 0 (0.0%) |
| Mining, Quarrying, & Extraction | 0 (0.0%) | 0 (0.0%) |
| Construction | 120 (91.6%) | 11 (8.4%) |
| Manufacturing | 134 (72.4%) | 51 (27.6%) |
| Wholesale Trade | 59 (78.7%) | 16 (21.3%) |
| Retail Trade | 61 (57.6%) | 45 (42.4%) |
| Transportation & Warehousing | 45 (54.9%) | 37 (45.1%) |
| Utilities | 30 (100.0%) | 0 (0.0%) |
| Information | 12 (75.0%) | 4 (25.0%) |
| Finance & Insurance | 23 (30.3%) | 53 (69.7%) |
| Real Estate, Rental & Leasing | 12 (48.0%) | 13 (52.0%) |
| Professional & Scientific | 11 (37.9%) | 18 (62.1%) |
| Enterprise Management | 0 (0.0%) | 0 (0.0%) |
| Administrative & Support | 14 (40.0%) | 21 (60.0%) |
| Educational Services | 110 (61.5%) | 69 (38.6%) |
| Health Care & Social Assistance | 11 (5.3%) | 197 (94.7%) |
| Arts, Entertainment & Recreation | 5 (100.0%) | 0 (0.0%) |
| Accommodation & Food Services | 10 (25.0%) | 30 (75.0%) |
| Public Administration | 19 (38.0%) | 31 (62.0%) |
| Total | 686 (52.6%) | 617 (47.3%) |
Education in Pioneer Village
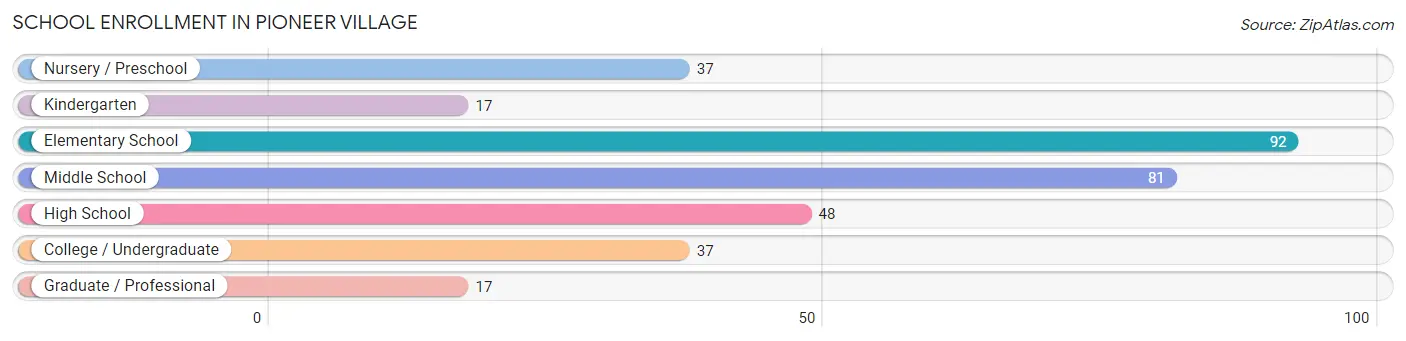
School Enrollment in Pioneer Village
The most common levels of schooling among the 329 students in Pioneer Village are elementary school (92 | 28.0%), middle school (81 | 24.6%), and high school (48 | 14.6%).
| School Level | # Students | % Students |
| Nursery / Preschool | 37 | 11.3% |
| Kindergarten | 17 | 5.2% |
| Elementary School | 92 | 28.0% |
| Middle School | 81 | 24.6% |
| High School | 48 | 14.6% |
| College / Undergraduate | 37 | 11.3% |
| Graduate / Professional | 17 | 5.2% |
| Total | 329 | 100.0% |
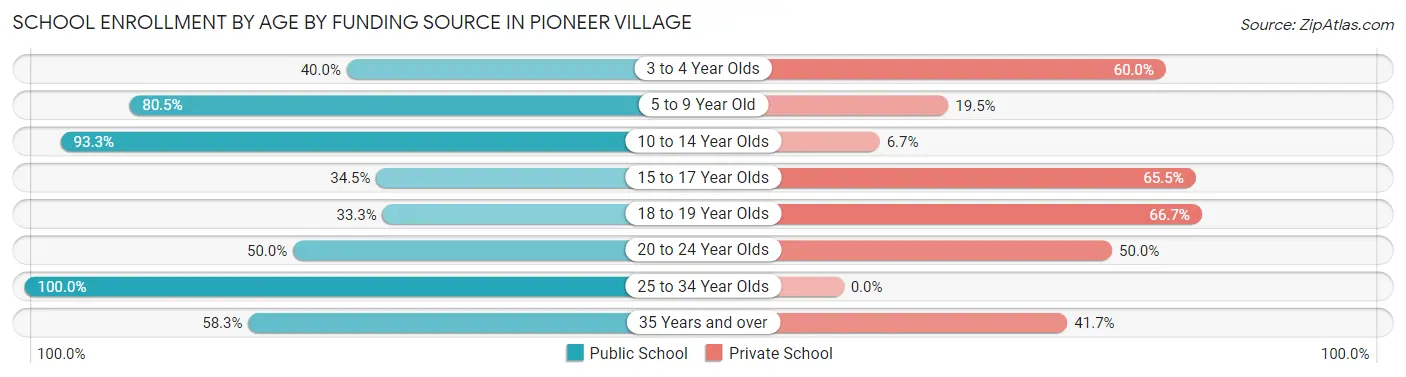
School Enrollment by Age by Funding Source in Pioneer Village
Out of a total of 329 students who are enrolled in schools in Pioneer Village, 82 (24.9%) attend a private institution, while the remaining 247 (75.1%) are enrolled in public schools. The age group of 18 to 19 year olds has the highest likelihood of being enrolled in private schools, with 12 (66.7% in the age bracket) enrolled. Conversely, the age group of 25 to 34 year olds has the lowest likelihood of being enrolled in a private school, with 17 (100.0% in the age bracket) attending a public institution.
| Age Bracket | Public School | Private School |
| 3 to 4 Year Olds | 10 (40.0%) | 15 (60.0%) |
| 5 to 9 Year Old | 66 (80.5%) | 16 (19.5%) |
| 10 to 14 Year Olds | 125 (93.3%) | 9 (6.7%) |
| 15 to 17 Year Olds | 10 (34.5%) | 19 (65.5%) |
| 18 to 19 Year Olds | 6 (33.3%) | 12 (66.7%) |
| 20 to 24 Year Olds | 6 (50.0%) | 6 (50.0%) |
| 25 to 34 Year Olds | 17 (100.0%) | 0 (0.0%) |
| 35 Years and over | 7 (58.3%) | 5 (41.7%) |
| Total | 247 (75.1%) | 82 (24.9%) |
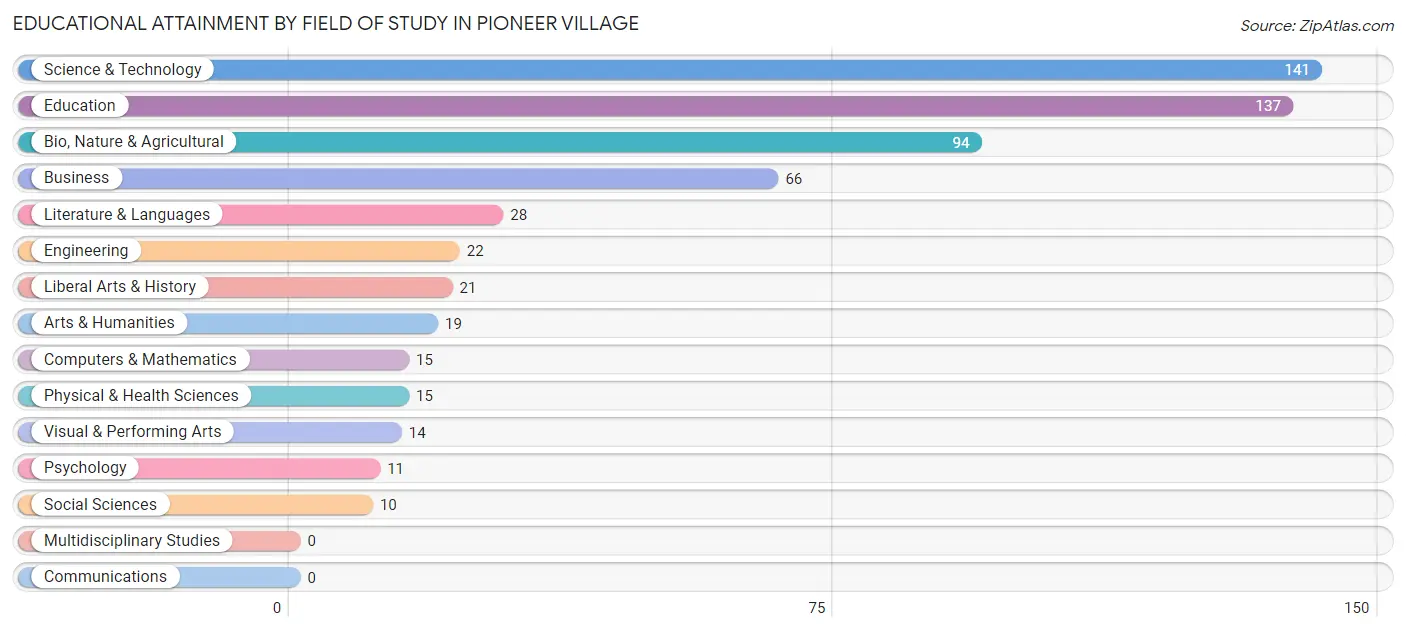
Educational Attainment by Field of Study in Pioneer Village
Science & technology (141 | 23.8%), education (137 | 23.1%), bio, nature & agricultural (94 | 15.9%), business (66 | 11.1%), and literature & languages (28 | 4.7%) are the most common fields of study among 593 individuals in Pioneer Village who have obtained a bachelor's degree or higher.
| Field of Study | # Graduates | % Graduates |
| Computers & Mathematics | 15 | 2.5% |
| Bio, Nature & Agricultural | 94 | 15.9% |
| Physical & Health Sciences | 15 | 2.5% |
| Psychology | 11 | 1.8% |
| Social Sciences | 10 | 1.7% |
| Engineering | 22 | 3.7% |
| Multidisciplinary Studies | 0 | 0.0% |
| Science & Technology | 141 | 23.8% |
| Business | 66 | 11.1% |
| Education | 137 | 23.1% |
| Literature & Languages | 28 | 4.7% |
| Liberal Arts & History | 21 | 3.5% |
| Visual & Performing Arts | 14 | 2.4% |
| Communications | 0 | 0.0% |
| Arts & Humanities | 19 | 3.2% |
| Total | 593 | 100.0% |
Transportation & Commute in Pioneer Village
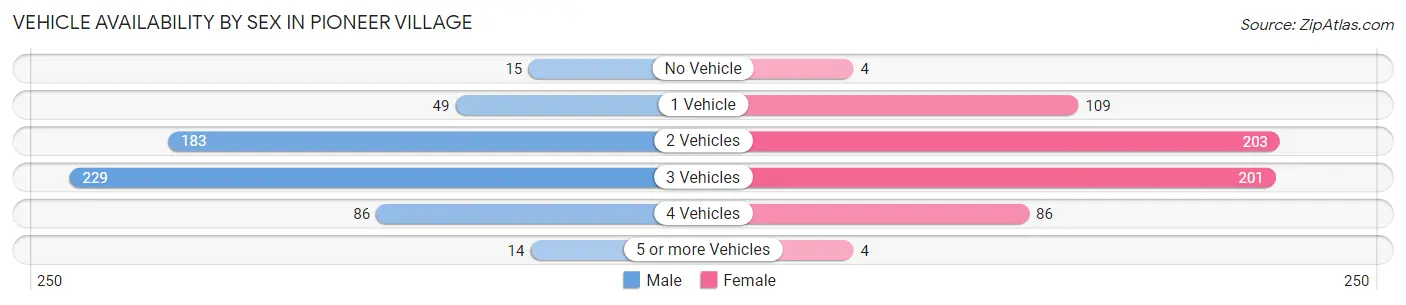
Vehicle Availability by Sex in Pioneer Village
The most prevalent vehicle ownership categories in Pioneer Village are males with 3 vehicles (229, accounting for 39.8%) and females with 3 vehicles (201, making up 37.7%).
| Vehicles Available | Male | Female |
| No Vehicle | 15 (2.6%) | 4 (0.7%) |
| 1 Vehicle | 49 (8.5%) | 109 (18.0%) |
| 2 Vehicles | 183 (31.8%) | 203 (33.4%) |
| 3 Vehicles | 229 (39.8%) | 201 (33.1%) |
| 4 Vehicles | 86 (14.9%) | 86 (14.2%) |
| 5 or more Vehicles | 14 (2.4%) | 4 (0.7%) |
| Total | 576 (100.0%) | 607 (100.0%) |
Commute Time in Pioneer Village
The most frequently occuring commute durations in Pioneer Village are 30 to 34 minutes (276 commuters, 25.6%), 20 to 24 minutes (203 commuters, 18.9%), and 15 to 19 minutes (168 commuters, 15.6%).
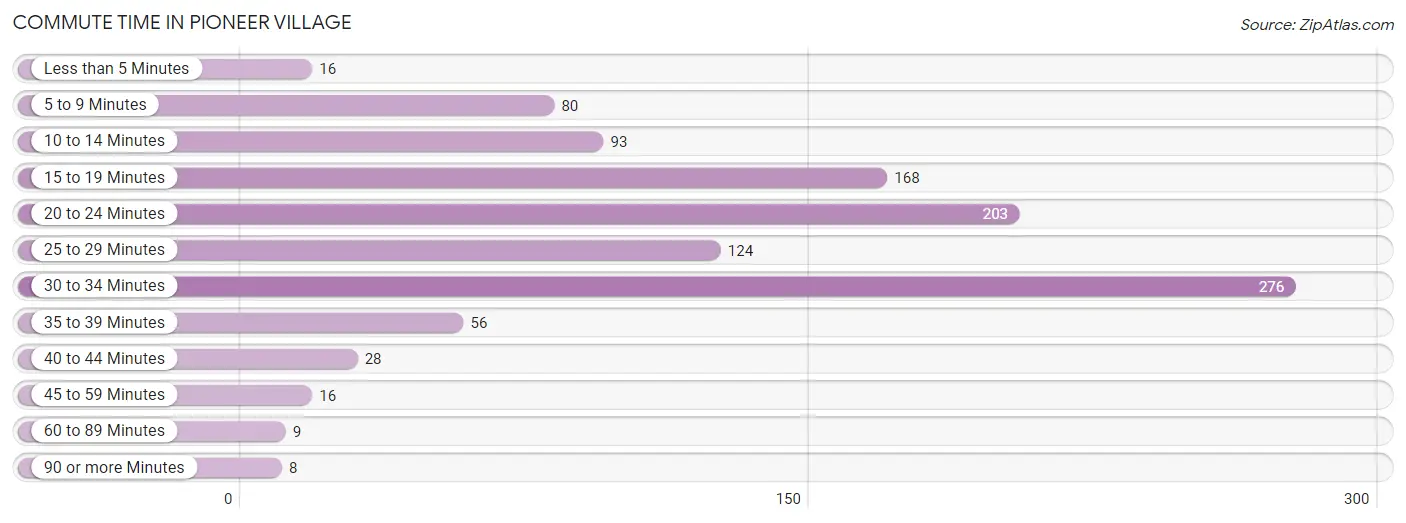
| Commute Time | # Commuters | % Commuters |
| Less than 5 Minutes | 16 | 1.5% |
| 5 to 9 Minutes | 80 | 7.4% |
| 10 to 14 Minutes | 93 | 8.6% |
| 15 to 19 Minutes | 168 | 15.6% |
| 20 to 24 Minutes | 203 | 18.9% |
| 25 to 29 Minutes | 124 | 11.5% |
| 30 to 34 Minutes | 276 | 25.6% |
| 35 to 39 Minutes | 56 | 5.2% |
| 40 to 44 Minutes | 28 | 2.6% |
| 45 to 59 Minutes | 16 | 1.5% |
| 60 to 89 Minutes | 9 | 0.8% |
| 90 or more Minutes | 8 | 0.7% |
Commute Time by Sex in Pioneer Village
The most common commute times in Pioneer Village are 20 to 24 minutes (136 commuters, 24.3%) for males and 30 to 34 minutes (226 commuters, 43.6%) for females.
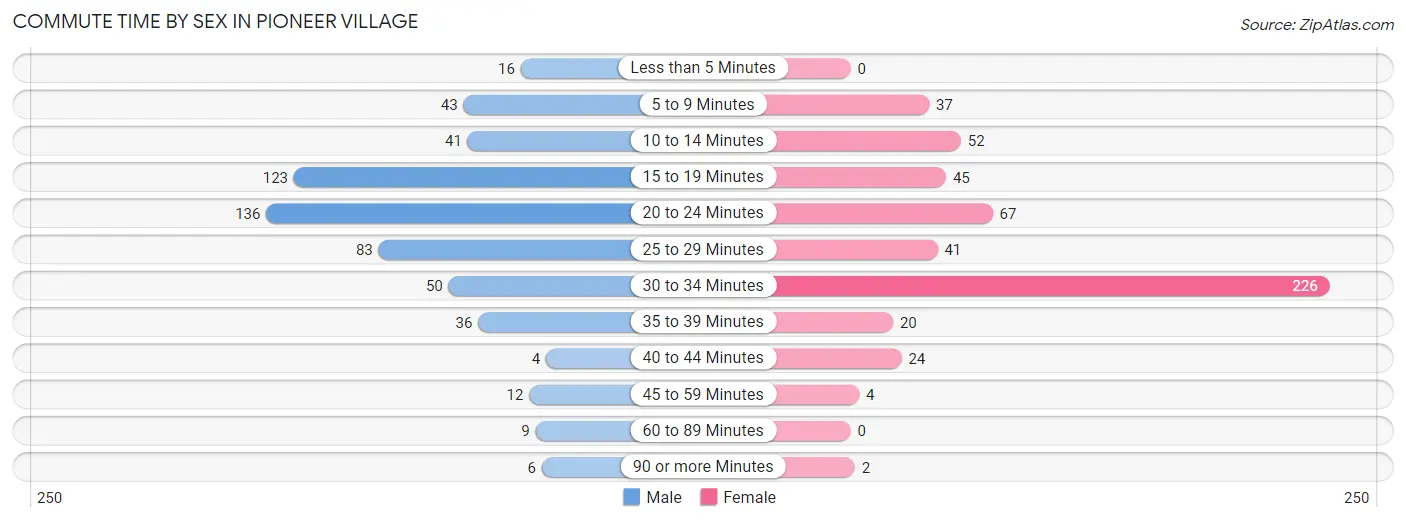
| Commute Time | Male | Female |
| Less than 5 Minutes | 16 (2.9%) | 0 (0.0%) |
| 5 to 9 Minutes | 43 (7.7%) | 37 (7.1%) |
| 10 to 14 Minutes | 41 (7.3%) | 52 (10.0%) |
| 15 to 19 Minutes | 123 (22.0%) | 45 (8.7%) |
| 20 to 24 Minutes | 136 (24.3%) | 67 (12.9%) |
| 25 to 29 Minutes | 83 (14.8%) | 41 (7.9%) |
| 30 to 34 Minutes | 50 (8.9%) | 226 (43.6%) |
| 35 to 39 Minutes | 36 (6.4%) | 20 (3.9%) |
| 40 to 44 Minutes | 4 (0.7%) | 24 (4.6%) |
| 45 to 59 Minutes | 12 (2.1%) | 4 (0.8%) |
| 60 to 89 Minutes | 9 (1.6%) | 0 (0.0%) |
| 90 or more Minutes | 6 (1.1%) | 2 (0.4%) |
Time of Departure to Work by Sex in Pioneer Village
The most frequent times of departure to work in Pioneer Village are 6:30 AM to 6:59 AM (110, 19.7%) for males and 7:30 AM to 7:59 AM (183, 35.3%) for females.
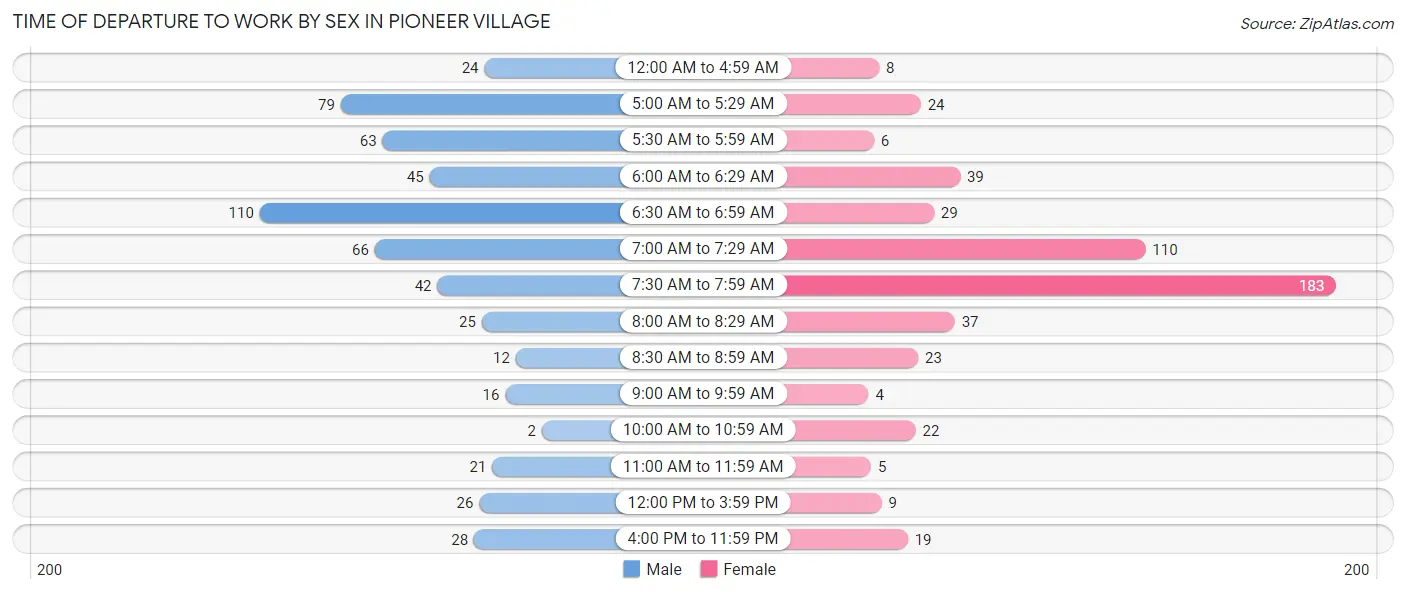
| Time of Departure | Male | Female |
| 12:00 AM to 4:59 AM | 24 (4.3%) | 8 (1.5%) |
| 5:00 AM to 5:29 AM | 79 (14.1%) | 24 (4.6%) |
| 5:30 AM to 5:59 AM | 63 (11.3%) | 6 (1.2%) |
| 6:00 AM to 6:29 AM | 45 (8.1%) | 39 (7.5%) |
| 6:30 AM to 6:59 AM | 110 (19.7%) | 29 (5.6%) |
| 7:00 AM to 7:29 AM | 66 (11.8%) | 110 (21.2%) |
| 7:30 AM to 7:59 AM | 42 (7.5%) | 183 (35.3%) |
| 8:00 AM to 8:29 AM | 25 (4.5%) | 37 (7.1%) |
| 8:30 AM to 8:59 AM | 12 (2.1%) | 23 (4.4%) |
| 9:00 AM to 9:59 AM | 16 (2.9%) | 4 (0.8%) |
| 10:00 AM to 10:59 AM | 2 (0.4%) | 22 (4.3%) |
| 11:00 AM to 11:59 AM | 21 (3.8%) | 5 (1.0%) |
| 12:00 PM to 3:59 PM | 26 (4.6%) | 9 (1.7%) |
| 4:00 PM to 11:59 PM | 28 (5.0%) | 19 (3.7%) |
| Total | 559 (100.0%) | 518 (100.0%) |
Housing Occupancy in Pioneer Village
Occupancy by Ownership in Pioneer Village
Of the total 1,035 dwellings in Pioneer Village, owner-occupied units account for 941 (90.9%), while renter-occupied units make up 94 (9.1%).
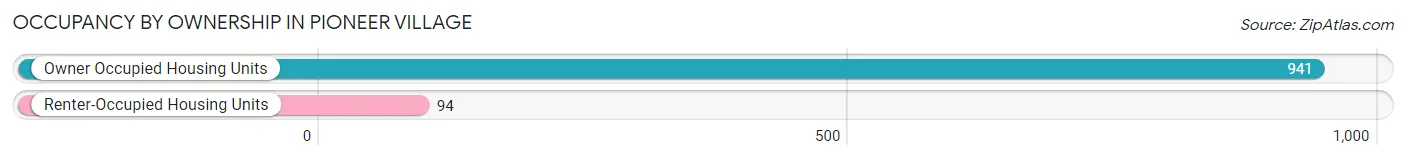
| Occupancy | # Housing Units | % Housing Units |
| Owner Occupied Housing Units | 941 | 90.9% |
| Renter-Occupied Housing Units | 94 | 9.1% |
| Total Occupied Housing Units | 1,035 | 100.0% |
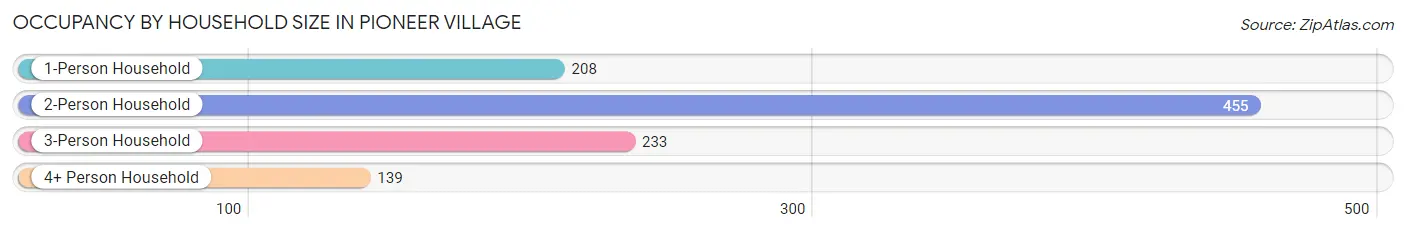
Occupancy by Household Size in Pioneer Village
| Household Size | # Housing Units | % Housing Units |
| 1-Person Household | 208 | 20.1% |
| 2-Person Household | 455 | 44.0% |
| 3-Person Household | 233 | 22.5% |
| 4+ Person Household | 139 | 13.4% |
| Total Housing Units | 1,035 | 100.0% |
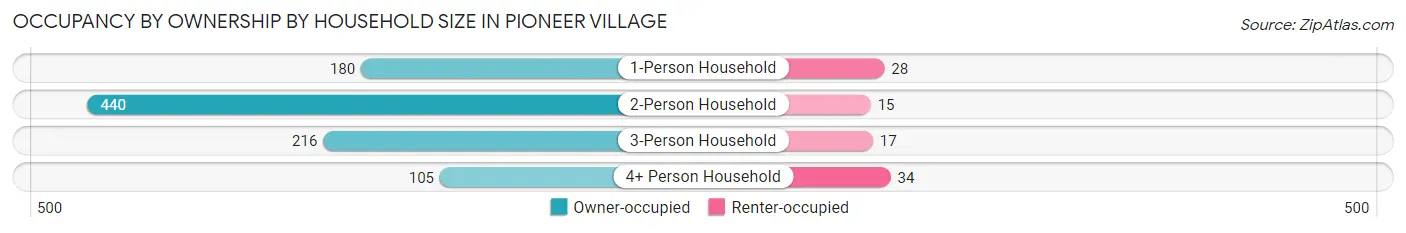
Occupancy by Ownership by Household Size in Pioneer Village
| Household Size | Owner-occupied | Renter-occupied |
| 1-Person Household | 180 (86.5%) | 28 (13.5%) |
| 2-Person Household | 440 (96.7%) | 15 (3.3%) |
| 3-Person Household | 216 (92.7%) | 17 (7.3%) |
| 4+ Person Household | 105 (75.5%) | 34 (24.5%) |
| Total Housing Units | 941 (90.9%) | 94 (9.1%) |
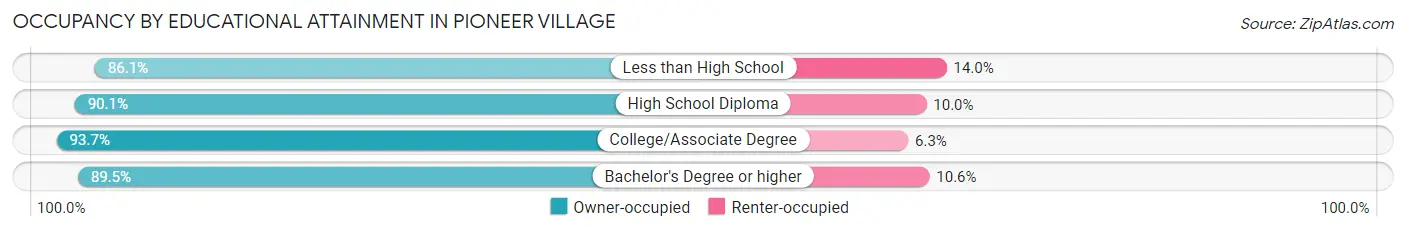
Occupancy by Educational Attainment in Pioneer Village
| Household Size | Owner-occupied | Renter-occupied |
| Less than High School | 37 (86.1%) | 6 (14.0%) |
| High School Diploma | 398 (90.0%) | 44 (10.0%) |
| College/Associate Degree | 311 (93.7%) | 21 (6.3%) |
| Bachelor's Degree or higher | 195 (89.4%) | 23 (10.5%) |
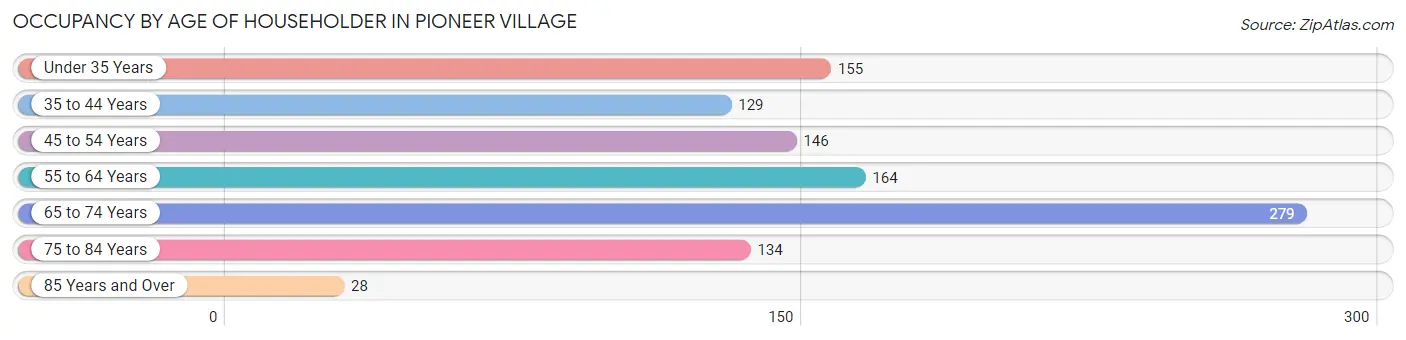
Occupancy by Age of Householder in Pioneer Village
| Age Bracket | # Households | % Households |
| Under 35 Years | 155 | 15.0% |
| 35 to 44 Years | 129 | 12.5% |
| 45 to 54 Years | 146 | 14.1% |
| 55 to 64 Years | 164 | 15.9% |
| 65 to 74 Years | 279 | 27.0% |
| 75 to 84 Years | 134 | 13.0% |
| 85 Years and Over | 28 | 2.7% |
| Total | 1,035 | 100.0% |
Housing Finances in Pioneer Village
Median Income by Occupancy in Pioneer Village
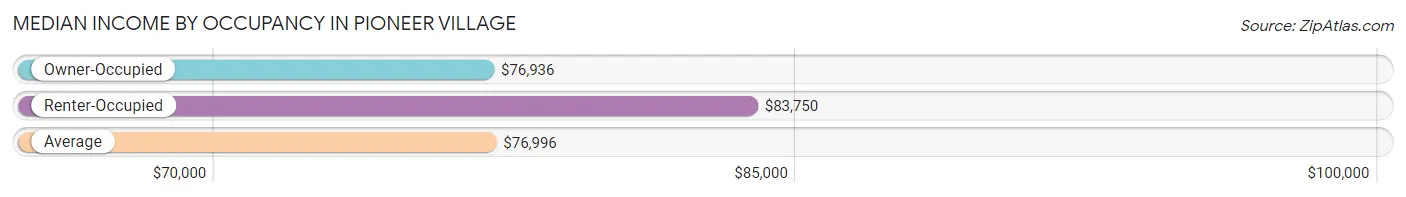
| Occupancy Type | # Households | Median Income |
| Owner-Occupied | 941 (90.9%) | $76,936 |
| Renter-Occupied | 94 (9.1%) | $83,750 |
| Average | 1,035 (100.0%) | $76,996 |
Occupancy by Householder Income Bracket in Pioneer Village
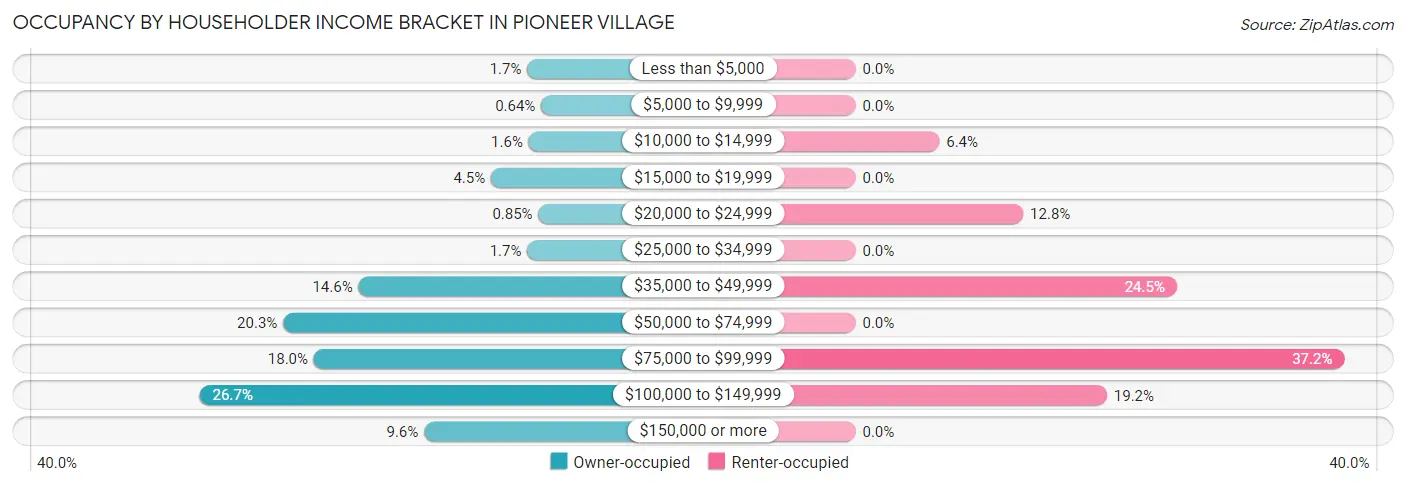
| Income Bracket | Owner-occupied | Renter-occupied |
| Less than $5,000 | 16 (1.7%) | 0 (0.0%) |
| $5,000 to $9,999 | 6 (0.6%) | 0 (0.0%) |
| $10,000 to $14,999 | 15 (1.6%) | 6 (6.4%) |
| $15,000 to $19,999 | 42 (4.5%) | 0 (0.0%) |
| $20,000 to $24,999 | 8 (0.9%) | 12 (12.8%) |
| $25,000 to $34,999 | 16 (1.7%) | 0 (0.0%) |
| $35,000 to $49,999 | 137 (14.6%) | 23 (24.5%) |
| $50,000 to $74,999 | 191 (20.3%) | 0 (0.0%) |
| $75,000 to $99,999 | 169 (18.0%) | 35 (37.2%) |
| $100,000 to $149,999 | 251 (26.7%) | 18 (19.2%) |
| $150,000 or more | 90 (9.6%) | 0 (0.0%) |
| Total | 941 (100.0%) | 94 (100.0%) |
Monthly Housing Cost Tiers in Pioneer Village
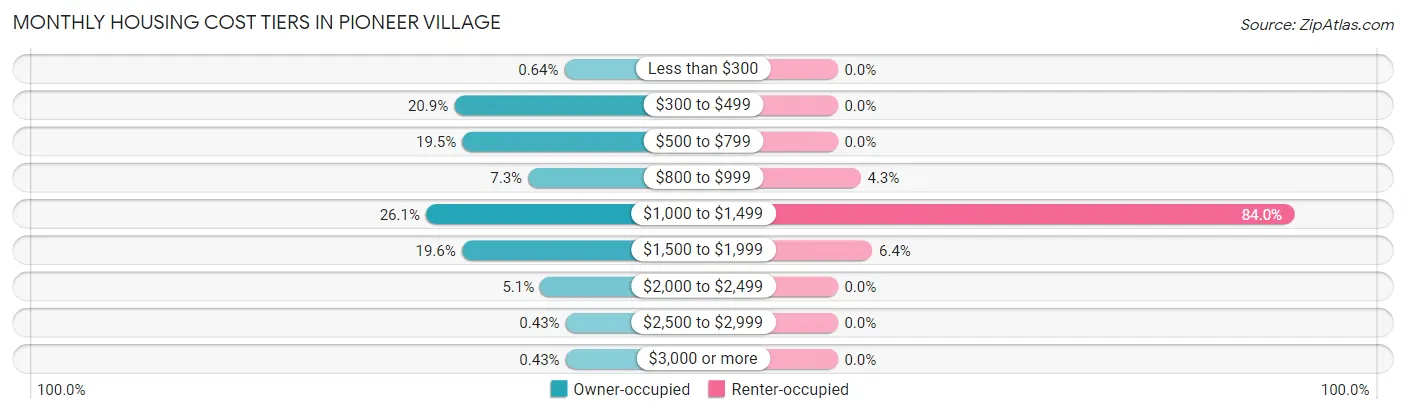
| Monthly Cost | Owner-occupied | Renter-occupied |
| Less than $300 | 6 (0.6%) | 0 (0.0%) |
| $300 to $499 | 197 (20.9%) | 0 (0.0%) |
| $500 to $799 | 183 (19.5%) | 0 (0.0%) |
| $800 to $999 | 69 (7.3%) | 4 (4.3%) |
| $1,000 to $1,499 | 246 (26.1%) | 79 (84.0%) |
| $1,500 to $1,999 | 184 (19.6%) | 6 (6.4%) |
| $2,000 to $2,499 | 48 (5.1%) | 0 (0.0%) |
| $2,500 to $2,999 | 4 (0.4%) | 0 (0.0%) |
| $3,000 or more | 4 (0.4%) | 0 (0.0%) |
| Total | 941 (100.0%) | 94 (100.0%) |
Physical Housing Characteristics in Pioneer Village
Housing Structures in Pioneer Village
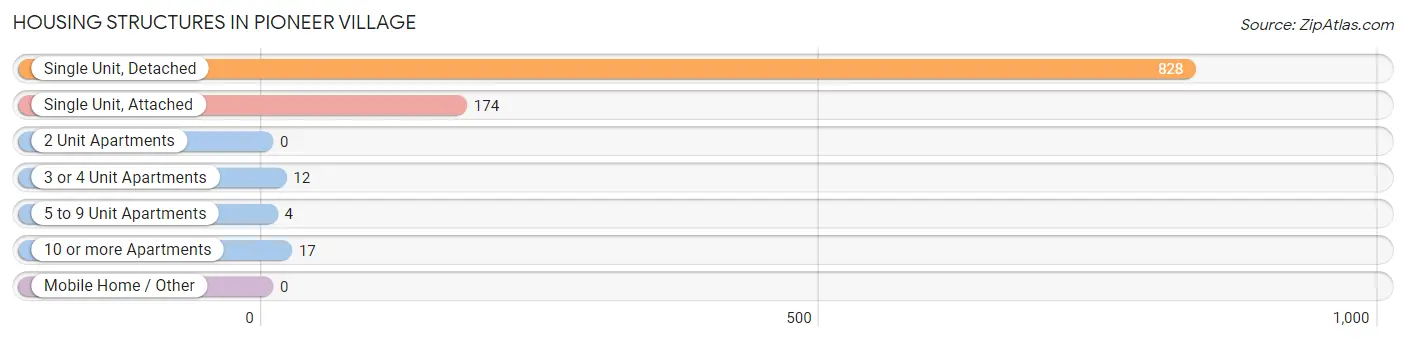
| Structure Type | # Housing Units | % Housing Units |
| Single Unit, Detached | 828 | 80.0% |
| Single Unit, Attached | 174 | 16.8% |
| 2 Unit Apartments | 0 | 0.0% |
| 3 or 4 Unit Apartments | 12 | 1.2% |
| 5 to 9 Unit Apartments | 4 | 0.4% |
| 10 or more Apartments | 17 | 1.6% |
| Mobile Home / Other | 0 | 0.0% |
| Total | 1,035 | 100.0% |
Housing Structures by Occupancy in Pioneer Village
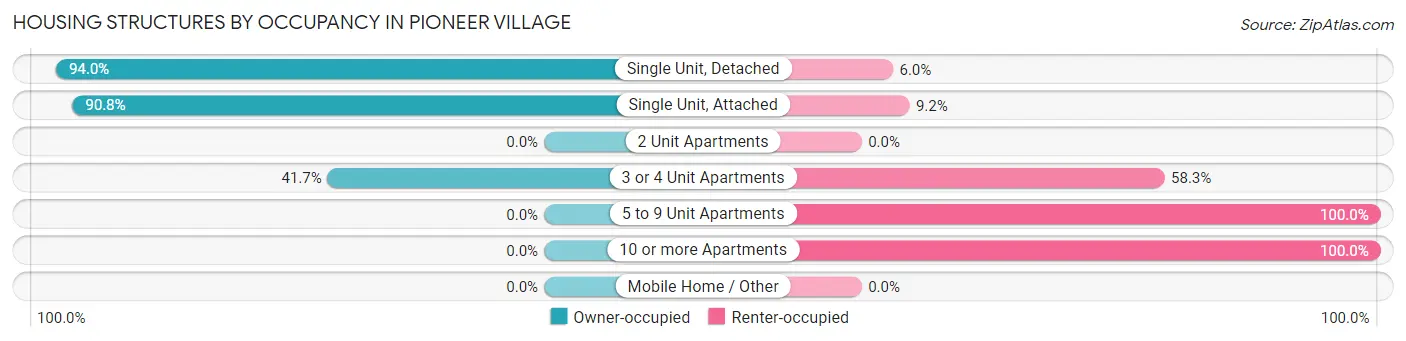
| Structure Type | Owner-occupied | Renter-occupied |
| Single Unit, Detached | 778 (94.0%) | 50 (6.0%) |
| Single Unit, Attached | 158 (90.8%) | 16 (9.2%) |
| 2 Unit Apartments | 0 (0.0%) | 0 (0.0%) |
| 3 or 4 Unit Apartments | 5 (41.7%) | 7 (58.3%) |
| 5 to 9 Unit Apartments | 0 (0.0%) | 4 (100.0%) |
| 10 or more Apartments | 0 (0.0%) | 17 (100.0%) |
| Mobile Home / Other | 0 (0.0%) | 0 (0.0%) |
| Total | 941 (90.9%) | 94 (9.1%) |
Housing Structures by Number of Rooms in Pioneer Village
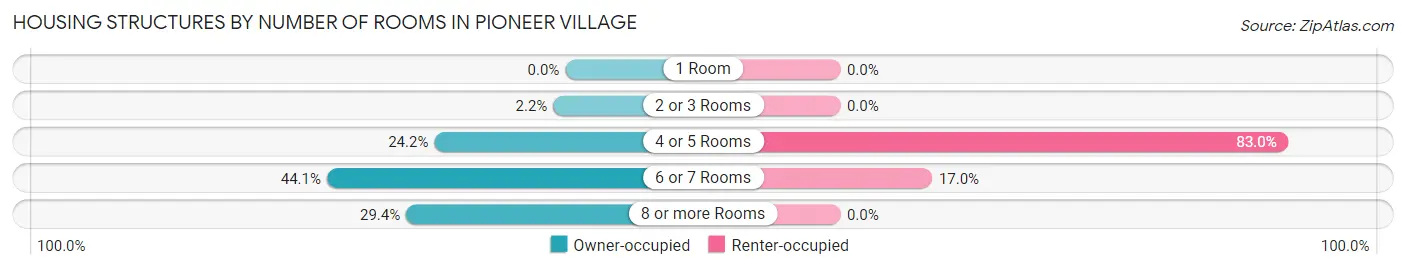
| Number of Rooms | Owner-occupied | Renter-occupied |
| 1 Room | 0 (0.0%) | 0 (0.0%) |
| 2 or 3 Rooms | 21 (2.2%) | 0 (0.0%) |
| 4 or 5 Rooms | 228 (24.2%) | 78 (83.0%) |
| 6 or 7 Rooms | 415 (44.1%) | 16 (17.0%) |
| 8 or more Rooms | 277 (29.4%) | 0 (0.0%) |
| Total | 941 (100.0%) | 94 (100.0%) |
Housing Structure by Heating Type in Pioneer Village
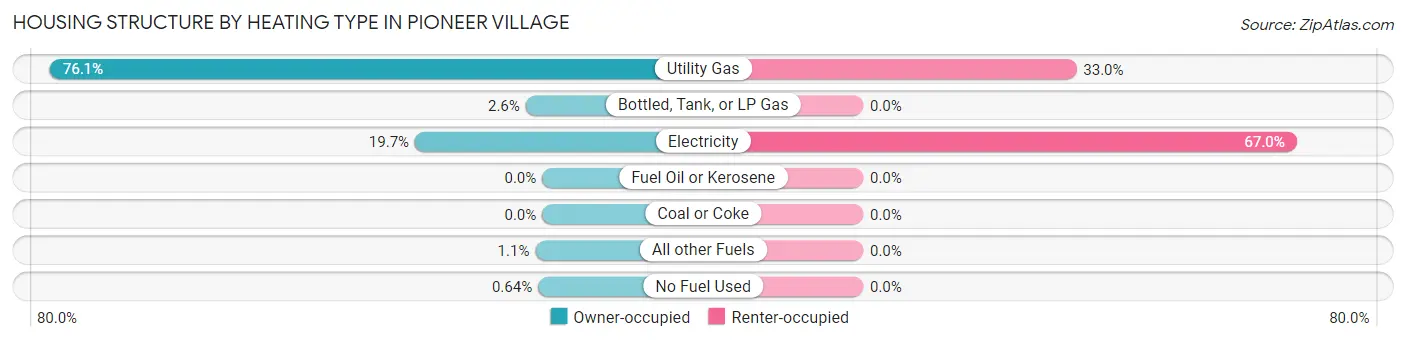
| Heating Type | Owner-occupied | Renter-occupied |
| Utility Gas | 716 (76.1%) | 31 (33.0%) |
| Bottled, Tank, or LP Gas | 24 (2.5%) | 0 (0.0%) |
| Electricity | 185 (19.7%) | 63 (67.0%) |
| Fuel Oil or Kerosene | 0 (0.0%) | 0 (0.0%) |
| Coal or Coke | 0 (0.0%) | 0 (0.0%) |
| All other Fuels | 10 (1.1%) | 0 (0.0%) |
| No Fuel Used | 6 (0.6%) | 0 (0.0%) |
| Total | 941 (100.0%) | 94 (100.0%) |
Household Vehicle Usage in Pioneer Village
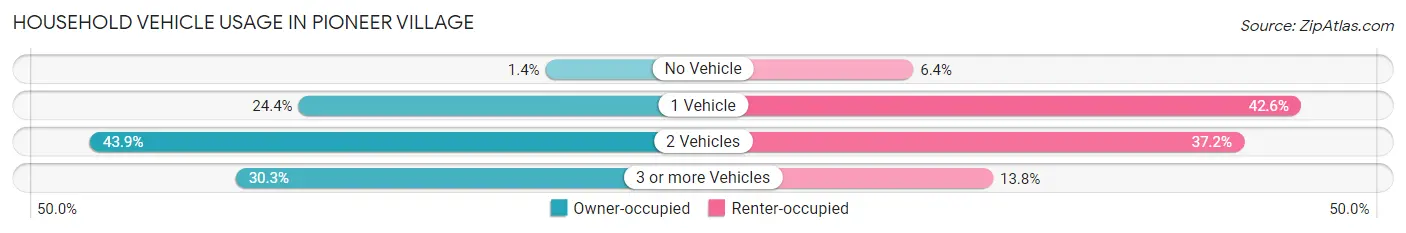
| Vehicles per Household | Owner-occupied | Renter-occupied |
| No Vehicle | 13 (1.4%) | 6 (6.4%) |
| 1 Vehicle | 230 (24.4%) | 40 (42.5%) |
| 2 Vehicles | 413 (43.9%) | 35 (37.2%) |
| 3 or more Vehicles | 285 (30.3%) | 13 (13.8%) |
| Total | 941 (100.0%) | 94 (100.0%) |
Real Estate & Mortgages in Pioneer Village
Real Estate and Mortgage Overview in Pioneer Village
| Characteristic | Without Mortgage | With Mortgage |
| Housing Units | 377 | 564 |
| Median Property Value | $240,300 | $209,500 |
| Median Household Income | $60,489 | $66 |
| Monthly Housing Costs | $493 | $4 |
| Real Estate Taxes | $2,066 | $11 |
Property Value by Mortgage Status in Pioneer Village
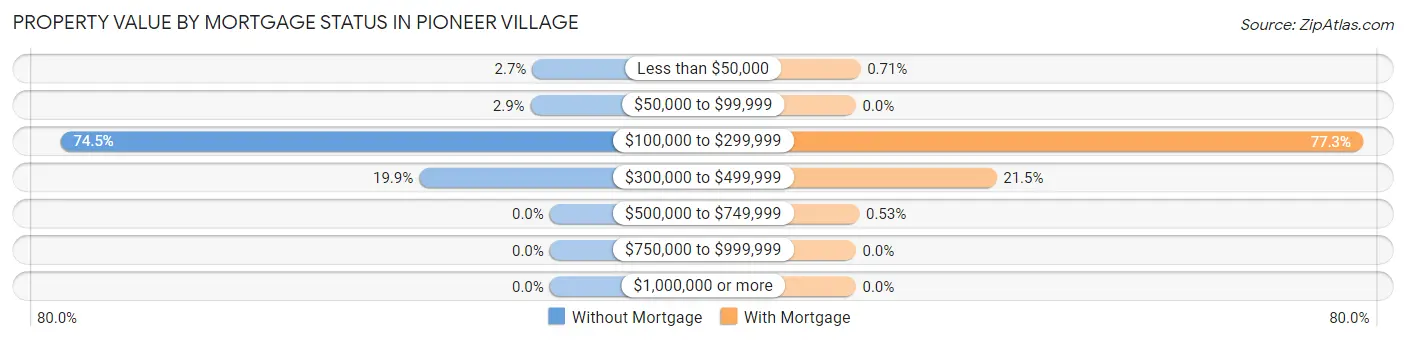
| Property Value | Without Mortgage | With Mortgage |
| Less than $50,000 | 10 (2.6%) | 4 (0.7%) |
| $50,000 to $99,999 | 11 (2.9%) | 0 (0.0%) |
| $100,000 to $299,999 | 281 (74.5%) | 436 (77.3%) |
| $300,000 to $499,999 | 75 (19.9%) | 121 (21.4%) |
| $500,000 to $749,999 | 0 (0.0%) | 3 (0.5%) |
| $750,000 to $999,999 | 0 (0.0%) | 0 (0.0%) |
| $1,000,000 or more | 0 (0.0%) | 0 (0.0%) |
| Total | 377 (100.0%) | 564 (100.0%) |
Household Income by Mortgage Status in Pioneer Village
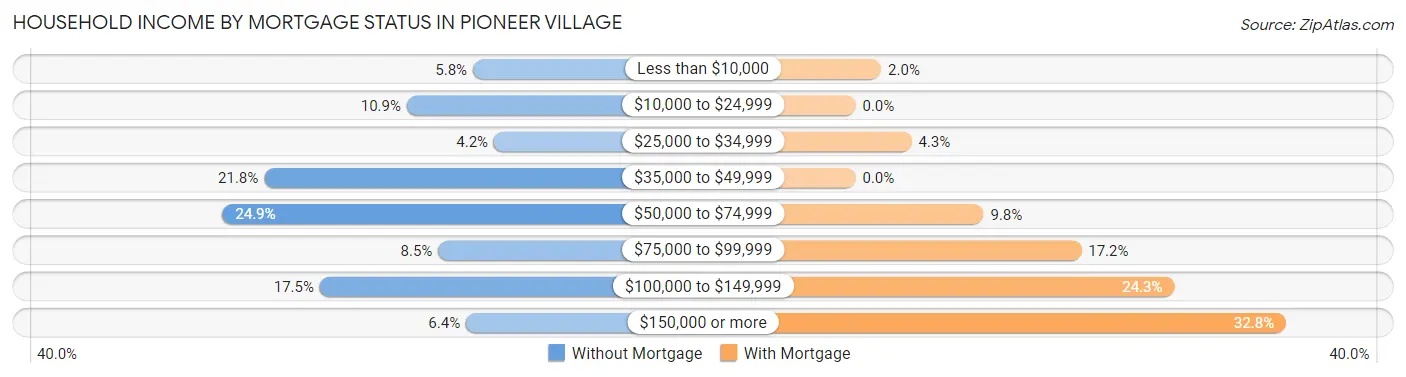
| Household Income | Without Mortgage | With Mortgage |
| Less than $10,000 | 22 (5.8%) | 11 (1.9%) |
| $10,000 to $24,999 | 41 (10.9%) | 0 (0.0%) |
| $25,000 to $34,999 | 16 (4.2%) | 24 (4.3%) |
| $35,000 to $49,999 | 82 (21.7%) | 0 (0.0%) |
| $50,000 to $74,999 | 94 (24.9%) | 55 (9.8%) |
| $75,000 to $99,999 | 32 (8.5%) | 97 (17.2%) |
| $100,000 to $149,999 | 66 (17.5%) | 137 (24.3%) |
| $150,000 or more | 24 (6.4%) | 185 (32.8%) |
| Total | 377 (100.0%) | 564 (100.0%) |
Property Value to Household Income Ratio in Pioneer Village
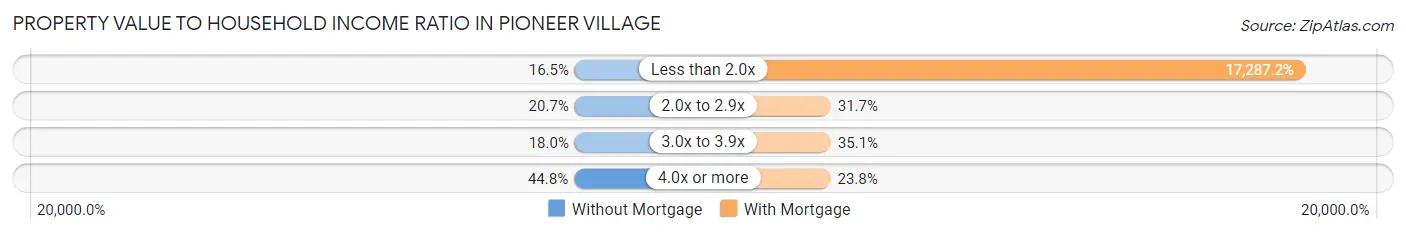
| Value-to-Income Ratio | Without Mortgage | With Mortgage |
| Less than 2.0x | 62 (16.5%) | 97,500 (17,287.2%) |
| 2.0x to 2.9x | 78 (20.7%) | 179 (31.7%) |
| 3.0x to 3.9x | 68 (18.0%) | 198 (35.1%) |
| 4.0x or more | 169 (44.8%) | 134 (23.8%) |
| Total | 377 (100.0%) | 564 (100.0%) |
Real Estate Taxes by Mortgage Status in Pioneer Village
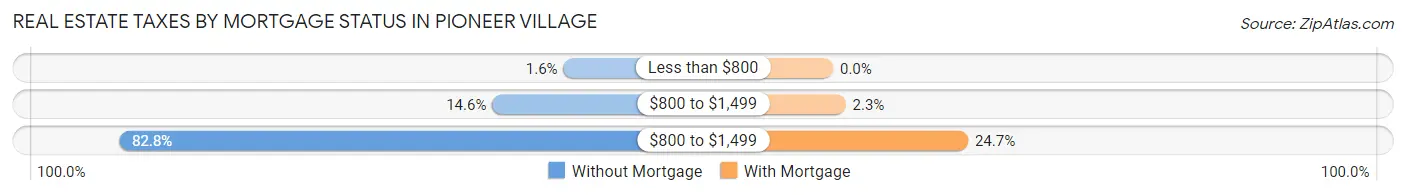
| Property Taxes | Without Mortgage | With Mortgage |
| Less than $800 | 6 (1.6%) | 0 (0.0%) |
| $800 to $1,499 | 55 (14.6%) | 13 (2.3%) |
| $800 to $1,499 | 312 (82.8%) | 139 (24.6%) |
| Total | 377 (100.0%) | 564 (100.0%) |
Health & Disability in Pioneer Village
Health Insurance Coverage by Age in Pioneer Village
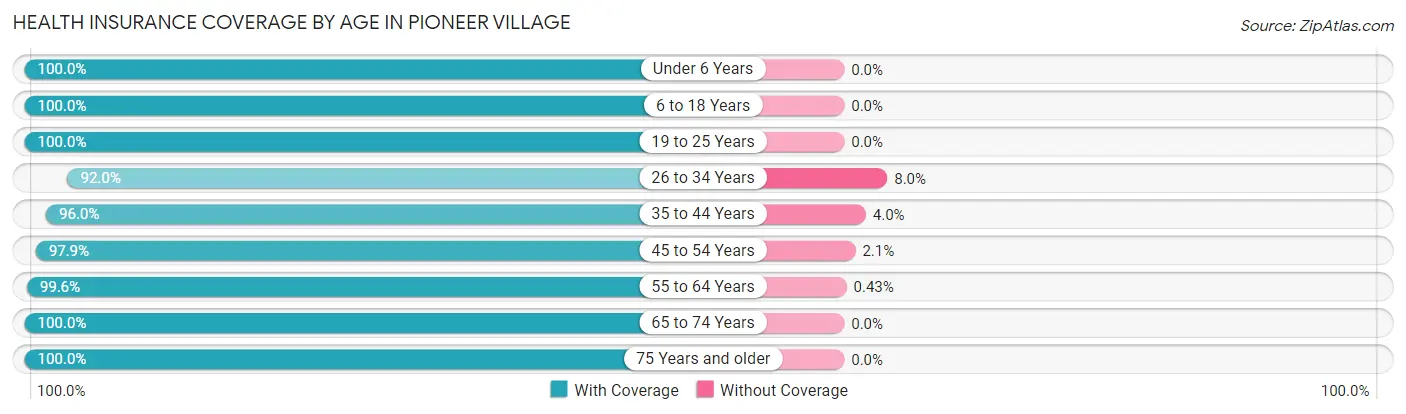
| Age Bracket | With Coverage | Without Coverage |
| Under 6 Years | 134 (100.0%) | 0 (0.0%) |
| 6 to 18 Years | 251 (100.0%) | 0 (0.0%) |
| 19 to 25 Years | 74 (100.0%) | 0 (0.0%) |
| 26 to 34 Years | 241 (92.0%) | 21 (8.0%) |
| 35 to 44 Years | 334 (96.0%) | 14 (4.0%) |
| 45 to 54 Years | 374 (97.9%) | 8 (2.1%) |
| 55 to 64 Years | 463 (99.6%) | 2 (0.4%) |
| 65 to 74 Years | 484 (100.0%) | 0 (0.0%) |
| 75 Years and older | 287 (100.0%) | 0 (0.0%) |
| Total | 2,642 (98.3%) | 45 (1.7%) |
Health Insurance Coverage by Citizenship Status in Pioneer Village
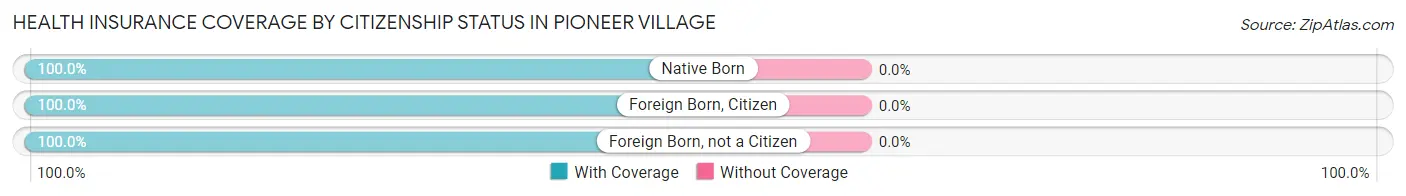
| Citizenship Status | With Coverage | Without Coverage |
| Native Born | 134 (100.0%) | 0 (0.0%) |
| Foreign Born, Citizen | 251 (100.0%) | 0 (0.0%) |
| Foreign Born, not a Citizen | 74 (100.0%) | 0 (0.0%) |
Health Insurance Coverage by Household Income in Pioneer Village
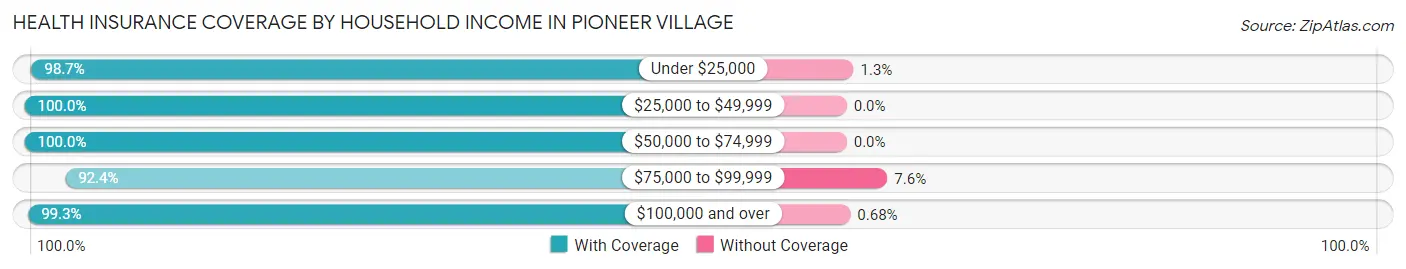
| Household Income | With Coverage | Without Coverage |
| Under $25,000 | 233 (98.7%) | 3 (1.3%) |
| $25,000 to $49,999 | 285 (100.0%) | 0 (0.0%) |
| $50,000 to $74,999 | 540 (100.0%) | 0 (0.0%) |
| $75,000 to $99,999 | 413 (92.4%) | 34 (7.6%) |
| $100,000 and over | 1,171 (99.3%) | 8 (0.7%) |
Public vs Private Health Insurance Coverage by Age in Pioneer Village
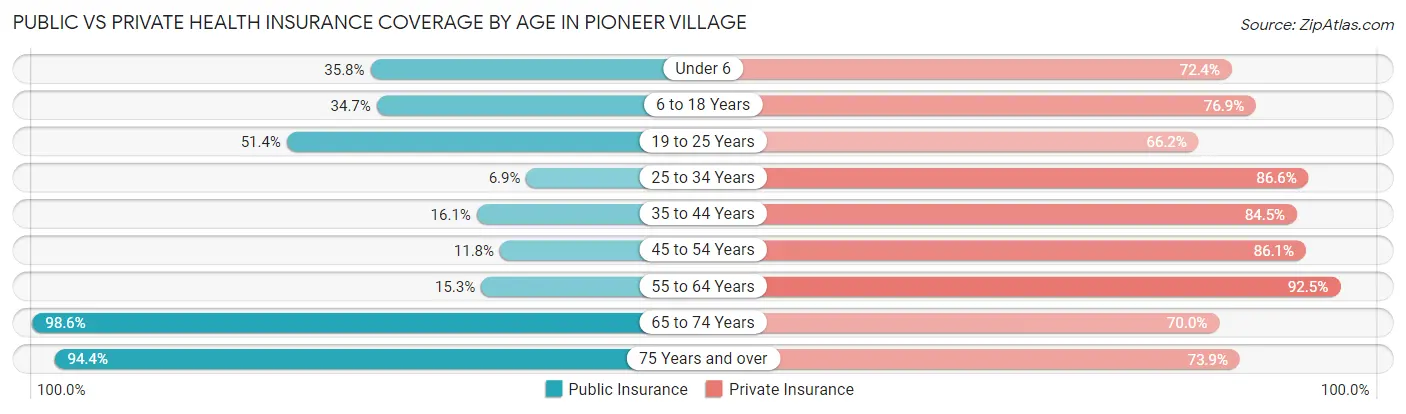
| Age Bracket | Public Insurance | Private Insurance |
| Under 6 | 48 (35.8%) | 97 (72.4%) |
| 6 to 18 Years | 87 (34.7%) | 193 (76.9%) |
| 19 to 25 Years | 38 (51.3%) | 49 (66.2%) |
| 25 to 34 Years | 18 (6.9%) | 227 (86.6%) |
| 35 to 44 Years | 56 (16.1%) | 294 (84.5%) |
| 45 to 54 Years | 45 (11.8%) | 329 (86.1%) |
| 55 to 64 Years | 71 (15.3%) | 430 (92.5%) |
| 65 to 74 Years | 477 (98.6%) | 339 (70.0%) |
| 75 Years and over | 271 (94.4%) | 212 (73.9%) |
| Total | 1,111 (41.3%) | 2,170 (80.8%) |
Disability Status by Sex by Age in Pioneer Village
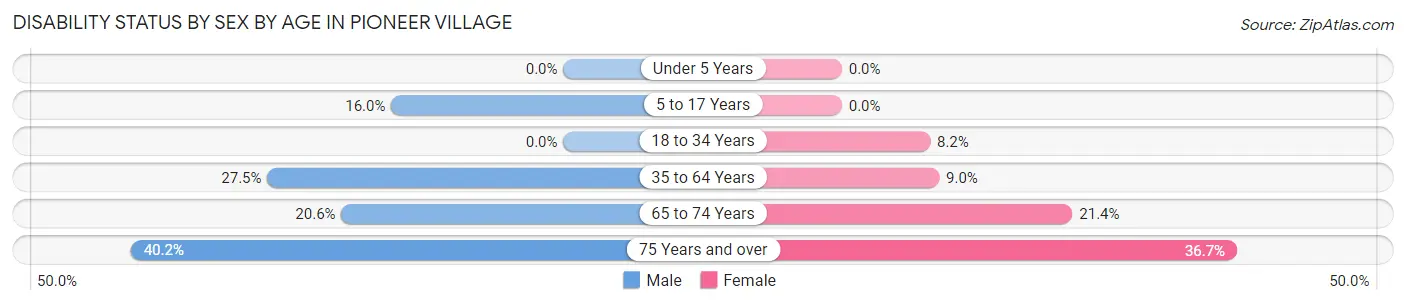
| Age Bracket | Male | Female |
| Under 5 Years | 0 (0.0%) | 0 (0.0%) |
| 5 to 17 Years | 19 (16.0%) | 0 (0.0%) |
| 18 to 34 Years | 0 (0.0%) | 14 (8.2%) |
| 35 to 64 Years | 161 (27.5%) | 55 (9.0%) |
| 65 to 74 Years | 41 (20.6%) | 61 (21.4%) |
| 75 Years and over | 55 (40.2%) | 55 (36.7%) |
Disability Class by Sex by Age in Pioneer Village
Disability Class: Hearing Difficulty
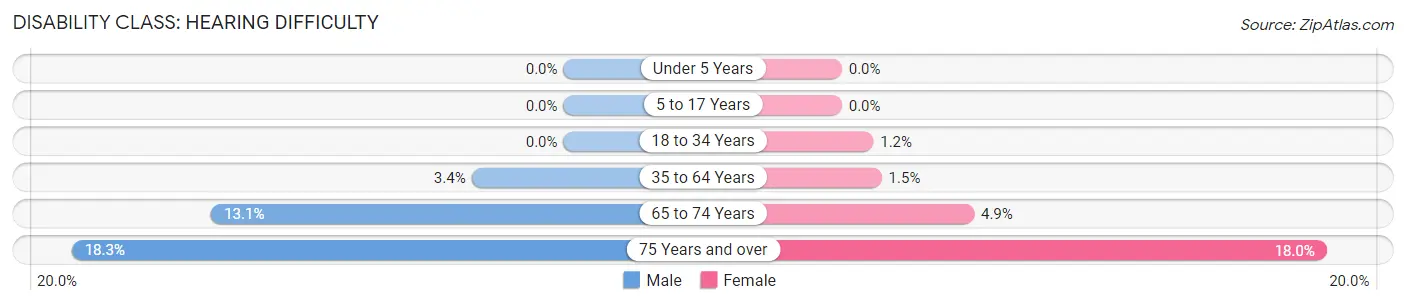
| Age Bracket | Male | Female |
| Under 5 Years | 0 (0.0%) | 0 (0.0%) |
| 5 to 17 Years | 0 (0.0%) | 0 (0.0%) |
| 18 to 34 Years | 0 (0.0%) | 2 (1.2%) |
| 35 to 64 Years | 20 (3.4%) | 9 (1.5%) |
| 65 to 74 Years | 26 (13.1%) | 14 (4.9%) |
| 75 Years and over | 25 (18.2%) | 27 (18.0%) |
Disability Class: Vision Difficulty
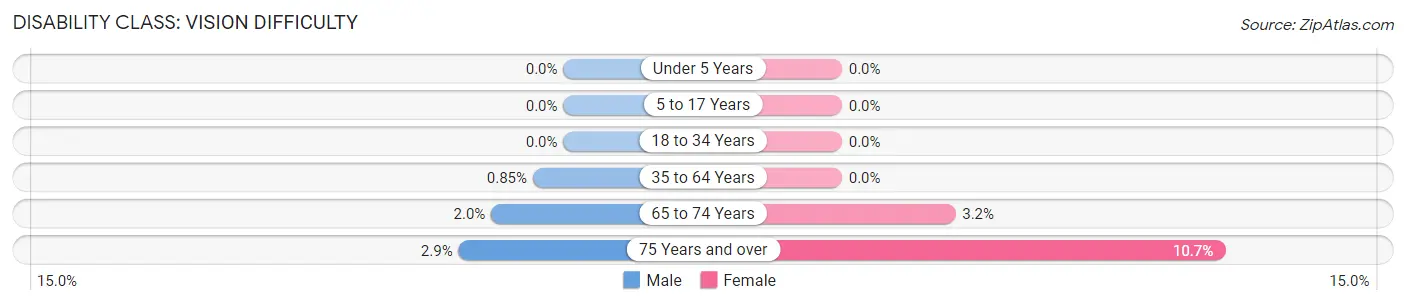
| Age Bracket | Male | Female |
| Under 5 Years | 0 (0.0%) | 0 (0.0%) |
| 5 to 17 Years | 0 (0.0%) | 0 (0.0%) |
| 18 to 34 Years | 0 (0.0%) | 0 (0.0%) |
| 35 to 64 Years | 5 (0.9%) | 0 (0.0%) |
| 65 to 74 Years | 4 (2.0%) | 9 (3.2%) |
| 75 Years and over | 4 (2.9%) | 16 (10.7%) |
Disability Class: Cognitive Difficulty
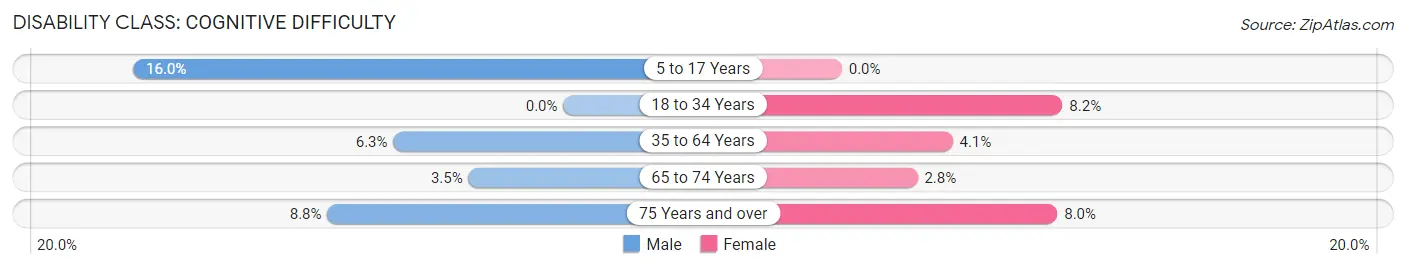
| Age Bracket | Male | Female |
| 5 to 17 Years | 19 (16.0%) | 0 (0.0%) |
| 18 to 34 Years | 0 (0.0%) | 14 (8.2%) |
| 35 to 64 Years | 37 (6.3%) | 25 (4.1%) |
| 65 to 74 Years | 7 (3.5%) | 8 (2.8%) |
| 75 Years and over | 12 (8.8%) | 12 (8.0%) |
Disability Class: Ambulatory Difficulty
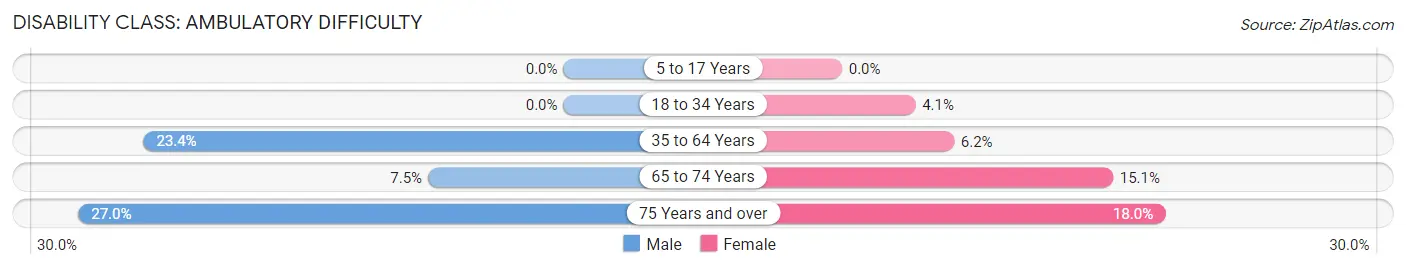
| Age Bracket | Male | Female |
| 5 to 17 Years | 0 (0.0%) | 0 (0.0%) |
| 18 to 34 Years | 0 (0.0%) | 7 (4.1%) |
| 35 to 64 Years | 137 (23.4%) | 38 (6.2%) |
| 65 to 74 Years | 15 (7.5%) | 43 (15.1%) |
| 75 Years and over | 37 (27.0%) | 27 (18.0%) |
Disability Class: Self-Care Difficulty
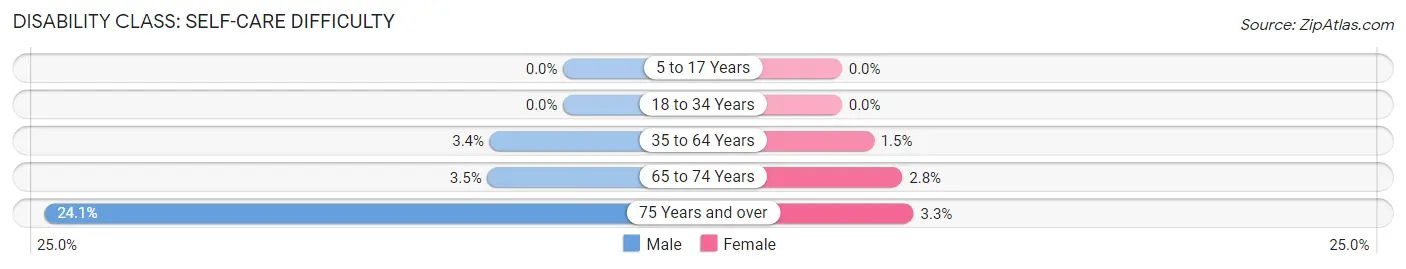
| Age Bracket | Male | Female |
| 5 to 17 Years | 0 (0.0%) | 0 (0.0%) |
| 18 to 34 Years | 0 (0.0%) | 0 (0.0%) |
| 35 to 64 Years | 20 (3.4%) | 9 (1.5%) |
| 65 to 74 Years | 7 (3.5%) | 8 (2.8%) |
| 75 Years and over | 33 (24.1%) | 5 (3.3%) |
Technology Access in Pioneer Village
Computing Device Access in Pioneer Village
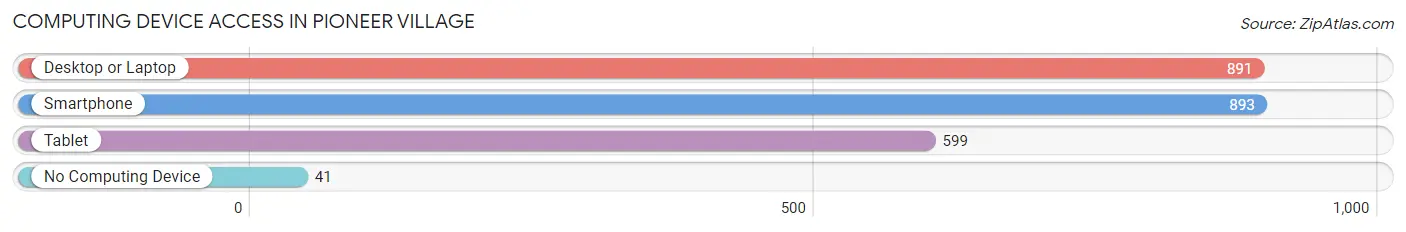
| Device Type | # Households | % Households |
| Desktop or Laptop | 891 | 86.1% |
| Smartphone | 893 | 86.3% |
| Tablet | 599 | 57.9% |
| No Computing Device | 41 | 4.0% |
| Total | 1,035 | 100.0% |
Internet Access in Pioneer Village
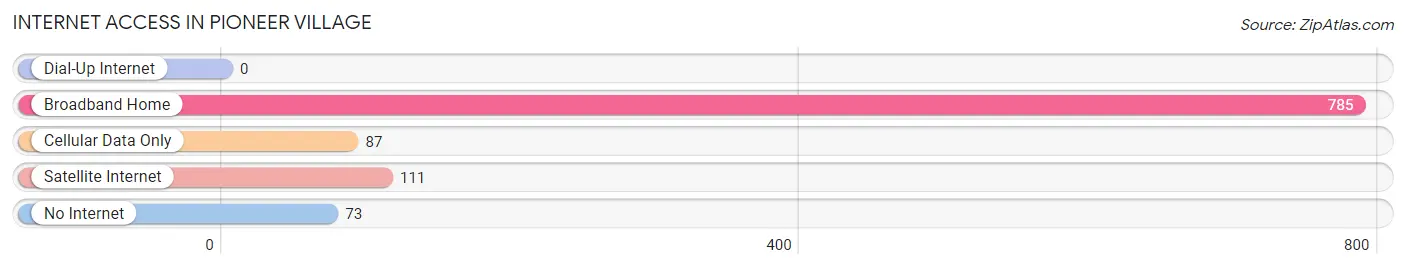
| Internet Type | # Households | % Households |
| Dial-Up Internet | 0 | 0.0% |
| Broadband Home | 785 | 75.8% |
| Cellular Data Only | 87 | 8.4% |
| Satellite Internet | 111 | 10.7% |
| No Internet | 73 | 7.0% |
| Total | 1,035 | 100.0% |
Pioneer Village Summary
Pioneer Village is a small unincorporated community located in Bullitt County, Kentucky. It is situated along the Salt River, approximately 15 miles south of Louisville. The population of Pioneer Village was estimated to be 1,845 in 2019.
History
Pioneer Village was founded in 1817 by a group of settlers from Virginia. The settlers were led by William and Mary Ann Smith, who had purchased the land from the local Native American tribes. The Smiths named the settlement after their hometown of Pioneer, Virginia. The settlement grew quickly, and by 1820, it had become a thriving community with a population of over 500.
The town was an important stop on the Louisville and Nashville Railroad, which ran through the area in the mid-1800s. The railroad brought new settlers to the area, and the population of Pioneer Village continued to grow. By the late 1800s, the town had become a bustling center of commerce and industry.
Geography
Pioneer Village is located in Bullitt County, Kentucky, approximately 15 miles south of Louisville. The town is situated along the Salt River, which flows through the area. The terrain is mostly flat, with some rolling hills in the area. The climate is humid subtropical, with hot summers and mild winters.
Economy
Pioneer Village is primarily a residential community, with most of its residents employed in the nearby cities of Louisville and Shepherdsville. The town does have some small businesses, including a few restaurants, a gas station, and a few convenience stores.
Demographics
As of 2019, the population of Pioneer Village was estimated to be 1,845. The racial makeup of the town was 94.3% White, 2.2% African American, 0.7% Asian, 0.3% Native American, and 2.5% from other races. The median household income was $50,945, and the median home value was $164,000.
Conclusion
Pioneer Village is a small unincorporated community located in Bullitt County, Kentucky. It was founded in 1817 by a group of settlers from Virginia, and has since grown into a thriving residential community. The town is situated along the Salt River, and has a humid subtropical climate. The population of Pioneer Village was estimated to be 1,845 in 2019, and the median household income was $50,945.
Common Questions
What is Per Capita Income in Pioneer Village?
Per Capita income in Pioneer Village is $37,129.
What is the Median Family Income in Pioneer Village?
Median Family Income in Pioneer Village is $91,406.
What is the Median Household income in Pioneer Village?
Median Household Income in Pioneer Village is $76,996.
What is Income or Wage Gap in Pioneer Village?
Income or Wage Gap in Pioneer Village is 26.9%.
Women in Pioneer Village earn 73.1 cents for every dollar earned by a man.
What is Inequality or Gini Index in Pioneer Village?
Inequality or Gini Index in Pioneer Village is 0.33.
What is the Total Population of Pioneer Village?
Total Population of Pioneer Village is 2,687.
What is the Total Male Population of Pioneer Village?
Total Male Population of Pioneer Village is 1,311.
What is the Total Female Population of Pioneer Village?
Total Female Population of Pioneer Village is 1,376.
What is the Ratio of Males per 100 Females in Pioneer Village?
There are 95.28 Males per 100 Females in Pioneer Village.
What is the Ratio of Females per 100 Males in Pioneer Village?
There are 104.96 Females per 100 Males in Pioneer Village.
What is the Median Population Age in Pioneer Village?
Median Population Age in Pioneer Village is 53.5 Years.
What is the Average Family Size in Pioneer Village
Average Family Size in Pioneer Village is 3.0 People.
What is the Average Household Size in Pioneer Village
Average Household Size in Pioneer Village is 2.6 People.
How Large is the Labor Force in Pioneer Village?
There are 1,328 People in the Labor Forcein in Pioneer Village.
What is the Percentage of People in the Labor Force in Pioneer Village?
56.4% of People are in the Labor Force in Pioneer Village.
What is the Unemployment Rate in Pioneer Village?
Unemployment Rate in Pioneer Village is 1.9%.