Linden, AZ Map & Demographics
Linden Map
Linden Overview
$35,410
PER CAPITA INCOME
$93,281
AVG FAMILY INCOME
$79,531
AVG HOUSEHOLD INCOME
25.7%
WAGE / INCOME GAP [ % ]
74.3¢/ $1
WAGE / INCOME GAP [ $ ]
$9,193
FAMILY INCOME DEFICIT
0.37
INEQUALITY / GINI INDEX
2,452
TOTAL POPULATION
1,325
MALE POPULATION
1,127
FEMALE POPULATION
117.57
MALES / 100 FEMALES
85.06
FEMALES / 100 MALES
57.6
MEDIAN AGE
2.8
AVG FAMILY SIZE
2.5
AVG HOUSEHOLD SIZE
907
LABOR FORCE [ PEOPLE ]
44.2%
PERCENT IN LABOR FORCE
4.1%
UNEMPLOYMENT RATE
Income in Linden
Income Overview in Linden
Per Capita Income in Linden is $35,410, while median incomes of families and households are $93,281 and $79,531 respectively.
| Characteristic | Number | Measure |
| Per Capita Income | 2,452 | $35,410 |
| Median Family Income | 753 | $93,281 |
| Mean Family Income | 753 | $96,044 |
| Median Household Income | 963 | $79,531 |
| Mean Household Income | 963 | $86,376 |
| Income Deficit | 753 | $9,193 |
| Wage / Income Gap (%) | 2,452 | 25.69% |
| Wage / Income Gap ($) | 2,452 | 74.31¢ per $1 |
| Gini / Inequality Index | 2,452 | 0.37 |
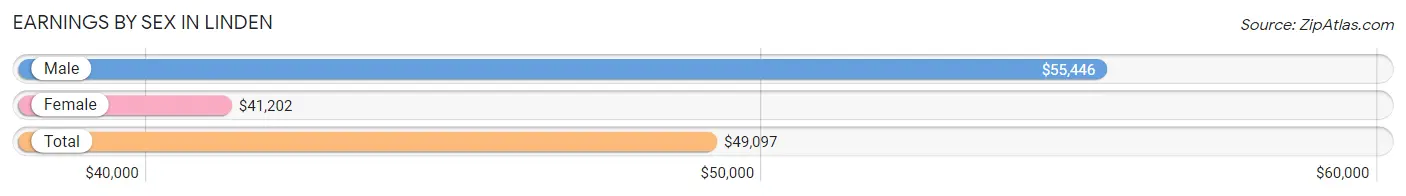
Earnings by Sex in Linden
Average Earnings in Linden are $49,097, $55,446 for men and $41,202 for women, a difference of 25.7%.
| Sex | Number | Average Earnings |
| Male | 557 (60.8%) | $55,446 |
| Female | 359 (39.2%) | $41,202 |
| Total | 916 (100.0%) | $49,097 |
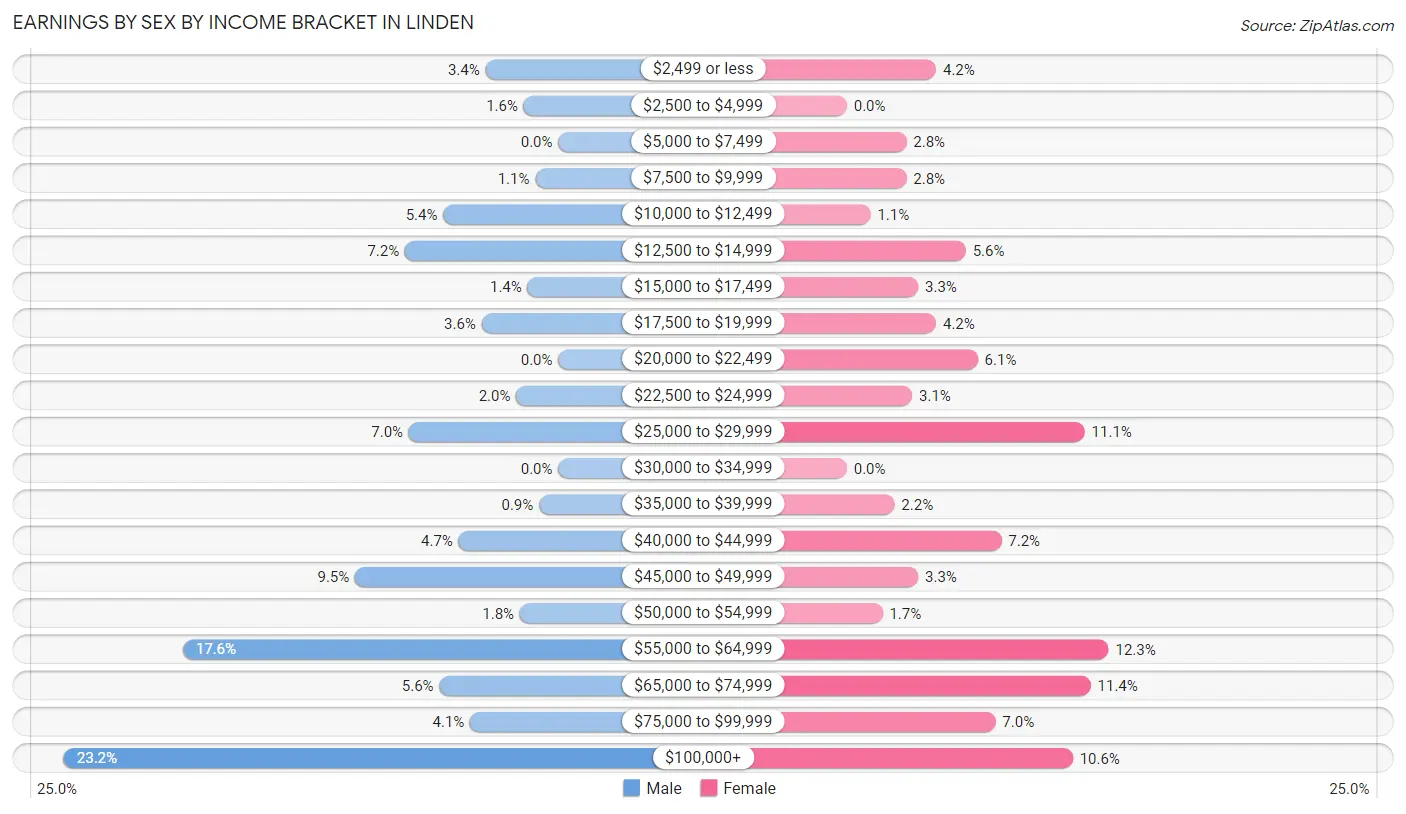
Earnings by Sex by Income Bracket in Linden
The most common earnings brackets in Linden are $100,000+ for men (129 | 23.2%) and $55,000 to $64,999 for women (44 | 12.3%).
| Income | Male | Female |
| $2,499 or less | 19 (3.4%) | 15 (4.2%) |
| $2,500 to $4,999 | 9 (1.6%) | 0 (0.0%) |
| $5,000 to $7,499 | 0 (0.0%) | 10 (2.8%) |
| $7,500 to $9,999 | 6 (1.1%) | 10 (2.8%) |
| $10,000 to $12,499 | 30 (5.4%) | 4 (1.1%) |
| $12,500 to $14,999 | 40 (7.2%) | 20 (5.6%) |
| $15,000 to $17,499 | 8 (1.4%) | 12 (3.3%) |
| $17,500 to $19,999 | 20 (3.6%) | 15 (4.2%) |
| $20,000 to $22,499 | 0 (0.0%) | 22 (6.1%) |
| $22,500 to $24,999 | 11 (2.0%) | 11 (3.1%) |
| $25,000 to $29,999 | 39 (7.0%) | 40 (11.1%) |
| $30,000 to $34,999 | 0 (0.0%) | 0 (0.0%) |
| $35,000 to $39,999 | 5 (0.9%) | 8 (2.2%) |
| $40,000 to $44,999 | 26 (4.7%) | 26 (7.2%) |
| $45,000 to $49,999 | 53 (9.5%) | 12 (3.3%) |
| $50,000 to $54,999 | 10 (1.8%) | 6 (1.7%) |
| $55,000 to $64,999 | 98 (17.6%) | 44 (12.3%) |
| $65,000 to $74,999 | 31 (5.6%) | 41 (11.4%) |
| $75,000 to $99,999 | 23 (4.1%) | 25 (7.0%) |
| $100,000+ | 129 (23.2%) | 38 (10.6%) |
| Total | 557 (100.0%) | 359 (100.0%) |
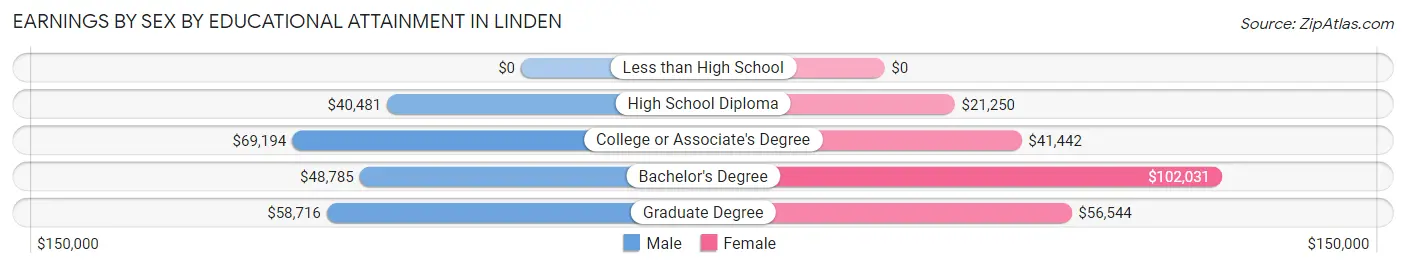
Earnings by Sex by Educational Attainment in Linden
Average earnings in Linden are $58,647 for men and $42,260 for women, a difference of 27.9%. Men with an educational attainment of college or associate's degree enjoy the highest average annual earnings of $69,194, while those with high school diploma education earn the least with $40,481. Women with an educational attainment of bachelor's degree earn the most with the average annual earnings of $102,031, while those with high school diploma education have the smallest earnings of $21,250.
| Educational Attainment | Male Income | Female Income |
| Less than High School | - | - |
| High School Diploma | $40,481 | $21,250 |
| College or Associate's Degree | $69,194 | $41,442 |
| Bachelor's Degree | $48,785 | $102,031 |
| Graduate Degree | $58,716 | $56,544 |
| Total | $58,647 | $42,260 |
Family Income in Linden
Family Income Brackets in Linden
According to the Linden family income data, there are 208 families falling into the $100,000 to $149,999 income range, which is the most common income bracket and makes up 27.6% of all families. Conversely, the $200,000+ income bracket is the least frequent group with only 12 families (1.6%) belonging to this category.
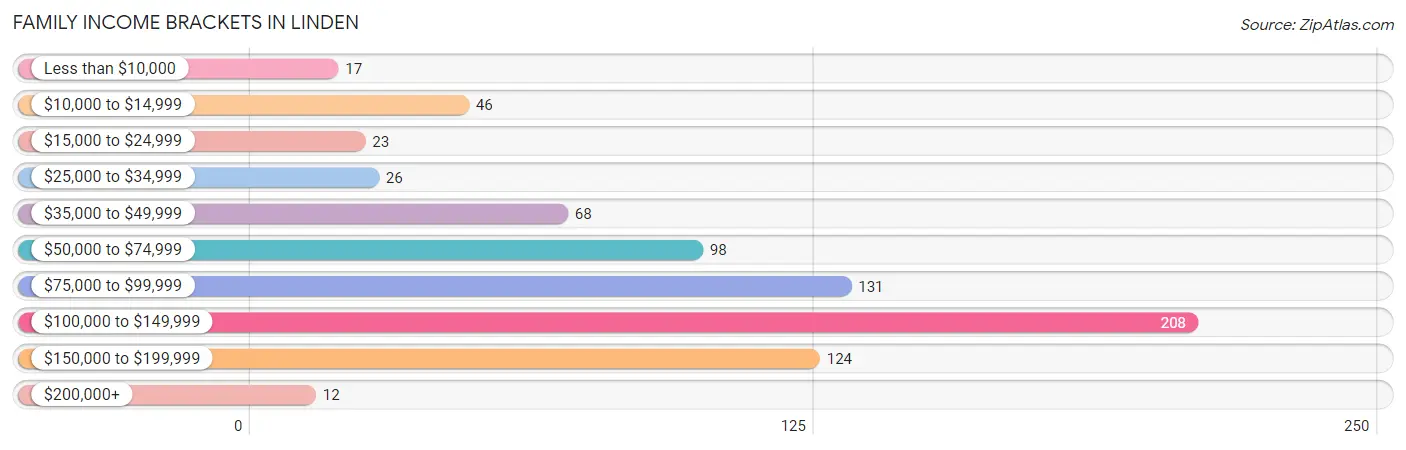
| Income Bracket | # Families | % Families |
| Less than $10,000 | 17 | 2.3% |
| $10,000 to $14,999 | 46 | 6.1% |
| $15,000 to $24,999 | 23 | 3.1% |
| $25,000 to $34,999 | 26 | 3.5% |
| $35,000 to $49,999 | 68 | 9.0% |
| $50,000 to $74,999 | 98 | 13.0% |
| $75,000 to $99,999 | 131 | 17.4% |
| $100,000 to $149,999 | 208 | 27.6% |
| $150,000 to $199,999 | 124 | 16.5% |
| $200,000+ | 12 | 1.6% |
Family Income by Famaliy Size in Linden
2-person families (593 | 78.7%) account for the highest median family income in Linden with $93,156 per family, while 2-person families (593 | 78.7%) have the highest median income of $46,578 per family member.
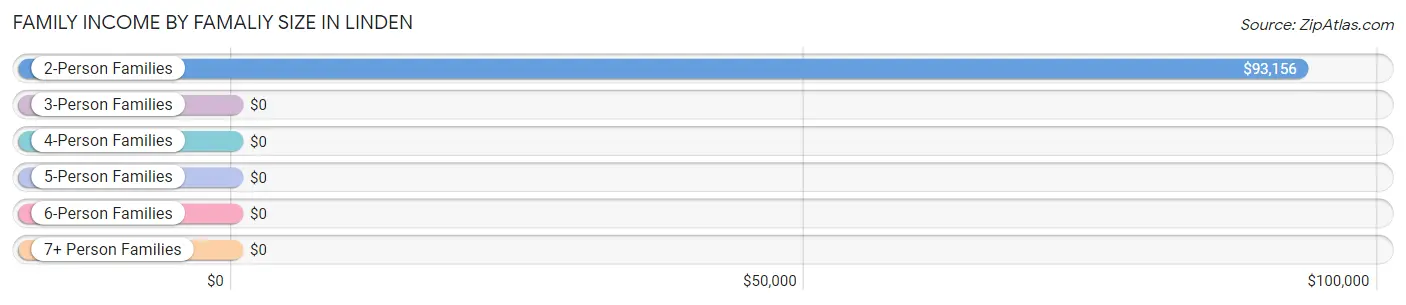
| Income Bracket | # Families | Median Income |
| 2-Person Families | 593 (78.7%) | $93,156 |
| 3-Person Families | 54 (7.2%) | $0 |
| 4-Person Families | 74 (9.8%) | $0 |
| 5-Person Families | 0 (0.0%) | $0 |
| 6-Person Families | 10 (1.3%) | $0 |
| 7+ Person Families | 22 (2.9%) | $0 |
| Total | 753 (100.0%) | $93,281 |
Family Income by Number of Earners in Linden
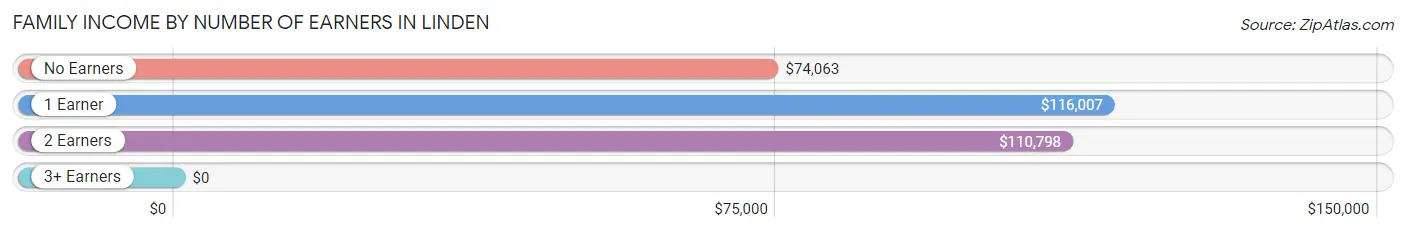
| Number of Earners | # Families | Median Income |
| No Earners | 233 (30.9%) | $74,063 |
| 1 Earner | 249 (33.1%) | $116,007 |
| 2 Earners | 260 (34.5%) | $110,798 |
| 3+ Earners | 11 (1.5%) | $0 |
| Total | 753 (100.0%) | $93,281 |
Household Income in Linden
Household Income Brackets in Linden
With 216 households falling in the category, the $100,000 to $149,999 income range is the most frequent in Linden, accounting for 22.4% of all households. In contrast, only 25 households (2.6%) fall into the less than $10,000 income bracket, making it the least populous group.
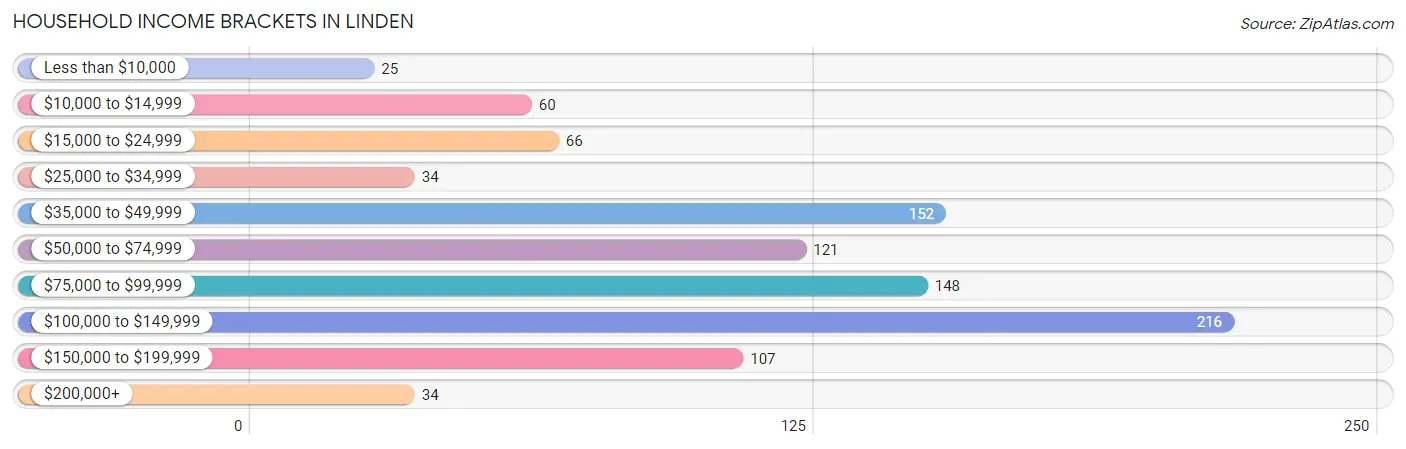
| Income Bracket | # Households | % Households |
| Less than $10,000 | 25 | 2.6% |
| $10,000 to $14,999 | 60 | 6.2% |
| $15,000 to $24,999 | 66 | 6.9% |
| $25,000 to $34,999 | 34 | 3.5% |
| $35,000 to $49,999 | 152 | 15.8% |
| $50,000 to $74,999 | 121 | 12.6% |
| $75,000 to $99,999 | 148 | 15.4% |
| $100,000 to $149,999 | 216 | 22.4% |
| $150,000 to $199,999 | 107 | 11.1% |
| $200,000+ | 34 | 3.5% |
Household Income by Householder Age in Linden
The median household income in Linden is $79,531, with the highest median household income of $110,304 found in the 25 to 44 years age bracket for the primary householder. A total of 109 households (11.3%) fall into this category. Meanwhile, the 15 to 24 years age bracket for the primary householder has the lowest median household income of $0, with 40 households (4.2%) in this group.
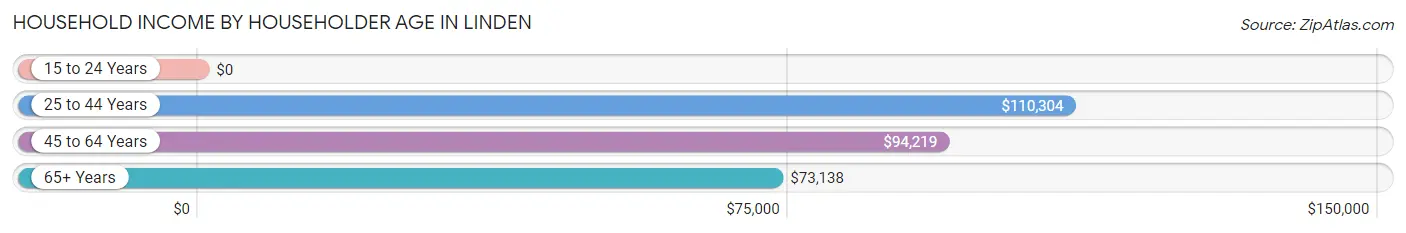
| Income Bracket | # Households | Median Income |
| 15 to 24 Years | 40 (4.2%) | $0 |
| 25 to 44 Years | 109 (11.3%) | $110,304 |
| 45 to 64 Years | 395 (41.0%) | $94,219 |
| 65+ Years | 419 (43.5%) | $73,138 |
| Total | 963 (100.0%) | $79,531 |
Poverty in Linden
Income Below Poverty by Sex and Age in Linden
With 10.9% poverty level for males and 11.1% for females among the residents of Linden, 12 to 14 year old males and 18 to 24 year old females are the most vulnerable to poverty, with 11 males (100.0%) and 29 females (100.0%) in their respective age groups living below the poverty level.
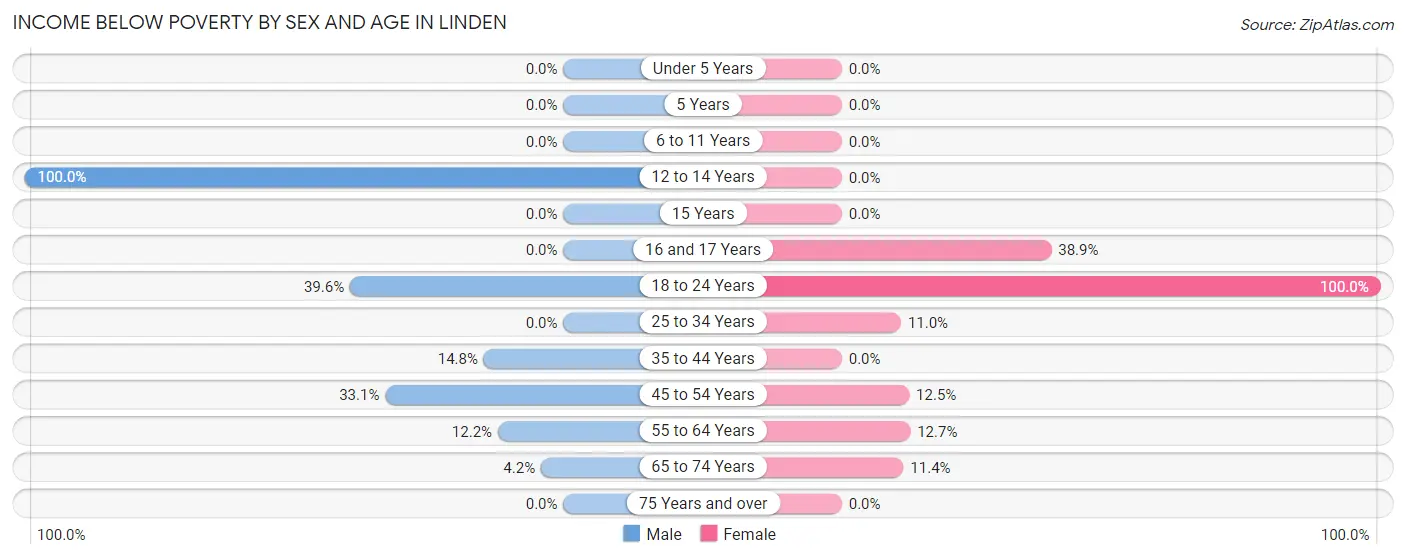
| Age Bracket | Male | Female |
| Under 5 Years | 0 (0.0%) | 0 (0.0%) |
| 5 Years | 0 (0.0%) | 0 (0.0%) |
| 6 to 11 Years | 0 (0.0%) | 0 (0.0%) |
| 12 to 14 Years | 11 (100.0%) | 0 (0.0%) |
| 15 Years | 0 (0.0%) | 0 (0.0%) |
| 16 and 17 Years | 0 (0.0%) | 7 (38.9%) |
| 18 to 24 Years | 40 (39.6%) | 29 (100.0%) |
| 25 to 34 Years | 0 (0.0%) | 9 (11.0%) |
| 35 to 44 Years | 13 (14.8%) | 0 (0.0%) |
| 45 to 54 Years | 41 (33.1%) | 17 (12.5%) |
| 55 to 64 Years | 30 (12.1%) | 40 (12.7%) |
| 65 to 74 Years | 10 (4.2%) | 23 (11.4%) |
| 75 Years and over | 0 (0.0%) | 0 (0.0%) |
| Total | 145 (10.9%) | 125 (11.1%) |
Income Above Poverty by Sex and Age in Linden
According to the poverty statistics in Linden, males aged under 5 years and females aged under 5 years are the age groups that are most secure financially, with 100.0% of males and 100.0% of females in these age groups living above the poverty line.
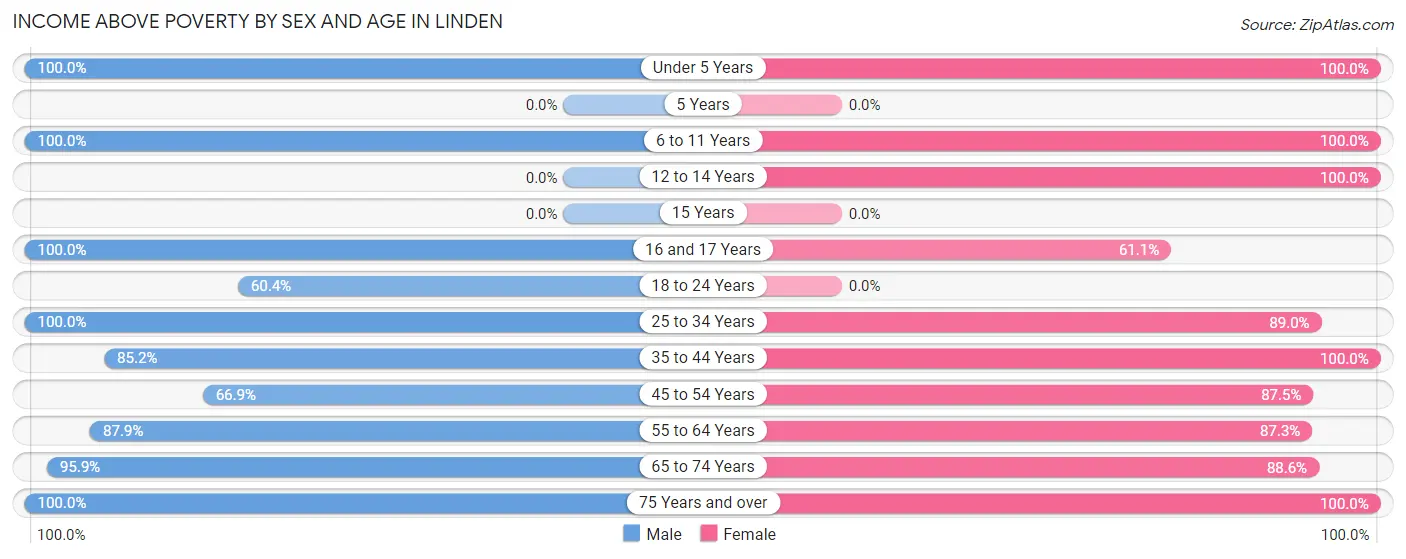
| Age Bracket | Male | Female |
| Under 5 Years | 66 (100.0%) | 76 (100.0%) |
| 5 Years | 0 (0.0%) | 0 (0.0%) |
| 6 to 11 Years | 183 (100.0%) | 46 (100.0%) |
| 12 to 14 Years | 0 (0.0%) | 18 (100.0%) |
| 15 Years | 0 (0.0%) | 0 (0.0%) |
| 16 and 17 Years | 62 (100.0%) | 11 (61.1%) |
| 18 to 24 Years | 61 (60.4%) | 0 (0.0%) |
| 25 to 34 Years | 52 (100.0%) | 73 (89.0%) |
| 35 to 44 Years | 75 (85.2%) | 51 (100.0%) |
| 45 to 54 Years | 83 (66.9%) | 119 (87.5%) |
| 55 to 64 Years | 217 (87.8%) | 275 (87.3%) |
| 65 to 74 Years | 231 (95.9%) | 178 (88.6%) |
| 75 Years and over | 150 (100.0%) | 155 (100.0%) |
| Total | 1,180 (89.1%) | 1,002 (88.9%) |
Income Below Poverty Among Married-Couple Families in Linden
The poverty statistics for married-couple families in Linden show that 9.9% or 70 of the total 707 families live below the poverty line. Families with 1 or 2 children have the highest poverty rate of 20.2%, comprising of 20 families. On the other hand, families with no children have the lowest poverty rate of 8.2%, which includes 50 families.
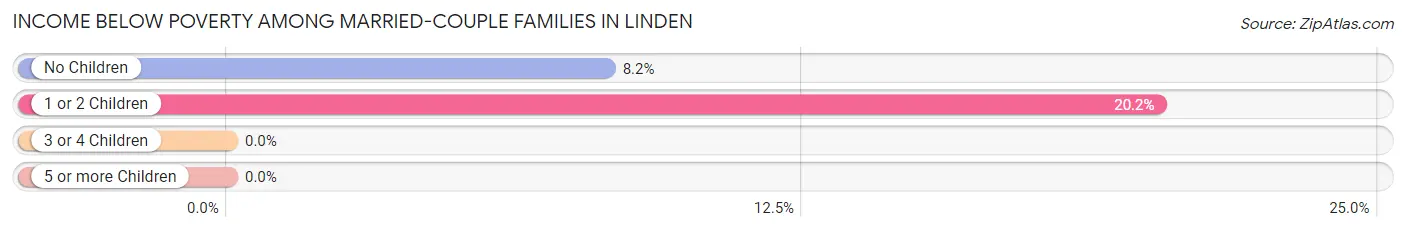
| Children | Above Poverty | Below Poverty |
| No Children | 558 (91.8%) | 50 (8.2%) |
| 1 or 2 Children | 79 (79.8%) | 20 (20.2%) |
| 3 or 4 Children | 0 (0.0%) | 0 (0.0%) |
| 5 or more Children | 0 (0.0%) | 0 (0.0%) |
| Total | 637 (90.1%) | 70 (9.9%) |
Income Below Poverty Among Single-Parent Households in Linden
| Children | Single Father | Single Mother |
| No Children | 0 (0.0%) | 0 (0.0%) |
| 1 or 2 Children | 0 (0.0%) | 0 (0.0%) |
| 3 or 4 Children | 0 (0.0%) | 0 (0.0%) |
| 5 or more Children | 0 (0.0%) | 0 (0.0%) |
| Total | 0 (0.0%) | 0 (0.0%) |
Income Below Poverty Among Married-Couple vs Single-Parent Households in Linden
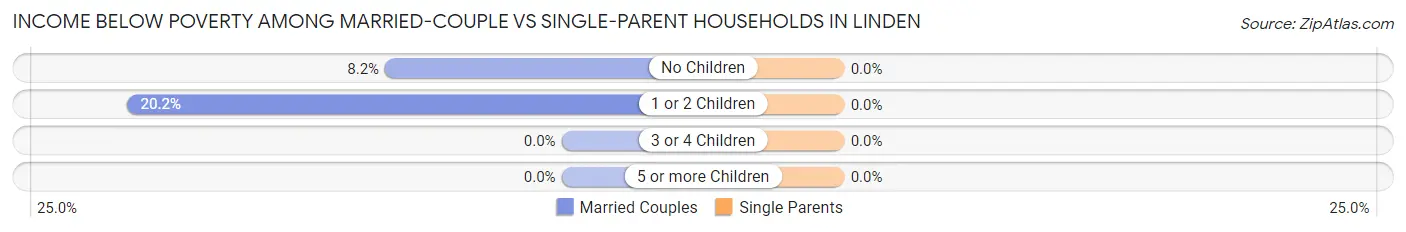
| Children | Married-Couple Families | Single-Parent Households |
| No Children | 50 (8.2%) | 0 (0.0%) |
| 1 or 2 Children | 20 (20.2%) | 0 (0.0%) |
| 3 or 4 Children | 0 (0.0%) | 0 (0.0%) |
| 5 or more Children | 0 (0.0%) | 0 (0.0%) |
| Total | 70 (9.9%) | 0 (0.0%) |
Race in Linden
The most populous races in Linden are White / Caucasian (1,979 | 80.7%), Two or more Races (330 | 13.5%), and Hispanic or Latino (248 | 10.1%).
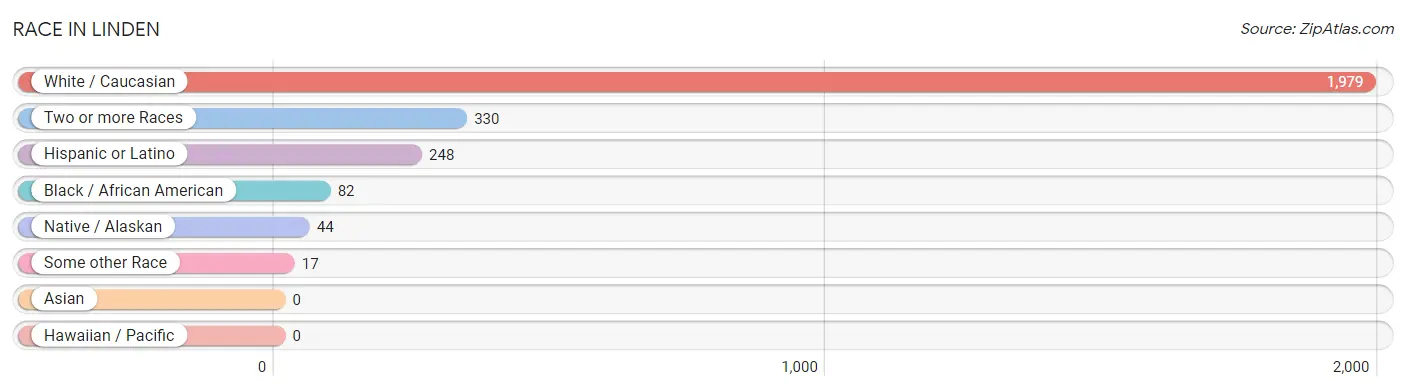
| Race | # Population | % Population |
| Asian | 0 | 0.0% |
| Black / African American | 82 | 3.3% |
| Hawaiian / Pacific | 0 | 0.0% |
| Hispanic or Latino | 248 | 10.1% |
| Native / Alaskan | 44 | 1.8% |
| White / Caucasian | 1,979 | 80.7% |
| Two or more Races | 330 | 13.5% |
| Some other Race | 17 | 0.7% |
| Total | 2,452 | 100.0% |
Ancestry in Linden
The most populous ancestries reported in Linden are English (391 | 16.0%), German (349 | 14.2%), American (293 | 11.9%), Irish (224 | 9.1%), and Mexican (136 | 5.6%), together accounting for 56.8% of all Linden residents.
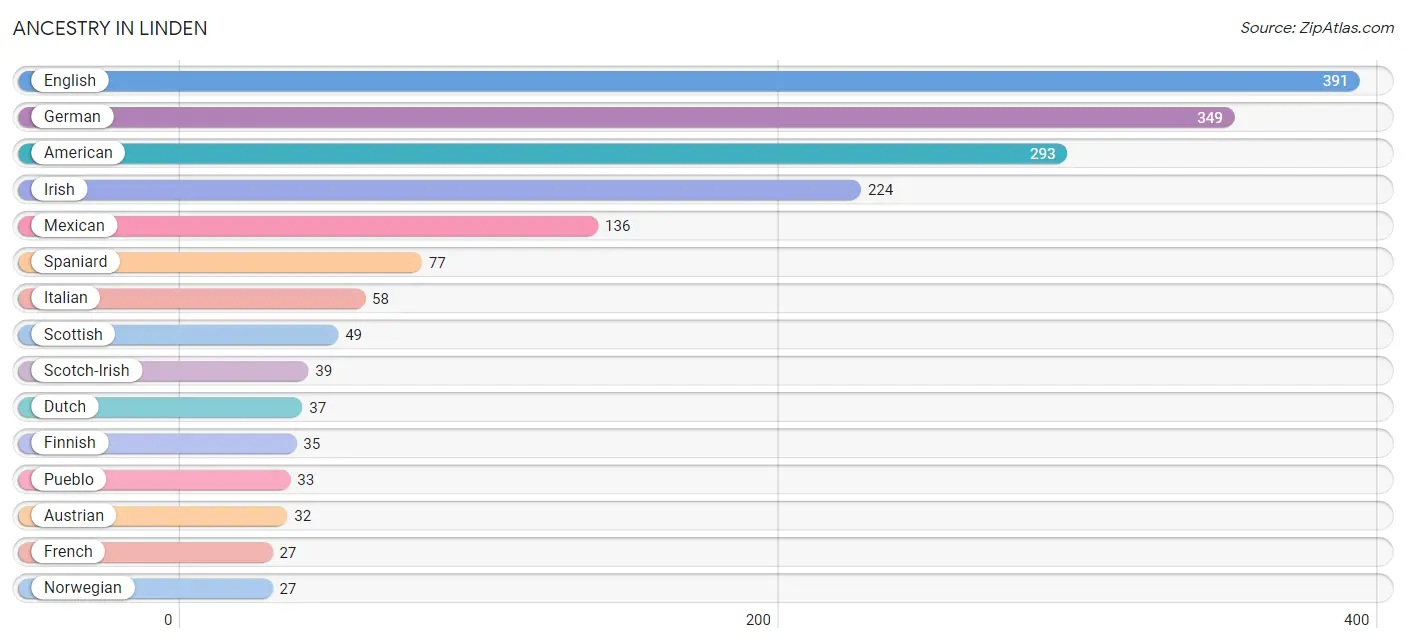
| Ancestry | # Population | % Population |
| American | 293 | 11.9% |
| Austrian | 32 | 1.3% |
| Basque | 23 | 0.9% |
| Blackfeet | 11 | 0.4% |
| British | 11 | 0.4% |
| Canadian | 8 | 0.3% |
| Celtic | 16 | 0.6% |
| Czech | 13 | 0.5% |
| Danish | 15 | 0.6% |
| Dutch | 37 | 1.5% |
| English | 391 | 16.0% |
| European | 3 | 0.1% |
| Finnish | 35 | 1.4% |
| French | 27 | 1.1% |
| French Canadian | 8 | 0.3% |
| German | 349 | 14.2% |
| Irish | 224 | 9.1% |
| Italian | 58 | 2.4% |
| Lithuanian | 15 | 0.6% |
| Mexican | 136 | 5.6% |
| Norwegian | 27 | 1.1% |
| Paraguayan | 11 | 0.4% |
| Pueblo | 33 | 1.3% |
| Scotch-Irish | 39 | 1.6% |
| Scottish | 49 | 2.0% |
| Slovak | 10 | 0.4% |
| Slovene | 12 | 0.5% |
| South American | 11 | 0.4% |
| South American Indian | 11 | 0.4% |
| Spaniard | 77 | 3.1% |
| Spanish | 12 | 0.5% |
| Spanish American | 12 | 0.5% |
| Swedish | 24 | 1.0% |
| Swiss | 9 | 0.4% |
| Welsh | 19 | 0.8% |
| Yaqui | 4 | 0.2% | View All 36 Rows |
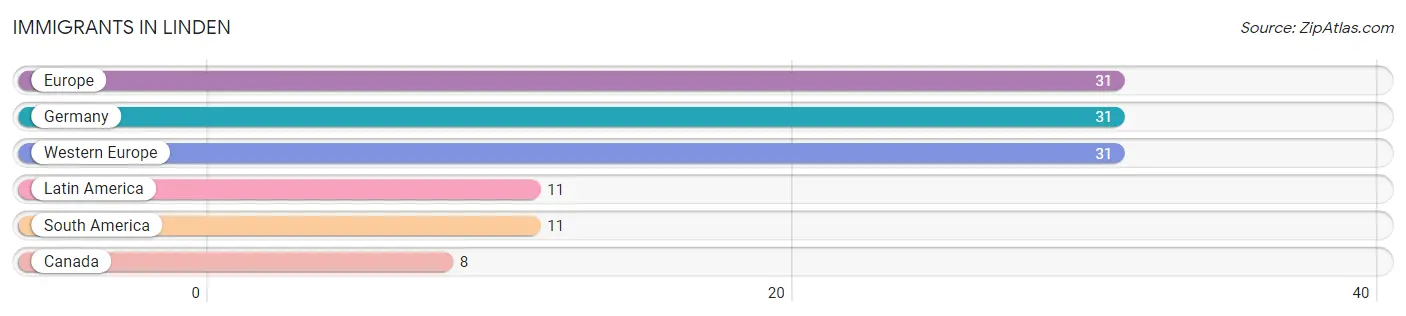
Immigrants in Linden
The most numerous immigrant groups reported in Linden came from Europe (31 | 1.3%), Germany (31 | 1.3%), Western Europe (31 | 1.3%), Latin America (11 | 0.4%), and South America (11 | 0.4%), together accounting for 4.7% of all Linden residents.
| Immigration Origin | # Population | % Population |
| Canada | 8 | 0.3% |
| Europe | 31 | 1.3% |
| Germany | 31 | 1.3% |
| Latin America | 11 | 0.4% |
| South America | 11 | 0.4% |
| Western Europe | 31 | 1.3% | View All 6 Rows |
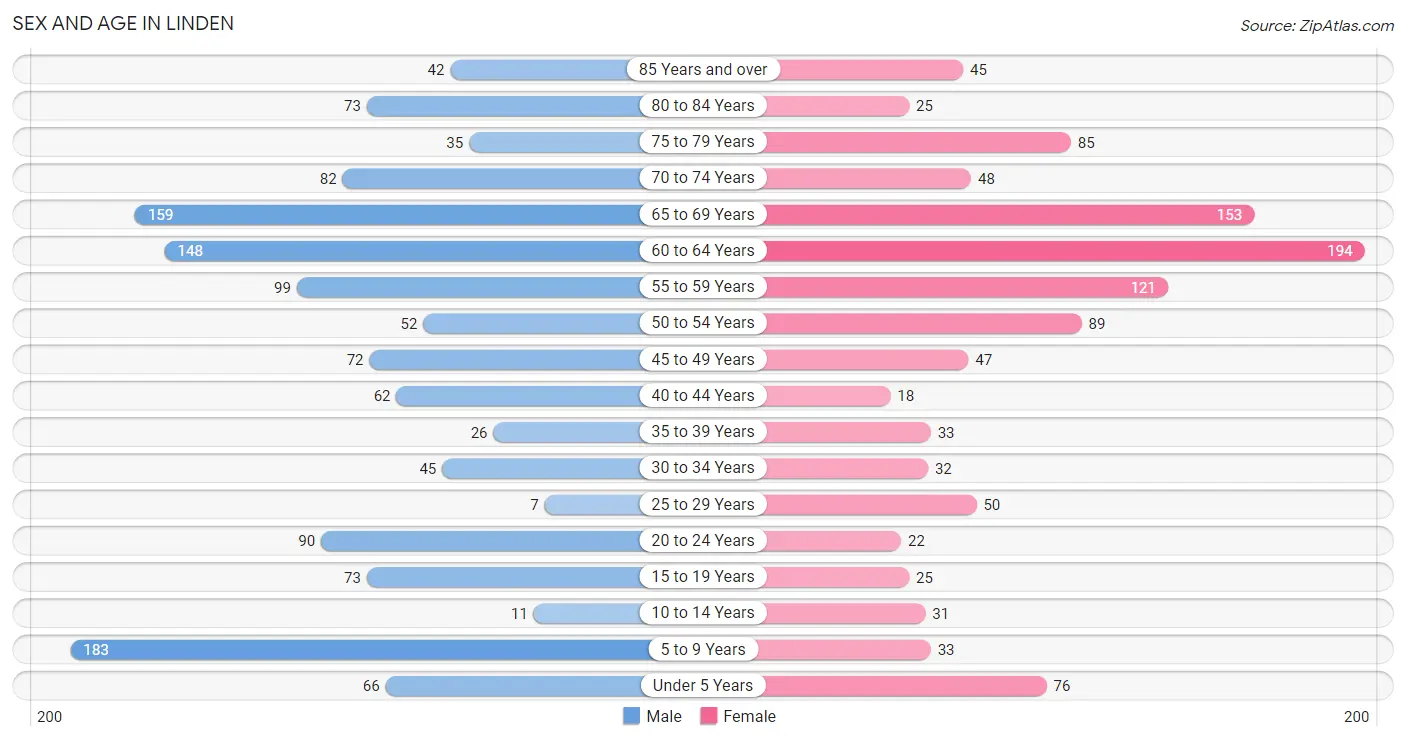
Sex and Age in Linden
Sex and Age in Linden
The most populous age groups in Linden are 5 to 9 Years (183 | 13.8%) for men and 60 to 64 Years (194 | 17.2%) for women.
| Age Bracket | Male | Female |
| Under 5 Years | 66 (5.0%) | 76 (6.7%) |
| 5 to 9 Years | 183 (13.8%) | 33 (2.9%) |
| 10 to 14 Years | 11 (0.8%) | 31 (2.8%) |
| 15 to 19 Years | 73 (5.5%) | 25 (2.2%) |
| 20 to 24 Years | 90 (6.8%) | 22 (1.9%) |
| 25 to 29 Years | 7 (0.5%) | 50 (4.4%) |
| 30 to 34 Years | 45 (3.4%) | 32 (2.8%) |
| 35 to 39 Years | 26 (2.0%) | 33 (2.9%) |
| 40 to 44 Years | 62 (4.7%) | 18 (1.6%) |
| 45 to 49 Years | 72 (5.4%) | 47 (4.2%) |
| 50 to 54 Years | 52 (3.9%) | 89 (7.9%) |
| 55 to 59 Years | 99 (7.5%) | 121 (10.7%) |
| 60 to 64 Years | 148 (11.2%) | 194 (17.2%) |
| 65 to 69 Years | 159 (12.0%) | 153 (13.6%) |
| 70 to 74 Years | 82 (6.2%) | 48 (4.3%) |
| 75 to 79 Years | 35 (2.6%) | 85 (7.5%) |
| 80 to 84 Years | 73 (5.5%) | 25 (2.2%) |
| 85 Years and over | 42 (3.2%) | 45 (4.0%) |
| Total | 1,325 (100.0%) | 1,127 (100.0%) |
Families and Households in Linden
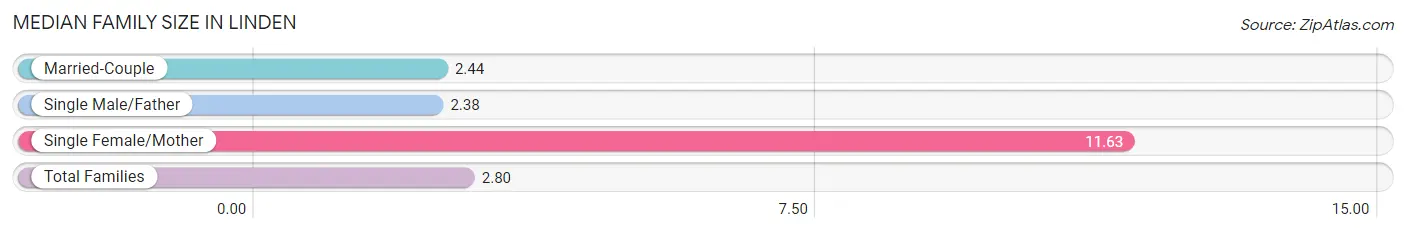
Median Family Size in Linden
The median family size in Linden is 2.80 persons per family, with single female/mother families (30 | 4.0%) accounting for the largest median family size of 11.63 persons per family. On the other hand, single male/father families (16 | 2.1%) represent the smallest median family size with 2.38 persons per family.
| Family Type | # Families | Family Size |
| Married-Couple | 707 (93.9%) | 2.44 |
| Single Male/Father | 16 (2.1%) | 2.38 |
| Single Female/Mother | 30 (4.0%) | 11.63 |
| Total Families | 753 (100.0%) | 2.80 |
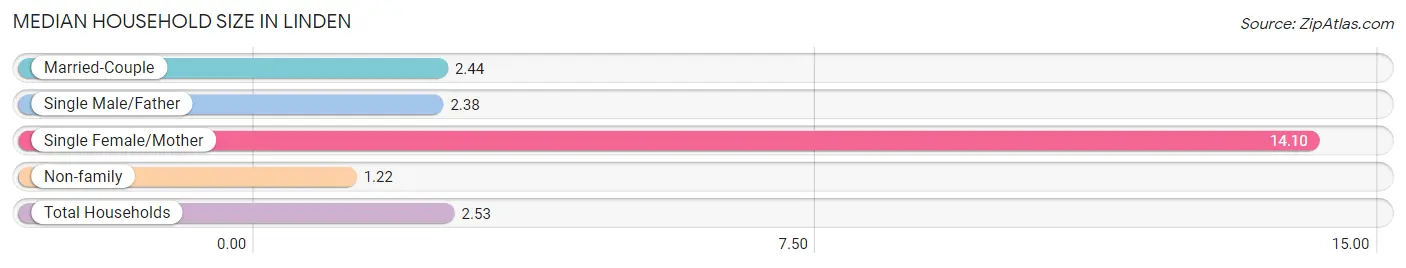
Median Household Size in Linden
The median household size in Linden is 2.53 persons per household, with single female/mother households (30 | 3.1%) accounting for the largest median household size of 14.1 persons per household. non-family households (210 | 21.8%) represent the smallest median household size with 1.22 persons per household.
| Household Type | # Households | Household Size |
| Married-Couple | 707 (73.4%) | 2.44 |
| Single Male/Father | 16 (1.7%) | 2.38 |
| Single Female/Mother | 30 (3.1%) | 14.10 |
| Non-family | 210 (21.8%) | 1.22 |
| Total Households | 963 (100.0%) | 2.53 |
Household Size by Marriage Status in Linden
Out of a total of 963 households in Linden, 753 (78.2%) are family households, while 210 (21.8%) are nonfamily households. The most numerous type of family households are 2-person households, comprising 593, and the most common type of nonfamily households are 1-person households, comprising 158.
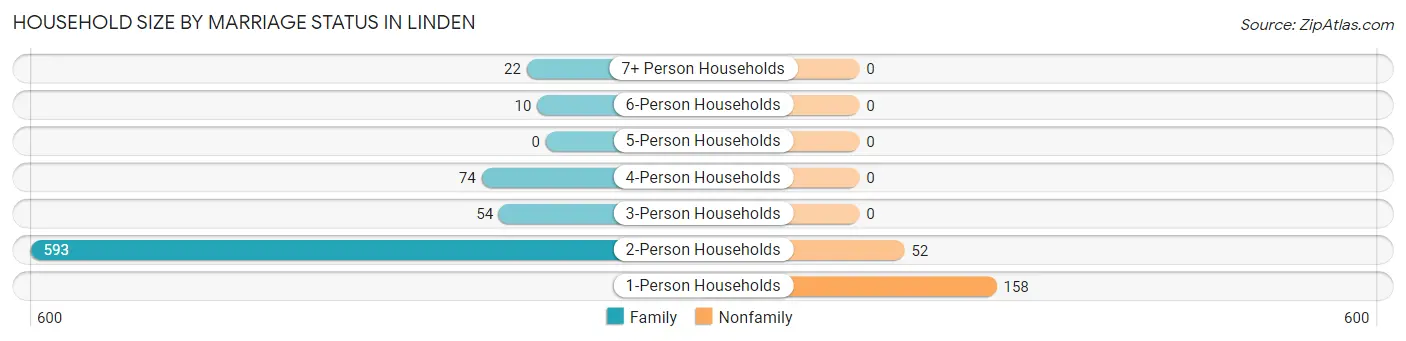
| Household Size | Family Households | Nonfamily Households |
| 1-Person Households | - | 158 (16.4%) |
| 2-Person Households | 593 (61.6%) | 52 (5.4%) |
| 3-Person Households | 54 (5.6%) | 0 (0.0%) |
| 4-Person Households | 74 (7.7%) | 0 (0.0%) |
| 5-Person Households | 0 (0.0%) | 0 (0.0%) |
| 6-Person Households | 10 (1.0%) | 0 (0.0%) |
| 7+ Person Households | 22 (2.3%) | 0 (0.0%) |
| Total | 753 (78.2%) | 210 (21.8%) |
Female Fertility in Linden
Fertility by Age in Linden
| Age Bracket | Women with Births | Births / 1,000 Women |
| 15 to 19 years | 0 (0.0%) | 0.0 |
| 20 to 34 years | 0 (0.0%) | 0.0 |
| 35 to 50 years | 0 (0.0%) | 0.0 |
| Total | 0 (0.0%) | 0.0 |
Fertility by Age by Marriage Status in Linden
| Age Bracket | Married | Unmarried |
| 15 to 19 years | 0 (0.0%) | 0 (0.0%) |
| 20 to 34 years | 0 (0.0%) | 0 (0.0%) |
| 35 to 50 years | 0 (0.0%) | 0 (0.0%) |
| Total | 0 (0.0%) | 0 (0.0%) |
Fertility by Education in Linden
| Educational Attainment | Women with Births | Births / 1,000 Women |
| Less than High School | 0 (0.0%) | 0.0 |
| High School Diploma | 0 (0.0%) | 0.0 |
| College or Associate's Degree | 0 (0.0%) | 0.0 |
| Bachelor's Degree | 0 (0.0%) | 0.0 |
| Graduate Degree | 0 (0.0%) | 0.0 |
| Total | 0 (0.0%) | 0.0 |
Fertility by Education by Marriage Status in Linden
| Educational Attainment | Married | Unmarried |
| Less than High School | 0 (0.0%) | 0 (0.0%) |
| High School Diploma | 0 (0.0%) | 0 (0.0%) |
| College or Associate's Degree | 0 (0.0%) | 0 (0.0%) |
| Bachelor's Degree | 0 (0.0%) | 0 (0.0%) |
| Graduate Degree | 0 (0.0%) | 0 (0.0%) |
| Total | 0 (0.0%) | 0 (0.0%) |
Employment Characteristics in Linden
Employment by Class of Employer in Linden
Among the 849 employed individuals in Linden, private company employees (461 | 54.3%), local government employees (92 | 10.8%), and not-for-profit organizations (89 | 10.5%) make up the most common classes of employment.
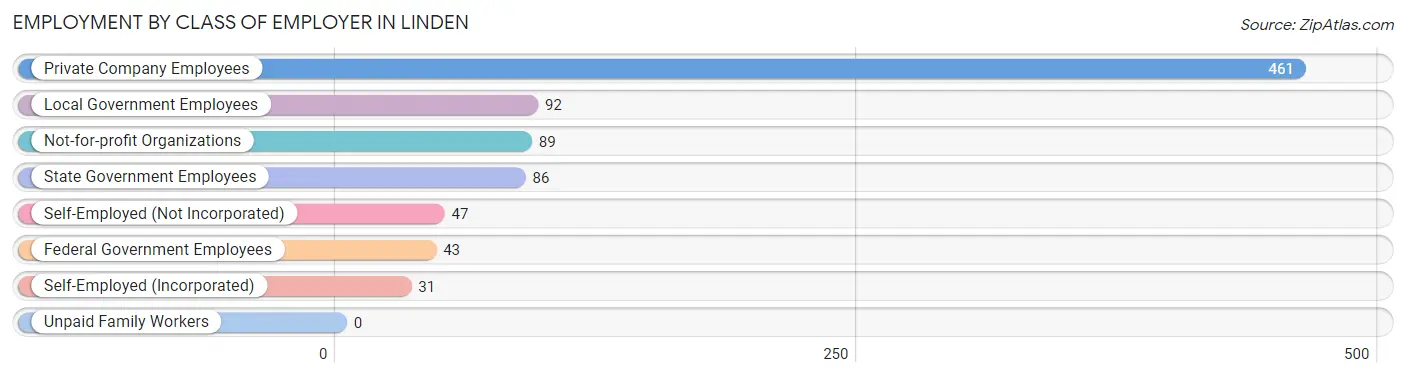
| Employer Class | # Employees | % Employees |
| Private Company Employees | 461 | 54.3% |
| Self-Employed (Incorporated) | 31 | 3.6% |
| Self-Employed (Not Incorporated) | 47 | 5.5% |
| Not-for-profit Organizations | 89 | 10.5% |
| Local Government Employees | 92 | 10.8% |
| State Government Employees | 86 | 10.1% |
| Federal Government Employees | 43 | 5.1% |
| Unpaid Family Workers | 0 | 0.0% |
| Total | 849 | 100.0% |
Employment Status by Age in Linden
According to the labor force statistics for Linden, out of the total population over 16 years of age (2,052), 44.2% or 907 individuals are in the labor force, with 4.1% or 37 of them unemployed. The age group with the highest labor force participation rate is 20 to 24 years, with 100.0% or 112 individuals in the labor force. Within the labor force, the 45 to 54 years age range has the highest percentage of unemployed individuals, with 22.6% or 37 of them being unemployed.
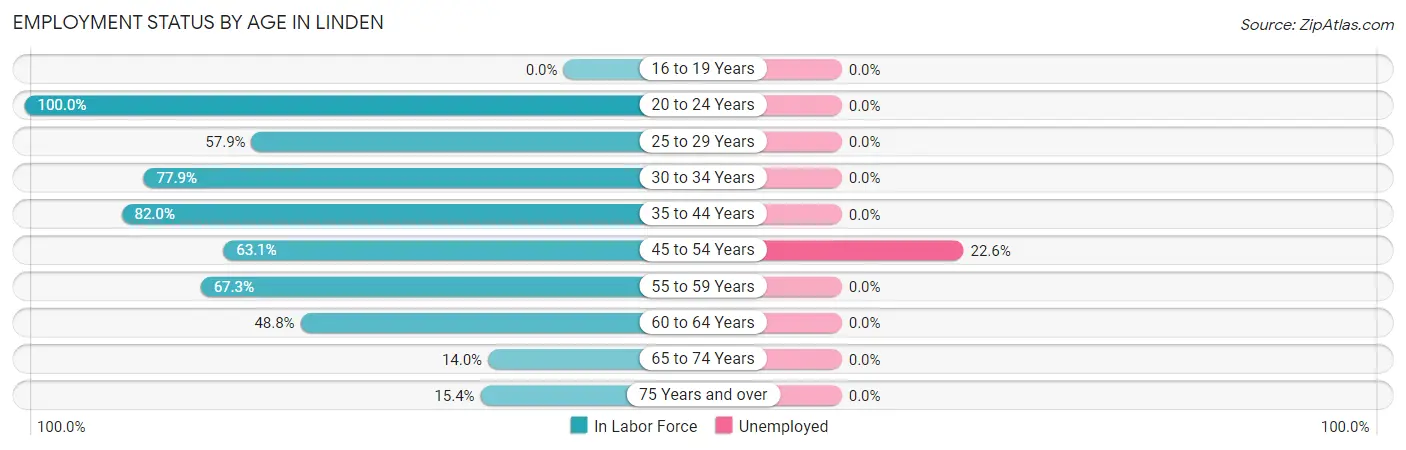
| Age Bracket | In Labor Force | Unemployed |
| 16 to 19 Years | 0 (0.0%) | 0 (0.0%) |
| 20 to 24 Years | 112 (100.0%) | 0 (0.0%) |
| 25 to 29 Years | 33 (57.9%) | 0 (0.0%) |
| 30 to 34 Years | 60 (77.9%) | 0 (0.0%) |
| 35 to 44 Years | 114 (82.0%) | 0 (0.0%) |
| 45 to 54 Years | 164 (63.1%) | 37 (22.6%) |
| 55 to 59 Years | 148 (67.3%) | 0 (0.0%) |
| 60 to 64 Years | 167 (48.8%) | 0 (0.0%) |
| 65 to 74 Years | 62 (14.0%) | 0 (0.0%) |
| 75 Years and over | 47 (15.4%) | 0 (0.0%) |
| Total | 907 (44.2%) | 37 (4.1%) |
Employment Status by Educational Attainment in Linden
According to labor force statistics for Linden, 62.6% of individuals (685) out of the total population between 25 and 64 years of age (1,095) are in the labor force, with 5.4% or 37 of them being unemployed. The group with the highest labor force participation rate are those with the educational attainment of bachelor's degree or higher, with 69.0% or 145 individuals in the labor force. Within the labor force, individuals with high school diploma education have the highest percentage of unemployment, with 25.2% or 37 of them being unemployed.
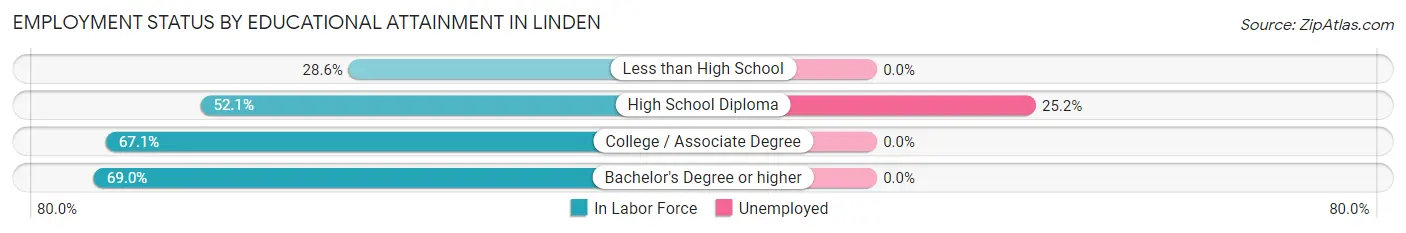
| Educational Attainment | In Labor Force | Unemployed |
| Less than High School | 8 (28.6%) | 0 (0.0%) |
| High School Diploma | 147 (52.1%) | 71 (25.2%) |
| College / Associate Degree | 386 (67.1%) | 0 (0.0%) |
| Bachelor's Degree or higher | 145 (69.0%) | 0 (0.0%) |
| Total | 685 (62.6%) | 59 (5.4%) |
Employment Occupations by Sex in Linden
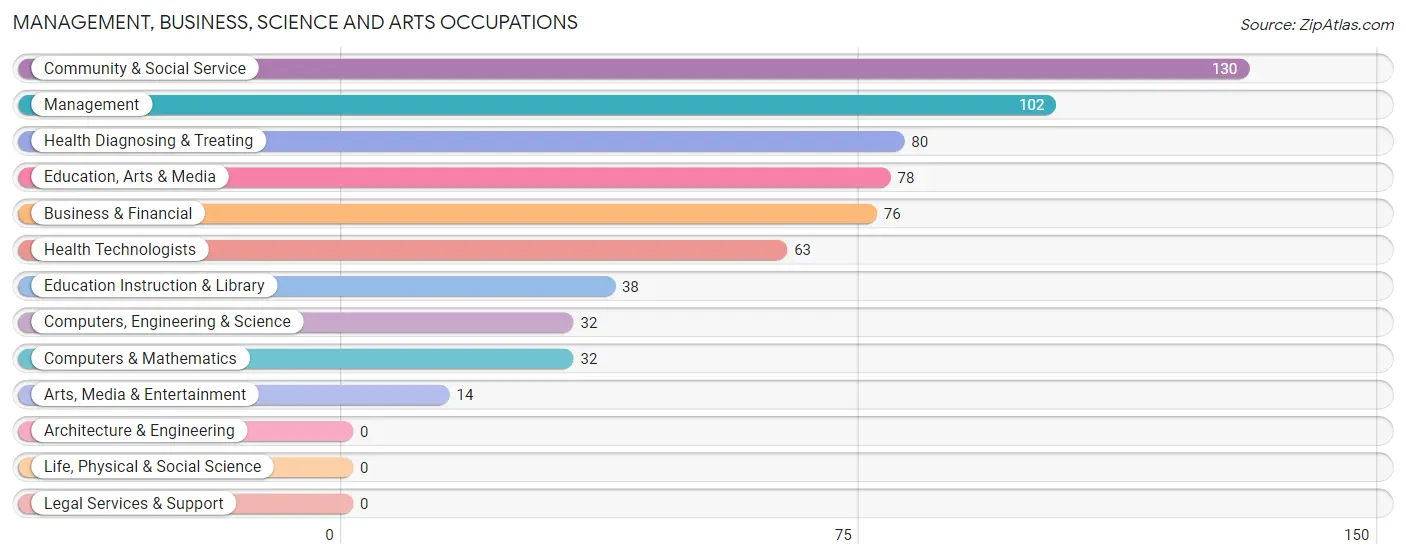
Management, Business, Science and Arts Occupations
The most common Management, Business, Science and Arts occupations in Linden are Community & Social Service (130 | 14.9%), Management (102 | 11.7%), Health Diagnosing & Treating (80 | 9.2%), Education, Arts & Media (78 | 9.0%), and Business & Financial (76 | 8.7%).
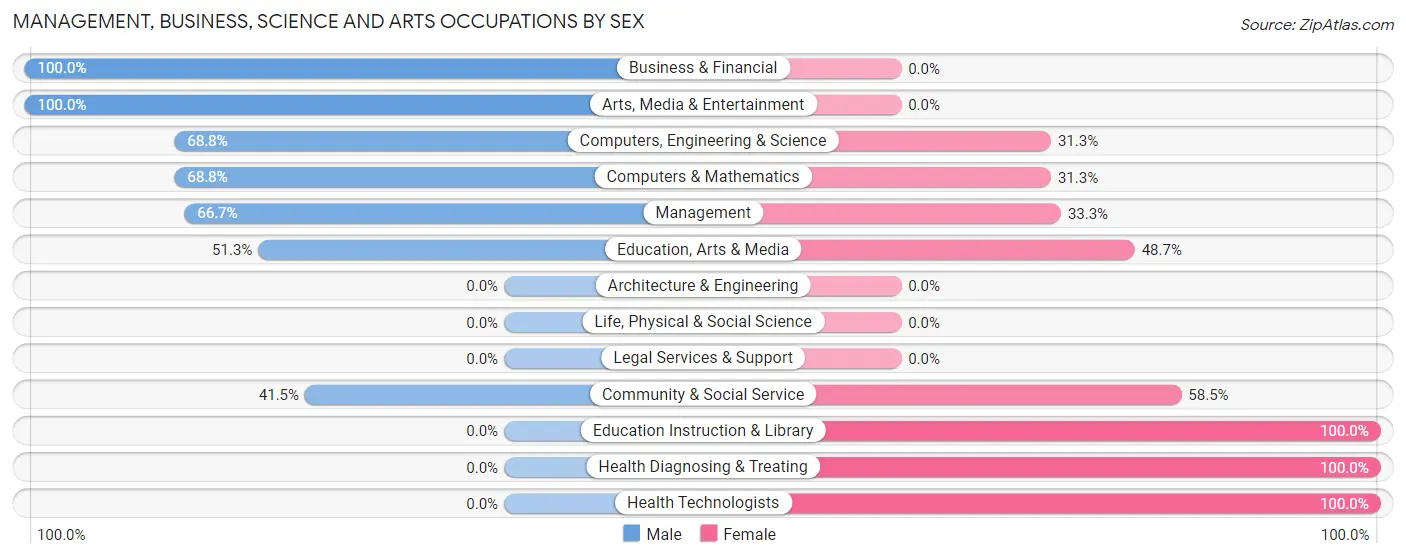
Management, Business, Science and Arts Occupations by Sex
Within the Management, Business, Science and Arts occupations in Linden, the most male-oriented occupations are Business & Financial (100.0%), Arts, Media & Entertainment (100.0%), and Computers, Engineering & Science (68.8%), while the most female-oriented occupations are Education Instruction & Library (100.0%), Health Diagnosing & Treating (100.0%), and Health Technologists (100.0%).
| Occupation | Male | Female |
| Management | 68 (66.7%) | 34 (33.3%) |
| Business & Financial | 76 (100.0%) | 0 (0.0%) |
| Computers, Engineering & Science | 22 (68.8%) | 10 (31.2%) |
| Computers & Mathematics | 22 (68.8%) | 10 (31.2%) |
| Architecture & Engineering | 0 (0.0%) | 0 (0.0%) |
| Life, Physical & Social Science | 0 (0.0%) | 0 (0.0%) |
| Community & Social Service | 54 (41.5%) | 76 (58.5%) |
| Education, Arts & Media | 40 (51.3%) | 38 (48.7%) |
| Legal Services & Support | 0 (0.0%) | 0 (0.0%) |
| Education Instruction & Library | 0 (0.0%) | 38 (100.0%) |
| Arts, Media & Entertainment | 14 (100.0%) | 0 (0.0%) |
| Health Diagnosing & Treating | 0 (0.0%) | 80 (100.0%) |
| Health Technologists | 0 (0.0%) | 63 (100.0%) |
| Total (Category) | 220 (52.4%) | 200 (47.6%) |
| Total (Overall) | 517 (59.4%) | 353 (40.6%) |
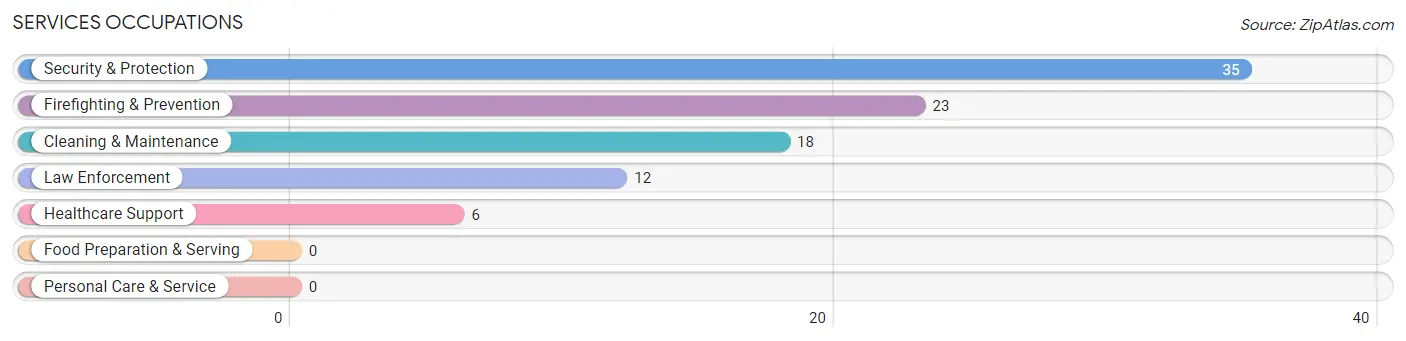
Services Occupations
The most common Services occupations in Linden are Security & Protection (35 | 4.0%), Firefighting & Prevention (23 | 2.6%), Cleaning & Maintenance (18 | 2.1%), Law Enforcement (12 | 1.4%), and Healthcare Support (6 | 0.7%).
Services Occupations by Sex
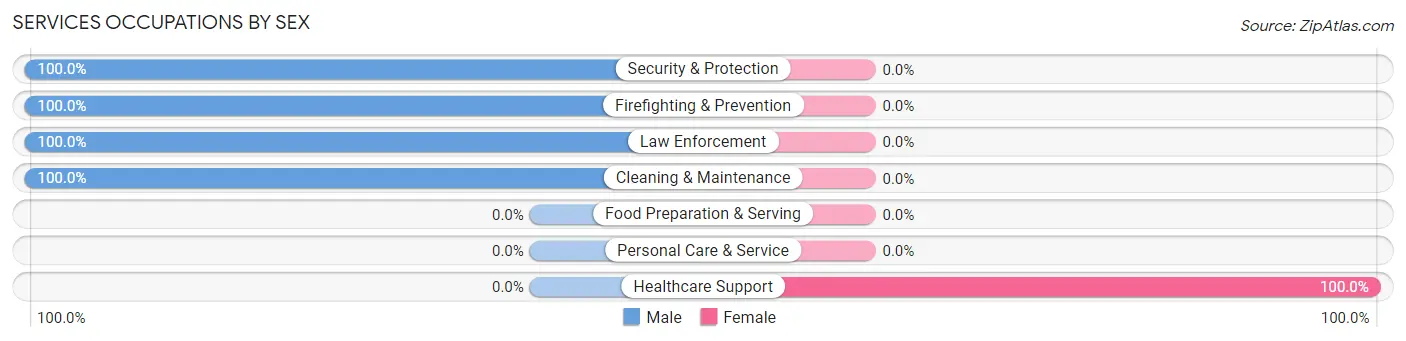
| Occupation | Male | Female |
| Healthcare Support | 0 (0.0%) | 6 (100.0%) |
| Security & Protection | 35 (100.0%) | 0 (0.0%) |
| Firefighting & Prevention | 23 (100.0%) | 0 (0.0%) |
| Law Enforcement | 12 (100.0%) | 0 (0.0%) |
| Food Preparation & Serving | 0 (0.0%) | 0 (0.0%) |
| Cleaning & Maintenance | 18 (100.0%) | 0 (0.0%) |
| Personal Care & Service | 0 (0.0%) | 0 (0.0%) |
| Total (Category) | 53 (89.8%) | 6 (10.2%) |
| Total (Overall) | 517 (59.4%) | 353 (40.6%) |
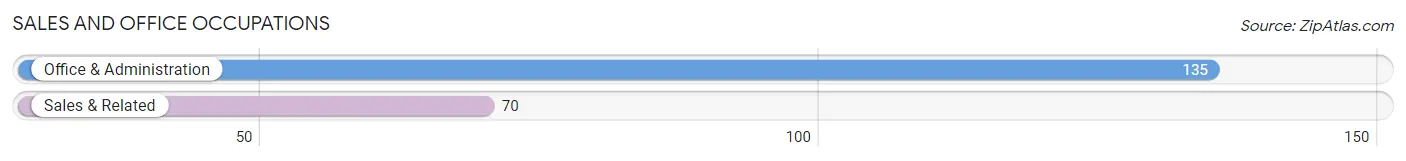
Sales and Office Occupations
The most common Sales and Office occupations in Linden are Office & Administration (135 | 15.5%), and Sales & Related (70 | 8.1%).
Sales and Office Occupations by Sex
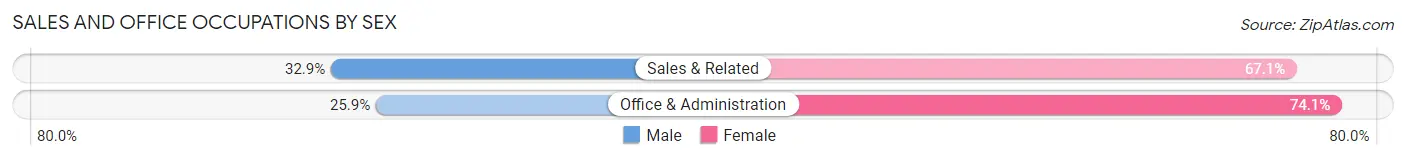
| Occupation | Male | Female |
| Sales & Related | 23 (32.9%) | 47 (67.1%) |
| Office & Administration | 35 (25.9%) | 100 (74.1%) |
| Total (Category) | 58 (28.3%) | 147 (71.7%) |
| Total (Overall) | 517 (59.4%) | 353 (40.6%) |
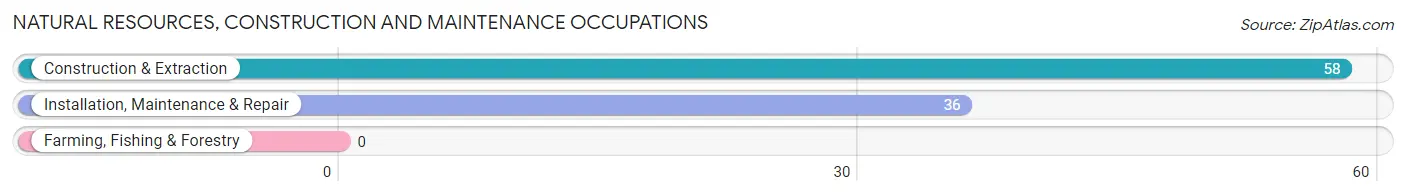
Natural Resources, Construction and Maintenance Occupations
The most common Natural Resources, Construction and Maintenance occupations in Linden are Construction & Extraction (58 | 6.7%), and Installation, Maintenance & Repair (36 | 4.1%).
Natural Resources, Construction and Maintenance Occupations by Sex
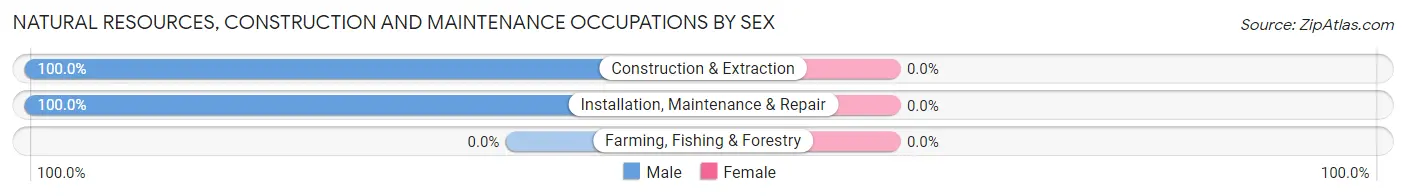
| Occupation | Male | Female |
| Farming, Fishing & Forestry | 0 (0.0%) | 0 (0.0%) |
| Construction & Extraction | 58 (100.0%) | 0 (0.0%) |
| Installation, Maintenance & Repair | 36 (100.0%) | 0 (0.0%) |
| Total (Category) | 94 (100.0%) | 0 (0.0%) |
| Total (Overall) | 517 (59.4%) | 353 (40.6%) |
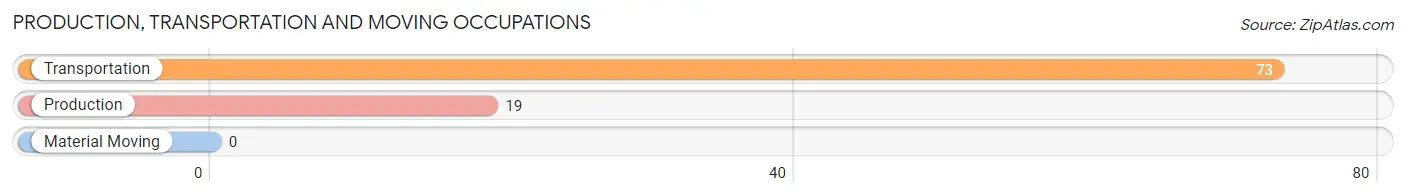
Production, Transportation and Moving Occupations
The most common Production, Transportation and Moving occupations in Linden are Transportation (73 | 8.4%), and Production (19 | 2.2%).
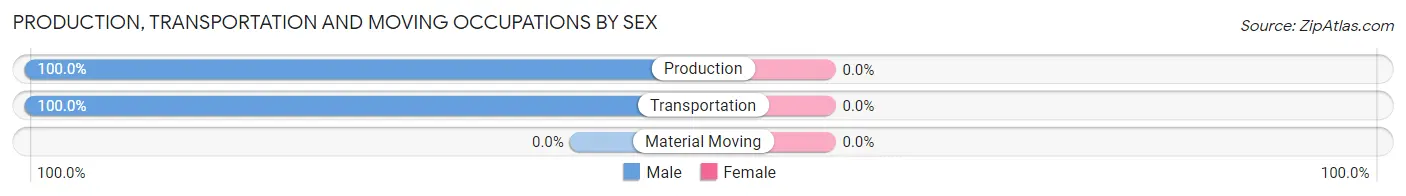
Production, Transportation and Moving Occupations by Sex
| Occupation | Male | Female |
| Production | 19 (100.0%) | 0 (0.0%) |
| Transportation | 73 (100.0%) | 0 (0.0%) |
| Material Moving | 0 (0.0%) | 0 (0.0%) |
| Total (Category) | 92 (100.0%) | 0 (0.0%) |
| Total (Overall) | 517 (59.4%) | 353 (40.6%) |
Employment Industries by Sex in Linden
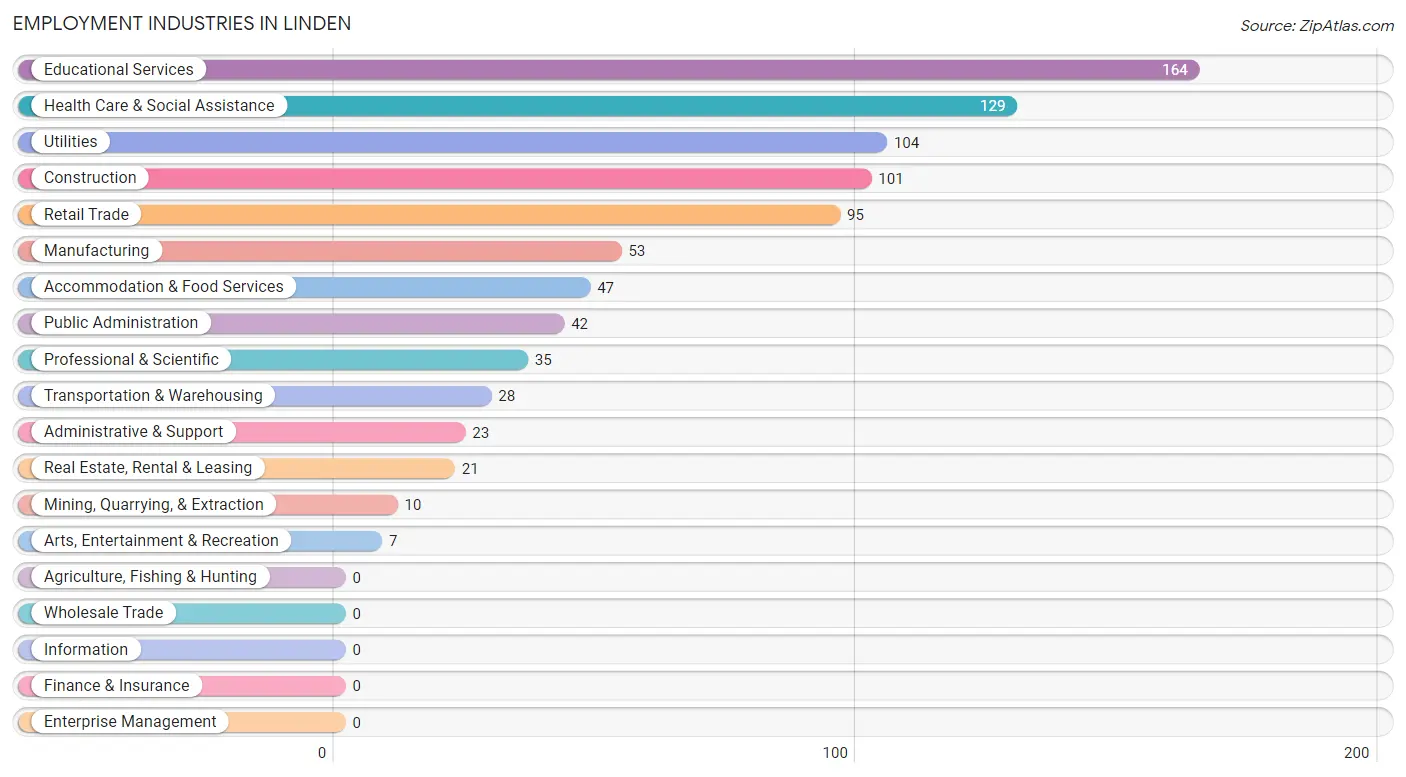
Employment Industries in Linden
The major employment industries in Linden include Educational Services (164 | 18.9%), Health Care & Social Assistance (129 | 14.8%), Utilities (104 | 11.9%), Construction (101 | 11.6%), and Retail Trade (95 | 10.9%).
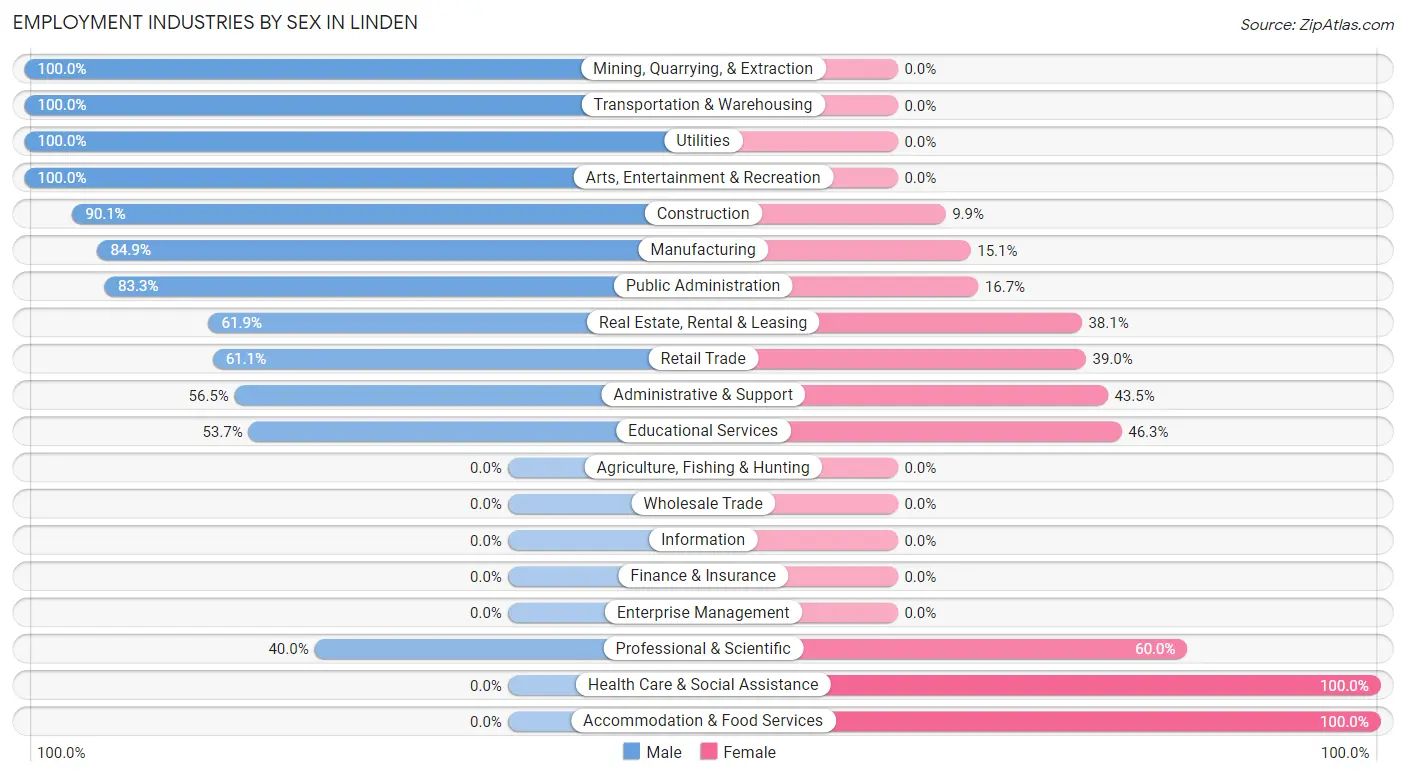
Employment Industries by Sex in Linden
The Linden industries that see more men than women are Mining, Quarrying, & Extraction (100.0%), Transportation & Warehousing (100.0%), and Utilities (100.0%), whereas the industries that tend to have a higher number of women are Health Care & Social Assistance (100.0%), Accommodation & Food Services (100.0%), and Professional & Scientific (60.0%).
| Industry | Male | Female |
| Agriculture, Fishing & Hunting | 0 (0.0%) | 0 (0.0%) |
| Mining, Quarrying, & Extraction | 10 (100.0%) | 0 (0.0%) |
| Construction | 91 (90.1%) | 10 (9.9%) |
| Manufacturing | 45 (84.9%) | 8 (15.1%) |
| Wholesale Trade | 0 (0.0%) | 0 (0.0%) |
| Retail Trade | 58 (61.1%) | 37 (39.0%) |
| Transportation & Warehousing | 28 (100.0%) | 0 (0.0%) |
| Utilities | 104 (100.0%) | 0 (0.0%) |
| Information | 0 (0.0%) | 0 (0.0%) |
| Finance & Insurance | 0 (0.0%) | 0 (0.0%) |
| Real Estate, Rental & Leasing | 13 (61.9%) | 8 (38.1%) |
| Professional & Scientific | 14 (40.0%) | 21 (60.0%) |
| Enterprise Management | 0 (0.0%) | 0 (0.0%) |
| Administrative & Support | 13 (56.5%) | 10 (43.5%) |
| Educational Services | 88 (53.7%) | 76 (46.3%) |
| Health Care & Social Assistance | 0 (0.0%) | 129 (100.0%) |
| Arts, Entertainment & Recreation | 7 (100.0%) | 0 (0.0%) |
| Accommodation & Food Services | 0 (0.0%) | 47 (100.0%) |
| Public Administration | 35 (83.3%) | 7 (16.7%) |
| Total | 517 (59.4%) | 353 (40.6%) |
Education in Linden
School Enrollment in Linden
The most common levels of schooling among the 516 students in Linden are elementary school (124 | 24.0%), high school (112 | 21.7%), and kindergarten (92 | 17.8%).
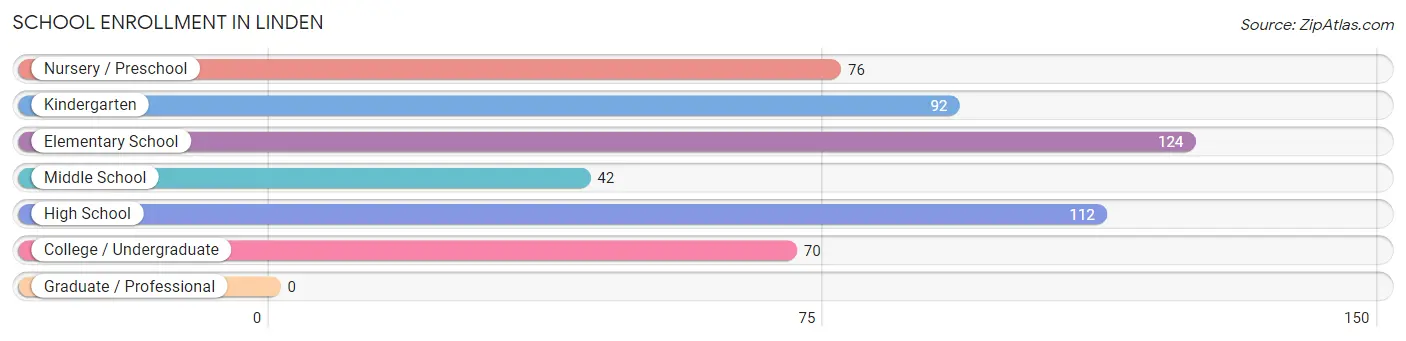
| School Level | # Students | % Students |
| Nursery / Preschool | 76 | 14.7% |
| Kindergarten | 92 | 17.8% |
| Elementary School | 124 | 24.0% |
| Middle School | 42 | 8.1% |
| High School | 112 | 21.7% |
| College / Undergraduate | 70 | 13.6% |
| Graduate / Professional | 0 | 0.0% |
| Total | 516 | 100.0% |
School Enrollment by Age by Funding Source in Linden
Out of a total of 516 students who are enrolled in schools in Linden, 24 (4.7%) attend a private institution, while the remaining 492 (95.3%) are enrolled in public schools. The age group of 3 to 4 year olds has the highest likelihood of being enrolled in private schools, with 24 (31.6% in the age bracket) enrolled. Conversely, the age group of 5 to 9 year old has the lowest likelihood of being enrolled in a private school, with 216 (100.0% in the age bracket) attending a public institution.
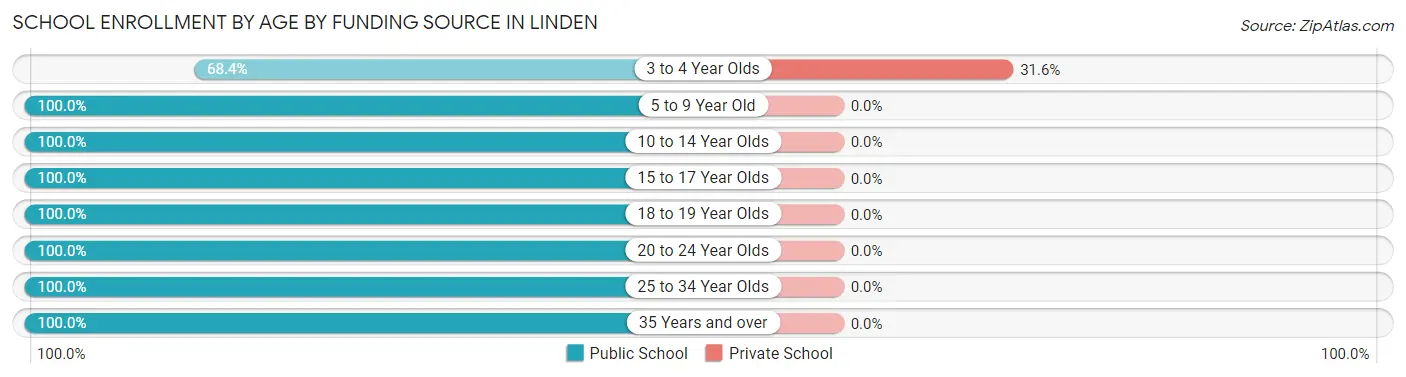
| Age Bracket | Public School | Private School |
| 3 to 4 Year Olds | 52 (68.4%) | 24 (31.6%) |
| 5 to 9 Year Old | 216 (100.0%) | 0 (0.0%) |
| 10 to 14 Year Olds | 42 (100.0%) | 0 (0.0%) |
| 15 to 17 Year Olds | 80 (100.0%) | 0 (0.0%) |
| 18 to 19 Year Olds | 11 (100.0%) | 0 (0.0%) |
| 20 to 24 Year Olds | 21 (100.0%) | 0 (0.0%) |
| 25 to 34 Year Olds | 33 (100.0%) | 0 (0.0%) |
| 35 Years and over | 37 (100.0%) | 0 (0.0%) |
| Total | 492 (95.3%) | 24 (4.7%) |
Educational Attainment by Field of Study in Linden
Business (118 | 29.8%), arts & humanities (66 | 16.7%), education (64 | 16.2%), bio, nature & agricultural (62 | 15.7%), and science & technology (39 | 9.9%) are the most common fields of study among 396 individuals in Linden who have obtained a bachelor's degree or higher.
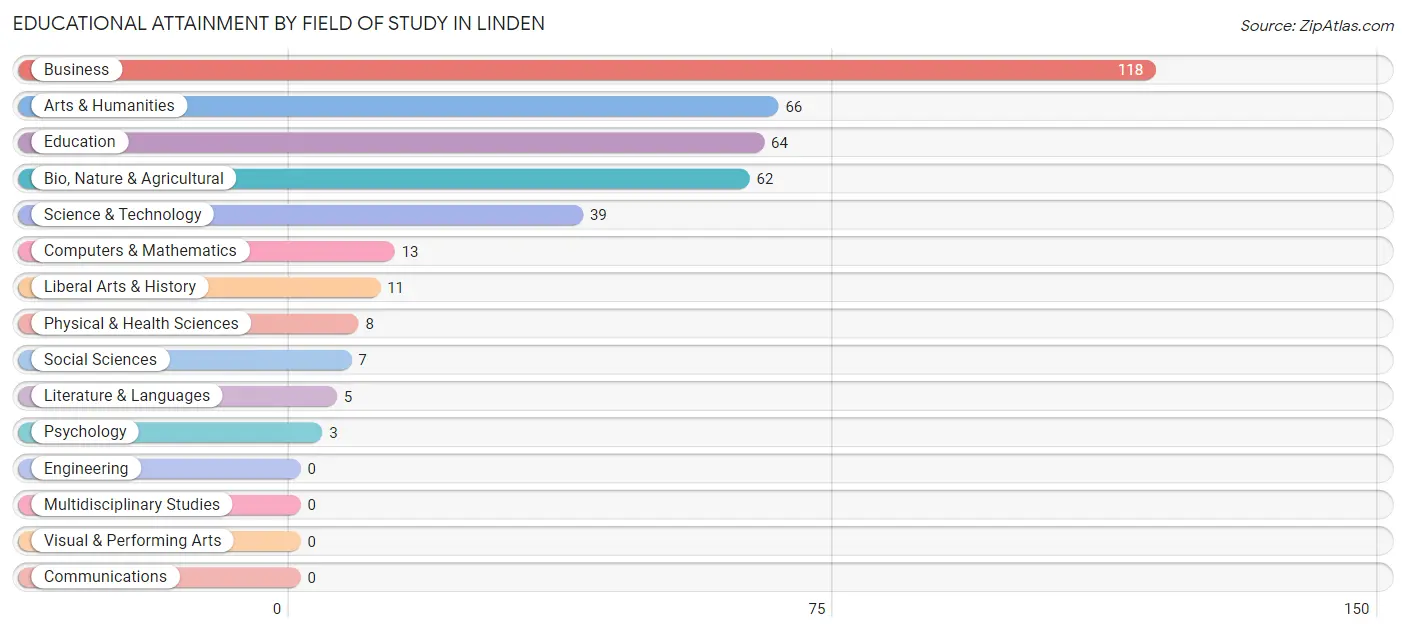
| Field of Study | # Graduates | % Graduates |
| Computers & Mathematics | 13 | 3.3% |
| Bio, Nature & Agricultural | 62 | 15.7% |
| Physical & Health Sciences | 8 | 2.0% |
| Psychology | 3 | 0.8% |
| Social Sciences | 7 | 1.8% |
| Engineering | 0 | 0.0% |
| Multidisciplinary Studies | 0 | 0.0% |
| Science & Technology | 39 | 9.9% |
| Business | 118 | 29.8% |
| Education | 64 | 16.2% |
| Literature & Languages | 5 | 1.3% |
| Liberal Arts & History | 11 | 2.8% |
| Visual & Performing Arts | 0 | 0.0% |
| Communications | 0 | 0.0% |
| Arts & Humanities | 66 | 16.7% |
| Total | 396 | 100.0% |
Transportation & Commute in Linden
Vehicle Availability by Sex in Linden
The most prevalent vehicle ownership categories in Linden are males with 3 vehicles (147, accounting for 29.6%) and females with 3 vehicles (125, making up 41.6%).
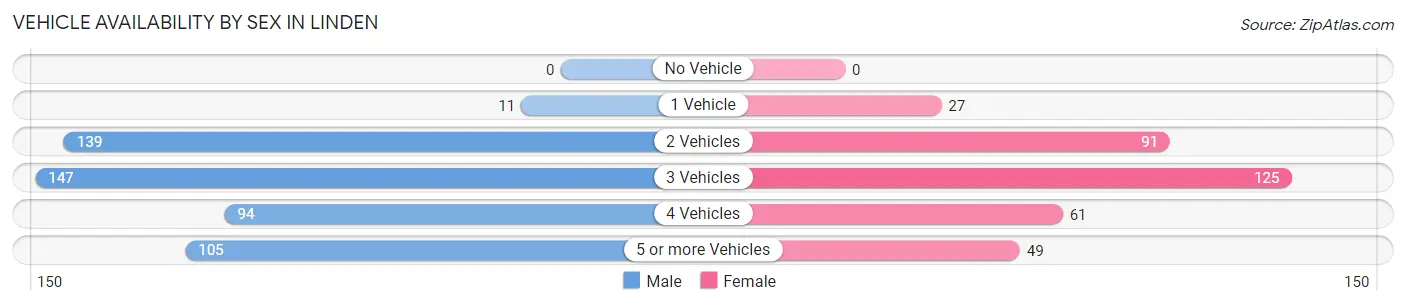
| Vehicles Available | Male | Female |
| No Vehicle | 0 (0.0%) | 0 (0.0%) |
| 1 Vehicle | 11 (2.2%) | 27 (7.6%) |
| 2 Vehicles | 139 (28.0%) | 91 (25.8%) |
| 3 Vehicles | 147 (29.6%) | 125 (35.4%) |
| 4 Vehicles | 94 (19.0%) | 61 (17.3%) |
| 5 or more Vehicles | 105 (21.2%) | 49 (13.9%) |
| Total | 496 (100.0%) | 353 (100.0%) |
Commute Time in Linden
The most frequently occuring commute durations in Linden are 15 to 19 minutes (166 commuters, 23.1%), 60 to 89 minutes (99 commuters, 13.8%), and 20 to 24 minutes (84 commuters, 11.7%).
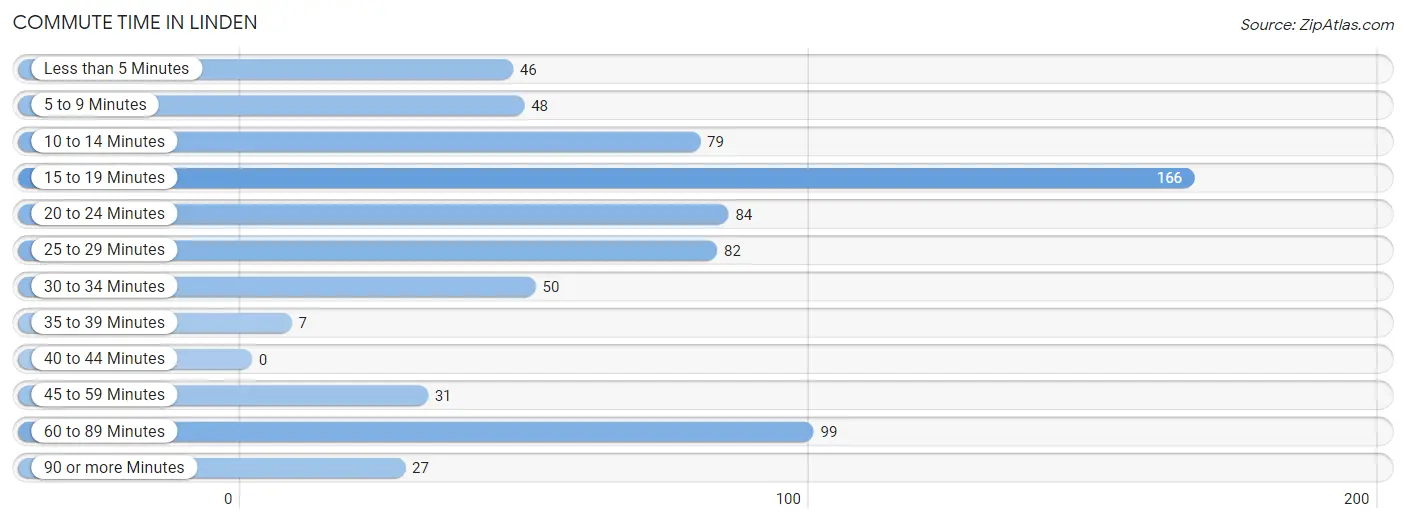
| Commute Time | # Commuters | % Commuters |
| Less than 5 Minutes | 46 | 6.4% |
| 5 to 9 Minutes | 48 | 6.7% |
| 10 to 14 Minutes | 79 | 11.0% |
| 15 to 19 Minutes | 166 | 23.1% |
| 20 to 24 Minutes | 84 | 11.7% |
| 25 to 29 Minutes | 82 | 11.4% |
| 30 to 34 Minutes | 50 | 7.0% |
| 35 to 39 Minutes | 7 | 1.0% |
| 40 to 44 Minutes | 0 | 0.0% |
| 45 to 59 Minutes | 31 | 4.3% |
| 60 to 89 Minutes | 99 | 13.8% |
| 90 or more Minutes | 27 | 3.8% |
Commute Time by Sex in Linden
The most common commute times in Linden are 15 to 19 minutes (117 commuters, 28.7%) for males and 20 to 24 minutes (50 commuters, 16.0%) for females.
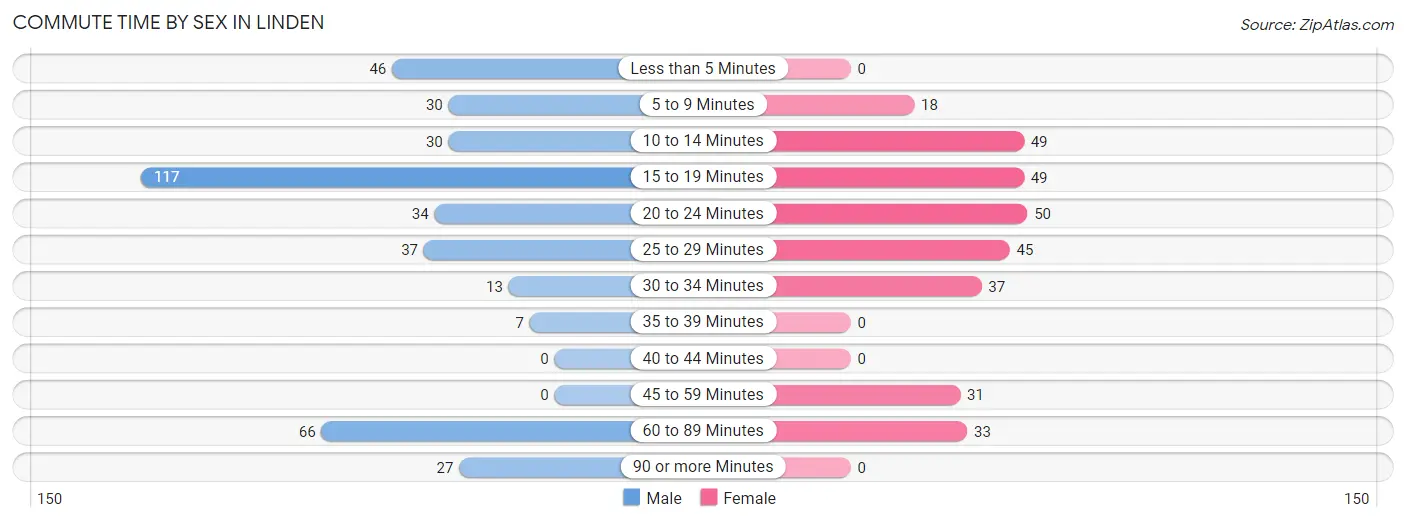
| Commute Time | Male | Female |
| Less than 5 Minutes | 46 (11.3%) | 0 (0.0%) |
| 5 to 9 Minutes | 30 (7.4%) | 18 (5.8%) |
| 10 to 14 Minutes | 30 (7.4%) | 49 (15.7%) |
| 15 to 19 Minutes | 117 (28.7%) | 49 (15.7%) |
| 20 to 24 Minutes | 34 (8.4%) | 50 (16.0%) |
| 25 to 29 Minutes | 37 (9.1%) | 45 (14.4%) |
| 30 to 34 Minutes | 13 (3.2%) | 37 (11.9%) |
| 35 to 39 Minutes | 7 (1.7%) | 0 (0.0%) |
| 40 to 44 Minutes | 0 (0.0%) | 0 (0.0%) |
| 45 to 59 Minutes | 0 (0.0%) | 31 (9.9%) |
| 60 to 89 Minutes | 66 (16.2%) | 33 (10.6%) |
| 90 or more Minutes | 27 (6.6%) | 0 (0.0%) |
Time of Departure to Work by Sex in Linden
The most frequent times of departure to work in Linden are 12:00 AM to 4:59 AM (116, 28.5%) for males and 7:30 AM to 7:59 AM (100, 32.1%) for females.
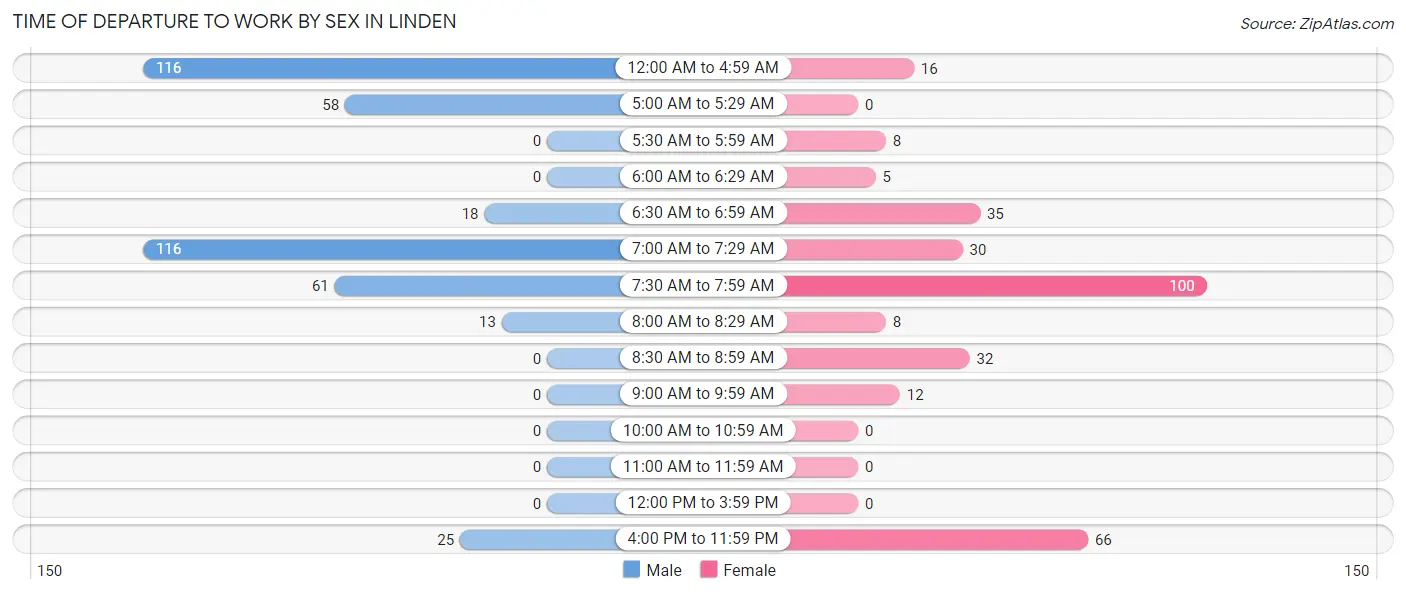
| Time of Departure | Male | Female |
| 12:00 AM to 4:59 AM | 116 (28.5%) | 16 (5.1%) |
| 5:00 AM to 5:29 AM | 58 (14.2%) | 0 (0.0%) |
| 5:30 AM to 5:59 AM | 0 (0.0%) | 8 (2.6%) |
| 6:00 AM to 6:29 AM | 0 (0.0%) | 5 (1.6%) |
| 6:30 AM to 6:59 AM | 18 (4.4%) | 35 (11.2%) |
| 7:00 AM to 7:29 AM | 116 (28.5%) | 30 (9.6%) |
| 7:30 AM to 7:59 AM | 61 (15.0%) | 100 (32.1%) |
| 8:00 AM to 8:29 AM | 13 (3.2%) | 8 (2.6%) |
| 8:30 AM to 8:59 AM | 0 (0.0%) | 32 (10.3%) |
| 9:00 AM to 9:59 AM | 0 (0.0%) | 12 (3.8%) |
| 10:00 AM to 10:59 AM | 0 (0.0%) | 0 (0.0%) |
| 11:00 AM to 11:59 AM | 0 (0.0%) | 0 (0.0%) |
| 12:00 PM to 3:59 PM | 0 (0.0%) | 0 (0.0%) |
| 4:00 PM to 11:59 PM | 25 (6.1%) | 66 (21.1%) |
| Total | 407 (100.0%) | 312 (100.0%) |
Housing Occupancy in Linden
Occupancy by Ownership in Linden
Of the total 963 dwellings in Linden, owner-occupied units account for 872 (90.5%), while renter-occupied units make up 91 (9.5%).
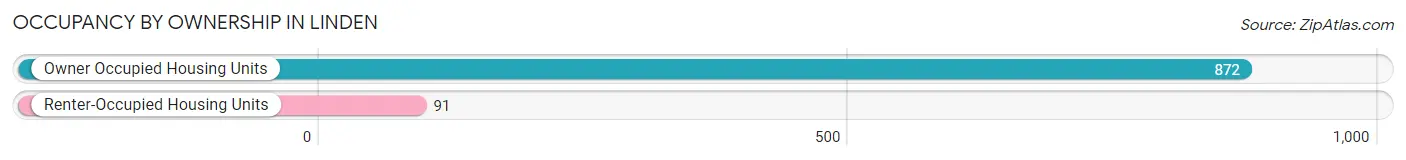
| Occupancy | # Housing Units | % Housing Units |
| Owner Occupied Housing Units | 872 | 90.5% |
| Renter-Occupied Housing Units | 91 | 9.5% |
| Total Occupied Housing Units | 963 | 100.0% |
Occupancy by Household Size in Linden
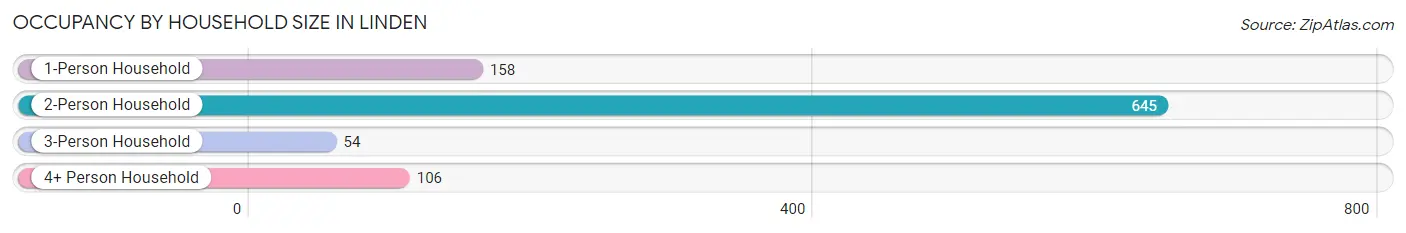
| Household Size | # Housing Units | % Housing Units |
| 1-Person Household | 158 | 16.4% |
| 2-Person Household | 645 | 67.0% |
| 3-Person Household | 54 | 5.6% |
| 4+ Person Household | 106 | 11.0% |
| Total Housing Units | 963 | 100.0% |
Occupancy by Ownership by Household Size in Linden
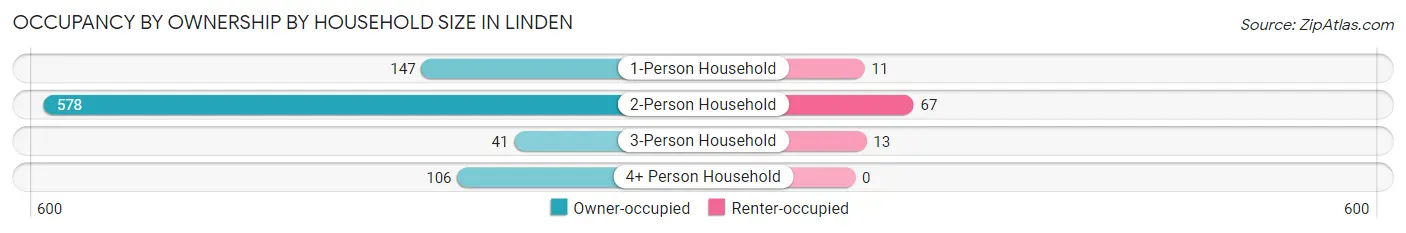
| Household Size | Owner-occupied | Renter-occupied |
| 1-Person Household | 147 (93.0%) | 11 (7.0%) |
| 2-Person Household | 578 (89.6%) | 67 (10.4%) |
| 3-Person Household | 41 (75.9%) | 13 (24.1%) |
| 4+ Person Household | 106 (100.0%) | 0 (0.0%) |
| Total Housing Units | 872 (90.5%) | 91 (9.5%) |
Occupancy by Educational Attainment in Linden
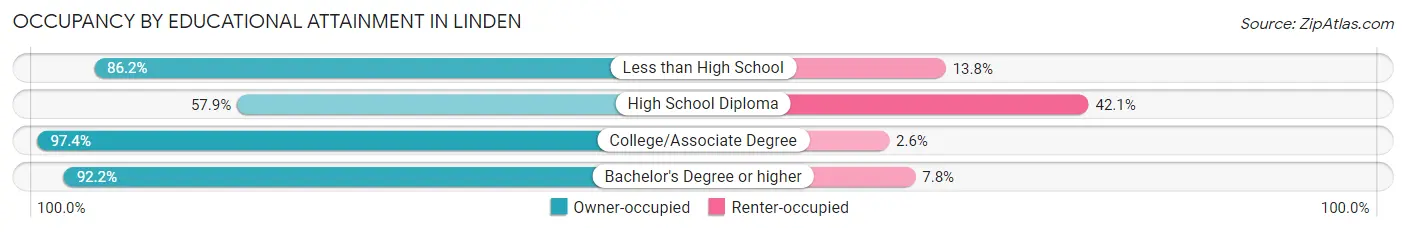
| Household Size | Owner-occupied | Renter-occupied |
| Less than High School | 50 (86.2%) | 8 (13.8%) |
| High School Diploma | 66 (57.9%) | 48 (42.1%) |
| College/Associate Degree | 495 (97.4%) | 13 (2.6%) |
| Bachelor's Degree or higher | 261 (92.2%) | 22 (7.8%) |
Occupancy by Age of Householder in Linden
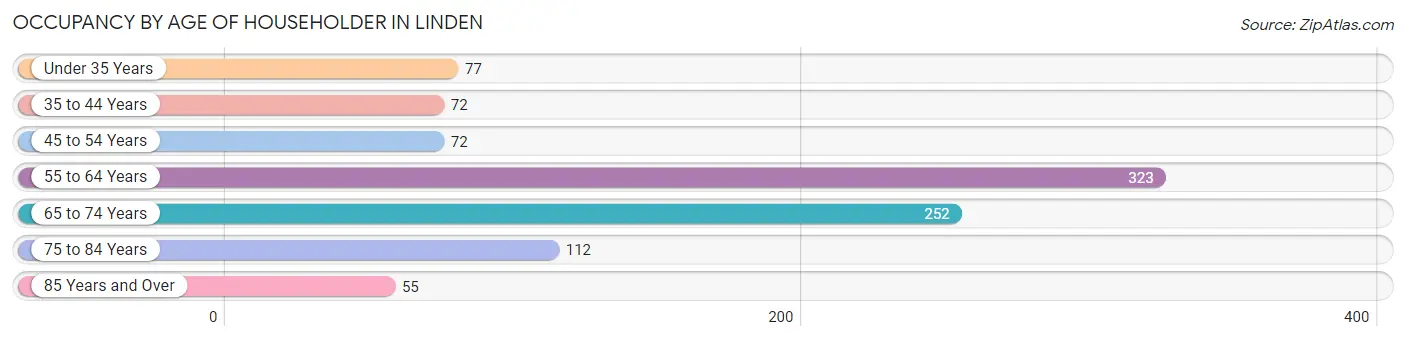
| Age Bracket | # Households | % Households |
| Under 35 Years | 77 | 8.0% |
| 35 to 44 Years | 72 | 7.5% |
| 45 to 54 Years | 72 | 7.5% |
| 55 to 64 Years | 323 | 33.5% |
| 65 to 74 Years | 252 | 26.2% |
| 75 to 84 Years | 112 | 11.6% |
| 85 Years and Over | 55 | 5.7% |
| Total | 963 | 100.0% |
Housing Finances in Linden
Median Income by Occupancy in Linden
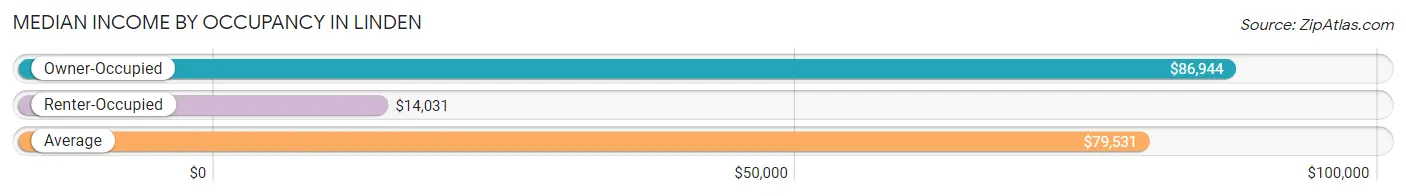
| Occupancy Type | # Households | Median Income |
| Owner-Occupied | 872 (90.5%) | $86,944 |
| Renter-Occupied | 91 (9.5%) | $14,031 |
| Average | 963 (100.0%) | $79,531 |
Occupancy by Householder Income Bracket in Linden
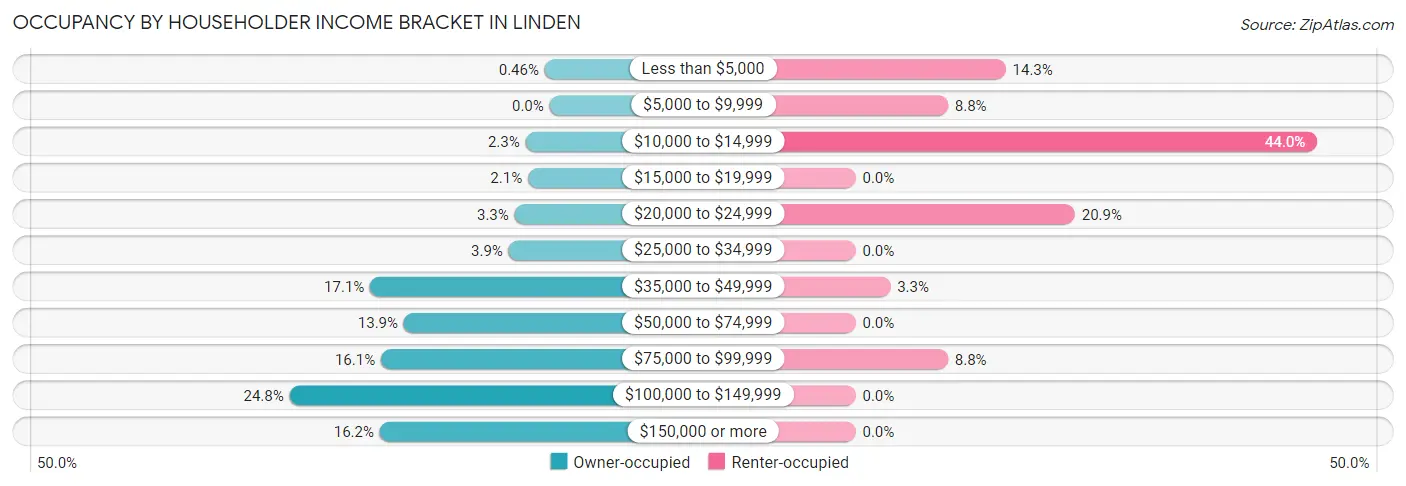
| Income Bracket | Owner-occupied | Renter-occupied |
| Less than $5,000 | 4 (0.5%) | 13 (14.3%) |
| $5,000 to $9,999 | 0 (0.0%) | 8 (8.8%) |
| $10,000 to $14,999 | 20 (2.3%) | 40 (44.0%) |
| $15,000 to $19,999 | 18 (2.1%) | 0 (0.0%) |
| $20,000 to $24,999 | 29 (3.3%) | 19 (20.9%) |
| $25,000 to $34,999 | 34 (3.9%) | 0 (0.0%) |
| $35,000 to $49,999 | 149 (17.1%) | 3 (3.3%) |
| $50,000 to $74,999 | 121 (13.9%) | 0 (0.0%) |
| $75,000 to $99,999 | 140 (16.1%) | 8 (8.8%) |
| $100,000 to $149,999 | 216 (24.8%) | 0 (0.0%) |
| $150,000 or more | 141 (16.2%) | 0 (0.0%) |
| Total | 872 (100.0%) | 91 (100.0%) |
Monthly Housing Cost Tiers in Linden
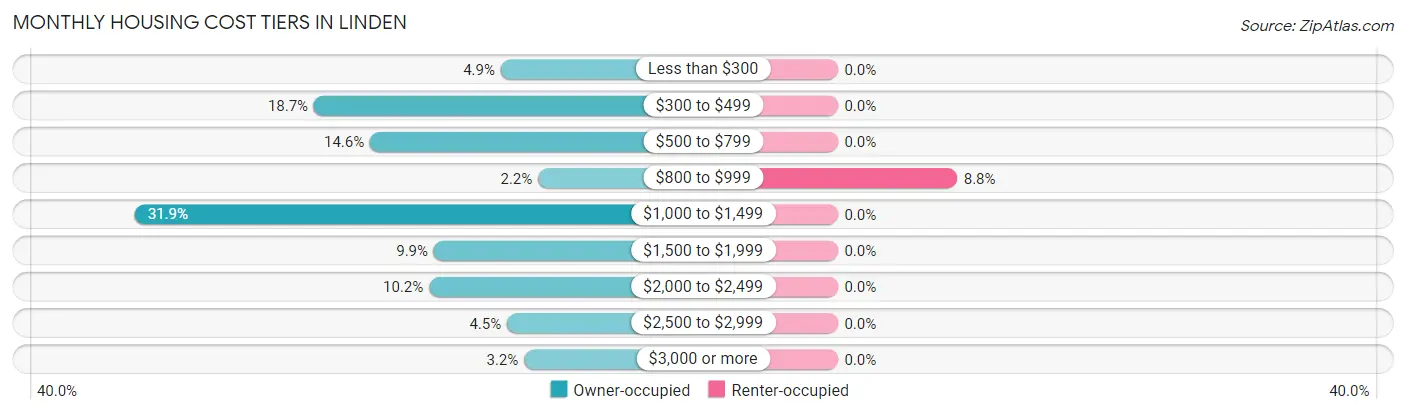
| Monthly Cost | Owner-occupied | Renter-occupied |
| Less than $300 | 43 (4.9%) | 0 (0.0%) |
| $300 to $499 | 163 (18.7%) | 0 (0.0%) |
| $500 to $799 | 127 (14.6%) | 0 (0.0%) |
| $800 to $999 | 19 (2.2%) | 8 (8.8%) |
| $1,000 to $1,499 | 278 (31.9%) | 0 (0.0%) |
| $1,500 to $1,999 | 86 (9.9%) | 0 (0.0%) |
| $2,000 to $2,499 | 89 (10.2%) | 0 (0.0%) |
| $2,500 to $2,999 | 39 (4.5%) | 0 (0.0%) |
| $3,000 or more | 28 (3.2%) | 0 (0.0%) |
| Total | 872 (100.0%) | 91 (100.0%) |
Physical Housing Characteristics in Linden
Housing Structures in Linden
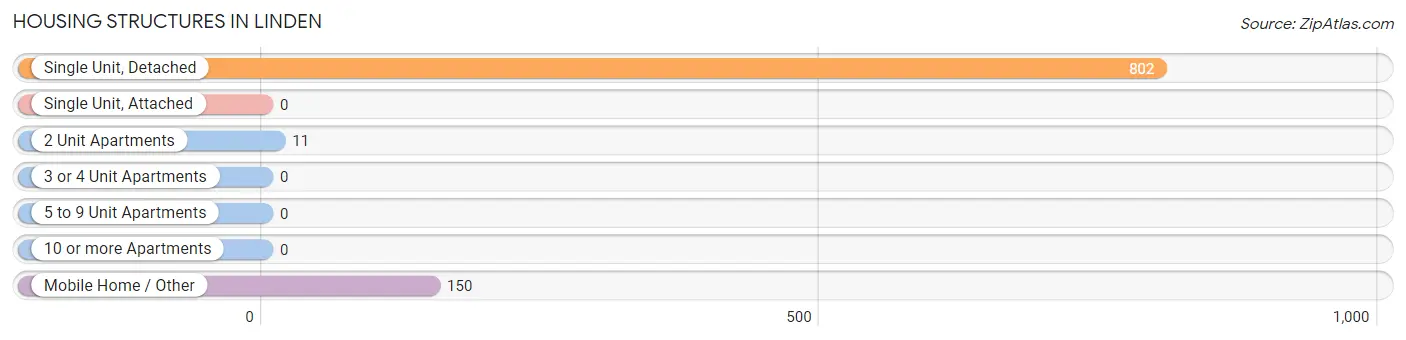
| Structure Type | # Housing Units | % Housing Units |
| Single Unit, Detached | 802 | 83.3% |
| Single Unit, Attached | 0 | 0.0% |
| 2 Unit Apartments | 11 | 1.1% |
| 3 or 4 Unit Apartments | 0 | 0.0% |
| 5 to 9 Unit Apartments | 0 | 0.0% |
| 10 or more Apartments | 0 | 0.0% |
| Mobile Home / Other | 150 | 15.6% |
| Total | 963 | 100.0% |
Housing Structures by Occupancy in Linden
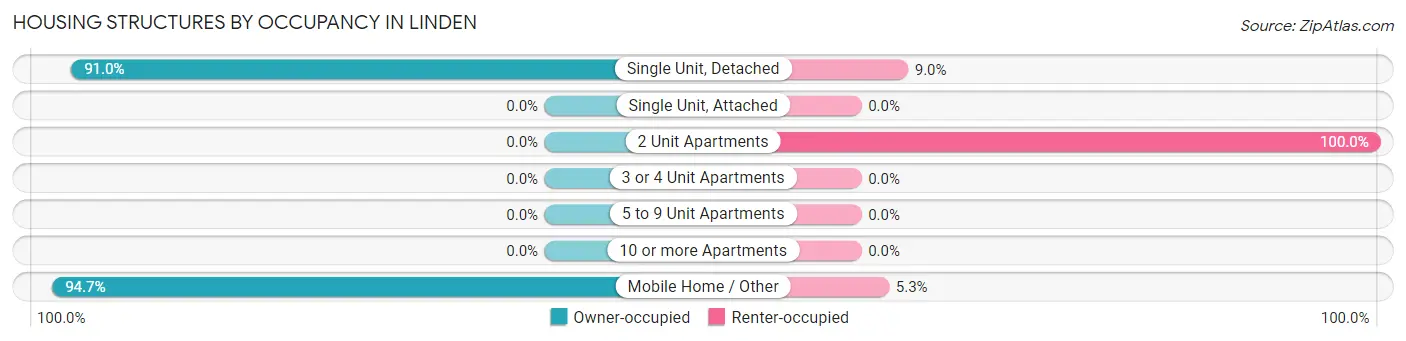
| Structure Type | Owner-occupied | Renter-occupied |
| Single Unit, Detached | 730 (91.0%) | 72 (9.0%) |
| Single Unit, Attached | 0 (0.0%) | 0 (0.0%) |
| 2 Unit Apartments | 0 (0.0%) | 11 (100.0%) |
| 3 or 4 Unit Apartments | 0 (0.0%) | 0 (0.0%) |
| 5 to 9 Unit Apartments | 0 (0.0%) | 0 (0.0%) |
| 10 or more Apartments | 0 (0.0%) | 0 (0.0%) |
| Mobile Home / Other | 142 (94.7%) | 8 (5.3%) |
| Total | 872 (90.5%) | 91 (9.5%) |
Housing Structures by Number of Rooms in Linden
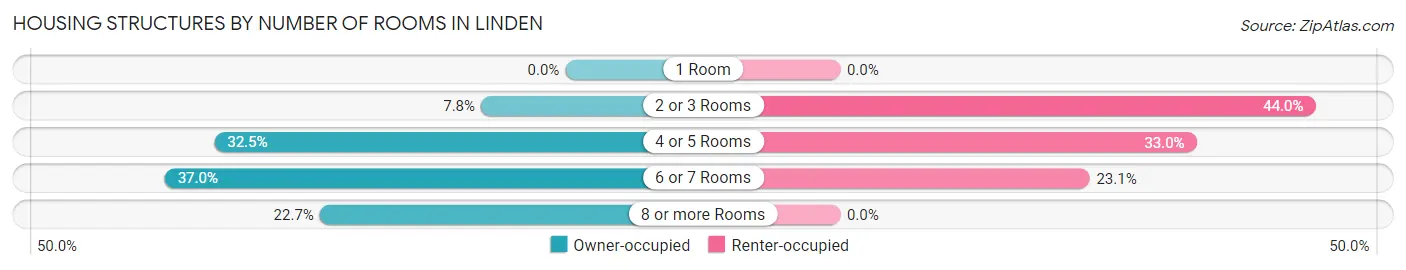
| Number of Rooms | Owner-occupied | Renter-occupied |
| 1 Room | 0 (0.0%) | 0 (0.0%) |
| 2 or 3 Rooms | 68 (7.8%) | 40 (44.0%) |
| 4 or 5 Rooms | 283 (32.5%) | 30 (33.0%) |
| 6 or 7 Rooms | 323 (37.0%) | 21 (23.1%) |
| 8 or more Rooms | 198 (22.7%) | 0 (0.0%) |
| Total | 872 (100.0%) | 91 (100.0%) |
Housing Structure by Heating Type in Linden
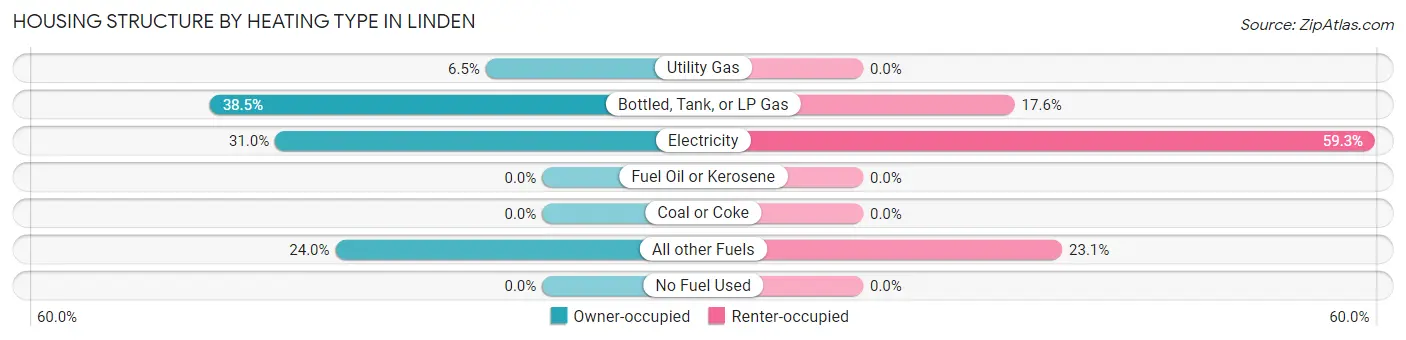
| Heating Type | Owner-occupied | Renter-occupied |
| Utility Gas | 57 (6.5%) | 0 (0.0%) |
| Bottled, Tank, or LP Gas | 336 (38.5%) | 16 (17.6%) |
| Electricity | 270 (31.0%) | 54 (59.3%) |
| Fuel Oil or Kerosene | 0 (0.0%) | 0 (0.0%) |
| Coal or Coke | 0 (0.0%) | 0 (0.0%) |
| All other Fuels | 209 (24.0%) | 21 (23.1%) |
| No Fuel Used | 0 (0.0%) | 0 (0.0%) |
| Total | 872 (100.0%) | 91 (100.0%) |
Household Vehicle Usage in Linden
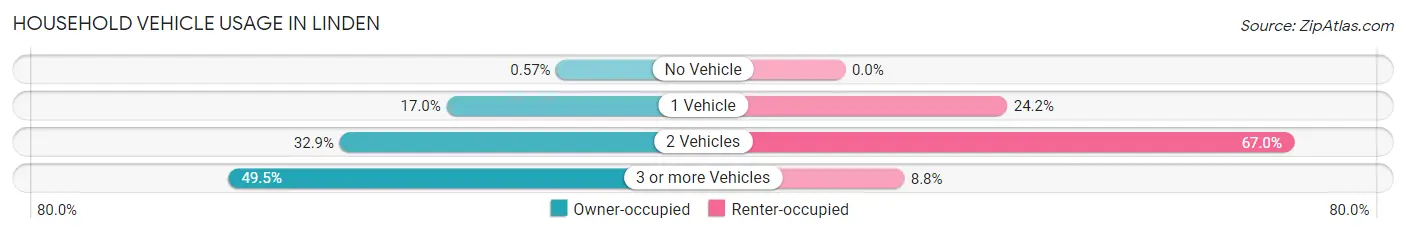
| Vehicles per Household | Owner-occupied | Renter-occupied |
| No Vehicle | 5 (0.6%) | 0 (0.0%) |
| 1 Vehicle | 148 (17.0%) | 22 (24.2%) |
| 2 Vehicles | 287 (32.9%) | 61 (67.0%) |
| 3 or more Vehicles | 432 (49.5%) | 8 (8.8%) |
| Total | 872 (100.0%) | 91 (100.0%) |
Real Estate & Mortgages in Linden
Real Estate and Mortgage Overview in Linden
| Characteristic | Without Mortgage | With Mortgage |
| Housing Units | 335 | 537 |
| Median Property Value | $370,200 | $355,400 |
| Median Household Income | $62,656 | $83 |
| Monthly Housing Costs | $458 | $28 |
| Real Estate Taxes | $1,789 | $0 |
Property Value by Mortgage Status in Linden
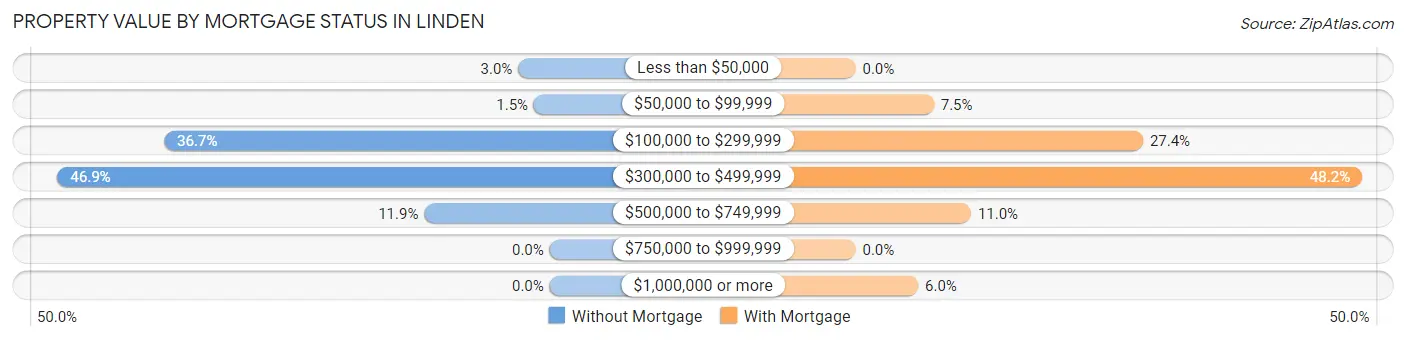
| Property Value | Without Mortgage | With Mortgage |
| Less than $50,000 | 10 (3.0%) | 0 (0.0%) |
| $50,000 to $99,999 | 5 (1.5%) | 40 (7.4%) |
| $100,000 to $299,999 | 123 (36.7%) | 147 (27.4%) |
| $300,000 to $499,999 | 157 (46.9%) | 259 (48.2%) |
| $500,000 to $749,999 | 40 (11.9%) | 59 (11.0%) |
| $750,000 to $999,999 | 0 (0.0%) | 0 (0.0%) |
| $1,000,000 or more | 0 (0.0%) | 32 (6.0%) |
| Total | 335 (100.0%) | 537 (100.0%) |
Household Income by Mortgage Status in Linden
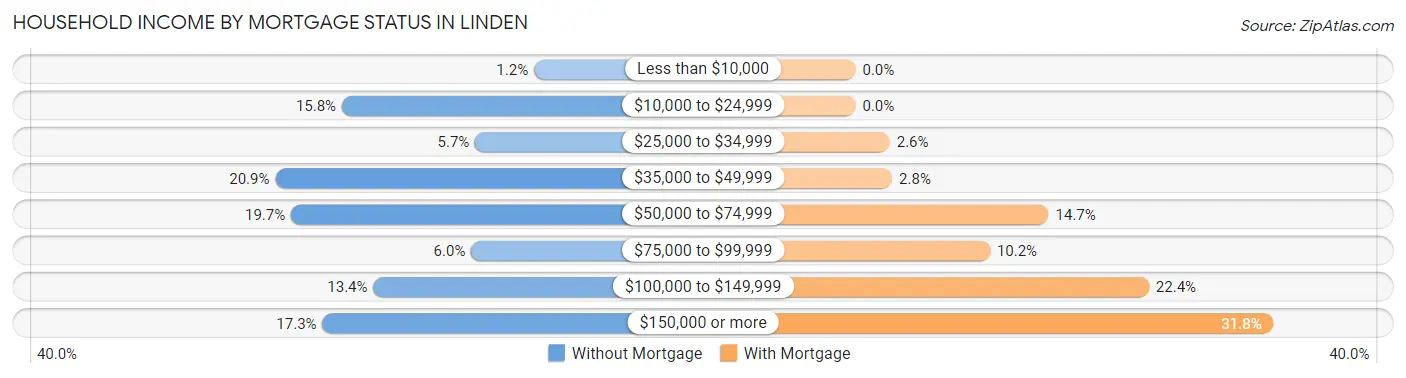
| Household Income | Without Mortgage | With Mortgage |
| Less than $10,000 | 4 (1.2%) | 0 (0.0%) |
| $10,000 to $24,999 | 53 (15.8%) | 0 (0.0%) |
| $25,000 to $34,999 | 19 (5.7%) | 14 (2.6%) |
| $35,000 to $49,999 | 70 (20.9%) | 15 (2.8%) |
| $50,000 to $74,999 | 66 (19.7%) | 79 (14.7%) |
| $75,000 to $99,999 | 20 (6.0%) | 55 (10.2%) |
| $100,000 to $149,999 | 45 (13.4%) | 120 (22.4%) |
| $150,000 or more | 58 (17.3%) | 171 (31.8%) |
| Total | 335 (100.0%) | 537 (100.0%) |
Property Value to Household Income Ratio in Linden
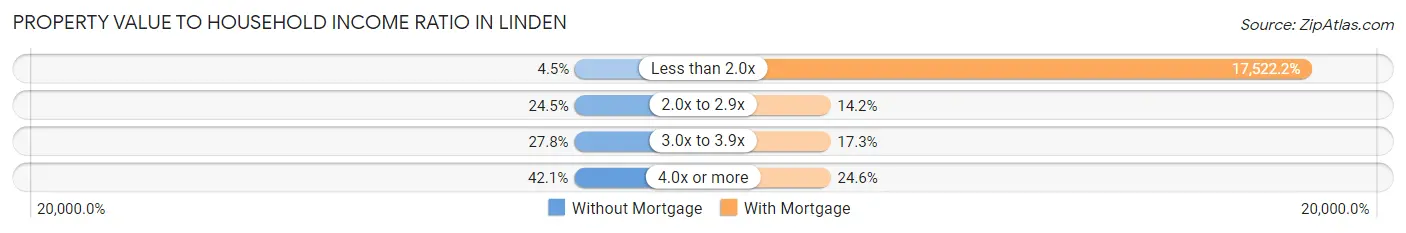
| Value-to-Income Ratio | Without Mortgage | With Mortgage |
| Less than 2.0x | 15 (4.5%) | 94,094 (17,522.2%) |
| 2.0x to 2.9x | 82 (24.5%) | 76 (14.1%) |
| 3.0x to 3.9x | 93 (27.8%) | 93 (17.3%) |
| 4.0x or more | 141 (42.1%) | 132 (24.6%) |
| Total | 335 (100.0%) | 537 (100.0%) |
Real Estate Taxes by Mortgage Status in Linden
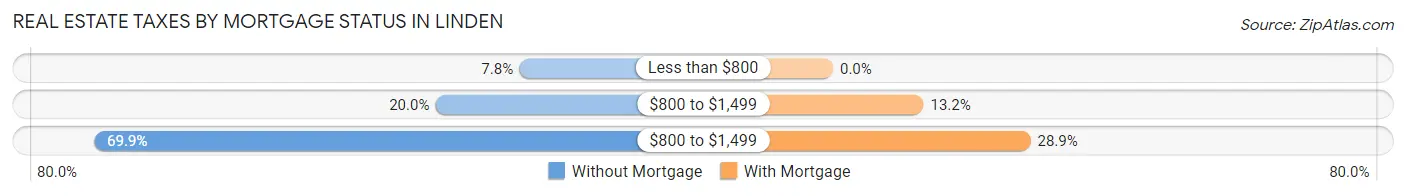
| Property Taxes | Without Mortgage | With Mortgage |
| Less than $800 | 26 (7.8%) | 0 (0.0%) |
| $800 to $1,499 | 67 (20.0%) | 71 (13.2%) |
| $800 to $1,499 | 234 (69.9%) | 155 (28.9%) |
| Total | 335 (100.0%) | 537 (100.0%) |
Health & Disability in Linden
Health Insurance Coverage by Age in Linden
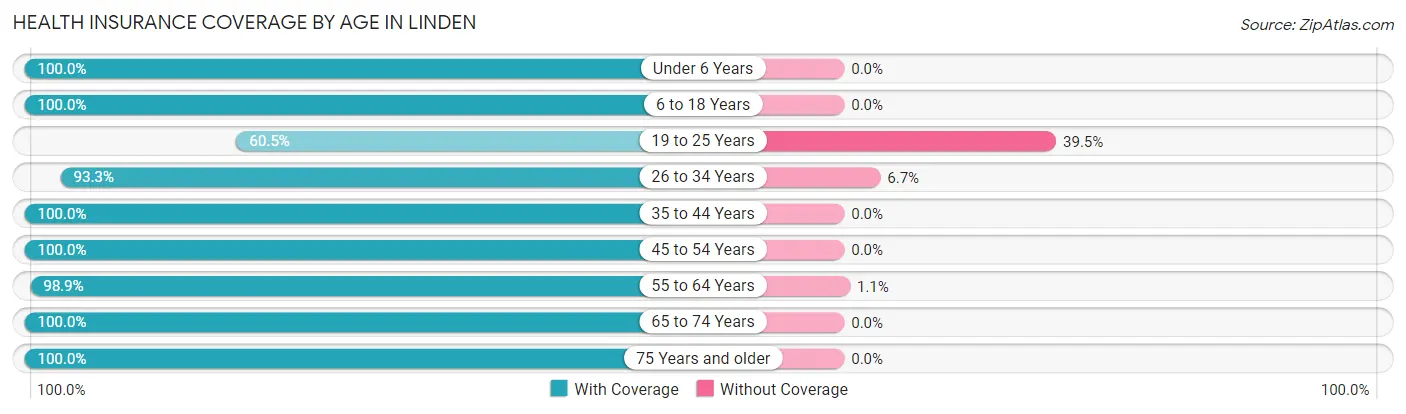
| Age Bracket | With Coverage | Without Coverage |
| Under 6 Years | 142 (100.0%) | 0 (0.0%) |
| 6 to 18 Years | 349 (100.0%) | 0 (0.0%) |
| 19 to 25 Years | 72 (60.5%) | 47 (39.5%) |
| 26 to 34 Years | 125 (93.3%) | 9 (6.7%) |
| 35 to 44 Years | 139 (100.0%) | 0 (0.0%) |
| 45 to 54 Years | 260 (100.0%) | 0 (0.0%) |
| 55 to 64 Years | 556 (98.9%) | 6 (1.1%) |
| 65 to 74 Years | 442 (100.0%) | 0 (0.0%) |
| 75 Years and older | 305 (100.0%) | 0 (0.0%) |
| Total | 2,390 (97.5%) | 62 (2.5%) |
Health Insurance Coverage by Citizenship Status in Linden
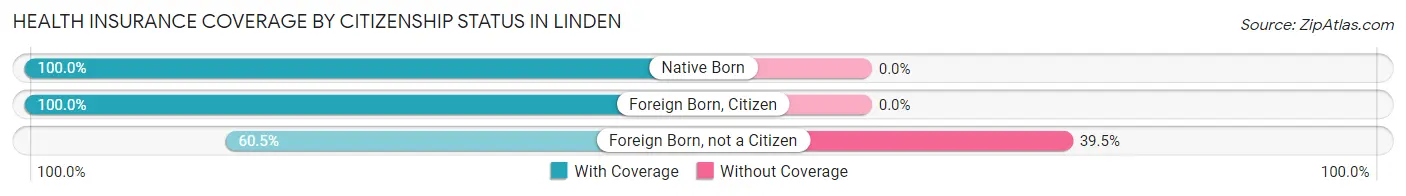
| Citizenship Status | With Coverage | Without Coverage |
| Native Born | 142 (100.0%) | 0 (0.0%) |
| Foreign Born, Citizen | 349 (100.0%) | 0 (0.0%) |
| Foreign Born, not a Citizen | 72 (60.5%) | 47 (39.5%) |
Health Insurance Coverage by Household Income in Linden
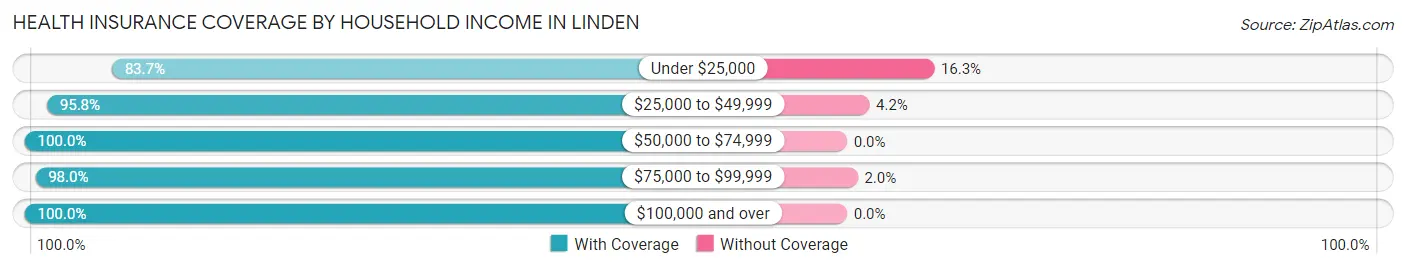
| Household Income | With Coverage | Without Coverage |
| Under $25,000 | 205 (83.7%) | 40 (16.3%) |
| $25,000 to $49,999 | 367 (95.8%) | 16 (4.2%) |
| $50,000 to $74,999 | 266 (100.0%) | 0 (0.0%) |
| $75,000 to $99,999 | 294 (98.0%) | 6 (2.0%) |
| $100,000 and over | 1,247 (100.0%) | 0 (0.0%) |
Public vs Private Health Insurance Coverage by Age in Linden
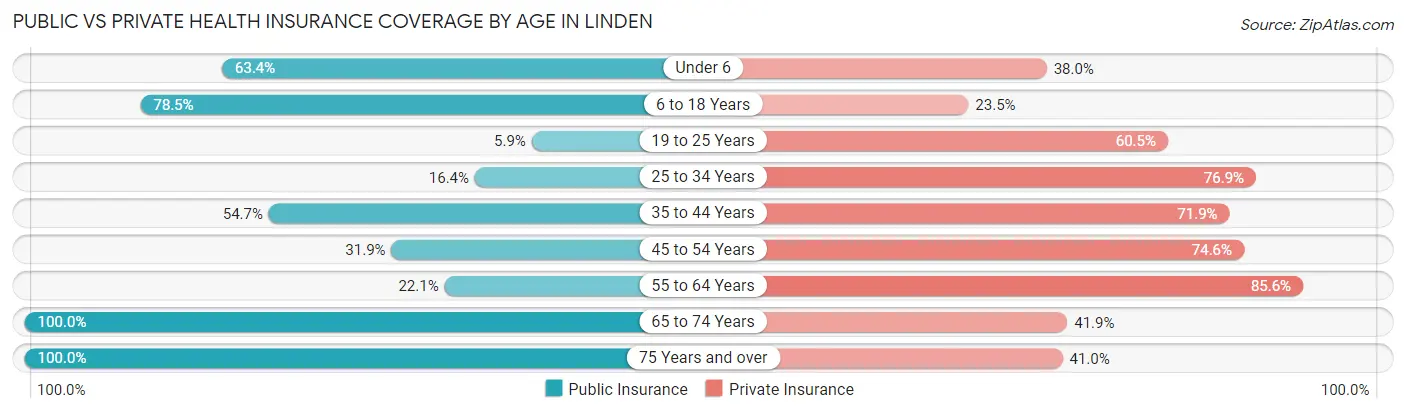
| Age Bracket | Public Insurance | Private Insurance |
| Under 6 | 90 (63.4%) | 54 (38.0%) |
| 6 to 18 Years | 274 (78.5%) | 82 (23.5%) |
| 19 to 25 Years | 7 (5.9%) | 72 (60.5%) |
| 25 to 34 Years | 22 (16.4%) | 103 (76.9%) |
| 35 to 44 Years | 76 (54.7%) | 100 (71.9%) |
| 45 to 54 Years | 83 (31.9%) | 194 (74.6%) |
| 55 to 64 Years | 124 (22.1%) | 481 (85.6%) |
| 65 to 74 Years | 442 (100.0%) | 185 (41.9%) |
| 75 Years and over | 305 (100.0%) | 125 (41.0%) |
| Total | 1,423 (58.0%) | 1,396 (56.9%) |
Disability Status by Sex by Age in Linden
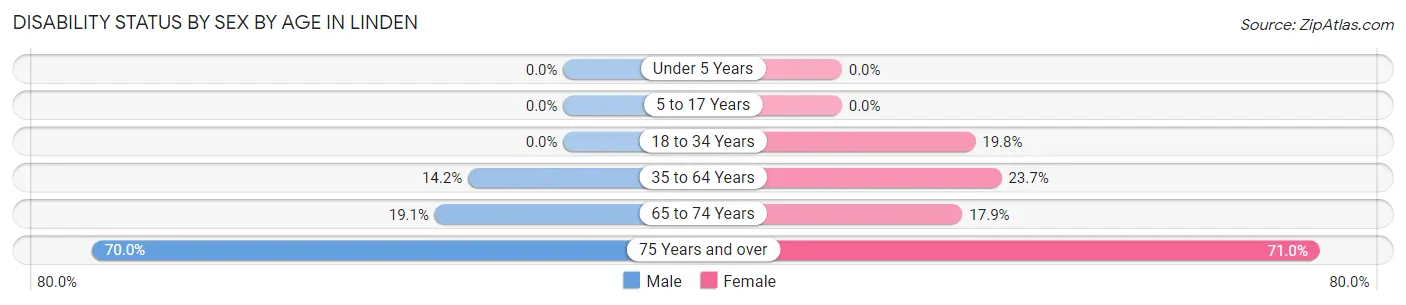
| Age Bracket | Male | Female |
| Under 5 Years | 0 (0.0%) | 0 (0.0%) |
| 5 to 17 Years | 0 (0.0%) | 0 (0.0%) |
| 18 to 34 Years | 0 (0.0%) | 22 (19.8%) |
| 35 to 64 Years | 65 (14.2%) | 119 (23.7%) |
| 65 to 74 Years | 46 (19.1%) | 36 (17.9%) |
| 75 Years and over | 105 (70.0%) | 110 (71.0%) |
Disability Class by Sex by Age in Linden
Disability Class: Hearing Difficulty
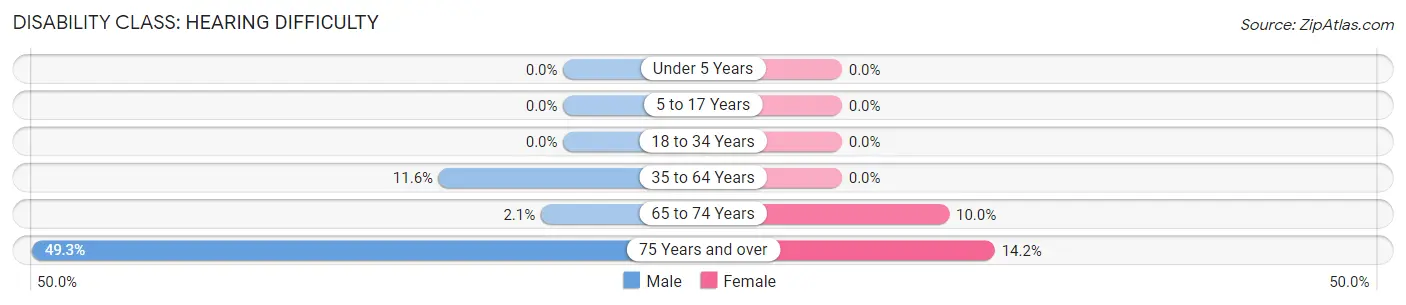
| Age Bracket | Male | Female |
| Under 5 Years | 0 (0.0%) | 0 (0.0%) |
| 5 to 17 Years | 0 (0.0%) | 0 (0.0%) |
| 18 to 34 Years | 0 (0.0%) | 0 (0.0%) |
| 35 to 64 Years | 53 (11.6%) | 0 (0.0%) |
| 65 to 74 Years | 5 (2.1%) | 20 (10.0%) |
| 75 Years and over | 74 (49.3%) | 22 (14.2%) |
Disability Class: Vision Difficulty
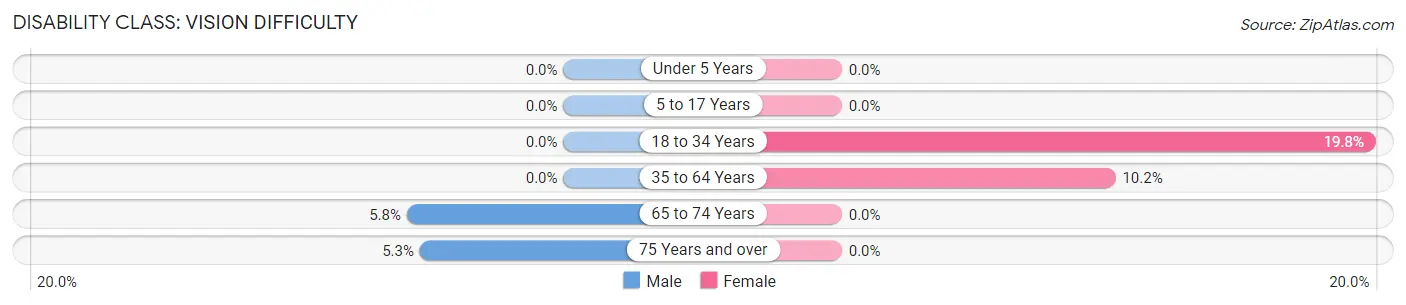
| Age Bracket | Male | Female |
| Under 5 Years | 0 (0.0%) | 0 (0.0%) |
| 5 to 17 Years | 0 (0.0%) | 0 (0.0%) |
| 18 to 34 Years | 0 (0.0%) | 22 (19.8%) |
| 35 to 64 Years | 0 (0.0%) | 51 (10.2%) |
| 65 to 74 Years | 14 (5.8%) | 0 (0.0%) |
| 75 Years and over | 8 (5.3%) | 0 (0.0%) |
Disability Class: Cognitive Difficulty
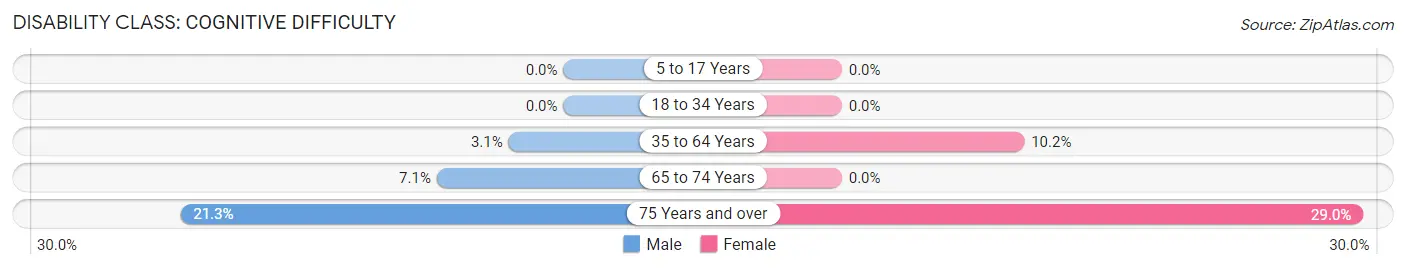
| Age Bracket | Male | Female |
| 5 to 17 Years | 0 (0.0%) | 0 (0.0%) |
| 18 to 34 Years | 0 (0.0%) | 0 (0.0%) |
| 35 to 64 Years | 14 (3.0%) | 51 (10.2%) |
| 65 to 74 Years | 17 (7.0%) | 0 (0.0%) |
| 75 Years and over | 32 (21.3%) | 45 (29.0%) |
Disability Class: Ambulatory Difficulty
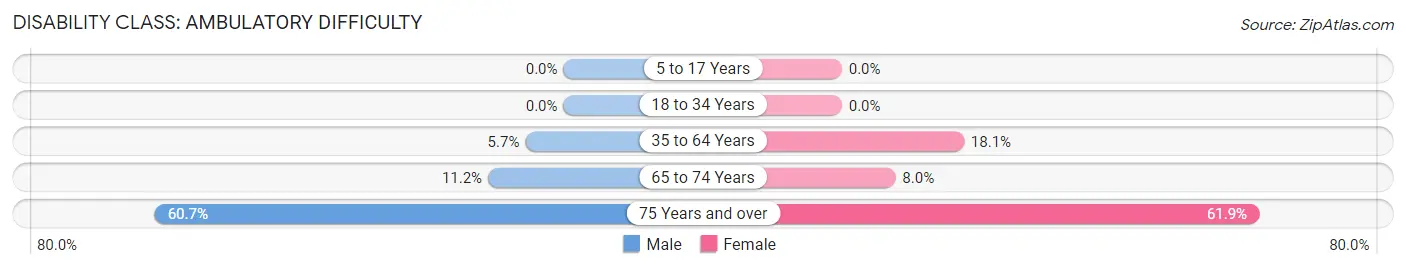
| Age Bracket | Male | Female |
| 5 to 17 Years | 0 (0.0%) | 0 (0.0%) |
| 18 to 34 Years | 0 (0.0%) | 0 (0.0%) |
| 35 to 64 Years | 26 (5.7%) | 91 (18.1%) |
| 65 to 74 Years | 27 (11.2%) | 16 (8.0%) |
| 75 Years and over | 91 (60.7%) | 96 (61.9%) |
Disability Class: Self-Care Difficulty
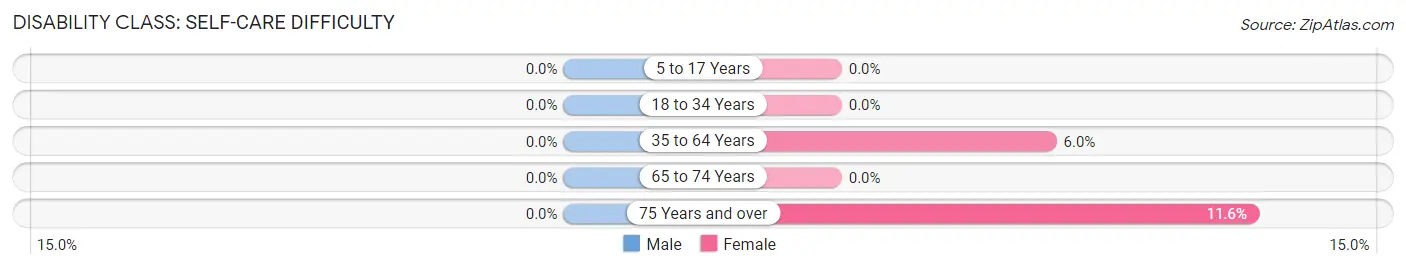
| Age Bracket | Male | Female |
| 5 to 17 Years | 0 (0.0%) | 0 (0.0%) |
| 18 to 34 Years | 0 (0.0%) | 0 (0.0%) |
| 35 to 64 Years | 0 (0.0%) | 30 (6.0%) |
| 65 to 74 Years | 0 (0.0%) | 0 (0.0%) |
| 75 Years and over | 0 (0.0%) | 18 (11.6%) |
Technology Access in Linden
Computing Device Access in Linden
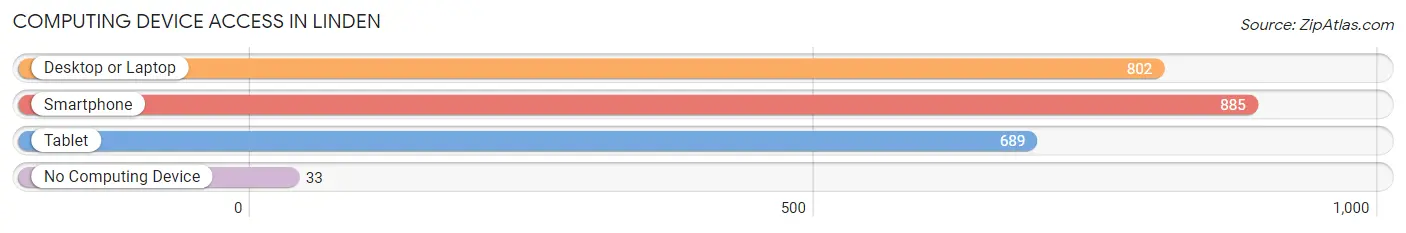
| Device Type | # Households | % Households |
| Desktop or Laptop | 802 | 83.3% |
| Smartphone | 885 | 91.9% |
| Tablet | 689 | 71.6% |
| No Computing Device | 33 | 3.4% |
| Total | 963 | 100.0% |
Internet Access in Linden
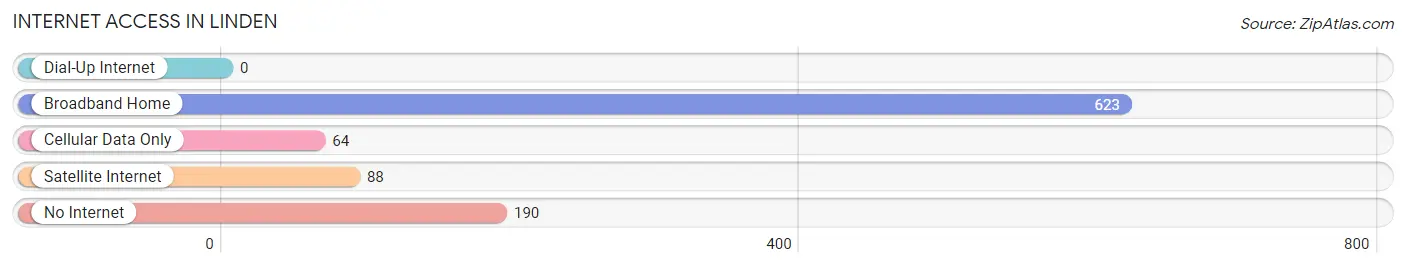
| Internet Type | # Households | % Households |
| Dial-Up Internet | 0 | 0.0% |
| Broadband Home | 623 | 64.7% |
| Cellular Data Only | 64 | 6.7% |
| Satellite Internet | 88 | 9.1% |
| No Internet | 190 | 19.7% |
| Total | 963 | 100.0% |
Linden Summary
Linden, Arizona is a small town located in Apache County, in the northeastern part of the state. It is situated in the White Mountains, near the Arizona-New Mexico border. The town was founded in 1876 by Mormon settlers, and was named after a nearby mountain peak. The population of Linden was estimated to be around 200 people in 2000.
Geography
Linden is located in the White Mountains, at an elevation of 6,400 feet. The town is situated in a valley surrounded by mountains, and is bordered by the Apache-Sitgreaves National Forest. The area is known for its scenic beauty, and is home to a variety of wildlife, including elk, deer, and bear. The climate in Linden is semi-arid, with hot summers and cold winters.
Economy
The economy of Linden is largely based on tourism and agriculture. The town is home to several tourist attractions, including the White Mountain Apache Cultural Center and Museum, and the Apache-Sitgreaves National Forest. The town also has several restaurants, shops, and lodging options. Agriculture is also an important part of the local economy, with cattle ranching and hay production being the main agricultural activities.
Demographics
In 2000, the population of Linden was estimated to be around 200 people. The racial makeup of the town was 95.5% White, 0.5% African American, 0.5% Native American, 0.5% Asian, and 3% from other races. The median household income was $25,000, and the median age was 40 years.
Conclusion
Linden, Arizona is a small town located in Apache County, in the northeastern part of the state. It was founded in 1876 by Mormon settlers, and is situated in the White Mountains, near the Arizona-New Mexico border. The economy of Linden is largely based on tourism and agriculture, and the population of the town was estimated to be around 200 people in 2000. The town is known for its scenic beauty, and is home to a variety of wildlife, including elk, deer, and bear.
Common Questions
What is Per Capita Income in Linden?
Per Capita income in Linden is $35,410.
What is the Median Family Income in Linden?
Median Family Income in Linden is $93,281.
What is the Median Household income in Linden?
Median Household Income in Linden is $79,531.
What is Income or Wage Gap in Linden?
Income or Wage Gap in Linden is 25.7%.
Women in Linden earn 74.3 cents for every dollar earned by a man.
What is Family Income Deficit in Linden?
Family Income Deficit in Linden is $9,193.
Families that are below poverty line in Linden earn $9,193 less on average than the poverty threshold level.
What is Inequality or Gini Index in Linden?
Inequality or Gini Index in Linden is 0.37.
What is the Total Population of Linden?
Total Population of Linden is 2,452.
What is the Total Male Population of Linden?
Total Male Population of Linden is 1,325.
What is the Total Female Population of Linden?
Total Female Population of Linden is 1,127.
What is the Ratio of Males per 100 Females in Linden?
There are 117.57 Males per 100 Females in Linden.
What is the Ratio of Females per 100 Males in Linden?
There are 85.06 Females per 100 Males in Linden.
What is the Median Population Age in Linden?
Median Population Age in Linden is 57.6 Years.
What is the Average Family Size in Linden
Average Family Size in Linden is 2.8 People.
What is the Average Household Size in Linden
Average Household Size in Linden is 2.5 People.
How Large is the Labor Force in Linden?
There are 907 People in the Labor Forcein in Linden.
What is the Percentage of People in the Labor Force in Linden?
44.2% of People are in the Labor Force in Linden.
What is the Unemployment Rate in Linden?
Unemployment Rate in Linden is 4.1%.