University Park, NM Map & Demographics
University Park Map
University Park Overview
$5,748
PER CAPITA INCOME
$15,536
AVG FAMILY INCOME
$23,375
AVG HOUSEHOLD INCOME
15.9%
WAGE / INCOME GAP [ % ]
84.1¢/ $1
WAGE / INCOME GAP [ $ ]
0.45
INEQUALITY / GINI INDEX
2,744
TOTAL POPULATION
1,248
MALE POPULATION
1,496
FEMALE POPULATION
83.42
MALES / 100 FEMALES
119.87
FEMALES / 100 MALES
19.0
MEDIAN AGE
2.2
AVG FAMILY SIZE
2.1
AVG HOUSEHOLD SIZE
1,365
LABOR FORCE [ PEOPLE ]
51.0%
PERCENT IN LABOR FORCE
22.1%
UNEMPLOYMENT RATE
Income in University Park
Income Overview in University Park
Per Capita Income in University Park is $5,748, while median incomes of families and households are $15,536 and $23,375 respectively.
| Characteristic | Number | Measure |
| Per Capita Income | 2,744 | $5,748 |
| Median Family Income | 95 | $15,536 |
| Mean Family Income | 95 | $20,364 |
| Median Household Income | 129 | $23,375 |
| Mean Household Income | 129 | $27,836 |
| Income Deficit | 95 | $0 |
| Wage / Income Gap (%) | 2,744 | 15.90% |
| Wage / Income Gap ($) | 2,744 | 84.10¢ per $1 |
| Gini / Inequality Index | 2,744 | 0.45 |
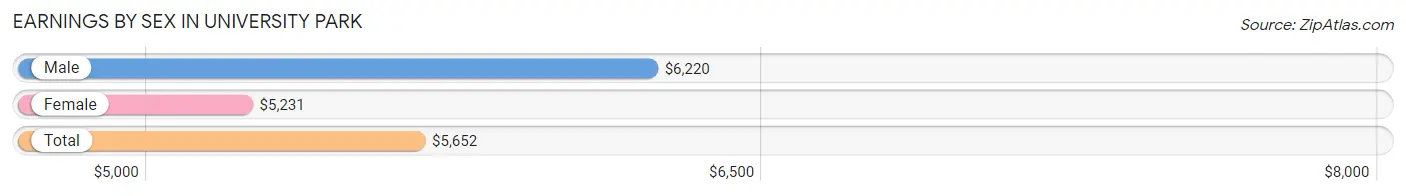
Earnings by Sex in University Park
Average Earnings in University Park are $5,652, $6,220 for men and $5,231 for women, a difference of 15.9%.
| Sex | Number | Average Earnings |
| Male | 818 (47.0%) | $6,220 |
| Female | 924 (53.0%) | $5,231 |
| Total | 1,742 (100.0%) | $5,652 |
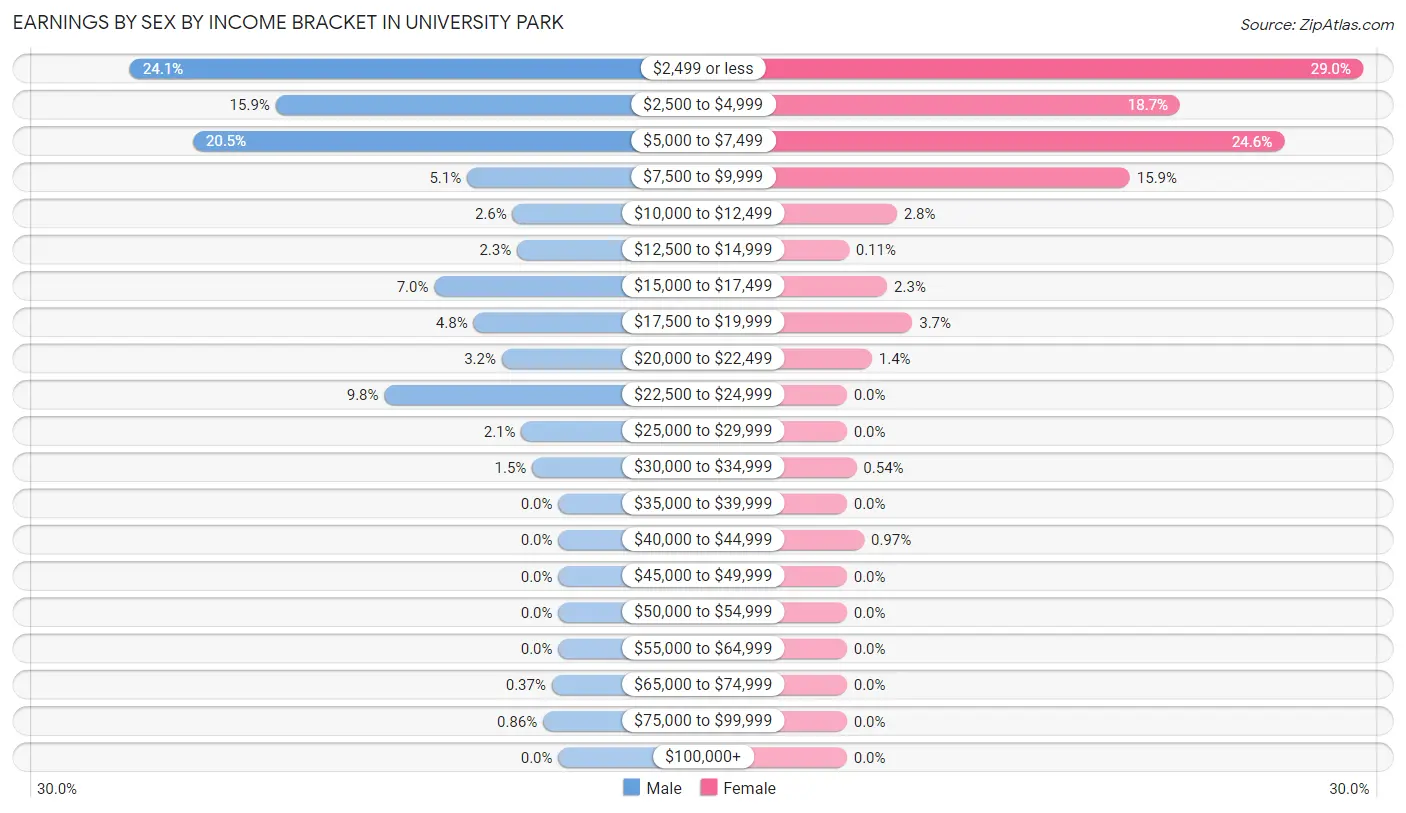
Earnings by Sex by Income Bracket in University Park
The most common earnings brackets in University Park are $2,499 or less for men (197 | 24.1%) and $2,499 or less for women (268 | 29.0%).
| Income | Male | Female |
| $2,499 or less | 197 (24.1%) | 268 (29.0%) |
| $2,500 to $4,999 | 130 (15.9%) | 173 (18.7%) |
| $5,000 to $7,499 | 168 (20.5%) | 227 (24.6%) |
| $7,500 to $9,999 | 42 (5.1%) | 147 (15.9%) |
| $10,000 to $12,499 | 21 (2.6%) | 26 (2.8%) |
| $12,500 to $14,999 | 19 (2.3%) | 1 (0.1%) |
| $15,000 to $17,499 | 57 (7.0%) | 21 (2.3%) |
| $17,500 to $19,999 | 39 (4.8%) | 34 (3.7%) |
| $20,000 to $22,499 | 26 (3.2%) | 13 (1.4%) |
| $22,500 to $24,999 | 80 (9.8%) | 0 (0.0%) |
| $25,000 to $29,999 | 17 (2.1%) | 0 (0.0%) |
| $30,000 to $34,999 | 12 (1.5%) | 5 (0.5%) |
| $35,000 to $39,999 | 0 (0.0%) | 0 (0.0%) |
| $40,000 to $44,999 | 0 (0.0%) | 9 (1.0%) |
| $45,000 to $49,999 | 0 (0.0%) | 0 (0.0%) |
| $50,000 to $54,999 | 0 (0.0%) | 0 (0.0%) |
| $55,000 to $64,999 | 0 (0.0%) | 0 (0.0%) |
| $65,000 to $74,999 | 3 (0.4%) | 0 (0.0%) |
| $75,000 to $99,999 | 7 (0.9%) | 0 (0.0%) |
| $100,000+ | 0 (0.0%) | 0 (0.0%) |
| Total | 818 (100.0%) | 924 (100.0%) |
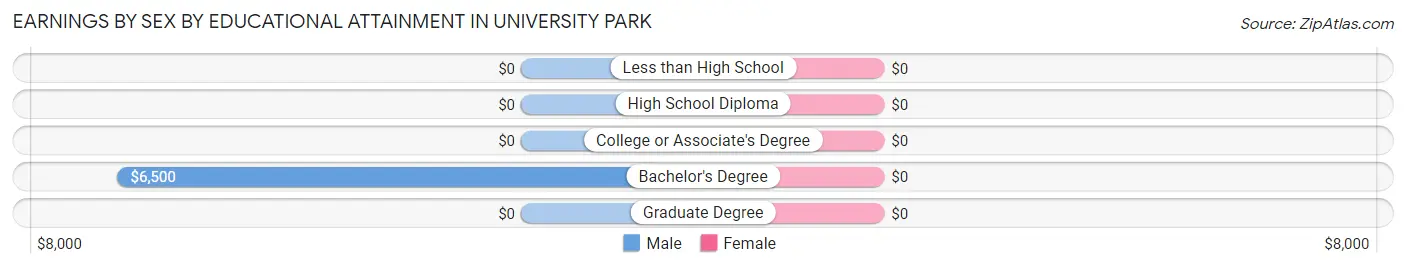
Earnings by Sex by Educational Attainment in University Park
| Educational Attainment | Male Income | Female Income |
| Less than High School | - | - |
| High School Diploma | - | - |
| College or Associate's Degree | - | - |
| Bachelor's Degree | $6,500 | $0 |
| Graduate Degree | - | - |
| Total | $6,692 | $20,865 |
Family Income in University Park
Family Income Brackets in University Park
According to the University Park family income data, there are 34 families falling into the less than $10,000 income range, which is the most common income bracket and makes up 35.8% of all families.
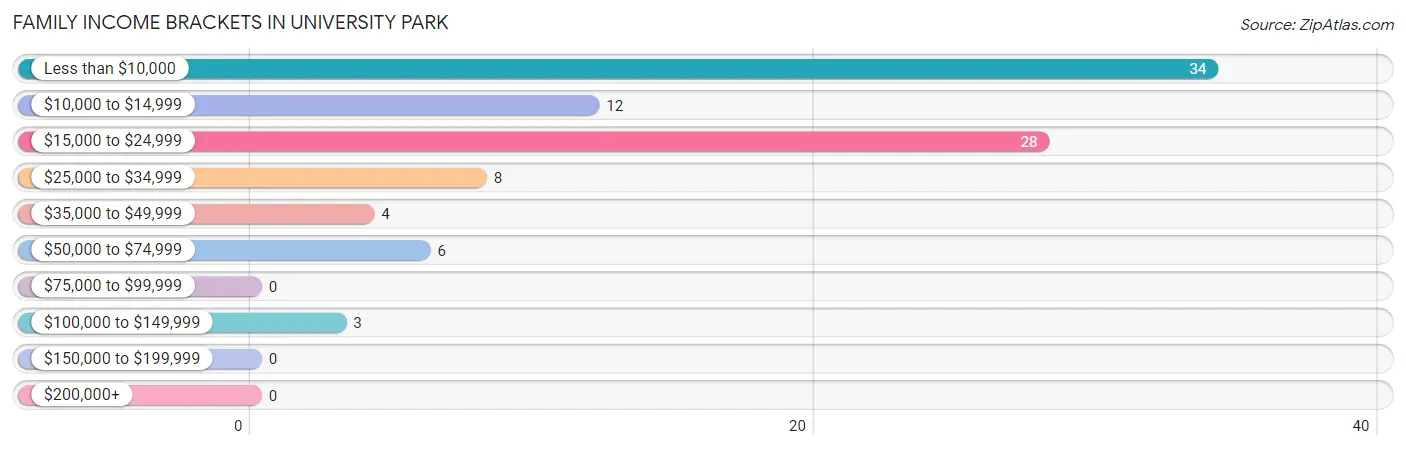
| Income Bracket | # Families | % Families |
| Less than $10,000 | 34 | 35.8% |
| $10,000 to $14,999 | 12 | 12.6% |
| $15,000 to $24,999 | 28 | 29.5% |
| $25,000 to $34,999 | 8 | 8.4% |
| $35,000 to $49,999 | 4 | 4.2% |
| $50,000 to $74,999 | 6 | 6.3% |
| $75,000 to $99,999 | 0 | 0.0% |
| $100,000 to $149,999 | 3 | 3.2% |
| $150,000 to $199,999 | 0 | 0.0% |
| $200,000+ | 0 | 0.0% |
Family Income by Famaliy Size in University Park
| Income Bracket | # Families | Median Income |
| 2-Person Families | 57 (60.0%) | $0 |
| 3-Person Families | 34 (35.8%) | $0 |
| 4-Person Families | 4 (4.2%) | $0 |
| 5-Person Families | 0 (0.0%) | $0 |
| 6-Person Families | 0 (0.0%) | $0 |
| 7+ Person Families | 0 (0.0%) | $0 |
| Total | 95 (100.0%) | $15,536 |
Family Income by Number of Earners in University Park
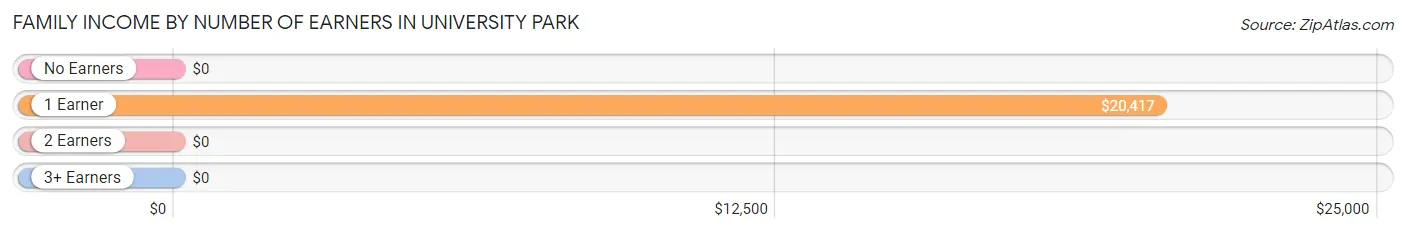
| Number of Earners | # Families | Median Income |
| No Earners | 9 (9.5%) | $0 |
| 1 Earner | 55 (57.9%) | $20,417 |
| 2 Earners | 31 (32.6%) | $0 |
| 3+ Earners | 0 (0.0%) | $0 |
| Total | 95 (100.0%) | $15,536 |
Household Income in University Park
Household Income Brackets in University Park
With 38 households falling in the category, the $25,000 to $34,999 income range is the most frequent in University Park, accounting for 29.5% of all households.
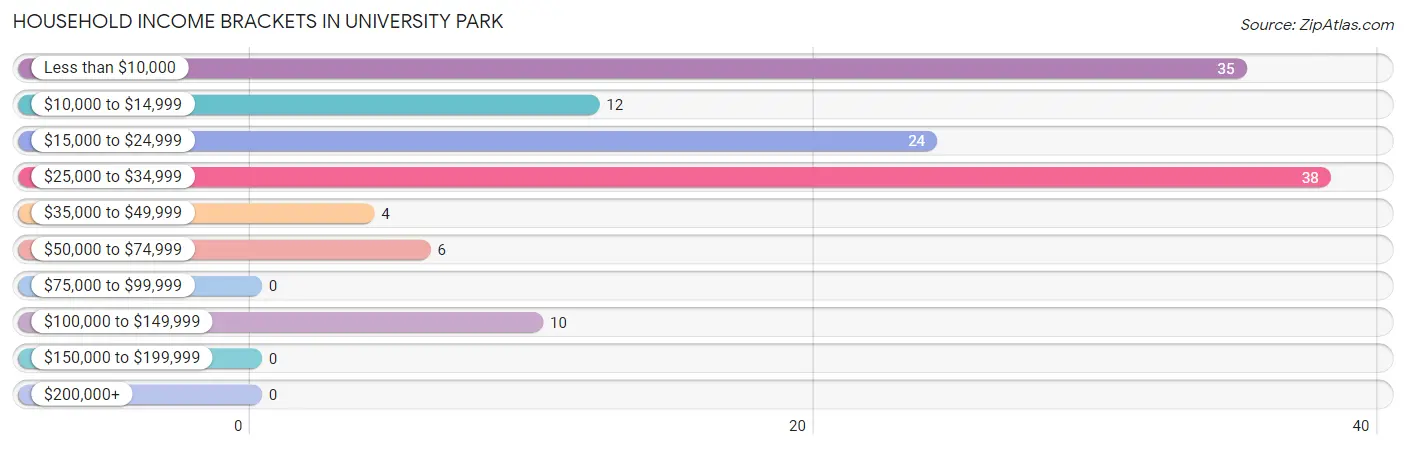
| Income Bracket | # Households | % Households |
| Less than $10,000 | 35 | 27.1% |
| $10,000 to $14,999 | 12 | 9.3% |
| $15,000 to $24,999 | 24 | 18.6% |
| $25,000 to $34,999 | 38 | 29.5% |
| $35,000 to $49,999 | 4 | 3.1% |
| $50,000 to $74,999 | 6 | 4.7% |
| $75,000 to $99,999 | 0 | 0.0% |
| $100,000 to $149,999 | 10 | 7.8% |
| $150,000 to $199,999 | 0 | 0.0% |
| $200,000+ | 0 | 0.0% |
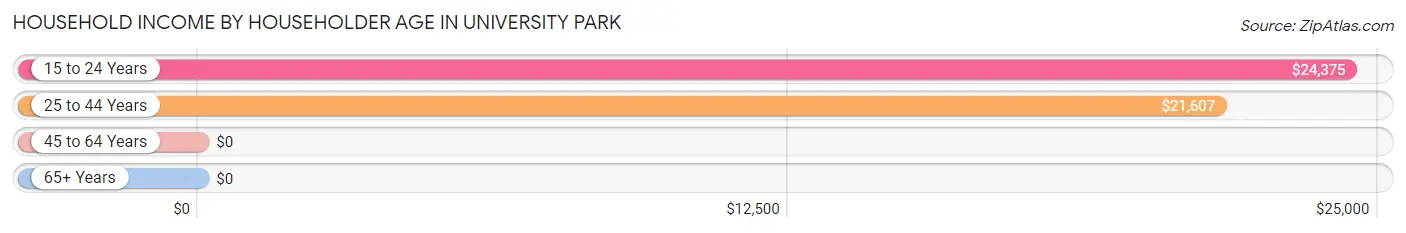
Household Income by Householder Age in University Park
The median household income in University Park is $23,375, with the highest median household income of $24,375 found in the 15 to 24 years age bracket for the primary householder. A total of 47 households (36.4%) fall into this category. Meanwhile, the 45 to 64 years age bracket for the primary householder has the lowest median household income of $0, with 11 households (8.5%) in this group.
| Income Bracket | # Households | Median Income |
| 15 to 24 Years | 47 (36.4%) | $24,375 |
| 25 to 44 Years | 71 (55.0%) | $21,607 |
| 45 to 64 Years | 11 (8.5%) | $0 |
| 65+ Years | 0 (0.0%) | $0 |
| Total | 129 (100.0%) | $23,375 |
Poverty in University Park
Income Below Poverty by Sex and Age in University Park
With 69.9% poverty level for males and 42.9% for females among the residents of University Park, 12 to 14 year old males and 6 to 11 year old females are the most vulnerable to poverty, with 8 males (100.0%) and 4 females (80.0%) in their respective age groups living below the poverty level.
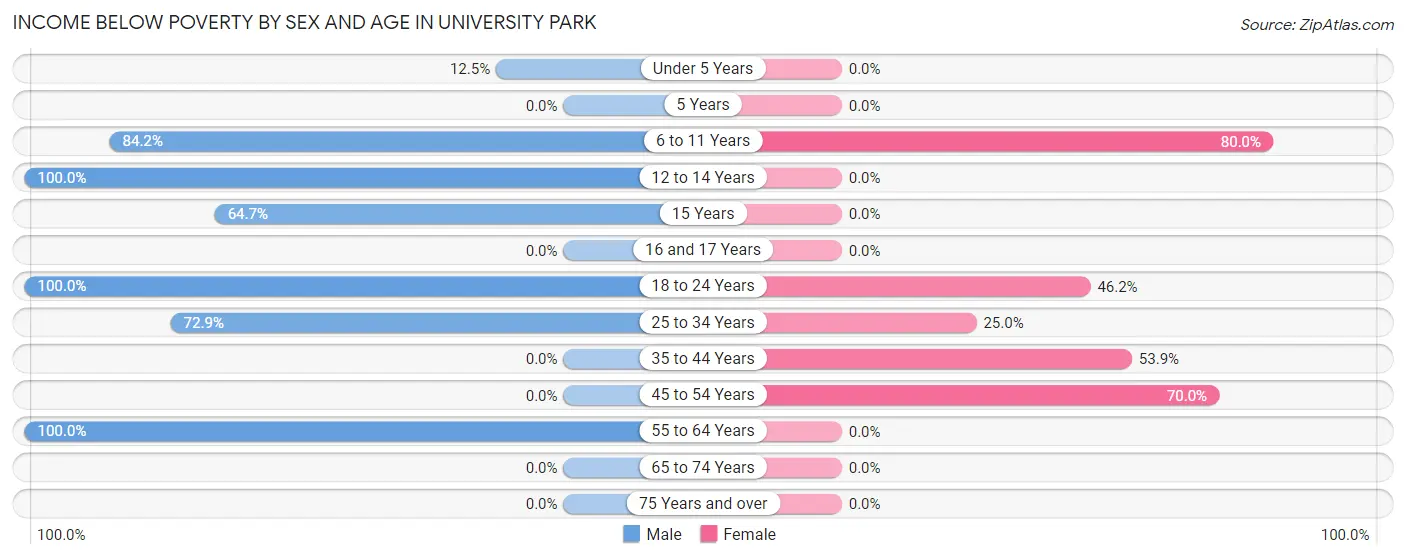
| Age Bracket | Male | Female |
| Under 5 Years | 2 (12.5%) | 0 (0.0%) |
| 5 Years | 0 (0.0%) | 0 (0.0%) |
| 6 to 11 Years | 16 (84.2%) | 4 (80.0%) |
| 12 to 14 Years | 8 (100.0%) | 0 (0.0%) |
| 15 Years | 11 (64.7%) | 0 (0.0%) |
| 16 and 17 Years | 0 (0.0%) | 0 (0.0%) |
| 18 to 24 Years | 28 (100.0%) | 18 (46.2%) |
| 25 to 34 Years | 43 (72.9%) | 9 (25.0%) |
| 35 to 44 Years | 0 (0.0%) | 7 (53.8%) |
| 45 to 54 Years | 0 (0.0%) | 7 (70.0%) |
| 55 to 64 Years | 8 (100.0%) | 0 (0.0%) |
| 65 to 74 Years | 0 (0.0%) | 0 (0.0%) |
| 75 Years and over | 0 (0.0%) | 0 (0.0%) |
| Total | 116 (69.9%) | 45 (42.9%) |
Income Above Poverty by Sex and Age in University Park
According to the poverty statistics in University Park, males aged 35 to 44 years and females aged 12 to 14 years are the age groups that are most secure financially, with 100.0% of males and 100.0% of females in these age groups living above the poverty line.
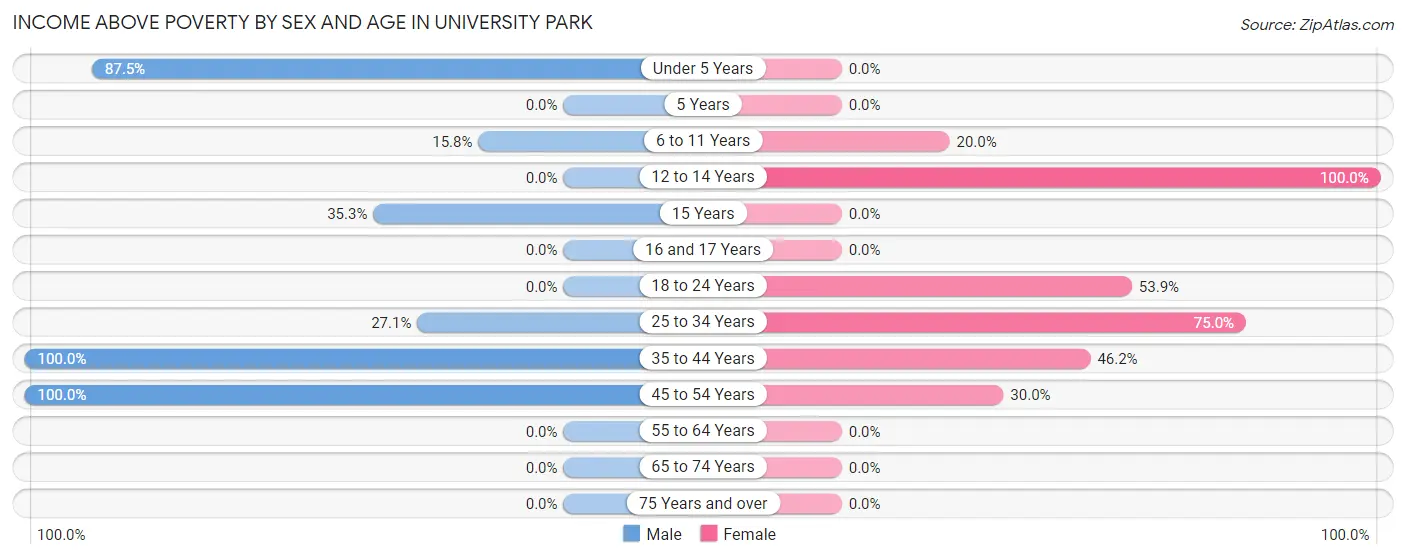
| Age Bracket | Male | Female |
| Under 5 Years | 14 (87.5%) | 0 (0.0%) |
| 5 Years | 0 (0.0%) | 0 (0.0%) |
| 6 to 11 Years | 3 (15.8%) | 1 (20.0%) |
| 12 to 14 Years | 0 (0.0%) | 2 (100.0%) |
| 15 Years | 6 (35.3%) | 0 (0.0%) |
| 16 and 17 Years | 0 (0.0%) | 0 (0.0%) |
| 18 to 24 Years | 0 (0.0%) | 21 (53.8%) |
| 25 to 34 Years | 16 (27.1%) | 27 (75.0%) |
| 35 to 44 Years | 6 (100.0%) | 6 (46.2%) |
| 45 to 54 Years | 5 (100.0%) | 3 (30.0%) |
| 55 to 64 Years | 0 (0.0%) | 0 (0.0%) |
| 65 to 74 Years | 0 (0.0%) | 0 (0.0%) |
| 75 Years and over | 0 (0.0%) | 0 (0.0%) |
| Total | 50 (30.1%) | 60 (57.1%) |
Income Below Poverty Among Married-Couple Families in University Park
The poverty statistics for married-couple families in University Park show that 46.2% or 18 of the total 39 families live below the poverty line. Families with no children have the highest poverty rate of 64.7%, comprising of 11 families. On the other hand, families with 1 or 2 children have the lowest poverty rate of 31.8%, which includes 7 families.
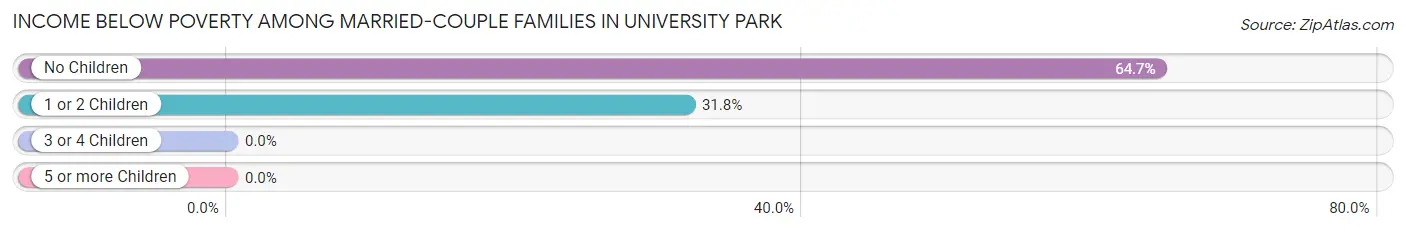
| Children | Above Poverty | Below Poverty |
| No Children | 6 (35.3%) | 11 (64.7%) |
| 1 or 2 Children | 15 (68.2%) | 7 (31.8%) |
| 3 or 4 Children | 0 (0.0%) | 0 (0.0%) |
| 5 or more Children | 0 (0.0%) | 0 (0.0%) |
| Total | 21 (53.8%) | 18 (46.2%) |
Income Below Poverty Among Single-Parent Households in University Park
According to the poverty data in University Park, 100.0% or 14 single-father households and 50.0% or 21 single-mother households are living below the poverty line. Among single-father households, those with 1 or 2 children have the highest poverty rate, with 14 households (100.0%) experiencing poverty. Likewise, among single-mother households, those with no children have the highest poverty rate, with 14 households (100.0%) falling below the poverty line.
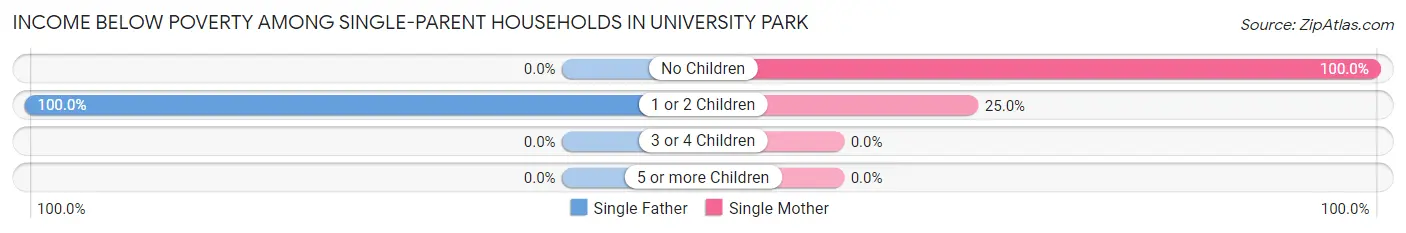
| Children | Single Father | Single Mother |
| No Children | 0 (0.0%) | 14 (100.0%) |
| 1 or 2 Children | 14 (100.0%) | 7 (25.0%) |
| 3 or 4 Children | 0 (0.0%) | 0 (0.0%) |
| 5 or more Children | 0 (0.0%) | 0 (0.0%) |
| Total | 14 (100.0%) | 21 (50.0%) |
Income Below Poverty Among Married-Couple vs Single-Parent Households in University Park
The poverty data for University Park shows that 18 of the married-couple family households (46.2%) and 35 of the single-parent households (62.5%) are living below the poverty level. Within the married-couple family households, those with no children have the highest poverty rate, with 11 households (64.7%) falling below the poverty line. Among the single-parent households, those with no children have the highest poverty rate, with 14 household (100.0%) living below poverty.
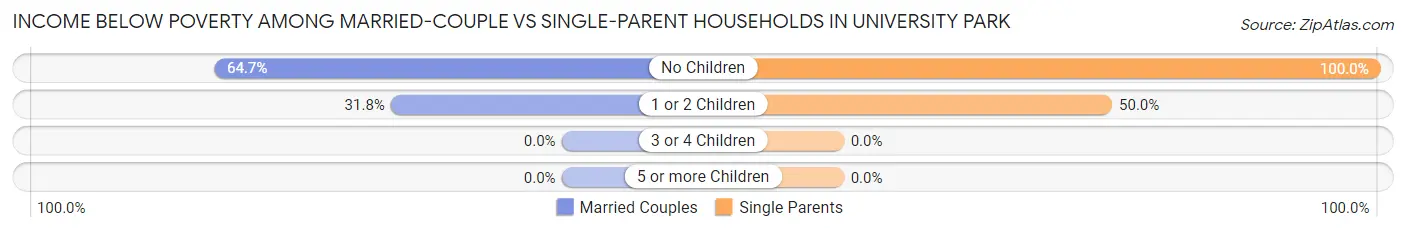
| Children | Married-Couple Families | Single-Parent Households |
| No Children | 11 (64.7%) | 14 (100.0%) |
| 1 or 2 Children | 7 (31.8%) | 21 (50.0%) |
| 3 or 4 Children | 0 (0.0%) | 0 (0.0%) |
| 5 or more Children | 0 (0.0%) | 0 (0.0%) |
| Total | 18 (46.2%) | 35 (62.5%) |
Race in University Park
The most populous races in University Park are White / Caucasian (1,827 | 66.6%), Hispanic or Latino (1,243 | 45.3%), and Two or more Races (668 | 24.3%).
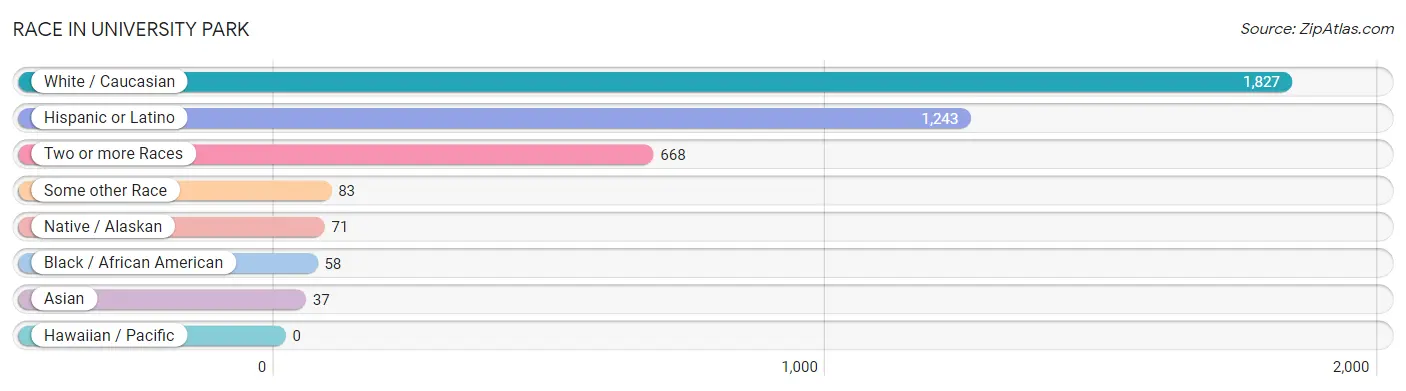
| Race | # Population | % Population |
| Asian | 37 | 1.3% |
| Black / African American | 58 | 2.1% |
| Hawaiian / Pacific | 0 | 0.0% |
| Hispanic or Latino | 1,243 | 45.3% |
| Native / Alaskan | 71 | 2.6% |
| White / Caucasian | 1,827 | 66.6% |
| Two or more Races | 668 | 24.3% |
| Some other Race | 83 | 3.0% |
| Total | 2,744 | 100.0% |
Ancestry in University Park
The most populous ancestries reported in University Park are Mexican (713 | 26.0%), English (305 | 11.1%), German (299 | 10.9%), Irish (233 | 8.5%), and Spaniard (148 | 5.4%), together accounting for 61.9% of all University Park residents.
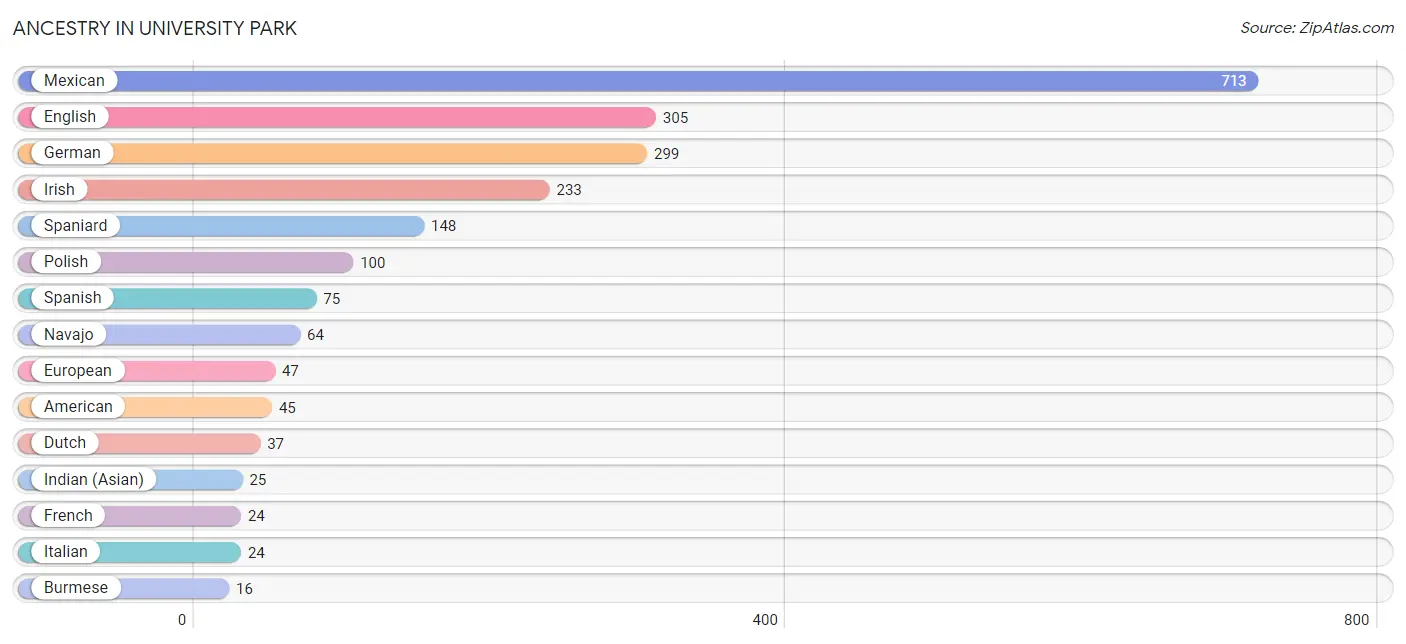
| Ancestry | # Population | % Population |
| African | 6 | 0.2% |
| American | 45 | 1.6% |
| Australian | 1 | 0.0% |
| Bhutanese | 2 | 0.1% |
| Burmese | 16 | 0.6% |
| Choctaw | 10 | 0.4% |
| Croatian | 2 | 0.1% |
| Dutch | 37 | 1.3% |
| English | 305 | 11.1% |
| European | 47 | 1.7% |
| French | 24 | 0.9% |
| German | 299 | 10.9% |
| Indian (Asian) | 25 | 0.9% |
| Irish | 233 | 8.5% |
| Italian | 24 | 0.9% |
| Korean | 7 | 0.3% |
| Mexican | 713 | 26.0% |
| Mongolian | 7 | 0.3% |
| Navajo | 64 | 2.3% |
| Norwegian | 14 | 0.5% |
| Paraguayan | 12 | 0.4% |
| Polish | 100 | 3.6% |
| Portuguese | 5 | 0.2% |
| Pueblo | 10 | 0.4% |
| Puerto Rican | 11 | 0.4% |
| Russian | 12 | 0.4% |
| Scotch-Irish | 10 | 0.4% |
| Scottish | 12 | 0.4% |
| South American | 12 | 0.4% |
| Spaniard | 148 | 5.4% |
| Spanish | 75 | 2.7% |
| Subsaharan African | 6 | 0.2% |
| Swedish | 11 | 0.4% |
| Turkish | 2 | 0.1% |
| Welsh | 11 | 0.4% | View All 35 Rows |
Immigrants in University Park
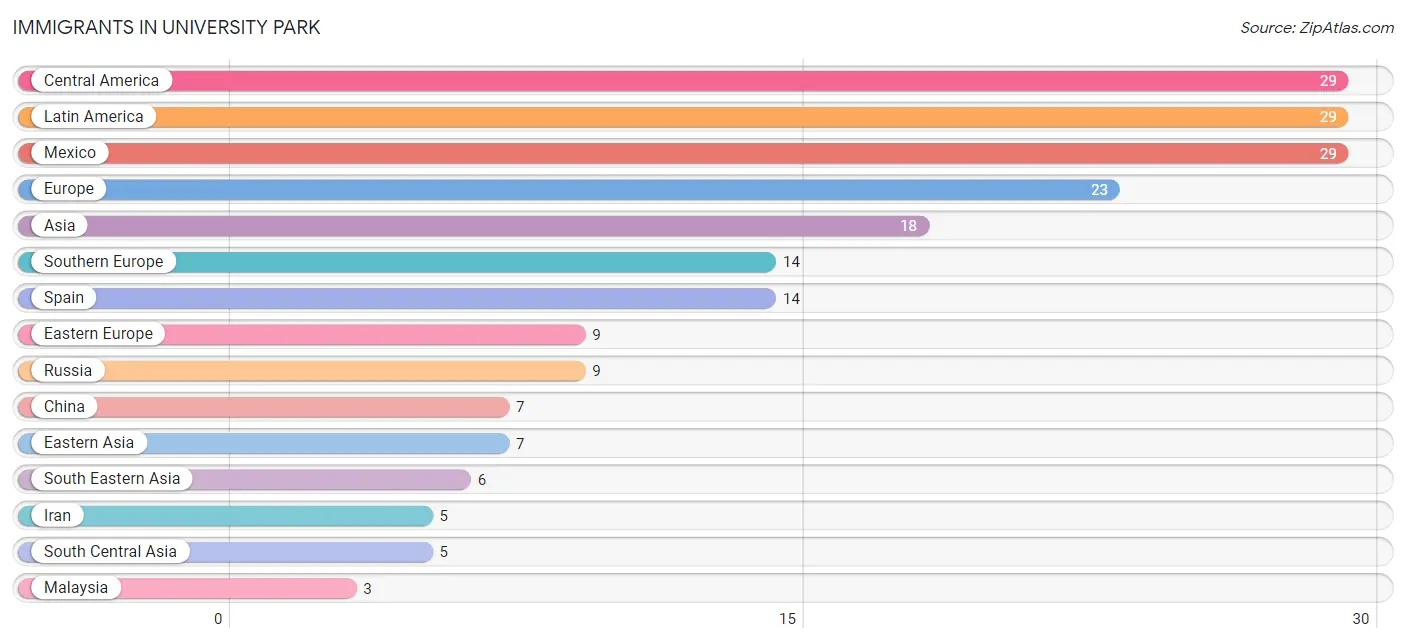
The most numerous immigrant groups reported in University Park came from Central America (29 | 1.1%), Latin America (29 | 1.1%), Mexico (29 | 1.1%), Europe (23 | 0.8%), and Asia (18 | 0.7%), together accounting for 4.7% of all University Park residents.
| Immigration Origin | # Population | % Population |
| Asia | 18 | 0.7% |
| Central America | 29 | 1.1% |
| China | 7 | 0.3% |
| Eastern Asia | 7 | 0.3% |
| Eastern Europe | 9 | 0.3% |
| Europe | 23 | 0.8% |
| Iran | 5 | 0.2% |
| Latin America | 29 | 1.1% |
| Malaysia | 3 | 0.1% |
| Mexico | 29 | 1.1% |
| Philippines | 3 | 0.1% |
| Russia | 9 | 0.3% |
| South Central Asia | 5 | 0.2% |
| South Eastern Asia | 6 | 0.2% |
| Southern Europe | 14 | 0.5% |
| Spain | 14 | 0.5% | View All 16 Rows |
Sex and Age in University Park
Sex and Age in University Park
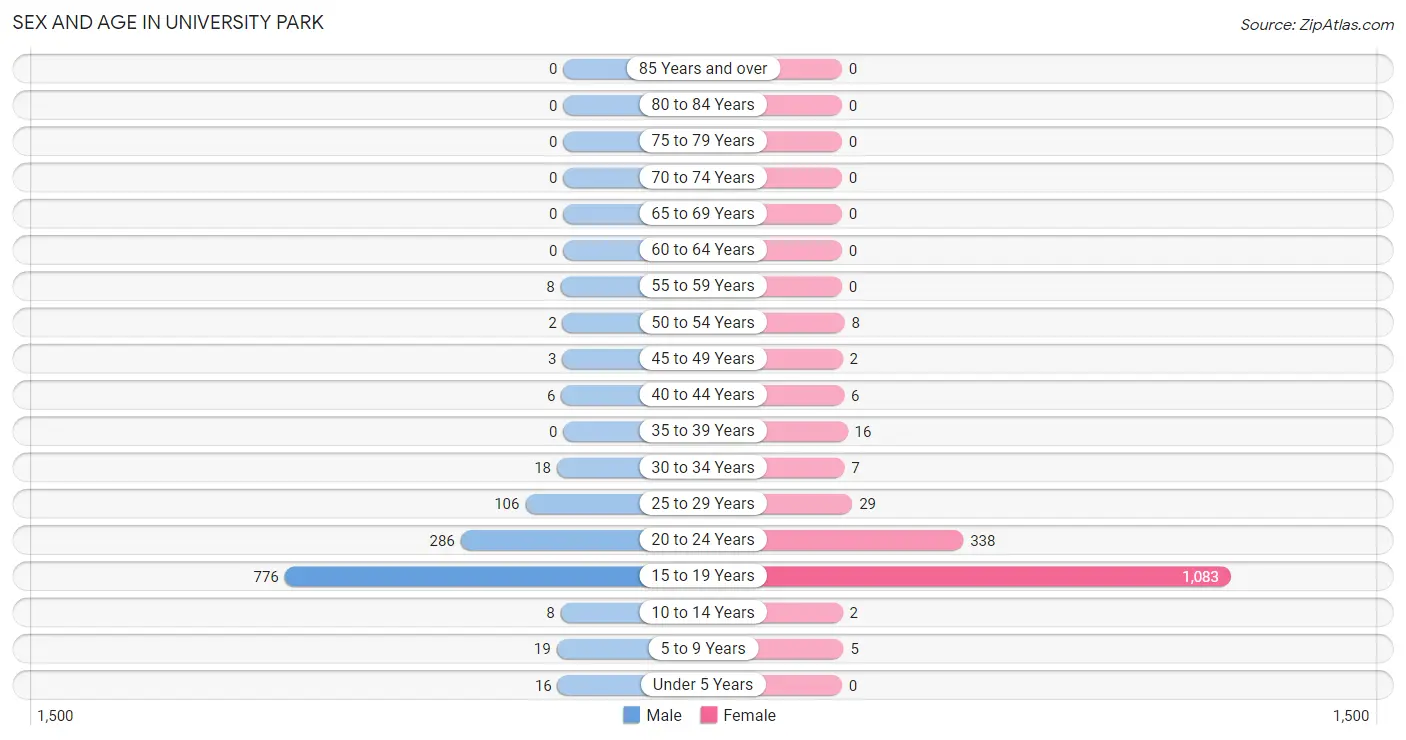
The most populous age groups in University Park are 15 to 19 Years (776 | 62.2%) for men and 15 to 19 Years (1,083 | 72.4%) for women.
| Age Bracket | Male | Female |
| Under 5 Years | 16 (1.3%) | 0 (0.0%) |
| 5 to 9 Years | 19 (1.5%) | 5 (0.3%) |
| 10 to 14 Years | 8 (0.6%) | 2 (0.1%) |
| 15 to 19 Years | 776 (62.2%) | 1,083 (72.4%) |
| 20 to 24 Years | 286 (22.9%) | 338 (22.6%) |
| 25 to 29 Years | 106 (8.5%) | 29 (1.9%) |
| 30 to 34 Years | 18 (1.4%) | 7 (0.5%) |
| 35 to 39 Years | 0 (0.0%) | 16 (1.1%) |
| 40 to 44 Years | 6 (0.5%) | 6 (0.4%) |
| 45 to 49 Years | 3 (0.2%) | 2 (0.1%) |
| 50 to 54 Years | 2 (0.2%) | 8 (0.5%) |
| 55 to 59 Years | 8 (0.6%) | 0 (0.0%) |
| 60 to 64 Years | 0 (0.0%) | 0 (0.0%) |
| 65 to 69 Years | 0 (0.0%) | 0 (0.0%) |
| 70 to 74 Years | 0 (0.0%) | 0 (0.0%) |
| 75 to 79 Years | 0 (0.0%) | 0 (0.0%) |
| 80 to 84 Years | 0 (0.0%) | 0 (0.0%) |
| 85 Years and over | 0 (0.0%) | 0 (0.0%) |
| Total | 1,248 (100.0%) | 1,496 (100.0%) |
Families and Households in University Park
Median Family Size in University Park
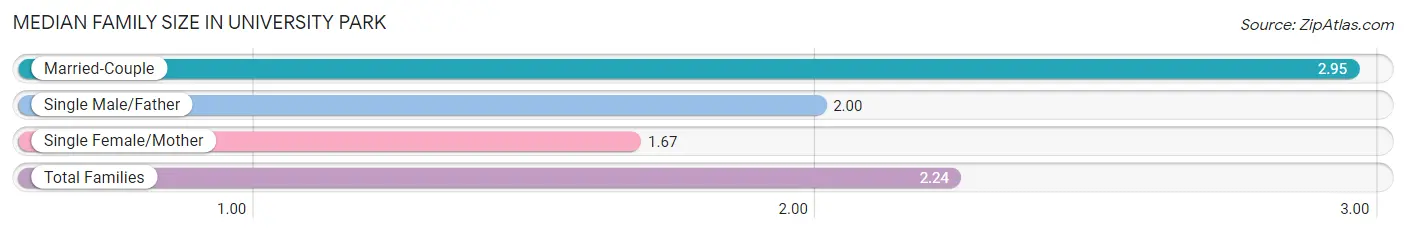
The median family size in University Park is 2.24 persons per family, with married-couple families (39 | 41.0%) accounting for the largest median family size of 2.95 persons per family. On the other hand, single female/mother families (42 | 44.2%) represent the smallest median family size with 1.67 persons per family.
| Family Type | # Families | Family Size |
| Married-Couple | 39 (41.0%) | 2.95 |
| Single Male/Father | 14 (14.7%) | 2.00 |
| Single Female/Mother | 42 (44.2%) | 1.67 |
| Total Families | 95 (100.0%) | 2.24 |
Median Household Size in University Park
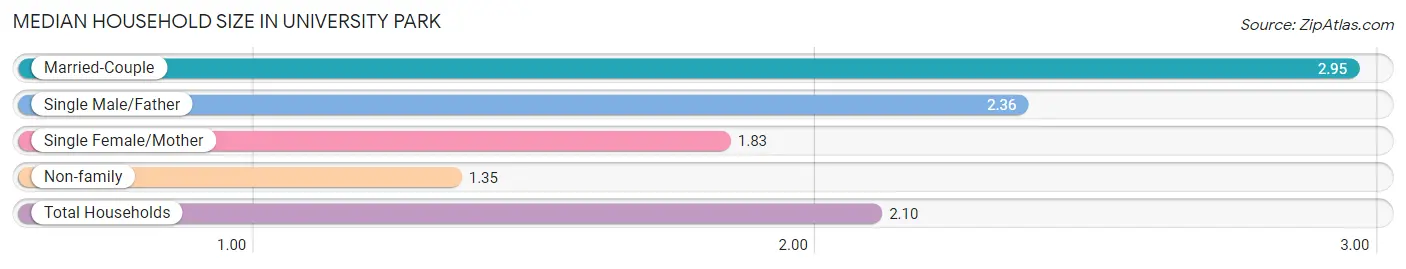
The median household size in University Park is 2.10 persons per household, with married-couple households (39 | 30.2%) accounting for the largest median household size of 2.95 persons per household. non-family households (34 | 26.4%) represent the smallest median household size with 1.35 persons per household.
| Household Type | # Households | Household Size |
| Married-Couple | 39 (30.2%) | 2.95 |
| Single Male/Father | 14 (10.8%) | 2.36 |
| Single Female/Mother | 42 (32.6%) | 1.83 |
| Non-family | 34 (26.4%) | 1.35 |
| Total Households | 129 (100.0%) | 2.10 |
Household Size by Marriage Status in University Park
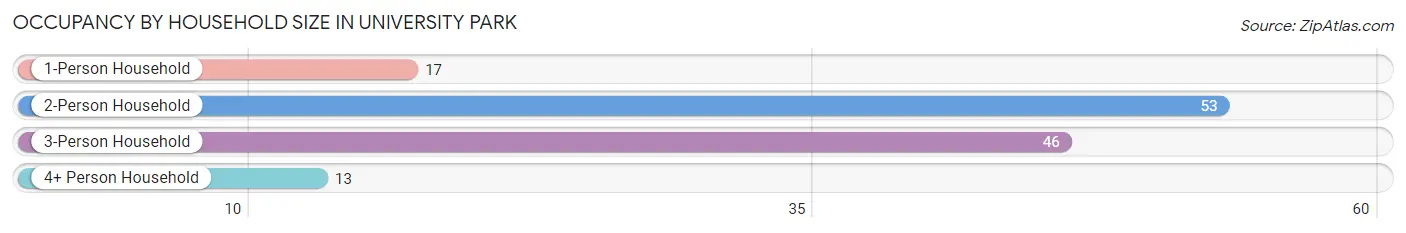
Out of a total of 129 households in University Park, 95 (73.6%) are family households, while 34 (26.4%) are nonfamily households. The most numerous type of family households are 3-person households, comprising 46, and the most common type of nonfamily households are 1-person households, comprising 17.
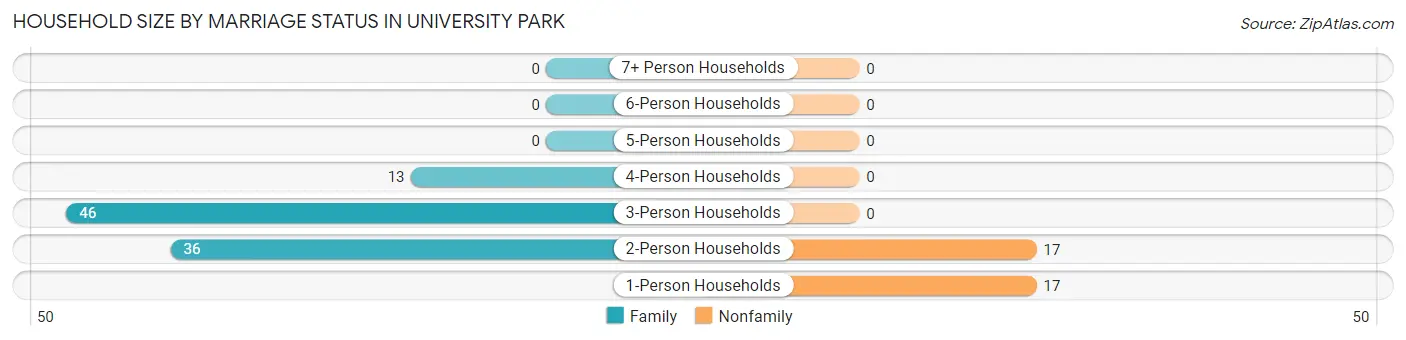
| Household Size | Family Households | Nonfamily Households |
| 1-Person Households | - | 17 (13.2%) |
| 2-Person Households | 36 (27.9%) | 17 (13.2%) |
| 3-Person Households | 46 (35.7%) | 0 (0.0%) |
| 4-Person Households | 13 (10.1%) | 0 (0.0%) |
| 5-Person Households | 0 (0.0%) | 0 (0.0%) |
| 6-Person Households | 0 (0.0%) | 0 (0.0%) |
| 7+ Person Households | 0 (0.0%) | 0 (0.0%) |
| Total | 95 (73.6%) | 34 (26.4%) |
Female Fertility in University Park
Fertility by Age in University Park
| Age Bracket | Women with Births | Births / 1,000 Women |
| 15 to 19 years | 0 (0.0%) | 0.0 |
| 20 to 34 years | 0 (0.0%) | 0.0 |
| 35 to 50 years | 0 (0.0%) | 0.0 |
| Total | 0 (0.0%) | 0.0 |
Fertility by Age by Marriage Status in University Park
| Age Bracket | Married | Unmarried |
| 15 to 19 years | 0 (0.0%) | 0 (0.0%) |
| 20 to 34 years | 0 (0.0%) | 0 (0.0%) |
| 35 to 50 years | 0 (0.0%) | 0 (0.0%) |
| Total | 0 (0.0%) | 0 (0.0%) |
Fertility by Education in University Park
| Educational Attainment | Women with Births | Births / 1,000 Women |
| Less than High School | 0 (0.0%) | 0.0 |
| High School Diploma | 0 (0.0%) | 0.0 |
| College or Associate's Degree | 0 (0.0%) | 0.0 |
| Bachelor's Degree | 0 (0.0%) | 0.0 |
| Graduate Degree | 0 (0.0%) | 0.0 |
| Total | 0 (0.0%) | 0.0 |
Fertility by Education by Marriage Status in University Park
| Educational Attainment | Married | Unmarried |
| Less than High School | 0 (0.0%) | 0 (0.0%) |
| High School Diploma | 0 (0.0%) | 0 (0.0%) |
| College or Associate's Degree | 0 (0.0%) | 0 (0.0%) |
| Bachelor's Degree | 0 (0.0%) | 0 (0.0%) |
| Graduate Degree | 0 (0.0%) | 0 (0.0%) |
| Total | 0 (0.0%) | 0 (0.0%) |
Employment Characteristics in University Park
Employment by Class of Employer in University Park
Among the 994 employed individuals in University Park, private company employees (602 | 60.6%), state government employees (340 | 34.2%), and not-for-profit organizations (40 | 4.0%) make up the most common classes of employment.
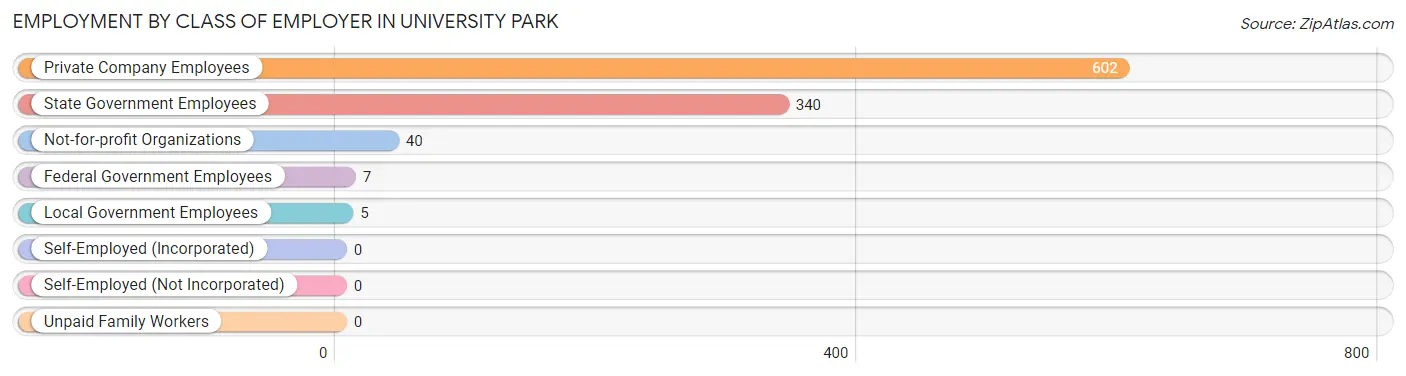
| Employer Class | # Employees | % Employees |
| Private Company Employees | 602 | 60.6% |
| Self-Employed (Incorporated) | 0 | 0.0% |
| Self-Employed (Not Incorporated) | 0 | 0.0% |
| Not-for-profit Organizations | 40 | 4.0% |
| Local Government Employees | 5 | 0.5% |
| State Government Employees | 340 | 34.2% |
| Federal Government Employees | 7 | 0.7% |
| Unpaid Family Workers | 0 | 0.0% |
| Total | 994 | 100.0% |
Employment Status by Age in University Park
According to the labor force statistics for University Park, out of the total population over 16 years of age (2,677), 51.0% or 1,365 individuals are in the labor force, with 22.1% or 302 of them unemployed. The age group with the highest labor force participation rate is 30 to 34 years, with 100.0% or 25 individuals in the labor force. Within the labor force, the 16 to 19 years age range has the highest percentage of unemployed individuals, with 31.7% or 268 of them being unemployed.
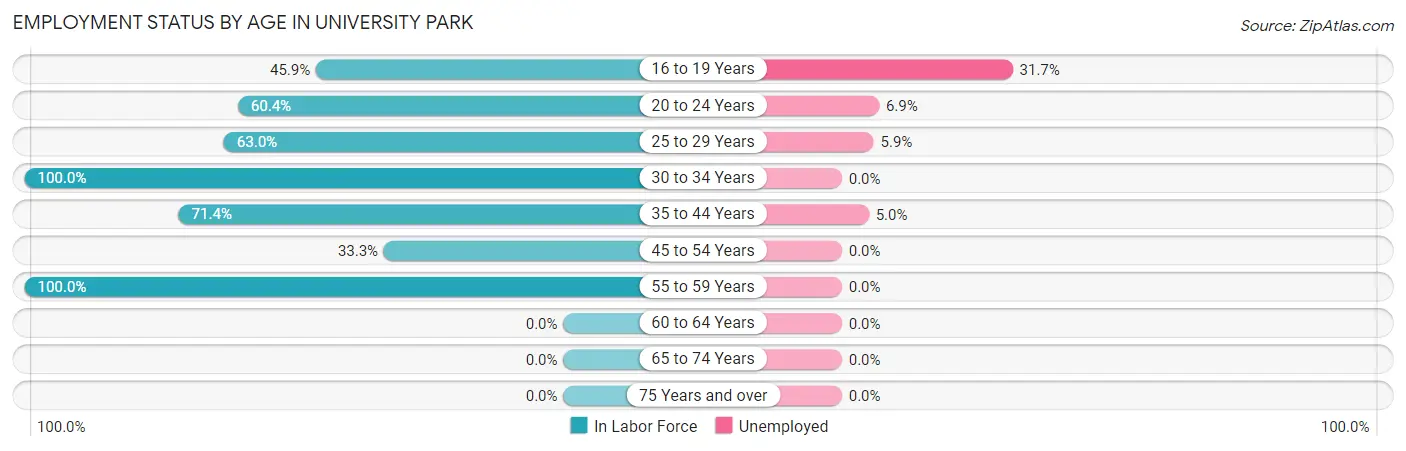
| Age Bracket | In Labor Force | Unemployed |
| 16 to 19 Years | 845 (45.9%) | 268 (31.7%) |
| 20 to 24 Years | 377 (60.4%) | 26 (6.9%) |
| 25 to 29 Years | 85 (63.0%) | 5 (5.9%) |
| 30 to 34 Years | 25 (100.0%) | 0 (0.0%) |
| 35 to 44 Years | 20 (71.4%) | 1 (5.0%) |
| 45 to 54 Years | 5 (33.3%) | 0 (0.0%) |
| 55 to 59 Years | 8 (100.0%) | 0 (0.0%) |
| 60 to 64 Years | 0 (0.0%) | 0 (0.0%) |
| 65 to 74 Years | 0 (0.0%) | 0 (0.0%) |
| 75 Years and over | 0 (0.0%) | 0 (0.0%) |
| Total | 1,365 (51.0%) | 302 (22.1%) |
Employment Status by Educational Attainment in University Park
According to labor force statistics for University Park, 67.8% of individuals (143) out of the total population between 25 and 64 years of age (211) are in the labor force, with 4.4% or 6 of them being unemployed. The group with the highest labor force participation rate are those with the educational attainment of bachelor's degree or higher, with 89.1% or 98 individuals in the labor force. Within the labor force, individuals with college / associate degree education have the highest percentage of unemployment, with 19.2% or 6 of them being unemployed.
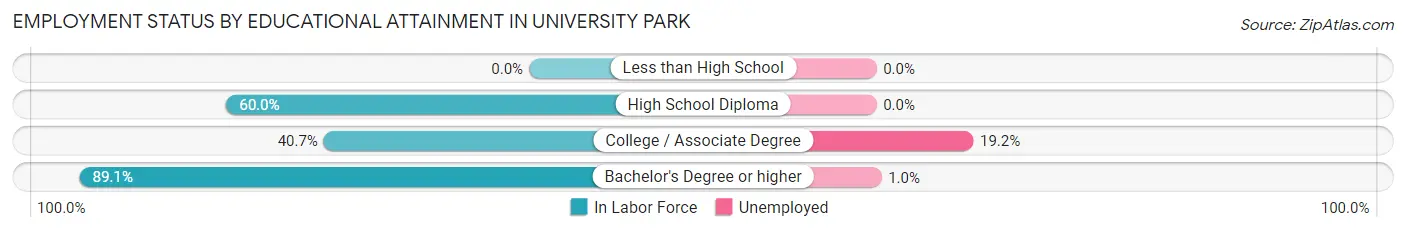
| Educational Attainment | In Labor Force | Unemployed |
| Less than High School | 0 (0.0%) | 0 (0.0%) |
| High School Diploma | 12 (60.0%) | 0 (0.0%) |
| College / Associate Degree | 33 (40.7%) | 16 (19.2%) |
| Bachelor's Degree or higher | 98 (89.1%) | 1 (1.0%) |
| Total | 143 (67.8%) | 9 (4.4%) |
Employment Occupations by Sex in University Park
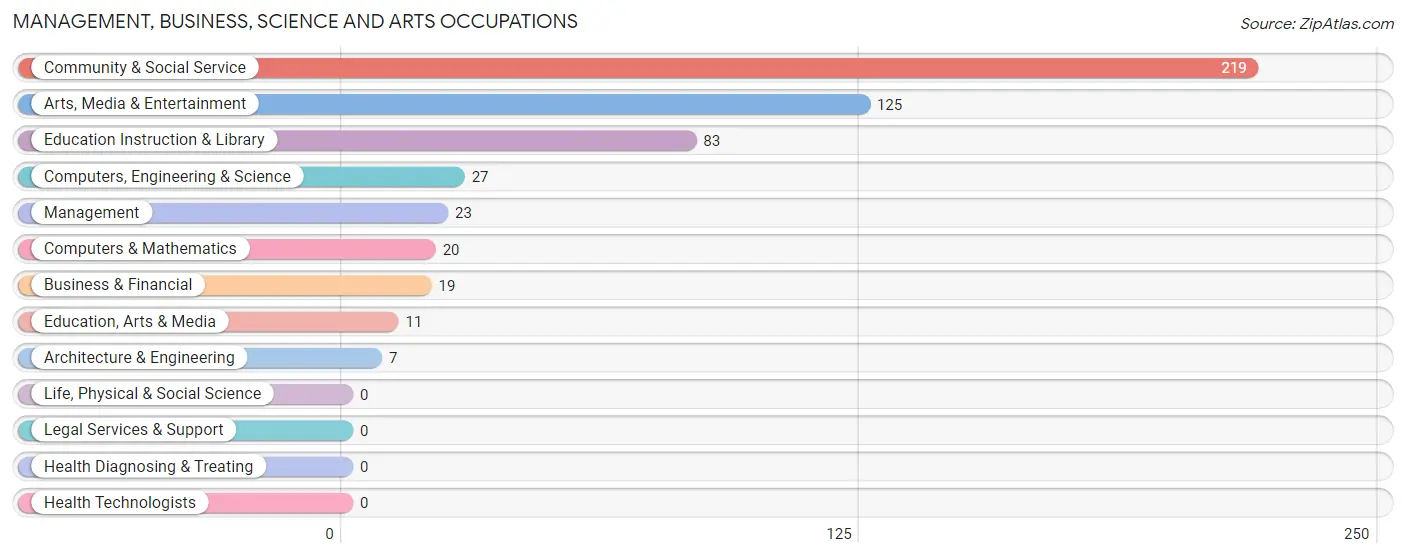
Management, Business, Science and Arts Occupations
The most common Management, Business, Science and Arts occupations in University Park are Community & Social Service (219 | 20.7%), Arts, Media & Entertainment (125 | 11.8%), Education Instruction & Library (83 | 7.8%), Computers, Engineering & Science (27 | 2.5%), and Management (23 | 2.2%).
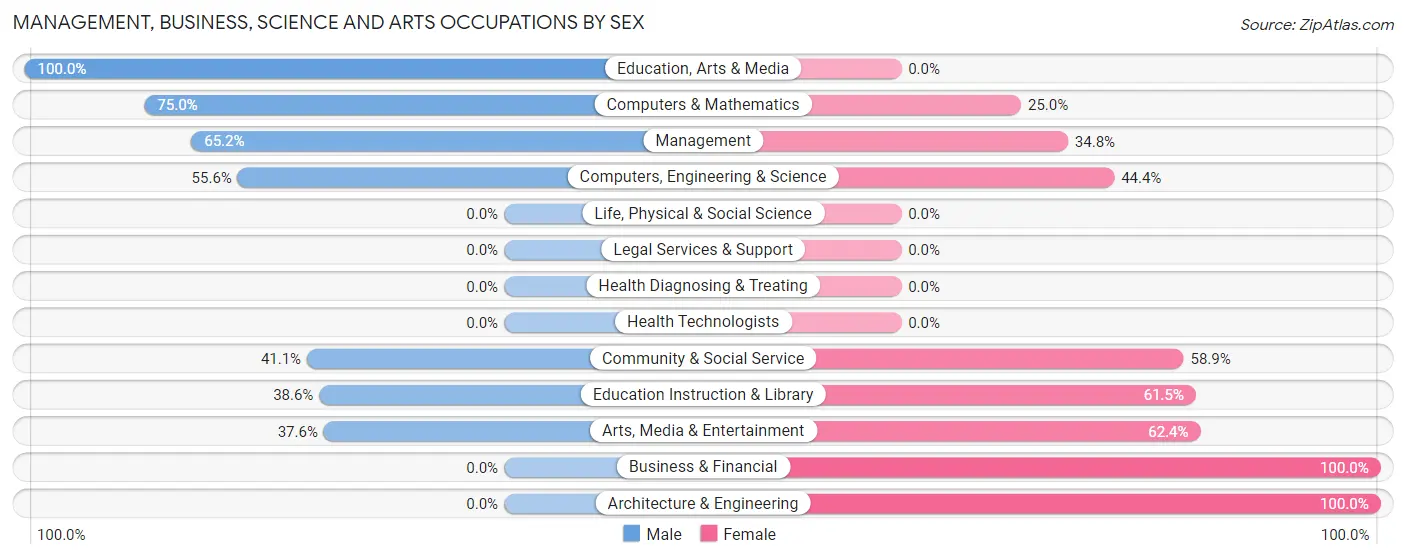
Management, Business, Science and Arts Occupations by Sex
Within the Management, Business, Science and Arts occupations in University Park, the most male-oriented occupations are Education, Arts & Media (100.0%), Computers & Mathematics (75.0%), and Management (65.2%), while the most female-oriented occupations are Business & Financial (100.0%), Architecture & Engineering (100.0%), and Arts, Media & Entertainment (62.4%).
| Occupation | Male | Female |
| Management | 15 (65.2%) | 8 (34.8%) |
| Business & Financial | 0 (0.0%) | 19 (100.0%) |
| Computers, Engineering & Science | 15 (55.6%) | 12 (44.4%) |
| Computers & Mathematics | 15 (75.0%) | 5 (25.0%) |
| Architecture & Engineering | 0 (0.0%) | 7 (100.0%) |
| Life, Physical & Social Science | 0 (0.0%) | 0 (0.0%) |
| Community & Social Service | 90 (41.1%) | 129 (58.9%) |
| Education, Arts & Media | 11 (100.0%) | 0 (0.0%) |
| Legal Services & Support | 0 (0.0%) | 0 (0.0%) |
| Education Instruction & Library | 32 (38.6%) | 51 (61.5%) |
| Arts, Media & Entertainment | 47 (37.6%) | 78 (62.4%) |
| Health Diagnosing & Treating | 0 (0.0%) | 0 (0.0%) |
| Health Technologists | 0 (0.0%) | 0 (0.0%) |
| Total (Category) | 120 (41.7%) | 168 (58.3%) |
| Total (Overall) | 474 (44.8%) | 584 (55.2%) |
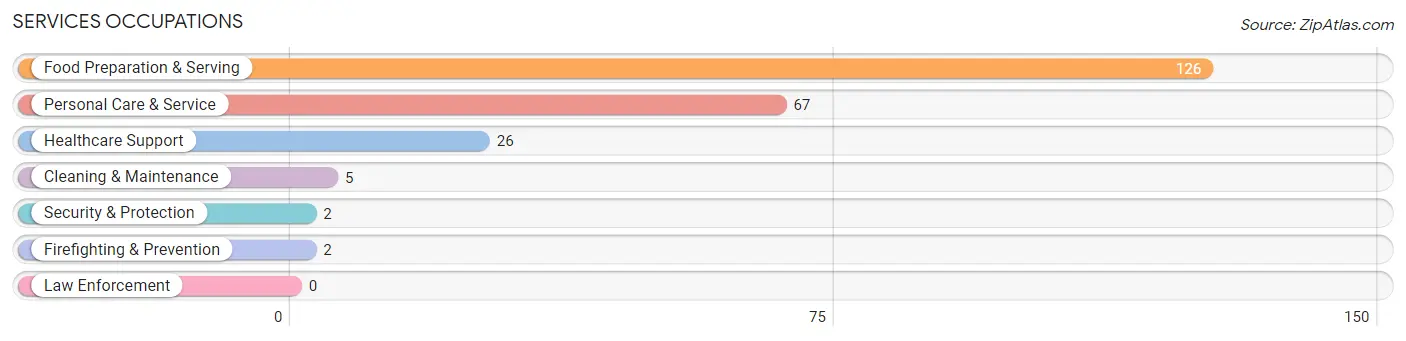
Services Occupations
The most common Services occupations in University Park are Food Preparation & Serving (126 | 11.9%), Personal Care & Service (67 | 6.3%), Healthcare Support (26 | 2.5%), Cleaning & Maintenance (5 | 0.5%), and Security & Protection (2 | 0.2%).
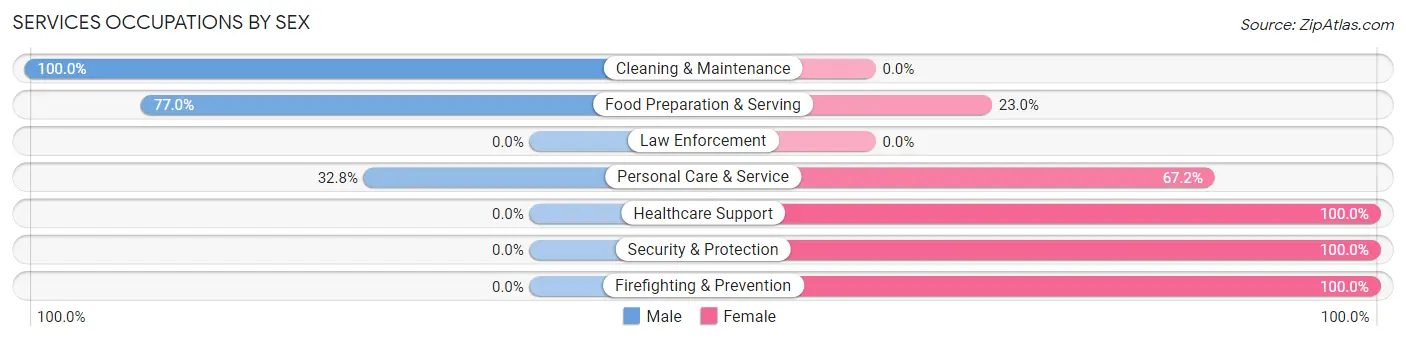
Services Occupations by Sex
Within the Services occupations in University Park, the most male-oriented occupations are Cleaning & Maintenance (100.0%), Food Preparation & Serving (77.0%), and Personal Care & Service (32.8%), while the most female-oriented occupations are Healthcare Support (100.0%), Security & Protection (100.0%), and Firefighting & Prevention (100.0%).
| Occupation | Male | Female |
| Healthcare Support | 0 (0.0%) | 26 (100.0%) |
| Security & Protection | 0 (0.0%) | 2 (100.0%) |
| Firefighting & Prevention | 0 (0.0%) | 2 (100.0%) |
| Law Enforcement | 0 (0.0%) | 0 (0.0%) |
| Food Preparation & Serving | 97 (77.0%) | 29 (23.0%) |
| Cleaning & Maintenance | 5 (100.0%) | 0 (0.0%) |
| Personal Care & Service | 22 (32.8%) | 45 (67.2%) |
| Total (Category) | 124 (54.9%) | 102 (45.1%) |
| Total (Overall) | 474 (44.8%) | 584 (55.2%) |
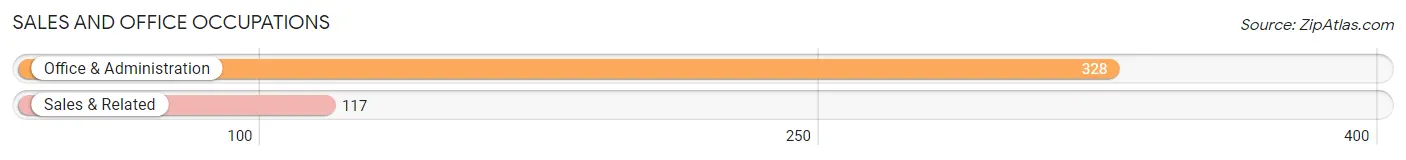
Sales and Office Occupations
The most common Sales and Office occupations in University Park are Office & Administration (328 | 31.0%), and Sales & Related (117 | 11.1%).
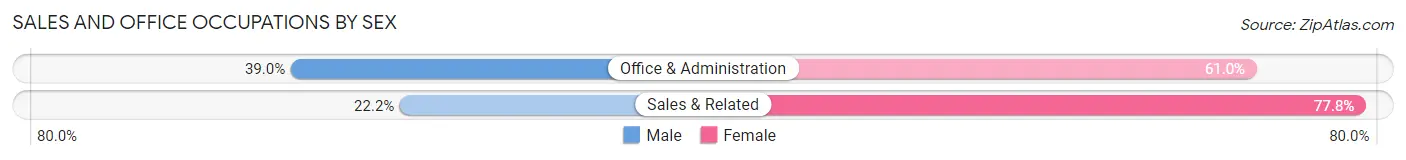
Sales and Office Occupations by Sex
| Occupation | Male | Female |
| Sales & Related | 26 (22.2%) | 91 (77.8%) |
| Office & Administration | 128 (39.0%) | 200 (61.0%) |
| Total (Category) | 154 (34.6%) | 291 (65.4%) |
| Total (Overall) | 474 (44.8%) | 584 (55.2%) |
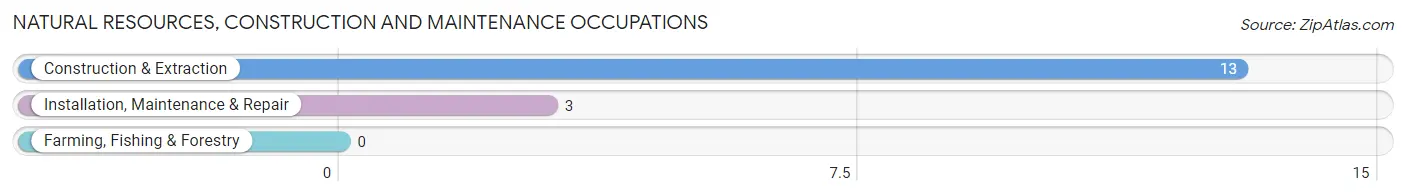
Natural Resources, Construction and Maintenance Occupations
The most common Natural Resources, Construction and Maintenance occupations in University Park are Construction & Extraction (13 | 1.2%), and Installation, Maintenance & Repair (3 | 0.3%).
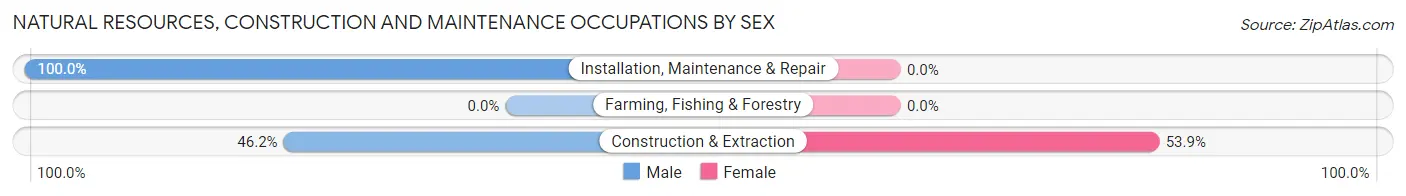
Natural Resources, Construction and Maintenance Occupations by Sex
| Occupation | Male | Female |
| Farming, Fishing & Forestry | 0 (0.0%) | 0 (0.0%) |
| Construction & Extraction | 6 (46.2%) | 7 (53.8%) |
| Installation, Maintenance & Repair | 3 (100.0%) | 0 (0.0%) |
| Total (Category) | 9 (56.2%) | 7 (43.8%) |
| Total (Overall) | 474 (44.8%) | 584 (55.2%) |
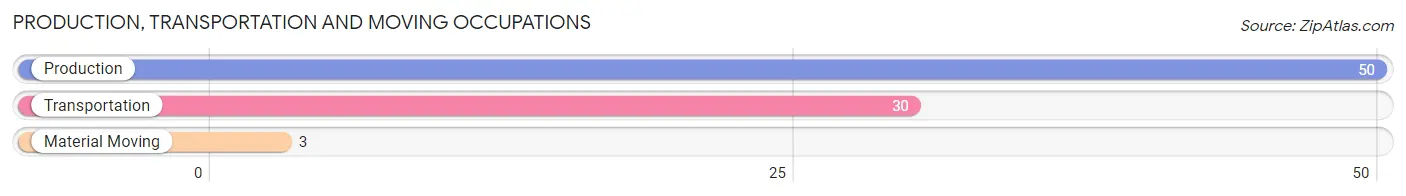
Production, Transportation and Moving Occupations
The most common Production, Transportation and Moving occupations in University Park are Production (50 | 4.7%), Transportation (30 | 2.8%), and Material Moving (3 | 0.3%).
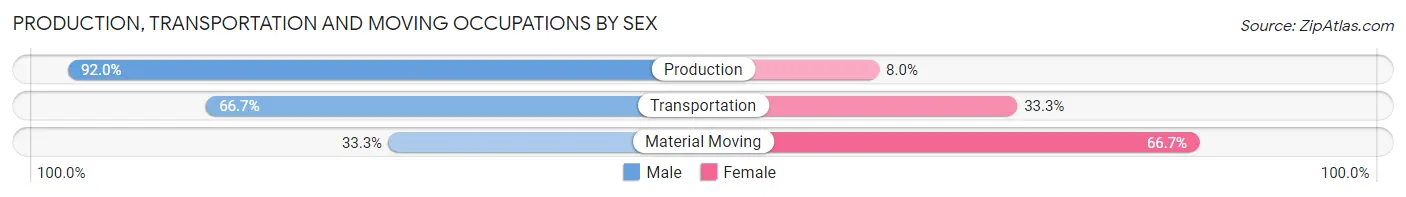
Production, Transportation and Moving Occupations by Sex
| Occupation | Male | Female |
| Production | 46 (92.0%) | 4 (8.0%) |
| Transportation | 20 (66.7%) | 10 (33.3%) |
| Material Moving | 1 (33.3%) | 2 (66.7%) |
| Total (Category) | 67 (80.7%) | 16 (19.3%) |
| Total (Overall) | 474 (44.8%) | 584 (55.2%) |
Employment Industries by Sex in University Park
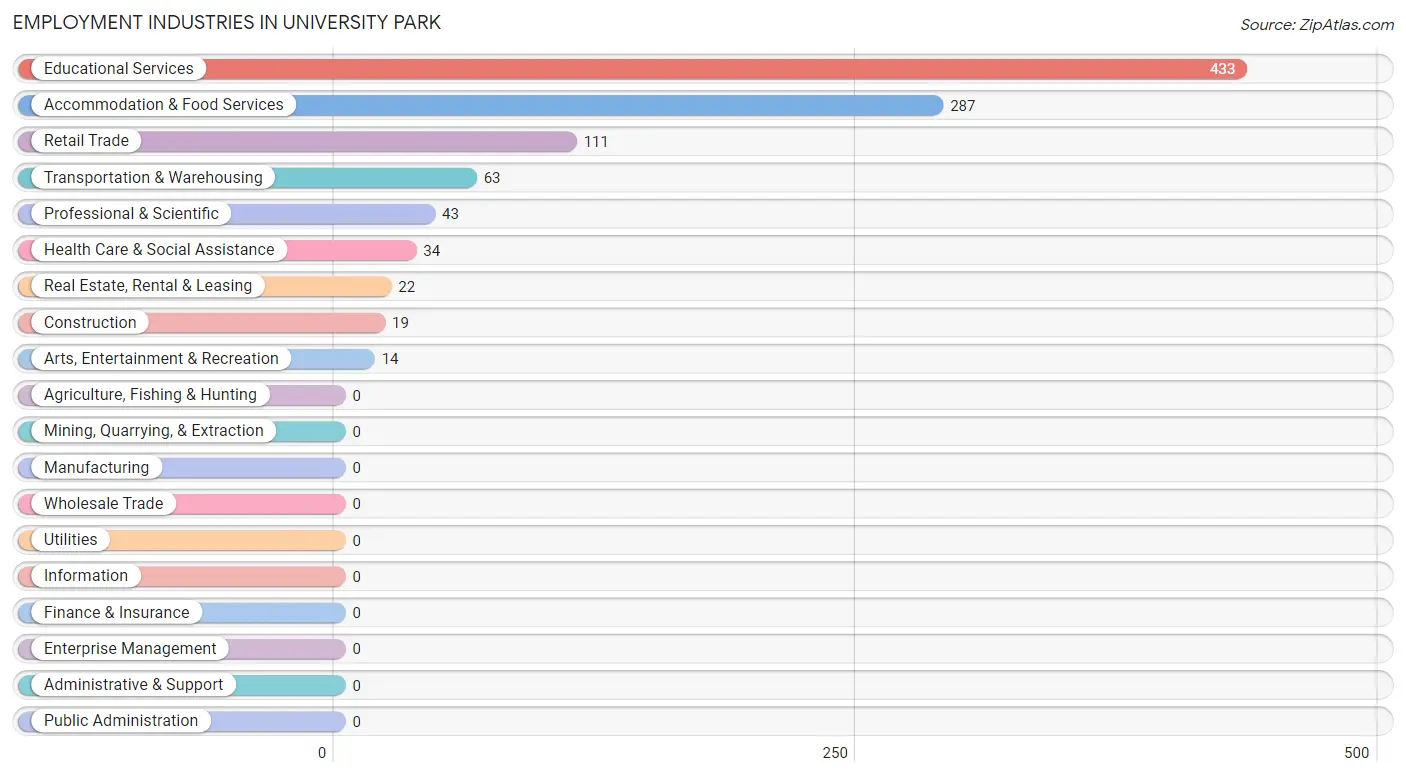
Employment Industries in University Park
The major employment industries in University Park include Educational Services (433 | 40.9%), Accommodation & Food Services (287 | 27.1%), Retail Trade (111 | 10.5%), Transportation & Warehousing (63 | 5.9%), and Professional & Scientific (43 | 4.1%).
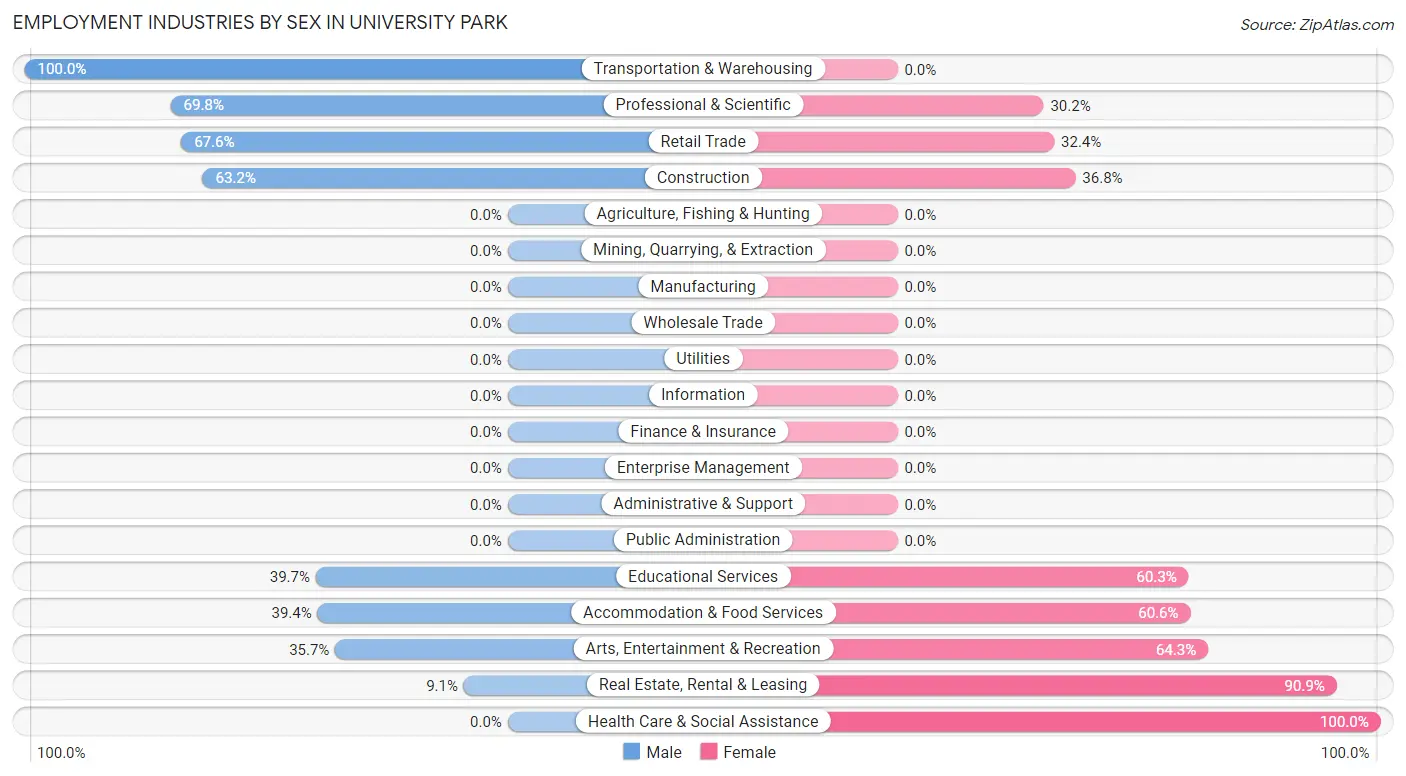
Employment Industries by Sex in University Park
The University Park industries that see more men than women are Transportation & Warehousing (100.0%), Professional & Scientific (69.8%), and Retail Trade (67.6%), whereas the industries that tend to have a higher number of women are Health Care & Social Assistance (100.0%), Real Estate, Rental & Leasing (90.9%), and Arts, Entertainment & Recreation (64.3%).
| Industry | Male | Female |
| Agriculture, Fishing & Hunting | 0 (0.0%) | 0 (0.0%) |
| Mining, Quarrying, & Extraction | 0 (0.0%) | 0 (0.0%) |
| Construction | 12 (63.2%) | 7 (36.8%) |
| Manufacturing | 0 (0.0%) | 0 (0.0%) |
| Wholesale Trade | 0 (0.0%) | 0 (0.0%) |
| Retail Trade | 75 (67.6%) | 36 (32.4%) |
| Transportation & Warehousing | 63 (100.0%) | 0 (0.0%) |
| Utilities | 0 (0.0%) | 0 (0.0%) |
| Information | 0 (0.0%) | 0 (0.0%) |
| Finance & Insurance | 0 (0.0%) | 0 (0.0%) |
| Real Estate, Rental & Leasing | 2 (9.1%) | 20 (90.9%) |
| Professional & Scientific | 30 (69.8%) | 13 (30.2%) |
| Enterprise Management | 0 (0.0%) | 0 (0.0%) |
| Administrative & Support | 0 (0.0%) | 0 (0.0%) |
| Educational Services | 172 (39.7%) | 261 (60.3%) |
| Health Care & Social Assistance | 0 (0.0%) | 34 (100.0%) |
| Arts, Entertainment & Recreation | 5 (35.7%) | 9 (64.3%) |
| Accommodation & Food Services | 113 (39.4%) | 174 (60.6%) |
| Public Administration | 0 (0.0%) | 0 (0.0%) |
| Total | 474 (44.8%) | 584 (55.2%) |
Education in University Park
School Enrollment in University Park
The most common levels of schooling among the 2,662 students in University Park are college / undergraduate (2,518 | 94.6%), graduate / professional (86 | 3.2%), and elementary school (24 | 0.9%).
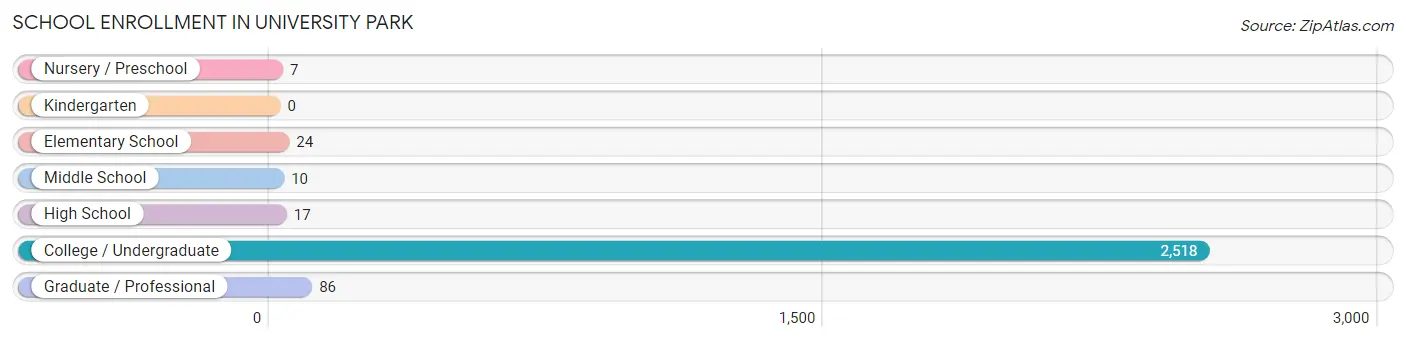
| School Level | # Students | % Students |
| Nursery / Preschool | 7 | 0.3% |
| Kindergarten | 0 | 0.0% |
| Elementary School | 24 | 0.9% |
| Middle School | 10 | 0.4% |
| High School | 17 | 0.6% |
| College / Undergraduate | 2,518 | 94.6% |
| Graduate / Professional | 86 | 3.2% |
| Total | 2,662 | 100.0% |
School Enrollment by Age by Funding Source in University Park
Out of a total of 2,662 students who are enrolled in schools in University Park, 5 (0.2%) attend a private institution, while the remaining 2,657 (99.8%) are enrolled in public schools. The age group of 3 to 4 year olds has the highest likelihood of being enrolled in private schools, with 5 (71.4% in the age bracket) enrolled. Conversely, the age group of 5 to 9 year old has the lowest likelihood of being enrolled in a private school, with 24 (100.0% in the age bracket) attending a public institution.
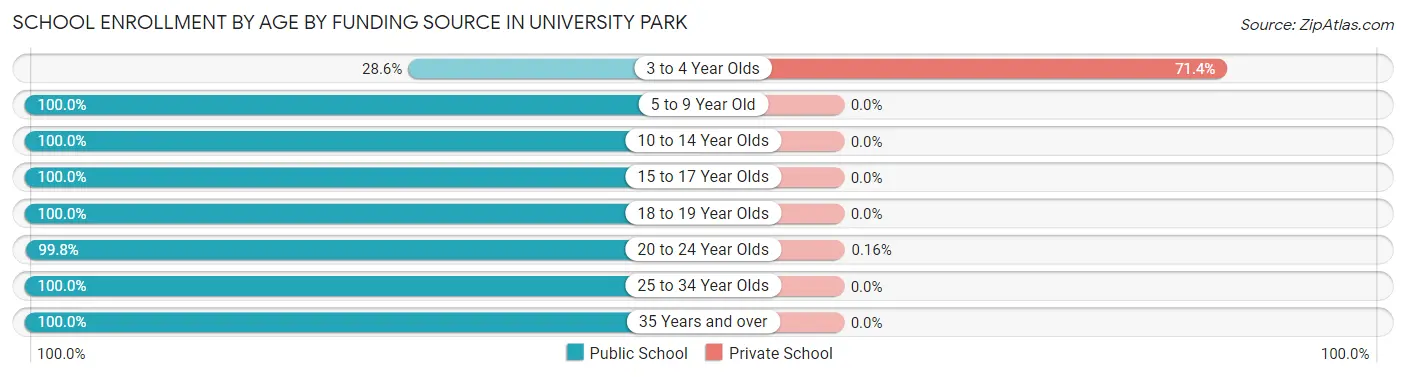
| Age Bracket | Public School | Private School |
| 3 to 4 Year Olds | 2 (28.6%) | 5 (71.4%) |
| 5 to 9 Year Old | 24 (100.0%) | 0 (0.0%) |
| 10 to 14 Year Olds | 10 (100.0%) | 0 (0.0%) |
| 15 to 17 Year Olds | 49 (100.0%) | 0 (0.0%) |
| 18 to 19 Year Olds | 1,810 (100.0%) | 0 (0.0%) |
| 20 to 24 Year Olds | 616 (99.8%) | 1 (0.2%) |
| 25 to 34 Year Olds | 113 (100.0%) | 0 (0.0%) |
| 35 Years and over | 32 (100.0%) | 0 (0.0%) |
| Total | 2,657 (99.8%) | 5 (0.2%) |
Educational Attainment by Field of Study in University Park
Social sciences (72 | 61.0%), engineering (12 | 10.2%), computers & mathematics (8 | 6.8%), business (8 | 6.8%), and education (7 | 5.9%) are the most common fields of study among 118 individuals in University Park who have obtained a bachelor's degree or higher.
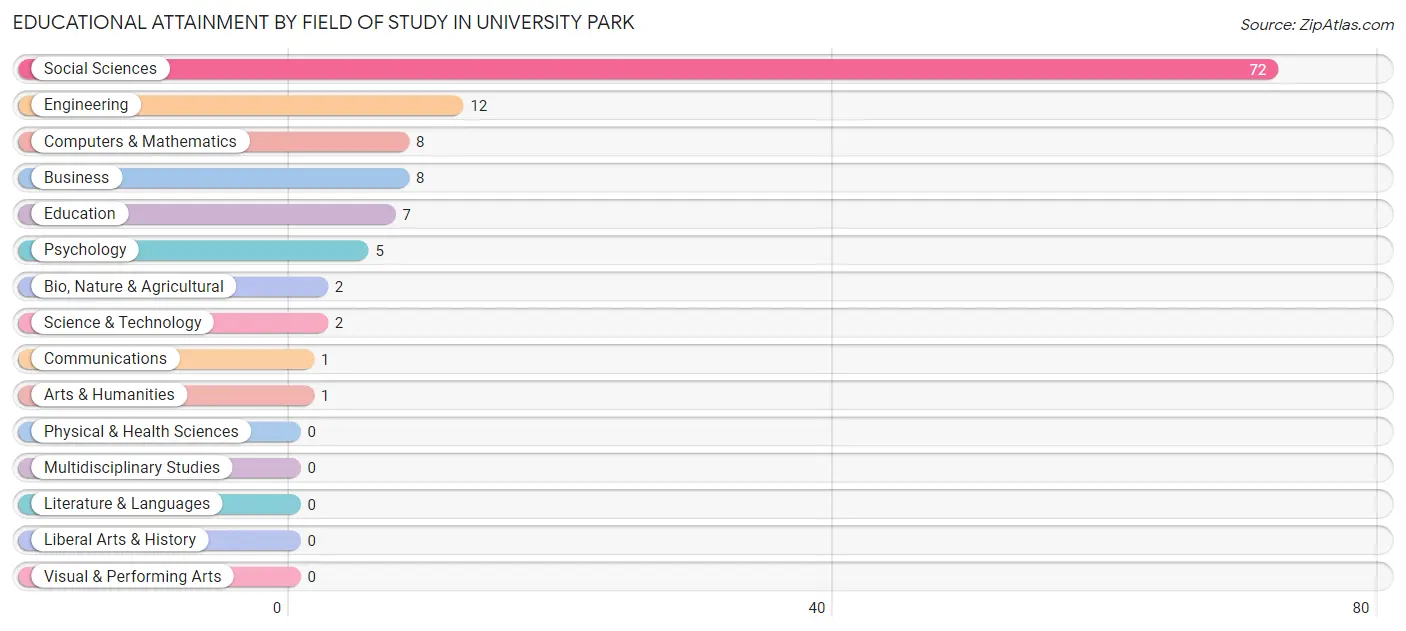
| Field of Study | # Graduates | % Graduates |
| Computers & Mathematics | 8 | 6.8% |
| Bio, Nature & Agricultural | 2 | 1.7% |
| Physical & Health Sciences | 0 | 0.0% |
| Psychology | 5 | 4.2% |
| Social Sciences | 72 | 61.0% |
| Engineering | 12 | 10.2% |
| Multidisciplinary Studies | 0 | 0.0% |
| Science & Technology | 2 | 1.7% |
| Business | 8 | 6.8% |
| Education | 7 | 5.9% |
| Literature & Languages | 0 | 0.0% |
| Liberal Arts & History | 0 | 0.0% |
| Visual & Performing Arts | 0 | 0.0% |
| Communications | 1 | 0.9% |
| Arts & Humanities | 1 | 0.9% |
| Total | 118 | 100.0% |
Transportation & Commute in University Park
Vehicle Availability by Sex in University Park
The most prevalent vehicle ownership categories in University Park are males with 1 vehicle (41, accounting for 54.7%) and females with 1 vehicle (23, making up 70.7%).
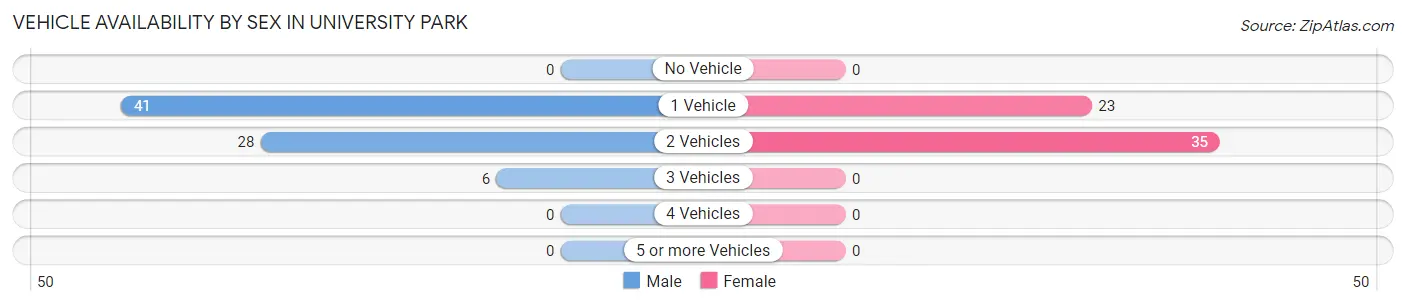
| Vehicles Available | Male | Female |
| No Vehicle | 0 (0.0%) | 0 (0.0%) |
| 1 Vehicle | 41 (54.7%) | 23 (39.7%) |
| 2 Vehicles | 28 (37.3%) | 35 (60.3%) |
| 3 Vehicles | 6 (8.0%) | 0 (0.0%) |
| 4 Vehicles | 0 (0.0%) | 0 (0.0%) |
| 5 or more Vehicles | 0 (0.0%) | 0 (0.0%) |
| Total | 75 (100.0%) | 58 (100.0%) |
Commute Time in University Park
The most frequently occuring commute durations in University Park are 10 to 14 minutes (403 commuters, 43.5%), 5 to 9 minutes (270 commuters, 29.1%), and 15 to 19 minutes (170 commuters, 18.3%).
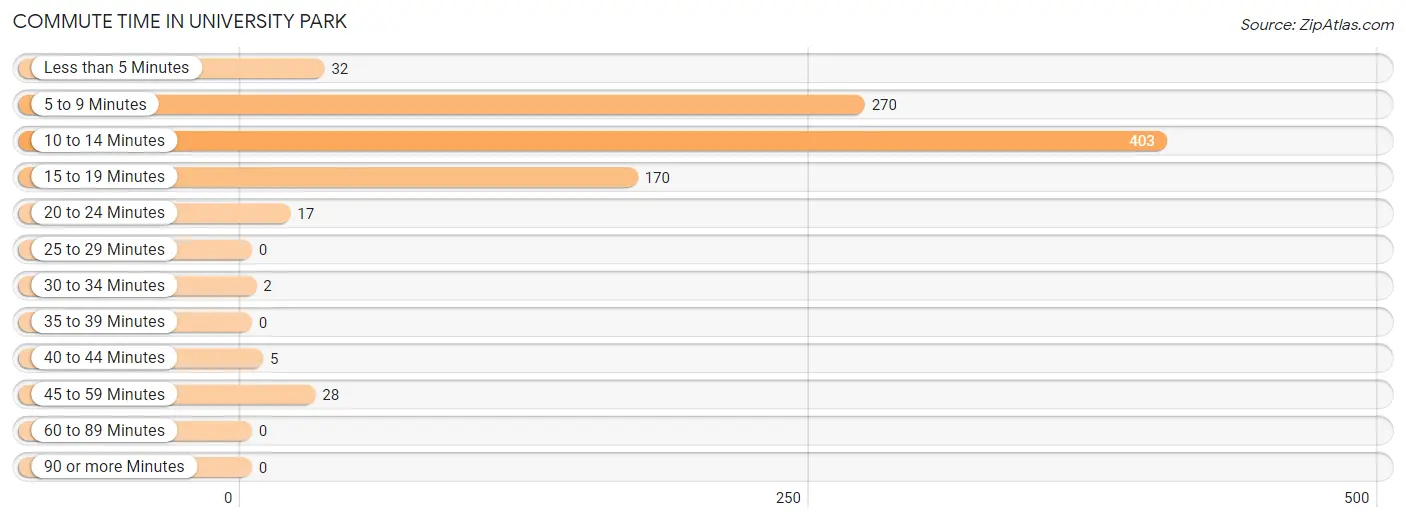
| Commute Time | # Commuters | % Commuters |
| Less than 5 Minutes | 32 | 3.5% |
| 5 to 9 Minutes | 270 | 29.1% |
| 10 to 14 Minutes | 403 | 43.5% |
| 15 to 19 Minutes | 170 | 18.3% |
| 20 to 24 Minutes | 17 | 1.8% |
| 25 to 29 Minutes | 0 | 0.0% |
| 30 to 34 Minutes | 2 | 0.2% |
| 35 to 39 Minutes | 0 | 0.0% |
| 40 to 44 Minutes | 5 | 0.5% |
| 45 to 59 Minutes | 28 | 3.0% |
| 60 to 89 Minutes | 0 | 0.0% |
| 90 or more Minutes | 0 | 0.0% |
Commute Time by Sex in University Park
The most common commute times in University Park are 10 to 14 minutes (165 commuters, 41.5%) for males and 10 to 14 minutes (238 commuters, 45.0%) for females.
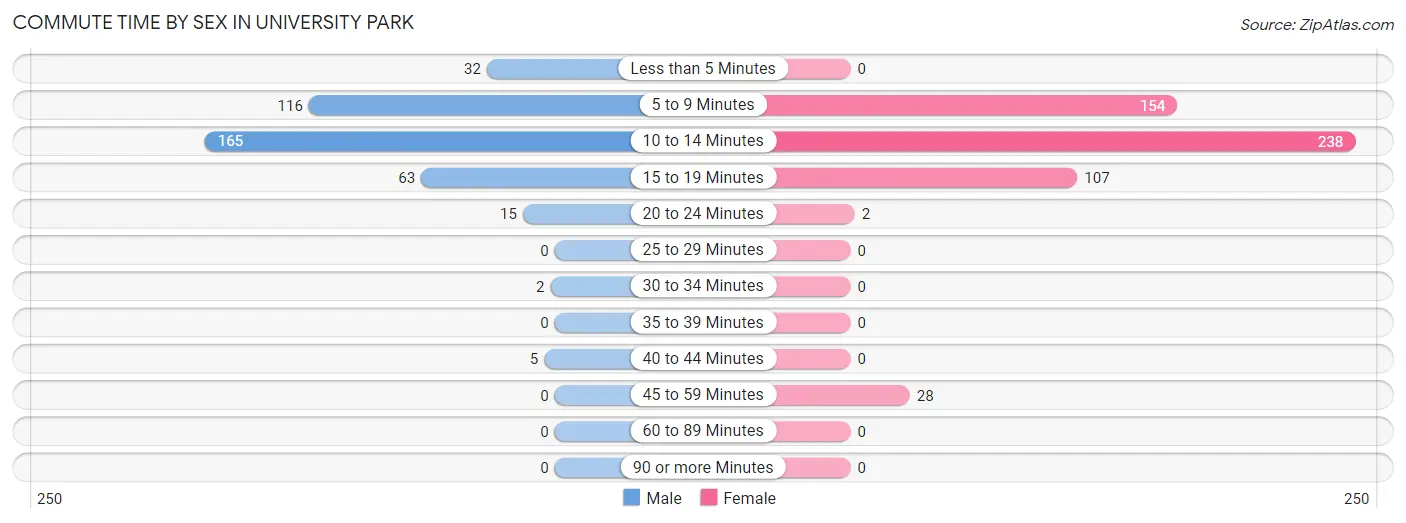
| Commute Time | Male | Female |
| Less than 5 Minutes | 32 (8.0%) | 0 (0.0%) |
| 5 to 9 Minutes | 116 (29.1%) | 154 (29.1%) |
| 10 to 14 Minutes | 165 (41.5%) | 238 (45.0%) |
| 15 to 19 Minutes | 63 (15.8%) | 107 (20.2%) |
| 20 to 24 Minutes | 15 (3.8%) | 2 (0.4%) |
| 25 to 29 Minutes | 0 (0.0%) | 0 (0.0%) |
| 30 to 34 Minutes | 2 (0.5%) | 0 (0.0%) |
| 35 to 39 Minutes | 0 (0.0%) | 0 (0.0%) |
| 40 to 44 Minutes | 5 (1.3%) | 0 (0.0%) |
| 45 to 59 Minutes | 0 (0.0%) | 28 (5.3%) |
| 60 to 89 Minutes | 0 (0.0%) | 0 (0.0%) |
| 90 or more Minutes | 0 (0.0%) | 0 (0.0%) |
Time of Departure to Work by Sex in University Park
The most frequent times of departure to work in University Park are 12:00 PM to 3:59 PM (133, 33.4%) for males and 12:00 PM to 3:59 PM (195, 36.9%) for females.
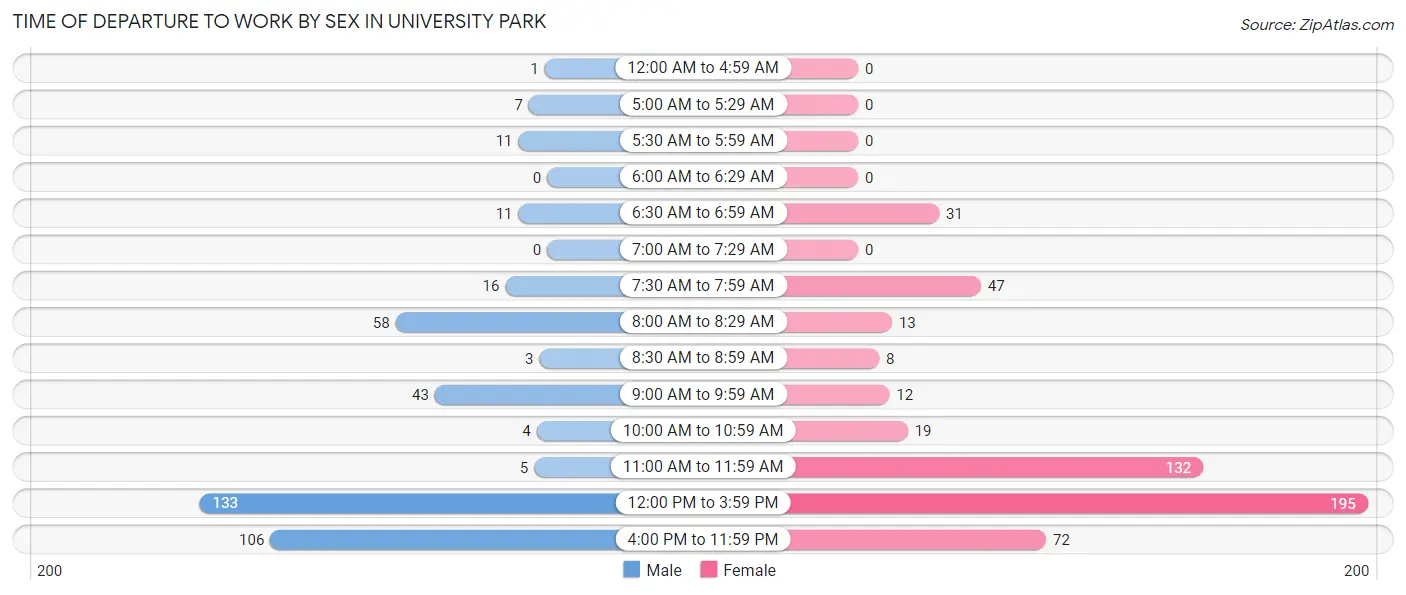
| Time of Departure | Male | Female |
| 12:00 AM to 4:59 AM | 1 (0.3%) | 0 (0.0%) |
| 5:00 AM to 5:29 AM | 7 (1.8%) | 0 (0.0%) |
| 5:30 AM to 5:59 AM | 11 (2.8%) | 0 (0.0%) |
| 6:00 AM to 6:29 AM | 0 (0.0%) | 0 (0.0%) |
| 6:30 AM to 6:59 AM | 11 (2.8%) | 31 (5.9%) |
| 7:00 AM to 7:29 AM | 0 (0.0%) | 0 (0.0%) |
| 7:30 AM to 7:59 AM | 16 (4.0%) | 47 (8.9%) |
| 8:00 AM to 8:29 AM | 58 (14.6%) | 13 (2.5%) |
| 8:30 AM to 8:59 AM | 3 (0.7%) | 8 (1.5%) |
| 9:00 AM to 9:59 AM | 43 (10.8%) | 12 (2.3%) |
| 10:00 AM to 10:59 AM | 4 (1.0%) | 19 (3.6%) |
| 11:00 AM to 11:59 AM | 5 (1.3%) | 132 (24.9%) |
| 12:00 PM to 3:59 PM | 133 (33.4%) | 195 (36.9%) |
| 4:00 PM to 11:59 PM | 106 (26.6%) | 72 (13.6%) |
| Total | 398 (100.0%) | 529 (100.0%) |
Housing Occupancy in University Park
Occupancy by Ownership in University Park
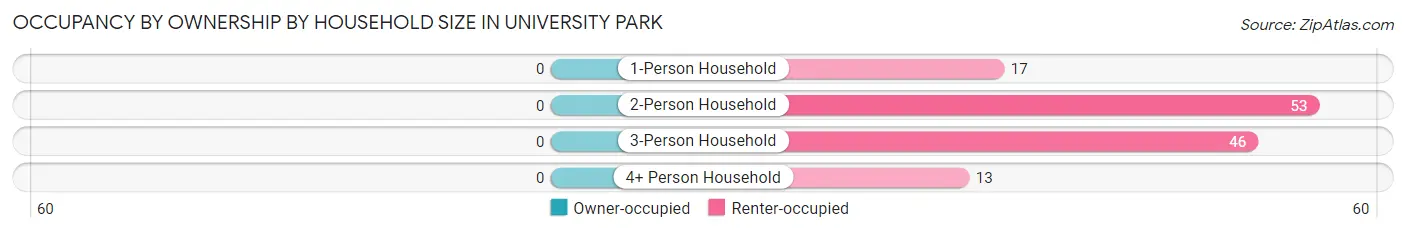
Of the total 129 dwellings in University Park, owner-occupied units account for 0 (0.0%), while renter-occupied units make up 129 (100.0%).
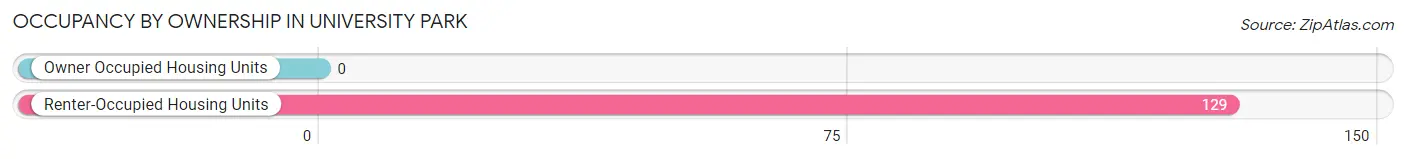
| Occupancy | # Housing Units | % Housing Units |
| Owner Occupied Housing Units | 0 | 0.0% |
| Renter-Occupied Housing Units | 129 | 100.0% |
| Total Occupied Housing Units | 129 | 100.0% |
Occupancy by Household Size in University Park
| Household Size | # Housing Units | % Housing Units |
| 1-Person Household | 17 | 13.2% |
| 2-Person Household | 53 | 41.1% |
| 3-Person Household | 46 | 35.7% |
| 4+ Person Household | 13 | 10.1% |
| Total Housing Units | 129 | 100.0% |
Occupancy by Ownership by Household Size in University Park
| Household Size | Owner-occupied | Renter-occupied |
| 1-Person Household | 0 (0.0%) | 17 (100.0%) |
| 2-Person Household | 0 (0.0%) | 53 (100.0%) |
| 3-Person Household | 0 (0.0%) | 46 (100.0%) |
| 4+ Person Household | 0 (0.0%) | 13 (100.0%) |
| Total Housing Units | 0 (0.0%) | 129 (100.0%) |
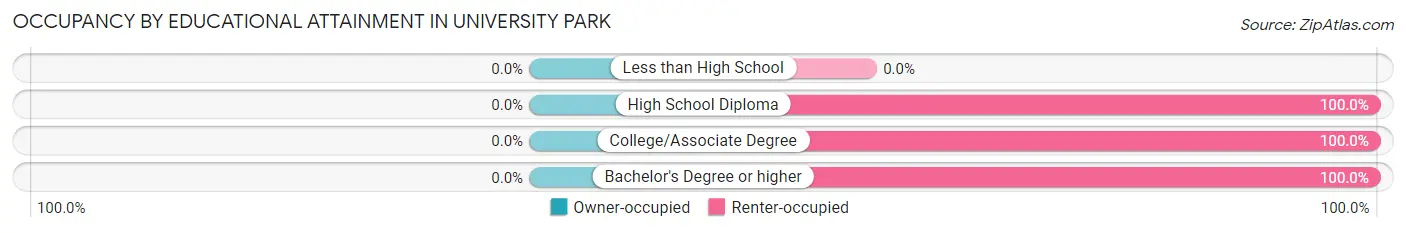
Occupancy by Educational Attainment in University Park
| Household Size | Owner-occupied | Renter-occupied |
| Less than High School | 0 (0.0%) | 0 (0.0%) |
| High School Diploma | 0 (0.0%) | 8 (100.0%) |
| College/Associate Degree | 0 (0.0%) | 93 (100.0%) |
| Bachelor's Degree or higher | 0 (0.0%) | 28 (100.0%) |
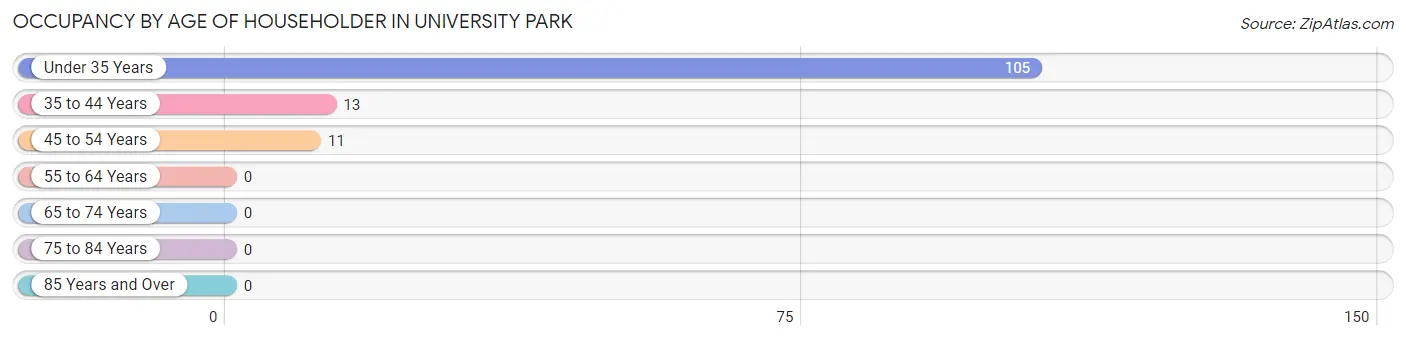
Occupancy by Age of Householder in University Park
| Age Bracket | # Households | % Households |
| Under 35 Years | 105 | 81.4% |
| 35 to 44 Years | 13 | 10.1% |
| 45 to 54 Years | 11 | 8.5% |
| 55 to 64 Years | 0 | 0.0% |
| 65 to 74 Years | 0 | 0.0% |
| 75 to 84 Years | 0 | 0.0% |
| 85 Years and Over | 0 | 0.0% |
| Total | 129 | 100.0% |
Housing Finances in University Park
Median Income by Occupancy in University Park
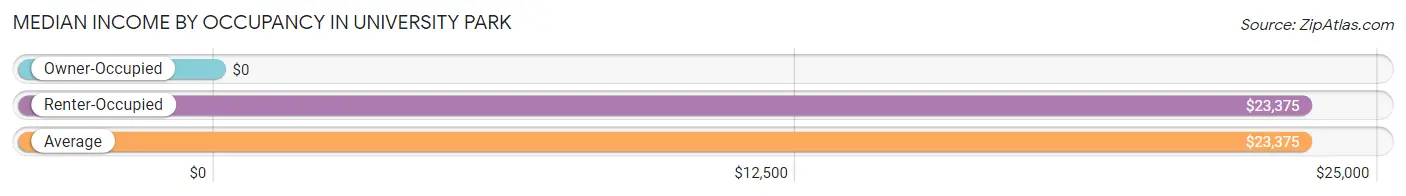
| Occupancy Type | # Households | Median Income |
| Owner-Occupied | 0 (0.0%) | $0 |
| Renter-Occupied | 129 (100.0%) | $23,375 |
| Average | 129 (100.0%) | $23,375 |
Occupancy by Householder Income Bracket in University Park
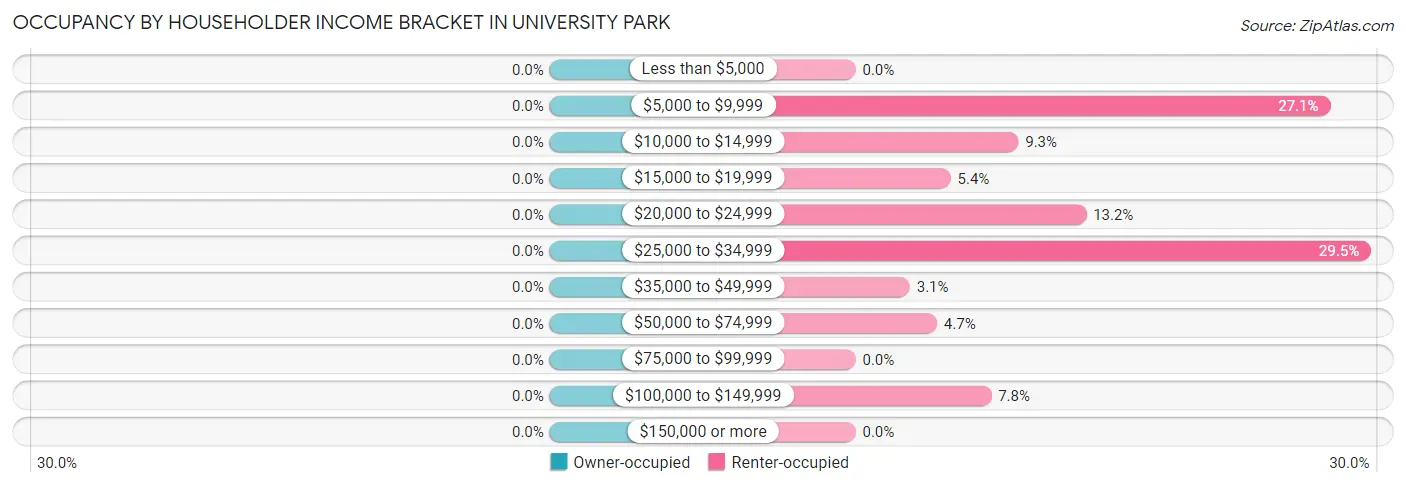
| Income Bracket | Owner-occupied | Renter-occupied |
| Less than $5,000 | 0 (0.0%) | 0 (0.0%) |
| $5,000 to $9,999 | 0 (0.0%) | 35 (27.1%) |
| $10,000 to $14,999 | 0 (0.0%) | 12 (9.3%) |
| $15,000 to $19,999 | 0 (0.0%) | 7 (5.4%) |
| $20,000 to $24,999 | 0 (0.0%) | 17 (13.2%) |
| $25,000 to $34,999 | 0 (0.0%) | 38 (29.5%) |
| $35,000 to $49,999 | 0 (0.0%) | 4 (3.1%) |
| $50,000 to $74,999 | 0 (0.0%) | 6 (4.6%) |
| $75,000 to $99,999 | 0 (0.0%) | 0 (0.0%) |
| $100,000 to $149,999 | 0 (0.0%) | 10 (7.7%) |
| $150,000 or more | 0 (0.0%) | 0 (0.0%) |
| Total | 0 (0.0%) | 129 (100.0%) |
Monthly Housing Cost Tiers in University Park
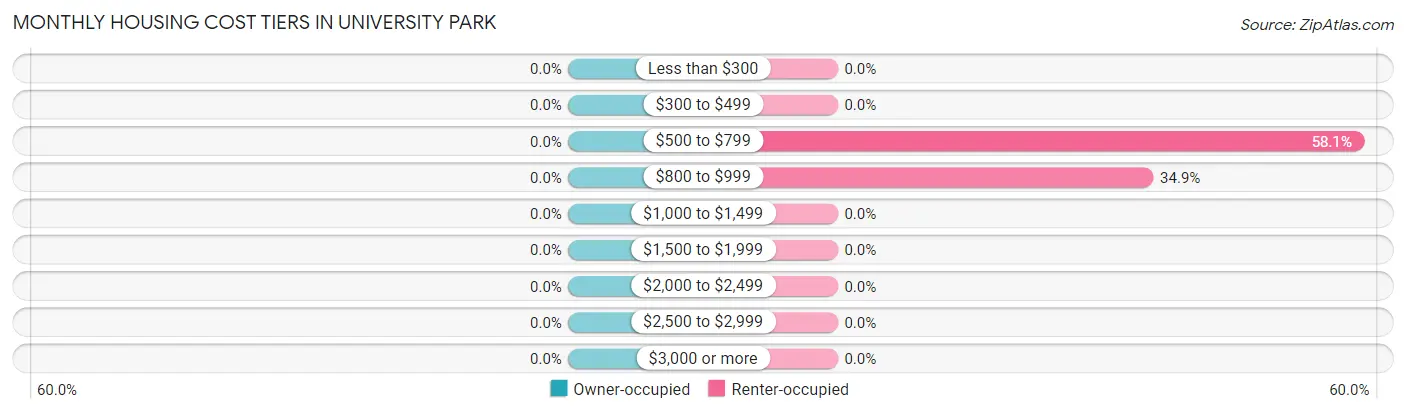
| Monthly Cost | Owner-occupied | Renter-occupied |
| Less than $300 | 0 (0.0%) | 0 (0.0%) |
| $300 to $499 | 0 (0.0%) | 0 (0.0%) |
| $500 to $799 | 0 (0.0%) | 75 (58.1%) |
| $800 to $999 | 0 (0.0%) | 45 (34.9%) |
| $1,000 to $1,499 | 0 (0.0%) | 0 (0.0%) |
| $1,500 to $1,999 | 0 (0.0%) | 0 (0.0%) |
| $2,000 to $2,499 | 0 (0.0%) | 0 (0.0%) |
| $2,500 to $2,999 | 0 (0.0%) | 0 (0.0%) |
| $3,000 or more | 0 (0.0%) | 0 (0.0%) |
| Total | 0 (0.0%) | 129 (100.0%) |
Physical Housing Characteristics in University Park
Housing Structures in University Park
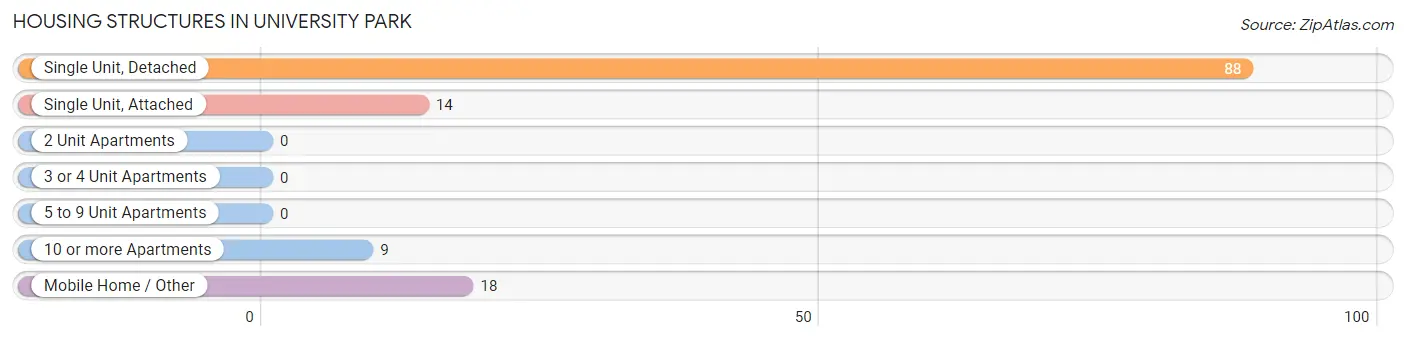
| Structure Type | # Housing Units | % Housing Units |
| Single Unit, Detached | 88 | 68.2% |
| Single Unit, Attached | 14 | 10.8% |
| 2 Unit Apartments | 0 | 0.0% |
| 3 or 4 Unit Apartments | 0 | 0.0% |
| 5 to 9 Unit Apartments | 0 | 0.0% |
| 10 or more Apartments | 9 | 7.0% |
| Mobile Home / Other | 18 | 14.0% |
| Total | 129 | 100.0% |
Housing Structures by Occupancy in University Park
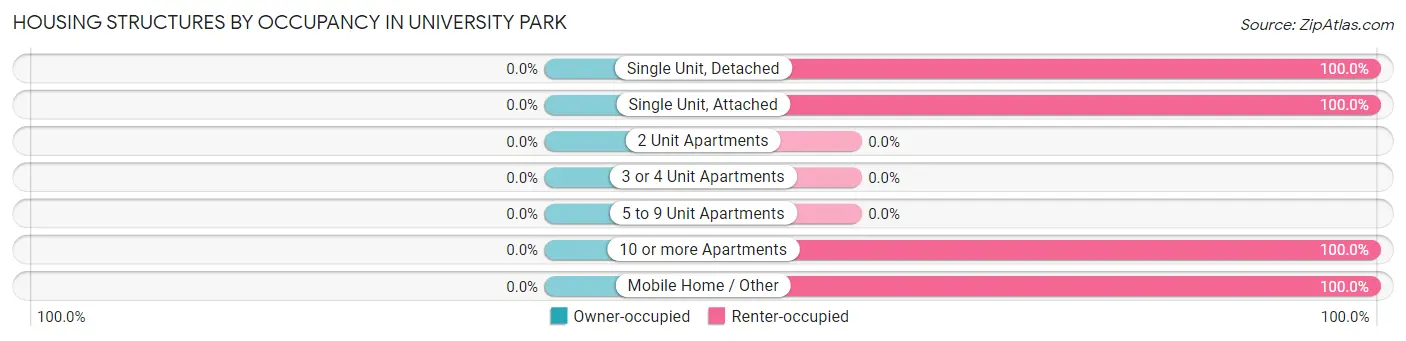
| Structure Type | Owner-occupied | Renter-occupied |
| Single Unit, Detached | 0 (0.0%) | 88 (100.0%) |
| Single Unit, Attached | 0 (0.0%) | 14 (100.0%) |
| 2 Unit Apartments | 0 (0.0%) | 0 (0.0%) |
| 3 or 4 Unit Apartments | 0 (0.0%) | 0 (0.0%) |
| 5 to 9 Unit Apartments | 0 (0.0%) | 0 (0.0%) |
| 10 or more Apartments | 0 (0.0%) | 9 (100.0%) |
| Mobile Home / Other | 0 (0.0%) | 18 (100.0%) |
| Total | 0 (0.0%) | 129 (100.0%) |
Housing Structures by Number of Rooms in University Park
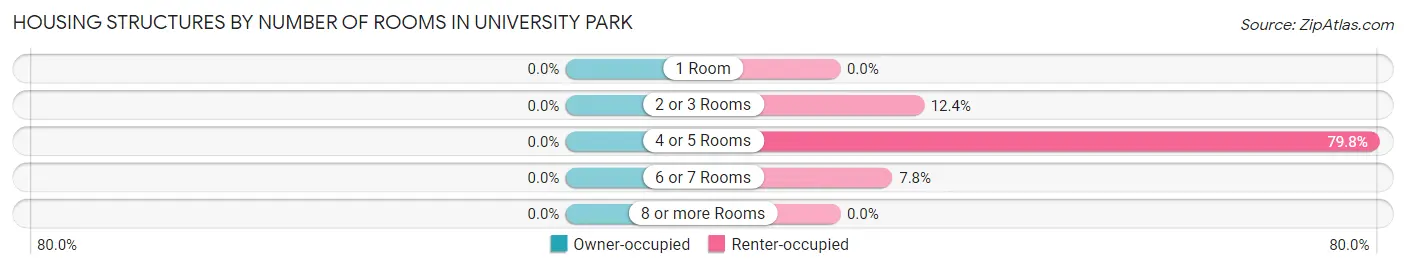
| Number of Rooms | Owner-occupied | Renter-occupied |
| 1 Room | 0 (0.0%) | 0 (0.0%) |
| 2 or 3 Rooms | 0 (0.0%) | 16 (12.4%) |
| 4 or 5 Rooms | 0 (0.0%) | 103 (79.8%) |
| 6 or 7 Rooms | 0 (0.0%) | 10 (7.7%) |
| 8 or more Rooms | 0 (0.0%) | 0 (0.0%) |
| Total | 0 (0.0%) | 129 (100.0%) |
Housing Structure by Heating Type in University Park
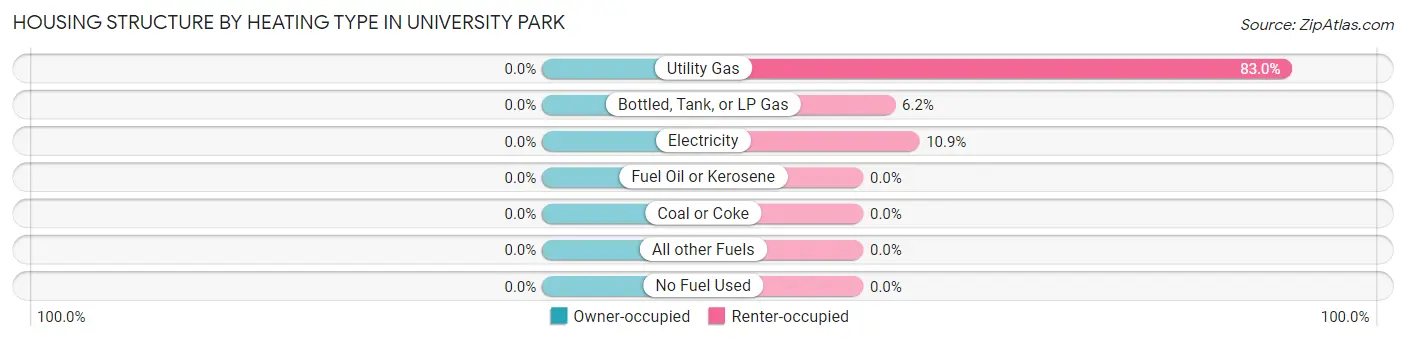
| Heating Type | Owner-occupied | Renter-occupied |
| Utility Gas | 0 (0.0%) | 107 (83.0%) |
| Bottled, Tank, or LP Gas | 0 (0.0%) | 8 (6.2%) |
| Electricity | 0 (0.0%) | 14 (10.8%) |
| Fuel Oil or Kerosene | 0 (0.0%) | 0 (0.0%) |
| Coal or Coke | 0 (0.0%) | 0 (0.0%) |
| All other Fuels | 0 (0.0%) | 0 (0.0%) |
| No Fuel Used | 0 (0.0%) | 0 (0.0%) |
| Total | 0 (0.0%) | 129 (100.0%) |
Household Vehicle Usage in University Park
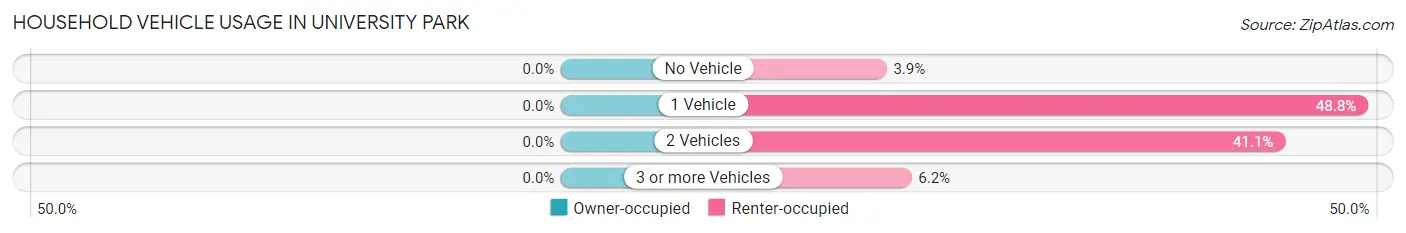
| Vehicles per Household | Owner-occupied | Renter-occupied |
| No Vehicle | 0 (0.0%) | 5 (3.9%) |
| 1 Vehicle | 0 (0.0%) | 63 (48.8%) |
| 2 Vehicles | 0 (0.0%) | 53 (41.1%) |
| 3 or more Vehicles | 0 (0.0%) | 8 (6.2%) |
| Total | 0 (0.0%) | 129 (100.0%) |
Real Estate & Mortgages in University Park
Real Estate and Mortgage Overview in University Park
| Characteristic | Without Mortgage | With Mortgage |
| Housing Units | 0 | 0 |
| Median Property Value | - | - |
| Median Household Income | - | - |
| Monthly Housing Costs | - | - |
| Real Estate Taxes | - | - |
Property Value by Mortgage Status in University Park
| Property Value | Without Mortgage | With Mortgage |
| Less than $50,000 | 0 (0.0%) | 0 (0.0%) |
| $50,000 to $99,999 | 0 (0.0%) | 0 (0.0%) |
| $100,000 to $299,999 | 0 (0.0%) | 0 (0.0%) |
| $300,000 to $499,999 | 0 (0.0%) | 0 (0.0%) |
| $500,000 to $749,999 | 0 (0.0%) | 0 (0.0%) |
| $750,000 to $999,999 | 0 (0.0%) | 0 (0.0%) |
| $1,000,000 or more | 0 (0.0%) | 0 (0.0%) |
| Total | 0 (0.0%) | 0 (0.0%) |
Household Income by Mortgage Status in University Park
| Household Income | Without Mortgage | With Mortgage |
| Less than $10,000 | 0 (0.0%) | 0 (0.0%) |
| $10,000 to $24,999 | 0 (0.0%) | 0 (0.0%) |
| $25,000 to $34,999 | 0 (0.0%) | 0 (0.0%) |
| $35,000 to $49,999 | 0 (0.0%) | 0 (0.0%) |
| $50,000 to $74,999 | 0 (0.0%) | 0 (0.0%) |
| $75,000 to $99,999 | 0 (0.0%) | 0 (0.0%) |
| $100,000 to $149,999 | 0 (0.0%) | 0 (0.0%) |
| $150,000 or more | 0 (0.0%) | 0 (0.0%) |
| Total | 0 (0.0%) | 0 (0.0%) |
Property Value to Household Income Ratio in University Park
| Value-to-Income Ratio | Without Mortgage | With Mortgage |
| Less than 2.0x | 0 (0.0%) | 0 (0.0%) |
| 2.0x to 2.9x | 0 (0.0%) | 0 (0.0%) |
| 3.0x to 3.9x | 0 (0.0%) | 0 (0.0%) |
| 4.0x or more | 0 (0.0%) | 0 (0.0%) |
| Total | 0 (0.0%) | 0 (0.0%) |
Real Estate Taxes by Mortgage Status in University Park
| Property Taxes | Without Mortgage | With Mortgage |
| Less than $800 | 0 (0.0%) | 0 (0.0%) |
| $800 to $1,499 | 0 (0.0%) | 0 (0.0%) |
| $800 to $1,499 | 0 (0.0%) | 0 (0.0%) |
| Total | 0 (0.0%) | 0 (0.0%) |
Health & Disability in University Park
Health Insurance Coverage by Age in University Park
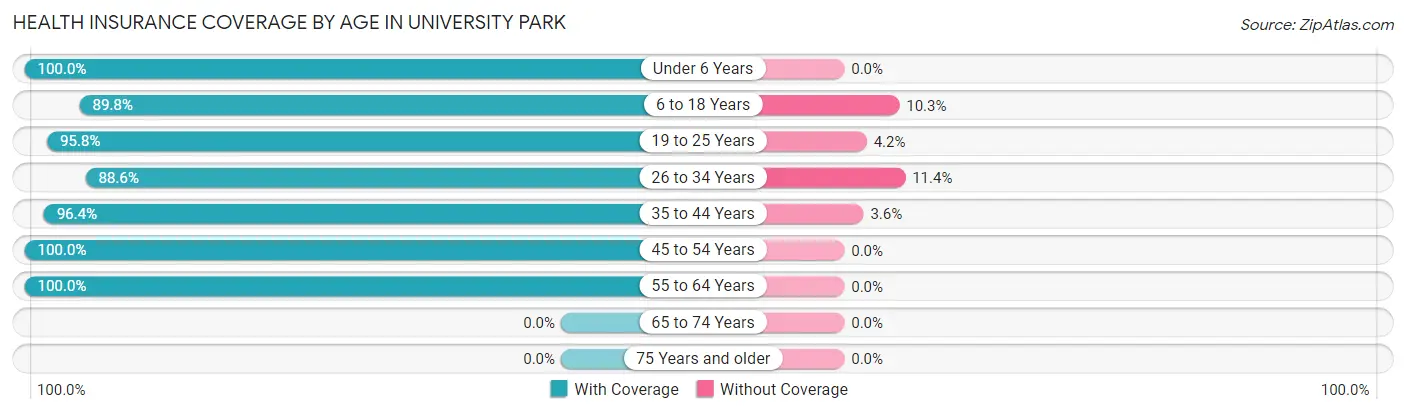
| Age Bracket | With Coverage | Without Coverage |
| Under 6 Years | 16 (100.0%) | 0 (0.0%) |
| 6 to 18 Years | 1,243 (89.7%) | 142 (10.2%) |
| 19 to 25 Years | 1,147 (95.8%) | 50 (4.2%) |
| 26 to 34 Years | 78 (88.6%) | 10 (11.4%) |
| 35 to 44 Years | 27 (96.4%) | 1 (3.6%) |
| 45 to 54 Years | 15 (100.0%) | 0 (0.0%) |
| 55 to 64 Years | 8 (100.0%) | 0 (0.0%) |
| 65 to 74 Years | 0 (0.0%) | 0 (0.0%) |
| 75 Years and older | 0 (0.0%) | 0 (0.0%) |
| Total | 2,534 (92.6%) | 203 (7.4%) |
Health Insurance Coverage by Citizenship Status in University Park
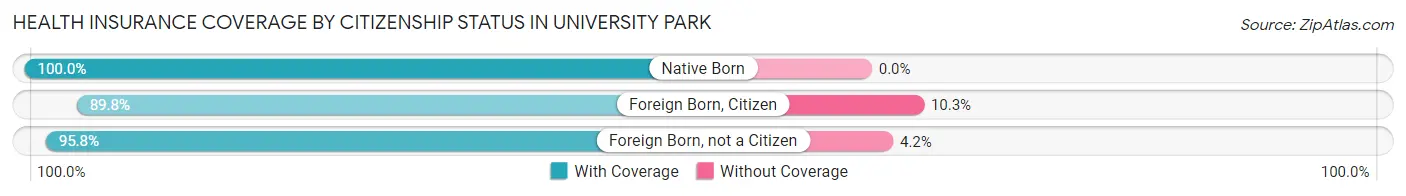
| Citizenship Status | With Coverage | Without Coverage |
| Native Born | 16 (100.0%) | 0 (0.0%) |
| Foreign Born, Citizen | 1,243 (89.7%) | 142 (10.2%) |
| Foreign Born, not a Citizen | 1,147 (95.8%) | 50 (4.2%) |
Health Insurance Coverage by Household Income in University Park
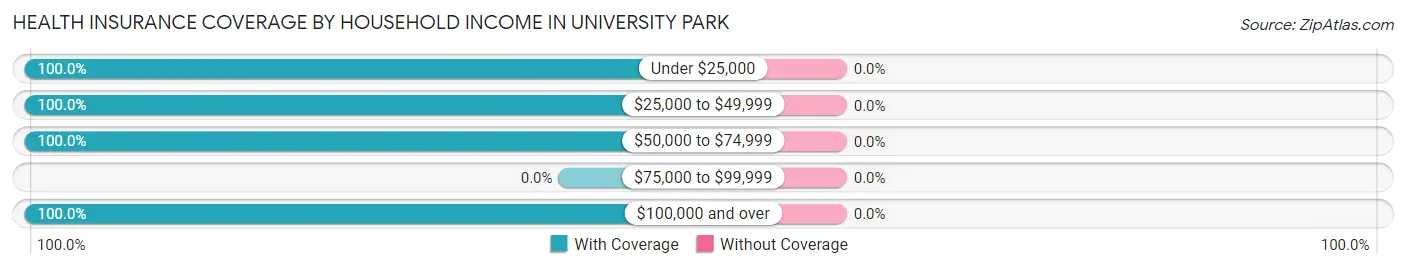
| Household Income | With Coverage | Without Coverage |
| Under $25,000 | 141 (100.0%) | 0 (0.0%) |
| $25,000 to $49,999 | 91 (100.0%) | 0 (0.0%) |
| $50,000 to $74,999 | 12 (100.0%) | 0 (0.0%) |
| $75,000 to $99,999 | 0 (0.0%) | 0 (0.0%) |
| $100,000 and over | 20 (100.0%) | 0 (0.0%) |
Public vs Private Health Insurance Coverage by Age in University Park
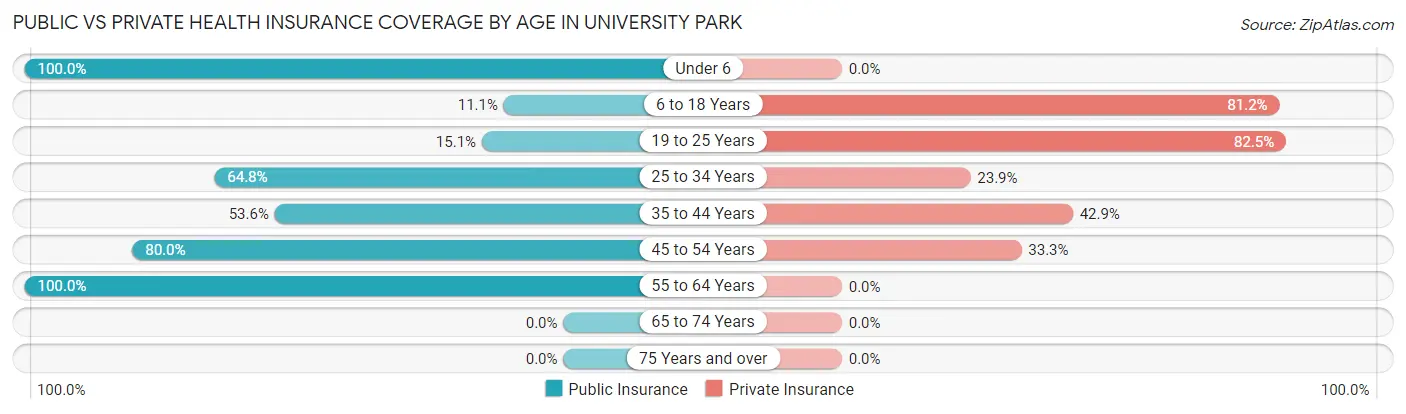
| Age Bracket | Public Insurance | Private Insurance |
| Under 6 | 16 (100.0%) | 0 (0.0%) |
| 6 to 18 Years | 153 (11.1%) | 1,125 (81.2%) |
| 19 to 25 Years | 181 (15.1%) | 987 (82.5%) |
| 25 to 34 Years | 57 (64.8%) | 21 (23.9%) |
| 35 to 44 Years | 15 (53.6%) | 12 (42.9%) |
| 45 to 54 Years | 12 (80.0%) | 5 (33.3%) |
| 55 to 64 Years | 8 (100.0%) | 0 (0.0%) |
| 65 to 74 Years | 0 (0.0%) | 0 (0.0%) |
| 75 Years and over | 0 (0.0%) | 0 (0.0%) |
| Total | 442 (16.2%) | 2,150 (78.5%) |
Disability Status by Sex by Age in University Park
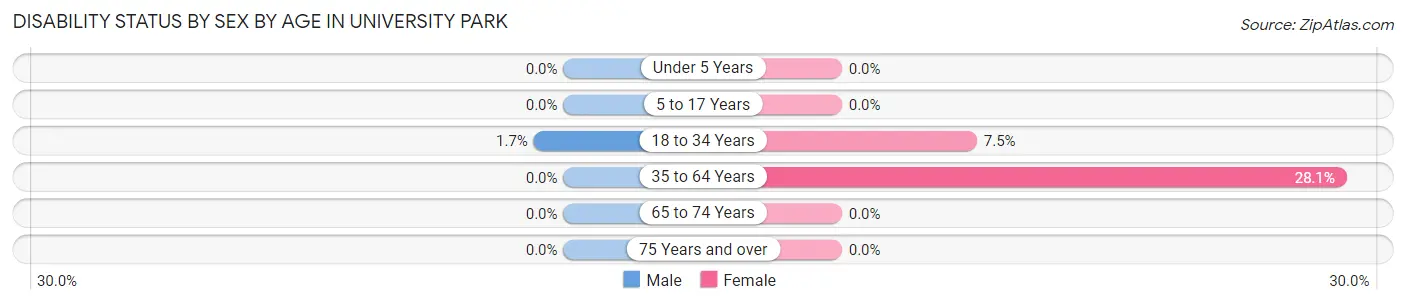
| Age Bracket | Male | Female |
| Under 5 Years | 0 (0.0%) | 0 (0.0%) |
| 5 to 17 Years | 0 (0.0%) | 0 (0.0%) |
| 18 to 34 Years | 19 (1.7%) | 108 (7.5%) |
| 35 to 64 Years | 0 (0.0%) | 9 (28.1%) |
| 65 to 74 Years | 0 (0.0%) | 0 (0.0%) |
| 75 Years and over | 0 (0.0%) | 0 (0.0%) |
Disability Class by Sex by Age in University Park
Disability Class: Hearing Difficulty
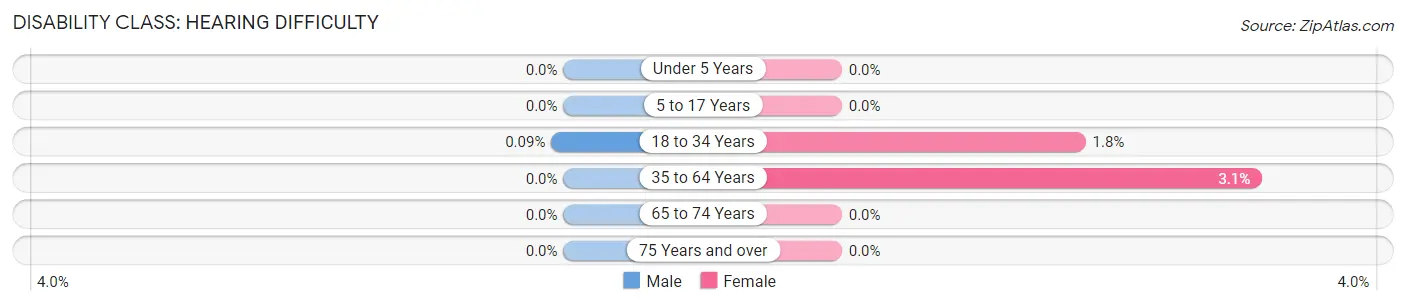
| Age Bracket | Male | Female |
| Under 5 Years | 0 (0.0%) | 0 (0.0%) |
| 5 to 17 Years | 0 (0.0%) | 0 (0.0%) |
| 18 to 34 Years | 1 (0.1%) | 26 (1.8%) |
| 35 to 64 Years | 0 (0.0%) | 1 (3.1%) |
| 65 to 74 Years | 0 (0.0%) | 0 (0.0%) |
| 75 Years and over | 0 (0.0%) | 0 (0.0%) |
Disability Class: Vision Difficulty
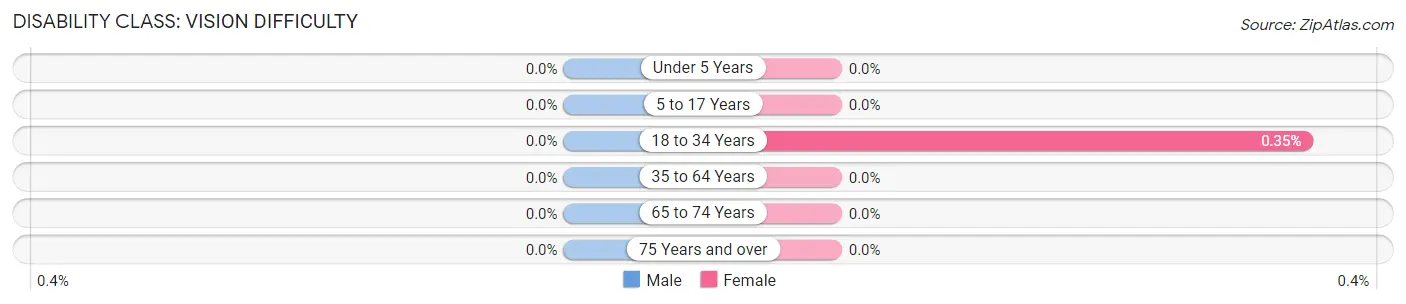
| Age Bracket | Male | Female |
| Under 5 Years | 0 (0.0%) | 0 (0.0%) |
| 5 to 17 Years | 0 (0.0%) | 0 (0.0%) |
| 18 to 34 Years | 0 (0.0%) | 5 (0.4%) |
| 35 to 64 Years | 0 (0.0%) | 0 (0.0%) |
| 65 to 74 Years | 0 (0.0%) | 0 (0.0%) |
| 75 Years and over | 0 (0.0%) | 0 (0.0%) |
Disability Class: Cognitive Difficulty
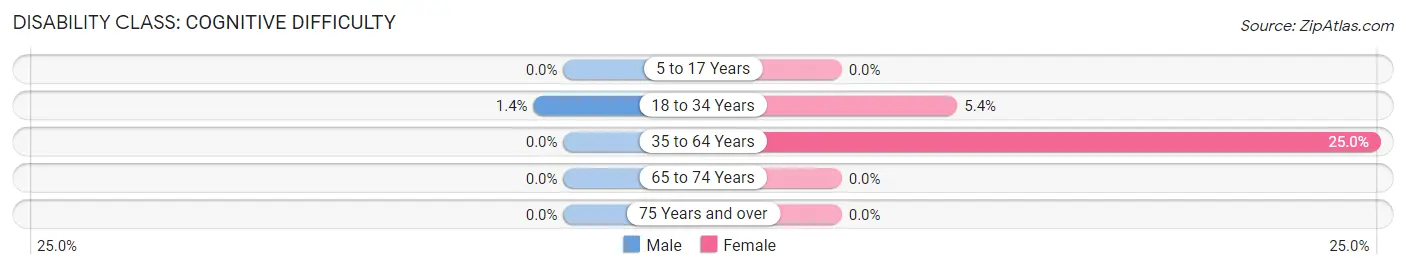
| Age Bracket | Male | Female |
| 5 to 17 Years | 0 (0.0%) | 0 (0.0%) |
| 18 to 34 Years | 16 (1.4%) | 77 (5.4%) |
| 35 to 64 Years | 0 (0.0%) | 8 (25.0%) |
| 65 to 74 Years | 0 (0.0%) | 0 (0.0%) |
| 75 Years and over | 0 (0.0%) | 0 (0.0%) |
Disability Class: Ambulatory Difficulty
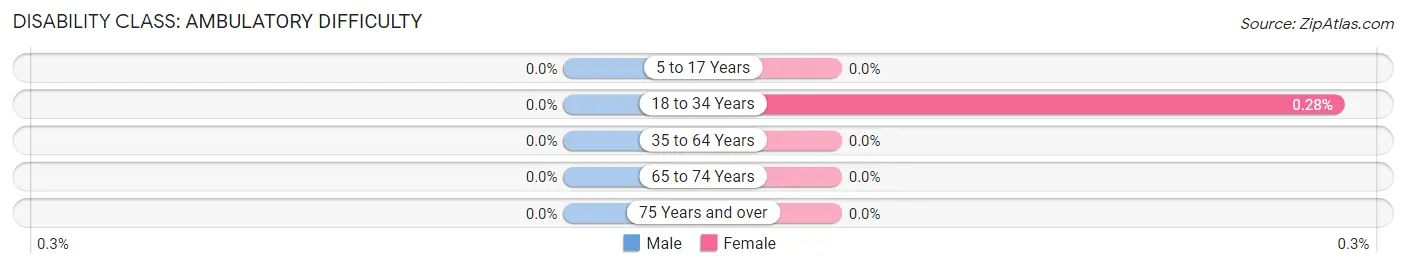
| Age Bracket | Male | Female |
| 5 to 17 Years | 0 (0.0%) | 0 (0.0%) |
| 18 to 34 Years | 0 (0.0%) | 4 (0.3%) |
| 35 to 64 Years | 0 (0.0%) | 0 (0.0%) |
| 65 to 74 Years | 0 (0.0%) | 0 (0.0%) |
| 75 Years and over | 0 (0.0%) | 0 (0.0%) |
Disability Class: Self-Care Difficulty
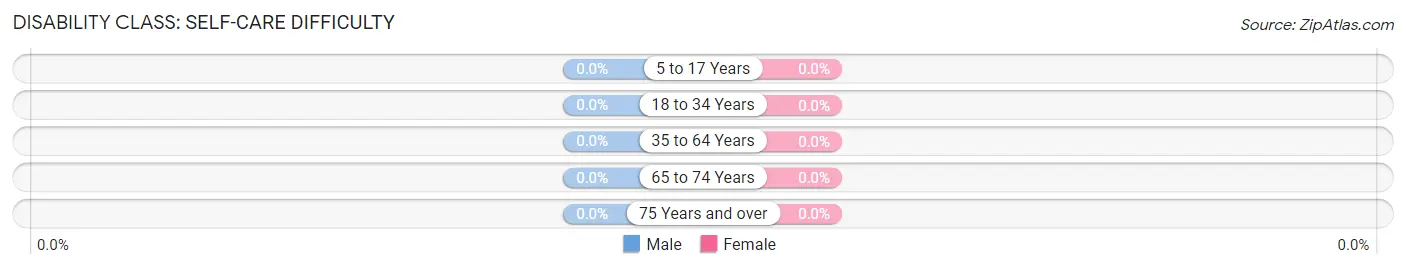
| Age Bracket | Male | Female |
| 5 to 17 Years | 0 (0.0%) | 0 (0.0%) |
| 18 to 34 Years | 0 (0.0%) | 0 (0.0%) |
| 35 to 64 Years | 0 (0.0%) | 0 (0.0%) |
| 65 to 74 Years | 0 (0.0%) | 0 (0.0%) |
| 75 Years and over | 0 (0.0%) | 0 (0.0%) |
Technology Access in University Park
Computing Device Access in University Park
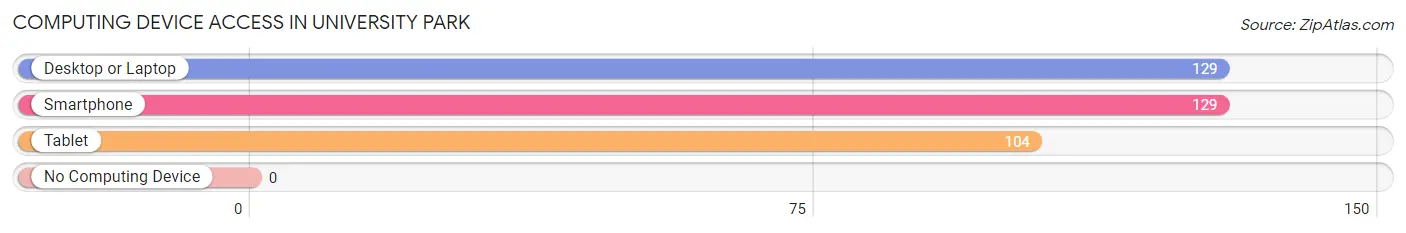
| Device Type | # Households | % Households |
| Desktop or Laptop | 129 | 100.0% |
| Smartphone | 129 | 100.0% |
| Tablet | 104 | 80.6% |
| No Computing Device | 0 | 0.0% |
| Total | 129 | 100.0% |
Internet Access in University Park
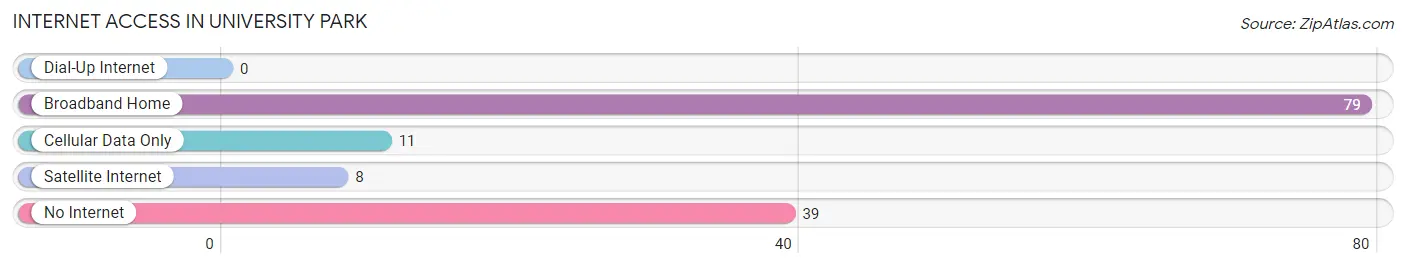
| Internet Type | # Households | % Households |
| Dial-Up Internet | 0 | 0.0% |
| Broadband Home | 79 | 61.2% |
| Cellular Data Only | 11 | 8.5% |
| Satellite Internet | 8 | 6.2% |
| No Internet | 39 | 30.2% |
| Total | 129 | 100.0% |
University Park Summary
University Park is a small unincorporated community located in the state of New Mexico. It is situated in the south-central part of the state, approximately 25 miles south of the city of Las Cruces. The community is located in Dona Ana County, and is part of the Las Cruces Metropolitan Statistical Area.
History
University Park was founded in the late 19th century by a group of settlers from the nearby town of Mesilla. The settlers were looking for a place to establish a new community, and they chose the area that is now University Park. The town was originally called “University Place”, and was later changed to “University Park”. The name was chosen to reflect the presence of the nearby New Mexico State University.
The town was officially incorporated in 1909, and the first mayor was elected in 1910. The town was originally a farming community, and the main crops grown were cotton, alfalfa, and corn. The town also had a small business district, which included a general store, a post office, and a few other businesses.
In the early 20th century, the town began to grow and develop. The population increased, and the town began to attract more businesses. The town also began to attract more students from the nearby university, and the town began to become a popular destination for students.
Geography
University Park is located in the south-central part of New Mexico, approximately 25 miles south of the city of Las Cruces. The town is situated in Dona Ana County, and is part of the Las Cruces Metropolitan Statistical Area.
The town is located in a semi-arid climate, with hot summers and mild winters. The average annual temperature is around 70 degrees Fahrenheit, and the average annual precipitation is around 8 inches.
The town is located in a flat, open area, with no major bodies of water nearby. The nearest major body of water is the Rio Grande, which is located approximately 25 miles to the south.
Economy
The economy of University Park is largely based on agriculture and education. The town is home to several farms, which produce a variety of crops, including cotton, alfalfa, and corn. The town is also home to New Mexico State University, which is a major employer in the area.
The town also has a small business district, which includes a few restaurants, a general store, and a post office. The town also has a few small manufacturing businesses, which produce a variety of products, including furniture and clothing.
Demographics
As of the 2010 census, the population of University Park was 1,845. The population is largely Hispanic, with approximately 75% of the population identifying as Hispanic or Latino. The median household income is around $30,000, and the median age is around 33 years old. The town has a relatively low unemployment rate, and the poverty rate is around 10%.
Common Questions
What is Per Capita Income in University Park?
Per Capita income in University Park is $5,748.
What is the Median Family Income in University Park?
Median Family Income in University Park is $15,536.
What is the Median Household income in University Park?
Median Household Income in University Park is $23,375.
What is Income or Wage Gap in University Park?
Income or Wage Gap in University Park is 15.9%.
Women in University Park earn 84.1 cents for every dollar earned by a man.
What is Inequality or Gini Index in University Park?
Inequality or Gini Index in University Park is 0.45.
What is the Total Population of University Park?
Total Population of University Park is 2,744.
What is the Total Male Population of University Park?
Total Male Population of University Park is 1,248.
What is the Total Female Population of University Park?
Total Female Population of University Park is 1,496.
What is the Ratio of Males per 100 Females in University Park?
There are 83.42 Males per 100 Females in University Park.
What is the Ratio of Females per 100 Males in University Park?
There are 119.87 Females per 100 Males in University Park.
What is the Median Population Age in University Park?
Median Population Age in University Park is 19.0 Years.
What is the Average Family Size in University Park
Average Family Size in University Park is 2.2 People.
What is the Average Household Size in University Park
Average Household Size in University Park is 2.1 People.
How Large is the Labor Force in University Park?
There are 1,365 People in the Labor Forcein in University Park.
What is the Percentage of People in the Labor Force in University Park?
51.0% of People are in the Labor Force in University Park.
What is the Unemployment Rate in University Park?
Unemployment Rate in University Park is 22.1%.