Fond Du Lac, WI Map & Demographics
Fond Du Lac Map
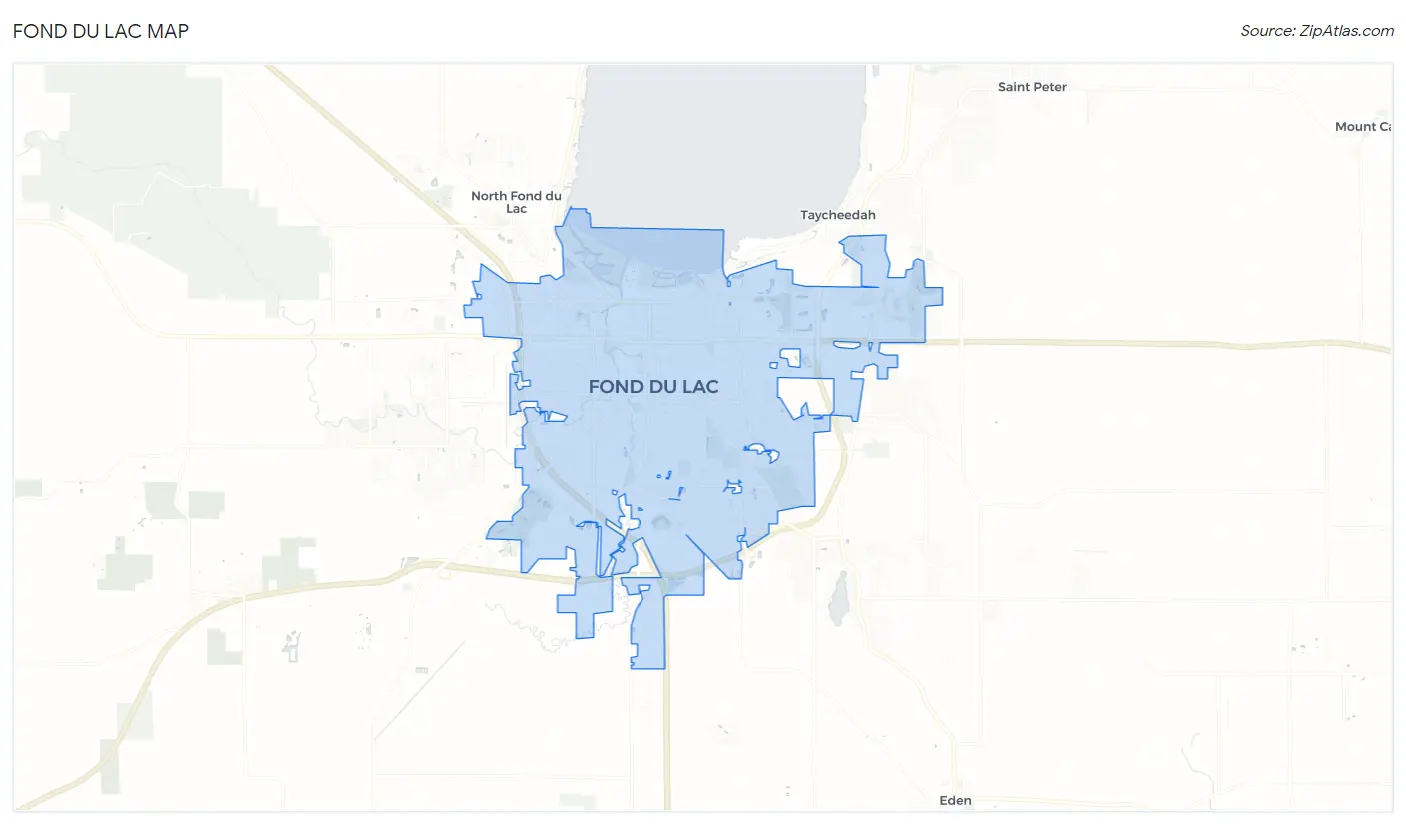
Fond Du Lac Overview
$31,286
PER CAPITA INCOME
$76,408
AVG FAMILY INCOME
$58,675
AVG HOUSEHOLD INCOME
35.3%
WAGE / INCOME GAP [ % ]
64.7¢/ $1
WAGE / INCOME GAP [ $ ]
$8,352
FAMILY INCOME DEFICIT
0.41
INEQUALITY / GINI INDEX
44,527
TOTAL POPULATION
21,205
MALE POPULATION
23,322
FEMALE POPULATION
90.92
MALES / 100 FEMALES
109.98
FEMALES / 100 MALES
37.9
MEDIAN AGE
3.0
AVG FAMILY SIZE
2.3
AVG HOUSEHOLD SIZE
22,991
LABOR FORCE [ PEOPLE ]
64.2%
PERCENT IN LABOR FORCE
4.9%
UNEMPLOYMENT RATE
Fond Du Lac Area Codes
Income in Fond Du Lac
Income Overview in Fond Du Lac
Per Capita Income in Fond Du Lac is $31,286, while median incomes of families and households are $76,408 and $58,675 respectively.
| Characteristic | Number | Measure |
| Per Capita Income | 44,527 | $31,286 |
| Median Family Income | 10,197 | $76,408 |
| Mean Family Income | 10,197 | $91,517 |
| Median Household Income | 18,603 | $58,675 |
| Mean Household Income | 18,603 | $72,612 |
| Income Deficit | 10,197 | $8,352 |
| Wage / Income Gap (%) | 44,527 | 35.34% |
| Wage / Income Gap ($) | 44,527 | 64.66¢ per $1 |
| Gini / Inequality Index | 44,527 | 0.41 |
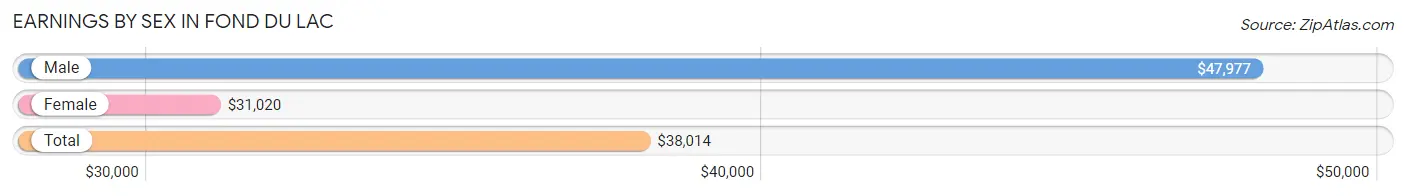
Earnings by Sex in Fond Du Lac
Average Earnings in Fond Du Lac are $38,014, $47,977 for men and $31,020 for women, a difference of 35.3%.
| Sex | Number | Average Earnings |
| Male | 12,547 (51.8%) | $47,977 |
| Female | 11,650 (48.1%) | $31,020 |
| Total | 24,197 (100.0%) | $38,014 |
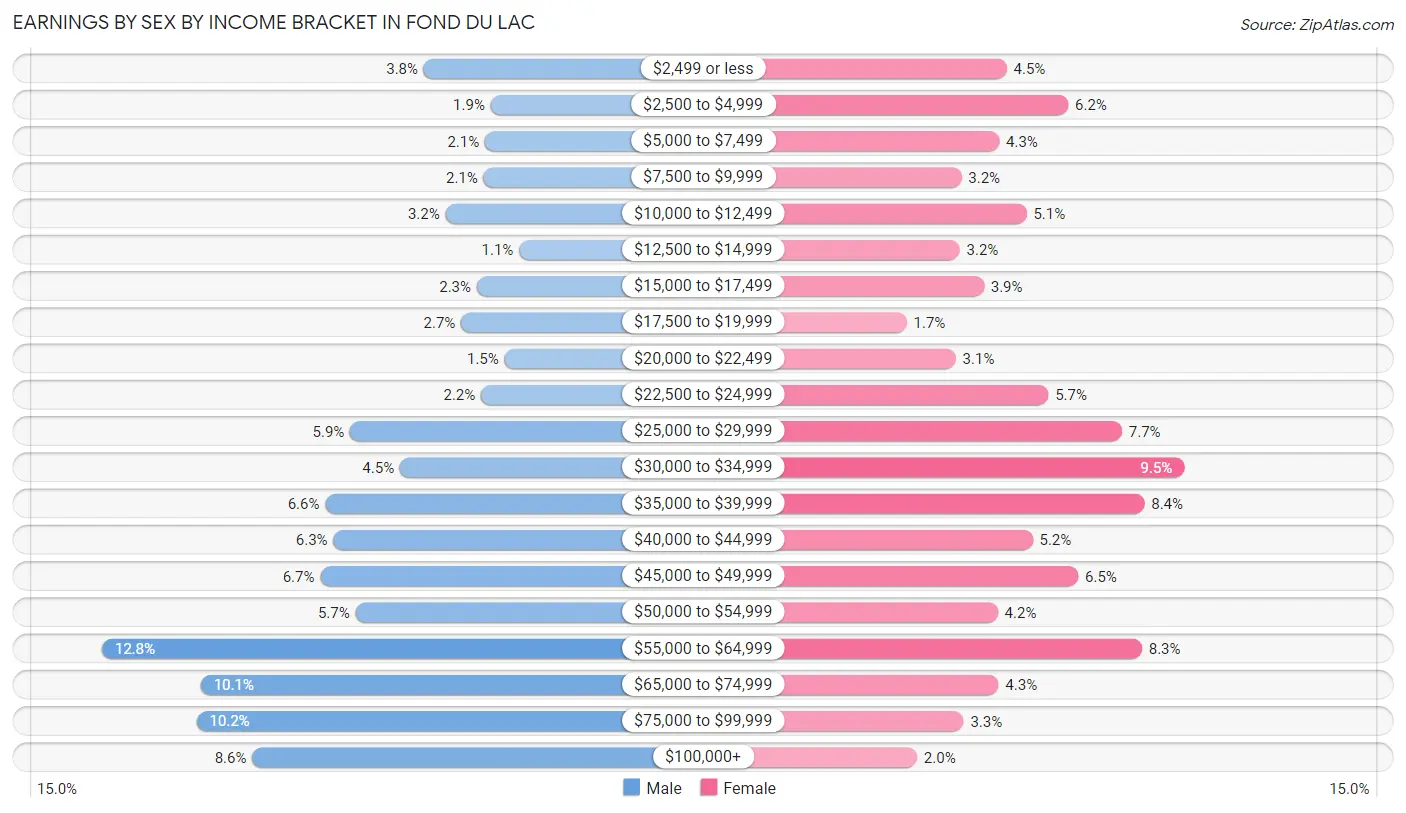
Earnings by Sex by Income Bracket in Fond Du Lac
The most common earnings brackets in Fond Du Lac are $55,000 to $64,999 for men (1,610 | 12.8%) and $30,000 to $34,999 for women (1,105 | 9.5%).
| Income | Male | Female |
| $2,499 or less | 474 (3.8%) | 523 (4.5%) |
| $2,500 to $4,999 | 239 (1.9%) | 725 (6.2%) |
| $5,000 to $7,499 | 258 (2.1%) | 499 (4.3%) |
| $7,500 to $9,999 | 263 (2.1%) | 375 (3.2%) |
| $10,000 to $12,499 | 398 (3.2%) | 588 (5.1%) |
| $12,500 to $14,999 | 138 (1.1%) | 369 (3.2%) |
| $15,000 to $17,499 | 287 (2.3%) | 448 (3.8%) |
| $17,500 to $19,999 | 342 (2.7%) | 196 (1.7%) |
| $20,000 to $22,499 | 189 (1.5%) | 357 (3.1%) |
| $22,500 to $24,999 | 272 (2.2%) | 659 (5.7%) |
| $25,000 to $29,999 | 734 (5.9%) | 900 (7.7%) |
| $30,000 to $34,999 | 558 (4.4%) | 1,105 (9.5%) |
| $35,000 to $39,999 | 822 (6.6%) | 974 (8.4%) |
| $40,000 to $44,999 | 793 (6.3%) | 608 (5.2%) |
| $45,000 to $49,999 | 839 (6.7%) | 757 (6.5%) |
| $50,000 to $54,999 | 715 (5.7%) | 494 (4.2%) |
| $55,000 to $64,999 | 1,610 (12.8%) | 966 (8.3%) |
| $65,000 to $74,999 | 1,261 (10.1%) | 496 (4.3%) |
| $75,000 to $99,999 | 1,276 (10.2%) | 382 (3.3%) |
| $100,000+ | 1,079 (8.6%) | 229 (2.0%) |
| Total | 12,547 (100.0%) | 11,650 (100.0%) |
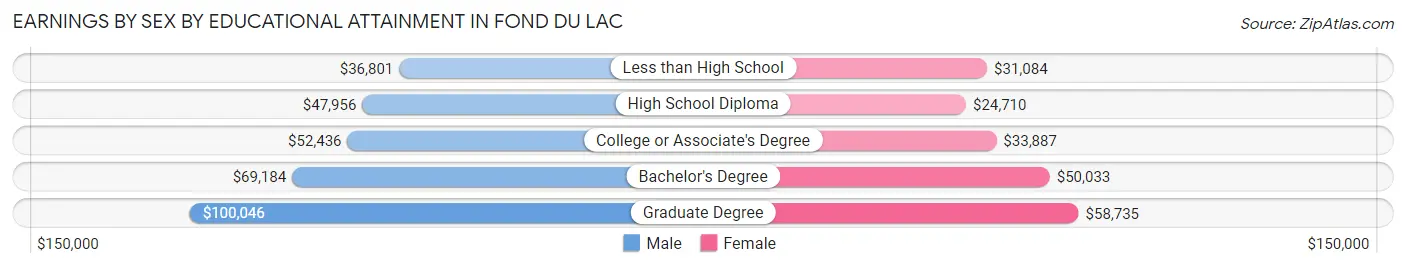
Earnings by Sex by Educational Attainment in Fond Du Lac
Average earnings in Fond Du Lac are $52,500 for men and $33,783 for women, a difference of 35.6%. Men with an educational attainment of graduate degree enjoy the highest average annual earnings of $100,046, while those with less than high school education earn the least with $36,801. Women with an educational attainment of graduate degree earn the most with the average annual earnings of $58,735, while those with high school diploma education have the smallest earnings of $24,710.
| Educational Attainment | Male Income | Female Income |
| Less than High School | $36,801 | $31,084 |
| High School Diploma | $47,956 | $24,710 |
| College or Associate's Degree | $52,436 | $33,887 |
| Bachelor's Degree | $69,184 | $50,033 |
| Graduate Degree | $100,046 | $58,735 |
| Total | $52,500 | $33,783 |
Family Income in Fond Du Lac
Family Income Brackets in Fond Du Lac
According to the Fond Du Lac family income data, there are 2,294 families falling into the $100,000 to $149,999 income range, which is the most common income bracket and makes up 22.5% of all families. Conversely, the $10,000 to $14,999 income bracket is the least frequent group with only 92 families (0.9%) belonging to this category.
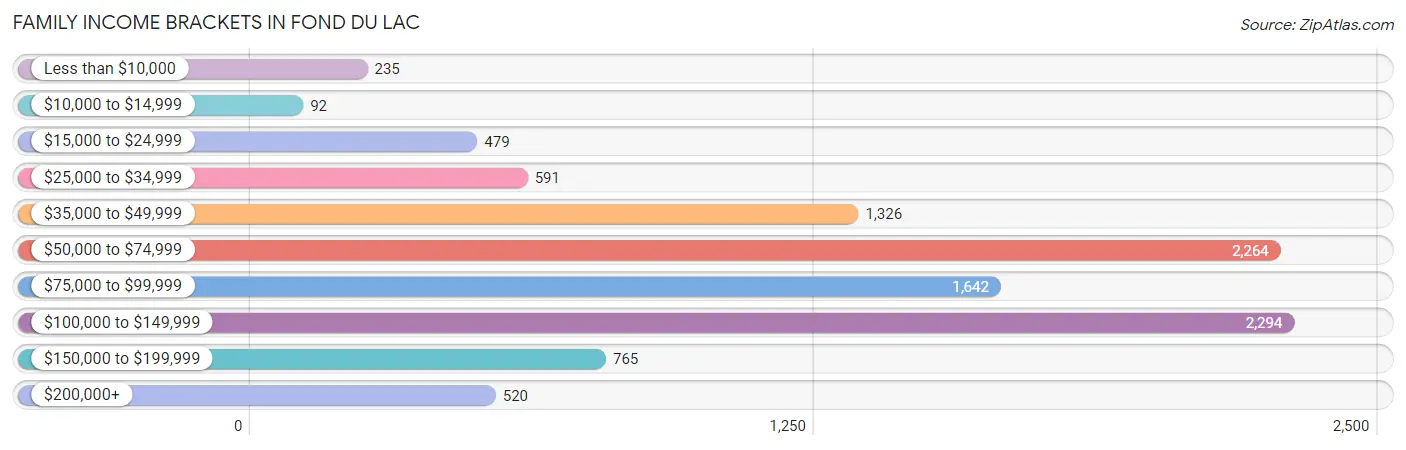
| Income Bracket | # Families | % Families |
| Less than $10,000 | 235 | 2.3% |
| $10,000 to $14,999 | 92 | 0.9% |
| $15,000 to $24,999 | 479 | 4.7% |
| $25,000 to $34,999 | 591 | 5.8% |
| $35,000 to $49,999 | 1,326 | 13.0% |
| $50,000 to $74,999 | 2,264 | 22.2% |
| $75,000 to $99,999 | 1,642 | 16.1% |
| $100,000 to $149,999 | 2,294 | 22.5% |
| $150,000 to $199,999 | 765 | 7.5% |
| $200,000+ | 520 | 5.1% |
Family Income by Famaliy Size in Fond Du Lac
7+ person families (224 | 2.2%) account for the highest median family income in Fond Du Lac with $145,408 per family, while 2-person families (5,385 | 52.8%) have the highest median income of $32,866 per family member.
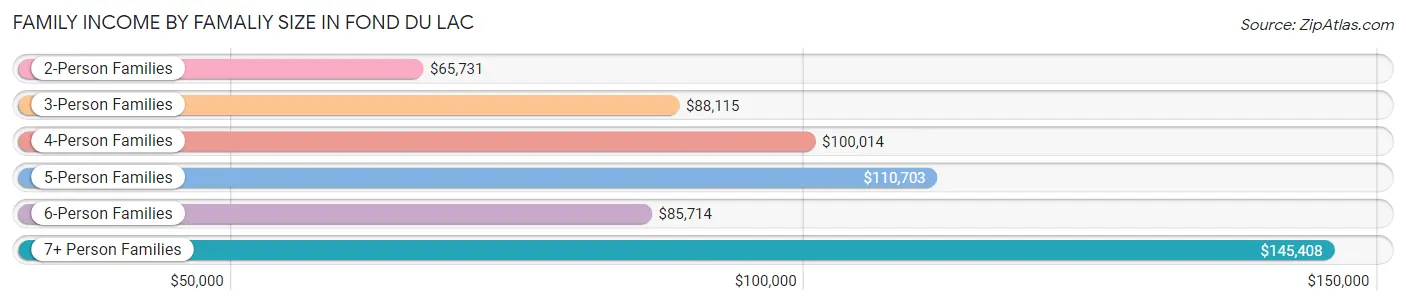
| Income Bracket | # Families | Median Income |
| 2-Person Families | 5,385 (52.8%) | $65,731 |
| 3-Person Families | 1,968 (19.3%) | $88,115 |
| 4-Person Families | 1,914 (18.8%) | $100,014 |
| 5-Person Families | 472 (4.6%) | $110,703 |
| 6-Person Families | 234 (2.3%) | $85,714 |
| 7+ Person Families | 224 (2.2%) | $145,408 |
| Total | 10,197 (100.0%) | $76,408 |
Family Income by Number of Earners in Fond Du Lac
The median family income in Fond Du Lac is $76,408, with families comprising 3+ earners (1,231) having the highest median family income of $134,928, while families with no earners (1,562) have the lowest median family income of $48,143, accounting for 12.1% and 15.3% of families, respectively.
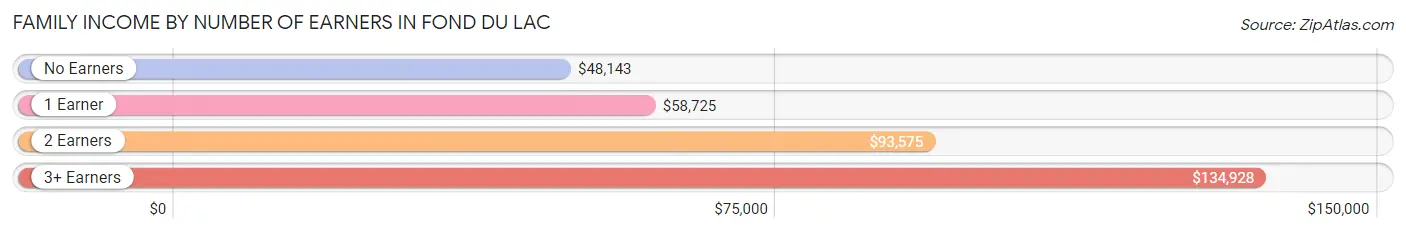
| Number of Earners | # Families | Median Income |
| No Earners | 1,562 (15.3%) | $48,143 |
| 1 Earner | 3,074 (30.1%) | $58,725 |
| 2 Earners | 4,330 (42.5%) | $93,575 |
| 3+ Earners | 1,231 (12.1%) | $134,928 |
| Total | 10,197 (100.0%) | $76,408 |
Household Income in Fond Du Lac
Household Income Brackets in Fond Du Lac
With 4,297 households falling in the category, the $50,000 to $74,999 income range is the most frequent in Fond Du Lac, accounting for 23.1% of all households. In contrast, only 595 households (3.2%) fall into the $200,000+ income bracket, making it the least populous group.
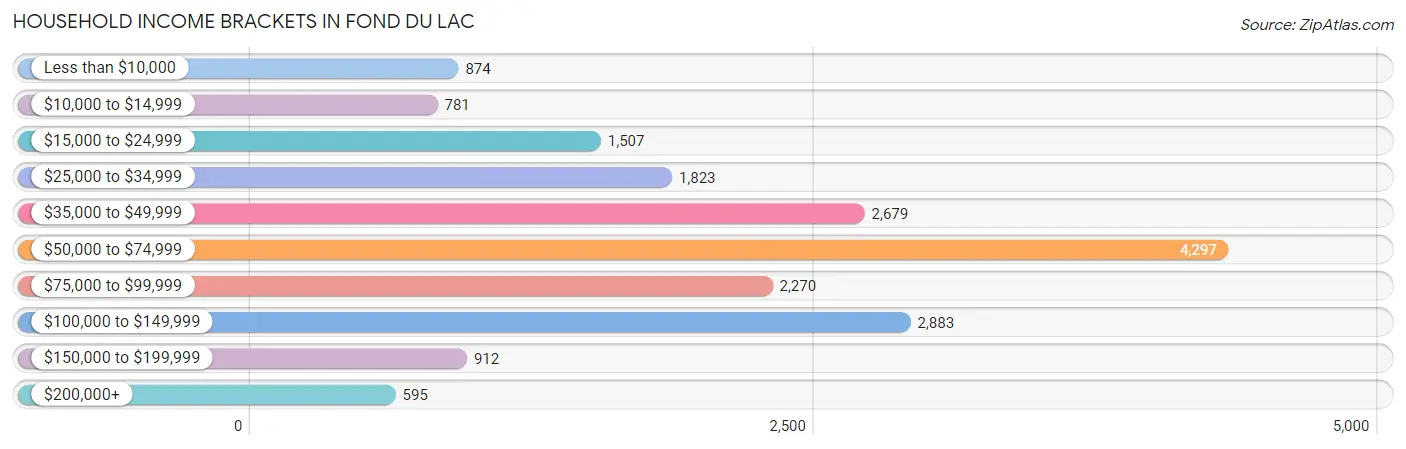
| Income Bracket | # Households | % Households |
| Less than $10,000 | 874 | 4.7% |
| $10,000 to $14,999 | 781 | 4.2% |
| $15,000 to $24,999 | 1,507 | 8.1% |
| $25,000 to $34,999 | 1,823 | 9.8% |
| $35,000 to $49,999 | 2,679 | 14.4% |
| $50,000 to $74,999 | 4,297 | 23.1% |
| $75,000 to $99,999 | 2,270 | 12.2% |
| $100,000 to $149,999 | 2,883 | 15.5% |
| $150,000 to $199,999 | 912 | 4.9% |
| $200,000+ | 595 | 3.2% |
Household Income by Householder Age in Fond Du Lac
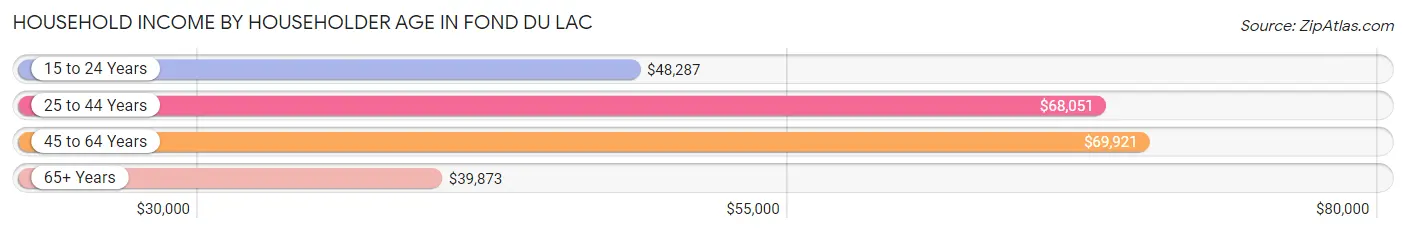
The median household income in Fond Du Lac is $58,675, with the highest median household income of $69,921 found in the 45 to 64 years age bracket for the primary householder. A total of 6,573 households (35.3%) fall into this category. Meanwhile, the 65+ years age bracket for the primary householder has the lowest median household income of $39,873, with 4,790 households (25.8%) in this group.
| Income Bracket | # Households | Median Income |
| 15 to 24 Years | 851 (4.6%) | $48,287 |
| 25 to 44 Years | 6,389 (34.3%) | $68,051 |
| 45 to 64 Years | 6,573 (35.3%) | $69,921 |
| 65+ Years | 4,790 (25.8%) | $39,873 |
| Total | 18,603 (100.0%) | $58,675 |
Poverty in Fond Du Lac
Income Below Poverty by Sex and Age in Fond Du Lac
With 10.3% poverty level for males and 12.8% for females among the residents of Fond Du Lac, under 5 year old males and 15 year old females are the most vulnerable to poverty, with 261 males (20.6%) and 56 females (35.2%) in their respective age groups living below the poverty level.
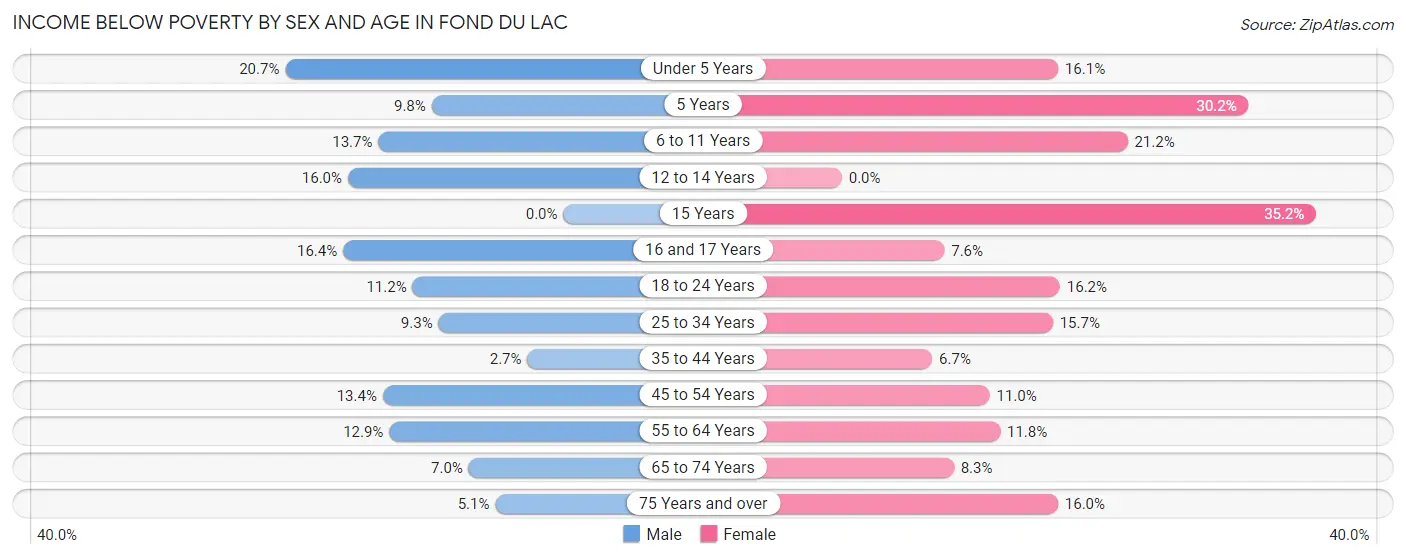
| Age Bracket | Male | Female |
| Under 5 Years | 261 (20.6%) | 185 (16.1%) |
| 5 Years | 22 (9.8%) | 74 (30.2%) |
| 6 to 11 Years | 196 (13.7%) | 361 (21.2%) |
| 12 to 14 Years | 139 (16.0%) | 0 (0.0%) |
| 15 Years | 0 (0.0%) | 56 (35.2%) |
| 16 and 17 Years | 79 (16.4%) | 49 (7.6%) |
| 18 to 24 Years | 213 (11.2%) | 303 (16.2%) |
| 25 to 34 Years | 250 (9.3%) | 459 (15.7%) |
| 35 to 44 Years | 82 (2.7%) | 186 (6.7%) |
| 45 to 54 Years | 377 (13.4%) | 262 (11.0%) |
| 55 to 64 Years | 324 (12.9%) | 296 (11.7%) |
| 65 to 74 Years | 134 (7.0%) | 162 (8.3%) |
| 75 Years and over | 60 (5.1%) | 339 (16.0%) |
| Total | 2,137 (10.3%) | 2,732 (12.8%) |
Income Above Poverty by Sex and Age in Fond Du Lac
According to the poverty statistics in Fond Du Lac, males aged 15 years and females aged 12 to 14 years are the age groups that are most secure financially, with 100.0% of males and 100.0% of females in these age groups living above the poverty line.
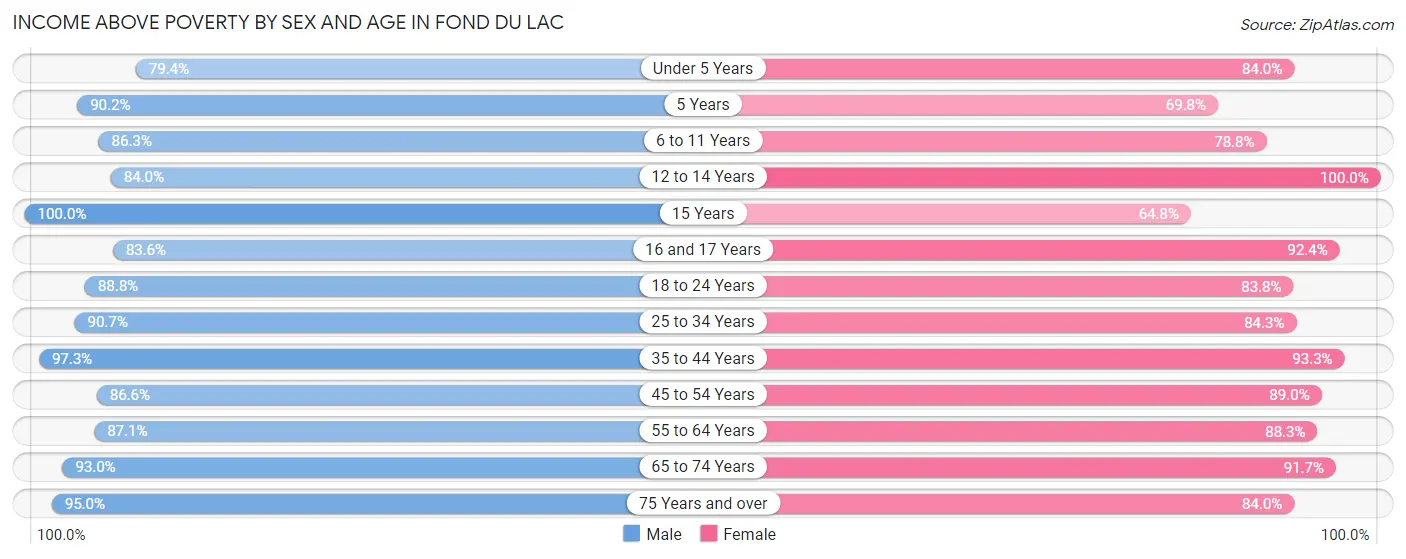
| Age Bracket | Male | Female |
| Under 5 Years | 1,003 (79.3%) | 968 (84.0%) |
| 5 Years | 203 (90.2%) | 171 (69.8%) |
| 6 to 11 Years | 1,230 (86.3%) | 1,341 (78.8%) |
| 12 to 14 Years | 730 (84.0%) | 967 (100.0%) |
| 15 Years | 367 (100.0%) | 103 (64.8%) |
| 16 and 17 Years | 404 (83.6%) | 595 (92.4%) |
| 18 to 24 Years | 1,689 (88.8%) | 1,568 (83.8%) |
| 25 to 34 Years | 2,447 (90.7%) | 2,472 (84.3%) |
| 35 to 44 Years | 2,984 (97.3%) | 2,588 (93.3%) |
| 45 to 54 Years | 2,434 (86.6%) | 2,127 (89.0%) |
| 55 to 64 Years | 2,181 (87.1%) | 2,223 (88.2%) |
| 65 to 74 Years | 1,771 (93.0%) | 1,787 (91.7%) |
| 75 Years and over | 1,128 (95.0%) | 1,774 (84.0%) |
| Total | 18,571 (89.7%) | 18,684 (87.2%) |
Income Below Poverty Among Married-Couple Families in Fond Du Lac
The poverty statistics for married-couple families in Fond Du Lac show that 2.8% or 211 of the total 7,442 families live below the poverty line. Families with 3 or 4 children have the highest poverty rate of 8.7%, comprising of 47 families. On the other hand, families with 5 or more children have the lowest poverty rate of 0.0%, which includes 0 families.
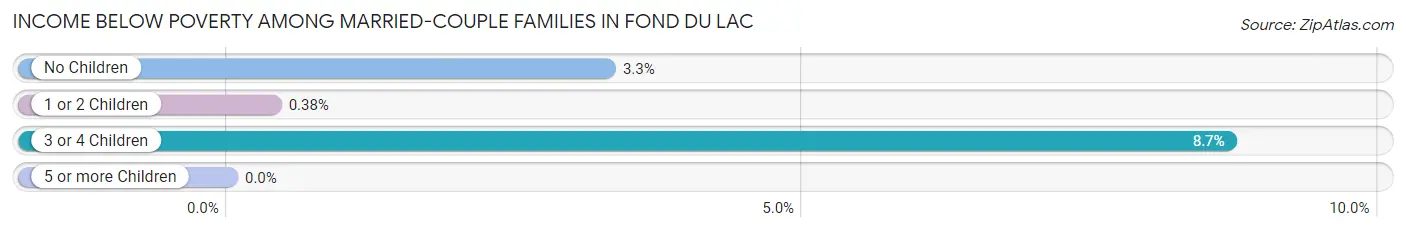
| Children | Above Poverty | Below Poverty |
| No Children | 4,581 (96.7%) | 156 (3.3%) |
| 1 or 2 Children | 2,075 (99.6%) | 8 (0.4%) |
| 3 or 4 Children | 494 (91.3%) | 47 (8.7%) |
| 5 or more Children | 81 (100.0%) | 0 (0.0%) |
| Total | 7,231 (97.2%) | 211 (2.8%) |
Income Below Poverty Among Single-Parent Households in Fond Du Lac
According to the poverty data in Fond Du Lac, 5.5% or 47 single-father households and 23.1% or 441 single-mother households are living below the poverty line. Among single-father households, those with 3 or 4 children have the highest poverty rate, with 16 households (42.1%) experiencing poverty. Likewise, among single-mother households, those with 5 or more children have the highest poverty rate, with 1 households (100.0%) falling below the poverty line.
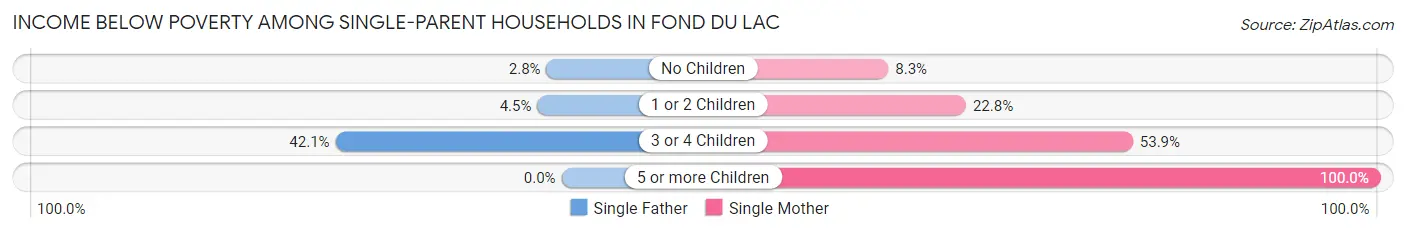
| Children | Single Father | Single Mother |
| No Children | 9 (2.8%) | 45 (8.3%) |
| 1 or 2 Children | 22 (4.5%) | 249 (22.8%) |
| 3 or 4 Children | 16 (42.1%) | 146 (53.9%) |
| 5 or more Children | 0 (0.0%) | 1 (100.0%) |
| Total | 47 (5.5%) | 441 (23.1%) |
Income Below Poverty Among Married-Couple vs Single-Parent Households in Fond Du Lac
The poverty data for Fond Du Lac shows that 211 of the married-couple family households (2.8%) and 488 of the single-parent households (17.7%) are living below the poverty level. Within the married-couple family households, those with 3 or 4 children have the highest poverty rate, with 47 households (8.7%) falling below the poverty line. Among the single-parent households, those with 5 or more children have the highest poverty rate, with 1 household (100.0%) living below poverty.
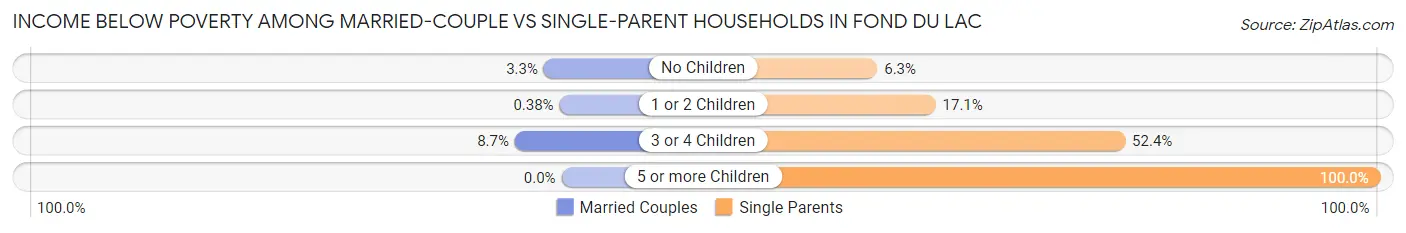
| Children | Married-Couple Families | Single-Parent Households |
| No Children | 156 (3.3%) | 54 (6.3%) |
| 1 or 2 Children | 8 (0.4%) | 271 (17.1%) |
| 3 or 4 Children | 47 (8.7%) | 162 (52.4%) |
| 5 or more Children | 0 (0.0%) | 1 (100.0%) |
| Total | 211 (2.8%) | 488 (17.7%) |
Race in Fond Du Lac
The most populous races in Fond Du Lac are White / Caucasian (38,648 | 86.8%), Hispanic or Latino (3,326 | 7.5%), and Two or more Races (2,140 | 4.8%).
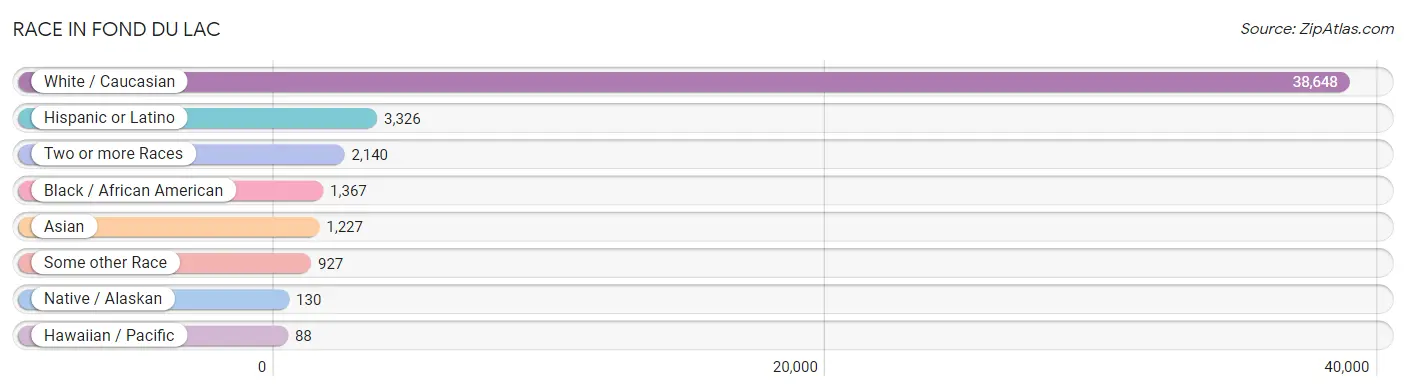
| Race | # Population | % Population |
| Asian | 1,227 | 2.8% |
| Black / African American | 1,367 | 3.1% |
| Hawaiian / Pacific | 88 | 0.2% |
| Hispanic or Latino | 3,326 | 7.5% |
| Native / Alaskan | 130 | 0.3% |
| White / Caucasian | 38,648 | 86.8% |
| Two or more Races | 2,140 | 4.8% |
| Some other Race | 927 | 2.1% |
| Total | 44,527 | 100.0% |
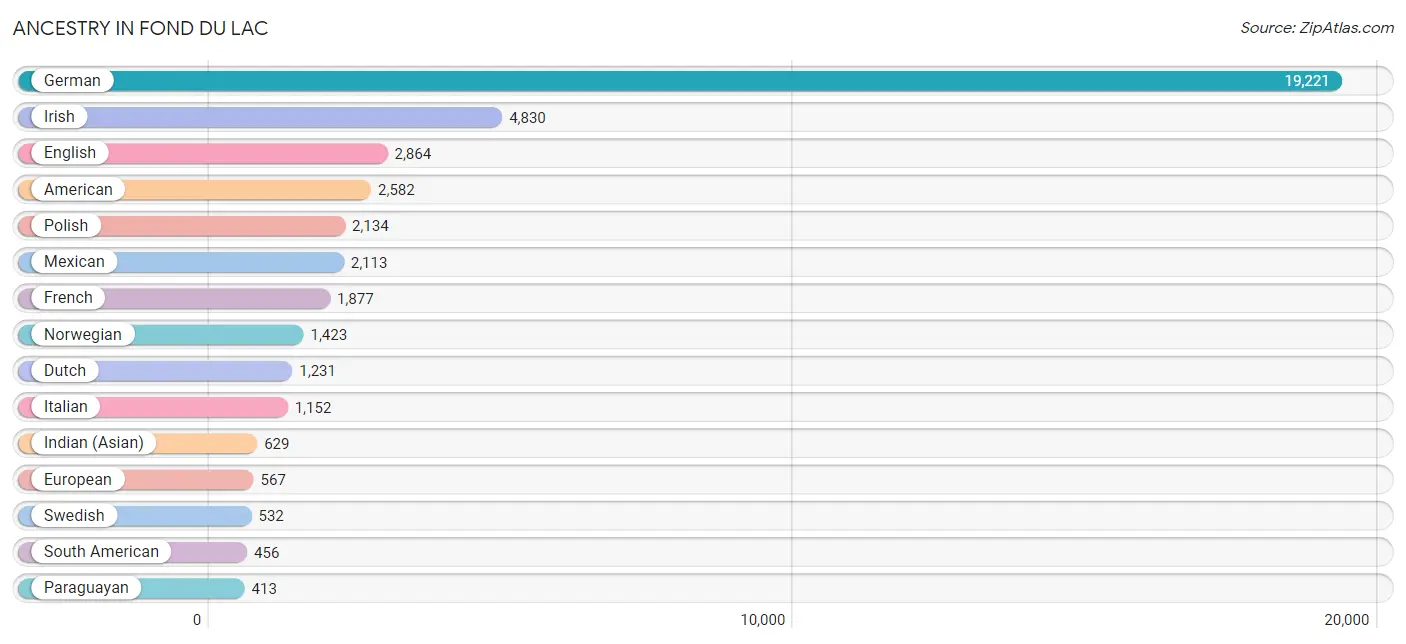
Ancestry in Fond Du Lac
The most populous ancestries reported in Fond Du Lac are German (19,221 | 43.2%), Irish (4,830 | 10.8%), English (2,864 | 6.4%), American (2,582 | 5.8%), and Polish (2,134 | 4.8%), together accounting for 71.0% of all Fond Du Lac residents.
| Ancestry | # Population | % Population |
| African | 167 | 0.4% |
| American | 2,582 | 5.8% |
| Arab | 74 | 0.2% |
| Armenian | 39 | 0.1% |
| Austrian | 161 | 0.4% |
| Bangladeshi | 233 | 0.5% |
| Belgian | 43 | 0.1% |
| Bhutanese | 31 | 0.1% |
| Blackfeet | 38 | 0.1% |
| Brazilian | 47 | 0.1% |
| British | 67 | 0.2% |
| Burmese | 30 | 0.1% |
| Canadian | 50 | 0.1% |
| Central American | 8 | 0.0% |
| Cherokee | 18 | 0.0% |
| Chippewa | 34 | 0.1% |
| Choctaw | 4 | 0.0% |
| Colombian | 43 | 0.1% |
| Comanche | 1 | 0.0% |
| Creek | 33 | 0.1% |
| Croatian | 78 | 0.2% |
| Cuban | 28 | 0.1% |
| Czech | 252 | 0.6% |
| Czechoslovakian | 14 | 0.0% |
| Danish | 335 | 0.7% |
| Dominican | 33 | 0.1% |
| Dutch | 1,231 | 2.8% |
| Eastern European | 171 | 0.4% |
| Egyptian | 14 | 0.0% |
| English | 2,864 | 6.4% |
| European | 567 | 1.3% |
| Fijian | 88 | 0.2% |
| Finnish | 195 | 0.4% |
| French | 1,877 | 4.2% |
| French Canadian | 276 | 0.6% |
| German | 19,221 | 43.2% |
| Greek | 167 | 0.4% |
| Guatemalan | 8 | 0.0% |
| Hungarian | 171 | 0.4% |
| Indian (Asian) | 629 | 1.4% |
| Indonesian | 246 | 0.5% |
| Irish | 4,830 | 10.8% |
| Iroquois | 39 | 0.1% |
| Italian | 1,152 | 2.6% |
| Korean | 152 | 0.3% |
| Lebanese | 60 | 0.1% |
| Liberian | 140 | 0.3% |
| Lithuanian | 22 | 0.1% |
| Luxembourger | 31 | 0.1% |
| Malaysian | 6 | 0.0% |
| Menominee | 3 | 0.0% |
| Mexican | 2,113 | 4.8% |
| Nigerian | 7 | 0.0% |
| Northern European | 106 | 0.2% |
| Norwegian | 1,423 | 3.2% |
| Pakistani | 5 | 0.0% |
| Paraguayan | 413 | 0.9% |
| Polish | 2,134 | 4.8% |
| Portuguese | 9 | 0.0% |
| Potawatomi | 100 | 0.2% |
| Puerto Rican | 218 | 0.5% |
| Romanian | 19 | 0.0% |
| Russian | 266 | 0.6% |
| Scandinavian | 56 | 0.1% |
| Scotch-Irish | 183 | 0.4% |
| Scottish | 176 | 0.4% |
| Sioux | 27 | 0.1% |
| Slovak | 31 | 0.1% |
| South African | 6 | 0.0% |
| South American | 456 | 1.0% |
| Spaniard | 53 | 0.1% |
| Sri Lankan | 6 | 0.0% |
| Subsaharan African | 320 | 0.7% |
| Swedish | 532 | 1.2% |
| Swiss | 236 | 0.5% |
| Turkish | 38 | 0.1% |
| Ukrainian | 32 | 0.1% |
| Welsh | 177 | 0.4% |
| Yugoslavian | 37 | 0.1% | View All 79 Rows |
Immigrants in Fond Du Lac
The most numerous immigrant groups reported in Fond Du Lac came from Latin America (915 | 2.1%), Asia (872 | 2.0%), Central America (798 | 1.8%), Mexico (769 | 1.7%), and Eastern Asia (617 | 1.4%), together accounting for 8.9% of all Fond Du Lac residents.
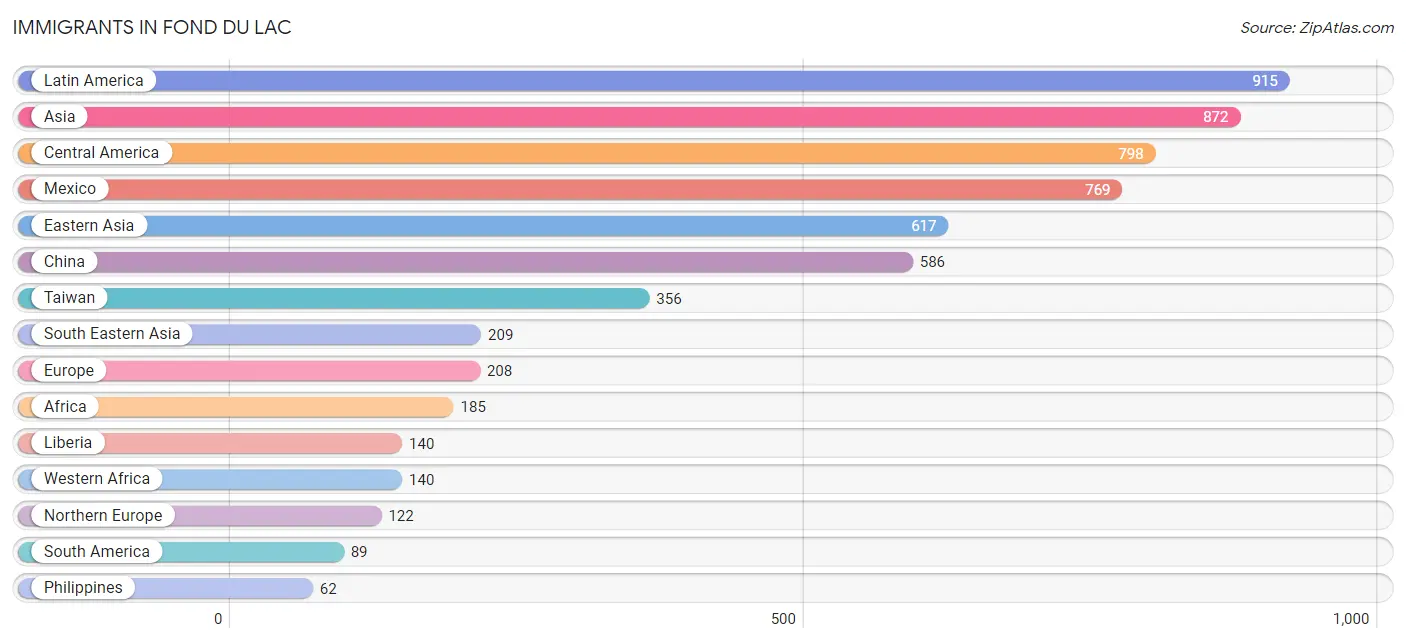
| Immigration Origin | # Population | % Population |
| Africa | 185 | 0.4% |
| Asia | 872 | 2.0% |
| Bosnia and Herzegovina | 29 | 0.1% |
| Brazil | 57 | 0.1% |
| Canada | 37 | 0.1% |
| Caribbean | 28 | 0.1% |
| Central America | 798 | 1.8% |
| China | 586 | 1.3% |
| Colombia | 1 | 0.0% |
| Cuba | 17 | 0.0% |
| Dominican Republic | 11 | 0.0% |
| Eastern Africa | 27 | 0.1% |
| Eastern Asia | 617 | 1.4% |
| Eastern Europe | 51 | 0.1% |
| England | 14 | 0.0% |
| Europe | 208 | 0.5% |
| Germany | 35 | 0.1% |
| Guatemala | 29 | 0.1% |
| Iran | 8 | 0.0% |
| Japan | 31 | 0.1% |
| Laos | 12 | 0.0% |
| Latin America | 915 | 2.1% |
| Liberia | 140 | 0.3% |
| Mexico | 769 | 1.7% |
| Northern Europe | 122 | 0.3% |
| Philippines | 62 | 0.1% |
| South Africa | 18 | 0.0% |
| South America | 89 | 0.2% |
| South Central Asia | 8 | 0.0% |
| South Eastern Asia | 209 | 0.5% |
| Sweden | 36 | 0.1% |
| Taiwan | 356 | 0.8% |
| Thailand | 22 | 0.1% |
| Turkey | 38 | 0.1% |
| Uganda | 27 | 0.1% |
| Western Africa | 140 | 0.3% |
| Western Asia | 38 | 0.1% |
| Western Europe | 35 | 0.1% | View All 38 Rows |
Sex and Age in Fond Du Lac
Sex and Age in Fond Du Lac
The most populous age groups in Fond Du Lac are 35 to 39 Years (1,848 | 8.7%) for men and 20 to 24 Years (1,812 | 7.8%) for women.
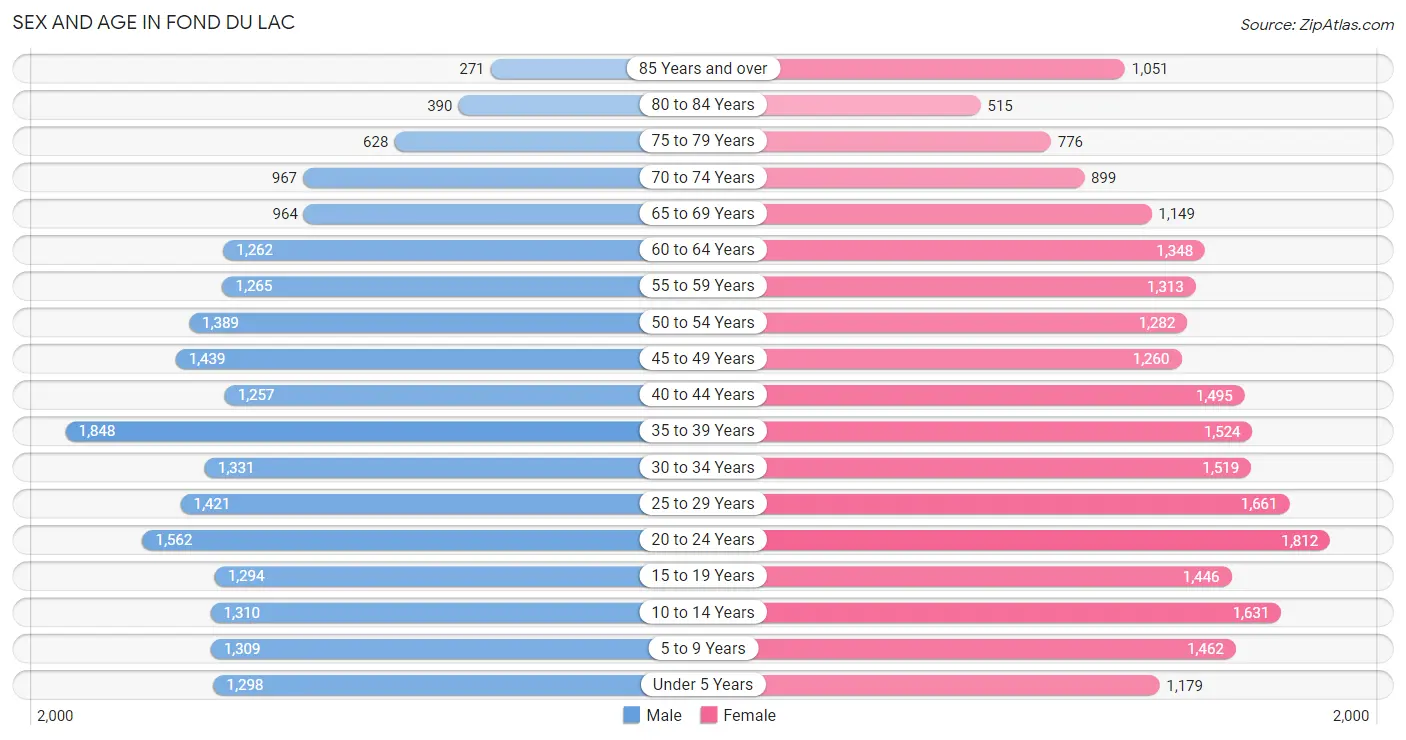
| Age Bracket | Male | Female |
| Under 5 Years | 1,298 (6.1%) | 1,179 (5.1%) |
| 5 to 9 Years | 1,309 (6.2%) | 1,462 (6.3%) |
| 10 to 14 Years | 1,310 (6.2%) | 1,631 (7.0%) |
| 15 to 19 Years | 1,294 (6.1%) | 1,446 (6.2%) |
| 20 to 24 Years | 1,562 (7.4%) | 1,812 (7.8%) |
| 25 to 29 Years | 1,421 (6.7%) | 1,661 (7.1%) |
| 30 to 34 Years | 1,331 (6.3%) | 1,519 (6.5%) |
| 35 to 39 Years | 1,848 (8.7%) | 1,524 (6.5%) |
| 40 to 44 Years | 1,257 (5.9%) | 1,495 (6.4%) |
| 45 to 49 Years | 1,439 (6.8%) | 1,260 (5.4%) |
| 50 to 54 Years | 1,389 (6.6%) | 1,282 (5.5%) |
| 55 to 59 Years | 1,265 (6.0%) | 1,313 (5.6%) |
| 60 to 64 Years | 1,262 (5.9%) | 1,348 (5.8%) |
| 65 to 69 Years | 964 (4.5%) | 1,149 (4.9%) |
| 70 to 74 Years | 967 (4.6%) | 899 (3.8%) |
| 75 to 79 Years | 628 (3.0%) | 776 (3.3%) |
| 80 to 84 Years | 390 (1.8%) | 515 (2.2%) |
| 85 Years and over | 271 (1.3%) | 1,051 (4.5%) |
| Total | 21,205 (100.0%) | 23,322 (100.0%) |
Families and Households in Fond Du Lac
Median Family Size in Fond Du Lac
The median family size in Fond Du Lac is 3.04 persons per family, with married-couple families (7,442 | 73.0%) accounting for the largest median family size of 3.13 persons per family. On the other hand, single female/mother families (1,906 | 18.7%) represent the smallest median family size with 2.77 persons per family.
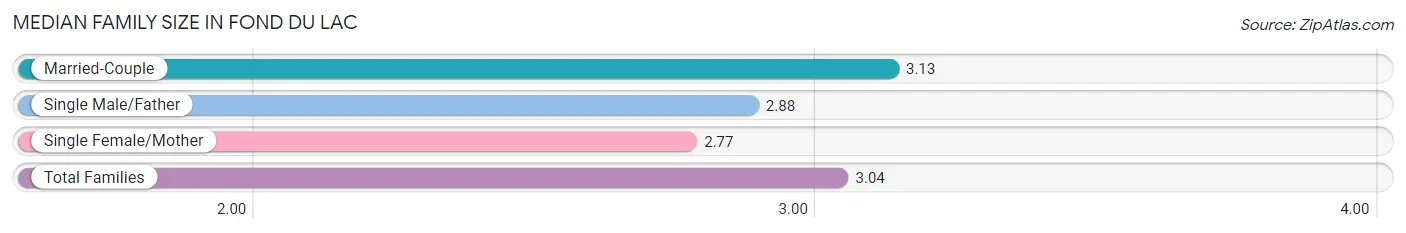
| Family Type | # Families | Family Size |
| Married-Couple | 7,442 (73.0%) | 3.13 |
| Single Male/Father | 849 (8.3%) | 2.88 |
| Single Female/Mother | 1,906 (18.7%) | 2.77 |
| Total Families | 10,197 (100.0%) | 3.04 |
Median Household Size in Fond Du Lac
The median household size in Fond Du Lac is 2.26 persons per household, with single male/father households (849 | 4.6%) accounting for the largest median household size of 3.54 persons per household. non-family households (8,406 | 45.2%) represent the smallest median household size with 1.17 persons per household.
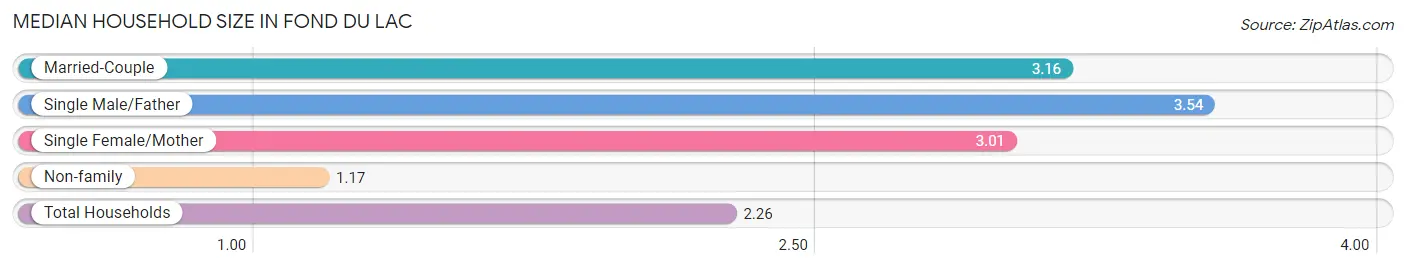
| Household Type | # Households | Household Size |
| Married-Couple | 7,442 (40.0%) | 3.16 |
| Single Male/Father | 849 (4.6%) | 3.54 |
| Single Female/Mother | 1,906 (10.2%) | 3.01 |
| Non-family | 8,406 (45.2%) | 1.17 |
| Total Households | 18,603 (100.0%) | 2.26 |
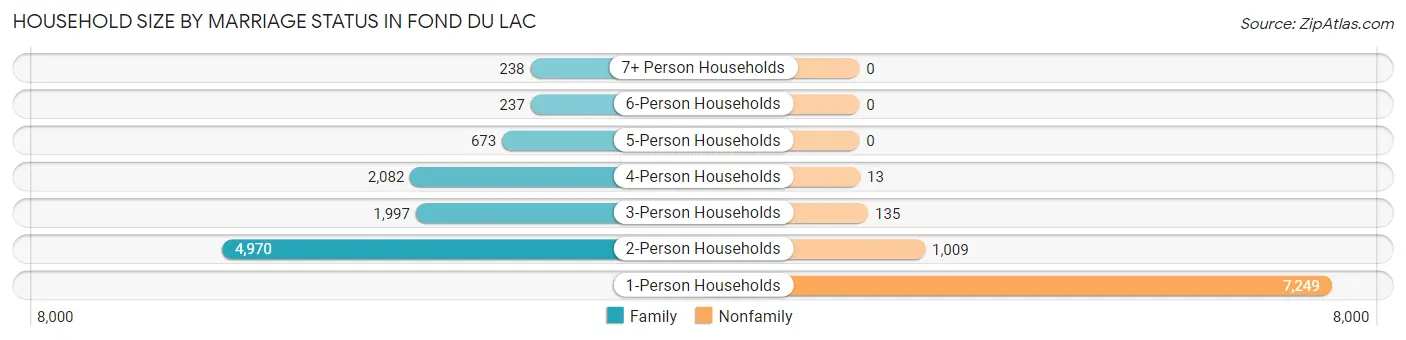
Household Size by Marriage Status in Fond Du Lac
Out of a total of 18,603 households in Fond Du Lac, 10,197 (54.8%) are family households, while 8,406 (45.2%) are nonfamily households. The most numerous type of family households are 2-person households, comprising 4,970, and the most common type of nonfamily households are 1-person households, comprising 7,249.
| Household Size | Family Households | Nonfamily Households |
| 1-Person Households | - | 7,249 (39.0%) |
| 2-Person Households | 4,970 (26.7%) | 1,009 (5.4%) |
| 3-Person Households | 1,997 (10.7%) | 135 (0.7%) |
| 4-Person Households | 2,082 (11.2%) | 13 (0.1%) |
| 5-Person Households | 673 (3.6%) | 0 (0.0%) |
| 6-Person Households | 237 (1.3%) | 0 (0.0%) |
| 7+ Person Households | 238 (1.3%) | 0 (0.0%) |
| Total | 10,197 (54.8%) | 8,406 (45.2%) |
Female Fertility in Fond Du Lac
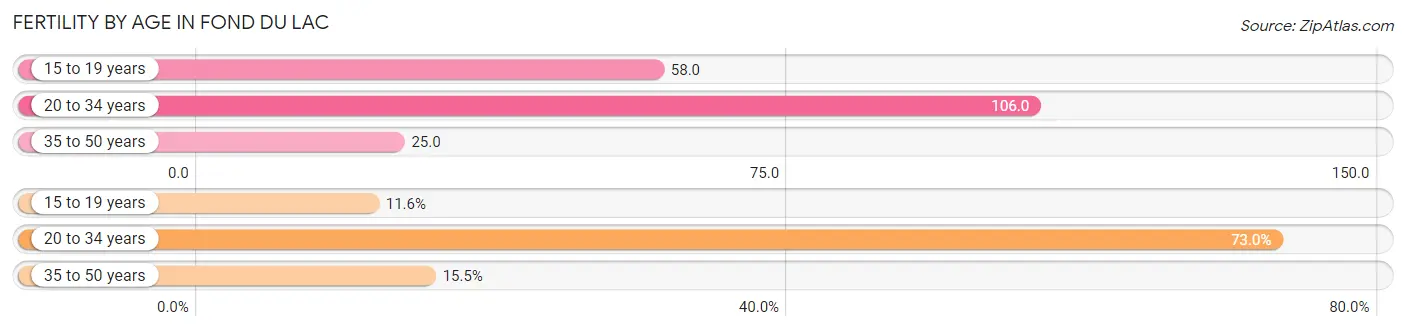
Fertility by Age in Fond Du Lac
Average fertility rate in Fond Du Lac is 66.0 births per 1,000 women. Women in the age bracket of 20 to 34 years have the highest fertility rate with 106.0 births per 1,000 women. Women in the age bracket of 20 to 34 years acount for 73.0% of all women with births.
| Age Bracket | Women with Births | Births / 1,000 Women |
| 15 to 19 years | 84 (11.6%) | 58.0 |
| 20 to 34 years | 529 (73.0%) | 106.0 |
| 35 to 50 years | 112 (15.4%) | 25.0 |
| Total | 725 (100.0%) | 66.0 |
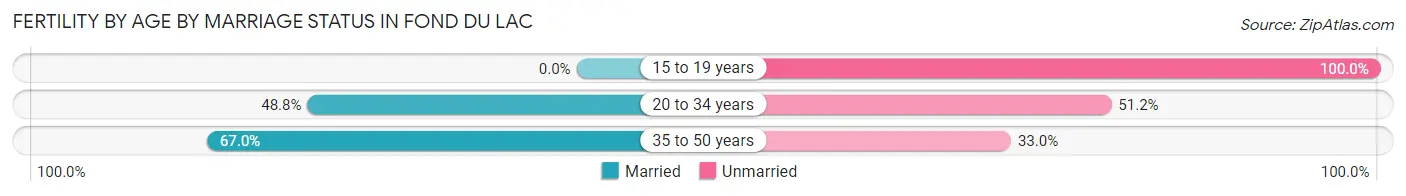
Fertility by Age by Marriage Status in Fond Du Lac
45.9% of women with births (725) in Fond Du Lac are married. The highest percentage of unmarried women with births falls into 15 to 19 years age bracket with 100.0% of them unmarried at the time of birth, while the lowest percentage of unmarried women with births belong to 35 to 50 years age bracket with 33.0% of them unmarried.
| Age Bracket | Married | Unmarried |
| 15 to 19 years | 0 (0.0%) | 84 (100.0%) |
| 20 to 34 years | 258 (48.8%) | 271 (51.2%) |
| 35 to 50 years | 75 (67.0%) | 37 (33.0%) |
| Total | 333 (45.9%) | 392 (54.1%) |
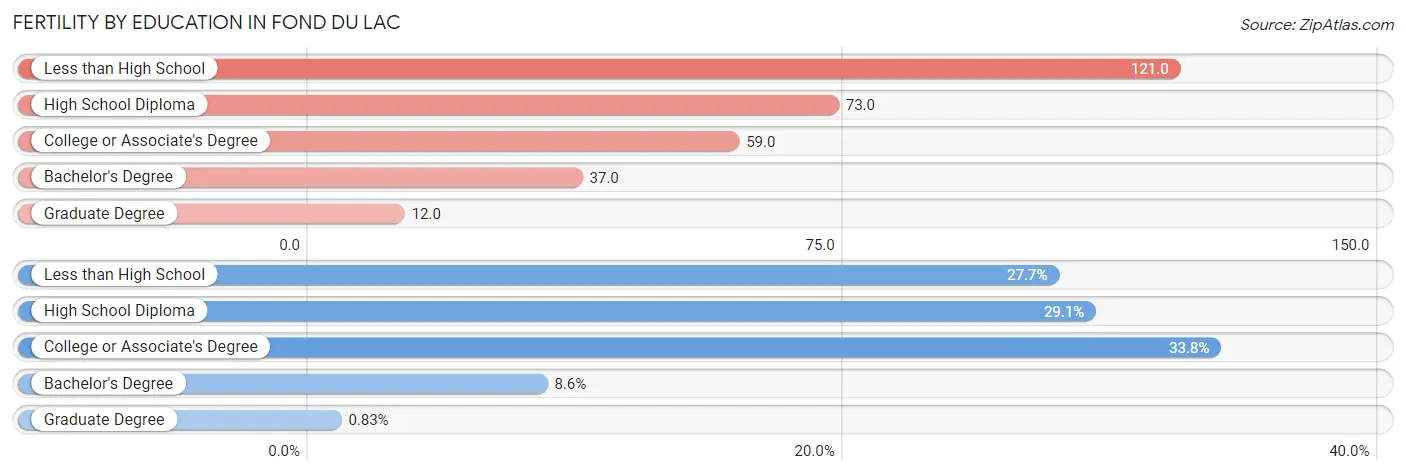
Fertility by Education in Fond Du Lac
Average fertility rate in Fond Du Lac is 66.0 births per 1,000 women. Women with the education attainment of less than high school have the highest fertility rate of 121.0 births per 1,000 women, while women with the education attainment of graduate degree have the lowest fertility at 12.0 births per 1,000 women. Women with the education attainment of college or associate's degree represent 33.8% of all women with births.
| Educational Attainment | Women with Births | Births / 1,000 Women |
| Less than High School | 201 (27.7%) | 121.0 |
| High School Diploma | 211 (29.1%) | 73.0 |
| College or Associate's Degree | 245 (33.8%) | 59.0 |
| Bachelor's Degree | 62 (8.6%) | 37.0 |
| Graduate Degree | 6 (0.8%) | 12.0 |
| Total | 725 (100.0%) | 66.0 |
Fertility by Education by Marriage Status in Fond Du Lac
54.1% of women with births in Fond Du Lac are unmarried. Women with the educational attainment of graduate degree are most likely to be married with 100.0% of them married at childbirth, while women with the educational attainment of less than high school are least likely to be married with 71.1% of them unmarried at childbirth.
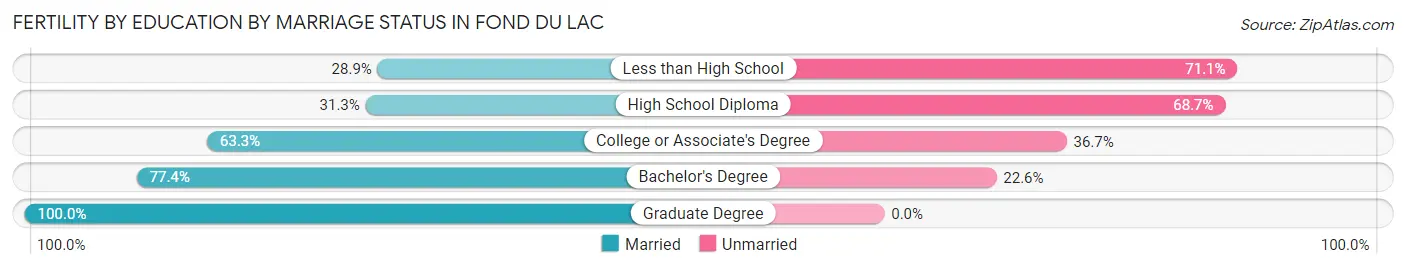
| Educational Attainment | Married | Unmarried |
| Less than High School | 58 (28.9%) | 143 (71.1%) |
| High School Diploma | 66 (31.3%) | 145 (68.7%) |
| College or Associate's Degree | 155 (63.3%) | 90 (36.7%) |
| Bachelor's Degree | 48 (77.4%) | 14 (22.6%) |
| Graduate Degree | 6 (100.0%) | 0 (0.0%) |
| Total | 333 (45.9%) | 392 (54.1%) |
Employment Characteristics in Fond Du Lac
Employment by Class of Employer in Fond Du Lac
Among the 21,426 employed individuals in Fond Du Lac, private company employees (16,163 | 75.4%), not-for-profit organizations (1,947 | 9.1%), and local government employees (1,304 | 6.1%) make up the most common classes of employment.
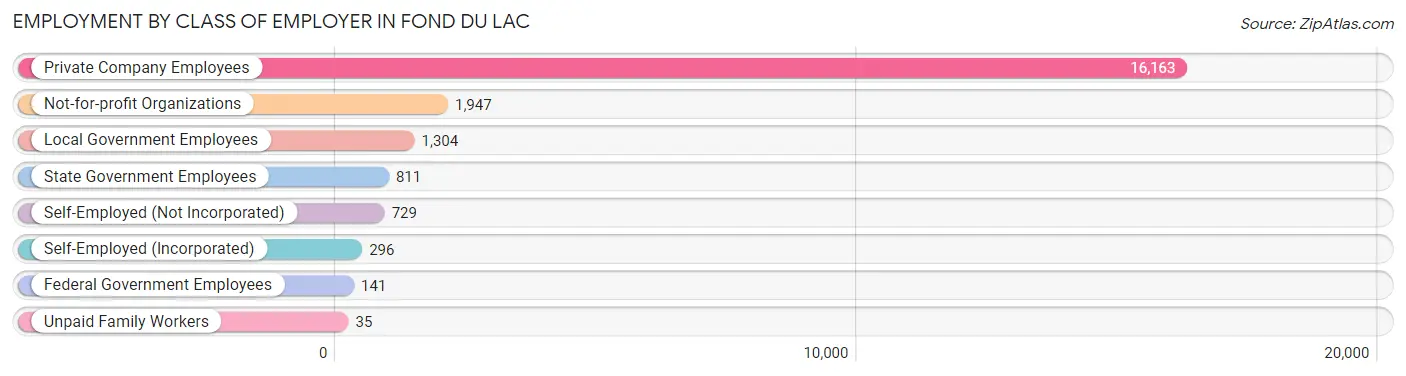
| Employer Class | # Employees | % Employees |
| Private Company Employees | 16,163 | 75.4% |
| Self-Employed (Incorporated) | 296 | 1.4% |
| Self-Employed (Not Incorporated) | 729 | 3.4% |
| Not-for-profit Organizations | 1,947 | 9.1% |
| Local Government Employees | 1,304 | 6.1% |
| State Government Employees | 811 | 3.8% |
| Federal Government Employees | 141 | 0.7% |
| Unpaid Family Workers | 35 | 0.2% |
| Total | 21,426 | 100.0% |
Employment Status by Age in Fond Du Lac
According to the labor force statistics for Fond Du Lac, out of the total population over 16 years of age (35,812), 64.2% or 22,991 individuals are in the labor force, with 4.9% or 1,127 of them unemployed. The age group with the highest labor force participation rate is 25 to 29 years, with 88.3% or 2,721 individuals in the labor force. Within the labor force, the 16 to 19 years age range has the highest percentage of unemployed individuals, with 22.9% or 258 of them being unemployed.
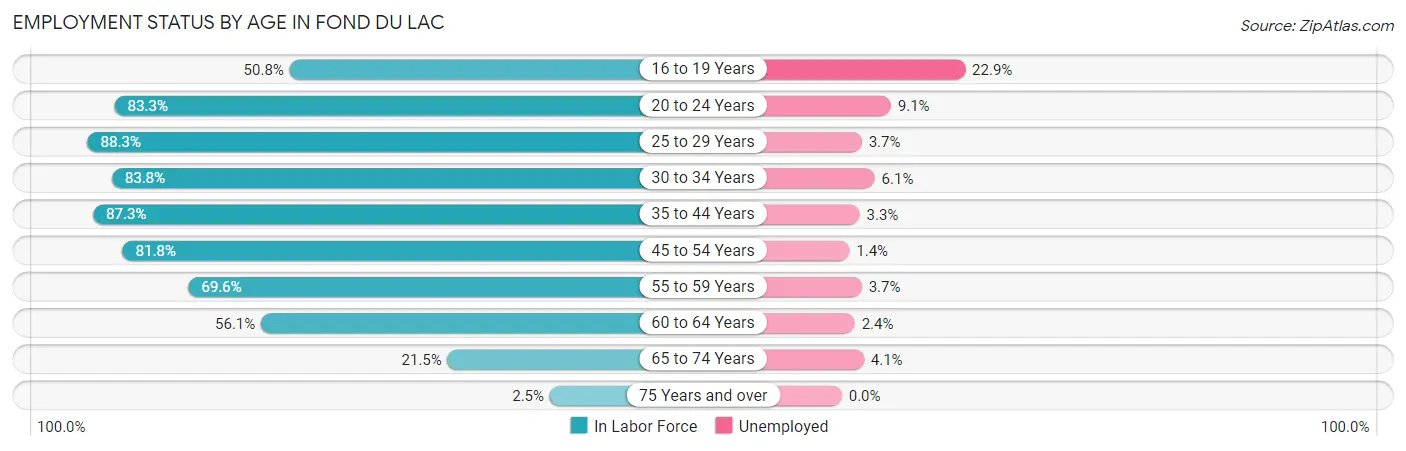
| Age Bracket | In Labor Force | Unemployed |
| 16 to 19 Years | 1,125 (50.8%) | 258 (22.9%) |
| 20 to 24 Years | 2,811 (83.3%) | 256 (9.1%) |
| 25 to 29 Years | 2,721 (88.3%) | 101 (3.7%) |
| 30 to 34 Years | 2,388 (83.8%) | 146 (6.1%) |
| 35 to 44 Years | 5,346 (87.3%) | 176 (3.3%) |
| 45 to 54 Years | 4,393 (81.8%) | 62 (1.4%) |
| 55 to 59 Years | 1,794 (69.6%) | 66 (3.7%) |
| 60 to 64 Years | 1,464 (56.1%) | 35 (2.4%) |
| 65 to 74 Years | 855 (21.5%) | 35 (4.1%) |
| 75 Years and over | 91 (2.5%) | 0 (0.0%) |
| Total | 22,991 (64.2%) | 1,127 (4.9%) |
Employment Status by Educational Attainment in Fond Du Lac
According to labor force statistics for Fond Du Lac, 80.1% of individuals (18,114) out of the total population between 25 and 64 years of age (22,614) are in the labor force, with 3.2% or 580 of them being unemployed. The group with the highest labor force participation rate are those with the educational attainment of bachelor's degree or higher, with 92.8% or 4,487 individuals in the labor force. Within the labor force, individuals with less than high school education have the highest percentage of unemployment, with 14.1% or 184 of them being unemployed.
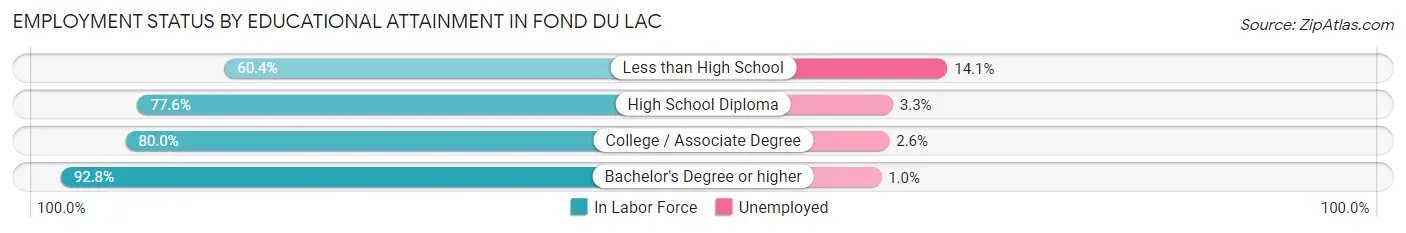
| Educational Attainment | In Labor Force | Unemployed |
| Less than High School | 1,303 (60.4%) | 304 (14.1%) |
| High School Diploma | 5,710 (77.6%) | 243 (3.3%) |
| College / Associate Degree | 6,611 (80.0%) | 215 (2.6%) |
| Bachelor's Degree or higher | 4,487 (92.8%) | 48 (1.0%) |
| Total | 18,114 (80.1%) | 724 (3.2%) |
Employment Occupations by Sex in Fond Du Lac
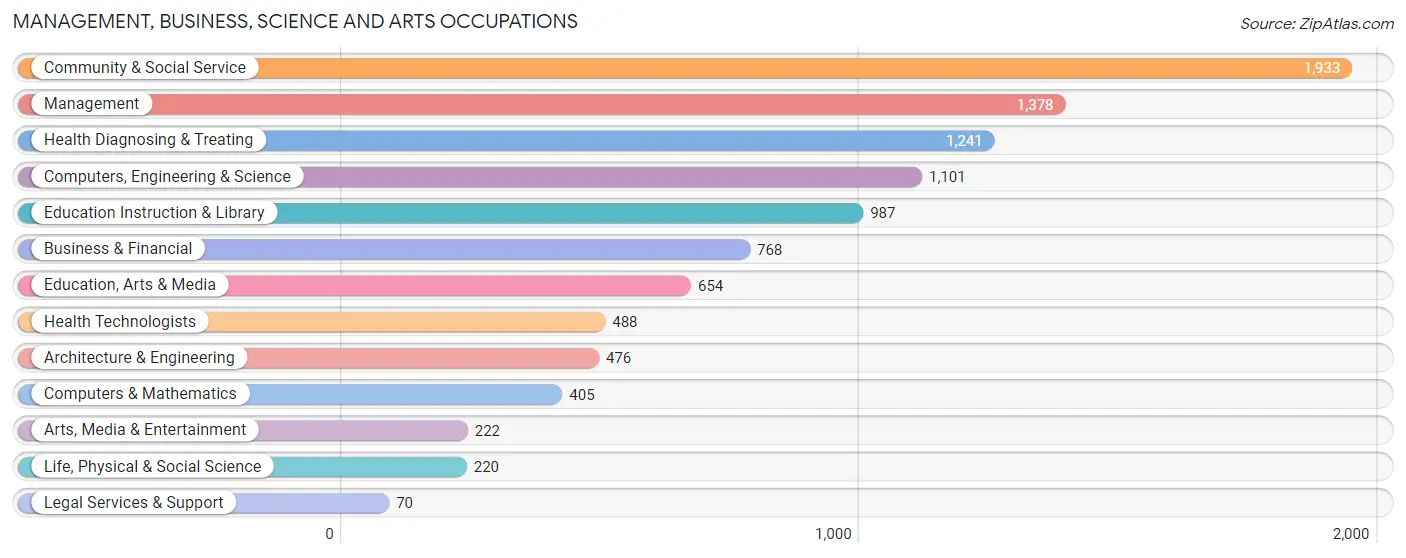
Management, Business, Science and Arts Occupations
The most common Management, Business, Science and Arts occupations in Fond Du Lac are Community & Social Service (1,933 | 8.8%), Management (1,378 | 6.3%), Health Diagnosing & Treating (1,241 | 5.7%), Computers, Engineering & Science (1,101 | 5.0%), and Education Instruction & Library (987 | 4.5%).
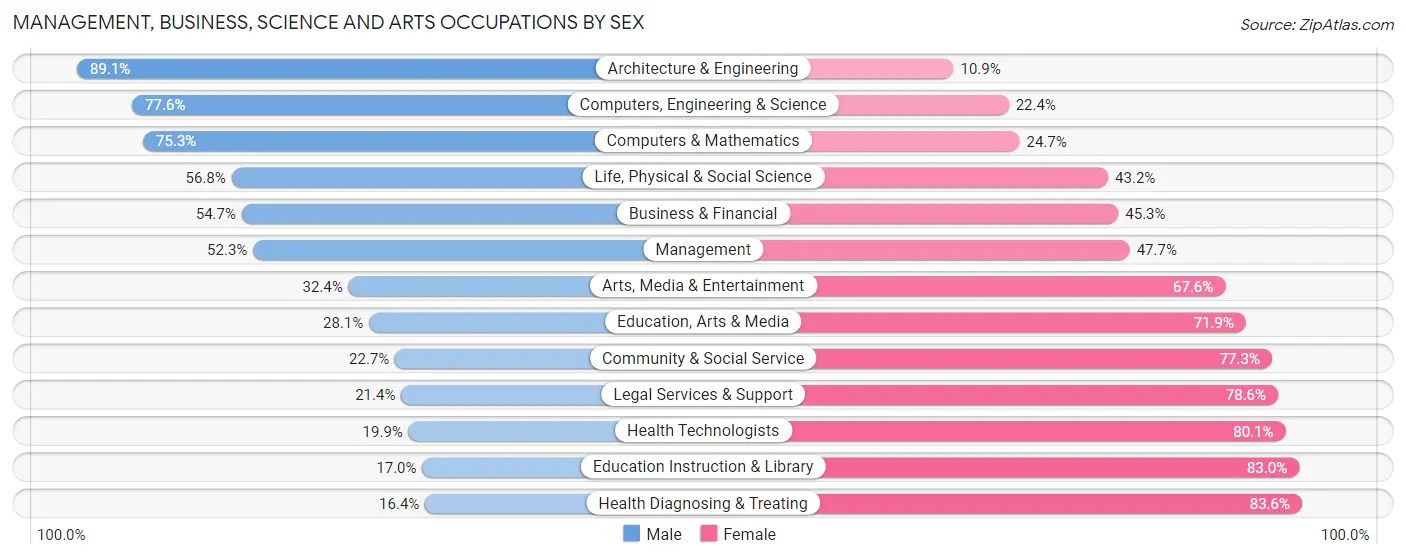
Management, Business, Science and Arts Occupations by Sex
Within the Management, Business, Science and Arts occupations in Fond Du Lac, the most male-oriented occupations are Architecture & Engineering (89.1%), Computers, Engineering & Science (77.6%), and Computers & Mathematics (75.3%), while the most female-oriented occupations are Health Diagnosing & Treating (83.6%), Education Instruction & Library (83.0%), and Health Technologists (80.1%).
| Occupation | Male | Female |
| Management | 721 (52.3%) | 657 (47.7%) |
| Business & Financial | 420 (54.7%) | 348 (45.3%) |
| Computers, Engineering & Science | 854 (77.6%) | 247 (22.4%) |
| Computers & Mathematics | 305 (75.3%) | 100 (24.7%) |
| Architecture & Engineering | 424 (89.1%) | 52 (10.9%) |
| Life, Physical & Social Science | 125 (56.8%) | 95 (43.2%) |
| Community & Social Service | 439 (22.7%) | 1,494 (77.3%) |
| Education, Arts & Media | 184 (28.1%) | 470 (71.9%) |
| Legal Services & Support | 15 (21.4%) | 55 (78.6%) |
| Education Instruction & Library | 168 (17.0%) | 819 (83.0%) |
| Arts, Media & Entertainment | 72 (32.4%) | 150 (67.6%) |
| Health Diagnosing & Treating | 204 (16.4%) | 1,037 (83.6%) |
| Health Technologists | 97 (19.9%) | 391 (80.1%) |
| Total (Category) | 2,638 (41.1%) | 3,783 (58.9%) |
| Total (Overall) | 11,379 (52.1%) | 10,476 (47.9%) |
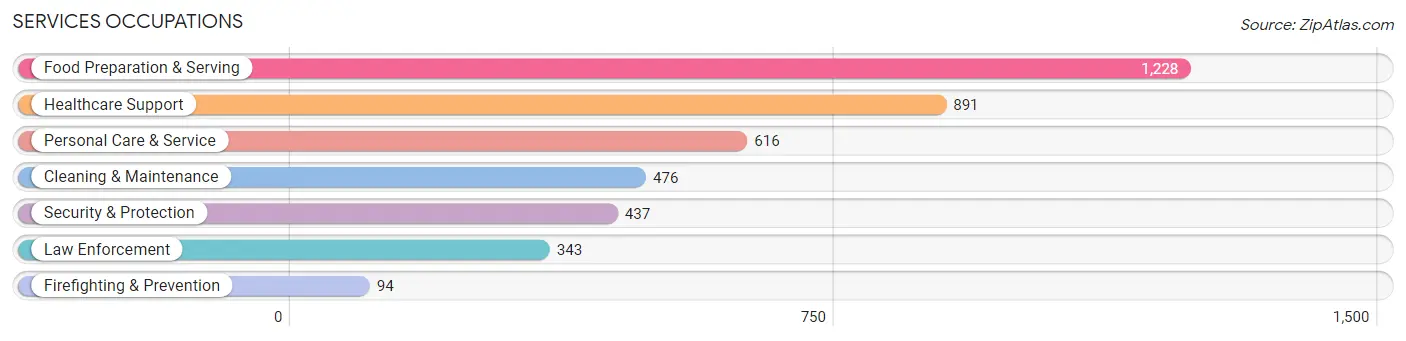
Services Occupations
The most common Services occupations in Fond Du Lac are Food Preparation & Serving (1,228 | 5.6%), Healthcare Support (891 | 4.1%), Personal Care & Service (616 | 2.8%), Cleaning & Maintenance (476 | 2.2%), and Security & Protection (437 | 2.0%).
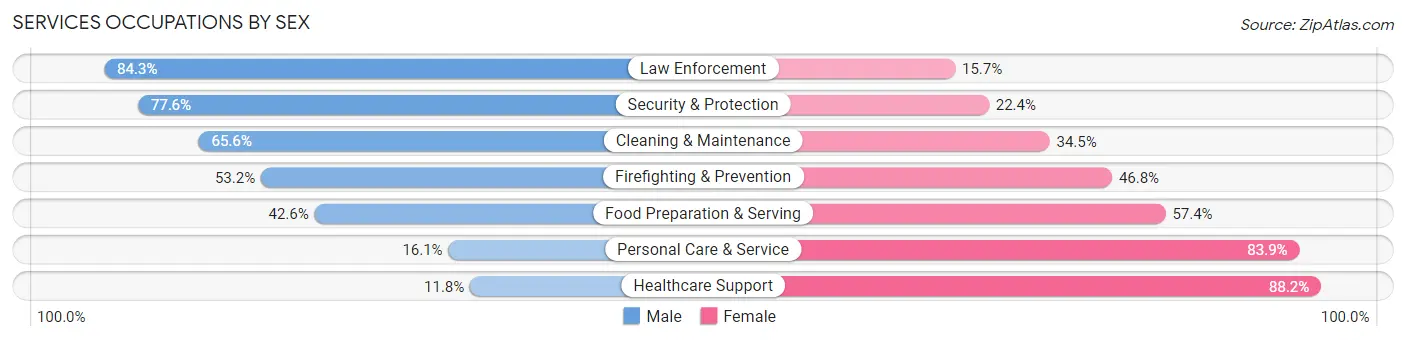
Services Occupations by Sex
Within the Services occupations in Fond Du Lac, the most male-oriented occupations are Law Enforcement (84.3%), Security & Protection (77.6%), and Cleaning & Maintenance (65.5%), while the most female-oriented occupations are Healthcare Support (88.2%), Personal Care & Service (83.9%), and Food Preparation & Serving (57.4%).
| Occupation | Male | Female |
| Healthcare Support | 105 (11.8%) | 786 (88.2%) |
| Security & Protection | 339 (77.6%) | 98 (22.4%) |
| Firefighting & Prevention | 50 (53.2%) | 44 (46.8%) |
| Law Enforcement | 289 (84.3%) | 54 (15.7%) |
| Food Preparation & Serving | 523 (42.6%) | 705 (57.4%) |
| Cleaning & Maintenance | 312 (65.5%) | 164 (34.4%) |
| Personal Care & Service | 99 (16.1%) | 517 (83.9%) |
| Total (Category) | 1,378 (37.8%) | 2,270 (62.2%) |
| Total (Overall) | 11,379 (52.1%) | 10,476 (47.9%) |
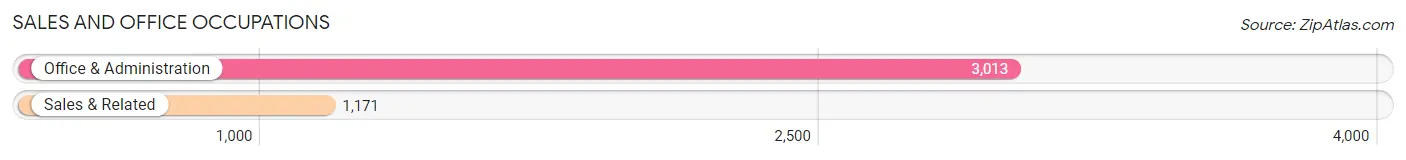
Sales and Office Occupations
The most common Sales and Office occupations in Fond Du Lac are Office & Administration (3,013 | 13.8%), and Sales & Related (1,171 | 5.4%).
Sales and Office Occupations by Sex
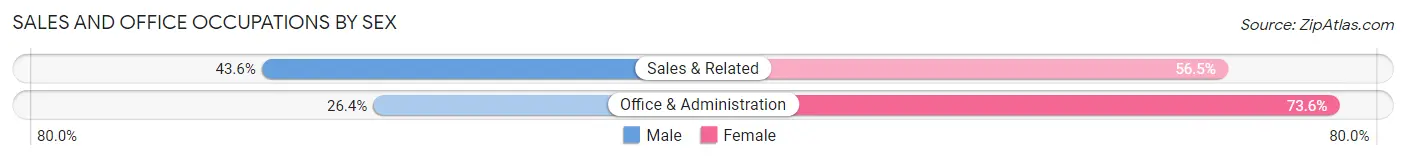
| Occupation | Male | Female |
| Sales & Related | 510 (43.5%) | 661 (56.5%) |
| Office & Administration | 795 (26.4%) | 2,218 (73.6%) |
| Total (Category) | 1,305 (31.2%) | 2,879 (68.8%) |
| Total (Overall) | 11,379 (52.1%) | 10,476 (47.9%) |
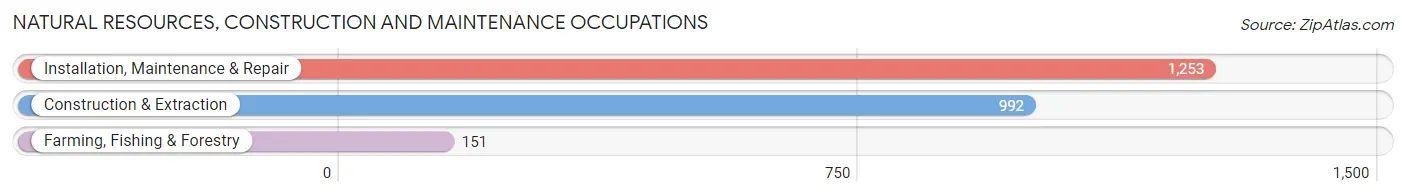
Natural Resources, Construction and Maintenance Occupations
The most common Natural Resources, Construction and Maintenance occupations in Fond Du Lac are Installation, Maintenance & Repair (1,253 | 5.7%), Construction & Extraction (992 | 4.5%), and Farming, Fishing & Forestry (151 | 0.7%).
Natural Resources, Construction and Maintenance Occupations by Sex
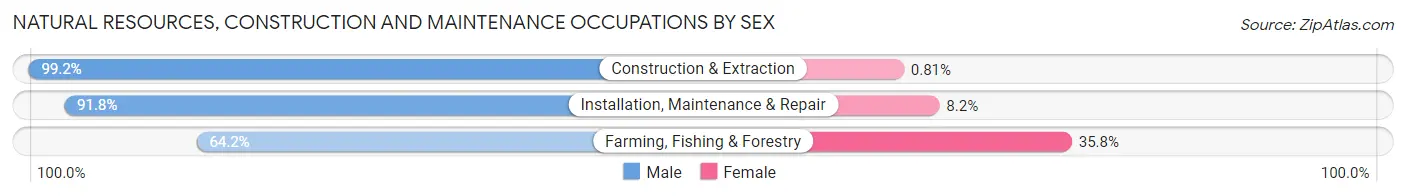
| Occupation | Male | Female |
| Farming, Fishing & Forestry | 97 (64.2%) | 54 (35.8%) |
| Construction & Extraction | 984 (99.2%) | 8 (0.8%) |
| Installation, Maintenance & Repair | 1,150 (91.8%) | 103 (8.2%) |
| Total (Category) | 2,231 (93.1%) | 165 (6.9%) |
| Total (Overall) | 11,379 (52.1%) | 10,476 (47.9%) |
Production, Transportation and Moving Occupations
The most common Production, Transportation and Moving occupations in Fond Du Lac are Production (3,227 | 14.8%), Material Moving (1,098 | 5.0%), and Transportation (881 | 4.0%).
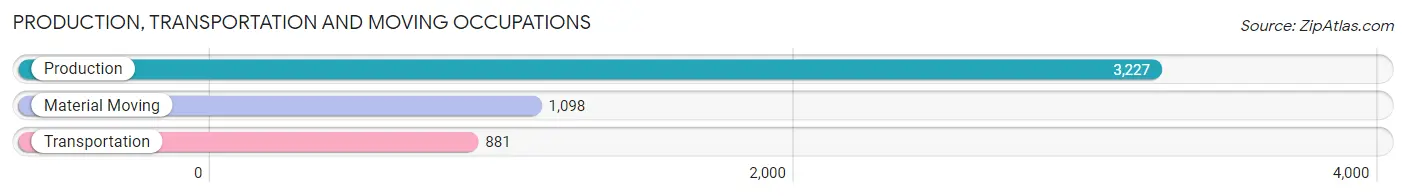
Production, Transportation and Moving Occupations by Sex
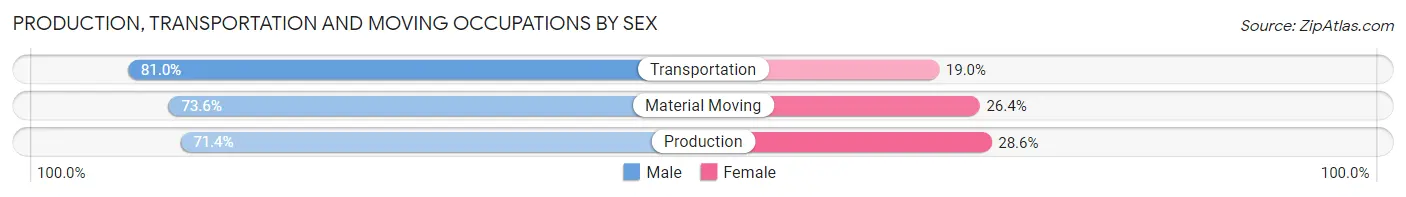
| Occupation | Male | Female |
| Production | 2,305 (71.4%) | 922 (28.6%) |
| Transportation | 714 (81.0%) | 167 (19.0%) |
| Material Moving | 808 (73.6%) | 290 (26.4%) |
| Total (Category) | 3,827 (73.5%) | 1,379 (26.5%) |
| Total (Overall) | 11,379 (52.1%) | 10,476 (47.9%) |
Employment Industries by Sex in Fond Du Lac
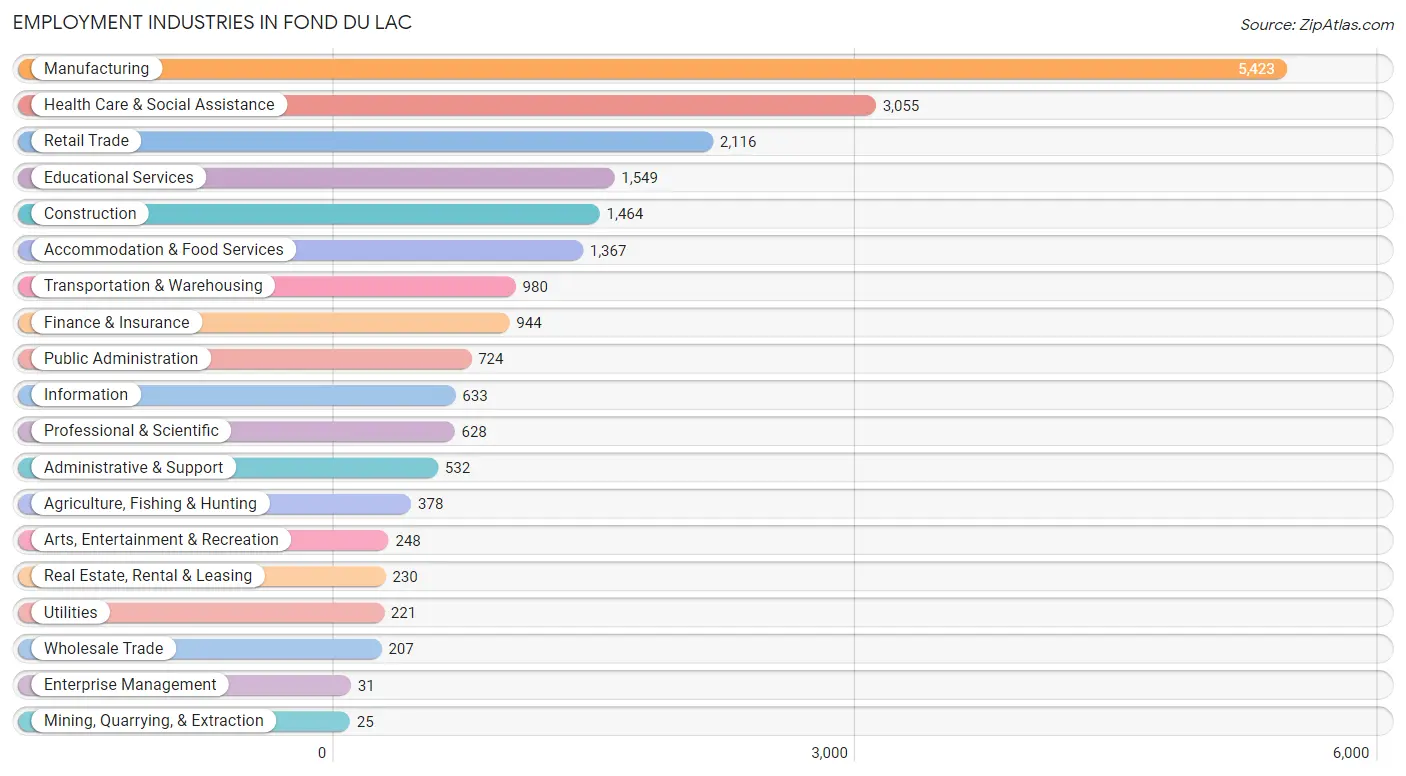
Employment Industries in Fond Du Lac
The major employment industries in Fond Du Lac include Manufacturing (5,423 | 24.8%), Health Care & Social Assistance (3,055 | 14.0%), Retail Trade (2,116 | 9.7%), Educational Services (1,549 | 7.1%), and Construction (1,464 | 6.7%).
Employment Industries by Sex in Fond Du Lac
The Fond Du Lac industries that see more men than women are Mining, Quarrying, & Extraction (100.0%), Construction (85.7%), and Wholesale Trade (81.2%), whereas the industries that tend to have a higher number of women are Enterprise Management (100.0%), Health Care & Social Assistance (81.5%), and Educational Services (78.0%).
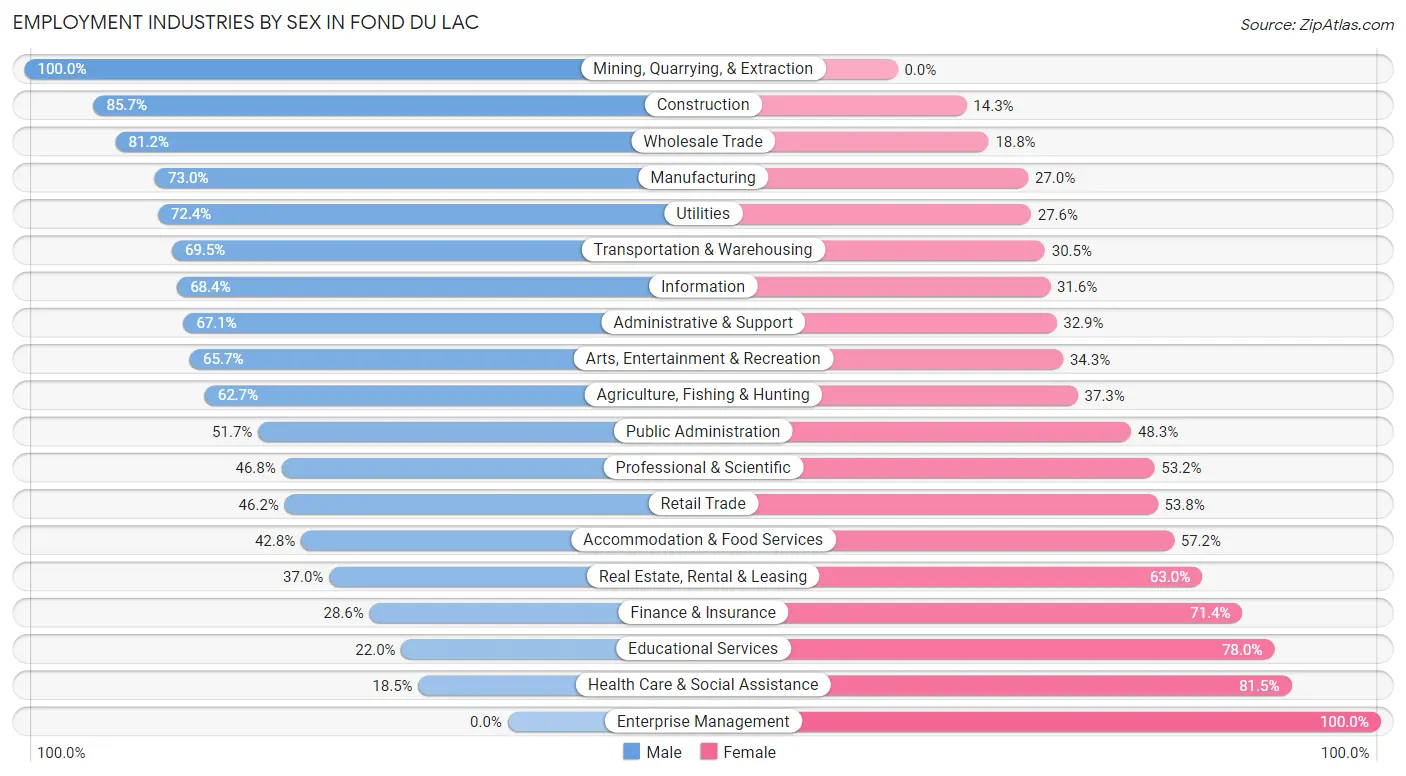
| Industry | Male | Female |
| Agriculture, Fishing & Hunting | 237 (62.7%) | 141 (37.3%) |
| Mining, Quarrying, & Extraction | 25 (100.0%) | 0 (0.0%) |
| Construction | 1,255 (85.7%) | 209 (14.3%) |
| Manufacturing | 3,957 (73.0%) | 1,466 (27.0%) |
| Wholesale Trade | 168 (81.2%) | 39 (18.8%) |
| Retail Trade | 977 (46.2%) | 1,139 (53.8%) |
| Transportation & Warehousing | 681 (69.5%) | 299 (30.5%) |
| Utilities | 160 (72.4%) | 61 (27.6%) |
| Information | 433 (68.4%) | 200 (31.6%) |
| Finance & Insurance | 270 (28.6%) | 674 (71.4%) |
| Real Estate, Rental & Leasing | 85 (37.0%) | 145 (63.0%) |
| Professional & Scientific | 294 (46.8%) | 334 (53.2%) |
| Enterprise Management | 0 (0.0%) | 31 (100.0%) |
| Administrative & Support | 357 (67.1%) | 175 (32.9%) |
| Educational Services | 341 (22.0%) | 1,208 (78.0%) |
| Health Care & Social Assistance | 565 (18.5%) | 2,490 (81.5%) |
| Arts, Entertainment & Recreation | 163 (65.7%) | 85 (34.3%) |
| Accommodation & Food Services | 585 (42.8%) | 782 (57.2%) |
| Public Administration | 374 (51.7%) | 350 (48.3%) |
| Total | 11,379 (52.1%) | 10,476 (47.9%) |
Education in Fond Du Lac
School Enrollment in Fond Du Lac
The most common levels of schooling among the 10,336 students in Fond Du Lac are middle school (2,490 | 24.1%), high school (2,230 | 21.6%), and college / undergraduate (2,200 | 21.3%).
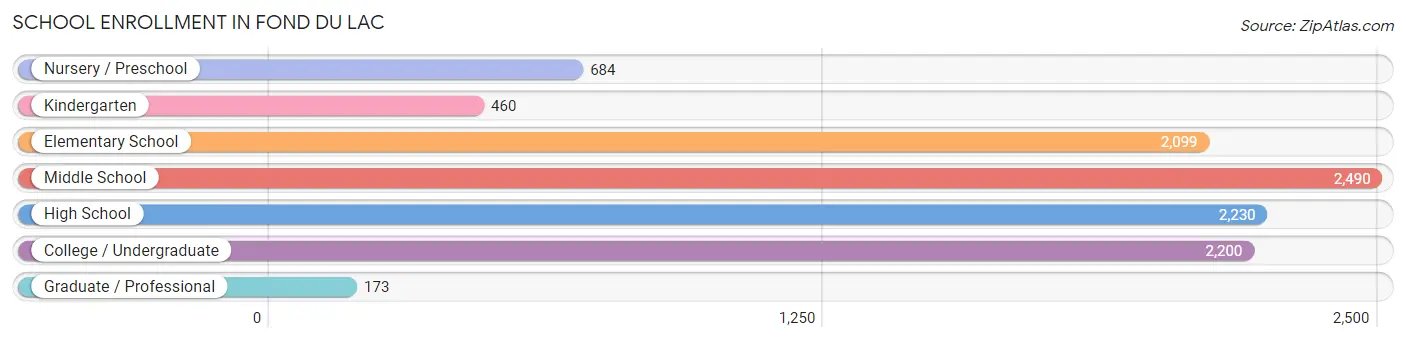
| School Level | # Students | % Students |
| Nursery / Preschool | 684 | 6.6% |
| Kindergarten | 460 | 4.4% |
| Elementary School | 2,099 | 20.3% |
| Middle School | 2,490 | 24.1% |
| High School | 2,230 | 21.6% |
| College / Undergraduate | 2,200 | 21.3% |
| Graduate / Professional | 173 | 1.7% |
| Total | 10,336 | 100.0% |
School Enrollment by Age by Funding Source in Fond Du Lac
Out of a total of 10,336 students who are enrolled in schools in Fond Du Lac, 2,553 (24.7%) attend a private institution, while the remaining 7,783 (75.3%) are enrolled in public schools. The age group of 20 to 24 year olds has the highest likelihood of being enrolled in private schools, with 689 (64.9% in the age bracket) enrolled. Conversely, the age group of 10 to 14 year olds has the lowest likelihood of being enrolled in a private school, with 2,514 (87.2% in the age bracket) attending a public institution.
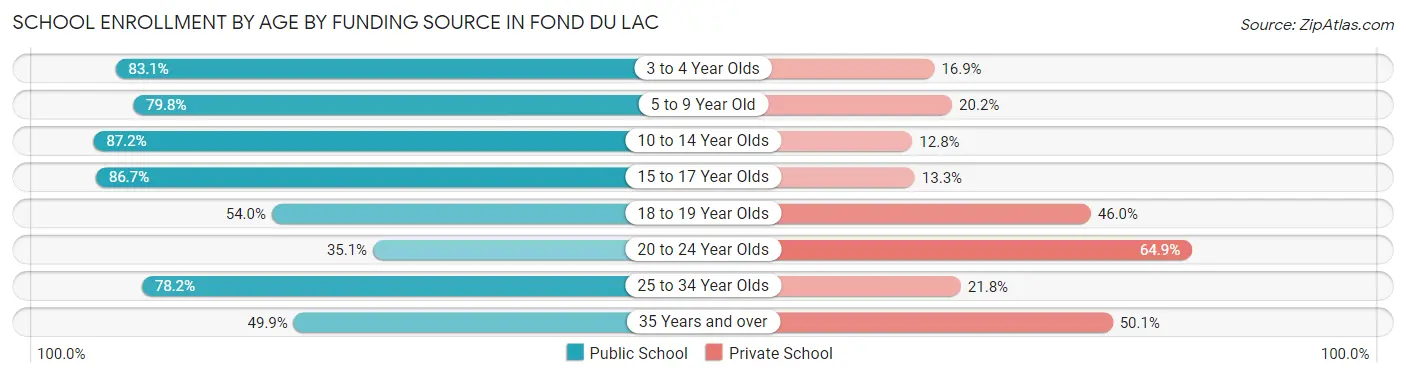
| Age Bracket | Public School | Private School |
| 3 to 4 Year Olds | 344 (83.1%) | 70 (16.9%) |
| 5 to 9 Year Old | 2,085 (79.8%) | 528 (20.2%) |
| 10 to 14 Year Olds | 2,514 (87.2%) | 369 (12.8%) |
| 15 to 17 Year Olds | 1,425 (86.7%) | 218 (13.3%) |
| 18 to 19 Year Olds | 409 (54.0%) | 349 (46.0%) |
| 20 to 24 Year Olds | 373 (35.1%) | 689 (64.9%) |
| 25 to 34 Year Olds | 408 (78.2%) | 114 (21.8%) |
| 35 Years and over | 220 (49.9%) | 221 (50.1%) |
| Total | 7,783 (75.3%) | 2,553 (24.7%) |
Educational Attainment by Field of Study in Fond Du Lac
Education (1,502 | 20.9%), business (1,161 | 16.1%), arts & humanities (791 | 11.0%), engineering (532 | 7.4%), and science & technology (505 | 7.0%) are the most common fields of study among 7,194 individuals in Fond Du Lac who have obtained a bachelor's degree or higher.
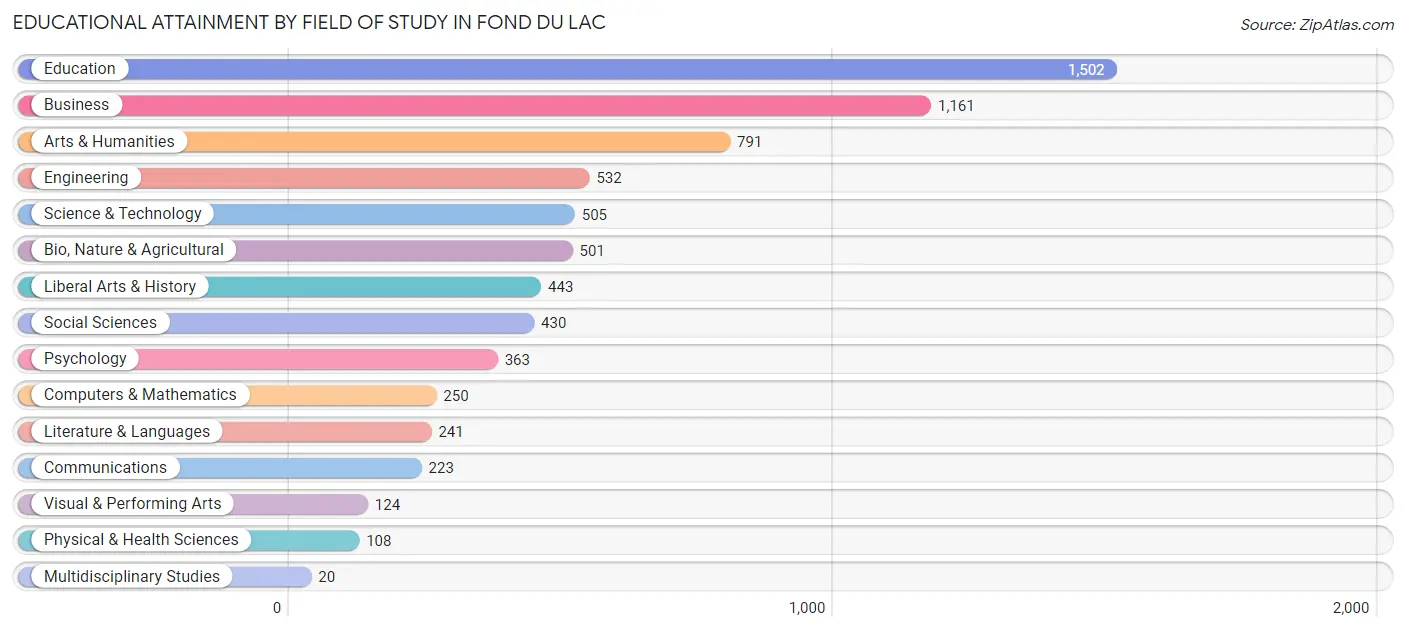
| Field of Study | # Graduates | % Graduates |
| Computers & Mathematics | 250 | 3.5% |
| Bio, Nature & Agricultural | 501 | 7.0% |
| Physical & Health Sciences | 108 | 1.5% |
| Psychology | 363 | 5.1% |
| Social Sciences | 430 | 6.0% |
| Engineering | 532 | 7.4% |
| Multidisciplinary Studies | 20 | 0.3% |
| Science & Technology | 505 | 7.0% |
| Business | 1,161 | 16.1% |
| Education | 1,502 | 20.9% |
| Literature & Languages | 241 | 3.4% |
| Liberal Arts & History | 443 | 6.2% |
| Visual & Performing Arts | 124 | 1.7% |
| Communications | 223 | 3.1% |
| Arts & Humanities | 791 | 11.0% |
| Total | 7,194 | 100.0% |
Transportation & Commute in Fond Du Lac
Vehicle Availability by Sex in Fond Du Lac
The most prevalent vehicle ownership categories in Fond Du Lac are males with 2 vehicles (4,283, accounting for 38.2%) and females with 2 vehicles (4,142, making up 43.4%).
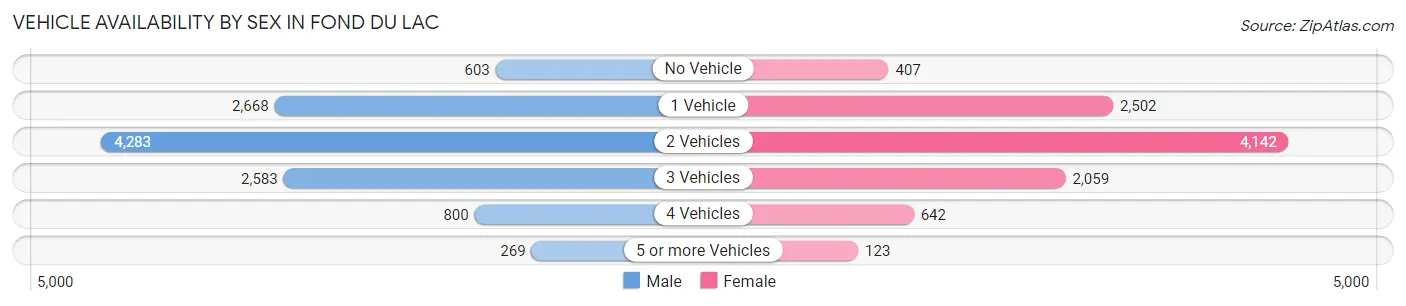
| Vehicles Available | Male | Female |
| No Vehicle | 603 (5.4%) | 407 (4.1%) |
| 1 Vehicle | 2,668 (23.8%) | 2,502 (25.3%) |
| 2 Vehicles | 4,283 (38.2%) | 4,142 (41.9%) |
| 3 Vehicles | 2,583 (23.1%) | 2,059 (20.8%) |
| 4 Vehicles | 800 (7.1%) | 642 (6.5%) |
| 5 or more Vehicles | 269 (2.4%) | 123 (1.3%) |
| Total | 11,206 (100.0%) | 9,875 (100.0%) |
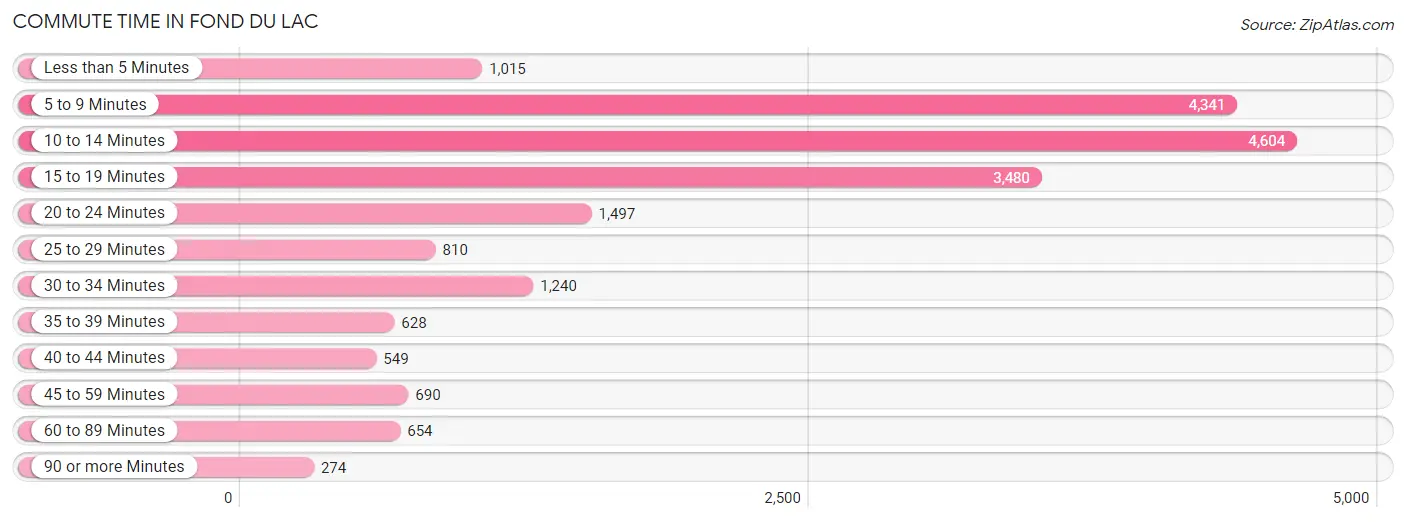
Commute Time in Fond Du Lac
The most frequently occuring commute durations in Fond Du Lac are 10 to 14 minutes (4,604 commuters, 23.3%), 5 to 9 minutes (4,341 commuters, 21.9%), and 15 to 19 minutes (3,480 commuters, 17.6%).
| Commute Time | # Commuters | % Commuters |
| Less than 5 Minutes | 1,015 | 5.1% |
| 5 to 9 Minutes | 4,341 | 21.9% |
| 10 to 14 Minutes | 4,604 | 23.3% |
| 15 to 19 Minutes | 3,480 | 17.6% |
| 20 to 24 Minutes | 1,497 | 7.6% |
| 25 to 29 Minutes | 810 | 4.1% |
| 30 to 34 Minutes | 1,240 | 6.3% |
| 35 to 39 Minutes | 628 | 3.2% |
| 40 to 44 Minutes | 549 | 2.8% |
| 45 to 59 Minutes | 690 | 3.5% |
| 60 to 89 Minutes | 654 | 3.3% |
| 90 or more Minutes | 274 | 1.4% |
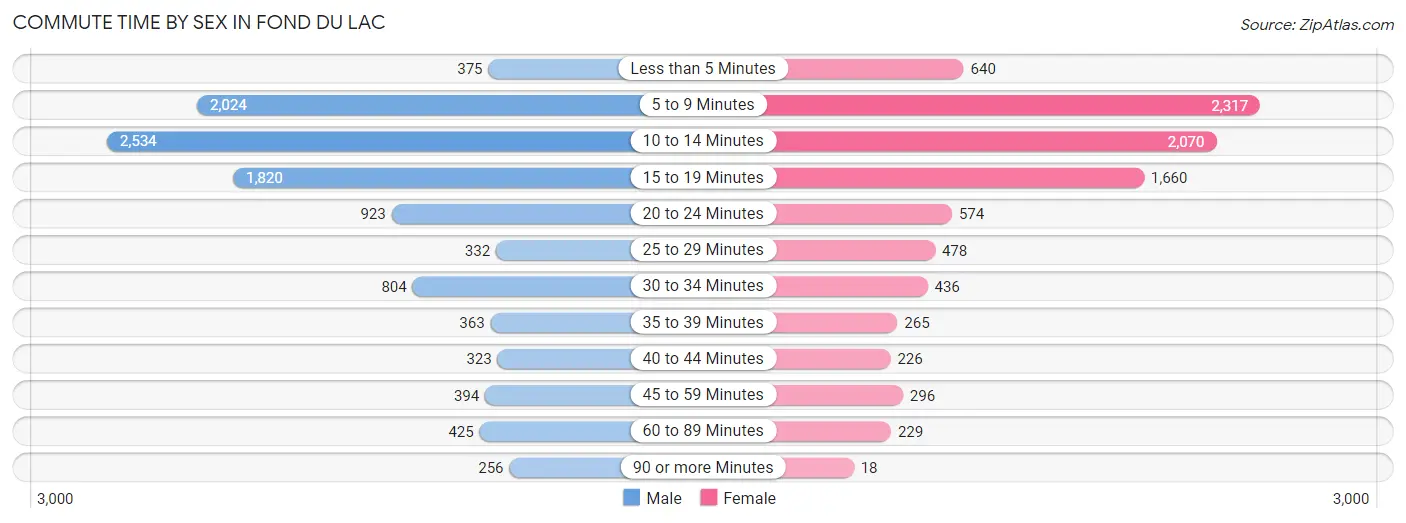
Commute Time by Sex in Fond Du Lac
The most common commute times in Fond Du Lac are 10 to 14 minutes (2,534 commuters, 24.0%) for males and 5 to 9 minutes (2,317 commuters, 25.2%) for females.
| Commute Time | Male | Female |
| Less than 5 Minutes | 375 (3.5%) | 640 (7.0%) |
| 5 to 9 Minutes | 2,024 (19.1%) | 2,317 (25.2%) |
| 10 to 14 Minutes | 2,534 (24.0%) | 2,070 (22.5%) |
| 15 to 19 Minutes | 1,820 (17.2%) | 1,660 (18.0%) |
| 20 to 24 Minutes | 923 (8.7%) | 574 (6.2%) |
| 25 to 29 Minutes | 332 (3.1%) | 478 (5.2%) |
| 30 to 34 Minutes | 804 (7.6%) | 436 (4.7%) |
| 35 to 39 Minutes | 363 (3.4%) | 265 (2.9%) |
| 40 to 44 Minutes | 323 (3.0%) | 226 (2.5%) |
| 45 to 59 Minutes | 394 (3.7%) | 296 (3.2%) |
| 60 to 89 Minutes | 425 (4.0%) | 229 (2.5%) |
| 90 or more Minutes | 256 (2.4%) | 18 (0.2%) |
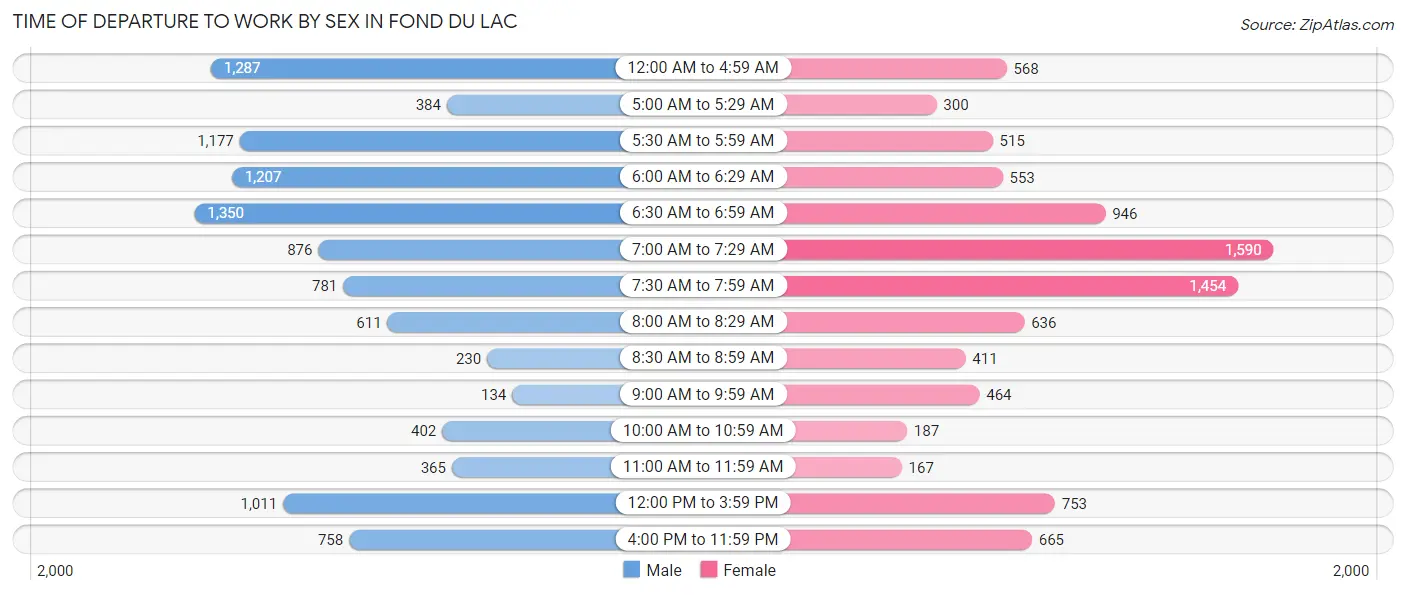
Time of Departure to Work by Sex in Fond Du Lac
The most frequent times of departure to work in Fond Du Lac are 6:30 AM to 6:59 AM (1,350, 12.8%) for males and 7:00 AM to 7:29 AM (1,590, 17.3%) for females.
| Time of Departure | Male | Female |
| 12:00 AM to 4:59 AM | 1,287 (12.2%) | 568 (6.2%) |
| 5:00 AM to 5:29 AM | 384 (3.6%) | 300 (3.3%) |
| 5:30 AM to 5:59 AM | 1,177 (11.1%) | 515 (5.6%) |
| 6:00 AM to 6:29 AM | 1,207 (11.4%) | 553 (6.0%) |
| 6:30 AM to 6:59 AM | 1,350 (12.8%) | 946 (10.3%) |
| 7:00 AM to 7:29 AM | 876 (8.3%) | 1,590 (17.3%) |
| 7:30 AM to 7:59 AM | 781 (7.4%) | 1,454 (15.8%) |
| 8:00 AM to 8:29 AM | 611 (5.8%) | 636 (6.9%) |
| 8:30 AM to 8:59 AM | 230 (2.2%) | 411 (4.5%) |
| 9:00 AM to 9:59 AM | 134 (1.3%) | 464 (5.0%) |
| 10:00 AM to 10:59 AM | 402 (3.8%) | 187 (2.0%) |
| 11:00 AM to 11:59 AM | 365 (3.5%) | 167 (1.8%) |
| 12:00 PM to 3:59 PM | 1,011 (9.6%) | 753 (8.2%) |
| 4:00 PM to 11:59 PM | 758 (7.2%) | 665 (7.2%) |
| Total | 10,573 (100.0%) | 9,209 (100.0%) |
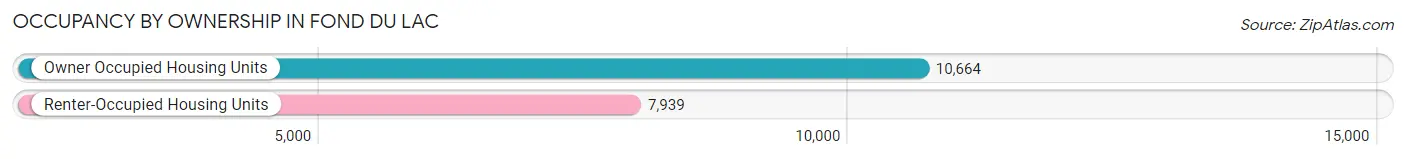
Housing Occupancy in Fond Du Lac
Occupancy by Ownership in Fond Du Lac
Of the total 18,603 dwellings in Fond Du Lac, owner-occupied units account for 10,664 (57.3%), while renter-occupied units make up 7,939 (42.7%).
| Occupancy | # Housing Units | % Housing Units |
| Owner Occupied Housing Units | 10,664 | 57.3% |
| Renter-Occupied Housing Units | 7,939 | 42.7% |
| Total Occupied Housing Units | 18,603 | 100.0% |
Occupancy by Household Size in Fond Du Lac
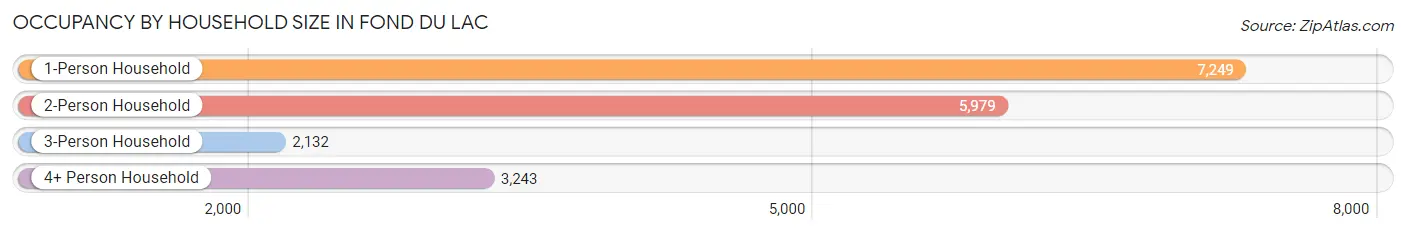
| Household Size | # Housing Units | % Housing Units |
| 1-Person Household | 7,249 | 39.0% |
| 2-Person Household | 5,979 | 32.1% |
| 3-Person Household | 2,132 | 11.5% |
| 4+ Person Household | 3,243 | 17.4% |
| Total Housing Units | 18,603 | 100.0% |
Occupancy by Ownership by Household Size in Fond Du Lac
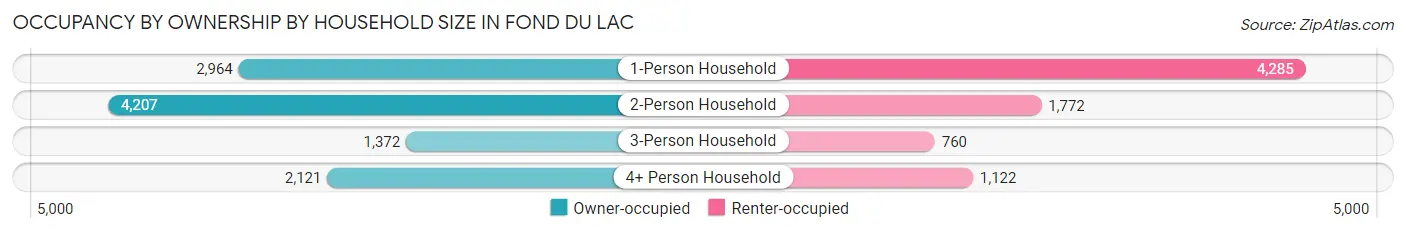
| Household Size | Owner-occupied | Renter-occupied |
| 1-Person Household | 2,964 (40.9%) | 4,285 (59.1%) |
| 2-Person Household | 4,207 (70.4%) | 1,772 (29.6%) |
| 3-Person Household | 1,372 (64.3%) | 760 (35.6%) |
| 4+ Person Household | 2,121 (65.4%) | 1,122 (34.6%) |
| Total Housing Units | 10,664 (57.3%) | 7,939 (42.7%) |
Occupancy by Educational Attainment in Fond Du Lac
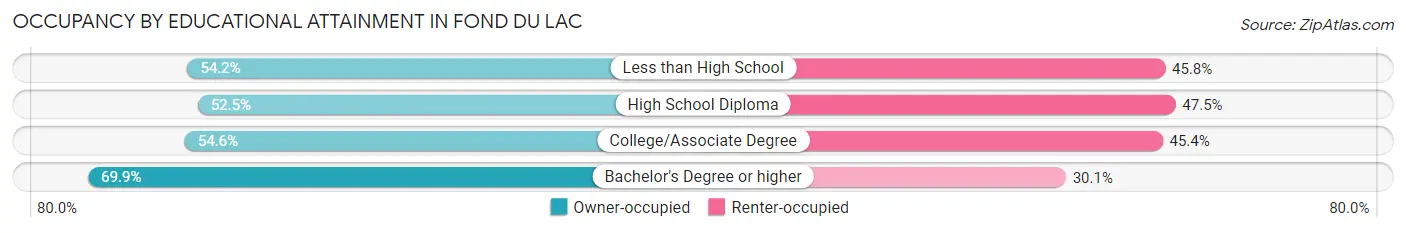
| Household Size | Owner-occupied | Renter-occupied |
| Less than High School | 687 (54.2%) | 581 (45.8%) |
| High School Diploma | 3,366 (52.5%) | 3,040 (47.5%) |
| College/Associate Degree | 3,667 (54.6%) | 3,052 (45.4%) |
| Bachelor's Degree or higher | 2,944 (69.9%) | 1,266 (30.1%) |
Occupancy by Age of Householder in Fond Du Lac
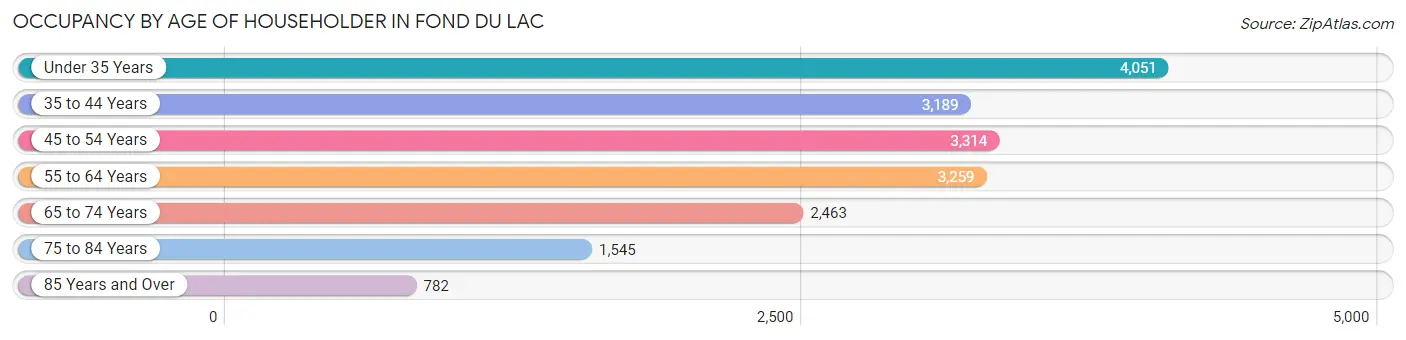
| Age Bracket | # Households | % Households |
| Under 35 Years | 4,051 | 21.8% |
| 35 to 44 Years | 3,189 | 17.1% |
| 45 to 54 Years | 3,314 | 17.8% |
| 55 to 64 Years | 3,259 | 17.5% |
| 65 to 74 Years | 2,463 | 13.2% |
| 75 to 84 Years | 1,545 | 8.3% |
| 85 Years and Over | 782 | 4.2% |
| Total | 18,603 | 100.0% |
Housing Finances in Fond Du Lac
Median Income by Occupancy in Fond Du Lac
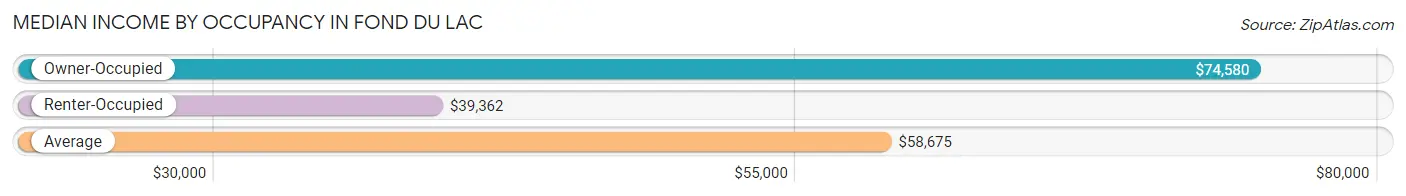
| Occupancy Type | # Households | Median Income |
| Owner-Occupied | 10,664 (57.3%) | $74,580 |
| Renter-Occupied | 7,939 (42.7%) | $39,362 |
| Average | 18,603 (100.0%) | $58,675 |
Occupancy by Householder Income Bracket in Fond Du Lac
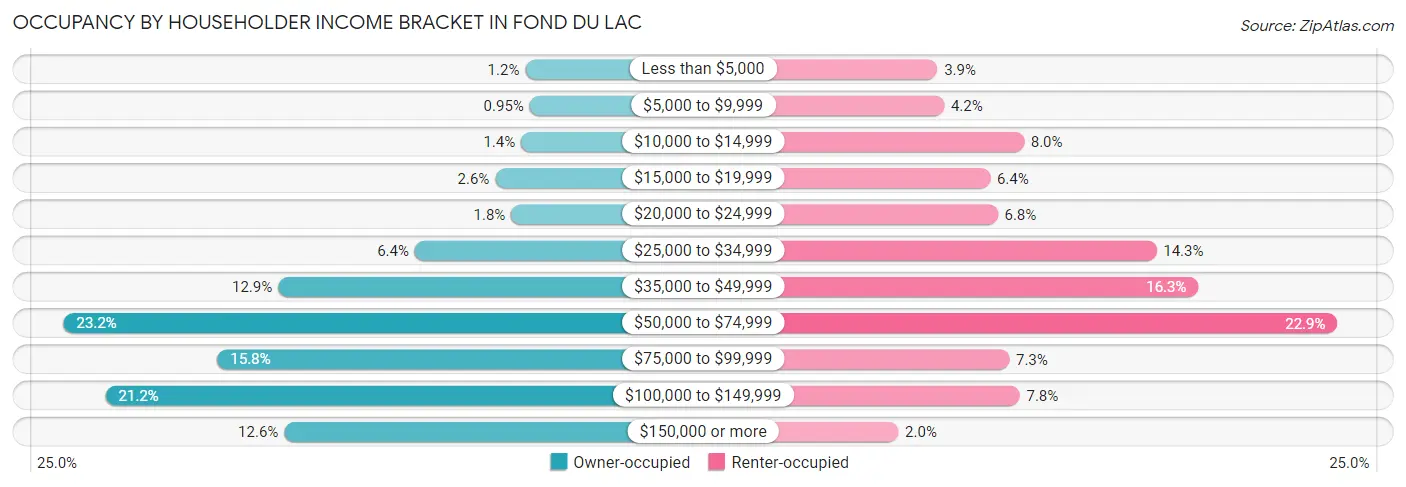
| Income Bracket | Owner-occupied | Renter-occupied |
| Less than $5,000 | 124 (1.2%) | 309 (3.9%) |
| $5,000 to $9,999 | 101 (0.9%) | 334 (4.2%) |
| $10,000 to $14,999 | 145 (1.4%) | 636 (8.0%) |
| $15,000 to $19,999 | 276 (2.6%) | 508 (6.4%) |
| $20,000 to $24,999 | 195 (1.8%) | 537 (6.8%) |
| $25,000 to $34,999 | 685 (6.4%) | 1,137 (14.3%) |
| $35,000 to $49,999 | 1,379 (12.9%) | 1,296 (16.3%) |
| $50,000 to $74,999 | 2,469 (23.2%) | 1,821 (22.9%) |
| $75,000 to $99,999 | 1,687 (15.8%) | 580 (7.3%) |
| $100,000 to $149,999 | 2,255 (21.1%) | 620 (7.8%) |
| $150,000 or more | 1,348 (12.6%) | 161 (2.0%) |
| Total | 10,664 (100.0%) | 7,939 (100.0%) |
Monthly Housing Cost Tiers in Fond Du Lac
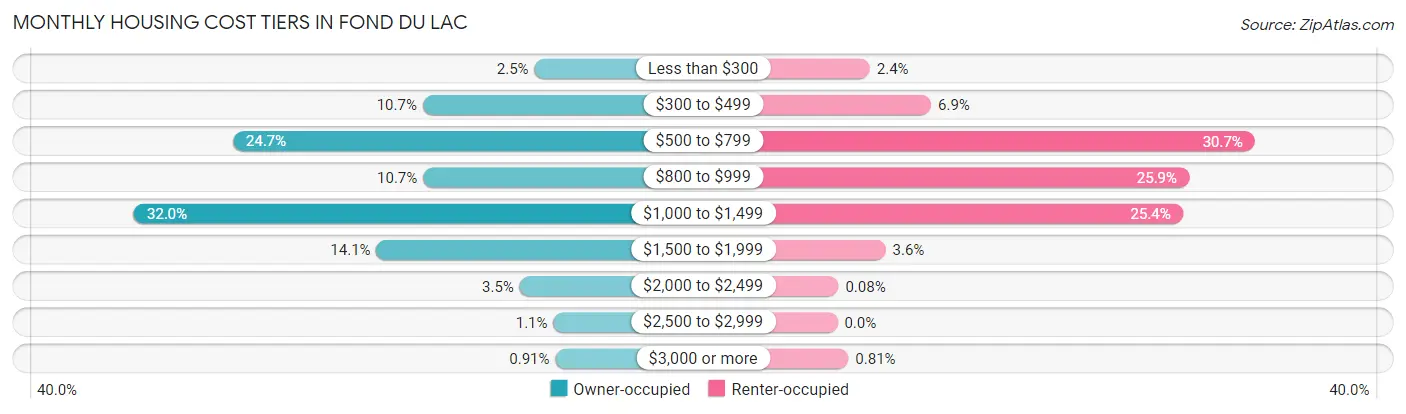
| Monthly Cost | Owner-occupied | Renter-occupied |
| Less than $300 | 261 (2.5%) | 190 (2.4%) |
| $300 to $499 | 1,139 (10.7%) | 548 (6.9%) |
| $500 to $799 | 2,630 (24.7%) | 2,440 (30.7%) |
| $800 to $999 | 1,136 (10.6%) | 2,055 (25.9%) |
| $1,000 to $1,499 | 3,407 (32.0%) | 2,018 (25.4%) |
| $1,500 to $1,999 | 1,503 (14.1%) | 282 (3.5%) |
| $2,000 to $2,499 | 378 (3.5%) | 6 (0.1%) |
| $2,500 to $2,999 | 113 (1.1%) | 0 (0.0%) |
| $3,000 or more | 97 (0.9%) | 64 (0.8%) |
| Total | 10,664 (100.0%) | 7,939 (100.0%) |
Physical Housing Characteristics in Fond Du Lac
Housing Structures in Fond Du Lac
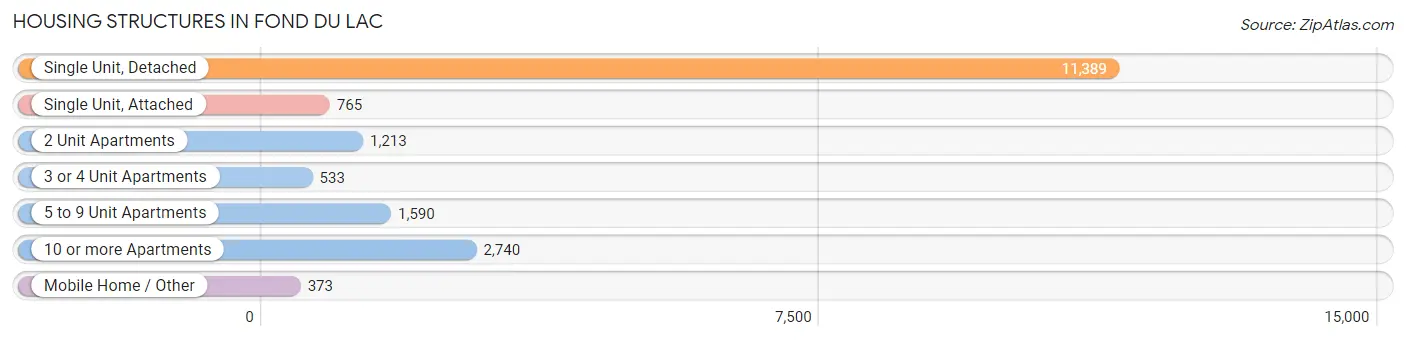
| Structure Type | # Housing Units | % Housing Units |
| Single Unit, Detached | 11,389 | 61.2% |
| Single Unit, Attached | 765 | 4.1% |
| 2 Unit Apartments | 1,213 | 6.5% |
| 3 or 4 Unit Apartments | 533 | 2.9% |
| 5 to 9 Unit Apartments | 1,590 | 8.6% |
| 10 or more Apartments | 2,740 | 14.7% |
| Mobile Home / Other | 373 | 2.0% |
| Total | 18,603 | 100.0% |
Housing Structures by Occupancy in Fond Du Lac
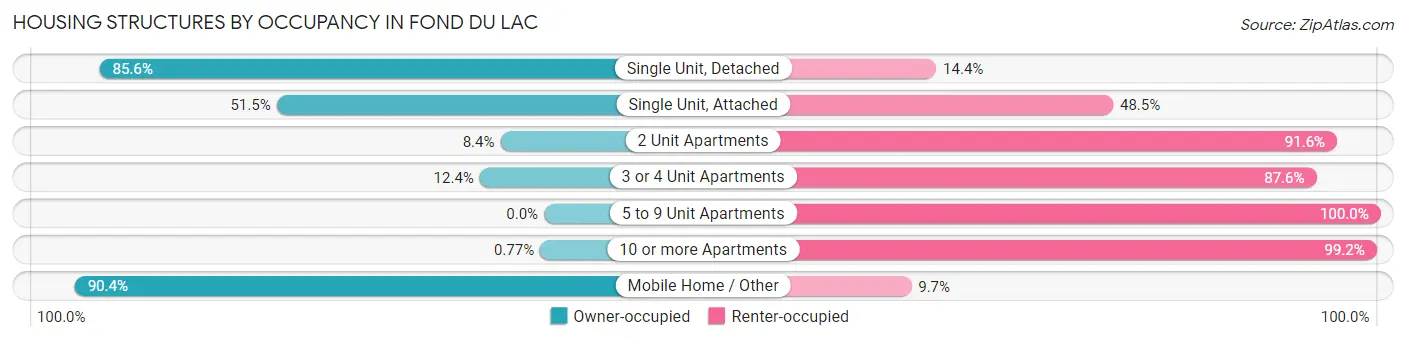
| Structure Type | Owner-occupied | Renter-occupied |
| Single Unit, Detached | 9,744 (85.6%) | 1,645 (14.4%) |
| Single Unit, Attached | 394 (51.5%) | 371 (48.5%) |
| 2 Unit Apartments | 102 (8.4%) | 1,111 (91.6%) |
| 3 or 4 Unit Apartments | 66 (12.4%) | 467 (87.6%) |
| 5 to 9 Unit Apartments | 0 (0.0%) | 1,590 (100.0%) |
| 10 or more Apartments | 21 (0.8%) | 2,719 (99.2%) |
| Mobile Home / Other | 337 (90.3%) | 36 (9.7%) |
| Total | 10,664 (57.3%) | 7,939 (42.7%) |
Housing Structures by Number of Rooms in Fond Du Lac
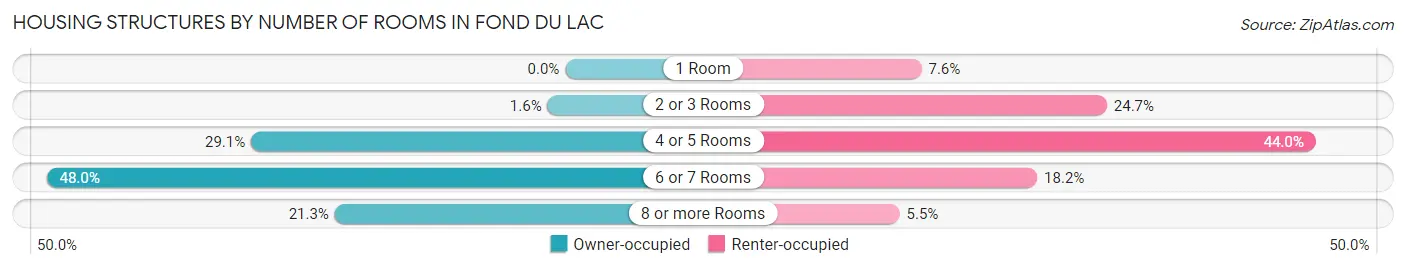
| Number of Rooms | Owner-occupied | Renter-occupied |
| 1 Room | 0 (0.0%) | 599 (7.5%) |
| 2 or 3 Rooms | 175 (1.6%) | 1,960 (24.7%) |
| 4 or 5 Rooms | 3,099 (29.1%) | 3,494 (44.0%) |
| 6 or 7 Rooms | 5,116 (48.0%) | 1,448 (18.2%) |
| 8 or more Rooms | 2,274 (21.3%) | 438 (5.5%) |
| Total | 10,664 (100.0%) | 7,939 (100.0%) |
Housing Structure by Heating Type in Fond Du Lac
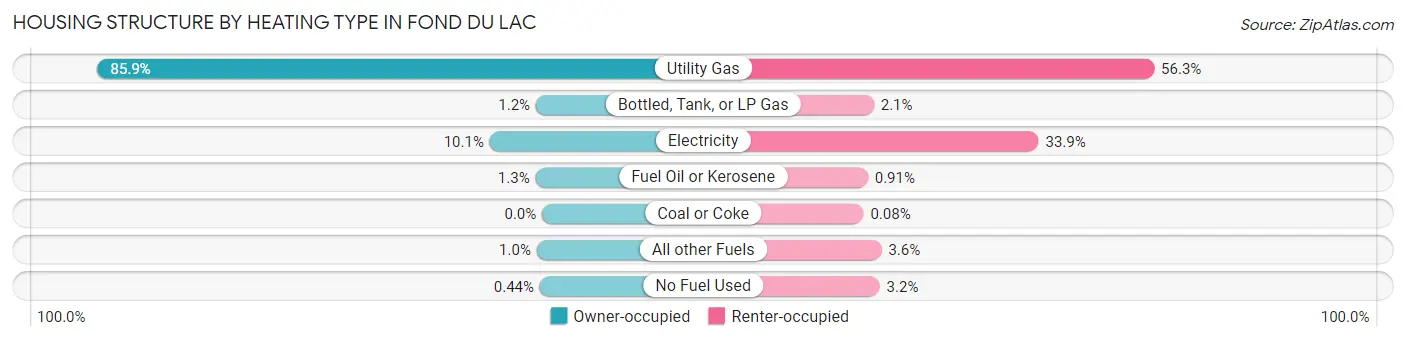
| Heating Type | Owner-occupied | Renter-occupied |
| Utility Gas | 9,163 (85.9%) | 4,466 (56.2%) |
| Bottled, Tank, or LP Gas | 128 (1.2%) | 164 (2.1%) |
| Electricity | 1,079 (10.1%) | 2,693 (33.9%) |
| Fuel Oil or Kerosene | 136 (1.3%) | 72 (0.9%) |
| Coal or Coke | 0 (0.0%) | 6 (0.1%) |
| All other Fuels | 111 (1.0%) | 283 (3.6%) |
| No Fuel Used | 47 (0.4%) | 255 (3.2%) |
| Total | 10,664 (100.0%) | 7,939 (100.0%) |
Household Vehicle Usage in Fond Du Lac
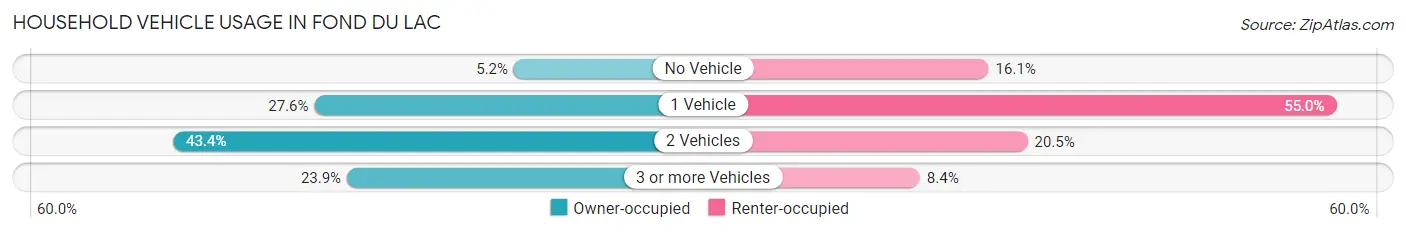
| Vehicles per Household | Owner-occupied | Renter-occupied |
| No Vehicle | 553 (5.2%) | 1,278 (16.1%) |
| 1 Vehicle | 2,938 (27.6%) | 4,370 (55.0%) |
| 2 Vehicles | 4,625 (43.4%) | 1,624 (20.5%) |
| 3 or more Vehicles | 2,548 (23.9%) | 667 (8.4%) |
| Total | 10,664 (100.0%) | 7,939 (100.0%) |
Real Estate & Mortgages in Fond Du Lac
Real Estate and Mortgage Overview in Fond Du Lac
| Characteristic | Without Mortgage | With Mortgage |
| Housing Units | 4,295 | 6,369 |
| Median Property Value | $148,500 | $148,600 |
| Median Household Income | $58,171 | $976 |
| Monthly Housing Costs | $582 | $97 |
| Real Estate Taxes | $3,121 | $27 |
Property Value by Mortgage Status in Fond Du Lac
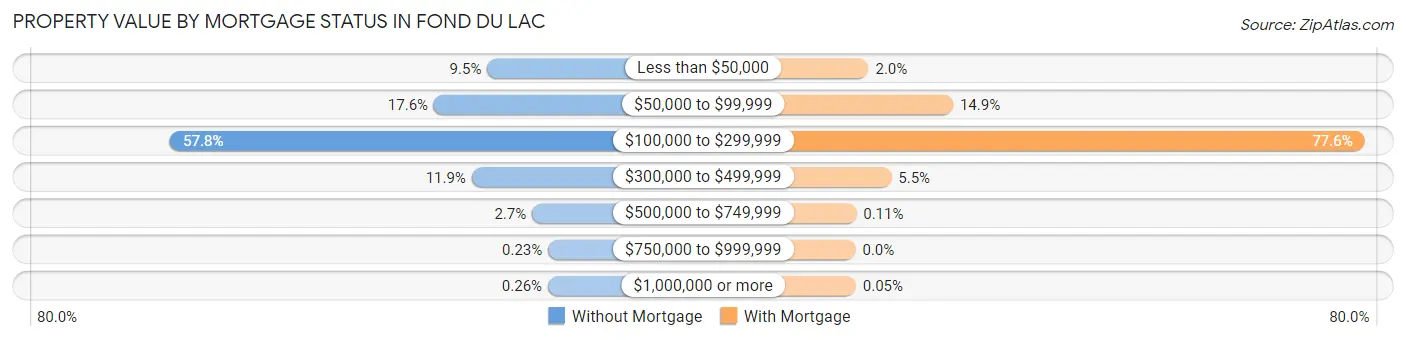
| Property Value | Without Mortgage | With Mortgage |
| Less than $50,000 | 408 (9.5%) | 126 (2.0%) |
| $50,000 to $99,999 | 757 (17.6%) | 946 (14.8%) |
| $100,000 to $299,999 | 2,484 (57.8%) | 4,939 (77.5%) |
| $300,000 to $499,999 | 510 (11.9%) | 348 (5.5%) |
| $500,000 to $749,999 | 115 (2.7%) | 7 (0.1%) |
| $750,000 to $999,999 | 10 (0.2%) | 0 (0.0%) |
| $1,000,000 or more | 11 (0.3%) | 3 (0.1%) |
| Total | 4,295 (100.0%) | 6,369 (100.0%) |
Household Income by Mortgage Status in Fond Du Lac
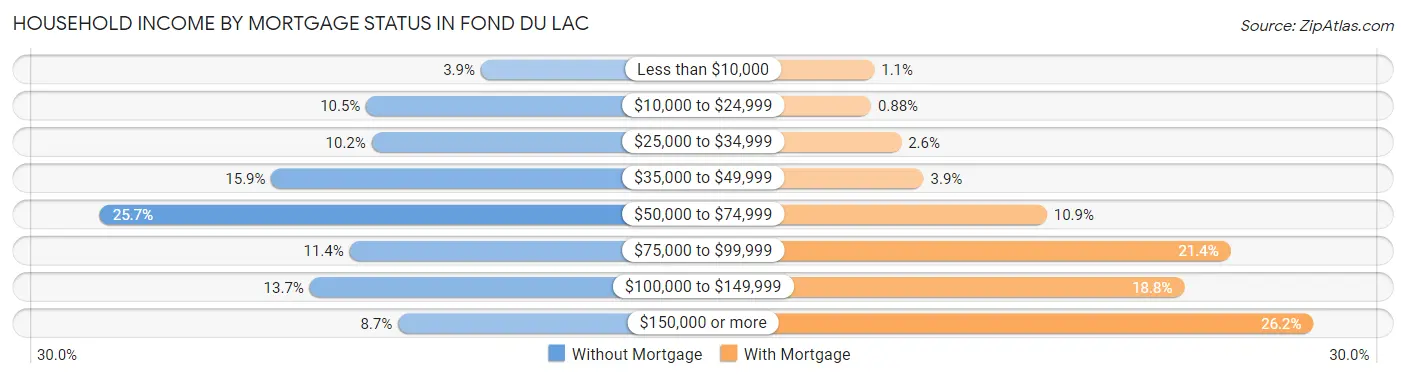
| Household Income | Without Mortgage | With Mortgage |
| Less than $10,000 | 169 (3.9%) | 68 (1.1%) |
| $10,000 to $24,999 | 450 (10.5%) | 56 (0.9%) |
| $25,000 to $34,999 | 437 (10.2%) | 166 (2.6%) |
| $35,000 to $49,999 | 683 (15.9%) | 248 (3.9%) |
| $50,000 to $74,999 | 1,104 (25.7%) | 696 (10.9%) |
| $75,000 to $99,999 | 491 (11.4%) | 1,365 (21.4%) |
| $100,000 to $149,999 | 589 (13.7%) | 1,196 (18.8%) |
| $150,000 or more | 372 (8.7%) | 1,666 (26.2%) |
| Total | 4,295 (100.0%) | 6,369 (100.0%) |
Property Value to Household Income Ratio in Fond Du Lac
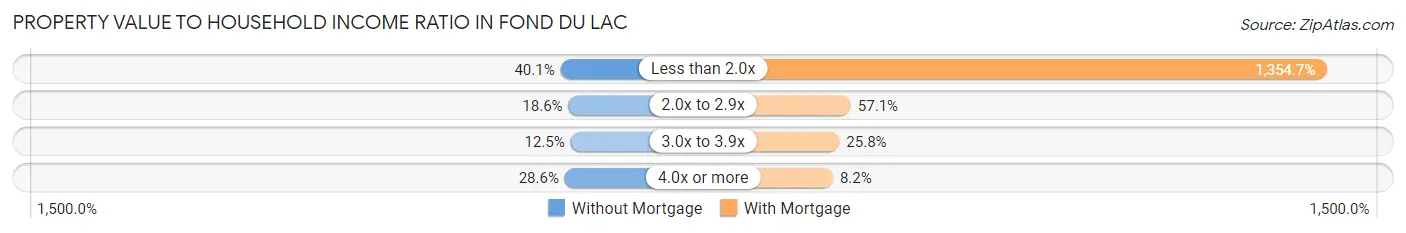
| Value-to-Income Ratio | Without Mortgage | With Mortgage |
| Less than 2.0x | 1,724 (40.1%) | 86,279 (1,354.7%) |
| 2.0x to 2.9x | 798 (18.6%) | 3,639 (57.1%) |
| 3.0x to 3.9x | 538 (12.5%) | 1,644 (25.8%) |
| 4.0x or more | 1,228 (28.6%) | 523 (8.2%) |
| Total | 4,295 (100.0%) | 6,369 (100.0%) |
Real Estate Taxes by Mortgage Status in Fond Du Lac
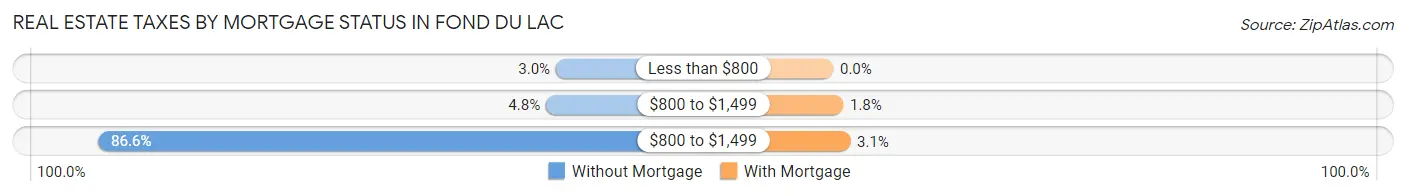
| Property Taxes | Without Mortgage | With Mortgage |
| Less than $800 | 127 (3.0%) | 0 (0.0%) |
| $800 to $1,499 | 205 (4.8%) | 116 (1.8%) |
| $800 to $1,499 | 3,718 (86.6%) | 199 (3.1%) |
| Total | 4,295 (100.0%) | 6,369 (100.0%) |
Health & Disability in Fond Du Lac
Health Insurance Coverage by Age in Fond Du Lac
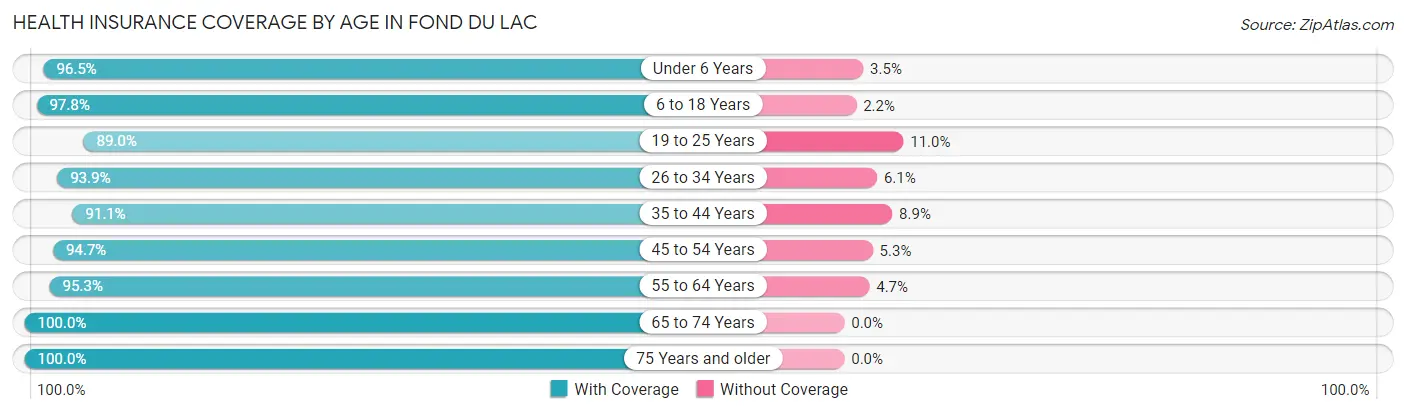
| Age Bracket | With Coverage | Without Coverage |
| Under 6 Years | 2,848 (96.5%) | 104 (3.5%) |
| 6 to 18 Years | 7,366 (97.8%) | 167 (2.2%) |
| 19 to 25 Years | 3,764 (89.0%) | 465 (11.0%) |
| 26 to 34 Years | 4,768 (93.9%) | 309 (6.1%) |
| 35 to 44 Years | 5,319 (91.1%) | 521 (8.9%) |
| 45 to 54 Years | 4,925 (94.7%) | 275 (5.3%) |
| 55 to 64 Years | 4,790 (95.3%) | 234 (4.7%) |
| 65 to 74 Years | 3,854 (100.0%) | 0 (0.0%) |
| 75 Years and older | 3,301 (100.0%) | 0 (0.0%) |
| Total | 40,935 (95.2%) | 2,075 (4.8%) |
Health Insurance Coverage by Citizenship Status in Fond Du Lac
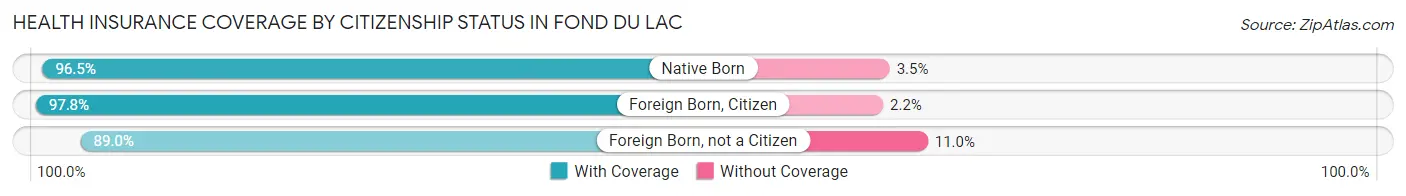
| Citizenship Status | With Coverage | Without Coverage |
| Native Born | 2,848 (96.5%) | 104 (3.5%) |
| Foreign Born, Citizen | 7,366 (97.8%) | 167 (2.2%) |
| Foreign Born, not a Citizen | 3,764 (89.0%) | 465 (11.0%) |
Health Insurance Coverage by Household Income in Fond Du Lac
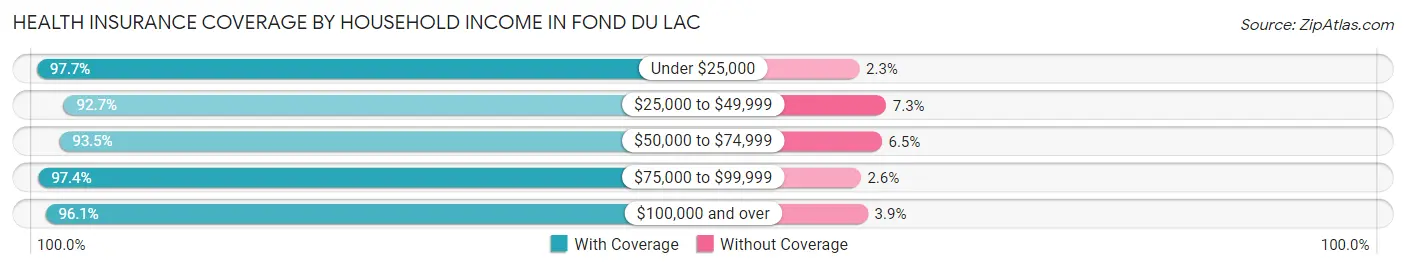
| Household Income | With Coverage | Without Coverage |
| Under $25,000 | 4,431 (97.7%) | 105 (2.3%) |
| $25,000 to $49,999 | 7,107 (92.7%) | 561 (7.3%) |
| $50,000 to $74,999 | 8,935 (93.5%) | 622 (6.5%) |
| $75,000 to $99,999 | 5,630 (97.4%) | 148 (2.6%) |
| $100,000 and over | 13,989 (96.1%) | 569 (3.9%) |
Public vs Private Health Insurance Coverage by Age in Fond Du Lac
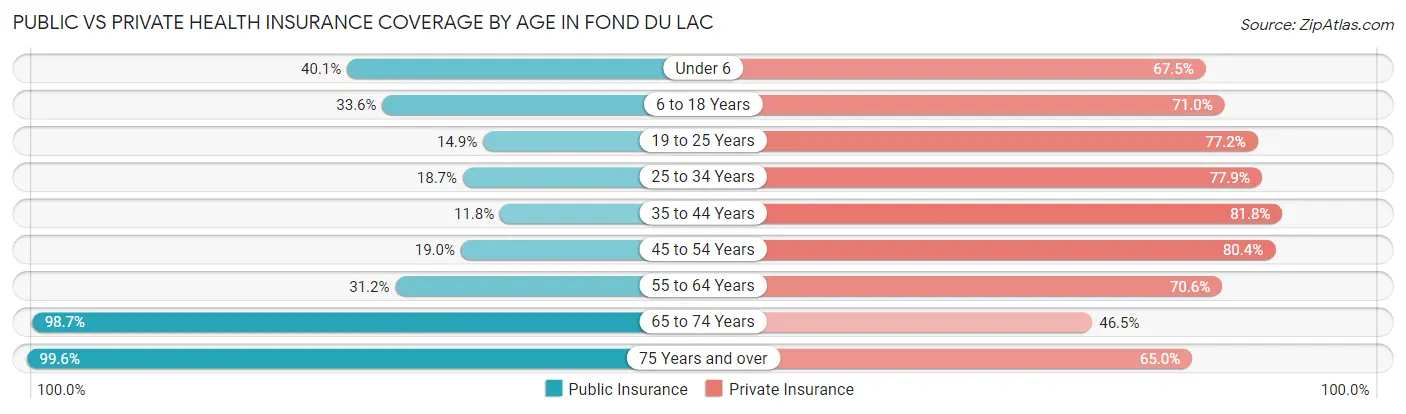
| Age Bracket | Public Insurance | Private Insurance |
| Under 6 | 1,185 (40.1%) | 1,993 (67.5%) |
| 6 to 18 Years | 2,530 (33.6%) | 5,351 (71.0%) |
| 19 to 25 Years | 630 (14.9%) | 3,263 (77.2%) |
| 25 to 34 Years | 947 (18.6%) | 3,957 (77.9%) |
| 35 to 44 Years | 686 (11.7%) | 4,774 (81.8%) |
| 45 to 54 Years | 990 (19.0%) | 4,181 (80.4%) |
| 55 to 64 Years | 1,567 (31.2%) | 3,546 (70.6%) |
| 65 to 74 Years | 3,803 (98.7%) | 1,792 (46.5%) |
| 75 Years and over | 3,289 (99.6%) | 2,146 (65.0%) |
| Total | 15,627 (36.3%) | 31,003 (72.1%) |
Disability Status by Sex by Age in Fond Du Lac
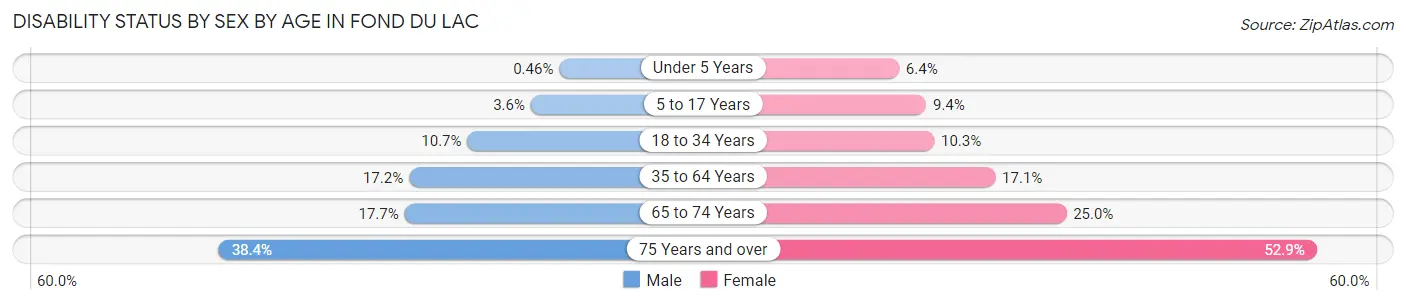
| Age Bracket | Male | Female |
| Under 5 Years | 6 (0.5%) | 75 (6.4%) |
| 5 to 17 Years | 126 (3.6%) | 365 (9.4%) |
| 18 to 34 Years | 502 (10.7%) | 540 (10.3%) |
| 35 to 64 Years | 1,441 (17.2%) | 1,312 (17.1%) |
| 65 to 74 Years | 337 (17.7%) | 487 (25.0%) |
| 75 Years and over | 456 (38.4%) | 1,117 (52.9%) |
Disability Class by Sex by Age in Fond Du Lac
Disability Class: Hearing Difficulty
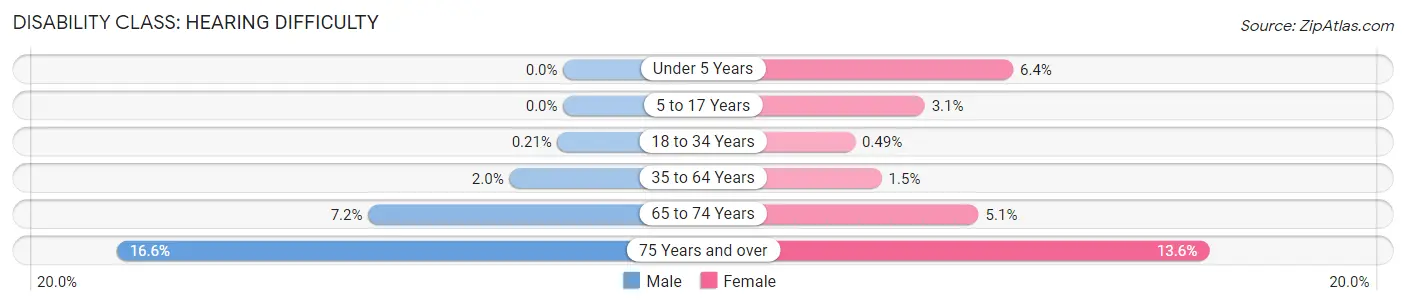
| Age Bracket | Male | Female |
| Under 5 Years | 0 (0.0%) | 75 (6.4%) |
| 5 to 17 Years | 0 (0.0%) | 120 (3.1%) |
| 18 to 34 Years | 10 (0.2%) | 26 (0.5%) |
| 35 to 64 Years | 168 (2.0%) | 114 (1.5%) |
| 65 to 74 Years | 138 (7.2%) | 99 (5.1%) |
| 75 Years and over | 197 (16.6%) | 288 (13.6%) |
Disability Class: Vision Difficulty
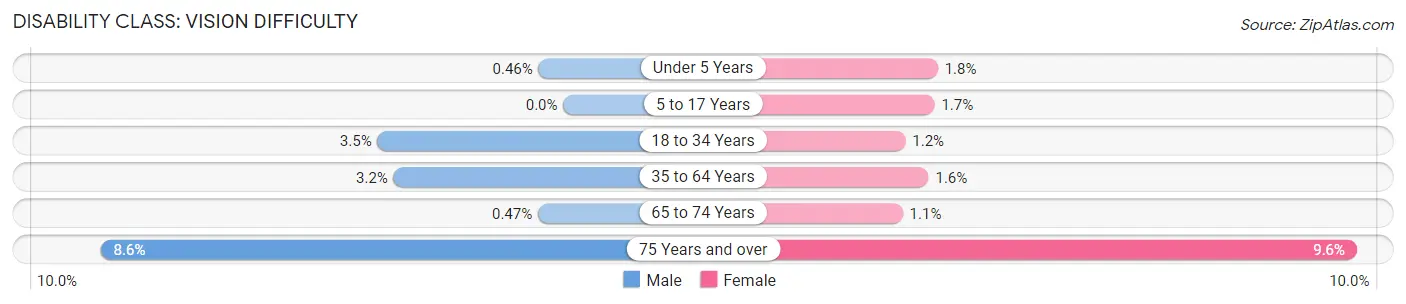
| Age Bracket | Male | Female |
| Under 5 Years | 6 (0.5%) | 21 (1.8%) |
| 5 to 17 Years | 0 (0.0%) | 67 (1.7%) |
| 18 to 34 Years | 162 (3.5%) | 62 (1.2%) |
| 35 to 64 Years | 264 (3.2%) | 124 (1.6%) |
| 65 to 74 Years | 9 (0.5%) | 22 (1.1%) |
| 75 Years and over | 102 (8.6%) | 202 (9.6%) |
Disability Class: Cognitive Difficulty
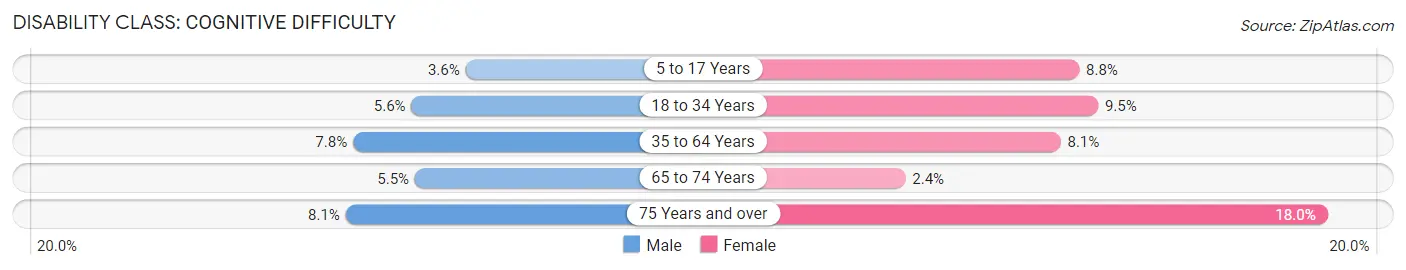
| Age Bracket | Male | Female |
| 5 to 17 Years | 126 (3.6%) | 343 (8.8%) |
| 18 to 34 Years | 265 (5.6%) | 500 (9.5%) |
| 35 to 64 Years | 655 (7.8%) | 624 (8.1%) |
| 65 to 74 Years | 105 (5.5%) | 46 (2.4%) |
| 75 Years and over | 96 (8.1%) | 381 (18.0%) |
Disability Class: Ambulatory Difficulty
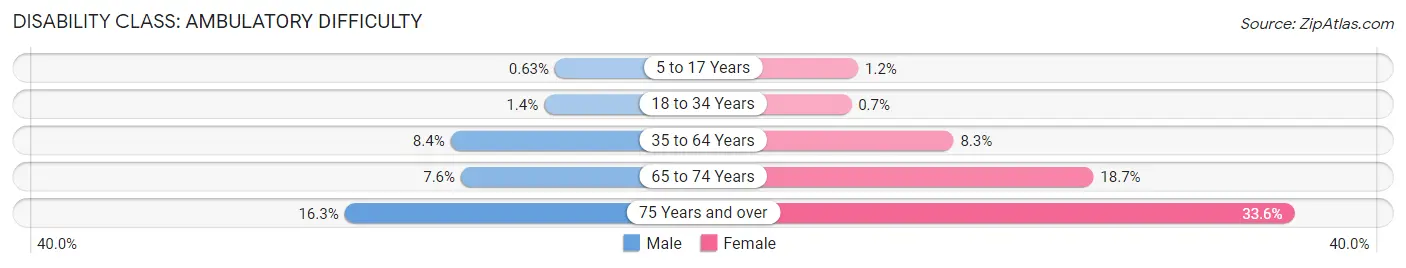
| Age Bracket | Male | Female |
| 5 to 17 Years | 22 (0.6%) | 47 (1.2%) |
| 18 to 34 Years | 67 (1.4%) | 37 (0.7%) |
| 35 to 64 Years | 702 (8.4%) | 637 (8.3%) |
| 65 to 74 Years | 145 (7.6%) | 364 (18.7%) |
| 75 Years and over | 193 (16.3%) | 710 (33.6%) |
Disability Class: Self-Care Difficulty
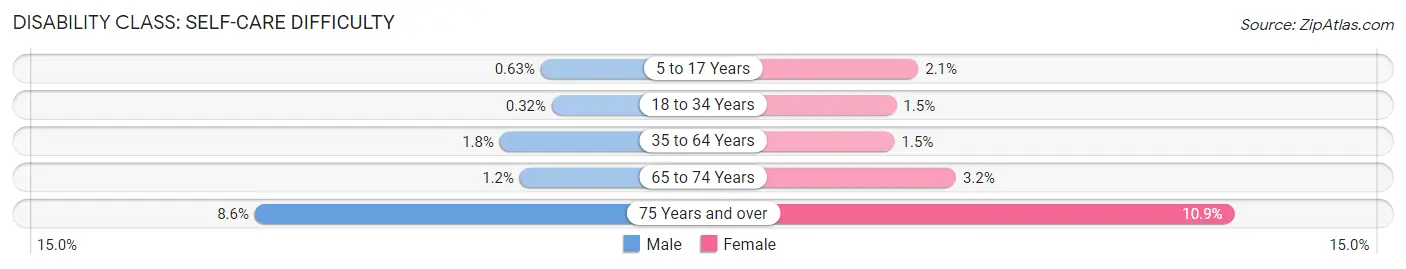
| Age Bracket | Male | Female |
| 5 to 17 Years | 22 (0.6%) | 83 (2.1%) |
| 18 to 34 Years | 15 (0.3%) | 80 (1.5%) |
| 35 to 64 Years | 148 (1.8%) | 113 (1.5%) |
| 65 to 74 Years | 23 (1.2%) | 62 (3.2%) |
| 75 Years and over | 102 (8.6%) | 231 (10.9%) |
Technology Access in Fond Du Lac
Computing Device Access in Fond Du Lac
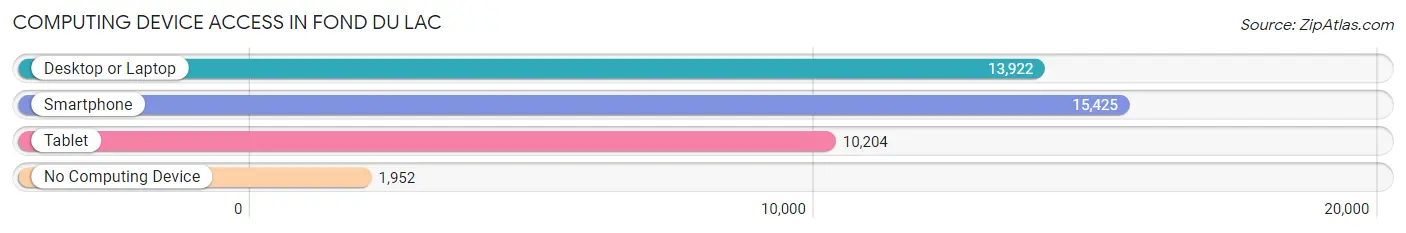
| Device Type | # Households | % Households |
| Desktop or Laptop | 13,922 | 74.8% |
| Smartphone | 15,425 | 82.9% |
| Tablet | 10,204 | 54.8% |
| No Computing Device | 1,952 | 10.5% |
| Total | 18,603 | 100.0% |
Internet Access in Fond Du Lac
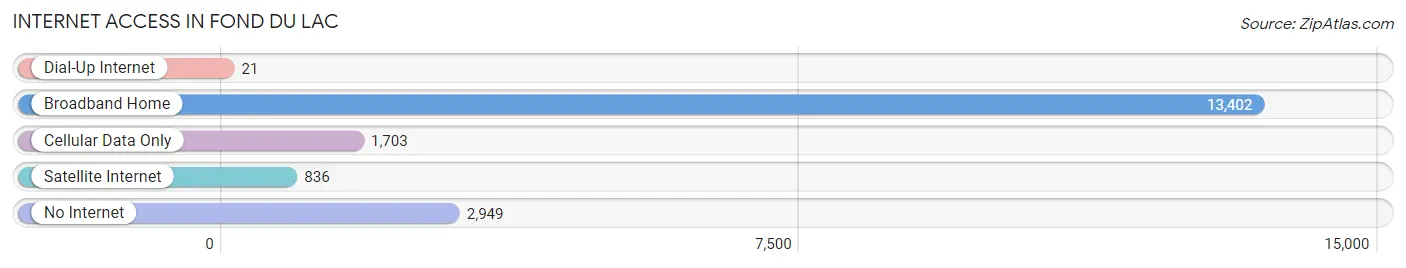
| Internet Type | # Households | % Households |
| Dial-Up Internet | 21 | 0.1% |
| Broadband Home | 13,402 | 72.0% |
| Cellular Data Only | 1,703 | 9.1% |
| Satellite Internet | 836 | 4.5% |
| No Internet | 2,949 | 15.9% |
| Total | 18,603 | 100.0% |
Fond Du Lac Summary
Fond du Lac, Wisconsin is a city located in Fond du Lac County, Wisconsin, United States. It is situated along the southern shore of Lake Winnebago, approximately 50 miles northwest of Milwaukee. As of the 2010 census, the city had a population of 43,021.
History
The area that is now Fond du Lac was first inhabited by the Menominee and Winnebago Native American tribes. The first European settlers arrived in the area in the early 19th century, and the city was officially incorporated in 1836. The city was named after the French phrase for “bottom of the lake”, referring to its location at the southern end of Lake Winnebago.
In the late 19th century, Fond du Lac became an important industrial center, with several factories and mills located in the city. The city was also home to several breweries, including the Fond du Lac Brewing Company, which was founded in 1856 and operated until the early 20th century.
Geography
Fond du Lac is located at 43°46′N 88°27′W (43.77, -88.45). According to the United States Census Bureau, the city has a total area of 16.2 square miles (41.8 km2), of which 15.7 square miles (40.7 km2) is land and 0.5 square miles (1.2 km2) is water.
The city is situated along the southern shore of Lake Winnebago, the largest lake in Wisconsin. The city is also located near the Fond du Lac River, which flows into the lake.
Economy
Fond du Lac’s economy is largely based on manufacturing and agriculture. The city is home to several large manufacturing companies, including Mercury Marine, which produces outboard motors, and Sargento Foods, which produces cheese and other dairy products.
Agriculture is also an important part of the local economy. The city is home to several large farms, which produce a variety of crops, including corn, soybeans, and wheat.
Demographics
As of the 2010 census, there were 43,021 people, 17,945 households, and 10,845 families residing in the city. The population density was 2,735.3 people per square mile (1,056.2/km2). There were 19,072 housing units at an average density of 1,210.3 per square mile (467.2/km2). The racial makeup of the city was 92.2% White, 2.3% African American, 0.4% Native American, 2.2% Asian, 0.1% Pacific Islander, 1.7% from other races, and 1.2% from two or more races. Hispanic or Latino of any race were 4.3% of the population.
There were 17,945 households, out of which 28.2% had children under the age of 18 living with them, 44.2% were married couples living together, 11.7% had a female householder with no husband present, and 39.7% were non-families. 33.2% of all households were made up of individuals, and 13.3% had someone living alone who was 65 years of age or older. The average household size was 2.30 and the average family size was 2.94.
In the city, the population was spread out, with 23.2% under the age of 18, 8.7% from 18 to 24, 28.2% from 25 to 44, 22.3% from 45 to 64, and 17.6% who were 65 years of age or older. The median age was 38 years. For every 100 females, there were 92.2 males. For every 100 females age 18 and over, there were 88.3 males.
The median income for a household in the city was $41,919, and the median income for a family was $52,890. Males had a median income of $37,945 versus $25,945 for females. The per capita income for the city was $21,890. About 5.2% of families and 8.2% of the population were below the poverty line, including 10.2% of those under age 18 and 7.2% of those age 65 or over.
Common Questions
What is Per Capita Income in Fond Du Lac?
Per Capita income in Fond Du Lac is $31,286.
What is the Median Family Income in Fond Du Lac?
Median Family Income in Fond Du Lac is $76,408.
What is the Median Household income in Fond Du Lac?
Median Household Income in Fond Du Lac is $58,675.
What is Income or Wage Gap in Fond Du Lac?
Income or Wage Gap in Fond Du Lac is 35.3%.
Women in Fond Du Lac earn 64.7 cents for every dollar earned by a man.
What is Family Income Deficit in Fond Du Lac?
Family Income Deficit in Fond Du Lac is $8,352.
Families that are below poverty line in Fond Du Lac earn $8,352 less on average than the poverty threshold level.
What is Inequality or Gini Index in Fond Du Lac?
Inequality or Gini Index in Fond Du Lac is 0.41.
What is the Total Population of Fond Du Lac?
Total Population of Fond Du Lac is 44,527.
What is the Total Male Population of Fond Du Lac?
Total Male Population of Fond Du Lac is 21,205.
What is the Total Female Population of Fond Du Lac?
Total Female Population of Fond Du Lac is 23,322.
What is the Ratio of Males per 100 Females in Fond Du Lac?
There are 90.92 Males per 100 Females in Fond Du Lac.
What is the Ratio of Females per 100 Males in Fond Du Lac?
There are 109.98 Females per 100 Males in Fond Du Lac.
What is the Median Population Age in Fond Du Lac?
Median Population Age in Fond Du Lac is 37.9 Years.
What is the Average Family Size in Fond Du Lac
Average Family Size in Fond Du Lac is 3.0 People.
What is the Average Household Size in Fond Du Lac
Average Household Size in Fond Du Lac is 2.3 People.
How Large is the Labor Force in Fond Du Lac?
There are 22,991 People in the Labor Forcein in Fond Du Lac.
What is the Percentage of People in the Labor Force in Fond Du Lac?
64.2% of People are in the Labor Force in Fond Du Lac.
What is the Unemployment Rate in Fond Du Lac?
Unemployment Rate in Fond Du Lac is 4.9%.