Lockwood, MT Map & Demographics
Lockwood Map
Lockwood Overview
$34,326
PER CAPITA INCOME
$81,109
AVG FAMILY INCOME
$73,625
AVG HOUSEHOLD INCOME
29.6%
WAGE / INCOME GAP [ % ]
70.4¢/ $1
WAGE / INCOME GAP [ $ ]
0.41
INEQUALITY / GINI INDEX
7,393
TOTAL POPULATION
3,785
MALE POPULATION
3,608
FEMALE POPULATION
104.91
MALES / 100 FEMALES
95.32
FEMALES / 100 MALES
35.4
MEDIAN AGE
3.0
AVG FAMILY SIZE
2.8
AVG HOUSEHOLD SIZE
4,080
LABOR FORCE [ PEOPLE ]
70.0%
PERCENT IN LABOR FORCE
3.8%
UNEMPLOYMENT RATE
Income in Lockwood
Income Overview in Lockwood
Per Capita Income in Lockwood is $34,326, while median incomes of families and households are $81,109 and $73,625 respectively.
| Characteristic | Number | Measure |
| Per Capita Income | 7,393 | $34,326 |
| Median Family Income | 2,103 | $81,109 |
| Mean Family Income | 2,103 | $96,526 |
| Median Household Income | 2,664 | $73,625 |
| Mean Household Income | 2,664 | $92,445 |
| Income Deficit | 2,103 | $0 |
| Wage / Income Gap (%) | 7,393 | 29.57% |
| Wage / Income Gap ($) | 7,393 | 70.43¢ per $1 |
| Gini / Inequality Index | 7,393 | 0.41 |
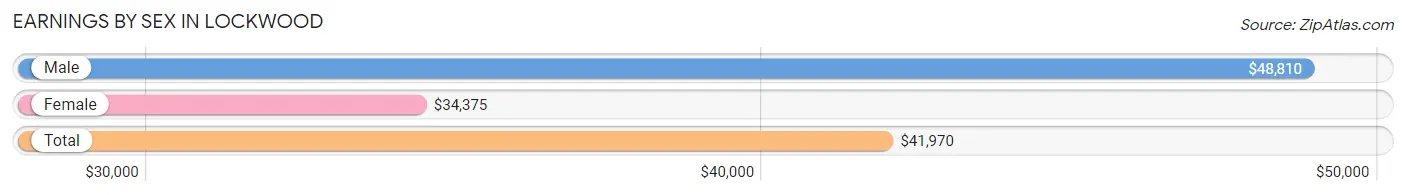
Earnings by Sex in Lockwood
Average Earnings in Lockwood are $41,970, $48,810 for men and $34,375 for women, a difference of 29.6%.
| Sex | Number | Average Earnings |
| Male | 2,312 (53.9%) | $48,810 |
| Female | 1,976 (46.1%) | $34,375 |
| Total | 4,288 (100.0%) | $41,970 |
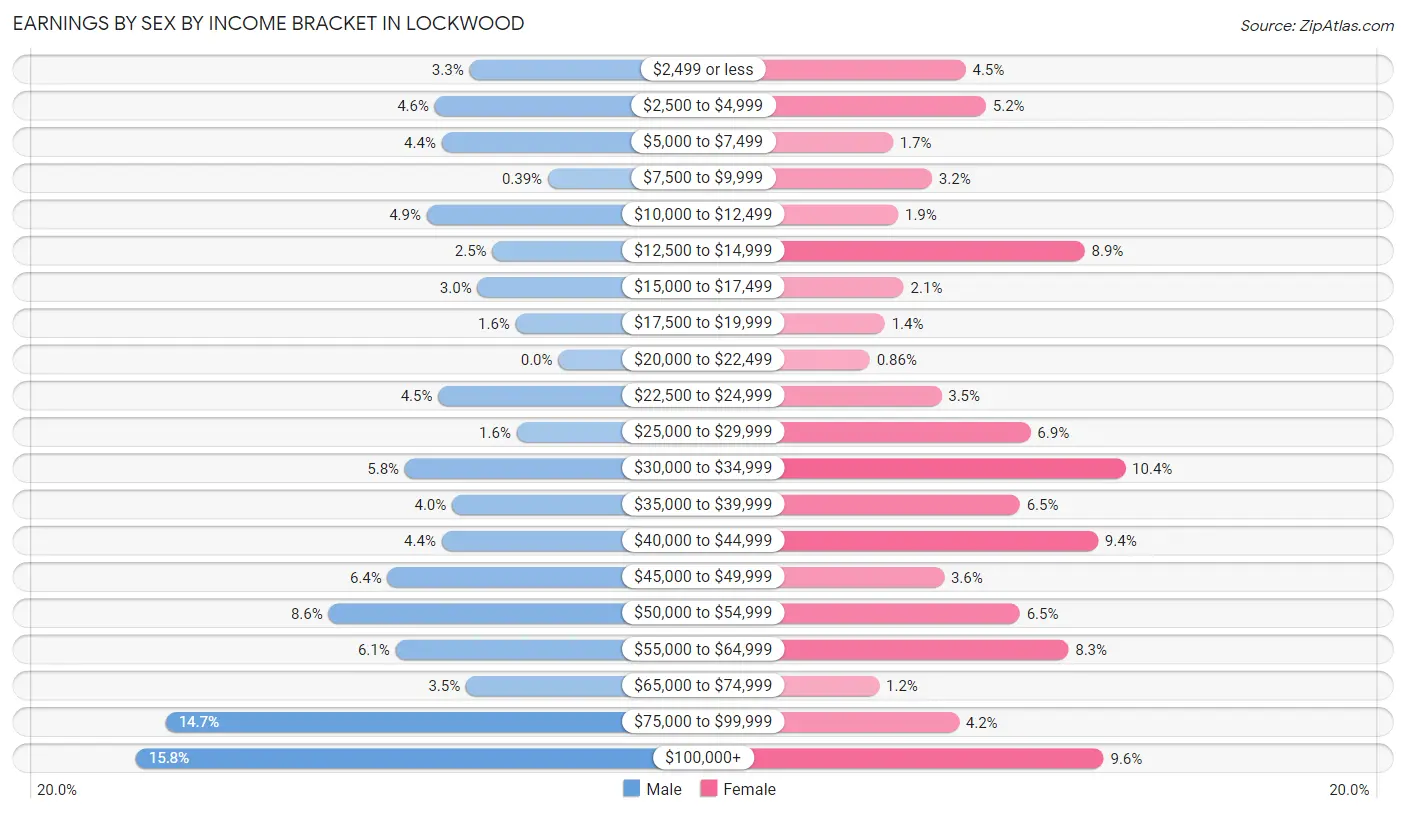
Earnings by Sex by Income Bracket in Lockwood
The most common earnings brackets in Lockwood are $100,000+ for men (366 | 15.8%) and $30,000 to $34,999 for women (206 | 10.4%).
| Income | Male | Female |
| $2,499 or less | 77 (3.3%) | 88 (4.4%) |
| $2,500 to $4,999 | 107 (4.6%) | 103 (5.2%) |
| $5,000 to $7,499 | 101 (4.4%) | 34 (1.7%) |
| $7,500 to $9,999 | 9 (0.4%) | 63 (3.2%) |
| $10,000 to $12,499 | 114 (4.9%) | 38 (1.9%) |
| $12,500 to $14,999 | 57 (2.5%) | 176 (8.9%) |
| $15,000 to $17,499 | 70 (3.0%) | 42 (2.1%) |
| $17,500 to $19,999 | 37 (1.6%) | 28 (1.4%) |
| $20,000 to $22,499 | 0 (0.0%) | 17 (0.9%) |
| $22,500 to $24,999 | 104 (4.5%) | 70 (3.5%) |
| $25,000 to $29,999 | 36 (1.6%) | 136 (6.9%) |
| $30,000 to $34,999 | 133 (5.8%) | 206 (10.4%) |
| $35,000 to $39,999 | 92 (4.0%) | 128 (6.5%) |
| $40,000 to $44,999 | 101 (4.4%) | 186 (9.4%) |
| $45,000 to $49,999 | 148 (6.4%) | 72 (3.6%) |
| $50,000 to $54,999 | 199 (8.6%) | 128 (6.5%) |
| $55,000 to $64,999 | 141 (6.1%) | 164 (8.3%) |
| $65,000 to $74,999 | 80 (3.5%) | 24 (1.2%) |
| $75,000 to $99,999 | 340 (14.7%) | 83 (4.2%) |
| $100,000+ | 366 (15.8%) | 190 (9.6%) |
| Total | 2,312 (100.0%) | 1,976 (100.0%) |
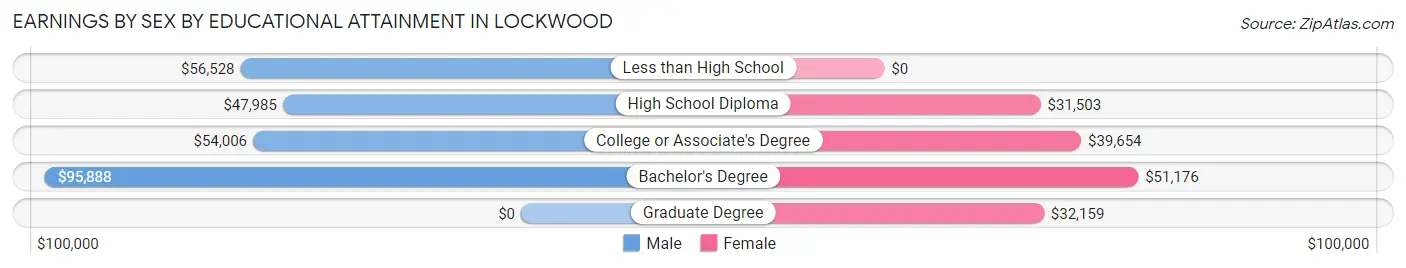
Earnings by Sex by Educational Attainment in Lockwood
Average earnings in Lockwood are $53,656 for men and $39,983 for women, a difference of 25.5%. Men with an educational attainment of bachelor's degree enjoy the highest average annual earnings of $95,888, while those with high school diploma education earn the least with $47,985. Women with an educational attainment of bachelor's degree earn the most with the average annual earnings of $51,176, while those with high school diploma education have the smallest earnings of $31,503.
| Educational Attainment | Male Income | Female Income |
| Less than High School | $56,528 | $0 |
| High School Diploma | $47,985 | $31,503 |
| College or Associate's Degree | $54,006 | $39,654 |
| Bachelor's Degree | $95,888 | $51,176 |
| Graduate Degree | - | - |
| Total | $53,656 | $39,983 |
Family Income in Lockwood
Family Income Brackets in Lockwood
According to the Lockwood family income data, there are 540 families falling into the $100,000 to $149,999 income range, which is the most common income bracket and makes up 25.7% of all families. Conversely, the less than $10,000 income bracket is the least frequent group with only 21 families (1.0%) belonging to this category.
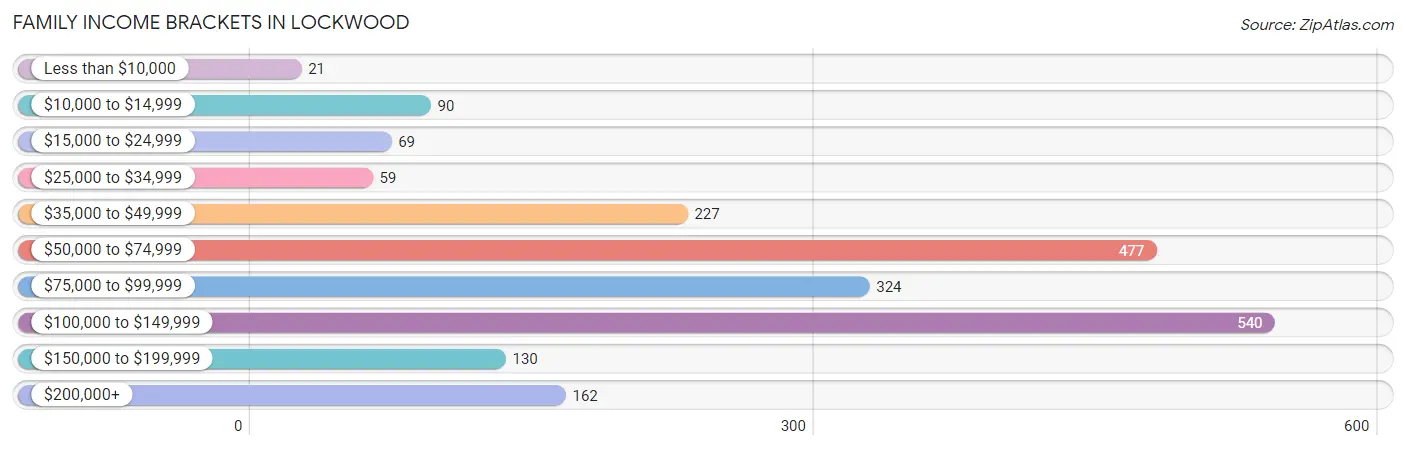
| Income Bracket | # Families | % Families |
| Less than $10,000 | 21 | 1.0% |
| $10,000 to $14,999 | 90 | 4.3% |
| $15,000 to $24,999 | 69 | 3.3% |
| $25,000 to $34,999 | 59 | 2.8% |
| $35,000 to $49,999 | 227 | 10.8% |
| $50,000 to $74,999 | 477 | 22.7% |
| $75,000 to $99,999 | 324 | 15.4% |
| $100,000 to $149,999 | 540 | 25.7% |
| $150,000 to $199,999 | 130 | 6.2% |
| $200,000+ | 162 | 7.7% |
Family Income by Famaliy Size in Lockwood
3-person families (554 | 26.3%) account for the highest median family income in Lockwood with $98,015 per family, while 2-person families (972 | 46.2%) have the highest median income of $39,844 per family member.
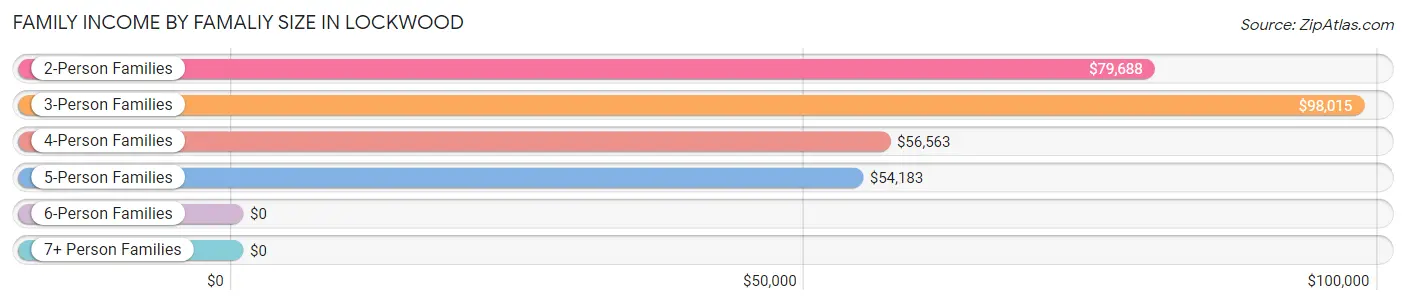
| Income Bracket | # Families | Median Income |
| 2-Person Families | 972 (46.2%) | $79,688 |
| 3-Person Families | 554 (26.3%) | $98,015 |
| 4-Person Families | 432 (20.5%) | $56,563 |
| 5-Person Families | 71 (3.4%) | $54,183 |
| 6-Person Families | 49 (2.3%) | $0 |
| 7+ Person Families | 25 (1.2%) | $0 |
| Total | 2,103 (100.0%) | $81,109 |
Family Income by Number of Earners in Lockwood
The median family income in Lockwood is $81,109, with families comprising 2 earners (908) having the highest median family income of $112,109, while families with 1 earner (763) have the lowest median family income of $54,391, accounting for 43.2% and 36.3% of families, respectively.
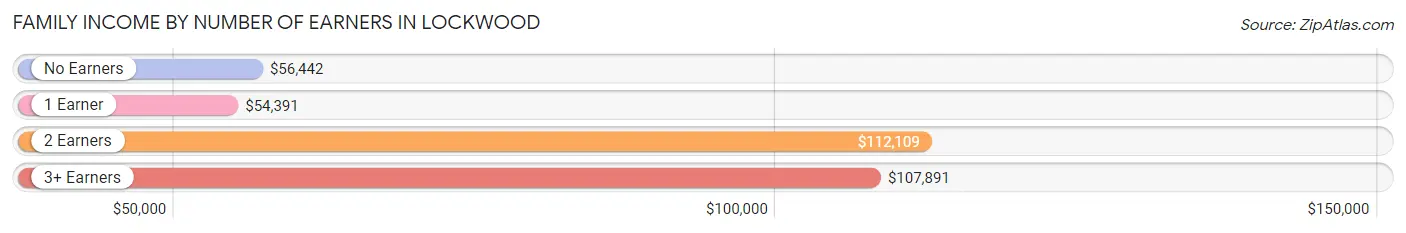
| Number of Earners | # Families | Median Income |
| No Earners | 201 (9.6%) | $56,442 |
| 1 Earner | 763 (36.3%) | $54,391 |
| 2 Earners | 908 (43.2%) | $112,109 |
| 3+ Earners | 231 (11.0%) | $107,891 |
| Total | 2,103 (100.0%) | $81,109 |
Household Income in Lockwood
Household Income Brackets in Lockwood
With 602 households falling in the category, the $50,000 to $74,999 income range is the most frequent in Lockwood, accounting for 22.6% of all households. In contrast, only 107 households (4.0%) fall into the $10,000 to $14,999 income bracket, making it the least populous group.
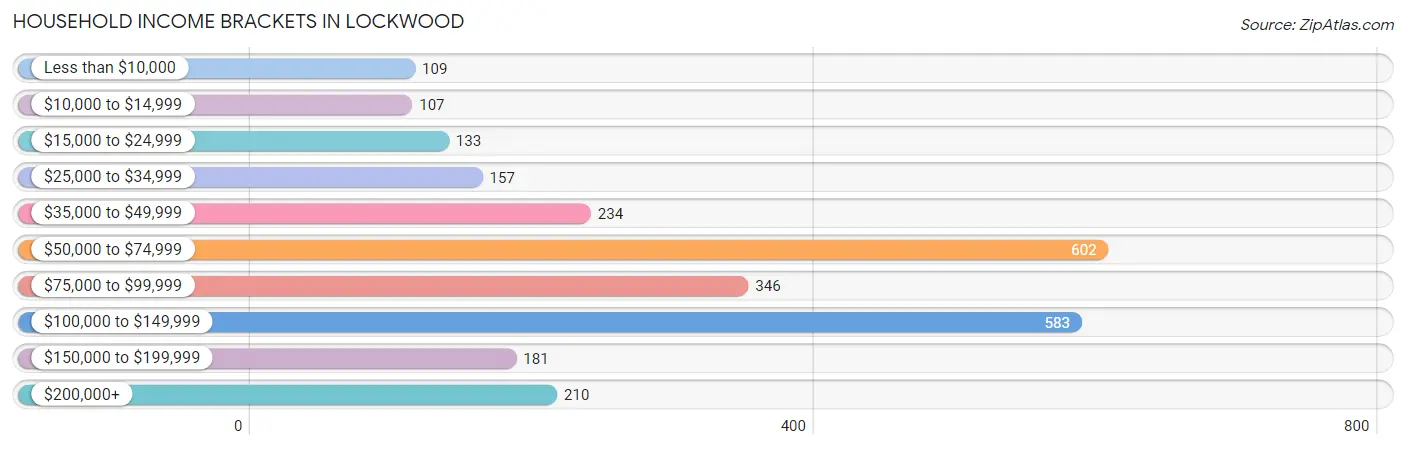
| Income Bracket | # Households | % Households |
| Less than $10,000 | 109 | 4.1% |
| $10,000 to $14,999 | 107 | 4.0% |
| $15,000 to $24,999 | 133 | 5.0% |
| $25,000 to $34,999 | 157 | 5.9% |
| $35,000 to $49,999 | 234 | 8.8% |
| $50,000 to $74,999 | 602 | 22.6% |
| $75,000 to $99,999 | 346 | 13.0% |
| $100,000 to $149,999 | 583 | 21.9% |
| $150,000 to $199,999 | 181 | 6.8% |
| $200,000+ | 210 | 7.9% |
Household Income by Householder Age in Lockwood
The median household income in Lockwood is $73,625, with the highest median household income of $103,851 found in the 45 to 64 years age bracket for the primary householder. A total of 924 households (34.7%) fall into this category. Meanwhile, the 15 to 24 years age bracket for the primary householder has the lowest median household income of $13,393, with 117 households (4.4%) in this group.
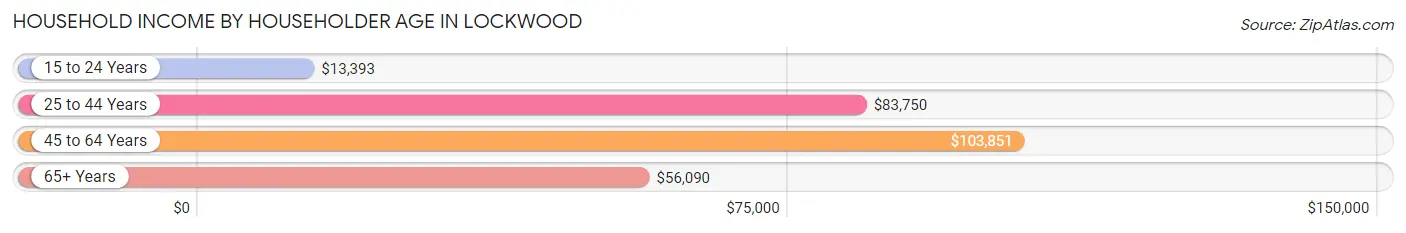
| Income Bracket | # Households | Median Income |
| 15 to 24 Years | 117 (4.4%) | $13,393 |
| 25 to 44 Years | 991 (37.2%) | $83,750 |
| 45 to 64 Years | 924 (34.7%) | $103,851 |
| 65+ Years | 632 (23.7%) | $56,090 |
| Total | 2,664 (100.0%) | $73,625 |
Poverty in Lockwood
Income Below Poverty by Sex and Age in Lockwood
With 12.6% poverty level for males and 14.0% for females among the residents of Lockwood, under 5 year old males and 18 to 24 year old females are the most vulnerable to poverty, with 100 males (35.1%) and 130 females (45.1%) in their respective age groups living below the poverty level.
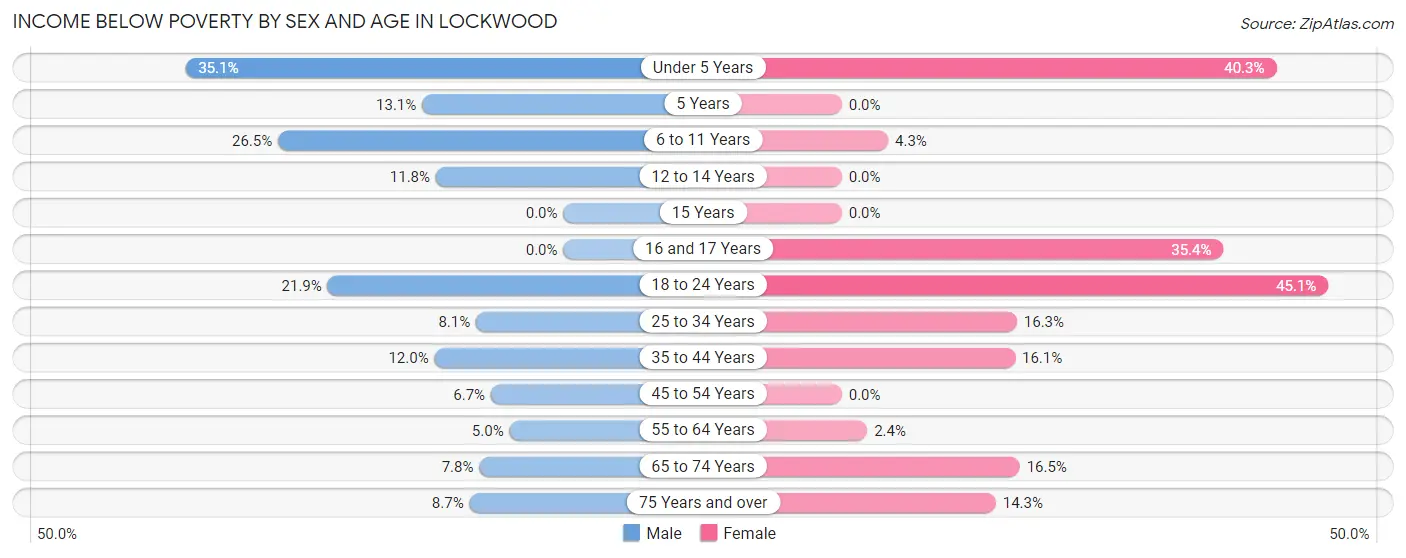
| Age Bracket | Male | Female |
| Under 5 Years | 100 (35.1%) | 50 (40.3%) |
| 5 Years | 8 (13.1%) | 0 (0.0%) |
| 6 to 11 Years | 67 (26.5%) | 16 (4.3%) |
| 12 to 14 Years | 33 (11.8%) | 0 (0.0%) |
| 15 Years | 0 (0.0%) | 0 (0.0%) |
| 16 and 17 Years | 0 (0.0%) | 40 (35.4%) |
| 18 to 24 Years | 63 (21.9%) | 130 (45.1%) |
| 25 to 34 Years | 55 (8.1%) | 103 (16.3%) |
| 35 to 44 Years | 55 (12.0%) | 69 (16.1%) |
| 45 to 54 Years | 35 (6.7%) | 0 (0.0%) |
| 55 to 64 Years | 17 (5.0%) | 10 (2.4%) |
| 65 to 74 Years | 22 (7.8%) | 54 (16.5%) |
| 75 Years and over | 23 (8.7%) | 25 (14.3%) |
| Total | 478 (12.6%) | 497 (14.0%) |
Income Above Poverty by Sex and Age in Lockwood
According to the poverty statistics in Lockwood, males aged 16 and 17 years and females aged 5 years are the age groups that are most secure financially, with 100.0% of males and 100.0% of females in these age groups living above the poverty line.
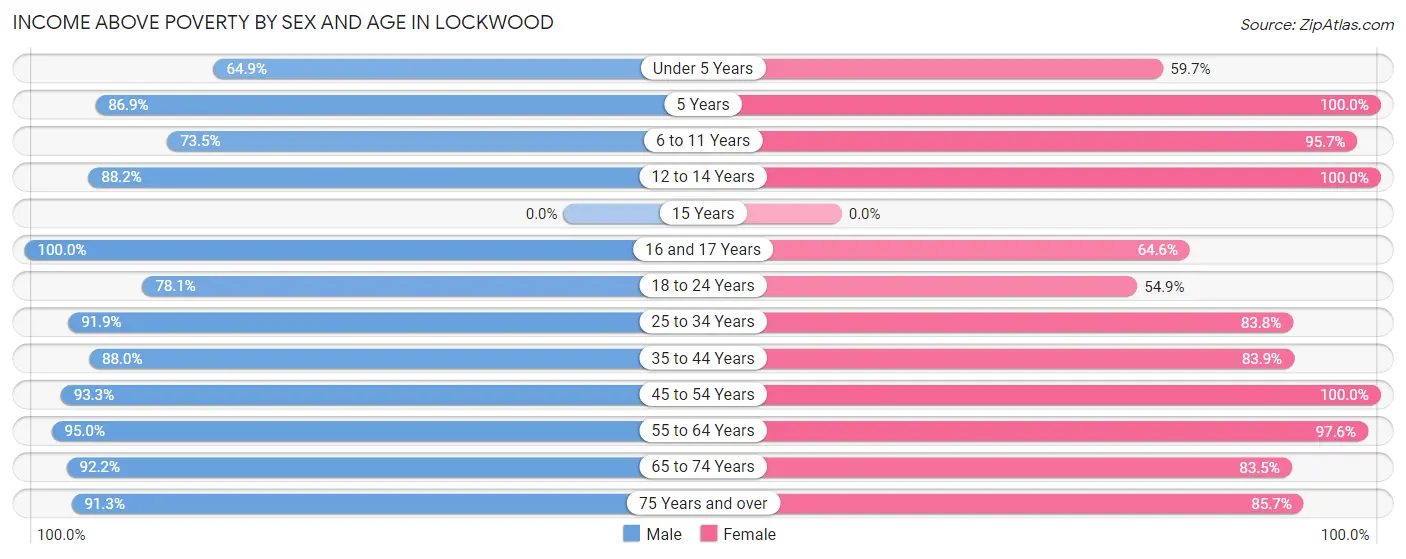
| Age Bracket | Male | Female |
| Under 5 Years | 185 (64.9%) | 74 (59.7%) |
| 5 Years | 53 (86.9%) | 49 (100.0%) |
| 6 to 11 Years | 186 (73.5%) | 356 (95.7%) |
| 12 to 14 Years | 246 (88.2%) | 111 (100.0%) |
| 15 Years | 0 (0.0%) | 0 (0.0%) |
| 16 and 17 Years | 73 (100.0%) | 73 (64.6%) |
| 18 to 24 Years | 225 (78.1%) | 158 (54.9%) |
| 25 to 34 Years | 624 (91.9%) | 531 (83.8%) |
| 35 to 44 Years | 405 (88.0%) | 360 (83.9%) |
| 45 to 54 Years | 486 (93.3%) | 516 (100.0%) |
| 55 to 64 Years | 323 (95.0%) | 413 (97.6%) |
| 65 to 74 Years | 260 (92.2%) | 273 (83.5%) |
| 75 Years and over | 241 (91.3%) | 150 (85.7%) |
| Total | 3,307 (87.4%) | 3,064 (86.0%) |
Income Below Poverty Among Married-Couple Families in Lockwood
The poverty statistics for married-couple families in Lockwood show that 3.1% or 46 of the total 1,465 families live below the poverty line. Families with 1 or 2 children have the highest poverty rate of 4.5%, comprising of 18 families. On the other hand, families with 3 or 4 children have the lowest poverty rate of 0.0%, which includes 0 families.
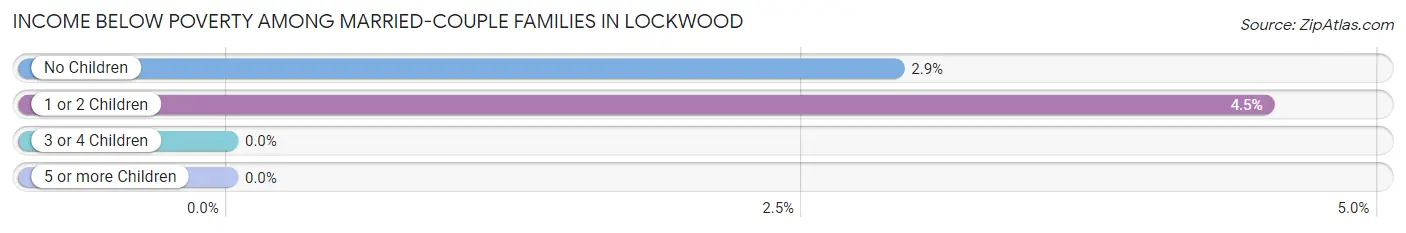
| Children | Above Poverty | Below Poverty |
| No Children | 938 (97.1%) | 28 (2.9%) |
| 1 or 2 Children | 381 (95.5%) | 18 (4.5%) |
| 3 or 4 Children | 85 (100.0%) | 0 (0.0%) |
| 5 or more Children | 15 (100.0%) | 0 (0.0%) |
| Total | 1,419 (96.9%) | 46 (3.1%) |
Income Below Poverty Among Single-Parent Households in Lockwood
According to the poverty data in Lockwood, 11.3% or 27 single-father households and 36.5% or 146 single-mother households are living below the poverty line. Among single-father households, those with 3 or 4 children have the highest poverty rate, with 27 households (36.5%) experiencing poverty. Likewise, among single-mother households, those with 3 or 4 children have the highest poverty rate, with 48 households (48.5%) falling below the poverty line.
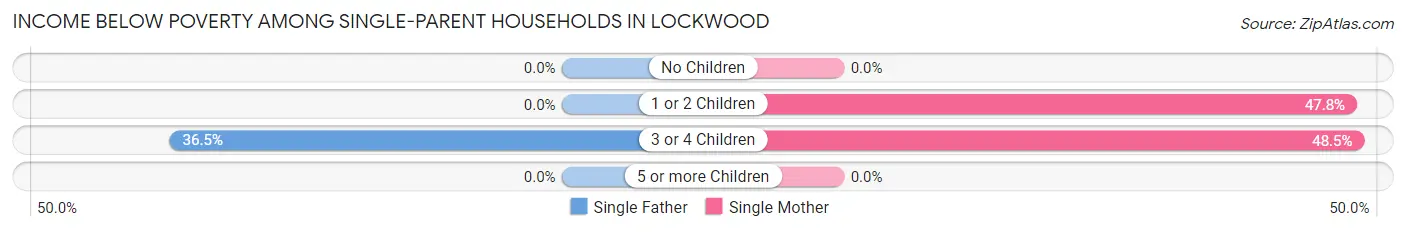
| Children | Single Father | Single Mother |
| No Children | 0 (0.0%) | 0 (0.0%) |
| 1 or 2 Children | 0 (0.0%) | 98 (47.8%) |
| 3 or 4 Children | 27 (36.5%) | 48 (48.5%) |
| 5 or more Children | 0 (0.0%) | 0 (0.0%) |
| Total | 27 (11.3%) | 146 (36.5%) |
Income Below Poverty Among Married-Couple vs Single-Parent Households in Lockwood
The poverty data for Lockwood shows that 46 of the married-couple family households (3.1%) and 173 of the single-parent households (27.1%) are living below the poverty level. Within the married-couple family households, those with 1 or 2 children have the highest poverty rate, with 18 households (4.5%) falling below the poverty line. Among the single-parent households, those with 3 or 4 children have the highest poverty rate, with 75 household (43.3%) living below poverty.
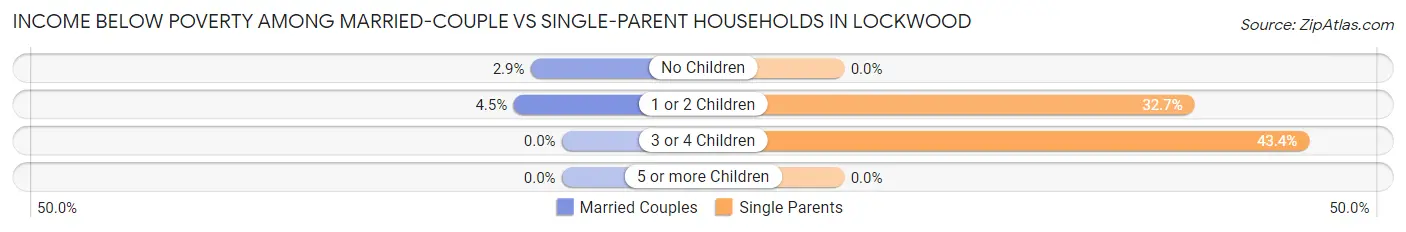
| Children | Married-Couple Families | Single-Parent Households |
| No Children | 28 (2.9%) | 0 (0.0%) |
| 1 or 2 Children | 18 (4.5%) | 98 (32.7%) |
| 3 or 4 Children | 0 (0.0%) | 75 (43.3%) |
| 5 or more Children | 0 (0.0%) | 0 (0.0%) |
| Total | 46 (3.1%) | 173 (27.1%) |
Race in Lockwood
The most populous races in Lockwood are White / Caucasian (6,553 | 88.6%), Hispanic or Latino (589 | 8.0%), and Two or more Races (516 | 7.0%).
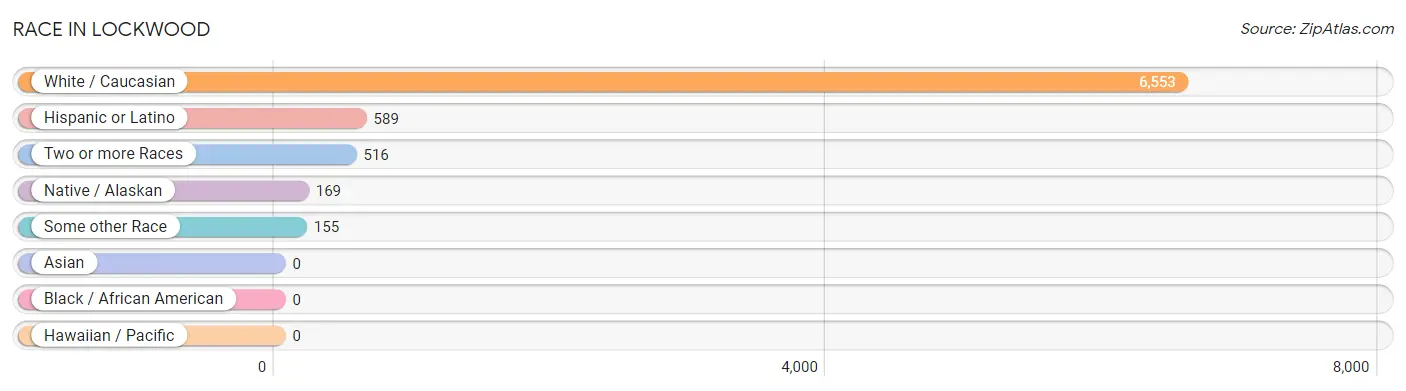
| Race | # Population | % Population |
| Asian | 0 | 0.0% |
| Black / African American | 0 | 0.0% |
| Hawaiian / Pacific | 0 | 0.0% |
| Hispanic or Latino | 589 | 8.0% |
| Native / Alaskan | 169 | 2.3% |
| White / Caucasian | 6,553 | 88.6% |
| Two or more Races | 516 | 7.0% |
| Some other Race | 155 | 2.1% |
| Total | 7,393 | 100.0% |
Ancestry in Lockwood
The most populous ancestries reported in Lockwood are German (1,744 | 23.6%), Irish (1,235 | 16.7%), English (639 | 8.6%), Norwegian (567 | 7.7%), and Mexican (442 | 6.0%), together accounting for 62.6% of all Lockwood residents.
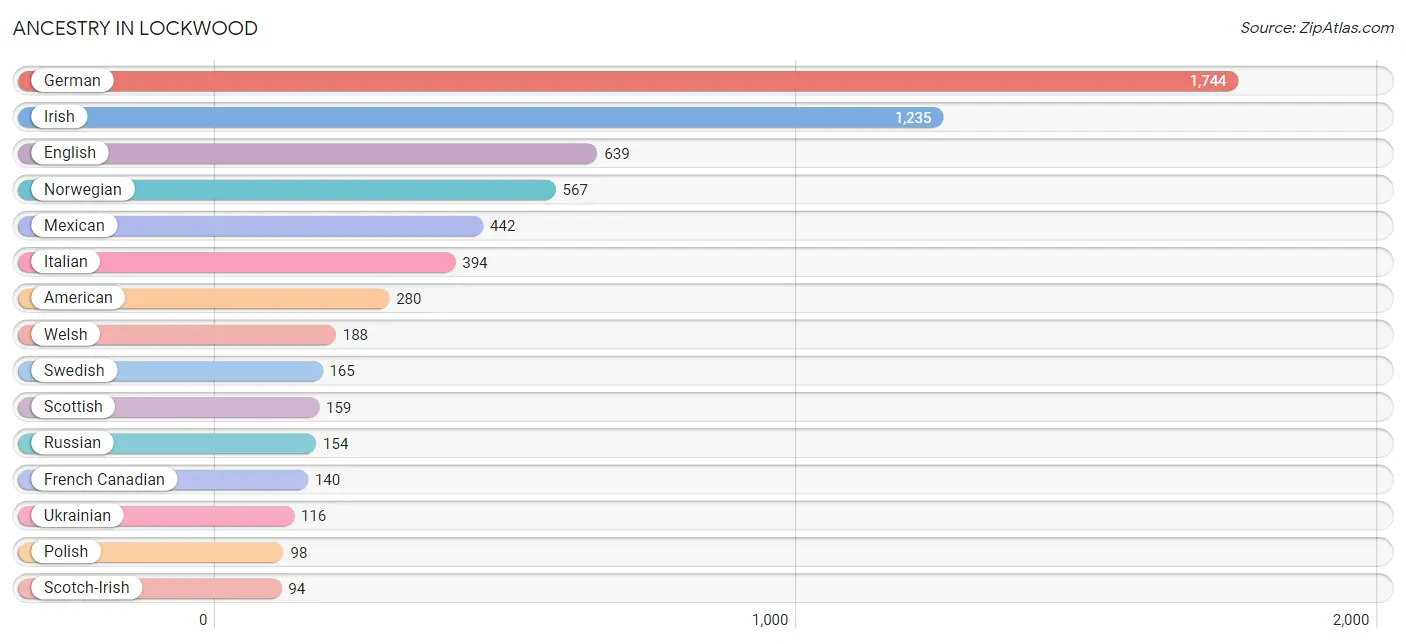
| Ancestry | # Population | % Population |
| African | 31 | 0.4% |
| American | 280 | 3.8% |
| Arab | 65 | 0.9% |
| Austrian | 9 | 0.1% |
| Bhutanese | 63 | 0.9% |
| British | 6 | 0.1% |
| Canadian | 1 | 0.0% |
| Central American | 9 | 0.1% |
| Chippewa | 51 | 0.7% |
| Croatian | 8 | 0.1% |
| Crow | 45 | 0.6% |
| Dutch | 5 | 0.1% |
| Egyptian | 65 | 0.9% |
| English | 639 | 8.6% |
| European | 81 | 1.1% |
| Finnish | 57 | 0.8% |
| French | 75 | 1.0% |
| French Canadian | 140 | 1.9% |
| German | 1,744 | 23.6% |
| Greek | 8 | 0.1% |
| Honduran | 9 | 0.1% |
| Hungarian | 1 | 0.0% |
| Irish | 1,235 | 16.7% |
| Italian | 394 | 5.3% |
| Lithuanian | 9 | 0.1% |
| Mexican | 442 | 6.0% |
| Norwegian | 567 | 7.7% |
| Paraguayan | 34 | 0.5% |
| Pennsylvania German | 1 | 0.0% |
| Peruvian | 31 | 0.4% |
| Polish | 98 | 1.3% |
| Portuguese | 19 | 0.3% |
| Russian | 154 | 2.1% |
| Scandinavian | 61 | 0.8% |
| Scotch-Irish | 94 | 1.3% |
| Scottish | 159 | 2.1% |
| Sioux | 24 | 0.3% |
| Slovene | 23 | 0.3% |
| South American | 65 | 0.9% |
| Spaniard | 30 | 0.4% |
| Spanish | 21 | 0.3% |
| Subsaharan African | 31 | 0.4% |
| Swedish | 165 | 2.2% |
| Ukrainian | 116 | 1.6% |
| Welsh | 188 | 2.5% | View All 45 Rows |
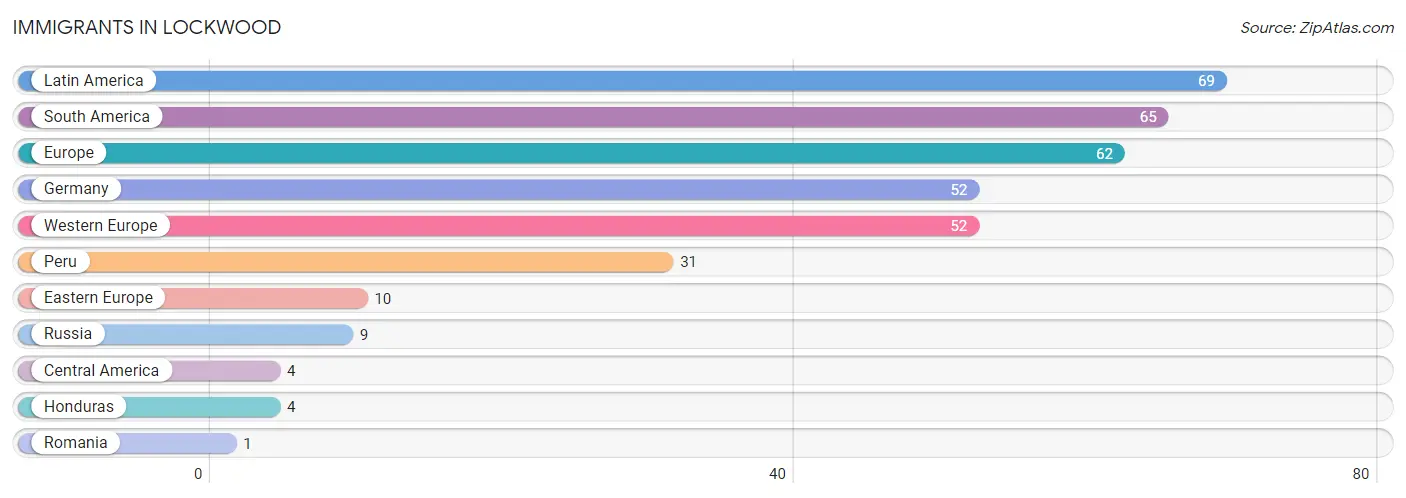
Immigrants in Lockwood
The most numerous immigrant groups reported in Lockwood came from Latin America (69 | 0.9%), South America (65 | 0.9%), Europe (62 | 0.8%), Germany (52 | 0.7%), and Western Europe (52 | 0.7%), together accounting for 4.0% of all Lockwood residents.
| Immigration Origin | # Population | % Population |
| Central America | 4 | 0.1% |
| Eastern Europe | 10 | 0.1% |
| Europe | 62 | 0.8% |
| Germany | 52 | 0.7% |
| Honduras | 4 | 0.1% |
| Latin America | 69 | 0.9% |
| Peru | 31 | 0.4% |
| Romania | 1 | 0.0% |
| Russia | 9 | 0.1% |
| South America | 65 | 0.9% |
| Western Europe | 52 | 0.7% | View All 11 Rows |
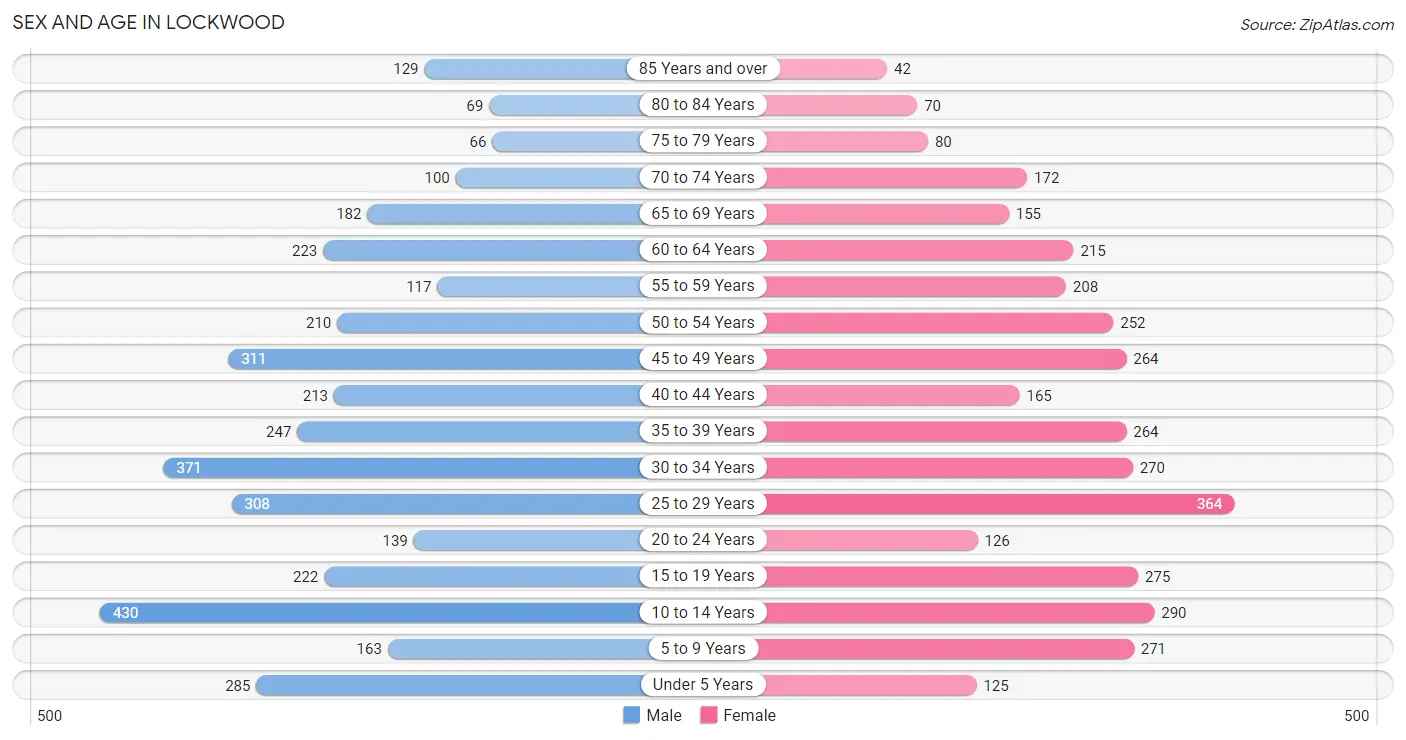
Sex and Age in Lockwood
Sex and Age in Lockwood
The most populous age groups in Lockwood are 10 to 14 Years (430 | 11.4%) for men and 25 to 29 Years (364 | 10.1%) for women.
| Age Bracket | Male | Female |
| Under 5 Years | 285 (7.5%) | 125 (3.5%) |
| 5 to 9 Years | 163 (4.3%) | 271 (7.5%) |
| 10 to 14 Years | 430 (11.4%) | 290 (8.0%) |
| 15 to 19 Years | 222 (5.9%) | 275 (7.6%) |
| 20 to 24 Years | 139 (3.7%) | 126 (3.5%) |
| 25 to 29 Years | 308 (8.1%) | 364 (10.1%) |
| 30 to 34 Years | 371 (9.8%) | 270 (7.5%) |
| 35 to 39 Years | 247 (6.5%) | 264 (7.3%) |
| 40 to 44 Years | 213 (5.6%) | 165 (4.6%) |
| 45 to 49 Years | 311 (8.2%) | 264 (7.3%) |
| 50 to 54 Years | 210 (5.6%) | 252 (7.0%) |
| 55 to 59 Years | 117 (3.1%) | 208 (5.8%) |
| 60 to 64 Years | 223 (5.9%) | 215 (6.0%) |
| 65 to 69 Years | 182 (4.8%) | 155 (4.3%) |
| 70 to 74 Years | 100 (2.6%) | 172 (4.8%) |
| 75 to 79 Years | 66 (1.7%) | 80 (2.2%) |
| 80 to 84 Years | 69 (1.8%) | 70 (1.9%) |
| 85 Years and over | 129 (3.4%) | 42 (1.2%) |
| Total | 3,785 (100.0%) | 3,608 (100.0%) |
Families and Households in Lockwood
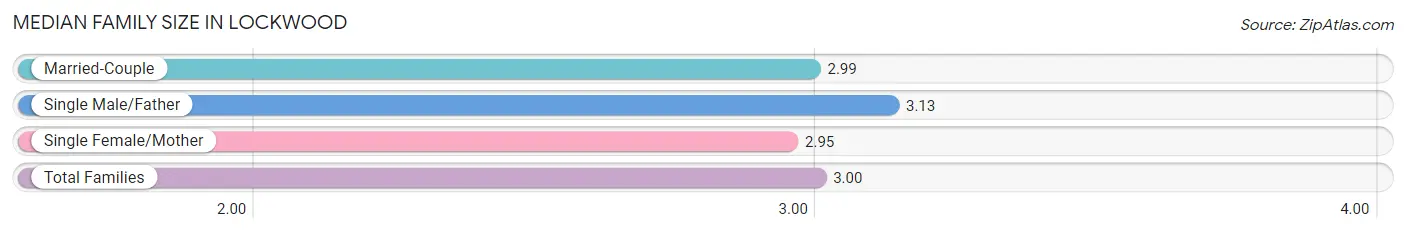
Median Family Size in Lockwood
The median family size in Lockwood is 3.00 persons per family, with single male/father families (238 | 11.3%) accounting for the largest median family size of 3.13 persons per family. On the other hand, single female/mother families (400 | 19.0%) represent the smallest median family size with 2.95 persons per family.
| Family Type | # Families | Family Size |
| Married-Couple | 1,465 (69.7%) | 2.99 |
| Single Male/Father | 238 (11.3%) | 3.13 |
| Single Female/Mother | 400 (19.0%) | 2.95 |
| Total Families | 2,103 (100.0%) | 3.00 |
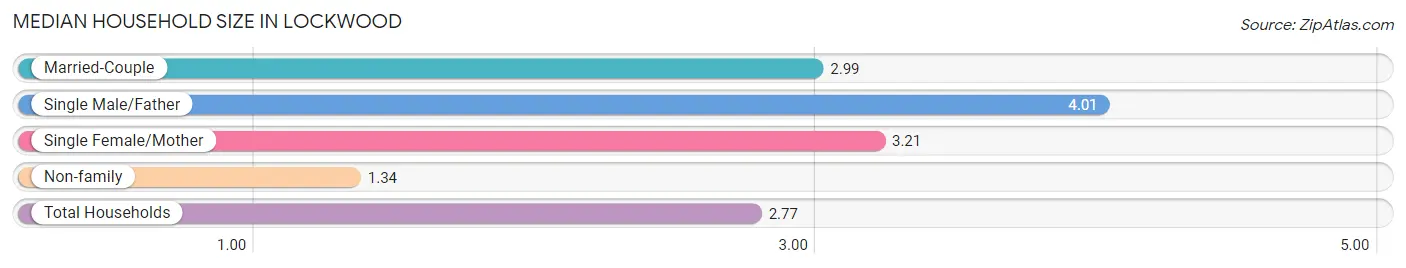
Median Household Size in Lockwood
The median household size in Lockwood is 2.77 persons per household, with single male/father households (238 | 8.9%) accounting for the largest median household size of 4.01 persons per household. non-family households (561 | 21.1%) represent the smallest median household size with 1.34 persons per household.
| Household Type | # Households | Household Size |
| Married-Couple | 1,465 (55.0%) | 2.99 |
| Single Male/Father | 238 (8.9%) | 4.01 |
| Single Female/Mother | 400 (15.0%) | 3.21 |
| Non-family | 561 (21.1%) | 1.34 |
| Total Households | 2,664 (100.0%) | 2.77 |
Household Size by Marriage Status in Lockwood
Out of a total of 2,664 households in Lockwood, 2,103 (78.9%) are family households, while 561 (21.1%) are nonfamily households. The most numerous type of family households are 2-person households, comprising 946, and the most common type of nonfamily households are 1-person households, comprising 375.
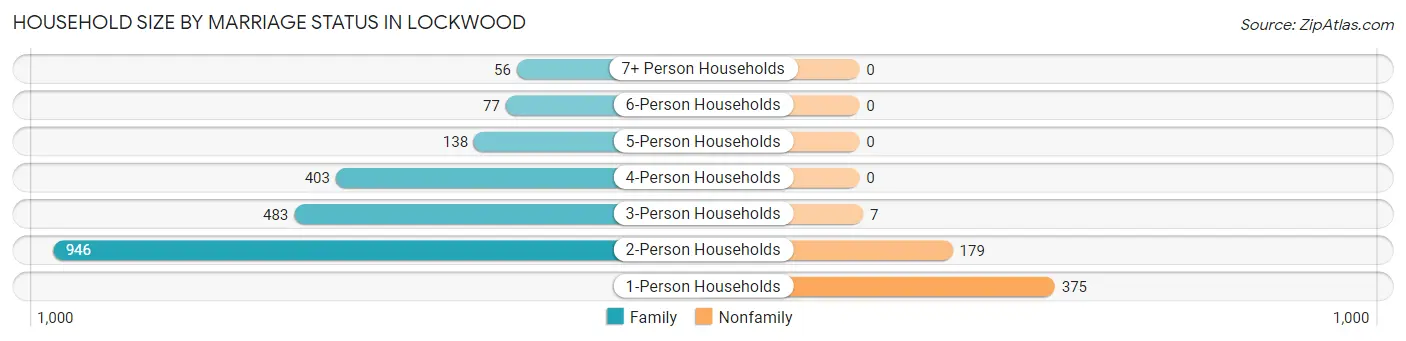
| Household Size | Family Households | Nonfamily Households |
| 1-Person Households | - | 375 (14.1%) |
| 2-Person Households | 946 (35.5%) | 179 (6.7%) |
| 3-Person Households | 483 (18.1%) | 7 (0.3%) |
| 4-Person Households | 403 (15.1%) | 0 (0.0%) |
| 5-Person Households | 138 (5.2%) | 0 (0.0%) |
| 6-Person Households | 77 (2.9%) | 0 (0.0%) |
| 7+ Person Households | 56 (2.1%) | 0 (0.0%) |
| Total | 2,103 (78.9%) | 561 (21.1%) |
Female Fertility in Lockwood
Fertility by Age in Lockwood
Average fertility rate in Lockwood is 35.0 births per 1,000 women. Women in the age bracket of 20 to 34 years have the highest fertility rate with 79.0 births per 1,000 women. Women in the age bracket of 20 to 34 years acount for 100.0% of all women with births.
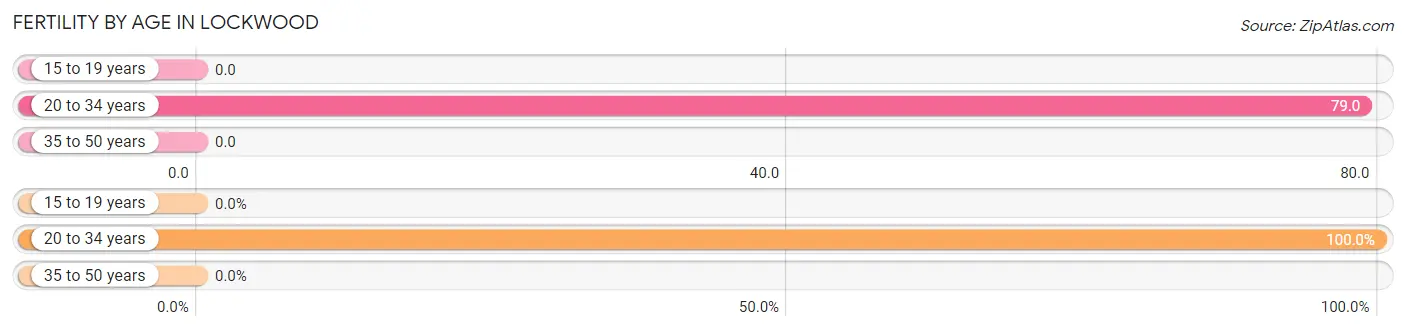
| Age Bracket | Women with Births | Births / 1,000 Women |
| 15 to 19 years | 0 (0.0%) | 0.0 |
| 20 to 34 years | 60 (100.0%) | 79.0 |
| 35 to 50 years | 0 (0.0%) | 0.0 |
| Total | 60 (100.0%) | 35.0 |
Fertility by Age by Marriage Status in Lockwood
53.3% of women with births (60) in Lockwood are married. The highest percentage of unmarried women with births falls into 20 to 34 years age bracket with 46.7% of them unmarried at the time of birth, while the lowest percentage of unmarried women with births belong to 20 to 34 years age bracket with 46.7% of them unmarried.
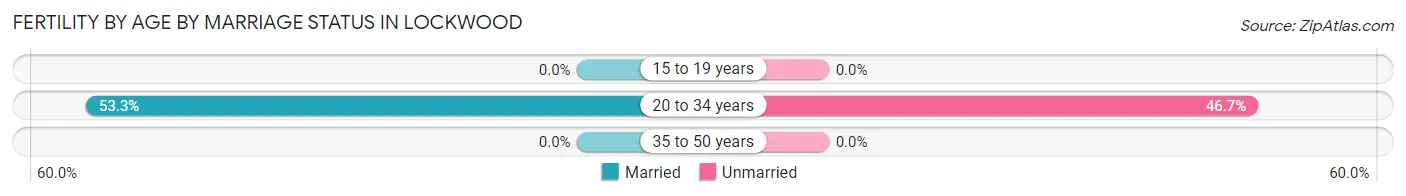
| Age Bracket | Married | Unmarried |
| 15 to 19 years | 0 (0.0%) | 0 (0.0%) |
| 20 to 34 years | 32 (53.3%) | 28 (46.7%) |
| 35 to 50 years | 0 (0.0%) | 0 (0.0%) |
| Total | 32 (53.3%) | 28 (46.7%) |
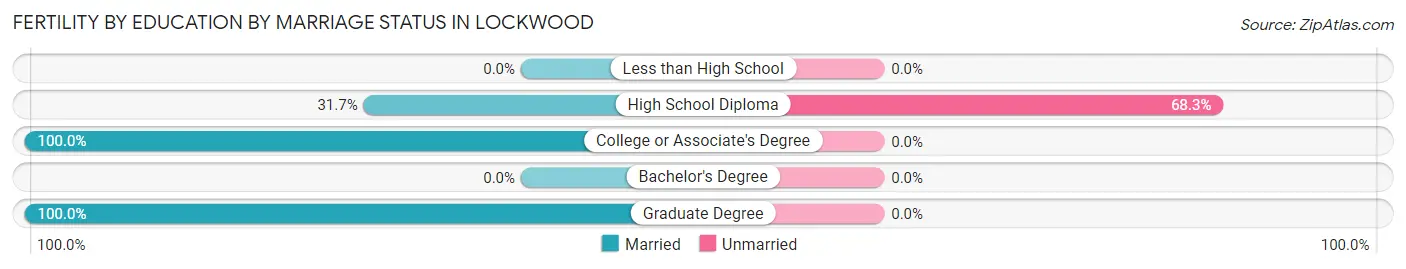
Fertility by Education in Lockwood
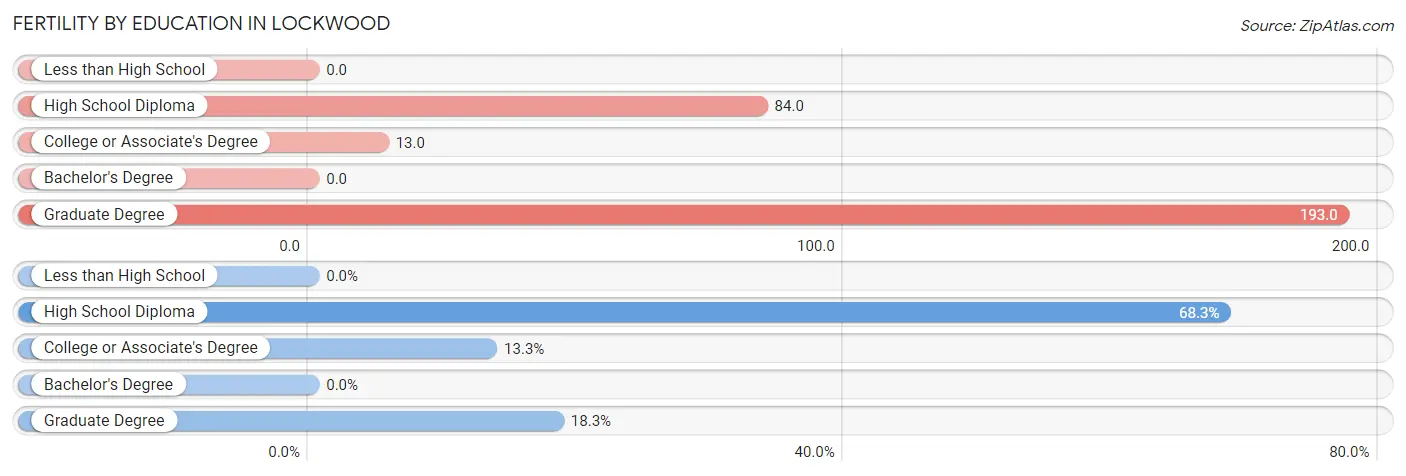
| Educational Attainment | Women with Births | Births / 1,000 Women |
| Less than High School | 0 (0.0%) | 0.0 |
| High School Diploma | 41 (68.3%) | 84.0 |
| College or Associate's Degree | 8 (13.3%) | 13.0 |
| Bachelor's Degree | 0 (0.0%) | 0.0 |
| Graduate Degree | 11 (18.3%) | 193.0 |
| Total | 60 (100.0%) | 35.0 |
Fertility by Education by Marriage Status in Lockwood
46.7% of women with births in Lockwood are unmarried. Women with the educational attainment of college or associate's degree are most likely to be married with 100.0% of them married at childbirth, while women with the educational attainment of high school diploma are least likely to be married with 68.3% of them unmarried at childbirth.
| Educational Attainment | Married | Unmarried |
| Less than High School | 0 (0.0%) | 0 (0.0%) |
| High School Diploma | 13 (31.7%) | 28 (68.3%) |
| College or Associate's Degree | 8 (100.0%) | 0 (0.0%) |
| Bachelor's Degree | 0 (0.0%) | 0 (0.0%) |
| Graduate Degree | 11 (100.0%) | 0 (0.0%) |
| Total | 32 (53.3%) | 28 (46.7%) |
Employment Characteristics in Lockwood
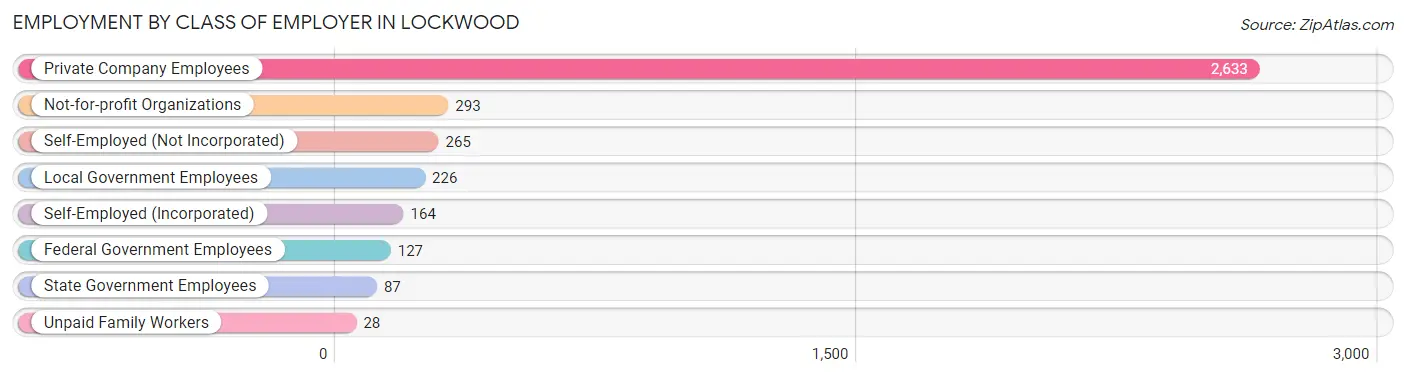
Employment by Class of Employer in Lockwood
Among the 3,823 employed individuals in Lockwood, private company employees (2,633 | 68.9%), not-for-profit organizations (293 | 7.7%), and self-employed (not incorporated) (265 | 6.9%) make up the most common classes of employment.
| Employer Class | # Employees | % Employees |
| Private Company Employees | 2,633 | 68.9% |
| Self-Employed (Incorporated) | 164 | 4.3% |
| Self-Employed (Not Incorporated) | 265 | 6.9% |
| Not-for-profit Organizations | 293 | 7.7% |
| Local Government Employees | 226 | 5.9% |
| State Government Employees | 87 | 2.3% |
| Federal Government Employees | 127 | 3.3% |
| Unpaid Family Workers | 28 | 0.7% |
| Total | 3,823 | 100.0% |
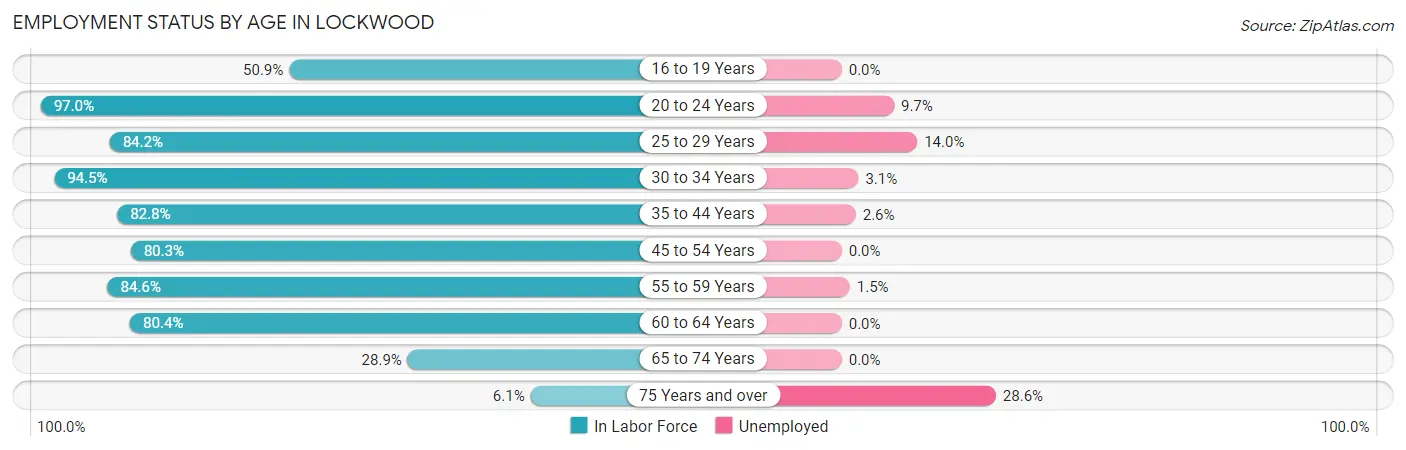
Employment Status by Age in Lockwood
According to the labor force statistics for Lockwood, out of the total population over 16 years of age (5,829), 70.0% or 4,080 individuals are in the labor force, with 3.8% or 155 of them unemployed. The age group with the highest labor force participation rate is 20 to 24 years, with 97.0% or 257 individuals in the labor force. Within the labor force, the 75 years and over age range has the highest percentage of unemployed individuals, with 28.6% or 8 of them being unemployed.
| Age Bracket | In Labor Force | Unemployed |
| 16 to 19 Years | 253 (50.9%) | 0 (0.0%) |
| 20 to 24 Years | 257 (97.0%) | 25 (9.7%) |
| 25 to 29 Years | 566 (84.2%) | 79 (14.0%) |
| 30 to 34 Years | 606 (94.5%) | 19 (3.1%) |
| 35 to 44 Years | 736 (82.8%) | 19 (2.6%) |
| 45 to 54 Years | 833 (80.3%) | 0 (0.0%) |
| 55 to 59 Years | 275 (84.6%) | 4 (1.5%) |
| 60 to 64 Years | 352 (80.4%) | 0 (0.0%) |
| 65 to 74 Years | 176 (28.9%) | 0 (0.0%) |
| 75 Years and over | 28 (6.1%) | 8 (28.6%) |
| Total | 4,080 (70.0%) | 155 (3.8%) |
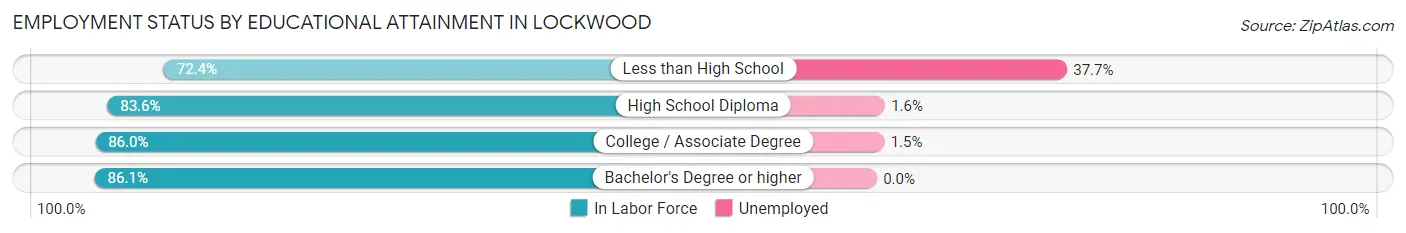
Employment Status by Educational Attainment in Lockwood
According to labor force statistics for Lockwood, 84.2% of individuals (3,370) out of the total population between 25 and 64 years of age (4,002) are in the labor force, with 3.6% or 121 of them being unemployed. The group with the highest labor force participation rate are those with the educational attainment of bachelor's degree or higher, with 86.1% or 741 individuals in the labor force. Within the labor force, individuals with less than high school education have the highest percentage of unemployment, with 37.7% or 84 of them being unemployed.
| Educational Attainment | In Labor Force | Unemployed |
| Less than High School | 223 (72.4%) | 116 (37.7%) |
| High School Diploma | 1,154 (83.6%) | 22 (1.6%) |
| College / Associate Degree | 1,250 (86.0%) | 22 (1.5%) |
| Bachelor's Degree or higher | 741 (86.1%) | 0 (0.0%) |
| Total | 3,370 (84.2%) | 144 (3.6%) |
Employment Occupations by Sex in Lockwood
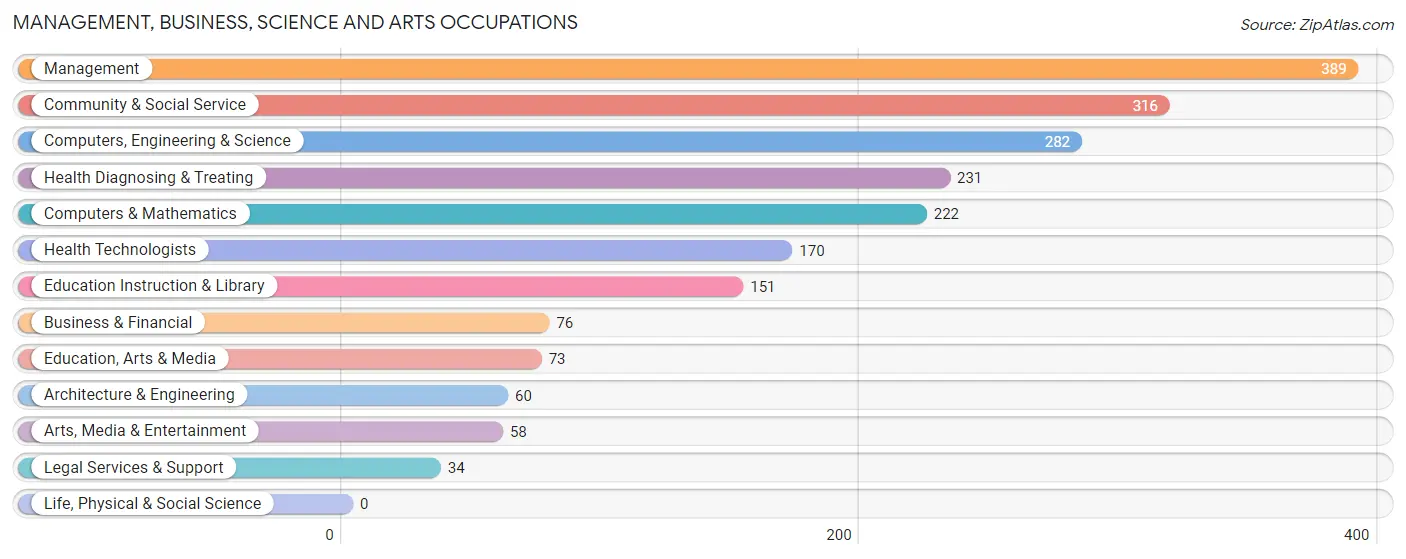
Management, Business, Science and Arts Occupations
The most common Management, Business, Science and Arts occupations in Lockwood are Management (389 | 9.9%), Community & Social Service (316 | 8.0%), Computers, Engineering & Science (282 | 7.2%), Health Diagnosing & Treating (231 | 5.9%), and Computers & Mathematics (222 | 5.7%).
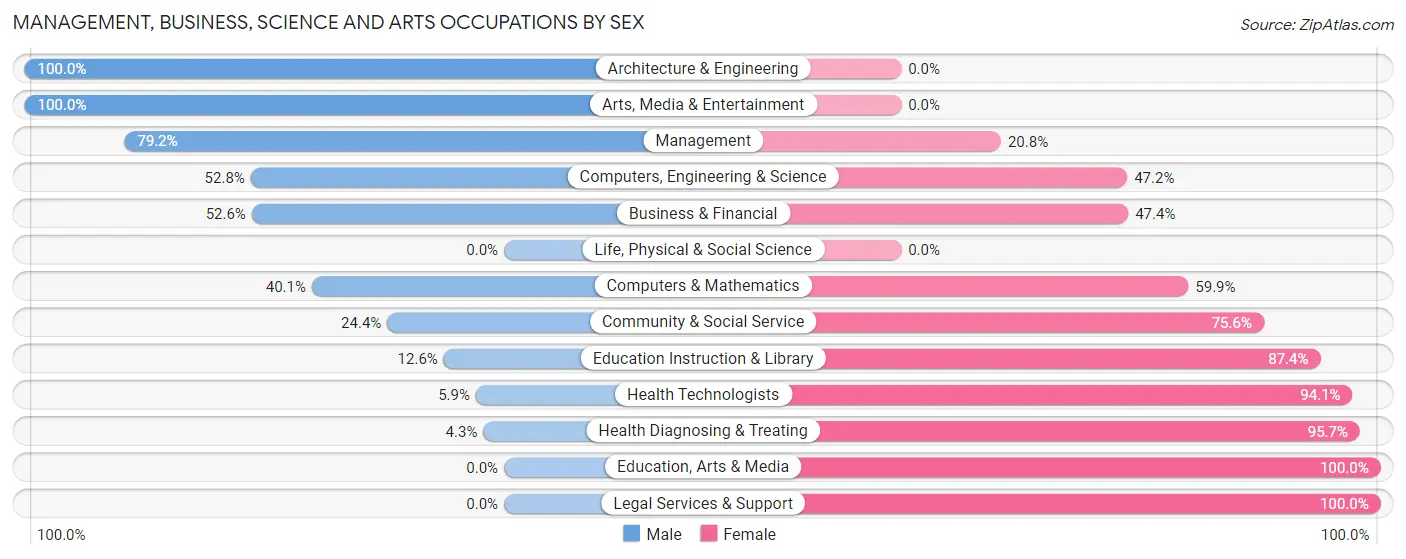
Management, Business, Science and Arts Occupations by Sex
Within the Management, Business, Science and Arts occupations in Lockwood, the most male-oriented occupations are Architecture & Engineering (100.0%), Arts, Media & Entertainment (100.0%), and Management (79.2%), while the most female-oriented occupations are Education, Arts & Media (100.0%), Legal Services & Support (100.0%), and Health Diagnosing & Treating (95.7%).
| Occupation | Male | Female |
| Management | 308 (79.2%) | 81 (20.8%) |
| Business & Financial | 40 (52.6%) | 36 (47.4%) |
| Computers, Engineering & Science | 149 (52.8%) | 133 (47.2%) |
| Computers & Mathematics | 89 (40.1%) | 133 (59.9%) |
| Architecture & Engineering | 60 (100.0%) | 0 (0.0%) |
| Life, Physical & Social Science | 0 (0.0%) | 0 (0.0%) |
| Community & Social Service | 77 (24.4%) | 239 (75.6%) |
| Education, Arts & Media | 0 (0.0%) | 73 (100.0%) |
| Legal Services & Support | 0 (0.0%) | 34 (100.0%) |
| Education Instruction & Library | 19 (12.6%) | 132 (87.4%) |
| Arts, Media & Entertainment | 58 (100.0%) | 0 (0.0%) |
| Health Diagnosing & Treating | 10 (4.3%) | 221 (95.7%) |
| Health Technologists | 10 (5.9%) | 160 (94.1%) |
| Total (Category) | 584 (45.1%) | 710 (54.9%) |
| Total (Overall) | 2,079 (52.9%) | 1,849 (47.1%) |
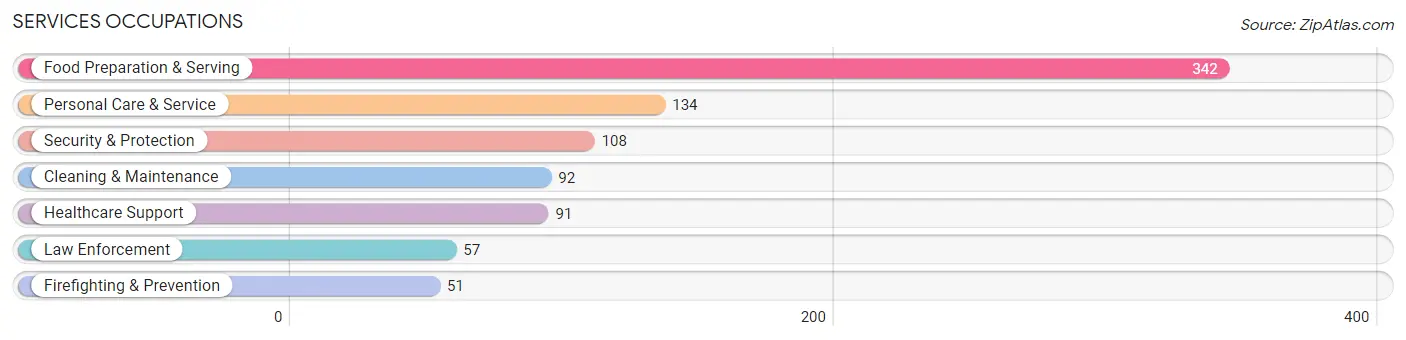
Services Occupations
The most common Services occupations in Lockwood are Food Preparation & Serving (342 | 8.7%), Personal Care & Service (134 | 3.4%), Security & Protection (108 | 2.8%), Cleaning & Maintenance (92 | 2.3%), and Healthcare Support (91 | 2.3%).
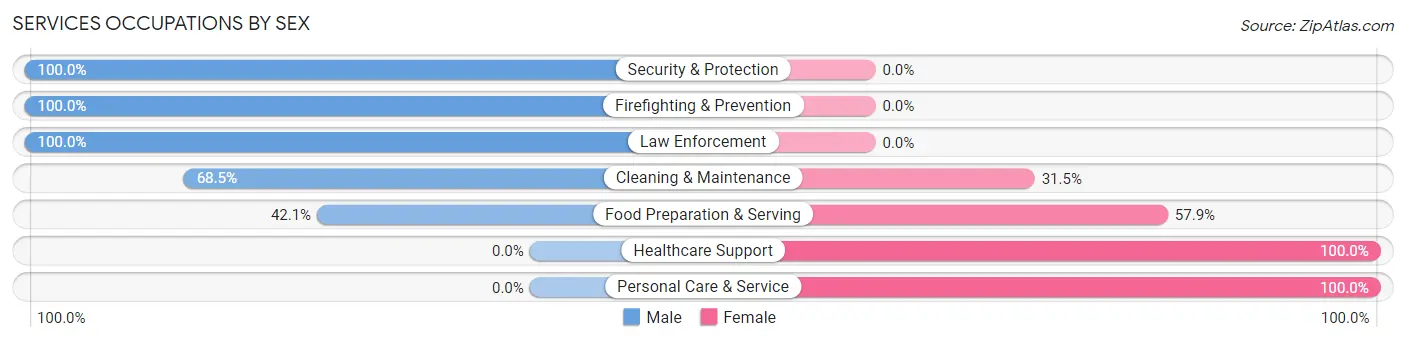
Services Occupations by Sex
Within the Services occupations in Lockwood, the most male-oriented occupations are Security & Protection (100.0%), Firefighting & Prevention (100.0%), and Law Enforcement (100.0%), while the most female-oriented occupations are Healthcare Support (100.0%), Personal Care & Service (100.0%), and Food Preparation & Serving (57.9%).
| Occupation | Male | Female |
| Healthcare Support | 0 (0.0%) | 91 (100.0%) |
| Security & Protection | 108 (100.0%) | 0 (0.0%) |
| Firefighting & Prevention | 51 (100.0%) | 0 (0.0%) |
| Law Enforcement | 57 (100.0%) | 0 (0.0%) |
| Food Preparation & Serving | 144 (42.1%) | 198 (57.9%) |
| Cleaning & Maintenance | 63 (68.5%) | 29 (31.5%) |
| Personal Care & Service | 0 (0.0%) | 134 (100.0%) |
| Total (Category) | 315 (41.1%) | 452 (58.9%) |
| Total (Overall) | 2,079 (52.9%) | 1,849 (47.1%) |
Sales and Office Occupations
The most common Sales and Office occupations in Lockwood are Office & Administration (398 | 10.1%), and Sales & Related (328 | 8.4%).
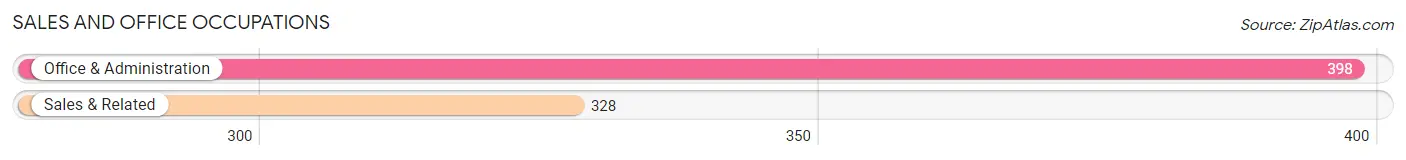
Sales and Office Occupations by Sex
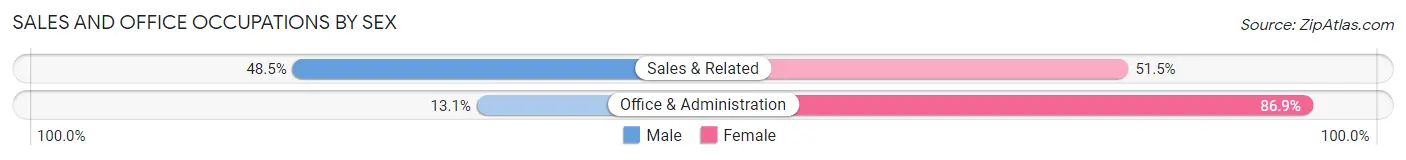
| Occupation | Male | Female |
| Sales & Related | 159 (48.5%) | 169 (51.5%) |
| Office & Administration | 52 (13.1%) | 346 (86.9%) |
| Total (Category) | 211 (29.1%) | 515 (70.9%) |
| Total (Overall) | 2,079 (52.9%) | 1,849 (47.1%) |
Natural Resources, Construction and Maintenance Occupations
The most common Natural Resources, Construction and Maintenance occupations in Lockwood are Installation, Maintenance & Repair (360 | 9.2%), Construction & Extraction (160 | 4.1%), and Farming, Fishing & Forestry (44 | 1.1%).
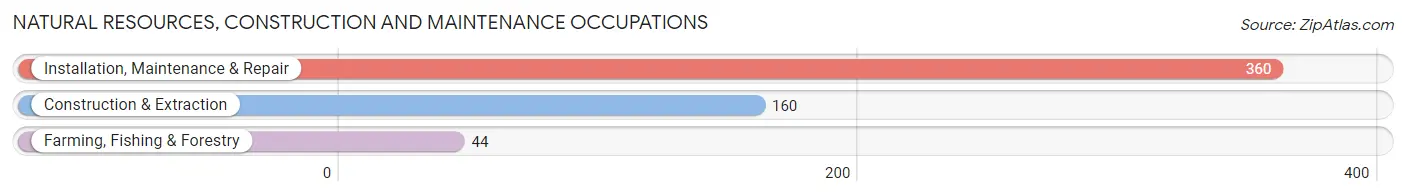
Natural Resources, Construction and Maintenance Occupations by Sex
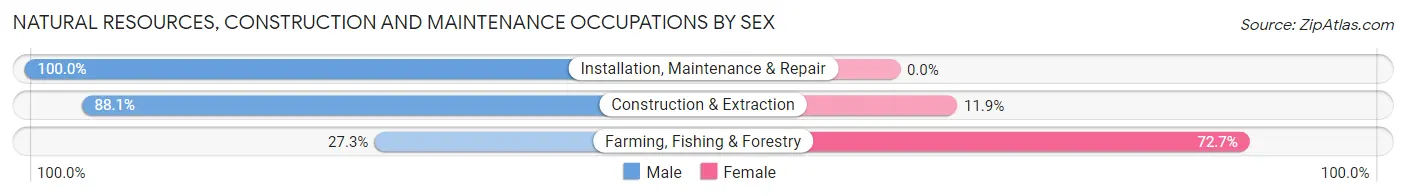
| Occupation | Male | Female |
| Farming, Fishing & Forestry | 12 (27.3%) | 32 (72.7%) |
| Construction & Extraction | 141 (88.1%) | 19 (11.9%) |
| Installation, Maintenance & Repair | 360 (100.0%) | 0 (0.0%) |
| Total (Category) | 513 (91.0%) | 51 (9.0%) |
| Total (Overall) | 2,079 (52.9%) | 1,849 (47.1%) |
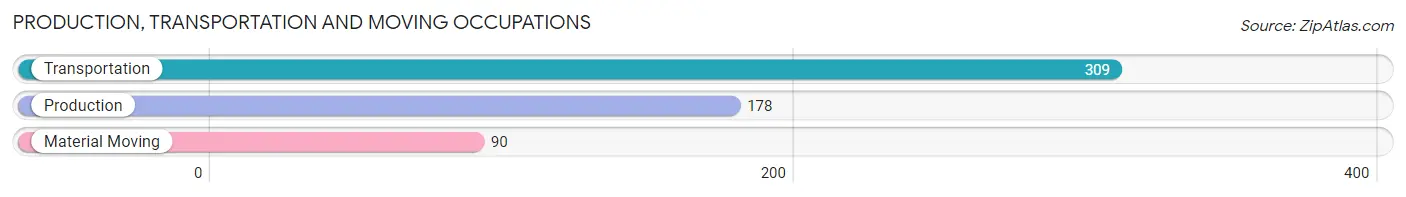
Production, Transportation and Moving Occupations
The most common Production, Transportation and Moving occupations in Lockwood are Transportation (309 | 7.9%), Production (178 | 4.5%), and Material Moving (90 | 2.3%).
Production, Transportation and Moving Occupations by Sex
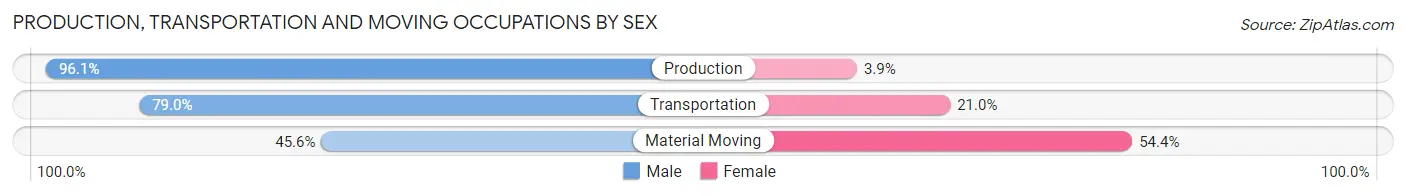
| Occupation | Male | Female |
| Production | 171 (96.1%) | 7 (3.9%) |
| Transportation | 244 (79.0%) | 65 (21.0%) |
| Material Moving | 41 (45.6%) | 49 (54.4%) |
| Total (Category) | 456 (79.0%) | 121 (21.0%) |
| Total (Overall) | 2,079 (52.9%) | 1,849 (47.1%) |
Employment Industries by Sex in Lockwood
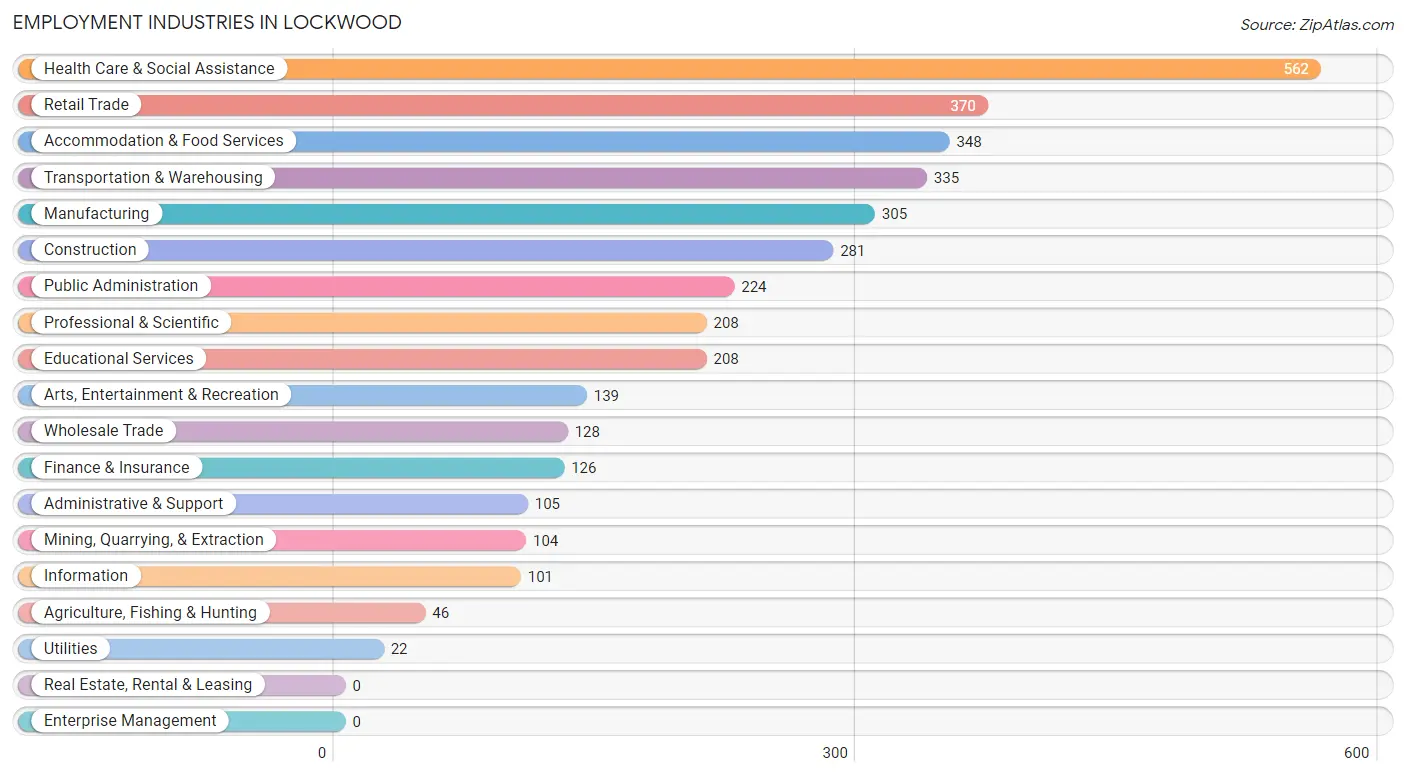
Employment Industries in Lockwood
The major employment industries in Lockwood include Health Care & Social Assistance (562 | 14.3%), Retail Trade (370 | 9.4%), Accommodation & Food Services (348 | 8.9%), Transportation & Warehousing (335 | 8.5%), and Manufacturing (305 | 7.8%).
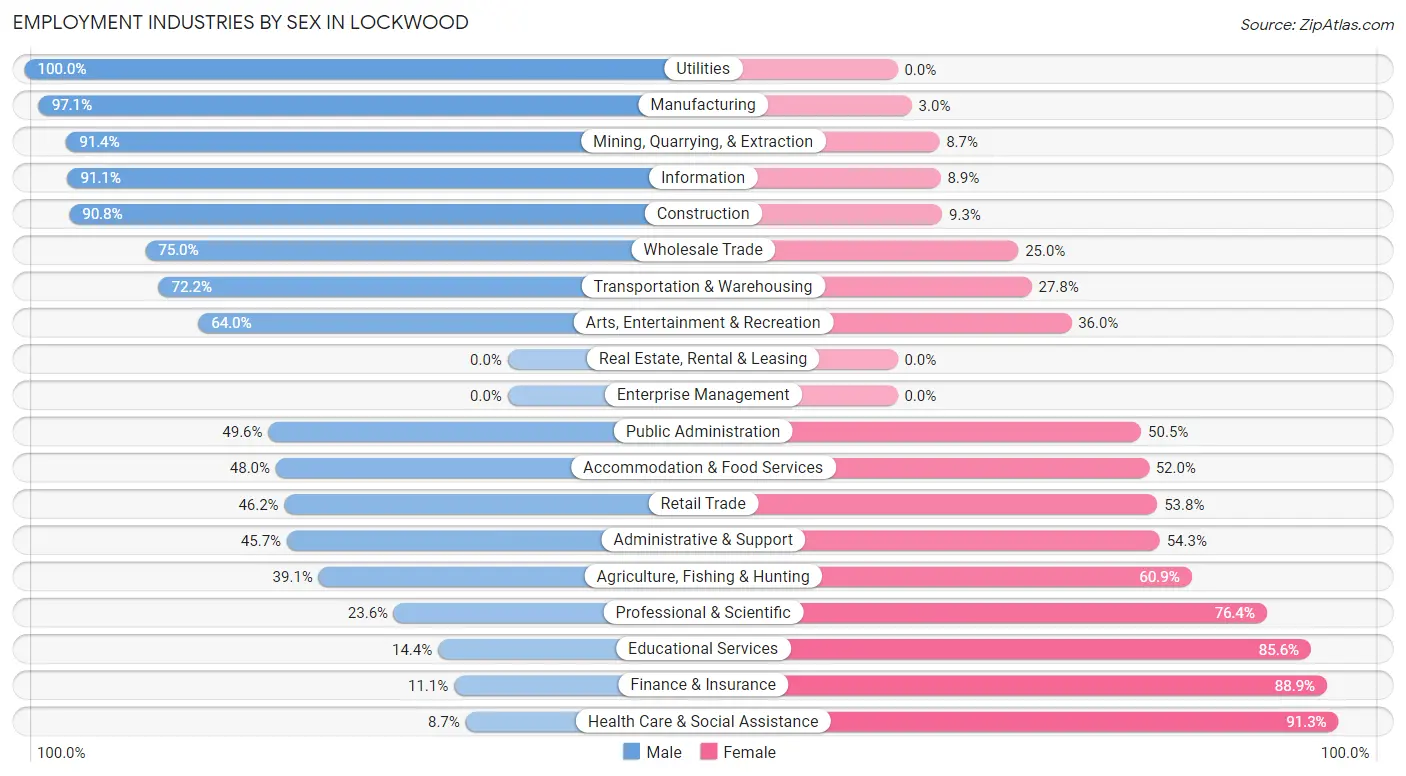
Employment Industries by Sex in Lockwood
The Lockwood industries that see more men than women are Utilities (100.0%), Manufacturing (97.1%), and Mining, Quarrying, & Extraction (91.3%), whereas the industries that tend to have a higher number of women are Health Care & Social Assistance (91.3%), Finance & Insurance (88.9%), and Educational Services (85.6%).
| Industry | Male | Female |
| Agriculture, Fishing & Hunting | 18 (39.1%) | 28 (60.9%) |
| Mining, Quarrying, & Extraction | 95 (91.3%) | 9 (8.6%) |
| Construction | 255 (90.7%) | 26 (9.2%) |
| Manufacturing | 296 (97.1%) | 9 (2.9%) |
| Wholesale Trade | 96 (75.0%) | 32 (25.0%) |
| Retail Trade | 171 (46.2%) | 199 (53.8%) |
| Transportation & Warehousing | 242 (72.2%) | 93 (27.8%) |
| Utilities | 22 (100.0%) | 0 (0.0%) |
| Information | 92 (91.1%) | 9 (8.9%) |
| Finance & Insurance | 14 (11.1%) | 112 (88.9%) |
| Real Estate, Rental & Leasing | 0 (0.0%) | 0 (0.0%) |
| Professional & Scientific | 49 (23.6%) | 159 (76.4%) |
| Enterprise Management | 0 (0.0%) | 0 (0.0%) |
| Administrative & Support | 48 (45.7%) | 57 (54.3%) |
| Educational Services | 30 (14.4%) | 178 (85.6%) |
| Health Care & Social Assistance | 49 (8.7%) | 513 (91.3%) |
| Arts, Entertainment & Recreation | 89 (64.0%) | 50 (36.0%) |
| Accommodation & Food Services | 167 (48.0%) | 181 (52.0%) |
| Public Administration | 111 (49.5%) | 113 (50.4%) |
| Total | 2,079 (52.9%) | 1,849 (47.1%) |
Education in Lockwood
School Enrollment in Lockwood
The most common levels of schooling among the 1,829 students in Lockwood are middle school (537 | 29.4%), high school (490 | 26.8%), and elementary school (377 | 20.6%).
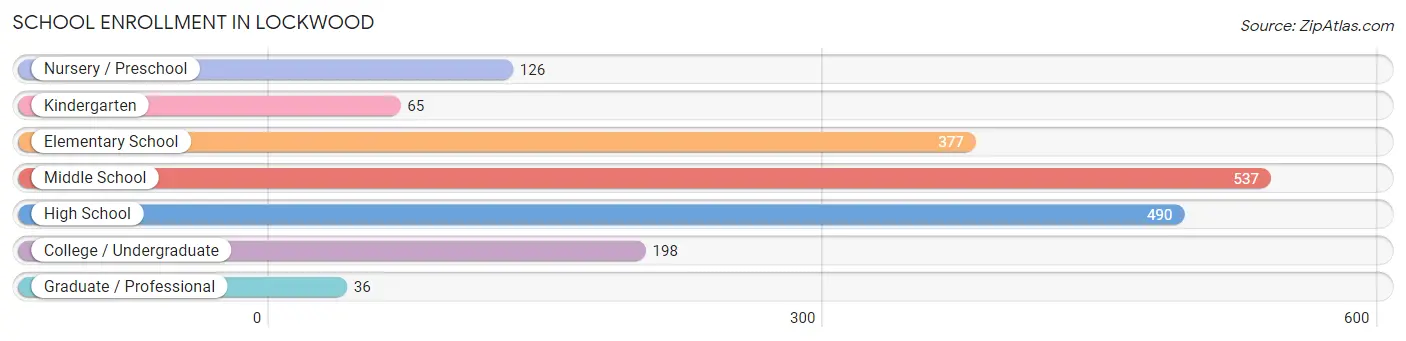
| School Level | # Students | % Students |
| Nursery / Preschool | 126 | 6.9% |
| Kindergarten | 65 | 3.5% |
| Elementary School | 377 | 20.6% |
| Middle School | 537 | 29.4% |
| High School | 490 | 26.8% |
| College / Undergraduate | 198 | 10.8% |
| Graduate / Professional | 36 | 2.0% |
| Total | 1,829 | 100.0% |
School Enrollment by Age by Funding Source in Lockwood
Out of a total of 1,829 students who are enrolled in schools in Lockwood, 198 (10.8%) attend a private institution, while the remaining 1,631 (89.2%) are enrolled in public schools. The age group of 3 to 4 year olds has the highest likelihood of being enrolled in private schools, with 66 (53.2% in the age bracket) enrolled. Conversely, the age group of 20 to 24 year olds has the lowest likelihood of being enrolled in a private school, with 39 (100.0% in the age bracket) attending a public institution.
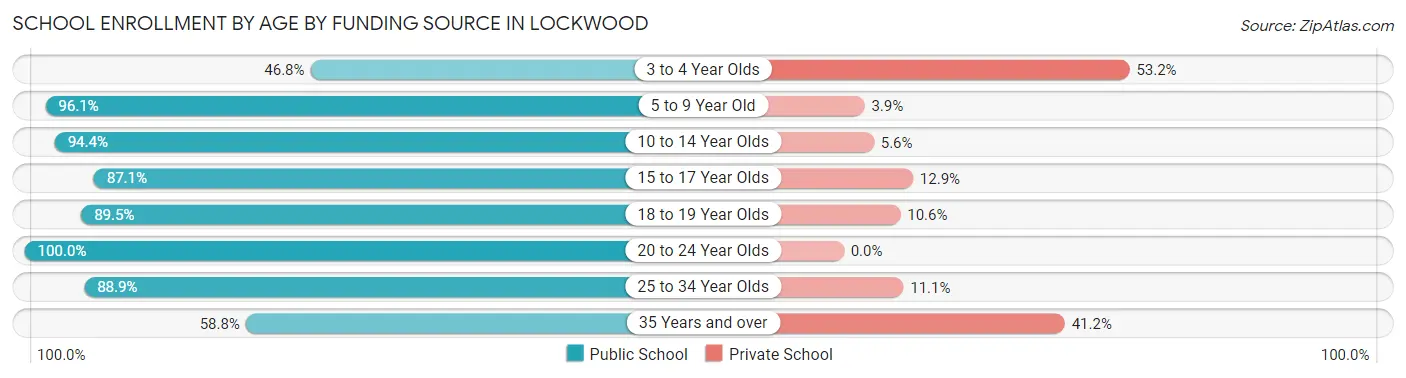
| Age Bracket | Public School | Private School |
| 3 to 4 Year Olds | 58 (46.8%) | 66 (53.2%) |
| 5 to 9 Year Old | 372 (96.1%) | 15 (3.9%) |
| 10 to 14 Year Olds | 656 (94.4%) | 39 (5.6%) |
| 15 to 17 Year Olds | 162 (87.1%) | 24 (12.9%) |
| 18 to 19 Year Olds | 229 (89.4%) | 27 (10.5%) |
| 20 to 24 Year Olds | 39 (100.0%) | 0 (0.0%) |
| 25 to 34 Year Olds | 96 (88.9%) | 12 (11.1%) |
| 35 Years and over | 20 (58.8%) | 14 (41.2%) |
| Total | 1,631 (89.2%) | 198 (10.8%) |
Educational Attainment by Field of Study in Lockwood
Science & technology (195 | 18.3%), business (167 | 15.6%), education (151 | 14.1%), social sciences (111 | 10.4%), and bio, nature & agricultural (70 | 6.6%) are the most common fields of study among 1,068 individuals in Lockwood who have obtained a bachelor's degree or higher.
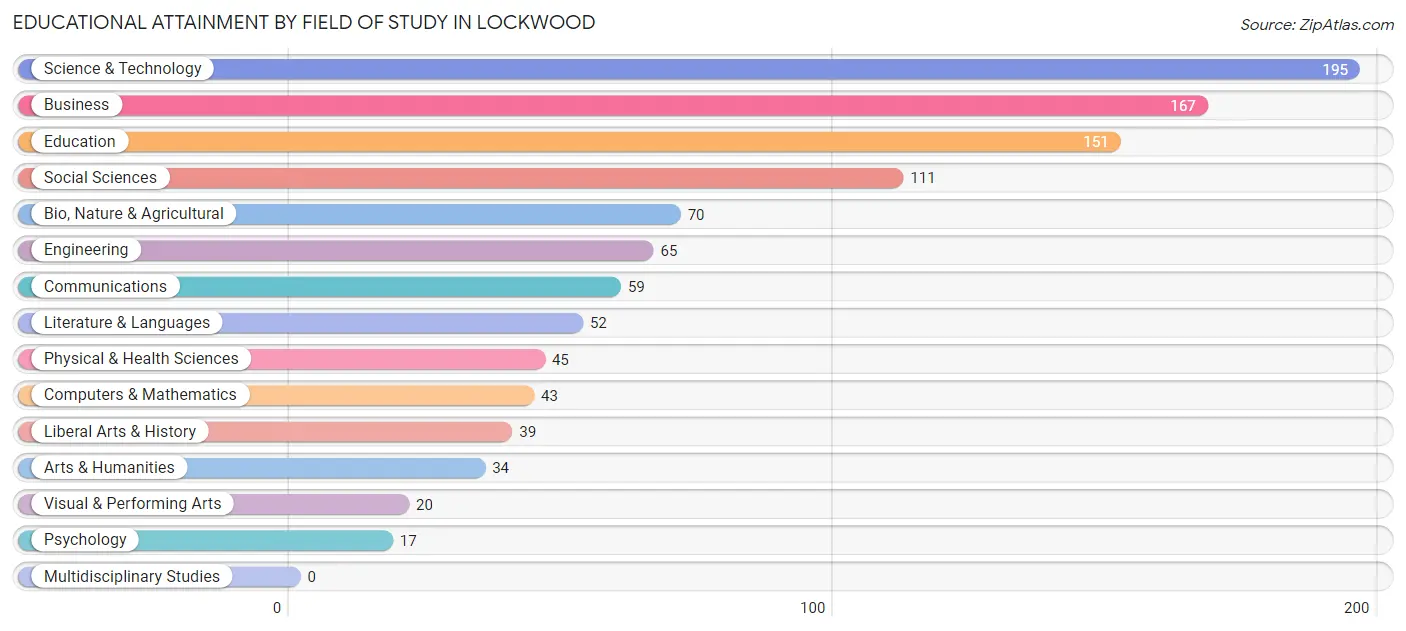
| Field of Study | # Graduates | % Graduates |
| Computers & Mathematics | 43 | 4.0% |
| Bio, Nature & Agricultural | 70 | 6.6% |
| Physical & Health Sciences | 45 | 4.2% |
| Psychology | 17 | 1.6% |
| Social Sciences | 111 | 10.4% |
| Engineering | 65 | 6.1% |
| Multidisciplinary Studies | 0 | 0.0% |
| Science & Technology | 195 | 18.3% |
| Business | 167 | 15.6% |
| Education | 151 | 14.1% |
| Literature & Languages | 52 | 4.9% |
| Liberal Arts & History | 39 | 3.6% |
| Visual & Performing Arts | 20 | 1.9% |
| Communications | 59 | 5.5% |
| Arts & Humanities | 34 | 3.2% |
| Total | 1,068 | 100.0% |
Transportation & Commute in Lockwood
Vehicle Availability by Sex in Lockwood
The most prevalent vehicle ownership categories in Lockwood are males with 2 vehicles (674, accounting for 33.4%) and females with 2 vehicles (603, making up 37.4%).
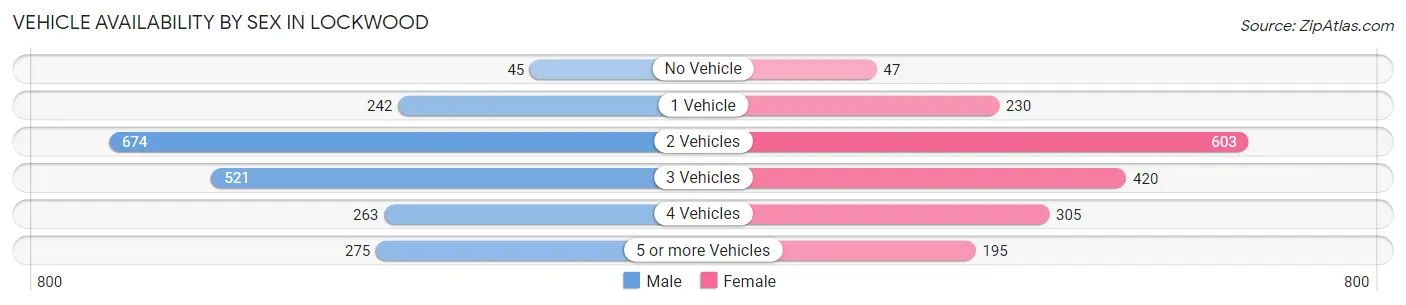
| Vehicles Available | Male | Female |
| No Vehicle | 45 (2.2%) | 47 (2.6%) |
| 1 Vehicle | 242 (12.0%) | 230 (12.8%) |
| 2 Vehicles | 674 (33.4%) | 603 (33.5%) |
| 3 Vehicles | 521 (25.8%) | 420 (23.3%) |
| 4 Vehicles | 263 (13.0%) | 305 (16.9%) |
| 5 or more Vehicles | 275 (13.6%) | 195 (10.8%) |
| Total | 2,020 (100.0%) | 1,800 (100.0%) |
Commute Time in Lockwood
The most frequently occuring commute durations in Lockwood are 20 to 24 minutes (1,036 commuters, 28.7%), 15 to 19 minutes (815 commuters, 22.6%), and 10 to 14 minutes (554 commuters, 15.3%).
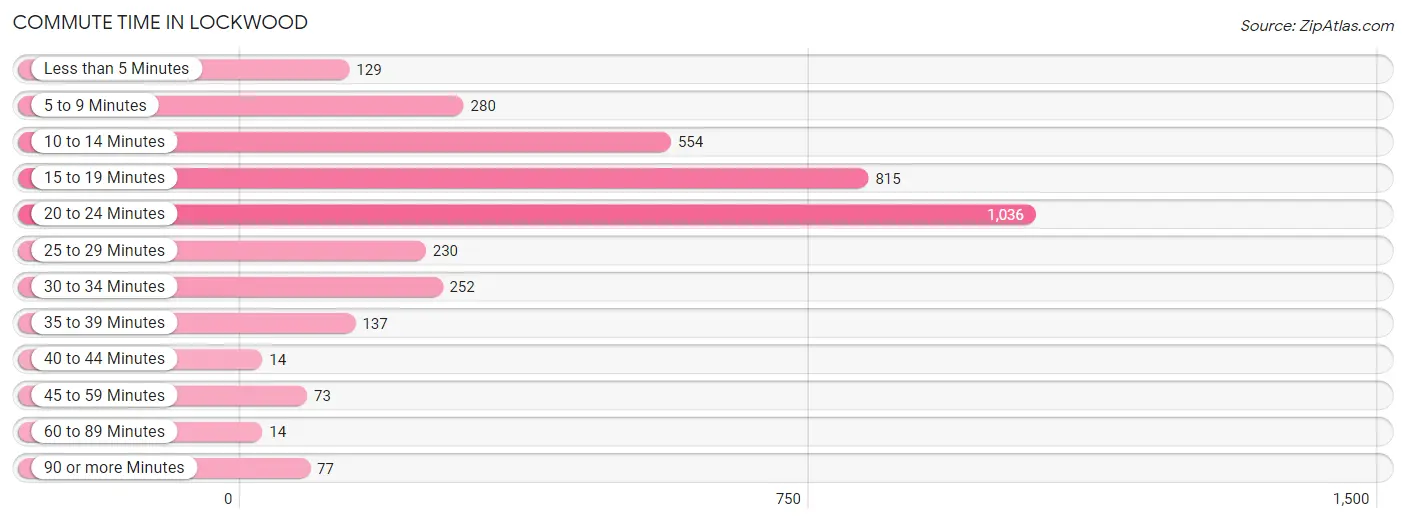
| Commute Time | # Commuters | % Commuters |
| Less than 5 Minutes | 129 | 3.6% |
| 5 to 9 Minutes | 280 | 7.7% |
| 10 to 14 Minutes | 554 | 15.3% |
| 15 to 19 Minutes | 815 | 22.6% |
| 20 to 24 Minutes | 1,036 | 28.7% |
| 25 to 29 Minutes | 230 | 6.4% |
| 30 to 34 Minutes | 252 | 7.0% |
| 35 to 39 Minutes | 137 | 3.8% |
| 40 to 44 Minutes | 14 | 0.4% |
| 45 to 59 Minutes | 73 | 2.0% |
| 60 to 89 Minutes | 14 | 0.4% |
| 90 or more Minutes | 77 | 2.1% |
Commute Time by Sex in Lockwood
The most common commute times in Lockwood are 15 to 19 minutes (506 commuters, 26.2%) for males and 20 to 24 minutes (553 commuters, 33.0%) for females.
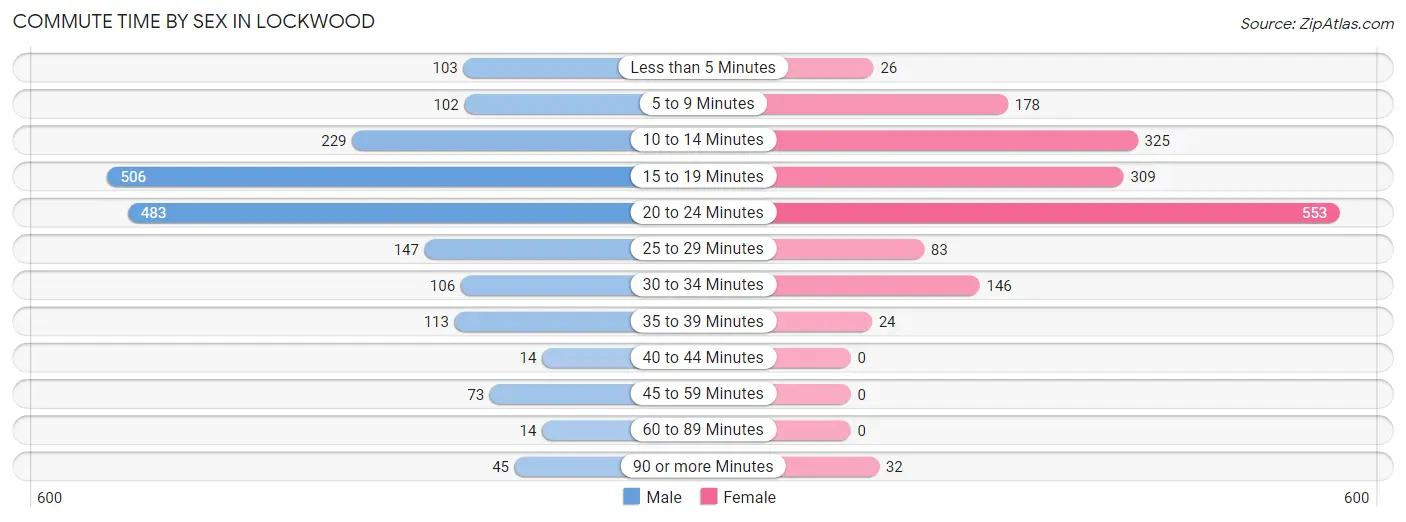
| Commute Time | Male | Female |
| Less than 5 Minutes | 103 (5.3%) | 26 (1.5%) |
| 5 to 9 Minutes | 102 (5.3%) | 178 (10.6%) |
| 10 to 14 Minutes | 229 (11.8%) | 325 (19.4%) |
| 15 to 19 Minutes | 506 (26.2%) | 309 (18.4%) |
| 20 to 24 Minutes | 483 (25.0%) | 553 (33.0%) |
| 25 to 29 Minutes | 147 (7.6%) | 83 (5.0%) |
| 30 to 34 Minutes | 106 (5.5%) | 146 (8.7%) |
| 35 to 39 Minutes | 113 (5.8%) | 24 (1.4%) |
| 40 to 44 Minutes | 14 (0.7%) | 0 (0.0%) |
| 45 to 59 Minutes | 73 (3.8%) | 0 (0.0%) |
| 60 to 89 Minutes | 14 (0.7%) | 0 (0.0%) |
| 90 or more Minutes | 45 (2.3%) | 32 (1.9%) |
Time of Departure to Work by Sex in Lockwood
The most frequent times of departure to work in Lockwood are 7:00 AM to 7:29 AM (394, 20.4%) for males and 7:30 AM to 7:59 AM (373, 22.3%) for females.
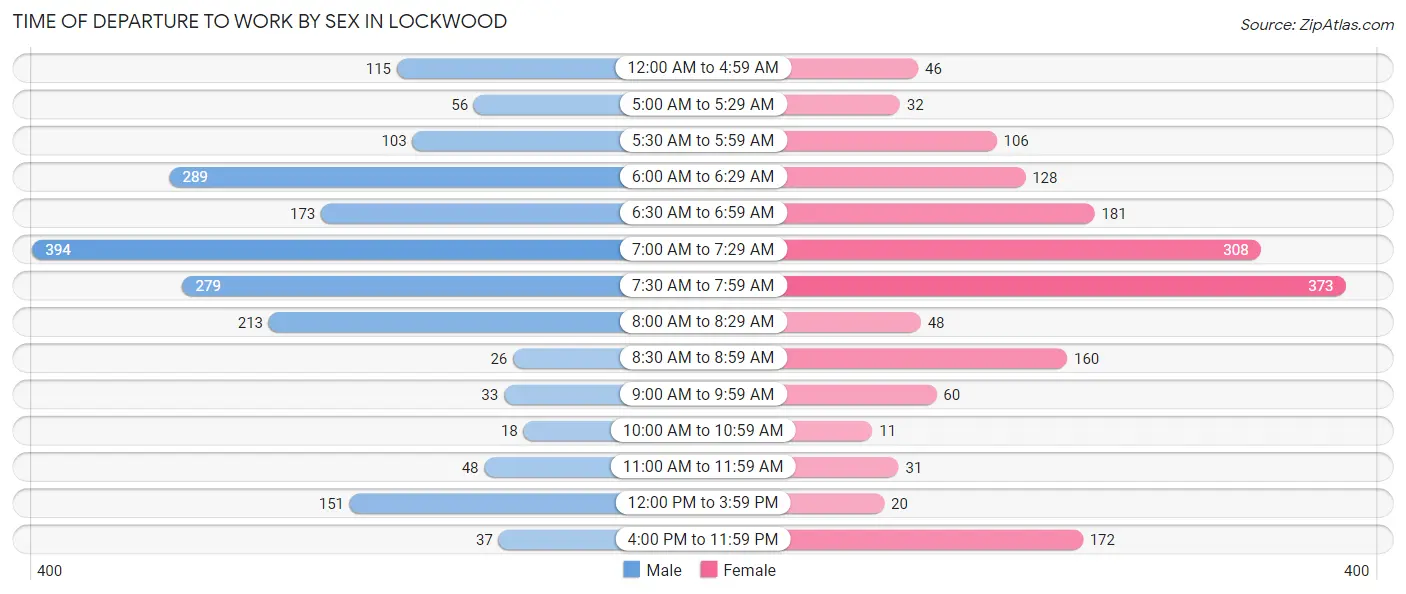
| Time of Departure | Male | Female |
| 12:00 AM to 4:59 AM | 115 (5.9%) | 46 (2.7%) |
| 5:00 AM to 5:29 AM | 56 (2.9%) | 32 (1.9%) |
| 5:30 AM to 5:59 AM | 103 (5.3%) | 106 (6.3%) |
| 6:00 AM to 6:29 AM | 289 (14.9%) | 128 (7.6%) |
| 6:30 AM to 6:59 AM | 173 (8.9%) | 181 (10.8%) |
| 7:00 AM to 7:29 AM | 394 (20.4%) | 308 (18.4%) |
| 7:30 AM to 7:59 AM | 279 (14.4%) | 373 (22.3%) |
| 8:00 AM to 8:29 AM | 213 (11.0%) | 48 (2.9%) |
| 8:30 AM to 8:59 AM | 26 (1.3%) | 160 (9.6%) |
| 9:00 AM to 9:59 AM | 33 (1.7%) | 60 (3.6%) |
| 10:00 AM to 10:59 AM | 18 (0.9%) | 11 (0.7%) |
| 11:00 AM to 11:59 AM | 48 (2.5%) | 31 (1.8%) |
| 12:00 PM to 3:59 PM | 151 (7.8%) | 20 (1.2%) |
| 4:00 PM to 11:59 PM | 37 (1.9%) | 172 (10.3%) |
| Total | 1,935 (100.0%) | 1,676 (100.0%) |
Housing Occupancy in Lockwood
Occupancy by Ownership in Lockwood
Of the total 2,664 dwellings in Lockwood, owner-occupied units account for 2,004 (75.2%), while renter-occupied units make up 660 (24.8%).
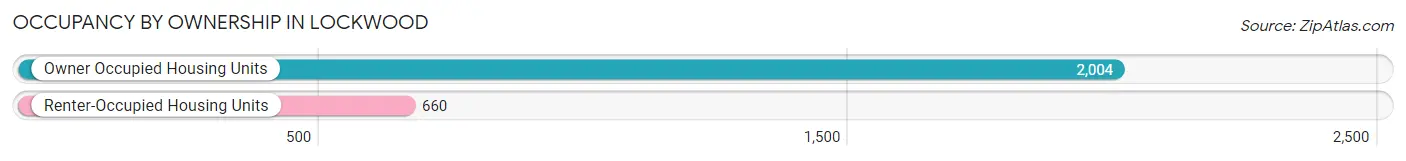
| Occupancy | # Housing Units | % Housing Units |
| Owner Occupied Housing Units | 2,004 | 75.2% |
| Renter-Occupied Housing Units | 660 | 24.8% |
| Total Occupied Housing Units | 2,664 | 100.0% |
Occupancy by Household Size in Lockwood
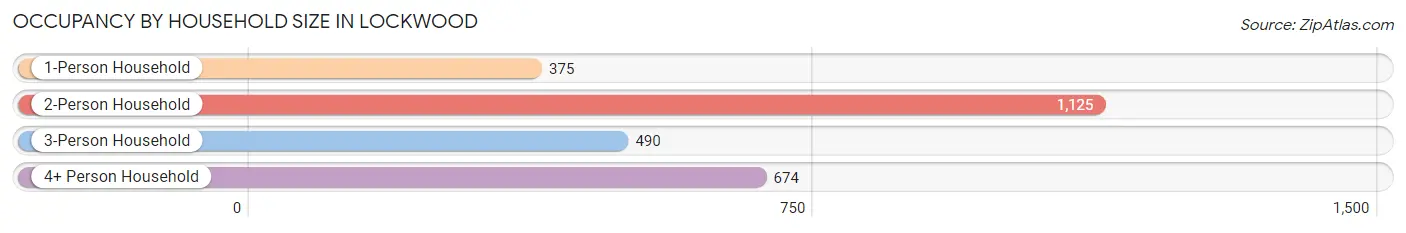
| Household Size | # Housing Units | % Housing Units |
| 1-Person Household | 375 | 14.1% |
| 2-Person Household | 1,125 | 42.2% |
| 3-Person Household | 490 | 18.4% |
| 4+ Person Household | 674 | 25.3% |
| Total Housing Units | 2,664 | 100.0% |
Occupancy by Ownership by Household Size in Lockwood
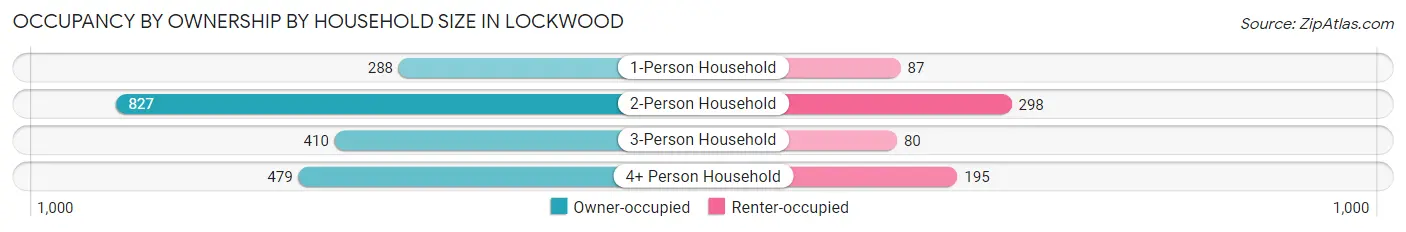
| Household Size | Owner-occupied | Renter-occupied |
| 1-Person Household | 288 (76.8%) | 87 (23.2%) |
| 2-Person Household | 827 (73.5%) | 298 (26.5%) |
| 3-Person Household | 410 (83.7%) | 80 (16.3%) |
| 4+ Person Household | 479 (71.1%) | 195 (28.9%) |
| Total Housing Units | 2,004 (75.2%) | 660 (24.8%) |
Occupancy by Educational Attainment in Lockwood
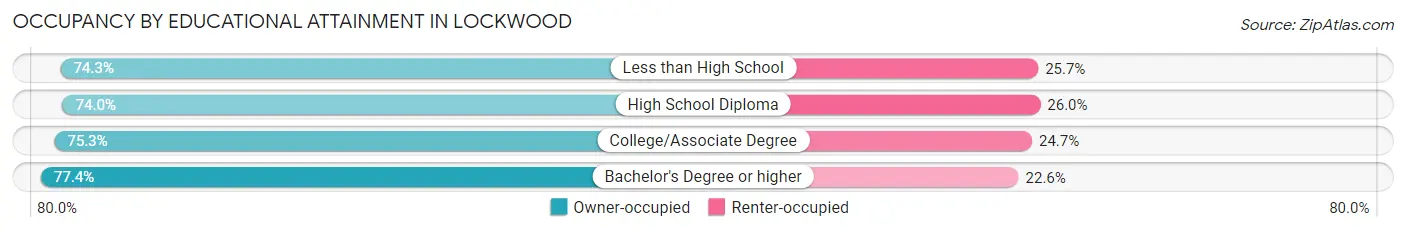
| Household Size | Owner-occupied | Renter-occupied |
| Less than High School | 133 (74.3%) | 46 (25.7%) |
| High School Diploma | 710 (74.0%) | 250 (26.0%) |
| College/Associate Degree | 688 (75.3%) | 226 (24.7%) |
| Bachelor's Degree or higher | 473 (77.4%) | 138 (22.6%) |
Occupancy by Age of Householder in Lockwood
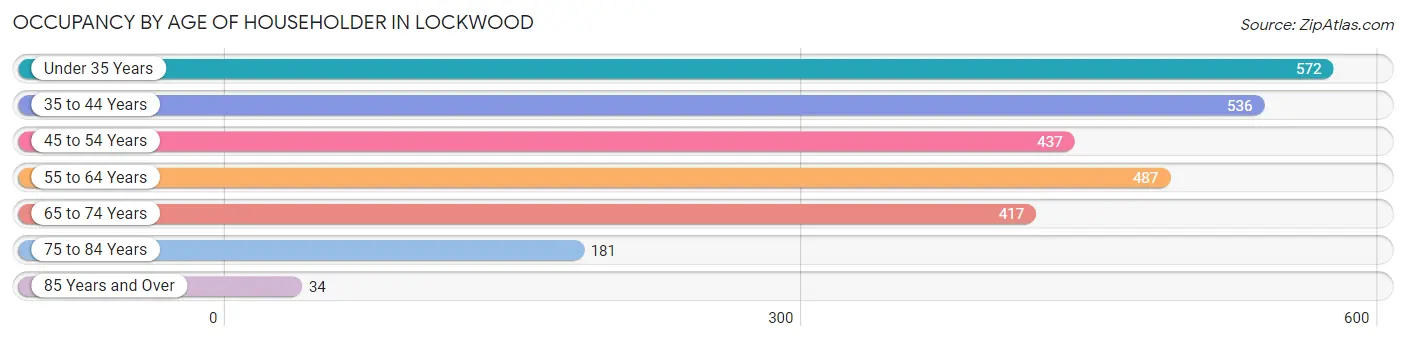
| Age Bracket | # Households | % Households |
| Under 35 Years | 572 | 21.5% |
| 35 to 44 Years | 536 | 20.1% |
| 45 to 54 Years | 437 | 16.4% |
| 55 to 64 Years | 487 | 18.3% |
| 65 to 74 Years | 417 | 15.7% |
| 75 to 84 Years | 181 | 6.8% |
| 85 Years and Over | 34 | 1.3% |
| Total | 2,664 | 100.0% |
Housing Finances in Lockwood
Median Income by Occupancy in Lockwood
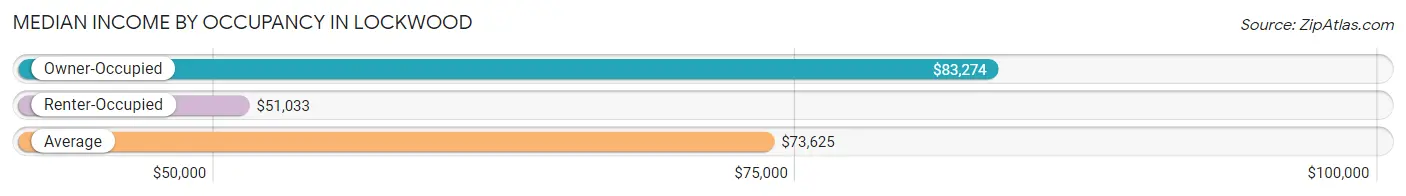
| Occupancy Type | # Households | Median Income |
| Owner-Occupied | 2,004 (75.2%) | $83,274 |
| Renter-Occupied | 660 (24.8%) | $51,033 |
| Average | 2,664 (100.0%) | $73,625 |
Occupancy by Householder Income Bracket in Lockwood
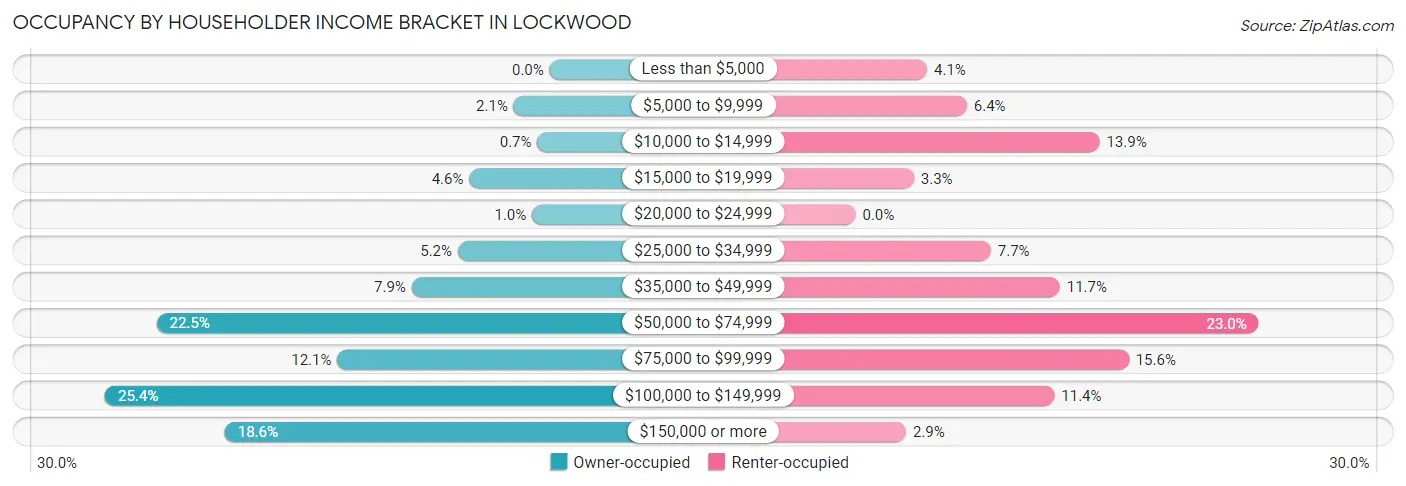
| Income Bracket | Owner-occupied | Renter-occupied |
| Less than $5,000 | 0 (0.0%) | 27 (4.1%) |
| $5,000 to $9,999 | 41 (2.1%) | 42 (6.4%) |
| $10,000 to $14,999 | 14 (0.7%) | 92 (13.9%) |
| $15,000 to $19,999 | 92 (4.6%) | 22 (3.3%) |
| $20,000 to $24,999 | 20 (1.0%) | 0 (0.0%) |
| $25,000 to $34,999 | 105 (5.2%) | 51 (7.7%) |
| $35,000 to $49,999 | 158 (7.9%) | 77 (11.7%) |
| $50,000 to $74,999 | 450 (22.5%) | 152 (23.0%) |
| $75,000 to $99,999 | 243 (12.1%) | 103 (15.6%) |
| $100,000 to $149,999 | 509 (25.4%) | 75 (11.4%) |
| $150,000 or more | 372 (18.6%) | 19 (2.9%) |
| Total | 2,004 (100.0%) | 660 (100.0%) |
Monthly Housing Cost Tiers in Lockwood
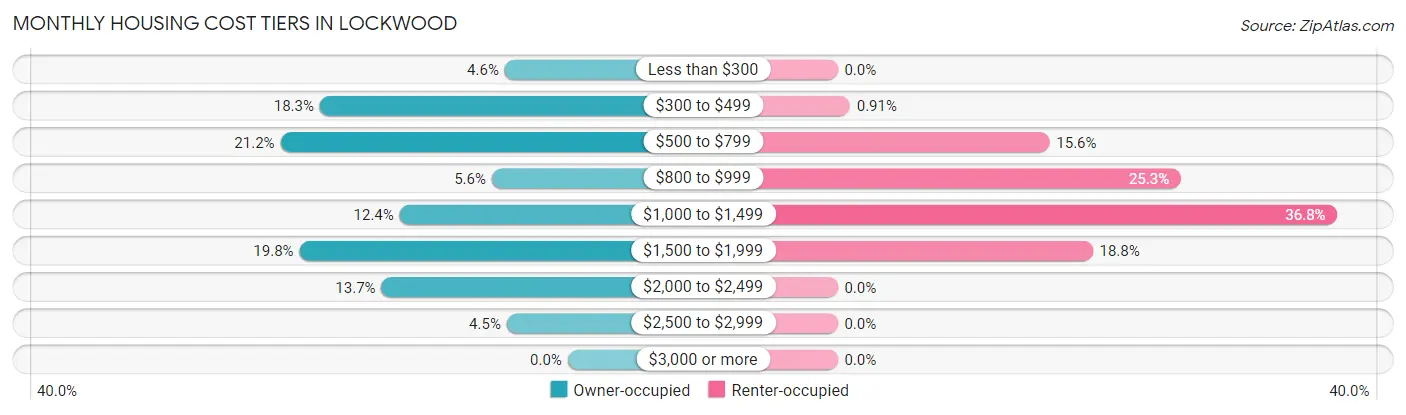
| Monthly Cost | Owner-occupied | Renter-occupied |
| Less than $300 | 93 (4.6%) | 0 (0.0%) |
| $300 to $499 | 366 (18.3%) | 6 (0.9%) |
| $500 to $799 | 424 (21.2%) | 103 (15.6%) |
| $800 to $999 | 112 (5.6%) | 167 (25.3%) |
| $1,000 to $1,499 | 248 (12.4%) | 243 (36.8%) |
| $1,500 to $1,999 | 396 (19.8%) | 124 (18.8%) |
| $2,000 to $2,499 | 275 (13.7%) | 0 (0.0%) |
| $2,500 to $2,999 | 90 (4.5%) | 0 (0.0%) |
| $3,000 or more | 0 (0.0%) | 0 (0.0%) |
| Total | 2,004 (100.0%) | 660 (100.0%) |
Physical Housing Characteristics in Lockwood
Housing Structures in Lockwood
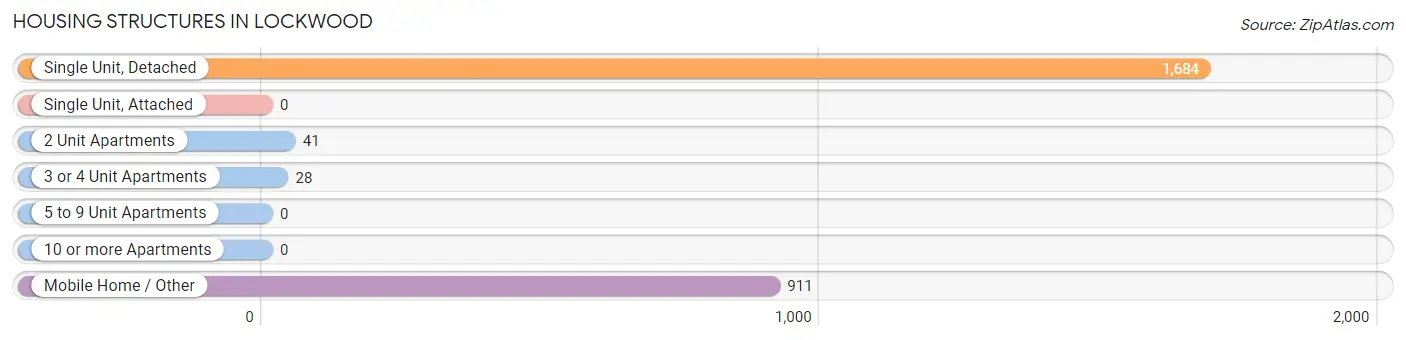
| Structure Type | # Housing Units | % Housing Units |
| Single Unit, Detached | 1,684 | 63.2% |
| Single Unit, Attached | 0 | 0.0% |
| 2 Unit Apartments | 41 | 1.5% |
| 3 or 4 Unit Apartments | 28 | 1.1% |
| 5 to 9 Unit Apartments | 0 | 0.0% |
| 10 or more Apartments | 0 | 0.0% |
| Mobile Home / Other | 911 | 34.2% |
| Total | 2,664 | 100.0% |
Housing Structures by Occupancy in Lockwood
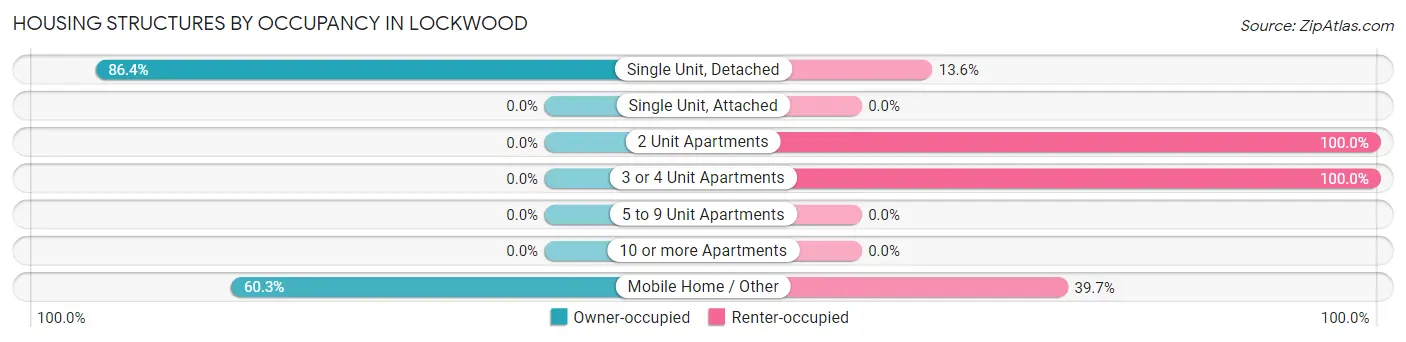
| Structure Type | Owner-occupied | Renter-occupied |
| Single Unit, Detached | 1,455 (86.4%) | 229 (13.6%) |
| Single Unit, Attached | 0 (0.0%) | 0 (0.0%) |
| 2 Unit Apartments | 0 (0.0%) | 41 (100.0%) |
| 3 or 4 Unit Apartments | 0 (0.0%) | 28 (100.0%) |
| 5 to 9 Unit Apartments | 0 (0.0%) | 0 (0.0%) |
| 10 or more Apartments | 0 (0.0%) | 0 (0.0%) |
| Mobile Home / Other | 549 (60.3%) | 362 (39.7%) |
| Total | 2,004 (75.2%) | 660 (24.8%) |
Housing Structures by Number of Rooms in Lockwood
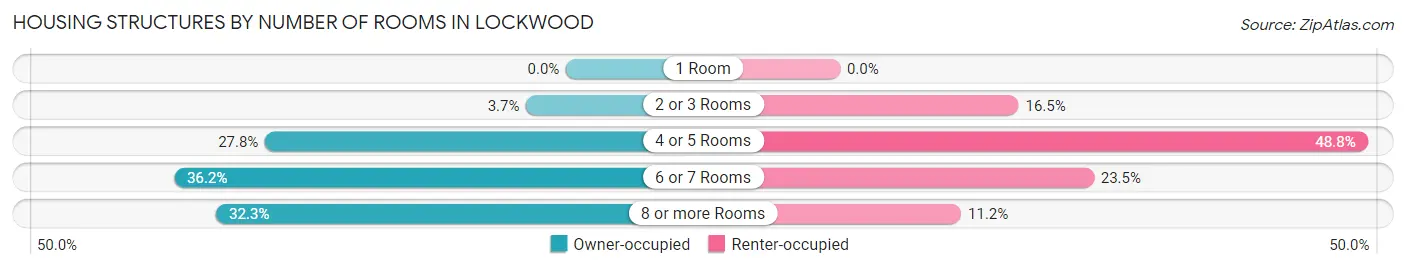
| Number of Rooms | Owner-occupied | Renter-occupied |
| 1 Room | 0 (0.0%) | 0 (0.0%) |
| 2 or 3 Rooms | 74 (3.7%) | 109 (16.5%) |
| 4 or 5 Rooms | 558 (27.8%) | 322 (48.8%) |
| 6 or 7 Rooms | 725 (36.2%) | 155 (23.5%) |
| 8 or more Rooms | 647 (32.3%) | 74 (11.2%) |
| Total | 2,004 (100.0%) | 660 (100.0%) |
Housing Structure by Heating Type in Lockwood
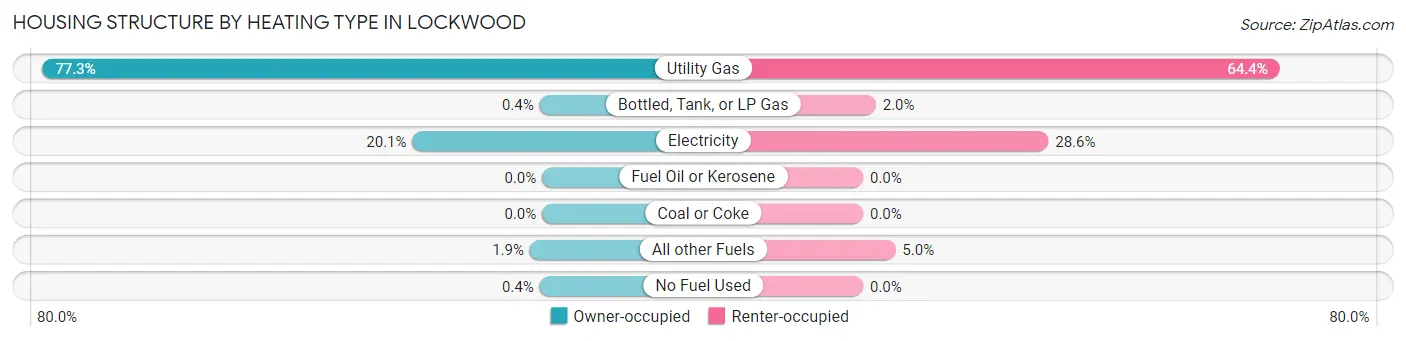
| Heating Type | Owner-occupied | Renter-occupied |
| Utility Gas | 1,548 (77.2%) | 425 (64.4%) |
| Bottled, Tank, or LP Gas | 8 (0.4%) | 13 (2.0%) |
| Electricity | 402 (20.1%) | 189 (28.6%) |
| Fuel Oil or Kerosene | 0 (0.0%) | 0 (0.0%) |
| Coal or Coke | 0 (0.0%) | 0 (0.0%) |
| All other Fuels | 38 (1.9%) | 33 (5.0%) |
| No Fuel Used | 8 (0.4%) | 0 (0.0%) |
| Total | 2,004 (100.0%) | 660 (100.0%) |
Household Vehicle Usage in Lockwood
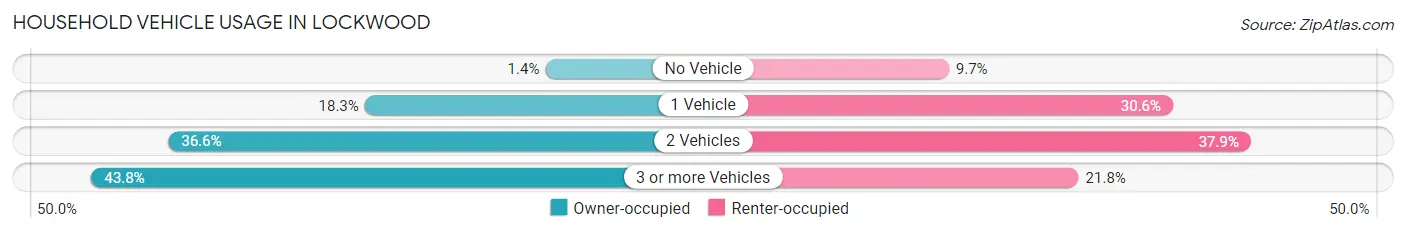
| Vehicles per Household | Owner-occupied | Renter-occupied |
| No Vehicle | 28 (1.4%) | 64 (9.7%) |
| 1 Vehicle | 366 (18.3%) | 202 (30.6%) |
| 2 Vehicles | 733 (36.6%) | 250 (37.9%) |
| 3 or more Vehicles | 877 (43.8%) | 144 (21.8%) |
| Total | 2,004 (100.0%) | 660 (100.0%) |
Real Estate & Mortgages in Lockwood
Real Estate and Mortgage Overview in Lockwood
| Characteristic | Without Mortgage | With Mortgage |
| Housing Units | 922 | 1,082 |
| Median Property Value | $106,400 | $296,700 |
| Median Household Income | $58,269 | $245 |
| Monthly Housing Costs | $507 | $0 |
| Real Estate Taxes | $1,106 | $0 |
Property Value by Mortgage Status in Lockwood
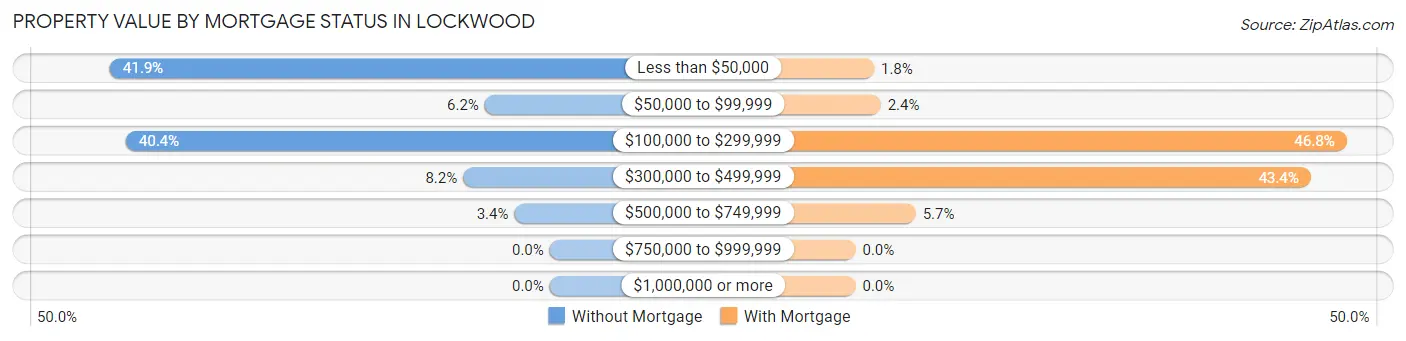
| Property Value | Without Mortgage | With Mortgage |
| Less than $50,000 | 386 (41.9%) | 19 (1.8%) |
| $50,000 to $99,999 | 57 (6.2%) | 26 (2.4%) |
| $100,000 to $299,999 | 372 (40.4%) | 506 (46.8%) |
| $300,000 to $499,999 | 76 (8.2%) | 469 (43.3%) |
| $500,000 to $749,999 | 31 (3.4%) | 62 (5.7%) |
| $750,000 to $999,999 | 0 (0.0%) | 0 (0.0%) |
| $1,000,000 or more | 0 (0.0%) | 0 (0.0%) |
| Total | 922 (100.0%) | 1,082 (100.0%) |
Household Income by Mortgage Status in Lockwood
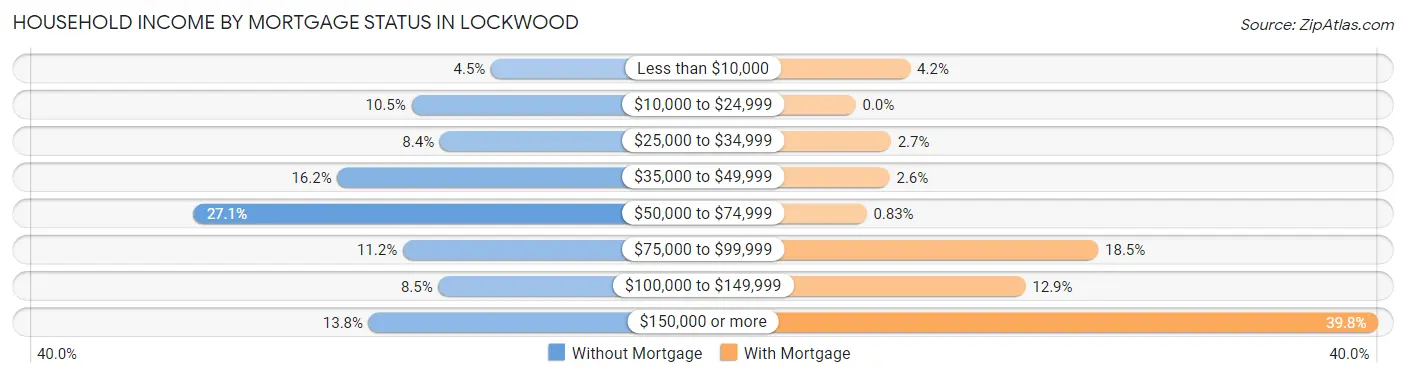
| Household Income | Without Mortgage | With Mortgage |
| Less than $10,000 | 41 (4.4%) | 45 (4.2%) |
| $10,000 to $24,999 | 97 (10.5%) | 0 (0.0%) |
| $25,000 to $34,999 | 77 (8.4%) | 29 (2.7%) |
| $35,000 to $49,999 | 149 (16.2%) | 28 (2.6%) |
| $50,000 to $74,999 | 250 (27.1%) | 9 (0.8%) |
| $75,000 to $99,999 | 103 (11.2%) | 200 (18.5%) |
| $100,000 to $149,999 | 78 (8.5%) | 140 (12.9%) |
| $150,000 or more | 127 (13.8%) | 431 (39.8%) |
| Total | 922 (100.0%) | 1,082 (100.0%) |
Property Value to Household Income Ratio in Lockwood
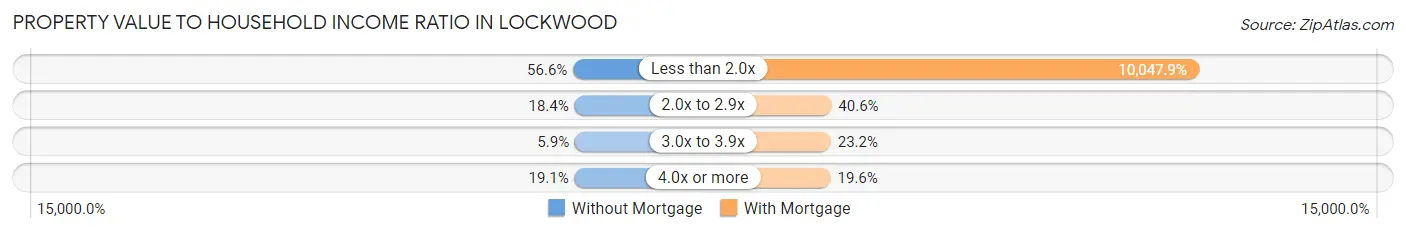
| Value-to-Income Ratio | Without Mortgage | With Mortgage |
| Less than 2.0x | 522 (56.6%) | 108,718 (10,047.9%) |
| 2.0x to 2.9x | 170 (18.4%) | 439 (40.6%) |
| 3.0x to 3.9x | 54 (5.9%) | 251 (23.2%) |
| 4.0x or more | 176 (19.1%) | 212 (19.6%) |
| Total | 922 (100.0%) | 1,082 (100.0%) |
Real Estate Taxes by Mortgage Status in Lockwood
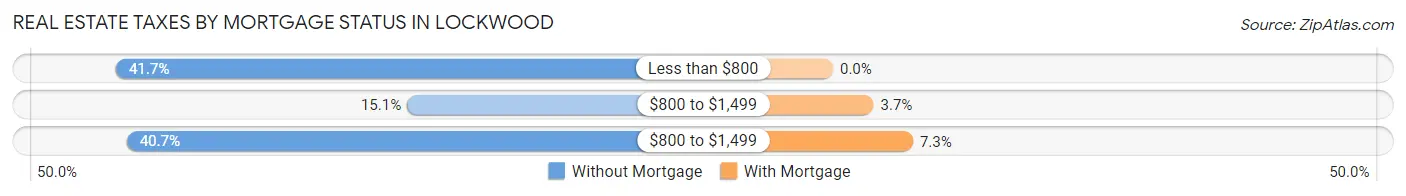
| Property Taxes | Without Mortgage | With Mortgage |
| Less than $800 | 384 (41.6%) | 0 (0.0%) |
| $800 to $1,499 | 139 (15.1%) | 40 (3.7%) |
| $800 to $1,499 | 375 (40.7%) | 79 (7.3%) |
| Total | 922 (100.0%) | 1,082 (100.0%) |
Health & Disability in Lockwood
Health Insurance Coverage by Age in Lockwood
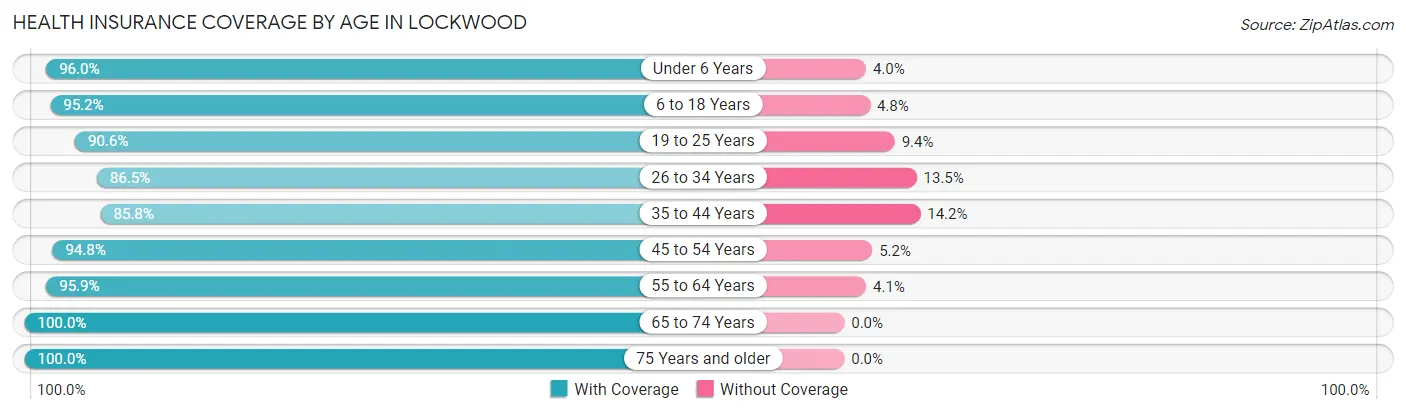
| Age Bracket | With Coverage | Without Coverage |
| Under 6 Years | 499 (96.0%) | 21 (4.0%) |
| 6 to 18 Years | 1,388 (95.2%) | 70 (4.8%) |
| 19 to 25 Years | 491 (90.6%) | 51 (9.4%) |
| 26 to 34 Years | 968 (86.5%) | 151 (13.5%) |
| 35 to 44 Years | 763 (85.8%) | 126 (14.2%) |
| 45 to 54 Years | 983 (94.8%) | 54 (5.2%) |
| 55 to 64 Years | 732 (95.9%) | 31 (4.1%) |
| 65 to 74 Years | 609 (100.0%) | 0 (0.0%) |
| 75 Years and older | 439 (100.0%) | 0 (0.0%) |
| Total | 6,872 (93.2%) | 504 (6.8%) |
Health Insurance Coverage by Citizenship Status in Lockwood
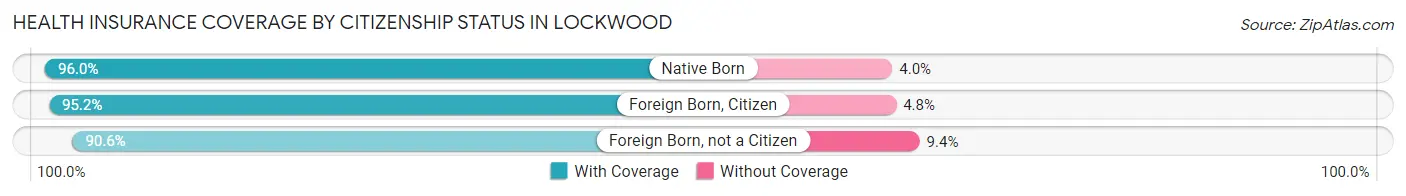
| Citizenship Status | With Coverage | Without Coverage |
| Native Born | 499 (96.0%) | 21 (4.0%) |
| Foreign Born, Citizen | 1,388 (95.2%) | 70 (4.8%) |
| Foreign Born, not a Citizen | 491 (90.6%) | 51 (9.4%) |
Health Insurance Coverage by Household Income in Lockwood
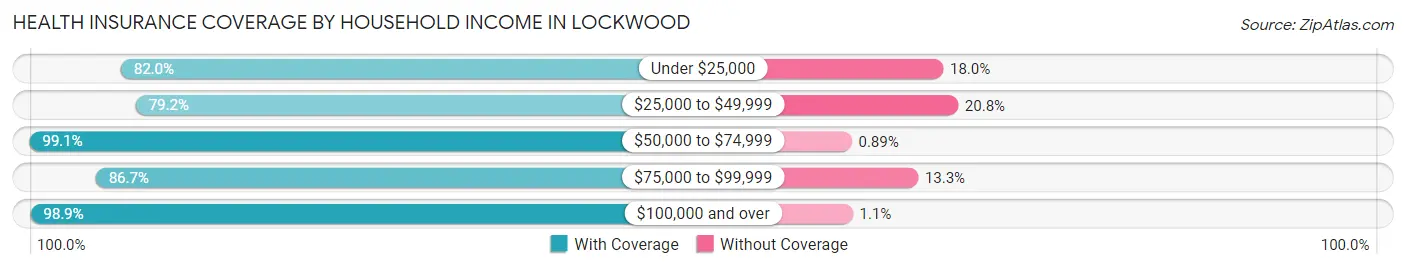
| Household Income | With Coverage | Without Coverage |
| Under $25,000 | 632 (82.0%) | 139 (18.0%) |
| $25,000 to $49,999 | 696 (79.2%) | 183 (20.8%) |
| $50,000 to $74,999 | 1,560 (99.1%) | 14 (0.9%) |
| $75,000 to $99,999 | 865 (86.7%) | 133 (13.3%) |
| $100,000 and over | 3,115 (98.9%) | 34 (1.1%) |
Public vs Private Health Insurance Coverage by Age in Lockwood
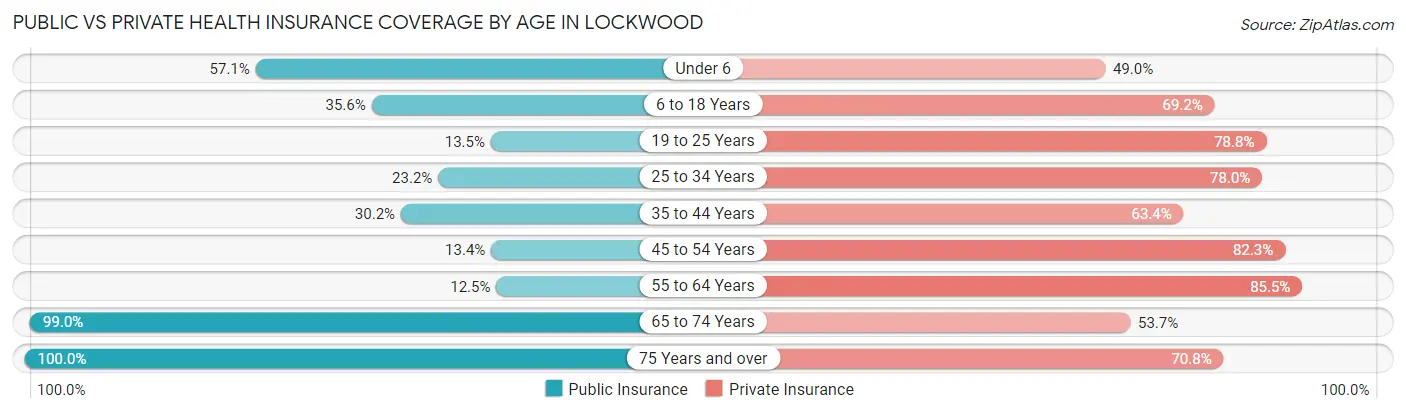
| Age Bracket | Public Insurance | Private Insurance |
| Under 6 | 297 (57.1%) | 255 (49.0%) |
| 6 to 18 Years | 519 (35.6%) | 1,009 (69.2%) |
| 19 to 25 Years | 73 (13.5%) | 427 (78.8%) |
| 25 to 34 Years | 260 (23.2%) | 873 (78.0%) |
| 35 to 44 Years | 268 (30.1%) | 564 (63.4%) |
| 45 to 54 Years | 139 (13.4%) | 853 (82.3%) |
| 55 to 64 Years | 95 (12.4%) | 652 (85.5%) |
| 65 to 74 Years | 603 (99.0%) | 327 (53.7%) |
| 75 Years and over | 439 (100.0%) | 311 (70.8%) |
| Total | 2,693 (36.5%) | 5,271 (71.5%) |
Disability Status by Sex by Age in Lockwood
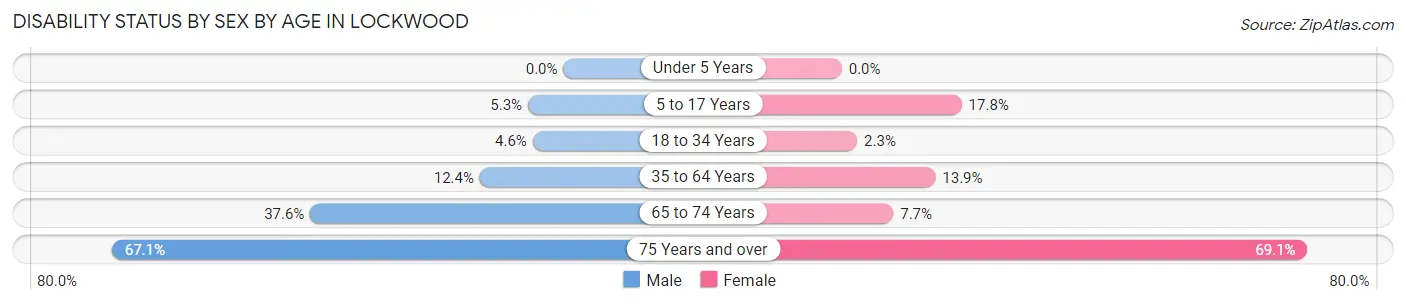
| Age Bracket | Male | Female |
| Under 5 Years | 0 (0.0%) | 0 (0.0%) |
| 5 to 17 Years | 35 (5.3%) | 120 (17.8%) |
| 18 to 34 Years | 44 (4.5%) | 21 (2.3%) |
| 35 to 64 Years | 164 (12.4%) | 190 (13.9%) |
| 65 to 74 Years | 106 (37.6%) | 25 (7.6%) |
| 75 Years and over | 177 (67.0%) | 121 (69.1%) |
Disability Class by Sex by Age in Lockwood
Disability Class: Hearing Difficulty
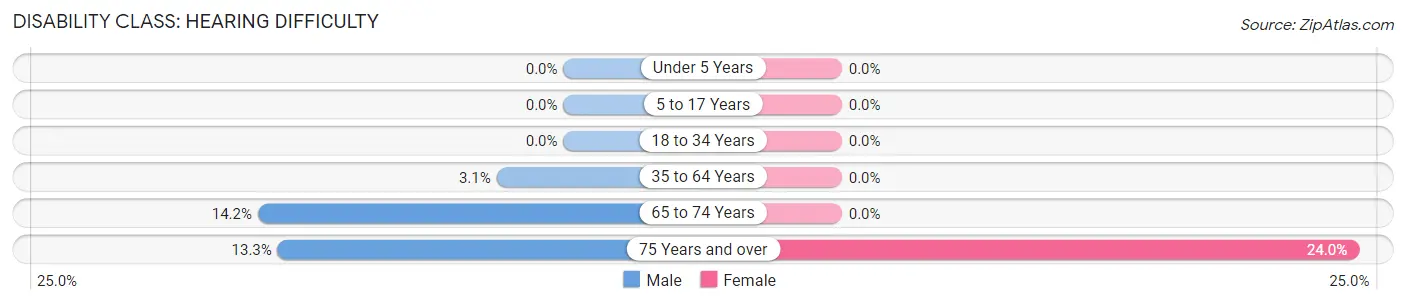
| Age Bracket | Male | Female |
| Under 5 Years | 0 (0.0%) | 0 (0.0%) |
| 5 to 17 Years | 0 (0.0%) | 0 (0.0%) |
| 18 to 34 Years | 0 (0.0%) | 0 (0.0%) |
| 35 to 64 Years | 41 (3.1%) | 0 (0.0%) |
| 65 to 74 Years | 40 (14.2%) | 0 (0.0%) |
| 75 Years and over | 35 (13.3%) | 42 (24.0%) |
Disability Class: Vision Difficulty
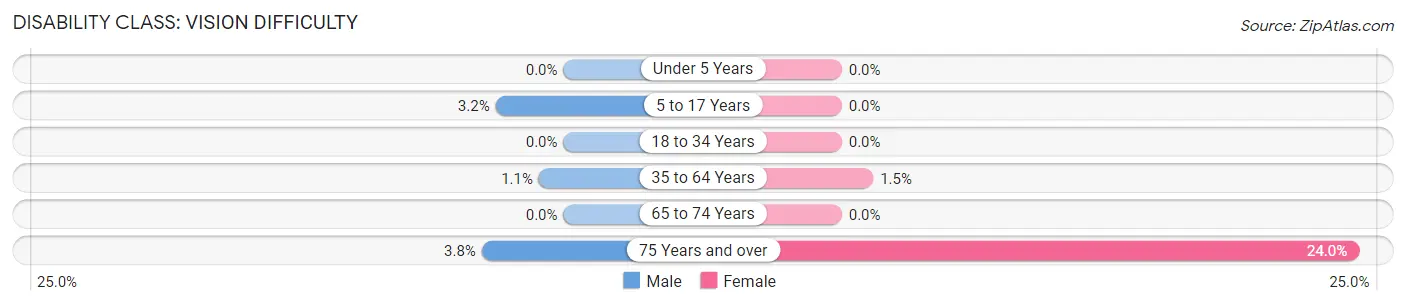
| Age Bracket | Male | Female |
| Under 5 Years | 0 (0.0%) | 0 (0.0%) |
| 5 to 17 Years | 21 (3.2%) | 0 (0.0%) |
| 18 to 34 Years | 0 (0.0%) | 0 (0.0%) |
| 35 to 64 Years | 15 (1.1%) | 20 (1.5%) |
| 65 to 74 Years | 0 (0.0%) | 0 (0.0%) |
| 75 Years and over | 10 (3.8%) | 42 (24.0%) |
Disability Class: Cognitive Difficulty
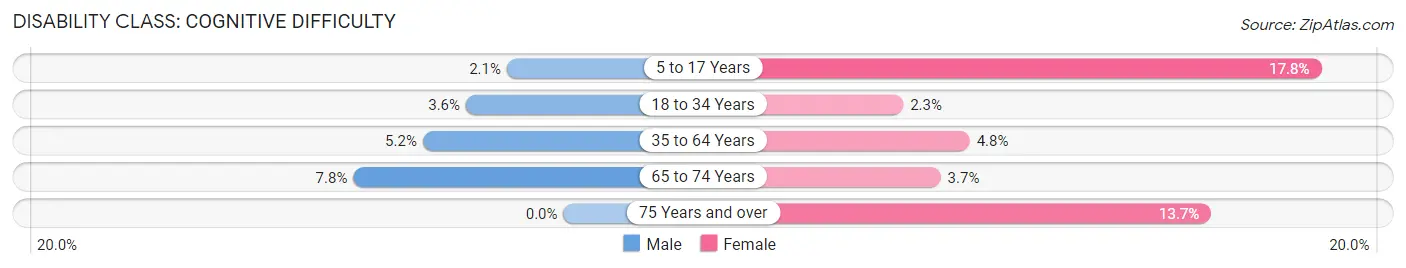
| Age Bracket | Male | Female |
| 5 to 17 Years | 14 (2.1%) | 120 (17.8%) |
| 18 to 34 Years | 35 (3.6%) | 21 (2.3%) |
| 35 to 64 Years | 69 (5.2%) | 65 (4.8%) |
| 65 to 74 Years | 22 (7.8%) | 12 (3.7%) |
| 75 Years and over | 0 (0.0%) | 24 (13.7%) |
Disability Class: Ambulatory Difficulty
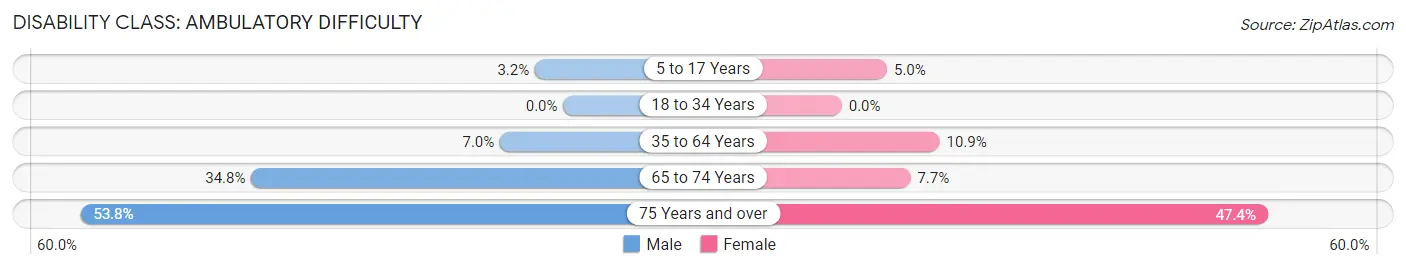
| Age Bracket | Male | Female |
| 5 to 17 Years | 21 (3.2%) | 34 (5.0%) |
| 18 to 34 Years | 0 (0.0%) | 0 (0.0%) |
| 35 to 64 Years | 93 (7.0%) | 149 (10.9%) |
| 65 to 74 Years | 98 (34.7%) | 25 (7.6%) |
| 75 Years and over | 142 (53.8%) | 83 (47.4%) |
Disability Class: Self-Care Difficulty
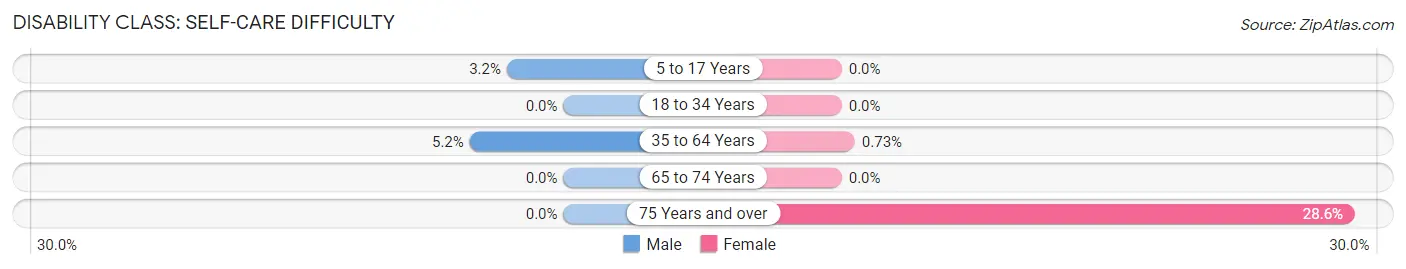
| Age Bracket | Male | Female |
| 5 to 17 Years | 21 (3.2%) | 0 (0.0%) |
| 18 to 34 Years | 0 (0.0%) | 0 (0.0%) |
| 35 to 64 Years | 69 (5.2%) | 10 (0.7%) |
| 65 to 74 Years | 0 (0.0%) | 0 (0.0%) |
| 75 Years and over | 0 (0.0%) | 50 (28.6%) |
Technology Access in Lockwood
Computing Device Access in Lockwood
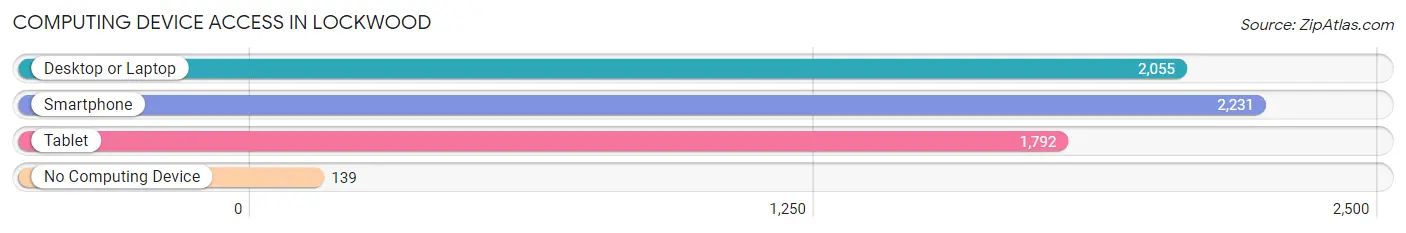
| Device Type | # Households | % Households |
| Desktop or Laptop | 2,055 | 77.1% |
| Smartphone | 2,231 | 83.8% |
| Tablet | 1,792 | 67.3% |
| No Computing Device | 139 | 5.2% |
| Total | 2,664 | 100.0% |
Internet Access in Lockwood
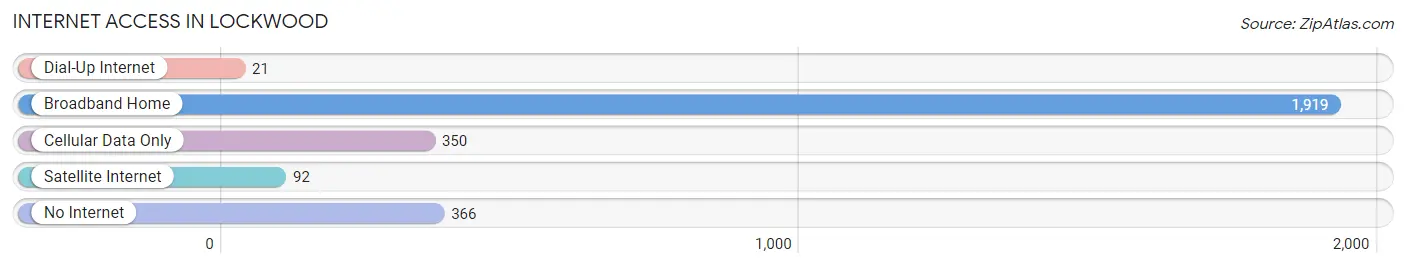
| Internet Type | # Households | % Households |
| Dial-Up Internet | 21 | 0.8% |
| Broadband Home | 1,919 | 72.0% |
| Cellular Data Only | 350 | 13.1% |
| Satellite Internet | 92 | 3.5% |
| No Internet | 366 | 13.7% |
| Total | 2,664 | 100.0% |
Lockwood Summary
Lockwood is an unincorporated community located in Yellowstone County, Montana. It is located just east of Billings, the largest city in the state. The population of Lockwood was estimated to be 8,845 in 2019.
History
The area that is now Lockwood was first settled in the late 1800s by homesteaders. The first post office was established in 1883 and the town was officially incorporated in 1887. The town was named after a local rancher, John Lockwood.
In the early 1900s, Lockwood was a thriving agricultural community. The town was home to several grain elevators, a creamery, and a flour mill. The town also had a hotel, a bank, and a general store.
In the 1950s, Lockwood began to experience a population boom as people moved to the area for jobs in the oil and gas industry. The town was also home to a large military base, which provided jobs for many of the residents.
Geography
Lockwood is located in the Yellowstone Valley, which is part of the larger Yellowstone River Valley. The town is situated on the banks of the Yellowstone River, which is the longest river in the United States. The town is surrounded by rolling hills and is located at an elevation of 3,400 feet.
The climate in Lockwood is semi-arid, with hot summers and cold winters. The average annual temperature is 48°F and the average annual precipitation is 13.5 inches.
Economy
The economy of Lockwood is largely based on agriculture and oil and gas production. The town is home to several grain elevators, a flour mill, and a creamery. The town is also home to several oil and gas companies, which provide jobs for many of the residents.
The town is also home to several small businesses, including restaurants, retail stores, and auto repair shops. The town is also home to a large military base, which provides jobs for many of the residents.
Demographics
The population of Lockwood was estimated to be 8,845 in 2019. The population is largely white (90.3%), with small percentages of African American (2.2%), Native American (1.2%), Asian (1.1%), and Hispanic (2.2%) residents.
The median household income in Lockwood is $50,945, which is slightly lower than the national median of $57,652. The median home value in Lockwood is $179,400, which is slightly higher than the national median of $184,700.
Conclusion
Lockwood is an unincorporated community located in Yellowstone County, Montana. It is located just east of Billings, the largest city in the state. The population of Lockwood was estimated to be 8,845 in 2019. The town is largely agricultural and oil and gas based, and is home to several small businesses. The population is largely white, with small percentages of African American, Native American, Asian, and Hispanic residents. The median household income in Lockwood is $50,945, and the median home value is $179,400.
Common Questions
What is Per Capita Income in Lockwood?
Per Capita income in Lockwood is $34,326.
What is the Median Family Income in Lockwood?
Median Family Income in Lockwood is $81,109.
What is the Median Household income in Lockwood?
Median Household Income in Lockwood is $73,625.
What is Income or Wage Gap in Lockwood?
Income or Wage Gap in Lockwood is 29.6%.
Women in Lockwood earn 70.4 cents for every dollar earned by a man.
What is Inequality or Gini Index in Lockwood?
Inequality or Gini Index in Lockwood is 0.41.
What is the Total Population of Lockwood?
Total Population of Lockwood is 7,393.
What is the Total Male Population of Lockwood?
Total Male Population of Lockwood is 3,785.
What is the Total Female Population of Lockwood?
Total Female Population of Lockwood is 3,608.
What is the Ratio of Males per 100 Females in Lockwood?
There are 104.91 Males per 100 Females in Lockwood.
What is the Ratio of Females per 100 Males in Lockwood?
There are 95.32 Females per 100 Males in Lockwood.
What is the Median Population Age in Lockwood?
Median Population Age in Lockwood is 35.4 Years.
What is the Average Family Size in Lockwood
Average Family Size in Lockwood is 3.0 People.
What is the Average Household Size in Lockwood
Average Household Size in Lockwood is 2.8 People.
How Large is the Labor Force in Lockwood?
There are 4,080 People in the Labor Forcein in Lockwood.
What is the Percentage of People in the Labor Force in Lockwood?
70.0% of People are in the Labor Force in Lockwood.
What is the Unemployment Rate in Lockwood?
Unemployment Rate in Lockwood is 3.8%.