North Spearfish, SD Map & Demographics
North Spearfish Map
North Spearfish Overview
$34,115
PER CAPITA INCOME
$81,800
AVG FAMILY INCOME
$67,736
AVG HOUSEHOLD INCOME
32.9%
WAGE / INCOME GAP [ % ]
67.1¢/ $1
WAGE / INCOME GAP [ $ ]
0.39
INEQUALITY / GINI INDEX
1,791
TOTAL POPULATION
833
MALE POPULATION
958
FEMALE POPULATION
86.95
MALES / 100 FEMALES
115.01
FEMALES / 100 MALES
44.2
MEDIAN AGE
2.9
AVG FAMILY SIZE
2.4
AVG HOUSEHOLD SIZE
1,114
LABOR FORCE [ PEOPLE ]
75.3%
PERCENT IN LABOR FORCE
1.1%
UNEMPLOYMENT RATE
Income in North Spearfish
Income Overview in North Spearfish
Per Capita Income in North Spearfish is $34,115, while median incomes of families and households are $81,800 and $67,736 respectively.
| Characteristic | Number | Measure |
| Per Capita Income | 1,791 | $34,115 |
| Median Family Income | 488 | $81,800 |
| Mean Family Income | 488 | $97,836 |
| Median Household Income | 749 | $67,736 |
| Mean Household Income | 749 | $79,413 |
| Income Deficit | 488 | $0 |
| Wage / Income Gap (%) | 1,791 | 32.88% |
| Wage / Income Gap ($) | 1,791 | 67.12¢ per $1 |
| Gini / Inequality Index | 1,791 | 0.39 |
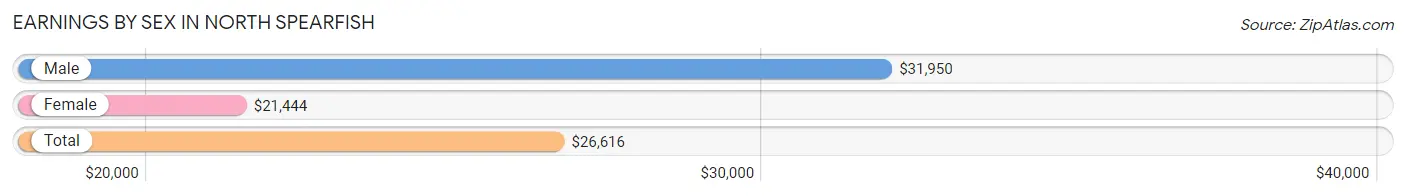
Earnings by Sex in North Spearfish
Average Earnings in North Spearfish are $26,616, $31,950 for men and $21,444 for women, a difference of 32.9%.
| Sex | Number | Average Earnings |
| Male | 517 (45.5%) | $31,950 |
| Female | 620 (54.5%) | $21,444 |
| Total | 1,137 (100.0%) | $26,616 |
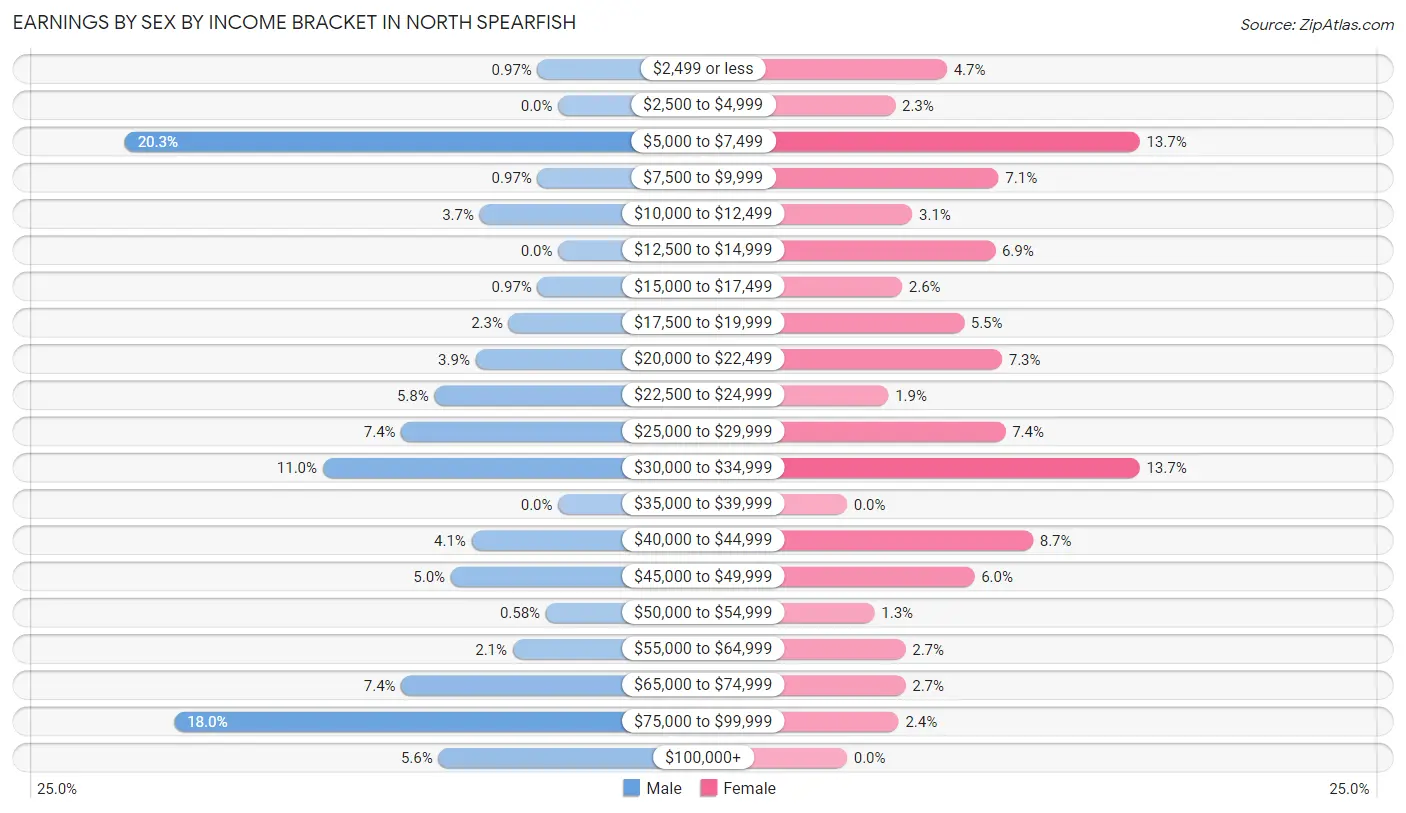
Earnings by Sex by Income Bracket in North Spearfish
The most common earnings brackets in North Spearfish are $5,000 to $7,499 for men (105 | 20.3%) and $5,000 to $7,499 for women (85 | 13.7%).
| Income | Male | Female |
| $2,499 or less | 5 (1.0%) | 29 (4.7%) |
| $2,500 to $4,999 | 0 (0.0%) | 14 (2.3%) |
| $5,000 to $7,499 | 105 (20.3%) | 85 (13.7%) |
| $7,500 to $9,999 | 5 (1.0%) | 44 (7.1%) |
| $10,000 to $12,499 | 19 (3.7%) | 19 (3.1%) |
| $12,500 to $14,999 | 0 (0.0%) | 43 (6.9%) |
| $15,000 to $17,499 | 5 (1.0%) | 16 (2.6%) |
| $17,500 to $19,999 | 12 (2.3%) | 34 (5.5%) |
| $20,000 to $22,499 | 20 (3.9%) | 45 (7.3%) |
| $22,500 to $24,999 | 30 (5.8%) | 12 (1.9%) |
| $25,000 to $29,999 | 38 (7.3%) | 46 (7.4%) |
| $30,000 to $34,999 | 57 (11.0%) | 85 (13.7%) |
| $35,000 to $39,999 | 0 (0.0%) | 0 (0.0%) |
| $40,000 to $44,999 | 21 (4.1%) | 54 (8.7%) |
| $45,000 to $49,999 | 26 (5.0%) | 37 (6.0%) |
| $50,000 to $54,999 | 3 (0.6%) | 8 (1.3%) |
| $55,000 to $64,999 | 11 (2.1%) | 17 (2.7%) |
| $65,000 to $74,999 | 38 (7.3%) | 17 (2.7%) |
| $75,000 to $99,999 | 93 (18.0%) | 15 (2.4%) |
| $100,000+ | 29 (5.6%) | 0 (0.0%) |
| Total | 517 (100.0%) | 620 (100.0%) |
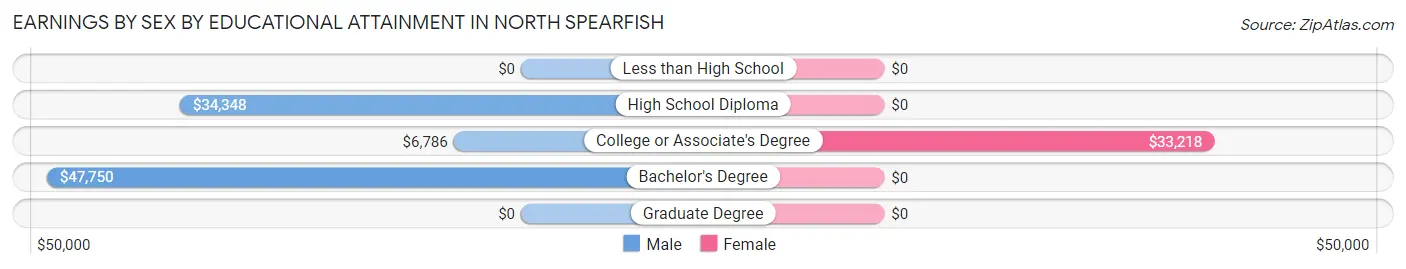
Earnings by Sex by Educational Attainment in North Spearfish
Average earnings in North Spearfish are $33,315 for men and $31,500 for women, a difference of 5.4%. Men with an educational attainment of bachelor's degree enjoy the highest average annual earnings of $47,750, while those with college or associate's degree education earn the least with $6,786. Women with an educational attainment of college or associate's degree earn the most with the average annual earnings of $33,218, while those with college or associate's degree education have the smallest earnings of $33,218.
| Educational Attainment | Male Income | Female Income |
| Less than High School | - | - |
| High School Diploma | $34,348 | $0 |
| College or Associate's Degree | $6,786 | $33,218 |
| Bachelor's Degree | $47,750 | $0 |
| Graduate Degree | - | - |
| Total | $33,315 | $31,500 |
Family Income in North Spearfish
Family Income Brackets in North Spearfish
According to the North Spearfish family income data, there are 146 families falling into the $100,000 to $149,999 income range, which is the most common income bracket and makes up 29.9% of all families.
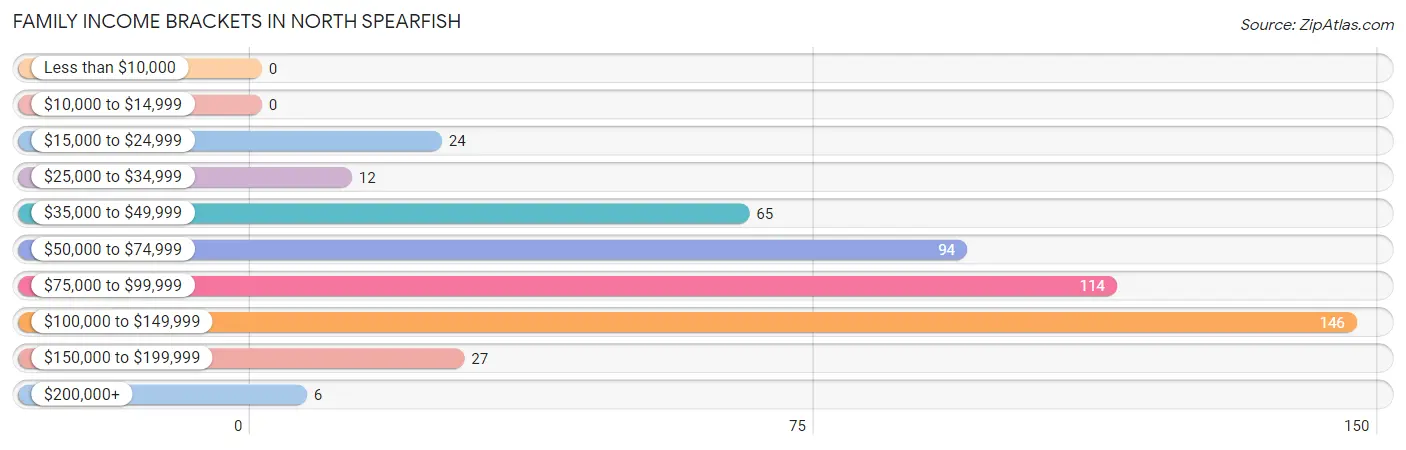
| Income Bracket | # Families | % Families |
| Less than $10,000 | 0 | 0.0% |
| $10,000 to $14,999 | 0 | 0.0% |
| $15,000 to $24,999 | 24 | 4.9% |
| $25,000 to $34,999 | 12 | 2.5% |
| $35,000 to $49,999 | 65 | 13.3% |
| $50,000 to $74,999 | 94 | 19.3% |
| $75,000 to $99,999 | 114 | 23.4% |
| $100,000 to $149,999 | 146 | 29.9% |
| $150,000 to $199,999 | 27 | 5.5% |
| $200,000+ | 6 | 1.2% |
Family Income by Famaliy Size in North Spearfish
3-person families (138 | 28.3%) account for the highest median family income in North Spearfish with $126,071 per family, while 3-person families (138 | 28.3%) have the highest median income of $42,024 per family member.
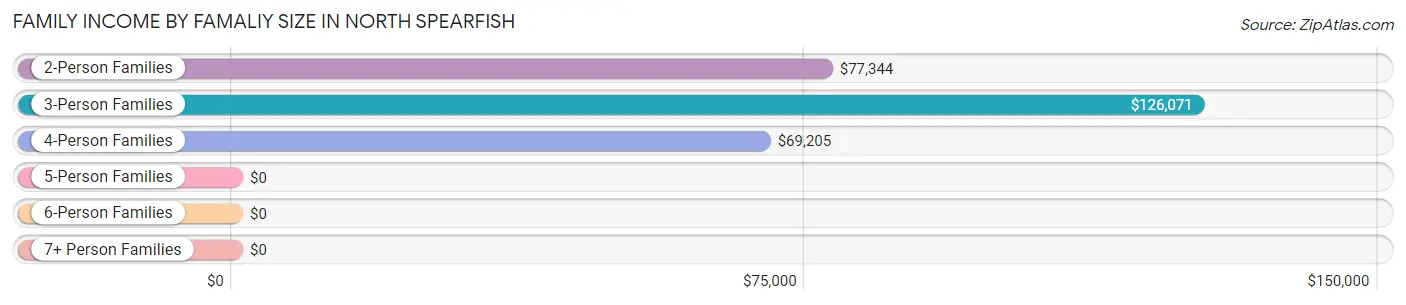
| Income Bracket | # Families | Median Income |
| 2-Person Families | 285 (58.4%) | $77,344 |
| 3-Person Families | 138 (28.3%) | $126,071 |
| 4-Person Families | 39 (8.0%) | $69,205 |
| 5-Person Families | 26 (5.3%) | $0 |
| 6-Person Families | 0 (0.0%) | $0 |
| 7+ Person Families | 0 (0.0%) | $0 |
| Total | 488 (100.0%) | $81,800 |
Family Income by Number of Earners in North Spearfish
The median family income in North Spearfish is $81,800, with families comprising 3+ earners (66) having the highest median family income of $125,536, while families with 1 earner (111) have the lowest median family income of $49,345, accounting for 13.5% and 22.8% of families, respectively.
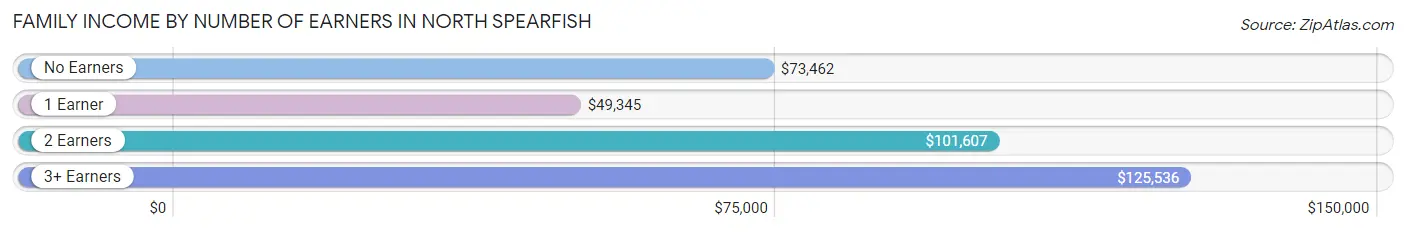
| Number of Earners | # Families | Median Income |
| No Earners | 84 (17.2%) | $73,462 |
| 1 Earner | 111 (22.8%) | $49,345 |
| 2 Earners | 227 (46.5%) | $101,607 |
| 3+ Earners | 66 (13.5%) | $125,536 |
| Total | 488 (100.0%) | $81,800 |
Household Income in North Spearfish
Household Income Brackets in North Spearfish
With 164 households falling in the category, the $25,000 to $34,999 income range is the most frequent in North Spearfish, accounting for 21.9% of all households.
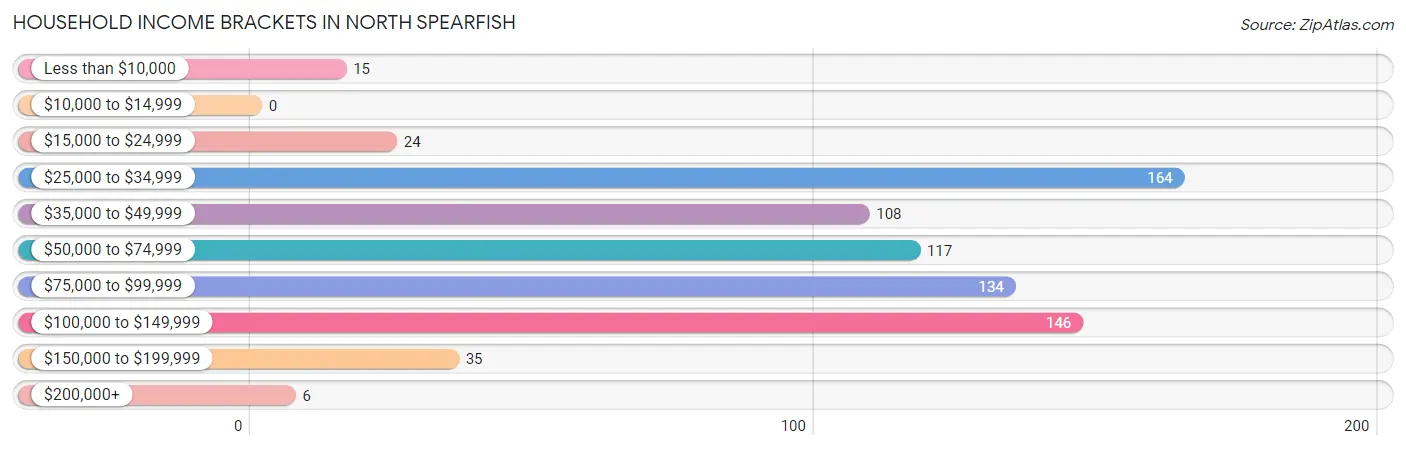
| Income Bracket | # Households | % Households |
| Less than $10,000 | 15 | 2.0% |
| $10,000 to $14,999 | 0 | 0.0% |
| $15,000 to $24,999 | 24 | 3.2% |
| $25,000 to $34,999 | 164 | 21.9% |
| $35,000 to $49,999 | 108 | 14.4% |
| $50,000 to $74,999 | 117 | 15.6% |
| $75,000 to $99,999 | 134 | 17.9% |
| $100,000 to $149,999 | 146 | 19.5% |
| $150,000 to $199,999 | 35 | 4.7% |
| $200,000+ | 6 | 0.8% |
Household Income by Householder Age in North Spearfish
The median household income in North Spearfish is $67,736, with the highest median household income of $76,786 found in the 65+ years age bracket for the primary householder. A total of 278 households (37.1%) fall into this category. Meanwhile, the 45 to 64 years age bracket for the primary householder has the lowest median household income of $0, with 271 households (36.2%) in this group.
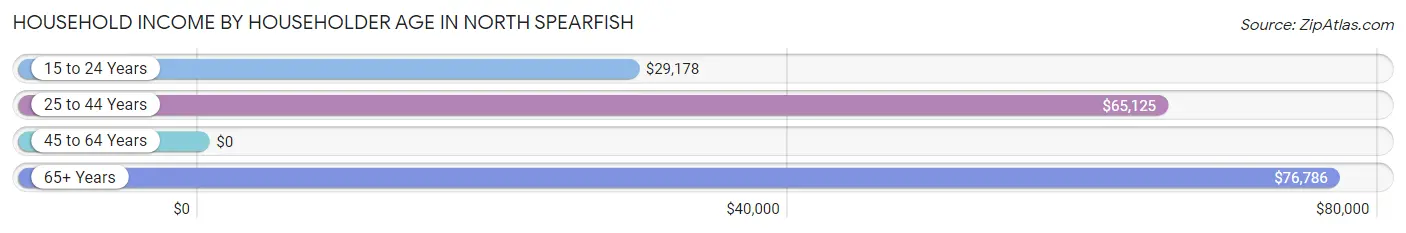
| Income Bracket | # Households | Median Income |
| 15 to 24 Years | 77 (10.3%) | $29,178 |
| 25 to 44 Years | 123 (16.4%) | $65,125 |
| 45 to 64 Years | 271 (36.2%) | $0 |
| 65+ Years | 278 (37.1%) | $76,786 |
| Total | 749 (100.0%) | $67,736 |
Poverty in North Spearfish
Income Below Poverty by Sex and Age in North Spearfish
With 6.8% poverty level for males and 11.2% for females among the residents of North Spearfish, 15 year old males and 18 to 24 year old females are the most vulnerable to poverty, with 15 males (100.0%) and 46 females (41.1%) in their respective age groups living below the poverty level.
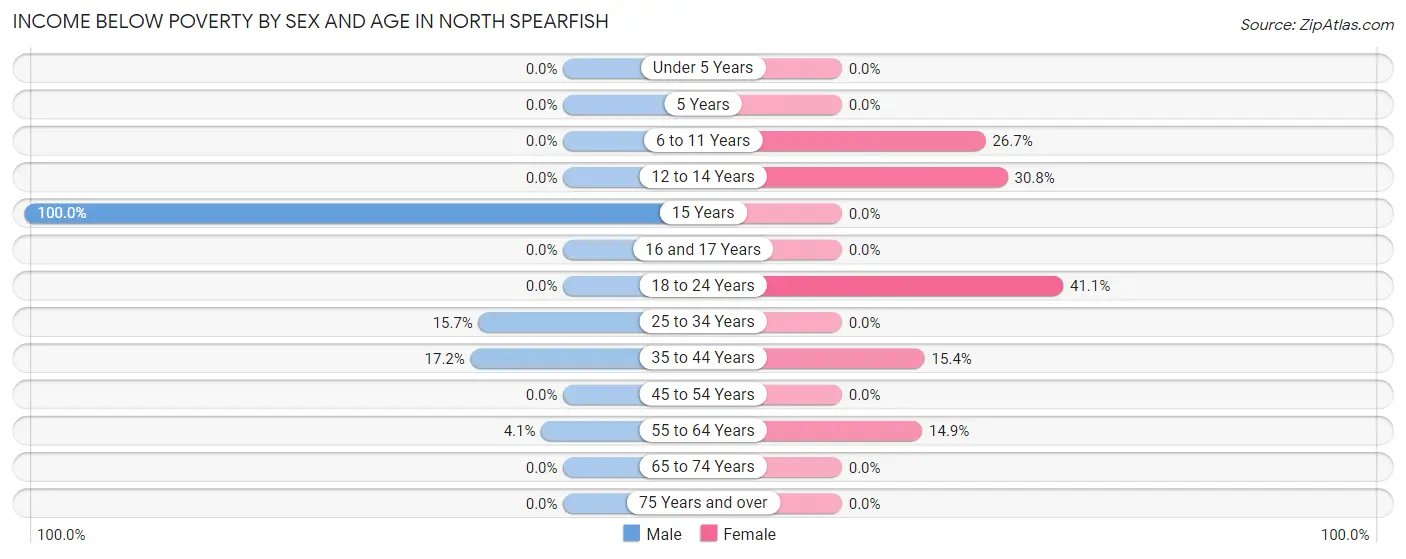
| Age Bracket | Male | Female |
| Under 5 Years | 0 (0.0%) | 0 (0.0%) |
| 5 Years | 0 (0.0%) | 0 (0.0%) |
| 6 to 11 Years | 0 (0.0%) | 16 (26.7%) |
| 12 to 14 Years | 0 (0.0%) | 16 (30.8%) |
| 15 Years | 15 (100.0%) | 0 (0.0%) |
| 16 and 17 Years | 0 (0.0%) | 0 (0.0%) |
| 18 to 24 Years | 0 (0.0%) | 46 (41.1%) |
| 25 to 34 Years | 11 (15.7%) | 0 (0.0%) |
| 35 to 44 Years | 26 (17.2%) | 12 (15.4%) |
| 45 to 54 Years | 0 (0.0%) | 0 (0.0%) |
| 55 to 64 Years | 5 (4.1%) | 17 (14.9%) |
| 65 to 74 Years | 0 (0.0%) | 0 (0.0%) |
| 75 Years and over | 0 (0.0%) | 0 (0.0%) |
| Total | 57 (6.8%) | 107 (11.2%) |
Income Above Poverty by Sex and Age in North Spearfish
According to the poverty statistics in North Spearfish, males aged 5 years and females aged under 5 years are the age groups that are most secure financially, with 100.0% of males and 100.0% of females in these age groups living above the poverty line.
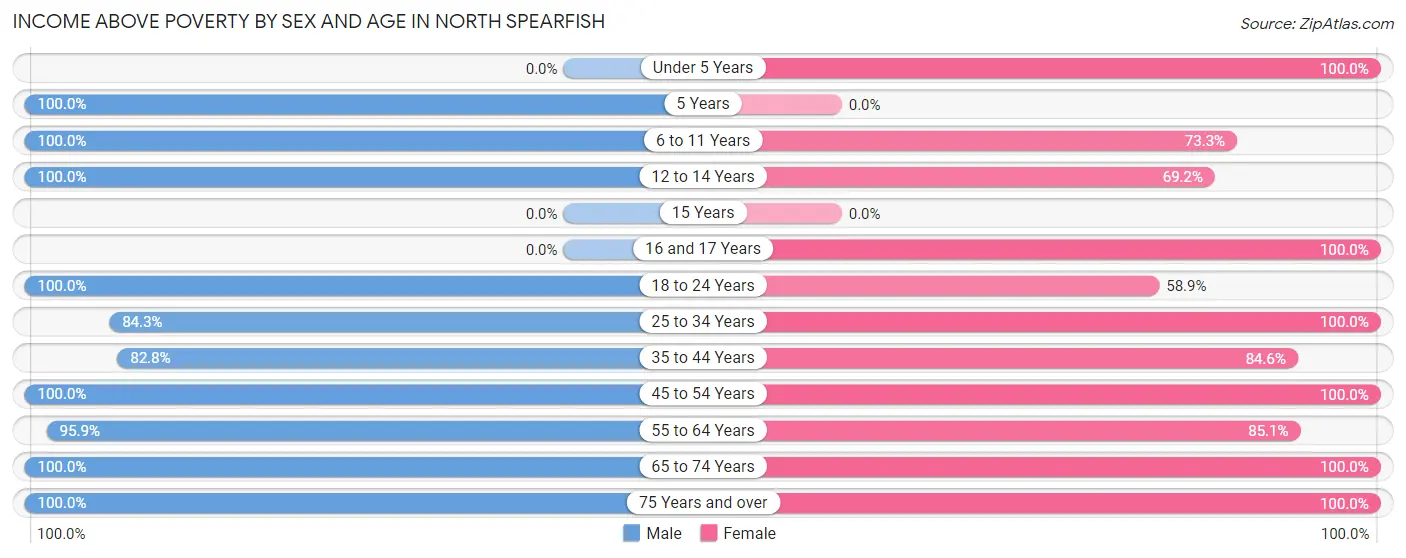
| Age Bracket | Male | Female |
| Under 5 Years | 0 (0.0%) | 52 (100.0%) |
| 5 Years | 23 (100.0%) | 0 (0.0%) |
| 6 to 11 Years | 54 (100.0%) | 44 (73.3%) |
| 12 to 14 Years | 55 (100.0%) | 36 (69.2%) |
| 15 Years | 0 (0.0%) | 0 (0.0%) |
| 16 and 17 Years | 0 (0.0%) | 70 (100.0%) |
| 18 to 24 Years | 74 (100.0%) | 66 (58.9%) |
| 25 to 34 Years | 59 (84.3%) | 60 (100.0%) |
| 35 to 44 Years | 125 (82.8%) | 66 (84.6%) |
| 45 to 54 Years | 45 (100.0%) | 119 (100.0%) |
| 55 to 64 Years | 117 (95.9%) | 97 (85.1%) |
| 65 to 74 Years | 170 (100.0%) | 191 (100.0%) |
| 75 Years and over | 54 (100.0%) | 50 (100.0%) |
| Total | 776 (93.2%) | 851 (88.8%) |
Income Below Poverty Among Married-Couple Families in North Spearfish
The poverty statistics for married-couple families in North Spearfish show that 2.9% or 12 of the total 410 families live below the poverty line. Families with 3 or 4 children have the highest poverty rate of 46.2%, comprising of 12 families. On the other hand, families with no children have the lowest poverty rate of 0.0%, which includes 0 families.
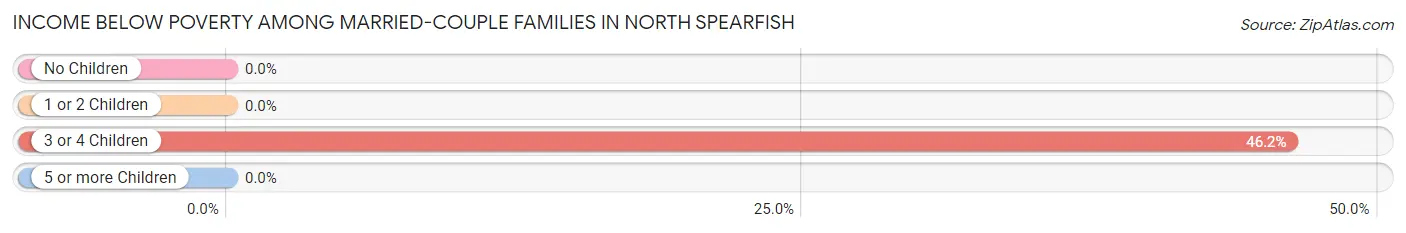
| Children | Above Poverty | Below Poverty |
| No Children | 286 (100.0%) | 0 (0.0%) |
| 1 or 2 Children | 98 (100.0%) | 0 (0.0%) |
| 3 or 4 Children | 14 (53.8%) | 12 (46.2%) |
| 5 or more Children | 0 (0.0%) | 0 (0.0%) |
| Total | 398 (97.1%) | 12 (2.9%) |
Income Below Poverty Among Single-Parent Households in North Spearfish
| Children | Single Father | Single Mother |
| No Children | 0 (0.0%) | 0 (0.0%) |
| 1 or 2 Children | 0 (0.0%) | 0 (0.0%) |
| 3 or 4 Children | 0 (0.0%) | 0 (0.0%) |
| 5 or more Children | 0 (0.0%) | 0 (0.0%) |
| Total | 0 (0.0%) | 0 (0.0%) |
Income Below Poverty Among Married-Couple vs Single-Parent Households in North Spearfish
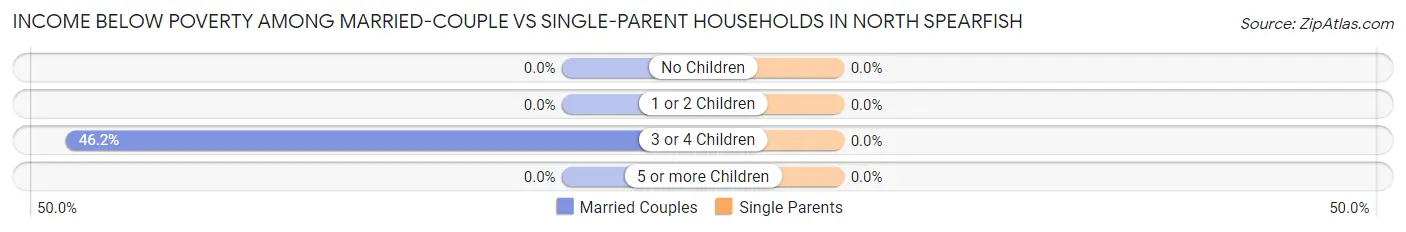
| Children | Married-Couple Families | Single-Parent Households |
| No Children | 0 (0.0%) | 0 (0.0%) |
| 1 or 2 Children | 0 (0.0%) | 0 (0.0%) |
| 3 or 4 Children | 12 (46.2%) | 0 (0.0%) |
| 5 or more Children | 0 (0.0%) | 0 (0.0%) |
| Total | 12 (2.9%) | 0 (0.0%) |
Race in North Spearfish
The most populous races in North Spearfish are White / Caucasian (1,700 | 94.9%), Hispanic or Latino (137 | 7.6%), and Two or more Races (51 | 2.9%).
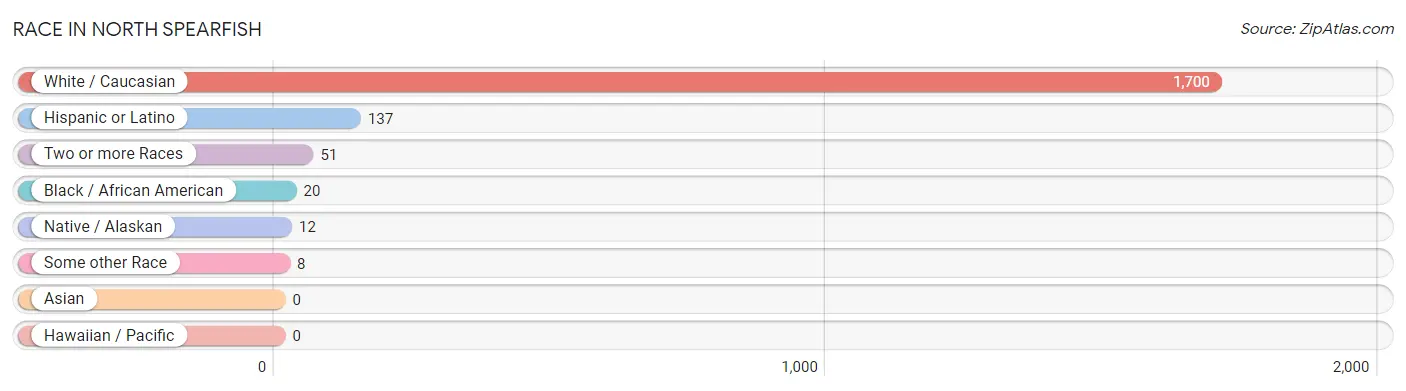
| Race | # Population | % Population |
| Asian | 0 | 0.0% |
| Black / African American | 20 | 1.1% |
| Hawaiian / Pacific | 0 | 0.0% |
| Hispanic or Latino | 137 | 7.6% |
| Native / Alaskan | 12 | 0.7% |
| White / Caucasian | 1,700 | 94.9% |
| Two or more Races | 51 | 2.9% |
| Some other Race | 8 | 0.4% |
| Total | 1,791 | 100.0% |
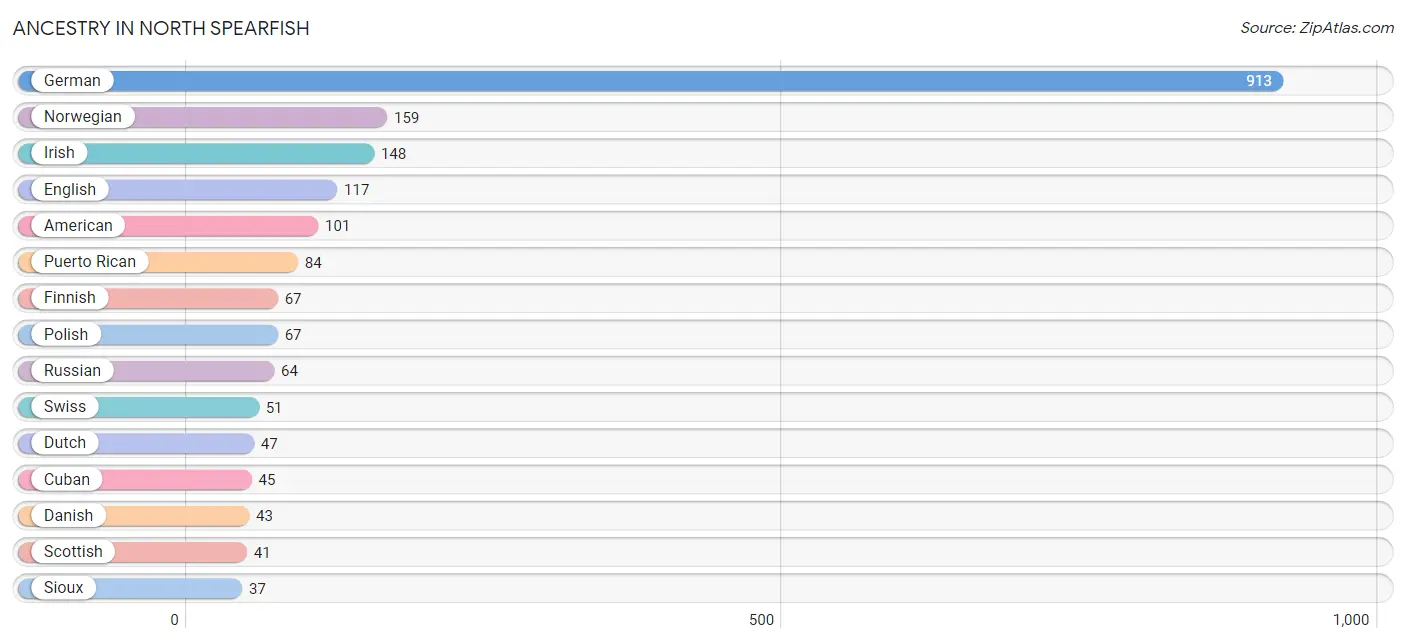
Ancestry in North Spearfish
The most populous ancestries reported in North Spearfish are German (913 | 51.0%), Norwegian (159 | 8.9%), Irish (148 | 8.3%), English (117 | 6.5%), and American (101 | 5.6%), together accounting for 80.3% of all North Spearfish residents.
| Ancestry | # Population | % Population |
| American | 101 | 5.6% |
| Belgian | 14 | 0.8% |
| British | 16 | 0.9% |
| Cuban | 45 | 2.5% |
| Czech | 18 | 1.0% |
| Danish | 43 | 2.4% |
| Dutch | 47 | 2.6% |
| English | 117 | 6.5% |
| Finnish | 67 | 3.7% |
| French Canadian | 23 | 1.3% |
| German | 913 | 51.0% |
| Irish | 148 | 8.3% |
| Italian | 20 | 1.1% |
| Lithuanian | 24 | 1.3% |
| Macedonian | 9 | 0.5% |
| Mexican | 8 | 0.4% |
| Northern European | 7 | 0.4% |
| Norwegian | 159 | 8.9% |
| Polish | 67 | 3.7% |
| Puerto Rican | 84 | 4.7% |
| Russian | 64 | 3.6% |
| Scotch-Irish | 7 | 0.4% |
| Scottish | 41 | 2.3% |
| Sioux | 37 | 2.1% |
| Slovak | 14 | 0.8% |
| Swedish | 28 | 1.6% |
| Swiss | 51 | 2.9% |
| Welsh | 17 | 0.9% | View All 28 Rows |
Immigrants in North Spearfish

| Immigration Origin | # Population | % Population | View All 0 Rows |
Sex and Age in North Spearfish
Sex and Age in North Spearfish
The most populous age groups in North Spearfish are 35 to 39 Years (133 | 16.0%) for men and 65 to 69 Years (137 | 14.3%) for women.
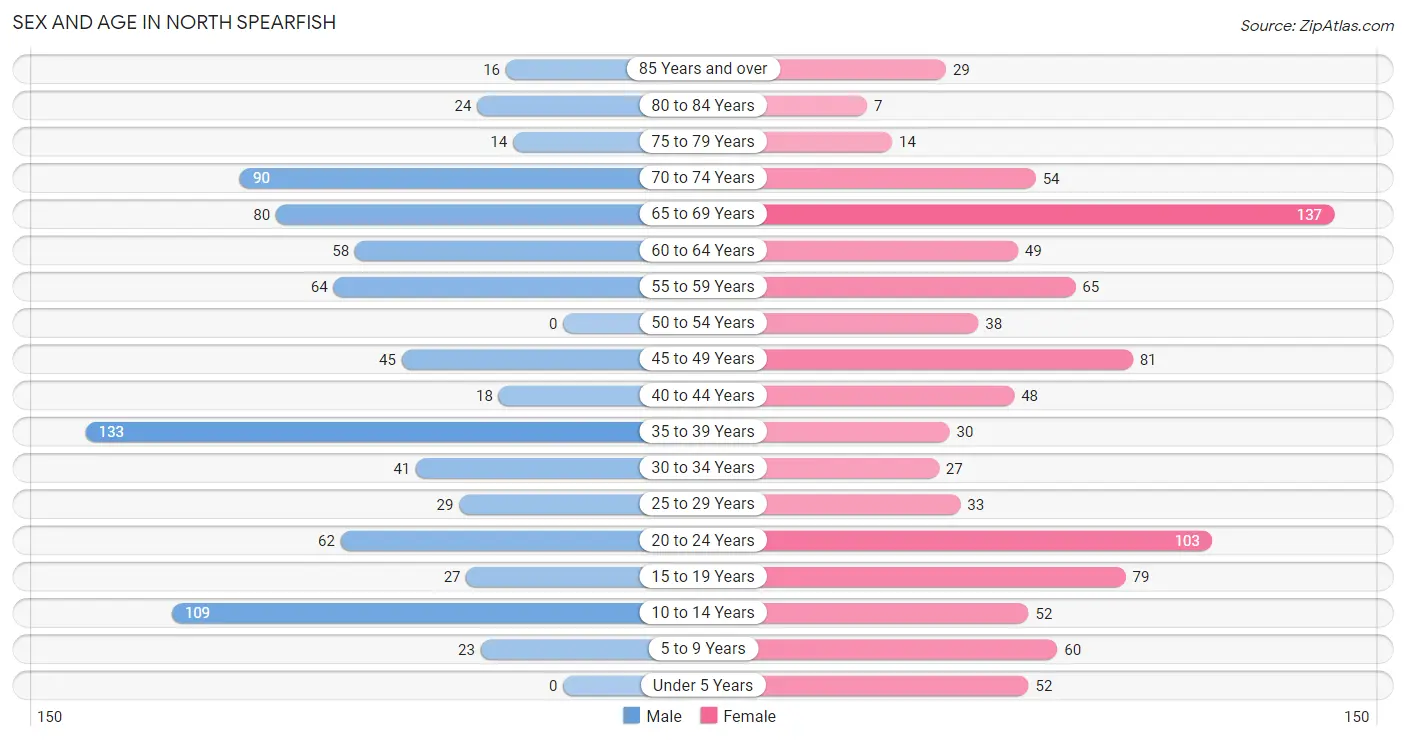
| Age Bracket | Male | Female |
| Under 5 Years | 0 (0.0%) | 52 (5.4%) |
| 5 to 9 Years | 23 (2.8%) | 60 (6.3%) |
| 10 to 14 Years | 109 (13.1%) | 52 (5.4%) |
| 15 to 19 Years | 27 (3.2%) | 79 (8.3%) |
| 20 to 24 Years | 62 (7.4%) | 103 (10.7%) |
| 25 to 29 Years | 29 (3.5%) | 33 (3.4%) |
| 30 to 34 Years | 41 (4.9%) | 27 (2.8%) |
| 35 to 39 Years | 133 (16.0%) | 30 (3.1%) |
| 40 to 44 Years | 18 (2.2%) | 48 (5.0%) |
| 45 to 49 Years | 45 (5.4%) | 81 (8.5%) |
| 50 to 54 Years | 0 (0.0%) | 38 (4.0%) |
| 55 to 59 Years | 64 (7.7%) | 65 (6.8%) |
| 60 to 64 Years | 58 (7.0%) | 49 (5.1%) |
| 65 to 69 Years | 80 (9.6%) | 137 (14.3%) |
| 70 to 74 Years | 90 (10.8%) | 54 (5.6%) |
| 75 to 79 Years | 14 (1.7%) | 14 (1.5%) |
| 80 to 84 Years | 24 (2.9%) | 7 (0.7%) |
| 85 Years and over | 16 (1.9%) | 29 (3.0%) |
| Total | 833 (100.0%) | 958 (100.0%) |
Families and Households in North Spearfish
Median Family Size in North Spearfish
The median family size in North Spearfish is 2.86 persons per family, with single male/father families (5 | 1.0%) accounting for the largest median family size of 3.4 persons per family. On the other hand, single female/mother families (73 | 15.0%) represent the smallest median family size with 2.56 persons per family.
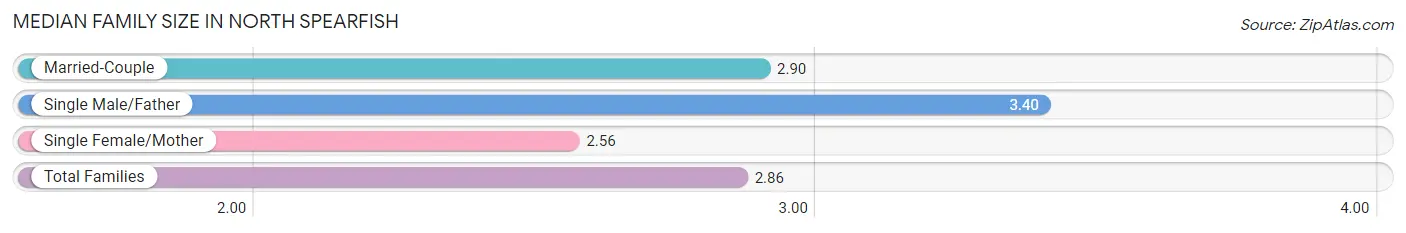
| Family Type | # Families | Family Size |
| Married-Couple | 410 (84.0%) | 2.90 |
| Single Male/Father | 5 (1.0%) | 3.40 |
| Single Female/Mother | 73 (15.0%) | 2.56 |
| Total Families | 488 (100.0%) | 2.86 |
Median Household Size in North Spearfish
The median household size in North Spearfish is 2.39 persons per household, with single male/father households (5 | 0.7%) accounting for the largest median household size of 3.4 persons per household. non-family households (261 | 34.8%) represent the smallest median household size with 1.23 persons per household.
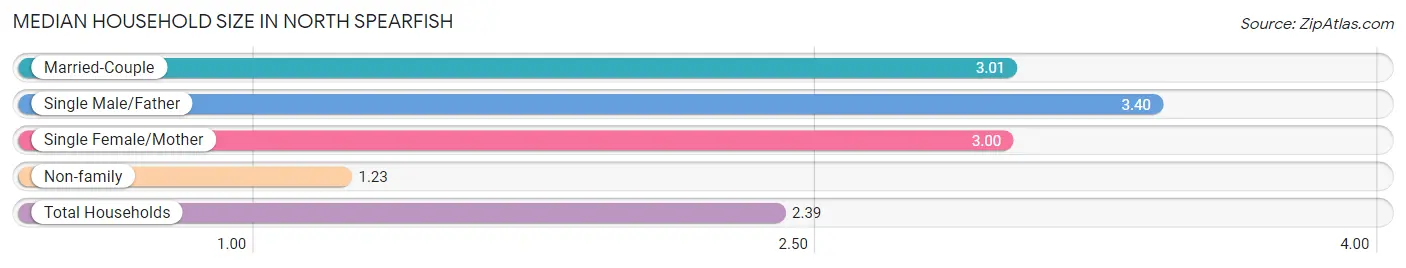
| Household Type | # Households | Household Size |
| Married-Couple | 410 (54.7%) | 3.01 |
| Single Male/Father | 5 (0.7%) | 3.40 |
| Single Female/Mother | 73 (9.8%) | 3.00 |
| Non-family | 261 (34.8%) | 1.23 |
| Total Households | 749 (100.0%) | 2.39 |
Household Size by Marriage Status in North Spearfish
Out of a total of 749 households in North Spearfish, 488 (65.1%) are family households, while 261 (34.8%) are nonfamily households. The most numerous type of family households are 2-person households, comprising 262, and the most common type of nonfamily households are 1-person households, comprising 205.
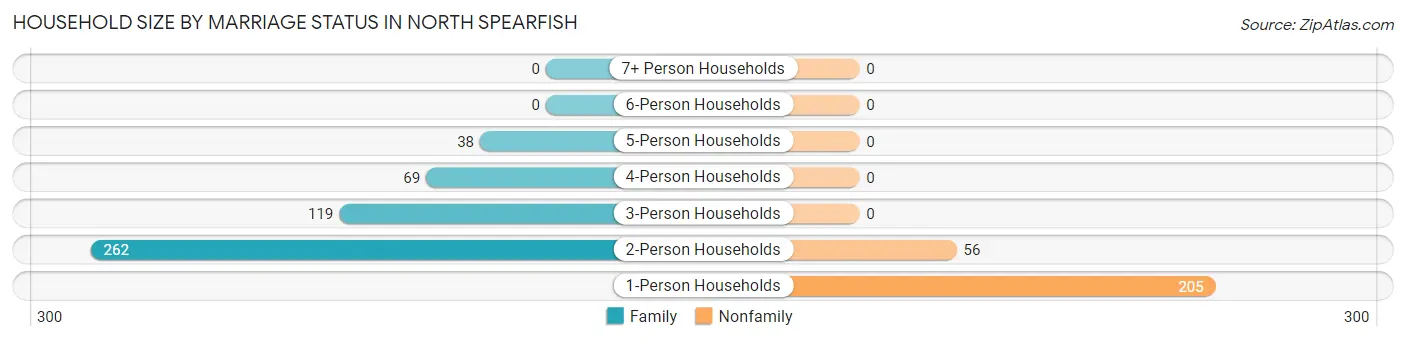
| Household Size | Family Households | Nonfamily Households |
| 1-Person Households | - | 205 (27.4%) |
| 2-Person Households | 262 (35.0%) | 56 (7.5%) |
| 3-Person Households | 119 (15.9%) | 0 (0.0%) |
| 4-Person Households | 69 (9.2%) | 0 (0.0%) |
| 5-Person Households | 38 (5.1%) | 0 (0.0%) |
| 6-Person Households | 0 (0.0%) | 0 (0.0%) |
| 7+ Person Households | 0 (0.0%) | 0 (0.0%) |
| Total | 488 (65.1%) | 261 (34.8%) |
Female Fertility in North Spearfish
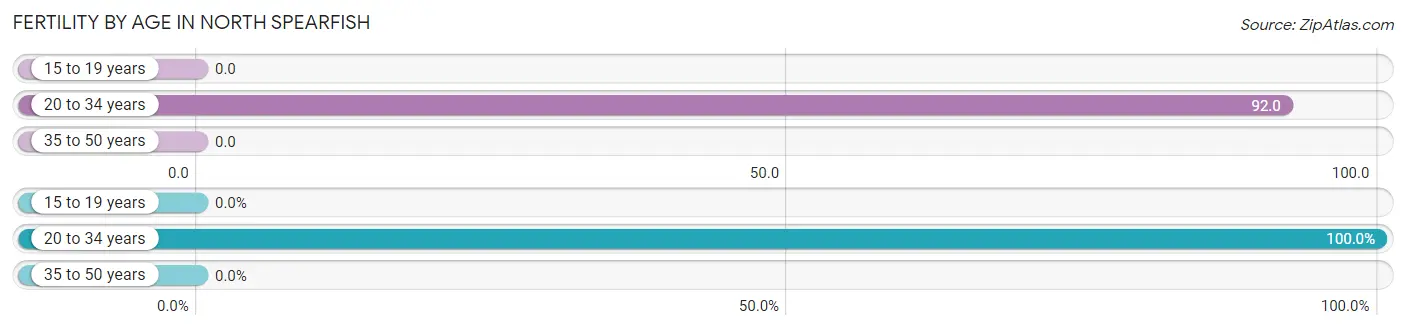
Fertility by Age in North Spearfish
Average fertility rate in North Spearfish is 37.0 births per 1,000 women. Women in the age bracket of 20 to 34 years have the highest fertility rate with 92.0 births per 1,000 women. Women in the age bracket of 20 to 34 years acount for 100.0% of all women with births.
| Age Bracket | Women with Births | Births / 1,000 Women |
| 15 to 19 years | 0 (0.0%) | 0.0 |
| 20 to 34 years | 15 (100.0%) | 92.0 |
| 35 to 50 years | 0 (0.0%) | 0.0 |
| Total | 15 (100.0%) | 37.0 |
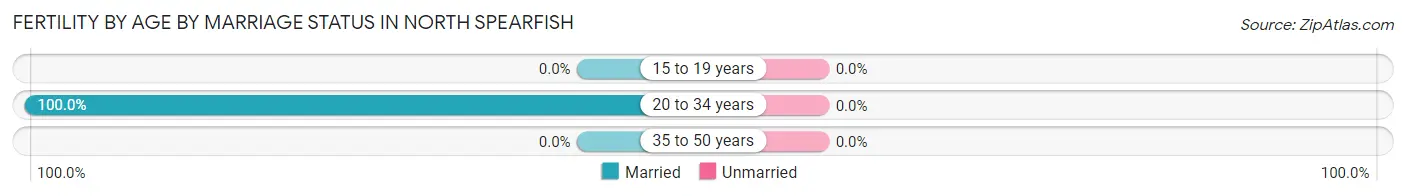
Fertility by Age by Marriage Status in North Spearfish
| Age Bracket | Married | Unmarried |
| 15 to 19 years | 0 (0.0%) | 0 (0.0%) |
| 20 to 34 years | 15 (100.0%) | 0 (0.0%) |
| 35 to 50 years | 0 (0.0%) | 0 (0.0%) |
| Total | 15 (100.0%) | 0 (0.0%) |
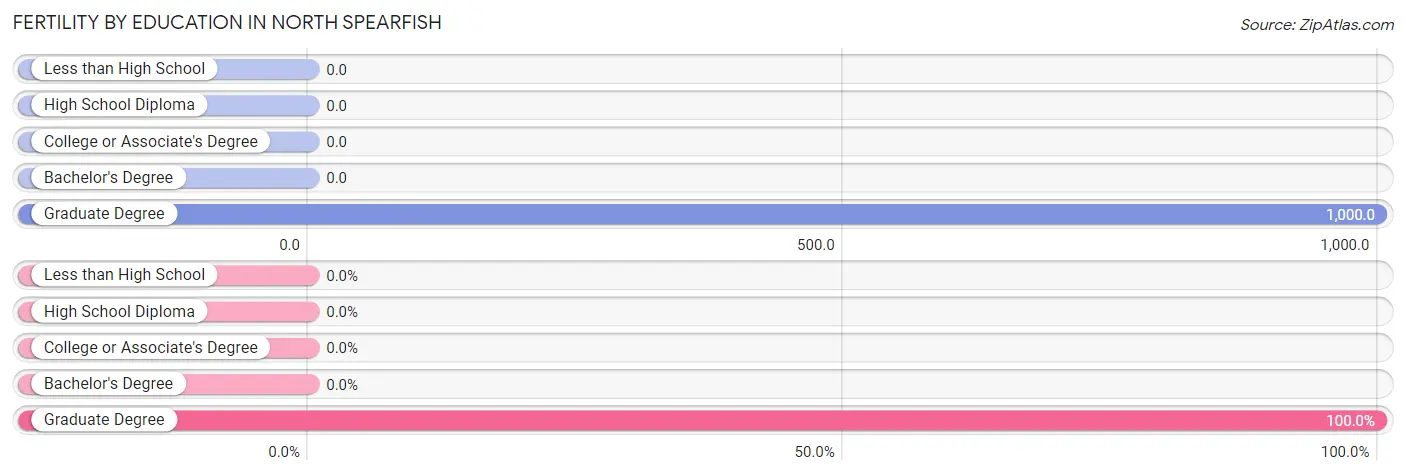
Fertility by Education in North Spearfish
| Educational Attainment | Women with Births | Births / 1,000 Women |
| Less than High School | 0 (0.0%) | 0.0 |
| High School Diploma | 0 (0.0%) | 0.0 |
| College or Associate's Degree | 0 (0.0%) | 0.0 |
| Bachelor's Degree | 0 (0.0%) | 0.0 |
| Graduate Degree | 15 (100.0%) | 1,000.0 |
| Total | 15 (100.0%) | 37.0 |
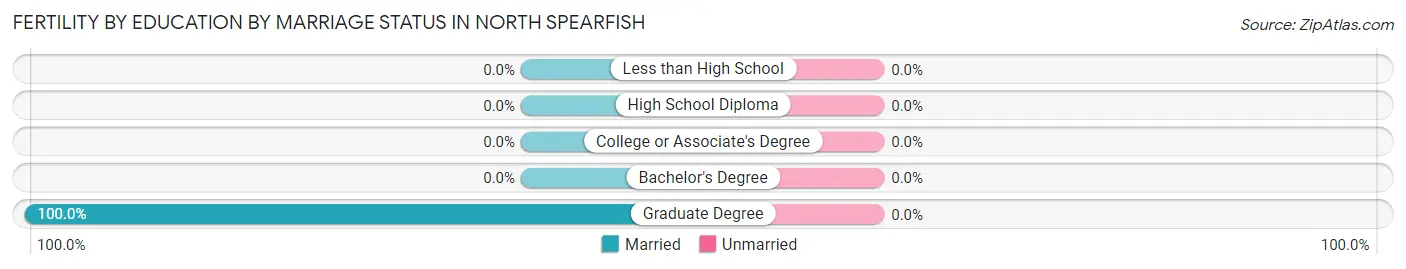
Fertility by Education by Marriage Status in North Spearfish
| Educational Attainment | Married | Unmarried |
| Less than High School | 0 (0.0%) | 0 (0.0%) |
| High School Diploma | 0 (0.0%) | 0 (0.0%) |
| College or Associate's Degree | 0 (0.0%) | 0 (0.0%) |
| Bachelor's Degree | 0 (0.0%) | 0 (0.0%) |
| Graduate Degree | 15 (100.0%) | 0 (0.0%) |
| Total | 15 (100.0%) | 0 (0.0%) |
Employment Characteristics in North Spearfish
Employment by Class of Employer in North Spearfish
Among the 1,066 employed individuals in North Spearfish, private company employees (768 | 72.1%), not-for-profit organizations (135 | 12.7%), and local government employees (68 | 6.4%) make up the most common classes of employment.
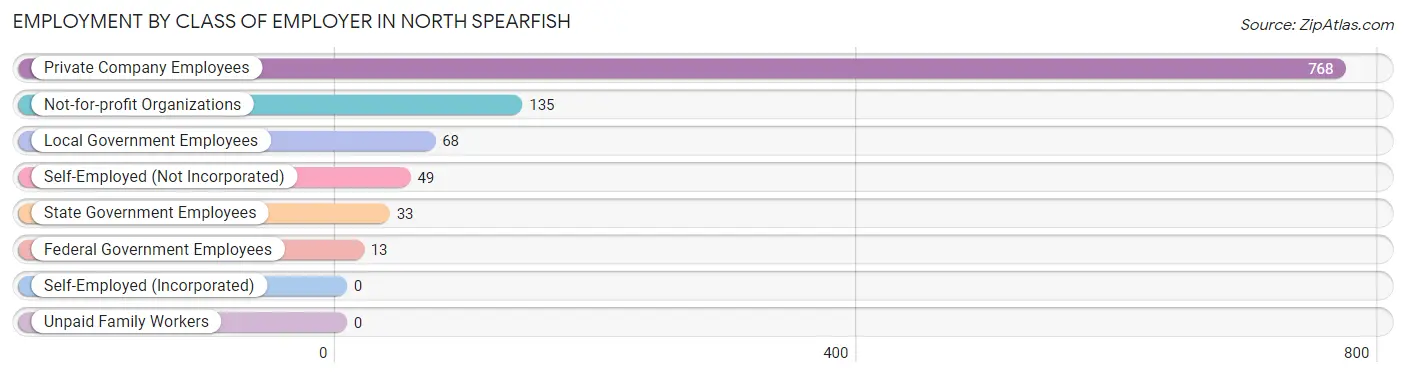
| Employer Class | # Employees | % Employees |
| Private Company Employees | 768 | 72.1% |
| Self-Employed (Incorporated) | 0 | 0.0% |
| Self-Employed (Not Incorporated) | 49 | 4.6% |
| Not-for-profit Organizations | 135 | 12.7% |
| Local Government Employees | 68 | 6.4% |
| State Government Employees | 33 | 3.1% |
| Federal Government Employees | 13 | 1.2% |
| Unpaid Family Workers | 0 | 0.0% |
| Total | 1,066 | 100.0% |
Employment Status by Age in North Spearfish
According to the labor force statistics for North Spearfish, out of the total population over 16 years of age (1,480), 75.3% or 1,114 individuals are in the labor force, with 1.1% or 12 of them unemployed. The age group with the highest labor force participation rate is 16 to 19 years, with 100.0% or 91 individuals in the labor force. Within the labor force, the 30 to 34 years age range has the highest percentage of unemployed individuals, with 17.6% or 12 of them being unemployed.
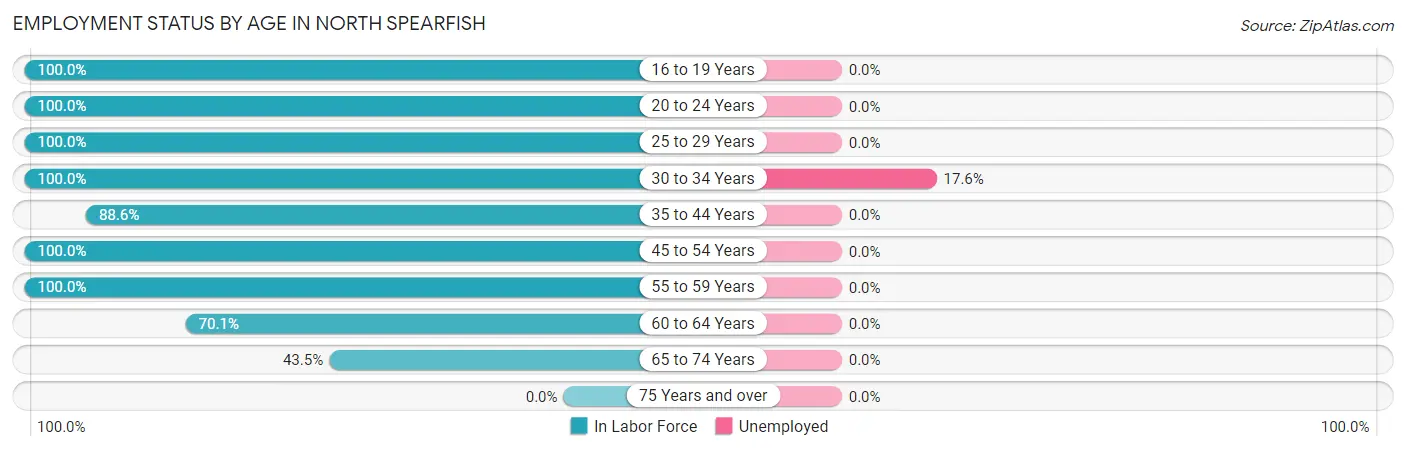
| Age Bracket | In Labor Force | Unemployed |
| 16 to 19 Years | 91 (100.0%) | 0 (0.0%) |
| 20 to 24 Years | 165 (100.0%) | 0 (0.0%) |
| 25 to 29 Years | 62 (100.0%) | 0 (0.0%) |
| 30 to 34 Years | 68 (100.0%) | 12 (17.6%) |
| 35 to 44 Years | 203 (88.6%) | 0 (0.0%) |
| 45 to 54 Years | 164 (100.0%) | 0 (0.0%) |
| 55 to 59 Years | 129 (100.0%) | 0 (0.0%) |
| 60 to 64 Years | 75 (70.1%) | 0 (0.0%) |
| 65 to 74 Years | 157 (43.5%) | 0 (0.0%) |
| 75 Years and over | 0 (0.0%) | 0 (0.0%) |
| Total | 1,114 (75.3%) | 12 (1.1%) |
Employment Status by Educational Attainment in North Spearfish
According to labor force statistics for North Spearfish, 92.4% of individuals (701) out of the total population between 25 and 64 years of age (759) are in the labor force, with 1.7% or 12 of them being unemployed. The group with the highest labor force participation rate are those with the educational attainment of high school diploma, with 100.0% or 143 individuals in the labor force. Within the labor force, individuals with high school diploma education have the highest percentage of unemployment, with 8.4% or 12 of them being unemployed.
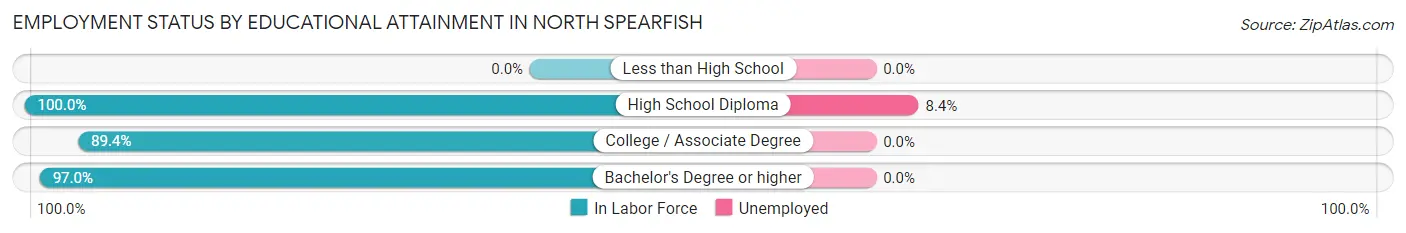
| Educational Attainment | In Labor Force | Unemployed |
| Less than High School | 0 (0.0%) | 0 (0.0%) |
| High School Diploma | 143 (100.0%) | 12 (8.4%) |
| College / Associate Degree | 303 (89.4%) | 0 (0.0%) |
| Bachelor's Degree or higher | 255 (97.0%) | 0 (0.0%) |
| Total | 701 (92.4%) | 13 (1.7%) |
Employment Occupations by Sex in North Spearfish
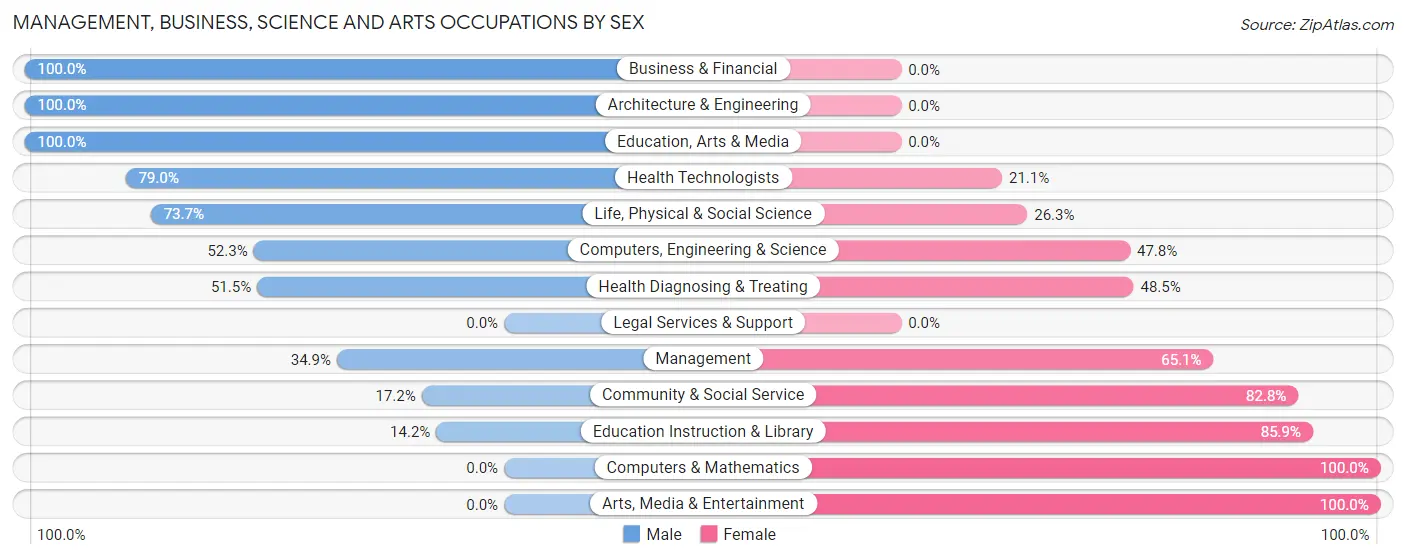
Management, Business, Science and Arts Occupations
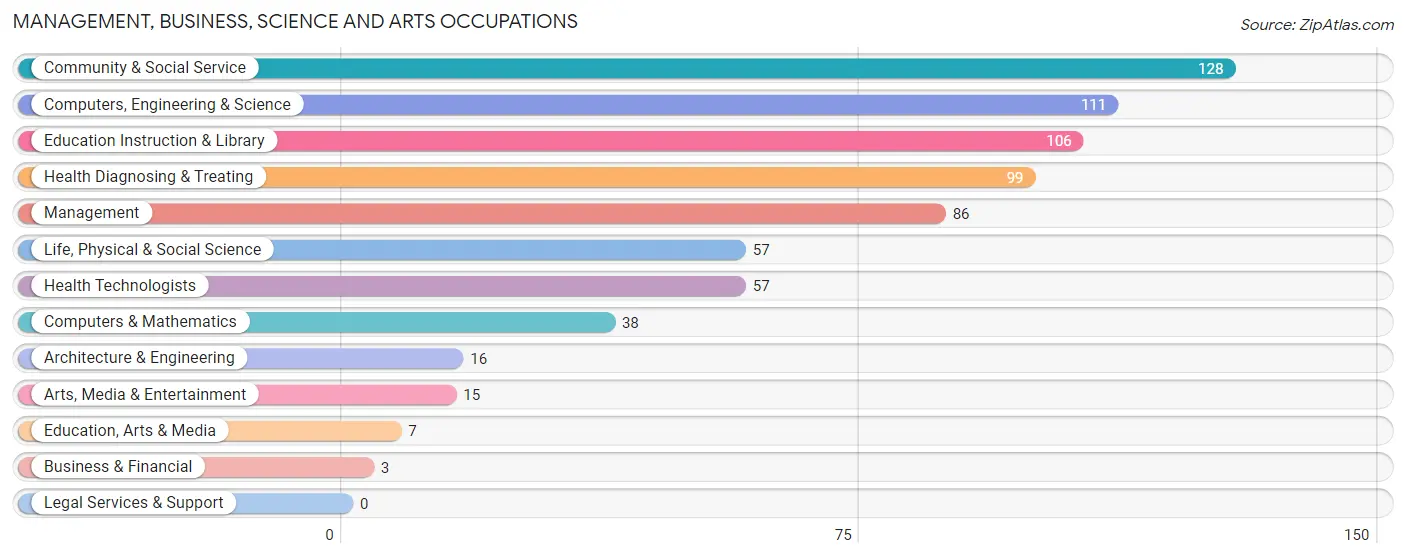
The most common Management, Business, Science and Arts occupations in North Spearfish are Community & Social Service (128 | 11.6%), Computers, Engineering & Science (111 | 10.1%), Education Instruction & Library (106 | 9.6%), Health Diagnosing & Treating (99 | 9.0%), and Management (86 | 7.8%).
Management, Business, Science and Arts Occupations by Sex
Within the Management, Business, Science and Arts occupations in North Spearfish, the most male-oriented occupations are Business & Financial (100.0%), Architecture & Engineering (100.0%), and Education, Arts & Media (100.0%), while the most female-oriented occupations are Computers & Mathematics (100.0%), Arts, Media & Entertainment (100.0%), and Education Instruction & Library (85.9%).
| Occupation | Male | Female |
| Management | 30 (34.9%) | 56 (65.1%) |
| Business & Financial | 3 (100.0%) | 0 (0.0%) |
| Computers, Engineering & Science | 58 (52.2%) | 53 (47.7%) |
| Computers & Mathematics | 0 (0.0%) | 38 (100.0%) |
| Architecture & Engineering | 16 (100.0%) | 0 (0.0%) |
| Life, Physical & Social Science | 42 (73.7%) | 15 (26.3%) |
| Community & Social Service | 22 (17.2%) | 106 (82.8%) |
| Education, Arts & Media | 7 (100.0%) | 0 (0.0%) |
| Legal Services & Support | 0 (0.0%) | 0 (0.0%) |
| Education Instruction & Library | 15 (14.1%) | 91 (85.9%) |
| Arts, Media & Entertainment | 0 (0.0%) | 15 (100.0%) |
| Health Diagnosing & Treating | 51 (51.5%) | 48 (48.5%) |
| Health Technologists | 45 (78.9%) | 12 (21.0%) |
| Total (Category) | 164 (38.4%) | 263 (61.6%) |
| Total (Overall) | 501 (45.5%) | 601 (54.5%) |
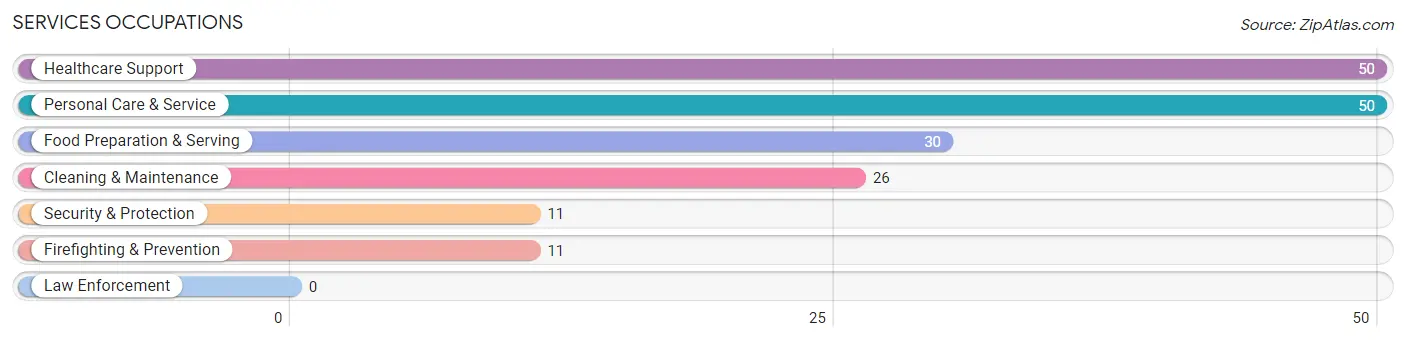
Services Occupations
The most common Services occupations in North Spearfish are Healthcare Support (50 | 4.5%), Personal Care & Service (50 | 4.5%), Food Preparation & Serving (30 | 2.7%), Cleaning & Maintenance (26 | 2.4%), and Security & Protection (11 | 1.0%).
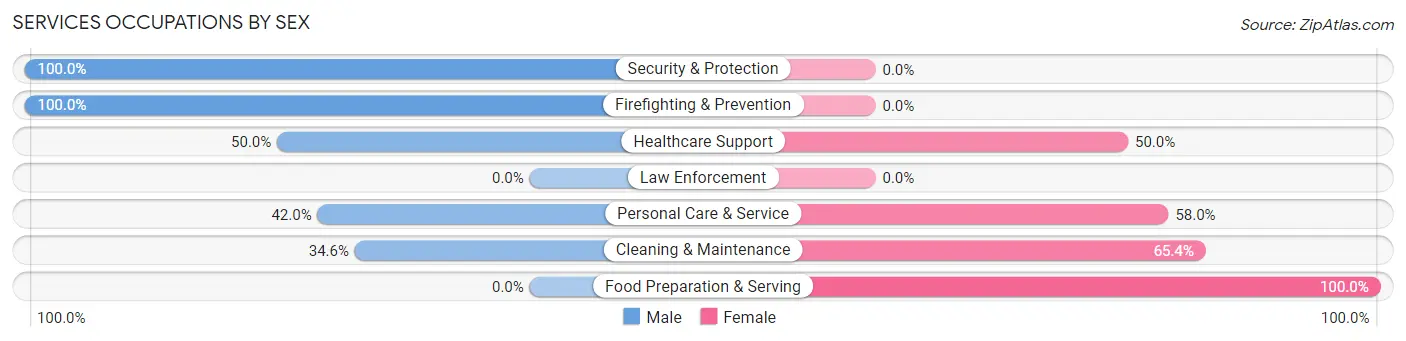
Services Occupations by Sex
Within the Services occupations in North Spearfish, the most male-oriented occupations are Security & Protection (100.0%), Firefighting & Prevention (100.0%), and Healthcare Support (50.0%), while the most female-oriented occupations are Food Preparation & Serving (100.0%), Cleaning & Maintenance (65.4%), and Personal Care & Service (58.0%).
| Occupation | Male | Female |
| Healthcare Support | 25 (50.0%) | 25 (50.0%) |
| Security & Protection | 11 (100.0%) | 0 (0.0%) |
| Firefighting & Prevention | 11 (100.0%) | 0 (0.0%) |
| Law Enforcement | 0 (0.0%) | 0 (0.0%) |
| Food Preparation & Serving | 0 (0.0%) | 30 (100.0%) |
| Cleaning & Maintenance | 9 (34.6%) | 17 (65.4%) |
| Personal Care & Service | 21 (42.0%) | 29 (58.0%) |
| Total (Category) | 66 (39.5%) | 101 (60.5%) |
| Total (Overall) | 501 (45.5%) | 601 (54.5%) |
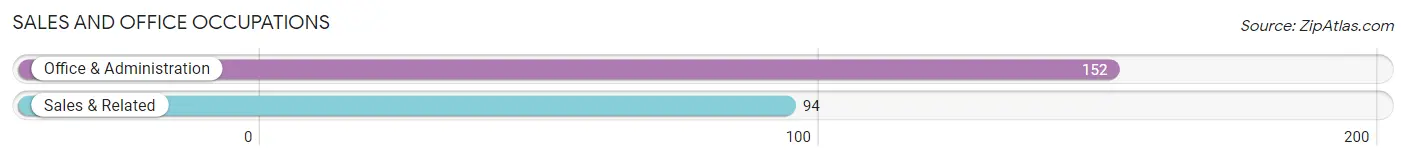
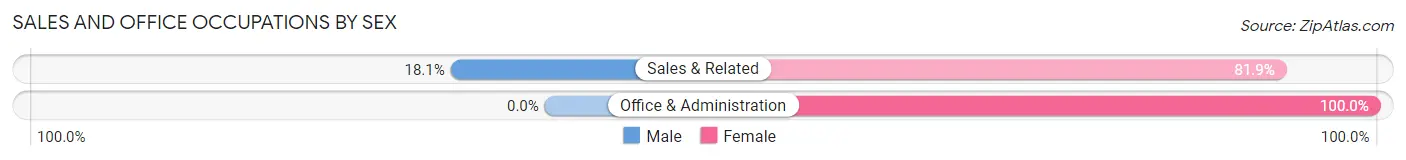
Sales and Office Occupations
The most common Sales and Office occupations in North Spearfish are Office & Administration (152 | 13.8%), and Sales & Related (94 | 8.5%).
Sales and Office Occupations by Sex
| Occupation | Male | Female |
| Sales & Related | 17 (18.1%) | 77 (81.9%) |
| Office & Administration | 0 (0.0%) | 152 (100.0%) |
| Total (Category) | 17 (6.9%) | 229 (93.1%) |
| Total (Overall) | 501 (45.5%) | 601 (54.5%) |
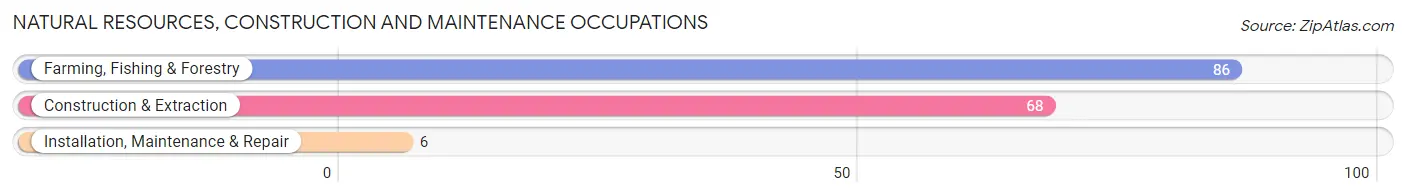
Natural Resources, Construction and Maintenance Occupations
The most common Natural Resources, Construction and Maintenance occupations in North Spearfish are Farming, Fishing & Forestry (86 | 7.8%), Construction & Extraction (68 | 6.2%), and Installation, Maintenance & Repair (6 | 0.5%).
Natural Resources, Construction and Maintenance Occupations by Sex
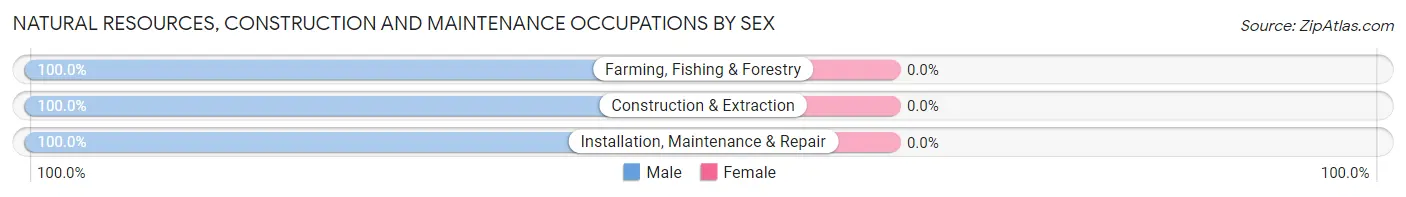
| Occupation | Male | Female |
| Farming, Fishing & Forestry | 86 (100.0%) | 0 (0.0%) |
| Construction & Extraction | 68 (100.0%) | 0 (0.0%) |
| Installation, Maintenance & Repair | 6 (100.0%) | 0 (0.0%) |
| Total (Category) | 160 (100.0%) | 0 (0.0%) |
| Total (Overall) | 501 (45.5%) | 601 (54.5%) |
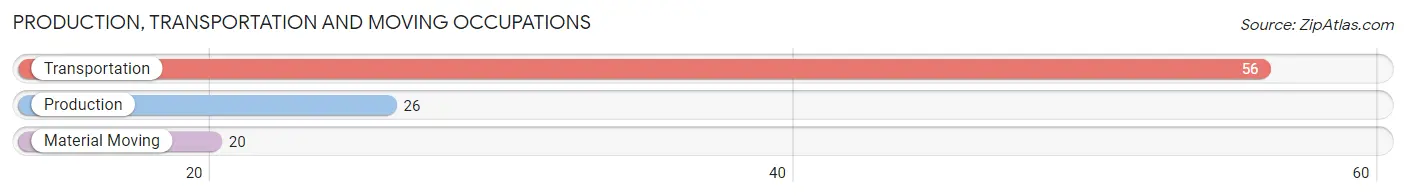
Production, Transportation and Moving Occupations
The most common Production, Transportation and Moving occupations in North Spearfish are Transportation (56 | 5.1%), Production (26 | 2.4%), and Material Moving (20 | 1.8%).
Production, Transportation and Moving Occupations by Sex
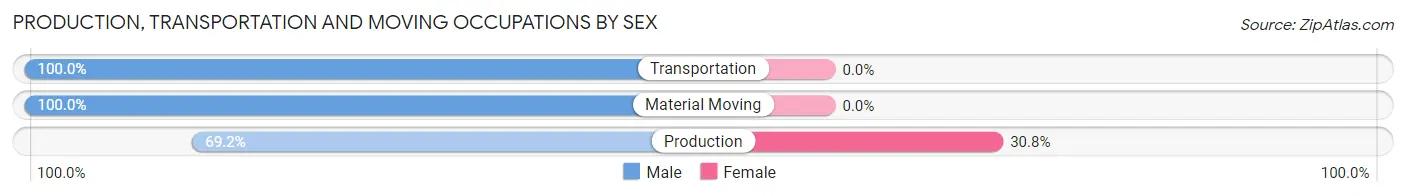
| Occupation | Male | Female |
| Production | 18 (69.2%) | 8 (30.8%) |
| Transportation | 56 (100.0%) | 0 (0.0%) |
| Material Moving | 20 (100.0%) | 0 (0.0%) |
| Total (Category) | 94 (92.2%) | 8 (7.8%) |
| Total (Overall) | 501 (45.5%) | 601 (54.5%) |
Employment Industries by Sex in North Spearfish
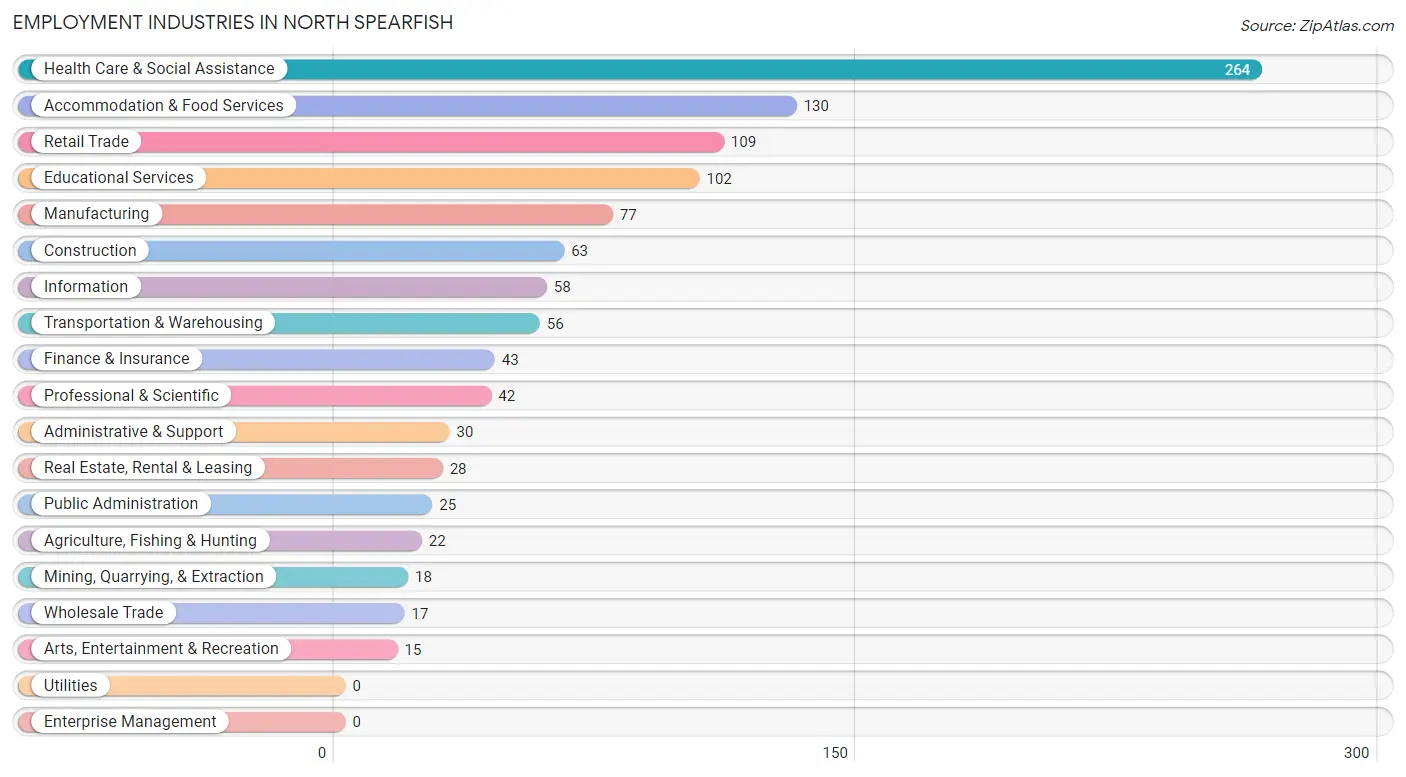
Employment Industries in North Spearfish
The major employment industries in North Spearfish include Health Care & Social Assistance (264 | 24.0%), Accommodation & Food Services (130 | 11.8%), Retail Trade (109 | 9.9%), Educational Services (102 | 9.3%), and Manufacturing (77 | 7.0%).
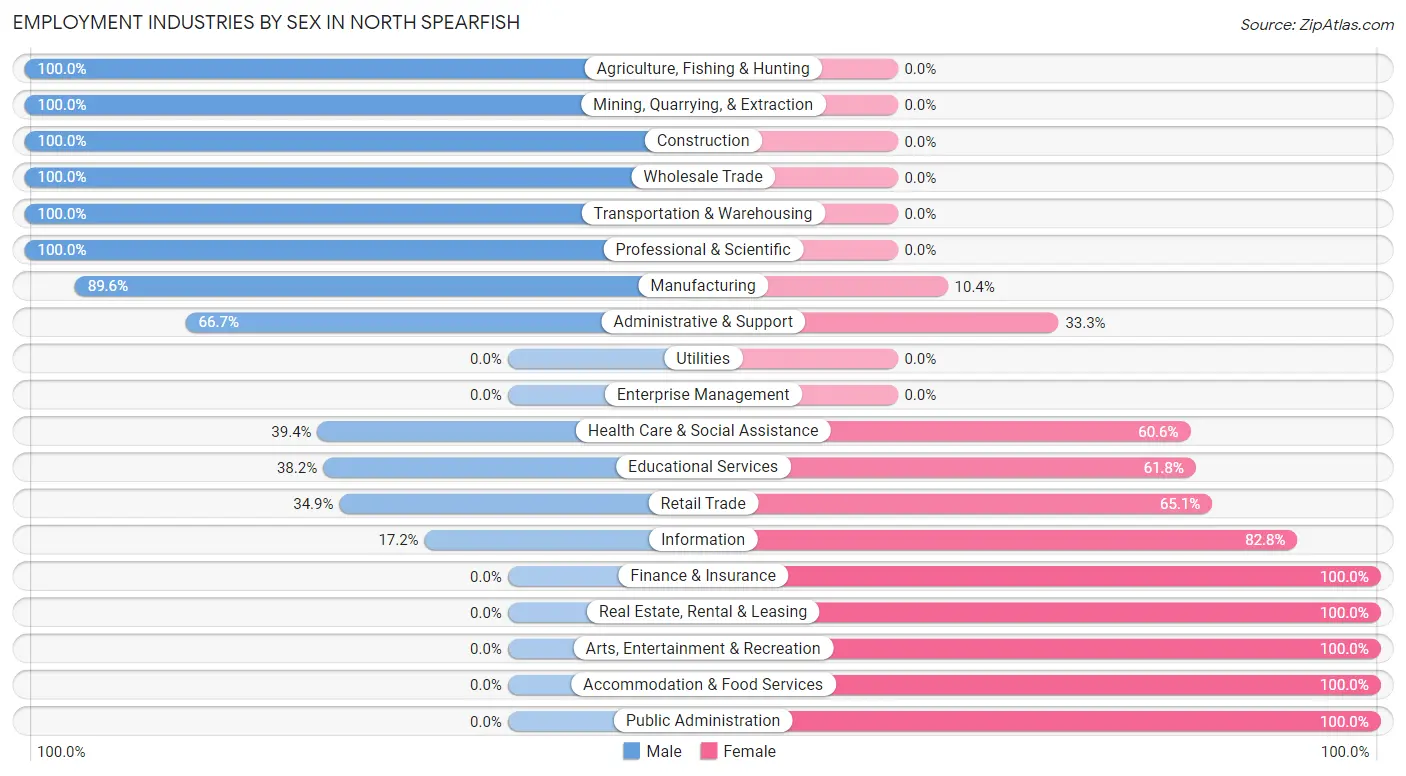
Employment Industries by Sex in North Spearfish
The North Spearfish industries that see more men than women are Agriculture, Fishing & Hunting (100.0%), Mining, Quarrying, & Extraction (100.0%), and Construction (100.0%), whereas the industries that tend to have a higher number of women are Finance & Insurance (100.0%), Real Estate, Rental & Leasing (100.0%), and Arts, Entertainment & Recreation (100.0%).
| Industry | Male | Female |
| Agriculture, Fishing & Hunting | 22 (100.0%) | 0 (0.0%) |
| Mining, Quarrying, & Extraction | 18 (100.0%) | 0 (0.0%) |
| Construction | 63 (100.0%) | 0 (0.0%) |
| Manufacturing | 69 (89.6%) | 8 (10.4%) |
| Wholesale Trade | 17 (100.0%) | 0 (0.0%) |
| Retail Trade | 38 (34.9%) | 71 (65.1%) |
| Transportation & Warehousing | 56 (100.0%) | 0 (0.0%) |
| Utilities | 0 (0.0%) | 0 (0.0%) |
| Information | 10 (17.2%) | 48 (82.8%) |
| Finance & Insurance | 0 (0.0%) | 43 (100.0%) |
| Real Estate, Rental & Leasing | 0 (0.0%) | 28 (100.0%) |
| Professional & Scientific | 42 (100.0%) | 0 (0.0%) |
| Enterprise Management | 0 (0.0%) | 0 (0.0%) |
| Administrative & Support | 20 (66.7%) | 10 (33.3%) |
| Educational Services | 39 (38.2%) | 63 (61.8%) |
| Health Care & Social Assistance | 104 (39.4%) | 160 (60.6%) |
| Arts, Entertainment & Recreation | 0 (0.0%) | 15 (100.0%) |
| Accommodation & Food Services | 0 (0.0%) | 130 (100.0%) |
| Public Administration | 0 (0.0%) | 25 (100.0%) |
| Total | 501 (45.5%) | 601 (54.5%) |
Education in North Spearfish
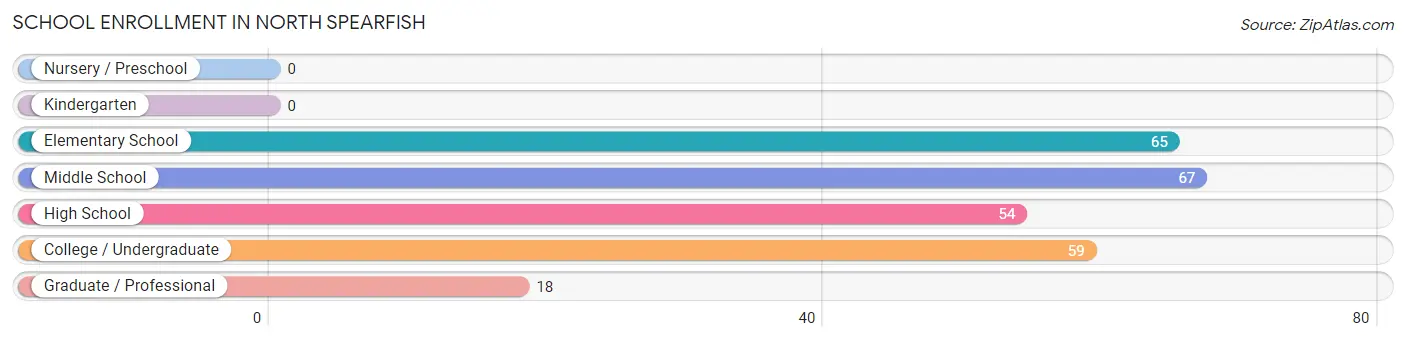
School Enrollment in North Spearfish
The most common levels of schooling among the 263 students in North Spearfish are middle school (67 | 25.5%), elementary school (65 | 24.7%), and college / undergraduate (59 | 22.4%).
| School Level | # Students | % Students |
| Nursery / Preschool | 0 | 0.0% |
| Kindergarten | 0 | 0.0% |
| Elementary School | 65 | 24.7% |
| Middle School | 67 | 25.5% |
| High School | 54 | 20.5% |
| College / Undergraduate | 59 | 22.4% |
| Graduate / Professional | 18 | 6.8% |
| Total | 263 | 100.0% |
School Enrollment by Age by Funding Source in North Spearfish
Out of a total of 263 students who are enrolled in schools in North Spearfish, 18 (6.8%) attend a private institution, while the remaining 245 (93.2%) are enrolled in public schools. The age group of 20 to 24 year olds has the highest likelihood of being enrolled in private schools, with 18 (36.0% in the age bracket) enrolled. Conversely, the age group of 5 to 9 year old has the lowest likelihood of being enrolled in a private school, with 24 (100.0% in the age bracket) attending a public institution.
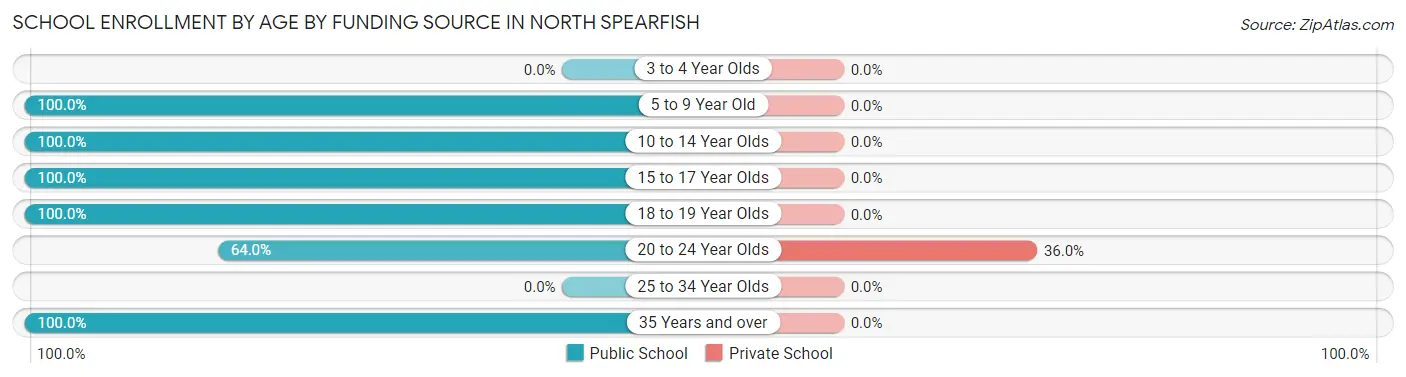
| Age Bracket | Public School | Private School |
| 3 to 4 Year Olds | 0 (0.0%) | 0 (0.0%) |
| 5 to 9 Year Old | 24 (100.0%) | 0 (0.0%) |
| 10 to 14 Year Olds | 122 (100.0%) | 0 (0.0%) |
| 15 to 17 Year Olds | 40 (100.0%) | 0 (0.0%) |
| 18 to 19 Year Olds | 9 (100.0%) | 0 (0.0%) |
| 20 to 24 Year Olds | 32 (64.0%) | 18 (36.0%) |
| 25 to 34 Year Olds | 0 (0.0%) | 0 (0.0%) |
| 35 Years and over | 18 (100.0%) | 0 (0.0%) |
| Total | 245 (93.2%) | 18 (6.8%) |
Educational Attainment by Field of Study in North Spearfish
Education (131 | 21.8%), physical & health sciences (101 | 16.8%), psychology (62 | 10.3%), arts & humanities (53 | 8.8%), and science & technology (51 | 8.5%) are the most common fields of study among 602 individuals in North Spearfish who have obtained a bachelor's degree or higher.
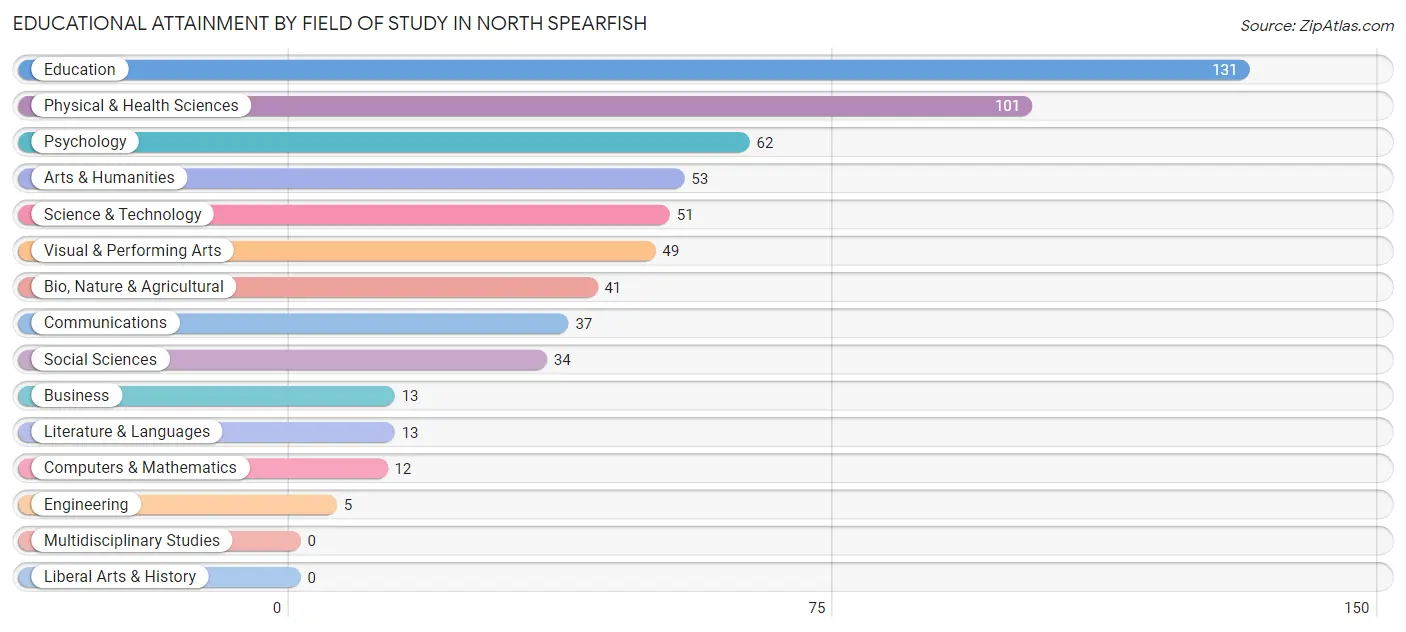
| Field of Study | # Graduates | % Graduates |
| Computers & Mathematics | 12 | 2.0% |
| Bio, Nature & Agricultural | 41 | 6.8% |
| Physical & Health Sciences | 101 | 16.8% |
| Psychology | 62 | 10.3% |
| Social Sciences | 34 | 5.7% |
| Engineering | 5 | 0.8% |
| Multidisciplinary Studies | 0 | 0.0% |
| Science & Technology | 51 | 8.5% |
| Business | 13 | 2.2% |
| Education | 131 | 21.8% |
| Literature & Languages | 13 | 2.2% |
| Liberal Arts & History | 0 | 0.0% |
| Visual & Performing Arts | 49 | 8.1% |
| Communications | 37 | 6.1% |
| Arts & Humanities | 53 | 8.8% |
| Total | 602 | 100.0% |
Transportation & Commute in North Spearfish
Vehicle Availability by Sex in North Spearfish
The most prevalent vehicle ownership categories in North Spearfish are males with 2 vehicles (230, accounting for 47.6%) and females with 2 vehicles (253, making up 39.5%).
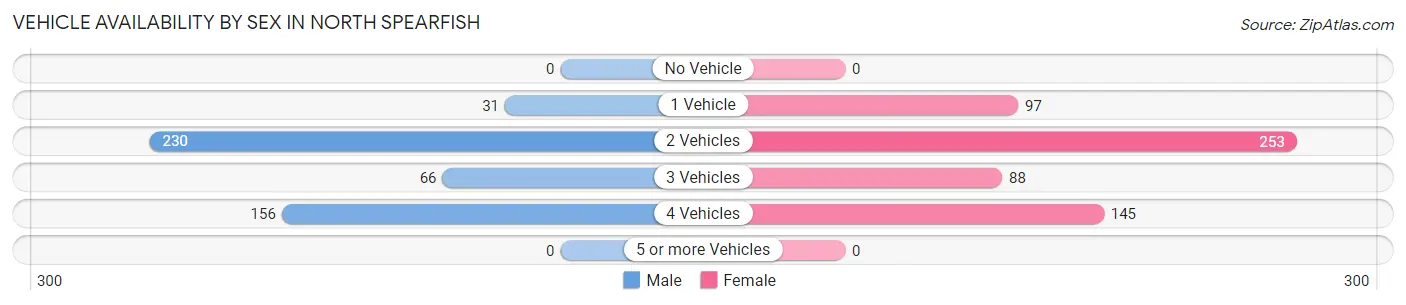
| Vehicles Available | Male | Female |
| No Vehicle | 0 (0.0%) | 0 (0.0%) |
| 1 Vehicle | 31 (6.4%) | 97 (16.6%) |
| 2 Vehicles | 230 (47.6%) | 253 (43.4%) |
| 3 Vehicles | 66 (13.7%) | 88 (15.1%) |
| 4 Vehicles | 156 (32.3%) | 145 (24.9%) |
| 5 or more Vehicles | 0 (0.0%) | 0 (0.0%) |
| Total | 483 (100.0%) | 583 (100.0%) |
Commute Time in North Spearfish
The most frequently occuring commute durations in North Spearfish are 10 to 14 minutes (348 commuters, 34.5%), 5 to 9 minutes (230 commuters, 22.8%), and 15 to 19 minutes (100 commuters, 9.9%).
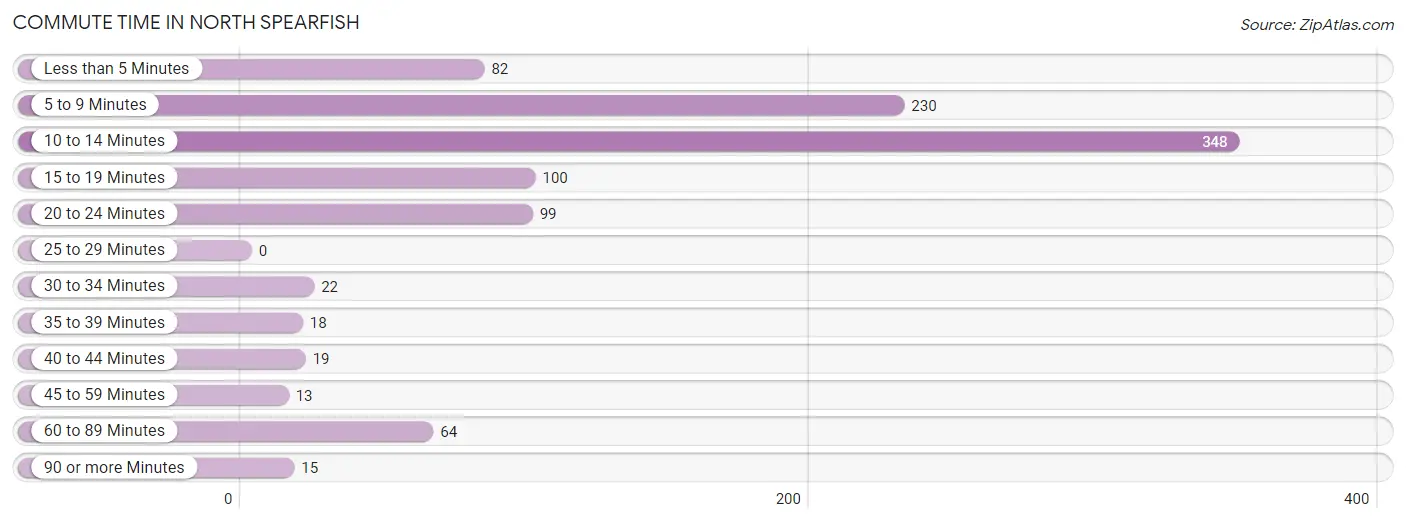
| Commute Time | # Commuters | % Commuters |
| Less than 5 Minutes | 82 | 8.1% |
| 5 to 9 Minutes | 230 | 22.8% |
| 10 to 14 Minutes | 348 | 34.5% |
| 15 to 19 Minutes | 100 | 9.9% |
| 20 to 24 Minutes | 99 | 9.8% |
| 25 to 29 Minutes | 0 | 0.0% |
| 30 to 34 Minutes | 22 | 2.2% |
| 35 to 39 Minutes | 18 | 1.8% |
| 40 to 44 Minutes | 19 | 1.9% |
| 45 to 59 Minutes | 13 | 1.3% |
| 60 to 89 Minutes | 64 | 6.3% |
| 90 or more Minutes | 15 | 1.5% |
Commute Time by Sex in North Spearfish
The most common commute times in North Spearfish are 5 to 9 minutes (115 commuters, 25.3%) for males and 10 to 14 minutes (286 commuters, 51.5%) for females.
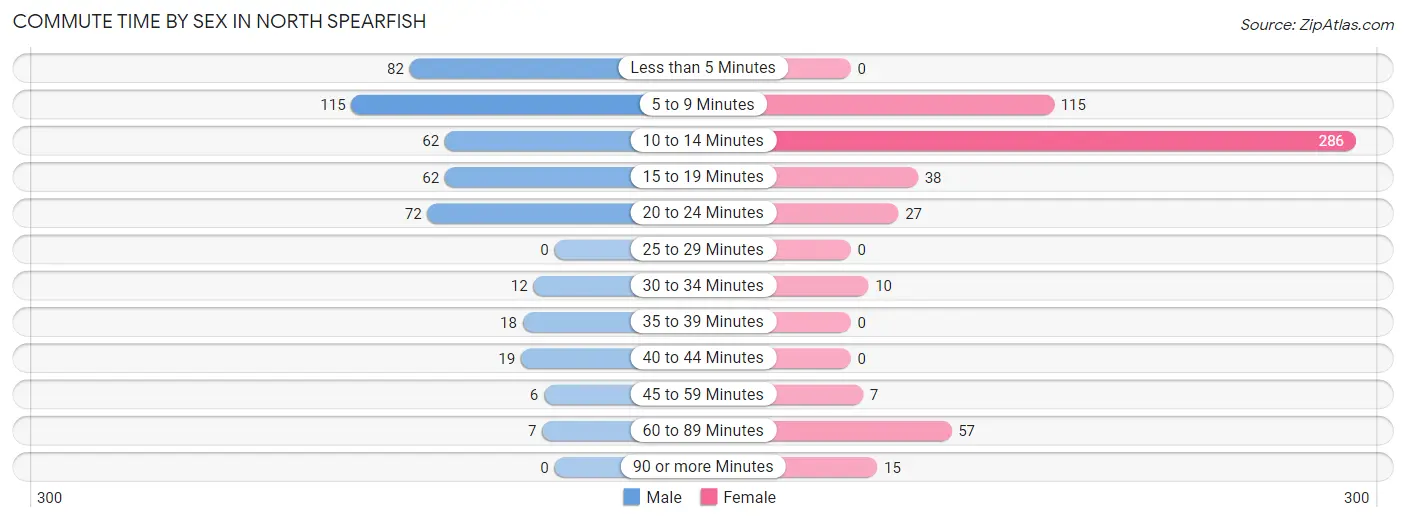
| Commute Time | Male | Female |
| Less than 5 Minutes | 82 (18.0%) | 0 (0.0%) |
| 5 to 9 Minutes | 115 (25.3%) | 115 (20.7%) |
| 10 to 14 Minutes | 62 (13.6%) | 286 (51.5%) |
| 15 to 19 Minutes | 62 (13.6%) | 38 (6.9%) |
| 20 to 24 Minutes | 72 (15.8%) | 27 (4.9%) |
| 25 to 29 Minutes | 0 (0.0%) | 0 (0.0%) |
| 30 to 34 Minutes | 12 (2.6%) | 10 (1.8%) |
| 35 to 39 Minutes | 18 (4.0%) | 0 (0.0%) |
| 40 to 44 Minutes | 19 (4.2%) | 0 (0.0%) |
| 45 to 59 Minutes | 6 (1.3%) | 7 (1.3%) |
| 60 to 89 Minutes | 7 (1.5%) | 57 (10.3%) |
| 90 or more Minutes | 0 (0.0%) | 15 (2.7%) |
Time of Departure to Work by Sex in North Spearfish
The most frequent times of departure to work in North Spearfish are 7:30 AM to 7:59 AM (126, 27.7%) for males and 12:00 PM to 3:59 PM (186, 33.5%) for females.
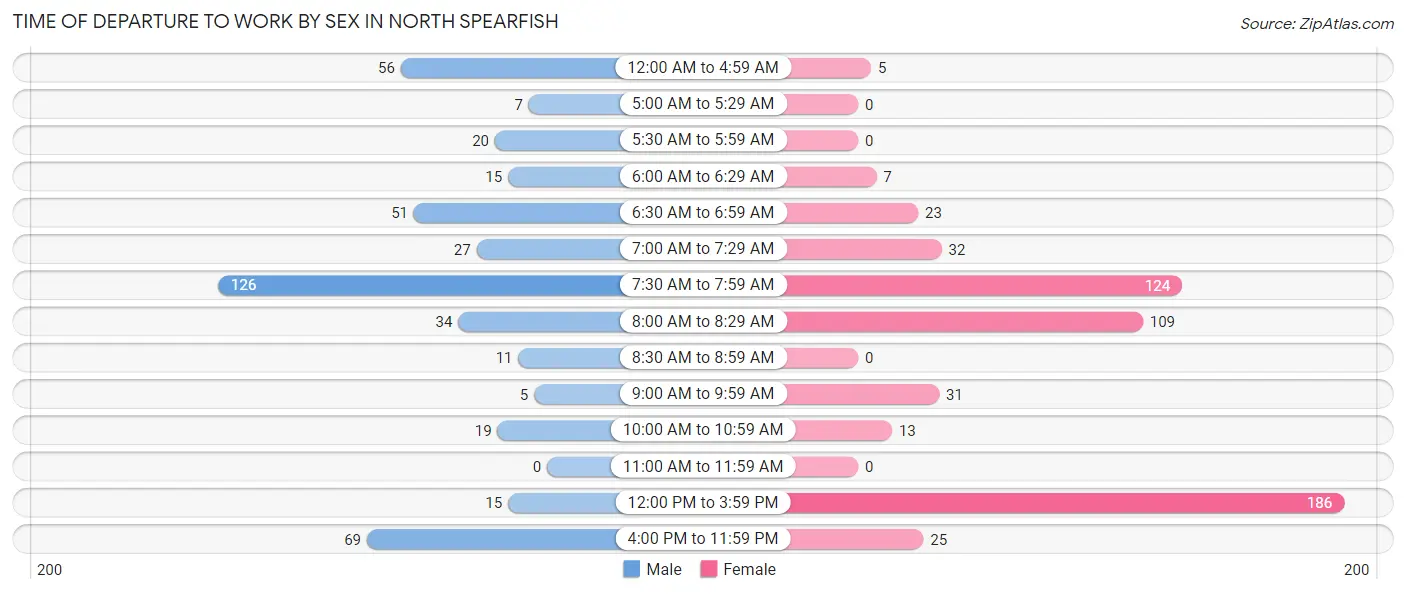
| Time of Departure | Male | Female |
| 12:00 AM to 4:59 AM | 56 (12.3%) | 5 (0.9%) |
| 5:00 AM to 5:29 AM | 7 (1.5%) | 0 (0.0%) |
| 5:30 AM to 5:59 AM | 20 (4.4%) | 0 (0.0%) |
| 6:00 AM to 6:29 AM | 15 (3.3%) | 7 (1.3%) |
| 6:30 AM to 6:59 AM | 51 (11.2%) | 23 (4.1%) |
| 7:00 AM to 7:29 AM | 27 (5.9%) | 32 (5.8%) |
| 7:30 AM to 7:59 AM | 126 (27.7%) | 124 (22.3%) |
| 8:00 AM to 8:29 AM | 34 (7.5%) | 109 (19.6%) |
| 8:30 AM to 8:59 AM | 11 (2.4%) | 0 (0.0%) |
| 9:00 AM to 9:59 AM | 5 (1.1%) | 31 (5.6%) |
| 10:00 AM to 10:59 AM | 19 (4.2%) | 13 (2.3%) |
| 11:00 AM to 11:59 AM | 0 (0.0%) | 0 (0.0%) |
| 12:00 PM to 3:59 PM | 15 (3.3%) | 186 (33.5%) |
| 4:00 PM to 11:59 PM | 69 (15.2%) | 25 (4.5%) |
| Total | 455 (100.0%) | 555 (100.0%) |
Housing Occupancy in North Spearfish
Occupancy by Ownership in North Spearfish
Of the total 749 dwellings in North Spearfish, owner-occupied units account for 621 (82.9%), while renter-occupied units make up 128 (17.1%).
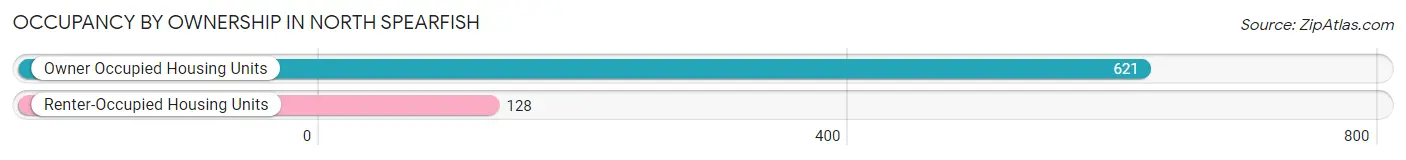
| Occupancy | # Housing Units | % Housing Units |
| Owner Occupied Housing Units | 621 | 82.9% |
| Renter-Occupied Housing Units | 128 | 17.1% |
| Total Occupied Housing Units | 749 | 100.0% |
Occupancy by Household Size in North Spearfish
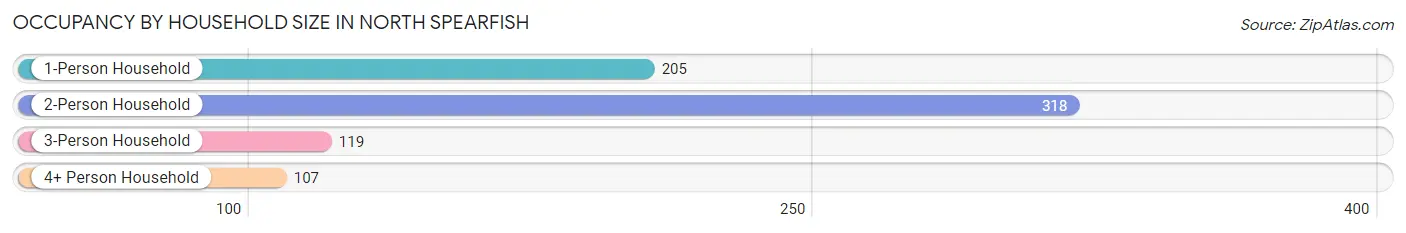
| Household Size | # Housing Units | % Housing Units |
| 1-Person Household | 205 | 27.4% |
| 2-Person Household | 318 | 42.5% |
| 3-Person Household | 119 | 15.9% |
| 4+ Person Household | 107 | 14.3% |
| Total Housing Units | 749 | 100.0% |
Occupancy by Ownership by Household Size in North Spearfish
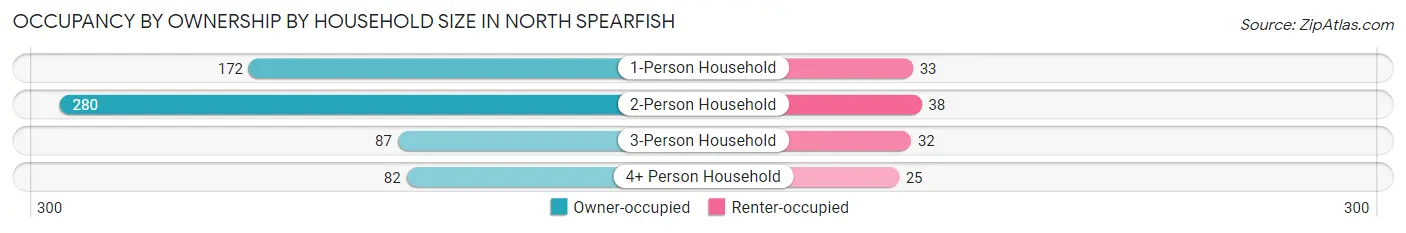
| Household Size | Owner-occupied | Renter-occupied |
| 1-Person Household | 172 (83.9%) | 33 (16.1%) |
| 2-Person Household | 280 (88.0%) | 38 (11.9%) |
| 3-Person Household | 87 (73.1%) | 32 (26.9%) |
| 4+ Person Household | 82 (76.6%) | 25 (23.4%) |
| Total Housing Units | 621 (82.9%) | 128 (17.1%) |
Occupancy by Educational Attainment in North Spearfish
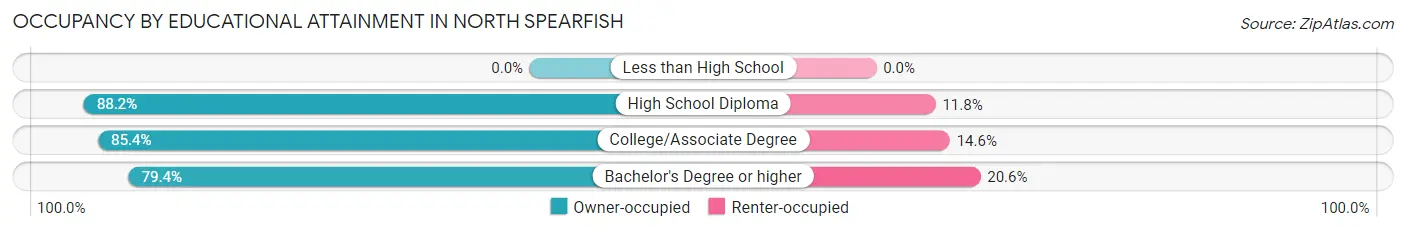
| Household Size | Owner-occupied | Renter-occupied |
| Less than High School | 0 (0.0%) | 0 (0.0%) |
| High School Diploma | 120 (88.2%) | 16 (11.8%) |
| College/Associate Degree | 205 (85.4%) | 35 (14.6%) |
| Bachelor's Degree or higher | 296 (79.4%) | 77 (20.6%) |
Occupancy by Age of Householder in North Spearfish
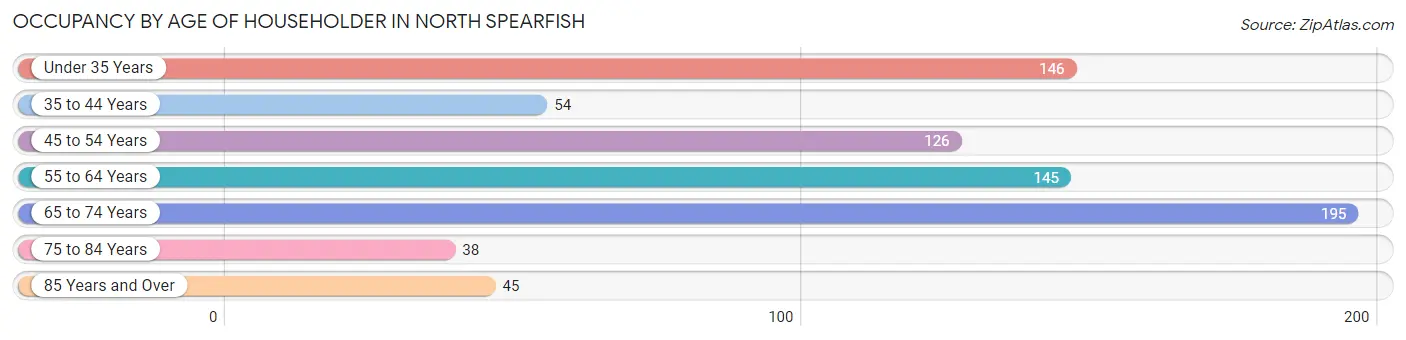
| Age Bracket | # Households | % Households |
| Under 35 Years | 146 | 19.5% |
| 35 to 44 Years | 54 | 7.2% |
| 45 to 54 Years | 126 | 16.8% |
| 55 to 64 Years | 145 | 19.4% |
| 65 to 74 Years | 195 | 26.0% |
| 75 to 84 Years | 38 | 5.1% |
| 85 Years and Over | 45 | 6.0% |
| Total | 749 | 100.0% |
Housing Finances in North Spearfish
Median Income by Occupancy in North Spearfish
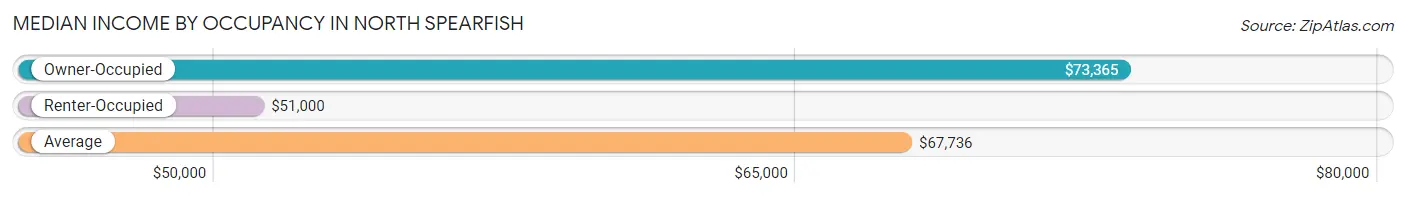
| Occupancy Type | # Households | Median Income |
| Owner-Occupied | 621 (82.9%) | $73,365 |
| Renter-Occupied | 128 (17.1%) | $51,000 |
| Average | 749 (100.0%) | $67,736 |
Occupancy by Householder Income Bracket in North Spearfish
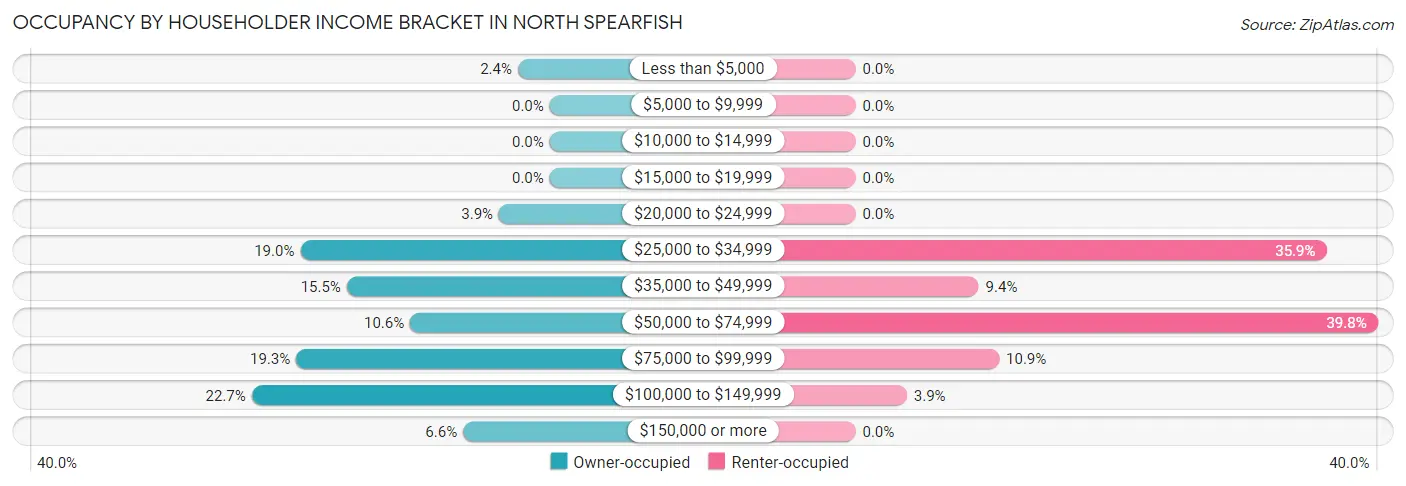
| Income Bracket | Owner-occupied | Renter-occupied |
| Less than $5,000 | 15 (2.4%) | 0 (0.0%) |
| $5,000 to $9,999 | 0 (0.0%) | 0 (0.0%) |
| $10,000 to $14,999 | 0 (0.0%) | 0 (0.0%) |
| $15,000 to $19,999 | 0 (0.0%) | 0 (0.0%) |
| $20,000 to $24,999 | 24 (3.9%) | 0 (0.0%) |
| $25,000 to $34,999 | 118 (19.0%) | 46 (35.9%) |
| $35,000 to $49,999 | 96 (15.5%) | 12 (9.4%) |
| $50,000 to $74,999 | 66 (10.6%) | 51 (39.8%) |
| $75,000 to $99,999 | 120 (19.3%) | 14 (10.9%) |
| $100,000 to $149,999 | 141 (22.7%) | 5 (3.9%) |
| $150,000 or more | 41 (6.6%) | 0 (0.0%) |
| Total | 621 (100.0%) | 128 (100.0%) |
Monthly Housing Cost Tiers in North Spearfish
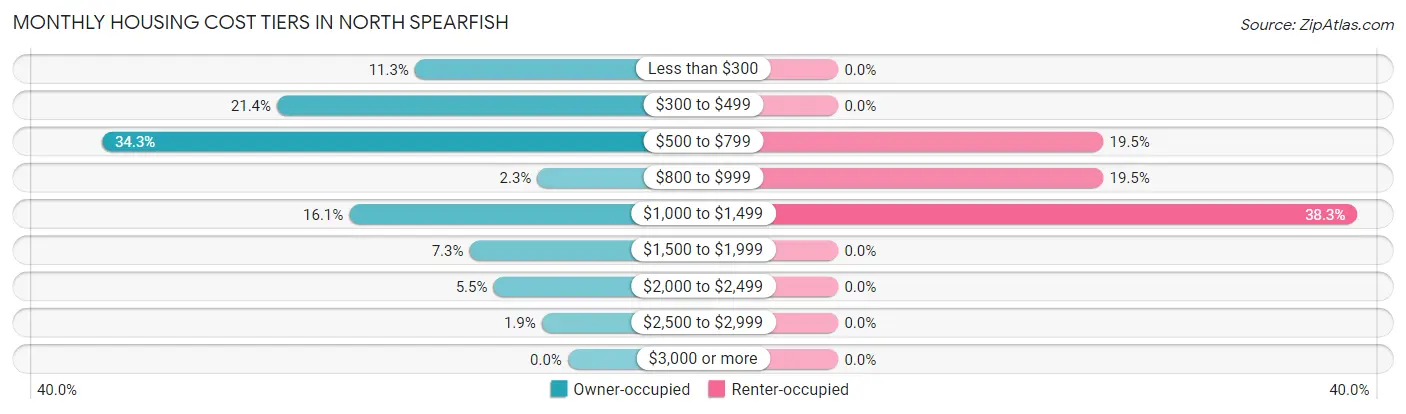
| Monthly Cost | Owner-occupied | Renter-occupied |
| Less than $300 | 70 (11.3%) | 0 (0.0%) |
| $300 to $499 | 133 (21.4%) | 0 (0.0%) |
| $500 to $799 | 213 (34.3%) | 25 (19.5%) |
| $800 to $999 | 14 (2.2%) | 25 (19.5%) |
| $1,000 to $1,499 | 100 (16.1%) | 49 (38.3%) |
| $1,500 to $1,999 | 45 (7.2%) | 0 (0.0%) |
| $2,000 to $2,499 | 34 (5.5%) | 0 (0.0%) |
| $2,500 to $2,999 | 12 (1.9%) | 0 (0.0%) |
| $3,000 or more | 0 (0.0%) | 0 (0.0%) |
| Total | 621 (100.0%) | 128 (100.0%) |
Physical Housing Characteristics in North Spearfish
Housing Structures in North Spearfish
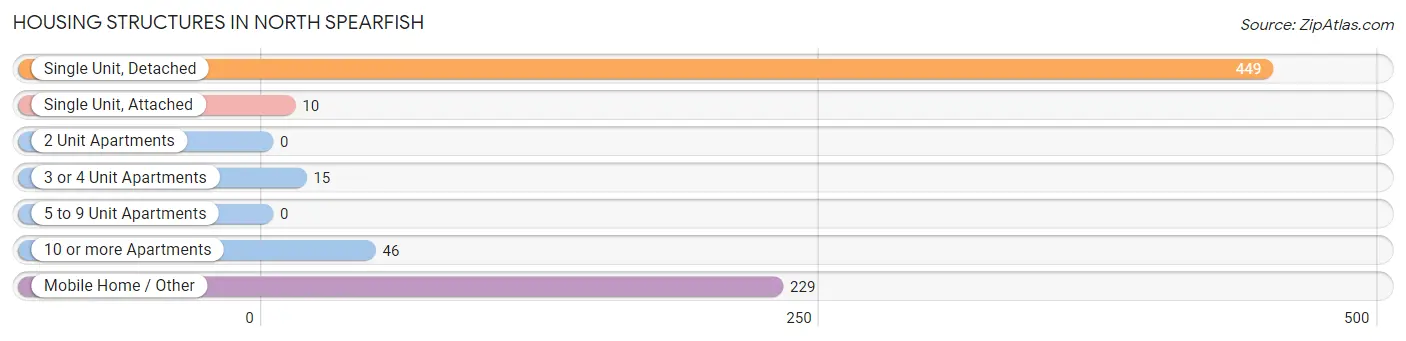
| Structure Type | # Housing Units | % Housing Units |
| Single Unit, Detached | 449 | 60.0% |
| Single Unit, Attached | 10 | 1.3% |
| 2 Unit Apartments | 0 | 0.0% |
| 3 or 4 Unit Apartments | 15 | 2.0% |
| 5 to 9 Unit Apartments | 0 | 0.0% |
| 10 or more Apartments | 46 | 6.1% |
| Mobile Home / Other | 229 | 30.6% |
| Total | 749 | 100.0% |
Housing Structures by Occupancy in North Spearfish
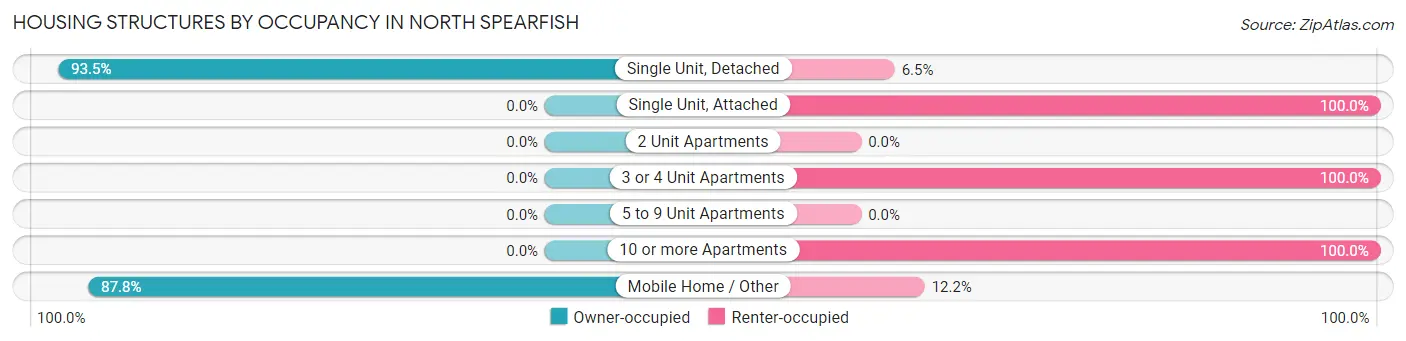
| Structure Type | Owner-occupied | Renter-occupied |
| Single Unit, Detached | 420 (93.5%) | 29 (6.5%) |
| Single Unit, Attached | 0 (0.0%) | 10 (100.0%) |
| 2 Unit Apartments | 0 (0.0%) | 0 (0.0%) |
| 3 or 4 Unit Apartments | 0 (0.0%) | 15 (100.0%) |
| 5 to 9 Unit Apartments | 0 (0.0%) | 0 (0.0%) |
| 10 or more Apartments | 0 (0.0%) | 46 (100.0%) |
| Mobile Home / Other | 201 (87.8%) | 28 (12.2%) |
| Total | 621 (82.9%) | 128 (17.1%) |
Housing Structures by Number of Rooms in North Spearfish
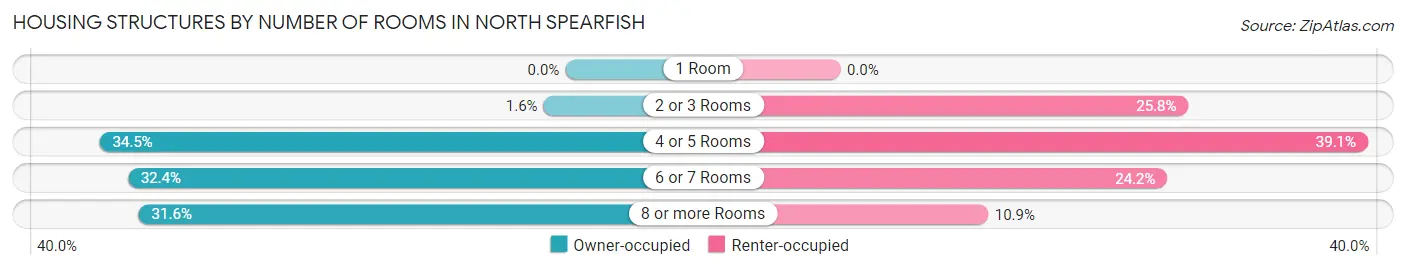
| Number of Rooms | Owner-occupied | Renter-occupied |
| 1 Room | 0 (0.0%) | 0 (0.0%) |
| 2 or 3 Rooms | 10 (1.6%) | 33 (25.8%) |
| 4 or 5 Rooms | 214 (34.5%) | 50 (39.1%) |
| 6 or 7 Rooms | 201 (32.4%) | 31 (24.2%) |
| 8 or more Rooms | 196 (31.6%) | 14 (10.9%) |
| Total | 621 (100.0%) | 128 (100.0%) |
Housing Structure by Heating Type in North Spearfish
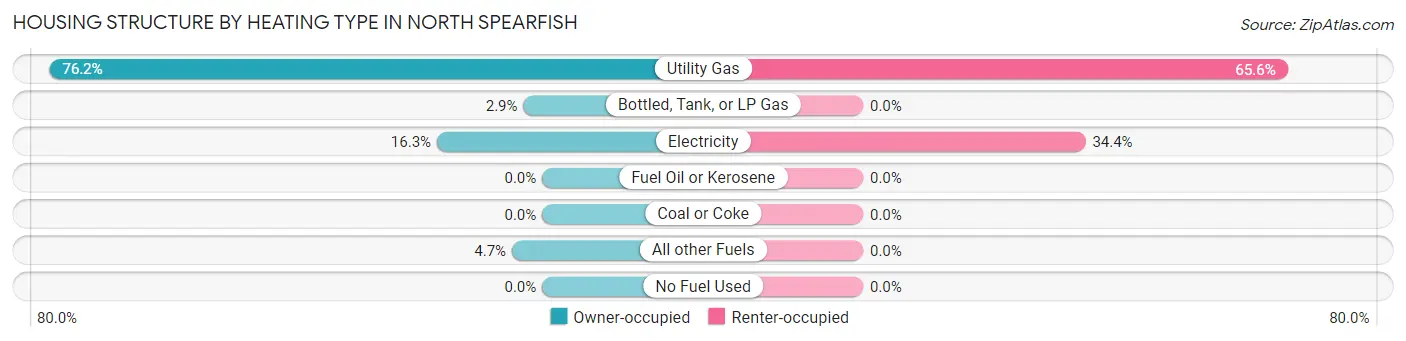
| Heating Type | Owner-occupied | Renter-occupied |
| Utility Gas | 473 (76.2%) | 84 (65.6%) |
| Bottled, Tank, or LP Gas | 18 (2.9%) | 0 (0.0%) |
| Electricity | 101 (16.3%) | 44 (34.4%) |
| Fuel Oil or Kerosene | 0 (0.0%) | 0 (0.0%) |
| Coal or Coke | 0 (0.0%) | 0 (0.0%) |
| All other Fuels | 29 (4.7%) | 0 (0.0%) |
| No Fuel Used | 0 (0.0%) | 0 (0.0%) |
| Total | 621 (100.0%) | 128 (100.0%) |
Household Vehicle Usage in North Spearfish
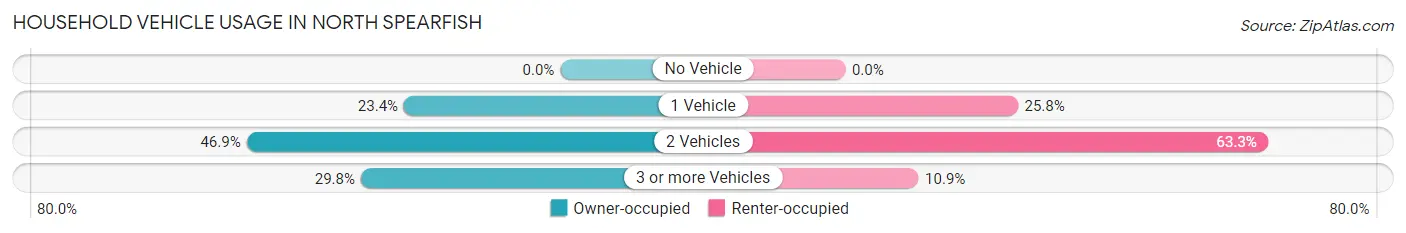
| Vehicles per Household | Owner-occupied | Renter-occupied |
| No Vehicle | 0 (0.0%) | 0 (0.0%) |
| 1 Vehicle | 145 (23.4%) | 33 (25.8%) |
| 2 Vehicles | 291 (46.9%) | 81 (63.3%) |
| 3 or more Vehicles | 185 (29.8%) | 14 (10.9%) |
| Total | 621 (100.0%) | 128 (100.0%) |
Real Estate & Mortgages in North Spearfish
Real Estate and Mortgage Overview in North Spearfish
| Characteristic | Without Mortgage | With Mortgage |
| Housing Units | 458 | 163 |
| Median Property Value | $250,600 | $279,200 |
| Median Household Income | $48,333 | $0 |
| Monthly Housing Costs | $526 | $0 |
| Real Estate Taxes | $1,686 | $0 |
Property Value by Mortgage Status in North Spearfish
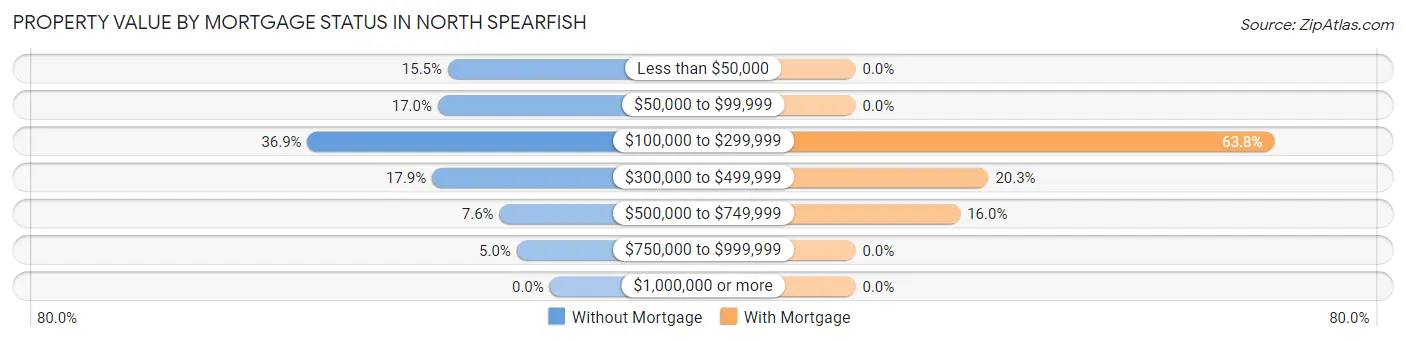
| Property Value | Without Mortgage | With Mortgage |
| Less than $50,000 | 71 (15.5%) | 0 (0.0%) |
| $50,000 to $99,999 | 78 (17.0%) | 0 (0.0%) |
| $100,000 to $299,999 | 169 (36.9%) | 104 (63.8%) |
| $300,000 to $499,999 | 82 (17.9%) | 33 (20.3%) |
| $500,000 to $749,999 | 35 (7.6%) | 26 (16.0%) |
| $750,000 to $999,999 | 23 (5.0%) | 0 (0.0%) |
| $1,000,000 or more | 0 (0.0%) | 0 (0.0%) |
| Total | 458 (100.0%) | 163 (100.0%) |
Household Income by Mortgage Status in North Spearfish
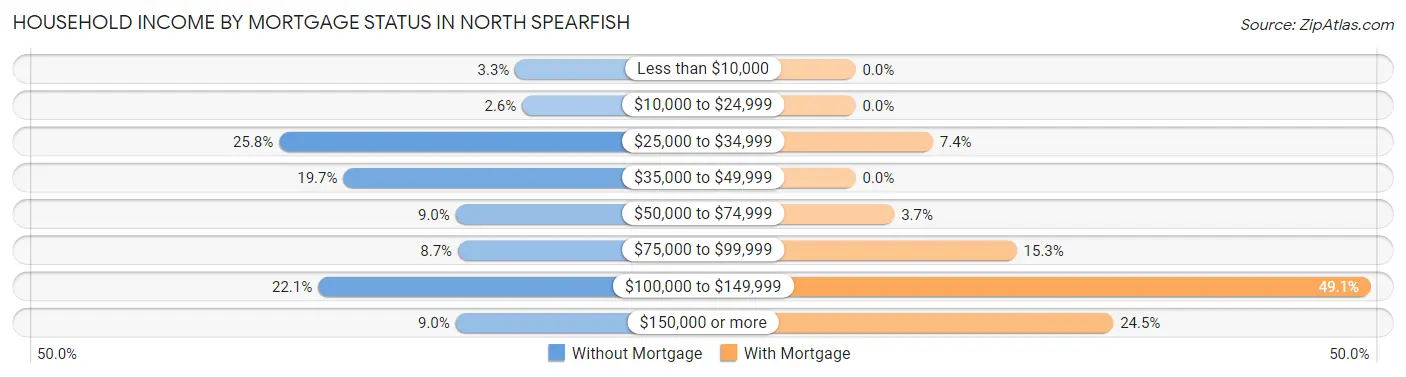
| Household Income | Without Mortgage | With Mortgage |
| Less than $10,000 | 15 (3.3%) | 0 (0.0%) |
| $10,000 to $24,999 | 12 (2.6%) | 0 (0.0%) |
| $25,000 to $34,999 | 118 (25.8%) | 12 (7.4%) |
| $35,000 to $49,999 | 90 (19.7%) | 0 (0.0%) |
| $50,000 to $74,999 | 41 (8.9%) | 6 (3.7%) |
| $75,000 to $99,999 | 40 (8.7%) | 25 (15.3%) |
| $100,000 to $149,999 | 101 (22.1%) | 80 (49.1%) |
| $150,000 or more | 41 (8.9%) | 40 (24.5%) |
| Total | 458 (100.0%) | 163 (100.0%) |
Property Value to Household Income Ratio in North Spearfish
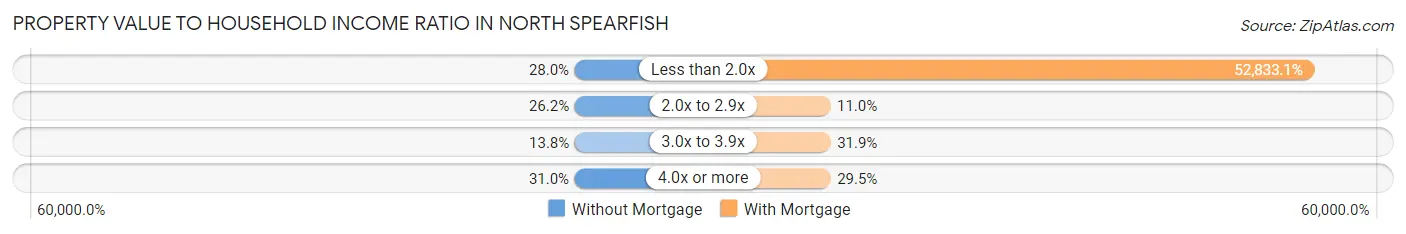
| Value-to-Income Ratio | Without Mortgage | With Mortgage |
| Less than 2.0x | 128 (28.0%) | 86,118 (52,833.1%) |
| 2.0x to 2.9x | 120 (26.2%) | 18 (11.0%) |
| 3.0x to 3.9x | 63 (13.8%) | 52 (31.9%) |
| 4.0x or more | 142 (31.0%) | 48 (29.4%) |
| Total | 458 (100.0%) | 163 (100.0%) |
Real Estate Taxes by Mortgage Status in North Spearfish
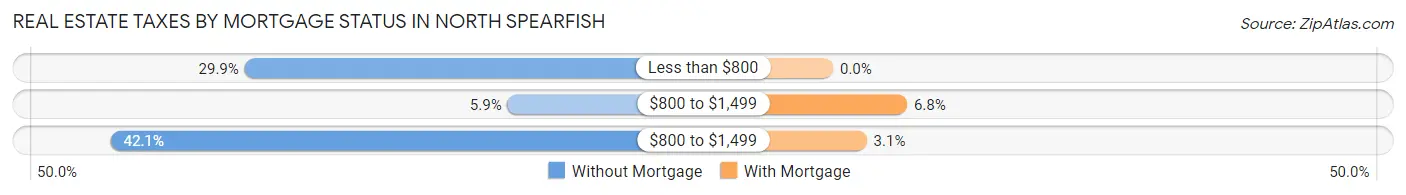
| Property Taxes | Without Mortgage | With Mortgage |
| Less than $800 | 137 (29.9%) | 0 (0.0%) |
| $800 to $1,499 | 27 (5.9%) | 11 (6.8%) |
| $800 to $1,499 | 193 (42.1%) | 5 (3.1%) |
| Total | 458 (100.0%) | 163 (100.0%) |
Health & Disability in North Spearfish
Health Insurance Coverage by Age in North Spearfish
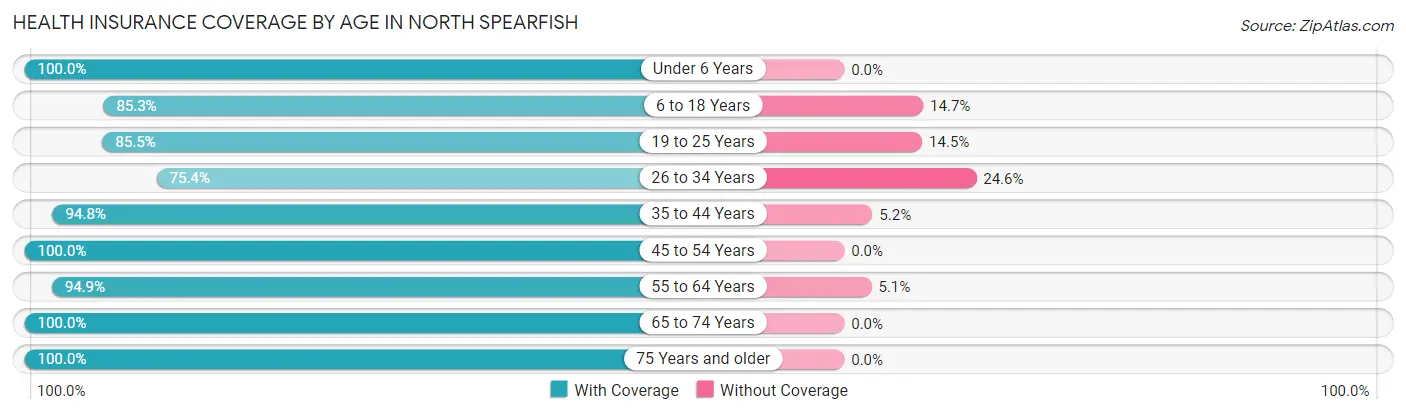
| Age Bracket | With Coverage | Without Coverage |
| Under 6 Years | 75 (100.0%) | 0 (0.0%) |
| 6 to 18 Years | 261 (85.3%) | 45 (14.7%) |
| 19 to 25 Years | 159 (85.5%) | 27 (14.5%) |
| 26 to 34 Years | 98 (75.4%) | 32 (24.6%) |
| 35 to 44 Years | 217 (94.8%) | 12 (5.2%) |
| 45 to 54 Years | 164 (100.0%) | 0 (0.0%) |
| 55 to 64 Years | 224 (94.9%) | 12 (5.1%) |
| 65 to 74 Years | 361 (100.0%) | 0 (0.0%) |
| 75 Years and older | 104 (100.0%) | 0 (0.0%) |
| Total | 1,663 (92.8%) | 128 (7.1%) |
Health Insurance Coverage by Citizenship Status in North Spearfish
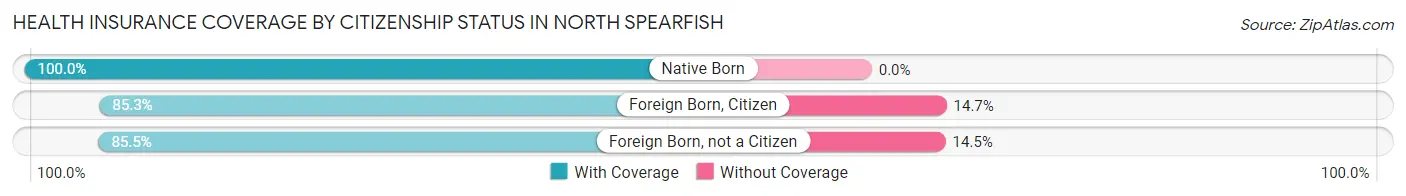
| Citizenship Status | With Coverage | Without Coverage |
| Native Born | 75 (100.0%) | 0 (0.0%) |
| Foreign Born, Citizen | 261 (85.3%) | 45 (14.7%) |
| Foreign Born, not a Citizen | 159 (85.5%) | 27 (14.5%) |
Health Insurance Coverage by Household Income in North Spearfish
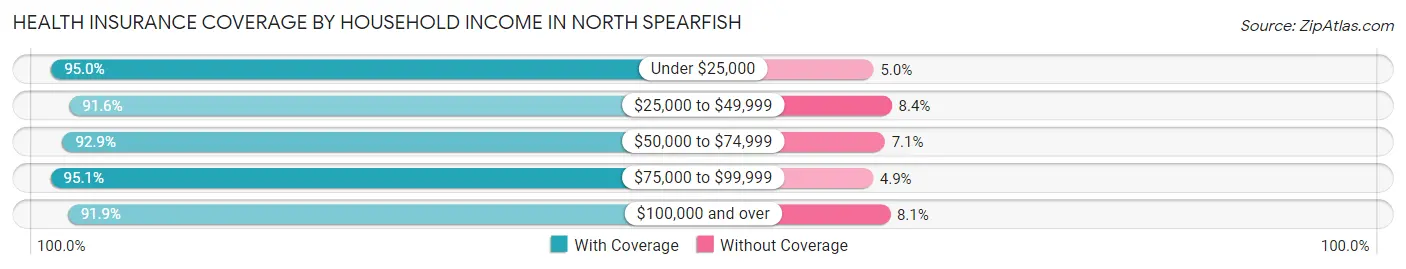
| Household Income | With Coverage | Without Coverage |
| Under $25,000 | 95 (95.0%) | 5 (5.0%) |
| $25,000 to $49,999 | 404 (91.6%) | 37 (8.4%) |
| $50,000 to $74,999 | 301 (92.9%) | 23 (7.1%) |
| $75,000 to $99,999 | 351 (95.1%) | 18 (4.9%) |
| $100,000 and over | 512 (91.9%) | 45 (8.1%) |
Public vs Private Health Insurance Coverage by Age in North Spearfish
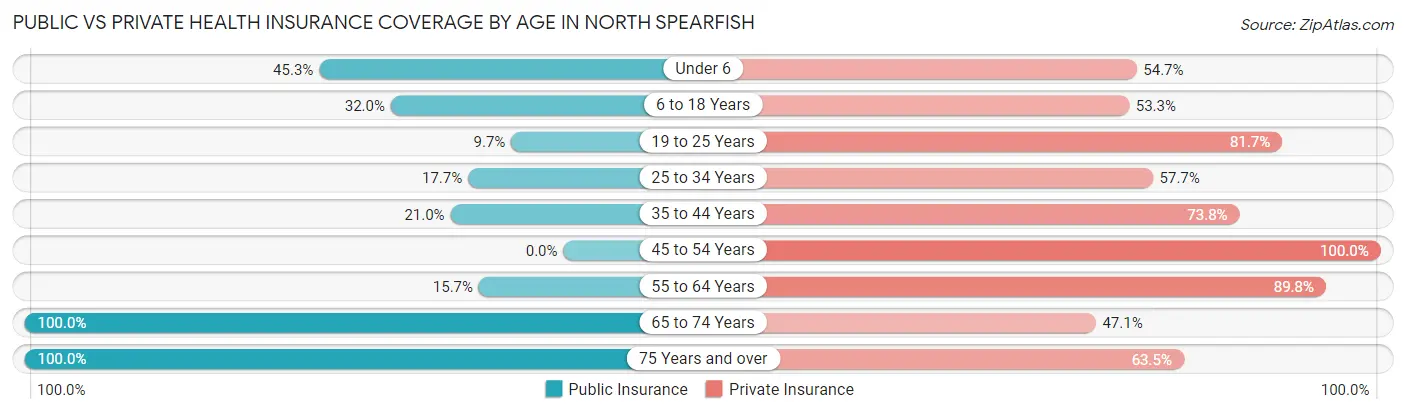
| Age Bracket | Public Insurance | Private Insurance |
| Under 6 | 34 (45.3%) | 41 (54.7%) |
| 6 to 18 Years | 98 (32.0%) | 163 (53.3%) |
| 19 to 25 Years | 18 (9.7%) | 152 (81.7%) |
| 25 to 34 Years | 23 (17.7%) | 75 (57.7%) |
| 35 to 44 Years | 48 (21.0%) | 169 (73.8%) |
| 45 to 54 Years | 0 (0.0%) | 164 (100.0%) |
| 55 to 64 Years | 37 (15.7%) | 212 (89.8%) |
| 65 to 74 Years | 361 (100.0%) | 170 (47.1%) |
| 75 Years and over | 104 (100.0%) | 66 (63.5%) |
| Total | 723 (40.4%) | 1,212 (67.7%) |
Disability Status by Sex by Age in North Spearfish
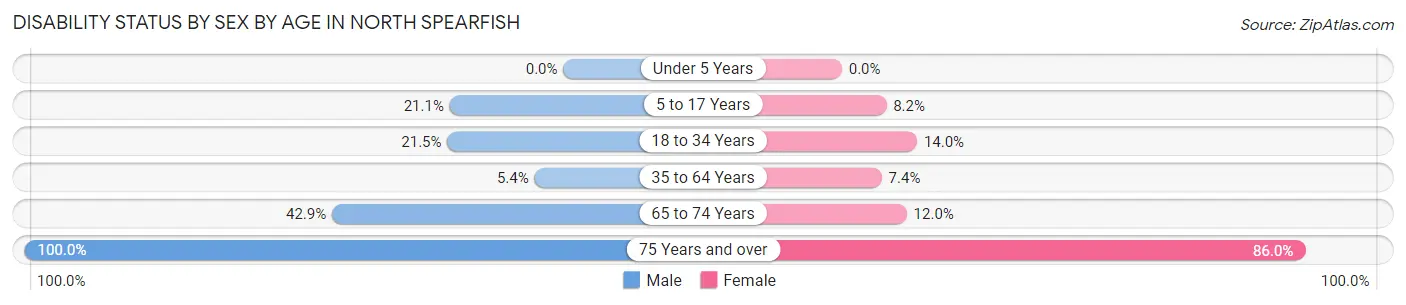
| Age Bracket | Male | Female |
| Under 5 Years | 0 (0.0%) | 0 (0.0%) |
| 5 to 17 Years | 31 (21.1%) | 15 (8.2%) |
| 18 to 34 Years | 31 (21.5%) | 24 (14.0%) |
| 35 to 64 Years | 17 (5.3%) | 23 (7.4%) |
| 65 to 74 Years | 73 (42.9%) | 23 (12.0%) |
| 75 Years and over | 54 (100.0%) | 43 (86.0%) |
Disability Class by Sex by Age in North Spearfish
Disability Class: Hearing Difficulty
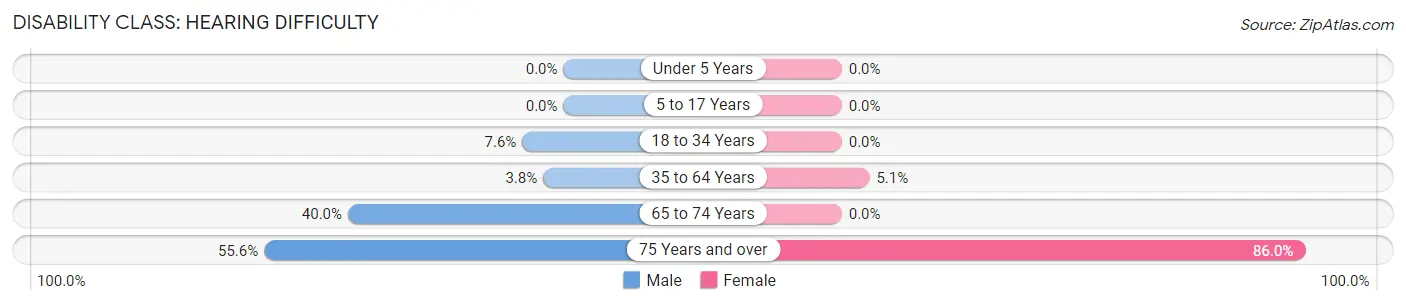
| Age Bracket | Male | Female |
| Under 5 Years | 0 (0.0%) | 0 (0.0%) |
| 5 to 17 Years | 0 (0.0%) | 0 (0.0%) |
| 18 to 34 Years | 11 (7.6%) | 0 (0.0%) |
| 35 to 64 Years | 12 (3.8%) | 16 (5.1%) |
| 65 to 74 Years | 68 (40.0%) | 0 (0.0%) |
| 75 Years and over | 30 (55.6%) | 43 (86.0%) |
Disability Class: Vision Difficulty
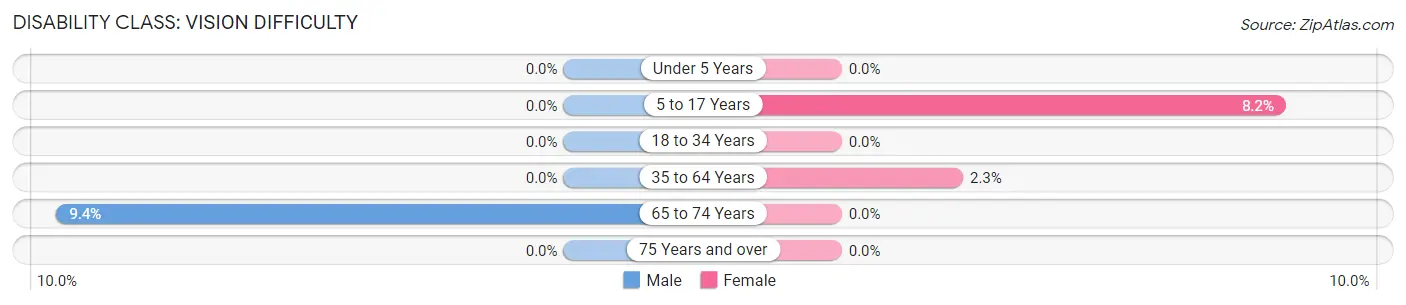
| Age Bracket | Male | Female |
| Under 5 Years | 0 (0.0%) | 0 (0.0%) |
| 5 to 17 Years | 0 (0.0%) | 15 (8.2%) |
| 18 to 34 Years | 0 (0.0%) | 0 (0.0%) |
| 35 to 64 Years | 0 (0.0%) | 7 (2.2%) |
| 65 to 74 Years | 16 (9.4%) | 0 (0.0%) |
| 75 Years and over | 0 (0.0%) | 0 (0.0%) |
Disability Class: Cognitive Difficulty
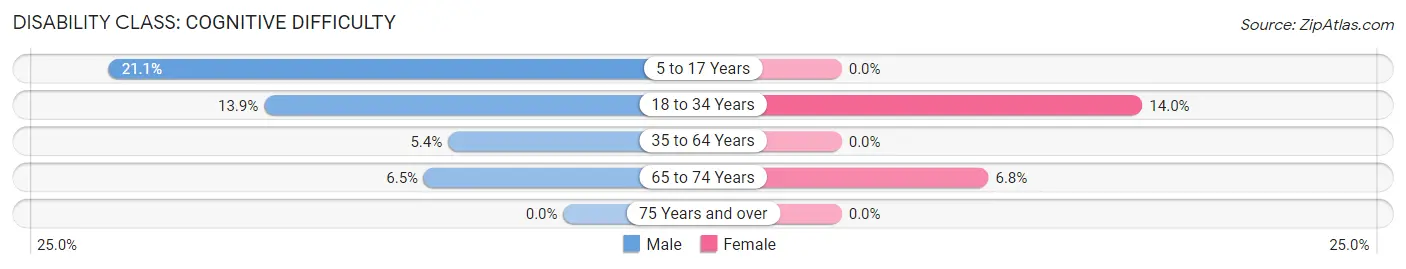
| Age Bracket | Male | Female |
| 5 to 17 Years | 31 (21.1%) | 0 (0.0%) |
| 18 to 34 Years | 20 (13.9%) | 24 (14.0%) |
| 35 to 64 Years | 17 (5.3%) | 0 (0.0%) |
| 65 to 74 Years | 11 (6.5%) | 13 (6.8%) |
| 75 Years and over | 0 (0.0%) | 0 (0.0%) |
Disability Class: Ambulatory Difficulty
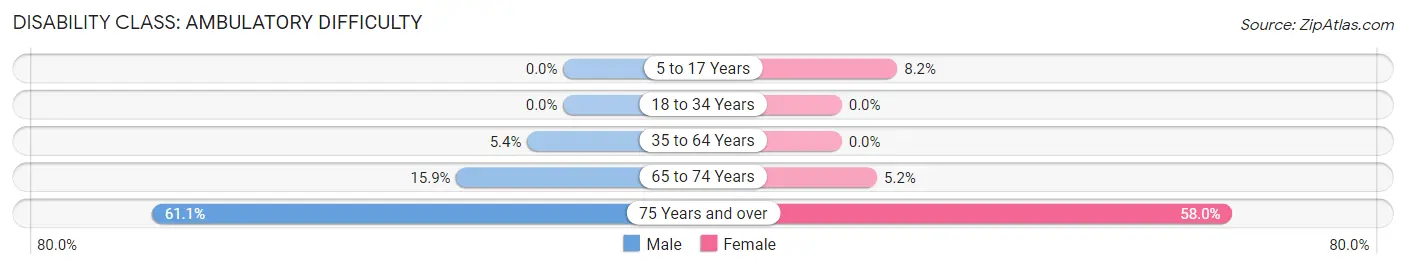
| Age Bracket | Male | Female |
| 5 to 17 Years | 0 (0.0%) | 15 (8.2%) |
| 18 to 34 Years | 0 (0.0%) | 0 (0.0%) |
| 35 to 64 Years | 17 (5.3%) | 0 (0.0%) |
| 65 to 74 Years | 27 (15.9%) | 10 (5.2%) |
| 75 Years and over | 33 (61.1%) | 29 (58.0%) |
Disability Class: Self-Care Difficulty
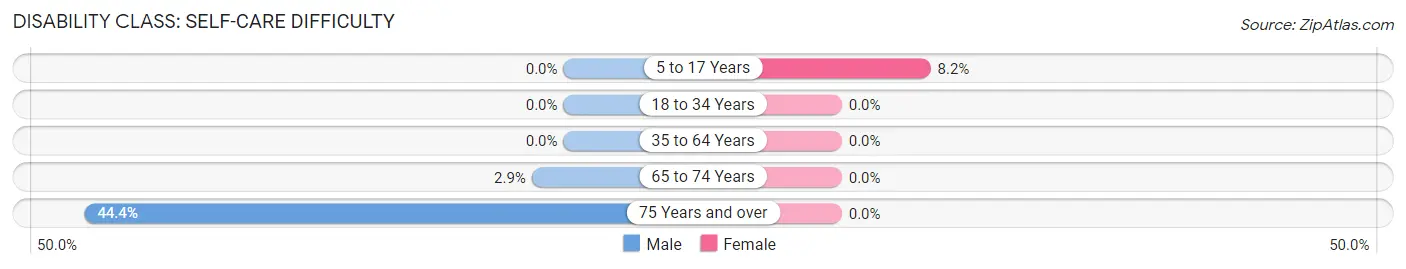
| Age Bracket | Male | Female |
| 5 to 17 Years | 0 (0.0%) | 15 (8.2%) |
| 18 to 34 Years | 0 (0.0%) | 0 (0.0%) |
| 35 to 64 Years | 0 (0.0%) | 0 (0.0%) |
| 65 to 74 Years | 5 (2.9%) | 0 (0.0%) |
| 75 Years and over | 24 (44.4%) | 0 (0.0%) |
Technology Access in North Spearfish
Computing Device Access in North Spearfish
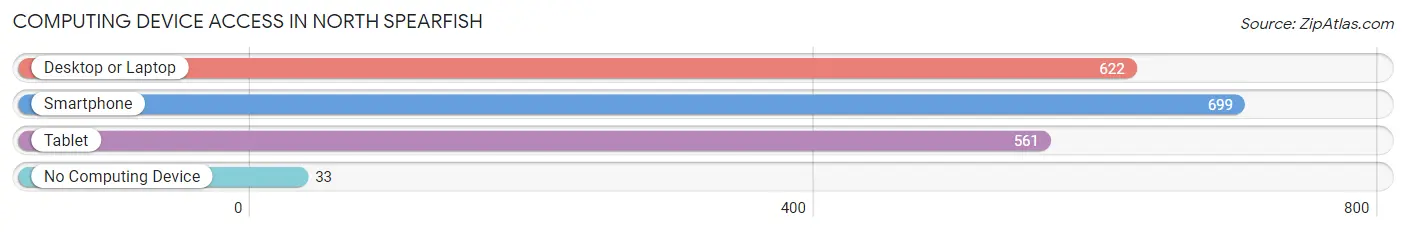
| Device Type | # Households | % Households |
| Desktop or Laptop | 622 | 83.0% |
| Smartphone | 699 | 93.3% |
| Tablet | 561 | 74.9% |
| No Computing Device | 33 | 4.4% |
| Total | 749 | 100.0% |
Internet Access in North Spearfish
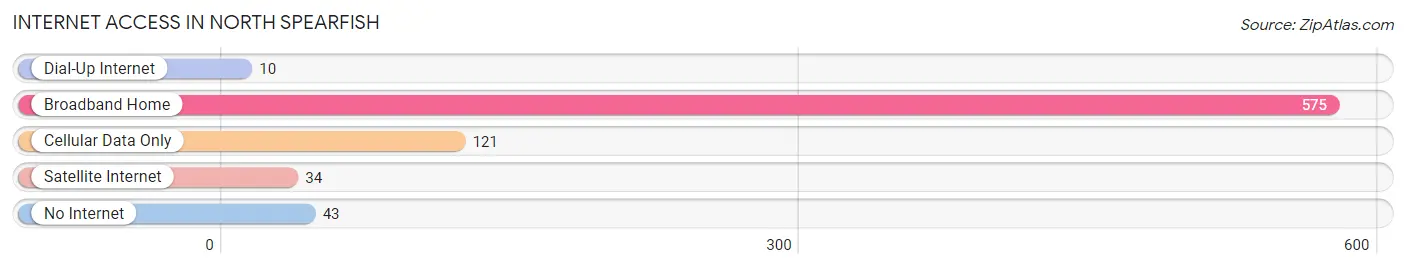
| Internet Type | # Households | % Households |
| Dial-Up Internet | 10 | 1.3% |
| Broadband Home | 575 | 76.8% |
| Cellular Data Only | 121 | 16.2% |
| Satellite Internet | 34 | 4.5% |
| No Internet | 43 | 5.7% |
| Total | 749 | 100.0% |
North Spearfish Summary
Spearfish, South Dakota is a small city located in the northern part of the state, in Lawrence County. It is situated in the Black Hills region of South Dakota, and is the county seat of Lawrence County. The city is located at the intersection of Interstate 90 and US Highway 14, and is approximately 25 miles east of Rapid City. The city has a population of 10,494 as of the 2020 census, making it the fourth largest city in South Dakota.
History
The area that is now Spearfish was first inhabited by the Lakota Sioux, who used the area for hunting and gathering. The first white settlers arrived in the area in the late 1800s, and the city was officially founded in 1883. The city was named after the Spearfish Creek, which runs through the city.
The city was initially a mining town, with gold, silver, and lead being mined in the area. The city also became a popular tourist destination, with the nearby Spearfish Canyon being a popular destination for hikers and sightseers.
In the early 1900s, the city began to grow and develop, with the construction of the Spearfish Hotel in 1906, and the Spearfish Normal School in 1907. The school was later renamed Black Hills State University, and is now the largest university in the state.
Geography
Spearfish is located in the northern part of South Dakota, in the Black Hills region. The city is situated at the intersection of Interstate 90 and US Highway 14, and is approximately 25 miles east of Rapid City. The city is located at an elevation of 3,845 feet, and has a total area of 8.2 square miles.
The city is located in a valley, surrounded by the Black Hills National Forest. The city is also located near the Spearfish Creek, which runs through the city.
Economy
Spearfish has a diverse economy, with a variety of industries providing employment opportunities. The city is home to several large employers, including Black Hills State University, Spearfish Regional Hospital, and the Spearfish School District.
The city is also home to several small businesses, including restaurants, retail stores, and service providers. The city is also home to several manufacturing companies, including Spearfish Manufacturing, which produces a variety of products, including furniture, cabinets, and other wood products.
Demographics
As of the 2020 census, the population of Spearfish was 10,494. The city has a population density of 1,269 people per square mile. The median age of the population is 36.7 years, and the median household income is $50,945.
The racial makeup of the city is 94.2% White, 1.2% African American, 0.7% Native American, 0.7% Asian, 0.2% Pacific Islander, 1.3% from other races, and 2.0% from two or more races. The city also has a large Hispanic population, with 8.3% of the population being of Hispanic or Latino origin.
Conclusion
Spearfish, South Dakota is a small city located in the northern part of the state, in Lawrence County. It is situated in the Black Hills region of South Dakota, and is the county seat of Lawrence County. The city has a population of 10,494 as of the 2020 census, making it the fourth largest city in South Dakota. The city has a diverse economy, with a variety of industries providing employment opportunities. The racial makeup of the city is 94.2% White, 1.2% African American, 0.7% Native American, 0.7% Asian, 0.2% Pacific Islander, 1.3% from other races, and 2.0% from two or more races. The city also has a large Hispanic population, with 8.3% of the population being of Hispanic or Latino origin.
Common Questions
What is Per Capita Income in North Spearfish?
Per Capita income in North Spearfish is $34,115.
What is the Median Family Income in North Spearfish?
Median Family Income in North Spearfish is $81,800.
What is the Median Household income in North Spearfish?
Median Household Income in North Spearfish is $67,736.
What is Income or Wage Gap in North Spearfish?
Income or Wage Gap in North Spearfish is 32.9%.
Women in North Spearfish earn 67.1 cents for every dollar earned by a man.
What is Inequality or Gini Index in North Spearfish?
Inequality or Gini Index in North Spearfish is 0.39.
What is the Total Population of North Spearfish?
Total Population of North Spearfish is 1,791.
What is the Total Male Population of North Spearfish?
Total Male Population of North Spearfish is 833.
What is the Total Female Population of North Spearfish?
Total Female Population of North Spearfish is 958.
What is the Ratio of Males per 100 Females in North Spearfish?
There are 86.95 Males per 100 Females in North Spearfish.
What is the Ratio of Females per 100 Males in North Spearfish?
There are 115.01 Females per 100 Males in North Spearfish.
What is the Median Population Age in North Spearfish?
Median Population Age in North Spearfish is 44.2 Years.
What is the Average Family Size in North Spearfish
Average Family Size in North Spearfish is 2.9 People.
What is the Average Household Size in North Spearfish
Average Household Size in North Spearfish is 2.4 People.
How Large is the Labor Force in North Spearfish?
There are 1,114 People in the Labor Forcein in North Spearfish.
What is the Percentage of People in the Labor Force in North Spearfish?
75.3% of People are in the Labor Force in North Spearfish.
What is the Unemployment Rate in North Spearfish?
Unemployment Rate in North Spearfish is 1.1%.