Lake Dalecarlia, IN Map & Demographics
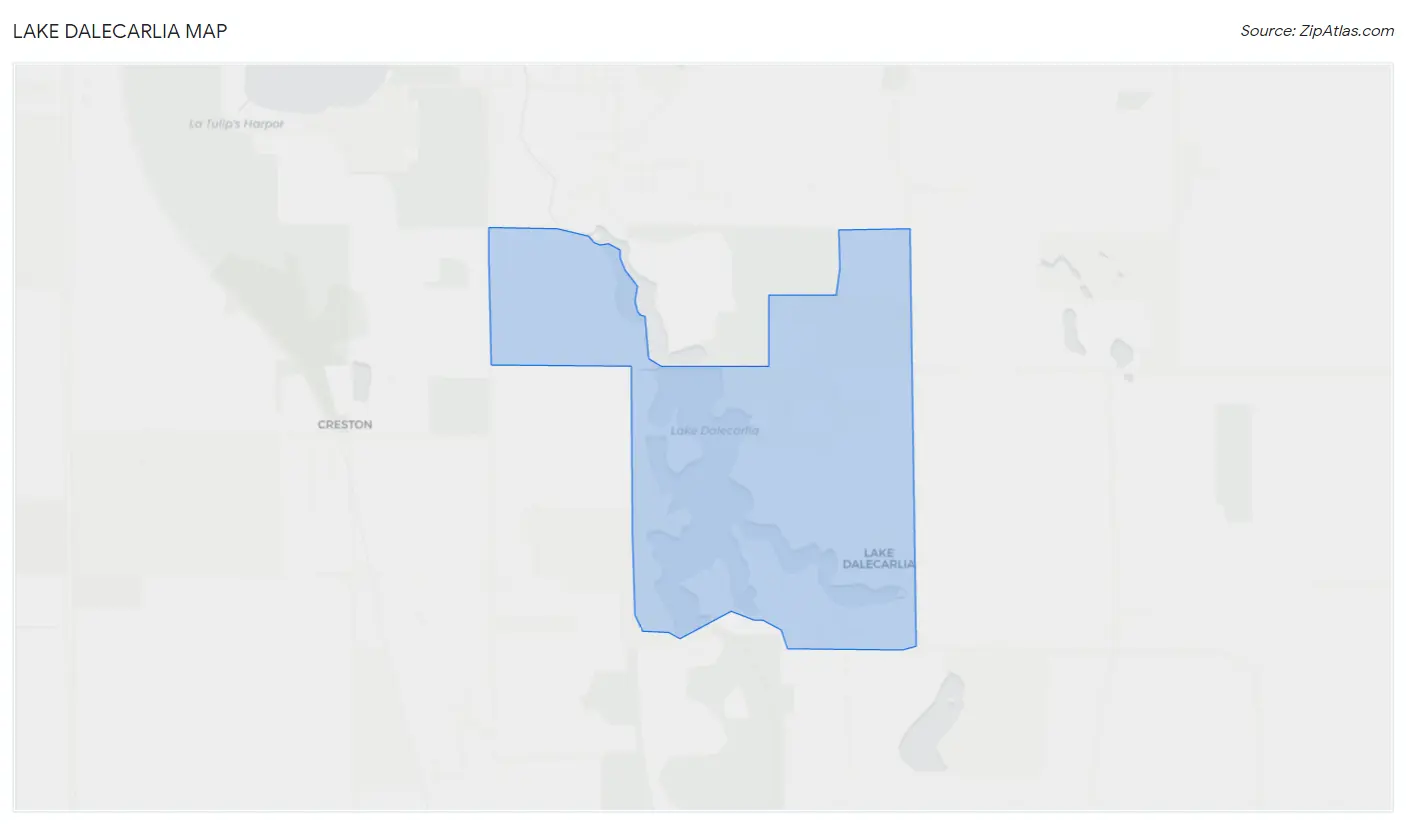
Lake Dalecarlia Map
Lake Dalecarlia Overview
$44,109
PER CAPITA INCOME
$114,257
AVG FAMILY INCOME
$107,214
AVG HOUSEHOLD INCOME
34.5%
WAGE / INCOME GAP [ % ]
65.5¢/ $1
WAGE / INCOME GAP [ $ ]
0.35
INEQUALITY / GINI INDEX
1,448
TOTAL POPULATION
695
MALE POPULATION
753
FEMALE POPULATION
92.30
MALES / 100 FEMALES
108.35
FEMALES / 100 MALES
45.0
MEDIAN AGE
3.2
AVG FAMILY SIZE
2.6
AVG HOUSEHOLD SIZE
869
LABOR FORCE [ PEOPLE ]
72.2%
PERCENT IN LABOR FORCE
3.7%
UNEMPLOYMENT RATE
Income in Lake Dalecarlia
Income Overview in Lake Dalecarlia
Per Capita Income in Lake Dalecarlia is $44,109, while median incomes of families and households are $114,257 and $107,214 respectively.
| Characteristic | Number | Measure |
| Per Capita Income | 1,448 | $44,109 |
| Median Family Income | 412 | $114,257 |
| Mean Family Income | 412 | $142,434 |
| Median Household Income | 554 | $107,214 |
| Mean Household Income | 554 | $116,561 |
| Income Deficit | 412 | $0 |
| Wage / Income Gap (%) | 1,448 | 34.45% |
| Wage / Income Gap ($) | 1,448 | 65.55¢ per $1 |
| Gini / Inequality Index | 1,448 | 0.35 |
Earnings by Sex in Lake Dalecarlia
Average Earnings in Lake Dalecarlia are $47,356, $61,979 for men and $40,625 for women, a difference of 34.4%.
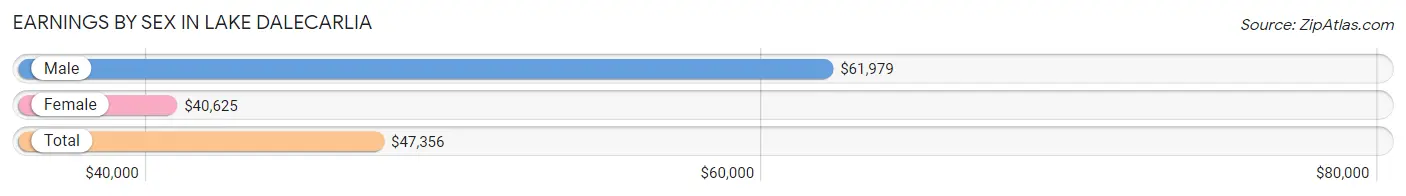
| Sex | Number | Average Earnings |
| Male | 463 (52.0%) | $61,979 |
| Female | 428 (48.0%) | $40,625 |
| Total | 891 (100.0%) | $47,356 |
Earnings by Sex by Income Bracket in Lake Dalecarlia
The most common earnings brackets in Lake Dalecarlia are $75,000 to $99,999 for men (121 | 26.1%) and $100,000+ for women (82 | 19.2%).
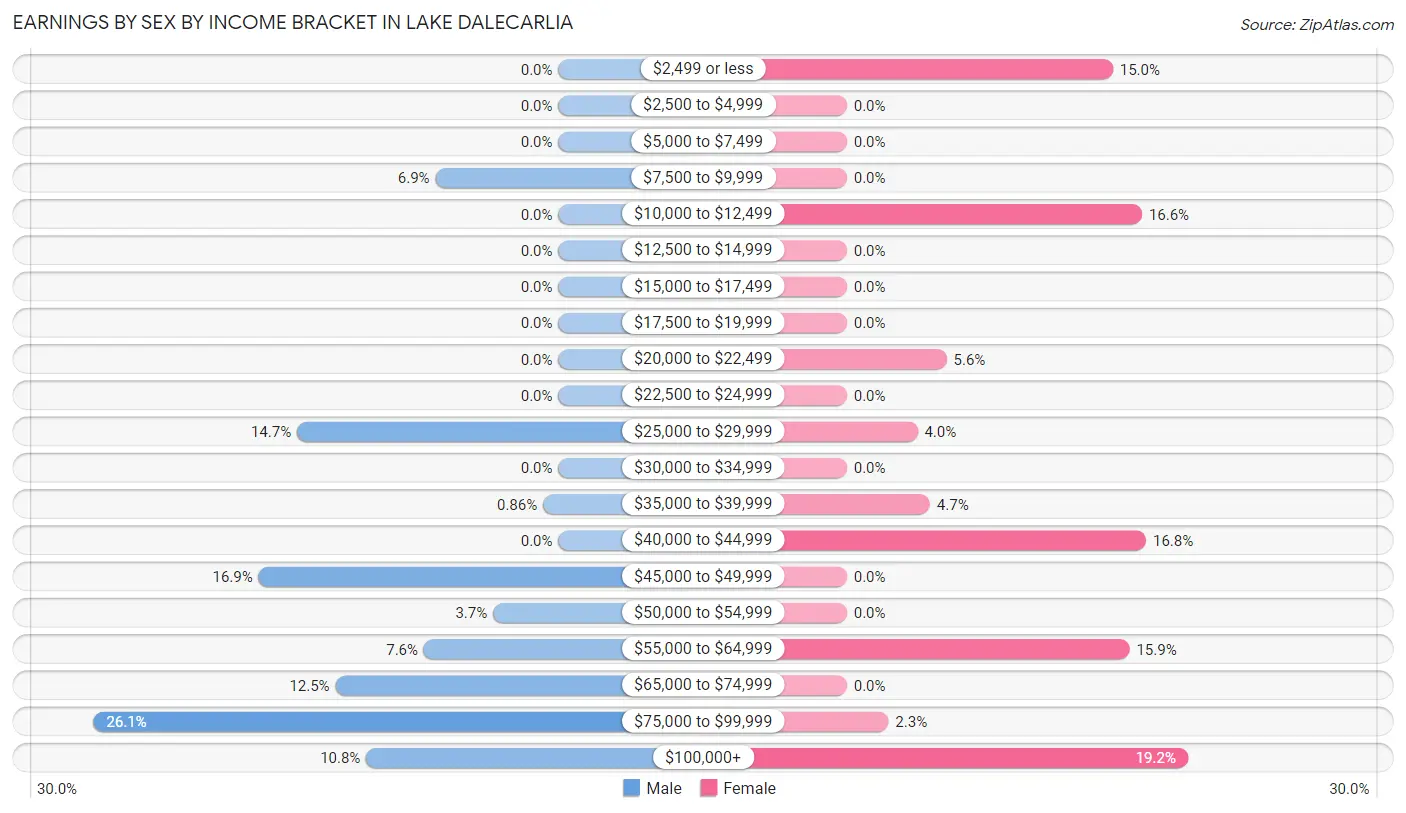
| Income | Male | Female |
| $2,499 or less | 0 (0.0%) | 64 (14.9%) |
| $2,500 to $4,999 | 0 (0.0%) | 0 (0.0%) |
| $5,000 to $7,499 | 0 (0.0%) | 0 (0.0%) |
| $7,500 to $9,999 | 32 (6.9%) | 0 (0.0%) |
| $10,000 to $12,499 | 0 (0.0%) | 71 (16.6%) |
| $12,500 to $14,999 | 0 (0.0%) | 0 (0.0%) |
| $15,000 to $17,499 | 0 (0.0%) | 0 (0.0%) |
| $17,500 to $19,999 | 0 (0.0%) | 0 (0.0%) |
| $20,000 to $22,499 | 0 (0.0%) | 24 (5.6%) |
| $22,500 to $24,999 | 0 (0.0%) | 0 (0.0%) |
| $25,000 to $29,999 | 68 (14.7%) | 17 (4.0%) |
| $30,000 to $34,999 | 0 (0.0%) | 0 (0.0%) |
| $35,000 to $39,999 | 4 (0.9%) | 20 (4.7%) |
| $40,000 to $44,999 | 0 (0.0%) | 72 (16.8%) |
| $45,000 to $49,999 | 78 (16.9%) | 0 (0.0%) |
| $50,000 to $54,999 | 17 (3.7%) | 0 (0.0%) |
| $55,000 to $64,999 | 35 (7.6%) | 68 (15.9%) |
| $65,000 to $74,999 | 58 (12.5%) | 0 (0.0%) |
| $75,000 to $99,999 | 121 (26.1%) | 10 (2.3%) |
| $100,000+ | 50 (10.8%) | 82 (19.2%) |
| Total | 463 (100.0%) | 428 (100.0%) |
Earnings by Sex by Educational Attainment in Lake Dalecarlia
Average earnings in Lake Dalecarlia are $69,547 for men and $63,311 for women, a difference of 9.0%. Men with an educational attainment of college or associate's degree enjoy the highest average annual earnings of $95,938, while those with bachelor's degree education earn the least with $67,569. Women with an educational attainment of college or associate's degree earn the most with the average annual earnings of $63,860, while those with college or associate's degree education have the smallest earnings of $63,860.
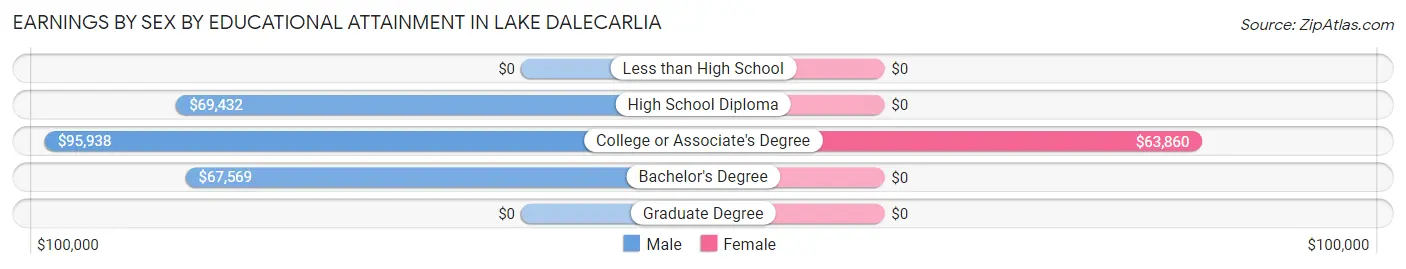
| Educational Attainment | Male Income | Female Income |
| Less than High School | - | - |
| High School Diploma | $69,432 | $0 |
| College or Associate's Degree | $95,938 | $63,860 |
| Bachelor's Degree | $67,569 | $0 |
| Graduate Degree | - | - |
| Total | $69,547 | $63,311 |
Family Income in Lake Dalecarlia
Family Income Brackets in Lake Dalecarlia
According to the Lake Dalecarlia family income data, there are 142 families falling into the $100,000 to $149,999 income range, which is the most common income bracket and makes up 34.5% of all families.
| Income Bracket | # Families | % Families |
| Less than $10,000 | 0 | 0.0% |
| $10,000 to $14,999 | 0 | 0.0% |
| $15,000 to $24,999 | 0 | 0.0% |
| $25,000 to $34,999 | 0 | 0.0% |
| $35,000 to $49,999 | 0 | 0.0% |
| $50,000 to $74,999 | 71 | 17.2% |
| $75,000 to $99,999 | 33 | 8.0% |
| $100,000 to $149,999 | 142 | 34.5% |
| $150,000 to $199,999 | 96 | 23.3% |
| $200,000+ | 70 | 17.0% |
Family Income by Famaliy Size in Lake Dalecarlia
2-person families (184 | 44.7%) account for the highest median family income in Lake Dalecarlia with $111,806 per family, while 2-person families (184 | 44.7%) have the highest median income of $55,903 per family member.
| Income Bracket | # Families | Median Income |
| 2-Person Families | 184 (44.7%) | $111,806 |
| 3-Person Families | 18 (4.4%) | $0 |
| 4-Person Families | 172 (41.7%) | $0 |
| 5-Person Families | 38 (9.2%) | $0 |
| 6-Person Families | 0 (0.0%) | $0 |
| 7+ Person Families | 0 (0.0%) | $0 |
| Total | 412 (100.0%) | $114,257 |
Family Income by Number of Earners in Lake Dalecarlia
| Number of Earners | # Families | Median Income |
| No Earners | 31 (7.5%) | $0 |
| 1 Earner | 130 (31.6%) | $112,568 |
| 2 Earners | 137 (33.3%) | $108,207 |
| 3+ Earners | 114 (27.7%) | $0 |
| Total | 412 (100.0%) | $114,257 |
Household Income in Lake Dalecarlia
Household Income Brackets in Lake Dalecarlia
With 142 households falling in the category, the $100,000 to $149,999 income range is the most frequent in Lake Dalecarlia, accounting for 25.6% of all households.
| Income Bracket | # Households | % Households |
| Less than $10,000 | 0 | 0.0% |
| $10,000 to $14,999 | 12 | 2.2% |
| $15,000 to $24,999 | 16 | 2.9% |
| $25,000 to $34,999 | 48 | 8.7% |
| $35,000 to $49,999 | 35 | 6.3% |
| $50,000 to $74,999 | 71 | 12.8% |
| $75,000 to $99,999 | 64 | 11.6% |
| $100,000 to $149,999 | 142 | 25.6% |
| $150,000 to $199,999 | 96 | 17.3% |
| $200,000+ | 70 | 12.6% |
Household Income by Householder Age in Lake Dalecarlia
The median household income in Lake Dalecarlia is $107,214, with the highest median household income of $150,702 found in the 45 to 64 years age bracket for the primary householder. A total of 240 households (43.3%) fall into this category.
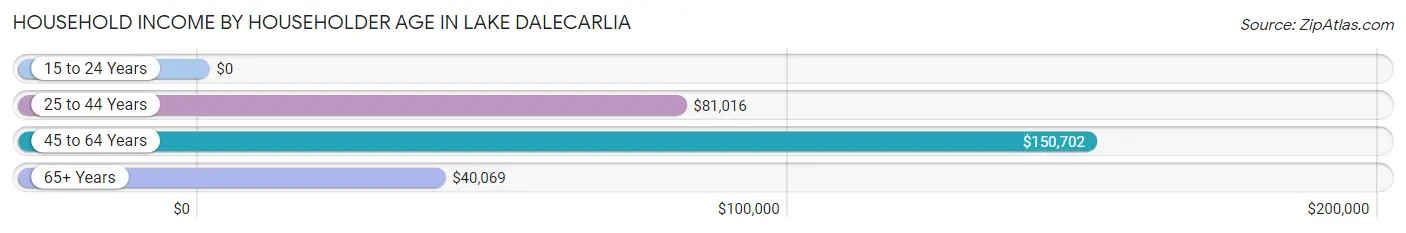
| Income Bracket | # Households | Median Income |
| 15 to 24 Years | 0 (0.0%) | $0 |
| 25 to 44 Years | 161 (29.1%) | $81,016 |
| 45 to 64 Years | 240 (43.3%) | $150,702 |
| 65+ Years | 153 (27.6%) | $40,069 |
| Total | 554 (100.0%) | $107,214 |
Poverty in Lake Dalecarlia
Income Below Poverty by Sex and Age in Lake Dalecarlia
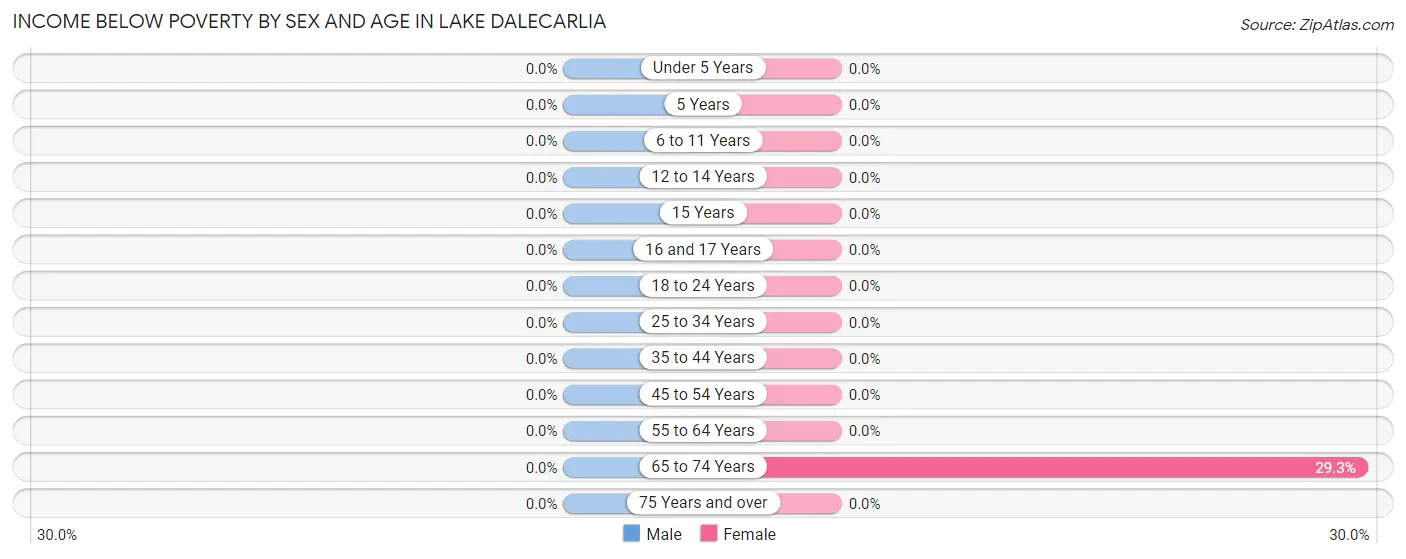
| Age Bracket | Male | Female |
| Under 5 Years | 0 (0.0%) | 0 (0.0%) |
| 5 Years | 0 (0.0%) | 0 (0.0%) |
| 6 to 11 Years | 0 (0.0%) | 0 (0.0%) |
| 12 to 14 Years | 0 (0.0%) | 0 (0.0%) |
| 15 Years | 0 (0.0%) | 0 (0.0%) |
| 16 and 17 Years | 0 (0.0%) | 0 (0.0%) |
| 18 to 24 Years | 0 (0.0%) | 0 (0.0%) |
| 25 to 34 Years | 0 (0.0%) | 0 (0.0%) |
| 35 to 44 Years | 0 (0.0%) | 0 (0.0%) |
| 45 to 54 Years | 0 (0.0%) | 0 (0.0%) |
| 55 to 64 Years | 0 (0.0%) | 0 (0.0%) |
| 65 to 74 Years | 0 (0.0%) | 12 (29.3%) |
| 75 Years and over | 0 (0.0%) | 0 (0.0%) |
| Total | 0 (0.0%) | 12 (1.6%) |
Income Above Poverty by Sex and Age in Lake Dalecarlia
According to the poverty statistics in Lake Dalecarlia, males aged under 5 years and females aged under 5 years are the age groups that are most secure financially, with 100.0% of males and 100.0% of females in these age groups living above the poverty line.
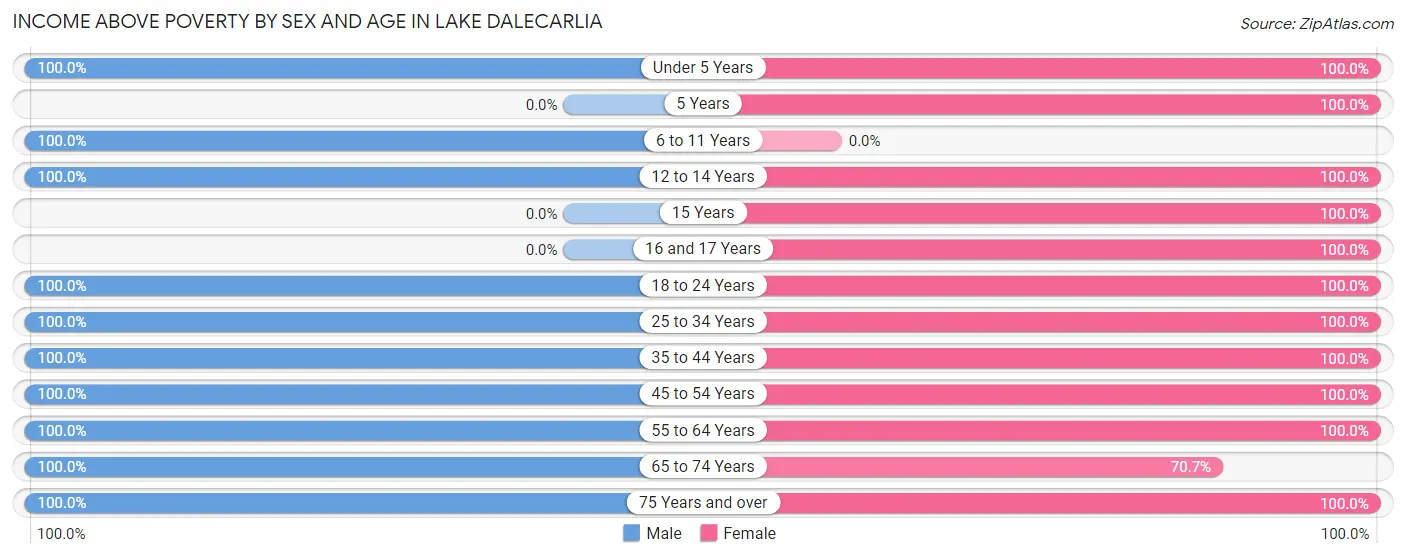
| Age Bracket | Male | Female |
| Under 5 Years | 22 (100.0%) | 53 (100.0%) |
| 5 Years | 0 (0.0%) | 16 (100.0%) |
| 6 to 11 Years | 53 (100.0%) | 0 (0.0%) |
| 12 to 14 Years | 50 (100.0%) | 25 (100.0%) |
| 15 Years | 0 (0.0%) | 25 (100.0%) |
| 16 and 17 Years | 0 (0.0%) | 64 (100.0%) |
| 18 to 24 Years | 100 (100.0%) | 103 (100.0%) |
| 25 to 34 Years | 27 (100.0%) | 32 (100.0%) |
| 35 to 44 Years | 97 (100.0%) | 56 (100.0%) |
| 45 to 54 Years | 123 (100.0%) | 98 (100.0%) |
| 55 to 64 Years | 108 (100.0%) | 169 (100.0%) |
| 65 to 74 Years | 102 (100.0%) | 29 (70.7%) |
| 75 Years and over | 13 (100.0%) | 71 (100.0%) |
| Total | 695 (100.0%) | 741 (98.4%) |
Income Below Poverty Among Married-Couple Families in Lake Dalecarlia
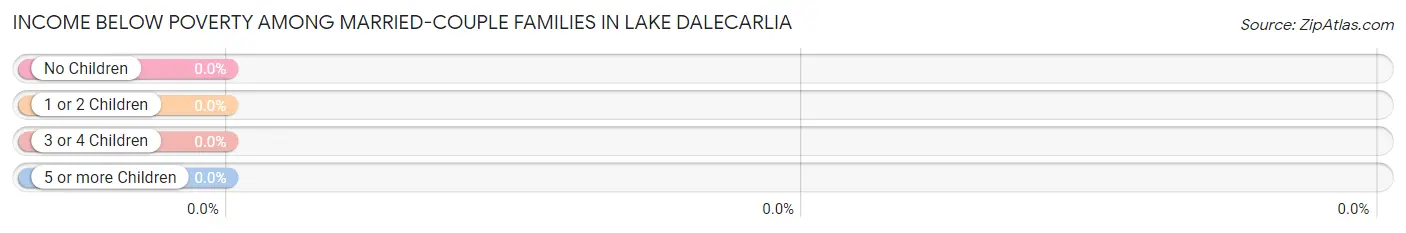
| Children | Above Poverty | Below Poverty |
| No Children | 220 (100.0%) | 0 (0.0%) |
| 1 or 2 Children | 133 (100.0%) | 0 (0.0%) |
| 3 or 4 Children | 20 (100.0%) | 0 (0.0%) |
| 5 or more Children | 0 (0.0%) | 0 (0.0%) |
| Total | 373 (100.0%) | 0 (0.0%) |
Income Below Poverty Among Single-Parent Households in Lake Dalecarlia
| Children | Single Father | Single Mother |
| No Children | 0 (0.0%) | 0 (0.0%) |
| 1 or 2 Children | 0 (0.0%) | 0 (0.0%) |
| 3 or 4 Children | 0 (0.0%) | 0 (0.0%) |
| 5 or more Children | 0 (0.0%) | 0 (0.0%) |
| Total | 0 (0.0%) | 0 (0.0%) |
Income Below Poverty Among Married-Couple vs Single-Parent Households in Lake Dalecarlia
| Children | Married-Couple Families | Single-Parent Households |
| No Children | 0 (0.0%) | 0 (0.0%) |
| 1 or 2 Children | 0 (0.0%) | 0 (0.0%) |
| 3 or 4 Children | 0 (0.0%) | 0 (0.0%) |
| 5 or more Children | 0 (0.0%) | 0 (0.0%) |
| Total | 0 (0.0%) | 0 (0.0%) |
Race in Lake Dalecarlia
The most populous races in Lake Dalecarlia are White / Caucasian (1,320 | 91.2%), Hispanic or Latino (117 | 8.1%), and Some other Race (117 | 8.1%).
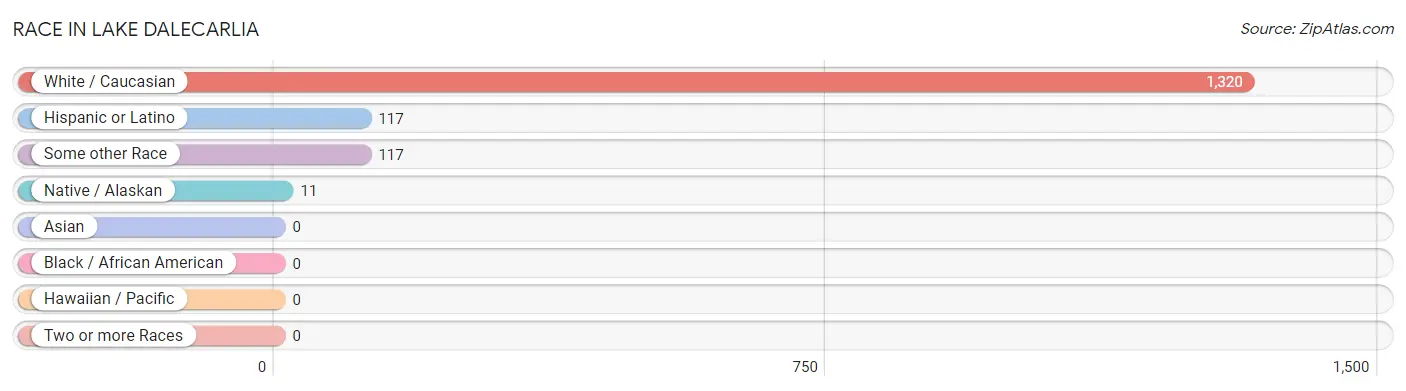
| Race | # Population | % Population |
| Asian | 0 | 0.0% |
| Black / African American | 0 | 0.0% |
| Hawaiian / Pacific | 0 | 0.0% |
| Hispanic or Latino | 117 | 8.1% |
| Native / Alaskan | 11 | 0.8% |
| White / Caucasian | 1,320 | 91.2% |
| Two or more Races | 0 | 0.0% |
| Some other Race | 117 | 8.1% |
| Total | 1,448 | 100.0% |
Ancestry in Lake Dalecarlia
The most populous ancestries reported in Lake Dalecarlia are German (535 | 36.9%), Irish (220 | 15.2%), Polish (208 | 14.4%), Hungarian (193 | 13.3%), and Serbian (193 | 13.3%), together accounting for 93.2% of all Lake Dalecarlia residents.
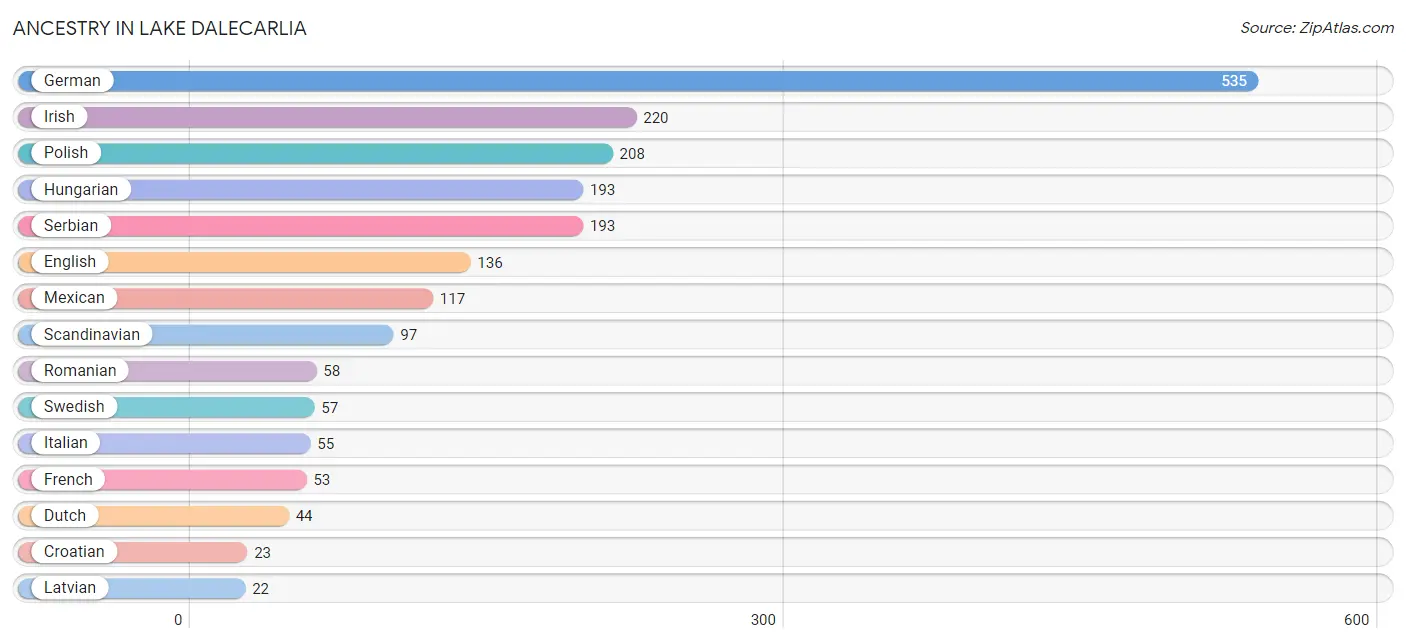
| Ancestry | # Population | % Population |
| Blackfeet | 11 | 0.8% |
| Croatian | 23 | 1.6% |
| Dutch | 44 | 3.0% |
| English | 136 | 9.4% |
| French | 53 | 3.7% |
| French Canadian | 12 | 0.8% |
| German | 535 | 36.9% |
| Hungarian | 193 | 13.3% |
| Irish | 220 | 15.2% |
| Italian | 55 | 3.8% |
| Latvian | 22 | 1.5% |
| Lithuanian | 21 | 1.5% |
| Mexican | 117 | 8.1% |
| Polish | 208 | 14.4% |
| Romanian | 58 | 4.0% |
| Scandinavian | 97 | 6.7% |
| Scottish | 11 | 0.8% |
| Serbian | 193 | 13.3% |
| Slovak | 16 | 1.1% |
| Swedish | 57 | 3.9% | View All 20 Rows |
Immigrants in Lake Dalecarlia

| Immigration Origin | # Population | % Population | View All 0 Rows |
Sex and Age in Lake Dalecarlia
Sex and Age in Lake Dalecarlia
The most populous age groups in Lake Dalecarlia are 65 to 69 Years (102 | 14.7%) for men and 55 to 59 Years (151 | 20.1%) for women.
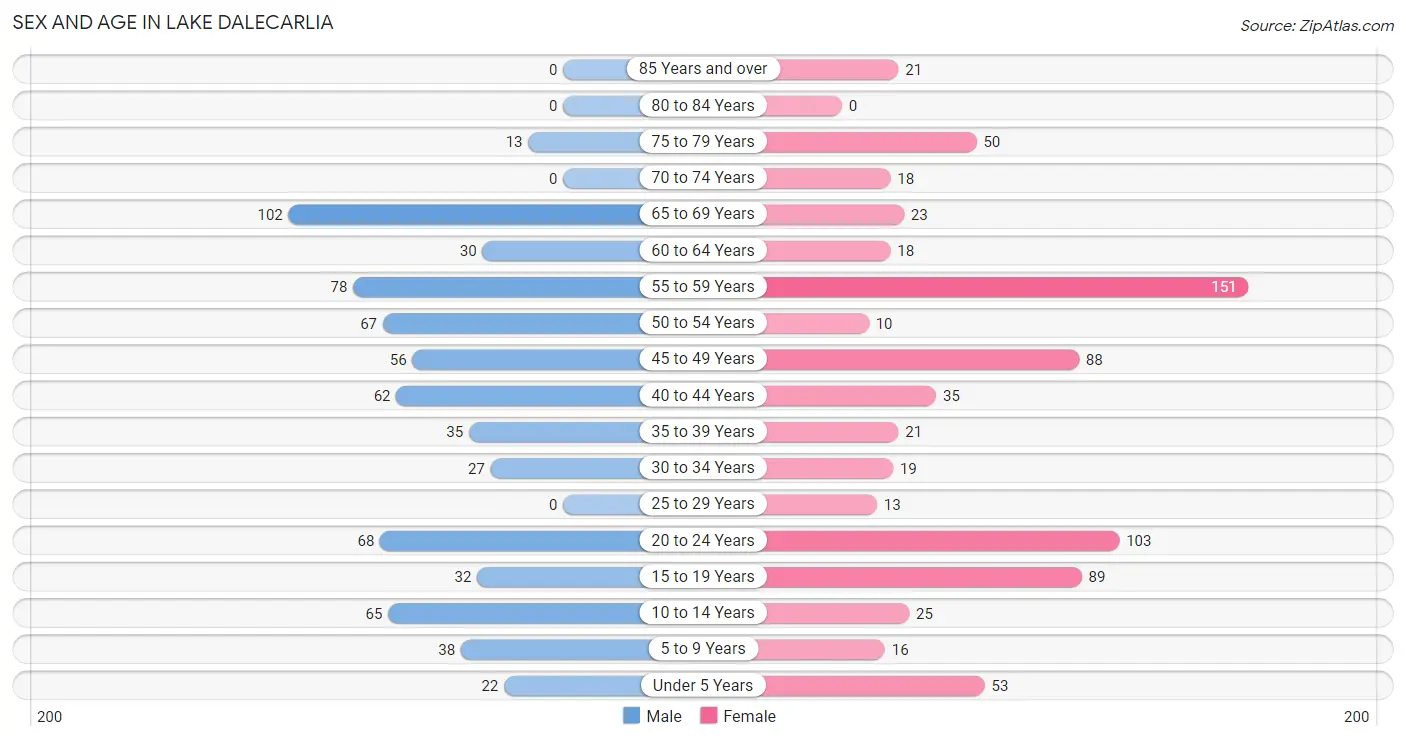
| Age Bracket | Male | Female |
| Under 5 Years | 22 (3.2%) | 53 (7.0%) |
| 5 to 9 Years | 38 (5.5%) | 16 (2.1%) |
| 10 to 14 Years | 65 (9.3%) | 25 (3.3%) |
| 15 to 19 Years | 32 (4.6%) | 89 (11.8%) |
| 20 to 24 Years | 68 (9.8%) | 103 (13.7%) |
| 25 to 29 Years | 0 (0.0%) | 13 (1.7%) |
| 30 to 34 Years | 27 (3.9%) | 19 (2.5%) |
| 35 to 39 Years | 35 (5.0%) | 21 (2.8%) |
| 40 to 44 Years | 62 (8.9%) | 35 (4.6%) |
| 45 to 49 Years | 56 (8.1%) | 88 (11.7%) |
| 50 to 54 Years | 67 (9.6%) | 10 (1.3%) |
| 55 to 59 Years | 78 (11.2%) | 151 (20.1%) |
| 60 to 64 Years | 30 (4.3%) | 18 (2.4%) |
| 65 to 69 Years | 102 (14.7%) | 23 (3.0%) |
| 70 to 74 Years | 0 (0.0%) | 18 (2.4%) |
| 75 to 79 Years | 13 (1.9%) | 50 (6.6%) |
| 80 to 84 Years | 0 (0.0%) | 0 (0.0%) |
| 85 Years and over | 0 (0.0%) | 21 (2.8%) |
| Total | 695 (100.0%) | 753 (100.0%) |
Families and Households in Lake Dalecarlia
Median Family Size in Lake Dalecarlia
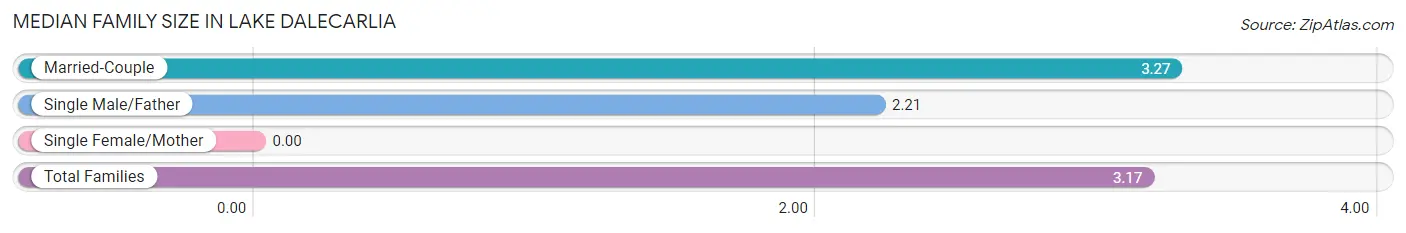
| Family Type | # Families | Family Size |
| Married-Couple | 373 (90.5%) | 3.27 |
| Single Male/Father | 39 (9.5%) | 2.21 |
| Single Female/Mother | 0 (0.0%) | - |
| Total Families | 412 (100.0%) | 3.17 |
Median Household Size in Lake Dalecarlia
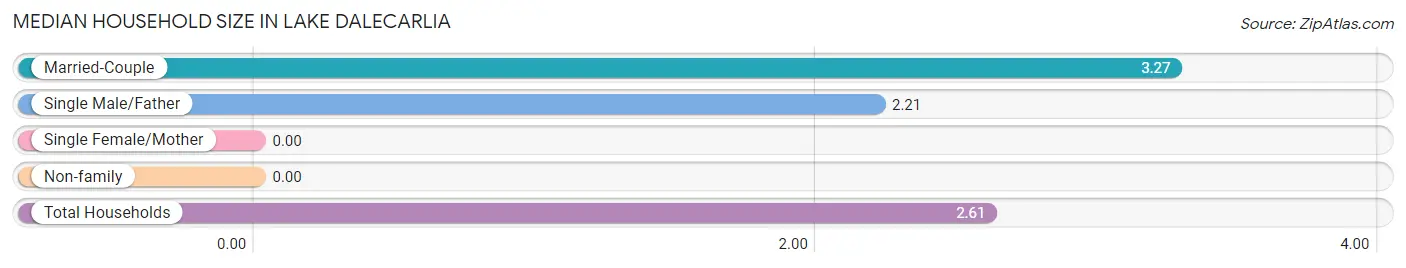
| Household Type | # Households | Household Size |
| Married-Couple | 373 (67.3%) | 3.27 |
| Single Male/Father | 39 (7.0%) | 2.21 |
| Single Female/Mother | 0 (0.0%) | - |
| Non-family | 142 (25.6%) | - |
| Total Households | 554 (100.0%) | 2.61 |
Household Size by Marriage Status in Lake Dalecarlia
Out of a total of 554 households in Lake Dalecarlia, 412 (74.4%) are family households, while 142 (25.6%) are nonfamily households. The most numerous type of family households are 2-person households, comprising 184, and the most common type of nonfamily households are 1-person households, comprising 142.
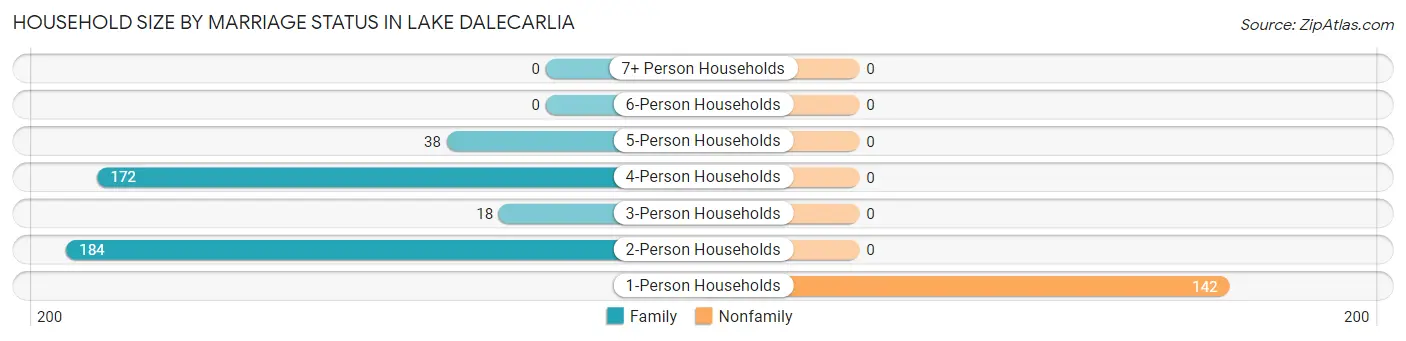
| Household Size | Family Households | Nonfamily Households |
| 1-Person Households | - | 142 (25.6%) |
| 2-Person Households | 184 (33.2%) | 0 (0.0%) |
| 3-Person Households | 18 (3.3%) | 0 (0.0%) |
| 4-Person Households | 172 (31.0%) | 0 (0.0%) |
| 5-Person Households | 38 (6.9%) | 0 (0.0%) |
| 6-Person Households | 0 (0.0%) | 0 (0.0%) |
| 7+ Person Households | 0 (0.0%) | 0 (0.0%) |
| Total | 412 (74.4%) | 142 (25.6%) |
Female Fertility in Lake Dalecarlia
Fertility by Age in Lake Dalecarlia
Average fertility rate in Lake Dalecarlia is 52.0 births per 1,000 women. Women in the age bracket of 20 to 34 years have the highest fertility rate with 141.0 births per 1,000 women. Women in the age bracket of 20 to 34 years acount for 100.0% of all women with births.
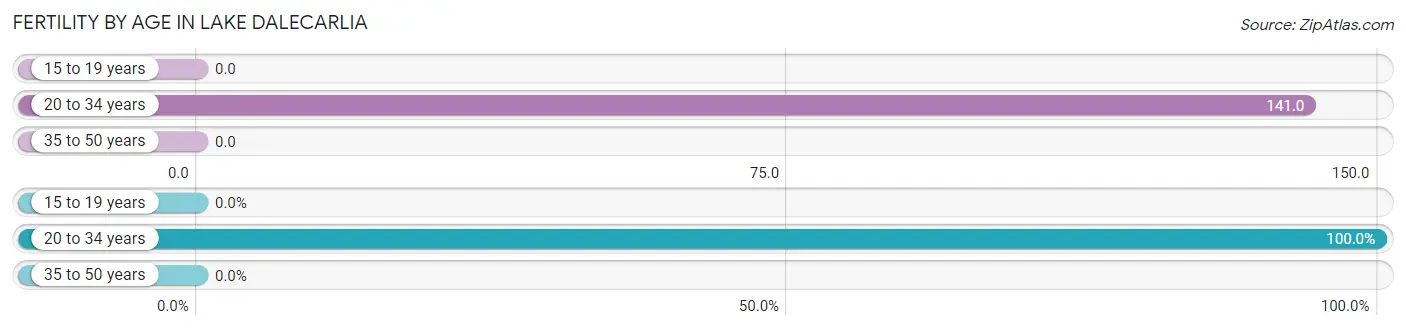
| Age Bracket | Women with Births | Births / 1,000 Women |
| 15 to 19 years | 0 (0.0%) | 0.0 |
| 20 to 34 years | 19 (100.0%) | 141.0 |
| 35 to 50 years | 0 (0.0%) | 0.0 |
| Total | 19 (100.0%) | 52.0 |
Fertility by Age by Marriage Status in Lake Dalecarlia
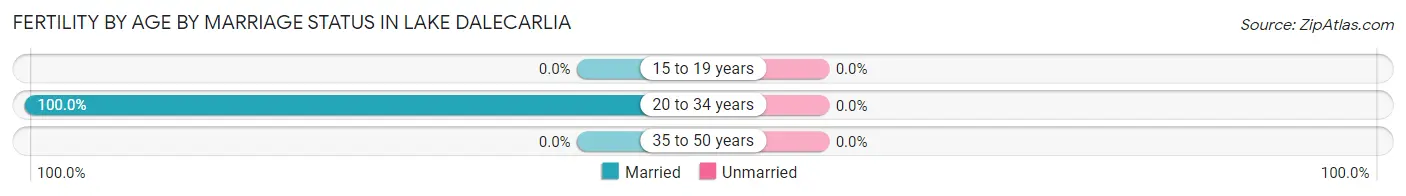
| Age Bracket | Married | Unmarried |
| 15 to 19 years | 0 (0.0%) | 0 (0.0%) |
| 20 to 34 years | 19 (100.0%) | 0 (0.0%) |
| 35 to 50 years | 0 (0.0%) | 0 (0.0%) |
| Total | 19 (100.0%) | 0 (0.0%) |
Fertility by Education in Lake Dalecarlia
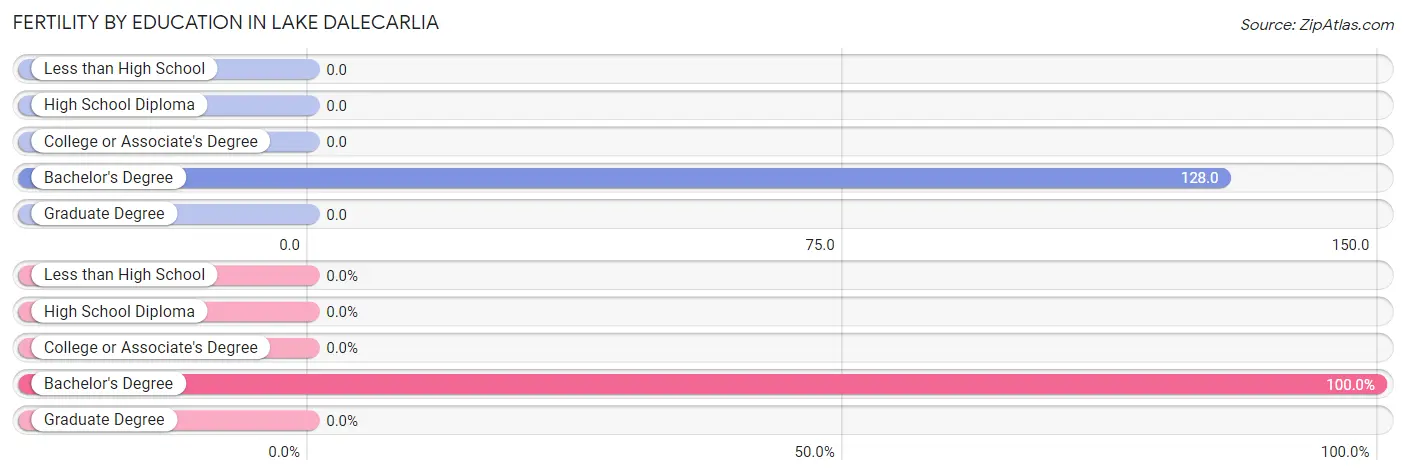
| Educational Attainment | Women with Births | Births / 1,000 Women |
| Less than High School | 0 (0.0%) | 0.0 |
| High School Diploma | 0 (0.0%) | 0.0 |
| College or Associate's Degree | 0 (0.0%) | 0.0 |
| Bachelor's Degree | 19 (100.0%) | 128.0 |
| Graduate Degree | 0 (0.0%) | 0.0 |
| Total | 19 (100.0%) | 52.0 |
Fertility by Education by Marriage Status in Lake Dalecarlia
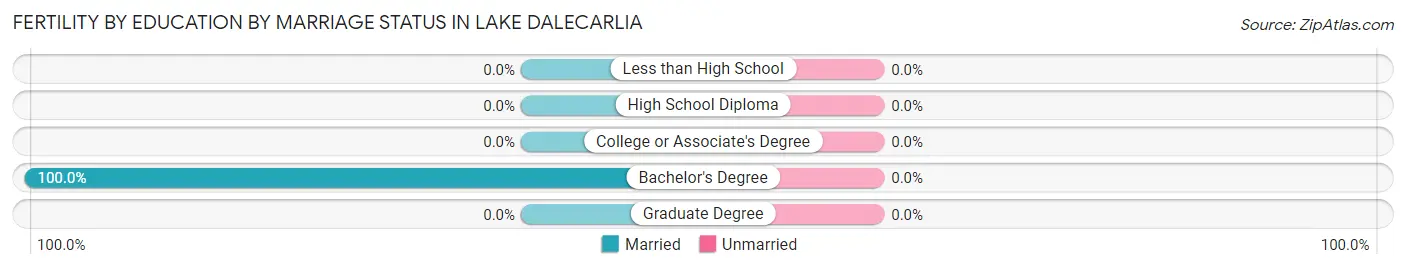
| Educational Attainment | Married | Unmarried |
| Less than High School | 0 (0.0%) | 0 (0.0%) |
| High School Diploma | 0 (0.0%) | 0 (0.0%) |
| College or Associate's Degree | 0 (0.0%) | 0 (0.0%) |
| Bachelor's Degree | 19 (100.0%) | 0 (0.0%) |
| Graduate Degree | 0 (0.0%) | 0 (0.0%) |
| Total | 19 (100.0%) | 0 (0.0%) |
Employment Characteristics in Lake Dalecarlia
Employment by Class of Employer in Lake Dalecarlia
Among the 837 employed individuals in Lake Dalecarlia, private company employees (791 | 94.5%), self-employed (incorporated) (17 | 2.0%), and local government employees (16 | 1.9%) make up the most common classes of employment.
| Employer Class | # Employees | % Employees |
| Private Company Employees | 791 | 94.5% |
| Self-Employed (Incorporated) | 17 | 2.0% |
| Self-Employed (Not Incorporated) | 0 | 0.0% |
| Not-for-profit Organizations | 13 | 1.5% |
| Local Government Employees | 16 | 1.9% |
| State Government Employees | 0 | 0.0% |
| Federal Government Employees | 0 | 0.0% |
| Unpaid Family Workers | 0 | 0.0% |
| Total | 837 | 100.0% |
Employment Status by Age in Lake Dalecarlia
According to the labor force statistics for Lake Dalecarlia, out of the total population over 16 years of age (1,204), 72.2% or 869 individuals are in the labor force, with 3.7% or 32 of them unemployed. The age group with the highest labor force participation rate is 16 to 19 years, with 100.0% or 96 individuals in the labor force. Within the labor force, the 16 to 19 years age range has the highest percentage of unemployed individuals, with 33.3% or 32 of them being unemployed.
| Age Bracket | In Labor Force | Unemployed |
| 16 to 19 Years | 96 (100.0%) | 32 (33.3%) |
| 20 to 24 Years | 171 (100.0%) | 0 (0.0%) |
| 25 to 29 Years | 13 (100.0%) | 0 (0.0%) |
| 30 to 34 Years | 27 (58.7%) | 0 (0.0%) |
| 35 to 44 Years | 110 (71.9%) | 0 (0.0%) |
| 45 to 54 Years | 211 (95.5%) | 0 (0.0%) |
| 55 to 59 Years | 180 (78.6%) | 0 (0.0%) |
| 60 to 64 Years | 12 (25.0%) | 0 (0.0%) |
| 65 to 74 Years | 49 (34.3%) | 0 (0.0%) |
| 75 Years and over | 0 (0.0%) | 0 (0.0%) |
| Total | 869 (72.2%) | 32 (3.7%) |
Employment Status by Educational Attainment in Lake Dalecarlia
| Educational Attainment | In Labor Force | Unemployed |
| Less than High School | 0 (0.0%) | 0 (0.0%) |
| High School Diploma | 215 (72.1%) | 0 (0.0%) |
| College / Associate Degree | 152 (73.4%) | 0 (0.0%) |
| Bachelor's Degree or higher | 186 (90.7%) | 0 (0.0%) |
| Total | 553 (77.9%) | 0 (0.0%) |
Employment Occupations by Sex in Lake Dalecarlia
Management, Business, Science and Arts Occupations
The most common Management, Business, Science and Arts occupations in Lake Dalecarlia are Business & Financial (197 | 23.5%), Computers, Engineering & Science (90 | 10.7%), Health Diagnosing & Treating (70 | 8.4%), Health Technologists (70 | 8.4%), and Architecture & Engineering (68 | 8.1%).
Management, Business, Science and Arts Occupations by Sex
Within the Management, Business, Science and Arts occupations in Lake Dalecarlia, the most male-oriented occupations are Computers, Engineering & Science (100.0%), Architecture & Engineering (100.0%), and Life, Physical & Social Science (100.0%), while the most female-oriented occupations are Management (100.0%), Health Diagnosing & Treating (100.0%), and Health Technologists (100.0%).
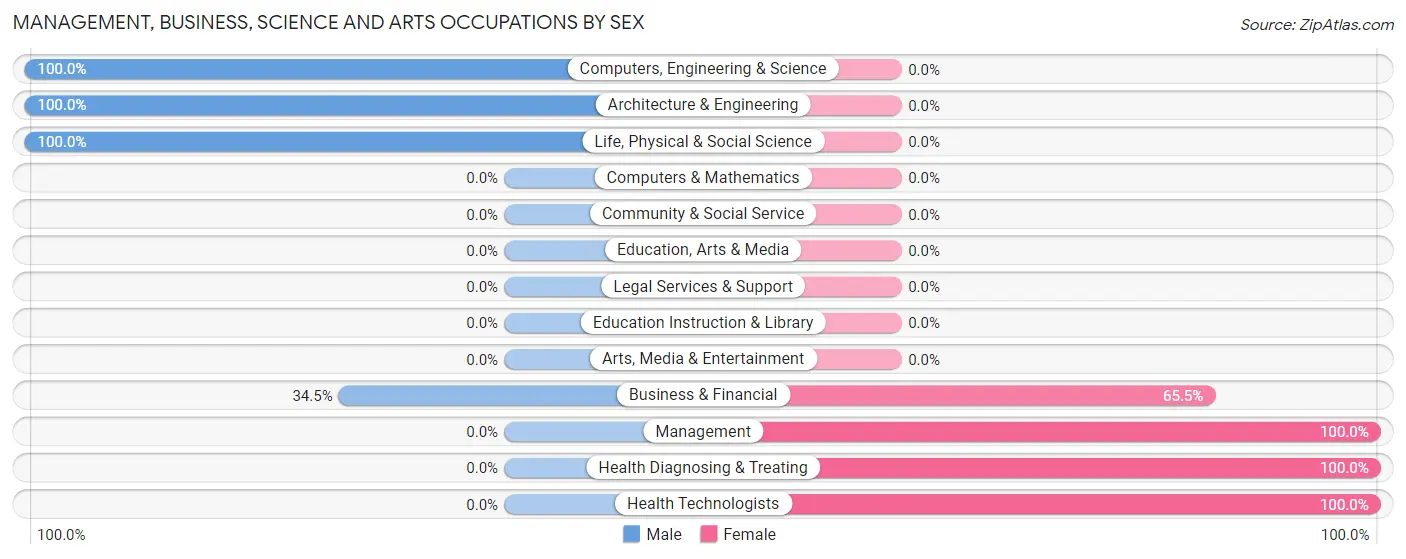
| Occupation | Male | Female |
| Management | 0 (0.0%) | 22 (100.0%) |
| Business & Financial | 68 (34.5%) | 129 (65.5%) |
| Computers, Engineering & Science | 90 (100.0%) | 0 (0.0%) |
| Computers & Mathematics | 0 (0.0%) | 0 (0.0%) |
| Architecture & Engineering | 68 (100.0%) | 0 (0.0%) |
| Life, Physical & Social Science | 22 (100.0%) | 0 (0.0%) |
| Community & Social Service | 0 (0.0%) | 0 (0.0%) |
| Education, Arts & Media | 0 (0.0%) | 0 (0.0%) |
| Legal Services & Support | 0 (0.0%) | 0 (0.0%) |
| Education Instruction & Library | 0 (0.0%) | 0 (0.0%) |
| Arts, Media & Entertainment | 0 (0.0%) | 0 (0.0%) |
| Health Diagnosing & Treating | 0 (0.0%) | 70 (100.0%) |
| Health Technologists | 0 (0.0%) | 70 (100.0%) |
| Total (Category) | 158 (41.7%) | 221 (58.3%) |
| Total (Overall) | 431 (51.5%) | 406 (48.5%) |
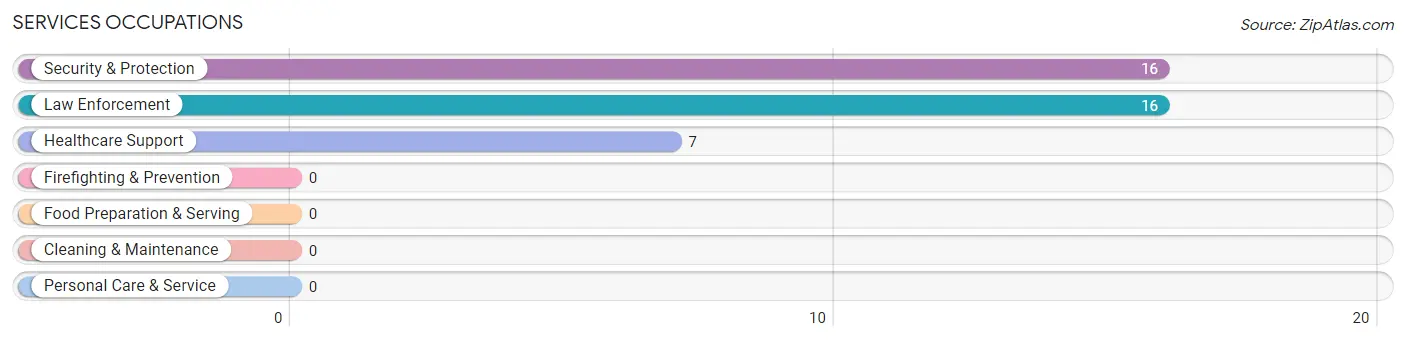
Services Occupations
The most common Services occupations in Lake Dalecarlia are Security & Protection (16 | 1.9%), Law Enforcement (16 | 1.9%), and Healthcare Support (7 | 0.8%).
Services Occupations by Sex
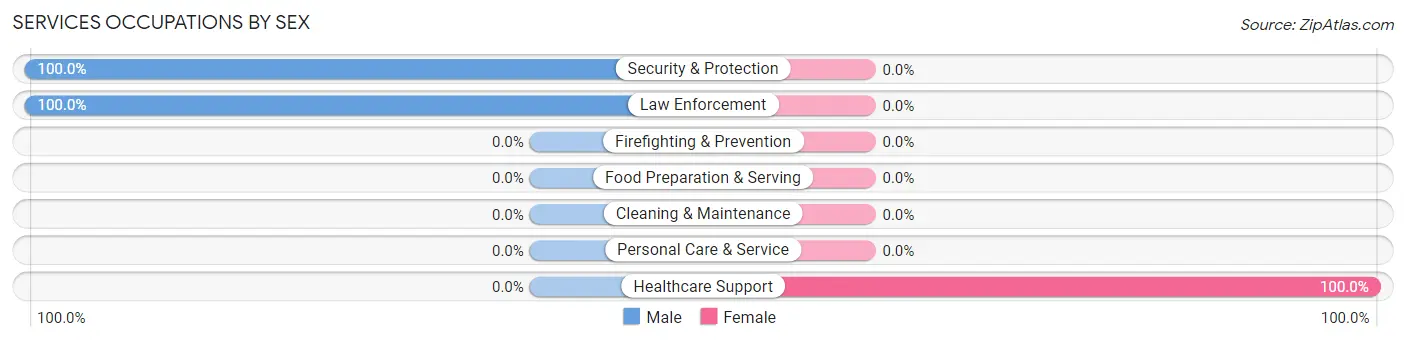
| Occupation | Male | Female |
| Healthcare Support | 0 (0.0%) | 7 (100.0%) |
| Security & Protection | 16 (100.0%) | 0 (0.0%) |
| Firefighting & Prevention | 0 (0.0%) | 0 (0.0%) |
| Law Enforcement | 16 (100.0%) | 0 (0.0%) |
| Food Preparation & Serving | 0 (0.0%) | 0 (0.0%) |
| Cleaning & Maintenance | 0 (0.0%) | 0 (0.0%) |
| Personal Care & Service | 0 (0.0%) | 0 (0.0%) |
| Total (Category) | 16 (69.6%) | 7 (30.4%) |
| Total (Overall) | 431 (51.5%) | 406 (48.5%) |
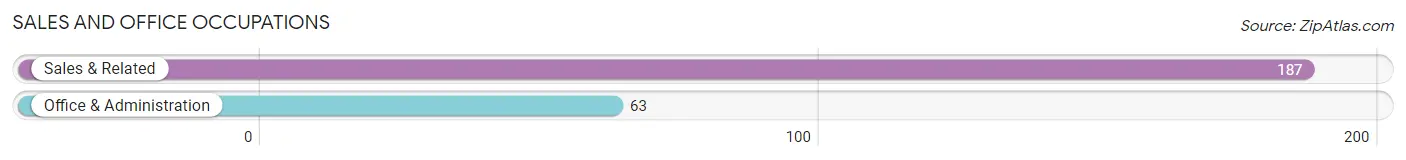
Sales and Office Occupations
The most common Sales and Office occupations in Lake Dalecarlia are Sales & Related (187 | 22.3%), and Office & Administration (63 | 7.5%).
Sales and Office Occupations by Sex
| Occupation | Male | Female |
| Sales & Related | 68 (36.4%) | 119 (63.6%) |
| Office & Administration | 4 (6.4%) | 59 (93.6%) |
| Total (Category) | 72 (28.8%) | 178 (71.2%) |
| Total (Overall) | 431 (51.5%) | 406 (48.5%) |
Natural Resources, Construction and Maintenance Occupations
The most common Natural Resources, Construction and Maintenance occupations in Lake Dalecarlia are Installation, Maintenance & Repair (29 | 3.5%), and Construction & Extraction (13 | 1.5%).
Natural Resources, Construction and Maintenance Occupations by Sex
| Occupation | Male | Female |
| Farming, Fishing & Forestry | 0 (0.0%) | 0 (0.0%) |
| Construction & Extraction | 13 (100.0%) | 0 (0.0%) |
| Installation, Maintenance & Repair | 29 (100.0%) | 0 (0.0%) |
| Total (Category) | 42 (100.0%) | 0 (0.0%) |
| Total (Overall) | 431 (51.5%) | 406 (48.5%) |
Production, Transportation and Moving Occupations
The most common Production, Transportation and Moving occupations in Lake Dalecarlia are Production (78 | 9.3%), and Transportation (65 | 7.8%).
Production, Transportation and Moving Occupations by Sex
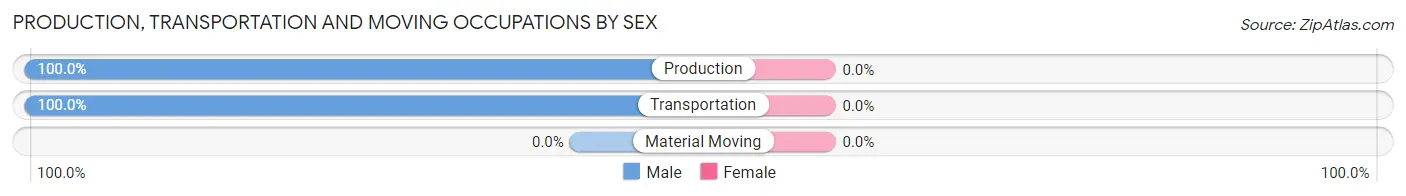
| Occupation | Male | Female |
| Production | 78 (100.0%) | 0 (0.0%) |
| Transportation | 65 (100.0%) | 0 (0.0%) |
| Material Moving | 0 (0.0%) | 0 (0.0%) |
| Total (Category) | 143 (100.0%) | 0 (0.0%) |
| Total (Overall) | 431 (51.5%) | 406 (48.5%) |
Employment Industries by Sex in Lake Dalecarlia
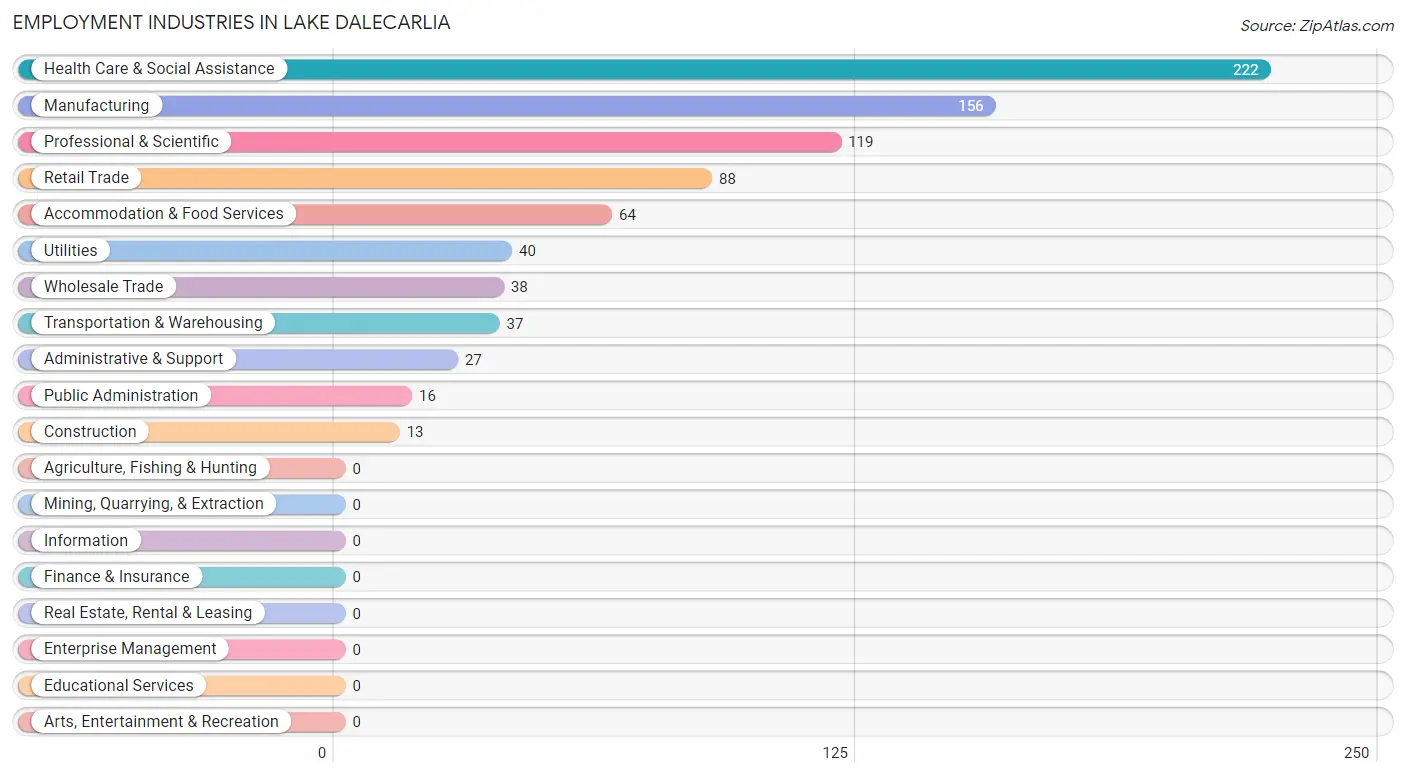
Employment Industries in Lake Dalecarlia
The major employment industries in Lake Dalecarlia include Health Care & Social Assistance (222 | 26.5%), Manufacturing (156 | 18.6%), Professional & Scientific (119 | 14.2%), Retail Trade (88 | 10.5%), and Accommodation & Food Services (64 | 7.6%).
Employment Industries by Sex in Lake Dalecarlia
The Lake Dalecarlia industries that see more men than women are Construction (100.0%), Transportation & Warehousing (100.0%), and Utilities (100.0%), whereas the industries that tend to have a higher number of women are Accommodation & Food Services (100.0%), Health Care & Social Assistance (72.5%), and Retail Trade (60.2%).
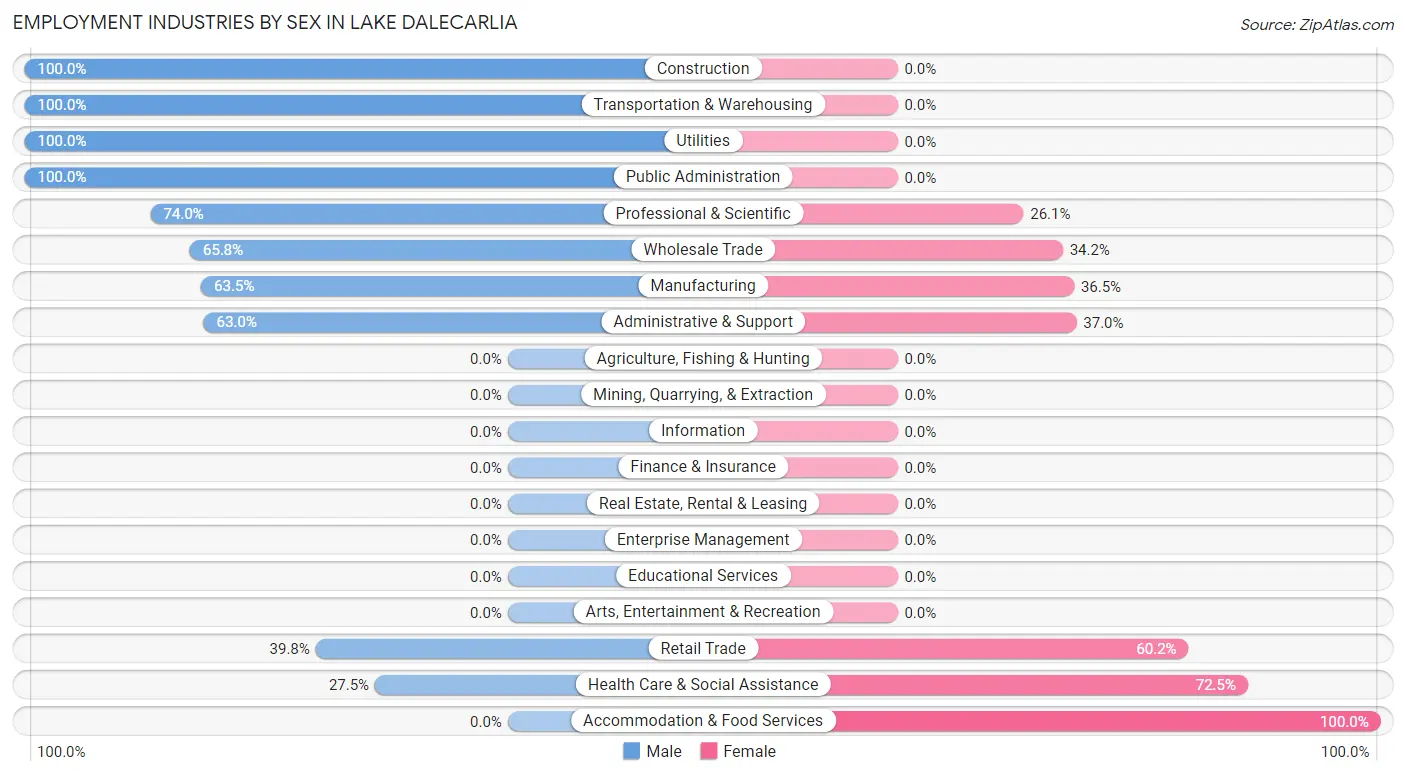
| Industry | Male | Female |
| Agriculture, Fishing & Hunting | 0 (0.0%) | 0 (0.0%) |
| Mining, Quarrying, & Extraction | 0 (0.0%) | 0 (0.0%) |
| Construction | 13 (100.0%) | 0 (0.0%) |
| Manufacturing | 99 (63.5%) | 57 (36.5%) |
| Wholesale Trade | 25 (65.8%) | 13 (34.2%) |
| Retail Trade | 35 (39.8%) | 53 (60.2%) |
| Transportation & Warehousing | 37 (100.0%) | 0 (0.0%) |
| Utilities | 40 (100.0%) | 0 (0.0%) |
| Information | 0 (0.0%) | 0 (0.0%) |
| Finance & Insurance | 0 (0.0%) | 0 (0.0%) |
| Real Estate, Rental & Leasing | 0 (0.0%) | 0 (0.0%) |
| Professional & Scientific | 88 (74.0%) | 31 (26.1%) |
| Enterprise Management | 0 (0.0%) | 0 (0.0%) |
| Administrative & Support | 17 (63.0%) | 10 (37.0%) |
| Educational Services | 0 (0.0%) | 0 (0.0%) |
| Health Care & Social Assistance | 61 (27.5%) | 161 (72.5%) |
| Arts, Entertainment & Recreation | 0 (0.0%) | 0 (0.0%) |
| Accommodation & Food Services | 0 (0.0%) | 64 (100.0%) |
| Public Administration | 16 (100.0%) | 0 (0.0%) |
| Total | 431 (51.5%) | 406 (48.5%) |
Education in Lake Dalecarlia
School Enrollment in Lake Dalecarlia
The most common levels of schooling among the 353 students in Lake Dalecarlia are high school (115 | 32.6%), graduate / professional (68 | 19.3%), and middle school (64 | 18.1%).
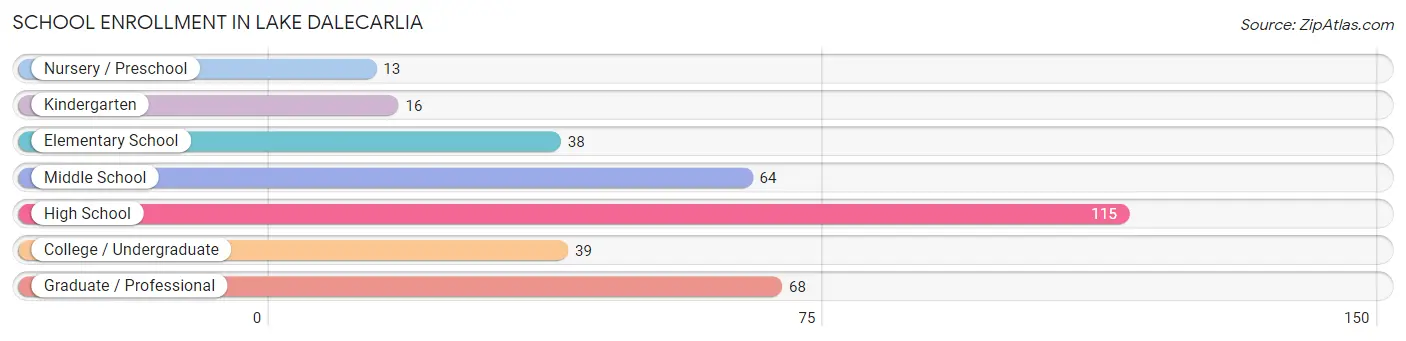
| School Level | # Students | % Students |
| Nursery / Preschool | 13 | 3.7% |
| Kindergarten | 16 | 4.5% |
| Elementary School | 38 | 10.8% |
| Middle School | 64 | 18.1% |
| High School | 115 | 32.6% |
| College / Undergraduate | 39 | 11.1% |
| Graduate / Professional | 68 | 19.3% |
| Total | 353 | 100.0% |
School Enrollment by Age by Funding Source in Lake Dalecarlia
Out of a total of 353 students who are enrolled in schools in Lake Dalecarlia, 28 (7.9%) attend a private institution, while the remaining 325 (92.1%) are enrolled in public schools. The age group of 3 to 4 year olds has the highest likelihood of being enrolled in private schools, with 13 (100.0% in the age bracket) enrolled. Conversely, the age group of 5 to 9 year old has the lowest likelihood of being enrolled in a private school, with 54 (100.0% in the age bracket) attending a public institution.
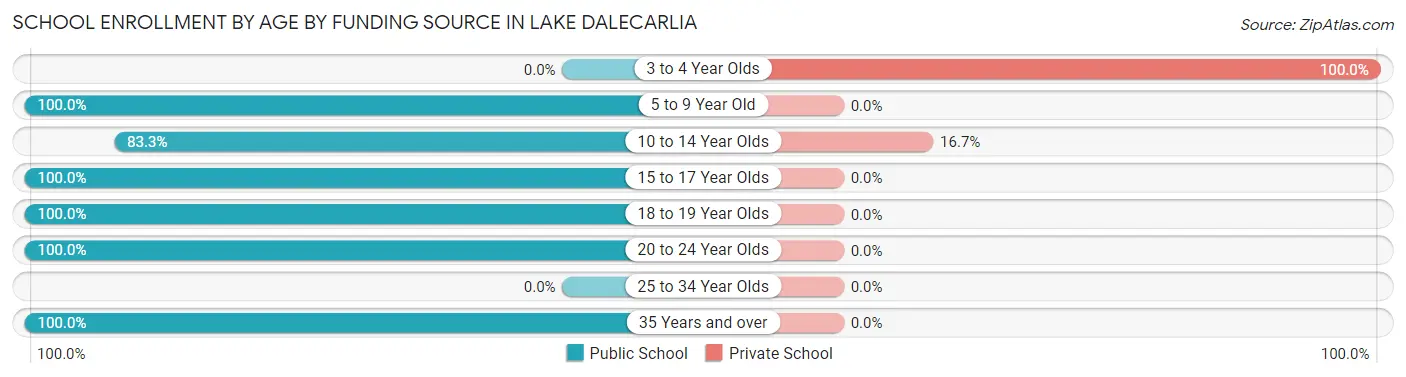
| Age Bracket | Public School | Private School |
| 3 to 4 Year Olds | 0 (0.0%) | 13 (100.0%) |
| 5 to 9 Year Old | 54 (100.0%) | 0 (0.0%) |
| 10 to 14 Year Olds | 75 (83.3%) | 15 (16.7%) |
| 15 to 17 Year Olds | 89 (100.0%) | 0 (0.0%) |
| 18 to 19 Year Olds | 32 (100.0%) | 0 (0.0%) |
| 20 to 24 Year Olds | 68 (100.0%) | 0 (0.0%) |
| 25 to 34 Year Olds | 0 (0.0%) | 0 (0.0%) |
| 35 Years and over | 7 (100.0%) | 0 (0.0%) |
| Total | 325 (92.1%) | 28 (7.9%) |
Educational Attainment by Field of Study in Lake Dalecarlia
Business (126 | 53.6%), education (37 | 15.7%), literature & languages (23 | 9.8%), computers & mathematics (20 | 8.5%), and arts & humanities (16 | 6.8%) are the most common fields of study among 235 individuals in Lake Dalecarlia who have obtained a bachelor's degree or higher.
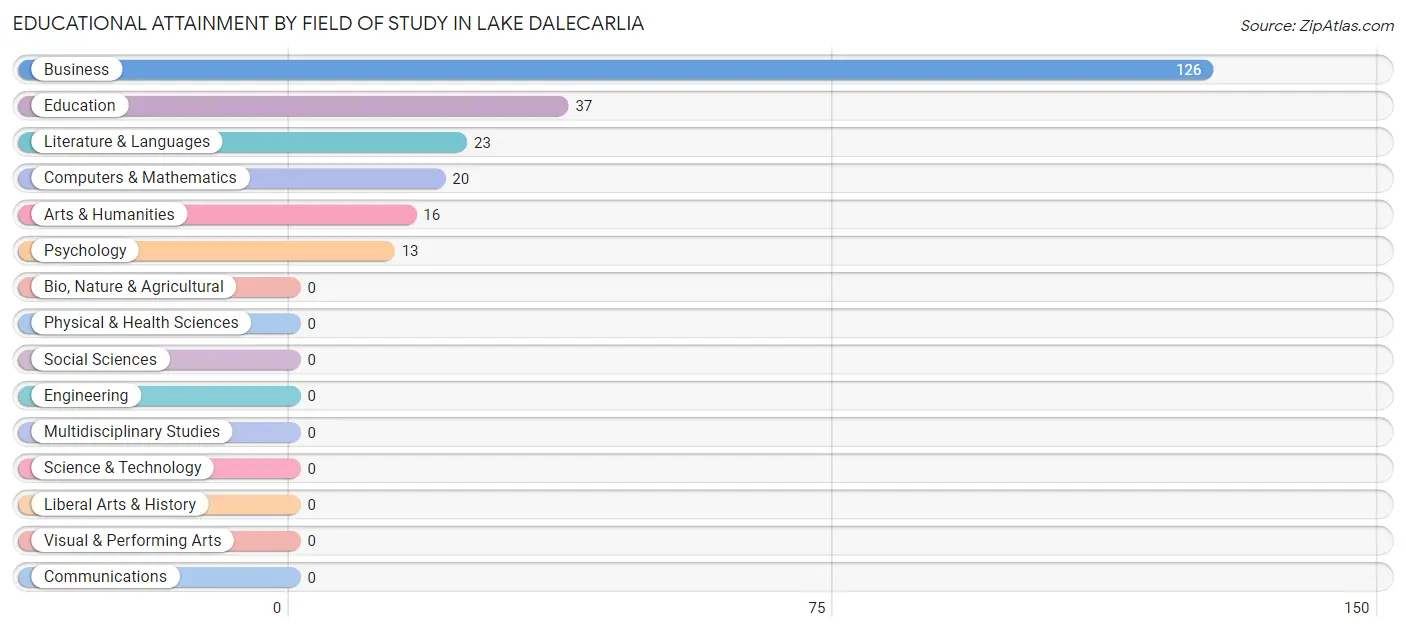
| Field of Study | # Graduates | % Graduates |
| Computers & Mathematics | 20 | 8.5% |
| Bio, Nature & Agricultural | 0 | 0.0% |
| Physical & Health Sciences | 0 | 0.0% |
| Psychology | 13 | 5.5% |
| Social Sciences | 0 | 0.0% |
| Engineering | 0 | 0.0% |
| Multidisciplinary Studies | 0 | 0.0% |
| Science & Technology | 0 | 0.0% |
| Business | 126 | 53.6% |
| Education | 37 | 15.7% |
| Literature & Languages | 23 | 9.8% |
| Liberal Arts & History | 0 | 0.0% |
| Visual & Performing Arts | 0 | 0.0% |
| Communications | 0 | 0.0% |
| Arts & Humanities | 16 | 6.8% |
| Total | 235 | 100.0% |
Transportation & Commute in Lake Dalecarlia
Vehicle Availability by Sex in Lake Dalecarlia
The most prevalent vehicle ownership categories in Lake Dalecarlia are males with 4 vehicles (165, accounting for 38.3%) and females with 4 vehicles (281, making up 40.6%).
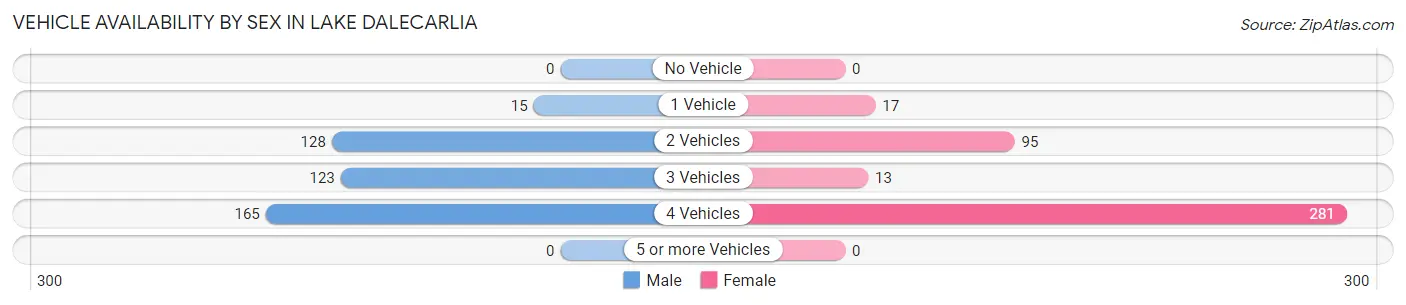
| Vehicles Available | Male | Female |
| No Vehicle | 0 (0.0%) | 0 (0.0%) |
| 1 Vehicle | 15 (3.5%) | 17 (4.2%) |
| 2 Vehicles | 128 (29.7%) | 95 (23.4%) |
| 3 Vehicles | 123 (28.5%) | 13 (3.2%) |
| 4 Vehicles | 165 (38.3%) | 281 (69.2%) |
| 5 or more Vehicles | 0 (0.0%) | 0 (0.0%) |
| Total | 431 (100.0%) | 406 (100.0%) |
Commute Time in Lake Dalecarlia
The most frequently occuring commute durations in Lake Dalecarlia are 15 to 19 minutes (222 commuters, 29.1%), 45 to 59 minutes (209 commuters, 27.4%), and 40 to 44 minutes (100 commuters, 13.1%).
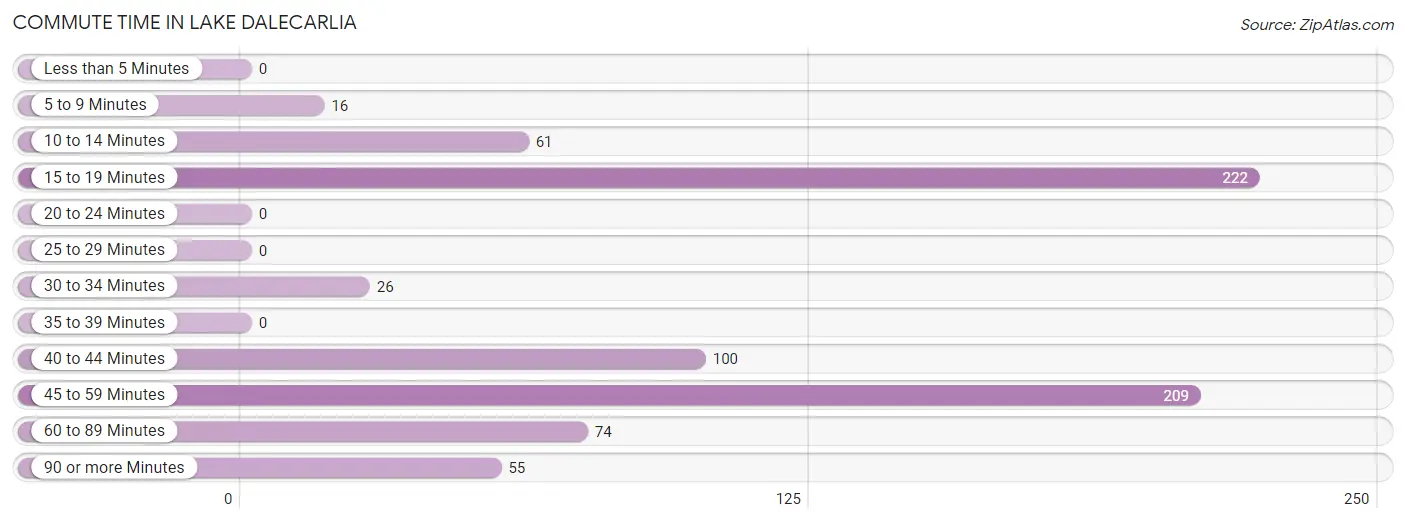
| Commute Time | # Commuters | % Commuters |
| Less than 5 Minutes | 0 | 0.0% |
| 5 to 9 Minutes | 16 | 2.1% |
| 10 to 14 Minutes | 61 | 8.0% |
| 15 to 19 Minutes | 222 | 29.1% |
| 20 to 24 Minutes | 0 | 0.0% |
| 25 to 29 Minutes | 0 | 0.0% |
| 30 to 34 Minutes | 26 | 3.4% |
| 35 to 39 Minutes | 0 | 0.0% |
| 40 to 44 Minutes | 100 | 13.1% |
| 45 to 59 Minutes | 209 | 27.4% |
| 60 to 89 Minutes | 74 | 9.7% |
| 90 or more Minutes | 55 | 7.2% |
Commute Time by Sex in Lake Dalecarlia
The most common commute times in Lake Dalecarlia are 45 to 59 minutes (107 commuters, 24.8%) for males and 15 to 19 minutes (187 commuters, 56.3%) for females.
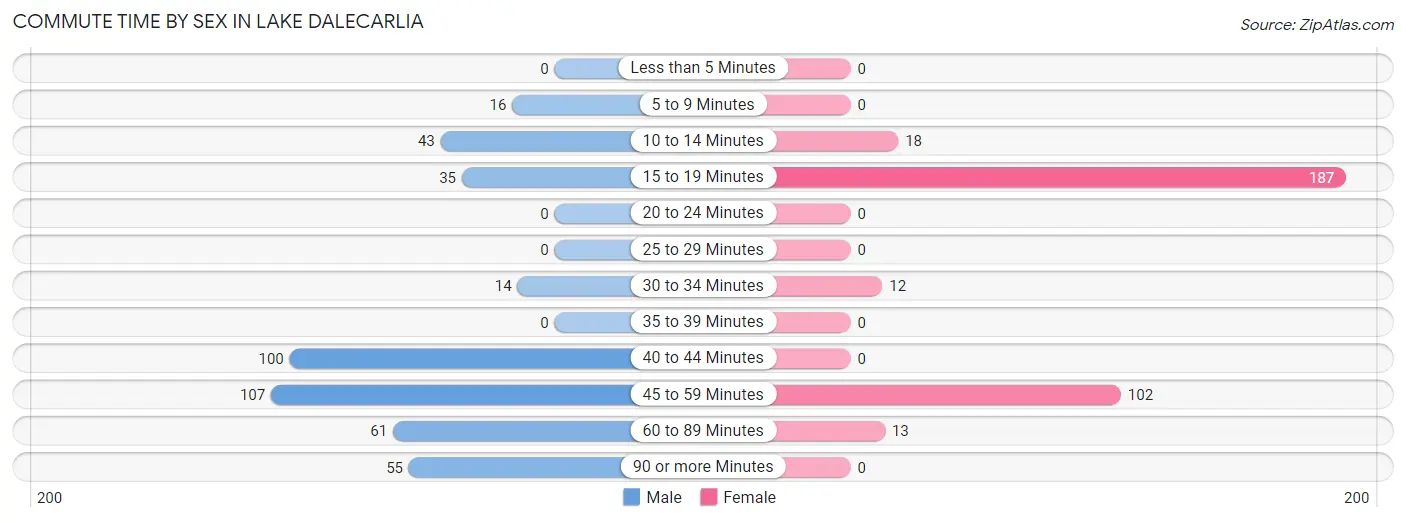
| Commute Time | Male | Female |
| Less than 5 Minutes | 0 (0.0%) | 0 (0.0%) |
| 5 to 9 Minutes | 16 (3.7%) | 0 (0.0%) |
| 10 to 14 Minutes | 43 (10.0%) | 18 (5.4%) |
| 15 to 19 Minutes | 35 (8.1%) | 187 (56.3%) |
| 20 to 24 Minutes | 0 (0.0%) | 0 (0.0%) |
| 25 to 29 Minutes | 0 (0.0%) | 0 (0.0%) |
| 30 to 34 Minutes | 14 (3.3%) | 12 (3.6%) |
| 35 to 39 Minutes | 0 (0.0%) | 0 (0.0%) |
| 40 to 44 Minutes | 100 (23.2%) | 0 (0.0%) |
| 45 to 59 Minutes | 107 (24.8%) | 102 (30.7%) |
| 60 to 89 Minutes | 61 (14.1%) | 13 (3.9%) |
| 90 or more Minutes | 55 (12.8%) | 0 (0.0%) |
Time of Departure to Work by Sex in Lake Dalecarlia
The most frequent times of departure to work in Lake Dalecarlia are 12:00 AM to 4:59 AM (69, 16.0%) for males and 6:00 AM to 6:29 AM (82, 24.7%) for females.
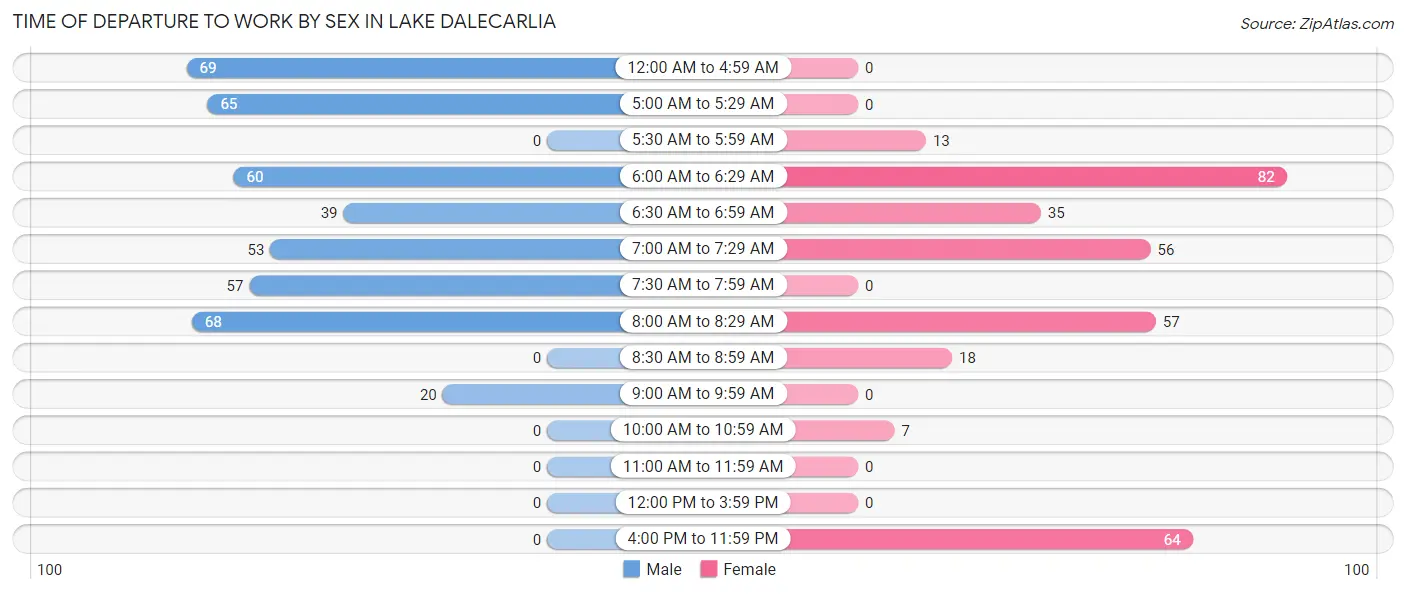
| Time of Departure | Male | Female |
| 12:00 AM to 4:59 AM | 69 (16.0%) | 0 (0.0%) |
| 5:00 AM to 5:29 AM | 65 (15.1%) | 0 (0.0%) |
| 5:30 AM to 5:59 AM | 0 (0.0%) | 13 (3.9%) |
| 6:00 AM to 6:29 AM | 60 (13.9%) | 82 (24.7%) |
| 6:30 AM to 6:59 AM | 39 (9.0%) | 35 (10.5%) |
| 7:00 AM to 7:29 AM | 53 (12.3%) | 56 (16.9%) |
| 7:30 AM to 7:59 AM | 57 (13.2%) | 0 (0.0%) |
| 8:00 AM to 8:29 AM | 68 (15.8%) | 57 (17.2%) |
| 8:30 AM to 8:59 AM | 0 (0.0%) | 18 (5.4%) |
| 9:00 AM to 9:59 AM | 20 (4.6%) | 0 (0.0%) |
| 10:00 AM to 10:59 AM | 0 (0.0%) | 7 (2.1%) |
| 11:00 AM to 11:59 AM | 0 (0.0%) | 0 (0.0%) |
| 12:00 PM to 3:59 PM | 0 (0.0%) | 0 (0.0%) |
| 4:00 PM to 11:59 PM | 0 (0.0%) | 64 (19.3%) |
| Total | 431 (100.0%) | 332 (100.0%) |
Housing Occupancy in Lake Dalecarlia
Occupancy by Ownership in Lake Dalecarlia
Of the total 554 dwellings in Lake Dalecarlia, owner-occupied units account for 554 (100.0%), while renter-occupied units make up 0 (0.0%).
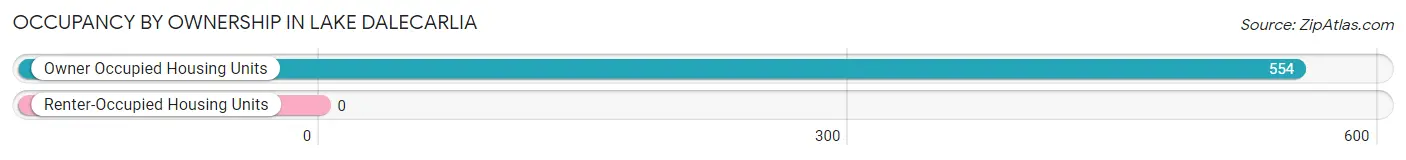
| Occupancy | # Housing Units | % Housing Units |
| Owner Occupied Housing Units | 554 | 100.0% |
| Renter-Occupied Housing Units | 0 | 0.0% |
| Total Occupied Housing Units | 554 | 100.0% |
Occupancy by Household Size in Lake Dalecarlia
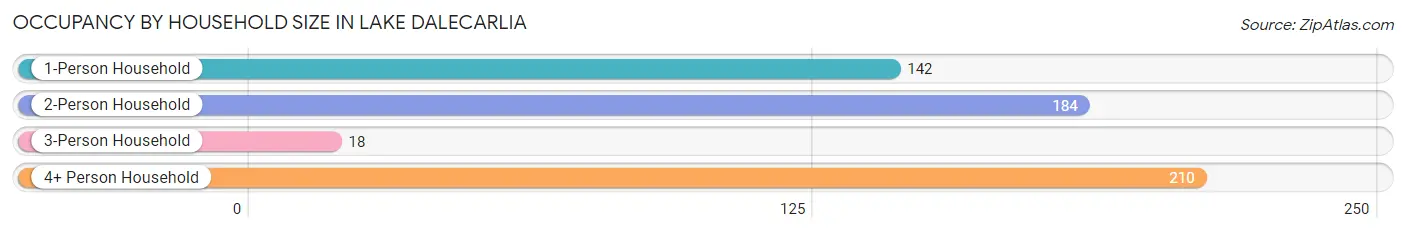
| Household Size | # Housing Units | % Housing Units |
| 1-Person Household | 142 | 25.6% |
| 2-Person Household | 184 | 33.2% |
| 3-Person Household | 18 | 3.3% |
| 4+ Person Household | 210 | 37.9% |
| Total Housing Units | 554 | 100.0% |
Occupancy by Ownership by Household Size in Lake Dalecarlia
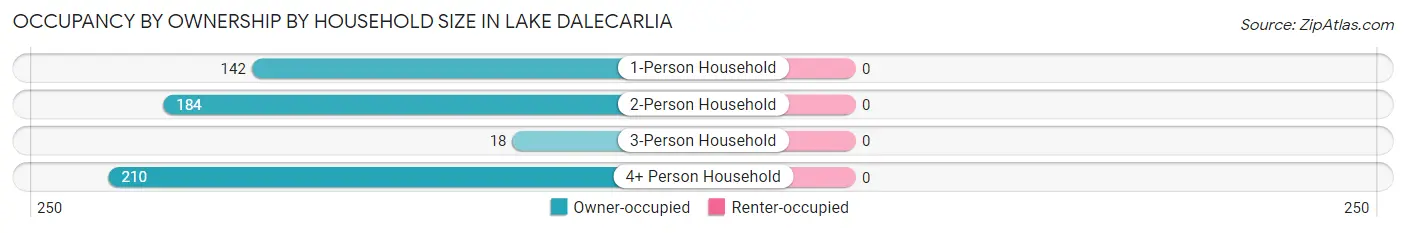
| Household Size | Owner-occupied | Renter-occupied |
| 1-Person Household | 142 (100.0%) | 0 (0.0%) |
| 2-Person Household | 184 (100.0%) | 0 (0.0%) |
| 3-Person Household | 18 (100.0%) | 0 (0.0%) |
| 4+ Person Household | 210 (100.0%) | 0 (0.0%) |
| Total Housing Units | 554 (100.0%) | 0 (0.0%) |
Occupancy by Educational Attainment in Lake Dalecarlia
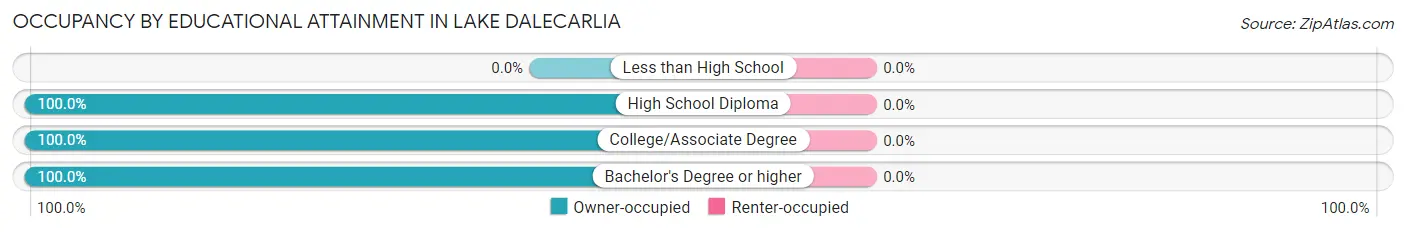
| Household Size | Owner-occupied | Renter-occupied |
| Less than High School | 0 (0.0%) | 0 (0.0%) |
| High School Diploma | 293 (100.0%) | 0 (0.0%) |
| College/Associate Degree | 102 (100.0%) | 0 (0.0%) |
| Bachelor's Degree or higher | 159 (100.0%) | 0 (0.0%) |
Occupancy by Age of Householder in Lake Dalecarlia
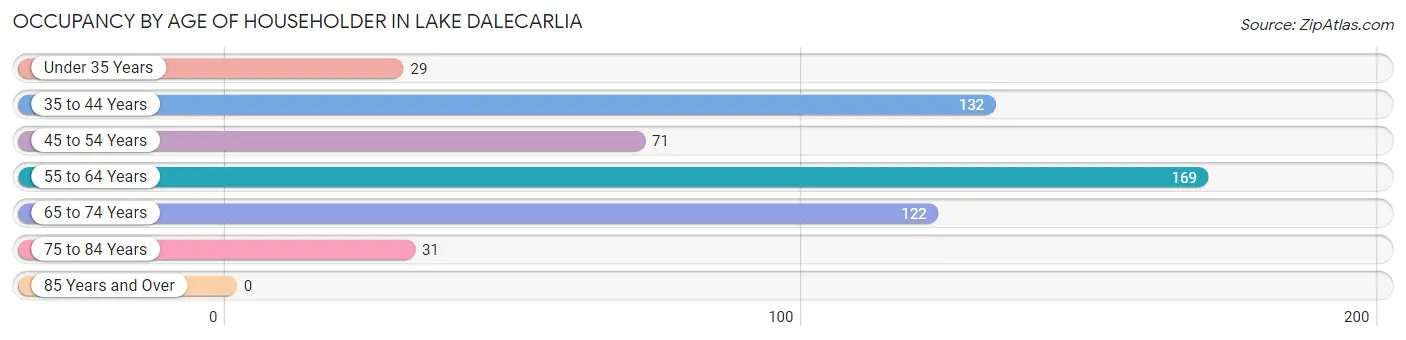
| Age Bracket | # Households | % Households |
| Under 35 Years | 29 | 5.2% |
| 35 to 44 Years | 132 | 23.8% |
| 45 to 54 Years | 71 | 12.8% |
| 55 to 64 Years | 169 | 30.5% |
| 65 to 74 Years | 122 | 22.0% |
| 75 to 84 Years | 31 | 5.6% |
| 85 Years and Over | 0 | 0.0% |
| Total | 554 | 100.0% |
Housing Finances in Lake Dalecarlia
Median Income by Occupancy in Lake Dalecarlia
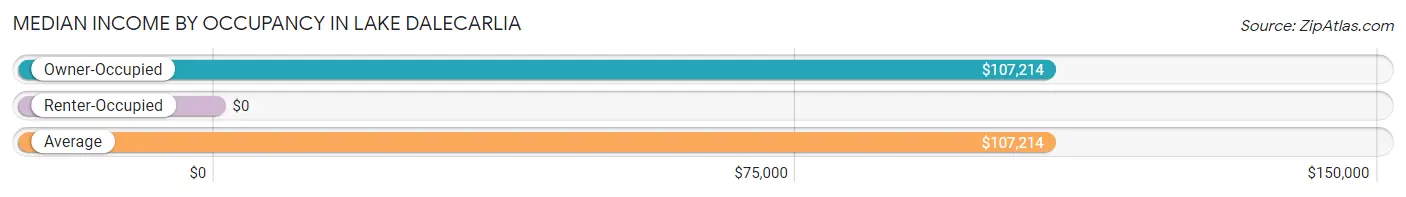
| Occupancy Type | # Households | Median Income |
| Owner-Occupied | 554 (100.0%) | $107,214 |
| Renter-Occupied | 0 (0.0%) | $0 |
| Average | 554 (100.0%) | $107,214 |
Occupancy by Householder Income Bracket in Lake Dalecarlia
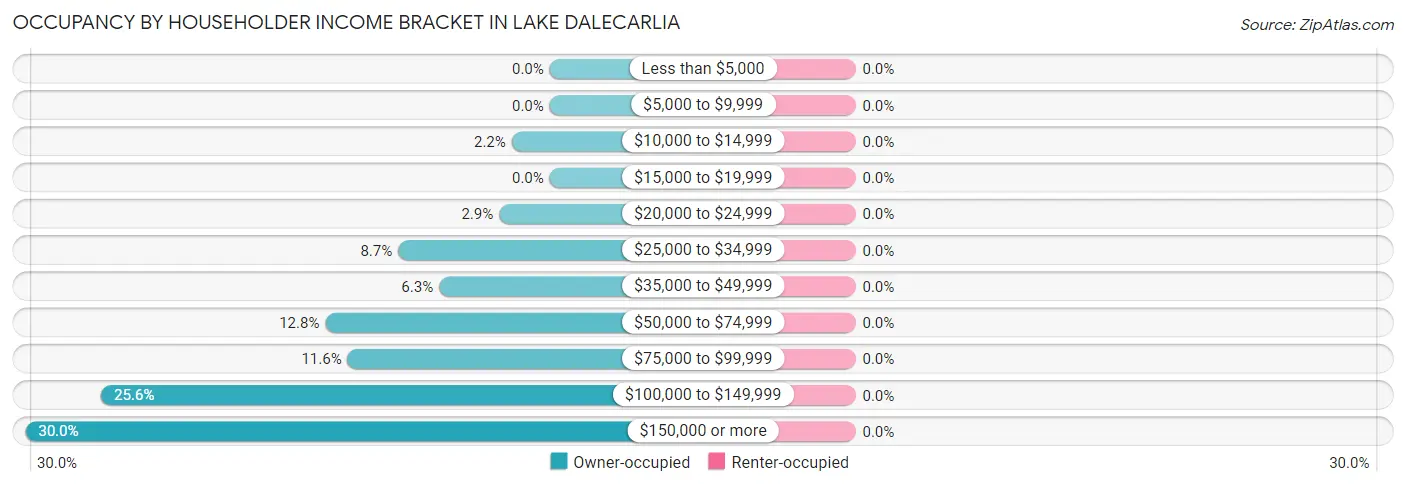
| Income Bracket | Owner-occupied | Renter-occupied |
| Less than $5,000 | 0 (0.0%) | 0 (0.0%) |
| $5,000 to $9,999 | 0 (0.0%) | 0 (0.0%) |
| $10,000 to $14,999 | 12 (2.2%) | 0 (0.0%) |
| $15,000 to $19,999 | 0 (0.0%) | 0 (0.0%) |
| $20,000 to $24,999 | 16 (2.9%) | 0 (0.0%) |
| $25,000 to $34,999 | 48 (8.7%) | 0 (0.0%) |
| $35,000 to $49,999 | 35 (6.3%) | 0 (0.0%) |
| $50,000 to $74,999 | 71 (12.8%) | 0 (0.0%) |
| $75,000 to $99,999 | 64 (11.6%) | 0 (0.0%) |
| $100,000 to $149,999 | 142 (25.6%) | 0 (0.0%) |
| $150,000 or more | 166 (30.0%) | 0 (0.0%) |
| Total | 554 (100.0%) | 0 (0.0%) |
Monthly Housing Cost Tiers in Lake Dalecarlia
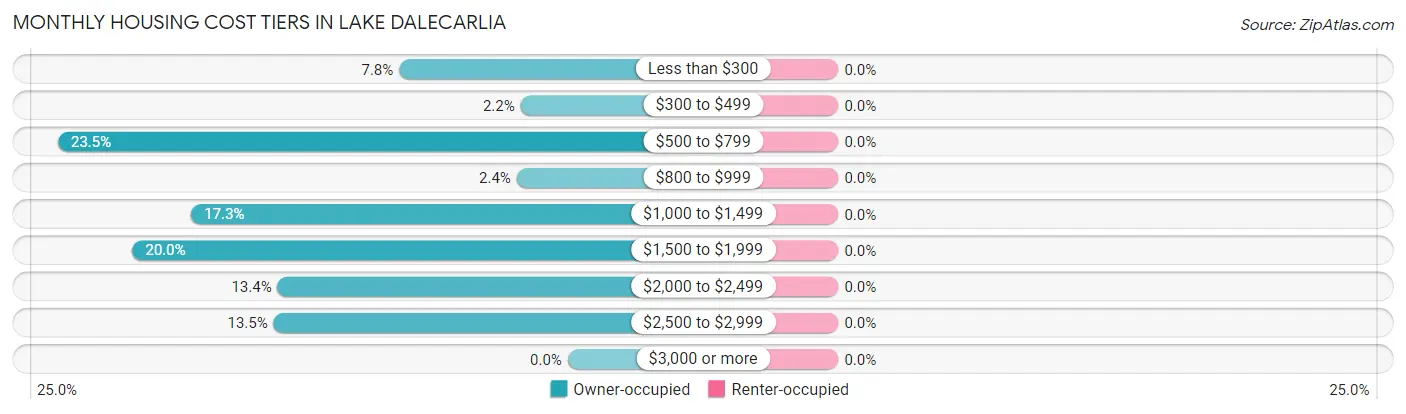
| Monthly Cost | Owner-occupied | Renter-occupied |
| Less than $300 | 43 (7.8%) | 0 (0.0%) |
| $300 to $499 | 12 (2.2%) | 0 (0.0%) |
| $500 to $799 | 130 (23.5%) | 0 (0.0%) |
| $800 to $999 | 13 (2.4%) | 0 (0.0%) |
| $1,000 to $1,499 | 96 (17.3%) | 0 (0.0%) |
| $1,500 to $1,999 | 111 (20.0%) | 0 (0.0%) |
| $2,000 to $2,499 | 74 (13.4%) | 0 (0.0%) |
| $2,500 to $2,999 | 75 (13.5%) | 0 (0.0%) |
| $3,000 or more | 0 (0.0%) | 0 (0.0%) |
| Total | 554 (100.0%) | 0 (0.0%) |
Physical Housing Characteristics in Lake Dalecarlia
Housing Structures in Lake Dalecarlia
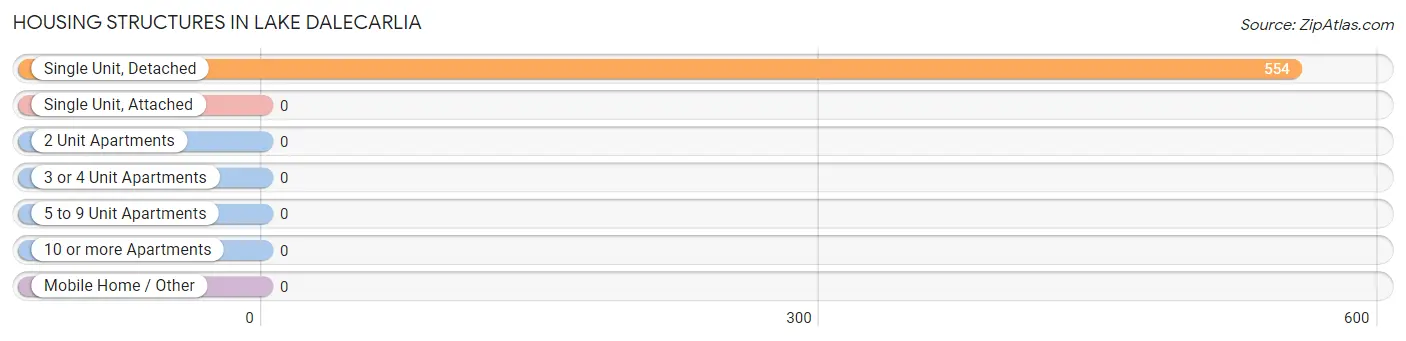
| Structure Type | # Housing Units | % Housing Units |
| Single Unit, Detached | 554 | 100.0% |
| Single Unit, Attached | 0 | 0.0% |
| 2 Unit Apartments | 0 | 0.0% |
| 3 or 4 Unit Apartments | 0 | 0.0% |
| 5 to 9 Unit Apartments | 0 | 0.0% |
| 10 or more Apartments | 0 | 0.0% |
| Mobile Home / Other | 0 | 0.0% |
| Total | 554 | 100.0% |
Housing Structures by Occupancy in Lake Dalecarlia
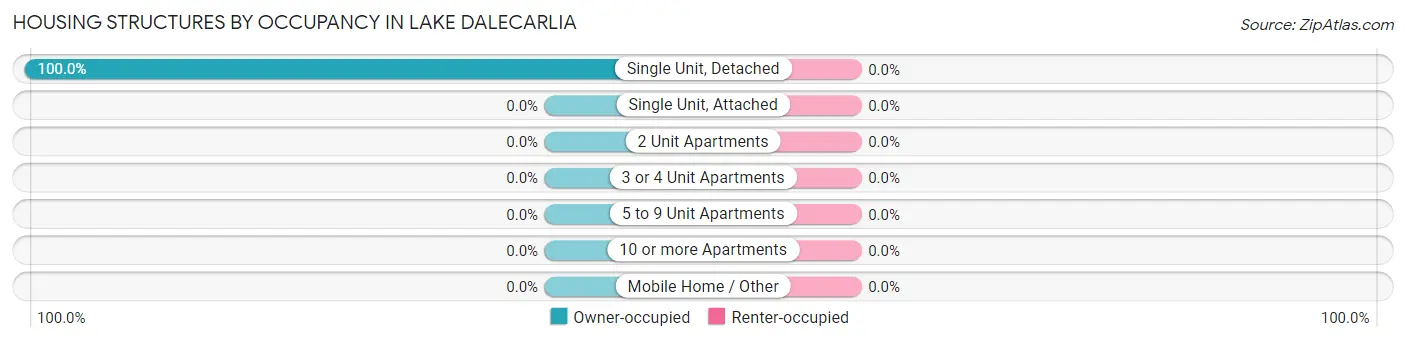
| Structure Type | Owner-occupied | Renter-occupied |
| Single Unit, Detached | 554 (100.0%) | 0 (0.0%) |
| Single Unit, Attached | 0 (0.0%) | 0 (0.0%) |
| 2 Unit Apartments | 0 (0.0%) | 0 (0.0%) |
| 3 or 4 Unit Apartments | 0 (0.0%) | 0 (0.0%) |
| 5 to 9 Unit Apartments | 0 (0.0%) | 0 (0.0%) |
| 10 or more Apartments | 0 (0.0%) | 0 (0.0%) |
| Mobile Home / Other | 0 (0.0%) | 0 (0.0%) |
| Total | 554 (100.0%) | 0 (0.0%) |
Housing Structures by Number of Rooms in Lake Dalecarlia
| Number of Rooms | Owner-occupied | Renter-occupied |
| 1 Room | 0 (0.0%) | 0 (0.0%) |
| 2 or 3 Rooms | 0 (0.0%) | 0 (0.0%) |
| 4 or 5 Rooms | 174 (31.4%) | 0 (0.0%) |
| 6 or 7 Rooms | 205 (37.0%) | 0 (0.0%) |
| 8 or more Rooms | 175 (31.6%) | 0 (0.0%) |
| Total | 554 (100.0%) | 0 (0.0%) |
Housing Structure by Heating Type in Lake Dalecarlia
| Heating Type | Owner-occupied | Renter-occupied |
| Utility Gas | 506 (91.3%) | 0 (0.0%) |
| Bottled, Tank, or LP Gas | 0 (0.0%) | 0 (0.0%) |
| Electricity | 31 (5.6%) | 0 (0.0%) |
| Fuel Oil or Kerosene | 17 (3.1%) | 0 (0.0%) |
| Coal or Coke | 0 (0.0%) | 0 (0.0%) |
| All other Fuels | 0 (0.0%) | 0 (0.0%) |
| No Fuel Used | 0 (0.0%) | 0 (0.0%) |
| Total | 554 (100.0%) | 0 (0.0%) |
Household Vehicle Usage in Lake Dalecarlia
| Vehicles per Household | Owner-occupied | Renter-occupied |
| No Vehicle | 0 (0.0%) | 0 (0.0%) |
| 1 Vehicle | 79 (14.3%) | 0 (0.0%) |
| 2 Vehicles | 216 (39.0%) | 0 (0.0%) |
| 3 or more Vehicles | 259 (46.8%) | 0 (0.0%) |
| Total | 554 (100.0%) | 0 (0.0%) |
Real Estate & Mortgages in Lake Dalecarlia
Real Estate and Mortgage Overview in Lake Dalecarlia
| Characteristic | Without Mortgage | With Mortgage |
| Housing Units | 211 | 343 |
| Median Property Value | $213,800 | $311,000 |
| Median Household Income | - | - |
| Monthly Housing Costs | $577 | $0 |
| Real Estate Taxes | $2,353 | $0 |
Property Value by Mortgage Status in Lake Dalecarlia
| Property Value | Without Mortgage | With Mortgage |
| Less than $50,000 | 0 (0.0%) | 0 (0.0%) |
| $50,000 to $99,999 | 20 (9.5%) | 0 (0.0%) |
| $100,000 to $299,999 | 147 (69.7%) | 163 (47.5%) |
| $300,000 to $499,999 | 26 (12.3%) | 164 (47.8%) |
| $500,000 to $749,999 | 18 (8.5%) | 16 (4.7%) |
| $750,000 to $999,999 | 0 (0.0%) | 0 (0.0%) |
| $1,000,000 or more | 0 (0.0%) | 0 (0.0%) |
| Total | 211 (100.0%) | 343 (100.0%) |
Household Income by Mortgage Status in Lake Dalecarlia
| Household Income | Without Mortgage | With Mortgage |
| Less than $10,000 | 0 (0.0%) | 0 (0.0%) |
| $10,000 to $24,999 | 28 (13.3%) | 0 (0.0%) |
| $25,000 to $34,999 | 48 (22.8%) | 0 (0.0%) |
| $35,000 to $49,999 | 18 (8.5%) | 0 (0.0%) |
| $50,000 to $74,999 | 17 (8.1%) | 17 (5.0%) |
| $75,000 to $99,999 | 23 (10.9%) | 54 (15.7%) |
| $100,000 to $149,999 | 37 (17.5%) | 41 (11.9%) |
| $150,000 or more | 40 (19.0%) | 105 (30.6%) |
| Total | 211 (100.0%) | 343 (100.0%) |
Property Value to Household Income Ratio in Lake Dalecarlia
| Value-to-Income Ratio | Without Mortgage | With Mortgage |
| Less than 2.0x | 81 (38.4%) | 110,208 (32,130.6%) |
| 2.0x to 2.9x | 23 (10.9%) | 109 (31.8%) |
| 3.0x to 3.9x | 16 (7.6%) | 147 (42.9%) |
| 4.0x or more | 91 (43.1%) | 0 (0.0%) |
| Total | 211 (100.0%) | 343 (100.0%) |
Real Estate Taxes by Mortgage Status in Lake Dalecarlia
| Property Taxes | Without Mortgage | With Mortgage |
| Less than $800 | 4 (1.9%) | 0 (0.0%) |
| $800 to $1,499 | 23 (10.9%) | 0 (0.0%) |
| $800 to $1,499 | 184 (87.2%) | 48 (14.0%) |
| Total | 211 (100.0%) | 343 (100.0%) |
Health & Disability in Lake Dalecarlia
Health Insurance Coverage by Age in Lake Dalecarlia
| Age Bracket | With Coverage | Without Coverage |
| Under 6 Years | 91 (100.0%) | 0 (0.0%) |
| 6 to 18 Years | 217 (100.0%) | 0 (0.0%) |
| 19 to 25 Years | 203 (100.0%) | 0 (0.0%) |
| 26 to 34 Years | 59 (100.0%) | 0 (0.0%) |
| 35 to 44 Years | 153 (100.0%) | 0 (0.0%) |
| 45 to 54 Years | 217 (98.2%) | 4 (1.8%) |
| 55 to 64 Years | 277 (100.0%) | 0 (0.0%) |
| 65 to 74 Years | 143 (100.0%) | 0 (0.0%) |
| 75 Years and older | 84 (100.0%) | 0 (0.0%) |
| Total | 1,444 (99.7%) | 4 (0.3%) |
Health Insurance Coverage by Citizenship Status in Lake Dalecarlia
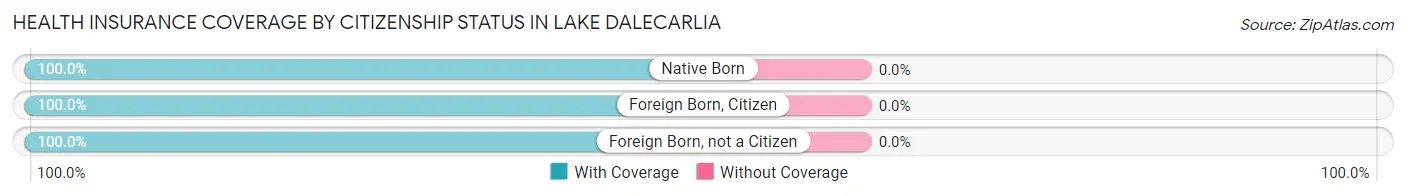
| Citizenship Status | With Coverage | Without Coverage |
| Native Born | 91 (100.0%) | 0 (0.0%) |
| Foreign Born, Citizen | 217 (100.0%) | 0 (0.0%) |
| Foreign Born, not a Citizen | 203 (100.0%) | 0 (0.0%) |
Health Insurance Coverage by Household Income in Lake Dalecarlia
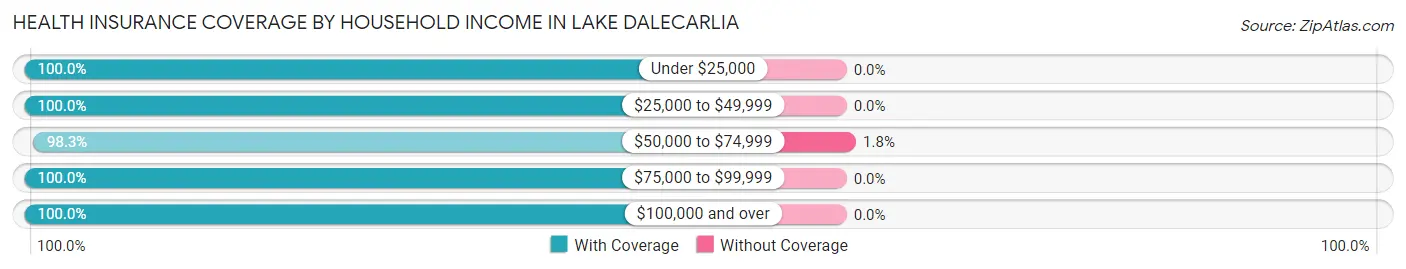
| Household Income | With Coverage | Without Coverage |
| Under $25,000 | 28 (100.0%) | 0 (0.0%) |
| $25,000 to $49,999 | 83 (100.0%) | 0 (0.0%) |
| $50,000 to $74,999 | 224 (98.3%) | 4 (1.8%) |
| $75,000 to $99,999 | 150 (100.0%) | 0 (0.0%) |
| $100,000 and over | 959 (100.0%) | 0 (0.0%) |
Public vs Private Health Insurance Coverage by Age in Lake Dalecarlia
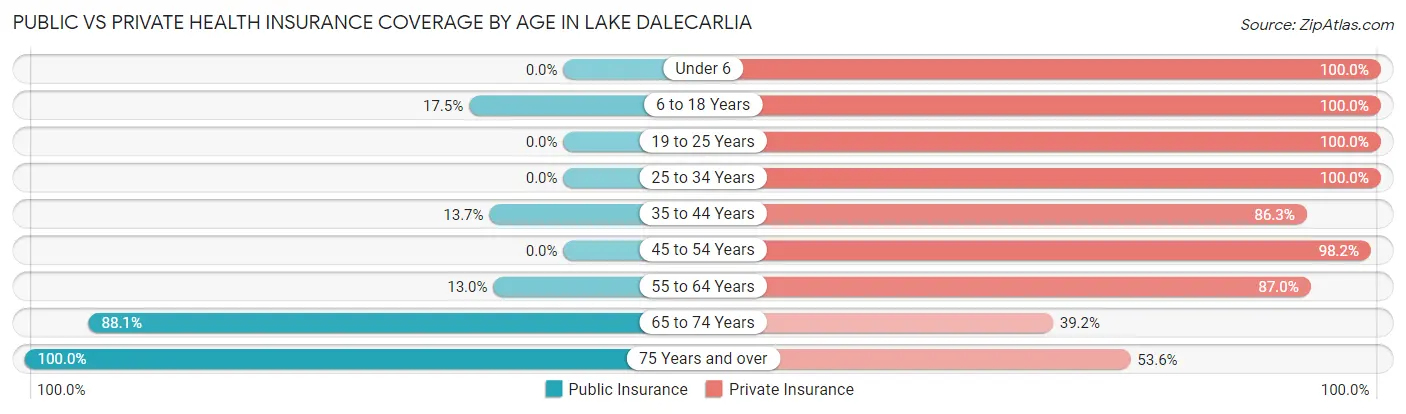
| Age Bracket | Public Insurance | Private Insurance |
| Under 6 | 0 (0.0%) | 91 (100.0%) |
| 6 to 18 Years | 38 (17.5%) | 217 (100.0%) |
| 19 to 25 Years | 0 (0.0%) | 203 (100.0%) |
| 25 to 34 Years | 0 (0.0%) | 59 (100.0%) |
| 35 to 44 Years | 21 (13.7%) | 132 (86.3%) |
| 45 to 54 Years | 0 (0.0%) | 217 (98.2%) |
| 55 to 64 Years | 36 (13.0%) | 241 (87.0%) |
| 65 to 74 Years | 126 (88.1%) | 56 (39.2%) |
| 75 Years and over | 84 (100.0%) | 45 (53.6%) |
| Total | 305 (21.1%) | 1,261 (87.1%) |
Disability Status by Sex by Age in Lake Dalecarlia
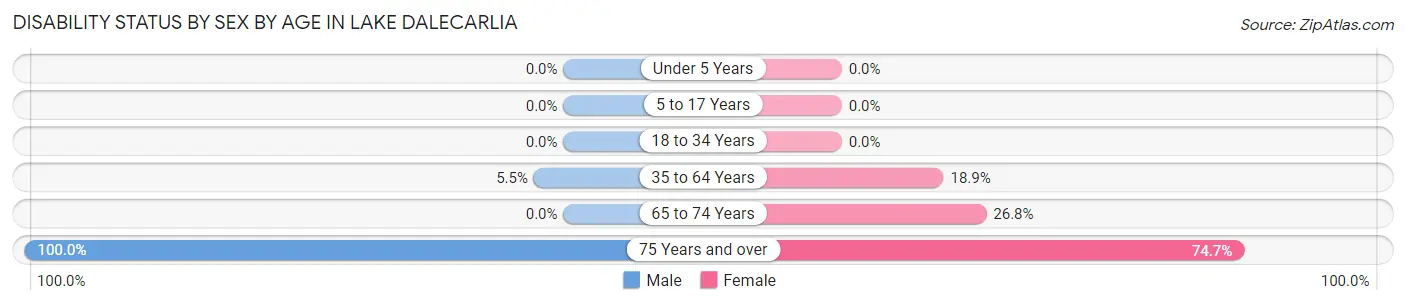
| Age Bracket | Male | Female |
| Under 5 Years | 0 (0.0%) | 0 (0.0%) |
| 5 to 17 Years | 0 (0.0%) | 0 (0.0%) |
| 18 to 34 Years | 0 (0.0%) | 0 (0.0%) |
| 35 to 64 Years | 18 (5.5%) | 61 (18.9%) |
| 65 to 74 Years | 0 (0.0%) | 11 (26.8%) |
| 75 Years and over | 13 (100.0%) | 53 (74.7%) |
Disability Class by Sex by Age in Lake Dalecarlia
Disability Class: Hearing Difficulty
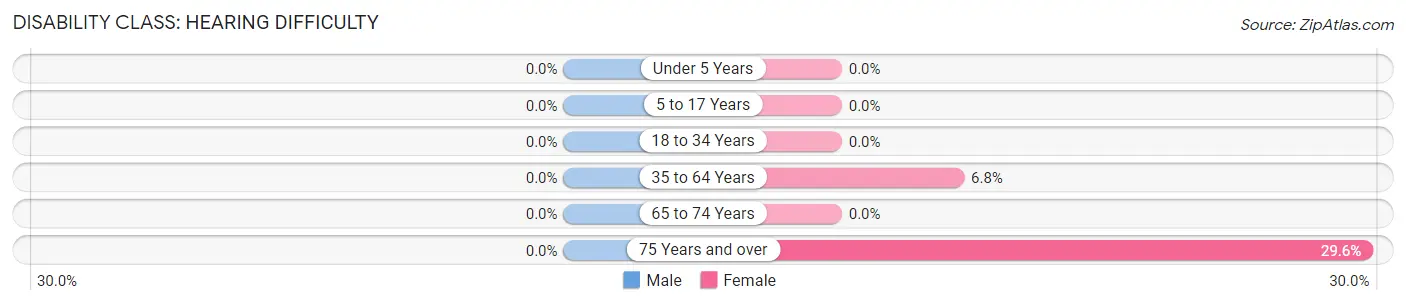
| Age Bracket | Male | Female |
| Under 5 Years | 0 (0.0%) | 0 (0.0%) |
| 5 to 17 Years | 0 (0.0%) | 0 (0.0%) |
| 18 to 34 Years | 0 (0.0%) | 0 (0.0%) |
| 35 to 64 Years | 0 (0.0%) | 22 (6.8%) |
| 65 to 74 Years | 0 (0.0%) | 0 (0.0%) |
| 75 Years and over | 0 (0.0%) | 21 (29.6%) |
Disability Class: Vision Difficulty
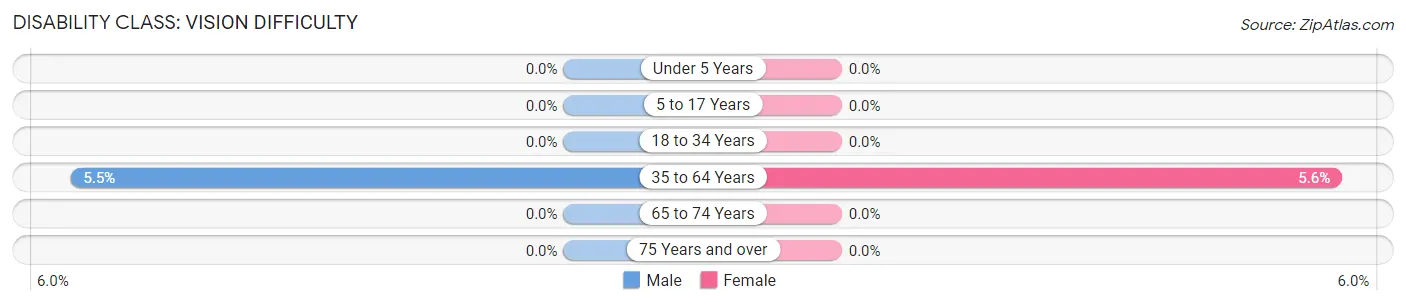
| Age Bracket | Male | Female |
| Under 5 Years | 0 (0.0%) | 0 (0.0%) |
| 5 to 17 Years | 0 (0.0%) | 0 (0.0%) |
| 18 to 34 Years | 0 (0.0%) | 0 (0.0%) |
| 35 to 64 Years | 18 (5.5%) | 18 (5.6%) |
| 65 to 74 Years | 0 (0.0%) | 0 (0.0%) |
| 75 Years and over | 0 (0.0%) | 0 (0.0%) |
Disability Class: Cognitive Difficulty
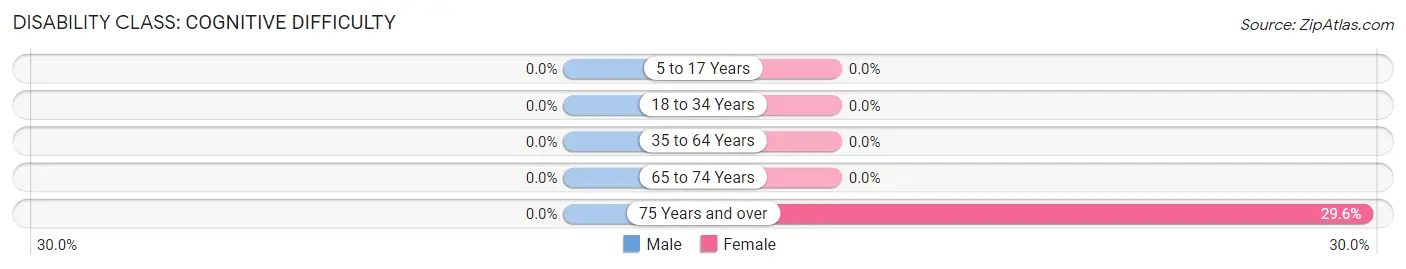
| Age Bracket | Male | Female |
| 5 to 17 Years | 0 (0.0%) | 0 (0.0%) |
| 18 to 34 Years | 0 (0.0%) | 0 (0.0%) |
| 35 to 64 Years | 0 (0.0%) | 0 (0.0%) |
| 65 to 74 Years | 0 (0.0%) | 0 (0.0%) |
| 75 Years and over | 0 (0.0%) | 21 (29.6%) |
Disability Class: Ambulatory Difficulty
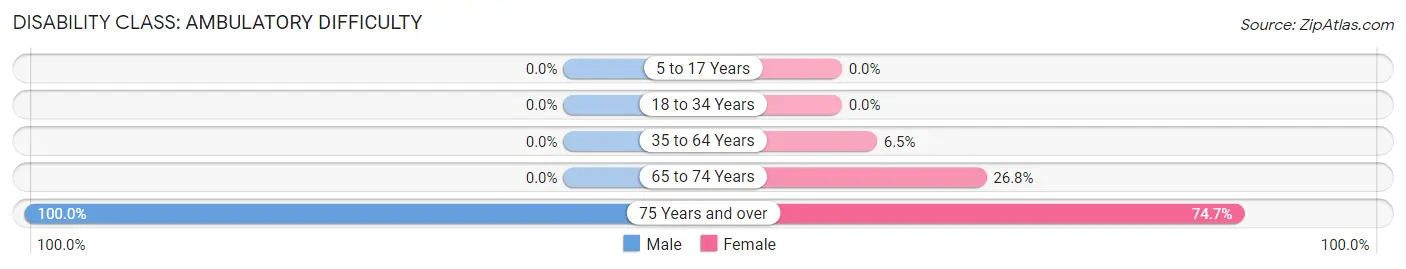
| Age Bracket | Male | Female |
| 5 to 17 Years | 0 (0.0%) | 0 (0.0%) |
| 18 to 34 Years | 0 (0.0%) | 0 (0.0%) |
| 35 to 64 Years | 0 (0.0%) | 21 (6.5%) |
| 65 to 74 Years | 0 (0.0%) | 11 (26.8%) |
| 75 Years and over | 13 (100.0%) | 53 (74.7%) |
Disability Class: Self-Care Difficulty
| Age Bracket | Male | Female |
| 5 to 17 Years | 0 (0.0%) | 0 (0.0%) |
| 18 to 34 Years | 0 (0.0%) | 0 (0.0%) |
| 35 to 64 Years | 0 (0.0%) | 0 (0.0%) |
| 65 to 74 Years | 0 (0.0%) | 0 (0.0%) |
| 75 Years and over | 0 (0.0%) | 0 (0.0%) |
Technology Access in Lake Dalecarlia
Computing Device Access in Lake Dalecarlia
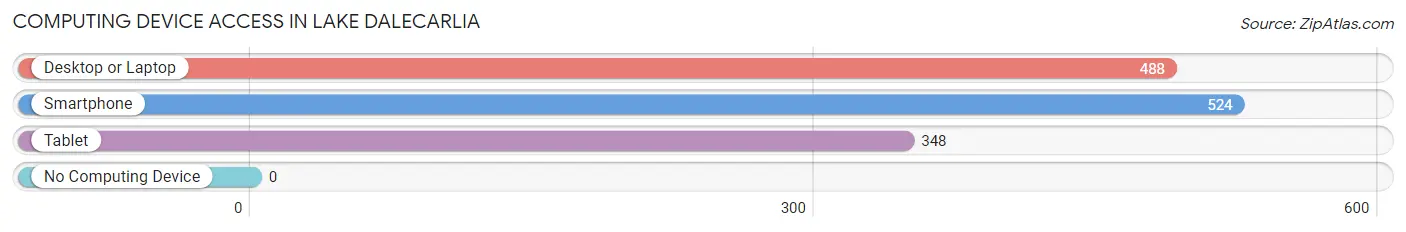
| Device Type | # Households | % Households |
| Desktop or Laptop | 488 | 88.1% |
| Smartphone | 524 | 94.6% |
| Tablet | 348 | 62.8% |
| No Computing Device | 0 | 0.0% |
| Total | 554 | 100.0% |
Internet Access in Lake Dalecarlia
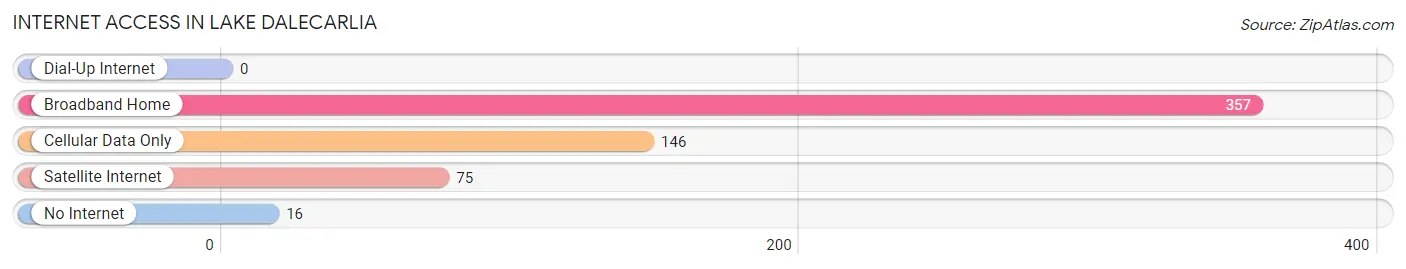
| Internet Type | # Households | % Households |
| Dial-Up Internet | 0 | 0.0% |
| Broadband Home | 357 | 64.4% |
| Cellular Data Only | 146 | 26.4% |
| Satellite Internet | 75 | 13.5% |
| No Internet | 16 | 2.9% |
| Total | 554 | 100.0% |
Lake Dalecarlia Summary
Dalecarlia Lake is a reservoir located in the northern part of Indiana, United States. It is located in the city of Indianapolis, and is the largest lake in the state. The lake was created in the early 1900s when the White River was dammed to create a reservoir for the city of Indianapolis. The lake is named after the Swedish province of Dalarna, which is also known as Dalecarlia.
History
The area around Dalecarlia Lake has been inhabited for thousands of years. The first known inhabitants were the Miami and Potawatomi tribes, who lived in the area until the early 1800s. In 1818, the Treaty of St. Mary's was signed, which ceded the land to the United States. The area was then opened up to settlement, and the first settlers arrived in the area in the 1830s.
In the early 1900s, the city of Indianapolis began to grow rapidly, and the need for a reliable water supply became apparent. In 1909, the city began construction on a dam on the White River, which would create a reservoir to provide water for the city. The dam was completed in 1913, and the reservoir was named Dalecarlia Lake.
Geography
Dalecarlia Lake is located in the northern part of Indiana, in the city of Indianapolis. The lake is approximately 4,000 acres in size, and is the largest lake in the state. The lake is fed by the White River, and is surrounded by a variety of parks and recreational areas. The lake is also home to a variety of wildlife, including fish, birds, and mammals.
Economy
Dalecarlia Lake is a major source of economic activity in the area. The lake is a popular destination for fishing, boating, and other recreational activities. The lake is also home to a variety of businesses, including marinas, restaurants, and hotels. The lake is also a popular destination for tourists, and the surrounding area is home to a variety of attractions, including museums, parks, and historic sites.
Demographics
The population of the area around Dalecarlia Lake is approximately 1.2 million people. The population is largely white, with a small percentage of African Americans, Hispanics, and other ethnicities. The median household income in the area is approximately $50,000, and the median home value is approximately $150,000. The area is home to a variety of educational institutions, including public and private schools, universities, and colleges.
Conclusion
Dalecarlia Lake is a major source of economic activity in the area, and is a popular destination for tourists and locals alike. The lake is home to a variety of businesses, and is surrounded by a variety of parks and recreational areas. The population of the area is largely white, with a small percentage of African Americans, Hispanics, and other ethnicities. The median household income in the area is approximately $50,000, and the median home value is approximately $150,000.
Common Questions
What is Per Capita Income in Lake Dalecarlia?
Per Capita income in Lake Dalecarlia is $44,109.
What is the Median Family Income in Lake Dalecarlia?
Median Family Income in Lake Dalecarlia is $114,257.
What is the Median Household income in Lake Dalecarlia?
Median Household Income in Lake Dalecarlia is $107,214.
What is Income or Wage Gap in Lake Dalecarlia?
Income or Wage Gap in Lake Dalecarlia is 34.5%.
Women in Lake Dalecarlia earn 65.5 cents for every dollar earned by a man.
What is Inequality or Gini Index in Lake Dalecarlia?
Inequality or Gini Index in Lake Dalecarlia is 0.35.
What is the Total Population of Lake Dalecarlia?
Total Population of Lake Dalecarlia is 1,448.
What is the Total Male Population of Lake Dalecarlia?
Total Male Population of Lake Dalecarlia is 695.
What is the Total Female Population of Lake Dalecarlia?
Total Female Population of Lake Dalecarlia is 753.
What is the Ratio of Males per 100 Females in Lake Dalecarlia?
There are 92.30 Males per 100 Females in Lake Dalecarlia.
What is the Ratio of Females per 100 Males in Lake Dalecarlia?
There are 108.35 Females per 100 Males in Lake Dalecarlia.
What is the Median Population Age in Lake Dalecarlia?
Median Population Age in Lake Dalecarlia is 45.0 Years.
What is the Average Family Size in Lake Dalecarlia
Average Family Size in Lake Dalecarlia is 3.2 People.
What is the Average Household Size in Lake Dalecarlia
Average Household Size in Lake Dalecarlia is 2.6 People.
How Large is the Labor Force in Lake Dalecarlia?
There are 869 People in the Labor Forcein in Lake Dalecarlia.
What is the Percentage of People in the Labor Force in Lake Dalecarlia?
72.2% of People are in the Labor Force in Lake Dalecarlia.
What is the Unemployment Rate in Lake Dalecarlia?
Unemployment Rate in Lake Dalecarlia is 3.7%.