Saratoga, WY Map & Demographics
Saratoga Map
Saratoga Overview
$37,103
PER CAPITA INCOME
$86,513
AVG FAMILY INCOME
$72,381
AVG HOUSEHOLD INCOME
57.3%
WAGE / INCOME GAP [ % ]
42.7¢/ $1
WAGE / INCOME GAP [ $ ]
0.40
INEQUALITY / GINI INDEX
1,715
TOTAL POPULATION
772
MALE POPULATION
943
FEMALE POPULATION
81.87
MALES / 100 FEMALES
122.15
FEMALES / 100 MALES
41.2
MEDIAN AGE
2.8
AVG FAMILY SIZE
2.4
AVG HOUSEHOLD SIZE
852
LABOR FORCE [ PEOPLE ]
63.1%
PERCENT IN LABOR FORCE
Saratoga Zip Codes
Saratoga Area Codes
Income in Saratoga
Income Overview in Saratoga
Per Capita Income in Saratoga is $37,103, while median incomes of families and households are $86,513 and $72,381 respectively.
| Characteristic | Number | Measure |
| Per Capita Income | 1,715 | $37,103 |
| Median Family Income | 437 | $86,513 |
| Mean Family Income | 437 | $83,617 |
| Median Household Income | 696 | $72,381 |
| Mean Household Income | 696 | $88,148 |
| Income Deficit | 437 | $0 |
| Wage / Income Gap (%) | 1,715 | 57.33% |
| Wage / Income Gap ($) | 1,715 | 42.67¢ per $1 |
| Gini / Inequality Index | 1,715 | 0.40 |
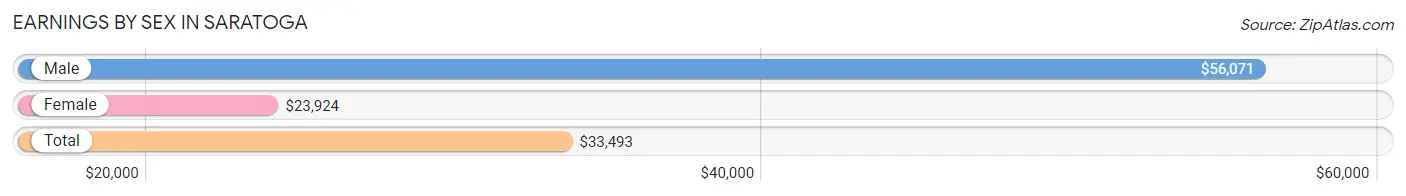
Earnings by Sex in Saratoga
Average Earnings in Saratoga are $33,493, $56,071 for men and $23,924 for women, a difference of 57.3%.
| Sex | Number | Average Earnings |
| Male | 416 (47.1%) | $56,071 |
| Female | 467 (52.9%) | $23,924 |
| Total | 883 (100.0%) | $33,493 |
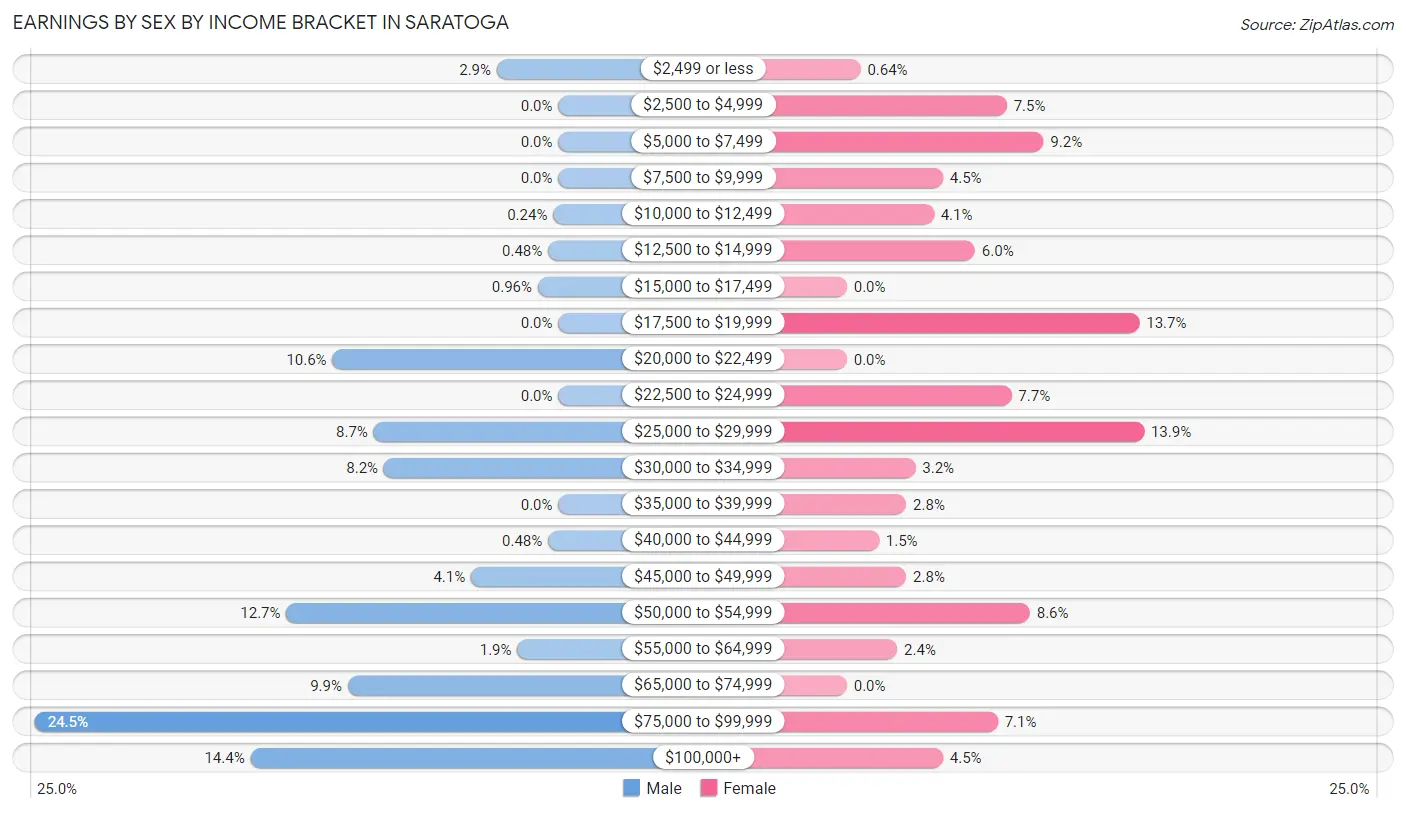
Earnings by Sex by Income Bracket in Saratoga
The most common earnings brackets in Saratoga are $75,000 to $99,999 for men (102 | 24.5%) and $25,000 to $29,999 for women (65 | 13.9%).
| Income | Male | Female |
| $2,499 or less | 12 (2.9%) | 3 (0.6%) |
| $2,500 to $4,999 | 0 (0.0%) | 35 (7.5%) |
| $5,000 to $7,499 | 0 (0.0%) | 43 (9.2%) |
| $7,500 to $9,999 | 0 (0.0%) | 21 (4.5%) |
| $10,000 to $12,499 | 1 (0.2%) | 19 (4.1%) |
| $12,500 to $14,999 | 2 (0.5%) | 28 (6.0%) |
| $15,000 to $17,499 | 4 (1.0%) | 0 (0.0%) |
| $17,500 to $19,999 | 0 (0.0%) | 64 (13.7%) |
| $20,000 to $22,499 | 44 (10.6%) | 0 (0.0%) |
| $22,500 to $24,999 | 0 (0.0%) | 36 (7.7%) |
| $25,000 to $29,999 | 36 (8.6%) | 65 (13.9%) |
| $30,000 to $34,999 | 34 (8.2%) | 15 (3.2%) |
| $35,000 to $39,999 | 0 (0.0%) | 13 (2.8%) |
| $40,000 to $44,999 | 2 (0.5%) | 7 (1.5%) |
| $45,000 to $49,999 | 17 (4.1%) | 13 (2.8%) |
| $50,000 to $54,999 | 53 (12.7%) | 40 (8.6%) |
| $55,000 to $64,999 | 8 (1.9%) | 11 (2.4%) |
| $65,000 to $74,999 | 41 (9.9%) | 0 (0.0%) |
| $75,000 to $99,999 | 102 (24.5%) | 33 (7.1%) |
| $100,000+ | 60 (14.4%) | 21 (4.5%) |
| Total | 416 (100.0%) | 467 (100.0%) |
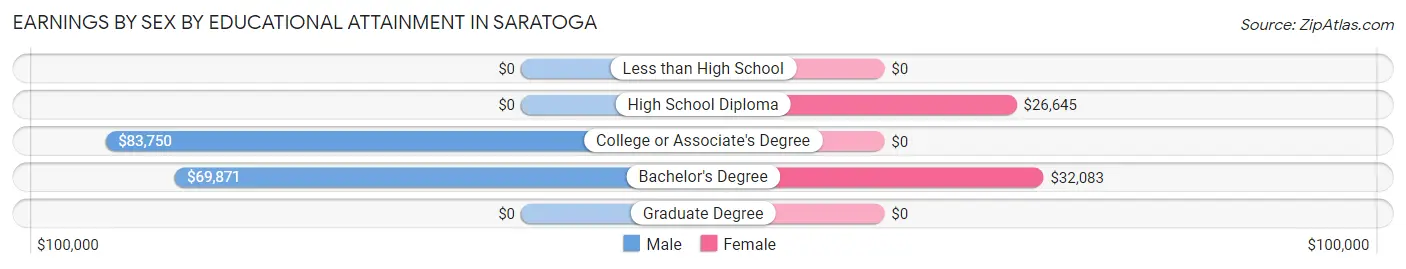
Earnings by Sex by Educational Attainment in Saratoga
Average earnings in Saratoga are $56,964 for men and $28,262 for women, a difference of 50.4%. Men with an educational attainment of college or associate's degree enjoy the highest average annual earnings of $83,750, while those with bachelor's degree education earn the least with $69,871. Women with an educational attainment of bachelor's degree earn the most with the average annual earnings of $32,083, while those with high school diploma education have the smallest earnings of $26,645.
| Educational Attainment | Male Income | Female Income |
| Less than High School | - | - |
| High School Diploma | - | - |
| College or Associate's Degree | $83,750 | $0 |
| Bachelor's Degree | $69,871 | $32,083 |
| Graduate Degree | - | - |
| Total | $56,964 | $28,262 |
Family Income in Saratoga
Family Income Brackets in Saratoga
According to the Saratoga family income data, there are 134 families falling into the $75,000 to $99,999 income range, which is the most common income bracket and makes up 30.7% of all families.
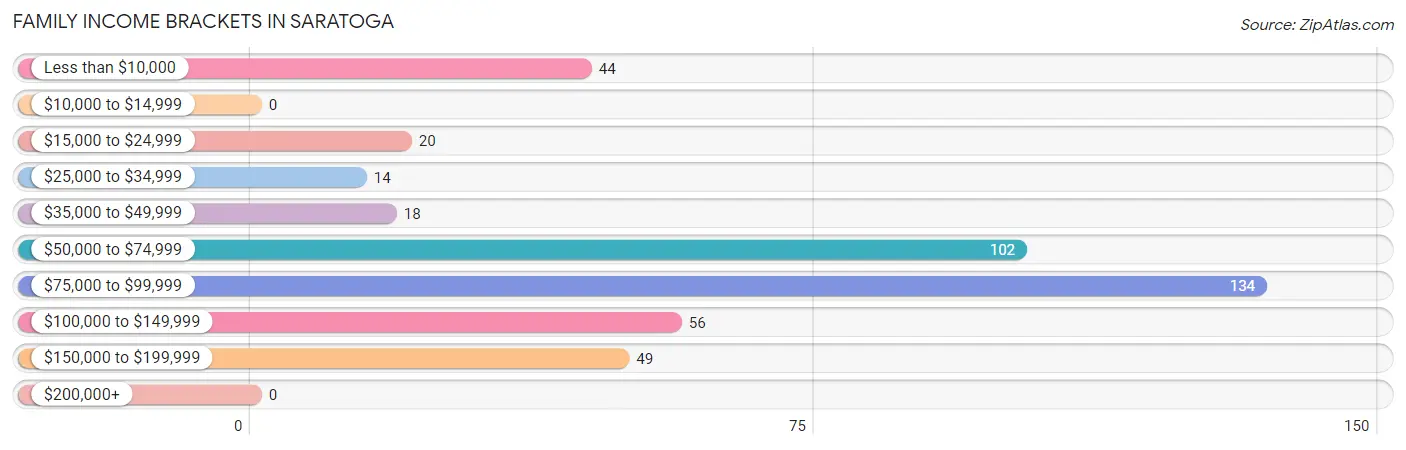
| Income Bracket | # Families | % Families |
| Less than $10,000 | 44 | 10.1% |
| $10,000 to $14,999 | 0 | 0.0% |
| $15,000 to $24,999 | 20 | 4.6% |
| $25,000 to $34,999 | 14 | 3.2% |
| $35,000 to $49,999 | 18 | 4.1% |
| $50,000 to $74,999 | 102 | 23.3% |
| $75,000 to $99,999 | 134 | 30.7% |
| $100,000 to $149,999 | 56 | 12.8% |
| $150,000 to $199,999 | 49 | 11.2% |
| $200,000+ | 0 | 0.0% |
Family Income by Famaliy Size in Saratoga
5-person families (79 | 18.1%) account for the highest median family income in Saratoga with $96,625 per family, while 2-person families (286 | 65.4%) have the highest median income of $35,536 per family member.
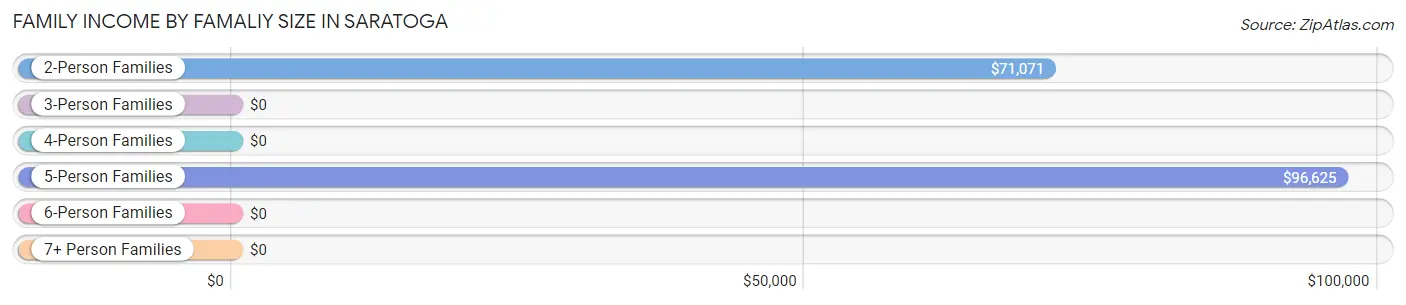
| Income Bracket | # Families | Median Income |
| 2-Person Families | 286 (65.4%) | $71,071 |
| 3-Person Families | 32 (7.3%) | $0 |
| 4-Person Families | 40 (9.1%) | $0 |
| 5-Person Families | 79 (18.1%) | $96,625 |
| 6-Person Families | 0 (0.0%) | $0 |
| 7+ Person Families | 0 (0.0%) | $0 |
| Total | 437 (100.0%) | $86,513 |
Family Income by Number of Earners in Saratoga
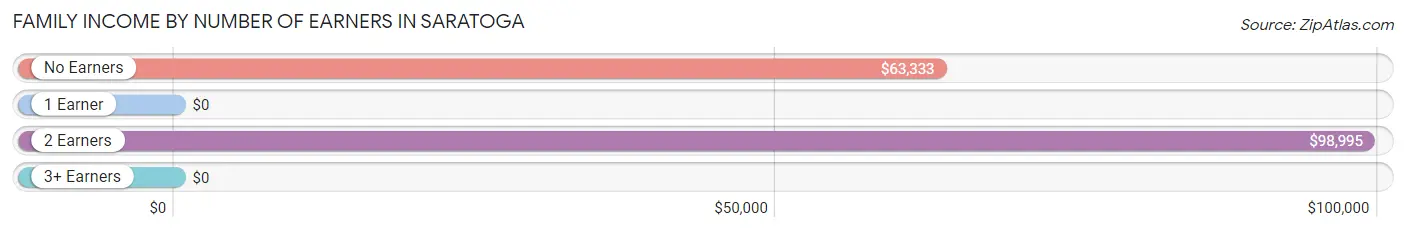
| Number of Earners | # Families | Median Income |
| No Earners | 70 (16.0%) | $63,333 |
| 1 Earner | 225 (51.5%) | $0 |
| 2 Earners | 133 (30.4%) | $98,995 |
| 3+ Earners | 9 (2.1%) | $0 |
| Total | 437 (100.0%) | $86,513 |
Household Income in Saratoga
Household Income Brackets in Saratoga
With 148 households falling in the category, the $75,000 to $99,999 income range is the most frequent in Saratoga, accounting for 21.3% of all households. In contrast, only 21 households (3.0%) fall into the $35,000 to $49,999 income bracket, making it the least populous group.
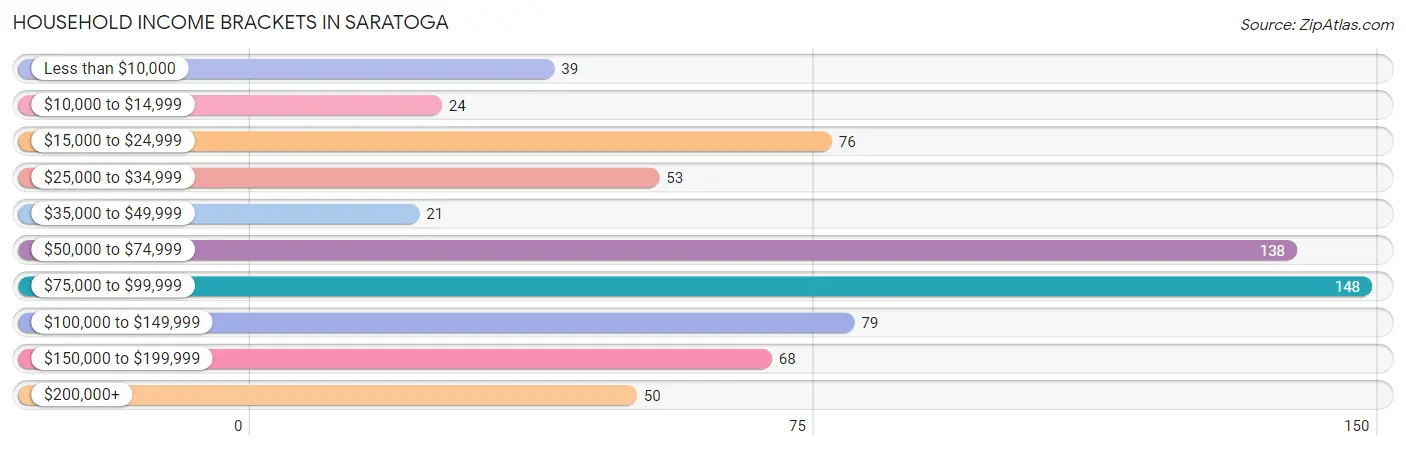
| Income Bracket | # Households | % Households |
| Less than $10,000 | 39 | 5.6% |
| $10,000 to $14,999 | 24 | 3.4% |
| $15,000 to $24,999 | 76 | 10.9% |
| $25,000 to $34,999 | 53 | 7.6% |
| $35,000 to $49,999 | 21 | 3.0% |
| $50,000 to $74,999 | 138 | 19.8% |
| $75,000 to $99,999 | 148 | 21.3% |
| $100,000 to $149,999 | 79 | 11.4% |
| $150,000 to $199,999 | 68 | 9.8% |
| $200,000+ | 50 | 7.2% |
Household Income by Householder Age in Saratoga
The median household income in Saratoga is $72,381, with the highest median household income of $87,303 found in the 45 to 64 years age bracket for the primary householder. A total of 293 households (42.1%) fall into this category. Meanwhile, the 15 to 24 years age bracket for the primary householder has the lowest median household income of $0, with 48 households (6.9%) in this group.
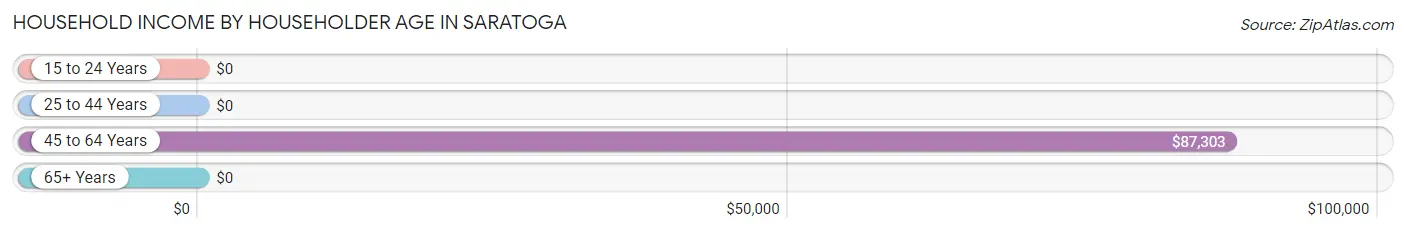
| Income Bracket | # Households | Median Income |
| 15 to 24 Years | 48 (6.9%) | $0 |
| 25 to 44 Years | 186 (26.7%) | $0 |
| 45 to 64 Years | 293 (42.1%) | $87,303 |
| 65+ Years | 169 (24.3%) | $0 |
| Total | 696 (100.0%) | $72,381 |
Poverty in Saratoga
Income Below Poverty by Sex and Age in Saratoga
With 5.1% poverty level for males and 11.9% for females among the residents of Saratoga, 6 to 11 year old males and 35 to 44 year old females are the most vulnerable to poverty, with 33 males (40.2%) and 39 females (49.4%) in their respective age groups living below the poverty level.
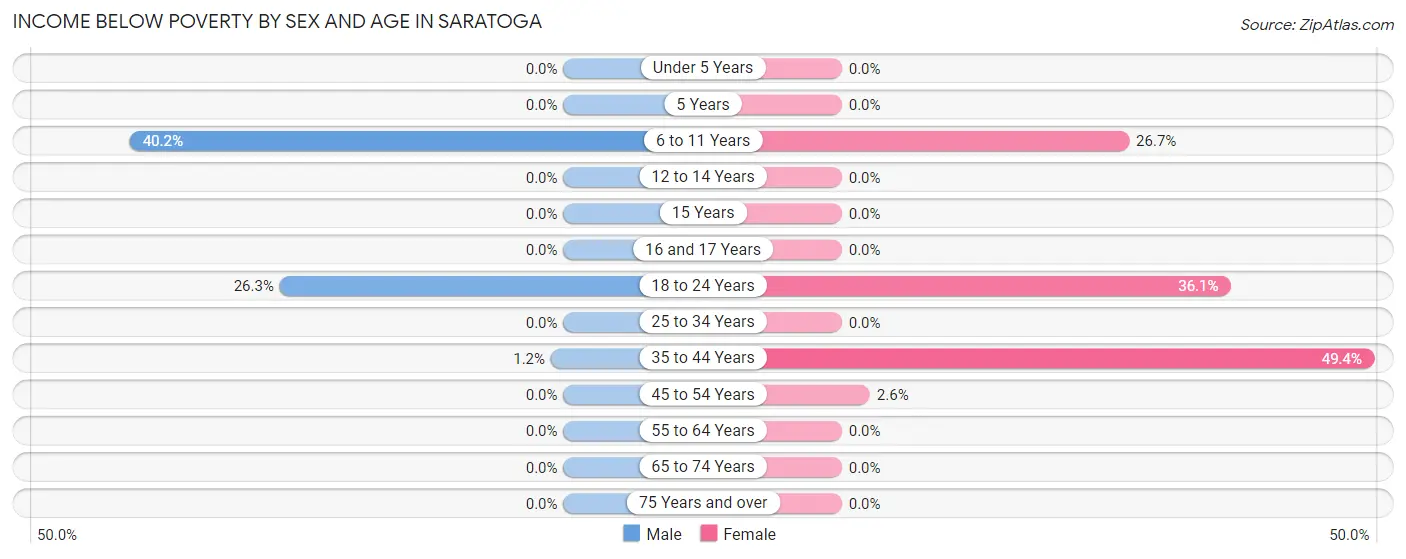
| Age Bracket | Male | Female |
| Under 5 Years | 0 (0.0%) | 0 (0.0%) |
| 5 Years | 0 (0.0%) | 0 (0.0%) |
| 6 to 11 Years | 33 (40.2%) | 16 (26.7%) |
| 12 to 14 Years | 0 (0.0%) | 0 (0.0%) |
| 15 Years | 0 (0.0%) | 0 (0.0%) |
| 16 and 17 Years | 0 (0.0%) | 0 (0.0%) |
| 18 to 24 Years | 5 (26.3%) | 53 (36.0%) |
| 25 to 34 Years | 0 (0.0%) | 0 (0.0%) |
| 35 to 44 Years | 1 (1.2%) | 39 (49.4%) |
| 45 to 54 Years | 0 (0.0%) | 3 (2.6%) |
| 55 to 64 Years | 0 (0.0%) | 0 (0.0%) |
| 65 to 74 Years | 0 (0.0%) | 0 (0.0%) |
| 75 Years and over | 0 (0.0%) | 0 (0.0%) |
| Total | 39 (5.1%) | 111 (11.9%) |
Income Above Poverty by Sex and Age in Saratoga
According to the poverty statistics in Saratoga, males aged under 5 years and females aged under 5 years are the age groups that are most secure financially, with 100.0% of males and 100.0% of females in these age groups living above the poverty line.
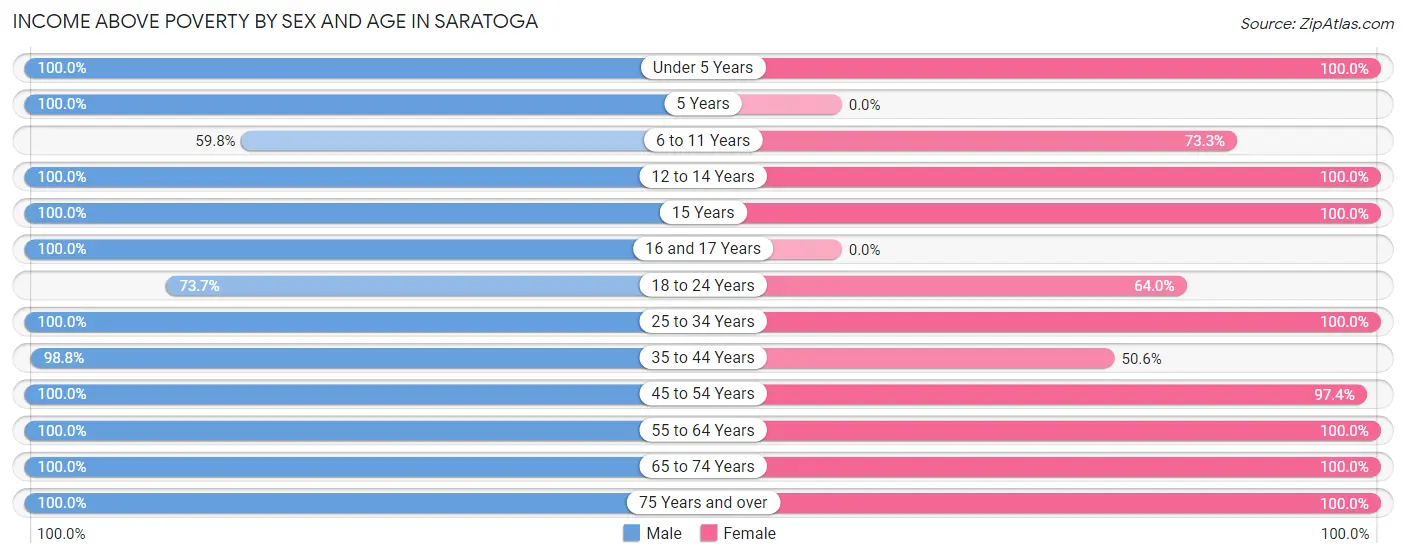
| Age Bracket | Male | Female |
| Under 5 Years | 24 (100.0%) | 97 (100.0%) |
| 5 Years | 35 (100.0%) | 0 (0.0%) |
| 6 to 11 Years | 49 (59.8%) | 44 (73.3%) |
| 12 to 14 Years | 10 (100.0%) | 39 (100.0%) |
| 15 Years | 7 (100.0%) | 11 (100.0%) |
| 16 and 17 Years | 25 (100.0%) | 0 (0.0%) |
| 18 to 24 Years | 14 (73.7%) | 94 (63.9%) |
| 25 to 34 Years | 112 (100.0%) | 92 (100.0%) |
| 35 to 44 Years | 85 (98.8%) | 40 (50.6%) |
| 45 to 54 Years | 109 (100.0%) | 112 (97.4%) |
| 55 to 64 Years | 116 (100.0%) | 176 (100.0%) |
| 65 to 74 Years | 42 (100.0%) | 68 (100.0%) |
| 75 Years and over | 99 (100.0%) | 47 (100.0%) |
| Total | 727 (94.9%) | 820 (88.1%) |
Income Below Poverty Among Married-Couple Families in Saratoga
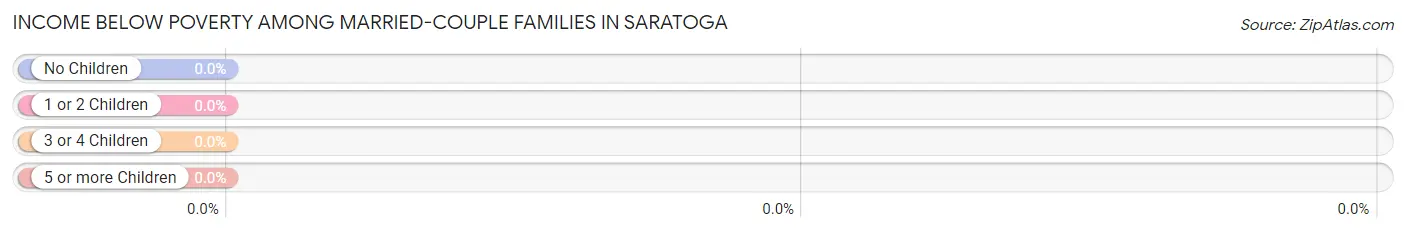
| Children | Above Poverty | Below Poverty |
| No Children | 217 (100.0%) | 0 (0.0%) |
| 1 or 2 Children | 57 (100.0%) | 0 (0.0%) |
| 3 or 4 Children | 62 (100.0%) | 0 (0.0%) |
| 5 or more Children | 0 (0.0%) | 0 (0.0%) |
| Total | 336 (100.0%) | 0 (0.0%) |
Income Below Poverty Among Single-Parent Households in Saratoga
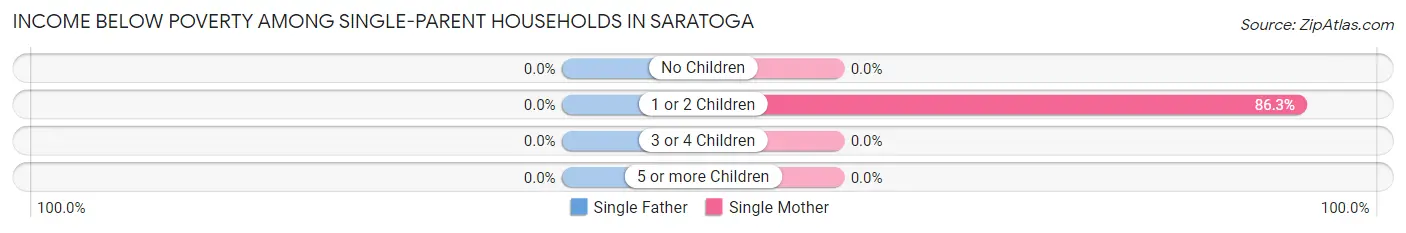
| Children | Single Father | Single Mother |
| No Children | 0 (0.0%) | 0 (0.0%) |
| 1 or 2 Children | 0 (0.0%) | 44 (86.3%) |
| 3 or 4 Children | 0 (0.0%) | 0 (0.0%) |
| 5 or more Children | 0 (0.0%) | 0 (0.0%) |
| Total | 0 (0.0%) | 44 (86.3%) |
Income Below Poverty Among Married-Couple vs Single-Parent Households in Saratoga
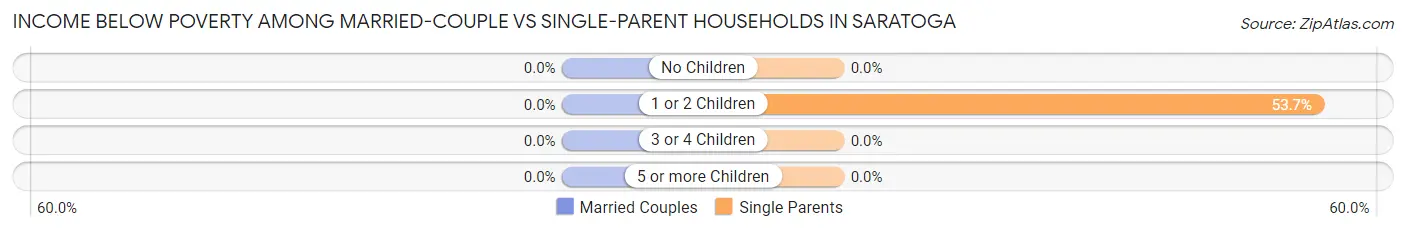
| Children | Married-Couple Families | Single-Parent Households |
| No Children | 0 (0.0%) | 0 (0.0%) |
| 1 or 2 Children | 0 (0.0%) | 44 (53.7%) |
| 3 or 4 Children | 0 (0.0%) | 0 (0.0%) |
| 5 or more Children | 0 (0.0%) | 0 (0.0%) |
| Total | 0 (0.0%) | 44 (43.6%) |
Race in Saratoga
The most populous races in Saratoga are White / Caucasian (1,523 | 88.8%), Two or more Races (129 | 7.5%), and Hispanic or Latino (111 | 6.5%).
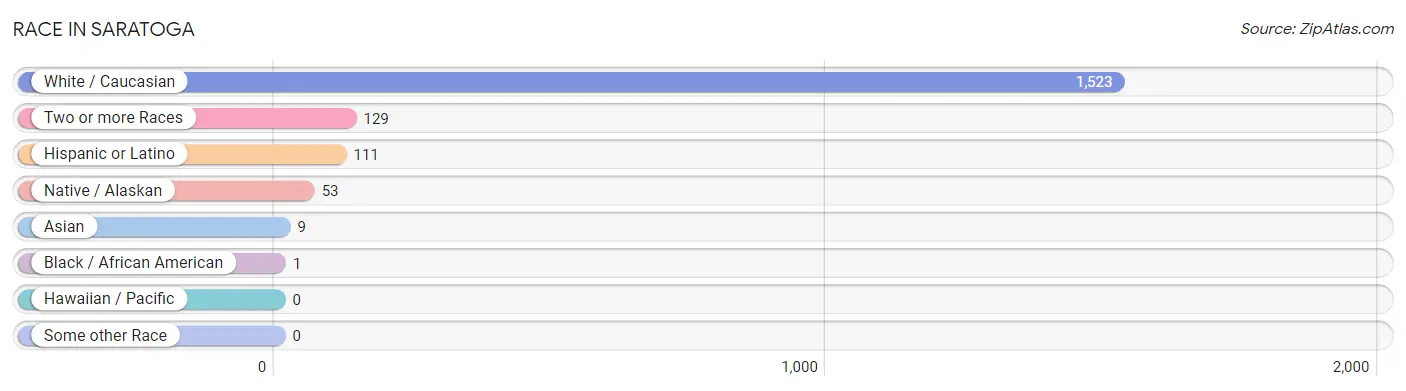
| Race | # Population | % Population |
| Asian | 9 | 0.5% |
| Black / African American | 1 | 0.1% |
| Hawaiian / Pacific | 0 | 0.0% |
| Hispanic or Latino | 111 | 6.5% |
| Native / Alaskan | 53 | 3.1% |
| White / Caucasian | 1,523 | 88.8% |
| Two or more Races | 129 | 7.5% |
| Some other Race | 0 | 0.0% |
| Total | 1,715 | 100.0% |
Ancestry in Saratoga
The most populous ancestries reported in Saratoga are German (449 | 26.2%), Irish (338 | 19.7%), French Canadian (141 | 8.2%), Mexican (108 | 6.3%), and American (97 | 5.7%), together accounting for 66.1% of all Saratoga residents.
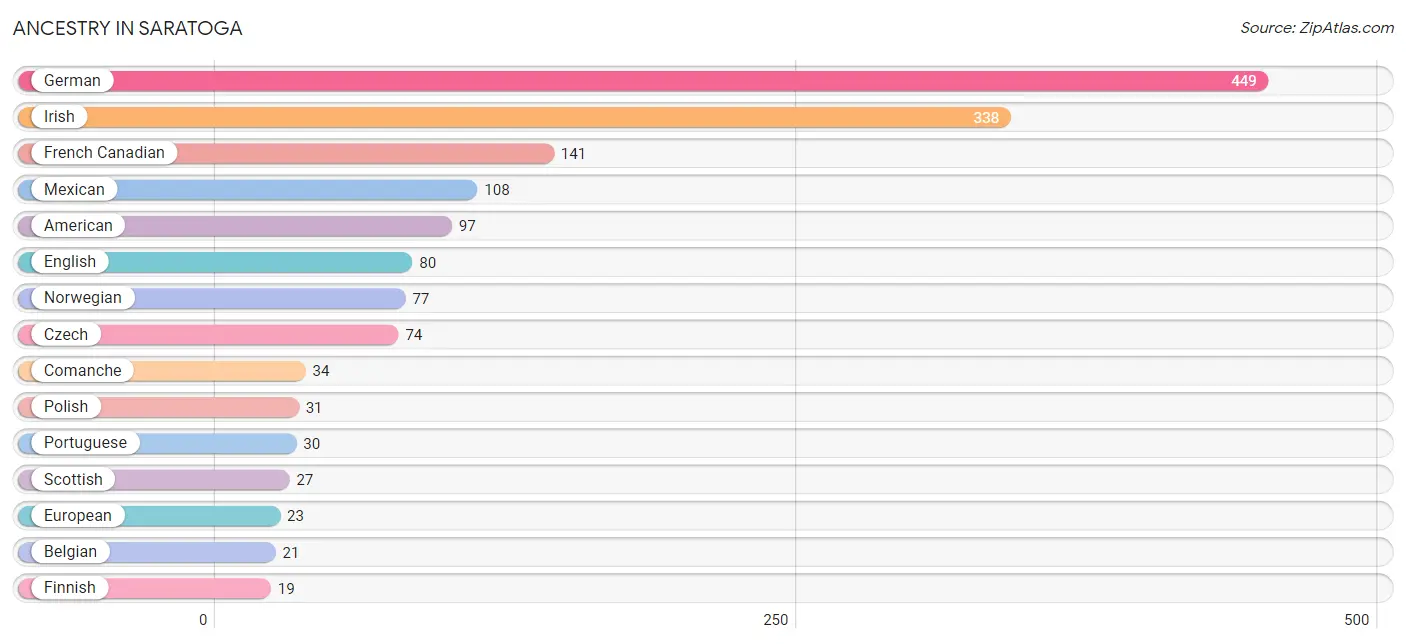
| Ancestry | # Population | % Population |
| Albanian | 13 | 0.8% |
| American | 97 | 5.7% |
| Arab | 6 | 0.4% |
| Belgian | 21 | 1.2% |
| British | 2 | 0.1% |
| Comanche | 34 | 2.0% |
| Czech | 74 | 4.3% |
| Dominican | 3 | 0.2% |
| English | 80 | 4.7% |
| European | 23 | 1.3% |
| Finnish | 19 | 1.1% |
| French | 16 | 0.9% |
| French Canadian | 141 | 8.2% |
| German | 449 | 26.2% |
| Hungarian | 1 | 0.1% |
| Irish | 338 | 19.7% |
| Italian | 10 | 0.6% |
| Lebanese | 6 | 0.4% |
| Mexican | 108 | 6.3% |
| Navajo | 19 | 1.1% |
| Norwegian | 77 | 4.5% |
| Polish | 31 | 1.8% |
| Portuguese | 30 | 1.8% |
| Russian | 16 | 0.9% |
| Scandinavian | 12 | 0.7% |
| Scotch-Irish | 15 | 0.9% |
| Scottish | 27 | 1.6% |
| Slovak | 16 | 0.9% |
| Sri Lankan | 9 | 0.5% |
| Swedish | 13 | 0.8% |
| Welsh | 10 | 0.6% | View All 31 Rows |
Immigrants in Saratoga
The most numerous immigrant groups reported in Saratoga came from Europe (20 | 1.2%), Ireland (20 | 1.2%), Northern Europe (20 | 1.2%), Asia (9 | 0.5%), and South Eastern Asia (9 | 0.5%), together accounting for 4.5% of all Saratoga residents.
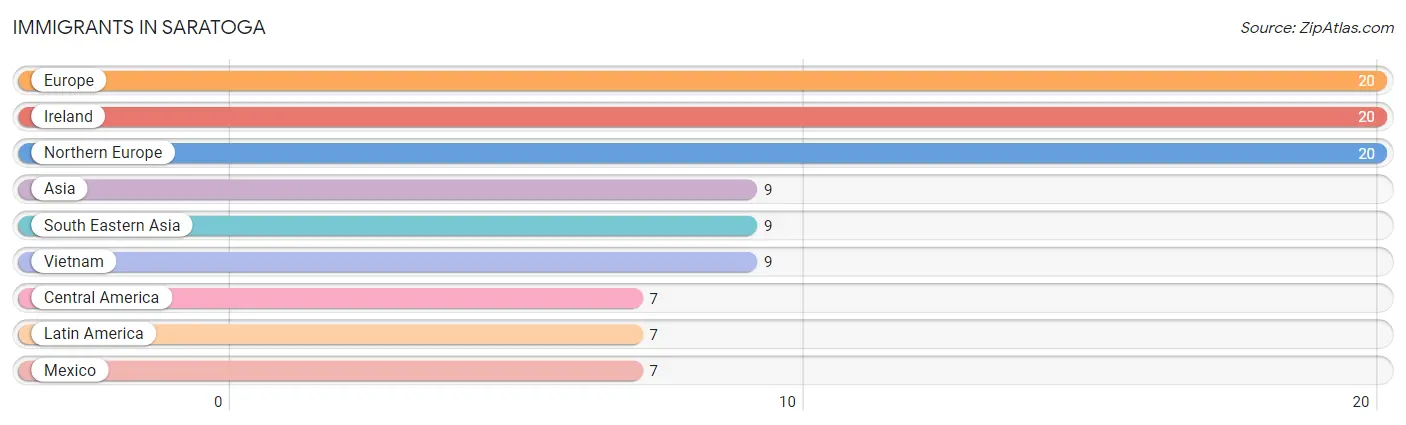
| Immigration Origin | # Population | % Population |
| Asia | 9 | 0.5% |
| Central America | 7 | 0.4% |
| Europe | 20 | 1.2% |
| Ireland | 20 | 1.2% |
| Latin America | 7 | 0.4% |
| Mexico | 7 | 0.4% |
| Northern Europe | 20 | 1.2% |
| South Eastern Asia | 9 | 0.5% |
| Vietnam | 9 | 0.5% | View All 9 Rows |
Sex and Age in Saratoga
Sex and Age in Saratoga
The most populous age groups in Saratoga are 5 to 9 Years (102 | 13.2%) for men and 20 to 24 Years (112 | 11.9%) for women.
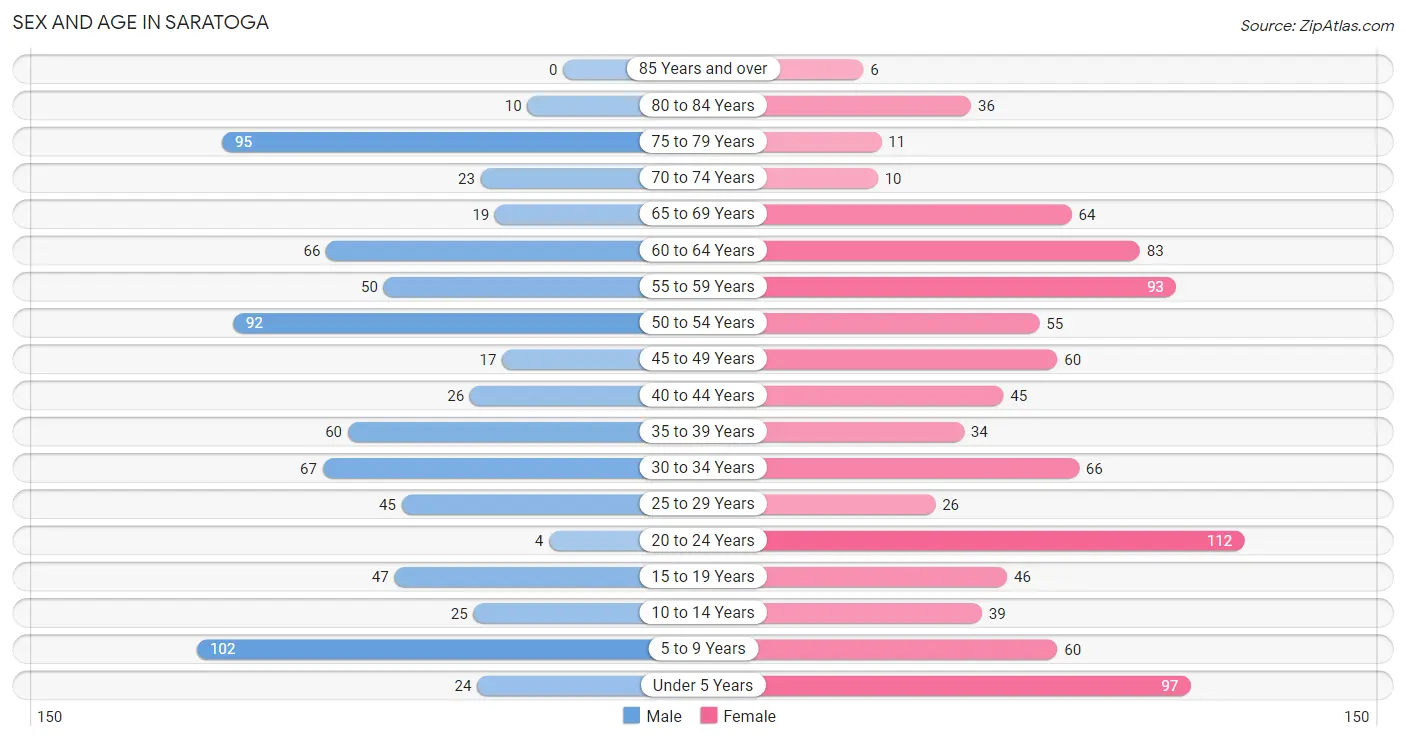
| Age Bracket | Male | Female |
| Under 5 Years | 24 (3.1%) | 97 (10.3%) |
| 5 to 9 Years | 102 (13.2%) | 60 (6.4%) |
| 10 to 14 Years | 25 (3.2%) | 39 (4.1%) |
| 15 to 19 Years | 47 (6.1%) | 46 (4.9%) |
| 20 to 24 Years | 4 (0.5%) | 112 (11.9%) |
| 25 to 29 Years | 45 (5.8%) | 26 (2.8%) |
| 30 to 34 Years | 67 (8.7%) | 66 (7.0%) |
| 35 to 39 Years | 60 (7.8%) | 34 (3.6%) |
| 40 to 44 Years | 26 (3.4%) | 45 (4.8%) |
| 45 to 49 Years | 17 (2.2%) | 60 (6.4%) |
| 50 to 54 Years | 92 (11.9%) | 55 (5.8%) |
| 55 to 59 Years | 50 (6.5%) | 93 (9.9%) |
| 60 to 64 Years | 66 (8.6%) | 83 (8.8%) |
| 65 to 69 Years | 19 (2.5%) | 64 (6.8%) |
| 70 to 74 Years | 23 (3.0%) | 10 (1.1%) |
| 75 to 79 Years | 95 (12.3%) | 11 (1.2%) |
| 80 to 84 Years | 10 (1.3%) | 36 (3.8%) |
| 85 Years and over | 0 (0.0%) | 6 (0.6%) |
| Total | 772 (100.0%) | 943 (100.0%) |
Families and Households in Saratoga
Median Family Size in Saratoga
The median family size in Saratoga is 2.82 persons per family, with married-couple families (336 | 76.9%) accounting for the largest median family size of 3.05 persons per family. On the other hand, single male/father families (50 | 11.4%) represent the smallest median family size with 1.66 persons per family.
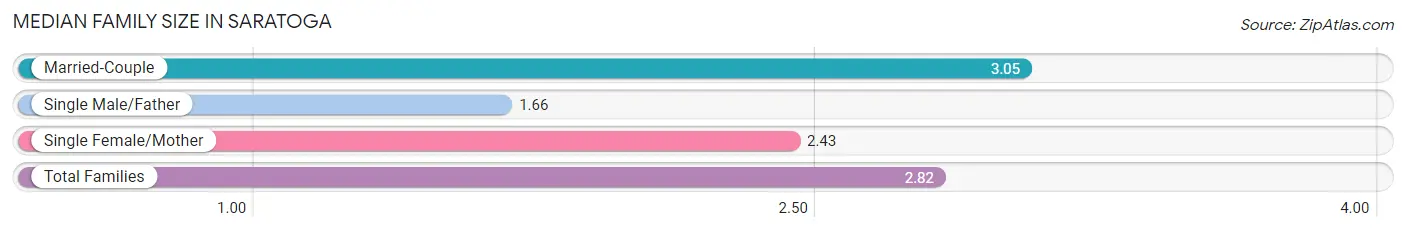
| Family Type | # Families | Family Size |
| Married-Couple | 336 (76.9%) | 3.05 |
| Single Male/Father | 50 (11.4%) | 1.66 |
| Single Female/Mother | 51 (11.7%) | 2.43 |
| Total Families | 437 (100.0%) | 2.82 |
Median Household Size in Saratoga
The median household size in Saratoga is 2.42 persons per household, with single female/mother households (51 | 7.3%) accounting for the largest median household size of 3.08 persons per household. non-family households (259 | 37.2%) represent the smallest median household size with 1.41 persons per household.
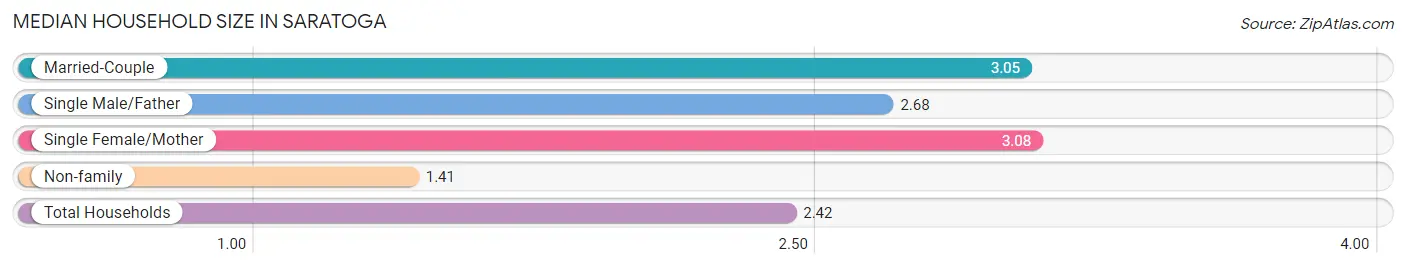
| Household Type | # Households | Household Size |
| Married-Couple | 336 (48.3%) | 3.05 |
| Single Male/Father | 50 (7.2%) | 2.68 |
| Single Female/Mother | 51 (7.3%) | 3.08 |
| Non-family | 259 (37.2%) | 1.41 |
| Total Households | 696 (100.0%) | 2.42 |
Household Size by Marriage Status in Saratoga
Out of a total of 696 households in Saratoga, 437 (62.8%) are family households, while 259 (37.2%) are nonfamily households. The most numerous type of family households are 2-person households, comprising 232, and the most common type of nonfamily households are 1-person households, comprising 207.
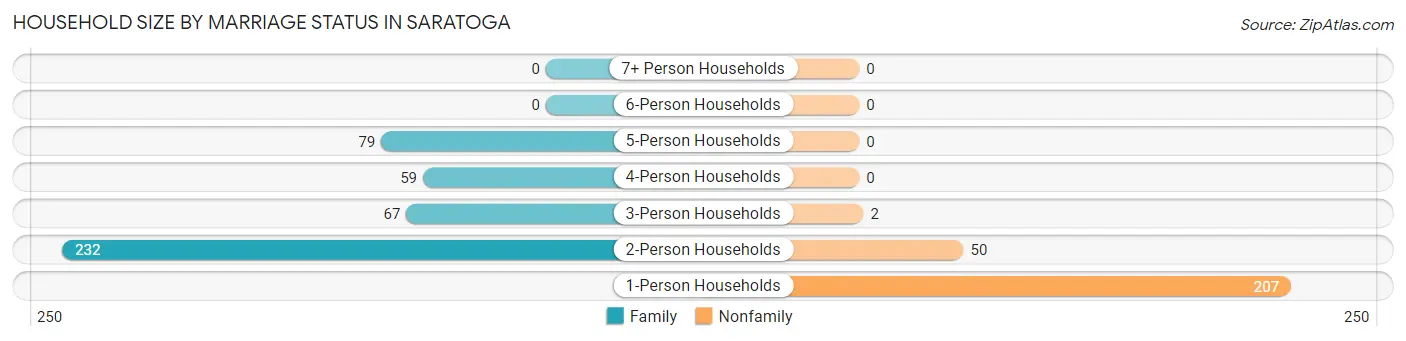
| Household Size | Family Households | Nonfamily Households |
| 1-Person Households | - | 207 (29.7%) |
| 2-Person Households | 232 (33.3%) | 50 (7.2%) |
| 3-Person Households | 67 (9.6%) | 2 (0.3%) |
| 4-Person Households | 59 (8.5%) | 0 (0.0%) |
| 5-Person Households | 79 (11.4%) | 0 (0.0%) |
| 6-Person Households | 0 (0.0%) | 0 (0.0%) |
| 7+ Person Households | 0 (0.0%) | 0 (0.0%) |
| Total | 437 (62.8%) | 259 (37.2%) |
Female Fertility in Saratoga
Fertility by Age in Saratoga
Average fertility rate in Saratoga is 180.0 births per 1,000 women. Women in the age bracket of 20 to 34 years have the highest fertility rate with 328.0 births per 1,000 women. Women in the age bracket of 20 to 34 years acount for 95.7% of all women with births.
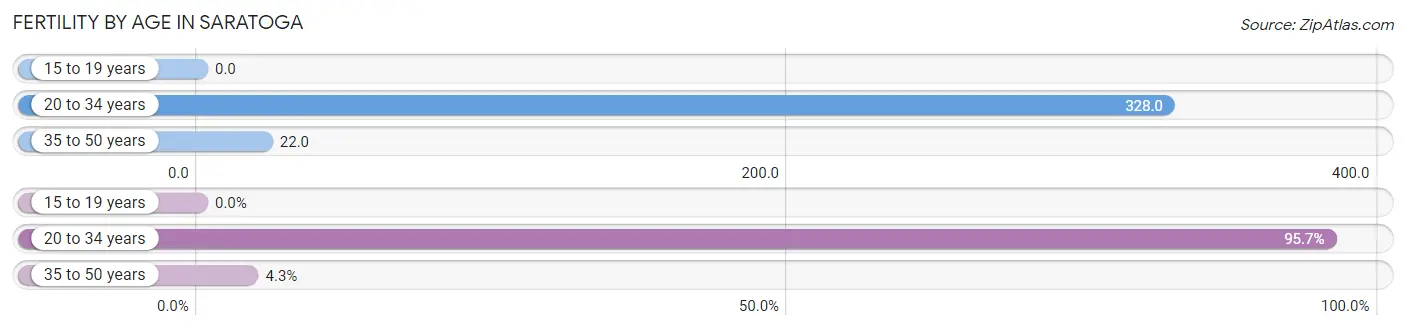
| Age Bracket | Women with Births | Births / 1,000 Women |
| 15 to 19 years | 0 (0.0%) | 0.0 |
| 20 to 34 years | 67 (95.7%) | 328.0 |
| 35 to 50 years | 3 (4.3%) | 22.0 |
| Total | 70 (100.0%) | 180.0 |
Fertility by Age by Marriage Status in Saratoga
55.7% of women with births (70) in Saratoga are married. The highest percentage of unmarried women with births falls into 35 to 50 years age bracket with 100.0% of them unmarried at the time of birth, while the lowest percentage of unmarried women with births belong to 20 to 34 years age bracket with 41.8% of them unmarried.
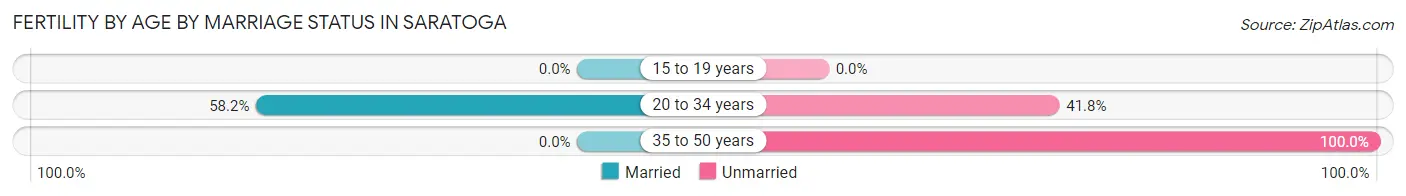
| Age Bracket | Married | Unmarried |
| 15 to 19 years | 0 (0.0%) | 0 (0.0%) |
| 20 to 34 years | 39 (58.2%) | 28 (41.8%) |
| 35 to 50 years | 0 (0.0%) | 3 (100.0%) |
| Total | 39 (55.7%) | 31 (44.3%) |
Fertility by Education in Saratoga
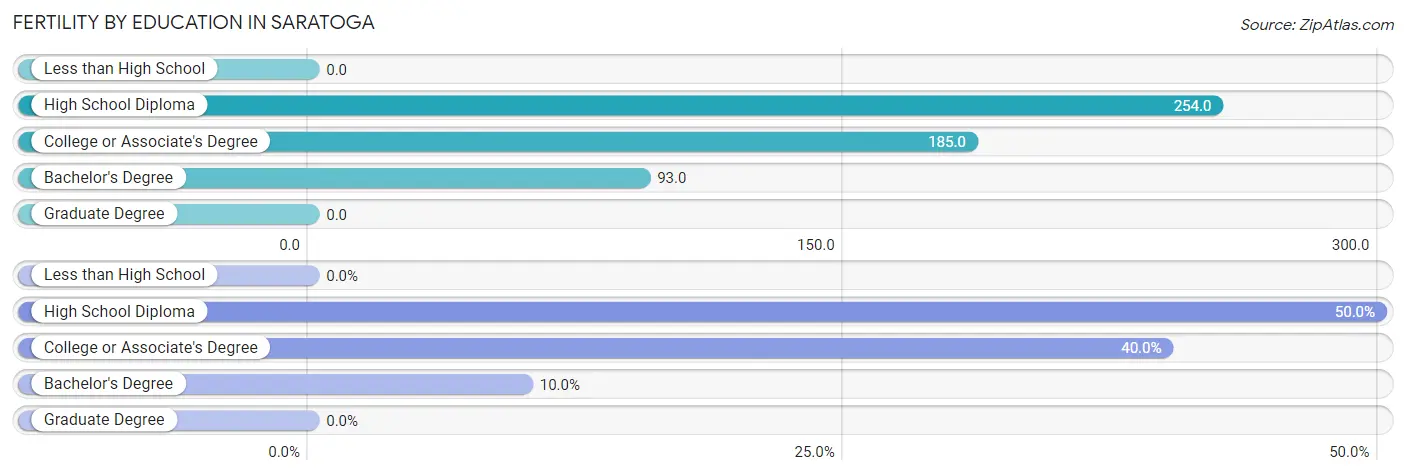
| Educational Attainment | Women with Births | Births / 1,000 Women |
| Less than High School | 0 (0.0%) | 0.0 |
| High School Diploma | 35 (50.0%) | 254.0 |
| College or Associate's Degree | 28 (40.0%) | 185.0 |
| Bachelor's Degree | 7 (10.0%) | 93.0 |
| Graduate Degree | 0 (0.0%) | 0.0 |
| Total | 70 (100.0%) | 180.0 |
Fertility by Education by Marriage Status in Saratoga
44.3% of women with births in Saratoga are unmarried. Women with the educational attainment of college or associate's degree are most likely to be married with 89.3% of them married at childbirth, while women with the educational attainment of bachelor's degree are least likely to be married with 100.0% of them unmarried at childbirth.
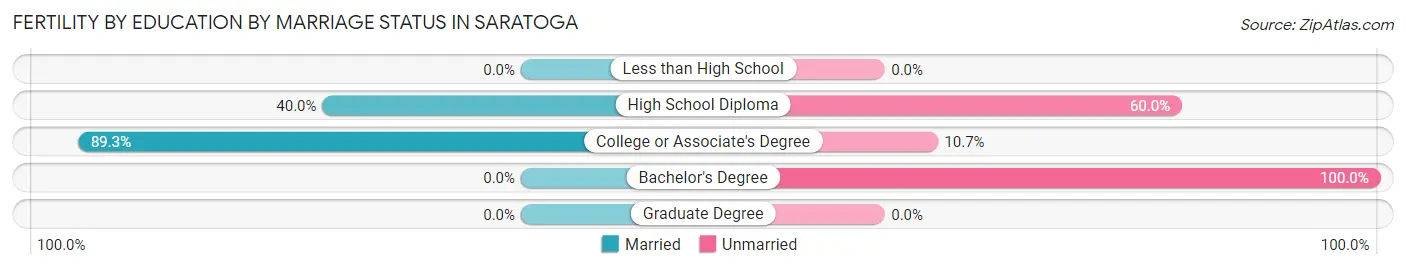
| Educational Attainment | Married | Unmarried |
| Less than High School | 0 (0.0%) | 0 (0.0%) |
| High School Diploma | 14 (40.0%) | 21 (60.0%) |
| College or Associate's Degree | 25 (89.3%) | 3 (10.7%) |
| Bachelor's Degree | 0 (0.0%) | 7 (100.0%) |
| Graduate Degree | 0 (0.0%) | 0 (0.0%) |
| Total | 39 (55.7%) | 31 (44.3%) |
Employment Characteristics in Saratoga
Employment by Class of Employer in Saratoga
Among the 822 employed individuals in Saratoga, private company employees (589 | 71.7%), local government employees (61 | 7.4%), and state government employees (57 | 6.9%) make up the most common classes of employment.
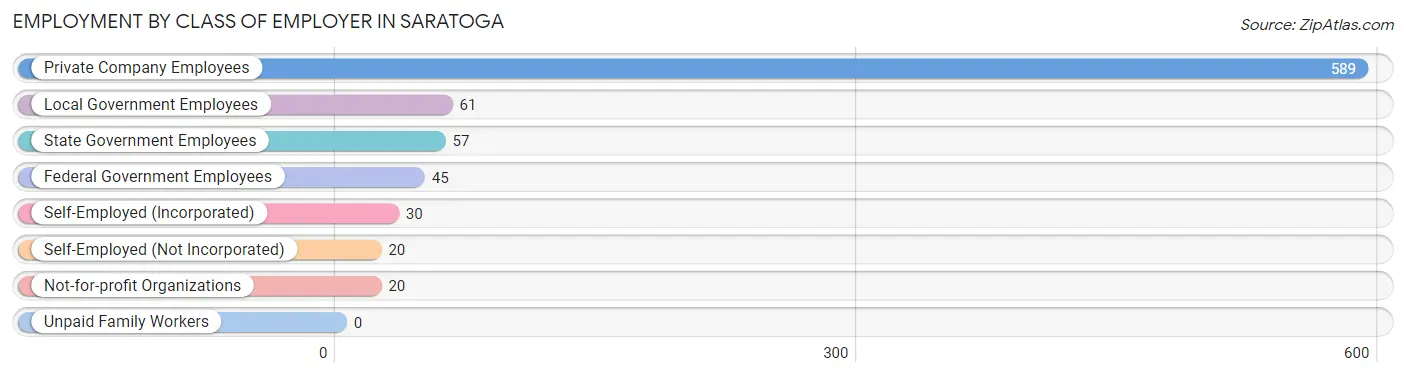
| Employer Class | # Employees | % Employees |
| Private Company Employees | 589 | 71.7% |
| Self-Employed (Incorporated) | 30 | 3.6% |
| Self-Employed (Not Incorporated) | 20 | 2.4% |
| Not-for-profit Organizations | 20 | 2.4% |
| Local Government Employees | 61 | 7.4% |
| State Government Employees | 57 | 6.9% |
| Federal Government Employees | 45 | 5.5% |
| Unpaid Family Workers | 0 | 0.0% |
| Total | 822 | 100.0% |
Employment Status by Age in Saratoga
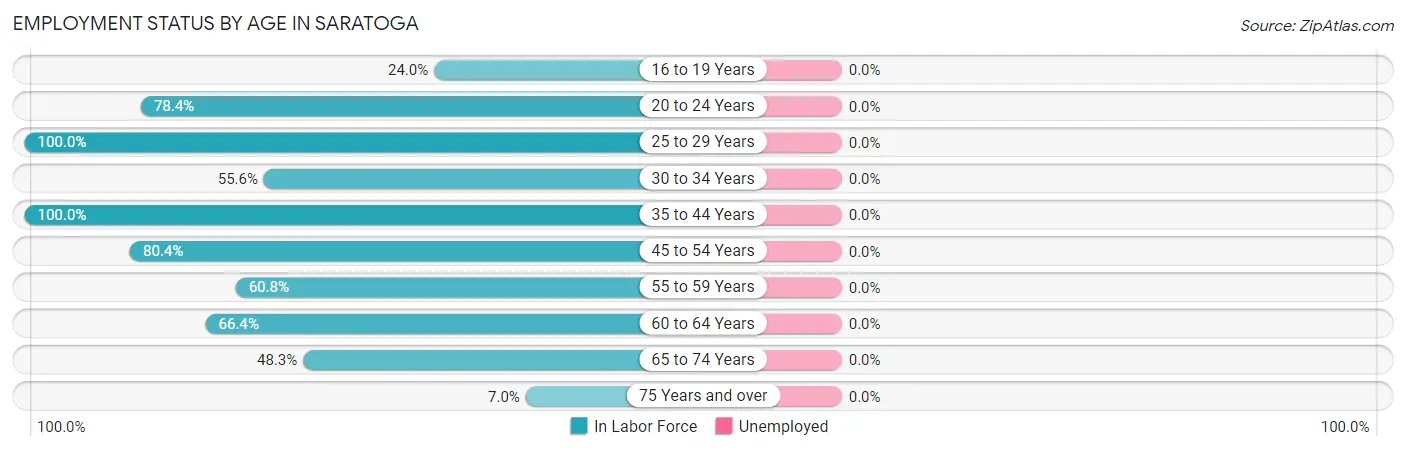
| Age Bracket | In Labor Force | Unemployed |
| 16 to 19 Years | 18 (24.0%) | 0 (0.0%) |
| 20 to 24 Years | 91 (78.4%) | 0 (0.0%) |
| 25 to 29 Years | 71 (100.0%) | 0 (0.0%) |
| 30 to 34 Years | 74 (55.6%) | 0 (0.0%) |
| 35 to 44 Years | 165 (100.0%) | 0 (0.0%) |
| 45 to 54 Years | 180 (80.4%) | 0 (0.0%) |
| 55 to 59 Years | 87 (60.8%) | 0 (0.0%) |
| 60 to 64 Years | 99 (66.4%) | 0 (0.0%) |
| 65 to 74 Years | 56 (48.3%) | 0 (0.0%) |
| 75 Years and over | 11 (7.0%) | 0 (0.0%) |
| Total | 852 (63.1%) | 0 (0.0%) |
Employment Status by Educational Attainment in Saratoga
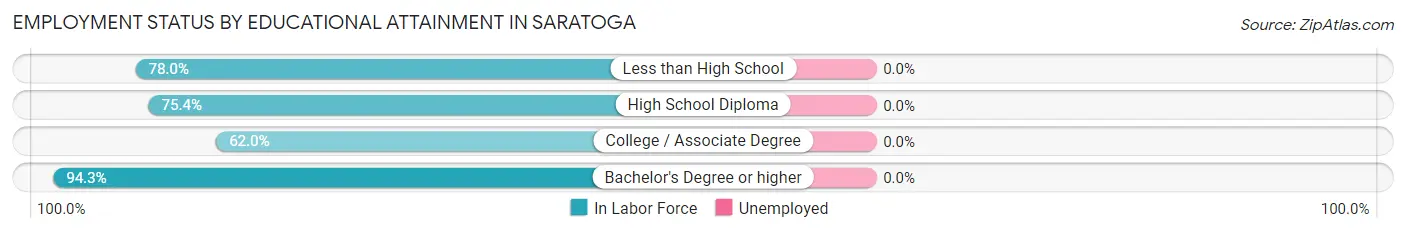
| Educational Attainment | In Labor Force | Unemployed |
| Less than High School | 71 (78.0%) | 0 (0.0%) |
| High School Diploma | 153 (75.4%) | 0 (0.0%) |
| College / Associate Degree | 202 (62.0%) | 0 (0.0%) |
| Bachelor's Degree or higher | 250 (94.3%) | 0 (0.0%) |
| Total | 676 (76.4%) | 0 (0.0%) |
Employment Occupations by Sex in Saratoga
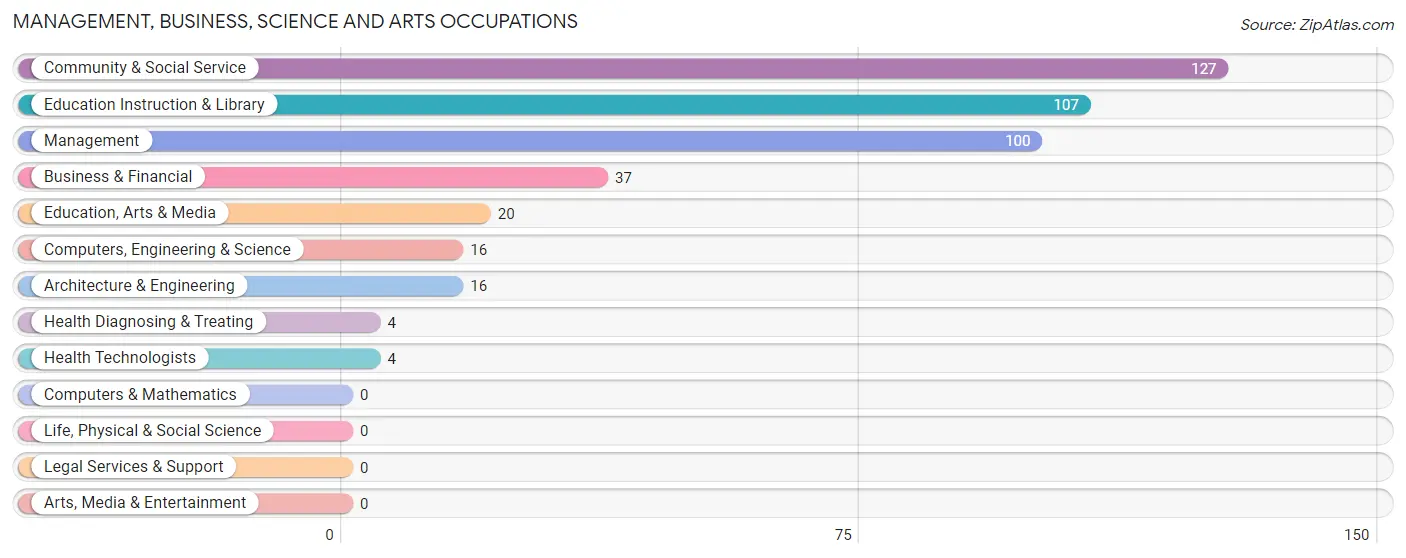
Management, Business, Science and Arts Occupations
The most common Management, Business, Science and Arts occupations in Saratoga are Community & Social Service (127 | 14.9%), Education Instruction & Library (107 | 12.6%), Management (100 | 11.7%), Business & Financial (37 | 4.3%), and Education, Arts & Media (20 | 2.4%).
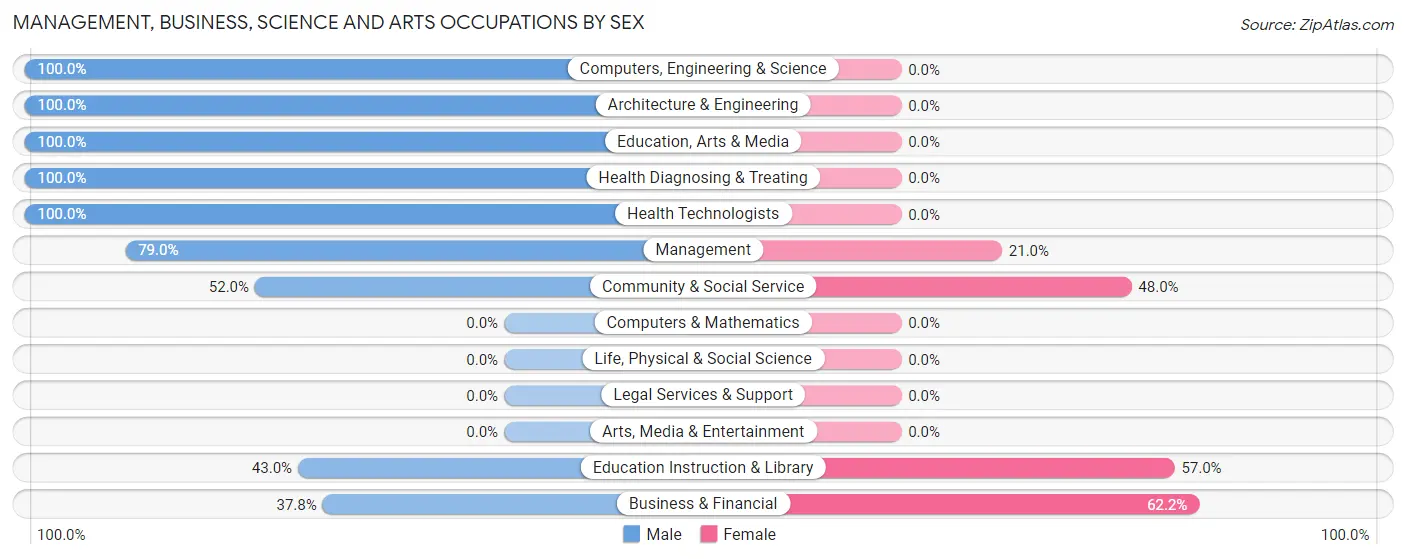
Management, Business, Science and Arts Occupations by Sex
Within the Management, Business, Science and Arts occupations in Saratoga, the most male-oriented occupations are Computers, Engineering & Science (100.0%), Architecture & Engineering (100.0%), and Education, Arts & Media (100.0%), while the most female-oriented occupations are Business & Financial (62.2%), Education Instruction & Library (57.0%), and Community & Social Service (48.0%).
| Occupation | Male | Female |
| Management | 79 (79.0%) | 21 (21.0%) |
| Business & Financial | 14 (37.8%) | 23 (62.2%) |
| Computers, Engineering & Science | 16 (100.0%) | 0 (0.0%) |
| Computers & Mathematics | 0 (0.0%) | 0 (0.0%) |
| Architecture & Engineering | 16 (100.0%) | 0 (0.0%) |
| Life, Physical & Social Science | 0 (0.0%) | 0 (0.0%) |
| Community & Social Service | 66 (52.0%) | 61 (48.0%) |
| Education, Arts & Media | 20 (100.0%) | 0 (0.0%) |
| Legal Services & Support | 0 (0.0%) | 0 (0.0%) |
| Education Instruction & Library | 46 (43.0%) | 61 (57.0%) |
| Arts, Media & Entertainment | 0 (0.0%) | 0 (0.0%) |
| Health Diagnosing & Treating | 4 (100.0%) | 0 (0.0%) |
| Health Technologists | 4 (100.0%) | 0 (0.0%) |
| Total (Category) | 179 (63.0%) | 105 (37.0%) |
| Total (Overall) | 407 (47.8%) | 445 (52.2%) |
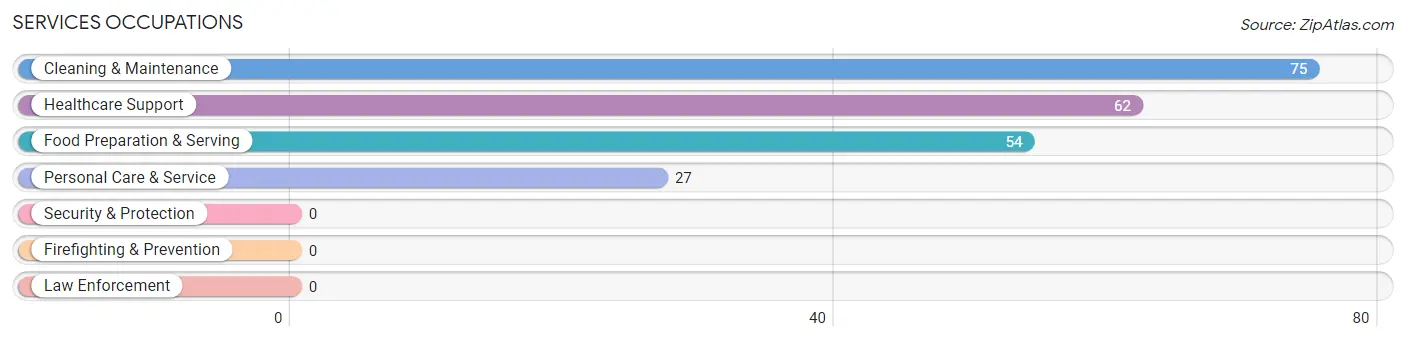
Services Occupations
The most common Services occupations in Saratoga are Cleaning & Maintenance (75 | 8.8%), Healthcare Support (62 | 7.3%), Food Preparation & Serving (54 | 6.3%), and Personal Care & Service (27 | 3.2%).
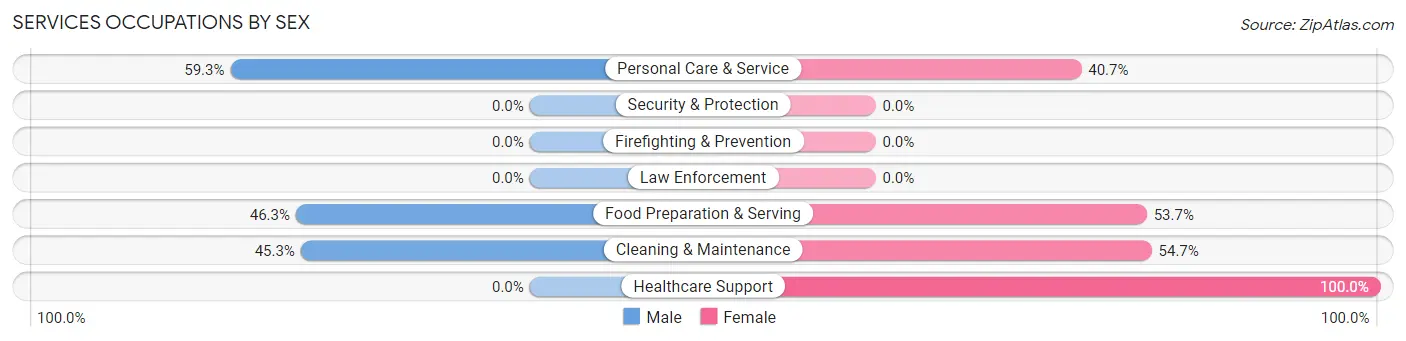
Services Occupations by Sex
Within the Services occupations in Saratoga, the most male-oriented occupations are Personal Care & Service (59.3%), Food Preparation & Serving (46.3%), and Cleaning & Maintenance (45.3%), while the most female-oriented occupations are Healthcare Support (100.0%), Cleaning & Maintenance (54.7%), and Food Preparation & Serving (53.7%).
| Occupation | Male | Female |
| Healthcare Support | 0 (0.0%) | 62 (100.0%) |
| Security & Protection | 0 (0.0%) | 0 (0.0%) |
| Firefighting & Prevention | 0 (0.0%) | 0 (0.0%) |
| Law Enforcement | 0 (0.0%) | 0 (0.0%) |
| Food Preparation & Serving | 25 (46.3%) | 29 (53.7%) |
| Cleaning & Maintenance | 34 (45.3%) | 41 (54.7%) |
| Personal Care & Service | 16 (59.3%) | 11 (40.7%) |
| Total (Category) | 75 (34.4%) | 143 (65.6%) |
| Total (Overall) | 407 (47.8%) | 445 (52.2%) |
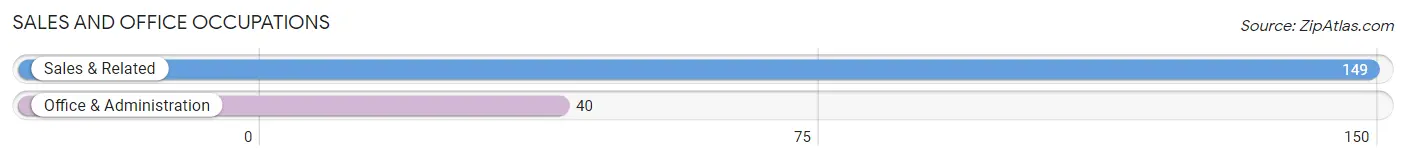
Sales and Office Occupations
The most common Sales and Office occupations in Saratoga are Sales & Related (149 | 17.5%), and Office & Administration (40 | 4.7%).
Sales and Office Occupations by Sex
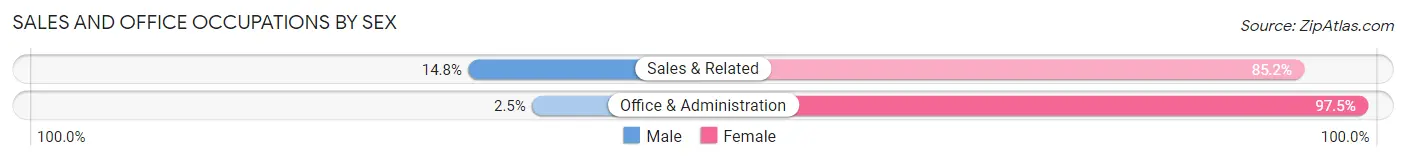
| Occupation | Male | Female |
| Sales & Related | 22 (14.8%) | 127 (85.2%) |
| Office & Administration | 1 (2.5%) | 39 (97.5%) |
| Total (Category) | 23 (12.2%) | 166 (87.8%) |
| Total (Overall) | 407 (47.8%) | 445 (52.2%) |
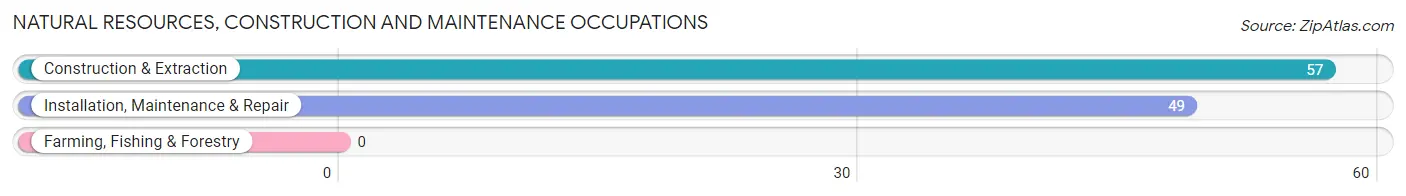
Natural Resources, Construction and Maintenance Occupations
The most common Natural Resources, Construction and Maintenance occupations in Saratoga are Construction & Extraction (57 | 6.7%), and Installation, Maintenance & Repair (49 | 5.8%).
Natural Resources, Construction and Maintenance Occupations by Sex
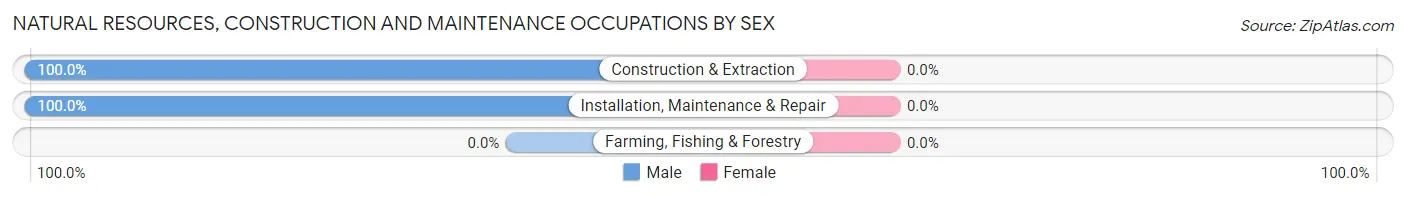
| Occupation | Male | Female |
| Farming, Fishing & Forestry | 0 (0.0%) | 0 (0.0%) |
| Construction & Extraction | 57 (100.0%) | 0 (0.0%) |
| Installation, Maintenance & Repair | 49 (100.0%) | 0 (0.0%) |
| Total (Category) | 106 (100.0%) | 0 (0.0%) |
| Total (Overall) | 407 (47.8%) | 445 (52.2%) |
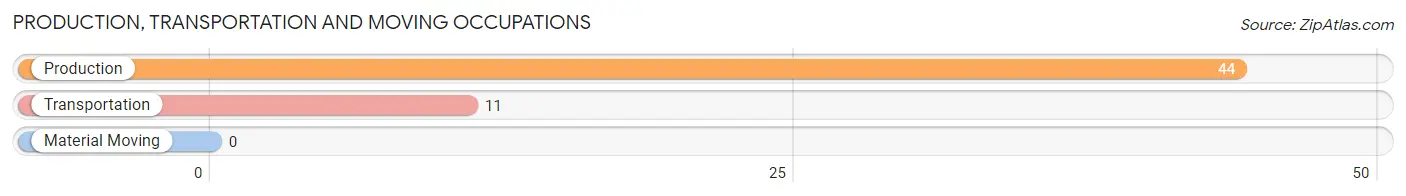
Production, Transportation and Moving Occupations
The most common Production, Transportation and Moving occupations in Saratoga are Production (44 | 5.2%), and Transportation (11 | 1.3%).
Production, Transportation and Moving Occupations by Sex
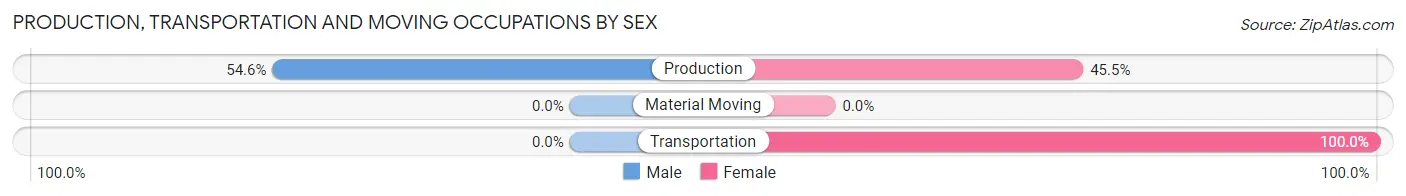
| Occupation | Male | Female |
| Production | 24 (54.5%) | 20 (45.5%) |
| Transportation | 0 (0.0%) | 11 (100.0%) |
| Material Moving | 0 (0.0%) | 0 (0.0%) |
| Total (Category) | 24 (43.6%) | 31 (56.4%) |
| Total (Overall) | 407 (47.8%) | 445 (52.2%) |
Employment Industries by Sex in Saratoga
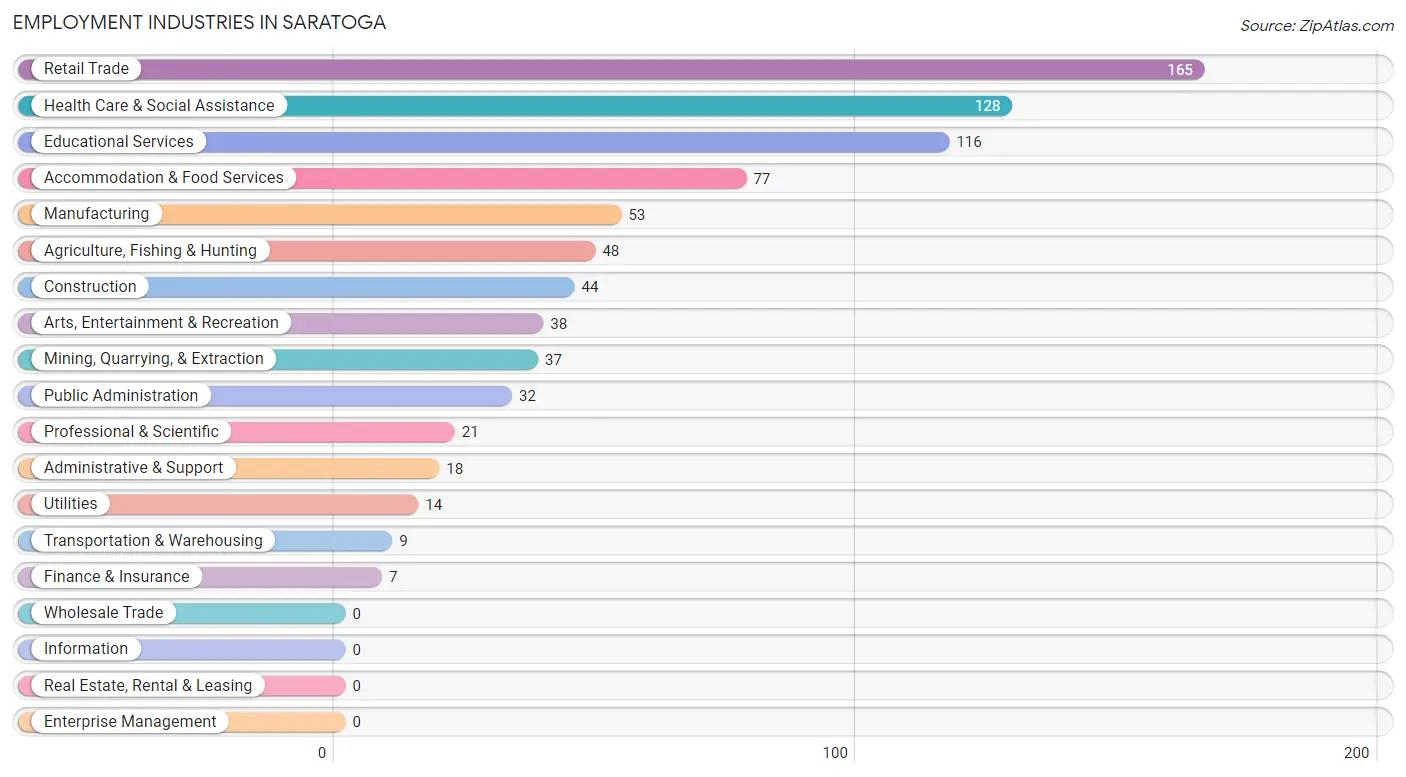
Employment Industries in Saratoga
The major employment industries in Saratoga include Retail Trade (165 | 19.4%), Health Care & Social Assistance (128 | 15.0%), Educational Services (116 | 13.6%), Accommodation & Food Services (77 | 9.0%), and Manufacturing (53 | 6.2%).
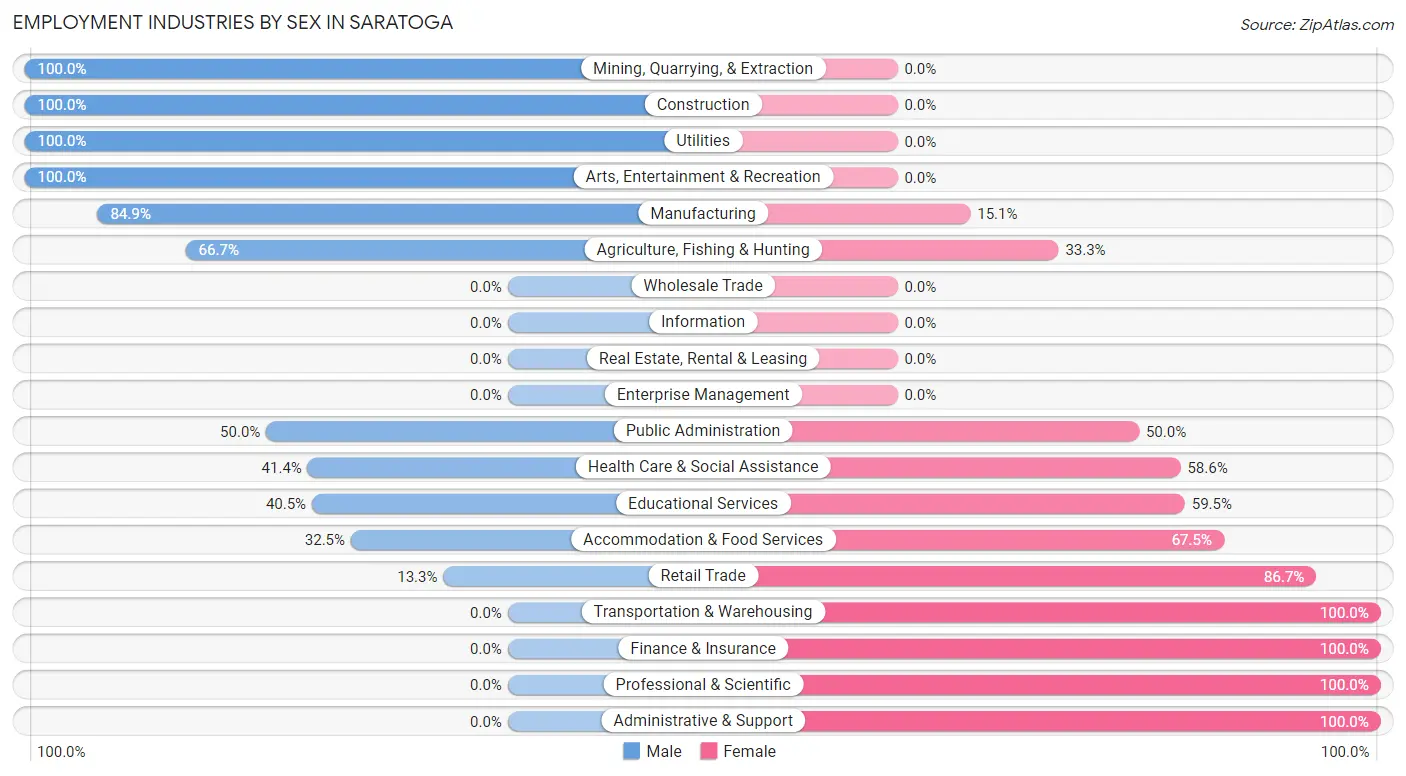
Employment Industries by Sex in Saratoga
The Saratoga industries that see more men than women are Mining, Quarrying, & Extraction (100.0%), Construction (100.0%), and Utilities (100.0%), whereas the industries that tend to have a higher number of women are Transportation & Warehousing (100.0%), Finance & Insurance (100.0%), and Professional & Scientific (100.0%).
| Industry | Male | Female |
| Agriculture, Fishing & Hunting | 32 (66.7%) | 16 (33.3%) |
| Mining, Quarrying, & Extraction | 37 (100.0%) | 0 (0.0%) |
| Construction | 44 (100.0%) | 0 (0.0%) |
| Manufacturing | 45 (84.9%) | 8 (15.1%) |
| Wholesale Trade | 0 (0.0%) | 0 (0.0%) |
| Retail Trade | 22 (13.3%) | 143 (86.7%) |
| Transportation & Warehousing | 0 (0.0%) | 9 (100.0%) |
| Utilities | 14 (100.0%) | 0 (0.0%) |
| Information | 0 (0.0%) | 0 (0.0%) |
| Finance & Insurance | 0 (0.0%) | 7 (100.0%) |
| Real Estate, Rental & Leasing | 0 (0.0%) | 0 (0.0%) |
| Professional & Scientific | 0 (0.0%) | 21 (100.0%) |
| Enterprise Management | 0 (0.0%) | 0 (0.0%) |
| Administrative & Support | 0 (0.0%) | 18 (100.0%) |
| Educational Services | 47 (40.5%) | 69 (59.5%) |
| Health Care & Social Assistance | 53 (41.4%) | 75 (58.6%) |
| Arts, Entertainment & Recreation | 38 (100.0%) | 0 (0.0%) |
| Accommodation & Food Services | 25 (32.5%) | 52 (67.5%) |
| Public Administration | 16 (50.0%) | 16 (50.0%) |
| Total | 407 (47.8%) | 445 (52.2%) |
Education in Saratoga
School Enrollment in Saratoga
The most common levels of schooling among the 350 students in Saratoga are elementary school (111 | 31.7%), college / undergraduate (104 | 29.7%), and high school (71 | 20.3%).
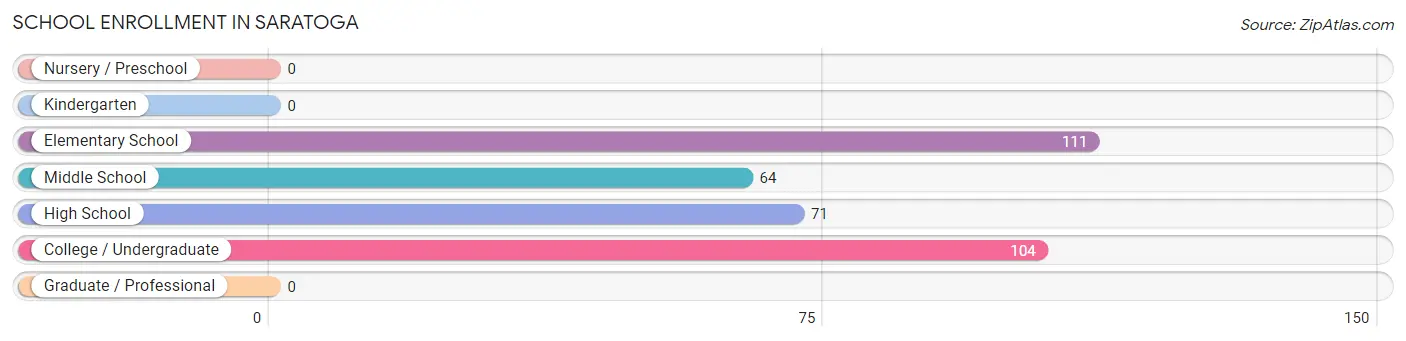
| School Level | # Students | % Students |
| Nursery / Preschool | 0 | 0.0% |
| Kindergarten | 0 | 0.0% |
| Elementary School | 111 | 31.7% |
| Middle School | 64 | 18.3% |
| High School | 71 | 20.3% |
| College / Undergraduate | 104 | 29.7% |
| Graduate / Professional | 0 | 0.0% |
| Total | 350 | 100.0% |
School Enrollment by Age by Funding Source in Saratoga
Out of a total of 350 students who are enrolled in schools in Saratoga, 28 (8.0%) attend a private institution, while the remaining 322 (92.0%) are enrolled in public schools. The age group of 25 to 34 year olds has the highest likelihood of being enrolled in private schools, with 14 (100.0% in the age bracket) enrolled. Conversely, the age group of 5 to 9 year old has the lowest likelihood of being enrolled in a private school, with 111 (100.0% in the age bracket) attending a public institution.
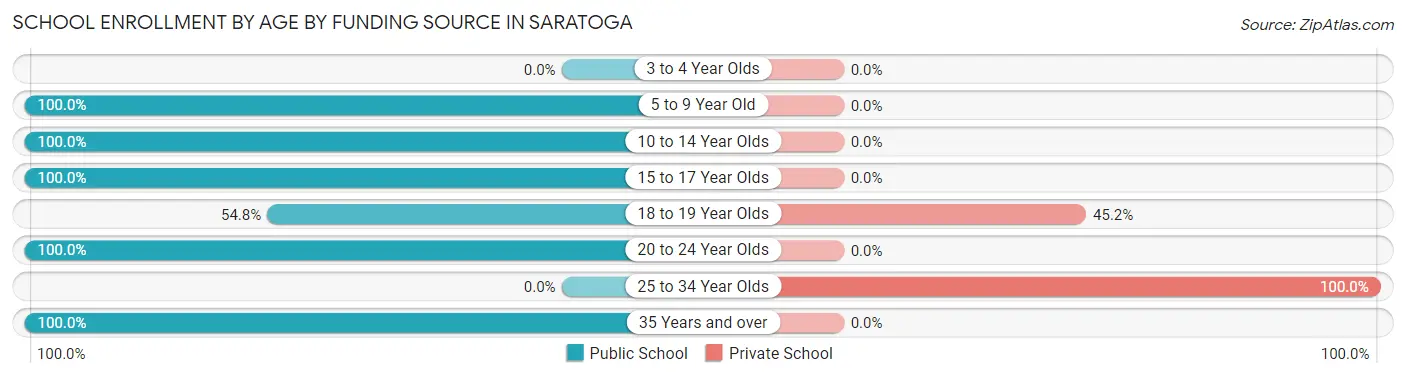
| Age Bracket | Public School | Private School |
| 3 to 4 Year Olds | 0 (0.0%) | 0 (0.0%) |
| 5 to 9 Year Old | 111 (100.0%) | 0 (0.0%) |
| 10 to 14 Year Olds | 64 (100.0%) | 0 (0.0%) |
| 15 to 17 Year Olds | 43 (100.0%) | 0 (0.0%) |
| 18 to 19 Year Olds | 17 (54.8%) | 14 (45.2%) |
| 20 to 24 Year Olds | 66 (100.0%) | 0 (0.0%) |
| 25 to 34 Year Olds | 0 (0.0%) | 14 (100.0%) |
| 35 Years and over | 21 (100.0%) | 0 (0.0%) |
| Total | 322 (92.0%) | 28 (8.0%) |
Educational Attainment by Field of Study in Saratoga
Engineering (83 | 21.5%), education (75 | 19.4%), bio, nature & agricultural (60 | 15.5%), business (46 | 11.9%), and arts & humanities (31 | 8.0%) are the most common fields of study among 386 individuals in Saratoga who have obtained a bachelor's degree or higher.
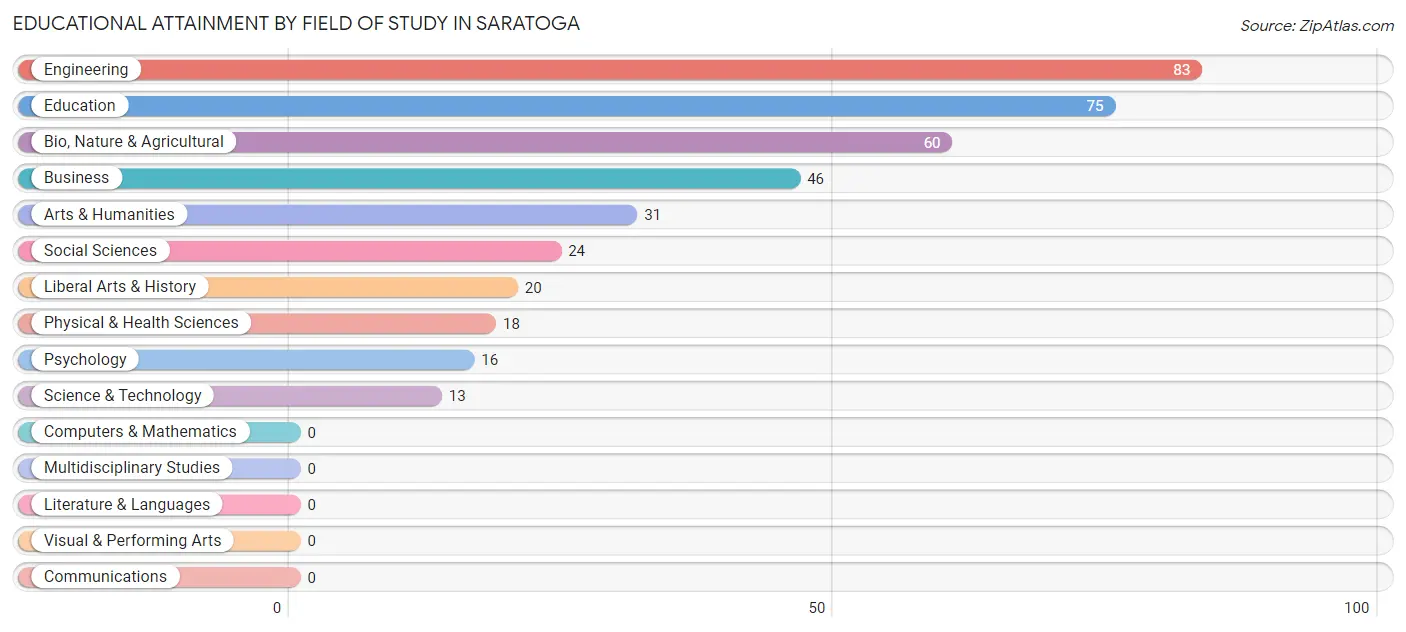
| Field of Study | # Graduates | % Graduates |
| Computers & Mathematics | 0 | 0.0% |
| Bio, Nature & Agricultural | 60 | 15.5% |
| Physical & Health Sciences | 18 | 4.7% |
| Psychology | 16 | 4.2% |
| Social Sciences | 24 | 6.2% |
| Engineering | 83 | 21.5% |
| Multidisciplinary Studies | 0 | 0.0% |
| Science & Technology | 13 | 3.4% |
| Business | 46 | 11.9% |
| Education | 75 | 19.4% |
| Literature & Languages | 0 | 0.0% |
| Liberal Arts & History | 20 | 5.2% |
| Visual & Performing Arts | 0 | 0.0% |
| Communications | 0 | 0.0% |
| Arts & Humanities | 31 | 8.0% |
| Total | 386 | 100.0% |
Transportation & Commute in Saratoga
Vehicle Availability by Sex in Saratoga
The most prevalent vehicle ownership categories in Saratoga are males with 3 vehicles (103, accounting for 26.1%) and females with 3 vehicles (141, making up 25.0%).
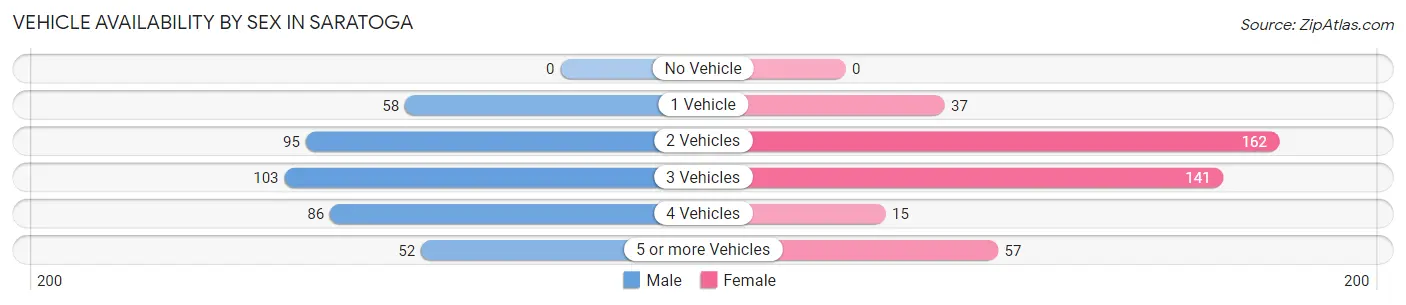
| Vehicles Available | Male | Female |
| No Vehicle | 0 (0.0%) | 0 (0.0%) |
| 1 Vehicle | 58 (14.7%) | 37 (9.0%) |
| 2 Vehicles | 95 (24.1%) | 162 (39.3%) |
| 3 Vehicles | 103 (26.1%) | 141 (34.2%) |
| 4 Vehicles | 86 (21.8%) | 15 (3.6%) |
| 5 or more Vehicles | 52 (13.2%) | 57 (13.8%) |
| Total | 394 (100.0%) | 412 (100.0%) |
Commute Time in Saratoga
The most frequently occuring commute durations in Saratoga are 5 to 9 minutes (342 commuters, 41.6%), 15 to 19 minutes (146 commuters, 17.8%), and 10 to 14 minutes (90 commuters, 11.0%).
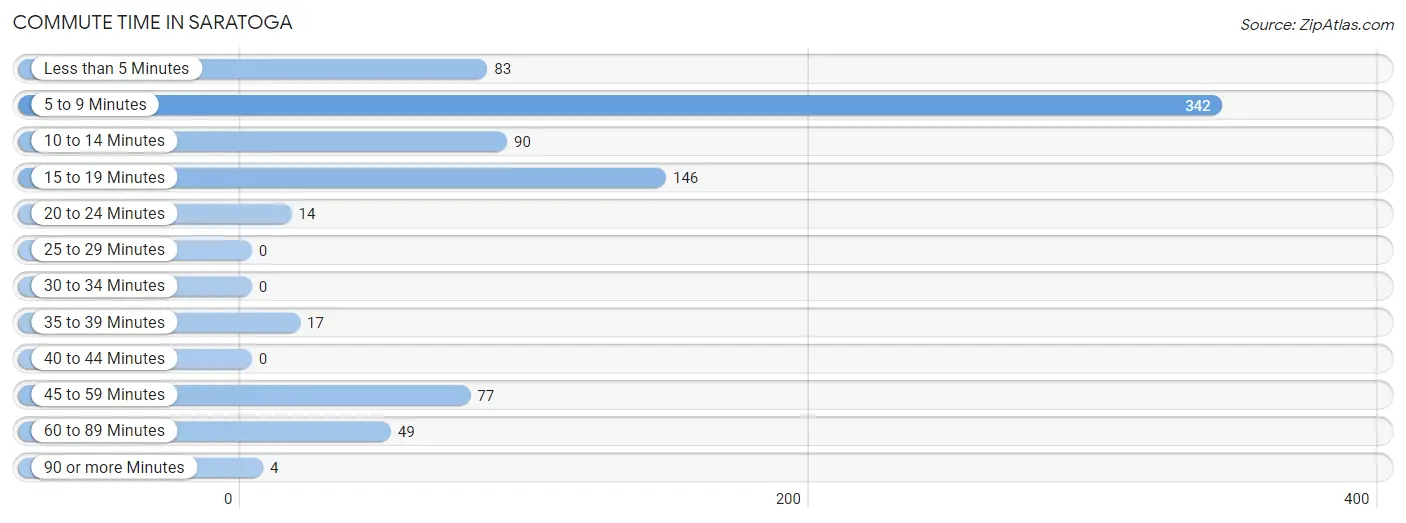
| Commute Time | # Commuters | % Commuters |
| Less than 5 Minutes | 83 | 10.1% |
| 5 to 9 Minutes | 342 | 41.6% |
| 10 to 14 Minutes | 90 | 11.0% |
| 15 to 19 Minutes | 146 | 17.8% |
| 20 to 24 Minutes | 14 | 1.7% |
| 25 to 29 Minutes | 0 | 0.0% |
| 30 to 34 Minutes | 0 | 0.0% |
| 35 to 39 Minutes | 17 | 2.1% |
| 40 to 44 Minutes | 0 | 0.0% |
| 45 to 59 Minutes | 77 | 9.4% |
| 60 to 89 Minutes | 49 | 6.0% |
| 90 or more Minutes | 4 | 0.5% |
Commute Time by Sex in Saratoga
The most common commute times in Saratoga are 5 to 9 minutes (108 commuters, 26.5%) for males and 5 to 9 minutes (234 commuters, 56.4%) for females.
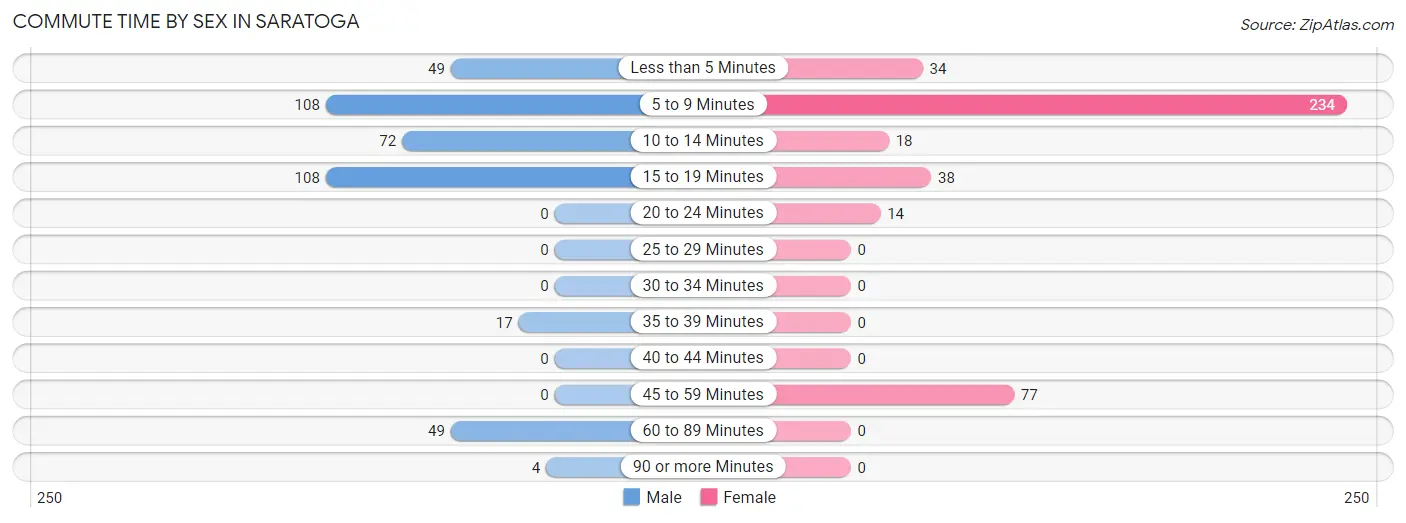
| Commute Time | Male | Female |
| Less than 5 Minutes | 49 (12.0%) | 34 (8.2%) |
| 5 to 9 Minutes | 108 (26.5%) | 234 (56.4%) |
| 10 to 14 Minutes | 72 (17.7%) | 18 (4.3%) |
| 15 to 19 Minutes | 108 (26.5%) | 38 (9.2%) |
| 20 to 24 Minutes | 0 (0.0%) | 14 (3.4%) |
| 25 to 29 Minutes | 0 (0.0%) | 0 (0.0%) |
| 30 to 34 Minutes | 0 (0.0%) | 0 (0.0%) |
| 35 to 39 Minutes | 17 (4.2%) | 0 (0.0%) |
| 40 to 44 Minutes | 0 (0.0%) | 0 (0.0%) |
| 45 to 59 Minutes | 0 (0.0%) | 77 (18.5%) |
| 60 to 89 Minutes | 49 (12.0%) | 0 (0.0%) |
| 90 or more Minutes | 4 (1.0%) | 0 (0.0%) |
Time of Departure to Work by Sex in Saratoga
The most frequent times of departure to work in Saratoga are 7:00 AM to 7:29 AM (79, 19.4%) for males and 9:00 AM to 9:59 AM (98, 23.6%) for females.
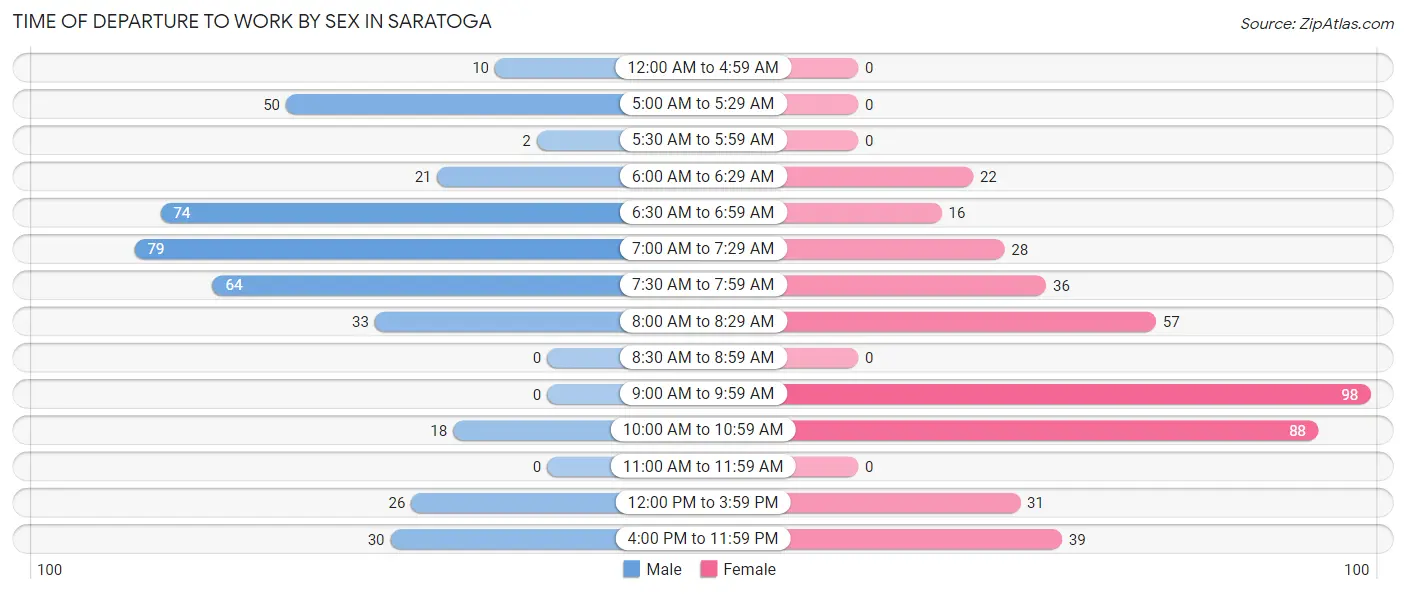
| Time of Departure | Male | Female |
| 12:00 AM to 4:59 AM | 10 (2.5%) | 0 (0.0%) |
| 5:00 AM to 5:29 AM | 50 (12.3%) | 0 (0.0%) |
| 5:30 AM to 5:59 AM | 2 (0.5%) | 0 (0.0%) |
| 6:00 AM to 6:29 AM | 21 (5.2%) | 22 (5.3%) |
| 6:30 AM to 6:59 AM | 74 (18.2%) | 16 (3.9%) |
| 7:00 AM to 7:29 AM | 79 (19.4%) | 28 (6.8%) |
| 7:30 AM to 7:59 AM | 64 (15.7%) | 36 (8.7%) |
| 8:00 AM to 8:29 AM | 33 (8.1%) | 57 (13.7%) |
| 8:30 AM to 8:59 AM | 0 (0.0%) | 0 (0.0%) |
| 9:00 AM to 9:59 AM | 0 (0.0%) | 98 (23.6%) |
| 10:00 AM to 10:59 AM | 18 (4.4%) | 88 (21.2%) |
| 11:00 AM to 11:59 AM | 0 (0.0%) | 0 (0.0%) |
| 12:00 PM to 3:59 PM | 26 (6.4%) | 31 (7.5%) |
| 4:00 PM to 11:59 PM | 30 (7.4%) | 39 (9.4%) |
| Total | 407 (100.0%) | 415 (100.0%) |
Housing Occupancy in Saratoga
Occupancy by Ownership in Saratoga
Of the total 696 dwellings in Saratoga, owner-occupied units account for 508 (73.0%), while renter-occupied units make up 188 (27.0%).
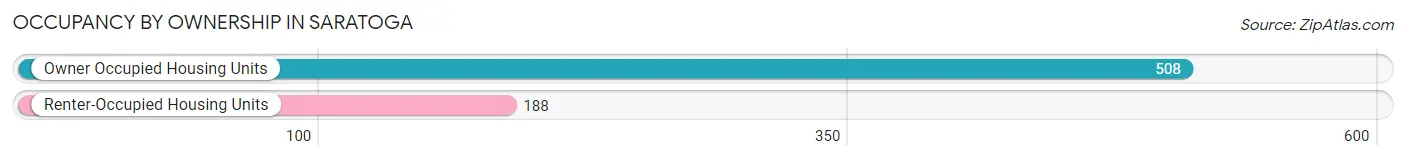
| Occupancy | # Housing Units | % Housing Units |
| Owner Occupied Housing Units | 508 | 73.0% |
| Renter-Occupied Housing Units | 188 | 27.0% |
| Total Occupied Housing Units | 696 | 100.0% |
Occupancy by Household Size in Saratoga
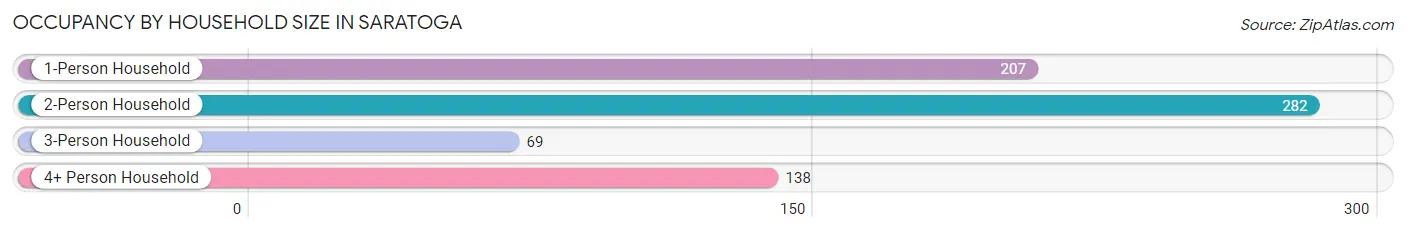
| Household Size | # Housing Units | % Housing Units |
| 1-Person Household | 207 | 29.7% |
| 2-Person Household | 282 | 40.5% |
| 3-Person Household | 69 | 9.9% |
| 4+ Person Household | 138 | 19.8% |
| Total Housing Units | 696 | 100.0% |
Occupancy by Ownership by Household Size in Saratoga
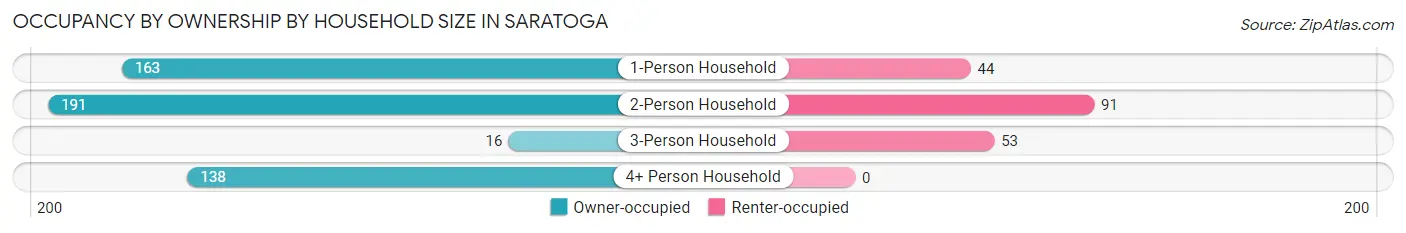
| Household Size | Owner-occupied | Renter-occupied |
| 1-Person Household | 163 (78.7%) | 44 (21.3%) |
| 2-Person Household | 191 (67.7%) | 91 (32.3%) |
| 3-Person Household | 16 (23.2%) | 53 (76.8%) |
| 4+ Person Household | 138 (100.0%) | 0 (0.0%) |
| Total Housing Units | 508 (73.0%) | 188 (27.0%) |
Occupancy by Educational Attainment in Saratoga
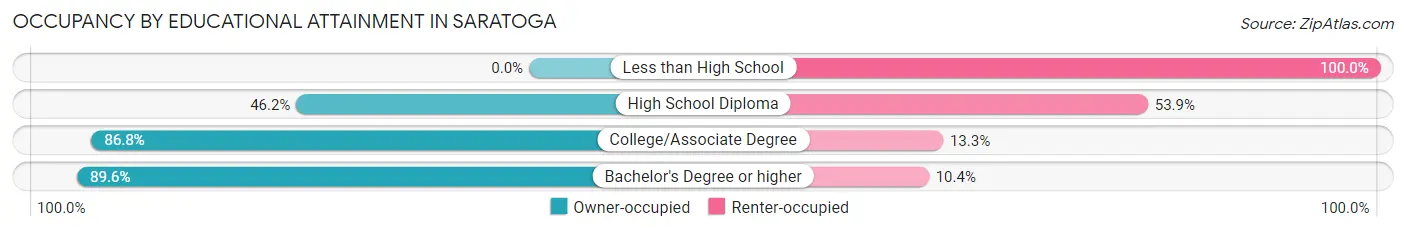
| Household Size | Owner-occupied | Renter-occupied |
| Less than High School | 0 (0.0%) | 58 (100.0%) |
| High School Diploma | 60 (46.2%) | 70 (53.8%) |
| College/Associate Degree | 216 (86.8%) | 33 (13.3%) |
| Bachelor's Degree or higher | 232 (89.6%) | 27 (10.4%) |
Occupancy by Age of Householder in Saratoga
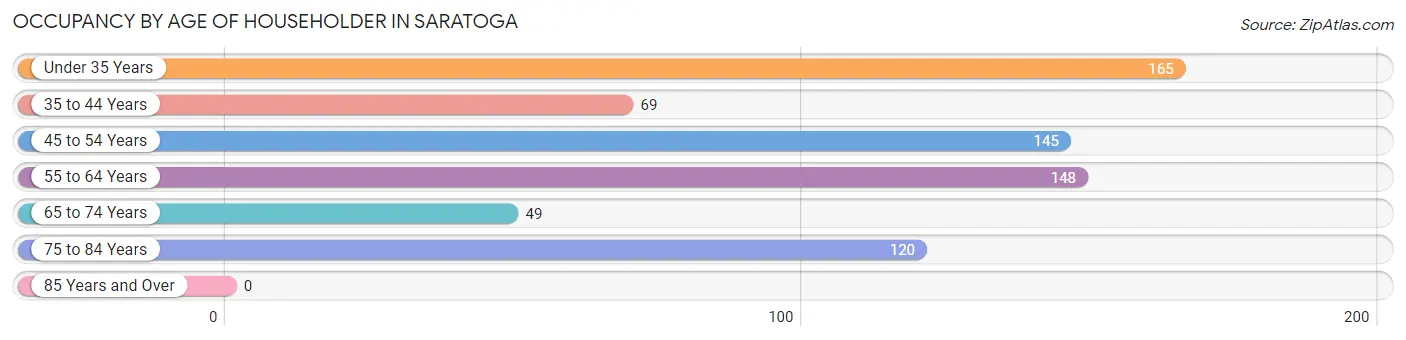
| Age Bracket | # Households | % Households |
| Under 35 Years | 165 | 23.7% |
| 35 to 44 Years | 69 | 9.9% |
| 45 to 54 Years | 145 | 20.8% |
| 55 to 64 Years | 148 | 21.3% |
| 65 to 74 Years | 49 | 7.0% |
| 75 to 84 Years | 120 | 17.2% |
| 85 Years and Over | 0 | 0.0% |
| Total | 696 | 100.0% |
Housing Finances in Saratoga
Median Income by Occupancy in Saratoga
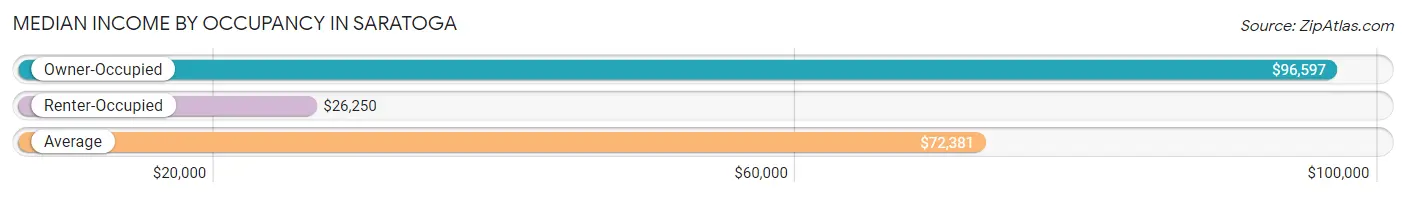
| Occupancy Type | # Households | Median Income |
| Owner-Occupied | 508 (73.0%) | $96,597 |
| Renter-Occupied | 188 (27.0%) | $26,250 |
| Average | 696 (100.0%) | $72,381 |
Occupancy by Householder Income Bracket in Saratoga
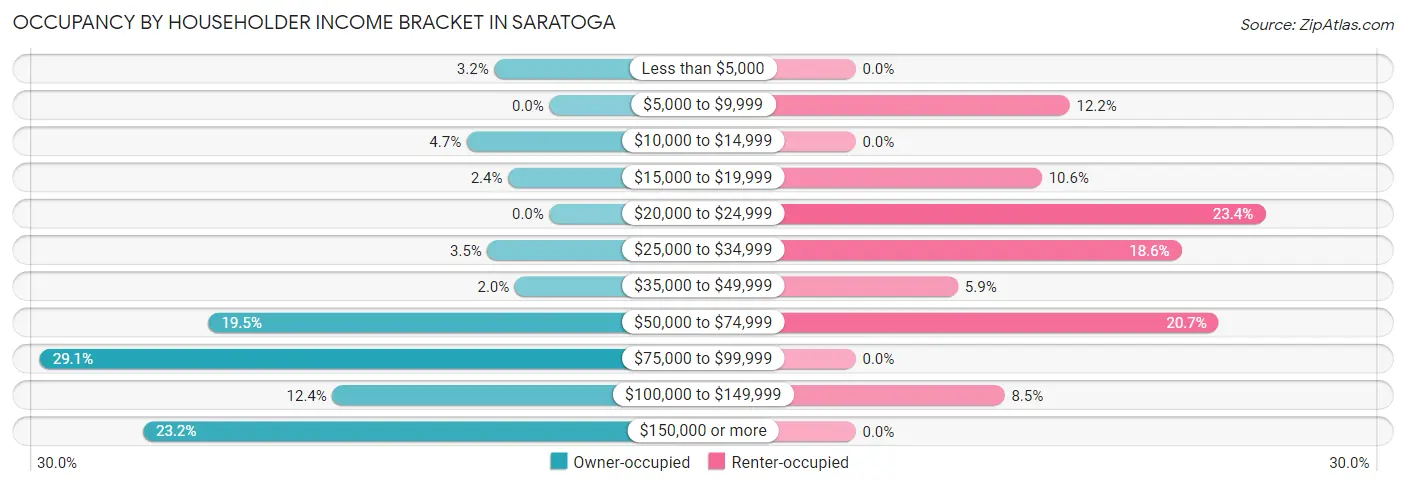
| Income Bracket | Owner-occupied | Renter-occupied |
| Less than $5,000 | 16 (3.2%) | 0 (0.0%) |
| $5,000 to $9,999 | 0 (0.0%) | 23 (12.2%) |
| $10,000 to $14,999 | 24 (4.7%) | 0 (0.0%) |
| $15,000 to $19,999 | 12 (2.4%) | 20 (10.6%) |
| $20,000 to $24,999 | 0 (0.0%) | 44 (23.4%) |
| $25,000 to $34,999 | 18 (3.5%) | 35 (18.6%) |
| $35,000 to $49,999 | 10 (2.0%) | 11 (5.9%) |
| $50,000 to $74,999 | 99 (19.5%) | 39 (20.7%) |
| $75,000 to $99,999 | 148 (29.1%) | 0 (0.0%) |
| $100,000 to $149,999 | 63 (12.4%) | 16 (8.5%) |
| $150,000 or more | 118 (23.2%) | 0 (0.0%) |
| Total | 508 (100.0%) | 188 (100.0%) |
Monthly Housing Cost Tiers in Saratoga
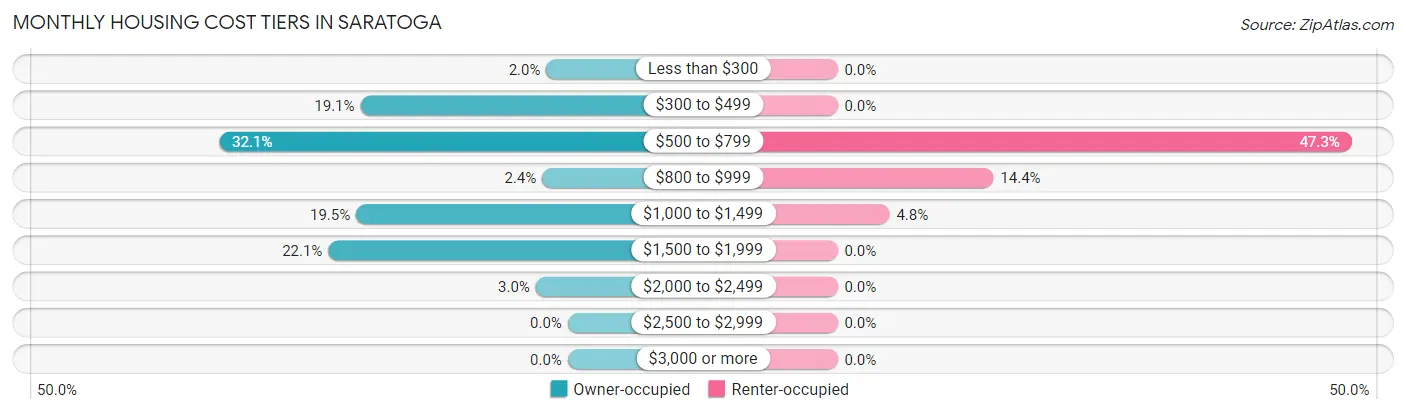
| Monthly Cost | Owner-occupied | Renter-occupied |
| Less than $300 | 10 (2.0%) | 0 (0.0%) |
| $300 to $499 | 97 (19.1%) | 0 (0.0%) |
| $500 to $799 | 163 (32.1%) | 89 (47.3%) |
| $800 to $999 | 12 (2.4%) | 27 (14.4%) |
| $1,000 to $1,499 | 99 (19.5%) | 9 (4.8%) |
| $1,500 to $1,999 | 112 (22.1%) | 0 (0.0%) |
| $2,000 to $2,499 | 15 (2.9%) | 0 (0.0%) |
| $2,500 to $2,999 | 0 (0.0%) | 0 (0.0%) |
| $3,000 or more | 0 (0.0%) | 0 (0.0%) |
| Total | 508 (100.0%) | 188 (100.0%) |
Physical Housing Characteristics in Saratoga
Housing Structures in Saratoga
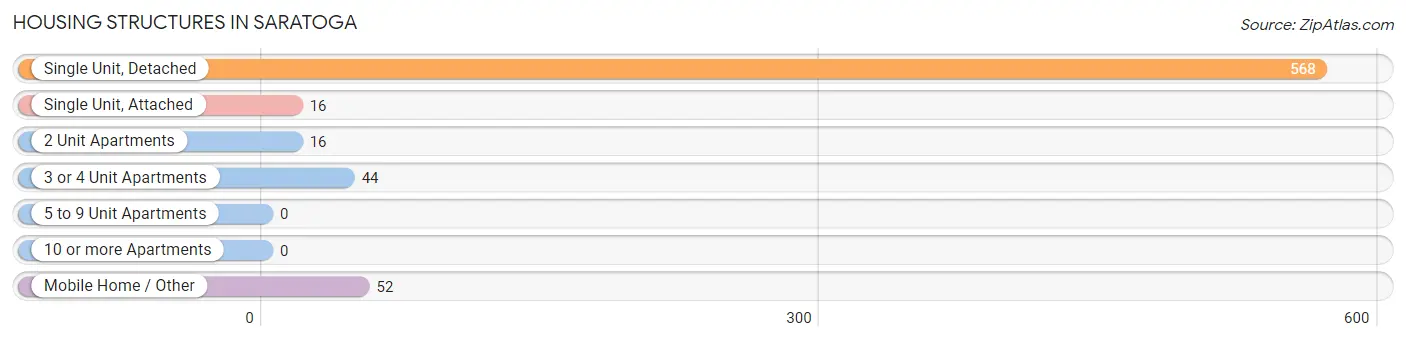
| Structure Type | # Housing Units | % Housing Units |
| Single Unit, Detached | 568 | 81.6% |
| Single Unit, Attached | 16 | 2.3% |
| 2 Unit Apartments | 16 | 2.3% |
| 3 or 4 Unit Apartments | 44 | 6.3% |
| 5 to 9 Unit Apartments | 0 | 0.0% |
| 10 or more Apartments | 0 | 0.0% |
| Mobile Home / Other | 52 | 7.5% |
| Total | 696 | 100.0% |
Housing Structures by Occupancy in Saratoga
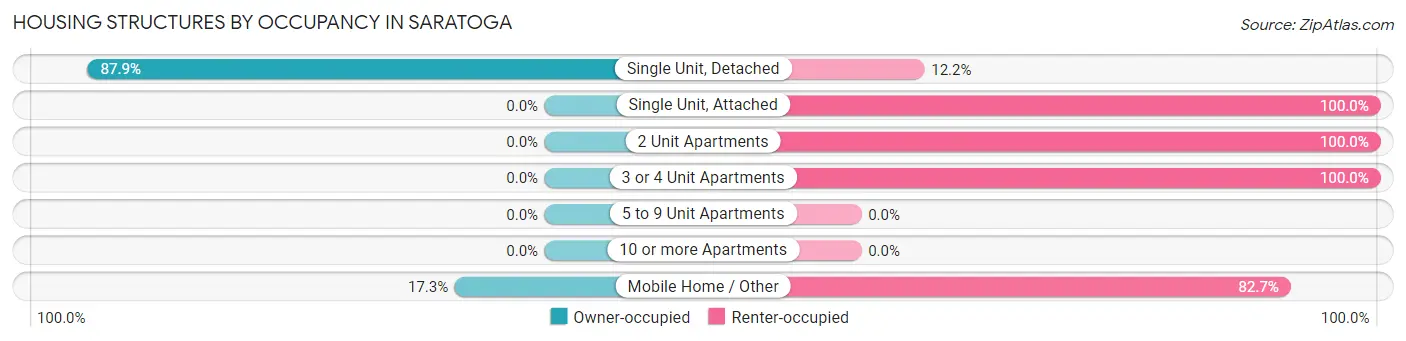
| Structure Type | Owner-occupied | Renter-occupied |
| Single Unit, Detached | 499 (87.8%) | 69 (12.1%) |
| Single Unit, Attached | 0 (0.0%) | 16 (100.0%) |
| 2 Unit Apartments | 0 (0.0%) | 16 (100.0%) |
| 3 or 4 Unit Apartments | 0 (0.0%) | 44 (100.0%) |
| 5 to 9 Unit Apartments | 0 (0.0%) | 0 (0.0%) |
| 10 or more Apartments | 0 (0.0%) | 0 (0.0%) |
| Mobile Home / Other | 9 (17.3%) | 43 (82.7%) |
| Total | 508 (73.0%) | 188 (27.0%) |
Housing Structures by Number of Rooms in Saratoga
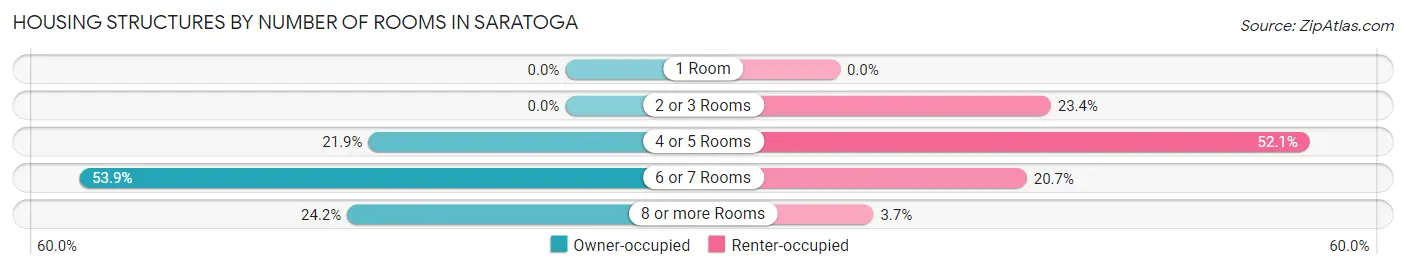
| Number of Rooms | Owner-occupied | Renter-occupied |
| 1 Room | 0 (0.0%) | 0 (0.0%) |
| 2 or 3 Rooms | 0 (0.0%) | 44 (23.4%) |
| 4 or 5 Rooms | 111 (21.8%) | 98 (52.1%) |
| 6 or 7 Rooms | 274 (53.9%) | 39 (20.7%) |
| 8 or more Rooms | 123 (24.2%) | 7 (3.7%) |
| Total | 508 (100.0%) | 188 (100.0%) |
Housing Structure by Heating Type in Saratoga
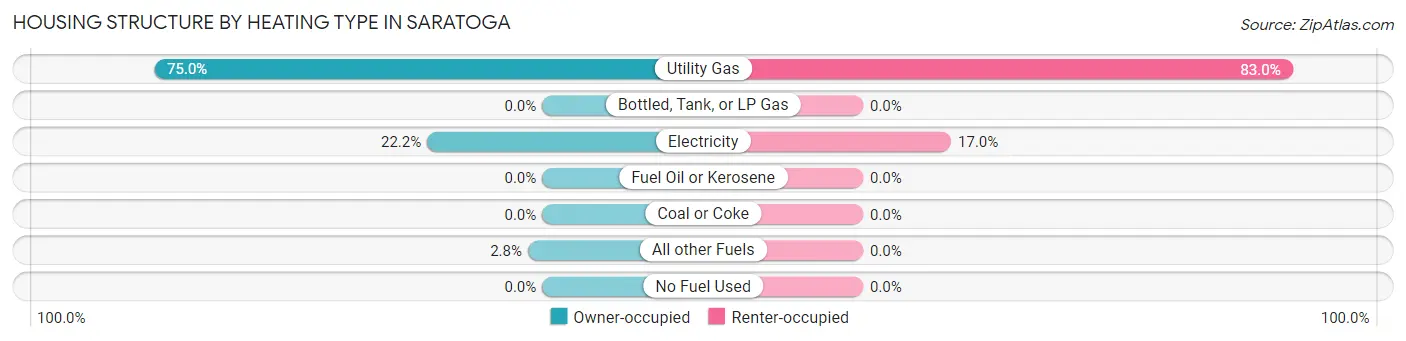
| Heating Type | Owner-occupied | Renter-occupied |
| Utility Gas | 381 (75.0%) | 156 (83.0%) |
| Bottled, Tank, or LP Gas | 0 (0.0%) | 0 (0.0%) |
| Electricity | 113 (22.2%) | 32 (17.0%) |
| Fuel Oil or Kerosene | 0 (0.0%) | 0 (0.0%) |
| Coal or Coke | 0 (0.0%) | 0 (0.0%) |
| All other Fuels | 14 (2.8%) | 0 (0.0%) |
| No Fuel Used | 0 (0.0%) | 0 (0.0%) |
| Total | 508 (100.0%) | 188 (100.0%) |
Household Vehicle Usage in Saratoga
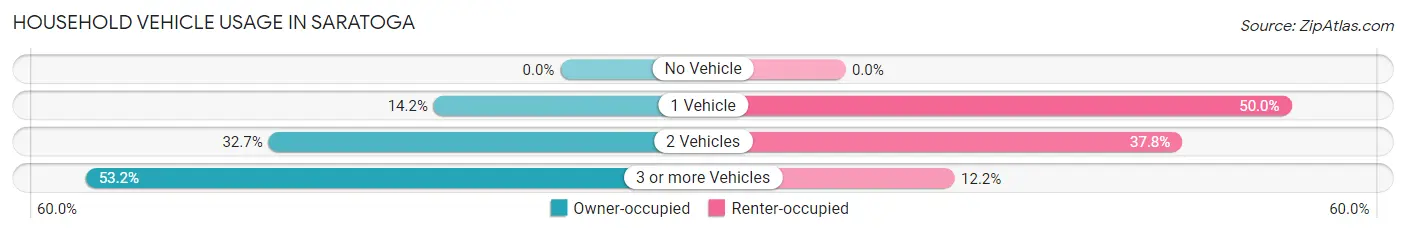
| Vehicles per Household | Owner-occupied | Renter-occupied |
| No Vehicle | 0 (0.0%) | 0 (0.0%) |
| 1 Vehicle | 72 (14.2%) | 94 (50.0%) |
| 2 Vehicles | 166 (32.7%) | 71 (37.8%) |
| 3 or more Vehicles | 270 (53.1%) | 23 (12.2%) |
| Total | 508 (100.0%) | 188 (100.0%) |
Real Estate & Mortgages in Saratoga
Real Estate and Mortgage Overview in Saratoga
| Characteristic | Without Mortgage | With Mortgage |
| Housing Units | 272 | 236 |
| Median Property Value | $245,600 | $270,100 |
| Median Household Income | $91,146 | $28 |
| Monthly Housing Costs | $524 | $0 |
| Real Estate Taxes | $1,352 | $0 |
Property Value by Mortgage Status in Saratoga
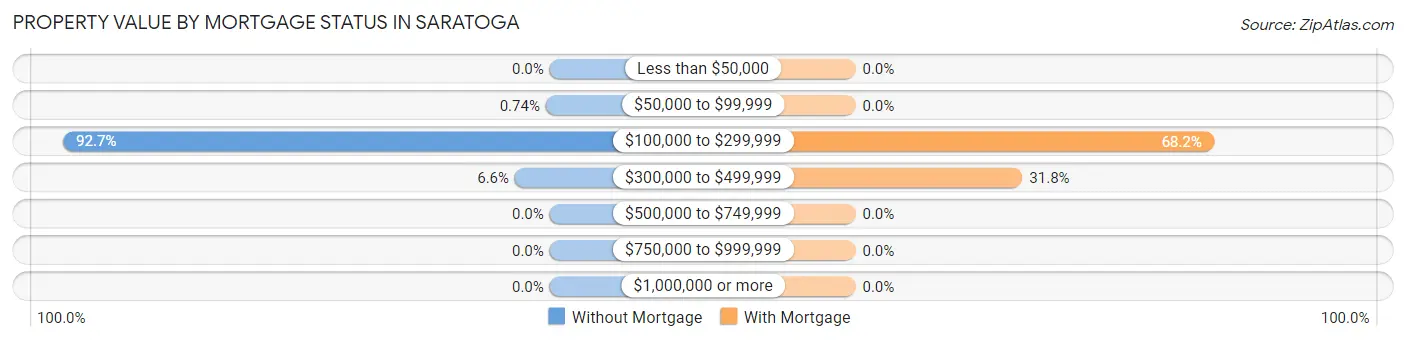
| Property Value | Without Mortgage | With Mortgage |
| Less than $50,000 | 0 (0.0%) | 0 (0.0%) |
| $50,000 to $99,999 | 2 (0.7%) | 0 (0.0%) |
| $100,000 to $299,999 | 252 (92.6%) | 161 (68.2%) |
| $300,000 to $499,999 | 18 (6.6%) | 75 (31.8%) |
| $500,000 to $749,999 | 0 (0.0%) | 0 (0.0%) |
| $750,000 to $999,999 | 0 (0.0%) | 0 (0.0%) |
| $1,000,000 or more | 0 (0.0%) | 0 (0.0%) |
| Total | 272 (100.0%) | 236 (100.0%) |
Household Income by Mortgage Status in Saratoga
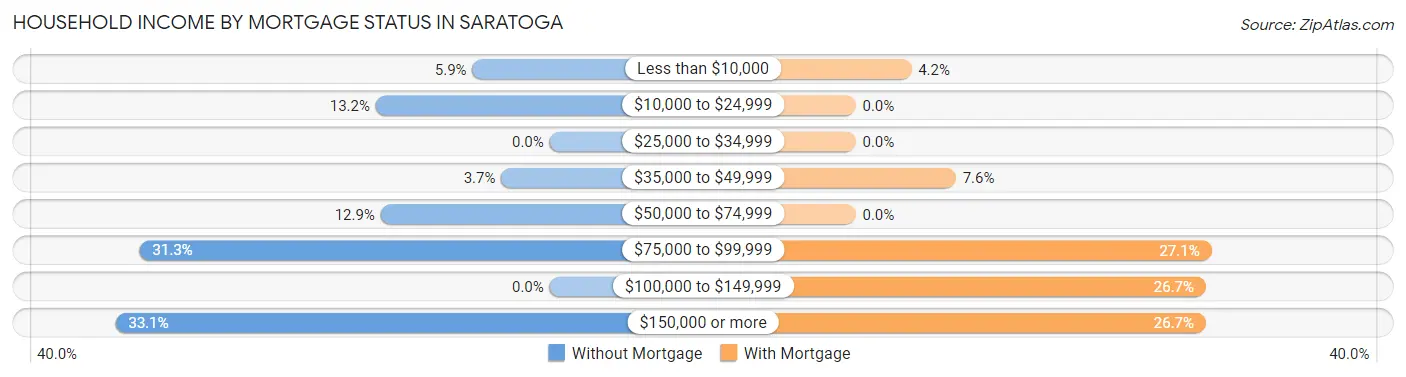
| Household Income | Without Mortgage | With Mortgage |
| Less than $10,000 | 16 (5.9%) | 10 (4.2%) |
| $10,000 to $24,999 | 36 (13.2%) | 0 (0.0%) |
| $25,000 to $34,999 | 0 (0.0%) | 0 (0.0%) |
| $35,000 to $49,999 | 10 (3.7%) | 18 (7.6%) |
| $50,000 to $74,999 | 35 (12.9%) | 0 (0.0%) |
| $75,000 to $99,999 | 85 (31.2%) | 64 (27.1%) |
| $100,000 to $149,999 | 0 (0.0%) | 63 (26.7%) |
| $150,000 or more | 90 (33.1%) | 63 (26.7%) |
| Total | 272 (100.0%) | 236 (100.0%) |
Property Value to Household Income Ratio in Saratoga
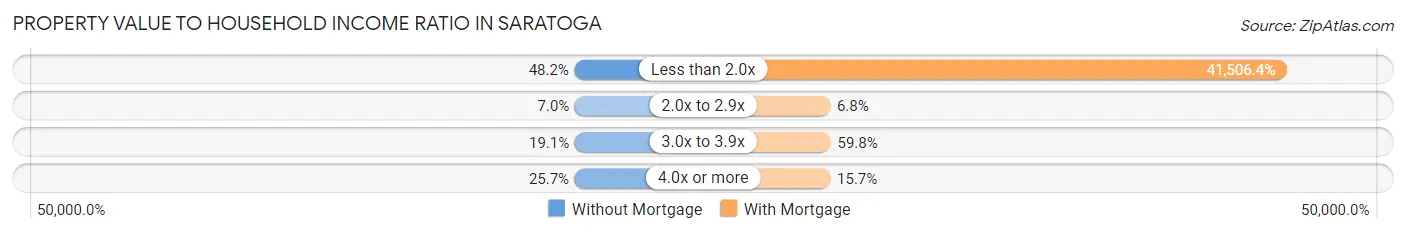
| Value-to-Income Ratio | Without Mortgage | With Mortgage |
| Less than 2.0x | 131 (48.2%) | 97,955 (41,506.4%) |
| 2.0x to 2.9x | 19 (7.0%) | 16 (6.8%) |
| 3.0x to 3.9x | 52 (19.1%) | 141 (59.8%) |
| 4.0x or more | 70 (25.7%) | 37 (15.7%) |
| Total | 272 (100.0%) | 236 (100.0%) |
Real Estate Taxes by Mortgage Status in Saratoga
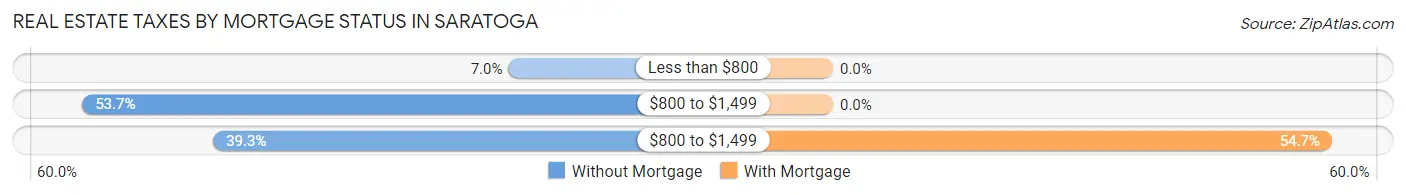
| Property Taxes | Without Mortgage | With Mortgage |
| Less than $800 | 19 (7.0%) | 0 (0.0%) |
| $800 to $1,499 | 146 (53.7%) | 0 (0.0%) |
| $800 to $1,499 | 107 (39.3%) | 129 (54.7%) |
| Total | 272 (100.0%) | 236 (100.0%) |
Health & Disability in Saratoga
Health Insurance Coverage by Age in Saratoga
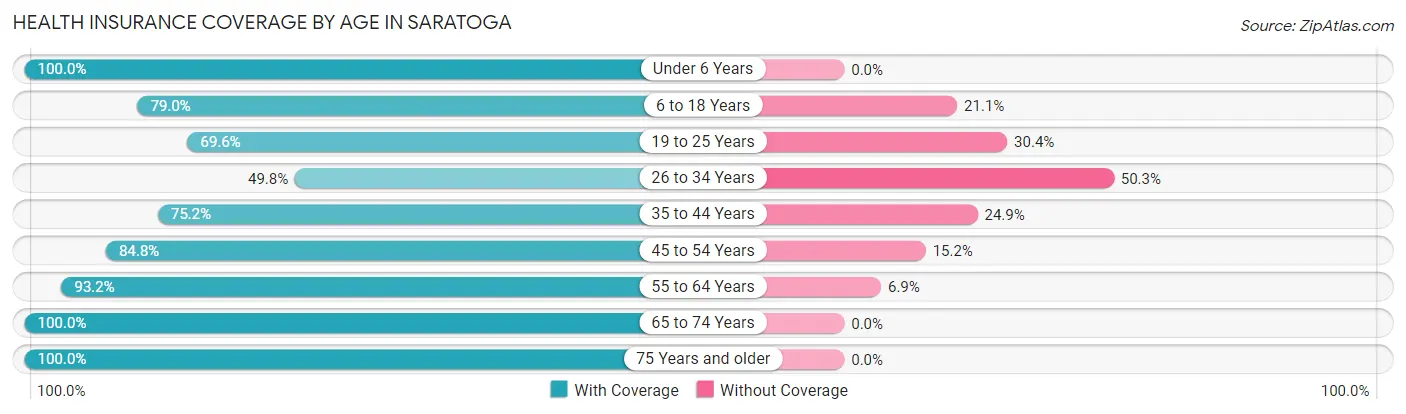
| Age Bracket | With Coverage | Without Coverage |
| Under 6 Years | 156 (100.0%) | 0 (0.0%) |
| 6 to 18 Years | 210 (78.9%) | 56 (21.0%) |
| 19 to 25 Years | 94 (69.6%) | 41 (30.4%) |
| 26 to 34 Years | 101 (49.7%) | 102 (50.2%) |
| 35 to 44 Years | 124 (75.1%) | 41 (24.8%) |
| 45 to 54 Years | 190 (84.8%) | 34 (15.2%) |
| 55 to 64 Years | 272 (93.1%) | 20 (6.9%) |
| 65 to 74 Years | 110 (100.0%) | 0 (0.0%) |
| 75 Years and older | 146 (100.0%) | 0 (0.0%) |
| Total | 1,403 (82.7%) | 294 (17.3%) |
Health Insurance Coverage by Citizenship Status in Saratoga
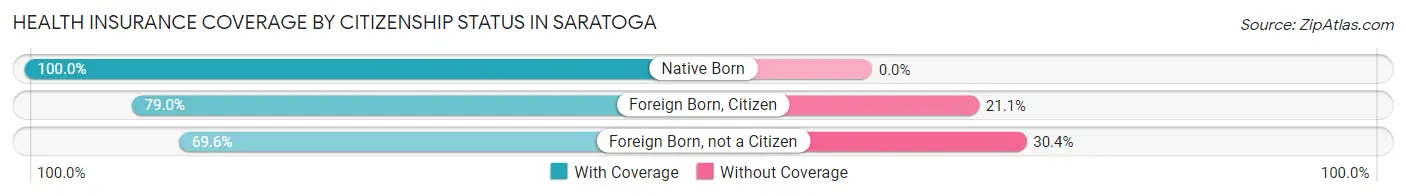
| Citizenship Status | With Coverage | Without Coverage |
| Native Born | 156 (100.0%) | 0 (0.0%) |
| Foreign Born, Citizen | 210 (78.9%) | 56 (21.0%) |
| Foreign Born, not a Citizen | 94 (69.6%) | 41 (30.4%) |
Health Insurance Coverage by Household Income in Saratoga
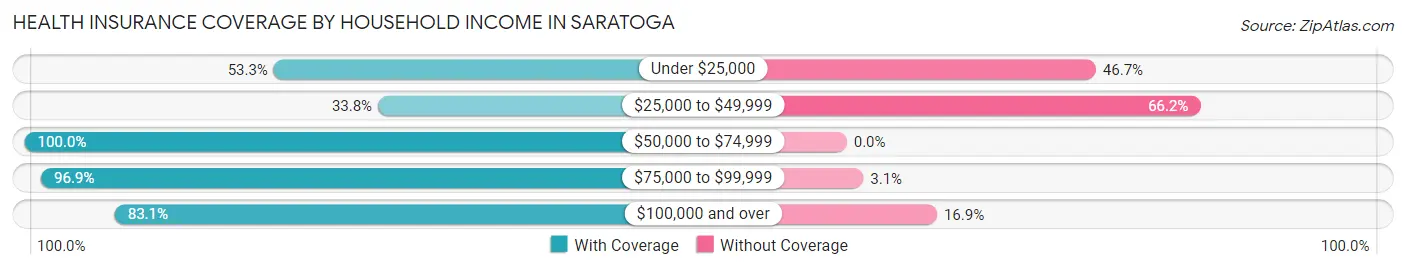
| Household Income | With Coverage | Without Coverage |
| Under $25,000 | 112 (53.3%) | 98 (46.7%) |
| $25,000 to $49,999 | 48 (33.8%) | 94 (66.2%) |
| $50,000 to $74,999 | 406 (100.0%) | 0 (0.0%) |
| $75,000 to $99,999 | 407 (96.9%) | 13 (3.1%) |
| $100,000 and over | 418 (83.1%) | 85 (16.9%) |
Public vs Private Health Insurance Coverage by Age in Saratoga
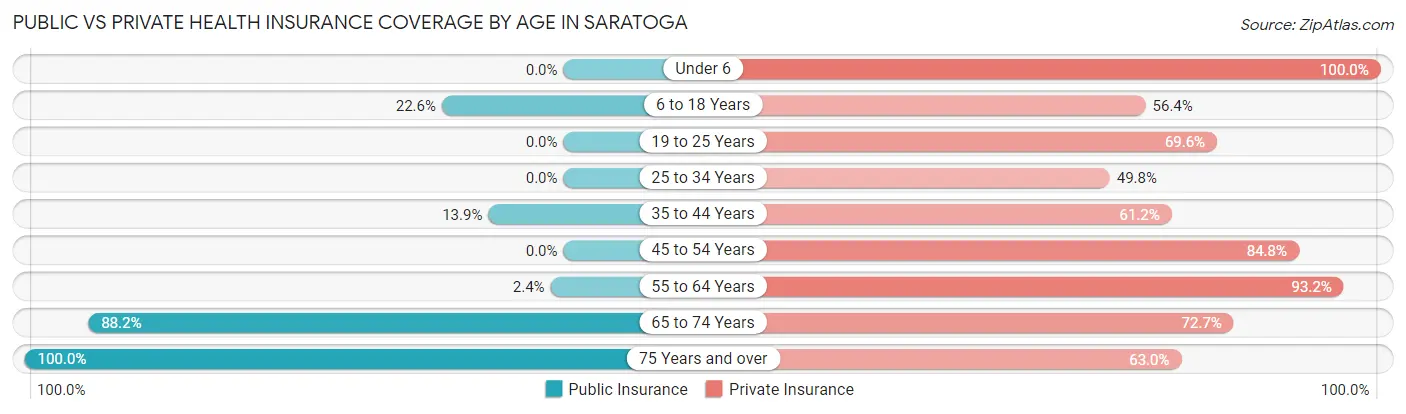
| Age Bracket | Public Insurance | Private Insurance |
| Under 6 | 0 (0.0%) | 156 (100.0%) |
| 6 to 18 Years | 60 (22.6%) | 150 (56.4%) |
| 19 to 25 Years | 0 (0.0%) | 94 (69.6%) |
| 25 to 34 Years | 0 (0.0%) | 101 (49.7%) |
| 35 to 44 Years | 23 (13.9%) | 101 (61.2%) |
| 45 to 54 Years | 0 (0.0%) | 190 (84.8%) |
| 55 to 64 Years | 7 (2.4%) | 272 (93.1%) |
| 65 to 74 Years | 97 (88.2%) | 80 (72.7%) |
| 75 Years and over | 146 (100.0%) | 92 (63.0%) |
| Total | 333 (19.6%) | 1,236 (72.8%) |
Disability Status by Sex by Age in Saratoga
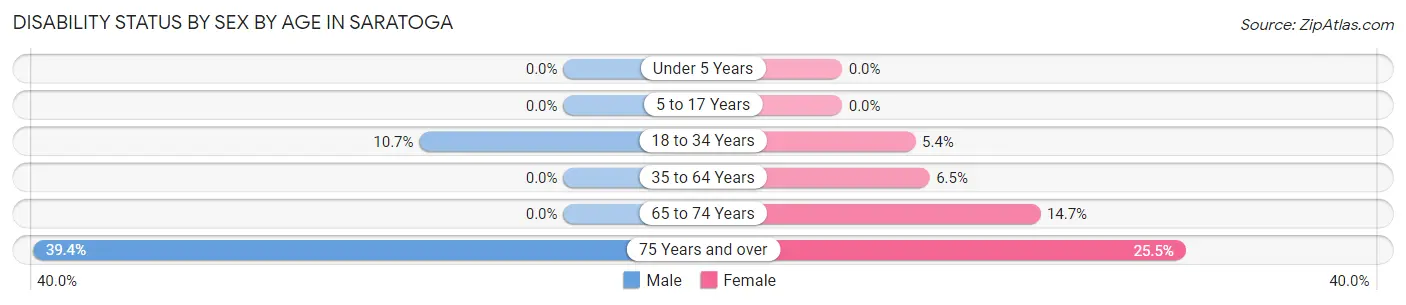
| Age Bracket | Male | Female |
| Under 5 Years | 0 (0.0%) | 0 (0.0%) |
| 5 to 17 Years | 0 (0.0%) | 0 (0.0%) |
| 18 to 34 Years | 14 (10.7%) | 13 (5.4%) |
| 35 to 64 Years | 0 (0.0%) | 24 (6.5%) |
| 65 to 74 Years | 0 (0.0%) | 10 (14.7%) |
| 75 Years and over | 39 (39.4%) | 12 (25.5%) |
Disability Class by Sex by Age in Saratoga
Disability Class: Hearing Difficulty
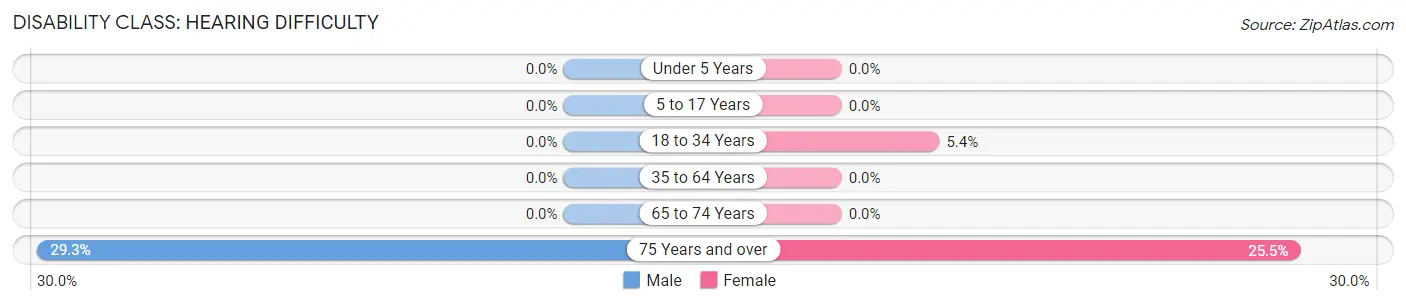
| Age Bracket | Male | Female |
| Under 5 Years | 0 (0.0%) | 0 (0.0%) |
| 5 to 17 Years | 0 (0.0%) | 0 (0.0%) |
| 18 to 34 Years | 0 (0.0%) | 13 (5.4%) |
| 35 to 64 Years | 0 (0.0%) | 0 (0.0%) |
| 65 to 74 Years | 0 (0.0%) | 0 (0.0%) |
| 75 Years and over | 29 (29.3%) | 12 (25.5%) |
Disability Class: Vision Difficulty
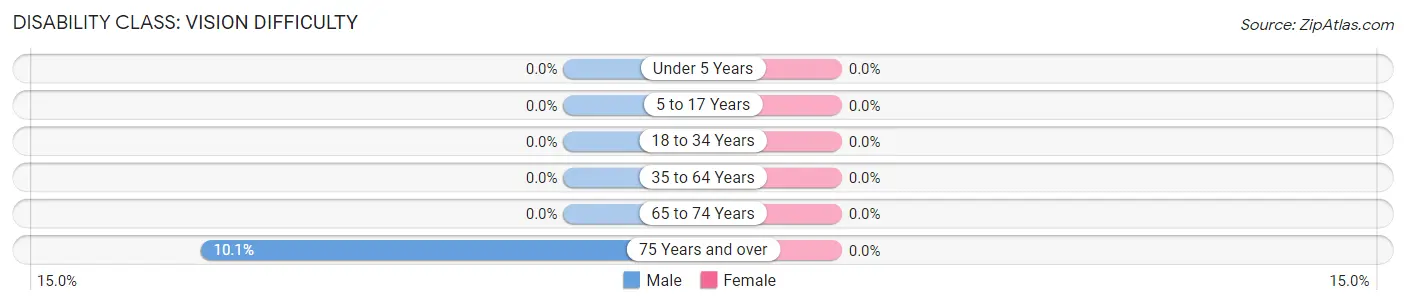
| Age Bracket | Male | Female |
| Under 5 Years | 0 (0.0%) | 0 (0.0%) |
| 5 to 17 Years | 0 (0.0%) | 0 (0.0%) |
| 18 to 34 Years | 0 (0.0%) | 0 (0.0%) |
| 35 to 64 Years | 0 (0.0%) | 0 (0.0%) |
| 65 to 74 Years | 0 (0.0%) | 0 (0.0%) |
| 75 Years and over | 10 (10.1%) | 0 (0.0%) |
Disability Class: Cognitive Difficulty
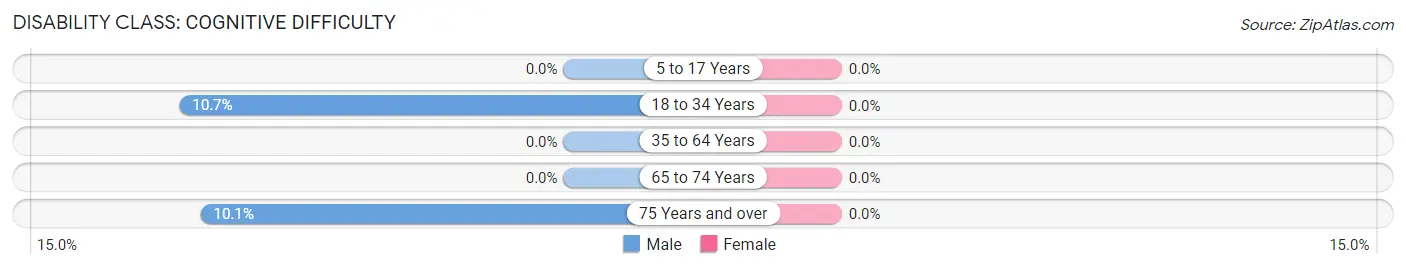
| Age Bracket | Male | Female |
| 5 to 17 Years | 0 (0.0%) | 0 (0.0%) |
| 18 to 34 Years | 14 (10.7%) | 0 (0.0%) |
| 35 to 64 Years | 0 (0.0%) | 0 (0.0%) |
| 65 to 74 Years | 0 (0.0%) | 0 (0.0%) |
| 75 Years and over | 10 (10.1%) | 0 (0.0%) |
Disability Class: Ambulatory Difficulty
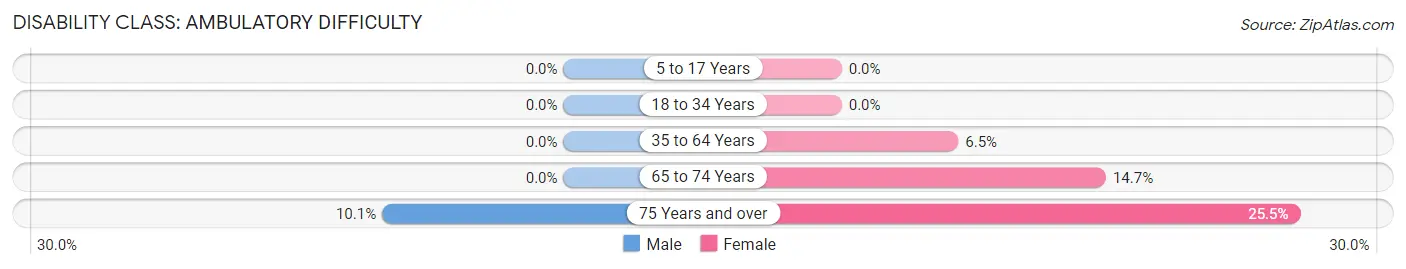
| Age Bracket | Male | Female |
| 5 to 17 Years | 0 (0.0%) | 0 (0.0%) |
| 18 to 34 Years | 0 (0.0%) | 0 (0.0%) |
| 35 to 64 Years | 0 (0.0%) | 24 (6.5%) |
| 65 to 74 Years | 0 (0.0%) | 10 (14.7%) |
| 75 Years and over | 10 (10.1%) | 12 (25.5%) |
Disability Class: Self-Care Difficulty
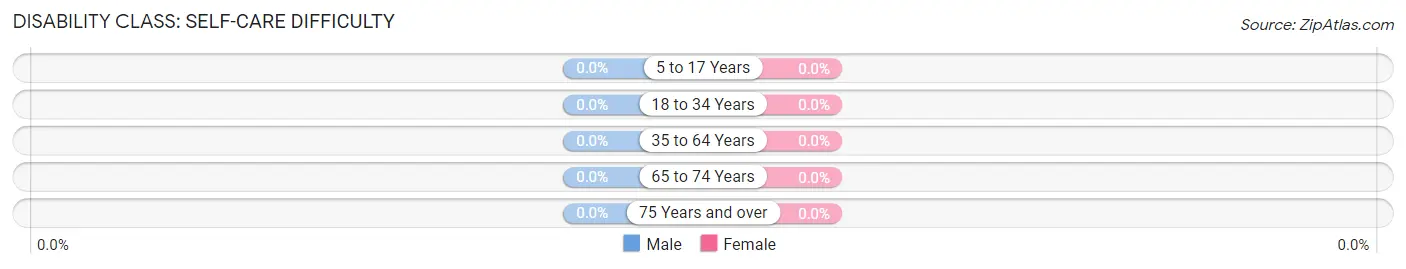
| Age Bracket | Male | Female |
| 5 to 17 Years | 0 (0.0%) | 0 (0.0%) |
| 18 to 34 Years | 0 (0.0%) | 0 (0.0%) |
| 35 to 64 Years | 0 (0.0%) | 0 (0.0%) |
| 65 to 74 Years | 0 (0.0%) | 0 (0.0%) |
| 75 Years and over | 0 (0.0%) | 0 (0.0%) |
Technology Access in Saratoga
Computing Device Access in Saratoga
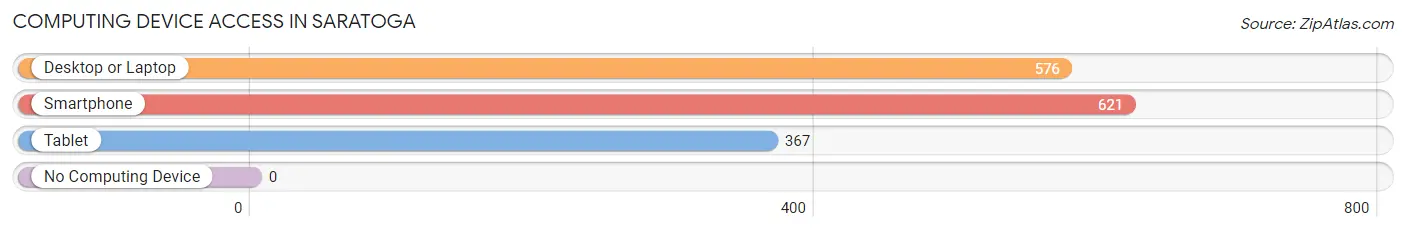
| Device Type | # Households | % Households |
| Desktop or Laptop | 576 | 82.8% |
| Smartphone | 621 | 89.2% |
| Tablet | 367 | 52.7% |
| No Computing Device | 0 | 0.0% |
| Total | 696 | 100.0% |
Internet Access in Saratoga
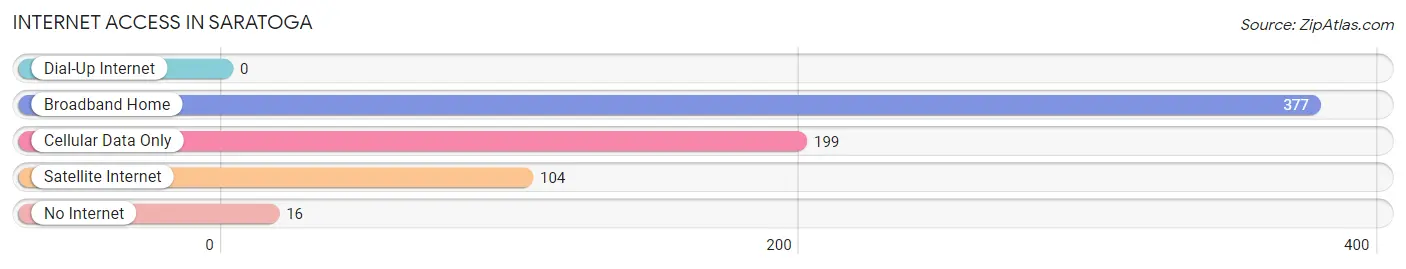
| Internet Type | # Households | % Households |
| Dial-Up Internet | 0 | 0.0% |
| Broadband Home | 377 | 54.2% |
| Cellular Data Only | 199 | 28.6% |
| Satellite Internet | 104 | 14.9% |
| No Internet | 16 | 2.3% |
| Total | 696 | 100.0% |
Saratoga Summary
Saratoga is a small town located in Carbon County, Wyoming, United States. It is situated in the Platte Valley of the North Platte River, approximately 30 miles south of Rawlins and 60 miles north of Laramie. The town was founded in 1884 and incorporated in 1905. As of the 2010 census, the population of Saratoga was 1,690.
History
Saratoga was founded in 1884 by a group of settlers from the nearby town of Rawlins. The settlers were looking for a place to settle and start a new life. The town was named after the nearby Saratoga Springs, which were discovered by the settlers. The springs were believed to have healing properties and were a popular destination for travelers.
The town quickly grew and by 1890, it had a population of over 500. The town was incorporated in 1905 and the first mayor was elected in 1906.
In the early 1900s, Saratoga was a bustling town with a variety of businesses, including a hotel, a bank, a newspaper, a theater, and a variety of stores. The town was also home to a number of saloons and gambling halls.
In the 1920s, the town began to decline as the railroad bypassed it and the population began to dwindle. The town was further impacted by the Great Depression and World War II.
In the 1950s, the town began to experience a resurgence as the oil and gas industry began to boom in the area. The town was also home to a number of uranium mines, which provided jobs for many of the town’s residents.
Geography
Saratoga is located in the Platte Valley of the North Platte River, approximately 30 miles south of Rawlins and 60 miles north of Laramie. The town is situated at an elevation of 6,845 feet and covers an area of 1.2 square miles.
The town is surrounded by the Medicine Bow National Forest and is located near the Snowy Range Mountains. The town is also located near the Saratoga Hot Springs, which are believed to have healing properties.
Economy
The economy of Saratoga is largely based on the oil and gas industry. The town is home to a number of oil and gas companies, including Anadarko Petroleum Corporation, Chevron Corporation, and Marathon Oil Corporation.
The town is also home to a number of uranium mines, which provide jobs for many of the town’s residents.
In addition to the oil and gas industry, Saratoga is home to a number of businesses, including restaurants, hotels, and retail stores. The town is also home to a number of tourist attractions, including the Saratoga Hot Springs and the Medicine Bow National Forest.
Demographics
As of the 2010 census, the population of Saratoga was 1,690. The racial makeup of the town was 95.3% White, 0.6% African American, 0.6% Native American, 0.3% Asian, 0.1% Pacific Islander, 1.2% from other races, and 2.3% from two or more races. Hispanic or Latino of any race were 4.2% of the population.
The median income for a household in the town was $41,250 and the median income for a family was $50,000. The per capita income for the town was $20,945. About 11.2% of families and 14.2% of the population were below the poverty line, including 18.2% of those under age 18 and 8.3% of those age 65 or over.
Common Questions
What is Per Capita Income in Saratoga?
Per Capita income in Saratoga is $37,103.
What is the Median Family Income in Saratoga?
Median Family Income in Saratoga is $86,513.
What is the Median Household income in Saratoga?
Median Household Income in Saratoga is $72,381.
What is Income or Wage Gap in Saratoga?
Income or Wage Gap in Saratoga is 57.3%.
Women in Saratoga earn 42.7 cents for every dollar earned by a man.
What is Inequality or Gini Index in Saratoga?
Inequality or Gini Index in Saratoga is 0.40.
What is the Total Population of Saratoga?
Total Population of Saratoga is 1,715.
What is the Total Male Population of Saratoga?
Total Male Population of Saratoga is 772.
What is the Total Female Population of Saratoga?
Total Female Population of Saratoga is 943.
What is the Ratio of Males per 100 Females in Saratoga?
There are 81.87 Males per 100 Females in Saratoga.
What is the Ratio of Females per 100 Males in Saratoga?
There are 122.15 Females per 100 Males in Saratoga.
What is the Median Population Age in Saratoga?
Median Population Age in Saratoga is 41.2 Years.
What is the Average Family Size in Saratoga
Average Family Size in Saratoga is 2.8 People.
What is the Average Household Size in Saratoga
Average Household Size in Saratoga is 2.4 People.
How Large is the Labor Force in Saratoga?
There are 852 People in the Labor Forcein in Saratoga.
What is the Percentage of People in the Labor Force in Saratoga?
63.1% of People are in the Labor Force in Saratoga.