Coburg, OR Map & Demographics
Coburg Map
Coburg Overview
$36,371
PER CAPITA INCOME
$81,607
AVG FAMILY INCOME
$79,732
AVG HOUSEHOLD INCOME
36.4%
WAGE / INCOME GAP [ % ]
63.6¢/ $1
WAGE / INCOME GAP [ $ ]
0.44
INEQUALITY / GINI INDEX
1,539
TOTAL POPULATION
653
MALE POPULATION
886
FEMALE POPULATION
73.70
MALES / 100 FEMALES
135.68
FEMALES / 100 MALES
37.9
MEDIAN AGE
3.6
AVG FAMILY SIZE
3.1
AVG HOUSEHOLD SIZE
667
LABOR FORCE [ PEOPLE ]
57.1%
PERCENT IN LABOR FORCE
12.4%
UNEMPLOYMENT RATE
Coburg Area Codes
Income in Coburg
Income Overview in Coburg
Per Capita Income in Coburg is $36,371, while median incomes of families and households are $81,607 and $79,732 respectively.
| Characteristic | Number | Measure |
| Per Capita Income | 1,539 | $36,371 |
| Median Family Income | 351 | $81,607 |
| Mean Family Income | 351 | $121,201 |
| Median Household Income | 497 | $79,732 |
| Mean Household Income | 497 | $106,820 |
| Income Deficit | 351 | $0 |
| Wage / Income Gap (%) | 1,539 | 36.39% |
| Wage / Income Gap ($) | 1,539 | 63.61¢ per $1 |
| Gini / Inequality Index | 1,539 | 0.44 |
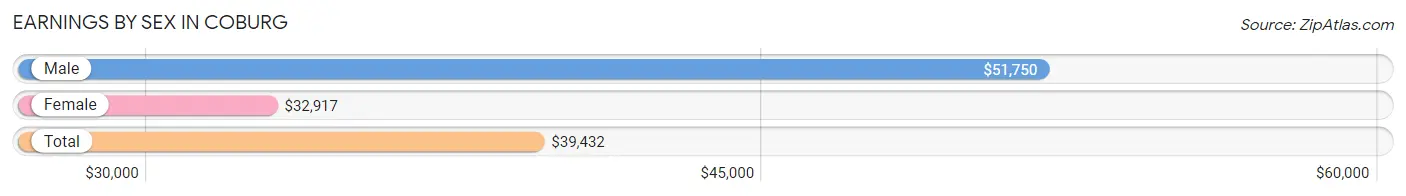
Earnings by Sex in Coburg
Average Earnings in Coburg are $39,432, $51,750 for men and $32,917 for women, a difference of 36.4%.
| Sex | Number | Average Earnings |
| Male | 369 (52.9%) | $51,750 |
| Female | 329 (47.1%) | $32,917 |
| Total | 698 (100.0%) | $39,432 |
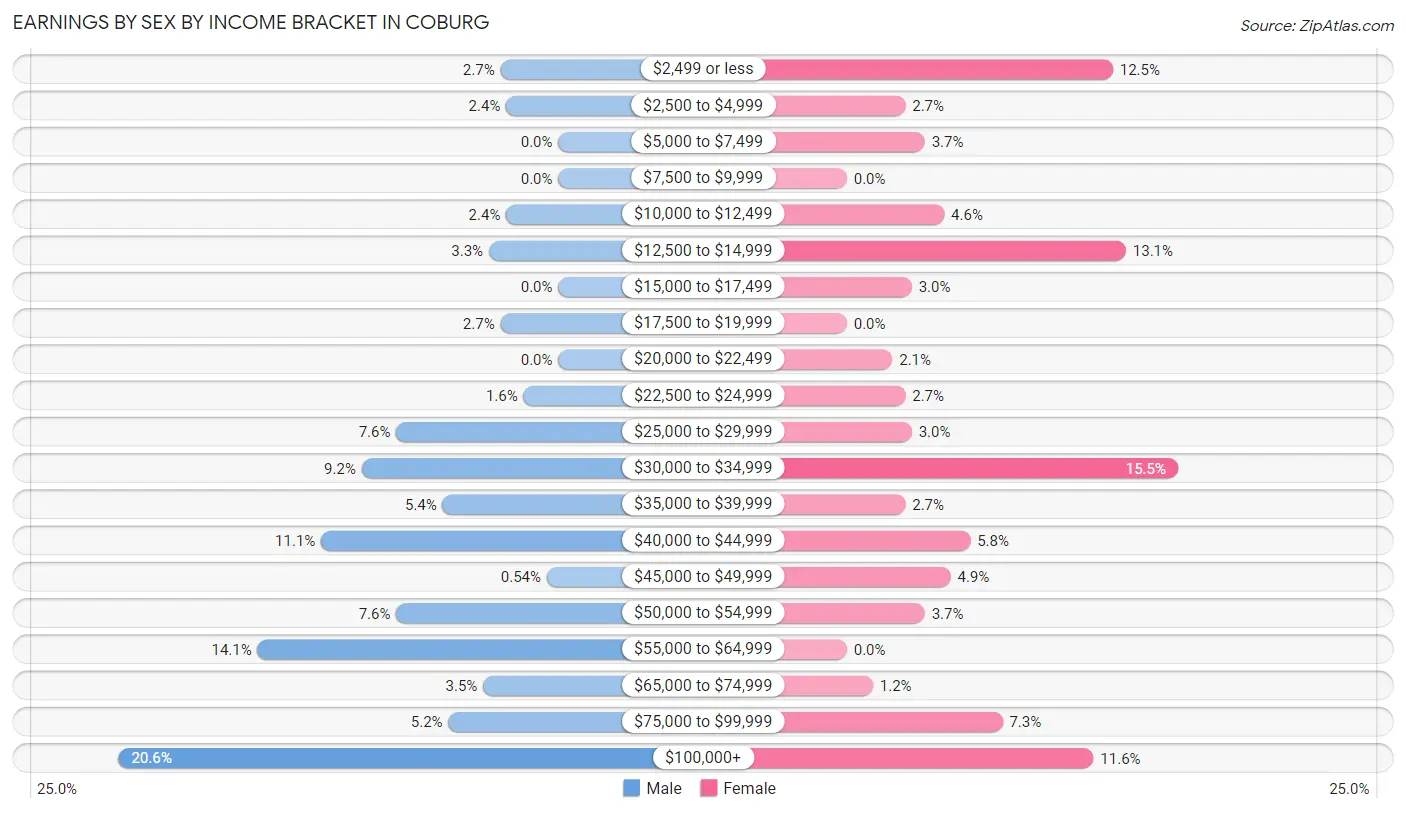
Earnings by Sex by Income Bracket in Coburg
The most common earnings brackets in Coburg are $100,000+ for men (76 | 20.6%) and $30,000 to $34,999 for women (51 | 15.5%).
| Income | Male | Female |
| $2,499 or less | 10 (2.7%) | 41 (12.5%) |
| $2,500 to $4,999 | 9 (2.4%) | 9 (2.7%) |
| $5,000 to $7,499 | 0 (0.0%) | 12 (3.6%) |
| $7,500 to $9,999 | 0 (0.0%) | 0 (0.0%) |
| $10,000 to $12,499 | 9 (2.4%) | 15 (4.6%) |
| $12,500 to $14,999 | 12 (3.3%) | 43 (13.1%) |
| $15,000 to $17,499 | 0 (0.0%) | 10 (3.0%) |
| $17,500 to $19,999 | 10 (2.7%) | 0 (0.0%) |
| $20,000 to $22,499 | 0 (0.0%) | 7 (2.1%) |
| $22,500 to $24,999 | 6 (1.6%) | 9 (2.7%) |
| $25,000 to $29,999 | 28 (7.6%) | 10 (3.0%) |
| $30,000 to $34,999 | 34 (9.2%) | 51 (15.5%) |
| $35,000 to $39,999 | 20 (5.4%) | 9 (2.7%) |
| $40,000 to $44,999 | 41 (11.1%) | 19 (5.8%) |
| $45,000 to $49,999 | 2 (0.5%) | 16 (4.9%) |
| $50,000 to $54,999 | 28 (7.6%) | 12 (3.6%) |
| $55,000 to $64,999 | 52 (14.1%) | 0 (0.0%) |
| $65,000 to $74,999 | 13 (3.5%) | 4 (1.2%) |
| $75,000 to $99,999 | 19 (5.1%) | 24 (7.3%) |
| $100,000+ | 76 (20.6%) | 38 (11.6%) |
| Total | 369 (100.0%) | 329 (100.0%) |
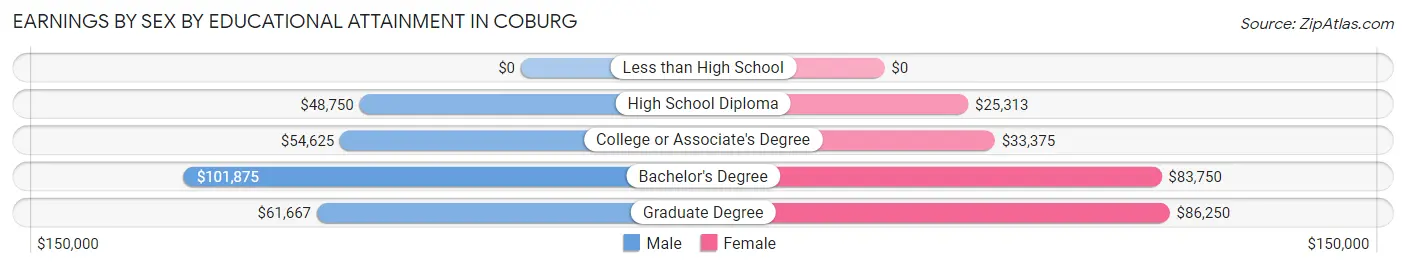
Earnings by Sex by Educational Attainment in Coburg
Average earnings in Coburg are $54,185 for men and $34,559 for women, a difference of 36.2%. Men with an educational attainment of bachelor's degree enjoy the highest average annual earnings of $101,875, while those with high school diploma education earn the least with $48,750. Women with an educational attainment of graduate degree earn the most with the average annual earnings of $86,250, while those with high school diploma education have the smallest earnings of $25,313.
| Educational Attainment | Male Income | Female Income |
| Less than High School | - | - |
| High School Diploma | $48,750 | $25,313 |
| College or Associate's Degree | $54,625 | $33,375 |
| Bachelor's Degree | $101,875 | $83,750 |
| Graduate Degree | $61,667 | $86,250 |
| Total | $54,185 | $34,559 |
Family Income in Coburg
Family Income Brackets in Coburg
According to the Coburg family income data, there are 78 families falling into the $50,000 to $74,999 income range, which is the most common income bracket and makes up 22.2% of all families.
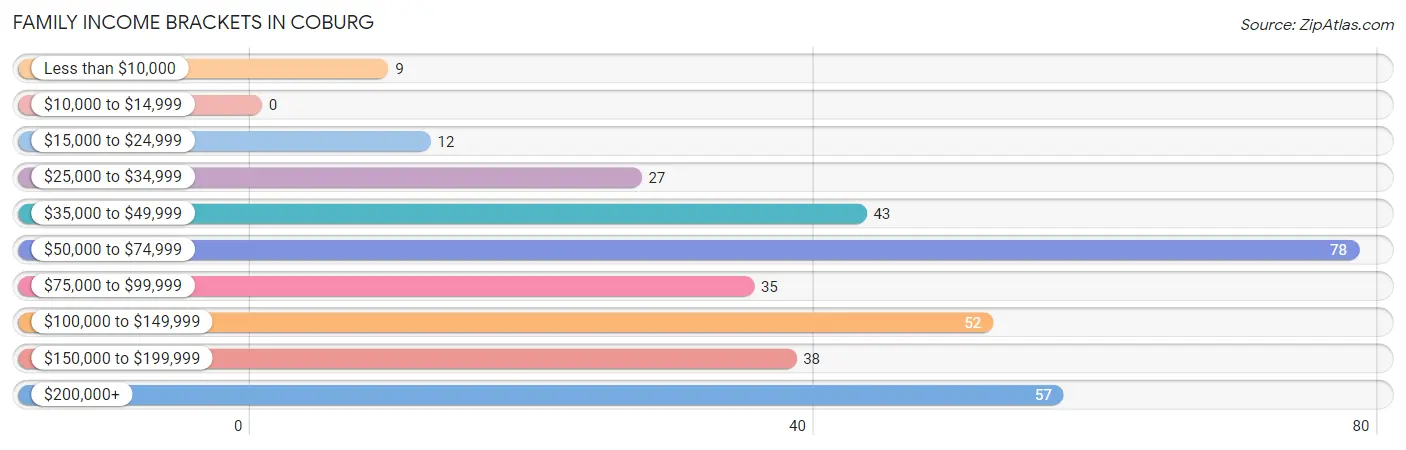
| Income Bracket | # Families | % Families |
| Less than $10,000 | 9 | 2.6% |
| $10,000 to $14,999 | 0 | 0.0% |
| $15,000 to $24,999 | 12 | 3.4% |
| $25,000 to $34,999 | 27 | 7.7% |
| $35,000 to $49,999 | 43 | 12.3% |
| $50,000 to $74,999 | 78 | 22.2% |
| $75,000 to $99,999 | 35 | 10.0% |
| $100,000 to $149,999 | 52 | 14.8% |
| $150,000 to $199,999 | 38 | 10.8% |
| $200,000+ | 57 | 16.2% |
Family Income by Famaliy Size in Coburg
3-person families (79 | 22.5%) account for the highest median family income in Coburg with $121,875 per family, while 3-person families (79 | 22.5%) have the highest median income of $40,625 per family member.
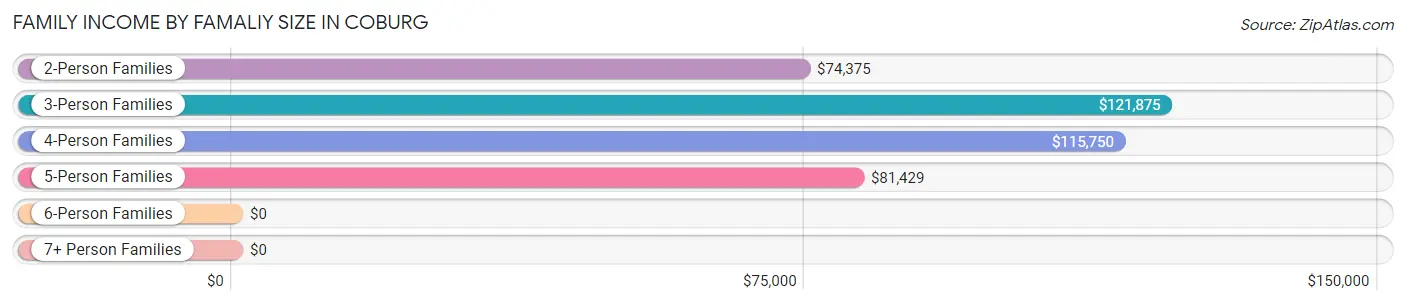
| Income Bracket | # Families | Median Income |
| 2-Person Families | 191 (54.4%) | $74,375 |
| 3-Person Families | 79 (22.5%) | $121,875 |
| 4-Person Families | 29 (8.3%) | $115,750 |
| 5-Person Families | 32 (9.1%) | $81,429 |
| 6-Person Families | 0 (0.0%) | $0 |
| 7+ Person Families | 20 (5.7%) | $0 |
| Total | 351 (100.0%) | $81,607 |
Family Income by Number of Earners in Coburg
The median family income in Coburg is $81,607, with families comprising 2 earners (95) having the highest median family income of $151,023, while families with no earners (91) have the lowest median family income of $46,150, accounting for 27.1% and 25.9% of families, respectively.
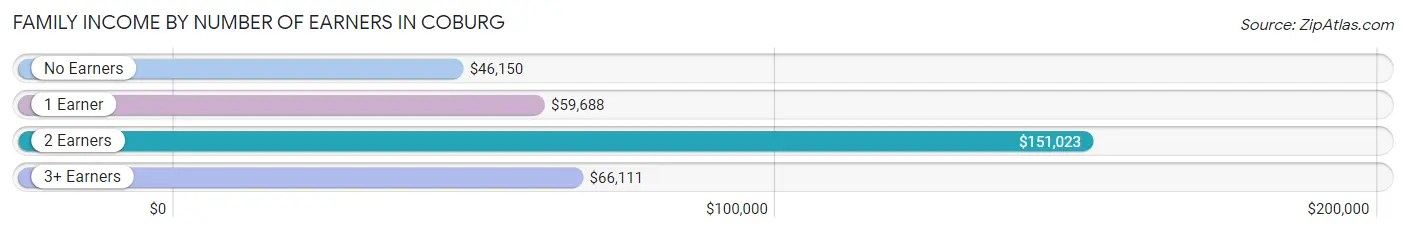
| Number of Earners | # Families | Median Income |
| No Earners | 91 (25.9%) | $46,150 |
| 1 Earner | 109 (31.0%) | $59,688 |
| 2 Earners | 95 (27.1%) | $151,023 |
| 3+ Earners | 56 (16.0%) | $66,111 |
| Total | 351 (100.0%) | $81,607 |
Household Income in Coburg
Household Income Brackets in Coburg
With 93 households falling in the category, the $75,000 to $99,999 income range is the most frequent in Coburg, accounting for 18.7% of all households. In contrast, only 7 households (1.4%) fall into the $10,000 to $14,999 income bracket, making it the least populous group.
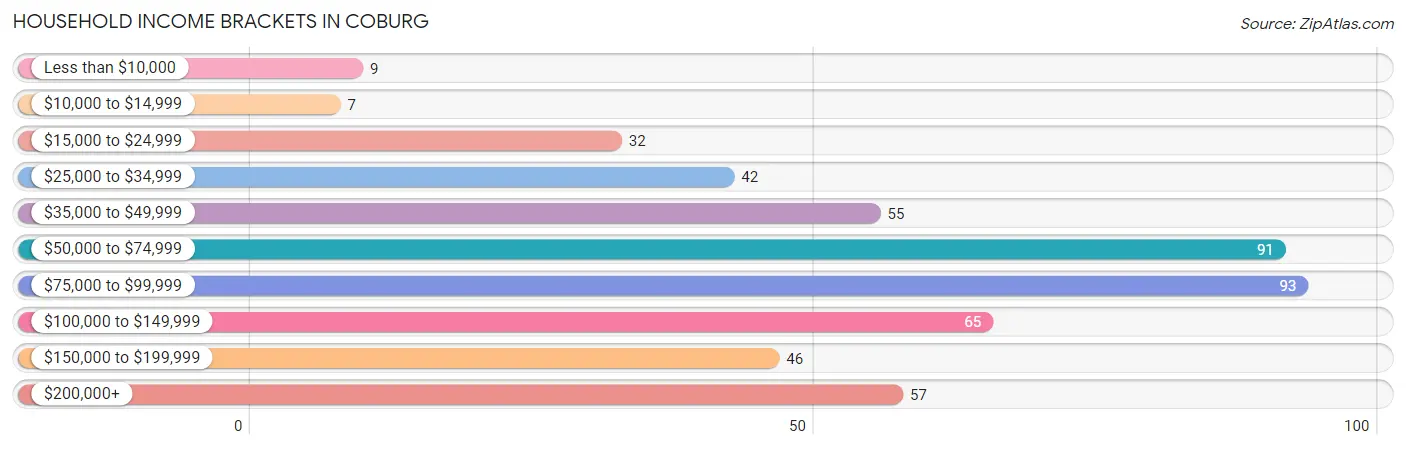
| Income Bracket | # Households | % Households |
| Less than $10,000 | 9 | 1.8% |
| $10,000 to $14,999 | 7 | 1.4% |
| $15,000 to $24,999 | 32 | 6.4% |
| $25,000 to $34,999 | 42 | 8.5% |
| $35,000 to $49,999 | 55 | 11.1% |
| $50,000 to $74,999 | 91 | 18.3% |
| $75,000 to $99,999 | 93 | 18.7% |
| $100,000 to $149,999 | 65 | 13.1% |
| $150,000 to $199,999 | 46 | 9.3% |
| $200,000+ | 57 | 11.5% |
Household Income by Householder Age in Coburg
The median household income in Coburg is $79,732, with the highest median household income of $90,703 found in the 45 to 64 years age bracket for the primary householder. A total of 201 households (40.4%) fall into this category. Meanwhile, the 15 to 24 years age bracket for the primary householder has the lowest median household income of $0, with 4 households (0.8%) in this group.
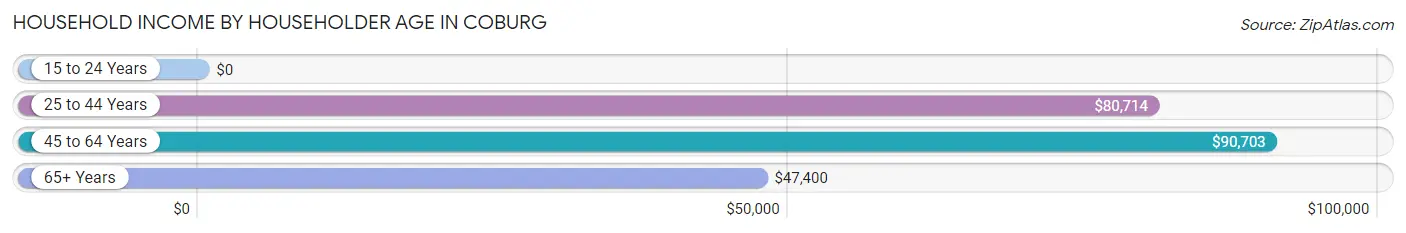
| Income Bracket | # Households | Median Income |
| 15 to 24 Years | 4 (0.8%) | $0 |
| 25 to 44 Years | 114 (22.9%) | $80,714 |
| 45 to 64 Years | 201 (40.4%) | $90,703 |
| 65+ Years | 178 (35.8%) | $47,400 |
| Total | 497 (100.0%) | $79,732 |
Poverty in Coburg
Income Below Poverty by Sex and Age in Coburg
With 6.8% poverty level for males and 4.3% for females among the residents of Coburg, 15 year old males and 35 to 44 year old females are the most vulnerable to poverty, with 3 males (50.0%) and 15 females (18.5%) in their respective age groups living below the poverty level.
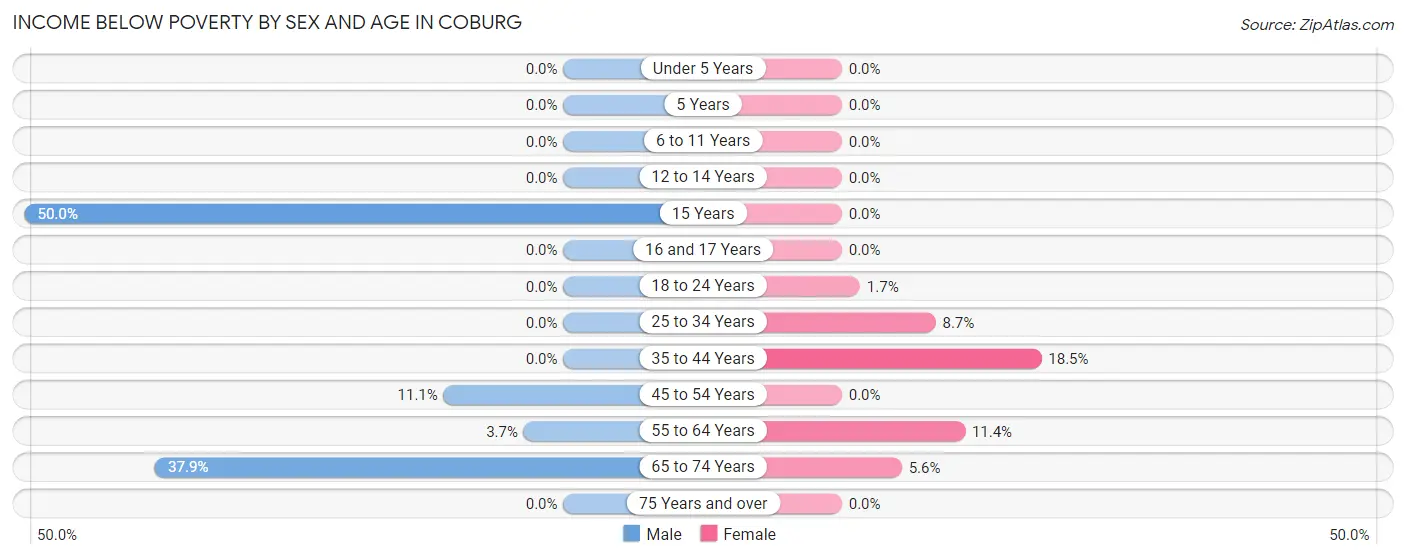
| Age Bracket | Male | Female |
| Under 5 Years | 0 (0.0%) | 0 (0.0%) |
| 5 Years | 0 (0.0%) | 0 (0.0%) |
| 6 to 11 Years | 0 (0.0%) | 0 (0.0%) |
| 12 to 14 Years | 0 (0.0%) | 0 (0.0%) |
| 15 Years | 3 (50.0%) | 0 (0.0%) |
| 16 and 17 Years | 0 (0.0%) | 0 (0.0%) |
| 18 to 24 Years | 0 (0.0%) | 2 (1.7%) |
| 25 to 34 Years | 0 (0.0%) | 4 (8.7%) |
| 35 to 44 Years | 0 (0.0%) | 15 (18.5%) |
| 45 to 54 Years | 12 (11.1%) | 0 (0.0%) |
| 55 to 64 Years | 4 (3.7%) | 8 (11.4%) |
| 65 to 74 Years | 25 (37.9%) | 9 (5.6%) |
| 75 Years and over | 0 (0.0%) | 0 (0.0%) |
| Total | 44 (6.8%) | 38 (4.3%) |
Income Above Poverty by Sex and Age in Coburg
According to the poverty statistics in Coburg, males aged under 5 years and females aged under 5 years are the age groups that are most secure financially, with 100.0% of males and 100.0% of females in these age groups living above the poverty line.
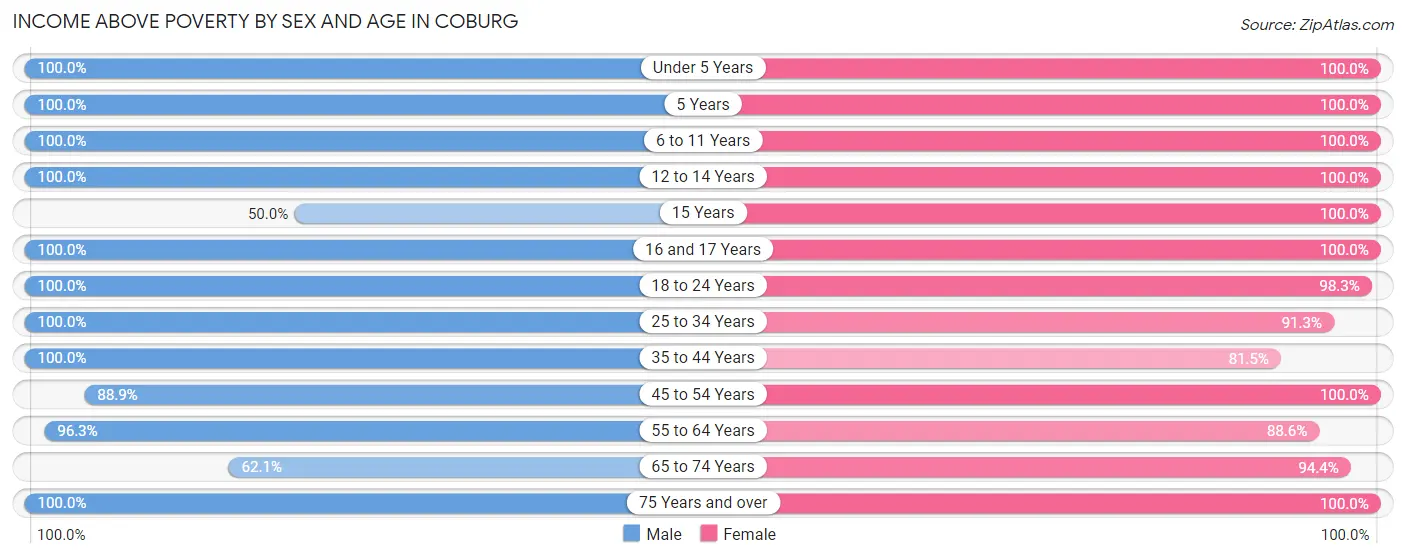
| Age Bracket | Male | Female |
| Under 5 Years | 53 (100.0%) | 103 (100.0%) |
| 5 Years | 15 (100.0%) | 14 (100.0%) |
| 6 to 11 Years | 43 (100.0%) | 71 (100.0%) |
| 12 to 14 Years | 25 (100.0%) | 27 (100.0%) |
| 15 Years | 3 (50.0%) | 5 (100.0%) |
| 16 and 17 Years | 10 (100.0%) | 53 (100.0%) |
| 18 to 24 Years | 34 (100.0%) | 117 (98.3%) |
| 25 to 34 Years | 65 (100.0%) | 42 (91.3%) |
| 35 to 44 Years | 63 (100.0%) | 66 (81.5%) |
| 45 to 54 Years | 96 (88.9%) | 86 (100.0%) |
| 55 to 64 Years | 105 (96.3%) | 62 (88.6%) |
| 65 to 74 Years | 41 (62.1%) | 153 (94.4%) |
| 75 Years and over | 52 (100.0%) | 45 (100.0%) |
| Total | 605 (93.2%) | 844 (95.7%) |
Income Below Poverty Among Married-Couple Families in Coburg
The poverty statistics for married-couple families in Coburg show that 3.2% or 9 of the total 278 families live below the poverty line. Families with no children have the highest poverty rate of 4.8%, comprising of 9 families. On the other hand, families with 1 or 2 children have the lowest poverty rate of 0.0%, which includes 0 families.
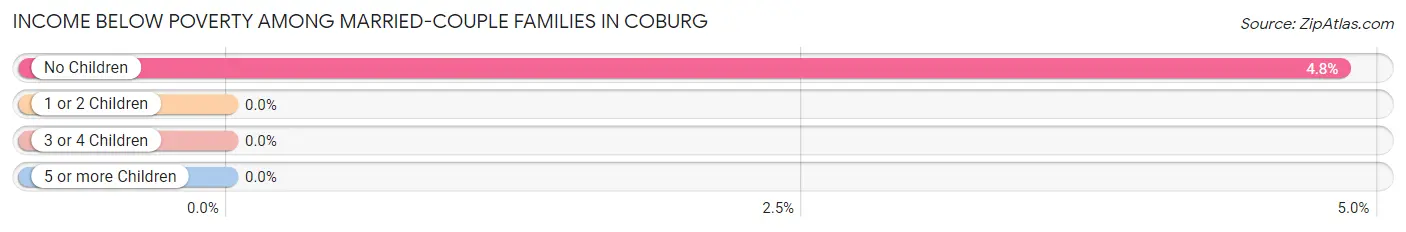
| Children | Above Poverty | Below Poverty |
| No Children | 177 (95.2%) | 9 (4.8%) |
| 1 or 2 Children | 45 (100.0%) | 0 (0.0%) |
| 3 or 4 Children | 27 (100.0%) | 0 (0.0%) |
| 5 or more Children | 20 (100.0%) | 0 (0.0%) |
| Total | 269 (96.8%) | 9 (3.2%) |
Income Below Poverty Among Single-Parent Households in Coburg
| Children | Single Father | Single Mother |
| No Children | 0 (0.0%) | 0 (0.0%) |
| 1 or 2 Children | 0 (0.0%) | 0 (0.0%) |
| 3 or 4 Children | 0 (0.0%) | 0 (0.0%) |
| 5 or more Children | 0 (0.0%) | 0 (0.0%) |
| Total | 0 (0.0%) | 0 (0.0%) |
Income Below Poverty Among Married-Couple vs Single-Parent Households in Coburg
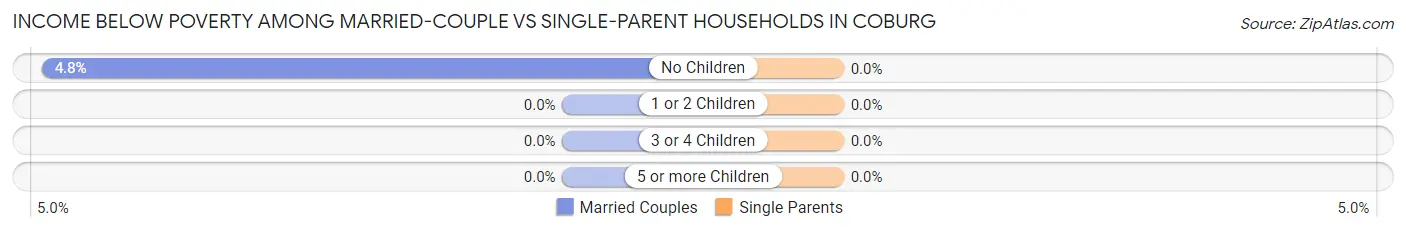
| Children | Married-Couple Families | Single-Parent Households |
| No Children | 9 (4.8%) | 0 (0.0%) |
| 1 or 2 Children | 0 (0.0%) | 0 (0.0%) |
| 3 or 4 Children | 0 (0.0%) | 0 (0.0%) |
| 5 or more Children | 0 (0.0%) | 0 (0.0%) |
| Total | 9 (3.2%) | 0 (0.0%) |
Race in Coburg
The most populous races in Coburg are White / Caucasian (1,349 | 87.6%), Two or more Races (70 | 4.5%), and Hispanic or Latino (52 | 3.4%).
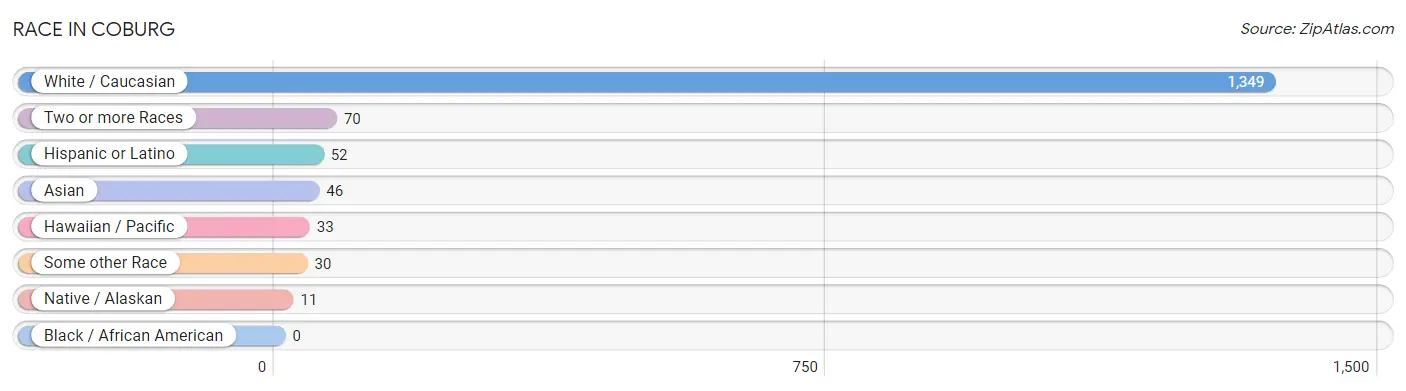
| Race | # Population | % Population |
| Asian | 46 | 3.0% |
| Black / African American | 0 | 0.0% |
| Hawaiian / Pacific | 33 | 2.1% |
| Hispanic or Latino | 52 | 3.4% |
| Native / Alaskan | 11 | 0.7% |
| White / Caucasian | 1,349 | 87.6% |
| Two or more Races | 70 | 4.5% |
| Some other Race | 30 | 1.9% |
| Total | 1,539 | 100.0% |
Ancestry in Coburg
The most populous ancestries reported in Coburg are Irish (204 | 13.3%), German (191 | 12.4%), English (161 | 10.5%), Italian (102 | 6.6%), and Scottish (102 | 6.6%), together accounting for 49.4% of all Coburg residents.
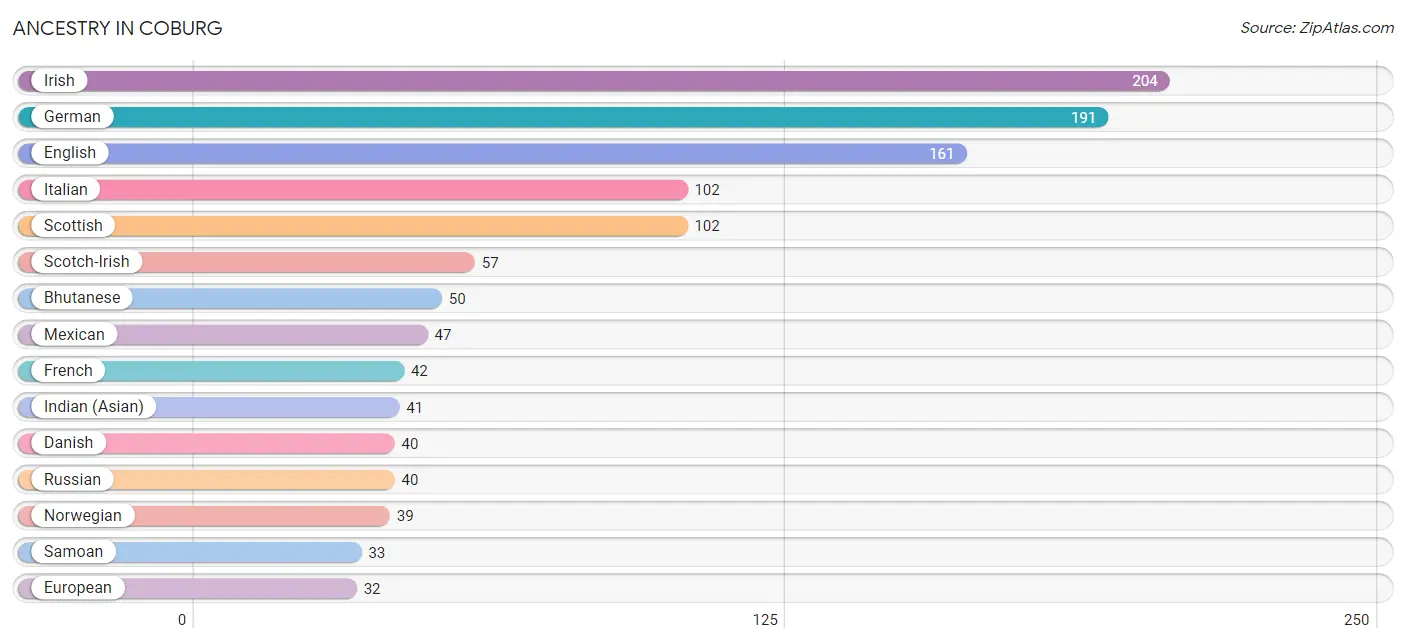
| Ancestry | # Population | % Population |
| American | 28 | 1.8% |
| Armenian | 9 | 0.6% |
| Austrian | 9 | 0.6% |
| Bhutanese | 50 | 3.3% |
| British | 31 | 2.0% |
| Central American | 5 | 0.3% |
| Cherokee | 16 | 1.0% |
| Croatian | 4 | 0.3% |
| Czech | 15 | 1.0% |
| Czechoslovakian | 10 | 0.6% |
| Danish | 40 | 2.6% |
| Dutch | 10 | 0.6% |
| Eastern European | 4 | 0.3% |
| English | 161 | 10.5% |
| European | 32 | 2.1% |
| French | 42 | 2.7% |
| French Canadian | 3 | 0.2% |
| German | 191 | 12.4% |
| Greek | 1 | 0.1% |
| Hungarian | 18 | 1.2% |
| Indian (Asian) | 41 | 2.7% |
| Irish | 204 | 13.3% |
| Italian | 102 | 6.6% |
| Mexican | 47 | 3.0% |
| Navajo | 14 | 0.9% |
| Nicaraguan | 5 | 0.3% |
| Northern European | 4 | 0.3% |
| Norwegian | 39 | 2.5% |
| Polish | 14 | 0.9% |
| Portuguese | 9 | 0.6% |
| Russian | 40 | 2.6% |
| Samoan | 33 | 2.1% |
| Scandinavian | 13 | 0.8% |
| Scotch-Irish | 57 | 3.7% |
| Scottish | 102 | 6.6% |
| Shoshone | 1 | 0.1% |
| Slavic | 2 | 0.1% |
| Swedish | 24 | 1.6% |
| Swiss | 14 | 0.9% |
| Ukrainian | 12 | 0.8% |
| Welsh | 4 | 0.3% | View All 41 Rows |
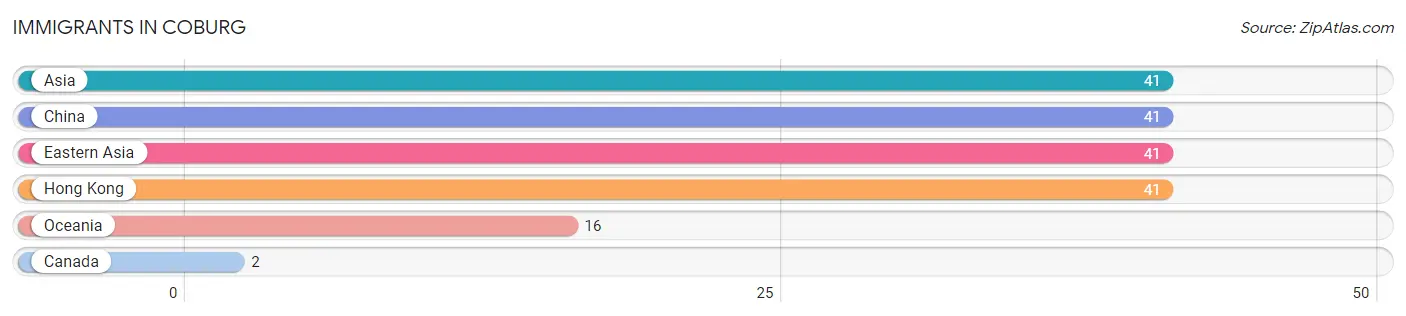
Immigrants in Coburg
The most numerous immigrant groups reported in Coburg came from Asia (41 | 2.7%), China (41 | 2.7%), Eastern Asia (41 | 2.7%), Hong Kong (41 | 2.7%), and Oceania (16 | 1.0%), together accounting for 11.7% of all Coburg residents.
| Immigration Origin | # Population | % Population |
| Asia | 41 | 2.7% |
| Canada | 2 | 0.1% |
| China | 41 | 2.7% |
| Eastern Asia | 41 | 2.7% |
| Hong Kong | 41 | 2.7% |
| Oceania | 16 | 1.0% | View All 6 Rows |
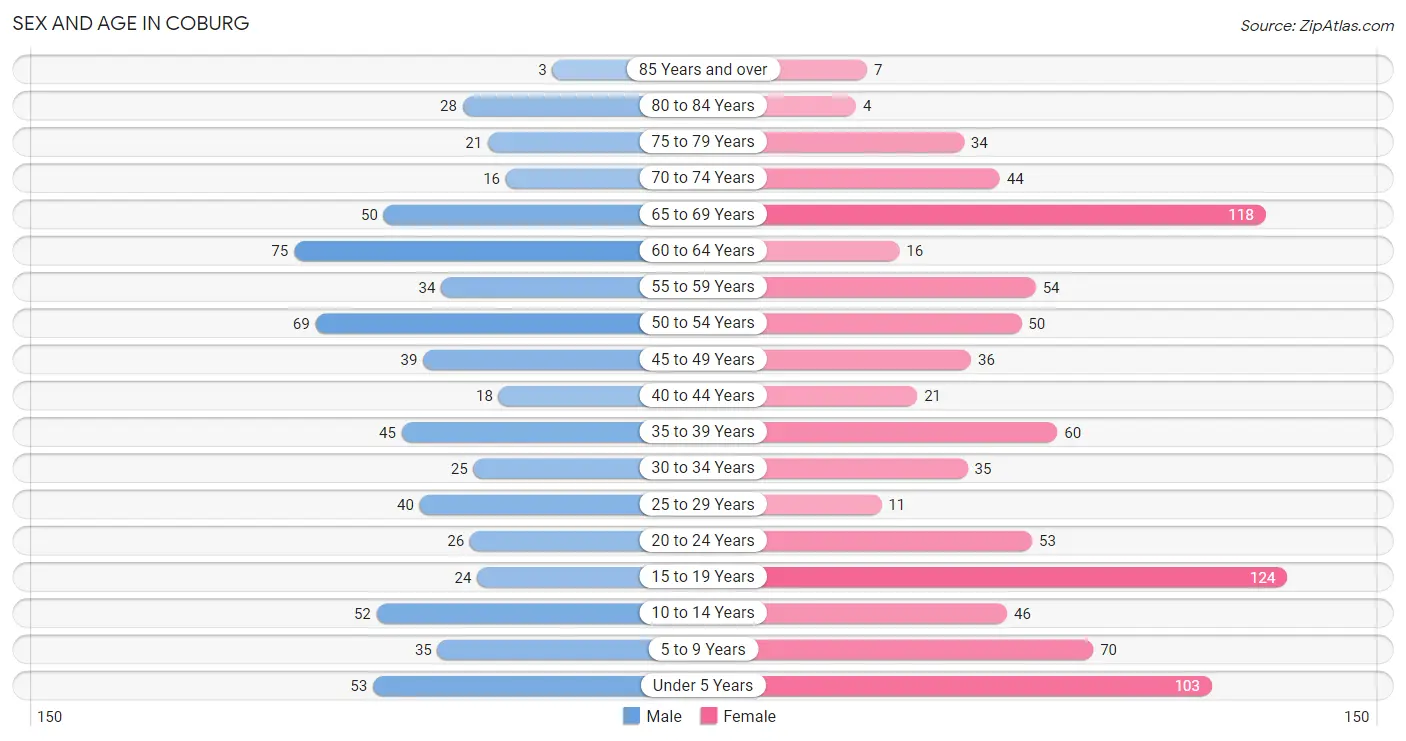
Sex and Age in Coburg
Sex and Age in Coburg
The most populous age groups in Coburg are 60 to 64 Years (75 | 11.5%) for men and 15 to 19 Years (124 | 14.0%) for women.
| Age Bracket | Male | Female |
| Under 5 Years | 53 (8.1%) | 103 (11.6%) |
| 5 to 9 Years | 35 (5.4%) | 70 (7.9%) |
| 10 to 14 Years | 52 (8.0%) | 46 (5.2%) |
| 15 to 19 Years | 24 (3.7%) | 124 (14.0%) |
| 20 to 24 Years | 26 (4.0%) | 53 (6.0%) |
| 25 to 29 Years | 40 (6.1%) | 11 (1.2%) |
| 30 to 34 Years | 25 (3.8%) | 35 (4.0%) |
| 35 to 39 Years | 45 (6.9%) | 60 (6.8%) |
| 40 to 44 Years | 18 (2.8%) | 21 (2.4%) |
| 45 to 49 Years | 39 (6.0%) | 36 (4.1%) |
| 50 to 54 Years | 69 (10.6%) | 50 (5.6%) |
| 55 to 59 Years | 34 (5.2%) | 54 (6.1%) |
| 60 to 64 Years | 75 (11.5%) | 16 (1.8%) |
| 65 to 69 Years | 50 (7.7%) | 118 (13.3%) |
| 70 to 74 Years | 16 (2.5%) | 44 (5.0%) |
| 75 to 79 Years | 21 (3.2%) | 34 (3.8%) |
| 80 to 84 Years | 28 (4.3%) | 4 (0.4%) |
| 85 Years and over | 3 (0.5%) | 7 (0.8%) |
| Total | 653 (100.0%) | 886 (100.0%) |
Families and Households in Coburg
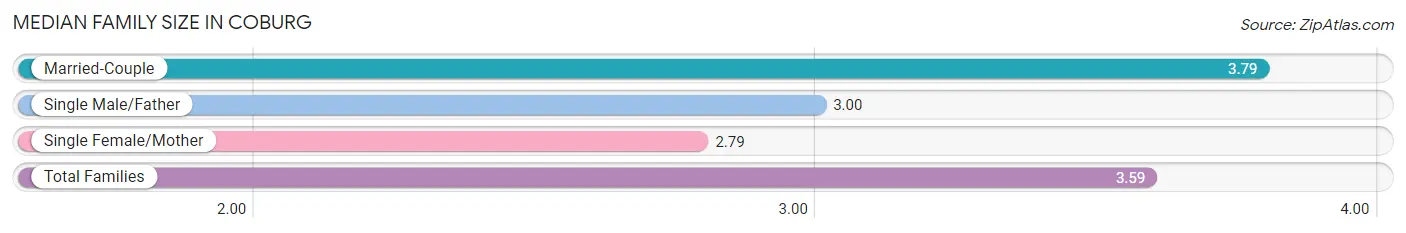
Median Family Size in Coburg
The median family size in Coburg is 3.59 persons per family, with married-couple families (278 | 79.2%) accounting for the largest median family size of 3.79 persons per family. On the other hand, single female/mother families (52 | 14.8%) represent the smallest median family size with 2.79 persons per family.
| Family Type | # Families | Family Size |
| Married-Couple | 278 (79.2%) | 3.79 |
| Single Male/Father | 21 (6.0%) | 3.00 |
| Single Female/Mother | 52 (14.8%) | 2.79 |
| Total Families | 351 (100.0%) | 3.59 |
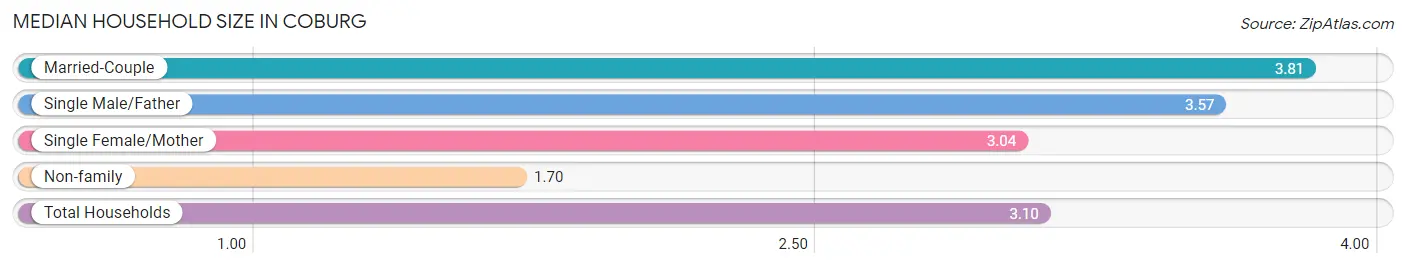
Median Household Size in Coburg
The median household size in Coburg is 3.10 persons per household, with married-couple households (278 | 55.9%) accounting for the largest median household size of 3.81 persons per household. non-family households (146 | 29.4%) represent the smallest median household size with 1.70 persons per household.
| Household Type | # Households | Household Size |
| Married-Couple | 278 (55.9%) | 3.81 |
| Single Male/Father | 21 (4.2%) | 3.57 |
| Single Female/Mother | 52 (10.5%) | 3.04 |
| Non-family | 146 (29.4%) | 1.70 |
| Total Households | 497 (100.0%) | 3.10 |
Household Size by Marriage Status in Coburg
Out of a total of 497 households in Coburg, 351 (70.6%) are family households, while 146 (29.4%) are nonfamily households. The most numerous type of family households are 2-person households, comprising 185, and the most common type of nonfamily households are 1-person households, comprising 82.
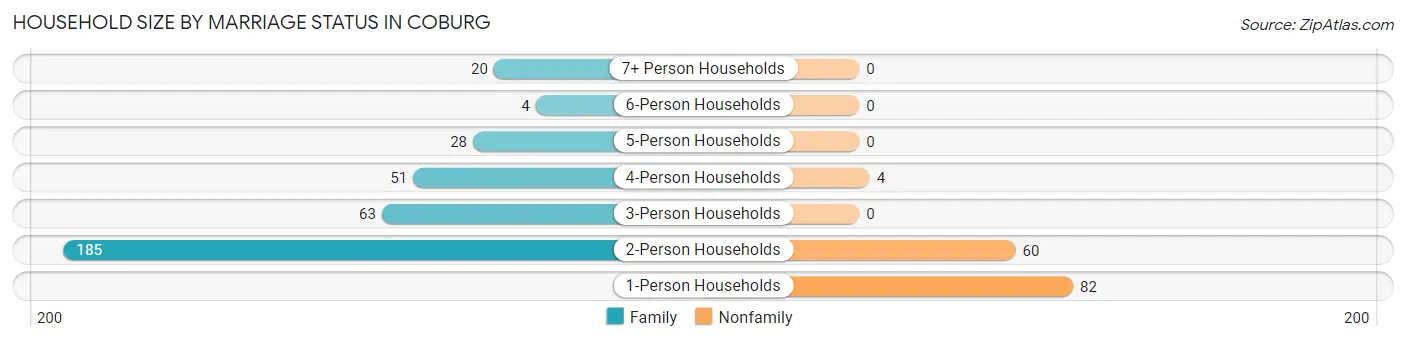
| Household Size | Family Households | Nonfamily Households |
| 1-Person Households | - | 82 (16.5%) |
| 2-Person Households | 185 (37.2%) | 60 (12.1%) |
| 3-Person Households | 63 (12.7%) | 0 (0.0%) |
| 4-Person Households | 51 (10.3%) | 4 (0.8%) |
| 5-Person Households | 28 (5.6%) | 0 (0.0%) |
| 6-Person Households | 4 (0.8%) | 0 (0.0%) |
| 7+ Person Households | 20 (4.0%) | 0 (0.0%) |
| Total | 351 (70.6%) | 146 (29.4%) |
Female Fertility in Coburg
Fertility by Age in Coburg
Average fertility rate in Coburg is 121.0 births per 1,000 women. Women in the age bracket of 20 to 34 years have the highest fertility rate with 424.0 births per 1,000 women. Women in the age bracket of 20 to 34 years acount for 100.0% of all women with births.
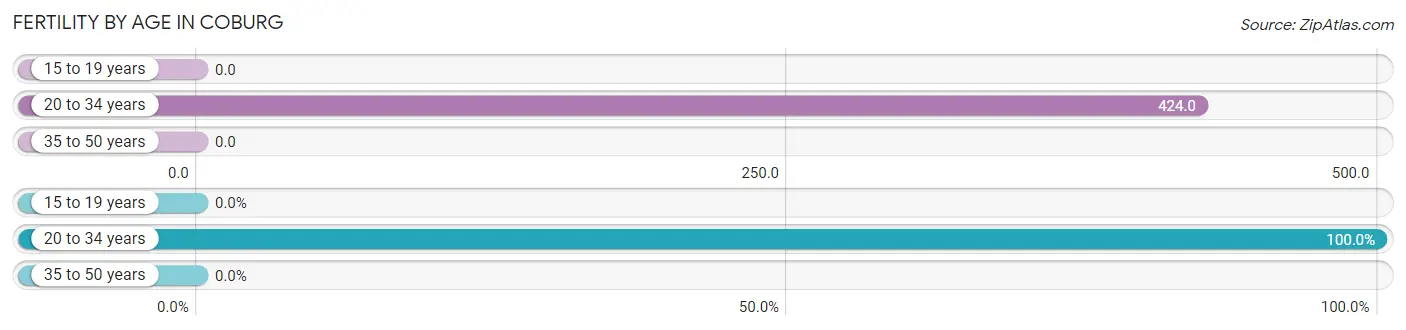
| Age Bracket | Women with Births | Births / 1,000 Women |
| 15 to 19 years | 0 (0.0%) | 0.0 |
| 20 to 34 years | 42 (100.0%) | 424.0 |
| 35 to 50 years | 0 (0.0%) | 0.0 |
| Total | 42 (100.0%) | 121.0 |
Fertility by Age by Marriage Status in Coburg
16.7% of women with births (42) in Coburg are married. The highest percentage of unmarried women with births falls into 20 to 34 years age bracket with 83.3% of them unmarried at the time of birth, while the lowest percentage of unmarried women with births belong to 20 to 34 years age bracket with 83.3% of them unmarried.
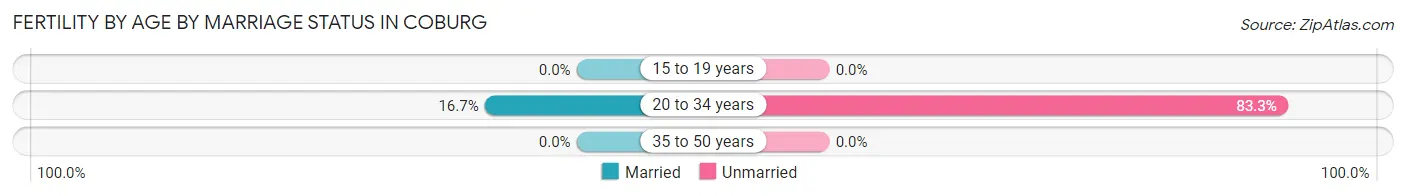
| Age Bracket | Married | Unmarried |
| 15 to 19 years | 0 (0.0%) | 0 (0.0%) |
| 20 to 34 years | 7 (16.7%) | 35 (83.3%) |
| 35 to 50 years | 0 (0.0%) | 0 (0.0%) |
| Total | 7 (16.7%) | 35 (83.3%) |
Fertility by Education in Coburg
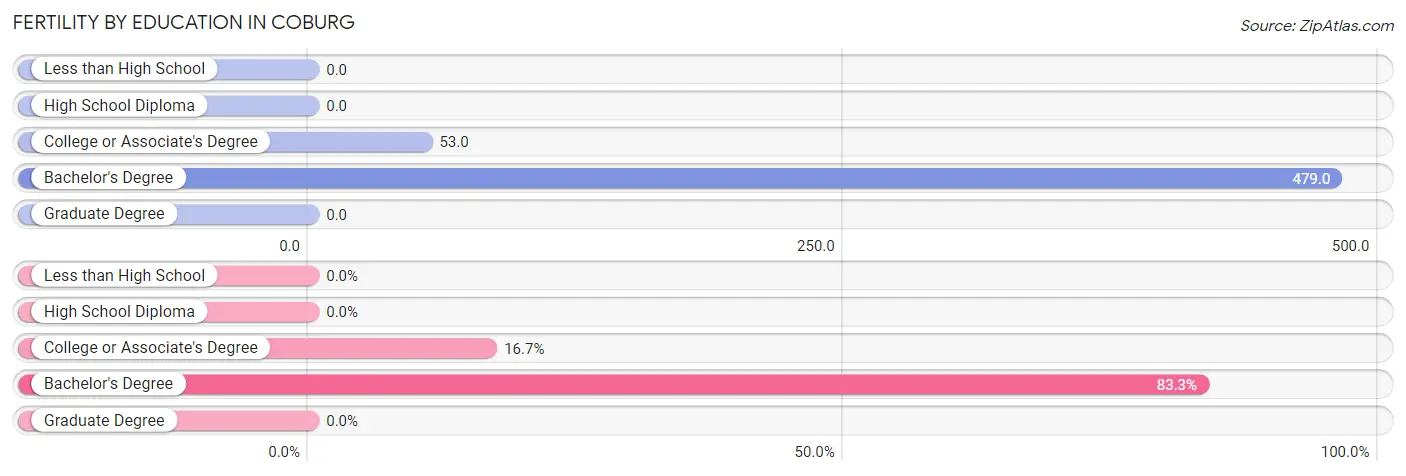
| Educational Attainment | Women with Births | Births / 1,000 Women |
| Less than High School | 0 (0.0%) | 0.0 |
| High School Diploma | 0 (0.0%) | 0.0 |
| College or Associate's Degree | 7 (16.7%) | 53.0 |
| Bachelor's Degree | 35 (83.3%) | 479.0 |
| Graduate Degree | 0 (0.0%) | 0.0 |
| Total | 42 (100.0%) | 121.0 |
Fertility by Education by Marriage Status in Coburg
83.3% of women with births in Coburg are unmarried. Women with the educational attainment of college or associate's degree are most likely to be married with 100.0% of them married at childbirth, while women with the educational attainment of bachelor's degree are least likely to be married with 100.0% of them unmarried at childbirth.
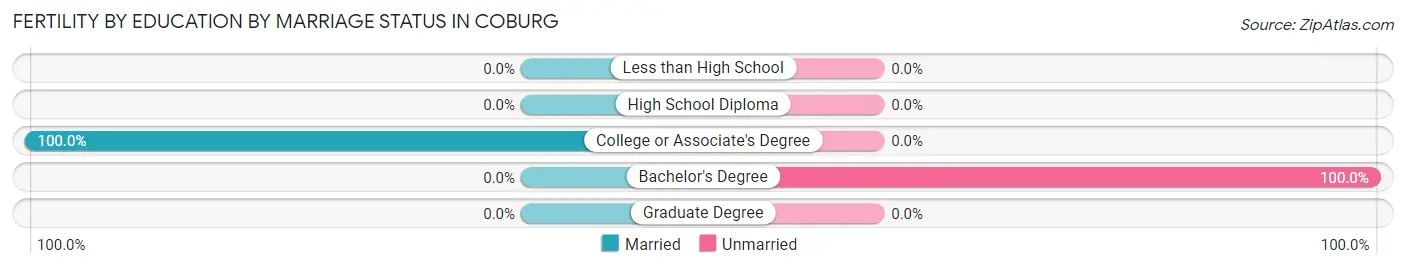
| Educational Attainment | Married | Unmarried |
| Less than High School | 0 (0.0%) | 0 (0.0%) |
| High School Diploma | 0 (0.0%) | 0 (0.0%) |
| College or Associate's Degree | 7 (100.0%) | 0 (0.0%) |
| Bachelor's Degree | 0 (0.0%) | 35 (100.0%) |
| Graduate Degree | 0 (0.0%) | 0 (0.0%) |
| Total | 7 (16.7%) | 35 (83.3%) |
Employment Characteristics in Coburg
Employment by Class of Employer in Coburg
Among the 580 employed individuals in Coburg, private company employees (371 | 64.0%), federal government employees (54 | 9.3%), and state government employees (45 | 7.8%) make up the most common classes of employment.
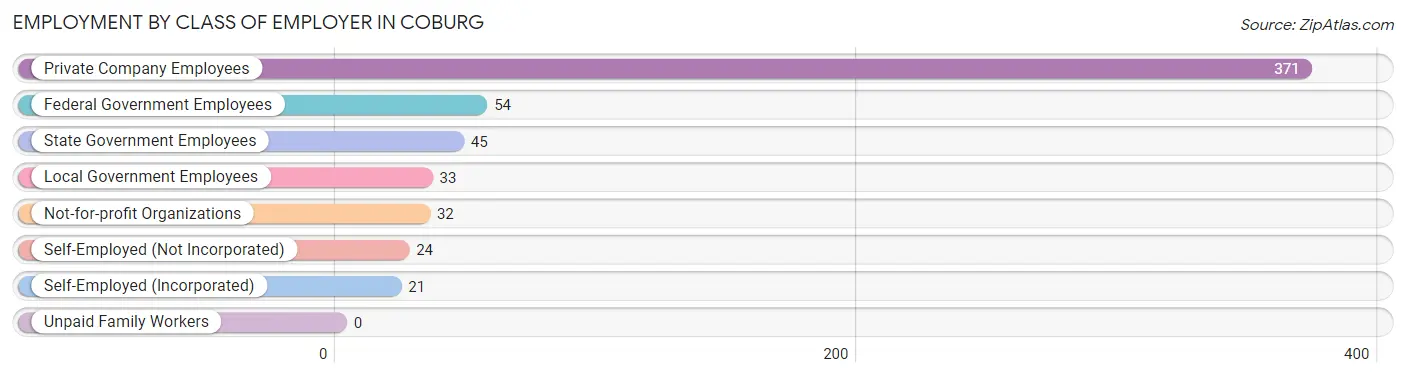
| Employer Class | # Employees | % Employees |
| Private Company Employees | 371 | 64.0% |
| Self-Employed (Incorporated) | 21 | 3.6% |
| Self-Employed (Not Incorporated) | 24 | 4.1% |
| Not-for-profit Organizations | 32 | 5.5% |
| Local Government Employees | 33 | 5.7% |
| State Government Employees | 45 | 7.8% |
| Federal Government Employees | 54 | 9.3% |
| Unpaid Family Workers | 0 | 0.0% |
| Total | 580 | 100.0% |
Employment Status by Age in Coburg
According to the labor force statistics for Coburg, out of the total population over 16 years of age (1,169), 57.1% or 667 individuals are in the labor force, with 12.4% or 83 of them unemployed. The age group with the highest labor force participation rate is 20 to 24 years, with 100.0% or 79 individuals in the labor force. Within the labor force, the 16 to 19 years age range has the highest percentage of unemployed individuals, with 67.2% or 45 of them being unemployed.
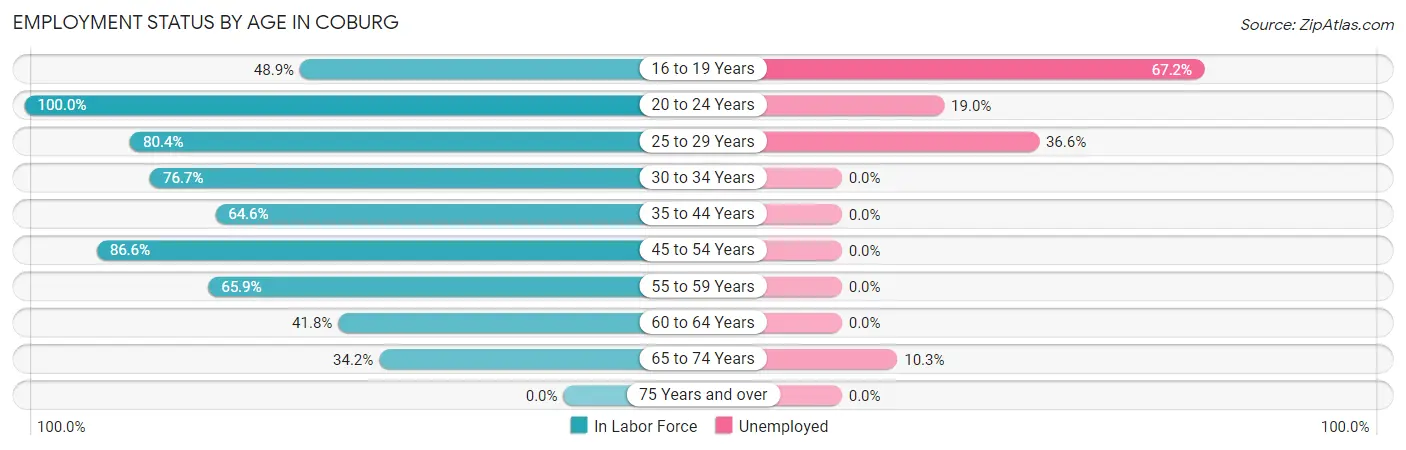
| Age Bracket | In Labor Force | Unemployed |
| 16 to 19 Years | 67 (48.9%) | 45 (67.2%) |
| 20 to 24 Years | 79 (100.0%) | 15 (19.0%) |
| 25 to 29 Years | 41 (80.4%) | 15 (36.6%) |
| 30 to 34 Years | 46 (76.7%) | 0 (0.0%) |
| 35 to 44 Years | 93 (64.6%) | 0 (0.0%) |
| 45 to 54 Years | 168 (86.6%) | 0 (0.0%) |
| 55 to 59 Years | 58 (65.9%) | 0 (0.0%) |
| 60 to 64 Years | 38 (41.8%) | 0 (0.0%) |
| 65 to 74 Years | 78 (34.2%) | 8 (10.3%) |
| 75 Years and over | 0 (0.0%) | 0 (0.0%) |
| Total | 667 (57.1%) | 83 (12.4%) |
Employment Status by Educational Attainment in Coburg
According to labor force statistics for Coburg, 70.7% of individuals (444) out of the total population between 25 and 64 years of age (628) are in the labor force, with 3.4% or 15 of them being unemployed. The group with the highest labor force participation rate are those with the educational attainment of bachelor's degree or higher, with 89.7% or 139 individuals in the labor force. Within the labor force, individuals with less than high school education have the highest percentage of unemployment, with 18.9% or 7 of them being unemployed.
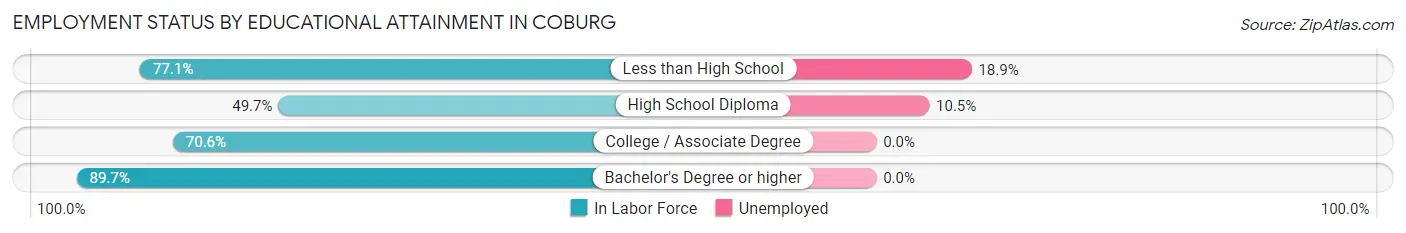
| Educational Attainment | In Labor Force | Unemployed |
| Less than High School | 37 (77.1%) | 9 (18.9%) |
| High School Diploma | 76 (49.7%) | 16 (10.5%) |
| College / Associate Degree | 192 (70.6%) | 0 (0.0%) |
| Bachelor's Degree or higher | 139 (89.7%) | 0 (0.0%) |
| Total | 444 (70.7%) | 21 (3.4%) |
Employment Occupations by Sex in Coburg
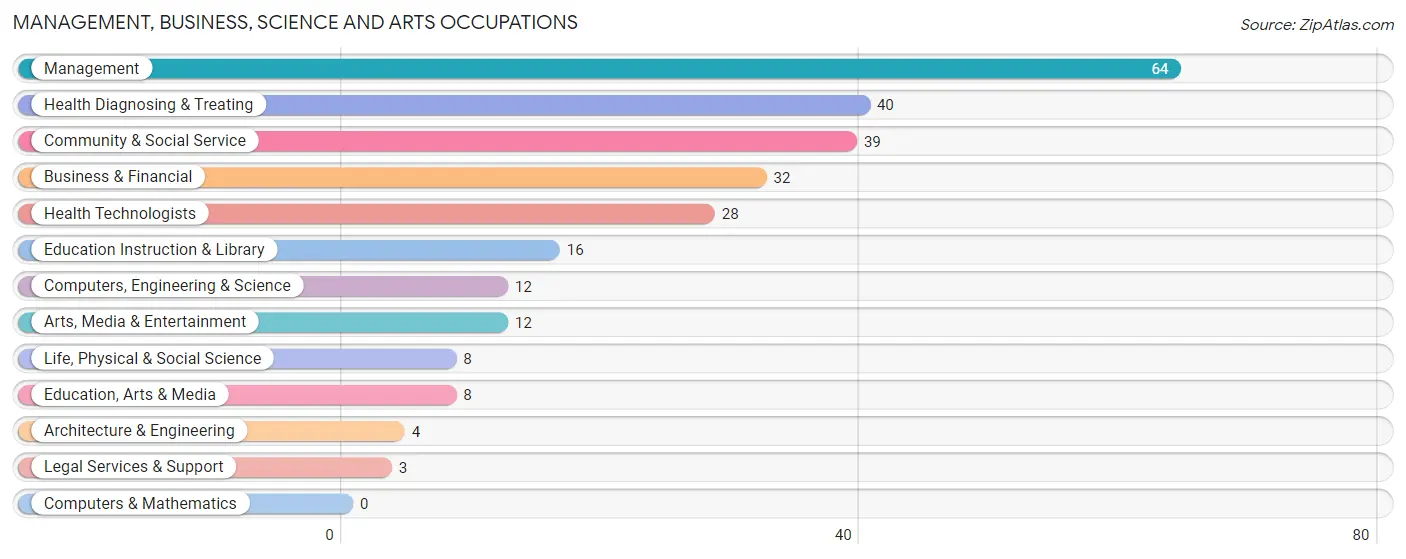
Management, Business, Science and Arts Occupations
The most common Management, Business, Science and Arts occupations in Coburg are Management (64 | 10.9%), Health Diagnosing & Treating (40 | 6.8%), Community & Social Service (39 | 6.7%), Business & Financial (32 | 5.5%), and Health Technologists (28 | 4.8%).
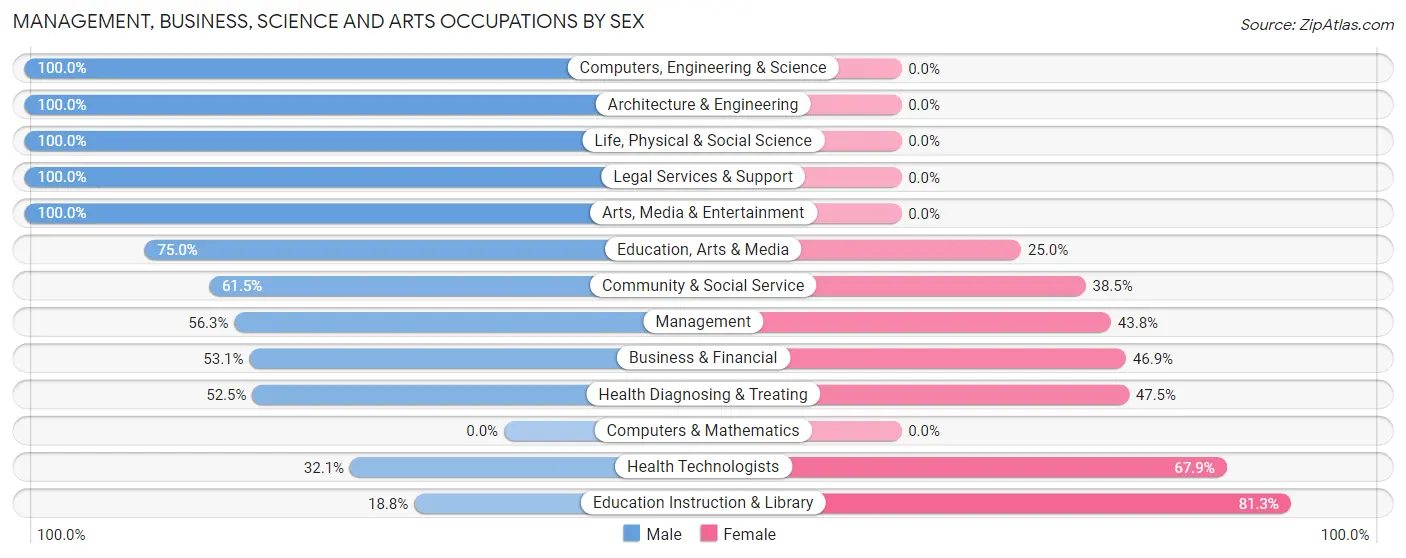
Management, Business, Science and Arts Occupations by Sex
Within the Management, Business, Science and Arts occupations in Coburg, the most male-oriented occupations are Computers, Engineering & Science (100.0%), Architecture & Engineering (100.0%), and Life, Physical & Social Science (100.0%), while the most female-oriented occupations are Education Instruction & Library (81.2%), Health Technologists (67.9%), and Health Diagnosing & Treating (47.5%).
| Occupation | Male | Female |
| Management | 36 (56.2%) | 28 (43.8%) |
| Business & Financial | 17 (53.1%) | 15 (46.9%) |
| Computers, Engineering & Science | 12 (100.0%) | 0 (0.0%) |
| Computers & Mathematics | 0 (0.0%) | 0 (0.0%) |
| Architecture & Engineering | 4 (100.0%) | 0 (0.0%) |
| Life, Physical & Social Science | 8 (100.0%) | 0 (0.0%) |
| Community & Social Service | 24 (61.5%) | 15 (38.5%) |
| Education, Arts & Media | 6 (75.0%) | 2 (25.0%) |
| Legal Services & Support | 3 (100.0%) | 0 (0.0%) |
| Education Instruction & Library | 3 (18.8%) | 13 (81.2%) |
| Arts, Media & Entertainment | 12 (100.0%) | 0 (0.0%) |
| Health Diagnosing & Treating | 21 (52.5%) | 19 (47.5%) |
| Health Technologists | 9 (32.1%) | 19 (67.9%) |
| Total (Category) | 110 (58.8%) | 77 (41.2%) |
| Total (Overall) | 313 (53.5%) | 272 (46.5%) |
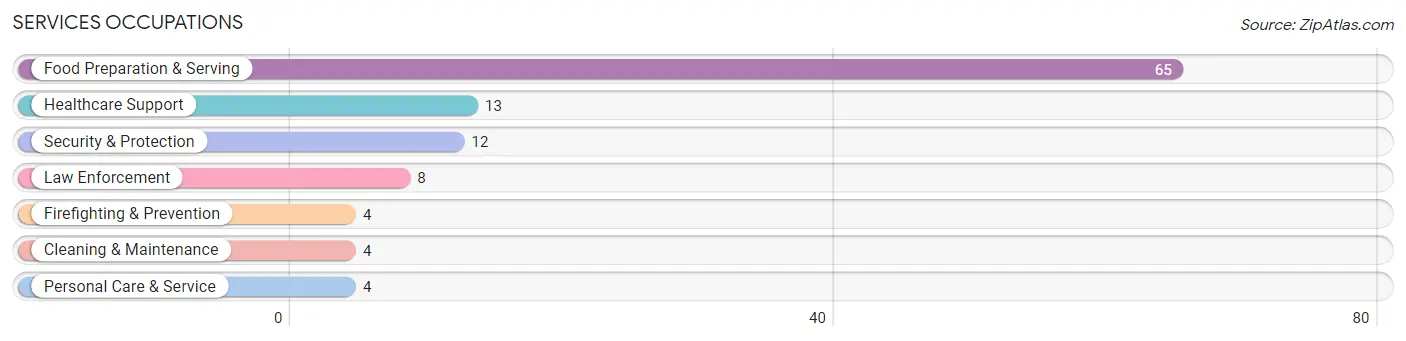
Services Occupations
The most common Services occupations in Coburg are Food Preparation & Serving (65 | 11.1%), Healthcare Support (13 | 2.2%), Security & Protection (12 | 2.1%), Law Enforcement (8 | 1.4%), and Firefighting & Prevention (4 | 0.7%).
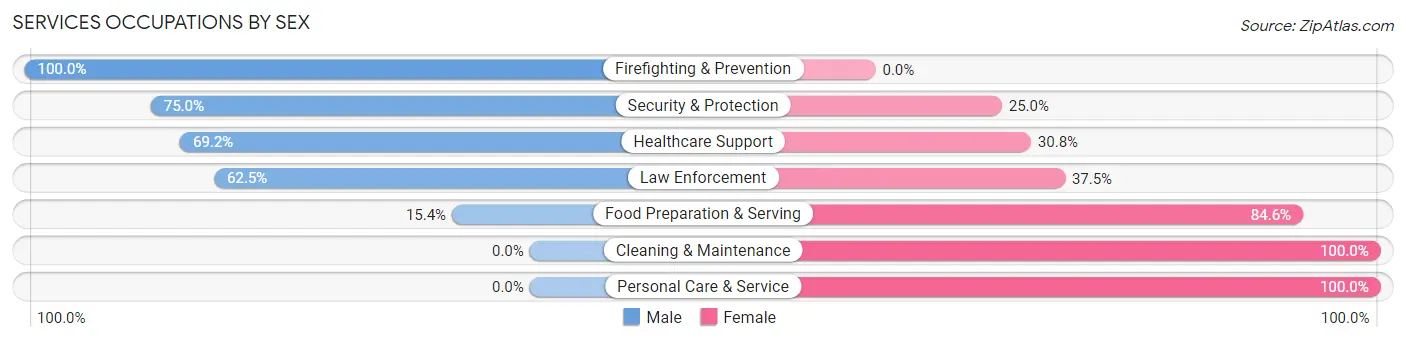
Services Occupations by Sex
Within the Services occupations in Coburg, the most male-oriented occupations are Firefighting & Prevention (100.0%), Security & Protection (75.0%), and Healthcare Support (69.2%), while the most female-oriented occupations are Cleaning & Maintenance (100.0%), Personal Care & Service (100.0%), and Food Preparation & Serving (84.6%).
| Occupation | Male | Female |
| Healthcare Support | 9 (69.2%) | 4 (30.8%) |
| Security & Protection | 9 (75.0%) | 3 (25.0%) |
| Firefighting & Prevention | 4 (100.0%) | 0 (0.0%) |
| Law Enforcement | 5 (62.5%) | 3 (37.5%) |
| Food Preparation & Serving | 10 (15.4%) | 55 (84.6%) |
| Cleaning & Maintenance | 0 (0.0%) | 4 (100.0%) |
| Personal Care & Service | 0 (0.0%) | 4 (100.0%) |
| Total (Category) | 28 (28.6%) | 70 (71.4%) |
| Total (Overall) | 313 (53.5%) | 272 (46.5%) |
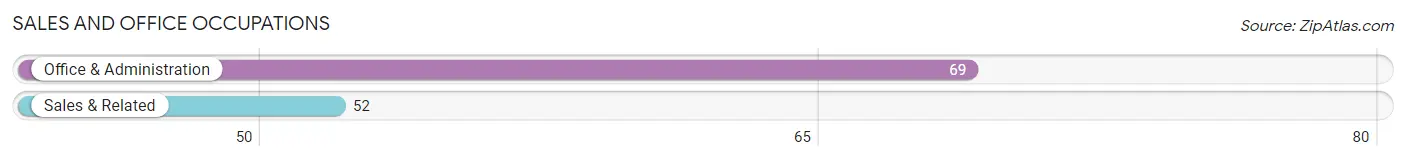
Sales and Office Occupations
The most common Sales and Office occupations in Coburg are Office & Administration (69 | 11.8%), and Sales & Related (52 | 8.9%).
Sales and Office Occupations by Sex
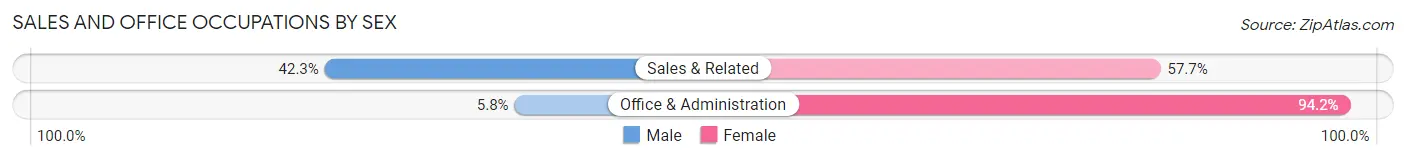
| Occupation | Male | Female |
| Sales & Related | 22 (42.3%) | 30 (57.7%) |
| Office & Administration | 4 (5.8%) | 65 (94.2%) |
| Total (Category) | 26 (21.5%) | 95 (78.5%) |
| Total (Overall) | 313 (53.5%) | 272 (46.5%) |
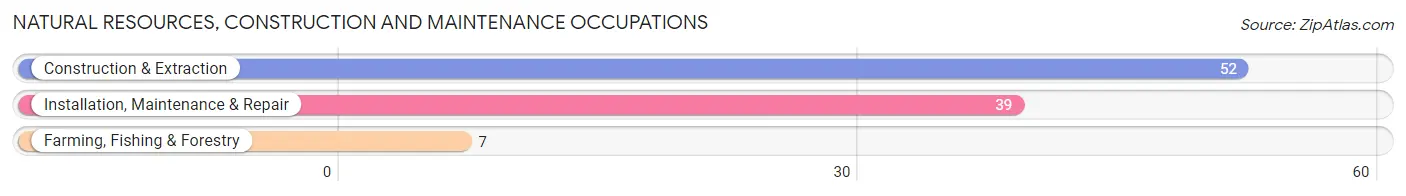
Natural Resources, Construction and Maintenance Occupations
The most common Natural Resources, Construction and Maintenance occupations in Coburg are Construction & Extraction (52 | 8.9%), Installation, Maintenance & Repair (39 | 6.7%), and Farming, Fishing & Forestry (7 | 1.2%).
Natural Resources, Construction and Maintenance Occupations by Sex
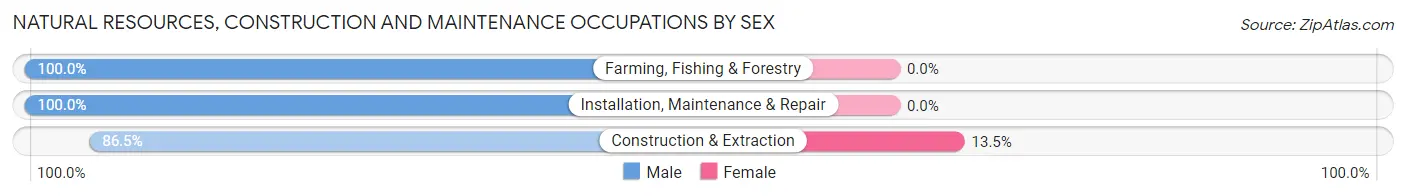
| Occupation | Male | Female |
| Farming, Fishing & Forestry | 7 (100.0%) | 0 (0.0%) |
| Construction & Extraction | 45 (86.5%) | 7 (13.5%) |
| Installation, Maintenance & Repair | 39 (100.0%) | 0 (0.0%) |
| Total (Category) | 91 (92.9%) | 7 (7.1%) |
| Total (Overall) | 313 (53.5%) | 272 (46.5%) |
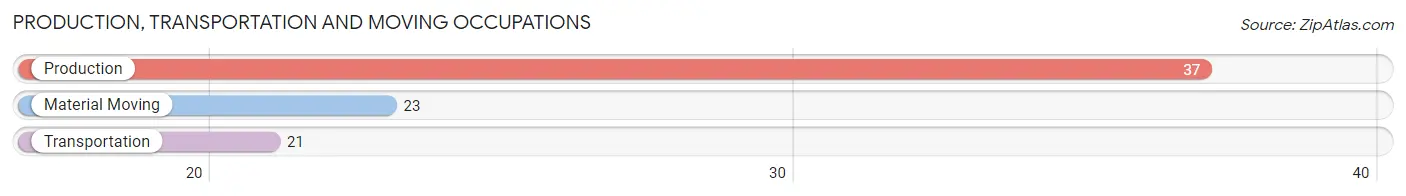
Production, Transportation and Moving Occupations
The most common Production, Transportation and Moving occupations in Coburg are Production (37 | 6.3%), Material Moving (23 | 3.9%), and Transportation (21 | 3.6%).
Production, Transportation and Moving Occupations by Sex
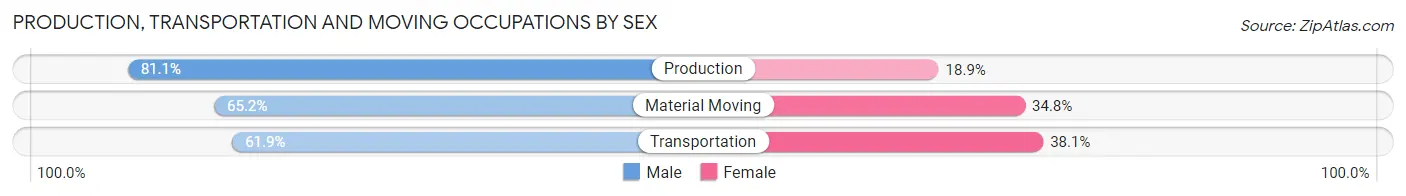
| Occupation | Male | Female |
| Production | 30 (81.1%) | 7 (18.9%) |
| Transportation | 13 (61.9%) | 8 (38.1%) |
| Material Moving | 15 (65.2%) | 8 (34.8%) |
| Total (Category) | 58 (71.6%) | 23 (28.4%) |
| Total (Overall) | 313 (53.5%) | 272 (46.5%) |
Employment Industries by Sex in Coburg
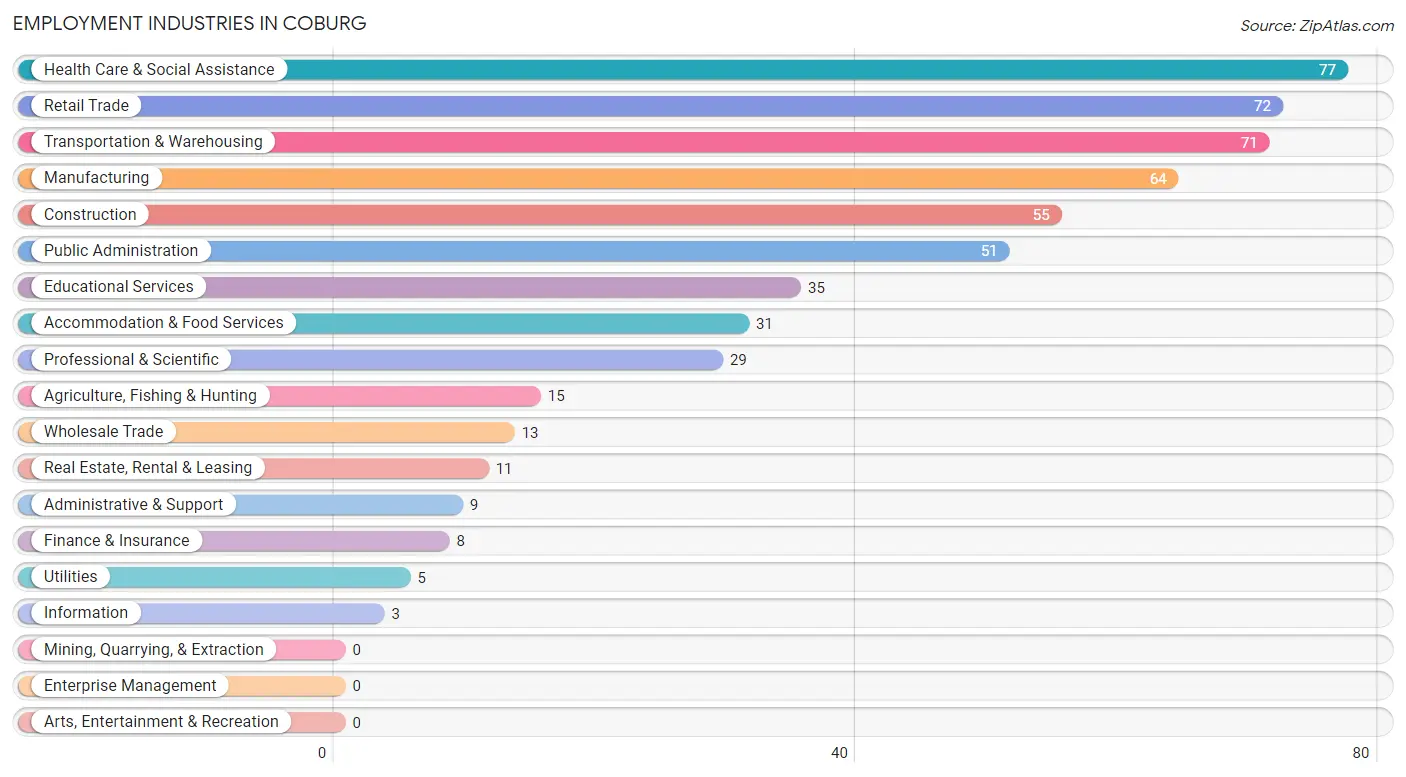
Employment Industries in Coburg
The major employment industries in Coburg include Health Care & Social Assistance (77 | 13.2%), Retail Trade (72 | 12.3%), Transportation & Warehousing (71 | 12.1%), Manufacturing (64 | 10.9%), and Construction (55 | 9.4%).
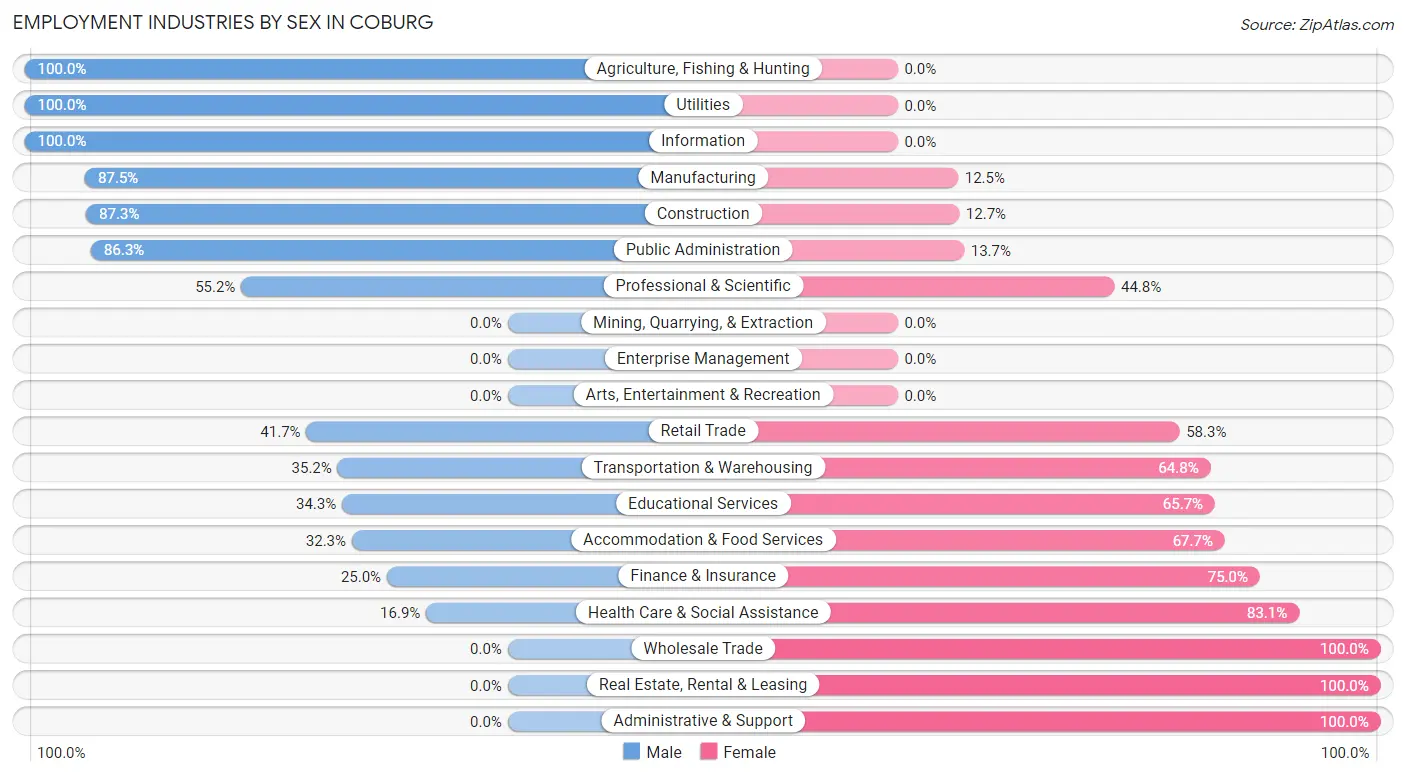
Employment Industries by Sex in Coburg
The Coburg industries that see more men than women are Agriculture, Fishing & Hunting (100.0%), Utilities (100.0%), and Information (100.0%), whereas the industries that tend to have a higher number of women are Wholesale Trade (100.0%), Real Estate, Rental & Leasing (100.0%), and Administrative & Support (100.0%).
| Industry | Male | Female |
| Agriculture, Fishing & Hunting | 15 (100.0%) | 0 (0.0%) |
| Mining, Quarrying, & Extraction | 0 (0.0%) | 0 (0.0%) |
| Construction | 48 (87.3%) | 7 (12.7%) |
| Manufacturing | 56 (87.5%) | 8 (12.5%) |
| Wholesale Trade | 0 (0.0%) | 13 (100.0%) |
| Retail Trade | 30 (41.7%) | 42 (58.3%) |
| Transportation & Warehousing | 25 (35.2%) | 46 (64.8%) |
| Utilities | 5 (100.0%) | 0 (0.0%) |
| Information | 3 (100.0%) | 0 (0.0%) |
| Finance & Insurance | 2 (25.0%) | 6 (75.0%) |
| Real Estate, Rental & Leasing | 0 (0.0%) | 11 (100.0%) |
| Professional & Scientific | 16 (55.2%) | 13 (44.8%) |
| Enterprise Management | 0 (0.0%) | 0 (0.0%) |
| Administrative & Support | 0 (0.0%) | 9 (100.0%) |
| Educational Services | 12 (34.3%) | 23 (65.7%) |
| Health Care & Social Assistance | 13 (16.9%) | 64 (83.1%) |
| Arts, Entertainment & Recreation | 0 (0.0%) | 0 (0.0%) |
| Accommodation & Food Services | 10 (32.3%) | 21 (67.7%) |
| Public Administration | 44 (86.3%) | 7 (13.7%) |
| Total | 313 (53.5%) | 272 (46.5%) |
Education in Coburg
School Enrollment in Coburg
The most common levels of schooling among the 312 students in Coburg are middle school (98 | 31.4%), high school (77 | 24.7%), and elementary school (59 | 18.9%).
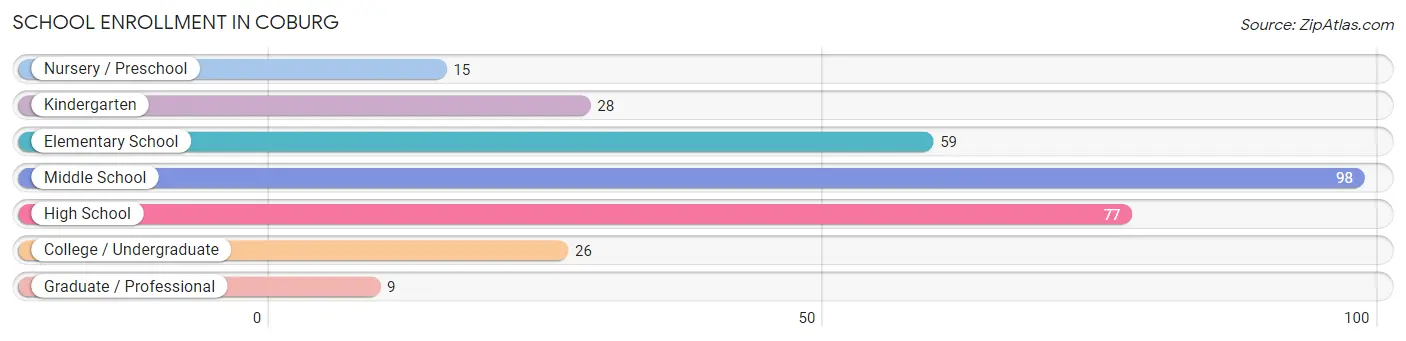
| School Level | # Students | % Students |
| Nursery / Preschool | 15 | 4.8% |
| Kindergarten | 28 | 9.0% |
| Elementary School | 59 | 18.9% |
| Middle School | 98 | 31.4% |
| High School | 77 | 24.7% |
| College / Undergraduate | 26 | 8.3% |
| Graduate / Professional | 9 | 2.9% |
| Total | 312 | 100.0% |
School Enrollment by Age by Funding Source in Coburg
Out of a total of 312 students who are enrolled in schools in Coburg, 36 (11.5%) attend a private institution, while the remaining 276 (88.5%) are enrolled in public schools. The age group of 35 years and over has the highest likelihood of being enrolled in private schools, with 19 (100.0% in the age bracket) enrolled. Conversely, the age group of 5 to 9 year old has the lowest likelihood of being enrolled in a private school, with 91 (100.0% in the age bracket) attending a public institution.
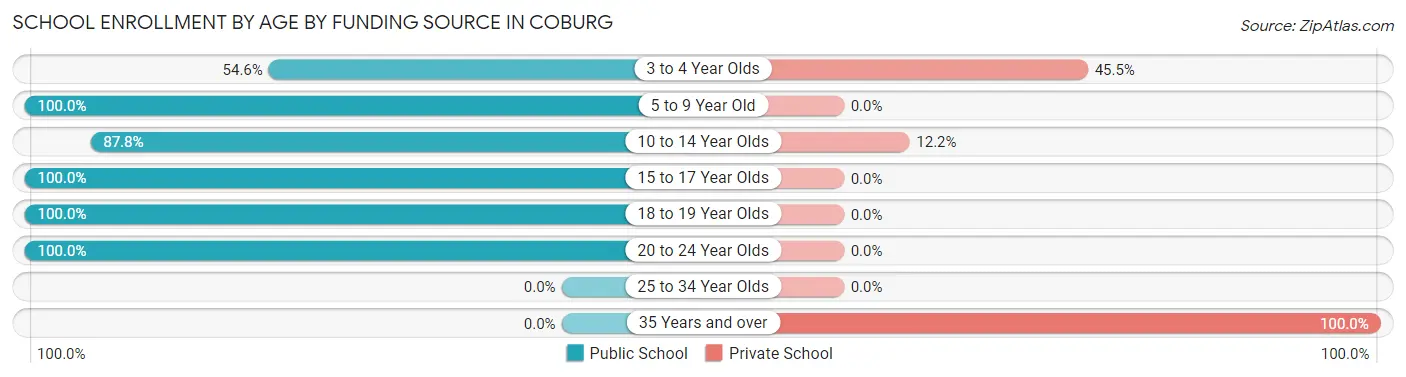
| Age Bracket | Public School | Private School |
| 3 to 4 Year Olds | 6 (54.5%) | 5 (45.5%) |
| 5 to 9 Year Old | 91 (100.0%) | 0 (0.0%) |
| 10 to 14 Year Olds | 86 (87.8%) | 12 (12.2%) |
| 15 to 17 Year Olds | 74 (100.0%) | 0 (0.0%) |
| 18 to 19 Year Olds | 14 (100.0%) | 0 (0.0%) |
| 20 to 24 Year Olds | 5 (100.0%) | 0 (0.0%) |
| 25 to 34 Year Olds | 0 (0.0%) | 0 (0.0%) |
| 35 Years and over | 0 (0.0%) | 19 (100.0%) |
| Total | 276 (88.5%) | 36 (11.5%) |
Educational Attainment by Field of Study in Coburg
Education (89 | 29.1%), business (42 | 13.7%), social sciences (40 | 13.1%), psychology (37 | 12.1%), and bio, nature & agricultural (23 | 7.5%) are the most common fields of study among 306 individuals in Coburg who have obtained a bachelor's degree or higher.
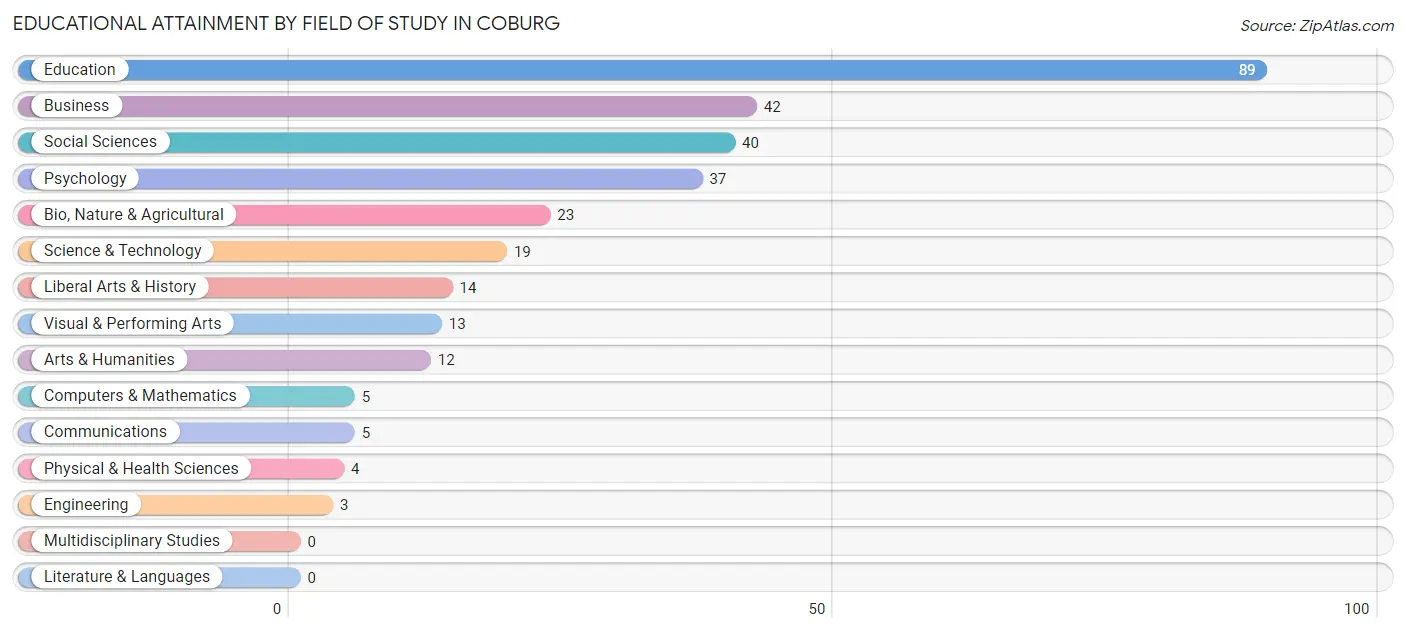
| Field of Study | # Graduates | % Graduates |
| Computers & Mathematics | 5 | 1.6% |
| Bio, Nature & Agricultural | 23 | 7.5% |
| Physical & Health Sciences | 4 | 1.3% |
| Psychology | 37 | 12.1% |
| Social Sciences | 40 | 13.1% |
| Engineering | 3 | 1.0% |
| Multidisciplinary Studies | 0 | 0.0% |
| Science & Technology | 19 | 6.2% |
| Business | 42 | 13.7% |
| Education | 89 | 29.1% |
| Literature & Languages | 0 | 0.0% |
| Liberal Arts & History | 14 | 4.6% |
| Visual & Performing Arts | 13 | 4.3% |
| Communications | 5 | 1.6% |
| Arts & Humanities | 12 | 3.9% |
| Total | 306 | 100.0% |
Transportation & Commute in Coburg
Vehicle Availability by Sex in Coburg
The most prevalent vehicle ownership categories in Coburg are males with 2 vehicles (109, accounting for 34.8%) and females with 2 vehicles (115, making up 40.8%).
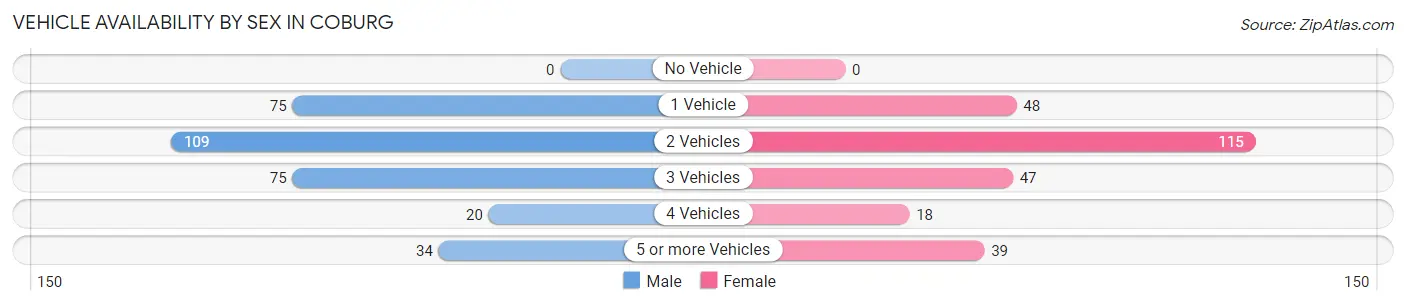
| Vehicles Available | Male | Female |
| No Vehicle | 0 (0.0%) | 0 (0.0%) |
| 1 Vehicle | 75 (24.0%) | 48 (18.0%) |
| 2 Vehicles | 109 (34.8%) | 115 (43.1%) |
| 3 Vehicles | 75 (24.0%) | 47 (17.6%) |
| 4 Vehicles | 20 (6.4%) | 18 (6.7%) |
| 5 or more Vehicles | 34 (10.9%) | 39 (14.6%) |
| Total | 313 (100.0%) | 267 (100.0%) |
Commute Time in Coburg
The most frequently occuring commute durations in Coburg are 20 to 24 minutes (133 commuters, 27.9%), 15 to 19 minutes (104 commuters, 21.8%), and 30 to 34 minutes (71 commuters, 14.9%).
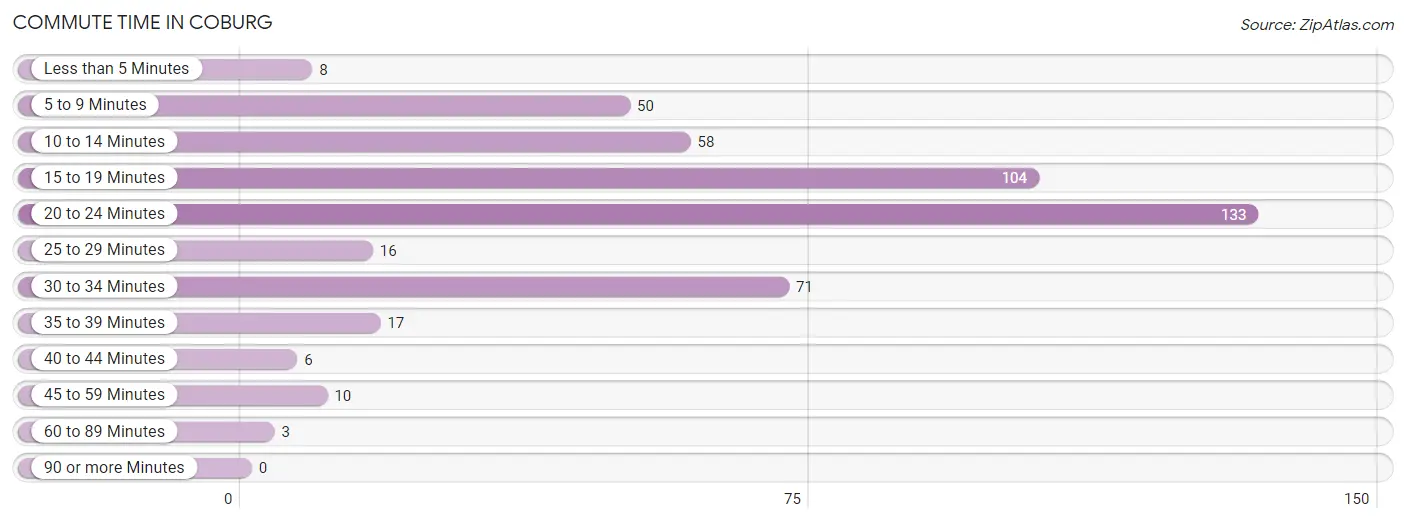
| Commute Time | # Commuters | % Commuters |
| Less than 5 Minutes | 8 | 1.7% |
| 5 to 9 Minutes | 50 | 10.5% |
| 10 to 14 Minutes | 58 | 12.2% |
| 15 to 19 Minutes | 104 | 21.8% |
| 20 to 24 Minutes | 133 | 27.9% |
| 25 to 29 Minutes | 16 | 3.4% |
| 30 to 34 Minutes | 71 | 14.9% |
| 35 to 39 Minutes | 17 | 3.6% |
| 40 to 44 Minutes | 6 | 1.3% |
| 45 to 59 Minutes | 10 | 2.1% |
| 60 to 89 Minutes | 3 | 0.6% |
| 90 or more Minutes | 0 | 0.0% |
Commute Time by Sex in Coburg
The most common commute times in Coburg are 15 to 19 minutes (54 commuters, 22.1%) for males and 20 to 24 minutes (79 commuters, 34.1%) for females.
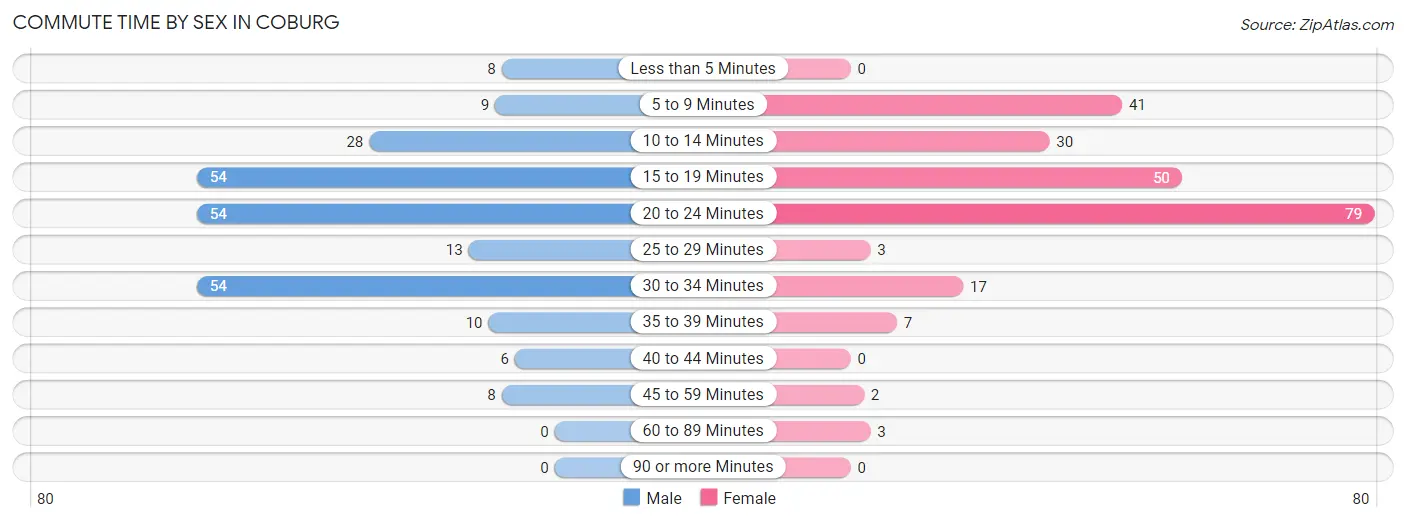
| Commute Time | Male | Female |
| Less than 5 Minutes | 8 (3.3%) | 0 (0.0%) |
| 5 to 9 Minutes | 9 (3.7%) | 41 (17.7%) |
| 10 to 14 Minutes | 28 (11.5%) | 30 (12.9%) |
| 15 to 19 Minutes | 54 (22.1%) | 50 (21.5%) |
| 20 to 24 Minutes | 54 (22.1%) | 79 (34.1%) |
| 25 to 29 Minutes | 13 (5.3%) | 3 (1.3%) |
| 30 to 34 Minutes | 54 (22.1%) | 17 (7.3%) |
| 35 to 39 Minutes | 10 (4.1%) | 7 (3.0%) |
| 40 to 44 Minutes | 6 (2.5%) | 0 (0.0%) |
| 45 to 59 Minutes | 8 (3.3%) | 2 (0.9%) |
| 60 to 89 Minutes | 0 (0.0%) | 3 (1.3%) |
| 90 or more Minutes | 0 (0.0%) | 0 (0.0%) |
Time of Departure to Work by Sex in Coburg
The most frequent times of departure to work in Coburg are 5:30 AM to 5:59 AM (60, 24.6%) for males and 6:00 AM to 6:29 AM (74, 31.9%) for females.
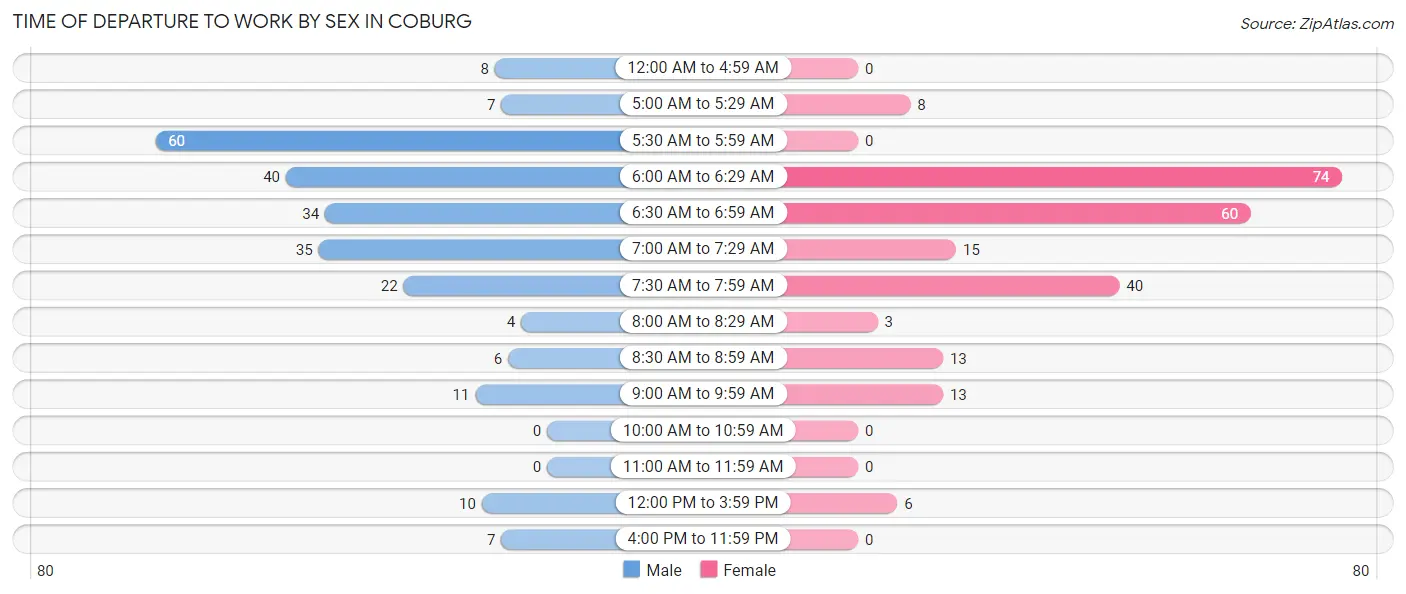
| Time of Departure | Male | Female |
| 12:00 AM to 4:59 AM | 8 (3.3%) | 0 (0.0%) |
| 5:00 AM to 5:29 AM | 7 (2.9%) | 8 (3.5%) |
| 5:30 AM to 5:59 AM | 60 (24.6%) | 0 (0.0%) |
| 6:00 AM to 6:29 AM | 40 (16.4%) | 74 (31.9%) |
| 6:30 AM to 6:59 AM | 34 (13.9%) | 60 (25.9%) |
| 7:00 AM to 7:29 AM | 35 (14.3%) | 15 (6.5%) |
| 7:30 AM to 7:59 AM | 22 (9.0%) | 40 (17.2%) |
| 8:00 AM to 8:29 AM | 4 (1.6%) | 3 (1.3%) |
| 8:30 AM to 8:59 AM | 6 (2.5%) | 13 (5.6%) |
| 9:00 AM to 9:59 AM | 11 (4.5%) | 13 (5.6%) |
| 10:00 AM to 10:59 AM | 0 (0.0%) | 0 (0.0%) |
| 11:00 AM to 11:59 AM | 0 (0.0%) | 0 (0.0%) |
| 12:00 PM to 3:59 PM | 10 (4.1%) | 6 (2.6%) |
| 4:00 PM to 11:59 PM | 7 (2.9%) | 0 (0.0%) |
| Total | 244 (100.0%) | 232 (100.0%) |
Housing Occupancy in Coburg
Occupancy by Ownership in Coburg
Of the total 497 dwellings in Coburg, owner-occupied units account for 405 (81.5%), while renter-occupied units make up 92 (18.5%).
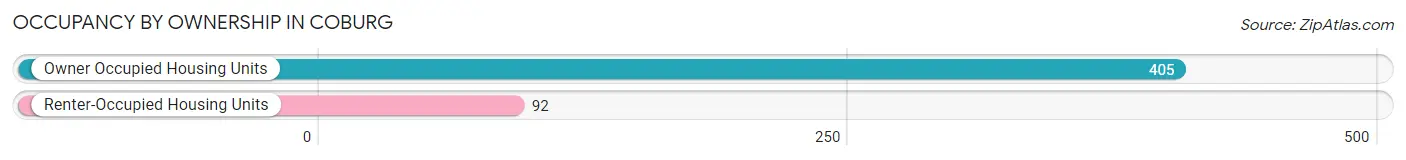
| Occupancy | # Housing Units | % Housing Units |
| Owner Occupied Housing Units | 405 | 81.5% |
| Renter-Occupied Housing Units | 92 | 18.5% |
| Total Occupied Housing Units | 497 | 100.0% |
Occupancy by Household Size in Coburg
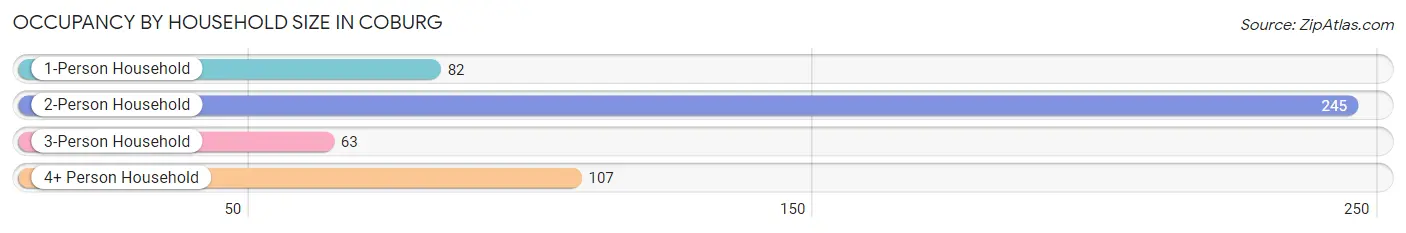
| Household Size | # Housing Units | % Housing Units |
| 1-Person Household | 82 | 16.5% |
| 2-Person Household | 245 | 49.3% |
| 3-Person Household | 63 | 12.7% |
| 4+ Person Household | 107 | 21.5% |
| Total Housing Units | 497 | 100.0% |
Occupancy by Ownership by Household Size in Coburg
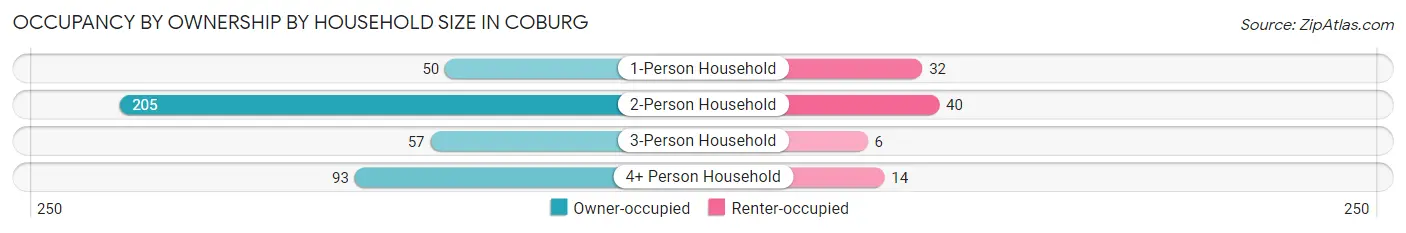
| Household Size | Owner-occupied | Renter-occupied |
| 1-Person Household | 50 (61.0%) | 32 (39.0%) |
| 2-Person Household | 205 (83.7%) | 40 (16.3%) |
| 3-Person Household | 57 (90.5%) | 6 (9.5%) |
| 4+ Person Household | 93 (86.9%) | 14 (13.1%) |
| Total Housing Units | 405 (81.5%) | 92 (18.5%) |
Occupancy by Educational Attainment in Coburg
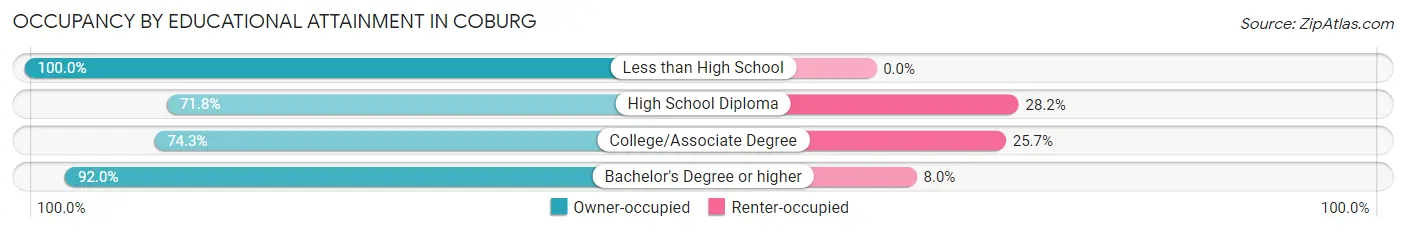
| Household Size | Owner-occupied | Renter-occupied |
| Less than High School | 36 (100.0%) | 0 (0.0%) |
| High School Diploma | 61 (71.8%) | 24 (28.2%) |
| College/Associate Degree | 159 (74.3%) | 55 (25.7%) |
| Bachelor's Degree or higher | 149 (92.0%) | 13 (8.0%) |
Occupancy by Age of Householder in Coburg
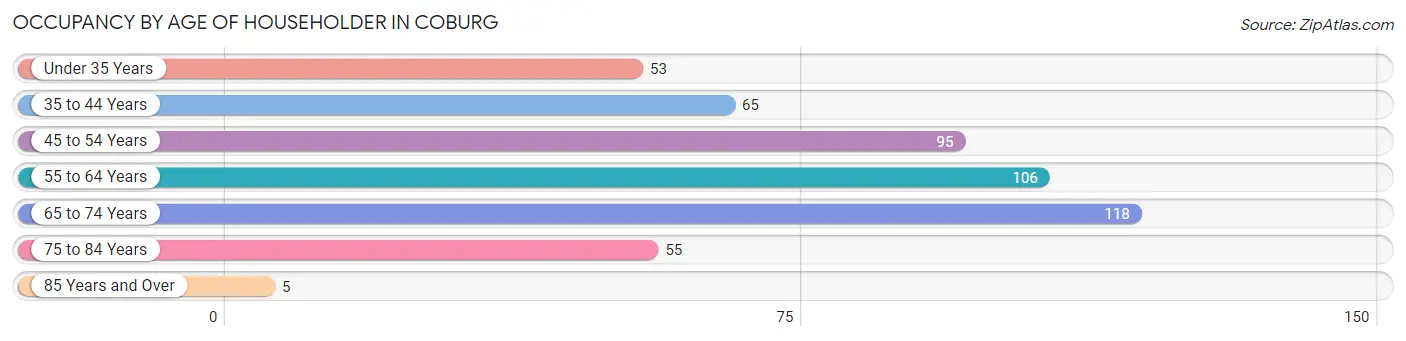
| Age Bracket | # Households | % Households |
| Under 35 Years | 53 | 10.7% |
| 35 to 44 Years | 65 | 13.1% |
| 45 to 54 Years | 95 | 19.1% |
| 55 to 64 Years | 106 | 21.3% |
| 65 to 74 Years | 118 | 23.7% |
| 75 to 84 Years | 55 | 11.1% |
| 85 Years and Over | 5 | 1.0% |
| Total | 497 | 100.0% |
Housing Finances in Coburg
Median Income by Occupancy in Coburg
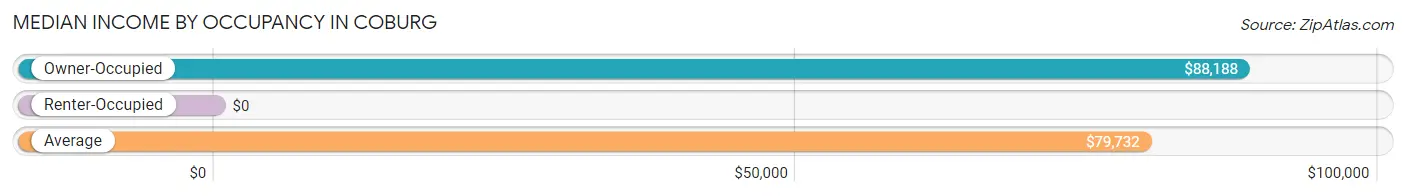
| Occupancy Type | # Households | Median Income |
| Owner-Occupied | 405 (81.5%) | $88,188 |
| Renter-Occupied | 92 (18.5%) | $0 |
| Average | 497 (100.0%) | $79,732 |
Occupancy by Householder Income Bracket in Coburg
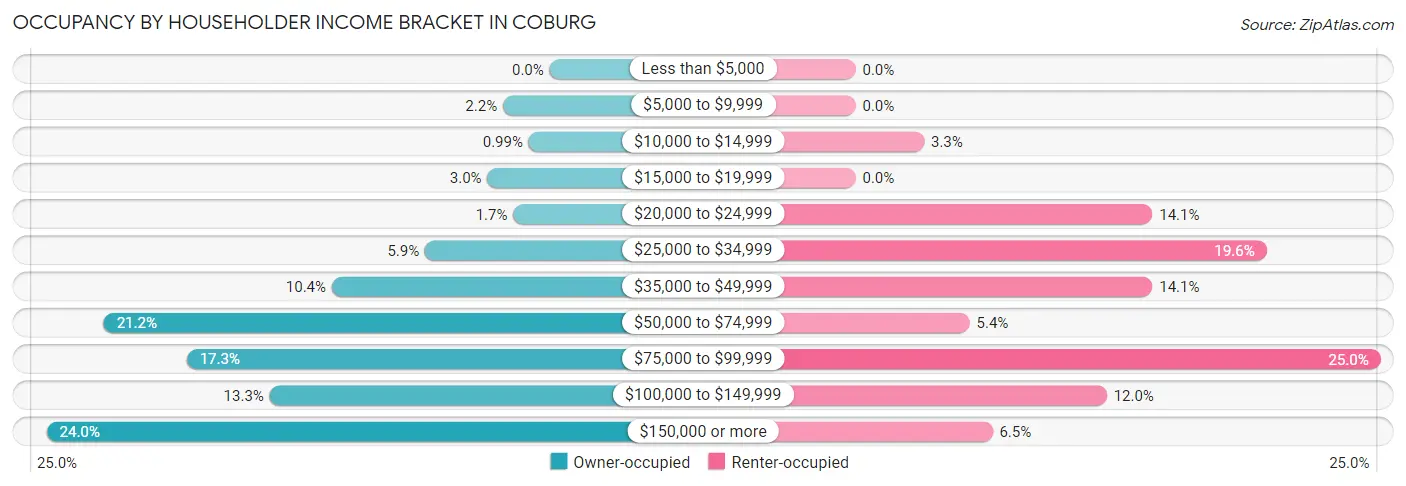
| Income Bracket | Owner-occupied | Renter-occupied |
| Less than $5,000 | 0 (0.0%) | 0 (0.0%) |
| $5,000 to $9,999 | 9 (2.2%) | 0 (0.0%) |
| $10,000 to $14,999 | 4 (1.0%) | 3 (3.3%) |
| $15,000 to $19,999 | 12 (3.0%) | 0 (0.0%) |
| $20,000 to $24,999 | 7 (1.7%) | 13 (14.1%) |
| $25,000 to $34,999 | 24 (5.9%) | 18 (19.6%) |
| $35,000 to $49,999 | 42 (10.4%) | 13 (14.1%) |
| $50,000 to $74,999 | 86 (21.2%) | 5 (5.4%) |
| $75,000 to $99,999 | 70 (17.3%) | 23 (25.0%) |
| $100,000 to $149,999 | 54 (13.3%) | 11 (12.0%) |
| $150,000 or more | 97 (23.9%) | 6 (6.5%) |
| Total | 405 (100.0%) | 92 (100.0%) |
Monthly Housing Cost Tiers in Coburg
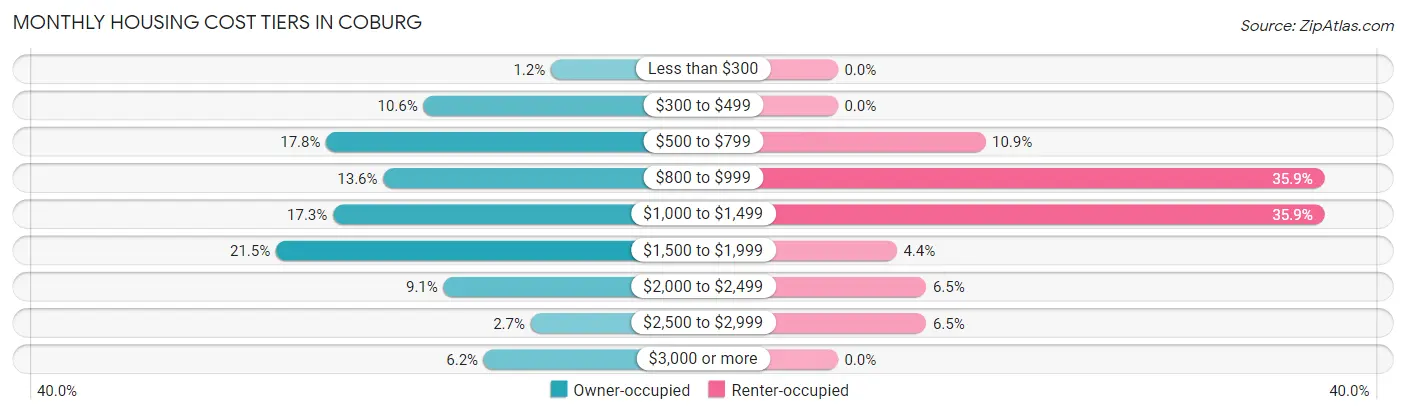
| Monthly Cost | Owner-occupied | Renter-occupied |
| Less than $300 | 5 (1.2%) | 0 (0.0%) |
| $300 to $499 | 43 (10.6%) | 0 (0.0%) |
| $500 to $799 | 72 (17.8%) | 10 (10.9%) |
| $800 to $999 | 55 (13.6%) | 33 (35.9%) |
| $1,000 to $1,499 | 70 (17.3%) | 33 (35.9%) |
| $1,500 to $1,999 | 87 (21.5%) | 4 (4.3%) |
| $2,000 to $2,499 | 37 (9.1%) | 6 (6.5%) |
| $2,500 to $2,999 | 11 (2.7%) | 6 (6.5%) |
| $3,000 or more | 25 (6.2%) | 0 (0.0%) |
| Total | 405 (100.0%) | 92 (100.0%) |
Physical Housing Characteristics in Coburg
Housing Structures in Coburg
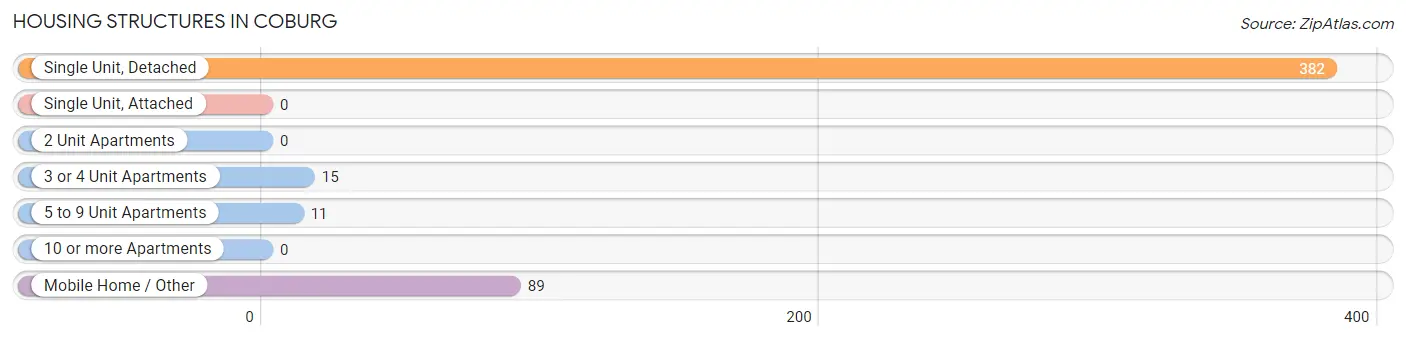
| Structure Type | # Housing Units | % Housing Units |
| Single Unit, Detached | 382 | 76.9% |
| Single Unit, Attached | 0 | 0.0% |
| 2 Unit Apartments | 0 | 0.0% |
| 3 or 4 Unit Apartments | 15 | 3.0% |
| 5 to 9 Unit Apartments | 11 | 2.2% |
| 10 or more Apartments | 0 | 0.0% |
| Mobile Home / Other | 89 | 17.9% |
| Total | 497 | 100.0% |
Housing Structures by Occupancy in Coburg
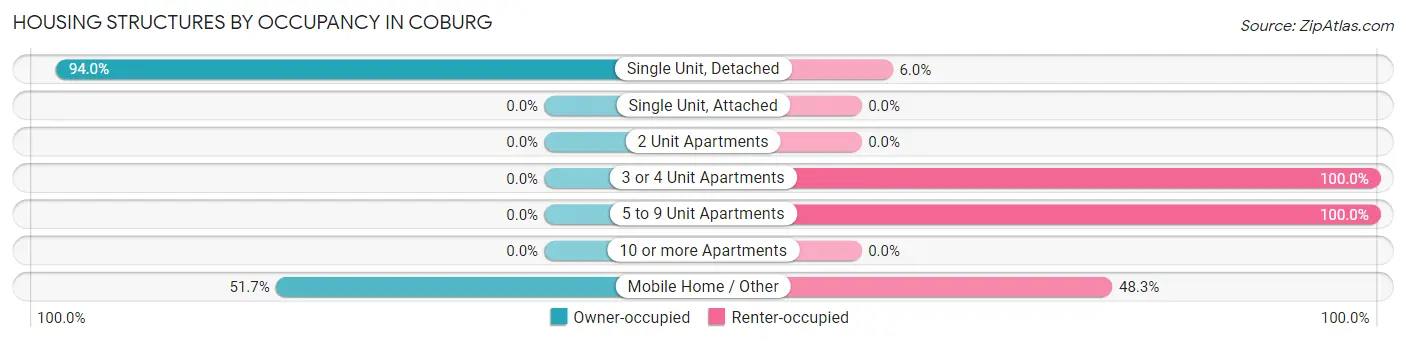
| Structure Type | Owner-occupied | Renter-occupied |
| Single Unit, Detached | 359 (94.0%) | 23 (6.0%) |
| Single Unit, Attached | 0 (0.0%) | 0 (0.0%) |
| 2 Unit Apartments | 0 (0.0%) | 0 (0.0%) |
| 3 or 4 Unit Apartments | 0 (0.0%) | 15 (100.0%) |
| 5 to 9 Unit Apartments | 0 (0.0%) | 11 (100.0%) |
| 10 or more Apartments | 0 (0.0%) | 0 (0.0%) |
| Mobile Home / Other | 46 (51.7%) | 43 (48.3%) |
| Total | 405 (81.5%) | 92 (18.5%) |
Housing Structures by Number of Rooms in Coburg
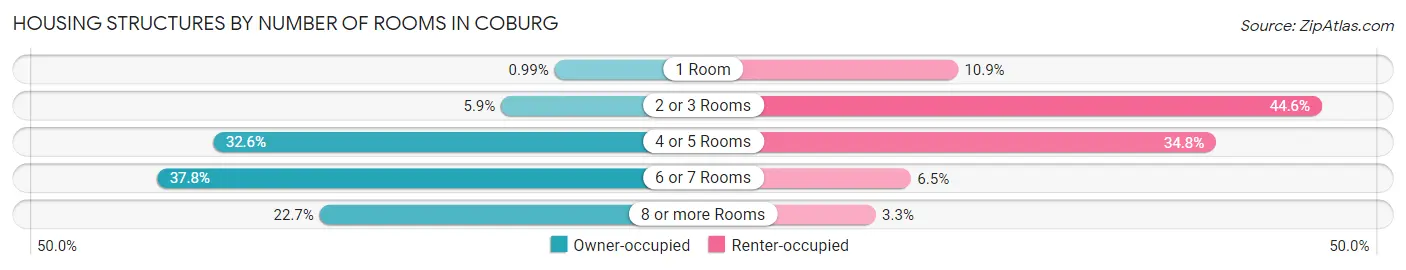
| Number of Rooms | Owner-occupied | Renter-occupied |
| 1 Room | 4 (1.0%) | 10 (10.9%) |
| 2 or 3 Rooms | 24 (5.9%) | 41 (44.6%) |
| 4 or 5 Rooms | 132 (32.6%) | 32 (34.8%) |
| 6 or 7 Rooms | 153 (37.8%) | 6 (6.5%) |
| 8 or more Rooms | 92 (22.7%) | 3 (3.3%) |
| Total | 405 (100.0%) | 92 (100.0%) |
Housing Structure by Heating Type in Coburg
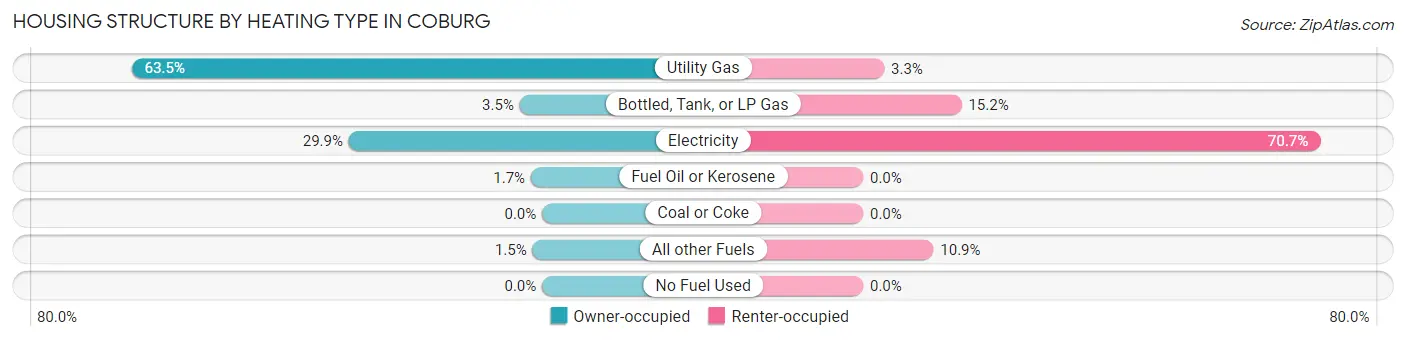
| Heating Type | Owner-occupied | Renter-occupied |
| Utility Gas | 257 (63.5%) | 3 (3.3%) |
| Bottled, Tank, or LP Gas | 14 (3.5%) | 14 (15.2%) |
| Electricity | 121 (29.9%) | 65 (70.7%) |
| Fuel Oil or Kerosene | 7 (1.7%) | 0 (0.0%) |
| Coal or Coke | 0 (0.0%) | 0 (0.0%) |
| All other Fuels | 6 (1.5%) | 10 (10.9%) |
| No Fuel Used | 0 (0.0%) | 0 (0.0%) |
| Total | 405 (100.0%) | 92 (100.0%) |
Household Vehicle Usage in Coburg
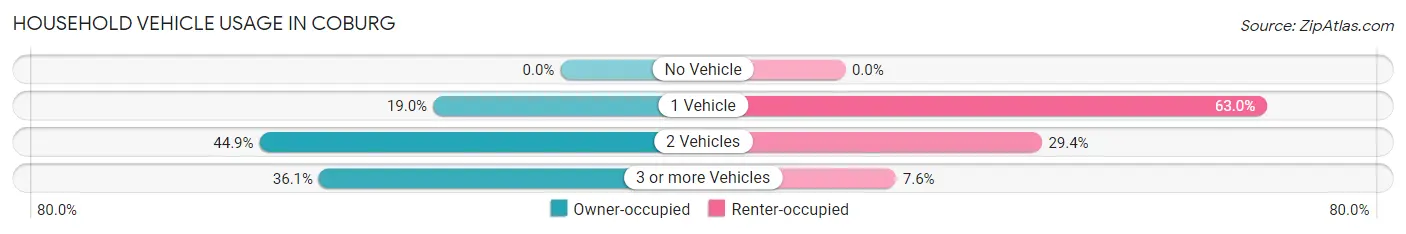
| Vehicles per Household | Owner-occupied | Renter-occupied |
| No Vehicle | 0 (0.0%) | 0 (0.0%) |
| 1 Vehicle | 77 (19.0%) | 58 (63.0%) |
| 2 Vehicles | 182 (44.9%) | 27 (29.3%) |
| 3 or more Vehicles | 146 (36.0%) | 7 (7.6%) |
| Total | 405 (100.0%) | 92 (100.0%) |
Real Estate & Mortgages in Coburg
Real Estate and Mortgage Overview in Coburg
| Characteristic | Without Mortgage | With Mortgage |
| Housing Units | 174 | 231 |
| Median Property Value | $431,600 | $377,500 |
| Median Household Income | $57,917 | $67 |
| Monthly Housing Costs | $686 | $25 |
| Real Estate Taxes | $4,313 | $14 |
Property Value by Mortgage Status in Coburg
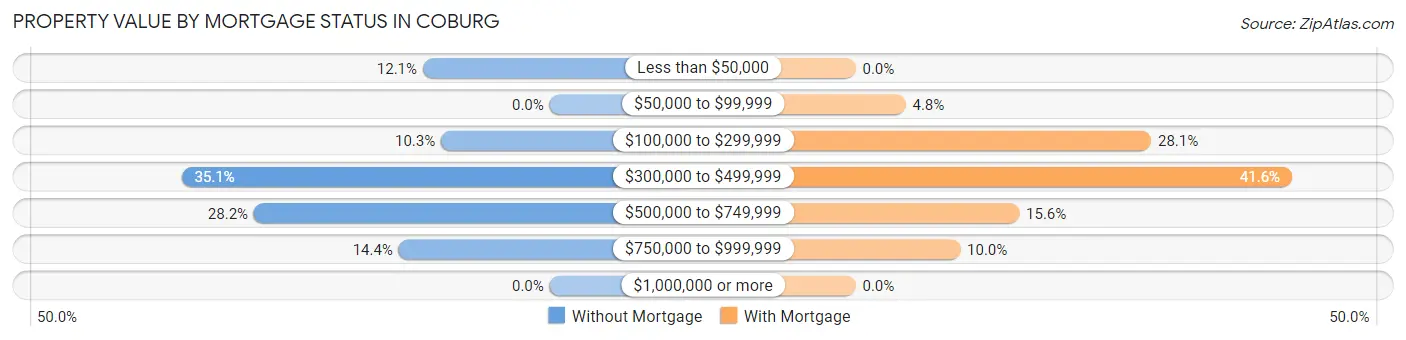
| Property Value | Without Mortgage | With Mortgage |
| Less than $50,000 | 21 (12.1%) | 0 (0.0%) |
| $50,000 to $99,999 | 0 (0.0%) | 11 (4.8%) |
| $100,000 to $299,999 | 18 (10.3%) | 65 (28.1%) |
| $300,000 to $499,999 | 61 (35.1%) | 96 (41.6%) |
| $500,000 to $749,999 | 49 (28.2%) | 36 (15.6%) |
| $750,000 to $999,999 | 25 (14.4%) | 23 (10.0%) |
| $1,000,000 or more | 0 (0.0%) | 0 (0.0%) |
| Total | 174 (100.0%) | 231 (100.0%) |
Household Income by Mortgage Status in Coburg
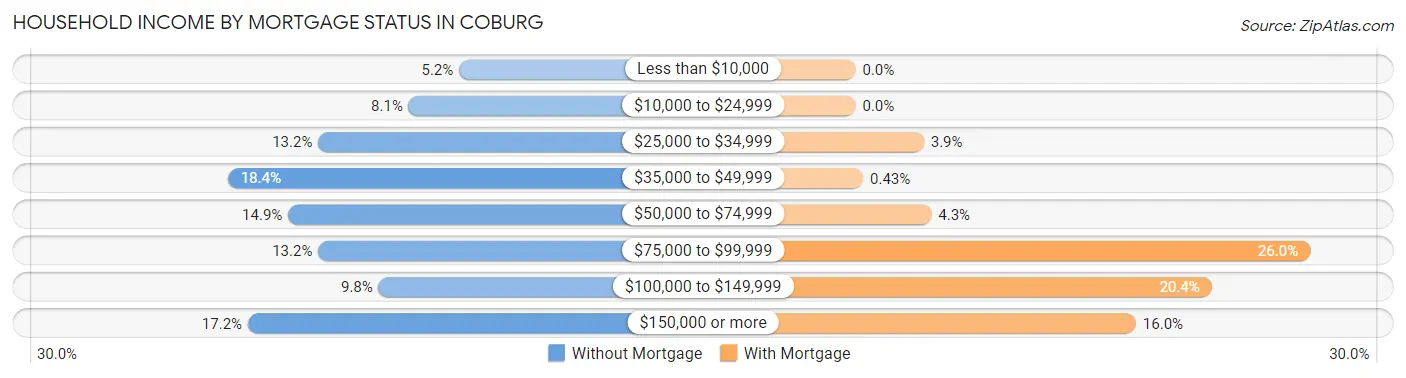
| Household Income | Without Mortgage | With Mortgage |
| Less than $10,000 | 9 (5.2%) | 0 (0.0%) |
| $10,000 to $24,999 | 14 (8.1%) | 0 (0.0%) |
| $25,000 to $34,999 | 23 (13.2%) | 9 (3.9%) |
| $35,000 to $49,999 | 32 (18.4%) | 1 (0.4%) |
| $50,000 to $74,999 | 26 (14.9%) | 10 (4.3%) |
| $75,000 to $99,999 | 23 (13.2%) | 60 (26.0%) |
| $100,000 to $149,999 | 17 (9.8%) | 47 (20.3%) |
| $150,000 or more | 30 (17.2%) | 37 (16.0%) |
| Total | 174 (100.0%) | 231 (100.0%) |
Property Value to Household Income Ratio in Coburg
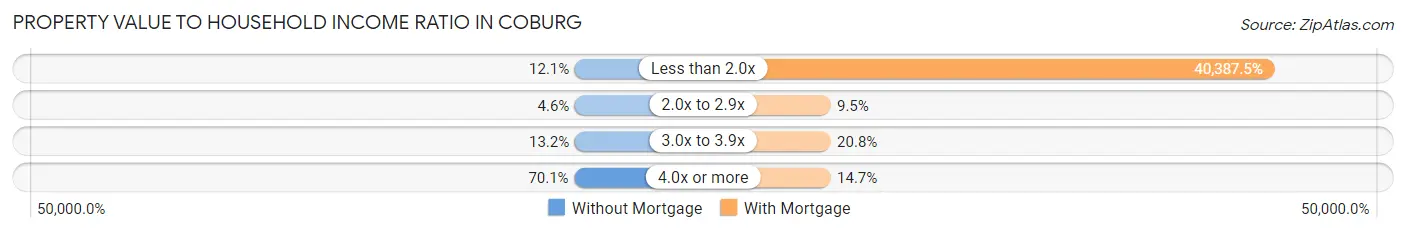
| Value-to-Income Ratio | Without Mortgage | With Mortgage |
| Less than 2.0x | 21 (12.1%) | 93,295 (40,387.5%) |
| 2.0x to 2.9x | 8 (4.6%) | 22 (9.5%) |
| 3.0x to 3.9x | 23 (13.2%) | 48 (20.8%) |
| 4.0x or more | 122 (70.1%) | 34 (14.7%) |
| Total | 174 (100.0%) | 231 (100.0%) |
Real Estate Taxes by Mortgage Status in Coburg
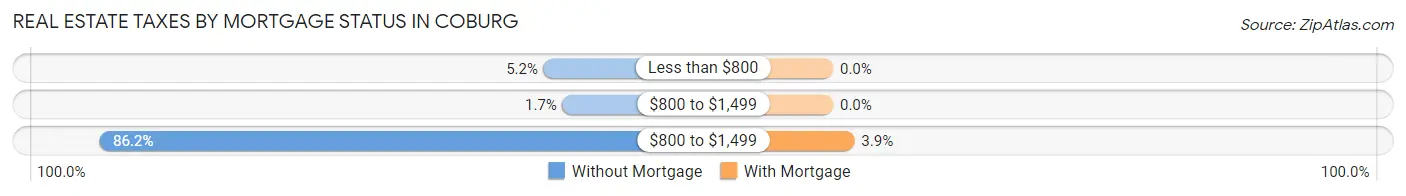
| Property Taxes | Without Mortgage | With Mortgage |
| Less than $800 | 9 (5.2%) | 0 (0.0%) |
| $800 to $1,499 | 3 (1.7%) | 0 (0.0%) |
| $800 to $1,499 | 150 (86.2%) | 9 (3.9%) |
| Total | 174 (100.0%) | 231 (100.0%) |
Health & Disability in Coburg
Health Insurance Coverage by Age in Coburg
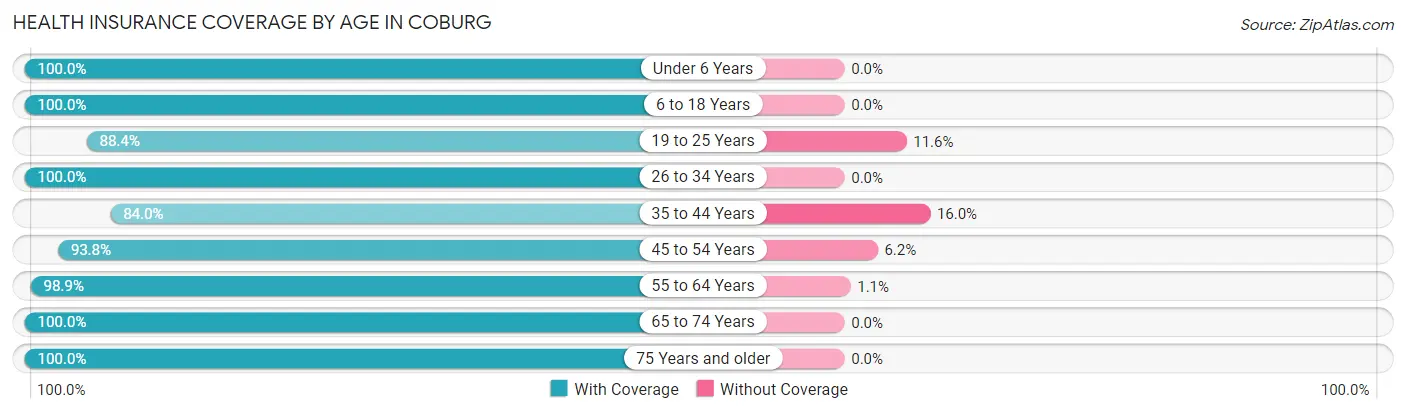
| Age Bracket | With Coverage | Without Coverage |
| Under 6 Years | 185 (100.0%) | 0 (0.0%) |
| 6 to 18 Years | 262 (100.0%) | 0 (0.0%) |
| 19 to 25 Years | 130 (88.4%) | 17 (11.6%) |
| 26 to 34 Years | 103 (100.0%) | 0 (0.0%) |
| 35 to 44 Years | 121 (84.0%) | 23 (16.0%) |
| 45 to 54 Years | 182 (93.8%) | 12 (6.2%) |
| 55 to 64 Years | 177 (98.9%) | 2 (1.1%) |
| 65 to 74 Years | 228 (100.0%) | 0 (0.0%) |
| 75 Years and older | 97 (100.0%) | 0 (0.0%) |
| Total | 1,485 (96.5%) | 54 (3.5%) |
Health Insurance Coverage by Citizenship Status in Coburg
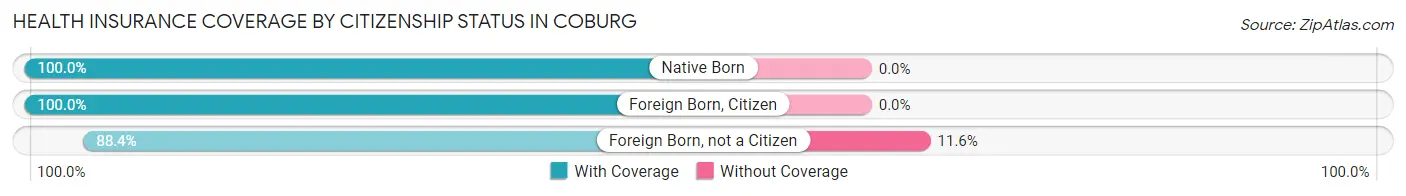
| Citizenship Status | With Coverage | Without Coverage |
| Native Born | 185 (100.0%) | 0 (0.0%) |
| Foreign Born, Citizen | 262 (100.0%) | 0 (0.0%) |
| Foreign Born, not a Citizen | 130 (88.4%) | 17 (11.6%) |
Health Insurance Coverage by Household Income in Coburg
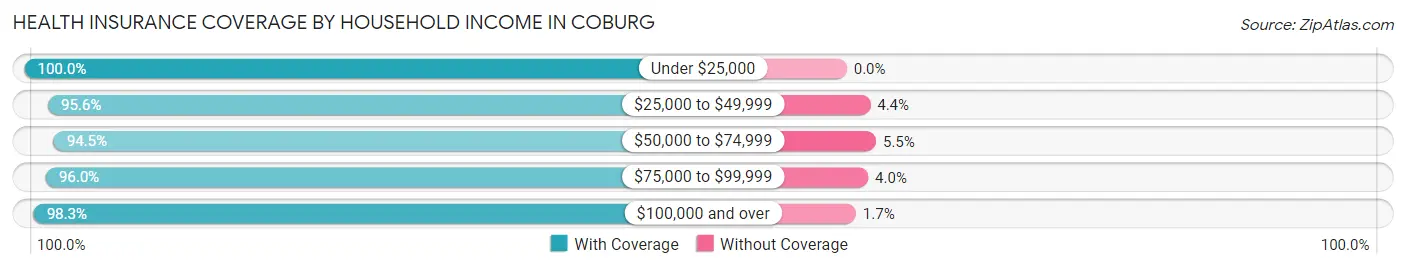
| Household Income | With Coverage | Without Coverage |
| Under $25,000 | 94 (100.0%) | 0 (0.0%) |
| $25,000 to $49,999 | 152 (95.6%) | 7 (4.4%) |
| $50,000 to $74,999 | 483 (94.5%) | 28 (5.5%) |
| $75,000 to $99,999 | 240 (96.0%) | 10 (4.0%) |
| $100,000 and over | 516 (98.3%) | 9 (1.7%) |
Public vs Private Health Insurance Coverage by Age in Coburg
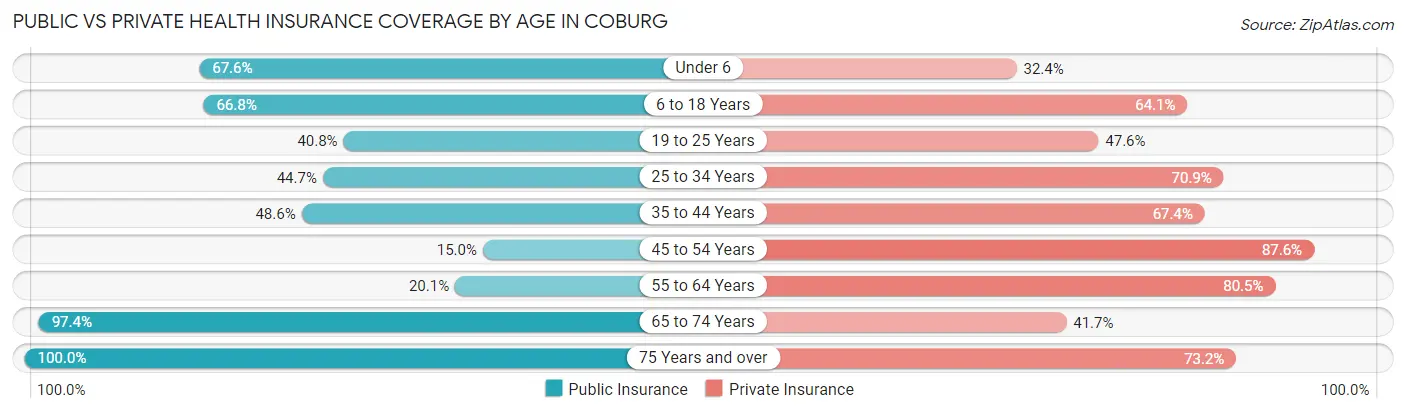
| Age Bracket | Public Insurance | Private Insurance |
| Under 6 | 125 (67.6%) | 60 (32.4%) |
| 6 to 18 Years | 175 (66.8%) | 168 (64.1%) |
| 19 to 25 Years | 60 (40.8%) | 70 (47.6%) |
| 25 to 34 Years | 46 (44.7%) | 73 (70.9%) |
| 35 to 44 Years | 70 (48.6%) | 97 (67.4%) |
| 45 to 54 Years | 29 (14.9%) | 170 (87.6%) |
| 55 to 64 Years | 36 (20.1%) | 144 (80.4%) |
| 65 to 74 Years | 222 (97.4%) | 95 (41.7%) |
| 75 Years and over | 97 (100.0%) | 71 (73.2%) |
| Total | 860 (55.9%) | 948 (61.6%) |
Disability Status by Sex by Age in Coburg
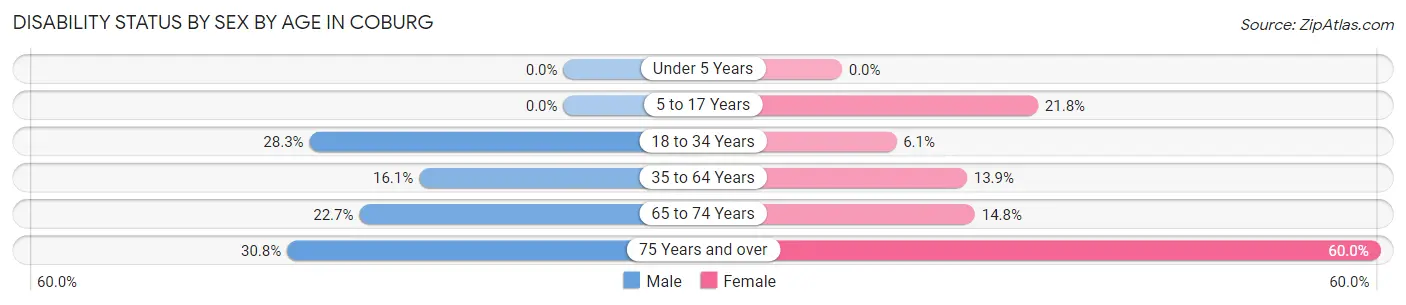
| Age Bracket | Male | Female |
| Under 5 Years | 0 (0.0%) | 0 (0.0%) |
| 5 to 17 Years | 0 (0.0%) | 38 (21.8%) |
| 18 to 34 Years | 28 (28.3%) | 10 (6.1%) |
| 35 to 64 Years | 45 (16.1%) | 33 (13.9%) |
| 65 to 74 Years | 15 (22.7%) | 24 (14.8%) |
| 75 Years and over | 16 (30.8%) | 27 (60.0%) |
Disability Class by Sex by Age in Coburg
Disability Class: Hearing Difficulty
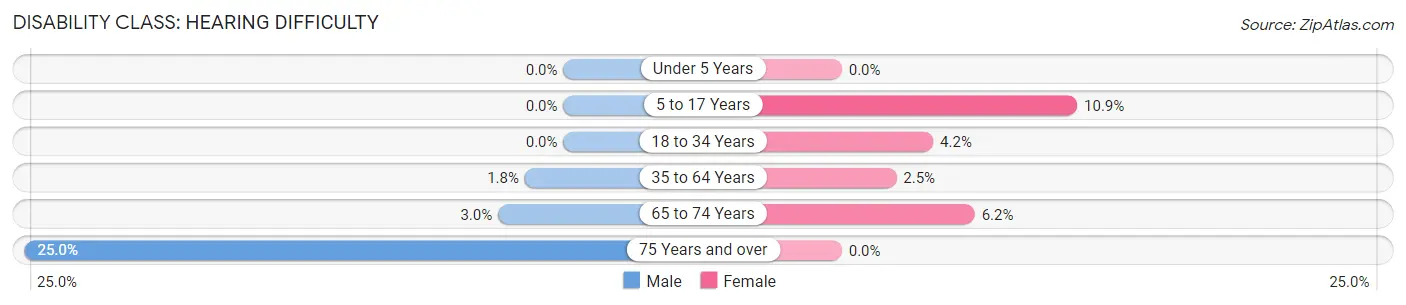
| Age Bracket | Male | Female |
| Under 5 Years | 0 (0.0%) | 0 (0.0%) |
| 5 to 17 Years | 0 (0.0%) | 19 (10.9%) |
| 18 to 34 Years | 0 (0.0%) | 7 (4.2%) |
| 35 to 64 Years | 5 (1.8%) | 6 (2.5%) |
| 65 to 74 Years | 2 (3.0%) | 10 (6.2%) |
| 75 Years and over | 13 (25.0%) | 0 (0.0%) |
Disability Class: Vision Difficulty
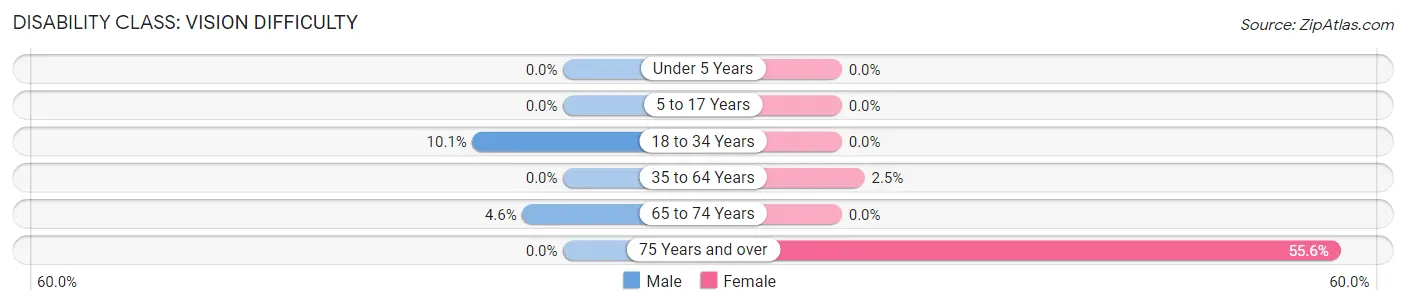
| Age Bracket | Male | Female |
| Under 5 Years | 0 (0.0%) | 0 (0.0%) |
| 5 to 17 Years | 0 (0.0%) | 0 (0.0%) |
| 18 to 34 Years | 10 (10.1%) | 0 (0.0%) |
| 35 to 64 Years | 0 (0.0%) | 6 (2.5%) |
| 65 to 74 Years | 3 (4.5%) | 0 (0.0%) |
| 75 Years and over | 0 (0.0%) | 25 (55.6%) |
Disability Class: Cognitive Difficulty
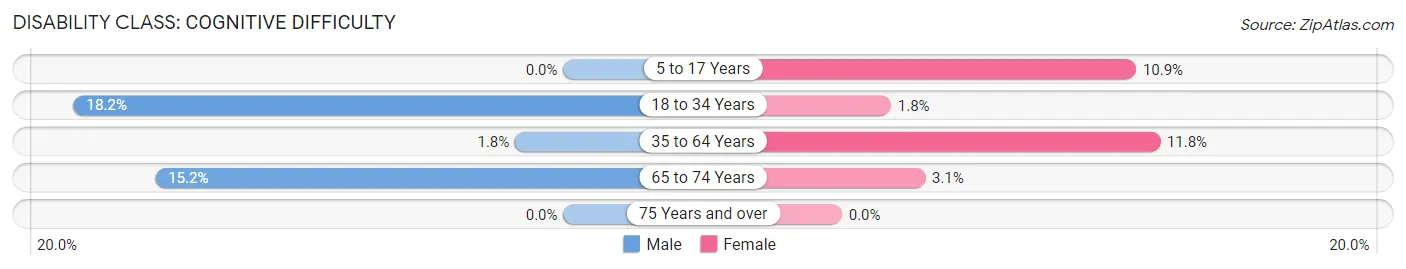
| Age Bracket | Male | Female |
| 5 to 17 Years | 0 (0.0%) | 19 (10.9%) |
| 18 to 34 Years | 18 (18.2%) | 3 (1.8%) |
| 35 to 64 Years | 5 (1.8%) | 28 (11.8%) |
| 65 to 74 Years | 10 (15.1%) | 5 (3.1%) |
| 75 Years and over | 0 (0.0%) | 0 (0.0%) |
Disability Class: Ambulatory Difficulty
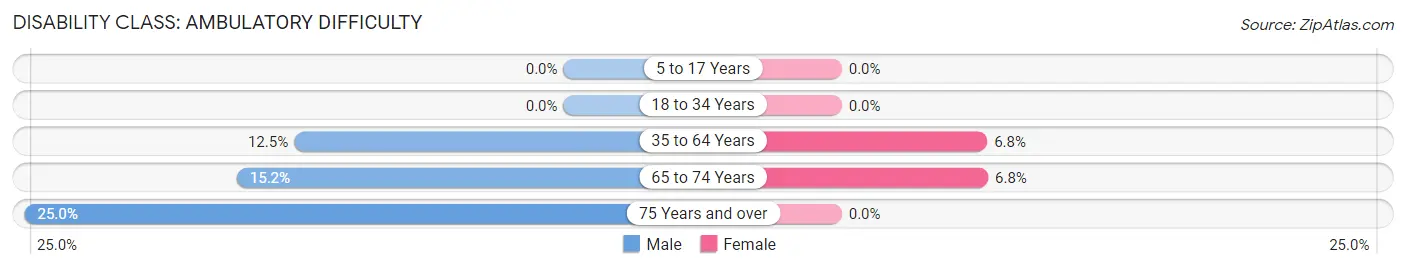
| Age Bracket | Male | Female |
| 5 to 17 Years | 0 (0.0%) | 0 (0.0%) |
| 18 to 34 Years | 0 (0.0%) | 0 (0.0%) |
| 35 to 64 Years | 35 (12.5%) | 16 (6.8%) |
| 65 to 74 Years | 10 (15.1%) | 11 (6.8%) |
| 75 Years and over | 13 (25.0%) | 0 (0.0%) |
Disability Class: Self-Care Difficulty
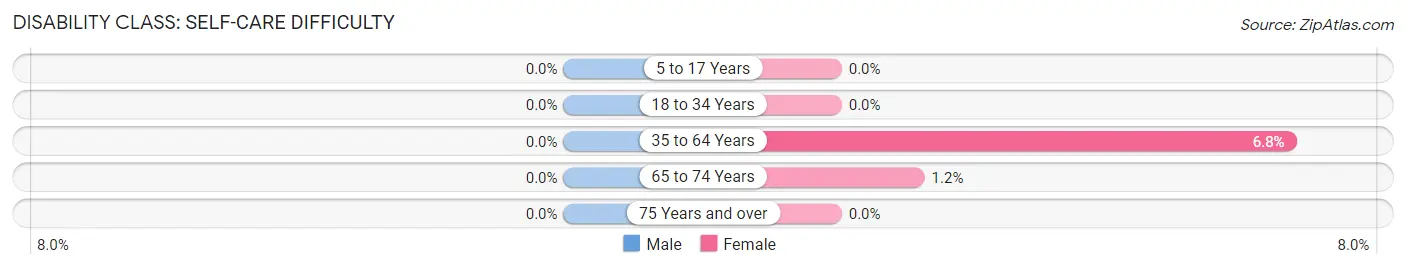
| Age Bracket | Male | Female |
| 5 to 17 Years | 0 (0.0%) | 0 (0.0%) |
| 18 to 34 Years | 0 (0.0%) | 0 (0.0%) |
| 35 to 64 Years | 0 (0.0%) | 16 (6.8%) |
| 65 to 74 Years | 0 (0.0%) | 2 (1.2%) |
| 75 Years and over | 0 (0.0%) | 0 (0.0%) |
Technology Access in Coburg
Computing Device Access in Coburg
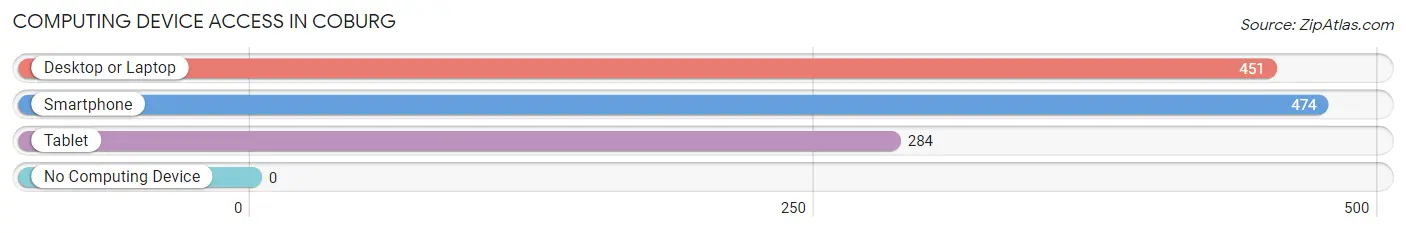
| Device Type | # Households | % Households |
| Desktop or Laptop | 451 | 90.7% |
| Smartphone | 474 | 95.4% |
| Tablet | 284 | 57.1% |
| No Computing Device | 0 | 0.0% |
| Total | 497 | 100.0% |
Internet Access in Coburg
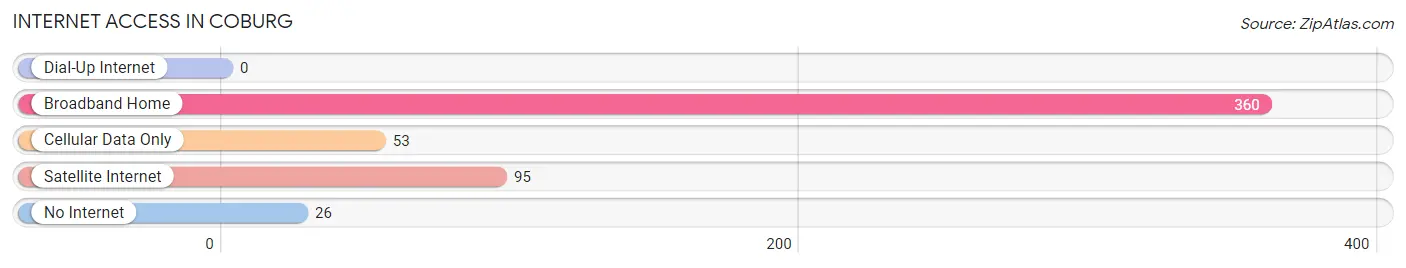
| Internet Type | # Households | % Households |
| Dial-Up Internet | 0 | 0.0% |
| Broadband Home | 360 | 72.4% |
| Cellular Data Only | 53 | 10.7% |
| Satellite Internet | 95 | 19.1% |
| No Internet | 26 | 5.2% |
| Total | 497 | 100.0% |
Coburg Summary
Coburg, Oregon is a small city located in Lane County, Oregon, United States. It is situated on the Willamette River, about 8 miles north of Eugene. The city has a population of about 1,800 people and is part of the Eugene-Springfield Metropolitan Statistical Area.
History
Coburg was founded in 1853 by a group of settlers from the Midwest. The town was named after Coburg, Germany, and was originally a farming community. In 1872, the Oregon and California Railroad arrived in Coburg, connecting the town to the rest of the state. This allowed the town to become a major shipping center for the surrounding area.
In the late 19th century, Coburg became a popular tourist destination due to its proximity to the Willamette River. The town was home to several resorts, including the Coburg Hotel, which was built in 1883. The hotel was a popular destination for visitors from all over the state.
In the early 20th century, Coburg began to decline as a tourist destination. The railroad stopped running in the 1930s, and the town's population began to decline. In the 1950s, the town was revitalized when the University of Oregon opened a campus in Coburg. The university brought new life to the town, and it has since become a popular destination for students and visitors alike.
Geography
Coburg is located in the Willamette Valley, about 8 miles north of Eugene. The city is situated on the banks of the Willamette River, and is surrounded by rolling hills and farmland. The city has a total area of 1.3 square miles, all of which is land.
The climate in Coburg is mild and temperate. The average temperature in the summer is around 75 degrees Fahrenheit, and in the winter it is around 40 degrees Fahrenheit. The city receives an average of 37 inches of precipitation per year.
Economy
Coburg's economy is largely based on the University of Oregon. The university is the largest employer in the city, and provides jobs for many of the city's residents. The city is also home to several small businesses, including restaurants, retail stores, and service providers.
The city is also home to several manufacturing companies, including a paper mill and a wood products plant. These companies provide jobs for many of the city's residents.
Demographics
As of the 2010 census, Coburg had a population of 1,811 people. The racial makeup of the city was 91.3% White, 1.2% African American, 0.7% Native American, 1.2% Asian, 0.2% Pacific Islander, and 4.6% from other races. Hispanic or Latino of any race were 5.3% of the population.
The median household income in Coburg was $41,944, and the median family income was $50,917. The per capita income for the city was $20,945. About 11.3% of the population was below the poverty line.
Coburg is a small city with a rich history and a vibrant economy. The city is home to the University of Oregon, which provides jobs for many of the city's residents. The city is also home to several small businesses, manufacturing companies, and tourist attractions. Coburg is a great place to live, work, and visit.
Common Questions
What is Per Capita Income in Coburg?
Per Capita income in Coburg is $36,371.
What is the Median Family Income in Coburg?
Median Family Income in Coburg is $81,607.
What is the Median Household income in Coburg?
Median Household Income in Coburg is $79,732.
What is Income or Wage Gap in Coburg?
Income or Wage Gap in Coburg is 36.4%.
Women in Coburg earn 63.6 cents for every dollar earned by a man.
What is Inequality or Gini Index in Coburg?
Inequality or Gini Index in Coburg is 0.44.
What is the Total Population of Coburg?
Total Population of Coburg is 1,539.
What is the Total Male Population of Coburg?
Total Male Population of Coburg is 653.
What is the Total Female Population of Coburg?
Total Female Population of Coburg is 886.
What is the Ratio of Males per 100 Females in Coburg?
There are 73.70 Males per 100 Females in Coburg.
What is the Ratio of Females per 100 Males in Coburg?
There are 135.68 Females per 100 Males in Coburg.
What is the Median Population Age in Coburg?
Median Population Age in Coburg is 37.9 Years.
What is the Average Family Size in Coburg
Average Family Size in Coburg is 3.6 People.
What is the Average Household Size in Coburg
Average Household Size in Coburg is 3.1 People.
How Large is the Labor Force in Coburg?
There are 667 People in the Labor Forcein in Coburg.
What is the Percentage of People in the Labor Force in Coburg?
57.1% of People are in the Labor Force in Coburg.
What is the Unemployment Rate in Coburg?
Unemployment Rate in Coburg is 12.4%.