Weston Lakes, TX Map & Demographics
Weston Lakes Map
Weston Lakes Overview
$71,628
PER CAPITA INCOME
$129,696
AVG FAMILY INCOME
$125,038
AVG HOUSEHOLD INCOME
60.3%
WAGE / INCOME GAP [ % ]
39.7¢/ $1
WAGE / INCOME GAP [ $ ]
0.45
INEQUALITY / GINI INDEX
3,907
TOTAL POPULATION
2,017
MALE POPULATION
1,890
FEMALE POPULATION
106.72
MALES / 100 FEMALES
93.70
FEMALES / 100 MALES
44.3
MEDIAN AGE
3.0
AVG FAMILY SIZE
2.8
AVG HOUSEHOLD SIZE
1,493
LABOR FORCE [ PEOPLE ]
49.8%
PERCENT IN LABOR FORCE
1.1%
UNEMPLOYMENT RATE
Income in Weston Lakes
Income Overview in Weston Lakes
Per Capita Income in Weston Lakes is $71,628, while median incomes of families and households are $129,696 and $125,038 respectively.
| Characteristic | Number | Measure |
| Per Capita Income | 3,907 | $71,628 |
| Median Family Income | 1,197 | $129,696 |
| Mean Family Income | 1,197 | $207,842 |
| Median Household Income | 1,409 | $125,038 |
| Mean Household Income | 1,409 | $195,145 |
| Income Deficit | 1,197 | $0 |
| Wage / Income Gap (%) | 3,907 | 60.29% |
| Wage / Income Gap ($) | 3,907 | 39.71¢ per $1 |
| Gini / Inequality Index | 3,907 | 0.45 |
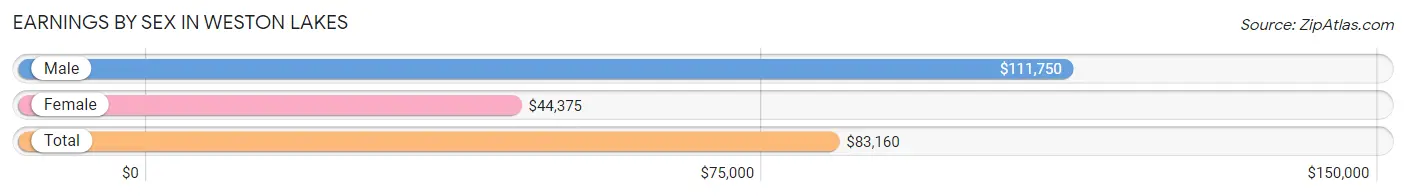
Earnings by Sex in Weston Lakes
Average Earnings in Weston Lakes are $83,160, $111,750 for men and $44,375 for women, a difference of 60.3%.
| Sex | Number | Average Earnings |
| Male | 1,034 (61.5%) | $111,750 |
| Female | 647 (38.5%) | $44,375 |
| Total | 1,681 (100.0%) | $83,160 |
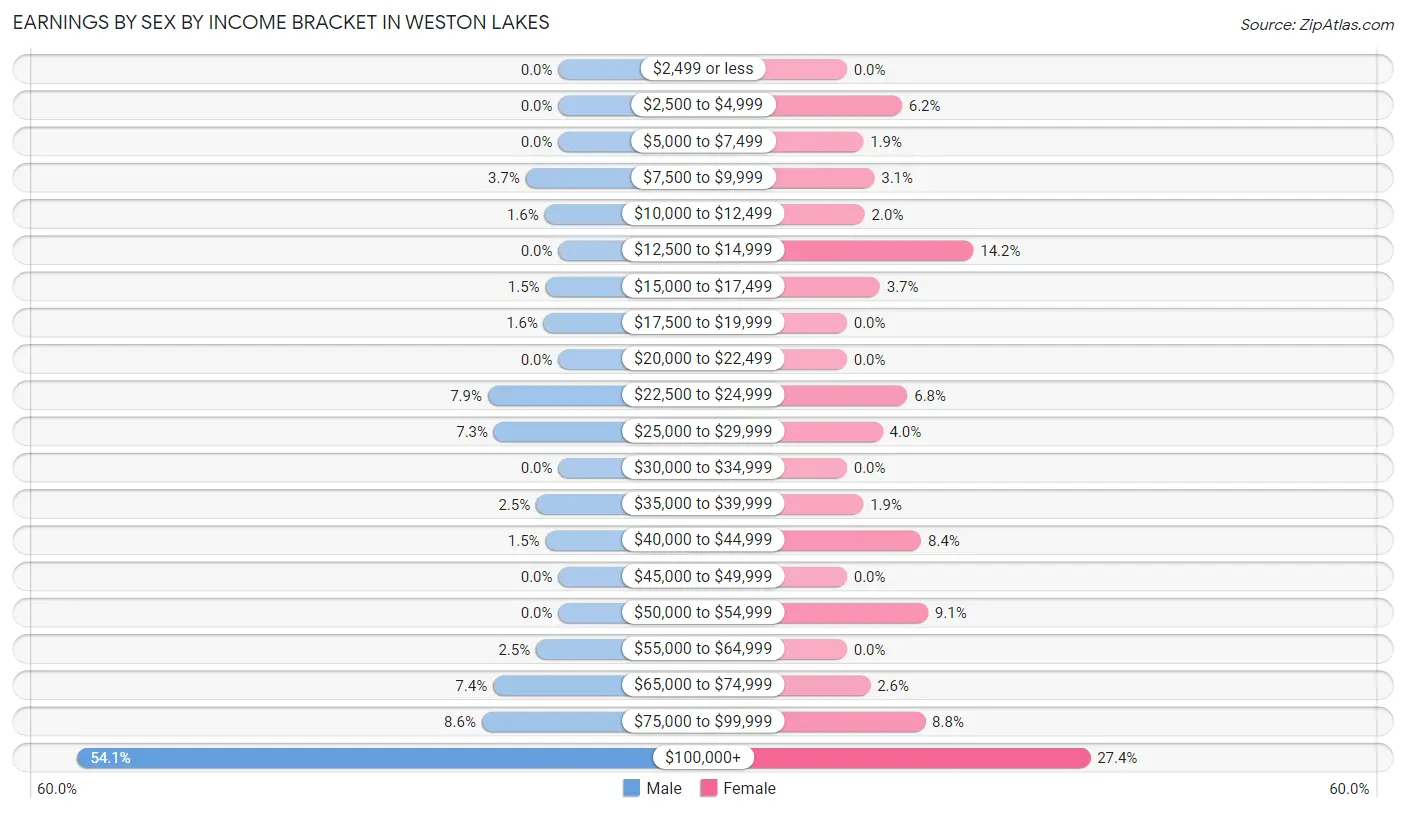
Earnings by Sex by Income Bracket in Weston Lakes
The most common earnings brackets in Weston Lakes are $100,000+ for men (559 | 54.1%) and $100,000+ for women (177 | 27.4%).
| Income | Male | Female |
| $2,499 or less | 0 (0.0%) | 0 (0.0%) |
| $2,500 to $4,999 | 0 (0.0%) | 40 (6.2%) |
| $5,000 to $7,499 | 0 (0.0%) | 12 (1.8%) |
| $7,500 to $9,999 | 38 (3.7%) | 20 (3.1%) |
| $10,000 to $12,499 | 16 (1.5%) | 13 (2.0%) |
| $12,500 to $14,999 | 0 (0.0%) | 92 (14.2%) |
| $15,000 to $17,499 | 15 (1.5%) | 24 (3.7%) |
| $17,500 to $19,999 | 17 (1.6%) | 0 (0.0%) |
| $20,000 to $22,499 | 0 (0.0%) | 0 (0.0%) |
| $22,500 to $24,999 | 82 (7.9%) | 44 (6.8%) |
| $25,000 to $29,999 | 75 (7.2%) | 26 (4.0%) |
| $30,000 to $34,999 | 0 (0.0%) | 0 (0.0%) |
| $35,000 to $39,999 | 26 (2.5%) | 12 (1.8%) |
| $40,000 to $44,999 | 15 (1.5%) | 54 (8.4%) |
| $45,000 to $49,999 | 0 (0.0%) | 0 (0.0%) |
| $50,000 to $54,999 | 0 (0.0%) | 59 (9.1%) |
| $55,000 to $64,999 | 26 (2.5%) | 0 (0.0%) |
| $65,000 to $74,999 | 76 (7.3%) | 17 (2.6%) |
| $75,000 to $99,999 | 89 (8.6%) | 57 (8.8%) |
| $100,000+ | 559 (54.1%) | 177 (27.4%) |
| Total | 1,034 (100.0%) | 647 (100.0%) |
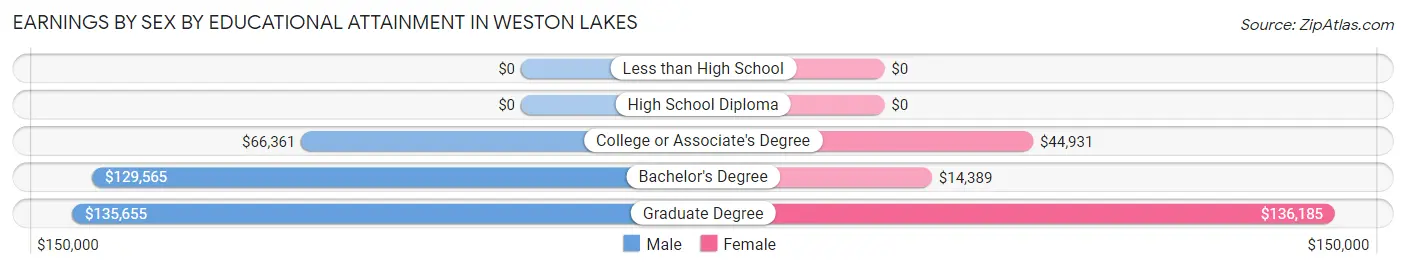
Earnings by Sex by Educational Attainment in Weston Lakes
Average earnings in Weston Lakes are $123,194 for men and $44,931 for women, a difference of 63.5%. Men with an educational attainment of graduate degree enjoy the highest average annual earnings of $135,655, while those with college or associate's degree education earn the least with $66,361. Women with an educational attainment of graduate degree earn the most with the average annual earnings of $136,185, while those with bachelor's degree education have the smallest earnings of $14,389.
| Educational Attainment | Male Income | Female Income |
| Less than High School | - | - |
| High School Diploma | - | - |
| College or Associate's Degree | $66,361 | $44,931 |
| Bachelor's Degree | $129,565 | $14,389 |
| Graduate Degree | $135,655 | $136,185 |
| Total | $123,194 | $44,931 |
Family Income in Weston Lakes
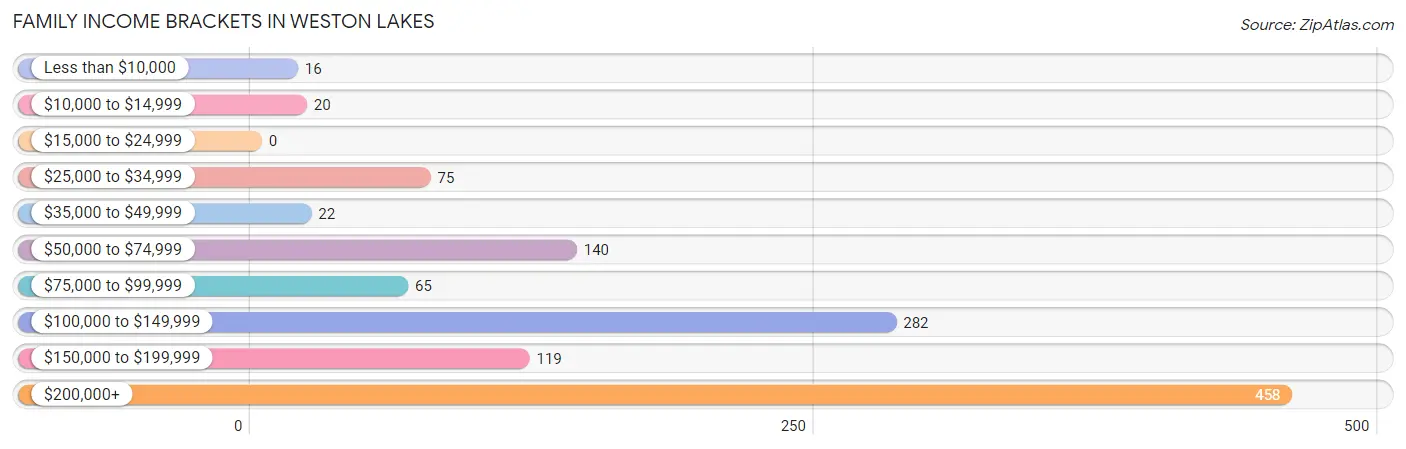
Family Income Brackets in Weston Lakes
According to the Weston Lakes family income data, there are 458 families falling into the $200,000+ income range, which is the most common income bracket and makes up 38.3% of all families.
| Income Bracket | # Families | % Families |
| Less than $10,000 | 16 | 1.3% |
| $10,000 to $14,999 | 20 | 1.7% |
| $15,000 to $24,999 | 0 | 0.0% |
| $25,000 to $34,999 | 75 | 6.3% |
| $35,000 to $49,999 | 22 | 1.8% |
| $50,000 to $74,999 | 140 | 11.7% |
| $75,000 to $99,999 | 65 | 5.4% |
| $100,000 to $149,999 | 282 | 23.6% |
| $150,000 to $199,999 | 119 | 9.9% |
| $200,000+ | 458 | 38.3% |
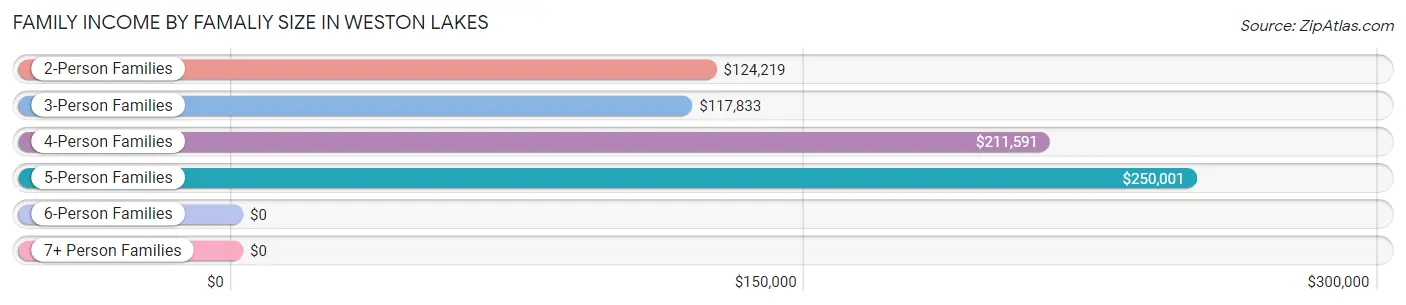
Family Income by Famaliy Size in Weston Lakes
5-person families (60 | 5.0%) account for the highest median family income in Weston Lakes with $250,001 per family, while 2-person families (758 | 63.3%) have the highest median income of $62,110 per family member.
| Income Bracket | # Families | Median Income |
| 2-Person Families | 758 (63.3%) | $124,219 |
| 3-Person Families | 78 (6.5%) | $117,833 |
| 4-Person Families | 212 (17.7%) | $211,591 |
| 5-Person Families | 60 (5.0%) | $250,001 |
| 6-Person Families | 89 (7.4%) | $0 |
| 7+ Person Families | 0 (0.0%) | $0 |
| Total | 1,197 (100.0%) | $129,696 |
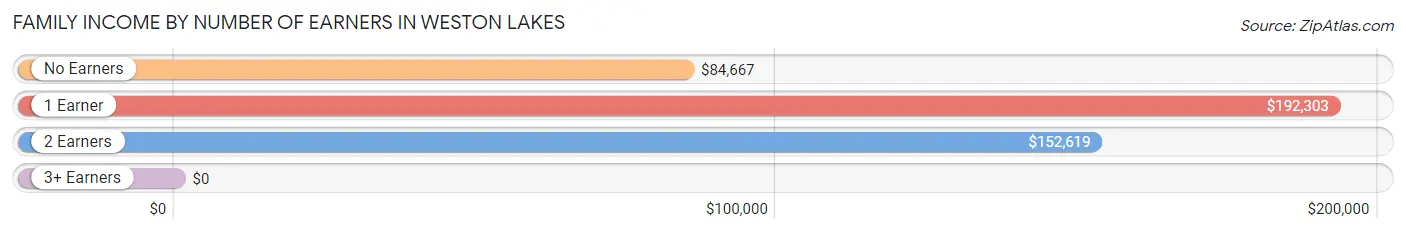
Family Income by Number of Earners in Weston Lakes
| Number of Earners | # Families | Median Income |
| No Earners | 174 (14.5%) | $84,667 |
| 1 Earner | 619 (51.7%) | $192,303 |
| 2 Earners | 404 (33.8%) | $152,619 |
| 3+ Earners | 0 (0.0%) | $0 |
| Total | 1,197 (100.0%) | $129,696 |
Household Income in Weston Lakes
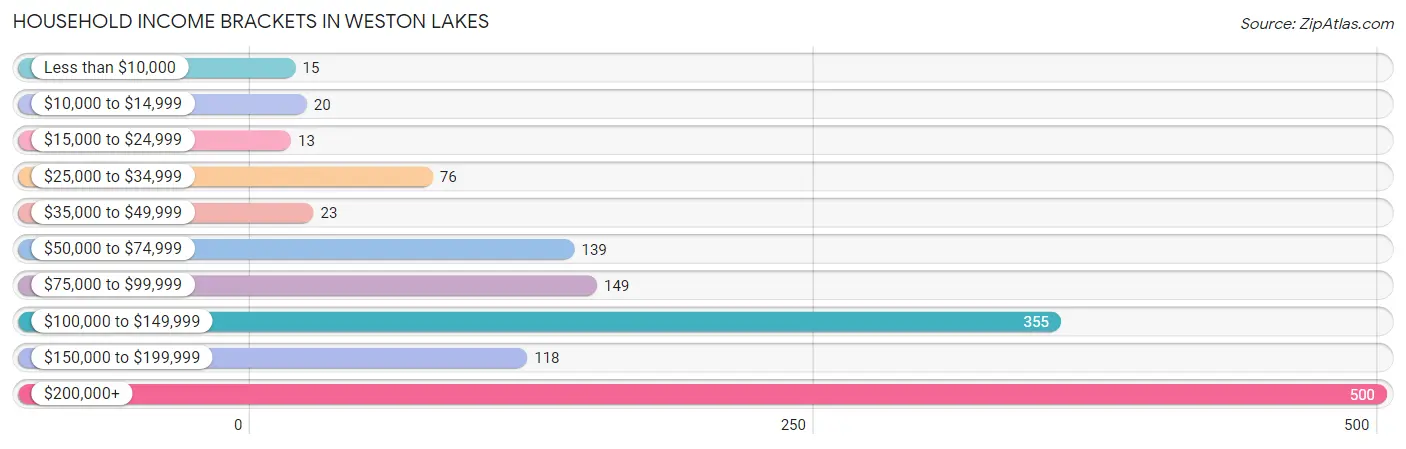
Household Income Brackets in Weston Lakes
With 500 households falling in the category, the $200,000+ income range is the most frequent in Weston Lakes, accounting for 35.5% of all households. In contrast, only 13 households (0.9%) fall into the $15,000 to $24,999 income bracket, making it the least populous group.
| Income Bracket | # Households | % Households |
| Less than $10,000 | 15 | 1.1% |
| $10,000 to $14,999 | 20 | 1.4% |
| $15,000 to $24,999 | 13 | 0.9% |
| $25,000 to $34,999 | 76 | 5.4% |
| $35,000 to $49,999 | 23 | 1.6% |
| $50,000 to $74,999 | 139 | 9.9% |
| $75,000 to $99,999 | 149 | 10.6% |
| $100,000 to $149,999 | 355 | 25.2% |
| $150,000 to $199,999 | 118 | 8.4% |
| $200,000+ | 500 | 35.5% |
Household Income by Householder Age in Weston Lakes
The median household income in Weston Lakes is $125,038, with the highest median household income of $209,761 found in the 25 to 44 years age bracket for the primary householder. A total of 331 households (23.5%) fall into this category. Meanwhile, the 15 to 24 years age bracket for the primary householder has the lowest median household income of $0, with 24 households (1.7%) in this group.
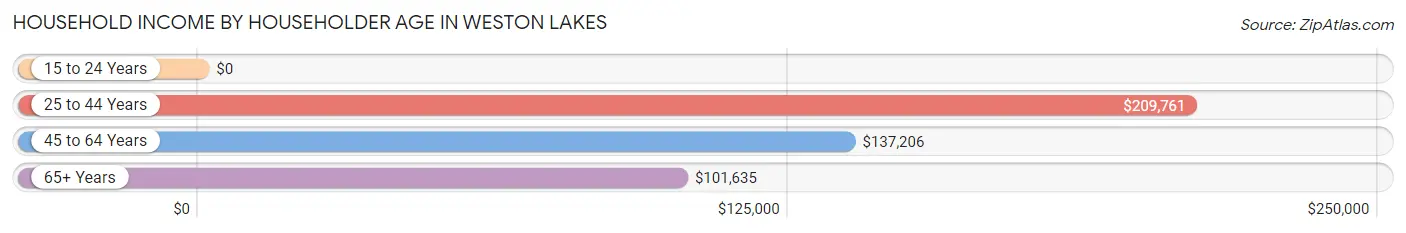
| Income Bracket | # Households | Median Income |
| 15 to 24 Years | 24 (1.7%) | $0 |
| 25 to 44 Years | 331 (23.5%) | $209,761 |
| 45 to 64 Years | 554 (39.3%) | $137,206 |
| 65+ Years | 500 (35.5%) | $101,635 |
| Total | 1,409 (100.0%) | $125,038 |
Poverty in Weston Lakes
Income Below Poverty by Sex and Age in Weston Lakes
With 2.8% poverty level for males and 4.0% for females among the residents of Weston Lakes, 75 year old and over males and 55 to 64 year old females are the most vulnerable to poverty, with 20 males (12.7%) and 56 females (18.9%) in their respective age groups living below the poverty level.
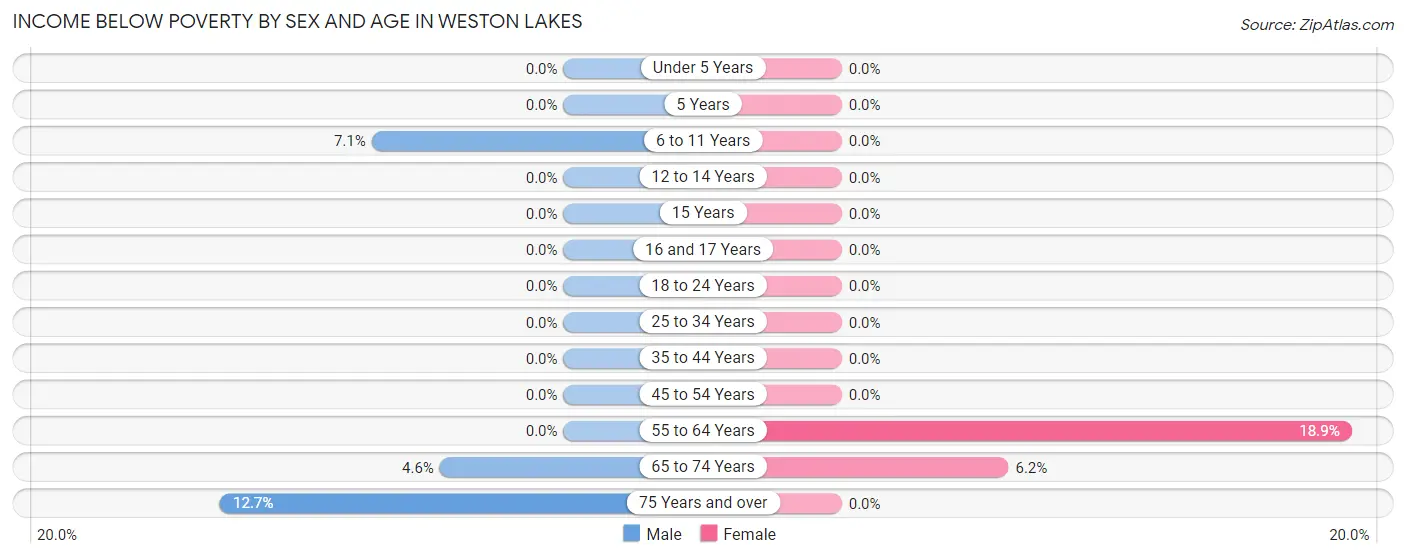
| Age Bracket | Male | Female |
| Under 5 Years | 0 (0.0%) | 0 (0.0%) |
| 5 Years | 0 (0.0%) | 0 (0.0%) |
| 6 to 11 Years | 22 (7.1%) | 0 (0.0%) |
| 12 to 14 Years | 0 (0.0%) | 0 (0.0%) |
| 15 Years | 0 (0.0%) | 0 (0.0%) |
| 16 and 17 Years | 0 (0.0%) | 0 (0.0%) |
| 18 to 24 Years | 0 (0.0%) | 0 (0.0%) |
| 25 to 34 Years | 0 (0.0%) | 0 (0.0%) |
| 35 to 44 Years | 0 (0.0%) | 0 (0.0%) |
| 45 to 54 Years | 0 (0.0%) | 0 (0.0%) |
| 55 to 64 Years | 0 (0.0%) | 56 (18.9%) |
| 65 to 74 Years | 15 (4.6%) | 20 (6.2%) |
| 75 Years and over | 20 (12.7%) | 0 (0.0%) |
| Total | 57 (2.8%) | 76 (4.0%) |
Income Above Poverty by Sex and Age in Weston Lakes
According to the poverty statistics in Weston Lakes, males aged under 5 years and females aged under 5 years are the age groups that are most secure financially, with 100.0% of males and 100.0% of females in these age groups living above the poverty line.
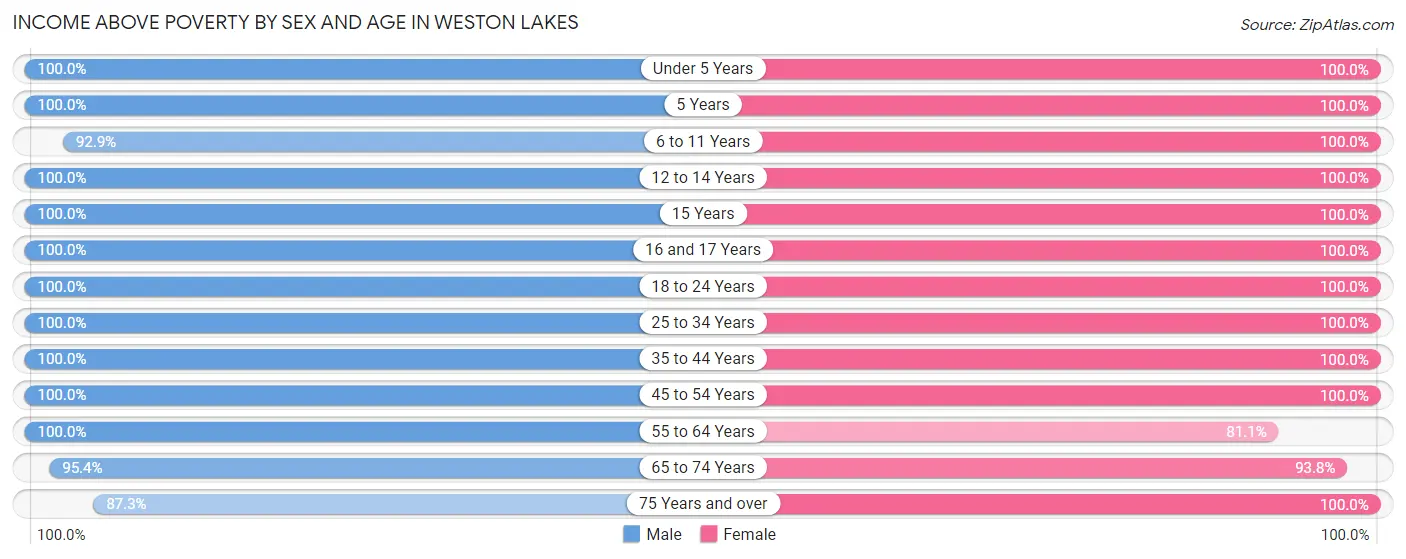
| Age Bracket | Male | Female |
| Under 5 Years | 80 (100.0%) | 58 (100.0%) |
| 5 Years | 24 (100.0%) | 61 (100.0%) |
| 6 to 11 Years | 287 (92.9%) | 108 (100.0%) |
| 12 to 14 Years | 74 (100.0%) | 41 (100.0%) |
| 15 Years | 42 (100.0%) | 112 (100.0%) |
| 16 and 17 Years | 72 (100.0%) | 37 (100.0%) |
| 18 to 24 Years | 55 (100.0%) | 69 (100.0%) |
| 25 to 34 Years | 148 (100.0%) | 274 (100.0%) |
| 35 to 44 Years | 244 (100.0%) | 253 (100.0%) |
| 45 to 54 Years | 155 (100.0%) | 133 (100.0%) |
| 55 to 64 Years | 330 (100.0%) | 240 (81.1%) |
| 65 to 74 Years | 312 (95.4%) | 303 (93.8%) |
| 75 Years and over | 137 (87.3%) | 125 (100.0%) |
| Total | 1,960 (97.2%) | 1,814 (96.0%) |
Income Below Poverty Among Married-Couple Families in Weston Lakes
The poverty statistics for married-couple families in Weston Lakes show that 3.3% or 35 of the total 1,055 families live below the poverty line. Families with 1 or 2 children have the highest poverty rate of 7.6%, comprising of 20 families. On the other hand, families with 3 or 4 children have the lowest poverty rate of 0.0%, which includes 0 families.
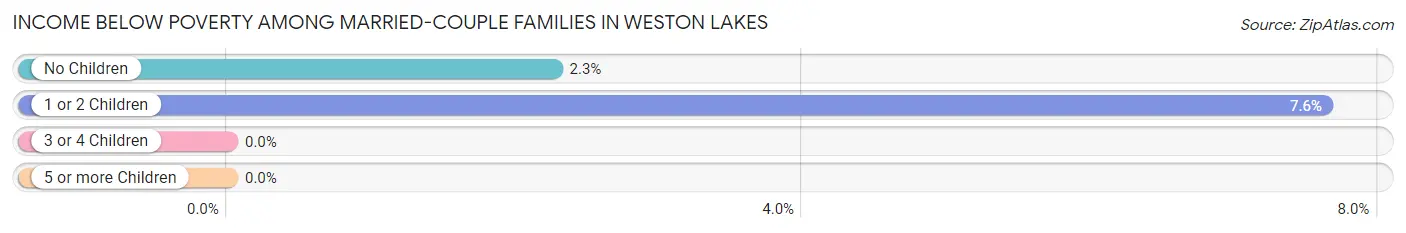
| Children | Above Poverty | Below Poverty |
| No Children | 649 (97.7%) | 15 (2.3%) |
| 1 or 2 Children | 242 (92.4%) | 20 (7.6%) |
| 3 or 4 Children | 129 (100.0%) | 0 (0.0%) |
| 5 or more Children | 0 (0.0%) | 0 (0.0%) |
| Total | 1,020 (96.7%) | 35 (3.3%) |
Income Below Poverty Among Single-Parent Households in Weston Lakes
| Children | Single Father | Single Mother |
| No Children | 0 (0.0%) | 0 (0.0%) |
| 1 or 2 Children | 0 (0.0%) | 0 (0.0%) |
| 3 or 4 Children | 0 (0.0%) | 0 (0.0%) |
| 5 or more Children | 0 (0.0%) | 0 (0.0%) |
| Total | 0 (0.0%) | 0 (0.0%) |
Income Below Poverty Among Married-Couple vs Single-Parent Households in Weston Lakes
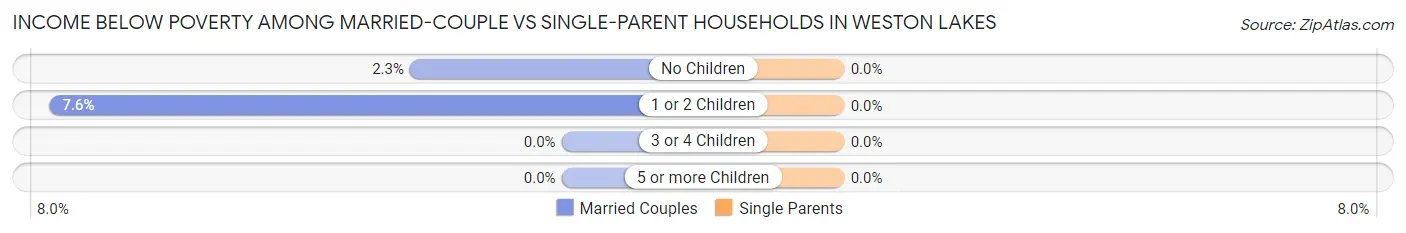
| Children | Married-Couple Families | Single-Parent Households |
| No Children | 15 (2.3%) | 0 (0.0%) |
| 1 or 2 Children | 20 (7.6%) | 0 (0.0%) |
| 3 or 4 Children | 0 (0.0%) | 0 (0.0%) |
| 5 or more Children | 0 (0.0%) | 0 (0.0%) |
| Total | 35 (3.3%) | 0 (0.0%) |
Race in Weston Lakes
The most populous races in Weston Lakes are White / Caucasian (3,411 | 87.3%), Hispanic or Latino (472 | 12.1%), and Two or more Races (421 | 10.8%).
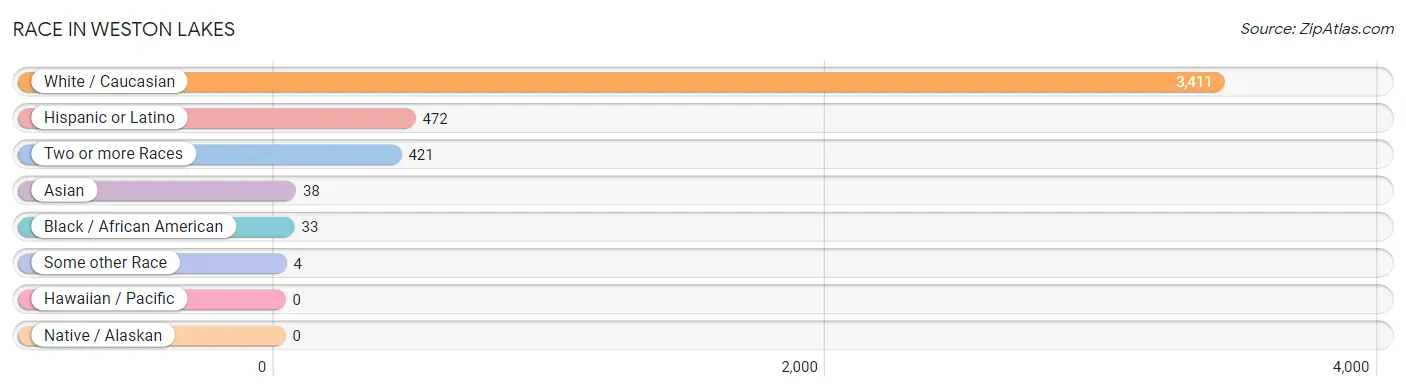
| Race | # Population | % Population |
| Asian | 38 | 1.0% |
| Black / African American | 33 | 0.8% |
| Hawaiian / Pacific | 0 | 0.0% |
| Hispanic or Latino | 472 | 12.1% |
| Native / Alaskan | 0 | 0.0% |
| White / Caucasian | 3,411 | 87.3% |
| Two or more Races | 421 | 10.8% |
| Some other Race | 4 | 0.1% |
| Total | 3,907 | 100.0% |
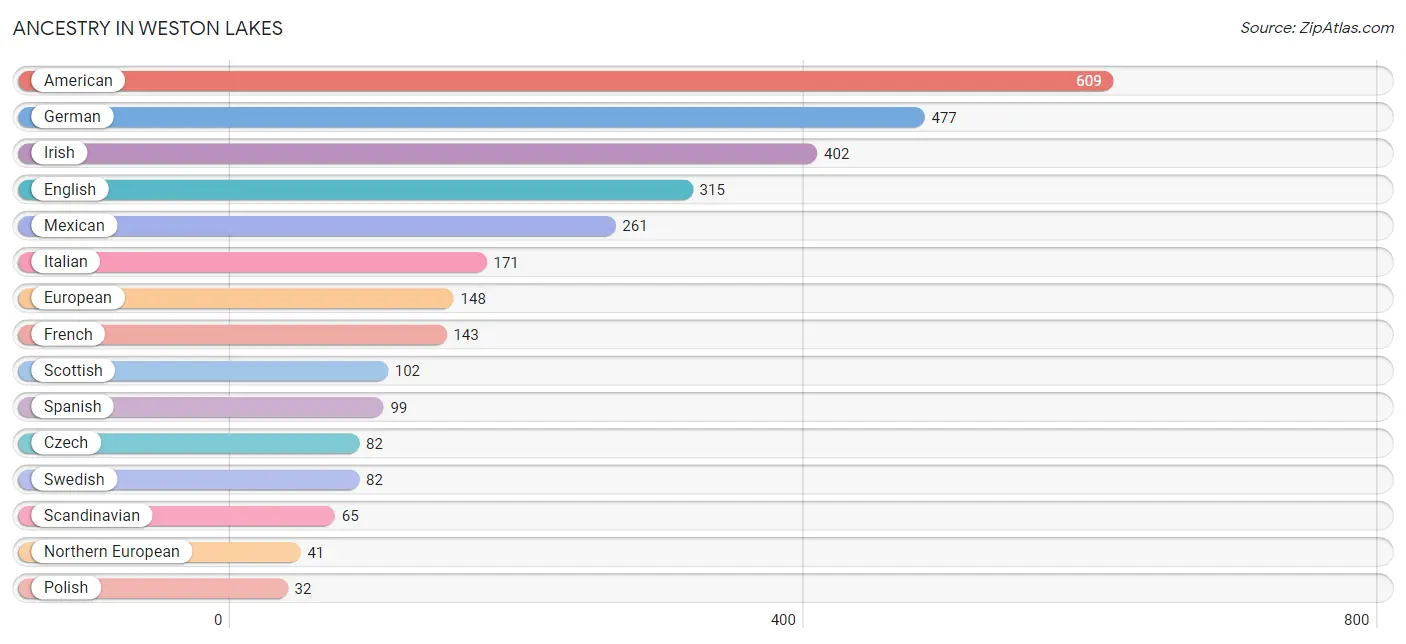
Ancestry in Weston Lakes
The most populous ancestries reported in Weston Lakes are American (609 | 15.6%), German (477 | 12.2%), Irish (402 | 10.3%), English (315 | 8.1%), and Mexican (261 | 6.7%), together accounting for 52.8% of all Weston Lakes residents.
| Ancestry | # Population | % Population |
| Alsatian | 11 | 0.3% |
| American | 609 | 15.6% |
| Armenian | 17 | 0.4% |
| Burmese | 18 | 0.5% |
| Central American | 16 | 0.4% |
| Choctaw | 9 | 0.2% |
| Cuban | 19 | 0.5% |
| Czech | 82 | 2.1% |
| Dutch | 27 | 0.7% |
| English | 315 | 8.1% |
| European | 148 | 3.8% |
| French | 143 | 3.7% |
| French Canadian | 19 | 0.5% |
| German | 477 | 12.2% |
| Greek | 15 | 0.4% |
| Guatemalan | 16 | 0.4% |
| Indian (Asian) | 20 | 0.5% |
| Irish | 402 | 10.3% |
| Italian | 171 | 4.4% |
| Latvian | 16 | 0.4% |
| Mexican | 261 | 6.7% |
| Northern European | 41 | 1.1% |
| Norwegian | 22 | 0.6% |
| Polish | 32 | 0.8% |
| Scandinavian | 65 | 1.7% |
| Scotch-Irish | 23 | 0.6% |
| Scottish | 102 | 2.6% |
| Spaniard | 16 | 0.4% |
| Spanish | 99 | 2.5% |
| Swedish | 82 | 2.1% |
| Welsh | 19 | 0.5% | View All 31 Rows |
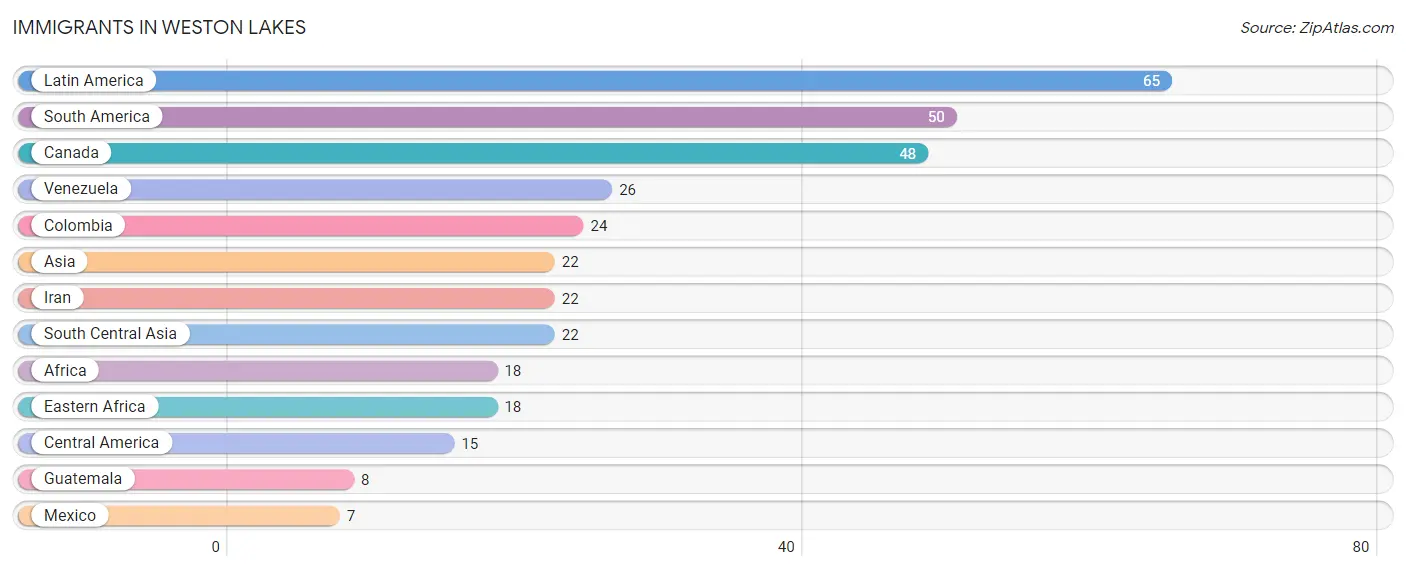
Immigrants in Weston Lakes
The most numerous immigrant groups reported in Weston Lakes came from Latin America (65 | 1.7%), South America (50 | 1.3%), Canada (48 | 1.2%), Venezuela (26 | 0.7%), and Colombia (24 | 0.6%), together accounting for 5.4% of all Weston Lakes residents.
| Immigration Origin | # Population | % Population |
| Africa | 18 | 0.5% |
| Asia | 22 | 0.6% |
| Canada | 48 | 1.2% |
| Central America | 15 | 0.4% |
| Colombia | 24 | 0.6% |
| Eastern Africa | 18 | 0.5% |
| Guatemala | 8 | 0.2% |
| Iran | 22 | 0.6% |
| Latin America | 65 | 1.7% |
| Mexico | 7 | 0.2% |
| South America | 50 | 1.3% |
| South Central Asia | 22 | 0.6% |
| Venezuela | 26 | 0.7% | View All 13 Rows |
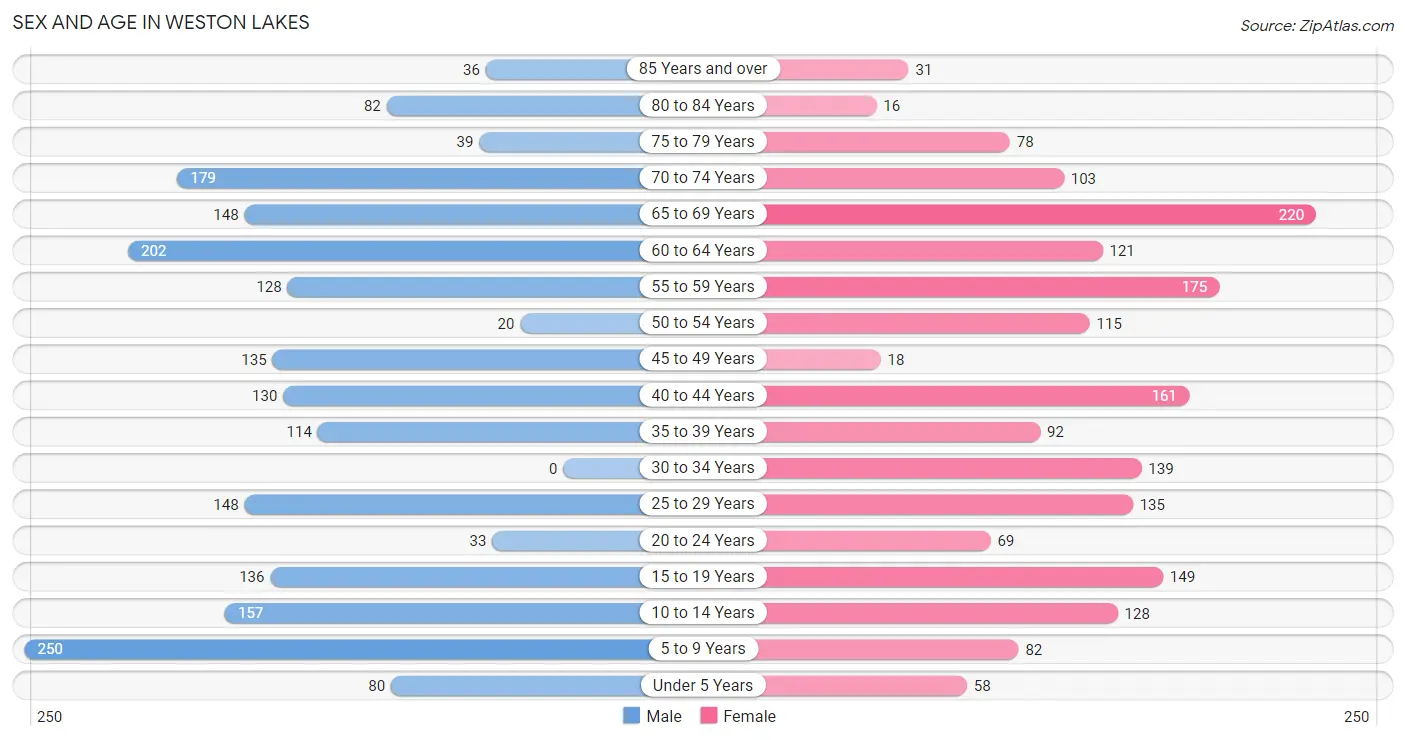
Sex and Age in Weston Lakes
Sex and Age in Weston Lakes
The most populous age groups in Weston Lakes are 5 to 9 Years (250 | 12.4%) for men and 65 to 69 Years (220 | 11.6%) for women.
| Age Bracket | Male | Female |
| Under 5 Years | 80 (4.0%) | 58 (3.1%) |
| 5 to 9 Years | 250 (12.4%) | 82 (4.3%) |
| 10 to 14 Years | 157 (7.8%) | 128 (6.8%) |
| 15 to 19 Years | 136 (6.7%) | 149 (7.9%) |
| 20 to 24 Years | 33 (1.6%) | 69 (3.6%) |
| 25 to 29 Years | 148 (7.3%) | 135 (7.1%) |
| 30 to 34 Years | 0 (0.0%) | 139 (7.3%) |
| 35 to 39 Years | 114 (5.7%) | 92 (4.9%) |
| 40 to 44 Years | 130 (6.5%) | 161 (8.5%) |
| 45 to 49 Years | 135 (6.7%) | 18 (0.9%) |
| 50 to 54 Years | 20 (1.0%) | 115 (6.1%) |
| 55 to 59 Years | 128 (6.4%) | 175 (9.3%) |
| 60 to 64 Years | 202 (10.0%) | 121 (6.4%) |
| 65 to 69 Years | 148 (7.3%) | 220 (11.6%) |
| 70 to 74 Years | 179 (8.9%) | 103 (5.4%) |
| 75 to 79 Years | 39 (1.9%) | 78 (4.1%) |
| 80 to 84 Years | 82 (4.1%) | 16 (0.9%) |
| 85 Years and over | 36 (1.8%) | 31 (1.6%) |
| Total | 2,017 (100.0%) | 1,890 (100.0%) |
Families and Households in Weston Lakes
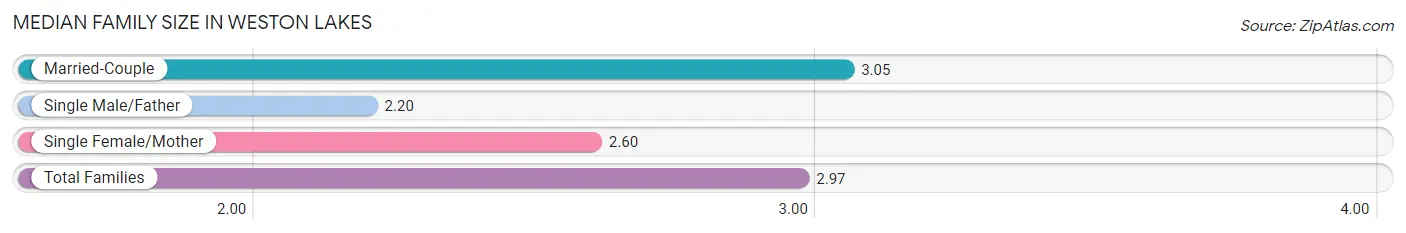
Median Family Size in Weston Lakes
The median family size in Weston Lakes is 2.97 persons per family, with married-couple families (1,055 | 88.1%) accounting for the largest median family size of 3.05 persons per family. On the other hand, single male/father families (59 | 4.9%) represent the smallest median family size with 2.20 persons per family.
| Family Type | # Families | Family Size |
| Married-Couple | 1,055 (88.1%) | 3.05 |
| Single Male/Father | 59 (4.9%) | 2.20 |
| Single Female/Mother | 83 (6.9%) | 2.60 |
| Total Families | 1,197 (100.0%) | 2.97 |
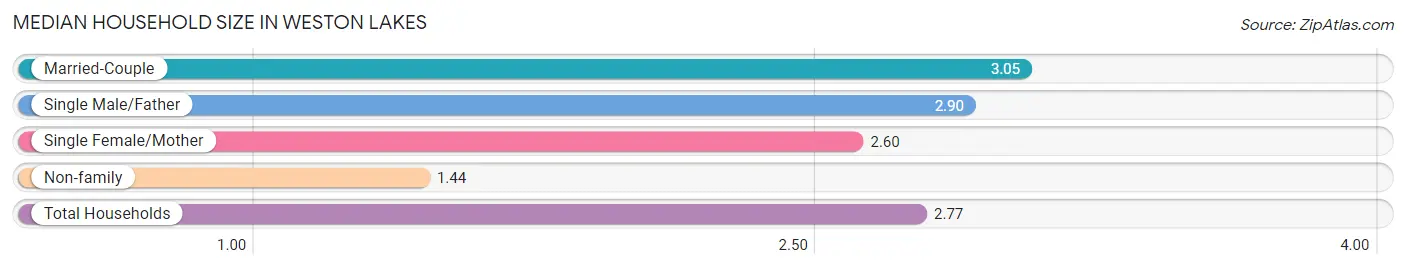
Median Household Size in Weston Lakes
The median household size in Weston Lakes is 2.77 persons per household, with married-couple households (1,055 | 74.9%) accounting for the largest median household size of 3.05 persons per household. non-family households (212 | 15.0%) represent the smallest median household size with 1.44 persons per household.
| Household Type | # Households | Household Size |
| Married-Couple | 1,055 (74.9%) | 3.05 |
| Single Male/Father | 59 (4.2%) | 2.90 |
| Single Female/Mother | 83 (5.9%) | 2.60 |
| Non-family | 212 (15.0%) | 1.44 |
| Total Households | 1,409 (100.0%) | 2.77 |
Household Size by Marriage Status in Weston Lakes
Out of a total of 1,409 households in Weston Lakes, 1,197 (85.0%) are family households, while 212 (15.0%) are nonfamily households. The most numerous type of family households are 2-person households, comprising 710, and the most common type of nonfamily households are 1-person households, comprising 120.
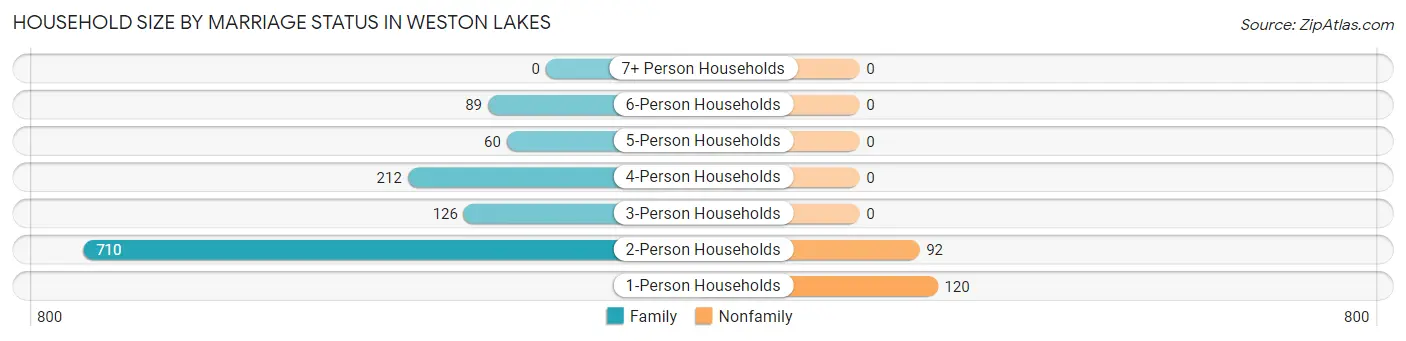
| Household Size | Family Households | Nonfamily Households |
| 1-Person Households | - | 120 (8.5%) |
| 2-Person Households | 710 (50.4%) | 92 (6.5%) |
| 3-Person Households | 126 (8.9%) | 0 (0.0%) |
| 4-Person Households | 212 (15.0%) | 0 (0.0%) |
| 5-Person Households | 60 (4.3%) | 0 (0.0%) |
| 6-Person Households | 89 (6.3%) | 0 (0.0%) |
| 7+ Person Households | 0 (0.0%) | 0 (0.0%) |
| Total | 1,197 (85.0%) | 212 (15.0%) |
Female Fertility in Weston Lakes
Fertility by Age in Weston Lakes
Average fertility rate in Weston Lakes is 41.0 births per 1,000 women. Women in the age bracket of 20 to 34 years have the highest fertility rate with 67.0 births per 1,000 women. Women in the age bracket of 20 to 34 years acount for 74.2% of all women with births.
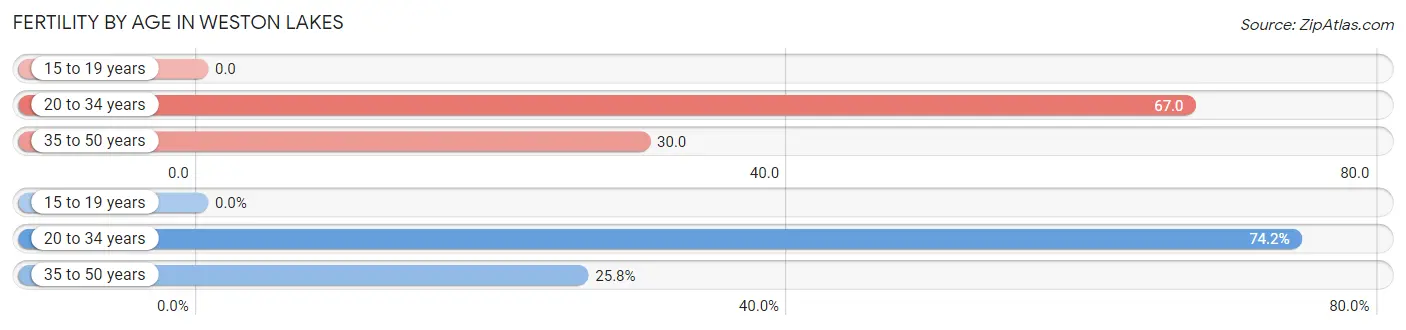
| Age Bracket | Women with Births | Births / 1,000 Women |
| 15 to 19 years | 0 (0.0%) | 0.0 |
| 20 to 34 years | 23 (74.2%) | 67.0 |
| 35 to 50 years | 8 (25.8%) | 30.0 |
| Total | 31 (100.0%) | 41.0 |
Fertility by Age by Marriage Status in Weston Lakes
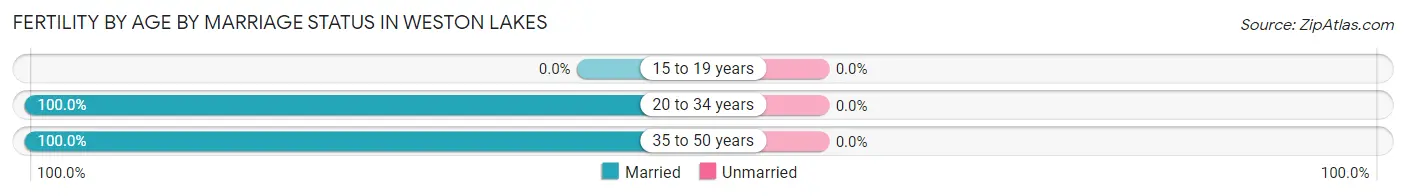
| Age Bracket | Married | Unmarried |
| 15 to 19 years | 0 (0.0%) | 0 (0.0%) |
| 20 to 34 years | 23 (100.0%) | 0 (0.0%) |
| 35 to 50 years | 8 (100.0%) | 0 (0.0%) |
| Total | 31 (100.0%) | 0 (0.0%) |
Fertility by Education in Weston Lakes
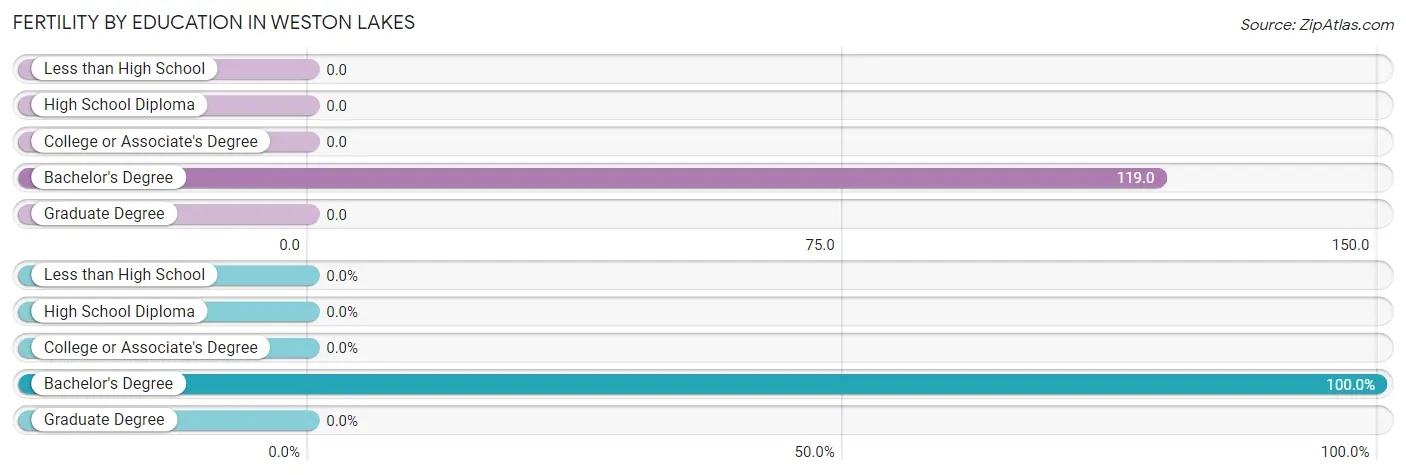
| Educational Attainment | Women with Births | Births / 1,000 Women |
| Less than High School | 0 (0.0%) | 0.0 |
| High School Diploma | 0 (0.0%) | 0.0 |
| College or Associate's Degree | 0 (0.0%) | 0.0 |
| Bachelor's Degree | 31 (100.0%) | 119.0 |
| Graduate Degree | 0 (0.0%) | 0.0 |
| Total | 31 (100.0%) | 41.0 |
Fertility by Education by Marriage Status in Weston Lakes
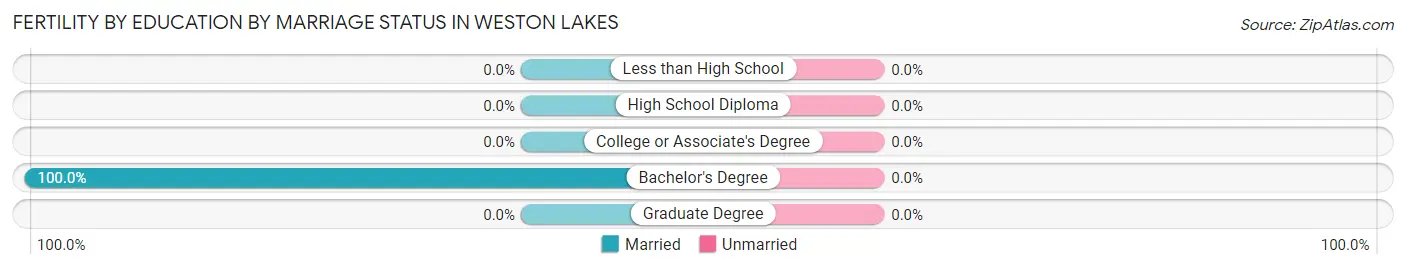
| Educational Attainment | Married | Unmarried |
| Less than High School | 0 (0.0%) | 0 (0.0%) |
| High School Diploma | 0 (0.0%) | 0 (0.0%) |
| College or Associate's Degree | 0 (0.0%) | 0 (0.0%) |
| Bachelor's Degree | 31 (100.0%) | 0 (0.0%) |
| Graduate Degree | 0 (0.0%) | 0 (0.0%) |
| Total | 31 (100.0%) | 0 (0.0%) |
Employment Characteristics in Weston Lakes
Employment by Class of Employer in Weston Lakes
Among the 1,477 employed individuals in Weston Lakes, private company employees (1,010 | 68.4%), self-employed (not incorporated) (181 | 12.2%), and not-for-profit organizations (120 | 8.1%) make up the most common classes of employment.
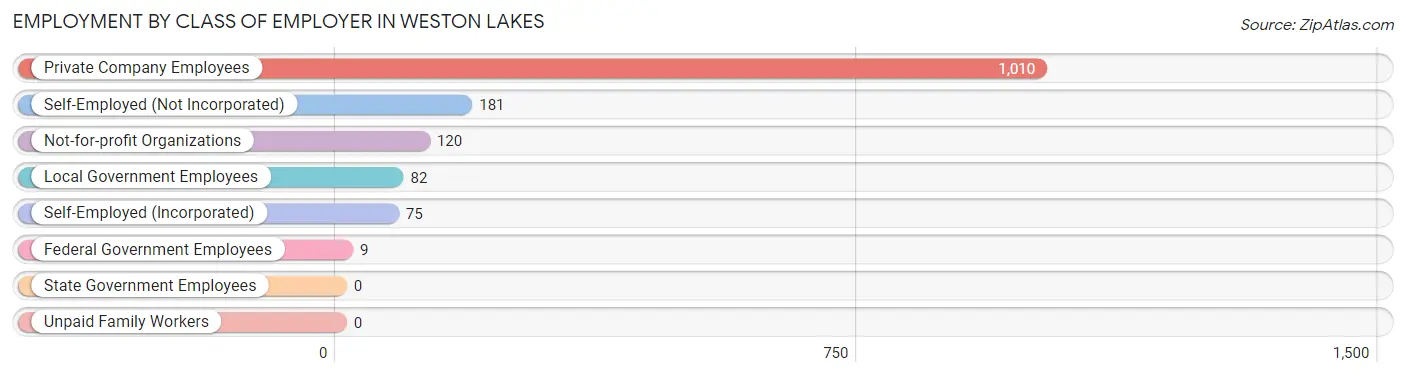
| Employer Class | # Employees | % Employees |
| Private Company Employees | 1,010 | 68.4% |
| Self-Employed (Incorporated) | 75 | 5.1% |
| Self-Employed (Not Incorporated) | 181 | 12.2% |
| Not-for-profit Organizations | 120 | 8.1% |
| Local Government Employees | 82 | 5.6% |
| State Government Employees | 0 | 0.0% |
| Federal Government Employees | 9 | 0.6% |
| Unpaid Family Workers | 0 | 0.0% |
| Total | 1,477 | 100.0% |
Employment Status by Age in Weston Lakes
According to the labor force statistics for Weston Lakes, out of the total population over 16 years of age (2,998), 49.8% or 1,493 individuals are in the labor force, with 1.1% or 16 of them unemployed. The age group with the highest labor force participation rate is 45 to 54 years, with 81.3% or 234 individuals in the labor force. Within the labor force, the 55 to 59 years age range has the highest percentage of unemployed individuals, with 11.4% or 17 of them being unemployed.
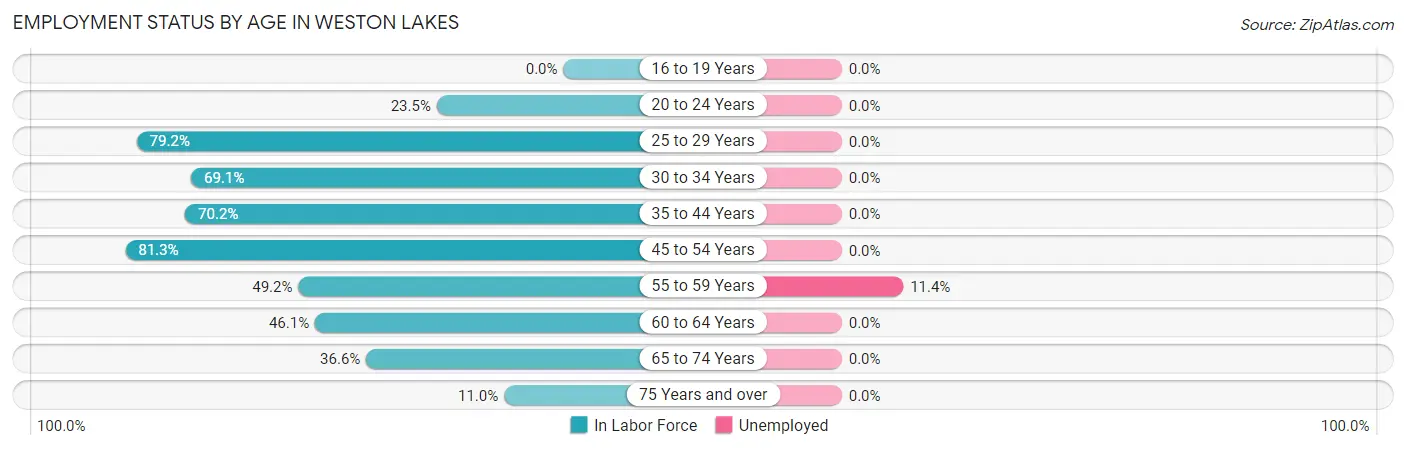
| Age Bracket | In Labor Force | Unemployed |
| 16 to 19 Years | 0 (0.0%) | 0 (0.0%) |
| 20 to 24 Years | 24 (23.5%) | 0 (0.0%) |
| 25 to 29 Years | 224 (79.2%) | 0 (0.0%) |
| 30 to 34 Years | 96 (69.1%) | 0 (0.0%) |
| 35 to 44 Years | 349 (70.2%) | 0 (0.0%) |
| 45 to 54 Years | 234 (81.3%) | 0 (0.0%) |
| 55 to 59 Years | 149 (49.2%) | 17 (11.4%) |
| 60 to 64 Years | 149 (46.1%) | 0 (0.0%) |
| 65 to 74 Years | 238 (36.6%) | 0 (0.0%) |
| 75 Years and over | 31 (11.0%) | 0 (0.0%) |
| Total | 1,493 (49.8%) | 16 (1.1%) |
Employment Status by Educational Attainment in Weston Lakes
According to labor force statistics for Weston Lakes, 65.5% of individuals (1,201) out of the total population between 25 and 64 years of age (1,833) are in the labor force, with 1.4% or 17 of them being unemployed. The group with the highest labor force participation rate are those with the educational attainment of less than high school, with 100.0% or 26 individuals in the labor force. Within the labor force, individuals with bachelor's degree or higher education have the highest percentage of unemployment, with 1.9% or 17 of them being unemployed.
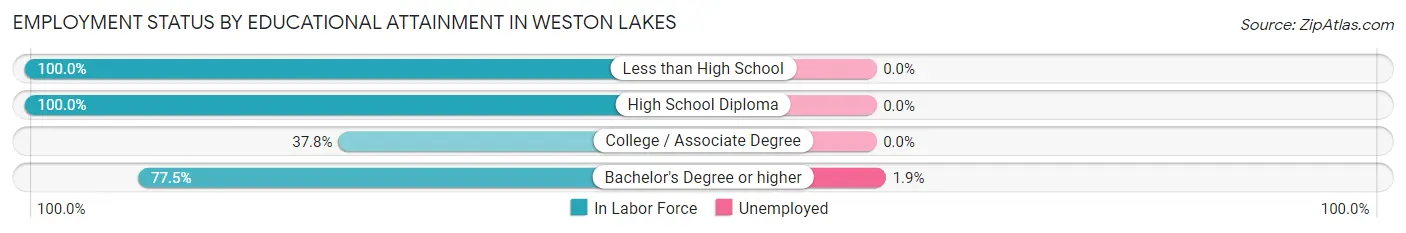
| Educational Attainment | In Labor Force | Unemployed |
| Less than High School | 26 (100.0%) | 0 (0.0%) |
| High School Diploma | 49 (100.0%) | 0 (0.0%) |
| College / Associate Degree | 225 (37.8%) | 0 (0.0%) |
| Bachelor's Degree or higher | 901 (77.5%) | 22 (1.9%) |
| Total | 1,201 (65.5%) | 26 (1.4%) |
Employment Occupations by Sex in Weston Lakes
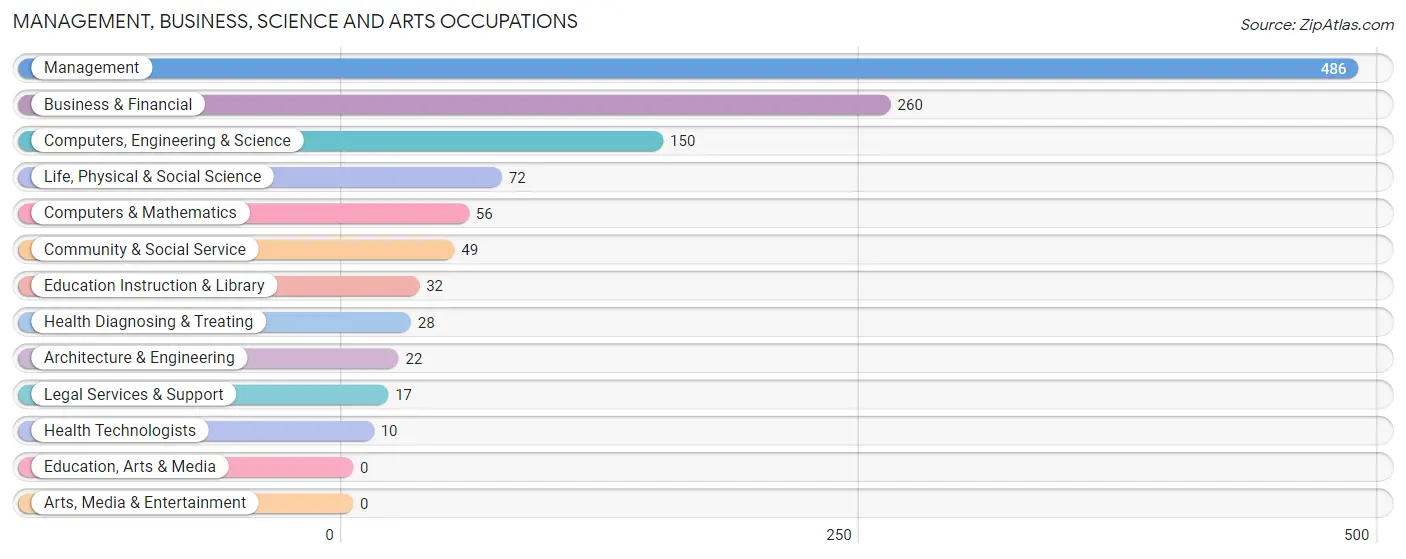
Management, Business, Science and Arts Occupations
The most common Management, Business, Science and Arts occupations in Weston Lakes are Management (486 | 32.9%), Business & Financial (260 | 17.6%), Computers, Engineering & Science (150 | 10.2%), Life, Physical & Social Science (72 | 4.9%), and Computers & Mathematics (56 | 3.8%).
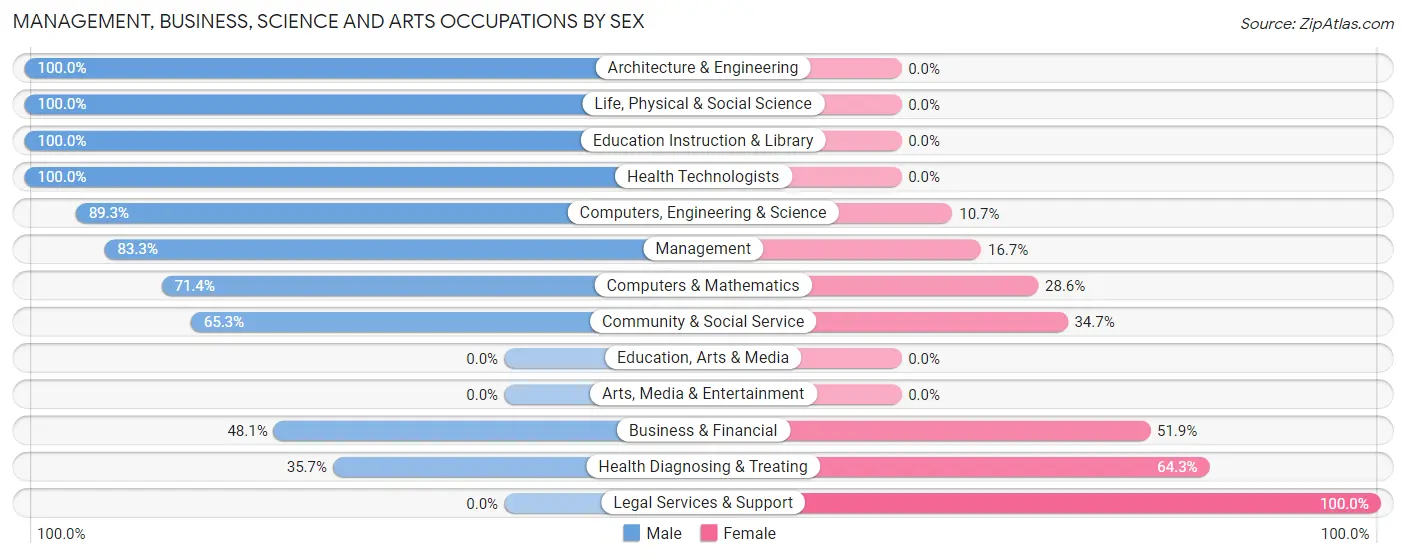
Management, Business, Science and Arts Occupations by Sex
Within the Management, Business, Science and Arts occupations in Weston Lakes, the most male-oriented occupations are Architecture & Engineering (100.0%), Life, Physical & Social Science (100.0%), and Education Instruction & Library (100.0%), while the most female-oriented occupations are Legal Services & Support (100.0%), Health Diagnosing & Treating (64.3%), and Business & Financial (51.9%).
| Occupation | Male | Female |
| Management | 405 (83.3%) | 81 (16.7%) |
| Business & Financial | 125 (48.1%) | 135 (51.9%) |
| Computers, Engineering & Science | 134 (89.3%) | 16 (10.7%) |
| Computers & Mathematics | 40 (71.4%) | 16 (28.6%) |
| Architecture & Engineering | 22 (100.0%) | 0 (0.0%) |
| Life, Physical & Social Science | 72 (100.0%) | 0 (0.0%) |
| Community & Social Service | 32 (65.3%) | 17 (34.7%) |
| Education, Arts & Media | 0 (0.0%) | 0 (0.0%) |
| Legal Services & Support | 0 (0.0%) | 17 (100.0%) |
| Education Instruction & Library | 32 (100.0%) | 0 (0.0%) |
| Arts, Media & Entertainment | 0 (0.0%) | 0 (0.0%) |
| Health Diagnosing & Treating | 10 (35.7%) | 18 (64.3%) |
| Health Technologists | 10 (100.0%) | 0 (0.0%) |
| Total (Category) | 706 (72.6%) | 267 (27.4%) |
| Total (Overall) | 917 (62.1%) | 560 (37.9%) |
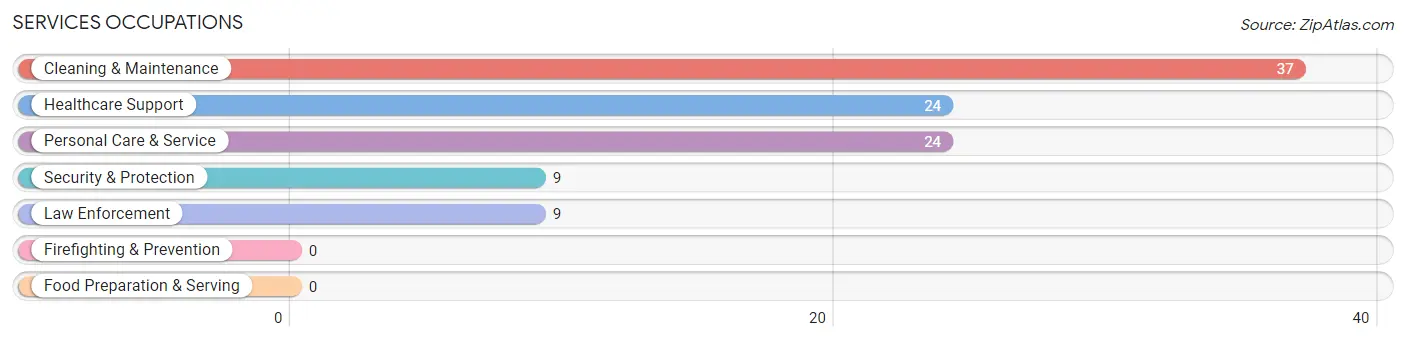
Services Occupations
The most common Services occupations in Weston Lakes are Cleaning & Maintenance (37 | 2.5%), Healthcare Support (24 | 1.6%), Personal Care & Service (24 | 1.6%), Security & Protection (9 | 0.6%), and Law Enforcement (9 | 0.6%).
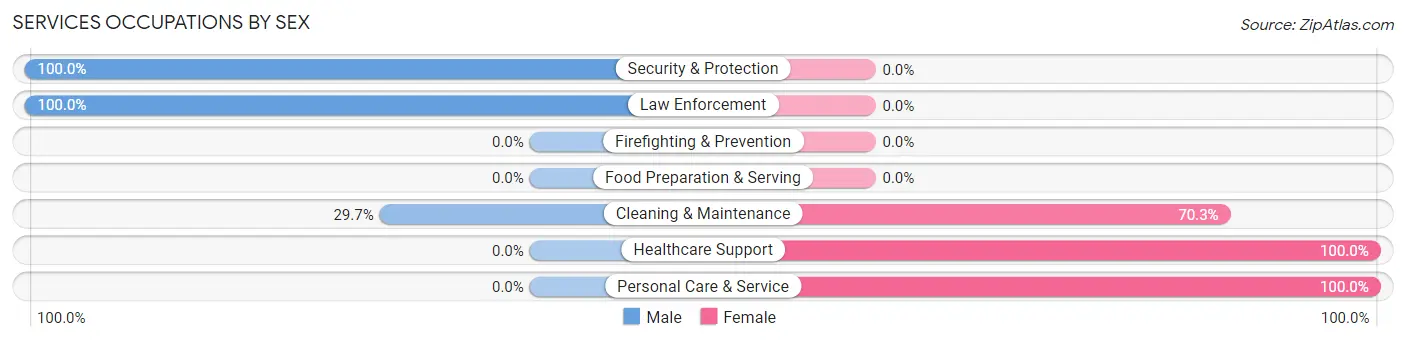
Services Occupations by Sex
Within the Services occupations in Weston Lakes, the most male-oriented occupations are Security & Protection (100.0%), Law Enforcement (100.0%), and Cleaning & Maintenance (29.7%), while the most female-oriented occupations are Healthcare Support (100.0%), Personal Care & Service (100.0%), and Cleaning & Maintenance (70.3%).
| Occupation | Male | Female |
| Healthcare Support | 0 (0.0%) | 24 (100.0%) |
| Security & Protection | 9 (100.0%) | 0 (0.0%) |
| Firefighting & Prevention | 0 (0.0%) | 0 (0.0%) |
| Law Enforcement | 9 (100.0%) | 0 (0.0%) |
| Food Preparation & Serving | 0 (0.0%) | 0 (0.0%) |
| Cleaning & Maintenance | 11 (29.7%) | 26 (70.3%) |
| Personal Care & Service | 0 (0.0%) | 24 (100.0%) |
| Total (Category) | 20 (21.3%) | 74 (78.7%) |
| Total (Overall) | 917 (62.1%) | 560 (37.9%) |
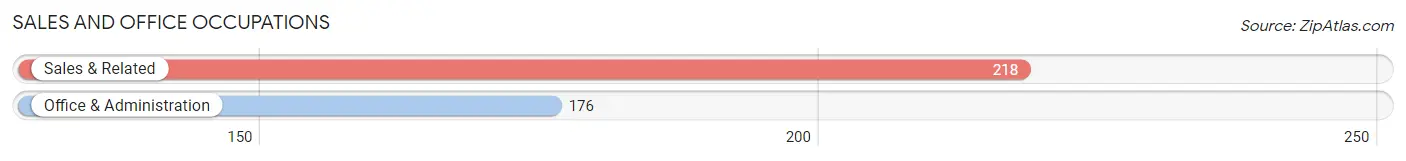
Sales and Office Occupations
The most common Sales and Office occupations in Weston Lakes are Sales & Related (218 | 14.8%), and Office & Administration (176 | 11.9%).
Sales and Office Occupations by Sex
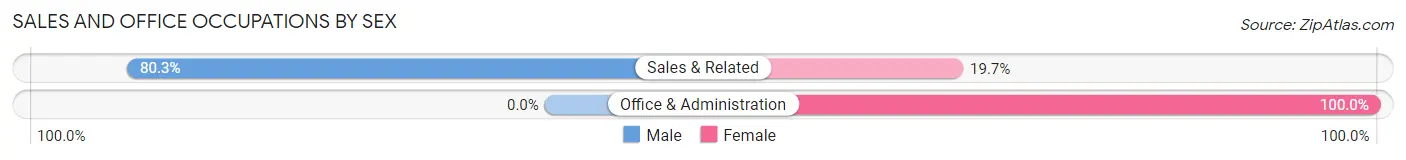
| Occupation | Male | Female |
| Sales & Related | 175 (80.3%) | 43 (19.7%) |
| Office & Administration | 0 (0.0%) | 176 (100.0%) |
| Total (Category) | 175 (44.4%) | 219 (55.6%) |
| Total (Overall) | 917 (62.1%) | 560 (37.9%) |
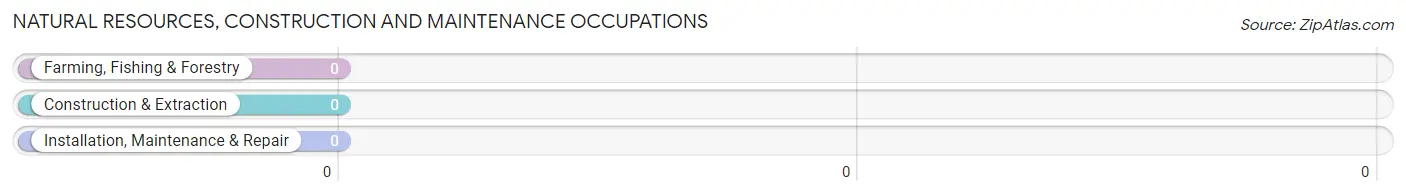
Natural Resources, Construction and Maintenance Occupations
Natural Resources, Construction and Maintenance Occupations by Sex
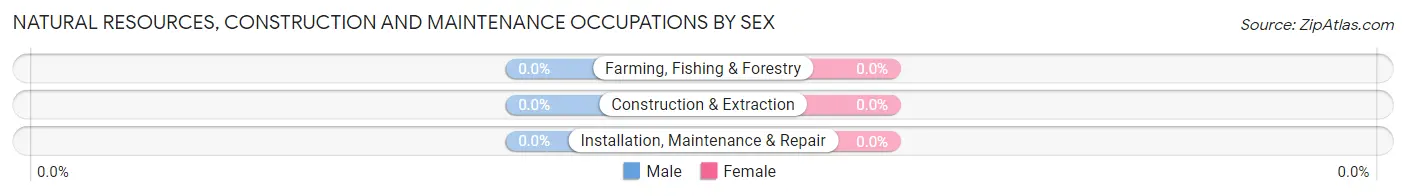
| Occupation | Male | Female |
| Farming, Fishing & Forestry | 0 (0.0%) | 0 (0.0%) |
| Construction & Extraction | 0 (0.0%) | 0 (0.0%) |
| Installation, Maintenance & Repair | 0 (0.0%) | 0 (0.0%) |
| Total (Category) | 0 (0.0%) | 0 (0.0%) |
| Total (Overall) | 917 (62.1%) | 560 (37.9%) |
Production, Transportation and Moving Occupations
The most common Production, Transportation and Moving occupations in Weston Lakes are , and Transportation (16 | 1.1%).
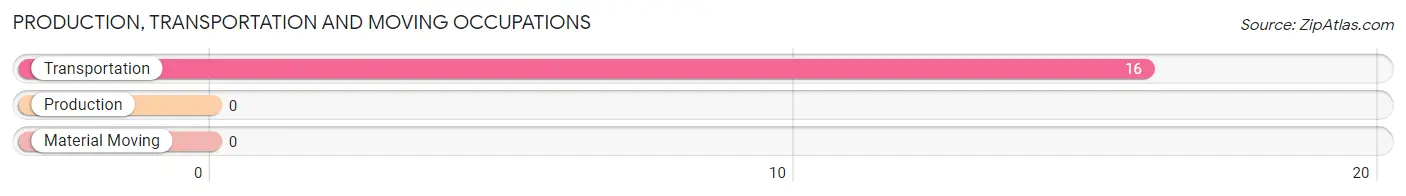
Production, Transportation and Moving Occupations by Sex
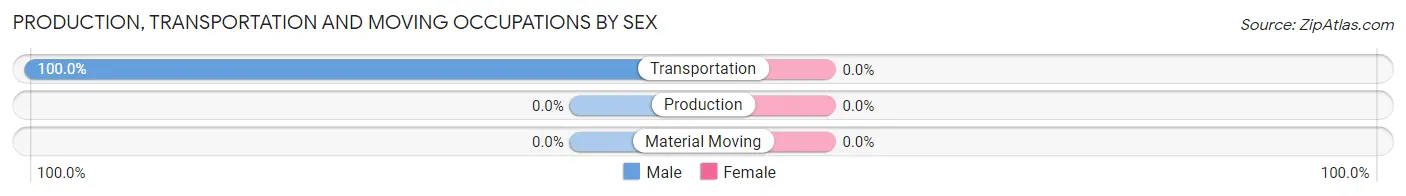
| Occupation | Male | Female |
| Production | 0 (0.0%) | 0 (0.0%) |
| Transportation | 16 (100.0%) | 0 (0.0%) |
| Material Moving | 0 (0.0%) | 0 (0.0%) |
| Total (Category) | 16 (100.0%) | 0 (0.0%) |
| Total (Overall) | 917 (62.1%) | 560 (37.9%) |
Employment Industries by Sex in Weston Lakes
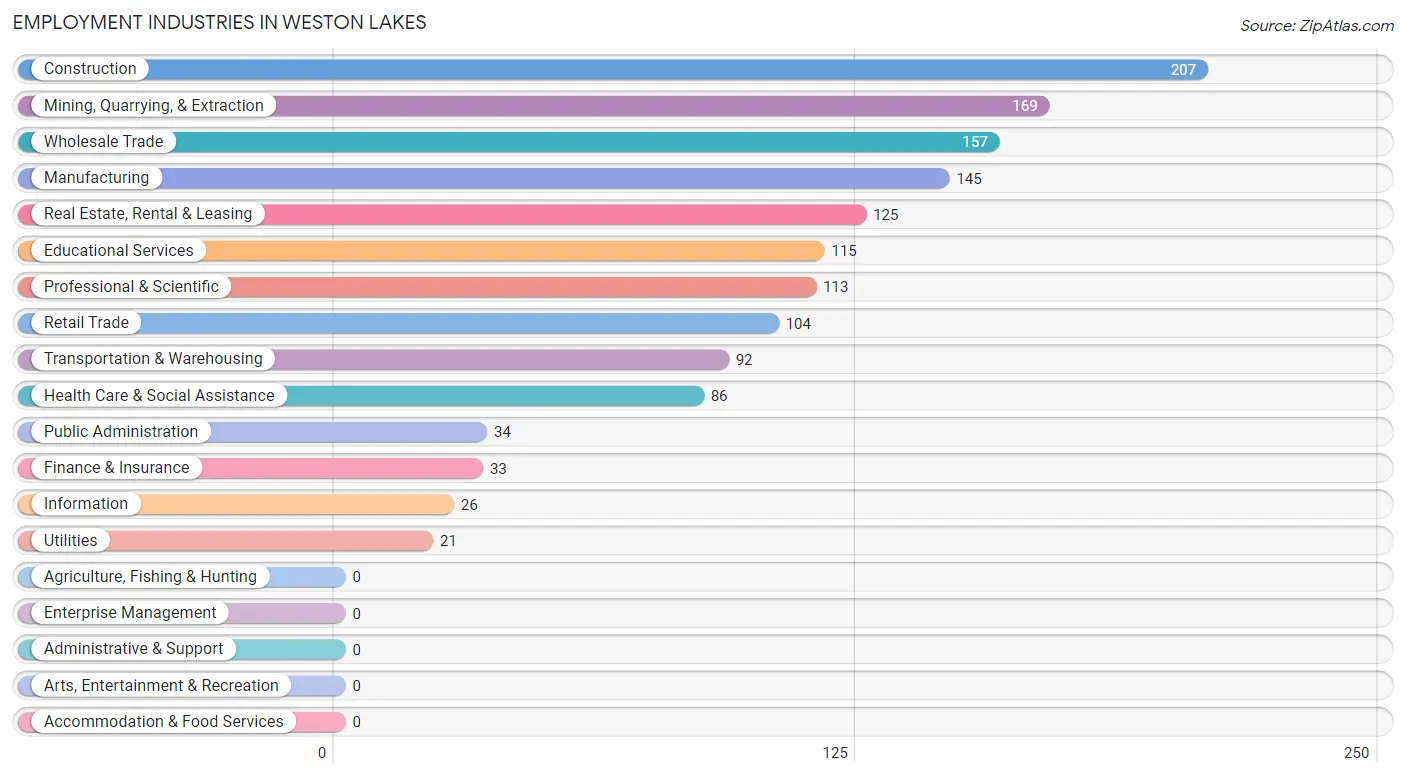
Employment Industries in Weston Lakes
The major employment industries in Weston Lakes include Construction (207 | 14.0%), Mining, Quarrying, & Extraction (169 | 11.4%), Wholesale Trade (157 | 10.6%), Manufacturing (145 | 9.8%), and Real Estate, Rental & Leasing (125 | 8.5%).
Employment Industries by Sex in Weston Lakes
The Weston Lakes industries that see more men than women are Manufacturing (100.0%), Wholesale Trade (100.0%), and Information (100.0%), whereas the industries that tend to have a higher number of women are Utilities (100.0%), Health Care & Social Assistance (88.4%), and Transportation & Warehousing (82.6%).
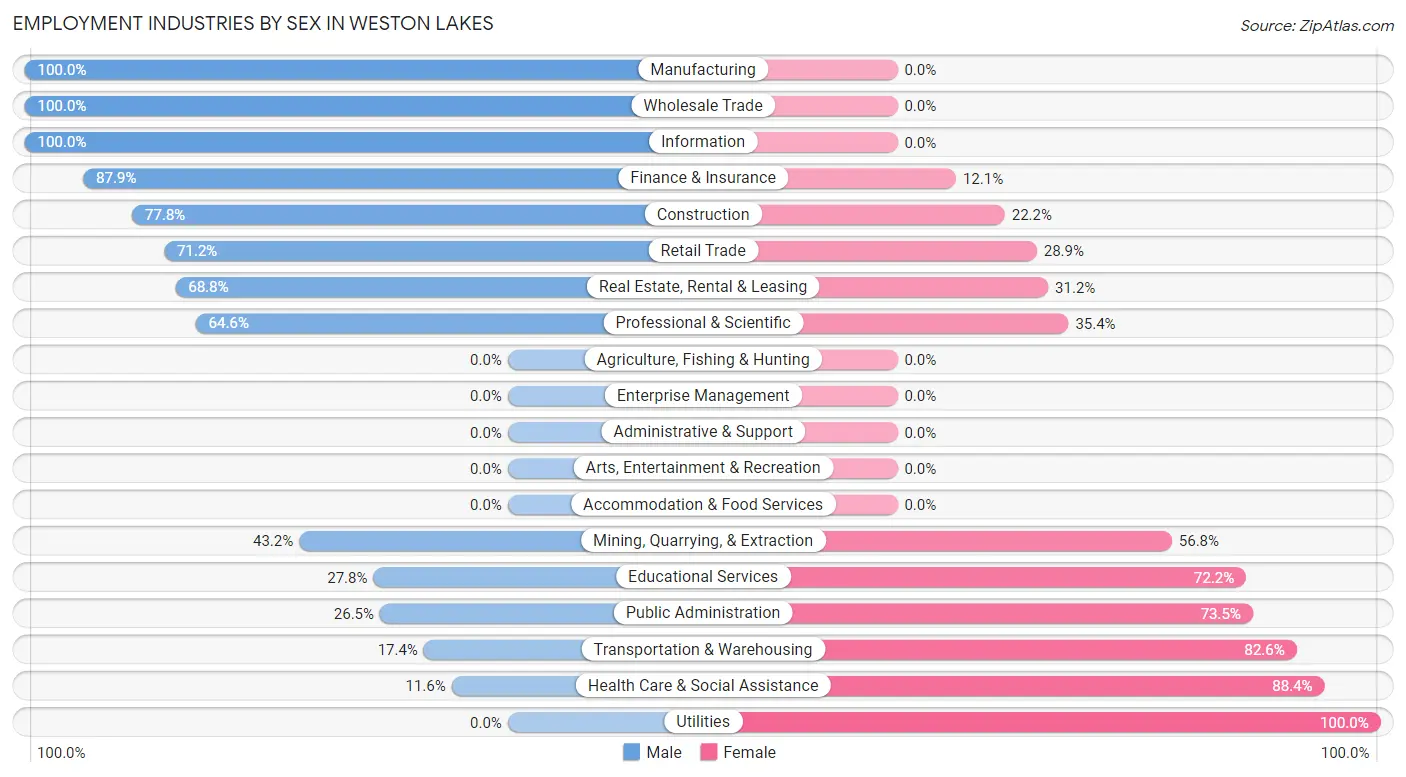
| Industry | Male | Female |
| Agriculture, Fishing & Hunting | 0 (0.0%) | 0 (0.0%) |
| Mining, Quarrying, & Extraction | 73 (43.2%) | 96 (56.8%) |
| Construction | 161 (77.8%) | 46 (22.2%) |
| Manufacturing | 145 (100.0%) | 0 (0.0%) |
| Wholesale Trade | 157 (100.0%) | 0 (0.0%) |
| Retail Trade | 74 (71.2%) | 30 (28.8%) |
| Transportation & Warehousing | 16 (17.4%) | 76 (82.6%) |
| Utilities | 0 (0.0%) | 21 (100.0%) |
| Information | 26 (100.0%) | 0 (0.0%) |
| Finance & Insurance | 29 (87.9%) | 4 (12.1%) |
| Real Estate, Rental & Leasing | 86 (68.8%) | 39 (31.2%) |
| Professional & Scientific | 73 (64.6%) | 40 (35.4%) |
| Enterprise Management | 0 (0.0%) | 0 (0.0%) |
| Administrative & Support | 0 (0.0%) | 0 (0.0%) |
| Educational Services | 32 (27.8%) | 83 (72.2%) |
| Health Care & Social Assistance | 10 (11.6%) | 76 (88.4%) |
| Arts, Entertainment & Recreation | 0 (0.0%) | 0 (0.0%) |
| Accommodation & Food Services | 0 (0.0%) | 0 (0.0%) |
| Public Administration | 9 (26.5%) | 25 (73.5%) |
| Total | 917 (62.1%) | 560 (37.9%) |
Education in Weston Lakes
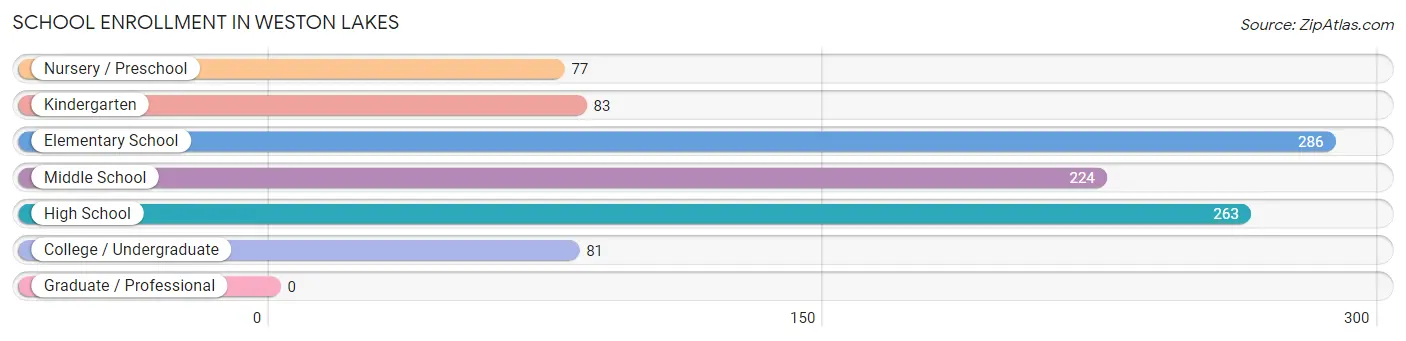
School Enrollment in Weston Lakes
The most common levels of schooling among the 1,014 students in Weston Lakes are elementary school (286 | 28.2%), high school (263 | 25.9%), and middle school (224 | 22.1%).
| School Level | # Students | % Students |
| Nursery / Preschool | 77 | 7.6% |
| Kindergarten | 83 | 8.2% |
| Elementary School | 286 | 28.2% |
| Middle School | 224 | 22.1% |
| High School | 263 | 25.9% |
| College / Undergraduate | 81 | 8.0% |
| Graduate / Professional | 0 | 0.0% |
| Total | 1,014 | 100.0% |
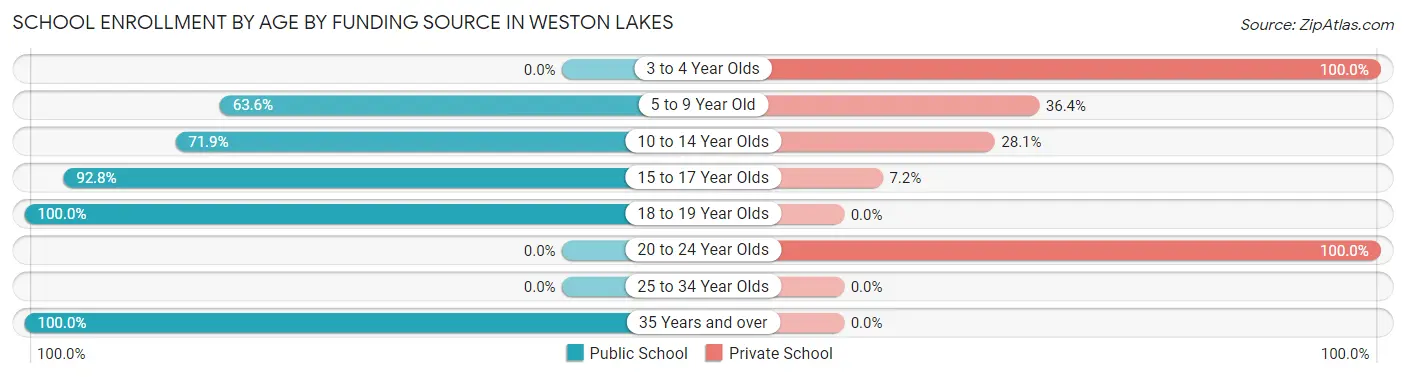
School Enrollment by Age by Funding Source in Weston Lakes
Out of a total of 1,014 students who are enrolled in schools in Weston Lakes, 312 (30.8%) attend a private institution, while the remaining 702 (69.2%) are enrolled in public schools. The age group of 3 to 4 year olds has the highest likelihood of being enrolled in private schools, with 77 (100.0% in the age bracket) enrolled. Conversely, the age group of 18 to 19 year olds has the lowest likelihood of being enrolled in a private school, with 22 (100.0% in the age bracket) attending a public institution.
| Age Bracket | Public School | Private School |
| 3 to 4 Year Olds | 0 (0.0%) | 77 (100.0%) |
| 5 to 9 Year Old | 196 (63.6%) | 112 (36.4%) |
| 10 to 14 Year Olds | 205 (71.9%) | 80 (28.1%) |
| 15 to 17 Year Olds | 244 (92.8%) | 19 (7.2%) |
| 18 to 19 Year Olds | 22 (100.0%) | 0 (0.0%) |
| 20 to 24 Year Olds | 0 (0.0%) | 24 (100.0%) |
| 25 to 34 Year Olds | 0 (0.0%) | 0 (0.0%) |
| 35 Years and over | 35 (100.0%) | 0 (0.0%) |
| Total | 702 (69.2%) | 312 (30.8%) |
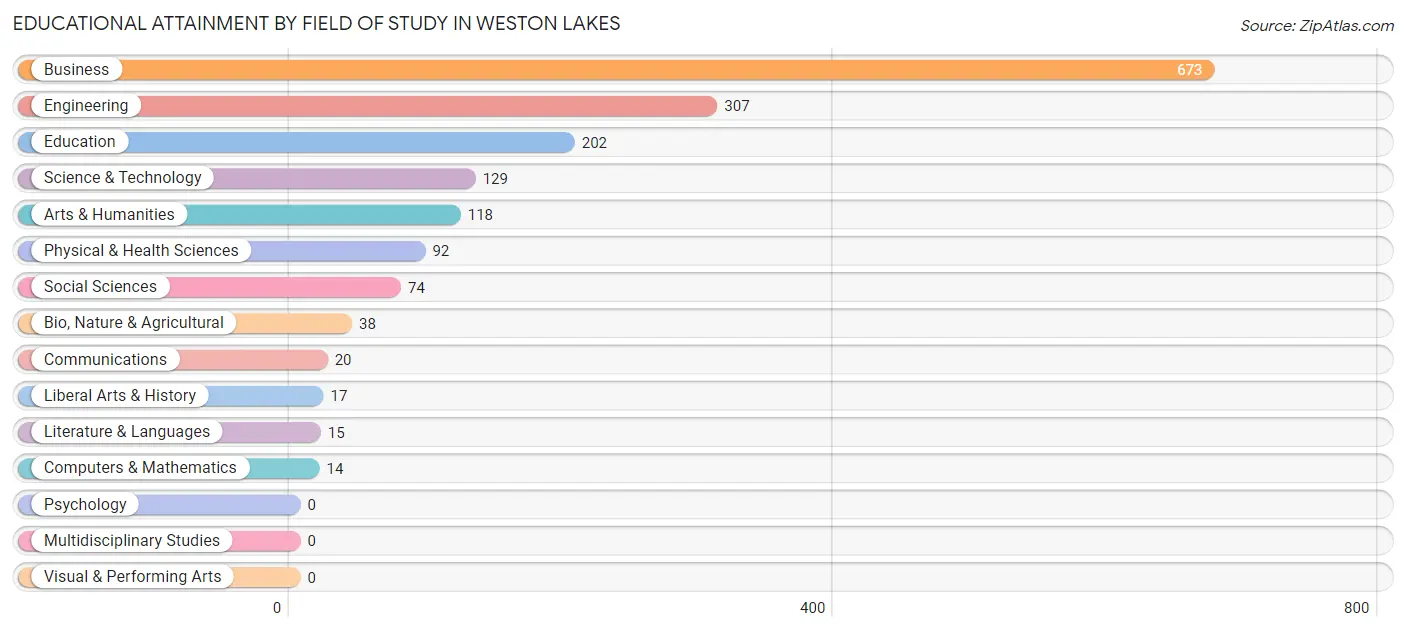
Educational Attainment by Field of Study in Weston Lakes
Business (673 | 39.6%), engineering (307 | 18.1%), education (202 | 11.9%), science & technology (129 | 7.6%), and arts & humanities (118 | 7.0%) are the most common fields of study among 1,699 individuals in Weston Lakes who have obtained a bachelor's degree or higher.
| Field of Study | # Graduates | % Graduates |
| Computers & Mathematics | 14 | 0.8% |
| Bio, Nature & Agricultural | 38 | 2.2% |
| Physical & Health Sciences | 92 | 5.4% |
| Psychology | 0 | 0.0% |
| Social Sciences | 74 | 4.4% |
| Engineering | 307 | 18.1% |
| Multidisciplinary Studies | 0 | 0.0% |
| Science & Technology | 129 | 7.6% |
| Business | 673 | 39.6% |
| Education | 202 | 11.9% |
| Literature & Languages | 15 | 0.9% |
| Liberal Arts & History | 17 | 1.0% |
| Visual & Performing Arts | 0 | 0.0% |
| Communications | 20 | 1.2% |
| Arts & Humanities | 118 | 7.0% |
| Total | 1,699 | 100.0% |
Transportation & Commute in Weston Lakes
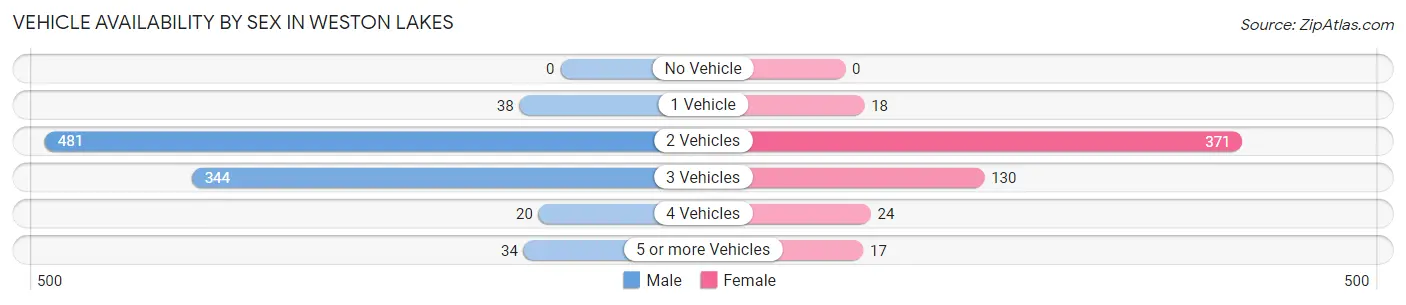
Vehicle Availability by Sex in Weston Lakes
The most prevalent vehicle ownership categories in Weston Lakes are males with 2 vehicles (481, accounting for 52.4%) and females with 2 vehicles (371, making up 85.9%).
| Vehicles Available | Male | Female |
| No Vehicle | 0 (0.0%) | 0 (0.0%) |
| 1 Vehicle | 38 (4.1%) | 18 (3.2%) |
| 2 Vehicles | 481 (52.4%) | 371 (66.2%) |
| 3 Vehicles | 344 (37.5%) | 130 (23.2%) |
| 4 Vehicles | 20 (2.2%) | 24 (4.3%) |
| 5 or more Vehicles | 34 (3.7%) | 17 (3.0%) |
| Total | 917 (100.0%) | 560 (100.0%) |
Commute Time in Weston Lakes
The most frequently occuring commute durations in Weston Lakes are 45 to 59 minutes (372 commuters, 31.2%), 25 to 29 minutes (189 commuters, 15.8%), and 20 to 24 minutes (161 commuters, 13.5%).
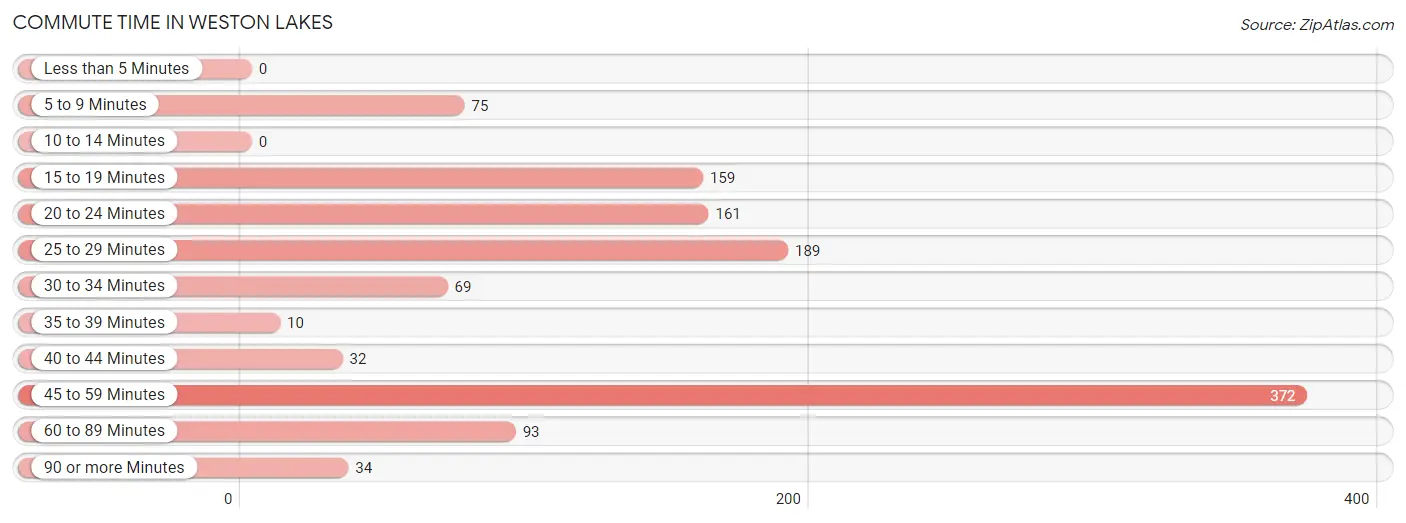
| Commute Time | # Commuters | % Commuters |
| Less than 5 Minutes | 0 | 0.0% |
| 5 to 9 Minutes | 75 | 6.3% |
| 10 to 14 Minutes | 0 | 0.0% |
| 15 to 19 Minutes | 159 | 13.3% |
| 20 to 24 Minutes | 161 | 13.5% |
| 25 to 29 Minutes | 189 | 15.8% |
| 30 to 34 Minutes | 69 | 5.8% |
| 35 to 39 Minutes | 10 | 0.8% |
| 40 to 44 Minutes | 32 | 2.7% |
| 45 to 59 Minutes | 372 | 31.2% |
| 60 to 89 Minutes | 93 | 7.8% |
| 90 or more Minutes | 34 | 2.9% |
Commute Time by Sex in Weston Lakes
The most common commute times in Weston Lakes are 45 to 59 minutes (224 commuters, 29.3%) for males and 45 to 59 minutes (148 commuters, 34.5%) for females.
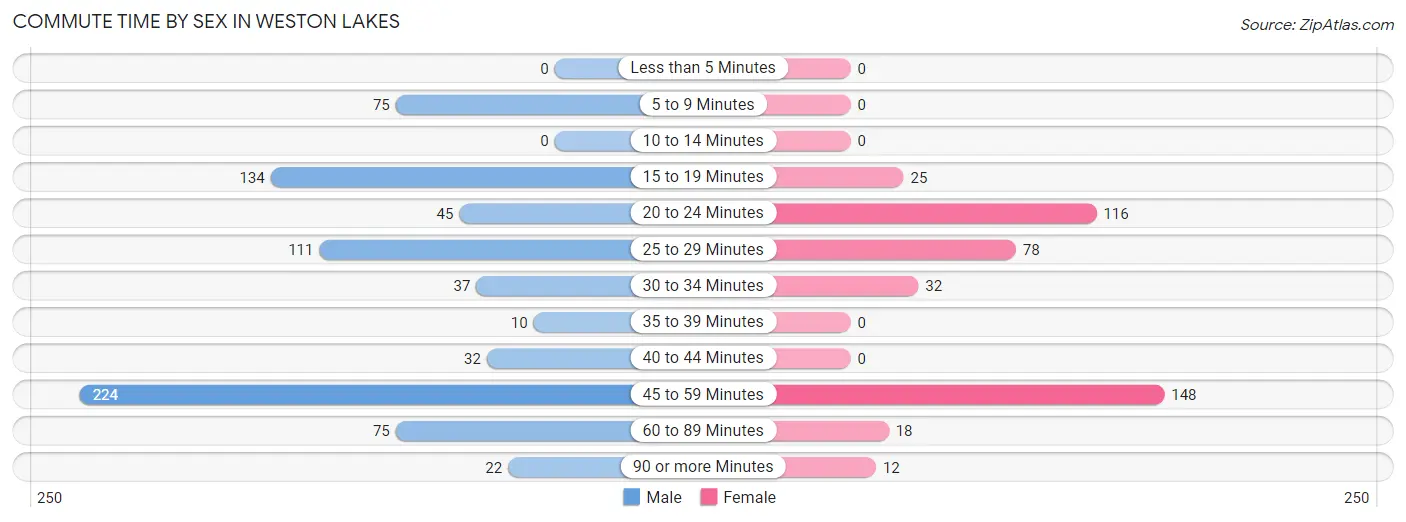
| Commute Time | Male | Female |
| Less than 5 Minutes | 0 (0.0%) | 0 (0.0%) |
| 5 to 9 Minutes | 75 (9.8%) | 0 (0.0%) |
| 10 to 14 Minutes | 0 (0.0%) | 0 (0.0%) |
| 15 to 19 Minutes | 134 (17.5%) | 25 (5.8%) |
| 20 to 24 Minutes | 45 (5.9%) | 116 (27.0%) |
| 25 to 29 Minutes | 111 (14.5%) | 78 (18.2%) |
| 30 to 34 Minutes | 37 (4.8%) | 32 (7.5%) |
| 35 to 39 Minutes | 10 (1.3%) | 0 (0.0%) |
| 40 to 44 Minutes | 32 (4.2%) | 0 (0.0%) |
| 45 to 59 Minutes | 224 (29.3%) | 148 (34.5%) |
| 60 to 89 Minutes | 75 (9.8%) | 18 (4.2%) |
| 90 or more Minutes | 22 (2.9%) | 12 (2.8%) |
Time of Departure to Work by Sex in Weston Lakes
The most frequent times of departure to work in Weston Lakes are 5:00 AM to 5:29 AM (178, 23.3%) for males and 8:00 AM to 8:29 AM (100, 23.3%) for females.
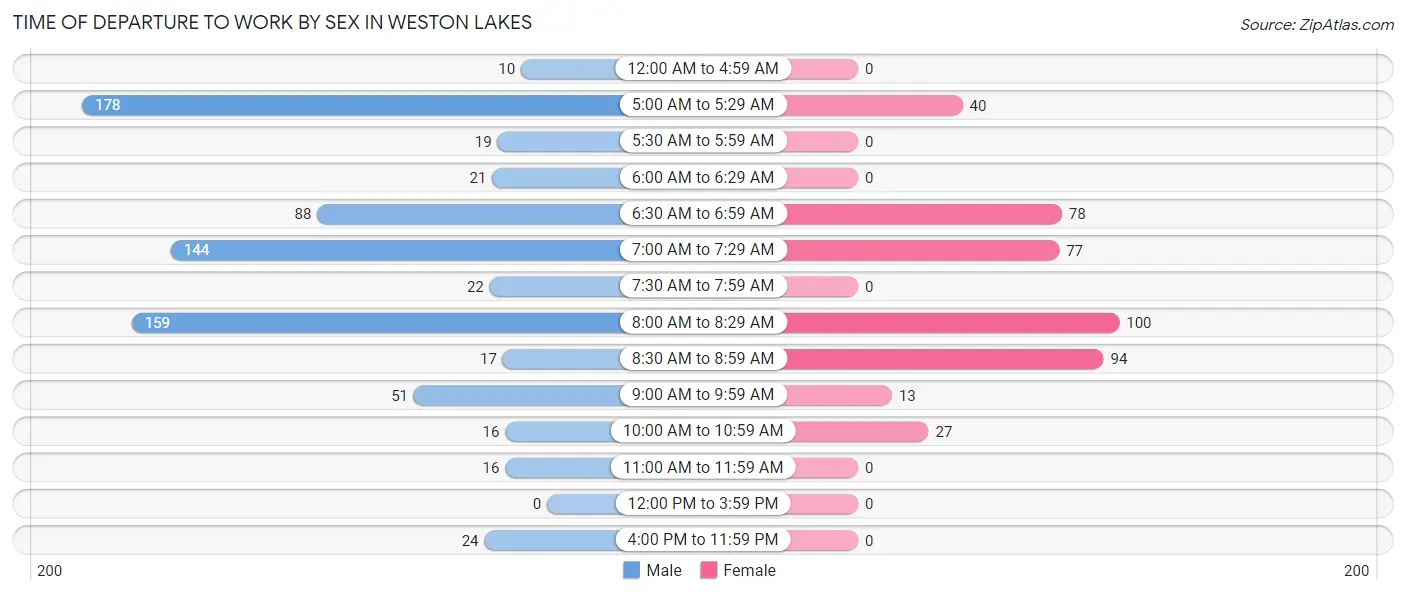
| Time of Departure | Male | Female |
| 12:00 AM to 4:59 AM | 10 (1.3%) | 0 (0.0%) |
| 5:00 AM to 5:29 AM | 178 (23.3%) | 40 (9.3%) |
| 5:30 AM to 5:59 AM | 19 (2.5%) | 0 (0.0%) |
| 6:00 AM to 6:29 AM | 21 (2.8%) | 0 (0.0%) |
| 6:30 AM to 6:59 AM | 88 (11.5%) | 78 (18.2%) |
| 7:00 AM to 7:29 AM | 144 (18.8%) | 77 (17.9%) |
| 7:30 AM to 7:59 AM | 22 (2.9%) | 0 (0.0%) |
| 8:00 AM to 8:29 AM | 159 (20.8%) | 100 (23.3%) |
| 8:30 AM to 8:59 AM | 17 (2.2%) | 94 (21.9%) |
| 9:00 AM to 9:59 AM | 51 (6.7%) | 13 (3.0%) |
| 10:00 AM to 10:59 AM | 16 (2.1%) | 27 (6.3%) |
| 11:00 AM to 11:59 AM | 16 (2.1%) | 0 (0.0%) |
| 12:00 PM to 3:59 PM | 0 (0.0%) | 0 (0.0%) |
| 4:00 PM to 11:59 PM | 24 (3.1%) | 0 (0.0%) |
| Total | 765 (100.0%) | 429 (100.0%) |
Housing Occupancy in Weston Lakes
Occupancy by Ownership in Weston Lakes
Of the total 1,409 dwellings in Weston Lakes, owner-occupied units account for 1,409 (100.0%), while renter-occupied units make up 0 (0.0%).
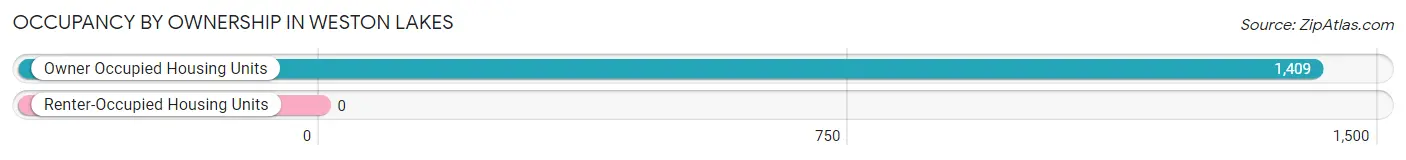
| Occupancy | # Housing Units | % Housing Units |
| Owner Occupied Housing Units | 1,409 | 100.0% |
| Renter-Occupied Housing Units | 0 | 0.0% |
| Total Occupied Housing Units | 1,409 | 100.0% |
Occupancy by Household Size in Weston Lakes
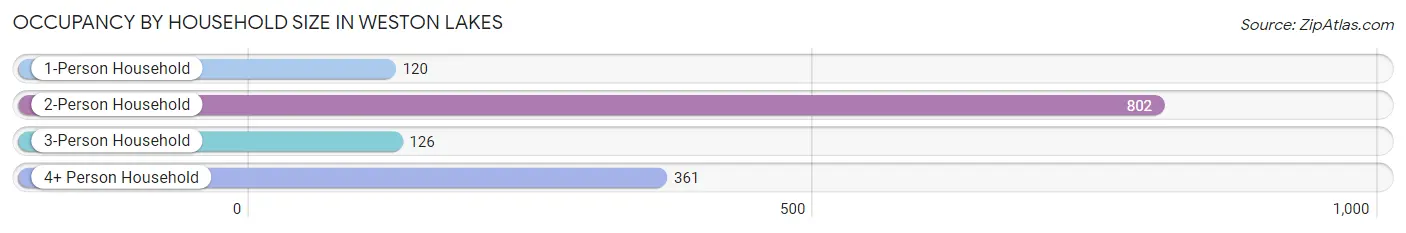
| Household Size | # Housing Units | % Housing Units |
| 1-Person Household | 120 | 8.5% |
| 2-Person Household | 802 | 56.9% |
| 3-Person Household | 126 | 8.9% |
| 4+ Person Household | 361 | 25.6% |
| Total Housing Units | 1,409 | 100.0% |
Occupancy by Ownership by Household Size in Weston Lakes
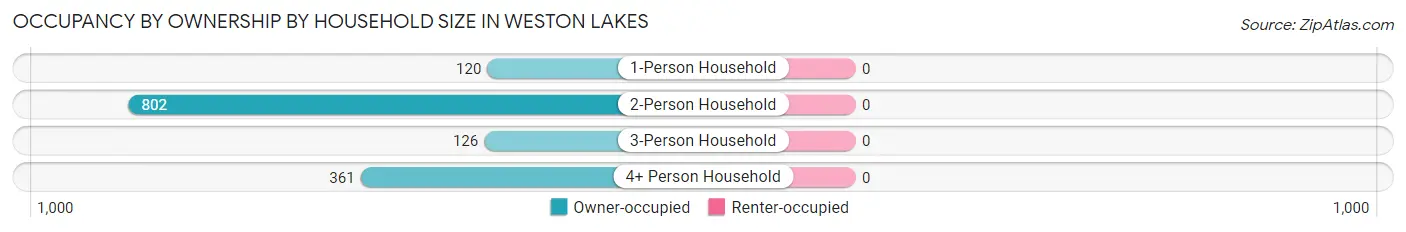
| Household Size | Owner-occupied | Renter-occupied |
| 1-Person Household | 120 (100.0%) | 0 (0.0%) |
| 2-Person Household | 802 (100.0%) | 0 (0.0%) |
| 3-Person Household | 126 (100.0%) | 0 (0.0%) |
| 4+ Person Household | 361 (100.0%) | 0 (0.0%) |
| Total Housing Units | 1,409 (100.0%) | 0 (0.0%) |
Occupancy by Educational Attainment in Weston Lakes
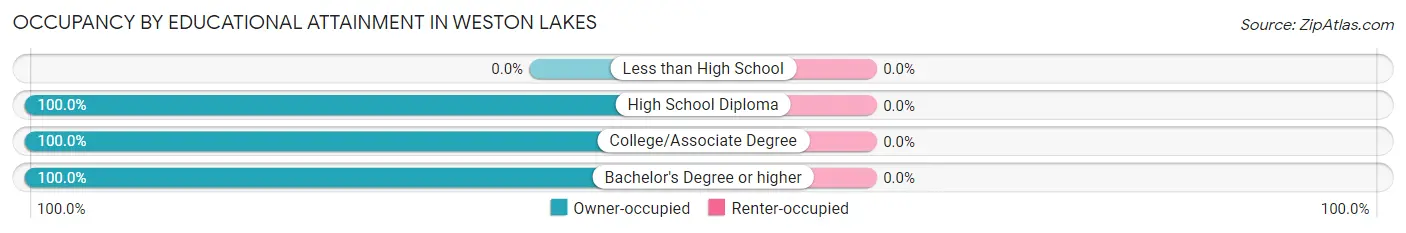
| Household Size | Owner-occupied | Renter-occupied |
| Less than High School | 0 (0.0%) | 0 (0.0%) |
| High School Diploma | 42 (100.0%) | 0 (0.0%) |
| College/Associate Degree | 533 (100.0%) | 0 (0.0%) |
| Bachelor's Degree or higher | 834 (100.0%) | 0 (0.0%) |
Occupancy by Age of Householder in Weston Lakes
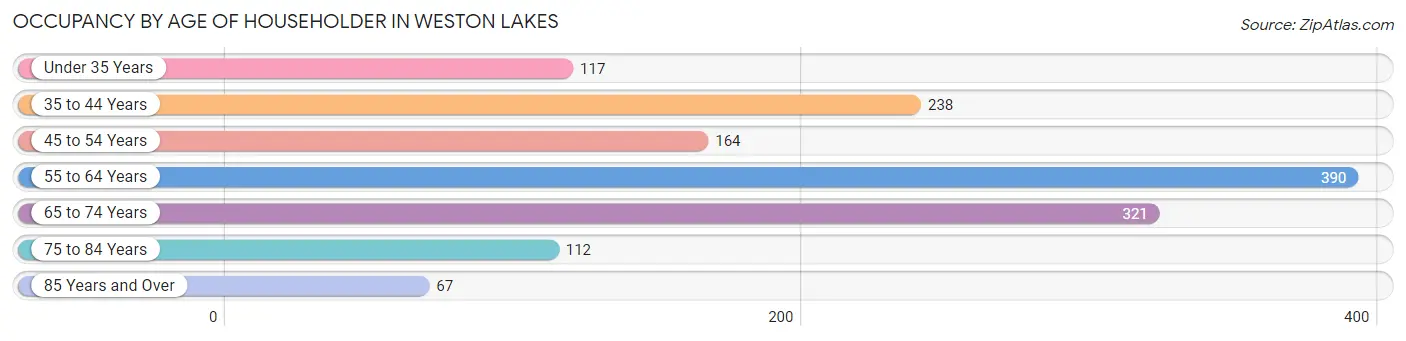
| Age Bracket | # Households | % Households |
| Under 35 Years | 117 | 8.3% |
| 35 to 44 Years | 238 | 16.9% |
| 45 to 54 Years | 164 | 11.6% |
| 55 to 64 Years | 390 | 27.7% |
| 65 to 74 Years | 321 | 22.8% |
| 75 to 84 Years | 112 | 8.0% |
| 85 Years and Over | 67 | 4.8% |
| Total | 1,409 | 100.0% |
Housing Finances in Weston Lakes
Median Income by Occupancy in Weston Lakes
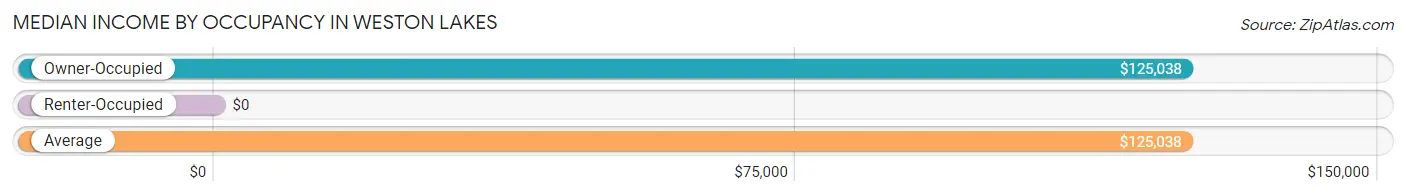
| Occupancy Type | # Households | Median Income |
| Owner-Occupied | 1,409 (100.0%) | $125,038 |
| Renter-Occupied | 0 (0.0%) | $0 |
| Average | 1,409 (100.0%) | $125,038 |
Occupancy by Householder Income Bracket in Weston Lakes
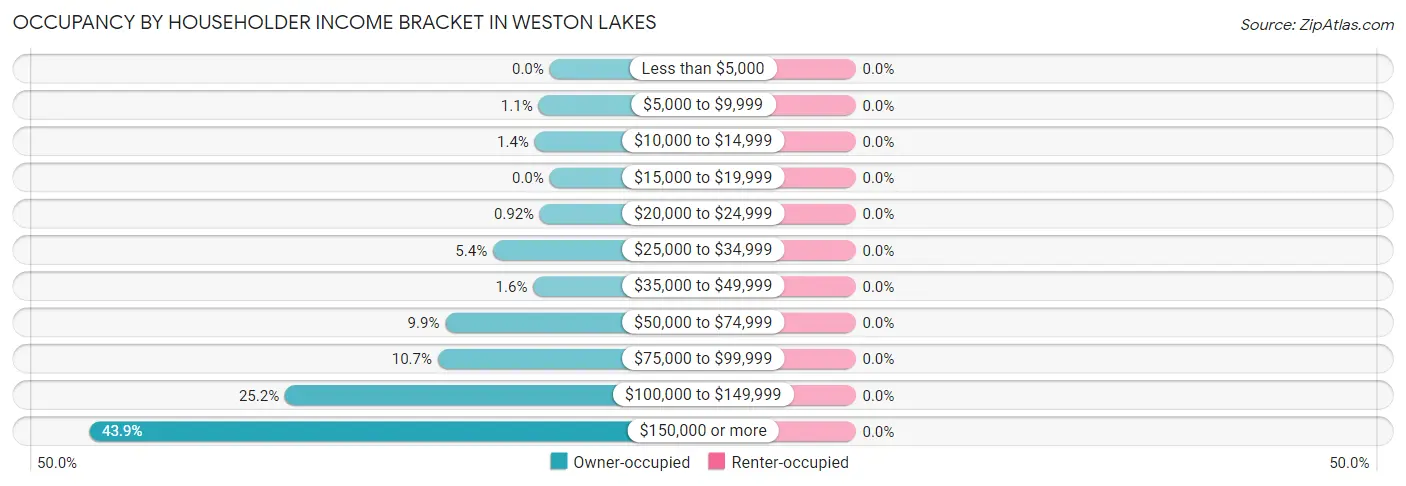
| Income Bracket | Owner-occupied | Renter-occupied |
| Less than $5,000 | 0 (0.0%) | 0 (0.0%) |
| $5,000 to $9,999 | 15 (1.1%) | 0 (0.0%) |
| $10,000 to $14,999 | 20 (1.4%) | 0 (0.0%) |
| $15,000 to $19,999 | 0 (0.0%) | 0 (0.0%) |
| $20,000 to $24,999 | 13 (0.9%) | 0 (0.0%) |
| $25,000 to $34,999 | 76 (5.4%) | 0 (0.0%) |
| $35,000 to $49,999 | 22 (1.6%) | 0 (0.0%) |
| $50,000 to $74,999 | 140 (9.9%) | 0 (0.0%) |
| $75,000 to $99,999 | 150 (10.6%) | 0 (0.0%) |
| $100,000 to $149,999 | 355 (25.2%) | 0 (0.0%) |
| $150,000 or more | 618 (43.9%) | 0 (0.0%) |
| Total | 1,409 (100.0%) | 0 (0.0%) |
Monthly Housing Cost Tiers in Weston Lakes
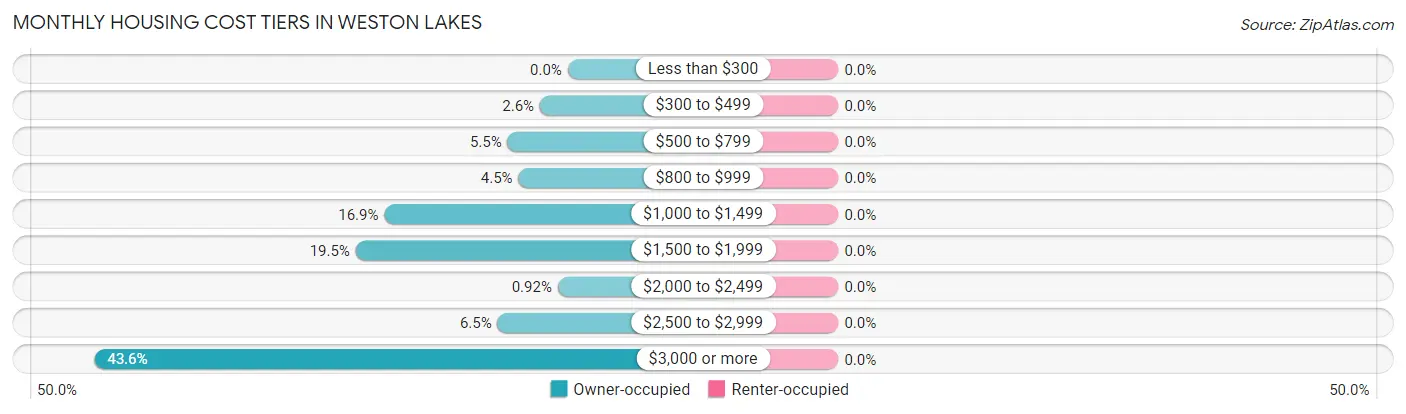
| Monthly Cost | Owner-occupied | Renter-occupied |
| Less than $300 | 0 (0.0%) | 0 (0.0%) |
| $300 to $499 | 36 (2.6%) | 0 (0.0%) |
| $500 to $799 | 78 (5.5%) | 0 (0.0%) |
| $800 to $999 | 64 (4.5%) | 0 (0.0%) |
| $1,000 to $1,499 | 238 (16.9%) | 0 (0.0%) |
| $1,500 to $1,999 | 275 (19.5%) | 0 (0.0%) |
| $2,000 to $2,499 | 13 (0.9%) | 0 (0.0%) |
| $2,500 to $2,999 | 91 (6.5%) | 0 (0.0%) |
| $3,000 or more | 614 (43.6%) | 0 (0.0%) |
| Total | 1,409 (100.0%) | 0 (0.0%) |
Physical Housing Characteristics in Weston Lakes
Housing Structures in Weston Lakes
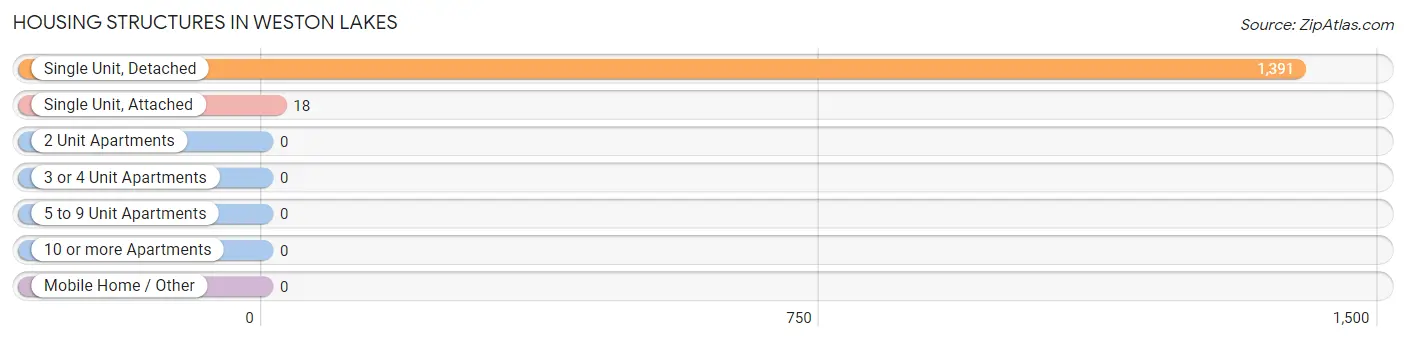
| Structure Type | # Housing Units | % Housing Units |
| Single Unit, Detached | 1,391 | 98.7% |
| Single Unit, Attached | 18 | 1.3% |
| 2 Unit Apartments | 0 | 0.0% |
| 3 or 4 Unit Apartments | 0 | 0.0% |
| 5 to 9 Unit Apartments | 0 | 0.0% |
| 10 or more Apartments | 0 | 0.0% |
| Mobile Home / Other | 0 | 0.0% |
| Total | 1,409 | 100.0% |
Housing Structures by Occupancy in Weston Lakes
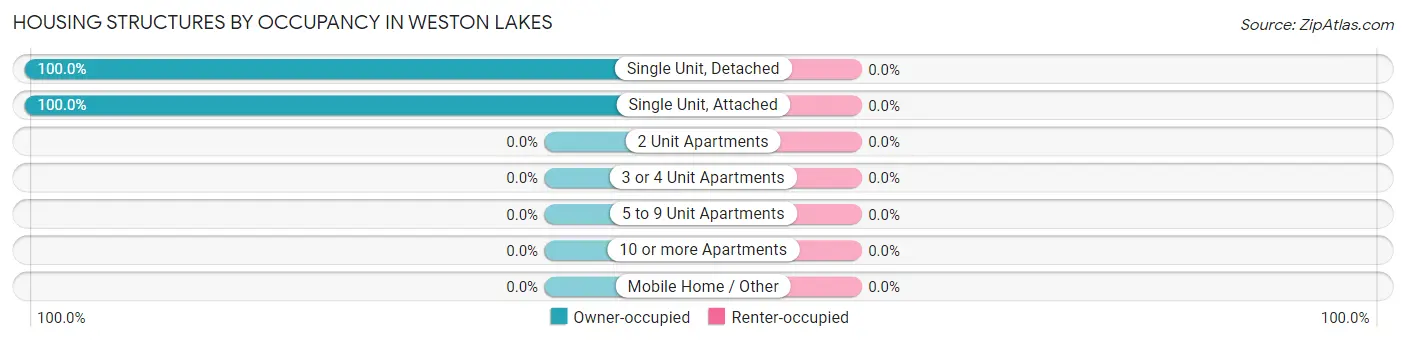
| Structure Type | Owner-occupied | Renter-occupied |
| Single Unit, Detached | 1,391 (100.0%) | 0 (0.0%) |
| Single Unit, Attached | 18 (100.0%) | 0 (0.0%) |
| 2 Unit Apartments | 0 (0.0%) | 0 (0.0%) |
| 3 or 4 Unit Apartments | 0 (0.0%) | 0 (0.0%) |
| 5 to 9 Unit Apartments | 0 (0.0%) | 0 (0.0%) |
| 10 or more Apartments | 0 (0.0%) | 0 (0.0%) |
| Mobile Home / Other | 0 (0.0%) | 0 (0.0%) |
| Total | 1,409 (100.0%) | 0 (0.0%) |
Housing Structures by Number of Rooms in Weston Lakes
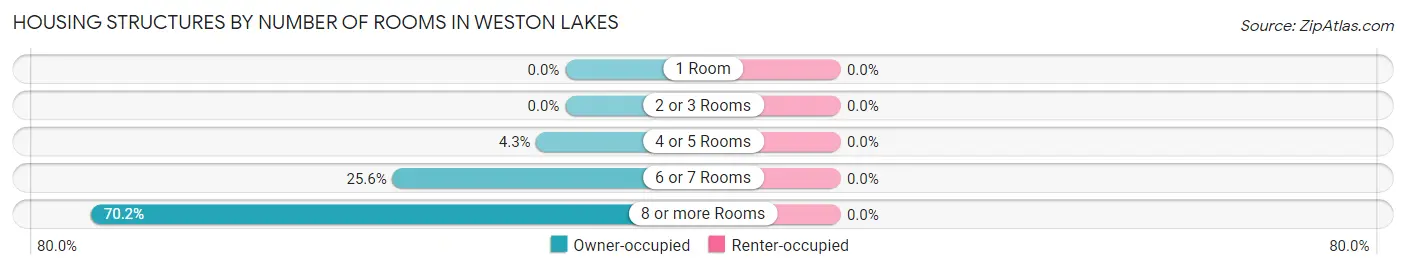
| Number of Rooms | Owner-occupied | Renter-occupied |
| 1 Room | 0 (0.0%) | 0 (0.0%) |
| 2 or 3 Rooms | 0 (0.0%) | 0 (0.0%) |
| 4 or 5 Rooms | 60 (4.3%) | 0 (0.0%) |
| 6 or 7 Rooms | 360 (25.6%) | 0 (0.0%) |
| 8 or more Rooms | 989 (70.2%) | 0 (0.0%) |
| Total | 1,409 (100.0%) | 0 (0.0%) |
Housing Structure by Heating Type in Weston Lakes
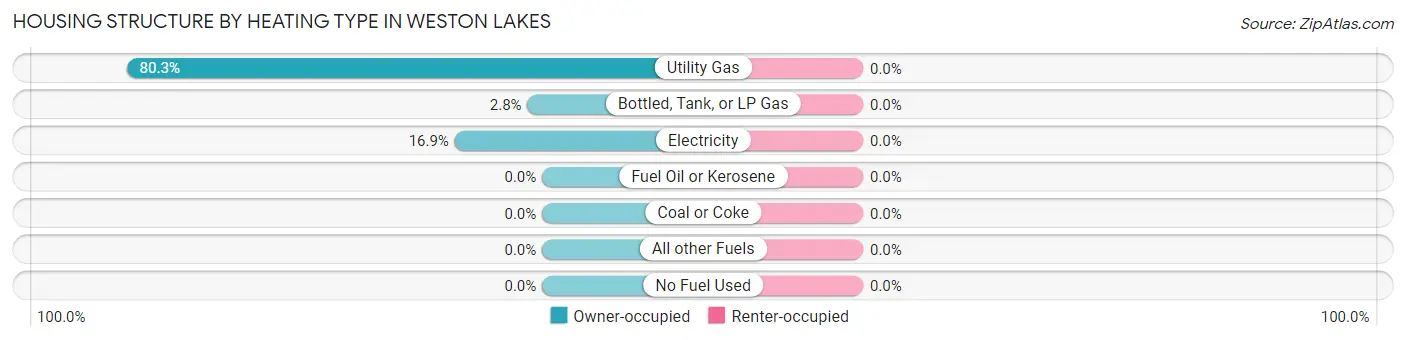
| Heating Type | Owner-occupied | Renter-occupied |
| Utility Gas | 1,131 (80.3%) | 0 (0.0%) |
| Bottled, Tank, or LP Gas | 40 (2.8%) | 0 (0.0%) |
| Electricity | 238 (16.9%) | 0 (0.0%) |
| Fuel Oil or Kerosene | 0 (0.0%) | 0 (0.0%) |
| Coal or Coke | 0 (0.0%) | 0 (0.0%) |
| All other Fuels | 0 (0.0%) | 0 (0.0%) |
| No Fuel Used | 0 (0.0%) | 0 (0.0%) |
| Total | 1,409 (100.0%) | 0 (0.0%) |
Household Vehicle Usage in Weston Lakes
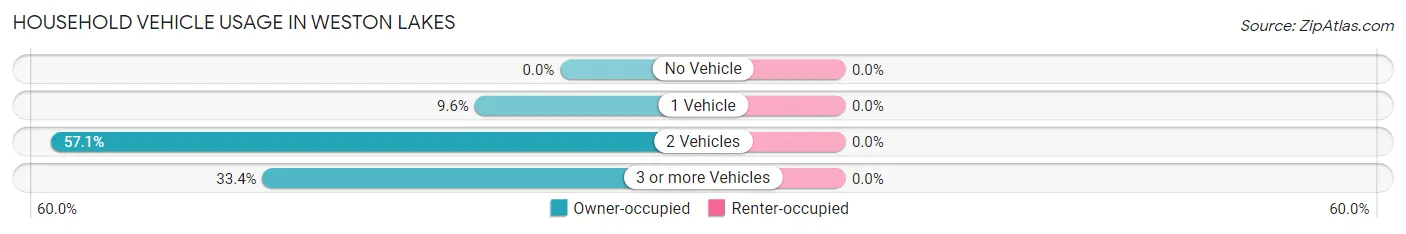
| Vehicles per Household | Owner-occupied | Renter-occupied |
| No Vehicle | 0 (0.0%) | 0 (0.0%) |
| 1 Vehicle | 135 (9.6%) | 0 (0.0%) |
| 2 Vehicles | 804 (57.1%) | 0 (0.0%) |
| 3 or more Vehicles | 470 (33.4%) | 0 (0.0%) |
| Total | 1,409 (100.0%) | 0 (0.0%) |
Real Estate & Mortgages in Weston Lakes
Real Estate and Mortgage Overview in Weston Lakes
| Characteristic | Without Mortgage | With Mortgage |
| Housing Units | 570 | 839 |
| Median Property Value | $503,400 | $611,100 |
| Median Household Income | $98,667 | $475 |
| Monthly Housing Costs | $1,227 | $614 |
| Real Estate Taxes | $8,455 | $17 |
Property Value by Mortgage Status in Weston Lakes
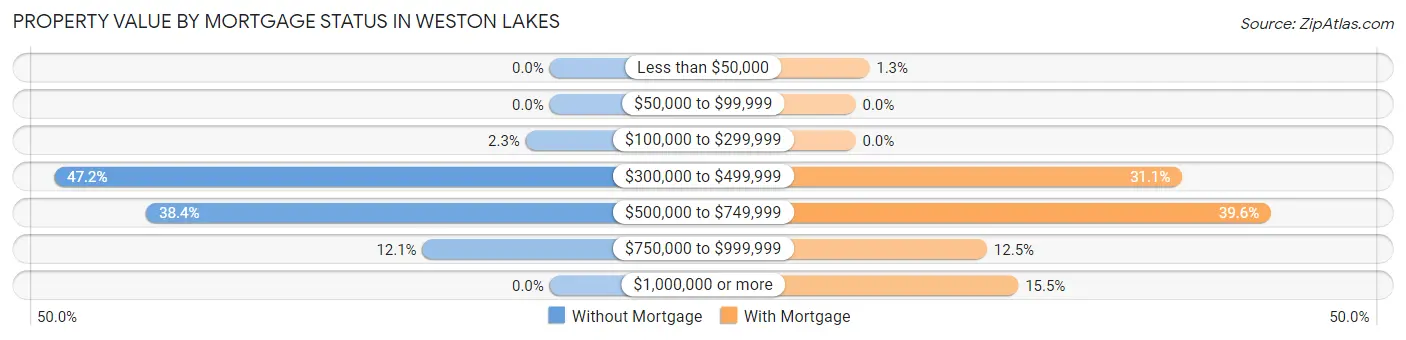
| Property Value | Without Mortgage | With Mortgage |
| Less than $50,000 | 0 (0.0%) | 11 (1.3%) |
| $50,000 to $99,999 | 0 (0.0%) | 0 (0.0%) |
| $100,000 to $299,999 | 13 (2.3%) | 0 (0.0%) |
| $300,000 to $499,999 | 269 (47.2%) | 261 (31.1%) |
| $500,000 to $749,999 | 219 (38.4%) | 332 (39.6%) |
| $750,000 to $999,999 | 69 (12.1%) | 105 (12.5%) |
| $1,000,000 or more | 0 (0.0%) | 130 (15.5%) |
| Total | 570 (100.0%) | 839 (100.0%) |
Household Income by Mortgage Status in Weston Lakes
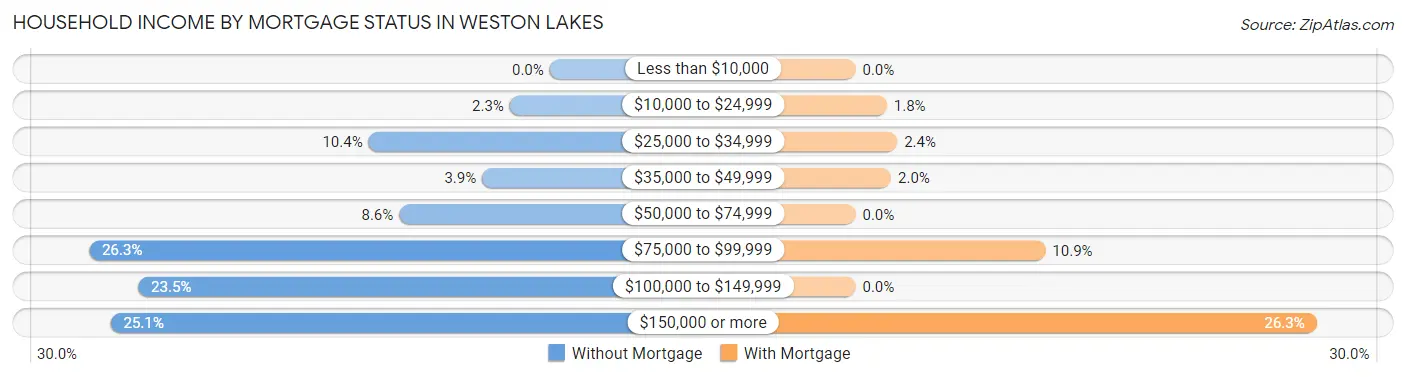
| Household Income | Without Mortgage | With Mortgage |
| Less than $10,000 | 0 (0.0%) | 0 (0.0%) |
| $10,000 to $24,999 | 13 (2.3%) | 15 (1.8%) |
| $25,000 to $34,999 | 59 (10.3%) | 20 (2.4%) |
| $35,000 to $49,999 | 22 (3.9%) | 17 (2.0%) |
| $50,000 to $74,999 | 49 (8.6%) | 0 (0.0%) |
| $75,000 to $99,999 | 150 (26.3%) | 91 (10.8%) |
| $100,000 to $149,999 | 134 (23.5%) | 0 (0.0%) |
| $150,000 or more | 143 (25.1%) | 221 (26.3%) |
| Total | 570 (100.0%) | 839 (100.0%) |
Property Value to Household Income Ratio in Weston Lakes
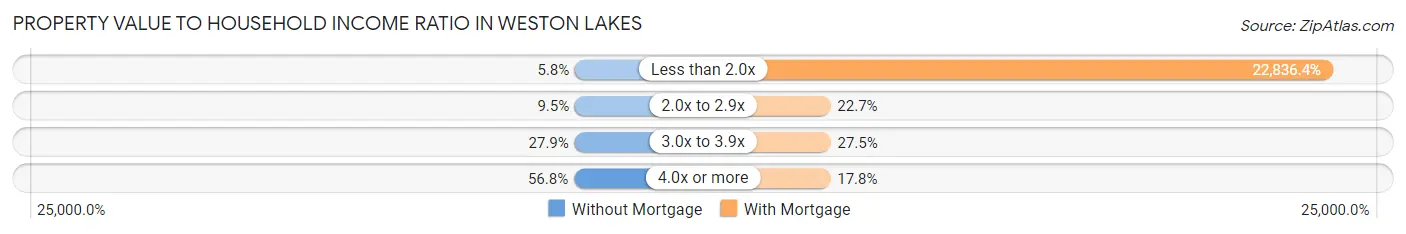
| Value-to-Income Ratio | Without Mortgage | With Mortgage |
| Less than 2.0x | 33 (5.8%) | 191,597 (22,836.3%) |
| 2.0x to 2.9x | 54 (9.5%) | 190 (22.7%) |
| 3.0x to 3.9x | 159 (27.9%) | 231 (27.5%) |
| 4.0x or more | 324 (56.8%) | 149 (17.8%) |
| Total | 570 (100.0%) | 839 (100.0%) |
Real Estate Taxes by Mortgage Status in Weston Lakes
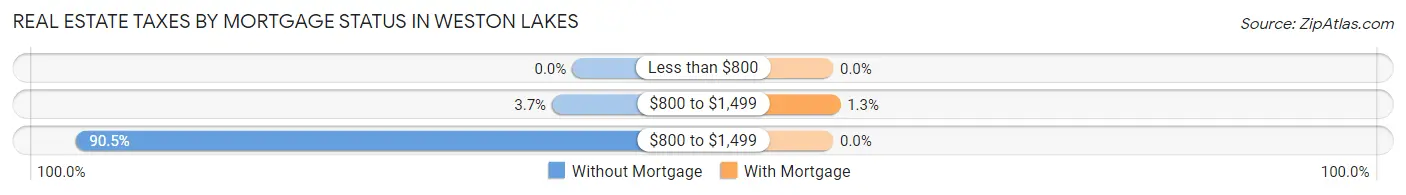
| Property Taxes | Without Mortgage | With Mortgage |
| Less than $800 | 0 (0.0%) | 0 (0.0%) |
| $800 to $1,499 | 21 (3.7%) | 11 (1.3%) |
| $800 to $1,499 | 516 (90.5%) | 0 (0.0%) |
| Total | 570 (100.0%) | 839 (100.0%) |
Health & Disability in Weston Lakes
Health Insurance Coverage by Age in Weston Lakes
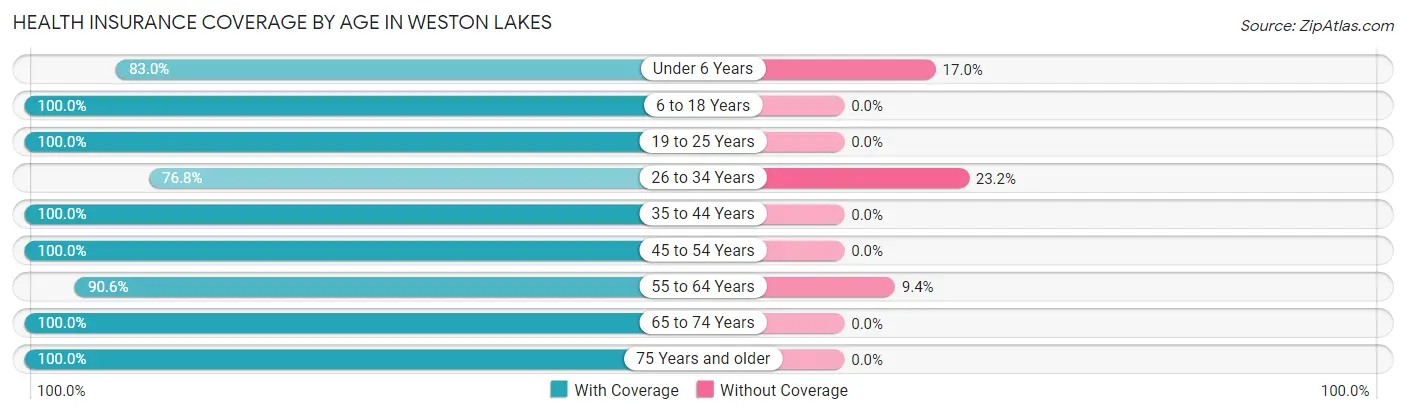
| Age Bracket | With Coverage | Without Coverage |
| Under 6 Years | 185 (83.0%) | 38 (17.0%) |
| 6 to 18 Years | 817 (100.0%) | 0 (0.0%) |
| 19 to 25 Years | 102 (100.0%) | 0 (0.0%) |
| 26 to 34 Years | 324 (76.8%) | 98 (23.2%) |
| 35 to 44 Years | 497 (100.0%) | 0 (0.0%) |
| 45 to 54 Years | 288 (100.0%) | 0 (0.0%) |
| 55 to 64 Years | 567 (90.6%) | 59 (9.4%) |
| 65 to 74 Years | 650 (100.0%) | 0 (0.0%) |
| 75 Years and older | 282 (100.0%) | 0 (0.0%) |
| Total | 3,712 (95.0%) | 195 (5.0%) |
Health Insurance Coverage by Citizenship Status in Weston Lakes
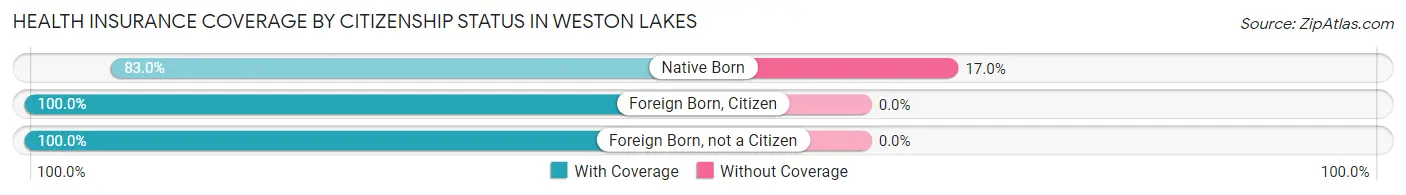
| Citizenship Status | With Coverage | Without Coverage |
| Native Born | 185 (83.0%) | 38 (17.0%) |
| Foreign Born, Citizen | 817 (100.0%) | 0 (0.0%) |
| Foreign Born, not a Citizen | 102 (100.0%) | 0 (0.0%) |
Health Insurance Coverage by Household Income in Weston Lakes
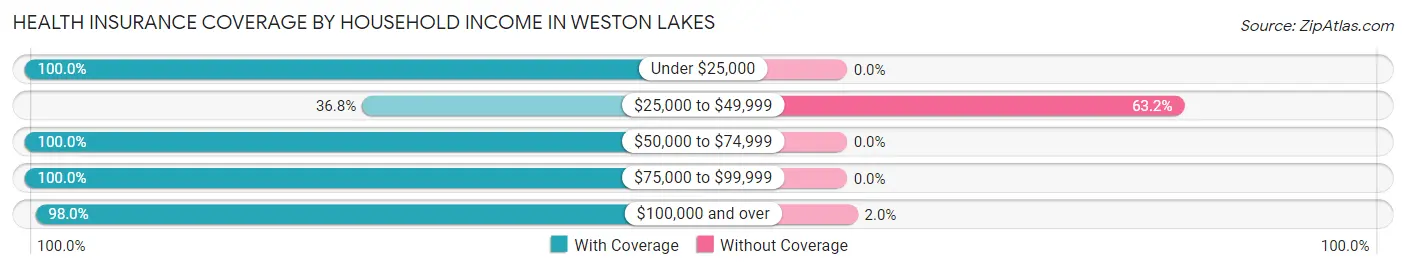
| Household Income | With Coverage | Without Coverage |
| Under $25,000 | 105 (100.0%) | 0 (0.0%) |
| $25,000 to $49,999 | 78 (36.8%) | 134 (63.2%) |
| $50,000 to $74,999 | 360 (100.0%) | 0 (0.0%) |
| $75,000 to $99,999 | 214 (100.0%) | 0 (0.0%) |
| $100,000 and over | 2,955 (98.0%) | 61 (2.0%) |
Public vs Private Health Insurance Coverage by Age in Weston Lakes
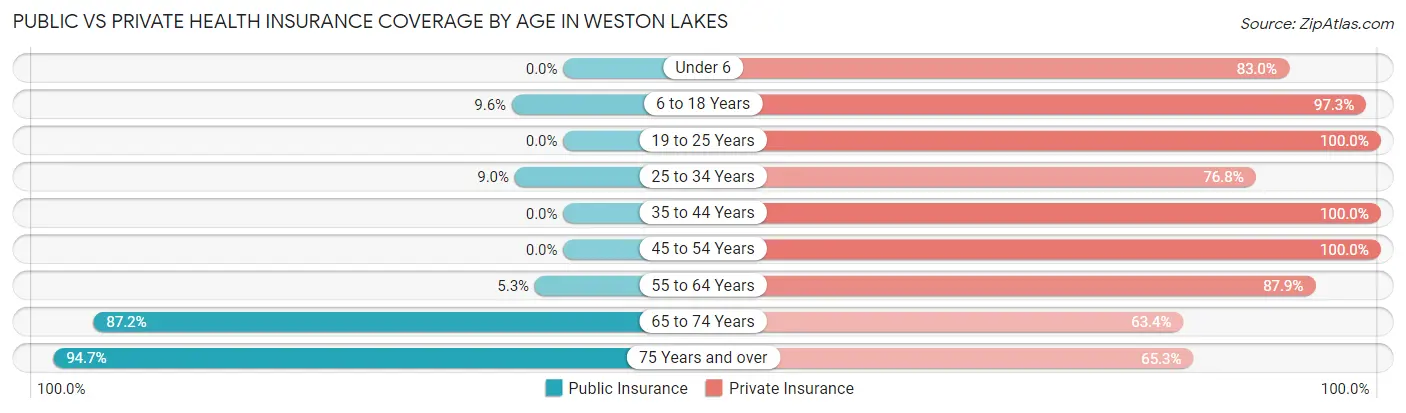
| Age Bracket | Public Insurance | Private Insurance |
| Under 6 | 0 (0.0%) | 185 (83.0%) |
| 6 to 18 Years | 78 (9.6%) | 795 (97.3%) |
| 19 to 25 Years | 0 (0.0%) | 102 (100.0%) |
| 25 to 34 Years | 38 (9.0%) | 324 (76.8%) |
| 35 to 44 Years | 0 (0.0%) | 497 (100.0%) |
| 45 to 54 Years | 0 (0.0%) | 288 (100.0%) |
| 55 to 64 Years | 33 (5.3%) | 550 (87.9%) |
| 65 to 74 Years | 567 (87.2%) | 412 (63.4%) |
| 75 Years and over | 267 (94.7%) | 184 (65.2%) |
| Total | 983 (25.2%) | 3,337 (85.4%) |
Disability Status by Sex by Age in Weston Lakes
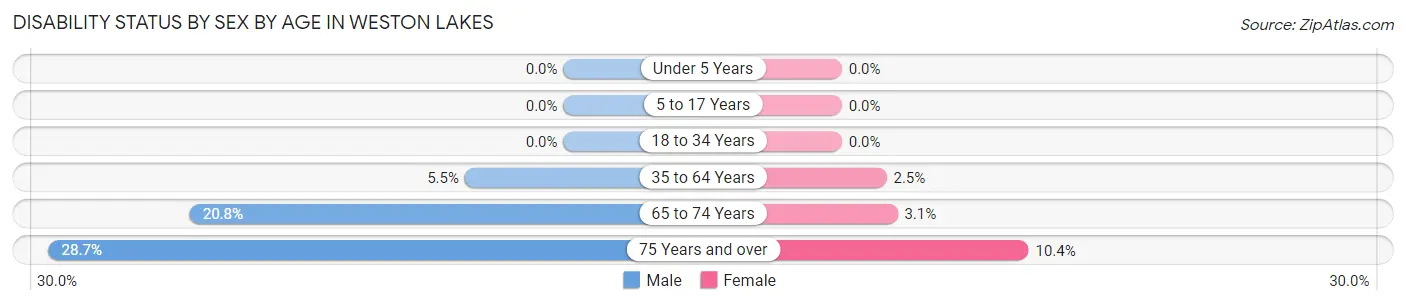
| Age Bracket | Male | Female |
| Under 5 Years | 0 (0.0%) | 0 (0.0%) |
| 5 to 17 Years | 0 (0.0%) | 0 (0.0%) |
| 18 to 34 Years | 0 (0.0%) | 0 (0.0%) |
| 35 to 64 Years | 40 (5.5%) | 17 (2.5%) |
| 65 to 74 Years | 68 (20.8%) | 10 (3.1%) |
| 75 Years and over | 45 (28.7%) | 13 (10.4%) |
Disability Class by Sex by Age in Weston Lakes
Disability Class: Hearing Difficulty
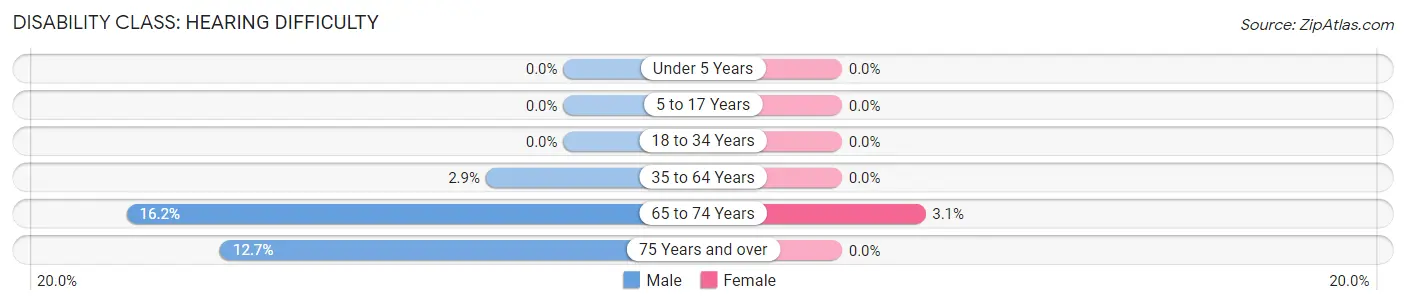
| Age Bracket | Male | Female |
| Under 5 Years | 0 (0.0%) | 0 (0.0%) |
| 5 to 17 Years | 0 (0.0%) | 0 (0.0%) |
| 18 to 34 Years | 0 (0.0%) | 0 (0.0%) |
| 35 to 64 Years | 21 (2.9%) | 0 (0.0%) |
| 65 to 74 Years | 53 (16.2%) | 10 (3.1%) |
| 75 Years and over | 20 (12.7%) | 0 (0.0%) |
Disability Class: Vision Difficulty
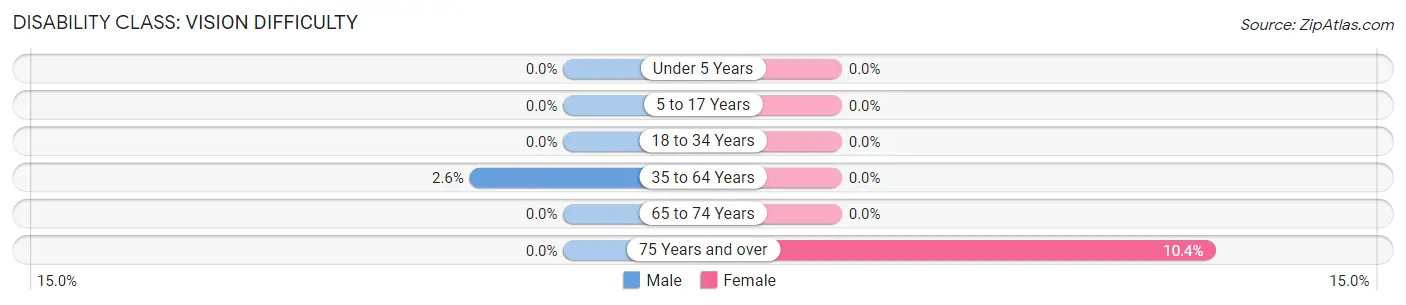
| Age Bracket | Male | Female |
| Under 5 Years | 0 (0.0%) | 0 (0.0%) |
| 5 to 17 Years | 0 (0.0%) | 0 (0.0%) |
| 18 to 34 Years | 0 (0.0%) | 0 (0.0%) |
| 35 to 64 Years | 19 (2.6%) | 0 (0.0%) |
| 65 to 74 Years | 0 (0.0%) | 0 (0.0%) |
| 75 Years and over | 0 (0.0%) | 13 (10.4%) |
Disability Class: Cognitive Difficulty
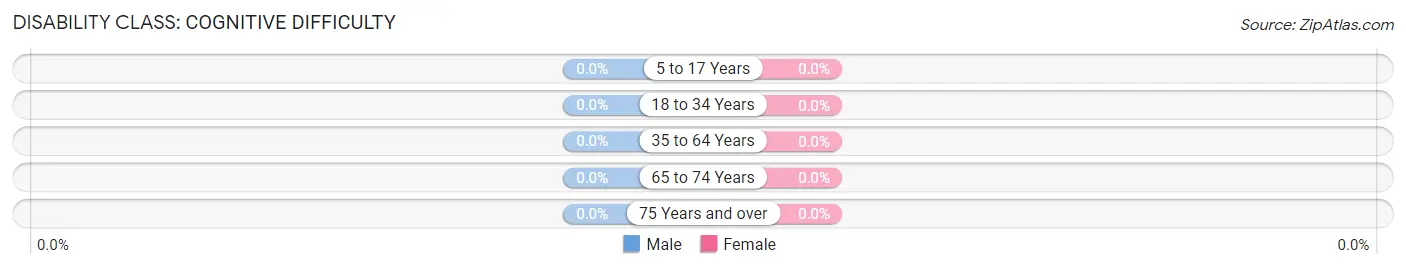
| Age Bracket | Male | Female |
| 5 to 17 Years | 0 (0.0%) | 0 (0.0%) |
| 18 to 34 Years | 0 (0.0%) | 0 (0.0%) |
| 35 to 64 Years | 0 (0.0%) | 0 (0.0%) |
| 65 to 74 Years | 0 (0.0%) | 0 (0.0%) |
| 75 Years and over | 0 (0.0%) | 0 (0.0%) |
Disability Class: Ambulatory Difficulty
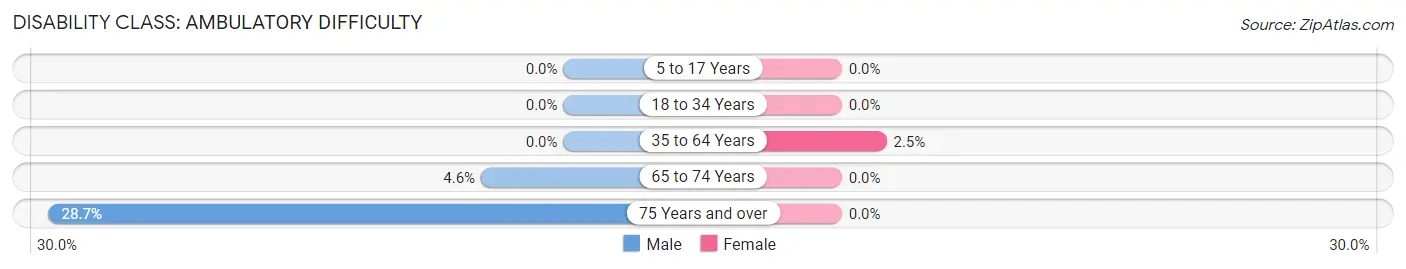
| Age Bracket | Male | Female |
| 5 to 17 Years | 0 (0.0%) | 0 (0.0%) |
| 18 to 34 Years | 0 (0.0%) | 0 (0.0%) |
| 35 to 64 Years | 0 (0.0%) | 17 (2.5%) |
| 65 to 74 Years | 15 (4.6%) | 0 (0.0%) |
| 75 Years and over | 45 (28.7%) | 0 (0.0%) |
Disability Class: Self-Care Difficulty
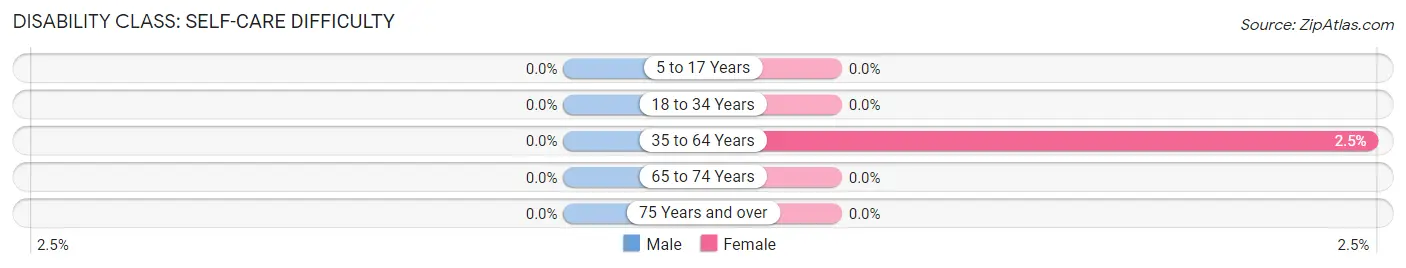
| Age Bracket | Male | Female |
| 5 to 17 Years | 0 (0.0%) | 0 (0.0%) |
| 18 to 34 Years | 0 (0.0%) | 0 (0.0%) |
| 35 to 64 Years | 0 (0.0%) | 17 (2.5%) |
| 65 to 74 Years | 0 (0.0%) | 0 (0.0%) |
| 75 Years and over | 0 (0.0%) | 0 (0.0%) |
Technology Access in Weston Lakes
Computing Device Access in Weston Lakes
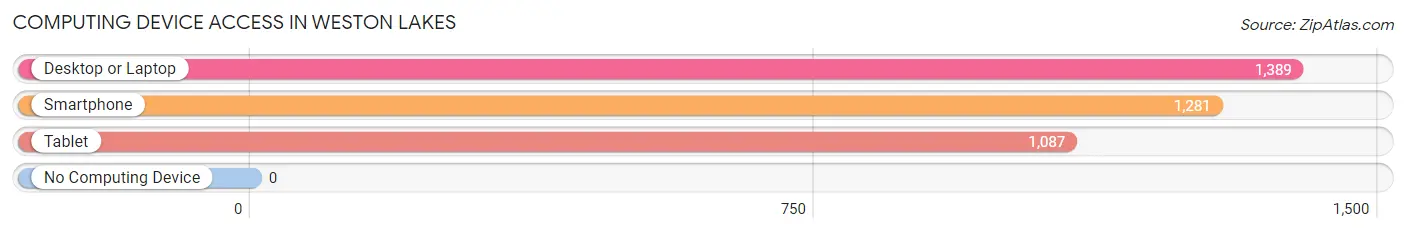
| Device Type | # Households | % Households |
| Desktop or Laptop | 1,389 | 98.6% |
| Smartphone | 1,281 | 90.9% |
| Tablet | 1,087 | 77.1% |
| No Computing Device | 0 | 0.0% |
| Total | 1,409 | 100.0% |
Internet Access in Weston Lakes
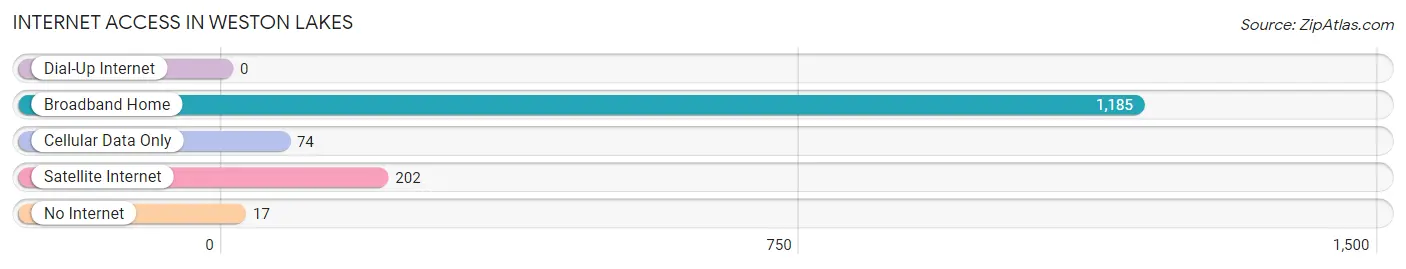
| Internet Type | # Households | % Households |
| Dial-Up Internet | 0 | 0.0% |
| Broadband Home | 1,185 | 84.1% |
| Cellular Data Only | 74 | 5.2% |
| Satellite Internet | 202 | 14.3% |
| No Internet | 17 | 1.2% |
| Total | 1,409 | 100.0% |
Weston Lakes Summary
Weston Lakes is a small unincorporated community located in the state of Texas, United States. It is situated in the western part of Fort Bend County, approximately 30 miles southwest of Houston. The community is located on the banks of the Brazos River and is surrounded by rolling hills and lush vegetation.
History
Weston Lakes was first settled in the late 1800s by a group of German immigrants. The settlers were attracted to the area due to its fertile soil and abundant wildlife. The community was originally known as “Weston” and was later changed to “Weston Lakes” when a nearby lake was discovered.
The first post office in Weston Lakes was established in 1891 and the community was officially incorporated in 1895. The town quickly grew and by the early 1900s, it had become a thriving agricultural center. The town was home to several cotton gins, a grist mill, and a sawmill.
In the 1920s, the town began to decline as the Great Depression hit the area. Many of the businesses closed and the population dwindled. However, the town was able to survive and by the 1950s, it had become a popular weekend getaway for Houstonians.
Geography
Weston Lakes is located in western Fort Bend County, approximately 30 miles southwest of Houston. The community is situated on the banks of the Brazos River and is surrounded by rolling hills and lush vegetation. The area is known for its mild climate and abundant wildlife.
The town is located at the intersection of State Highway 6 and FM 1463. It is also close to the cities of Richmond, Rosenberg, and Sugar Land.
Economy
Weston Lakes is a small, rural community with a population of just over 1,000 people. The town is primarily a bedroom community, with most of its residents commuting to nearby cities for work.
The town is home to several small businesses, including a grocery store, a gas station, and a few restaurants. The town also has a post office and a library.
Demographics
As of the 2010 census, the population of Weston Lakes was 1,072. The racial makeup of the town was 79.3% White, 11.2% African American, 0.3% Native American, 0.7% Asian, and 8.5% from other races. Hispanic or Latino of any race were 18.2% of the population.
The median household income in Weston Lakes was $50,000, and the median family income was $54,000. The per capita income was $20,000. About 11.2% of families and 13.2% of the population were below the poverty line.
Conclusion
Weston Lakes is a small, rural community located in western Fort Bend County, Texas. The town was first settled in the late 1800s by a group of German immigrants and has since become a popular weekend getaway for Houstonians. The town is home to several small businesses and is primarily a bedroom community, with most of its residents commuting to nearby cities for work. The population of Weston Lakes is just over 1,000 people and the town has a median household income of $50,000.
Common Questions
What is Per Capita Income in Weston Lakes?
Per Capita income in Weston Lakes is $71,628.
What is the Median Family Income in Weston Lakes?
Median Family Income in Weston Lakes is $129,696.
What is the Median Household income in Weston Lakes?
Median Household Income in Weston Lakes is $125,038.
What is Income or Wage Gap in Weston Lakes?
Income or Wage Gap in Weston Lakes is 60.3%.
Women in Weston Lakes earn 39.7 cents for every dollar earned by a man.
What is Inequality or Gini Index in Weston Lakes?
Inequality or Gini Index in Weston Lakes is 0.45.
What is the Total Population of Weston Lakes?
Total Population of Weston Lakes is 3,907.
What is the Total Male Population of Weston Lakes?
Total Male Population of Weston Lakes is 2,017.
What is the Total Female Population of Weston Lakes?
Total Female Population of Weston Lakes is 1,890.
What is the Ratio of Males per 100 Females in Weston Lakes?
There are 106.72 Males per 100 Females in Weston Lakes.
What is the Ratio of Females per 100 Males in Weston Lakes?
There are 93.70 Females per 100 Males in Weston Lakes.
What is the Median Population Age in Weston Lakes?
Median Population Age in Weston Lakes is 44.3 Years.
What is the Average Family Size in Weston Lakes
Average Family Size in Weston Lakes is 3.0 People.
What is the Average Household Size in Weston Lakes
Average Household Size in Weston Lakes is 2.8 People.
How Large is the Labor Force in Weston Lakes?
There are 1,493 People in the Labor Forcein in Weston Lakes.
What is the Percentage of People in the Labor Force in Weston Lakes?
49.8% of People are in the Labor Force in Weston Lakes.
What is the Unemployment Rate in Weston Lakes?
Unemployment Rate in Weston Lakes is 1.1%.