Willow Park, TX Map & Demographics
Willow Park Map
Willow Park Overview
$42,604
PER CAPITA INCOME
$115,145
AVG FAMILY INCOME
$104,931
AVG HOUSEHOLD INCOME
51.3%
WAGE / INCOME GAP [ % ]
48.7¢/ $1
WAGE / INCOME GAP [ $ ]
0.39
INEQUALITY / GINI INDEX
5,055
TOTAL POPULATION
2,137
MALE POPULATION
2,918
FEMALE POPULATION
73.24
MALES / 100 FEMALES
136.55
FEMALES / 100 MALES
40.9
MEDIAN AGE
3.3
AVG FAMILY SIZE
2.9
AVG HOUSEHOLD SIZE
2,434
LABOR FORCE [ PEOPLE ]
64.7%
PERCENT IN LABOR FORCE
3.4%
UNEMPLOYMENT RATE
Income in Willow Park
Income Overview in Willow Park
Per Capita Income in Willow Park is $42,604, while median incomes of families and households are $115,145 and $104,931 respectively.
| Characteristic | Number | Measure |
| Per Capita Income | 5,055 | $42,604 |
| Median Family Income | 1,415 | $115,145 |
| Mean Family Income | 1,415 | $121,757 |
| Median Household Income | 1,714 | $104,931 |
| Mean Household Income | 1,714 | $118,237 |
| Income Deficit | 1,415 | $0 |
| Wage / Income Gap (%) | 5,055 | 51.29% |
| Wage / Income Gap ($) | 5,055 | 48.71¢ per $1 |
| Gini / Inequality Index | 5,055 | 0.39 |
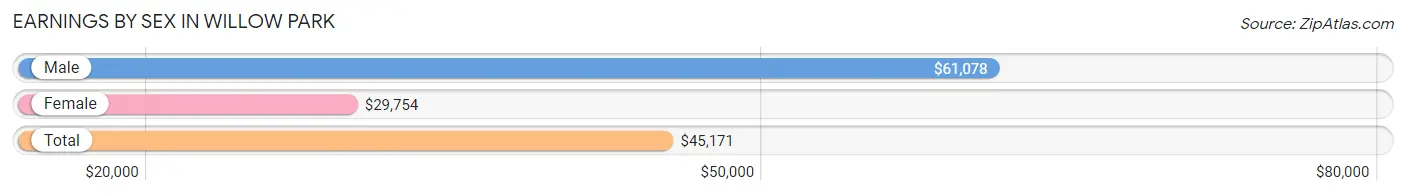
Earnings by Sex in Willow Park
Average Earnings in Willow Park are $45,171, $61,078 for men and $29,754 for women, a difference of 51.3%.
| Sex | Number | Average Earnings |
| Male | 1,213 (45.4%) | $61,078 |
| Female | 1,459 (54.6%) | $29,754 |
| Total | 2,672 (100.0%) | $45,171 |
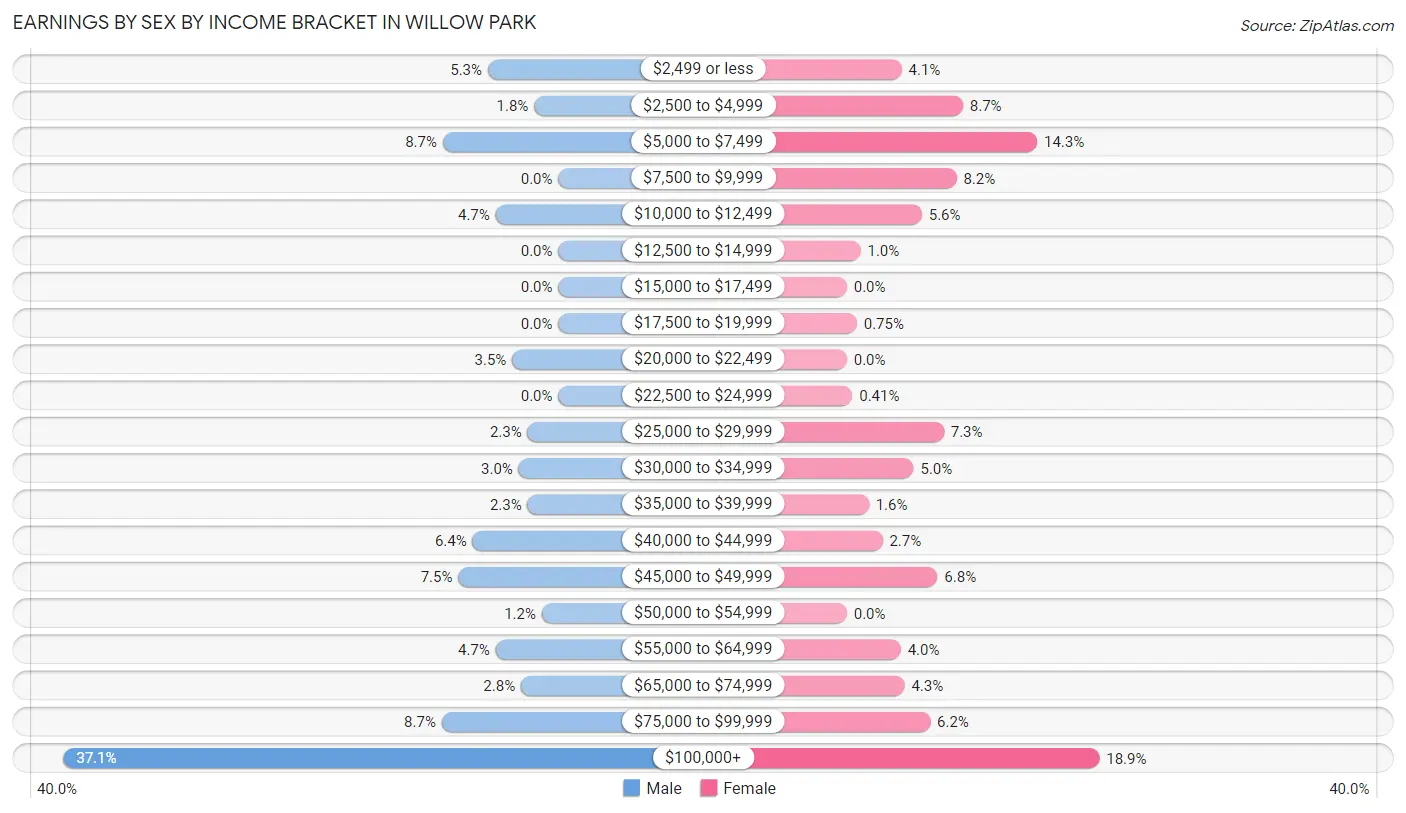
Earnings by Sex by Income Bracket in Willow Park
The most common earnings brackets in Willow Park are $100,000+ for men (450 | 37.1%) and $100,000+ for women (276 | 18.9%).
| Income | Male | Female |
| $2,499 or less | 64 (5.3%) | 60 (4.1%) |
| $2,500 to $4,999 | 22 (1.8%) | 127 (8.7%) |
| $5,000 to $7,499 | 105 (8.7%) | 208 (14.3%) |
| $7,500 to $9,999 | 0 (0.0%) | 120 (8.2%) |
| $10,000 to $12,499 | 57 (4.7%) | 82 (5.6%) |
| $12,500 to $14,999 | 0 (0.0%) | 15 (1.0%) |
| $15,000 to $17,499 | 0 (0.0%) | 0 (0.0%) |
| $17,500 to $19,999 | 0 (0.0%) | 11 (0.7%) |
| $20,000 to $22,499 | 42 (3.5%) | 0 (0.0%) |
| $22,500 to $24,999 | 0 (0.0%) | 6 (0.4%) |
| $25,000 to $29,999 | 28 (2.3%) | 106 (7.3%) |
| $30,000 to $34,999 | 36 (3.0%) | 73 (5.0%) |
| $35,000 to $39,999 | 28 (2.3%) | 24 (1.6%) |
| $40,000 to $44,999 | 78 (6.4%) | 39 (2.7%) |
| $45,000 to $49,999 | 91 (7.5%) | 99 (6.8%) |
| $50,000 to $54,999 | 15 (1.2%) | 0 (0.0%) |
| $55,000 to $64,999 | 57 (4.7%) | 59 (4.0%) |
| $65,000 to $74,999 | 34 (2.8%) | 63 (4.3%) |
| $75,000 to $99,999 | 106 (8.7%) | 91 (6.2%) |
| $100,000+ | 450 (37.1%) | 276 (18.9%) |
| Total | 1,213 (100.0%) | 1,459 (100.0%) |
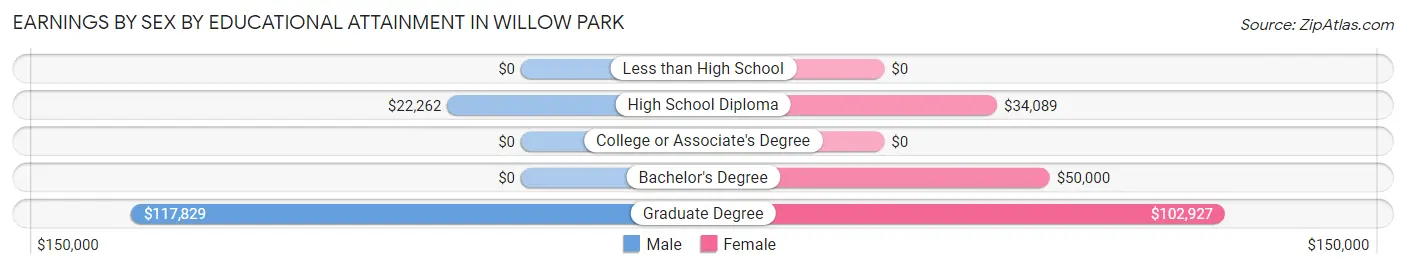
Earnings by Sex by Educational Attainment in Willow Park
Average earnings in Willow Park are $61,681 for men and $37,240 for women, a difference of 39.6%. Men with an educational attainment of graduate degree enjoy the highest average annual earnings of $117,829, while those with high school diploma education earn the least with $22,262. Women with an educational attainment of graduate degree earn the most with the average annual earnings of $102,927, while those with high school diploma education have the smallest earnings of $34,089.
| Educational Attainment | Male Income | Female Income |
| Less than High School | - | - |
| High School Diploma | $22,262 | $34,089 |
| College or Associate's Degree | - | - |
| Bachelor's Degree | - | - |
| Graduate Degree | $117,829 | $102,927 |
| Total | $61,681 | $37,240 |
Family Income in Willow Park
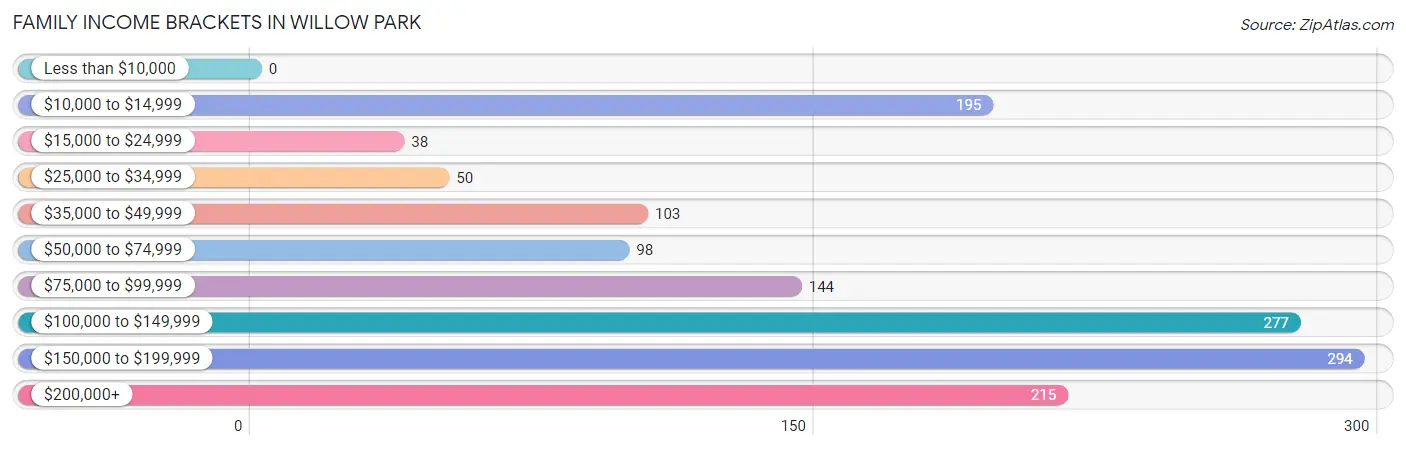
Family Income Brackets in Willow Park
According to the Willow Park family income data, there are 294 families falling into the $150,000 to $199,999 income range, which is the most common income bracket and makes up 20.8% of all families.
| Income Bracket | # Families | % Families |
| Less than $10,000 | 0 | 0.0% |
| $10,000 to $14,999 | 195 | 13.8% |
| $15,000 to $24,999 | 38 | 2.7% |
| $25,000 to $34,999 | 50 | 3.5% |
| $35,000 to $49,999 | 103 | 7.3% |
| $50,000 to $74,999 | 98 | 6.9% |
| $75,000 to $99,999 | 144 | 10.2% |
| $100,000 to $149,999 | 277 | 19.6% |
| $150,000 to $199,999 | 294 | 20.8% |
| $200,000+ | 215 | 15.2% |
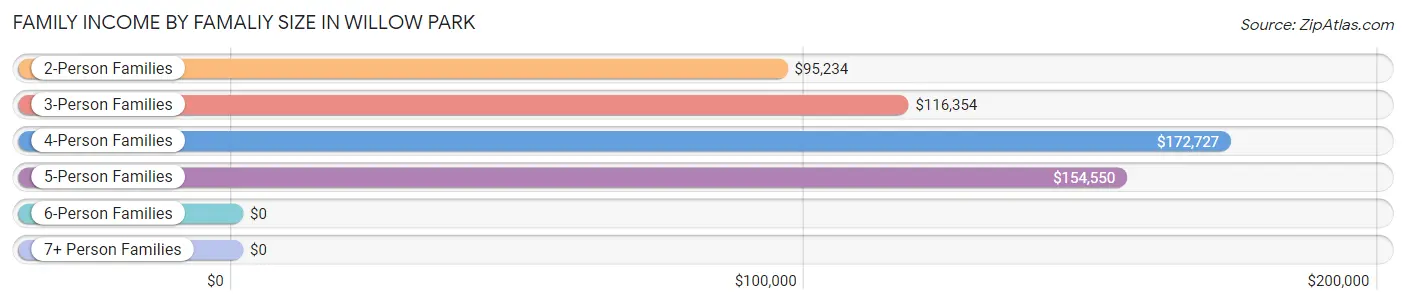
Family Income by Famaliy Size in Willow Park
4-person families (116 | 8.2%) account for the highest median family income in Willow Park with $172,727 per family, while 2-person families (595 | 42.0%) have the highest median income of $47,617 per family member.
| Income Bracket | # Families | Median Income |
| 2-Person Families | 595 (42.0%) | $95,234 |
| 3-Person Families | 525 (37.1%) | $116,354 |
| 4-Person Families | 116 (8.2%) | $172,727 |
| 5-Person Families | 97 (6.9%) | $154,550 |
| 6-Person Families | 60 (4.2%) | $0 |
| 7+ Person Families | 22 (1.5%) | $0 |
| Total | 1,415 (100.0%) | $115,145 |
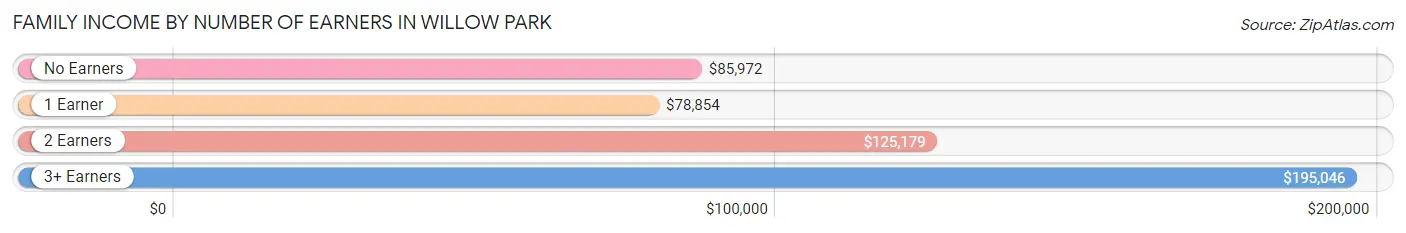
Family Income by Number of Earners in Willow Park
The median family income in Willow Park is $115,145, with families comprising 3+ earners (191) having the highest median family income of $195,046, while families with 1 earner (298) have the lowest median family income of $78,854, accounting for 13.5% and 21.1% of families, respectively.
| Number of Earners | # Families | Median Income |
| No Earners | 188 (13.3%) | $85,972 |
| 1 Earner | 298 (21.1%) | $78,854 |
| 2 Earners | 738 (52.2%) | $125,179 |
| 3+ Earners | 191 (13.5%) | $195,046 |
| Total | 1,415 (100.0%) | $115,145 |
Household Income in Willow Park
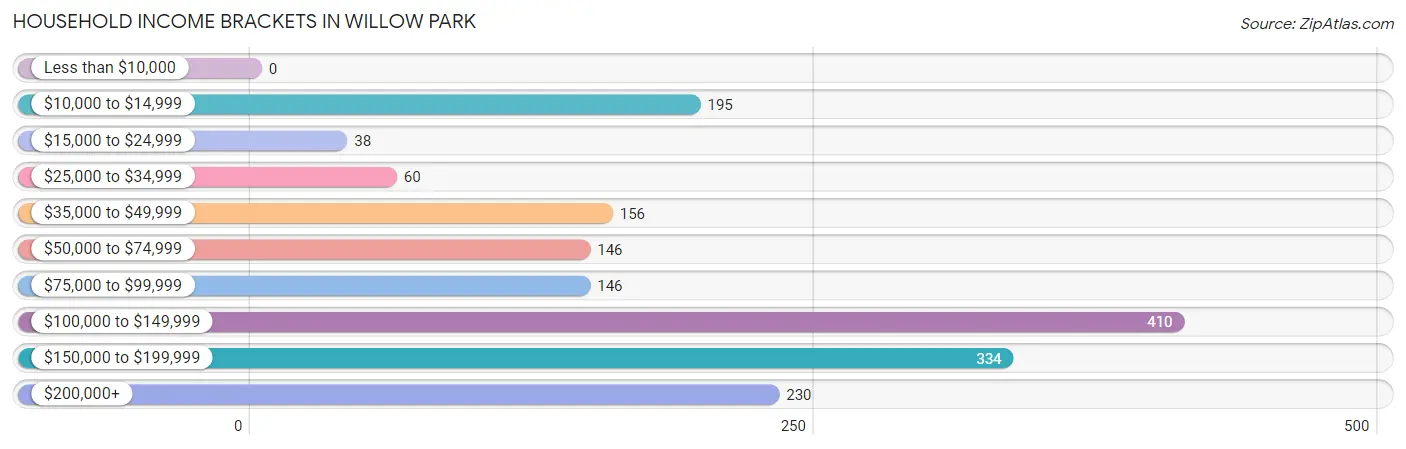
Household Income Brackets in Willow Park
With 410 households falling in the category, the $100,000 to $149,999 income range is the most frequent in Willow Park, accounting for 23.9% of all households.
| Income Bracket | # Households | % Households |
| Less than $10,000 | 0 | 0.0% |
| $10,000 to $14,999 | 195 | 11.4% |
| $15,000 to $24,999 | 38 | 2.2% |
| $25,000 to $34,999 | 60 | 3.5% |
| $35,000 to $49,999 | 156 | 9.1% |
| $50,000 to $74,999 | 146 | 8.5% |
| $75,000 to $99,999 | 146 | 8.5% |
| $100,000 to $149,999 | 410 | 23.9% |
| $150,000 to $199,999 | 334 | 19.5% |
| $200,000+ | 230 | 13.4% |
Household Income by Householder Age in Willow Park
The median household income in Willow Park is $104,931, with the highest median household income of $134,712 found in the 25 to 44 years age bracket for the primary householder. A total of 459 households (26.8%) fall into this category. Meanwhile, the 15 to 24 years age bracket for the primary householder has the lowest median household income of $0, with 57 households (3.3%) in this group.
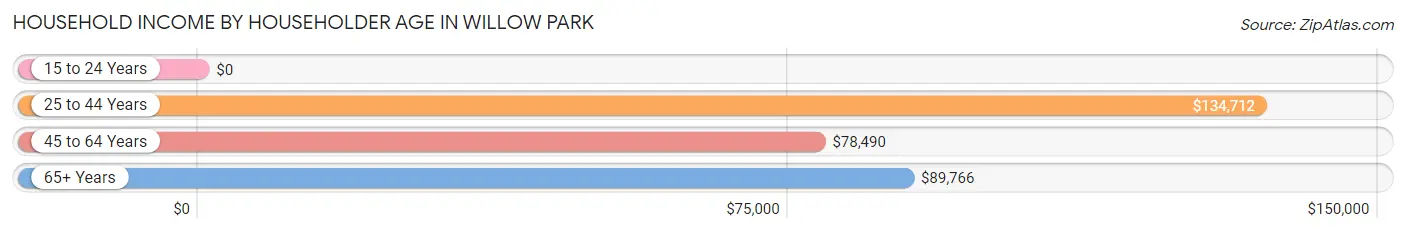
| Income Bracket | # Households | Median Income |
| 15 to 24 Years | 57 (3.3%) | $0 |
| 25 to 44 Years | 459 (26.8%) | $134,712 |
| 45 to 64 Years | 761 (44.4%) | $78,490 |
| 65+ Years | 437 (25.5%) | $89,766 |
| Total | 1,714 (100.0%) | $104,931 |
Poverty in Willow Park
Income Below Poverty by Sex and Age in Willow Park
With 5.3% poverty level for males and 13.3% for females among the residents of Willow Park, 45 to 54 year old males and 6 to 11 year old females are the most vulnerable to poverty, with 113 males (31.0%) and 160 females (40.7%) in their respective age groups living below the poverty level.
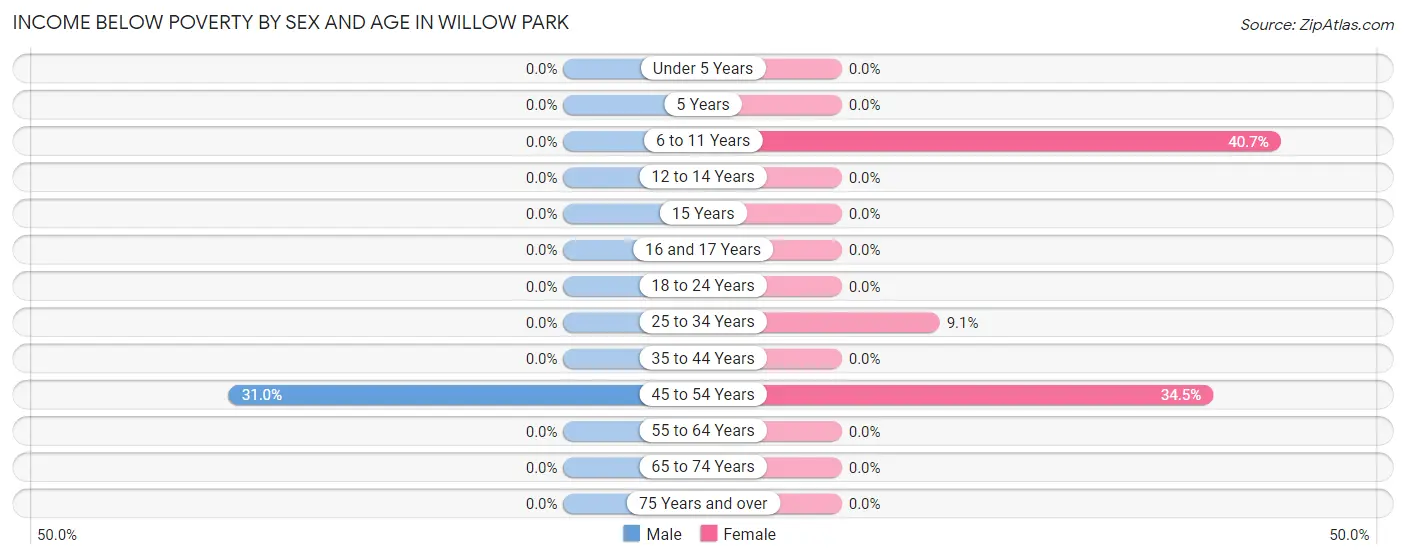
| Age Bracket | Male | Female |
| Under 5 Years | 0 (0.0%) | 0 (0.0%) |
| 5 Years | 0 (0.0%) | 0 (0.0%) |
| 6 to 11 Years | 0 (0.0%) | 160 (40.7%) |
| 12 to 14 Years | 0 (0.0%) | 0 (0.0%) |
| 15 Years | 0 (0.0%) | 0 (0.0%) |
| 16 and 17 Years | 0 (0.0%) | 0 (0.0%) |
| 18 to 24 Years | 0 (0.0%) | 0 (0.0%) |
| 25 to 34 Years | 0 (0.0%) | 25 (9.1%) |
| 35 to 44 Years | 0 (0.0%) | 0 (0.0%) |
| 45 to 54 Years | 113 (31.0%) | 195 (34.4%) |
| 55 to 64 Years | 0 (0.0%) | 0 (0.0%) |
| 65 to 74 Years | 0 (0.0%) | 0 (0.0%) |
| 75 Years and over | 0 (0.0%) | 0 (0.0%) |
| Total | 113 (5.3%) | 380 (13.3%) |
Income Above Poverty by Sex and Age in Willow Park
According to the poverty statistics in Willow Park, males aged under 5 years and females aged under 5 years are the age groups that are most secure financially, with 100.0% of males and 100.0% of females in these age groups living above the poverty line.
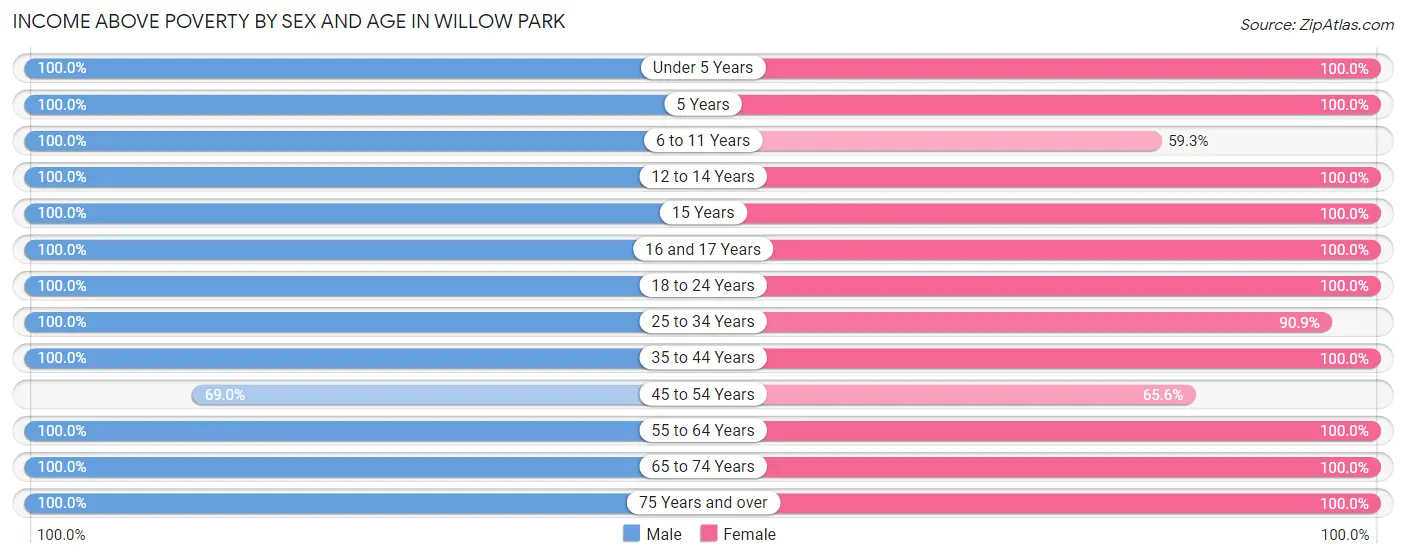
| Age Bracket | Male | Female |
| Under 5 Years | 84 (100.0%) | 153 (100.0%) |
| 5 Years | 9 (100.0%) | 26 (100.0%) |
| 6 to 11 Years | 294 (100.0%) | 233 (59.3%) |
| 12 to 14 Years | 93 (100.0%) | 91 (100.0%) |
| 15 Years | 36 (100.0%) | 34 (100.0%) |
| 16 and 17 Years | 35 (100.0%) | 55 (100.0%) |
| 18 to 24 Years | 123 (100.0%) | 182 (100.0%) |
| 25 to 34 Years | 125 (100.0%) | 250 (90.9%) |
| 35 to 44 Years | 307 (100.0%) | 363 (100.0%) |
| 45 to 54 Years | 251 (69.0%) | 371 (65.5%) |
| 55 to 64 Years | 306 (100.0%) | 239 (100.0%) |
| 65 to 74 Years | 194 (100.0%) | 272 (100.0%) |
| 75 Years and over | 149 (100.0%) | 207 (100.0%) |
| Total | 2,006 (94.7%) | 2,476 (86.7%) |
Income Below Poverty Among Married-Couple Families in Willow Park
The poverty statistics for married-couple families in Willow Park show that 15.7% or 195 of the total 1,244 families live below the poverty line. Families with 1 or 2 children have the highest poverty rate of 44.9%, comprising of 195 families. On the other hand, families with no children have the lowest poverty rate of 0.0%, which includes 0 families.
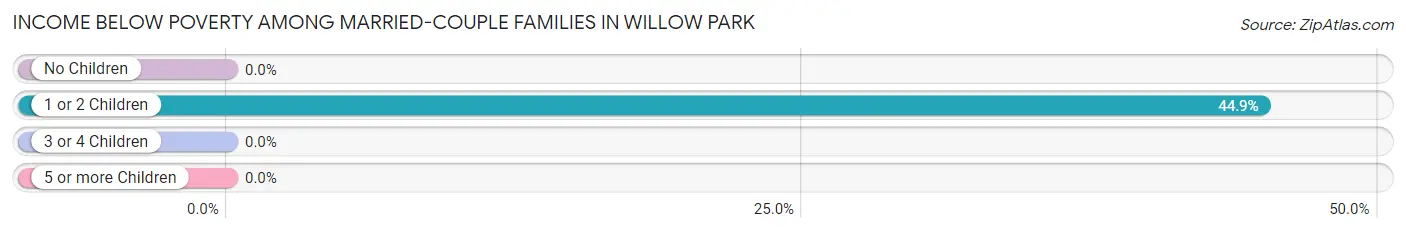
| Children | Above Poverty | Below Poverty |
| No Children | 661 (100.0%) | 0 (0.0%) |
| 1 or 2 Children | 239 (55.1%) | 195 (44.9%) |
| 3 or 4 Children | 149 (100.0%) | 0 (0.0%) |
| 5 or more Children | 0 (0.0%) | 0 (0.0%) |
| Total | 1,049 (84.3%) | 195 (15.7%) |
Income Below Poverty Among Single-Parent Households in Willow Park
| Children | Single Father | Single Mother |
| No Children | 0 (0.0%) | 0 (0.0%) |
| 1 or 2 Children | 0 (0.0%) | 0 (0.0%) |
| 3 or 4 Children | 0 (0.0%) | 0 (0.0%) |
| 5 or more Children | 0 (0.0%) | 0 (0.0%) |
| Total | 0 (0.0%) | 0 (0.0%) |
Income Below Poverty Among Married-Couple vs Single-Parent Households in Willow Park
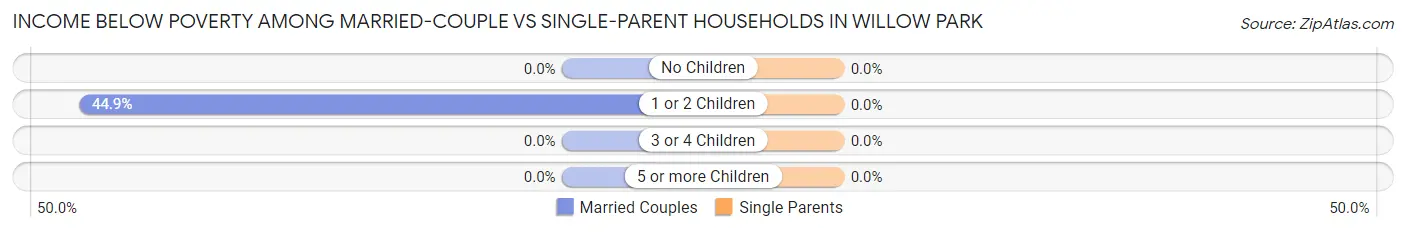
| Children | Married-Couple Families | Single-Parent Households |
| No Children | 0 (0.0%) | 0 (0.0%) |
| 1 or 2 Children | 195 (44.9%) | 0 (0.0%) |
| 3 or 4 Children | 0 (0.0%) | 0 (0.0%) |
| 5 or more Children | 0 (0.0%) | 0 (0.0%) |
| Total | 195 (15.7%) | 0 (0.0%) |
Race in Willow Park
The most populous races in Willow Park are White / Caucasian (4,756 | 94.1%), Hispanic or Latino (318 | 6.3%), and Two or more Races (137 | 2.7%).
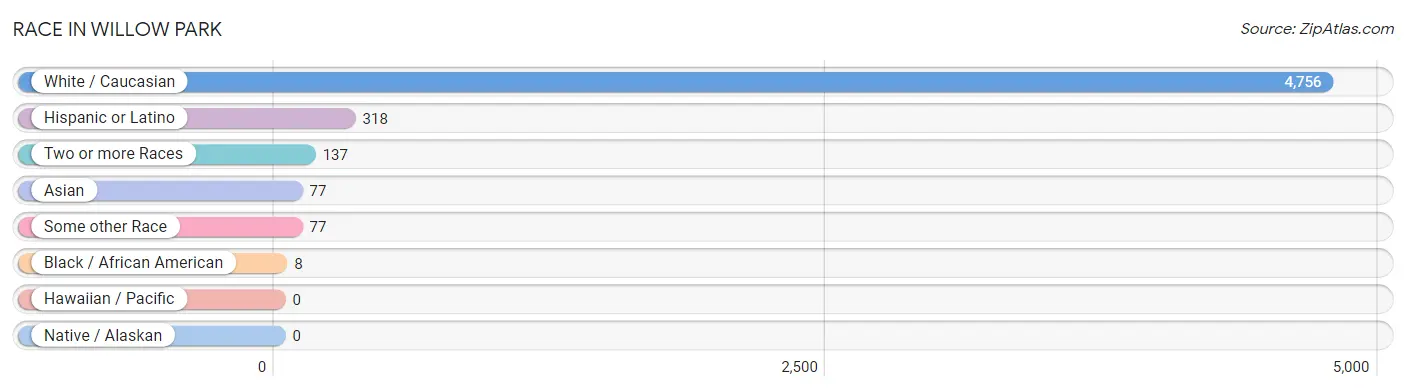
| Race | # Population | % Population |
| Asian | 77 | 1.5% |
| Black / African American | 8 | 0.2% |
| Hawaiian / Pacific | 0 | 0.0% |
| Hispanic or Latino | 318 | 6.3% |
| Native / Alaskan | 0 | 0.0% |
| White / Caucasian | 4,756 | 94.1% |
| Two or more Races | 137 | 2.7% |
| Some other Race | 77 | 1.5% |
| Total | 5,055 | 100.0% |
Ancestry in Willow Park
The most populous ancestries reported in Willow Park are English (547 | 10.8%), German (494 | 9.8%), Irish (485 | 9.6%), American (477 | 9.4%), and French (262 | 5.2%), together accounting for 44.8% of all Willow Park residents.
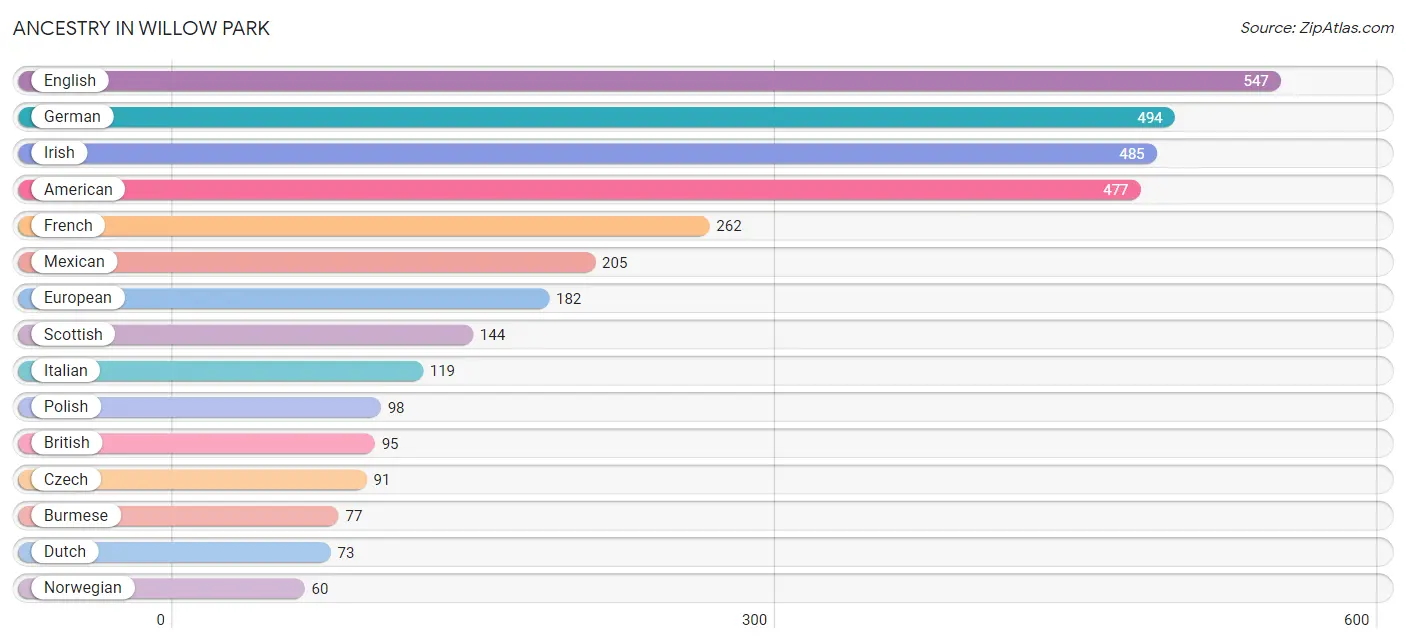
| Ancestry | # Population | % Population |
| American | 477 | 9.4% |
| Arab | 41 | 0.8% |
| Belgian | 11 | 0.2% |
| British | 95 | 1.9% |
| Burmese | 77 | 1.5% |
| Central American | 44 | 0.9% |
| Choctaw | 15 | 0.3% |
| Croatian | 15 | 0.3% |
| Czech | 91 | 1.8% |
| Dutch | 73 | 1.4% |
| Eastern European | 50 | 1.0% |
| English | 547 | 10.8% |
| European | 182 | 3.6% |
| Finnish | 9 | 0.2% |
| French | 262 | 5.2% |
| German | 494 | 9.8% |
| Guatemalan | 44 | 0.9% |
| Hungarian | 42 | 0.8% |
| Indian (Asian) | 5 | 0.1% |
| Irish | 485 | 9.6% |
| Italian | 119 | 2.4% |
| Lebanese | 13 | 0.3% |
| Mexican | 205 | 4.1% |
| Norwegian | 60 | 1.2% |
| Polish | 98 | 1.9% |
| Puerto Rican | 19 | 0.4% |
| Russian | 45 | 0.9% |
| Scottish | 144 | 2.9% |
| Spaniard | 50 | 1.0% |
| Swedish | 11 | 0.2% |
| Syrian | 28 | 0.5% |
| Welsh | 7 | 0.1% | View All 32 Rows |
Immigrants in Willow Park
The most numerous immigrant groups reported in Willow Park came from Europe (109 | 2.2%), England (94 | 1.9%), Northern Europe (94 | 1.9%), Asia (77 | 1.5%), and Eastern Asia (77 | 1.5%), together accounting for 8.9% of all Willow Park residents.
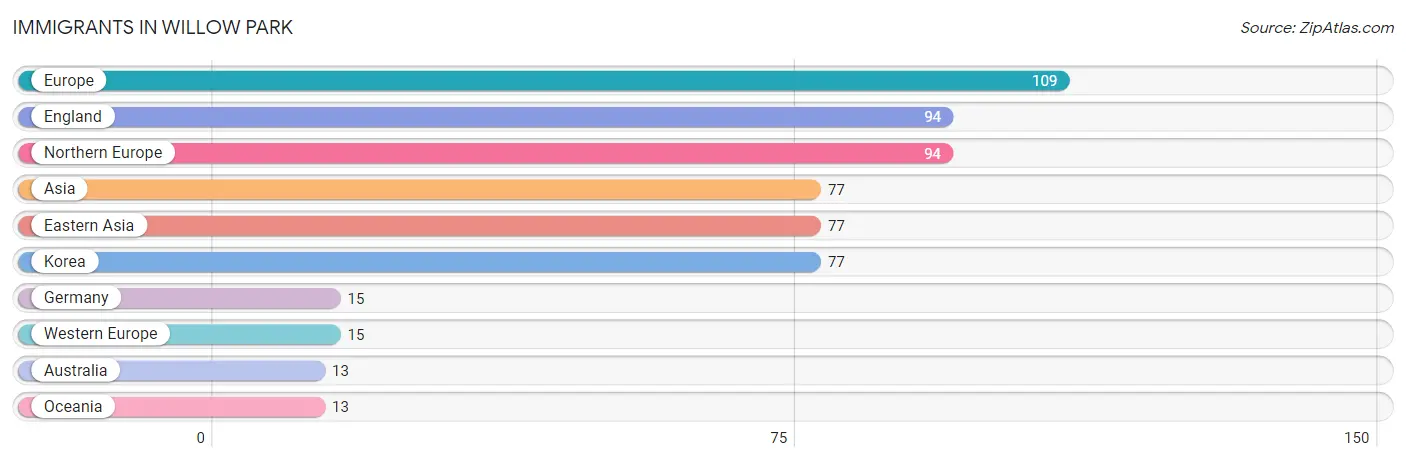
| Immigration Origin | # Population | % Population |
| Asia | 77 | 1.5% |
| Australia | 13 | 0.3% |
| Eastern Asia | 77 | 1.5% |
| England | 94 | 1.9% |
| Europe | 109 | 2.2% |
| Germany | 15 | 0.3% |
| Korea | 77 | 1.5% |
| Northern Europe | 94 | 1.9% |
| Oceania | 13 | 0.3% |
| Western Europe | 15 | 0.3% | View All 10 Rows |
Sex and Age in Willow Park
Sex and Age in Willow Park
The most populous age groups in Willow Park are 5 to 9 Years (213 | 10.0%) for men and 10 to 14 Years (369 | 12.7%) for women.
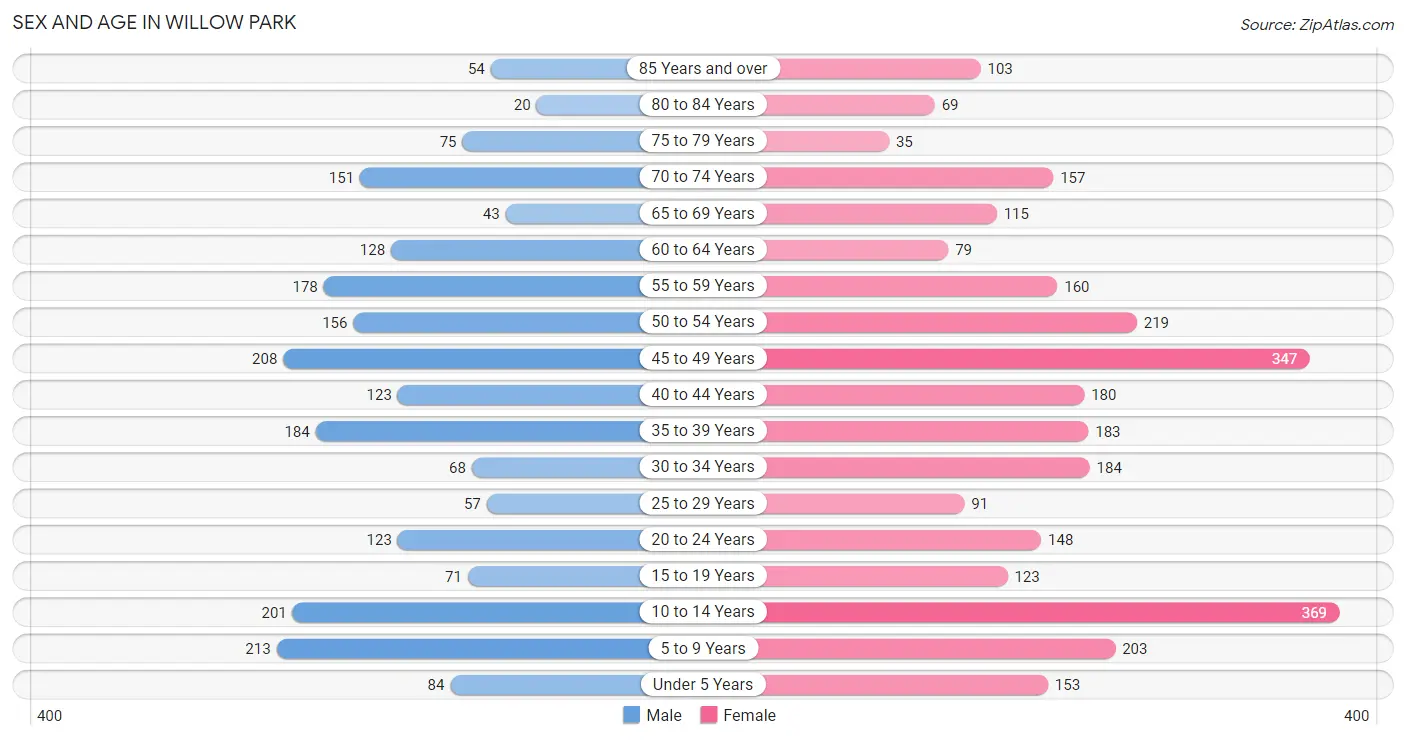
| Age Bracket | Male | Female |
| Under 5 Years | 84 (3.9%) | 153 (5.2%) |
| 5 to 9 Years | 213 (10.0%) | 203 (7.0%) |
| 10 to 14 Years | 201 (9.4%) | 369 (12.7%) |
| 15 to 19 Years | 71 (3.3%) | 123 (4.2%) |
| 20 to 24 Years | 123 (5.8%) | 148 (5.1%) |
| 25 to 29 Years | 57 (2.7%) | 91 (3.1%) |
| 30 to 34 Years | 68 (3.2%) | 184 (6.3%) |
| 35 to 39 Years | 184 (8.6%) | 183 (6.3%) |
| 40 to 44 Years | 123 (5.8%) | 180 (6.2%) |
| 45 to 49 Years | 208 (9.7%) | 347 (11.9%) |
| 50 to 54 Years | 156 (7.3%) | 219 (7.5%) |
| 55 to 59 Years | 178 (8.3%) | 160 (5.5%) |
| 60 to 64 Years | 128 (6.0%) | 79 (2.7%) |
| 65 to 69 Years | 43 (2.0%) | 115 (3.9%) |
| 70 to 74 Years | 151 (7.1%) | 157 (5.4%) |
| 75 to 79 Years | 75 (3.5%) | 35 (1.2%) |
| 80 to 84 Years | 20 (0.9%) | 69 (2.4%) |
| 85 Years and over | 54 (2.5%) | 103 (3.5%) |
| Total | 2,137 (100.0%) | 2,918 (100.0%) |
Families and Households in Willow Park
Median Family Size in Willow Park
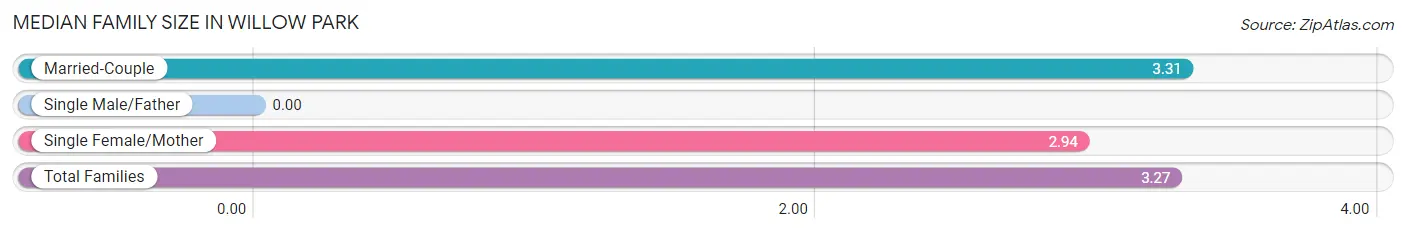
| Family Type | # Families | Family Size |
| Married-Couple | 1,244 (87.9%) | 3.31 |
| Single Male/Father | 0 (0.0%) | - |
| Single Female/Mother | 171 (12.1%) | 2.94 |
| Total Families | 1,415 (100.0%) | 3.27 |
Median Household Size in Willow Park
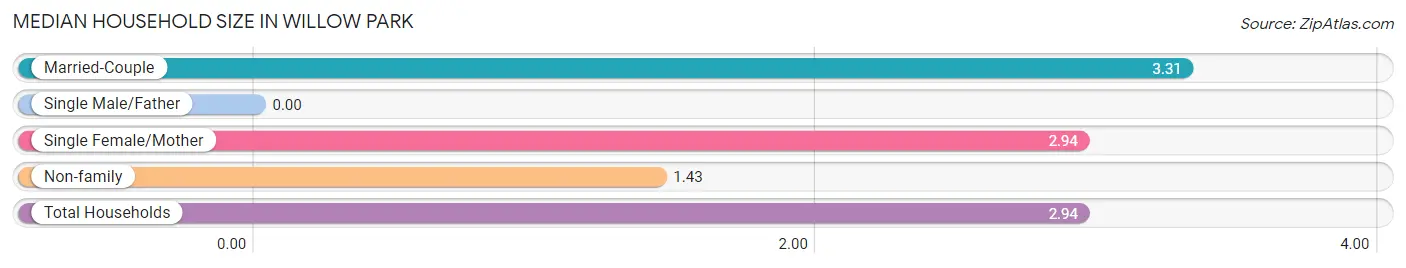
| Household Type | # Households | Household Size |
| Married-Couple | 1,244 (72.6%) | 3.31 |
| Single Male/Father | 0 (0.0%) | - |
| Single Female/Mother | 171 (10.0%) | 2.94 |
| Non-family | 299 (17.4%) | 1.43 |
| Total Households | 1,714 (100.0%) | 2.94 |
Household Size by Marriage Status in Willow Park
Out of a total of 1,714 households in Willow Park, 1,415 (82.6%) are family households, while 299 (17.4%) are nonfamily households. The most numerous type of family households are 2-person households, comprising 595, and the most common type of nonfamily households are 1-person households, comprising 264.
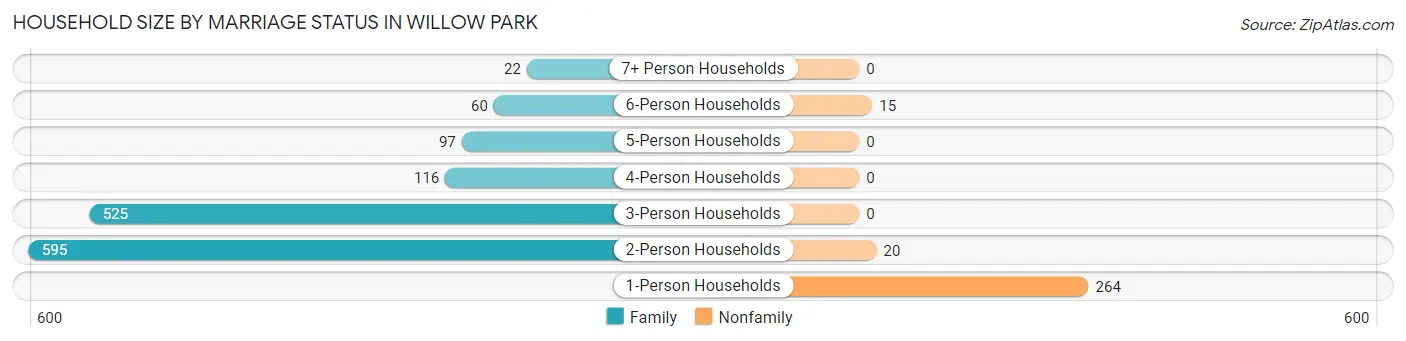
| Household Size | Family Households | Nonfamily Households |
| 1-Person Households | - | 264 (15.4%) |
| 2-Person Households | 595 (34.7%) | 20 (1.2%) |
| 3-Person Households | 525 (30.6%) | 0 (0.0%) |
| 4-Person Households | 116 (6.8%) | 0 (0.0%) |
| 5-Person Households | 97 (5.7%) | 0 (0.0%) |
| 6-Person Households | 60 (3.5%) | 15 (0.9%) |
| 7+ Person Households | 22 (1.3%) | 0 (0.0%) |
| Total | 1,415 (82.6%) | 299 (17.4%) |
Female Fertility in Willow Park
Fertility by Age in Willow Park
Average fertility rate in Willow Park is 74.0 births per 1,000 women. Women in the age bracket of 20 to 34 years have the highest fertility rate with 125.0 births per 1,000 women. Women in the age bracket of 20 to 34 years acount for 53.0% of all women with births.
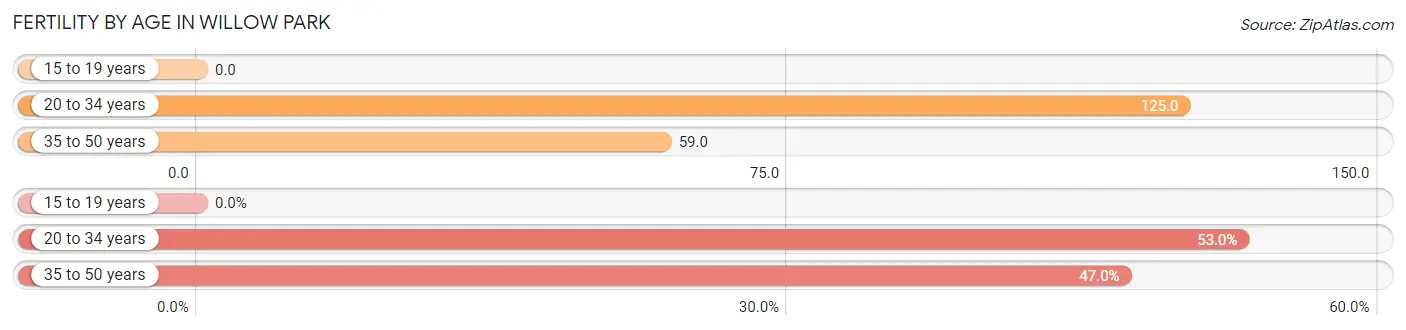
| Age Bracket | Women with Births | Births / 1,000 Women |
| 15 to 19 years | 0 (0.0%) | 0.0 |
| 20 to 34 years | 53 (53.0%) | 125.0 |
| 35 to 50 years | 47 (47.0%) | 59.0 |
| Total | 100 (100.0%) | 74.0 |
Fertility by Age by Marriage Status in Willow Park
14.0% of women with births (100) in Willow Park are married. The highest percentage of unmarried women with births falls into 35 to 50 years age bracket with 100.0% of them unmarried at the time of birth, while the lowest percentage of unmarried women with births belong to 20 to 34 years age bracket with 73.6% of them unmarried.
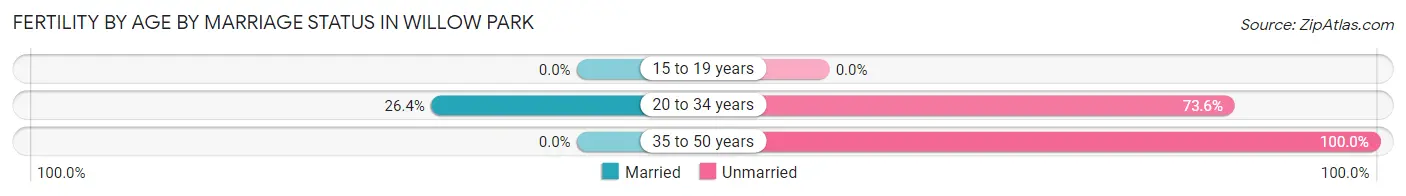
| Age Bracket | Married | Unmarried |
| 15 to 19 years | 0 (0.0%) | 0 (0.0%) |
| 20 to 34 years | 14 (26.4%) | 39 (73.6%) |
| 35 to 50 years | 0 (0.0%) | 47 (100.0%) |
| Total | 14 (14.0%) | 86 (86.0%) |
Fertility by Education in Willow Park
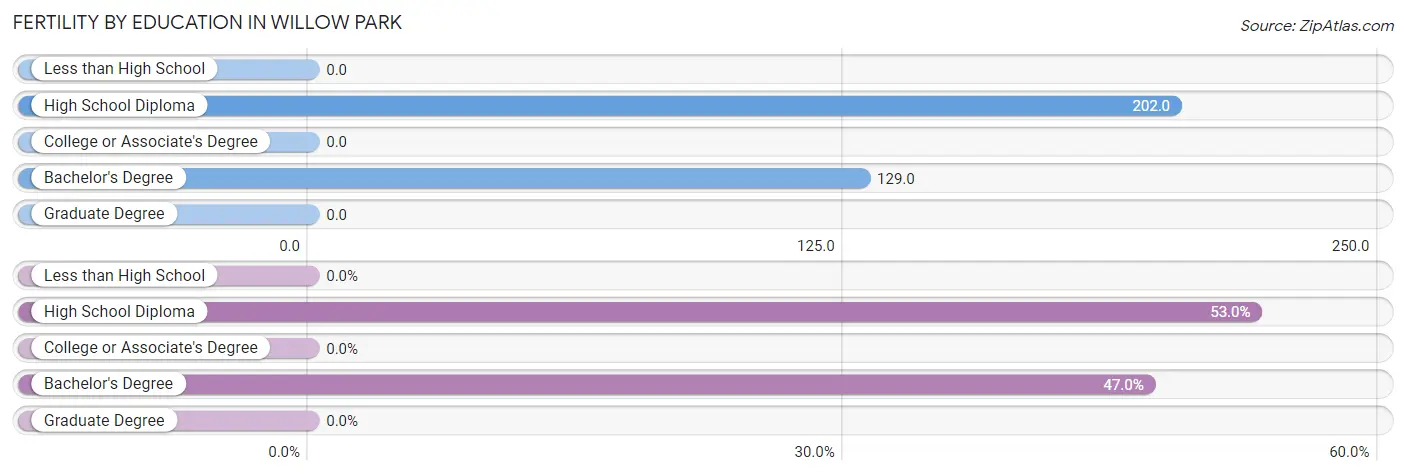
| Educational Attainment | Women with Births | Births / 1,000 Women |
| Less than High School | 0 (0.0%) | 0.0 |
| High School Diploma | 53 (53.0%) | 202.0 |
| College or Associate's Degree | 0 (0.0%) | 0.0 |
| Bachelor's Degree | 47 (47.0%) | 129.0 |
| Graduate Degree | 0 (0.0%) | 0.0 |
| Total | 100 (100.0%) | 74.0 |
Fertility by Education by Marriage Status in Willow Park
86.0% of women with births in Willow Park are unmarried. Women with the educational attainment of high school diploma are most likely to be married with 26.4% of them married at childbirth, while women with the educational attainment of bachelor's degree are least likely to be married with 100.0% of them unmarried at childbirth.
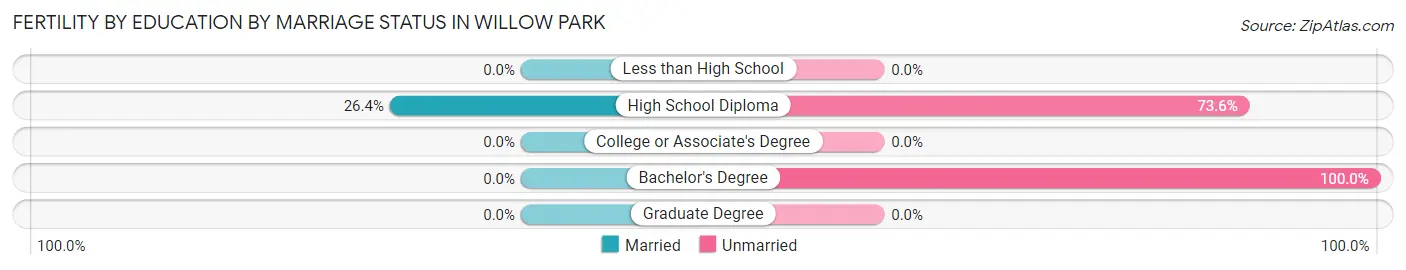
| Educational Attainment | Married | Unmarried |
| Less than High School | 0 (0.0%) | 0 (0.0%) |
| High School Diploma | 14 (26.4%) | 39 (73.6%) |
| College or Associate's Degree | 0 (0.0%) | 0 (0.0%) |
| Bachelor's Degree | 0 (0.0%) | 47 (100.0%) |
| Graduate Degree | 0 (0.0%) | 0 (0.0%) |
| Total | 14 (14.0%) | 86 (86.0%) |
Employment Characteristics in Willow Park
Employment by Class of Employer in Willow Park
Among the 2,342 employed individuals in Willow Park, private company employees (1,634 | 69.8%), not-for-profit organizations (245 | 10.5%), and self-employed (not incorporated) (157 | 6.7%) make up the most common classes of employment.
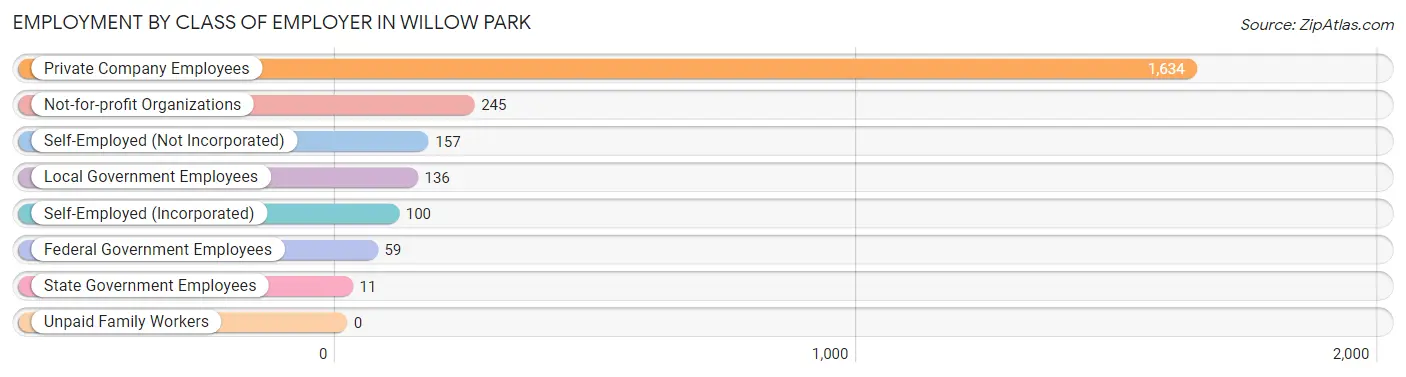
| Employer Class | # Employees | % Employees |
| Private Company Employees | 1,634 | 69.8% |
| Self-Employed (Incorporated) | 100 | 4.3% |
| Self-Employed (Not Incorporated) | 157 | 6.7% |
| Not-for-profit Organizations | 245 | 10.5% |
| Local Government Employees | 136 | 5.8% |
| State Government Employees | 11 | 0.5% |
| Federal Government Employees | 59 | 2.5% |
| Unpaid Family Workers | 0 | 0.0% |
| Total | 2,342 | 100.0% |
Employment Status by Age in Willow Park
According to the labor force statistics for Willow Park, out of the total population over 16 years of age (3,762), 64.7% or 2,434 individuals are in the labor force, with 3.4% or 83 of them unemployed. The age group with the highest labor force participation rate is 20 to 24 years, with 88.9% or 241 individuals in the labor force. Within the labor force, the 25 to 29 years age range has the highest percentage of unemployed individuals, with 68.3% or 84 of them being unemployed.
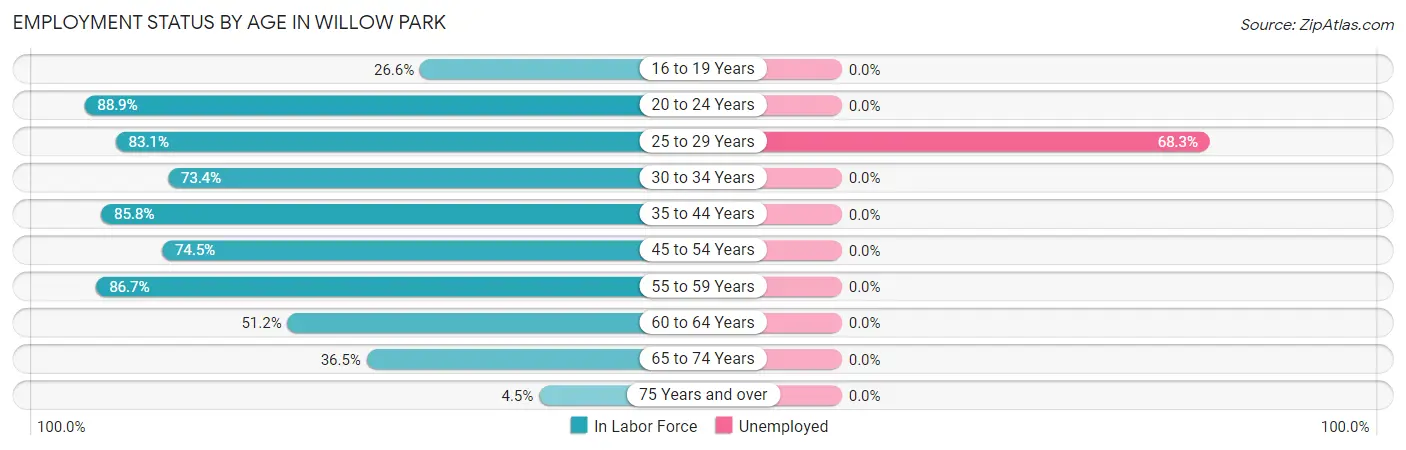
| Age Bracket | In Labor Force | Unemployed |
| 16 to 19 Years | 33 (26.6%) | 0 (0.0%) |
| 20 to 24 Years | 241 (88.9%) | 0 (0.0%) |
| 25 to 29 Years | 123 (83.1%) | 84 (68.3%) |
| 30 to 34 Years | 185 (73.4%) | 0 (0.0%) |
| 35 to 44 Years | 575 (85.8%) | 0 (0.0%) |
| 45 to 54 Years | 693 (74.5%) | 0 (0.0%) |
| 55 to 59 Years | 293 (86.7%) | 0 (0.0%) |
| 60 to 64 Years | 106 (51.2%) | 0 (0.0%) |
| 65 to 74 Years | 170 (36.5%) | 0 (0.0%) |
| 75 Years and over | 16 (4.5%) | 0 (0.0%) |
| Total | 2,434 (64.7%) | 83 (3.4%) |
Employment Status by Educational Attainment in Willow Park
According to labor force statistics for Willow Park, 77.6% of individuals (1,975) out of the total population between 25 and 64 years of age (2,545) are in the labor force, with 4.3% or 85 of them being unemployed. The group with the highest labor force participation rate are those with the educational attainment of bachelor's degree or higher, with 83.6% or 1,002 individuals in the labor force. Within the labor force, individuals with college / associate degree education have the highest percentage of unemployment, with 9.5% or 57 of them being unemployed.
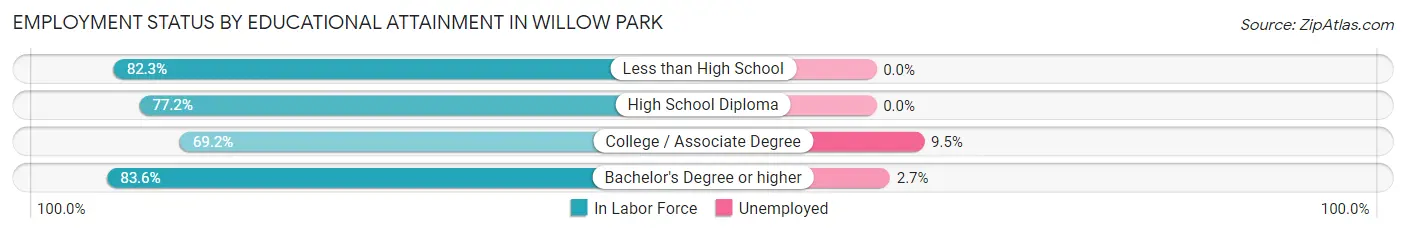
| Educational Attainment | In Labor Force | Unemployed |
| Less than High School | 65 (82.3%) | 0 (0.0%) |
| High School Diploma | 308 (77.2%) | 0 (0.0%) |
| College / Associate Degree | 601 (69.2%) | 83 (9.5%) |
| Bachelor's Degree or higher | 1,002 (83.6%) | 32 (2.7%) |
| Total | 1,975 (77.6%) | 109 (4.3%) |
Employment Occupations by Sex in Willow Park
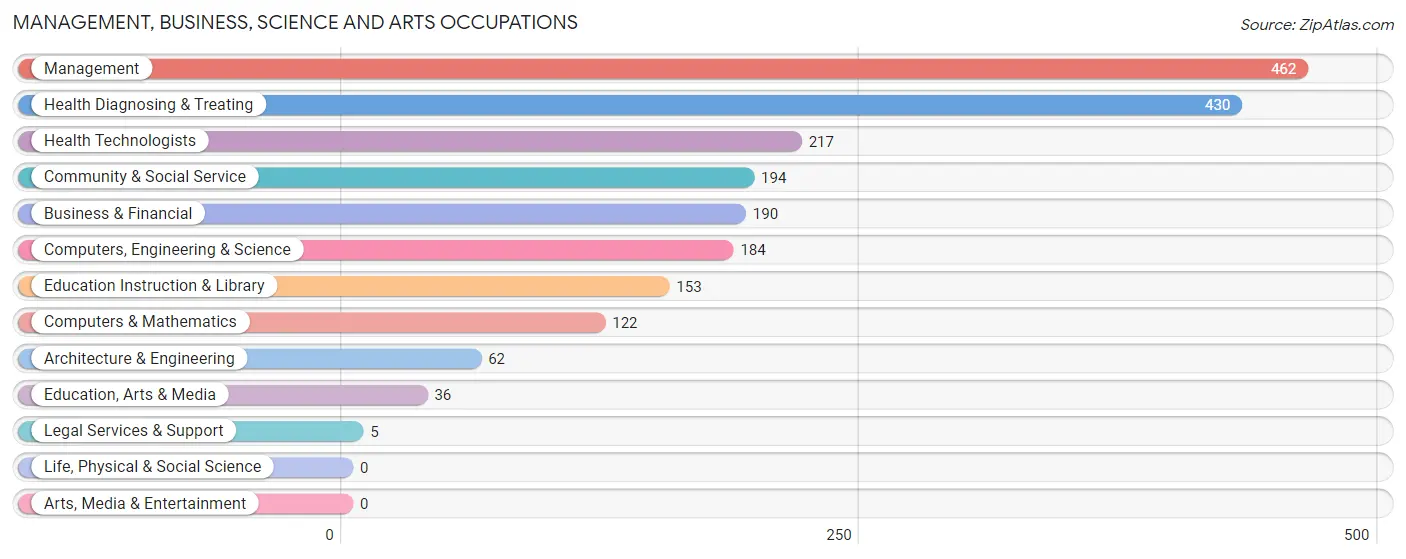
Management, Business, Science and Arts Occupations
The most common Management, Business, Science and Arts occupations in Willow Park are Management (462 | 19.7%), Health Diagnosing & Treating (430 | 18.3%), Health Technologists (217 | 9.2%), Community & Social Service (194 | 8.3%), and Business & Financial (190 | 8.1%).
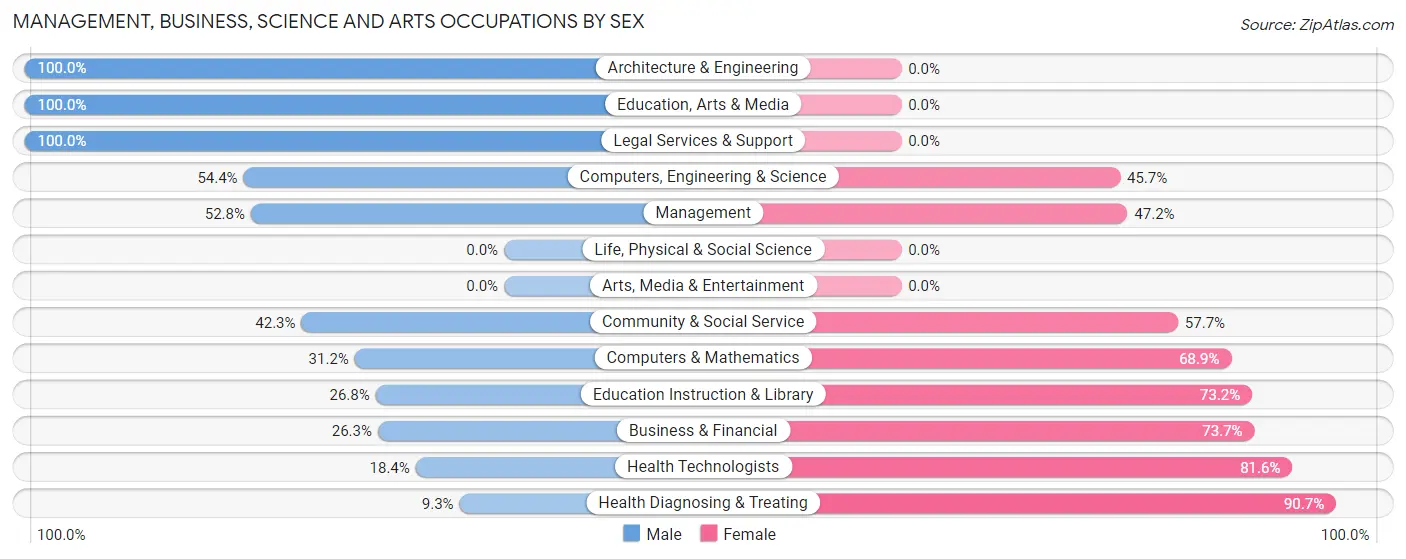
Management, Business, Science and Arts Occupations by Sex
Within the Management, Business, Science and Arts occupations in Willow Park, the most male-oriented occupations are Architecture & Engineering (100.0%), Education, Arts & Media (100.0%), and Legal Services & Support (100.0%), while the most female-oriented occupations are Health Diagnosing & Treating (90.7%), Health Technologists (81.6%), and Business & Financial (73.7%).
| Occupation | Male | Female |
| Management | 244 (52.8%) | 218 (47.2%) |
| Business & Financial | 50 (26.3%) | 140 (73.7%) |
| Computers, Engineering & Science | 100 (54.3%) | 84 (45.7%) |
| Computers & Mathematics | 38 (31.1%) | 84 (68.9%) |
| Architecture & Engineering | 62 (100.0%) | 0 (0.0%) |
| Life, Physical & Social Science | 0 (0.0%) | 0 (0.0%) |
| Community & Social Service | 82 (42.3%) | 112 (57.7%) |
| Education, Arts & Media | 36 (100.0%) | 0 (0.0%) |
| Legal Services & Support | 5 (100.0%) | 0 (0.0%) |
| Education Instruction & Library | 41 (26.8%) | 112 (73.2%) |
| Arts, Media & Entertainment | 0 (0.0%) | 0 (0.0%) |
| Health Diagnosing & Treating | 40 (9.3%) | 390 (90.7%) |
| Health Technologists | 40 (18.4%) | 177 (81.6%) |
| Total (Category) | 516 (35.3%) | 944 (64.7%) |
| Total (Overall) | 1,001 (42.6%) | 1,350 (57.4%) |
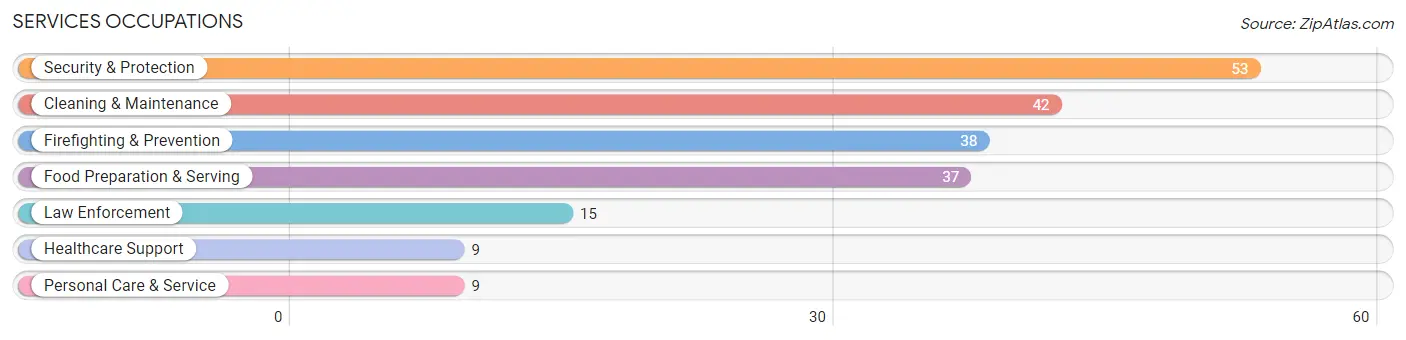
Services Occupations
The most common Services occupations in Willow Park are Security & Protection (53 | 2.2%), Cleaning & Maintenance (42 | 1.8%), Firefighting & Prevention (38 | 1.6%), Food Preparation & Serving (37 | 1.6%), and Law Enforcement (15 | 0.6%).
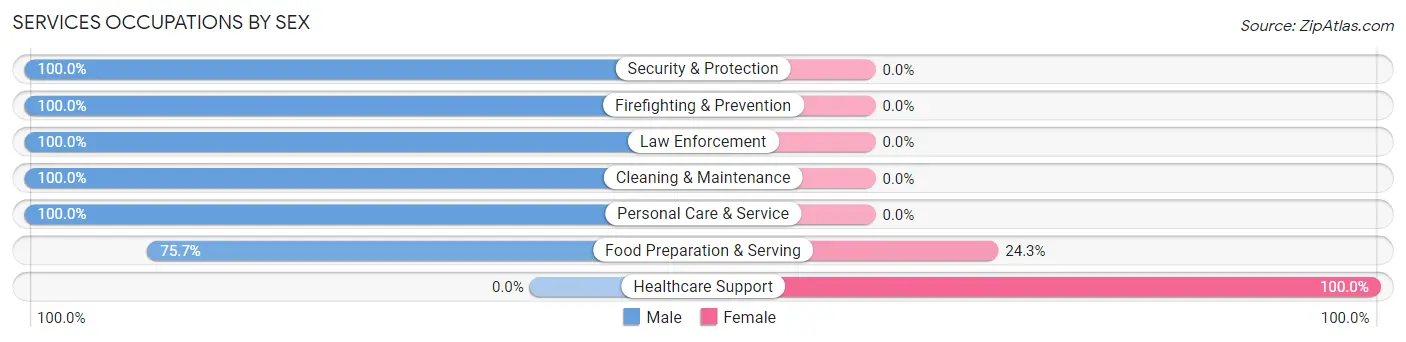
Services Occupations by Sex
Within the Services occupations in Willow Park, the most male-oriented occupations are Security & Protection (100.0%), Firefighting & Prevention (100.0%), and Law Enforcement (100.0%), while the most female-oriented occupations are Healthcare Support (100.0%), and Food Preparation & Serving (24.3%).
| Occupation | Male | Female |
| Healthcare Support | 0 (0.0%) | 9 (100.0%) |
| Security & Protection | 53 (100.0%) | 0 (0.0%) |
| Firefighting & Prevention | 38 (100.0%) | 0 (0.0%) |
| Law Enforcement | 15 (100.0%) | 0 (0.0%) |
| Food Preparation & Serving | 28 (75.7%) | 9 (24.3%) |
| Cleaning & Maintenance | 42 (100.0%) | 0 (0.0%) |
| Personal Care & Service | 9 (100.0%) | 0 (0.0%) |
| Total (Category) | 132 (88.0%) | 18 (12.0%) |
| Total (Overall) | 1,001 (42.6%) | 1,350 (57.4%) |
Sales and Office Occupations
The most common Sales and Office occupations in Willow Park are Sales & Related (402 | 17.1%), and Office & Administration (127 | 5.4%).
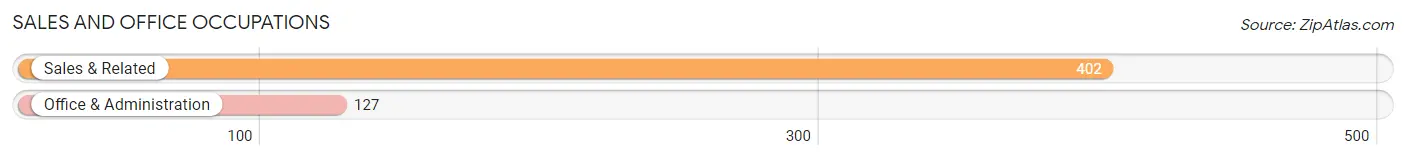
Sales and Office Occupations by Sex
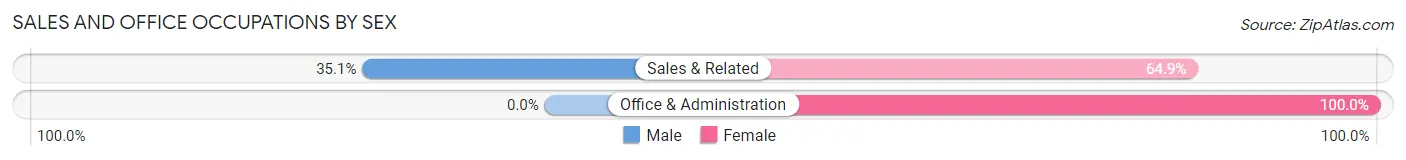
| Occupation | Male | Female |
| Sales & Related | 141 (35.1%) | 261 (64.9%) |
| Office & Administration | 0 (0.0%) | 127 (100.0%) |
| Total (Category) | 141 (26.7%) | 388 (73.4%) |
| Total (Overall) | 1,001 (42.6%) | 1,350 (57.4%) |
Natural Resources, Construction and Maintenance Occupations
The most common Natural Resources, Construction and Maintenance occupations in Willow Park are Installation, Maintenance & Repair (41 | 1.7%), and Construction & Extraction (27 | 1.1%).
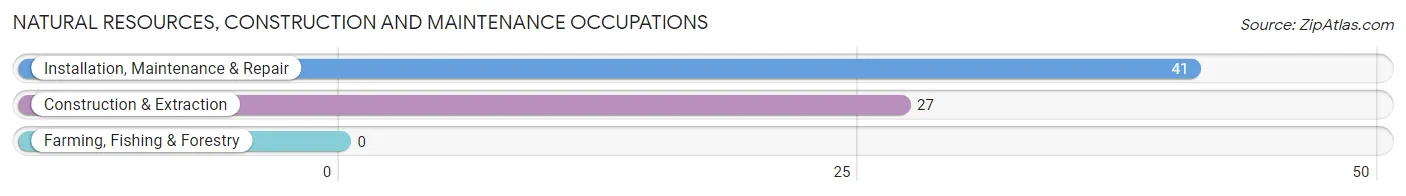
Natural Resources, Construction and Maintenance Occupations by Sex
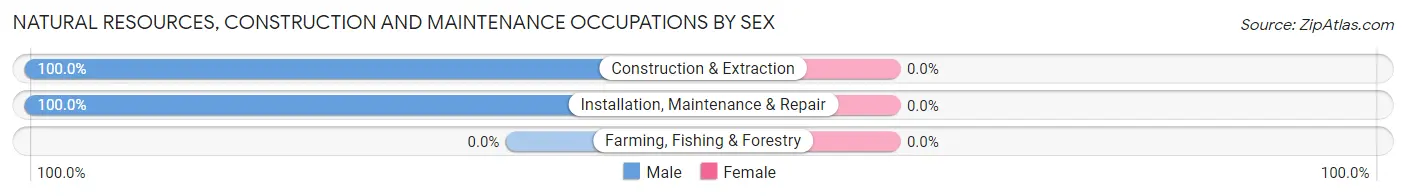
| Occupation | Male | Female |
| Farming, Fishing & Forestry | 0 (0.0%) | 0 (0.0%) |
| Construction & Extraction | 27 (100.0%) | 0 (0.0%) |
| Installation, Maintenance & Repair | 41 (100.0%) | 0 (0.0%) |
| Total (Category) | 68 (100.0%) | 0 (0.0%) |
| Total (Overall) | 1,001 (42.6%) | 1,350 (57.4%) |
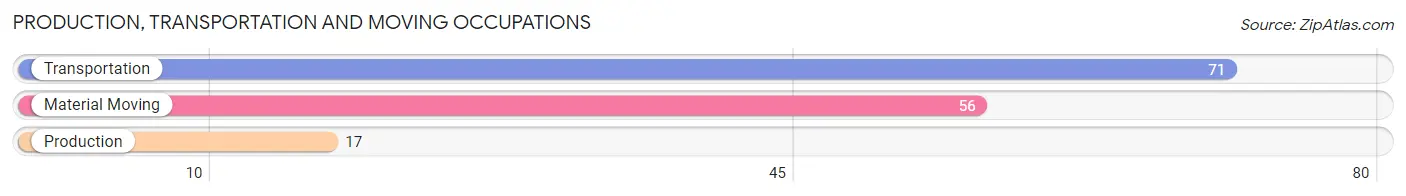
Production, Transportation and Moving Occupations
The most common Production, Transportation and Moving occupations in Willow Park are Transportation (71 | 3.0%), Material Moving (56 | 2.4%), and Production (17 | 0.7%).
Production, Transportation and Moving Occupations by Sex
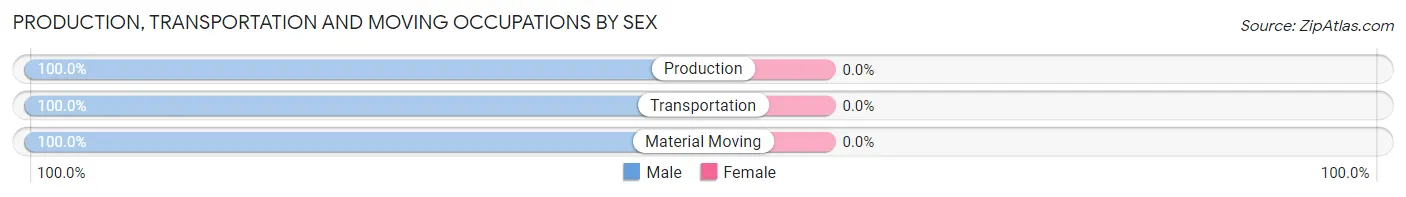
| Occupation | Male | Female |
| Production | 17 (100.0%) | 0 (0.0%) |
| Transportation | 71 (100.0%) | 0 (0.0%) |
| Material Moving | 56 (100.0%) | 0 (0.0%) |
| Total (Category) | 144 (100.0%) | 0 (0.0%) |
| Total (Overall) | 1,001 (42.6%) | 1,350 (57.4%) |
Employment Industries by Sex in Willow Park
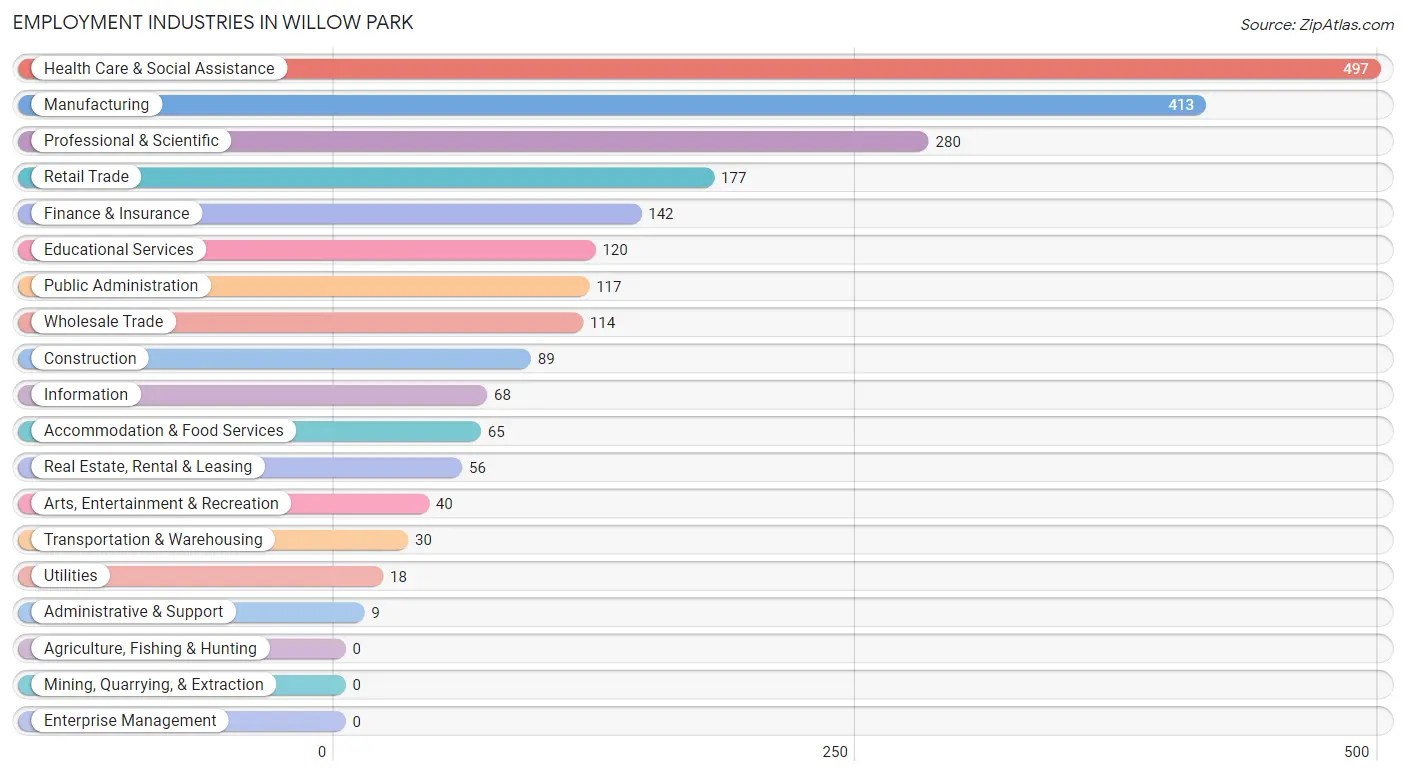
Employment Industries in Willow Park
The major employment industries in Willow Park include Health Care & Social Assistance (497 | 21.1%), Manufacturing (413 | 17.6%), Professional & Scientific (280 | 11.9%), Retail Trade (177 | 7.5%), and Finance & Insurance (142 | 6.0%).
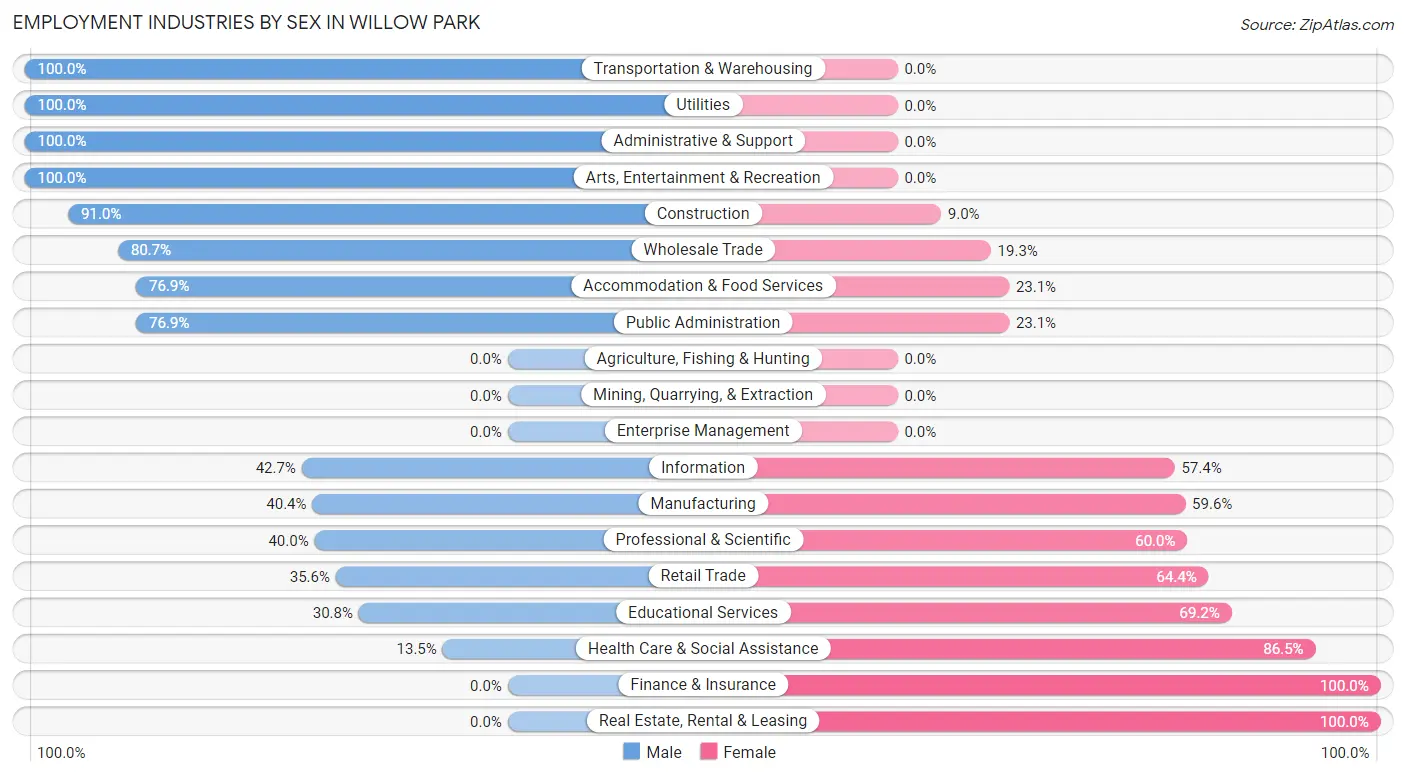
Employment Industries by Sex in Willow Park
The Willow Park industries that see more men than women are Transportation & Warehousing (100.0%), Utilities (100.0%), and Administrative & Support (100.0%), whereas the industries that tend to have a higher number of women are Finance & Insurance (100.0%), Real Estate, Rental & Leasing (100.0%), and Health Care & Social Assistance (86.5%).
| Industry | Male | Female |
| Agriculture, Fishing & Hunting | 0 (0.0%) | 0 (0.0%) |
| Mining, Quarrying, & Extraction | 0 (0.0%) | 0 (0.0%) |
| Construction | 81 (91.0%) | 8 (9.0%) |
| Manufacturing | 167 (40.4%) | 246 (59.6%) |
| Wholesale Trade | 92 (80.7%) | 22 (19.3%) |
| Retail Trade | 63 (35.6%) | 114 (64.4%) |
| Transportation & Warehousing | 30 (100.0%) | 0 (0.0%) |
| Utilities | 18 (100.0%) | 0 (0.0%) |
| Information | 29 (42.6%) | 39 (57.4%) |
| Finance & Insurance | 0 (0.0%) | 142 (100.0%) |
| Real Estate, Rental & Leasing | 0 (0.0%) | 56 (100.0%) |
| Professional & Scientific | 112 (40.0%) | 168 (60.0%) |
| Enterprise Management | 0 (0.0%) | 0 (0.0%) |
| Administrative & Support | 9 (100.0%) | 0 (0.0%) |
| Educational Services | 37 (30.8%) | 83 (69.2%) |
| Health Care & Social Assistance | 67 (13.5%) | 430 (86.5%) |
| Arts, Entertainment & Recreation | 40 (100.0%) | 0 (0.0%) |
| Accommodation & Food Services | 50 (76.9%) | 15 (23.1%) |
| Public Administration | 90 (76.9%) | 27 (23.1%) |
| Total | 1,001 (42.6%) | 1,350 (57.4%) |
Education in Willow Park
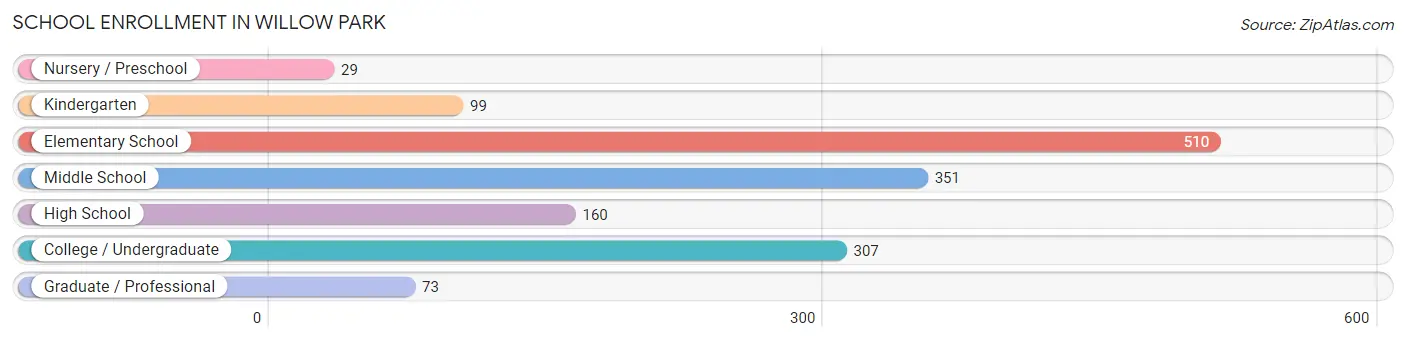
School Enrollment in Willow Park
The most common levels of schooling among the 1,529 students in Willow Park are elementary school (510 | 33.4%), middle school (351 | 23.0%), and college / undergraduate (307 | 20.1%).
| School Level | # Students | % Students |
| Nursery / Preschool | 29 | 1.9% |
| Kindergarten | 99 | 6.5% |
| Elementary School | 510 | 33.4% |
| Middle School | 351 | 23.0% |
| High School | 160 | 10.5% |
| College / Undergraduate | 307 | 20.1% |
| Graduate / Professional | 73 | 4.8% |
| Total | 1,529 | 100.0% |
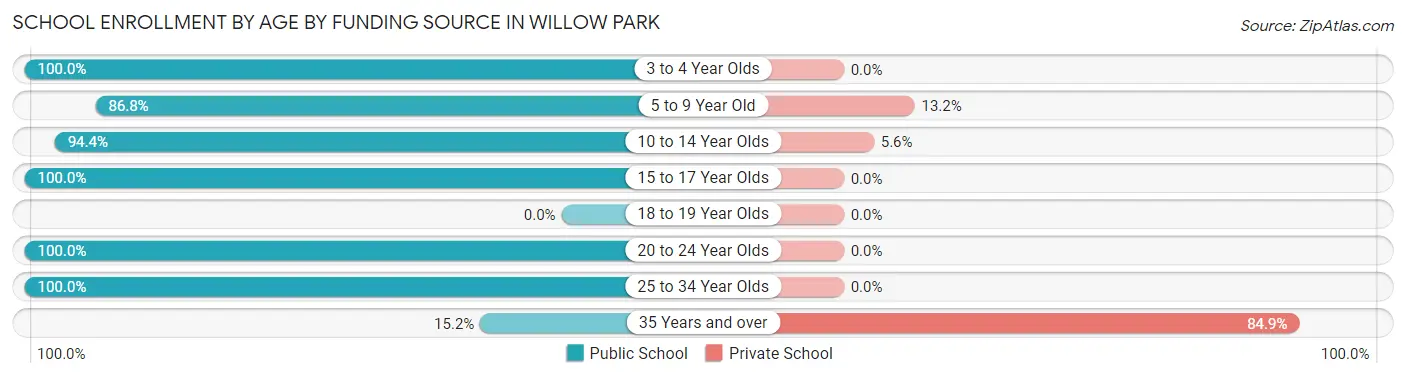
School Enrollment by Age by Funding Source in Willow Park
Out of a total of 1,529 students who are enrolled in schools in Willow Park, 170 (11.1%) attend a private institution, while the remaining 1,359 (88.9%) are enrolled in public schools. The age group of 35 years and over has the highest likelihood of being enrolled in private schools, with 84 (84.9% in the age bracket) enrolled. Conversely, the age group of 3 to 4 year olds has the lowest likelihood of being enrolled in a private school, with 10 (100.0% in the age bracket) attending a public institution.
| Age Bracket | Public School | Private School |
| 3 to 4 Year Olds | 10 (100.0%) | 0 (0.0%) |
| 5 to 9 Year Old | 355 (86.8%) | 54 (13.2%) |
| 10 to 14 Year Olds | 538 (94.4%) | 32 (5.6%) |
| 15 to 17 Year Olds | 160 (100.0%) | 0 (0.0%) |
| 18 to 19 Year Olds | 0 (0.0%) | 0 (0.0%) |
| 20 to 24 Year Olds | 168 (100.0%) | 0 (0.0%) |
| 25 to 34 Year Olds | 113 (100.0%) | 0 (0.0%) |
| 35 Years and over | 15 (15.1%) | 84 (84.9%) |
| Total | 1,359 (88.9%) | 170 (11.1%) |
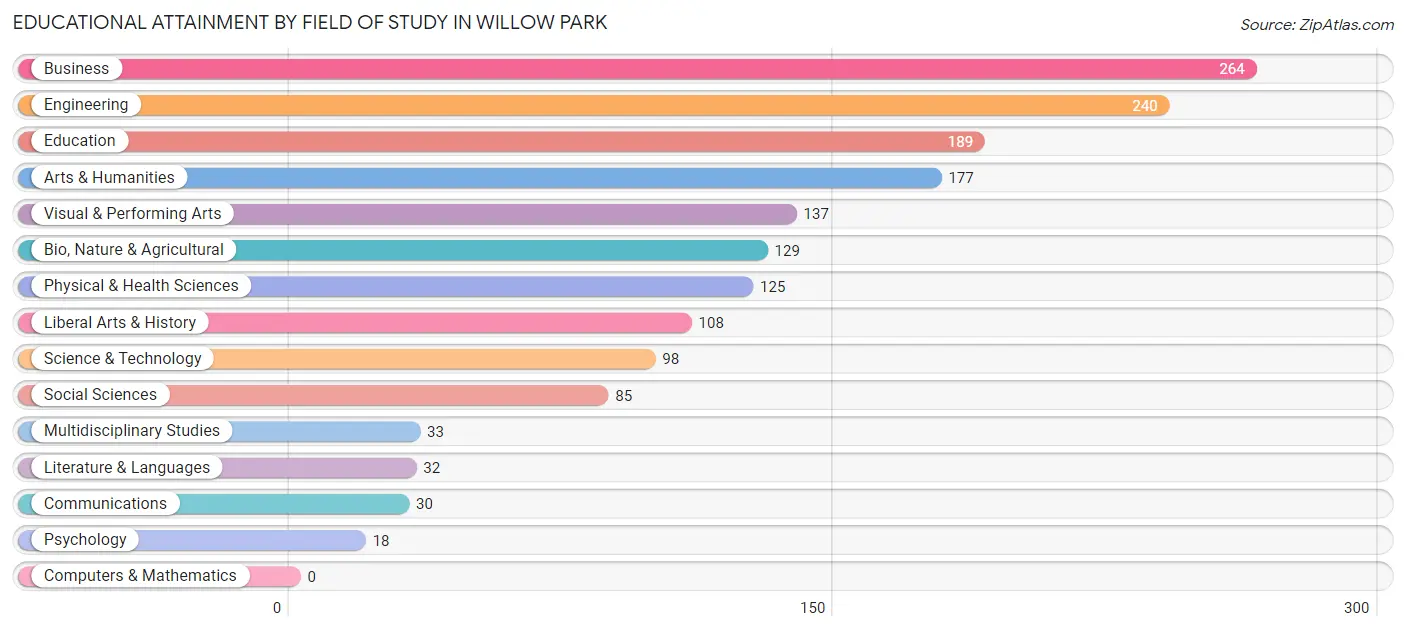
Educational Attainment by Field of Study in Willow Park
Business (264 | 15.9%), engineering (240 | 14.4%), education (189 | 11.4%), arts & humanities (177 | 10.6%), and visual & performing arts (137 | 8.2%) are the most common fields of study among 1,665 individuals in Willow Park who have obtained a bachelor's degree or higher.
| Field of Study | # Graduates | % Graduates |
| Computers & Mathematics | 0 | 0.0% |
| Bio, Nature & Agricultural | 129 | 7.7% |
| Physical & Health Sciences | 125 | 7.5% |
| Psychology | 18 | 1.1% |
| Social Sciences | 85 | 5.1% |
| Engineering | 240 | 14.4% |
| Multidisciplinary Studies | 33 | 2.0% |
| Science & Technology | 98 | 5.9% |
| Business | 264 | 15.9% |
| Education | 189 | 11.4% |
| Literature & Languages | 32 | 1.9% |
| Liberal Arts & History | 108 | 6.5% |
| Visual & Performing Arts | 137 | 8.2% |
| Communications | 30 | 1.8% |
| Arts & Humanities | 177 | 10.6% |
| Total | 1,665 | 100.0% |
Transportation & Commute in Willow Park
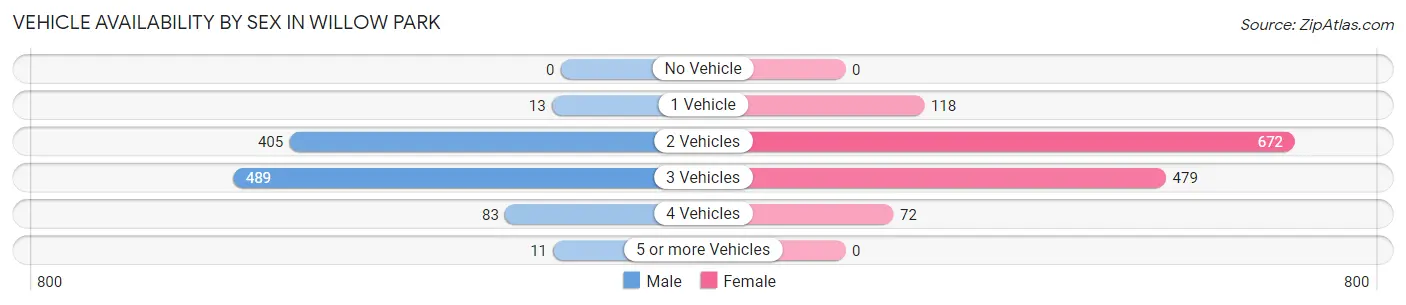
Vehicle Availability by Sex in Willow Park
The most prevalent vehicle ownership categories in Willow Park are males with 3 vehicles (489, accounting for 48.8%) and females with 3 vehicles (479, making up 36.5%).
| Vehicles Available | Male | Female |
| No Vehicle | 0 (0.0%) | 0 (0.0%) |
| 1 Vehicle | 13 (1.3%) | 118 (8.8%) |
| 2 Vehicles | 405 (40.5%) | 672 (50.1%) |
| 3 Vehicles | 489 (48.8%) | 479 (35.7%) |
| 4 Vehicles | 83 (8.3%) | 72 (5.4%) |
| 5 or more Vehicles | 11 (1.1%) | 0 (0.0%) |
| Total | 1,001 (100.0%) | 1,341 (100.0%) |
Commute Time in Willow Park
The most frequently occuring commute durations in Willow Park are 20 to 24 minutes (605 commuters, 30.3%), 30 to 34 minutes (361 commuters, 18.1%), and 15 to 19 minutes (274 commuters, 13.7%).
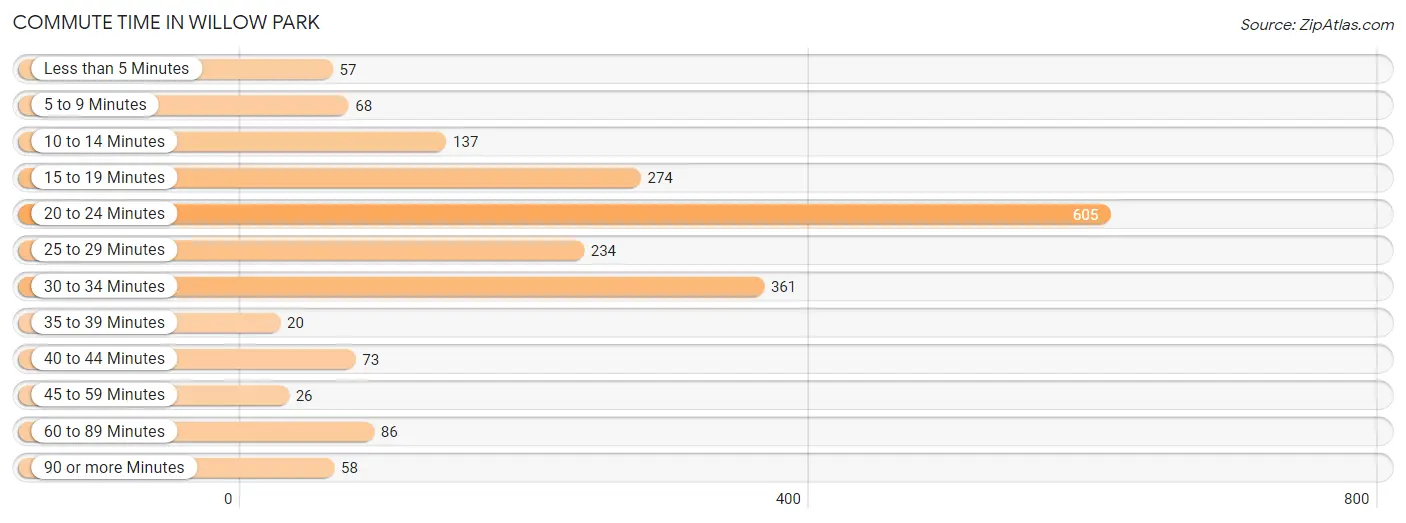
| Commute Time | # Commuters | % Commuters |
| Less than 5 Minutes | 57 | 2.9% |
| 5 to 9 Minutes | 68 | 3.4% |
| 10 to 14 Minutes | 137 | 6.9% |
| 15 to 19 Minutes | 274 | 13.7% |
| 20 to 24 Minutes | 605 | 30.3% |
| 25 to 29 Minutes | 234 | 11.7% |
| 30 to 34 Minutes | 361 | 18.1% |
| 35 to 39 Minutes | 20 | 1.0% |
| 40 to 44 Minutes | 73 | 3.6% |
| 45 to 59 Minutes | 26 | 1.3% |
| 60 to 89 Minutes | 86 | 4.3% |
| 90 or more Minutes | 58 | 2.9% |
Commute Time by Sex in Willow Park
The most common commute times in Willow Park are 30 to 34 minutes (230 commuters, 24.4%) for males and 20 to 24 minutes (447 commuters, 42.3%) for females.
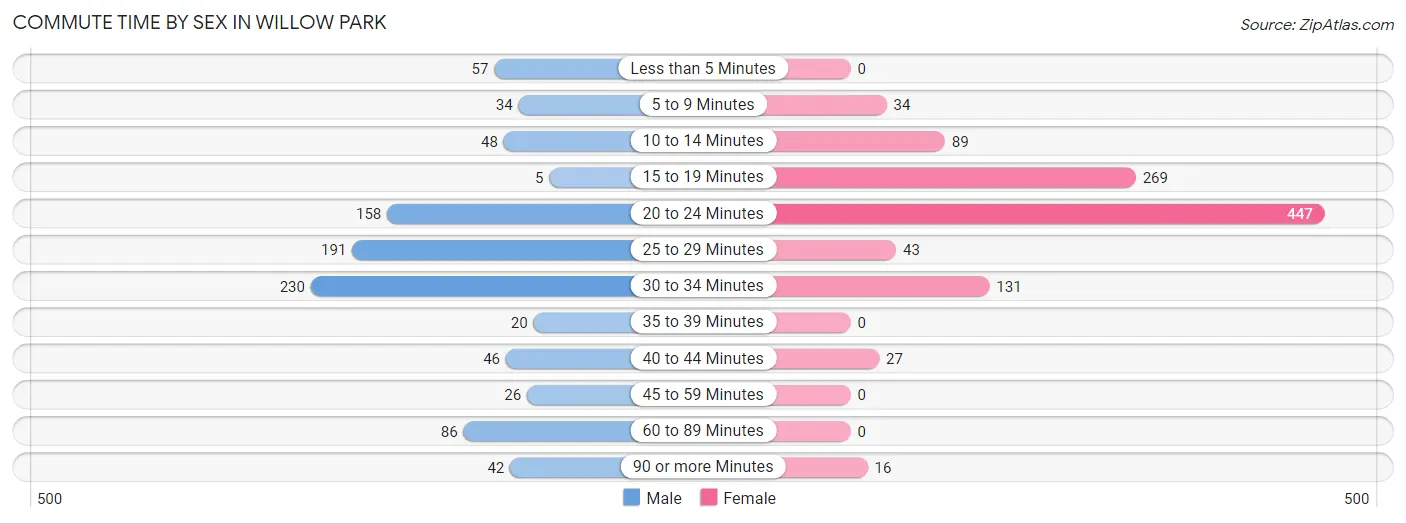
| Commute Time | Male | Female |
| Less than 5 Minutes | 57 (6.0%) | 0 (0.0%) |
| 5 to 9 Minutes | 34 (3.6%) | 34 (3.2%) |
| 10 to 14 Minutes | 48 (5.1%) | 89 (8.4%) |
| 15 to 19 Minutes | 5 (0.5%) | 269 (25.5%) |
| 20 to 24 Minutes | 158 (16.8%) | 447 (42.3%) |
| 25 to 29 Minutes | 191 (20.3%) | 43 (4.1%) |
| 30 to 34 Minutes | 230 (24.4%) | 131 (12.4%) |
| 35 to 39 Minutes | 20 (2.1%) | 0 (0.0%) |
| 40 to 44 Minutes | 46 (4.9%) | 27 (2.6%) |
| 45 to 59 Minutes | 26 (2.8%) | 0 (0.0%) |
| 60 to 89 Minutes | 86 (9.1%) | 0 (0.0%) |
| 90 or more Minutes | 42 (4.4%) | 16 (1.5%) |
Time of Departure to Work by Sex in Willow Park
The most frequent times of departure to work in Willow Park are 6:00 AM to 6:29 AM (293, 31.1%) for males and 7:00 AM to 7:29 AM (327, 31.0%) for females.
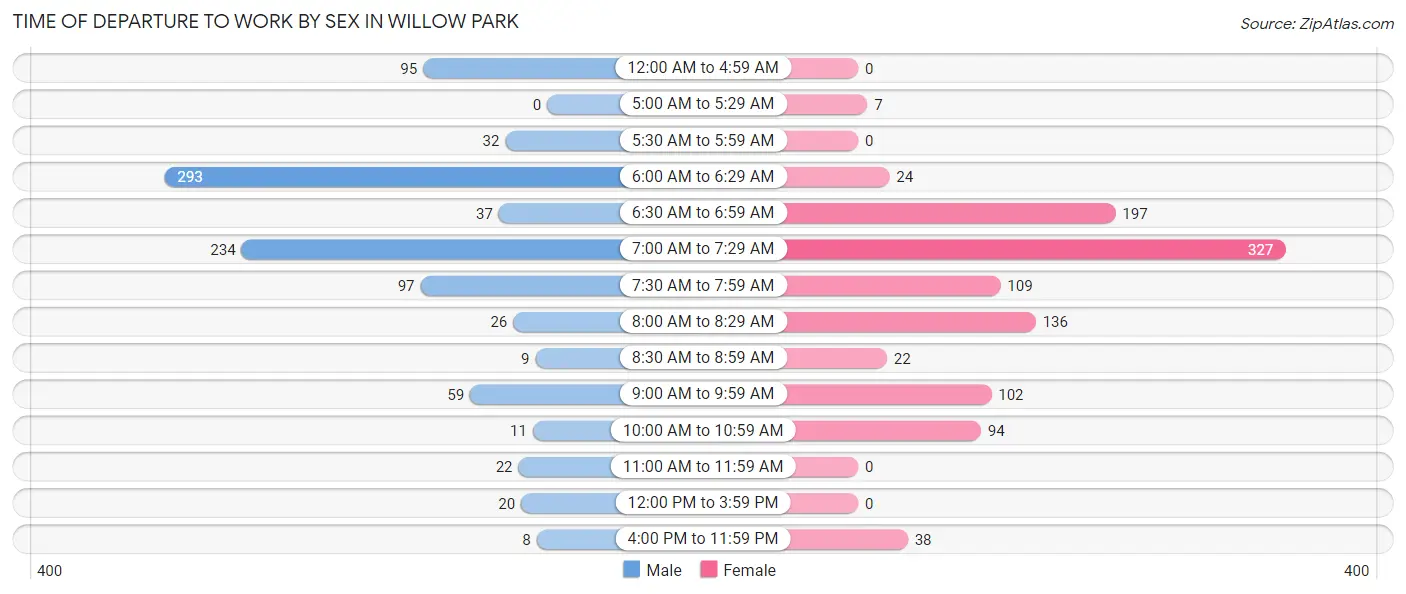
| Time of Departure | Male | Female |
| 12:00 AM to 4:59 AM | 95 (10.1%) | 0 (0.0%) |
| 5:00 AM to 5:29 AM | 0 (0.0%) | 7 (0.7%) |
| 5:30 AM to 5:59 AM | 32 (3.4%) | 0 (0.0%) |
| 6:00 AM to 6:29 AM | 293 (31.1%) | 24 (2.3%) |
| 6:30 AM to 6:59 AM | 37 (3.9%) | 197 (18.7%) |
| 7:00 AM to 7:29 AM | 234 (24.8%) | 327 (31.0%) |
| 7:30 AM to 7:59 AM | 97 (10.3%) | 109 (10.3%) |
| 8:00 AM to 8:29 AM | 26 (2.8%) | 136 (12.9%) |
| 8:30 AM to 8:59 AM | 9 (0.9%) | 22 (2.1%) |
| 9:00 AM to 9:59 AM | 59 (6.3%) | 102 (9.7%) |
| 10:00 AM to 10:59 AM | 11 (1.2%) | 94 (8.9%) |
| 11:00 AM to 11:59 AM | 22 (2.3%) | 0 (0.0%) |
| 12:00 PM to 3:59 PM | 20 (2.1%) | 0 (0.0%) |
| 4:00 PM to 11:59 PM | 8 (0.9%) | 38 (3.6%) |
| Total | 943 (100.0%) | 1,056 (100.0%) |
Housing Occupancy in Willow Park
Occupancy by Ownership in Willow Park
Of the total 1,714 dwellings in Willow Park, owner-occupied units account for 1,480 (86.4%), while renter-occupied units make up 234 (13.7%).
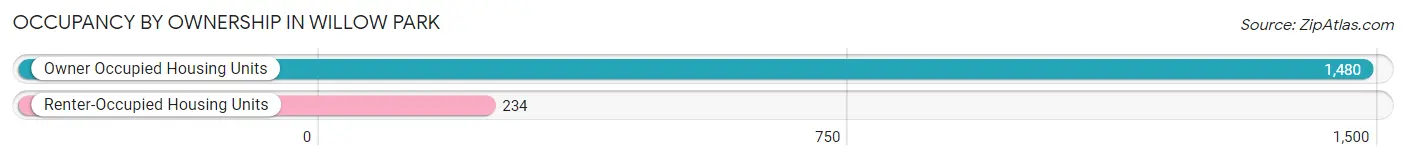
| Occupancy | # Housing Units | % Housing Units |
| Owner Occupied Housing Units | 1,480 | 86.4% |
| Renter-Occupied Housing Units | 234 | 13.7% |
| Total Occupied Housing Units | 1,714 | 100.0% |
Occupancy by Household Size in Willow Park
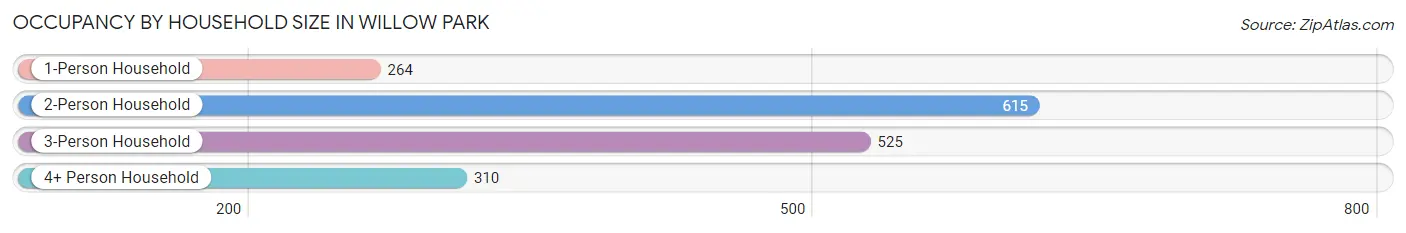
| Household Size | # Housing Units | % Housing Units |
| 1-Person Household | 264 | 15.4% |
| 2-Person Household | 615 | 35.9% |
| 3-Person Household | 525 | 30.6% |
| 4+ Person Household | 310 | 18.1% |
| Total Housing Units | 1,714 | 100.0% |
Occupancy by Ownership by Household Size in Willow Park
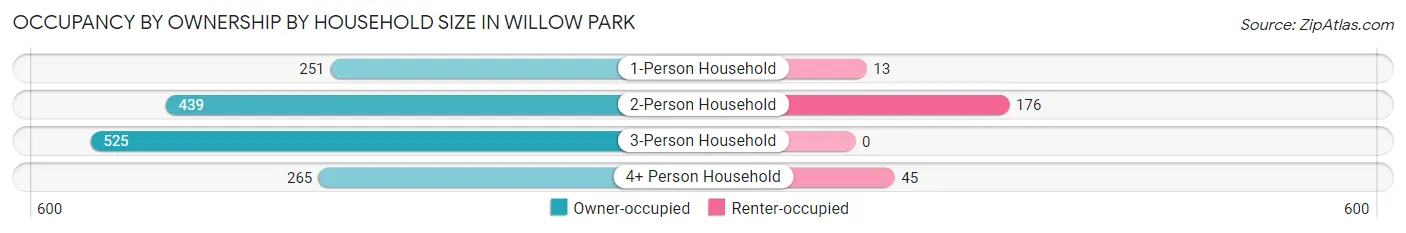
| Household Size | Owner-occupied | Renter-occupied |
| 1-Person Household | 251 (95.1%) | 13 (4.9%) |
| 2-Person Household | 439 (71.4%) | 176 (28.6%) |
| 3-Person Household | 525 (100.0%) | 0 (0.0%) |
| 4+ Person Household | 265 (85.5%) | 45 (14.5%) |
| Total Housing Units | 1,480 (86.4%) | 234 (13.7%) |
Occupancy by Educational Attainment in Willow Park
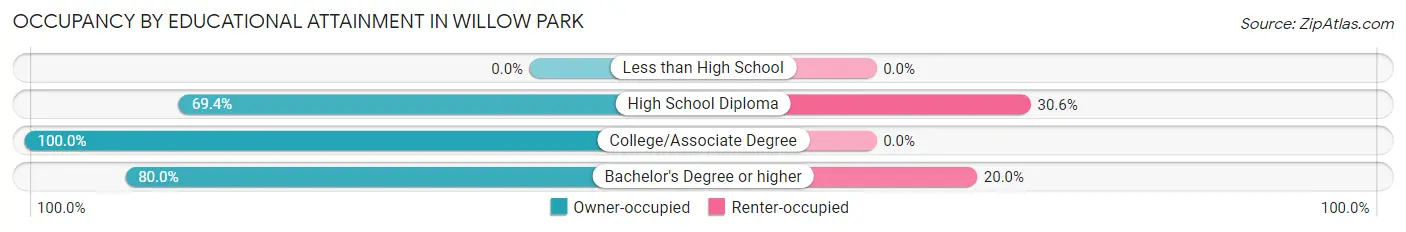
| Household Size | Owner-occupied | Renter-occupied |
| Less than High School | 0 (0.0%) | 0 (0.0%) |
| High School Diploma | 127 (69.4%) | 56 (30.6%) |
| College/Associate Degree | 639 (100.0%) | 0 (0.0%) |
| Bachelor's Degree or higher | 714 (80.0%) | 178 (20.0%) |
Occupancy by Age of Householder in Willow Park
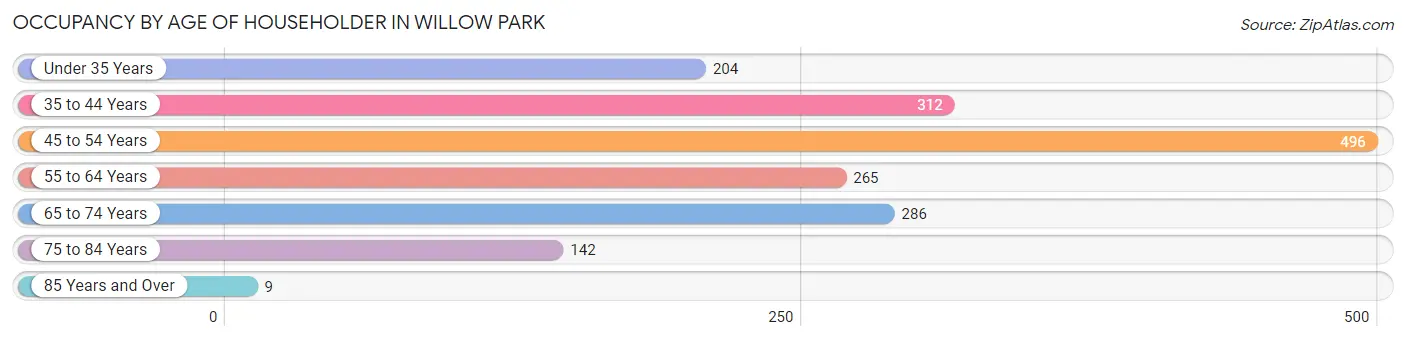
| Age Bracket | # Households | % Households |
| Under 35 Years | 204 | 11.9% |
| 35 to 44 Years | 312 | 18.2% |
| 45 to 54 Years | 496 | 28.9% |
| 55 to 64 Years | 265 | 15.5% |
| 65 to 74 Years | 286 | 16.7% |
| 75 to 84 Years | 142 | 8.3% |
| 85 Years and Over | 9 | 0.5% |
| Total | 1,714 | 100.0% |
Housing Finances in Willow Park
Median Income by Occupancy in Willow Park
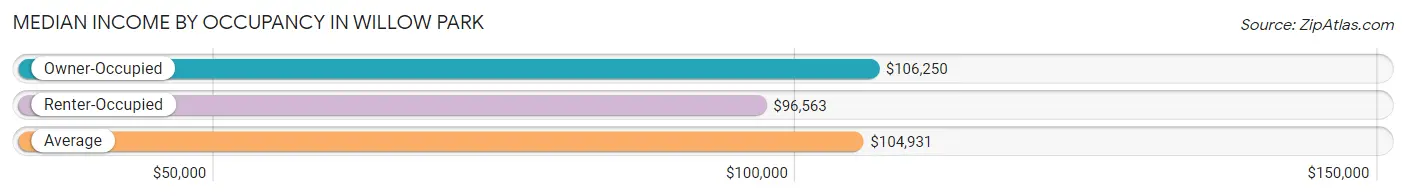
| Occupancy Type | # Households | Median Income |
| Owner-Occupied | 1,480 (86.4%) | $106,250 |
| Renter-Occupied | 234 (13.7%) | $96,563 |
| Average | 1,714 (100.0%) | $104,931 |
Occupancy by Householder Income Bracket in Willow Park
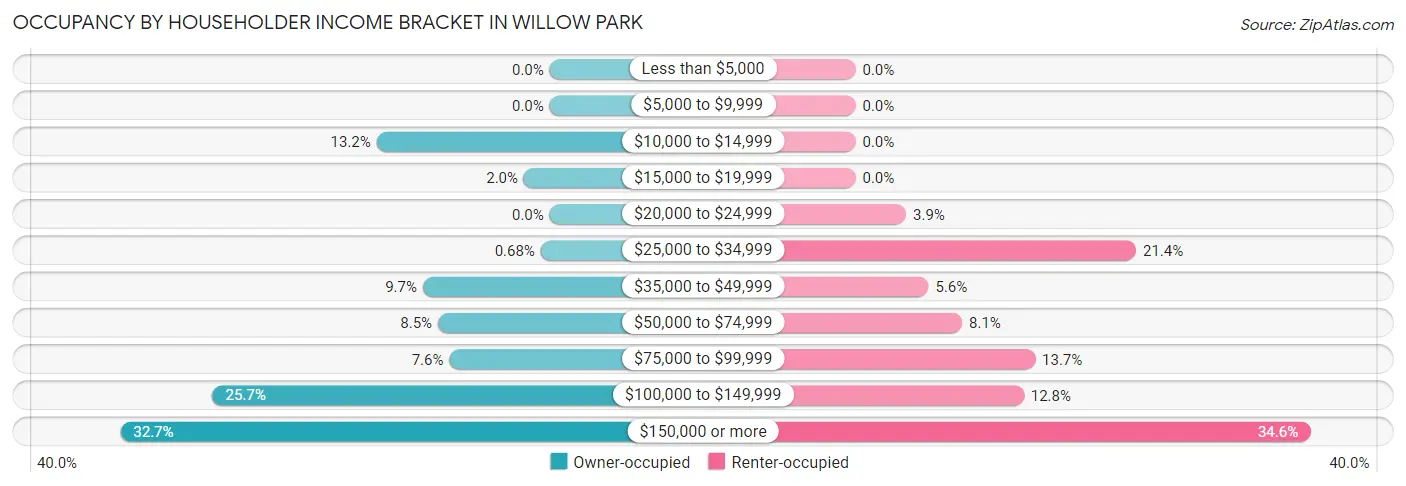
| Income Bracket | Owner-occupied | Renter-occupied |
| Less than $5,000 | 0 (0.0%) | 0 (0.0%) |
| $5,000 to $9,999 | 0 (0.0%) | 0 (0.0%) |
| $10,000 to $14,999 | 195 (13.2%) | 0 (0.0%) |
| $15,000 to $19,999 | 29 (2.0%) | 0 (0.0%) |
| $20,000 to $24,999 | 0 (0.0%) | 9 (3.8%) |
| $25,000 to $34,999 | 10 (0.7%) | 50 (21.4%) |
| $35,000 to $49,999 | 143 (9.7%) | 13 (5.6%) |
| $50,000 to $74,999 | 126 (8.5%) | 19 (8.1%) |
| $75,000 to $99,999 | 113 (7.6%) | 32 (13.7%) |
| $100,000 to $149,999 | 380 (25.7%) | 30 (12.8%) |
| $150,000 or more | 484 (32.7%) | 81 (34.6%) |
| Total | 1,480 (100.0%) | 234 (100.0%) |
Monthly Housing Cost Tiers in Willow Park
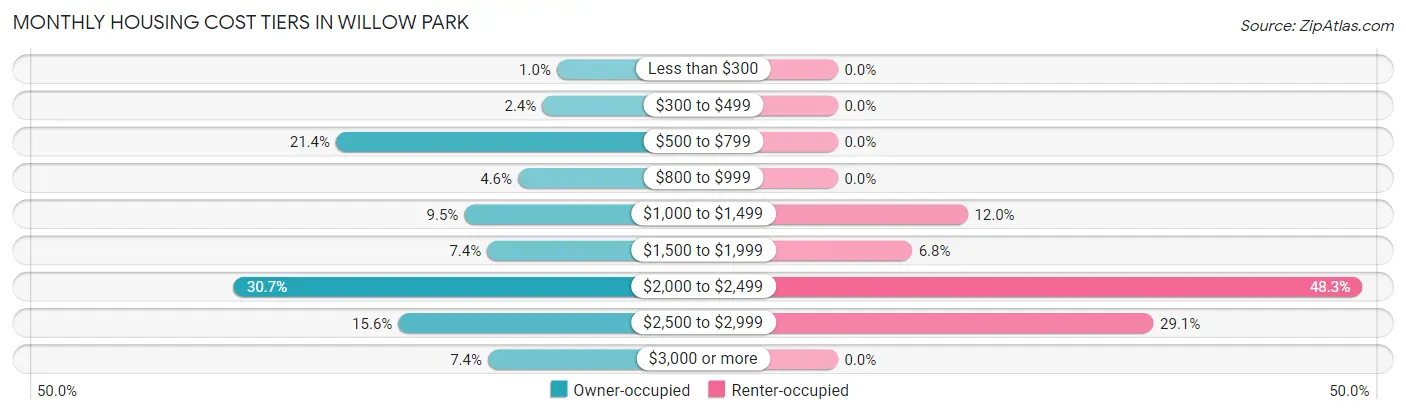
| Monthly Cost | Owner-occupied | Renter-occupied |
| Less than $300 | 15 (1.0%) | 0 (0.0%) |
| $300 to $499 | 35 (2.4%) | 0 (0.0%) |
| $500 to $799 | 316 (21.3%) | 0 (0.0%) |
| $800 to $999 | 68 (4.6%) | 0 (0.0%) |
| $1,000 to $1,499 | 141 (9.5%) | 28 (12.0%) |
| $1,500 to $1,999 | 110 (7.4%) | 16 (6.8%) |
| $2,000 to $2,499 | 455 (30.7%) | 113 (48.3%) |
| $2,500 to $2,999 | 231 (15.6%) | 68 (29.1%) |
| $3,000 or more | 109 (7.4%) | 0 (0.0%) |
| Total | 1,480 (100.0%) | 234 (100.0%) |
Physical Housing Characteristics in Willow Park
Housing Structures in Willow Park
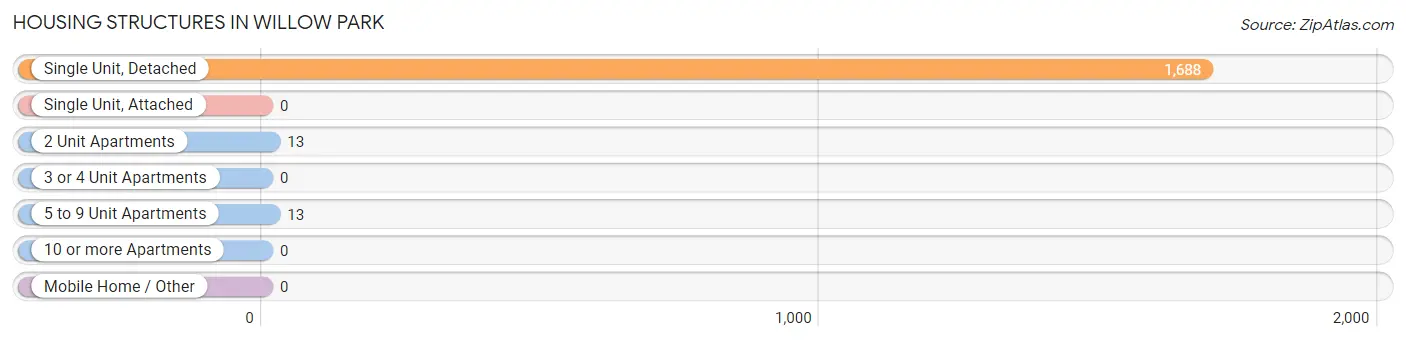
| Structure Type | # Housing Units | % Housing Units |
| Single Unit, Detached | 1,688 | 98.5% |
| Single Unit, Attached | 0 | 0.0% |
| 2 Unit Apartments | 13 | 0.8% |
| 3 or 4 Unit Apartments | 0 | 0.0% |
| 5 to 9 Unit Apartments | 13 | 0.8% |
| 10 or more Apartments | 0 | 0.0% |
| Mobile Home / Other | 0 | 0.0% |
| Total | 1,714 | 100.0% |
Housing Structures by Occupancy in Willow Park
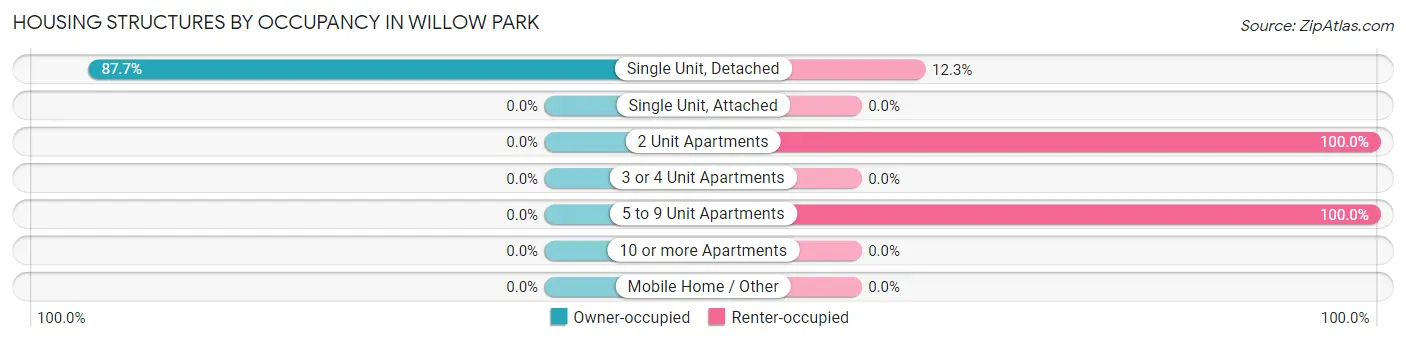
| Structure Type | Owner-occupied | Renter-occupied |
| Single Unit, Detached | 1,480 (87.7%) | 208 (12.3%) |
| Single Unit, Attached | 0 (0.0%) | 0 (0.0%) |
| 2 Unit Apartments | 0 (0.0%) | 13 (100.0%) |
| 3 or 4 Unit Apartments | 0 (0.0%) | 0 (0.0%) |
| 5 to 9 Unit Apartments | 0 (0.0%) | 13 (100.0%) |
| 10 or more Apartments | 0 (0.0%) | 0 (0.0%) |
| Mobile Home / Other | 0 (0.0%) | 0 (0.0%) |
| Total | 1,480 (86.4%) | 234 (13.7%) |
Housing Structures by Number of Rooms in Willow Park
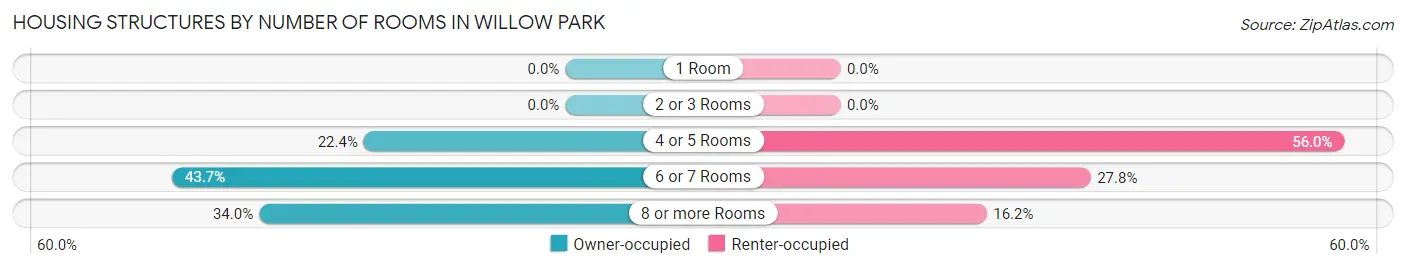
| Number of Rooms | Owner-occupied | Renter-occupied |
| 1 Room | 0 (0.0%) | 0 (0.0%) |
| 2 or 3 Rooms | 0 (0.0%) | 0 (0.0%) |
| 4 or 5 Rooms | 331 (22.4%) | 131 (56.0%) |
| 6 or 7 Rooms | 646 (43.6%) | 65 (27.8%) |
| 8 or more Rooms | 503 (34.0%) | 38 (16.2%) |
| Total | 1,480 (100.0%) | 234 (100.0%) |
Housing Structure by Heating Type in Willow Park
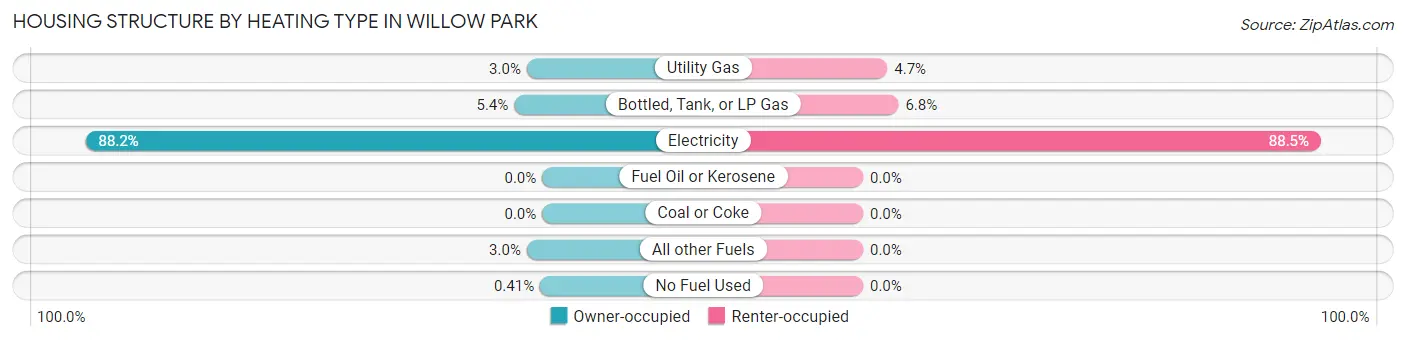
| Heating Type | Owner-occupied | Renter-occupied |
| Utility Gas | 44 (3.0%) | 11 (4.7%) |
| Bottled, Tank, or LP Gas | 80 (5.4%) | 16 (6.8%) |
| Electricity | 1,306 (88.2%) | 207 (88.5%) |
| Fuel Oil or Kerosene | 0 (0.0%) | 0 (0.0%) |
| Coal or Coke | 0 (0.0%) | 0 (0.0%) |
| All other Fuels | 44 (3.0%) | 0 (0.0%) |
| No Fuel Used | 6 (0.4%) | 0 (0.0%) |
| Total | 1,480 (100.0%) | 234 (100.0%) |
Household Vehicle Usage in Willow Park
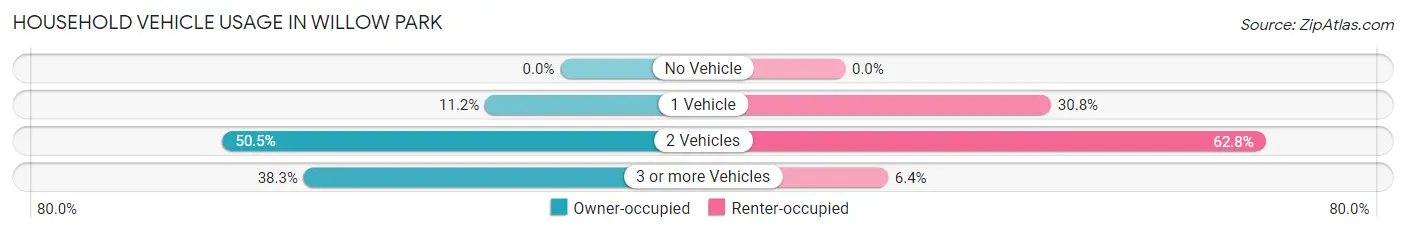
| Vehicles per Household | Owner-occupied | Renter-occupied |
| No Vehicle | 0 (0.0%) | 0 (0.0%) |
| 1 Vehicle | 166 (11.2%) | 72 (30.8%) |
| 2 Vehicles | 747 (50.5%) | 147 (62.8%) |
| 3 or more Vehicles | 567 (38.3%) | 15 (6.4%) |
| Total | 1,480 (100.0%) | 234 (100.0%) |
Real Estate & Mortgages in Willow Park
Real Estate and Mortgage Overview in Willow Park
| Characteristic | Without Mortgage | With Mortgage |
| Housing Units | 530 | 950 |
| Median Property Value | $279,000 | $321,000 |
| Median Household Income | - | - |
| Monthly Housing Costs | $756 | $86 |
| Real Estate Taxes | $4,386 | $102 |
Property Value by Mortgage Status in Willow Park
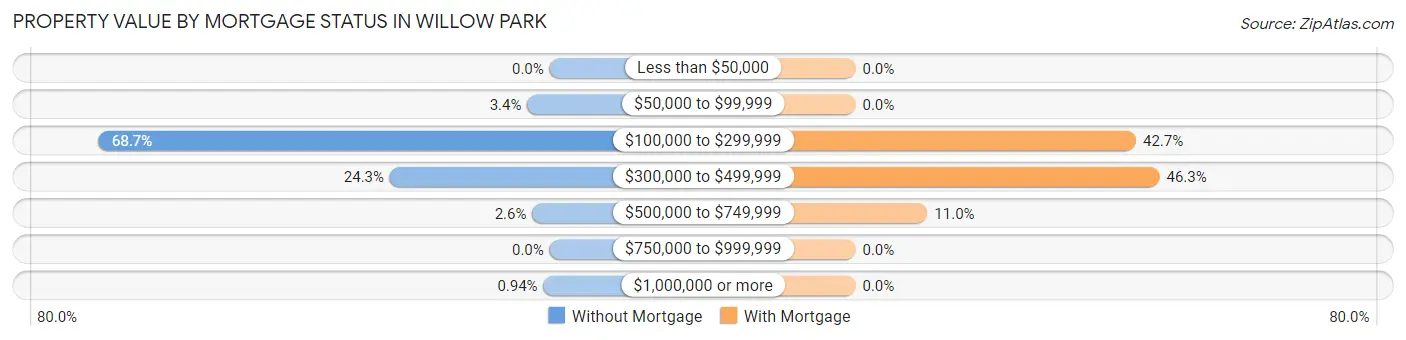
| Property Value | Without Mortgage | With Mortgage |
| Less than $50,000 | 0 (0.0%) | 0 (0.0%) |
| $50,000 to $99,999 | 18 (3.4%) | 0 (0.0%) |
| $100,000 to $299,999 | 364 (68.7%) | 406 (42.7%) |
| $300,000 to $499,999 | 129 (24.3%) | 440 (46.3%) |
| $500,000 to $749,999 | 14 (2.6%) | 104 (11.0%) |
| $750,000 to $999,999 | 0 (0.0%) | 0 (0.0%) |
| $1,000,000 or more | 5 (0.9%) | 0 (0.0%) |
| Total | 530 (100.0%) | 950 (100.0%) |
Household Income by Mortgage Status in Willow Park
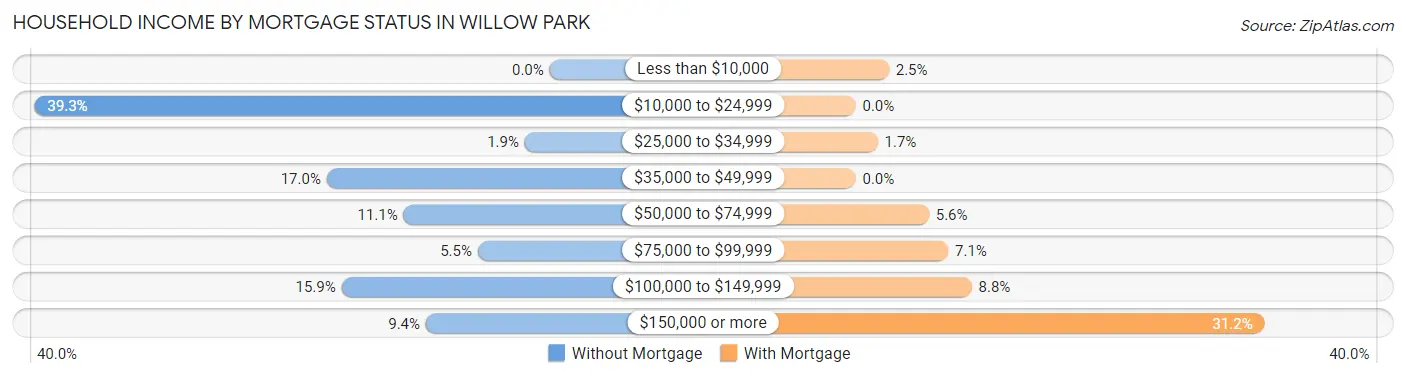
| Household Income | Without Mortgage | With Mortgage |
| Less than $10,000 | 0 (0.0%) | 24 (2.5%) |
| $10,000 to $24,999 | 208 (39.3%) | 0 (0.0%) |
| $25,000 to $34,999 | 10 (1.9%) | 16 (1.7%) |
| $35,000 to $49,999 | 90 (17.0%) | 0 (0.0%) |
| $50,000 to $74,999 | 59 (11.1%) | 53 (5.6%) |
| $75,000 to $99,999 | 29 (5.5%) | 67 (7.0%) |
| $100,000 to $149,999 | 84 (15.9%) | 84 (8.8%) |
| $150,000 or more | 50 (9.4%) | 296 (31.2%) |
| Total | 530 (100.0%) | 950 (100.0%) |
Property Value to Household Income Ratio in Willow Park
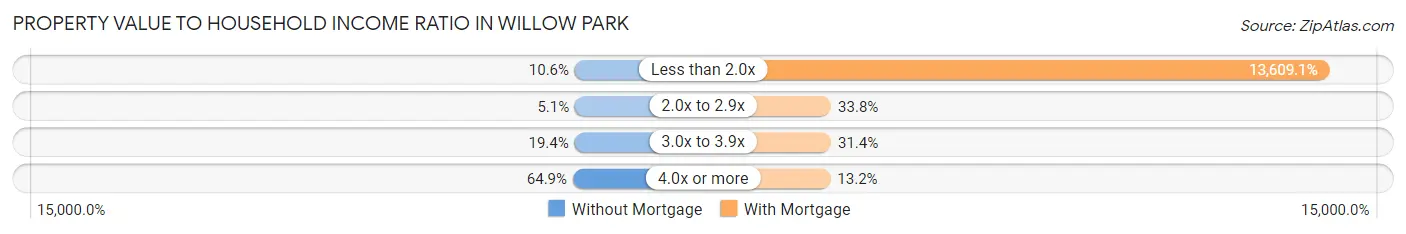
| Value-to-Income Ratio | Without Mortgage | With Mortgage |
| Less than 2.0x | 56 (10.6%) | 129,286 (13,609.0%) |
| 2.0x to 2.9x | 27 (5.1%) | 321 (33.8%) |
| 3.0x to 3.9x | 103 (19.4%) | 298 (31.4%) |
| 4.0x or more | 344 (64.9%) | 125 (13.2%) |
| Total | 530 (100.0%) | 950 (100.0%) |
Real Estate Taxes by Mortgage Status in Willow Park
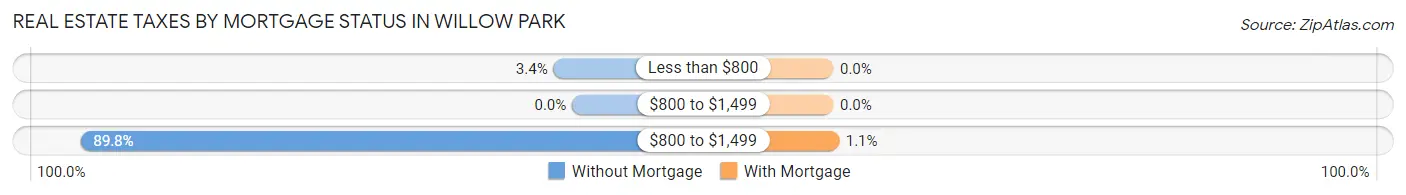
| Property Taxes | Without Mortgage | With Mortgage |
| Less than $800 | 18 (3.4%) | 0 (0.0%) |
| $800 to $1,499 | 0 (0.0%) | 0 (0.0%) |
| $800 to $1,499 | 476 (89.8%) | 10 (1.1%) |
| Total | 530 (100.0%) | 950 (100.0%) |
Health & Disability in Willow Park
Health Insurance Coverage by Age in Willow Park
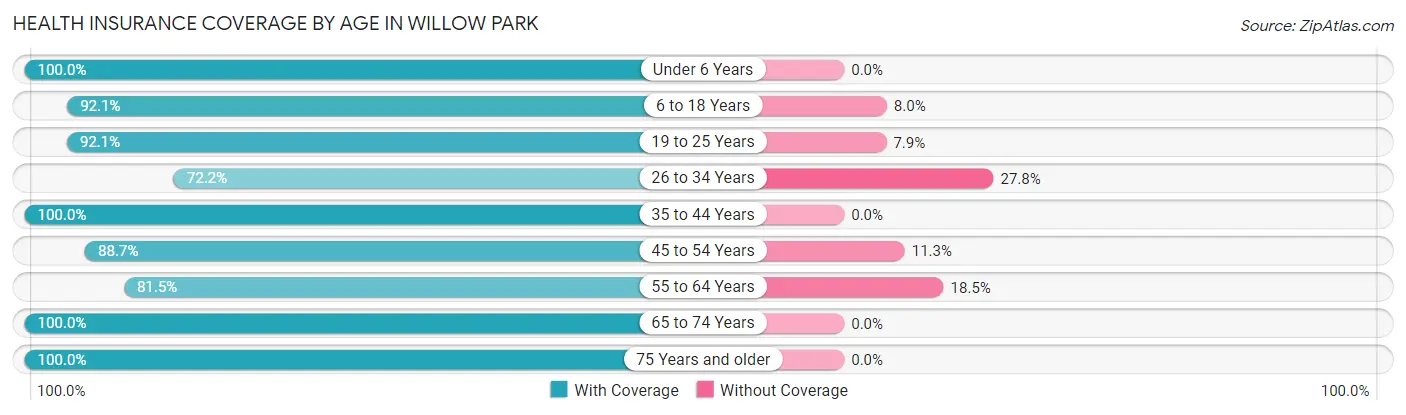
| Age Bracket | With Coverage | Without Coverage |
| Under 6 Years | 292 (100.0%) | 0 (0.0%) |
| 6 to 18 Years | 1,030 (92.0%) | 89 (8.0%) |
| 19 to 25 Years | 316 (92.1%) | 27 (7.9%) |
| 26 to 34 Years | 241 (72.2%) | 93 (27.8%) |
| 35 to 44 Years | 670 (100.0%) | 0 (0.0%) |
| 45 to 54 Years | 825 (88.7%) | 105 (11.3%) |
| 55 to 64 Years | 444 (81.5%) | 101 (18.5%) |
| 65 to 74 Years | 466 (100.0%) | 0 (0.0%) |
| 75 Years and older | 356 (100.0%) | 0 (0.0%) |
| Total | 4,640 (91.8%) | 415 (8.2%) |
Health Insurance Coverage by Citizenship Status in Willow Park
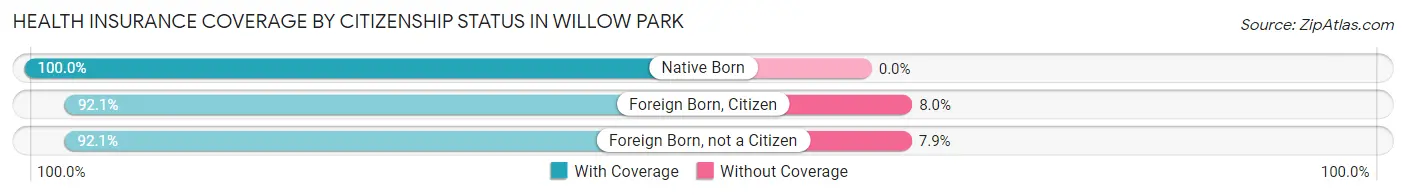
| Citizenship Status | With Coverage | Without Coverage |
| Native Born | 292 (100.0%) | 0 (0.0%) |
| Foreign Born, Citizen | 1,030 (92.0%) | 89 (8.0%) |
| Foreign Born, not a Citizen | 316 (92.1%) | 27 (7.9%) |
Health Insurance Coverage by Household Income in Willow Park
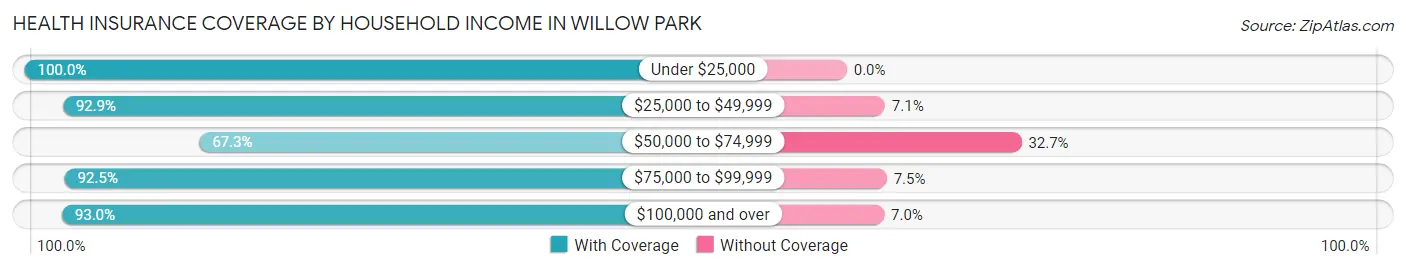
| Household Income | With Coverage | Without Coverage |
| Under $25,000 | 555 (100.0%) | 0 (0.0%) |
| $25,000 to $49,999 | 351 (92.9%) | 27 (7.1%) |
| $50,000 to $74,999 | 257 (67.3%) | 125 (32.7%) |
| $75,000 to $99,999 | 408 (92.5%) | 33 (7.5%) |
| $100,000 and over | 3,061 (93.0%) | 230 (7.0%) |
Public vs Private Health Insurance Coverage by Age in Willow Park
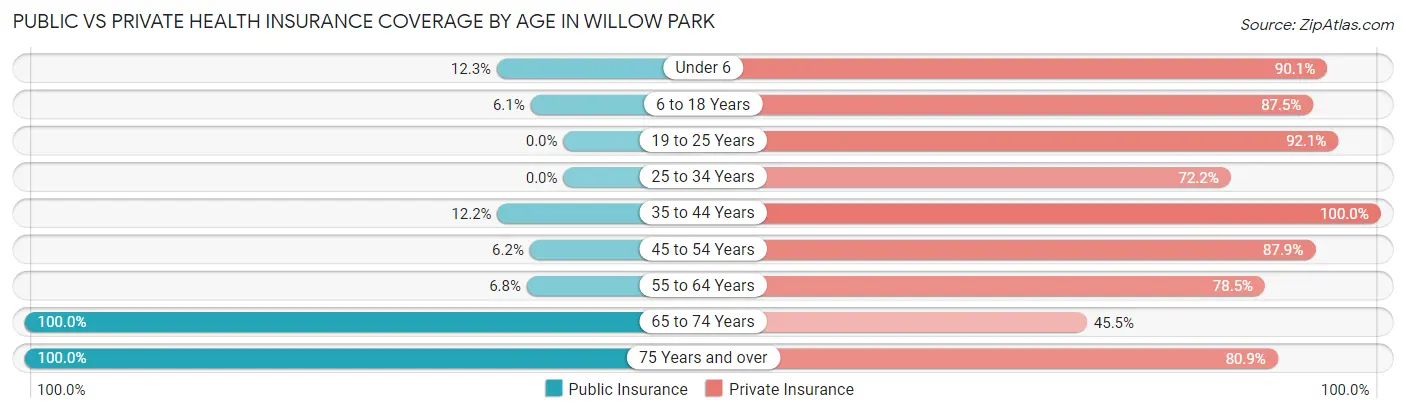
| Age Bracket | Public Insurance | Private Insurance |
| Under 6 | 36 (12.3%) | 263 (90.1%) |
| 6 to 18 Years | 68 (6.1%) | 979 (87.5%) |
| 19 to 25 Years | 0 (0.0%) | 316 (92.1%) |
| 25 to 34 Years | 0 (0.0%) | 241 (72.2%) |
| 35 to 44 Years | 82 (12.2%) | 670 (100.0%) |
| 45 to 54 Years | 58 (6.2%) | 817 (87.8%) |
| 55 to 64 Years | 37 (6.8%) | 428 (78.5%) |
| 65 to 74 Years | 466 (100.0%) | 212 (45.5%) |
| 75 Years and over | 356 (100.0%) | 288 (80.9%) |
| Total | 1,103 (21.8%) | 4,214 (83.4%) |
Disability Status by Sex by Age in Willow Park
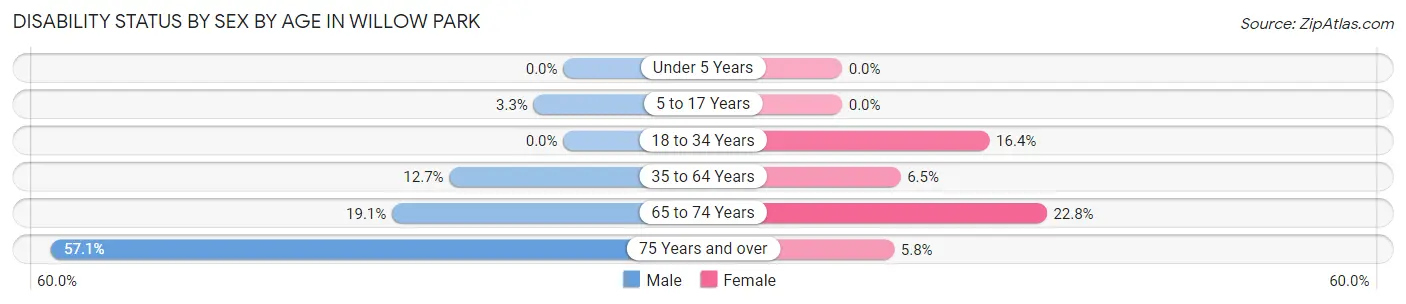
| Age Bracket | Male | Female |
| Under 5 Years | 0 (0.0%) | 0 (0.0%) |
| 5 to 17 Years | 16 (3.3%) | 0 (0.0%) |
| 18 to 34 Years | 0 (0.0%) | 75 (16.4%) |
| 35 to 64 Years | 124 (12.7%) | 76 (6.5%) |
| 65 to 74 Years | 37 (19.1%) | 62 (22.8%) |
| 75 Years and over | 85 (57.1%) | 12 (5.8%) |
Disability Class by Sex by Age in Willow Park
Disability Class: Hearing Difficulty
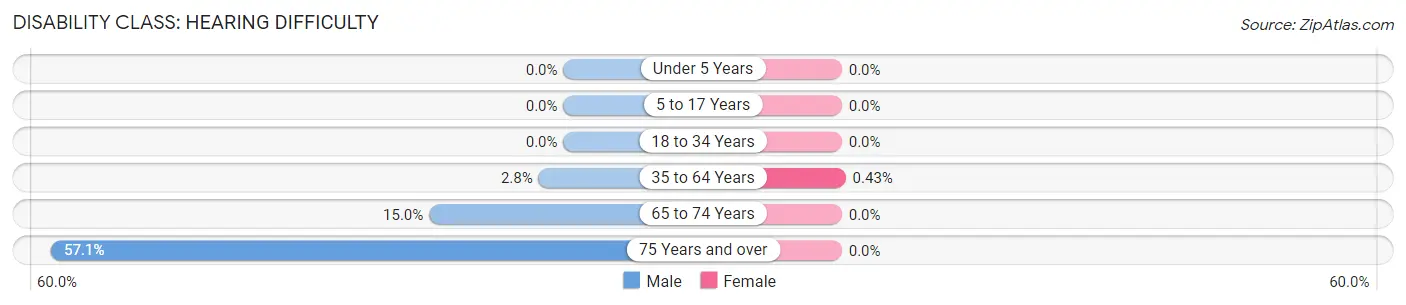
| Age Bracket | Male | Female |
| Under 5 Years | 0 (0.0%) | 0 (0.0%) |
| 5 to 17 Years | 0 (0.0%) | 0 (0.0%) |
| 18 to 34 Years | 0 (0.0%) | 0 (0.0%) |
| 35 to 64 Years | 27 (2.8%) | 5 (0.4%) |
| 65 to 74 Years | 29 (14.9%) | 0 (0.0%) |
| 75 Years and over | 85 (57.1%) | 0 (0.0%) |
Disability Class: Vision Difficulty
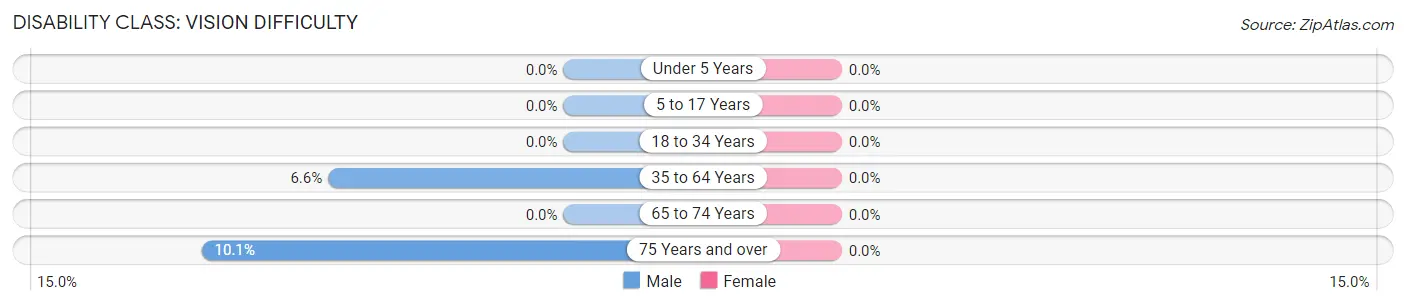
| Age Bracket | Male | Female |
| Under 5 Years | 0 (0.0%) | 0 (0.0%) |
| 5 to 17 Years | 0 (0.0%) | 0 (0.0%) |
| 18 to 34 Years | 0 (0.0%) | 0 (0.0%) |
| 35 to 64 Years | 64 (6.6%) | 0 (0.0%) |
| 65 to 74 Years | 0 (0.0%) | 0 (0.0%) |
| 75 Years and over | 15 (10.1%) | 0 (0.0%) |
Disability Class: Cognitive Difficulty
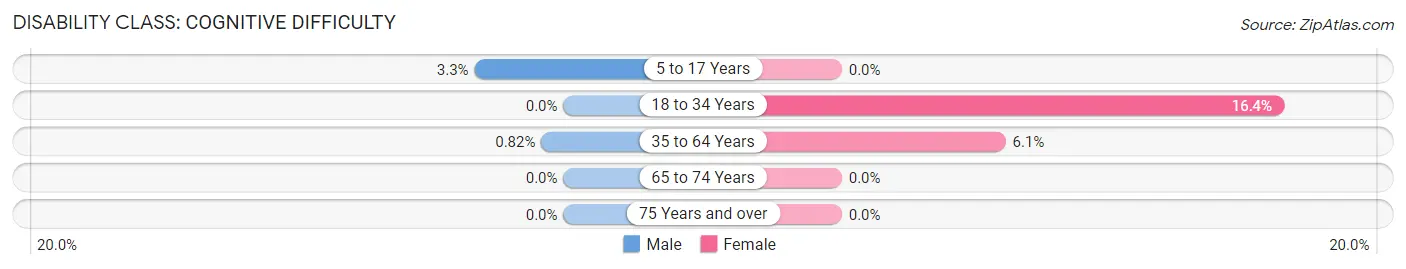
| Age Bracket | Male | Female |
| 5 to 17 Years | 16 (3.3%) | 0 (0.0%) |
| 18 to 34 Years | 0 (0.0%) | 75 (16.4%) |
| 35 to 64 Years | 8 (0.8%) | 71 (6.1%) |
| 65 to 74 Years | 0 (0.0%) | 0 (0.0%) |
| 75 Years and over | 0 (0.0%) | 0 (0.0%) |
Disability Class: Ambulatory Difficulty
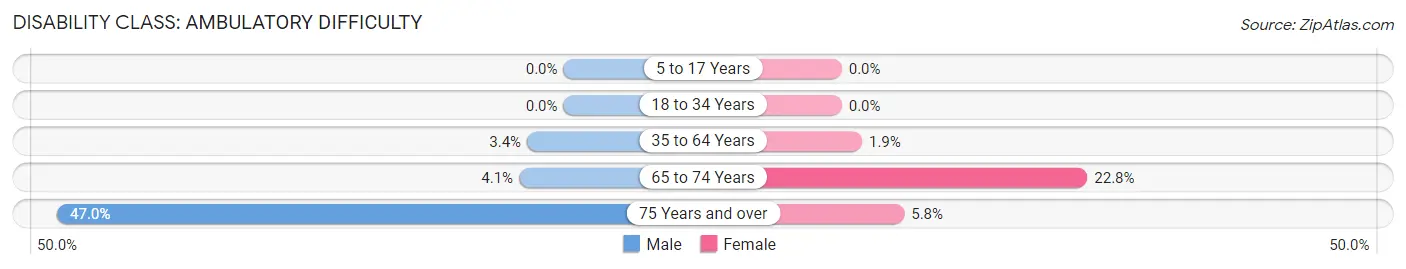
| Age Bracket | Male | Female |
| 5 to 17 Years | 0 (0.0%) | 0 (0.0%) |
| 18 to 34 Years | 0 (0.0%) | 0 (0.0%) |
| 35 to 64 Years | 33 (3.4%) | 22 (1.9%) |
| 65 to 74 Years | 8 (4.1%) | 62 (22.8%) |
| 75 Years and over | 70 (47.0%) | 12 (5.8%) |
Disability Class: Self-Care Difficulty
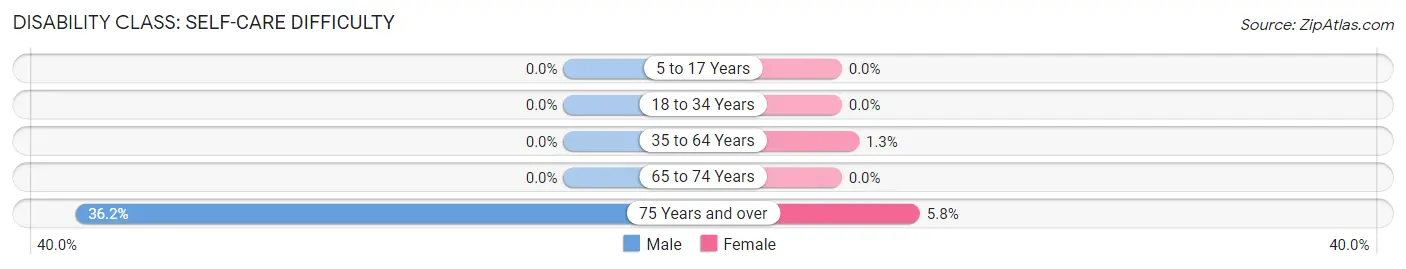
| Age Bracket | Male | Female |
| 5 to 17 Years | 0 (0.0%) | 0 (0.0%) |
| 18 to 34 Years | 0 (0.0%) | 0 (0.0%) |
| 35 to 64 Years | 0 (0.0%) | 15 (1.3%) |
| 65 to 74 Years | 0 (0.0%) | 0 (0.0%) |
| 75 Years and over | 54 (36.2%) | 12 (5.8%) |
Technology Access in Willow Park
Computing Device Access in Willow Park
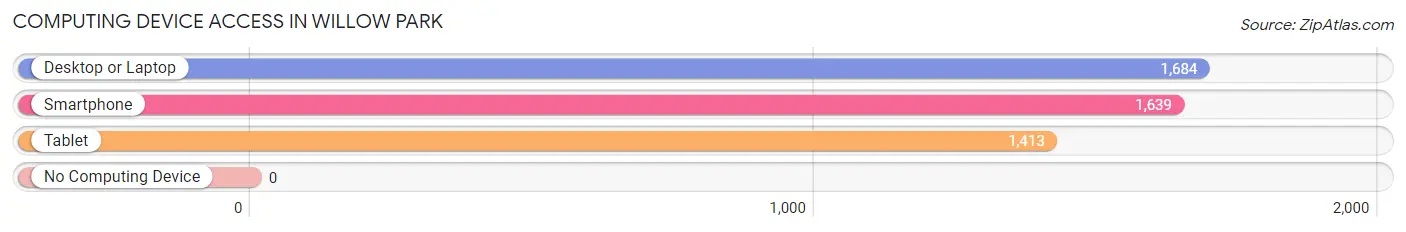
| Device Type | # Households | % Households |
| Desktop or Laptop | 1,684 | 98.3% |
| Smartphone | 1,639 | 95.6% |
| Tablet | 1,413 | 82.4% |
| No Computing Device | 0 | 0.0% |
| Total | 1,714 | 100.0% |
Internet Access in Willow Park
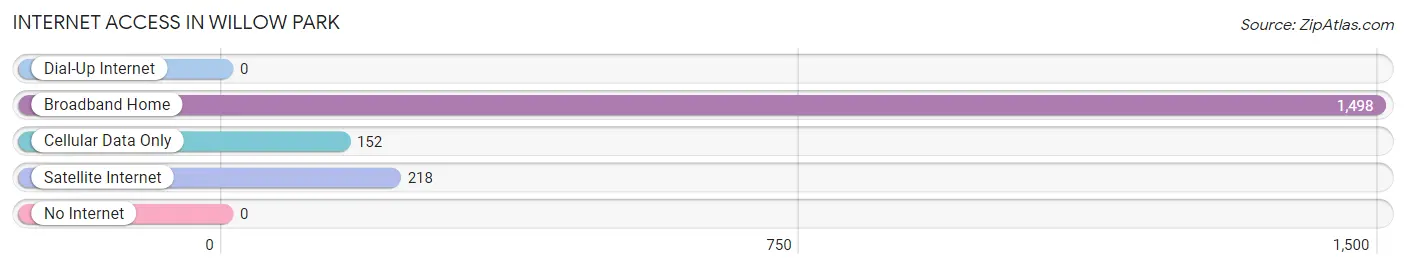
| Internet Type | # Households | % Households |
| Dial-Up Internet | 0 | 0.0% |
| Broadband Home | 1,498 | 87.4% |
| Cellular Data Only | 152 | 8.9% |
| Satellite Internet | 218 | 12.7% |
| No Internet | 0 | 0.0% |
| Total | 1,714 | 100.0% |
Willow Park Summary
Willow Park is a small city located in Parker County, Texas, United States. It is part of the Dallas-Fort Worth-Arlington metropolitan area. The population was 2,711 at the 2010 census.
History
Willow Park was founded in 1876 by a group of settlers from Missouri. The town was named after the willow trees that grew along the banks of the nearby Trinity River. The town was originally a farming community, but in the early 1900s, the town began to grow as a result of the oil boom in the area. By the mid-1900s, Willow Park had become a popular tourist destination, with many people coming to the area to enjoy the natural beauty of the area.
Geography
Willow Park is located at 32°45'25" North, 97°45'45" West (32.756944, -97.762500). It is situated in the eastern part of Parker County, about 20 miles west of Fort Worth. The city has a total area of 2.2 square miles, all of which is land.
Economy
Willow Park's economy is largely based on the oil and gas industry. The city is home to several oil and gas companies, including Chevron, ExxonMobil, and Shell. In addition, the city is home to several manufacturing companies, including a plastics plant and a metal fabrication plant. The city also has a number of retail stores, restaurants, and other businesses.
Demographics
As of the 2010 census, there were 2,711 people, 990 households, and 745 families residing in the city. The population density was 1,225.2 people per square mile. The racial makeup of the city was 92.2% White, 0.7% African American, 0.3% Native American, 0.7% Asian, 0.1% Pacific Islander, 4.2% from other races, and 1.9% from two or more races. Hispanic or Latino of any race were 8.3% of the population.
The median income for a household in the city was $50,938, and the median income for a family was $60,000. Males had a median income of $41,250 versus $30,000 for females. The per capita income for the city was $22,945. About 4.2% of families and 5.7% of the population were below the poverty line, including 6.3% of those under age 18 and 4.2% of those age 65 or over.
Conclusion
Willow Park is a small city located in Parker County, Texas, United States. It is part of the Dallas-Fort Worth-Arlington metropolitan area. The city has a long history, dating back to 1876 when it was founded by a group of settlers from Missouri. The city's economy is largely based on the oil and gas industry, as well as manufacturing and retail. As of the 2010 census, the population of Willow Park was 2,711. The median income for a household in the city was $50,938, and the median income for a family was $60,000.
Common Questions
What is Per Capita Income in Willow Park?
Per Capita income in Willow Park is $42,604.
What is the Median Family Income in Willow Park?
Median Family Income in Willow Park is $115,145.
What is the Median Household income in Willow Park?
Median Household Income in Willow Park is $104,931.
What is Income or Wage Gap in Willow Park?
Income or Wage Gap in Willow Park is 51.3%.
Women in Willow Park earn 48.7 cents for every dollar earned by a man.
What is Inequality or Gini Index in Willow Park?
Inequality or Gini Index in Willow Park is 0.39.
What is the Total Population of Willow Park?
Total Population of Willow Park is 5,055.
What is the Total Male Population of Willow Park?
Total Male Population of Willow Park is 2,137.
What is the Total Female Population of Willow Park?
Total Female Population of Willow Park is 2,918.
What is the Ratio of Males per 100 Females in Willow Park?
There are 73.24 Males per 100 Females in Willow Park.
What is the Ratio of Females per 100 Males in Willow Park?
There are 136.55 Females per 100 Males in Willow Park.
What is the Median Population Age in Willow Park?
Median Population Age in Willow Park is 40.9 Years.
What is the Average Family Size in Willow Park
Average Family Size in Willow Park is 3.3 People.
What is the Average Household Size in Willow Park
Average Household Size in Willow Park is 2.9 People.
How Large is the Labor Force in Willow Park?
There are 2,434 People in the Labor Forcein in Willow Park.
What is the Percentage of People in the Labor Force in Willow Park?
64.7% of People are in the Labor Force in Willow Park.
What is the Unemployment Rate in Willow Park?
Unemployment Rate in Willow Park is 3.4%.