La Villita, NM Map & Demographics
La Villita Map
La Villita Overview
$34,750
PER CAPITA INCOME
$87,170
AVG FAMILY INCOME
$99,127
AVG HOUSEHOLD INCOME
48.3%
WAGE / INCOME GAP [ % ]
51.7¢/ $1
WAGE / INCOME GAP [ $ ]
0.22
INEQUALITY / GINI INDEX
1,504
TOTAL POPULATION
756
MALE POPULATION
748
FEMALE POPULATION
101.07
MALES / 100 FEMALES
98.94
FEMALES / 100 MALES
42.6
MEDIAN AGE
3.9
AVG FAMILY SIZE
4.1
AVG HOUSEHOLD SIZE
805
LABOR FORCE [ PEOPLE ]
66.5%
PERCENT IN LABOR FORCE
Income in La Villita
Income Overview in La Villita
Per Capita Income in La Villita is $34,750, while median incomes of families and households are $87,170 and $99,127 respectively.
| Characteristic | Number | Measure |
| Per Capita Income | 1,504 | $34,750 |
| Median Family Income | 342 | $87,170 |
| Mean Family Income | 342 | $107,555 |
| Median Household Income | 365 | $99,127 |
| Mean Household Income | 365 | $106,173 |
| Income Deficit | 342 | $0 |
| Wage / Income Gap (%) | 1,504 | 48.26% |
| Wage / Income Gap ($) | 1,504 | 51.74¢ per $1 |
| Gini / Inequality Index | 1,504 | 0.22 |
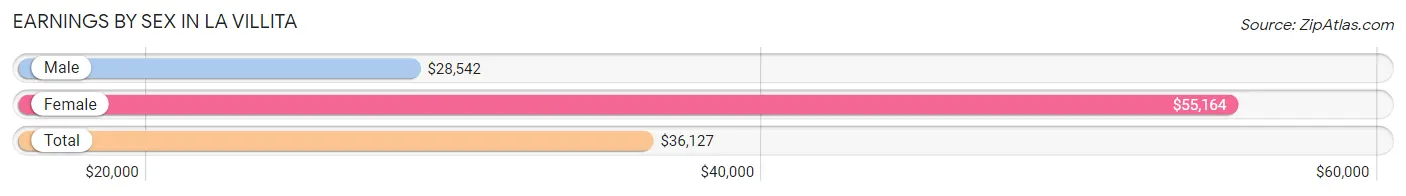
Earnings by Sex in La Villita
Average Earnings in La Villita are $36,127, $28,542 for men and $55,164 for women, a difference of 48.3%.
| Sex | Number | Average Earnings |
| Male | 149 (17.5%) | $28,542 |
| Female | 701 (82.5%) | $55,164 |
| Total | 850 (100.0%) | $36,127 |
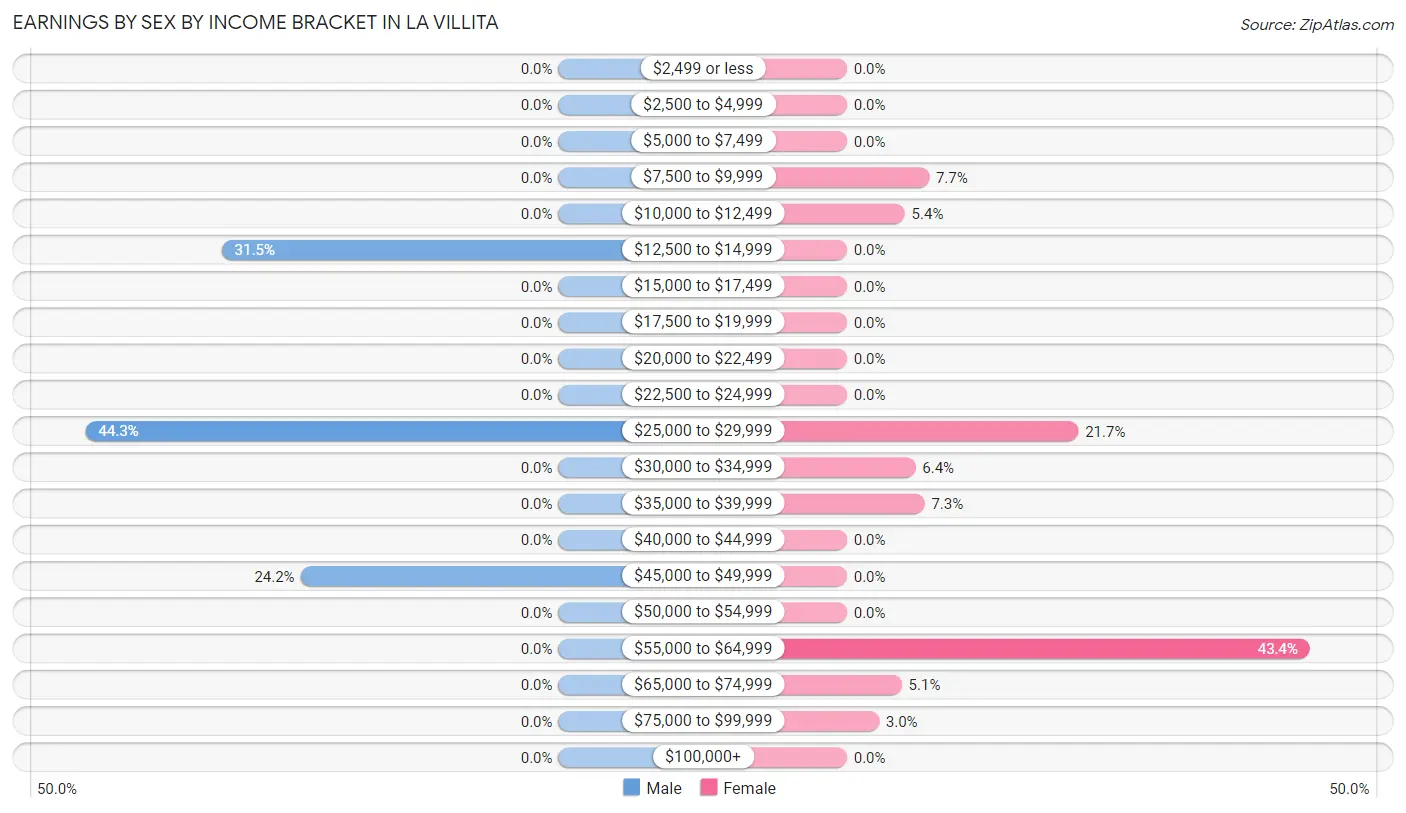
Earnings by Sex by Income Bracket in La Villita
The most common earnings brackets in La Villita are $25,000 to $29,999 for men (66 | 44.3%) and $55,000 to $64,999 for women (304 | 43.4%).
| Income | Male | Female |
| $2,499 or less | 0 (0.0%) | 0 (0.0%) |
| $2,500 to $4,999 | 0 (0.0%) | 0 (0.0%) |
| $5,000 to $7,499 | 0 (0.0%) | 0 (0.0%) |
| $7,500 to $9,999 | 0 (0.0%) | 54 (7.7%) |
| $10,000 to $12,499 | 0 (0.0%) | 38 (5.4%) |
| $12,500 to $14,999 | 47 (31.5%) | 0 (0.0%) |
| $15,000 to $17,499 | 0 (0.0%) | 0 (0.0%) |
| $17,500 to $19,999 | 0 (0.0%) | 0 (0.0%) |
| $20,000 to $22,499 | 0 (0.0%) | 0 (0.0%) |
| $22,500 to $24,999 | 0 (0.0%) | 0 (0.0%) |
| $25,000 to $29,999 | 66 (44.3%) | 152 (21.7%) |
| $30,000 to $34,999 | 0 (0.0%) | 45 (6.4%) |
| $35,000 to $39,999 | 0 (0.0%) | 51 (7.3%) |
| $40,000 to $44,999 | 0 (0.0%) | 0 (0.0%) |
| $45,000 to $49,999 | 36 (24.2%) | 0 (0.0%) |
| $50,000 to $54,999 | 0 (0.0%) | 0 (0.0%) |
| $55,000 to $64,999 | 0 (0.0%) | 304 (43.4%) |
| $65,000 to $74,999 | 0 (0.0%) | 36 (5.1%) |
| $75,000 to $99,999 | 0 (0.0%) | 21 (3.0%) |
| $100,000+ | 0 (0.0%) | 0 (0.0%) |
| Total | 149 (100.0%) | 701 (100.0%) |
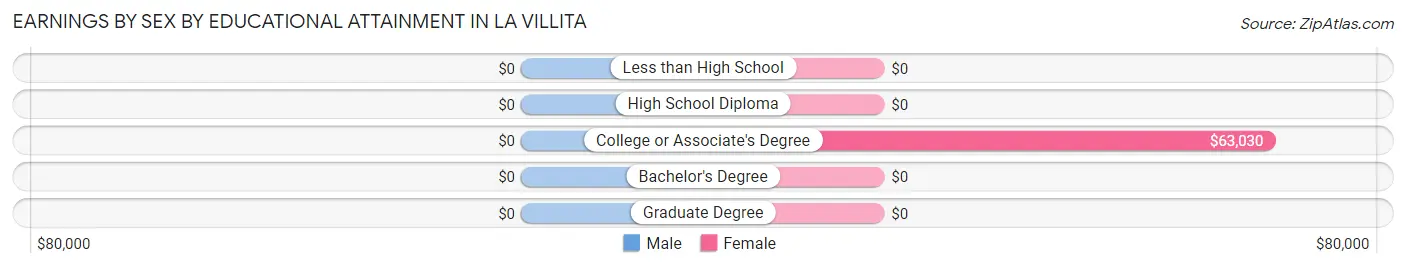
Earnings by Sex by Educational Attainment in La Villita
| Educational Attainment | Male Income | Female Income |
| Less than High School | - | - |
| High School Diploma | - | - |
| College or Associate's Degree | - | - |
| Bachelor's Degree | - | - |
| Graduate Degree | - | - |
| Total | $28,542 | $55,883 |
Family Income in La Villita
Family Income Brackets in La Villita
According to the La Villita family income data, there are 125 families falling into the $50,000 to $74,999 income range, which is the most common income bracket and makes up 36.5% of all families.
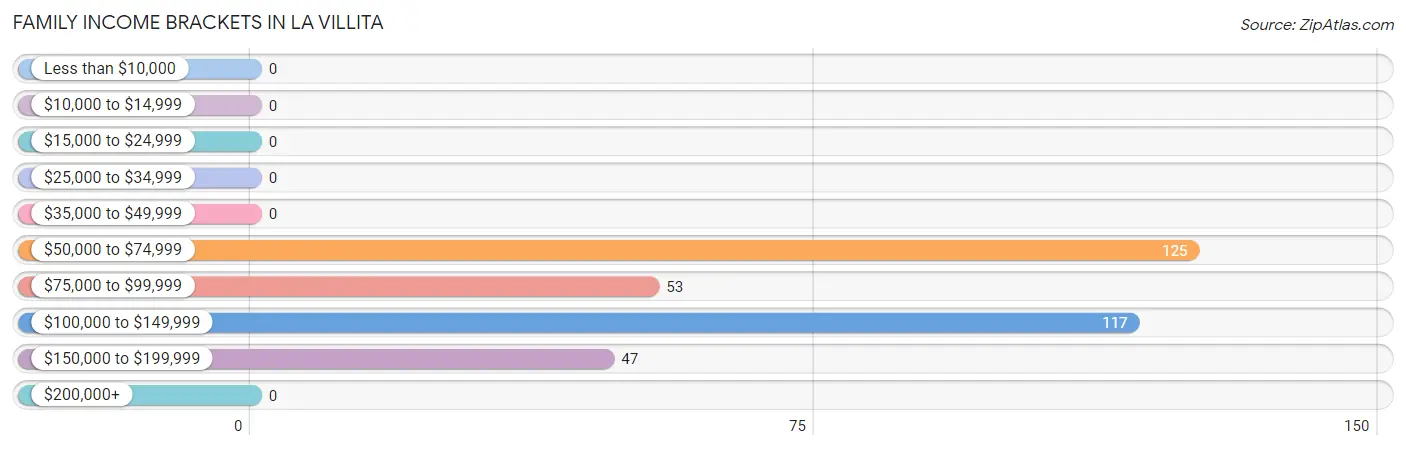
| Income Bracket | # Families | % Families |
| Less than $10,000 | 0 | 0.0% |
| $10,000 to $14,999 | 0 | 0.0% |
| $15,000 to $24,999 | 0 | 0.0% |
| $25,000 to $34,999 | 0 | 0.0% |
| $35,000 to $49,999 | 0 | 0.0% |
| $50,000 to $74,999 | 125 | 36.5% |
| $75,000 to $99,999 | 53 | 15.5% |
| $100,000 to $149,999 | 117 | 34.2% |
| $150,000 to $199,999 | 47 | 13.7% |
| $200,000+ | 0 | 0.0% |
Family Income by Famaliy Size in La Villita
3-person families (214 | 62.6%) account for the highest median family income in La Villita with $74,318 per family, while 3-person families (214 | 62.6%) have the highest median income of $24,773 per family member.
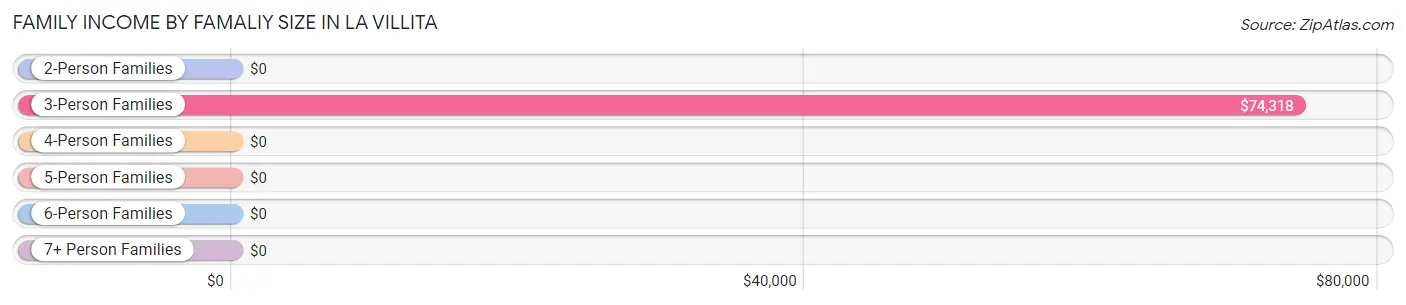
| Income Bracket | # Families | Median Income |
| 2-Person Families | 81 (23.7%) | $0 |
| 3-Person Families | 214 (62.6%) | $74,318 |
| 4-Person Families | 0 (0.0%) | $0 |
| 5-Person Families | 47 (13.7%) | $0 |
| 6-Person Families | 0 (0.0%) | $0 |
| 7+ Person Families | 0 (0.0%) | $0 |
| Total | 342 (100.0%) | $87,170 |
Family Income by Number of Earners in La Villita
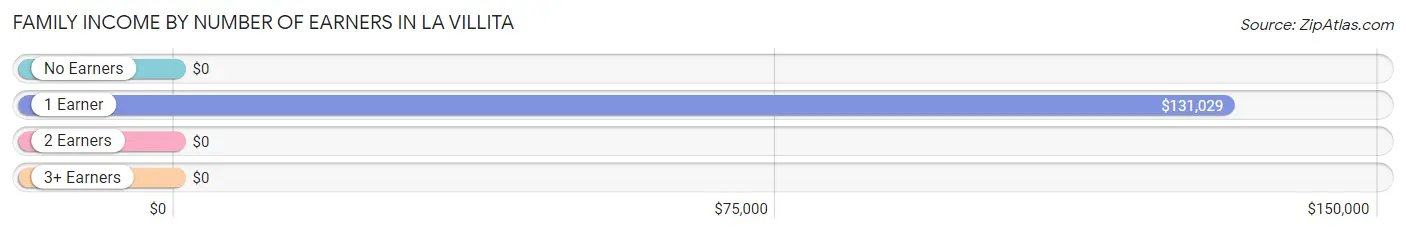
| Number of Earners | # Families | Median Income |
| No Earners | 0 (0.0%) | $0 |
| 1 Earner | 134 (39.2%) | $131,029 |
| 2 Earners | 106 (31.0%) | $0 |
| 3+ Earners | 102 (29.8%) | $0 |
| Total | 342 (100.0%) | $87,170 |
Household Income in La Villita
Household Income Brackets in La Villita
With 148 households falling in the category, the $50,000 to $74,999 income range is the most frequent in La Villita, accounting for 40.6% of all households.
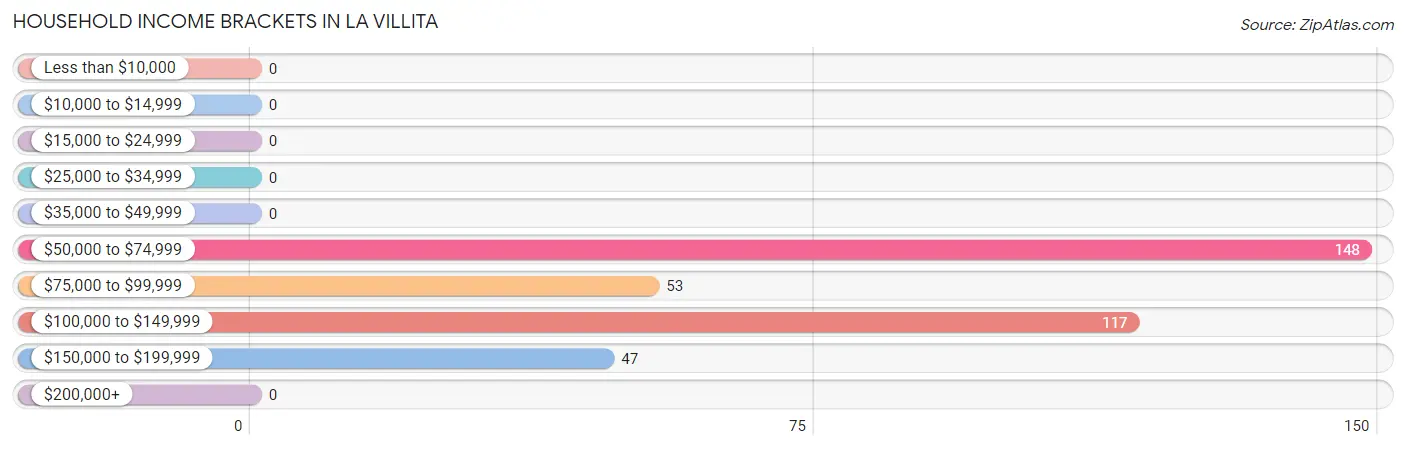
| Income Bracket | # Households | % Households |
| Less than $10,000 | 0 | 0.0% |
| $10,000 to $14,999 | 0 | 0.0% |
| $15,000 to $24,999 | 0 | 0.0% |
| $25,000 to $34,999 | 0 | 0.0% |
| $35,000 to $49,999 | 0 | 0.0% |
| $50,000 to $74,999 | 148 | 40.5% |
| $75,000 to $99,999 | 53 | 14.5% |
| $100,000 to $149,999 | 117 | 32.1% |
| $150,000 to $199,999 | 47 | 12.9% |
| $200,000+ | 0 | 0.0% |
Household Income by Householder Age in La Villita
The median household income in La Villita is $99,127, with the highest median household income of $130,551 found in the 45 to 64 years age bracket for the primary householder. A total of 147 households (40.3%) fall into this category.
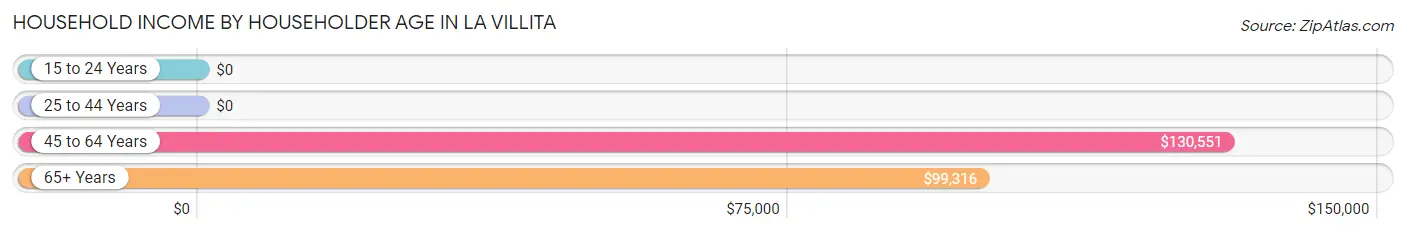
| Income Bracket | # Households | Median Income |
| 15 to 24 Years | 0 (0.0%) | $0 |
| 25 to 44 Years | 95 (26.0%) | $0 |
| 45 to 64 Years | 147 (40.3%) | $130,551 |
| 65+ Years | 123 (33.7%) | $99,316 |
| Total | 365 (100.0%) | $99,127 |
Poverty in La Villita
Income Below Poverty by Sex and Age in La Villita
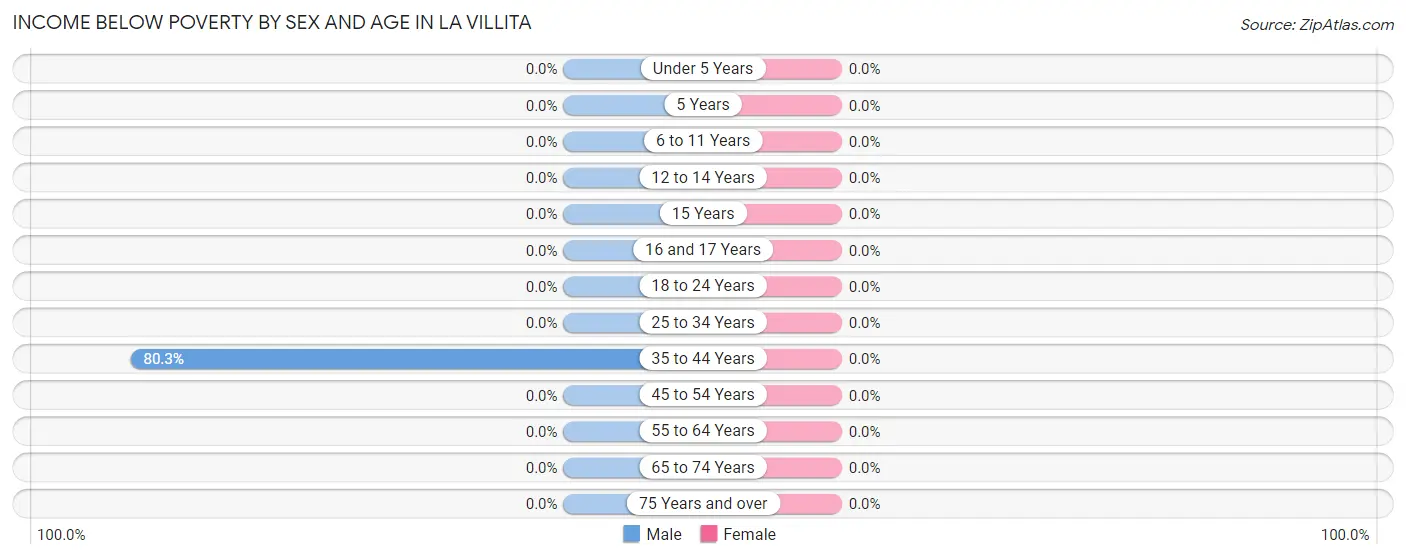
| Age Bracket | Male | Female |
| Under 5 Years | 0 (0.0%) | 0 (0.0%) |
| 5 Years | 0 (0.0%) | 0 (0.0%) |
| 6 to 11 Years | 0 (0.0%) | 0 (0.0%) |
| 12 to 14 Years | 0 (0.0%) | 0 (0.0%) |
| 15 Years | 0 (0.0%) | 0 (0.0%) |
| 16 and 17 Years | 0 (0.0%) | 0 (0.0%) |
| 18 to 24 Years | 0 (0.0%) | 0 (0.0%) |
| 25 to 34 Years | 0 (0.0%) | 0 (0.0%) |
| 35 to 44 Years | 147 (80.3%) | 0 (0.0%) |
| 45 to 54 Years | 0 (0.0%) | 0 (0.0%) |
| 55 to 64 Years | 0 (0.0%) | 0 (0.0%) |
| 65 to 74 Years | 0 (0.0%) | 0 (0.0%) |
| 75 Years and over | 0 (0.0%) | 0 (0.0%) |
| Total | 147 (19.4%) | 0 (0.0%) |
Income Above Poverty by Sex and Age in La Villita
According to the poverty statistics in La Villita, males aged 5 years and females aged 16 and 17 years are the age groups that are most secure financially, with 100.0% of males and 100.0% of females in these age groups living above the poverty line.
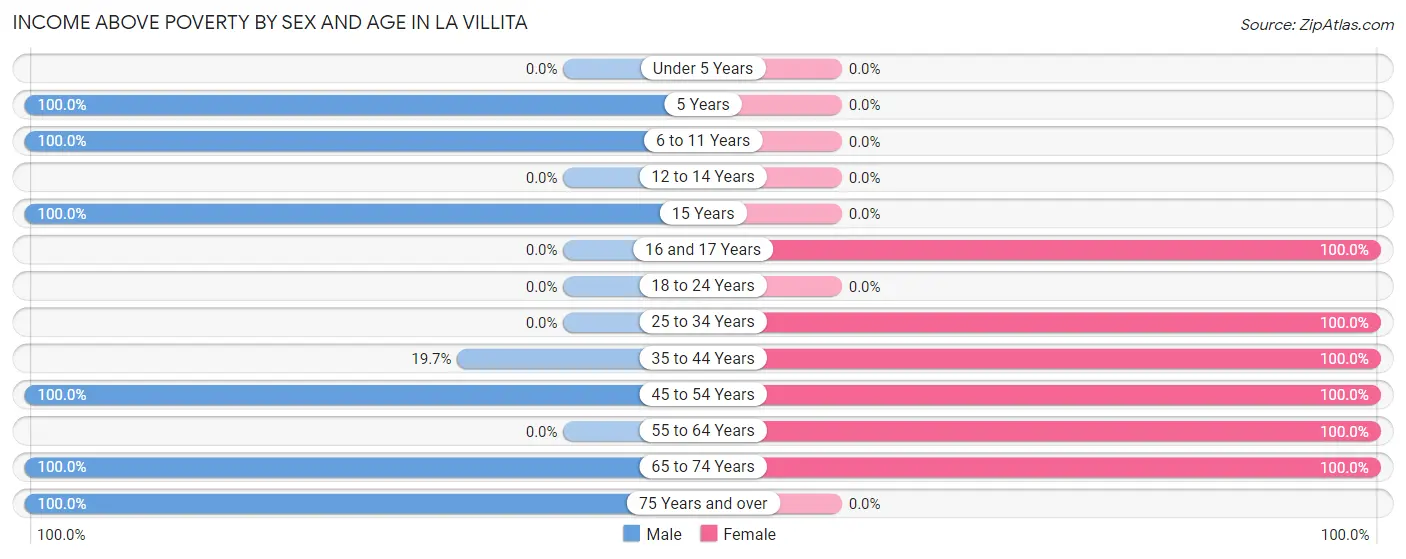
| Age Bracket | Male | Female |
| Under 5 Years | 0 (0.0%) | 0 (0.0%) |
| 5 Years | 76 (100.0%) | 0 (0.0%) |
| 6 to 11 Years | 158 (100.0%) | 0 (0.0%) |
| 12 to 14 Years | 0 (0.0%) | 0 (0.0%) |
| 15 Years | 59 (100.0%) | 0 (0.0%) |
| 16 and 17 Years | 0 (0.0%) | 92 (100.0%) |
| 18 to 24 Years | 0 (0.0%) | 0 (0.0%) |
| 25 to 34 Years | 0 (0.0%) | 93 (100.0%) |
| 35 to 44 Years | 36 (19.7%) | 290 (100.0%) |
| 45 to 54 Years | 100 (100.0%) | 181 (100.0%) |
| 55 to 64 Years | 0 (0.0%) | 47 (100.0%) |
| 65 to 74 Years | 123 (100.0%) | 45 (100.0%) |
| 75 Years and over | 57 (100.0%) | 0 (0.0%) |
| Total | 609 (80.6%) | 748 (100.0%) |
Income Below Poverty Among Married-Couple Families in La Villita
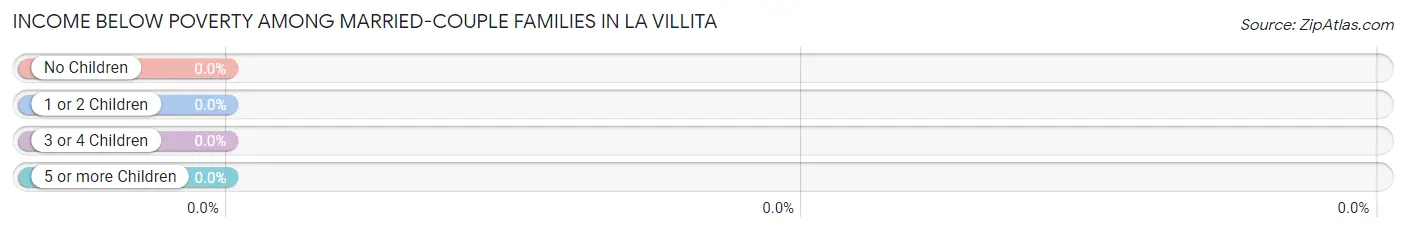
| Children | Above Poverty | Below Poverty |
| No Children | 81 (100.0%) | 0 (0.0%) |
| 1 or 2 Children | 149 (100.0%) | 0 (0.0%) |
| 3 or 4 Children | 0 (0.0%) | 0 (0.0%) |
| 5 or more Children | 0 (0.0%) | 0 (0.0%) |
| Total | 230 (100.0%) | 0 (0.0%) |
Income Below Poverty Among Single-Parent Households in La Villita
| Children | Single Father | Single Mother |
| No Children | 0 (0.0%) | 0 (0.0%) |
| 1 or 2 Children | 0 (0.0%) | 0 (0.0%) |
| 3 or 4 Children | 0 (0.0%) | 0 (0.0%) |
| 5 or more Children | 0 (0.0%) | 0 (0.0%) |
| Total | 0 (0.0%) | 0 (0.0%) |
Income Below Poverty Among Married-Couple vs Single-Parent Households in La Villita
| Children | Married-Couple Families | Single-Parent Households |
| No Children | 0 (0.0%) | 0 (0.0%) |
| 1 or 2 Children | 0 (0.0%) | 0 (0.0%) |
| 3 or 4 Children | 0 (0.0%) | 0 (0.0%) |
| 5 or more Children | 0 (0.0%) | 0 (0.0%) |
| Total | 0 (0.0%) | 0 (0.0%) |
Race in La Villita
The most populous races in La Villita are Hispanic or Latino (1,392 | 92.5%), Two or more Races (757 | 50.3%), and Some other Race (612 | 40.7%).
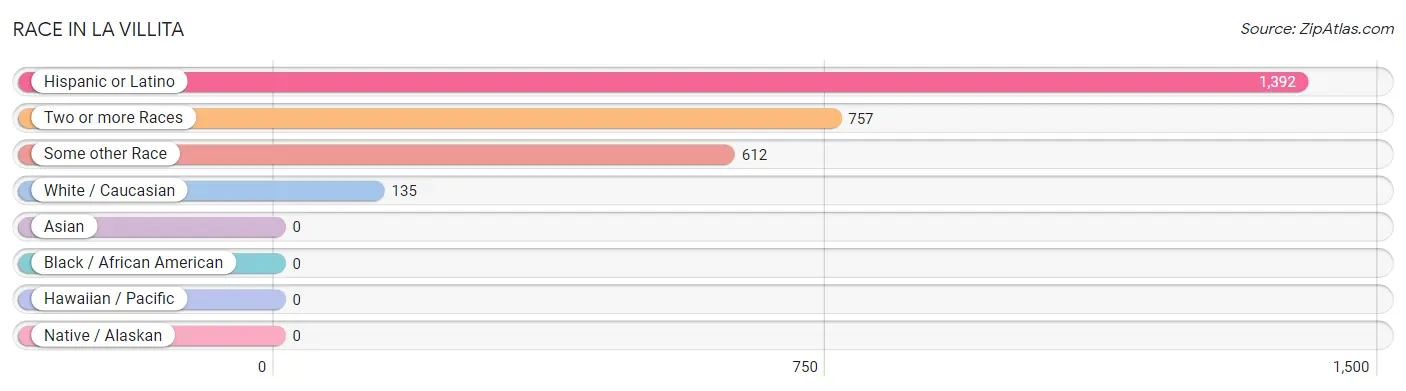
| Race | # Population | % Population |
| Asian | 0 | 0.0% |
| Black / African American | 0 | 0.0% |
| Hawaiian / Pacific | 0 | 0.0% |
| Hispanic or Latino | 1,392 | 92.5% |
| Native / Alaskan | 0 | 0.0% |
| White / Caucasian | 135 | 9.0% |
| Two or more Races | 757 | 50.3% |
| Some other Race | 612 | 40.7% |
| Total | 1,504 | 100.0% |
Ancestry in La Villita
The most populous ancestries reported in La Villita are Spaniard (612 | 40.7%), Spanish (436 | 29.0%), Spanish American (229 | 15.2%), Scottish (57 | 3.8%), and Irish (45 | 3.0%), together accounting for 91.7% of all La Villita residents.
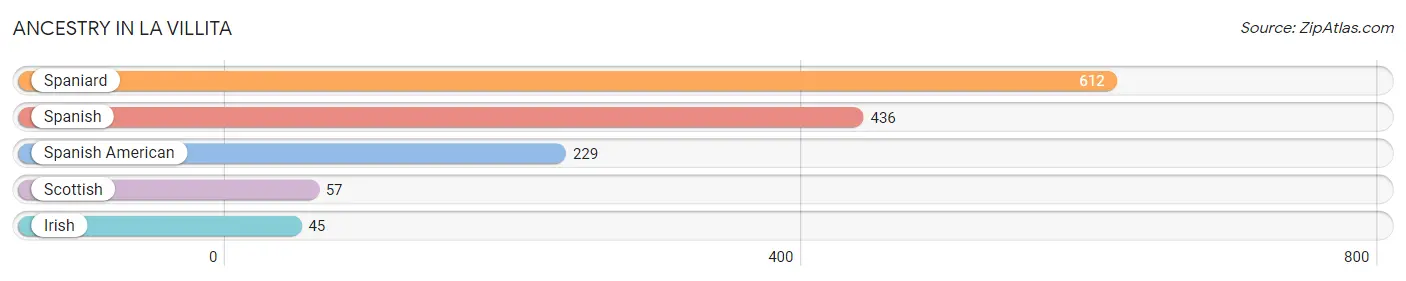
| Ancestry | # Population | % Population |
| Irish | 45 | 3.0% |
| Scottish | 57 | 3.8% |
| Spaniard | 612 | 40.7% |
| Spanish | 436 | 29.0% |
| Spanish American | 229 | 15.2% | View All 5 Rows |
Immigrants in La Villita

| Immigration Origin | # Population | % Population | View All 0 Rows |
Sex and Age in La Villita
Sex and Age in La Villita
The most populous age groups in La Villita are 40 to 44 Years (183 | 24.2%) for men and 40 to 44 Years (290 | 38.8%) for women.
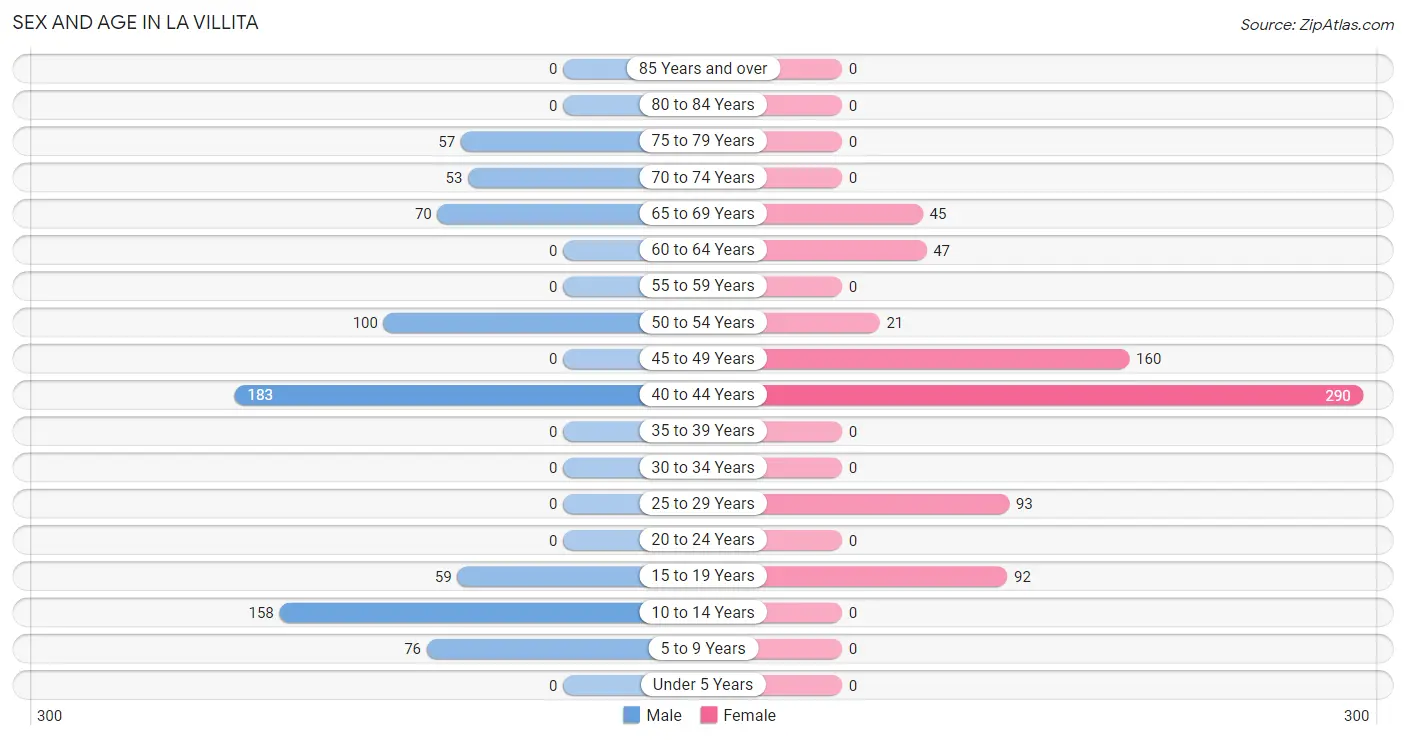
| Age Bracket | Male | Female |
| Under 5 Years | 0 (0.0%) | 0 (0.0%) |
| 5 to 9 Years | 76 (10.1%) | 0 (0.0%) |
| 10 to 14 Years | 158 (20.9%) | 0 (0.0%) |
| 15 to 19 Years | 59 (7.8%) | 92 (12.3%) |
| 20 to 24 Years | 0 (0.0%) | 0 (0.0%) |
| 25 to 29 Years | 0 (0.0%) | 93 (12.4%) |
| 30 to 34 Years | 0 (0.0%) | 0 (0.0%) |
| 35 to 39 Years | 0 (0.0%) | 0 (0.0%) |
| 40 to 44 Years | 183 (24.2%) | 290 (38.8%) |
| 45 to 49 Years | 0 (0.0%) | 160 (21.4%) |
| 50 to 54 Years | 100 (13.2%) | 21 (2.8%) |
| 55 to 59 Years | 0 (0.0%) | 0 (0.0%) |
| 60 to 64 Years | 0 (0.0%) | 47 (6.3%) |
| 65 to 69 Years | 70 (9.3%) | 45 (6.0%) |
| 70 to 74 Years | 53 (7.0%) | 0 (0.0%) |
| 75 to 79 Years | 57 (7.5%) | 0 (0.0%) |
| 80 to 84 Years | 0 (0.0%) | 0 (0.0%) |
| 85 Years and over | 0 (0.0%) | 0 (0.0%) |
| Total | 756 (100.0%) | 748 (100.0%) |
Families and Households in La Villita
Median Family Size in La Villita
The median family size in La Villita is 3.90 persons per family, with single male/father families (53 | 15.5%) accounting for the largest median family size of 5.55 persons per family. On the other hand, married-couple families (230 | 67.2%) represent the smallest median family size with 3.53 persons per family.
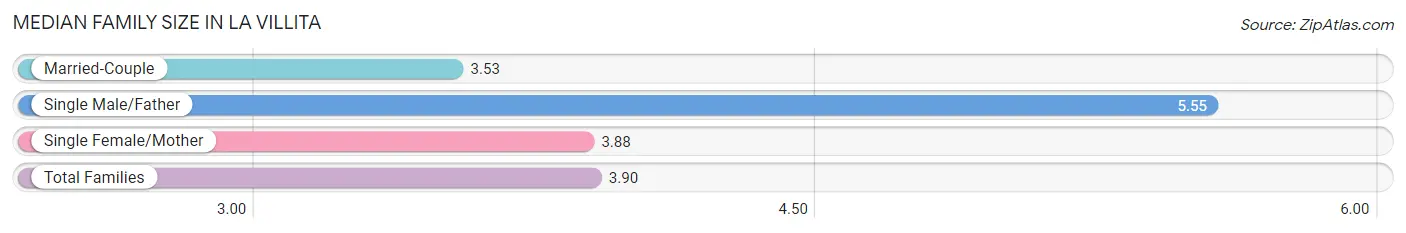
| Family Type | # Families | Family Size |
| Married-Couple | 230 (67.2%) | 3.53 |
| Single Male/Father | 53 (15.5%) | 5.55 |
| Single Female/Mother | 59 (17.2%) | 3.88 |
| Total Families | 342 (100.0%) | 3.90 |
Median Household Size in La Villita
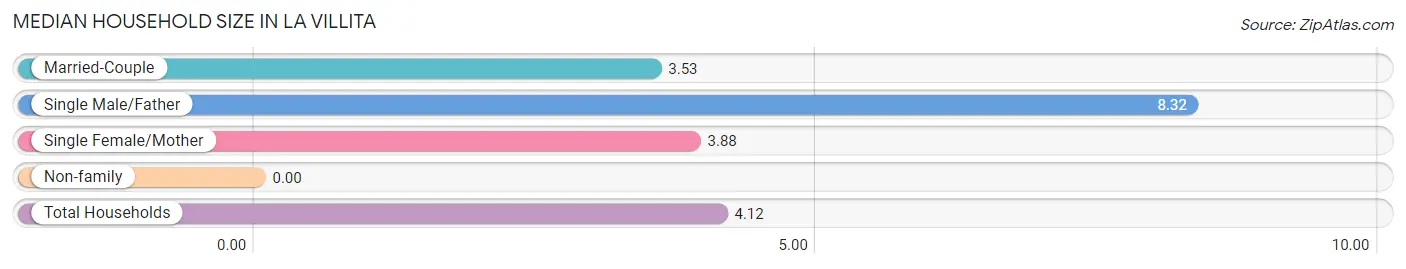
| Household Type | # Households | Household Size |
| Married-Couple | 230 (63.0%) | 3.53 |
| Single Male/Father | 53 (14.5%) | 8.32 |
| Single Female/Mother | 59 (16.2%) | 3.88 |
| Non-family | 23 (6.3%) | - |
| Total Households | 365 (100.0%) | 4.12 |
Household Size by Marriage Status in La Villita
Out of a total of 365 households in La Villita, 342 (93.7%) are family households, while 23 (6.3%) are nonfamily households. The most numerous type of family households are 3-person households, comprising 161, and the most common type of nonfamily households are 1-person households, comprising 23.
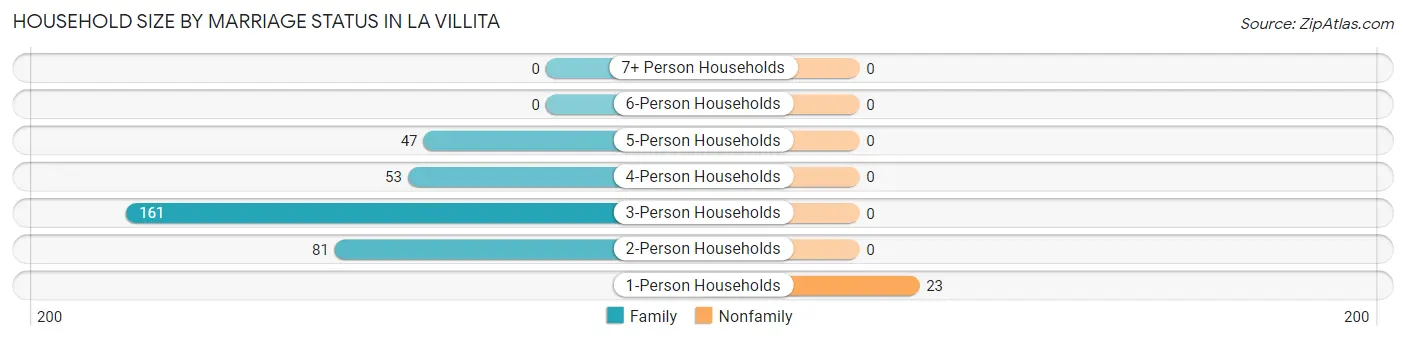
| Household Size | Family Households | Nonfamily Households |
| 1-Person Households | - | 23 (6.3%) |
| 2-Person Households | 81 (22.2%) | 0 (0.0%) |
| 3-Person Households | 161 (44.1%) | 0 (0.0%) |
| 4-Person Households | 53 (14.5%) | 0 (0.0%) |
| 5-Person Households | 47 (12.9%) | 0 (0.0%) |
| 6-Person Households | 0 (0.0%) | 0 (0.0%) |
| 7+ Person Households | 0 (0.0%) | 0 (0.0%) |
| Total | 342 (93.7%) | 23 (6.3%) |
Female Fertility in La Villita
Fertility by Age in La Villita
| Age Bracket | Women with Births | Births / 1,000 Women |
| 15 to 19 years | 0 (0.0%) | 0.0 |
| 20 to 34 years | 0 (0.0%) | 0.0 |
| 35 to 50 years | 0 (0.0%) | 0.0 |
| Total | 0 (0.0%) | 0.0 |
Fertility by Age by Marriage Status in La Villita
| Age Bracket | Married | Unmarried |
| 15 to 19 years | 0 (0.0%) | 0 (0.0%) |
| 20 to 34 years | 0 (0.0%) | 0 (0.0%) |
| 35 to 50 years | 0 (0.0%) | 0 (0.0%) |
| Total | 0 (0.0%) | 0 (0.0%) |
Fertility by Education in La Villita
| Educational Attainment | Women with Births | Births / 1,000 Women |
| Less than High School | 0 (0.0%) | 0.0 |
| High School Diploma | 0 (0.0%) | 0.0 |
| College or Associate's Degree | 0 (0.0%) | 0.0 |
| Bachelor's Degree | 0 (0.0%) | 0.0 |
| Graduate Degree | 0 (0.0%) | 0.0 |
| Total | 0 (0.0%) | 0.0 |
Fertility by Education by Marriage Status in La Villita
| Educational Attainment | Married | Unmarried |
| Less than High School | 0 (0.0%) | 0 (0.0%) |
| High School Diploma | 0 (0.0%) | 0 (0.0%) |
| College or Associate's Degree | 0 (0.0%) | 0 (0.0%) |
| Bachelor's Degree | 0 (0.0%) | 0 (0.0%) |
| Graduate Degree | 0 (0.0%) | 0 (0.0%) |
| Total | 0 (0.0%) | 0 (0.0%) |
Employment Characteristics in La Villita
Employment by Class of Employer in La Villita
Among the 805 employed individuals in La Villita, private company employees (300 | 37.3%), local government employees (218 | 27.1%), and state government employees (181 | 22.5%) make up the most common classes of employment.
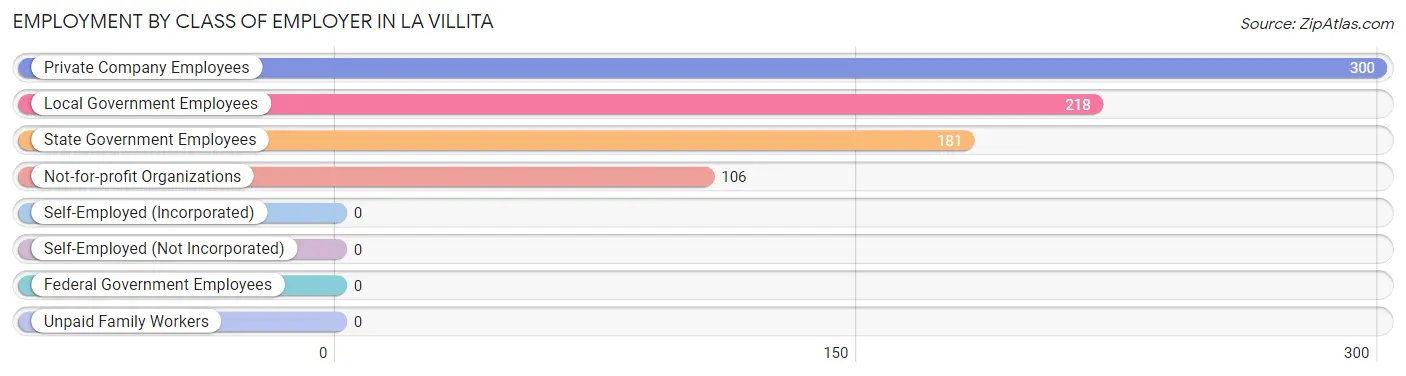
| Employer Class | # Employees | % Employees |
| Private Company Employees | 300 | 37.3% |
| Self-Employed (Incorporated) | 0 | 0.0% |
| Self-Employed (Not Incorporated) | 0 | 0.0% |
| Not-for-profit Organizations | 106 | 13.2% |
| Local Government Employees | 218 | 27.1% |
| State Government Employees | 181 | 22.5% |
| Federal Government Employees | 0 | 0.0% |
| Unpaid Family Workers | 0 | 0.0% |
| Total | 805 | 100.0% |
Employment Status by Age in La Villita
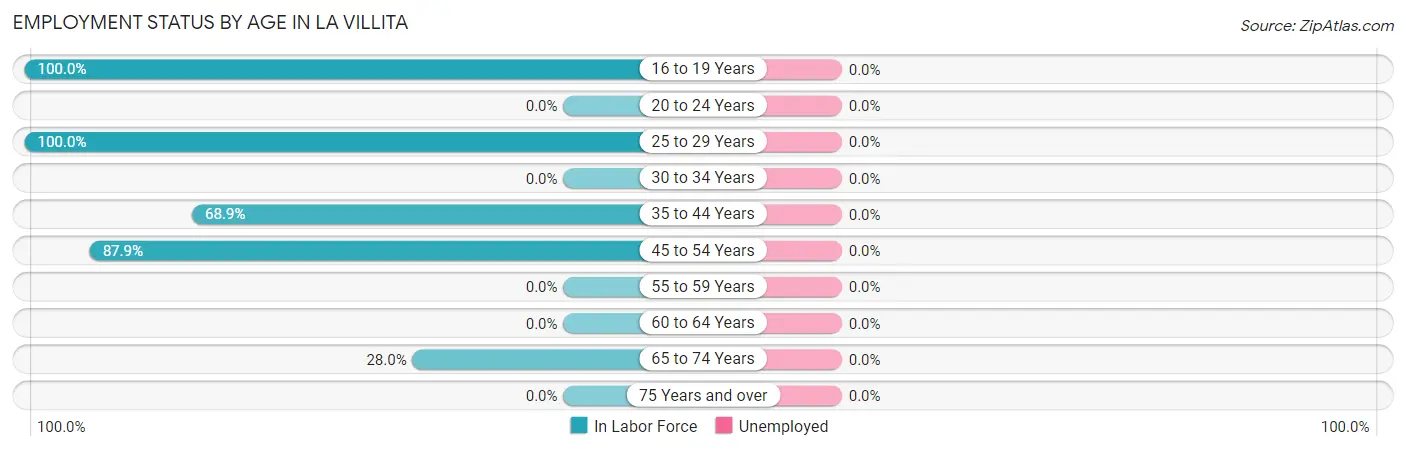
| Age Bracket | In Labor Force | Unemployed |
| 16 to 19 Years | 92 (100.0%) | 0 (0.0%) |
| 20 to 24 Years | 0 (0.0%) | 0 (0.0%) |
| 25 to 29 Years | 93 (100.0%) | 0 (0.0%) |
| 30 to 34 Years | 0 (0.0%) | 0 (0.0%) |
| 35 to 44 Years | 326 (68.9%) | 0 (0.0%) |
| 45 to 54 Years | 247 (87.9%) | 0 (0.0%) |
| 55 to 59 Years | 0 (0.0%) | 0 (0.0%) |
| 60 to 64 Years | 0 (0.0%) | 0 (0.0%) |
| 65 to 74 Years | 47 (28.0%) | 0 (0.0%) |
| 75 Years and over | 0 (0.0%) | 0 (0.0%) |
| Total | 805 (66.5%) | 0 (0.0%) |
Employment Status by Educational Attainment in La Villita
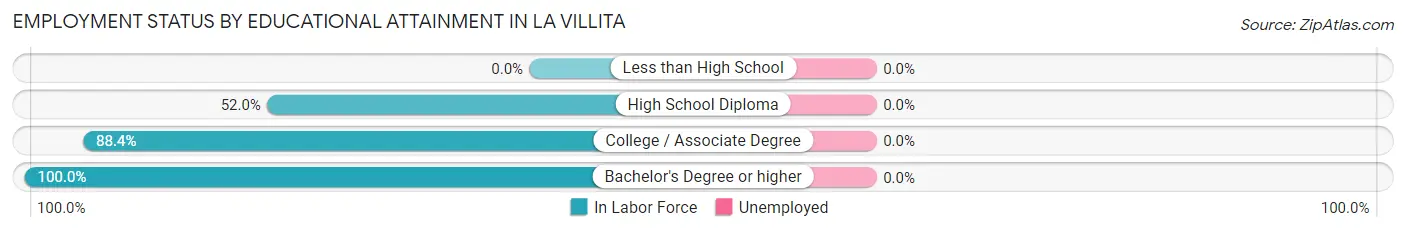
| Educational Attainment | In Labor Force | Unemployed |
| Less than High School | 0 (0.0%) | 0 (0.0%) |
| High School Diploma | 210 (52.0%) | 0 (0.0%) |
| College / Associate Degree | 260 (88.4%) | 0 (0.0%) |
| Bachelor's Degree or higher | 196 (100.0%) | 0 (0.0%) |
| Total | 666 (74.5%) | 0 (0.0%) |
Employment Occupations by Sex in La Villita
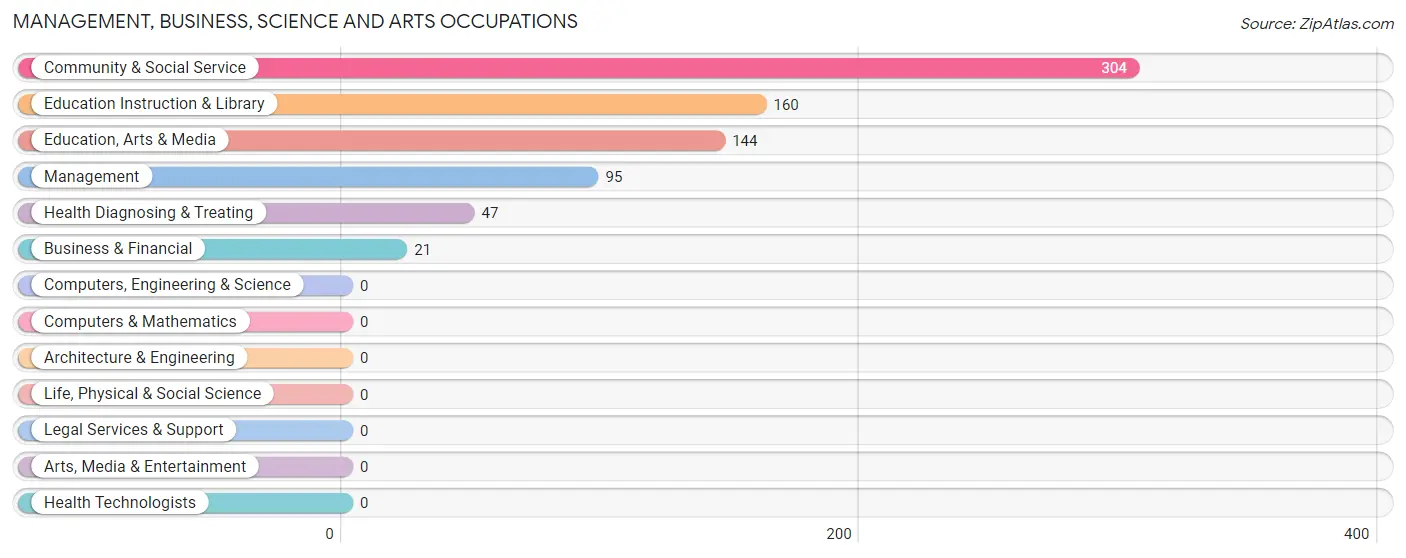
Management, Business, Science and Arts Occupations
The most common Management, Business, Science and Arts occupations in La Villita are Community & Social Service (304 | 37.8%), Education Instruction & Library (160 | 19.9%), Education, Arts & Media (144 | 17.9%), Management (95 | 11.8%), and Health Diagnosing & Treating (47 | 5.8%).
Management, Business, Science and Arts Occupations by Sex
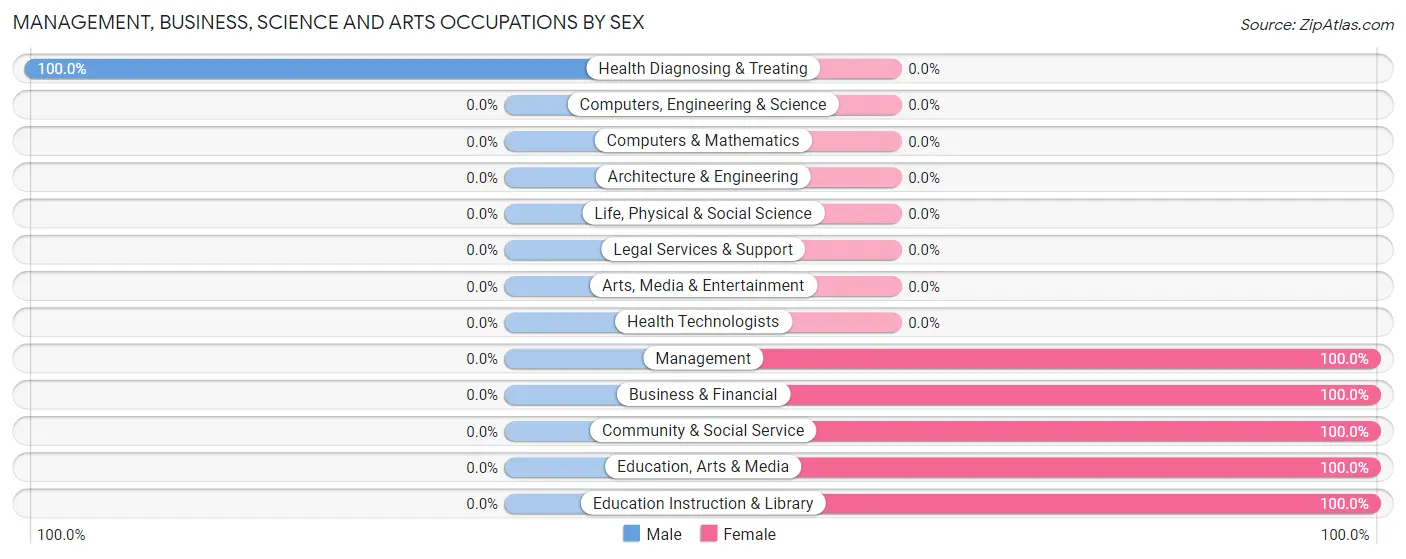
| Occupation | Male | Female |
| Management | 0 (0.0%) | 95 (100.0%) |
| Business & Financial | 0 (0.0%) | 21 (100.0%) |
| Computers, Engineering & Science | 0 (0.0%) | 0 (0.0%) |
| Computers & Mathematics | 0 (0.0%) | 0 (0.0%) |
| Architecture & Engineering | 0 (0.0%) | 0 (0.0%) |
| Life, Physical & Social Science | 0 (0.0%) | 0 (0.0%) |
| Community & Social Service | 0 (0.0%) | 304 (100.0%) |
| Education, Arts & Media | 0 (0.0%) | 144 (100.0%) |
| Legal Services & Support | 0 (0.0%) | 0 (0.0%) |
| Education Instruction & Library | 0 (0.0%) | 160 (100.0%) |
| Arts, Media & Entertainment | 0 (0.0%) | 0 (0.0%) |
| Health Diagnosing & Treating | 47 (100.0%) | 0 (0.0%) |
| Health Technologists | 0 (0.0%) | 0 (0.0%) |
| Total (Category) | 47 (10.1%) | 420 (89.9%) |
| Total (Overall) | 149 (18.5%) | 656 (81.5%) |
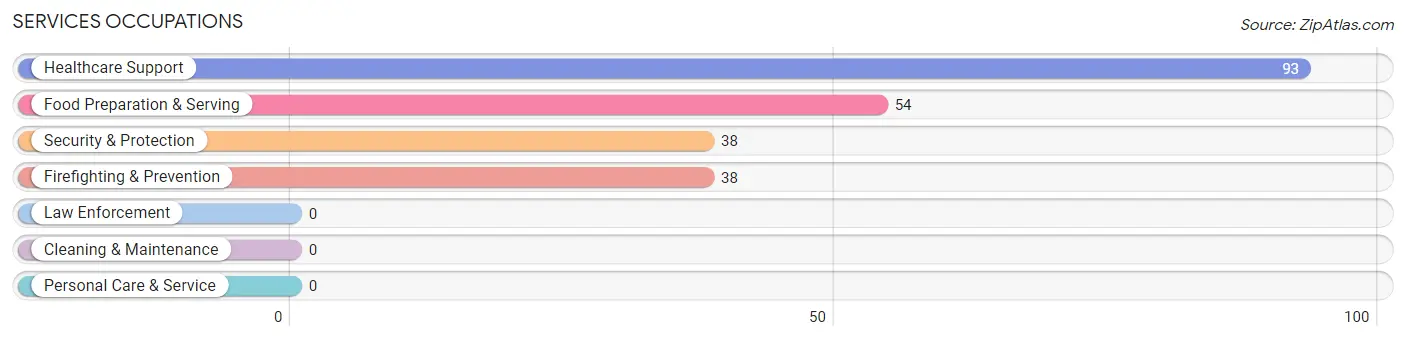
Services Occupations
The most common Services occupations in La Villita are Healthcare Support (93 | 11.6%), Food Preparation & Serving (54 | 6.7%), Security & Protection (38 | 4.7%), and Firefighting & Prevention (38 | 4.7%).
Services Occupations by Sex
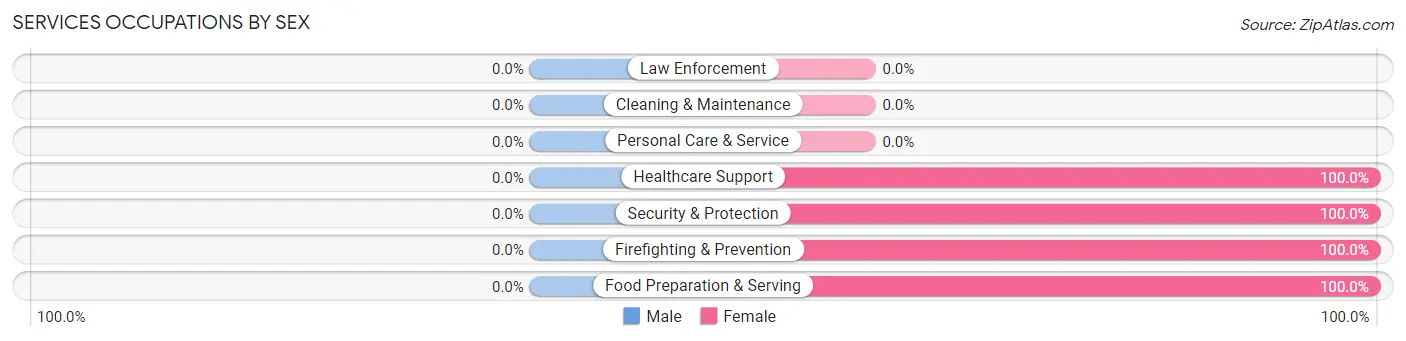
| Occupation | Male | Female |
| Healthcare Support | 0 (0.0%) | 93 (100.0%) |
| Security & Protection | 0 (0.0%) | 38 (100.0%) |
| Firefighting & Prevention | 0 (0.0%) | 38 (100.0%) |
| Law Enforcement | 0 (0.0%) | 0 (0.0%) |
| Food Preparation & Serving | 0 (0.0%) | 54 (100.0%) |
| Cleaning & Maintenance | 0 (0.0%) | 0 (0.0%) |
| Personal Care & Service | 0 (0.0%) | 0 (0.0%) |
| Total (Category) | 0 (0.0%) | 185 (100.0%) |
| Total (Overall) | 149 (18.5%) | 656 (81.5%) |
Sales and Office Occupations
The most common Sales and Office occupations in La Villita are , and Office & Administration (51 | 6.3%).

Sales and Office Occupations by Sex

| Occupation | Male | Female |
| Sales & Related | 0 (0.0%) | 0 (0.0%) |
| Office & Administration | 0 (0.0%) | 51 (100.0%) |
| Total (Category) | 0 (0.0%) | 51 (100.0%) |
| Total (Overall) | 149 (18.5%) | 656 (81.5%) |
Natural Resources, Construction and Maintenance Occupations
The most common Natural Resources, Construction and Maintenance occupations in La Villita are , and Installation, Maintenance & Repair (66 | 8.2%).
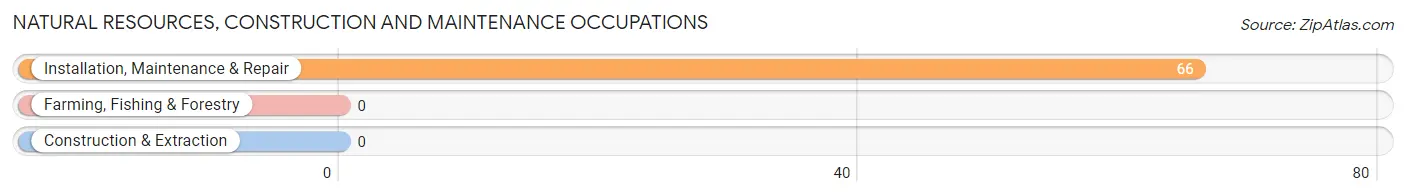
Natural Resources, Construction and Maintenance Occupations by Sex
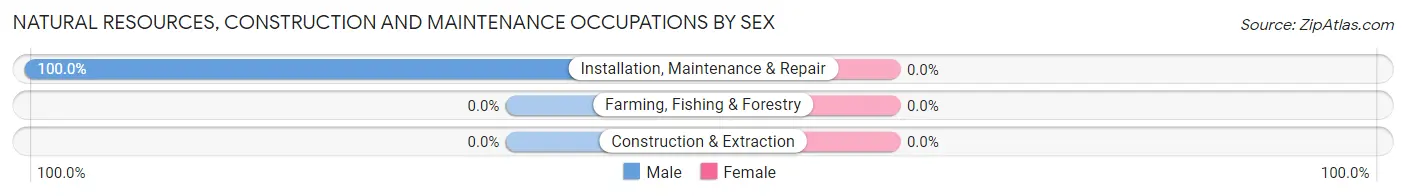
| Occupation | Male | Female |
| Farming, Fishing & Forestry | 0 (0.0%) | 0 (0.0%) |
| Construction & Extraction | 0 (0.0%) | 0 (0.0%) |
| Installation, Maintenance & Repair | 66 (100.0%) | 0 (0.0%) |
| Total (Category) | 66 (100.0%) | 0 (0.0%) |
| Total (Overall) | 149 (18.5%) | 656 (81.5%) |
Production, Transportation and Moving Occupations
The most common Production, Transportation and Moving occupations in La Villita are , and Production (36 | 4.5%).
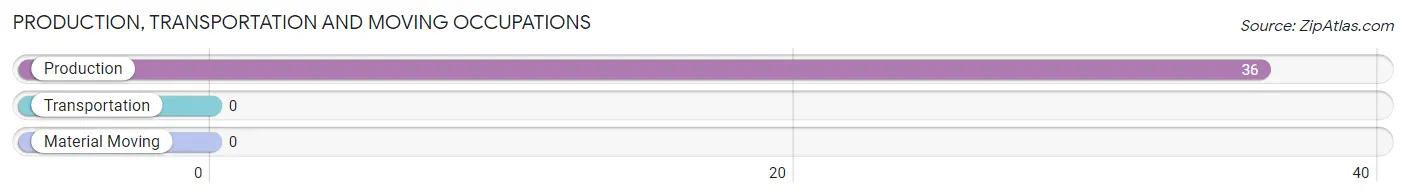
Production, Transportation and Moving Occupations by Sex
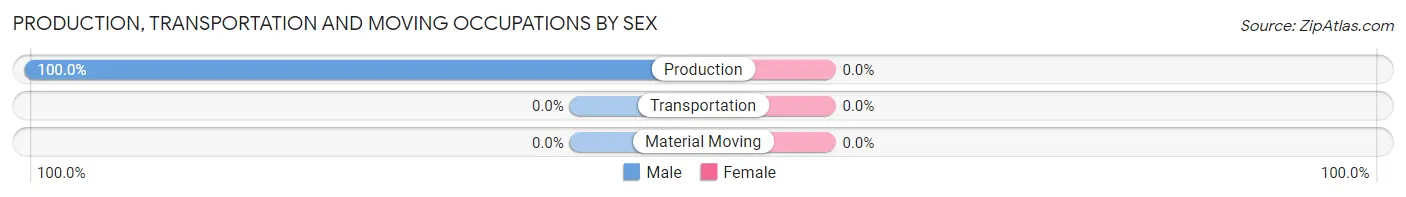
| Occupation | Male | Female |
| Production | 36 (100.0%) | 0 (0.0%) |
| Transportation | 0 (0.0%) | 0 (0.0%) |
| Material Moving | 0 (0.0%) | 0 (0.0%) |
| Total (Category) | 36 (100.0%) | 0 (0.0%) |
| Total (Overall) | 149 (18.5%) | 656 (81.5%) |
Employment Industries by Sex in La Villita
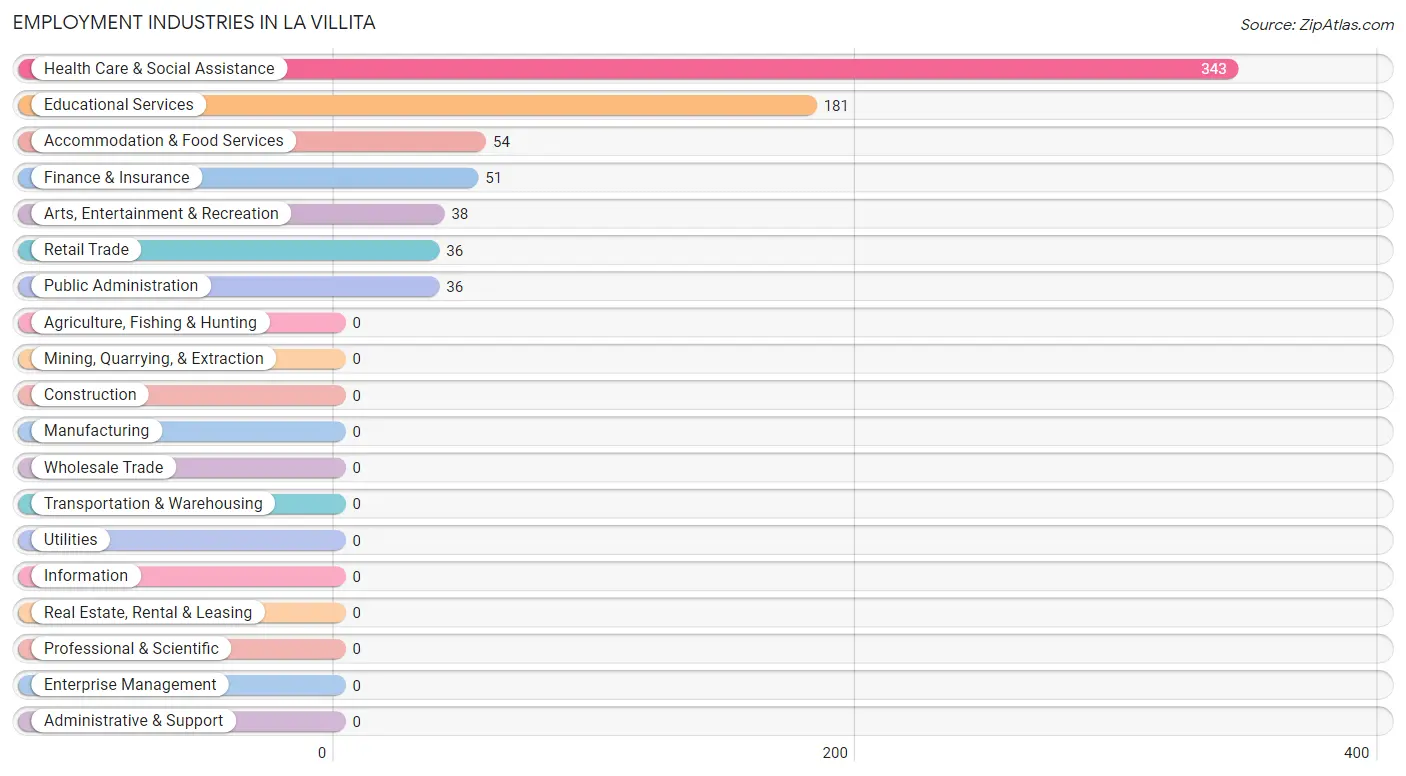
Employment Industries in La Villita
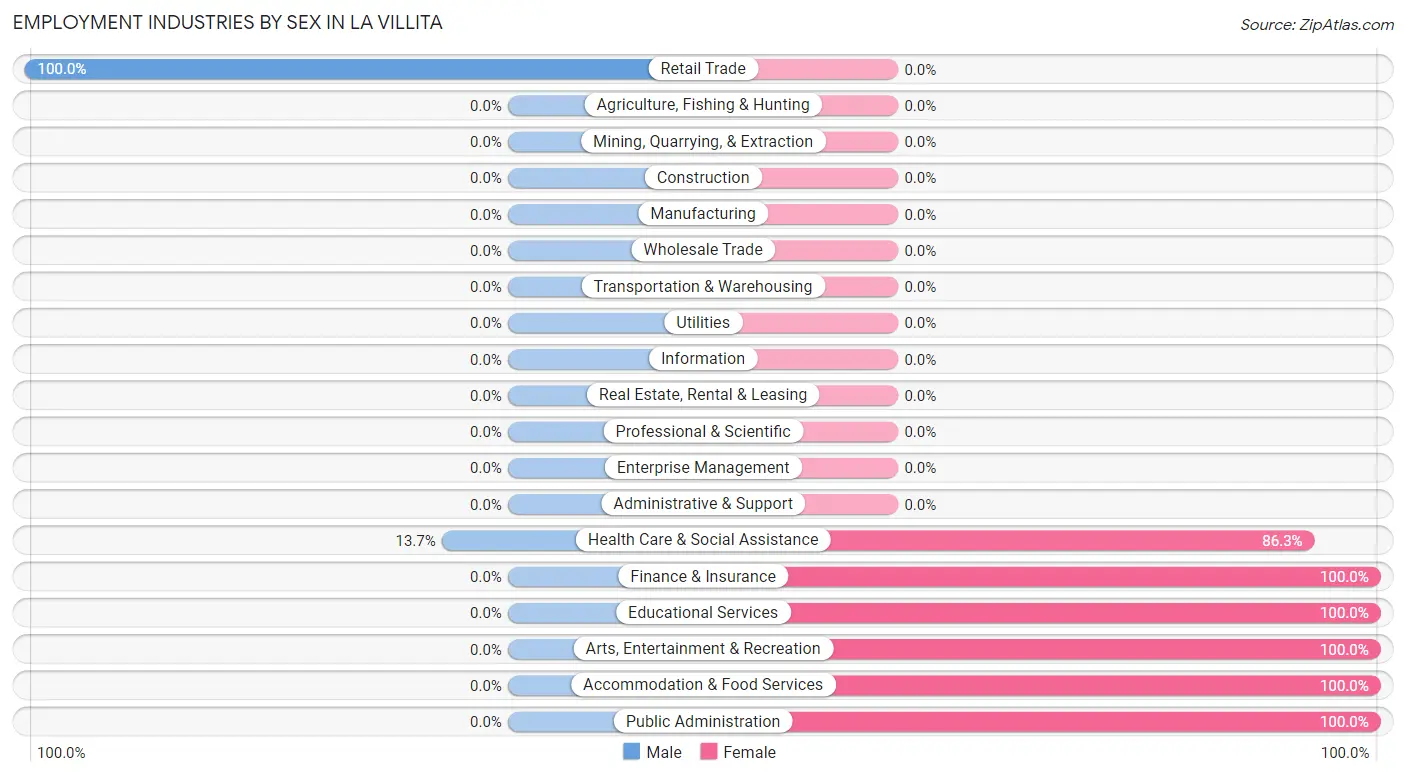
The major employment industries in La Villita include Health Care & Social Assistance (343 | 42.6%), Educational Services (181 | 22.5%), Accommodation & Food Services (54 | 6.7%), Finance & Insurance (51 | 6.3%), and Arts, Entertainment & Recreation (38 | 4.7%).
Employment Industries by Sex in La Villita
The La Villita industries that see more men than women are Retail Trade (100.0%), and Health Care & Social Assistance (13.7%), whereas the industries that tend to have a higher number of women are Finance & Insurance (100.0%), Educational Services (100.0%), and Arts, Entertainment & Recreation (100.0%).
| Industry | Male | Female |
| Agriculture, Fishing & Hunting | 0 (0.0%) | 0 (0.0%) |
| Mining, Quarrying, & Extraction | 0 (0.0%) | 0 (0.0%) |
| Construction | 0 (0.0%) | 0 (0.0%) |
| Manufacturing | 0 (0.0%) | 0 (0.0%) |
| Wholesale Trade | 0 (0.0%) | 0 (0.0%) |
| Retail Trade | 36 (100.0%) | 0 (0.0%) |
| Transportation & Warehousing | 0 (0.0%) | 0 (0.0%) |
| Utilities | 0 (0.0%) | 0 (0.0%) |
| Information | 0 (0.0%) | 0 (0.0%) |
| Finance & Insurance | 0 (0.0%) | 51 (100.0%) |
| Real Estate, Rental & Leasing | 0 (0.0%) | 0 (0.0%) |
| Professional & Scientific | 0 (0.0%) | 0 (0.0%) |
| Enterprise Management | 0 (0.0%) | 0 (0.0%) |
| Administrative & Support | 0 (0.0%) | 0 (0.0%) |
| Educational Services | 0 (0.0%) | 181 (100.0%) |
| Health Care & Social Assistance | 47 (13.7%) | 296 (86.3%) |
| Arts, Entertainment & Recreation | 0 (0.0%) | 38 (100.0%) |
| Accommodation & Food Services | 0 (0.0%) | 54 (100.0%) |
| Public Administration | 0 (0.0%) | 36 (100.0%) |
| Total | 149 (18.5%) | 656 (81.5%) |
Education in La Villita
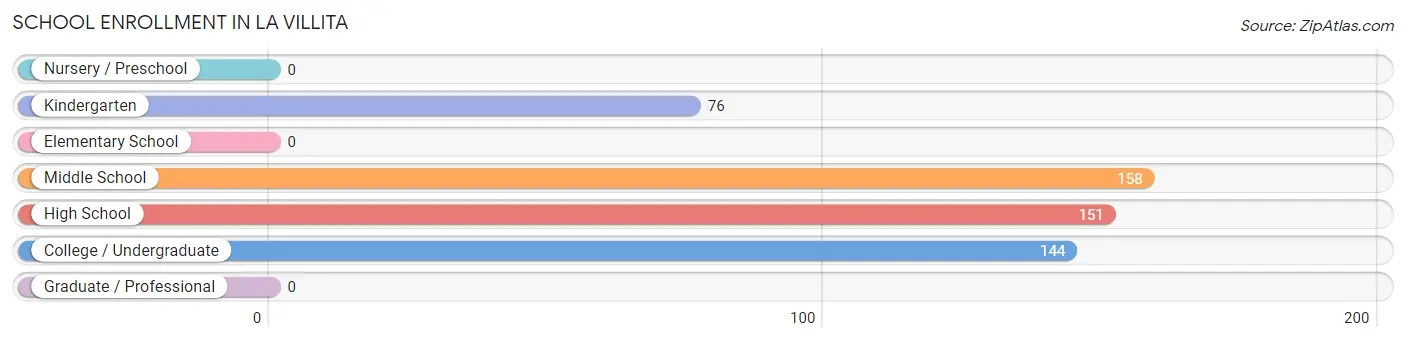
School Enrollment in La Villita
The most common levels of schooling among the 529 students in La Villita are middle school (158 | 29.9%), high school (151 | 28.5%), and college / undergraduate (144 | 27.2%).
| School Level | # Students | % Students |
| Nursery / Preschool | 0 | 0.0% |
| Kindergarten | 76 | 14.4% |
| Elementary School | 0 | 0.0% |
| Middle School | 158 | 29.9% |
| High School | 151 | 28.5% |
| College / Undergraduate | 144 | 27.2% |
| Graduate / Professional | 0 | 0.0% |
| Total | 529 | 100.0% |
School Enrollment by Age by Funding Source in La Villita
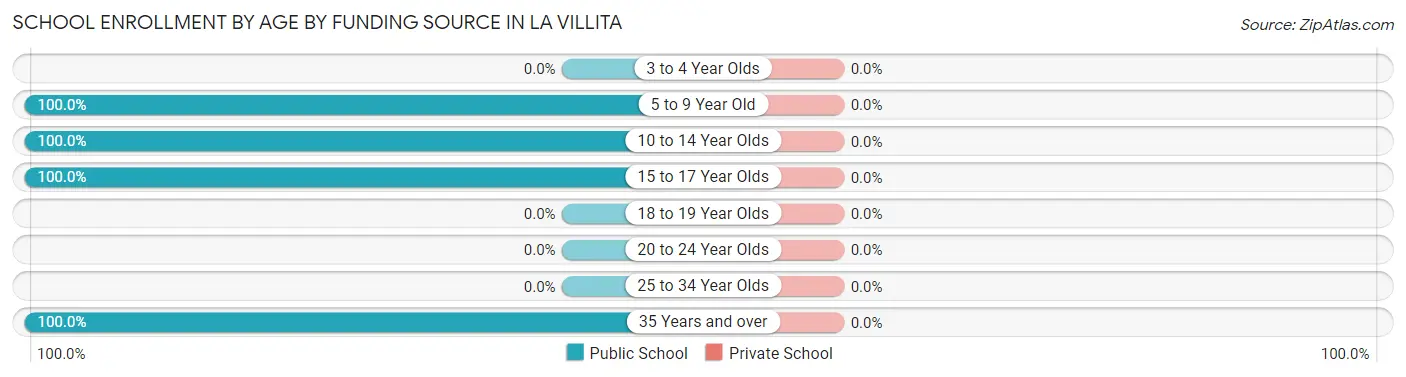
| Age Bracket | Public School | Private School |
| 3 to 4 Year Olds | 0 (0.0%) | 0 (0.0%) |
| 5 to 9 Year Old | 76 (100.0%) | 0 (0.0%) |
| 10 to 14 Year Olds | 158 (100.0%) | 0 (0.0%) |
| 15 to 17 Year Olds | 151 (100.0%) | 0 (0.0%) |
| 18 to 19 Year Olds | 0 (0.0%) | 0 (0.0%) |
| 20 to 24 Year Olds | 0 (0.0%) | 0 (0.0%) |
| 25 to 34 Year Olds | 0 (0.0%) | 0 (0.0%) |
| 35 Years and over | 144 (100.0%) | 0 (0.0%) |
| Total | 529 (100.0%) | 0 (0.0%) |
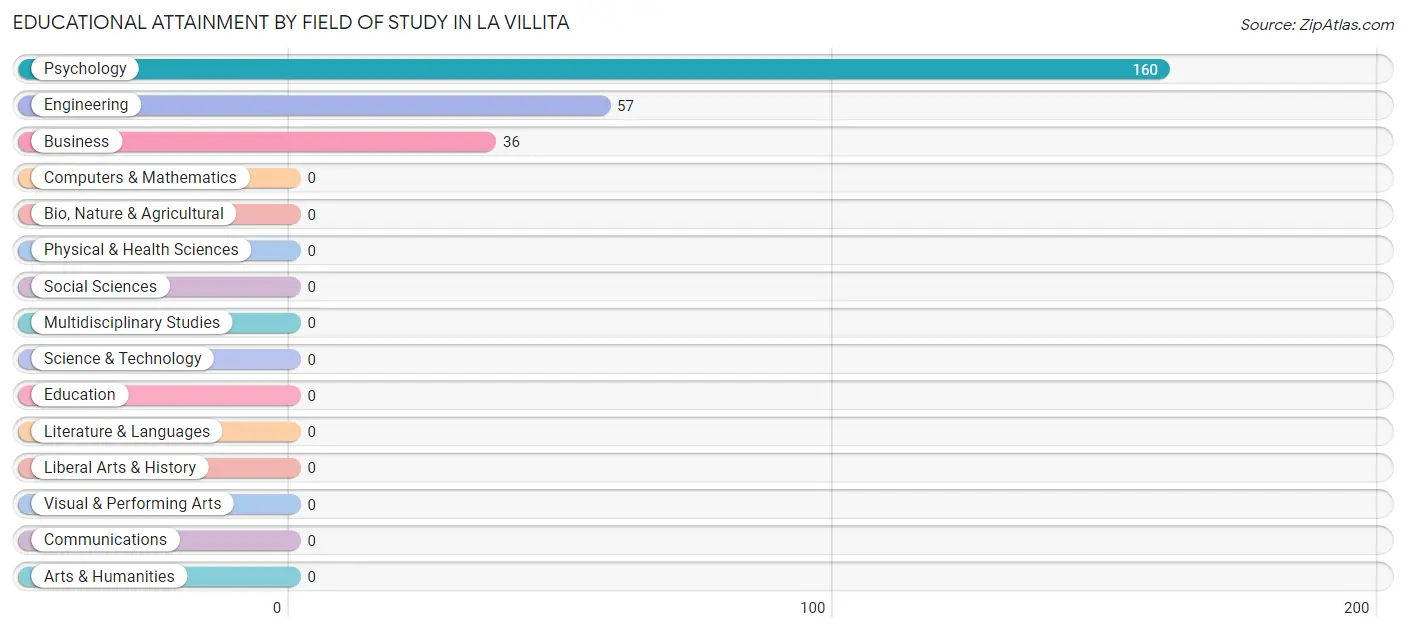
Educational Attainment by Field of Study in La Villita
Psychology (160 | 63.2%), engineering (57 | 22.5%), and business (36 | 14.2%) are the most common fields of study among 253 individuals in La Villita who have obtained a bachelor's degree or higher.
| Field of Study | # Graduates | % Graduates |
| Computers & Mathematics | 0 | 0.0% |
| Bio, Nature & Agricultural | 0 | 0.0% |
| Physical & Health Sciences | 0 | 0.0% |
| Psychology | 160 | 63.2% |
| Social Sciences | 0 | 0.0% |
| Engineering | 57 | 22.5% |
| Multidisciplinary Studies | 0 | 0.0% |
| Science & Technology | 0 | 0.0% |
| Business | 36 | 14.2% |
| Education | 0 | 0.0% |
| Literature & Languages | 0 | 0.0% |
| Liberal Arts & History | 0 | 0.0% |
| Visual & Performing Arts | 0 | 0.0% |
| Communications | 0 | 0.0% |
| Arts & Humanities | 0 | 0.0% |
| Total | 253 | 100.0% |
Transportation & Commute in La Villita
Vehicle Availability by Sex in La Villita
The most prevalent vehicle ownership categories in La Villita are males with 3 vehicles (66, accounting for 44.3%) and females with 3 vehicles (105, making up 10.1%).
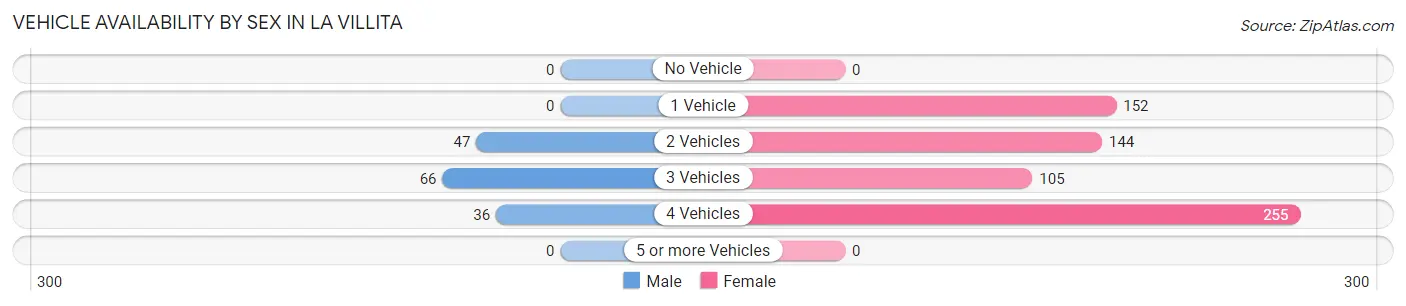
| Vehicles Available | Male | Female |
| No Vehicle | 0 (0.0%) | 0 (0.0%) |
| 1 Vehicle | 0 (0.0%) | 152 (23.2%) |
| 2 Vehicles | 47 (31.5%) | 144 (22.0%) |
| 3 Vehicles | 66 (44.3%) | 105 (16.0%) |
| 4 Vehicles | 36 (24.2%) | 255 (38.9%) |
| 5 or more Vehicles | 0 (0.0%) | 0 (0.0%) |
| Total | 149 (100.0%) | 656 (100.0%) |
Commute Time in La Villita
The most frequently occuring commute durations in La Villita are 15 to 19 minutes (351 commuters, 43.6%), 60 to 89 minutes (173 commuters, 21.5%), and 20 to 24 minutes (140 commuters, 17.4%).
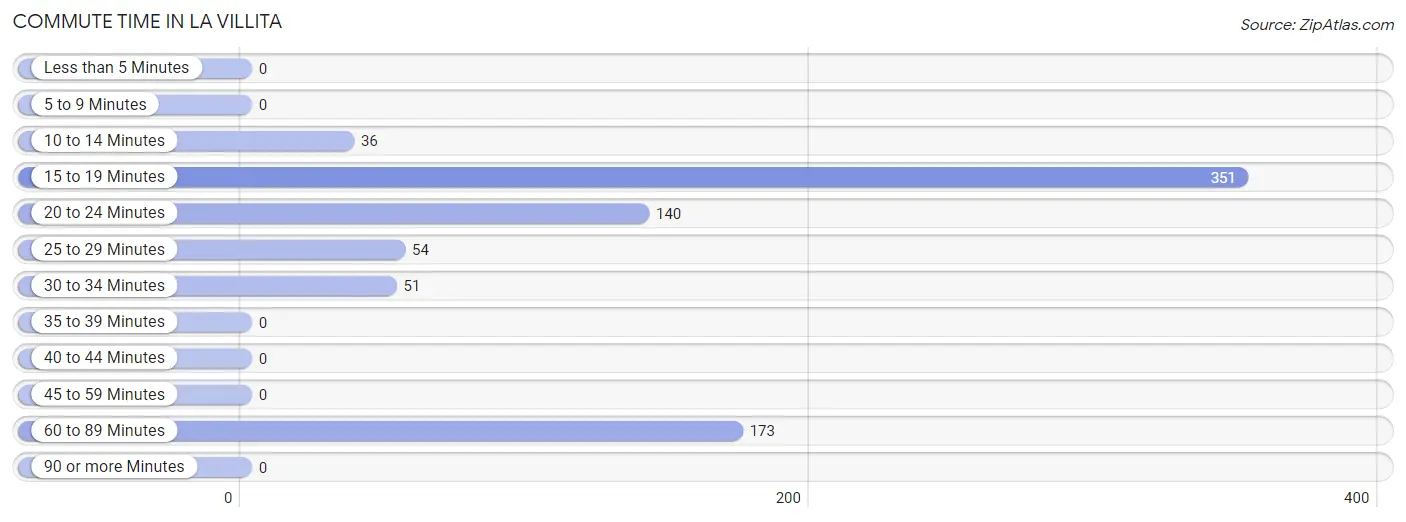
| Commute Time | # Commuters | % Commuters |
| Less than 5 Minutes | 0 | 0.0% |
| 5 to 9 Minutes | 0 | 0.0% |
| 10 to 14 Minutes | 36 | 4.5% |
| 15 to 19 Minutes | 351 | 43.6% |
| 20 to 24 Minutes | 140 | 17.4% |
| 25 to 29 Minutes | 54 | 6.7% |
| 30 to 34 Minutes | 51 | 6.3% |
| 35 to 39 Minutes | 0 | 0.0% |
| 40 to 44 Minutes | 0 | 0.0% |
| 45 to 59 Minutes | 0 | 0.0% |
| 60 to 89 Minutes | 173 | 21.5% |
| 90 or more Minutes | 0 | 0.0% |
Commute Time by Sex in La Villita
The most common commute times in La Villita are 20 to 24 minutes (66 commuters, 44.3%) for males and 15 to 19 minutes (304 commuters, 46.3%) for females.
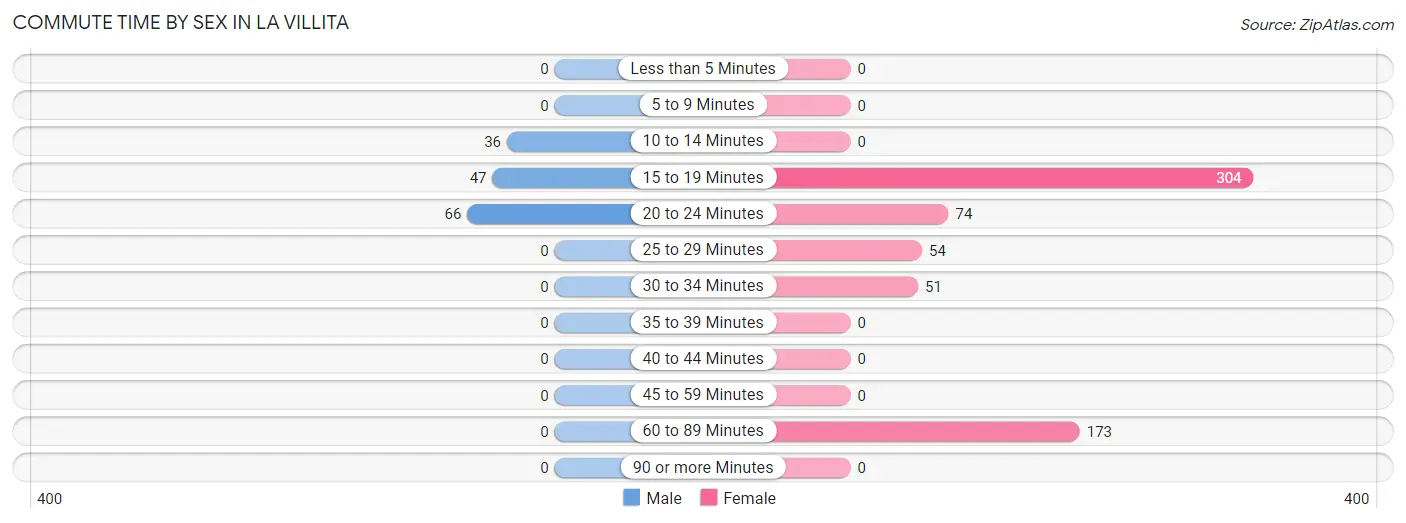
| Commute Time | Male | Female |
| Less than 5 Minutes | 0 (0.0%) | 0 (0.0%) |
| 5 to 9 Minutes | 0 (0.0%) | 0 (0.0%) |
| 10 to 14 Minutes | 36 (24.2%) | 0 (0.0%) |
| 15 to 19 Minutes | 47 (31.5%) | 304 (46.3%) |
| 20 to 24 Minutes | 66 (44.3%) | 74 (11.3%) |
| 25 to 29 Minutes | 0 (0.0%) | 54 (8.2%) |
| 30 to 34 Minutes | 0 (0.0%) | 51 (7.8%) |
| 35 to 39 Minutes | 0 (0.0%) | 0 (0.0%) |
| 40 to 44 Minutes | 0 (0.0%) | 0 (0.0%) |
| 45 to 59 Minutes | 0 (0.0%) | 0 (0.0%) |
| 60 to 89 Minutes | 0 (0.0%) | 173 (26.4%) |
| 90 or more Minutes | 0 (0.0%) | 0 (0.0%) |
Time of Departure to Work by Sex in La Villita
The most frequent times of departure to work in La Villita are 7:30 AM to 7:59 AM (66, 44.3%) for males and 7:30 AM to 7:59 AM (285, 43.4%) for females.
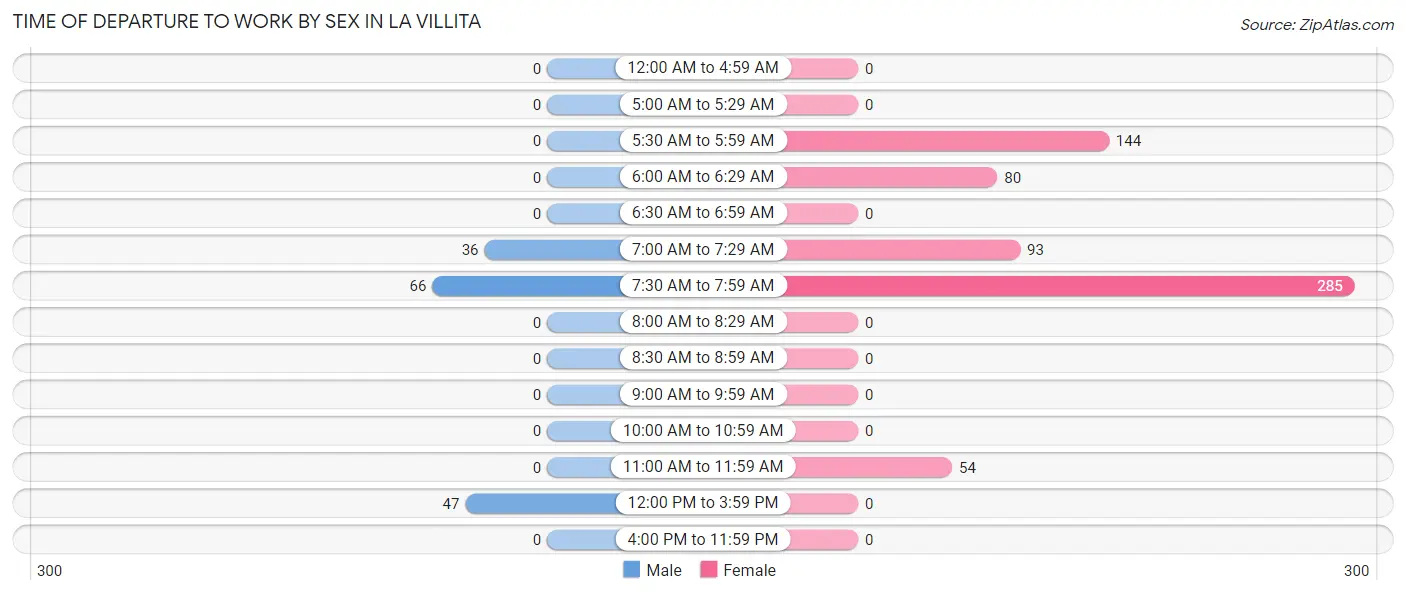
| Time of Departure | Male | Female |
| 12:00 AM to 4:59 AM | 0 (0.0%) | 0 (0.0%) |
| 5:00 AM to 5:29 AM | 0 (0.0%) | 0 (0.0%) |
| 5:30 AM to 5:59 AM | 0 (0.0%) | 144 (22.0%) |
| 6:00 AM to 6:29 AM | 0 (0.0%) | 80 (12.2%) |
| 6:30 AM to 6:59 AM | 0 (0.0%) | 0 (0.0%) |
| 7:00 AM to 7:29 AM | 36 (24.2%) | 93 (14.2%) |
| 7:30 AM to 7:59 AM | 66 (44.3%) | 285 (43.4%) |
| 8:00 AM to 8:29 AM | 0 (0.0%) | 0 (0.0%) |
| 8:30 AM to 8:59 AM | 0 (0.0%) | 0 (0.0%) |
| 9:00 AM to 9:59 AM | 0 (0.0%) | 0 (0.0%) |
| 10:00 AM to 10:59 AM | 0 (0.0%) | 0 (0.0%) |
| 11:00 AM to 11:59 AM | 0 (0.0%) | 54 (8.2%) |
| 12:00 PM to 3:59 PM | 47 (31.5%) | 0 (0.0%) |
| 4:00 PM to 11:59 PM | 0 (0.0%) | 0 (0.0%) |
| Total | 149 (100.0%) | 656 (100.0%) |
Housing Occupancy in La Villita
Occupancy by Ownership in La Villita
Of the total 365 dwellings in La Villita, owner-occupied units account for 283 (77.5%), while renter-occupied units make up 82 (22.5%).
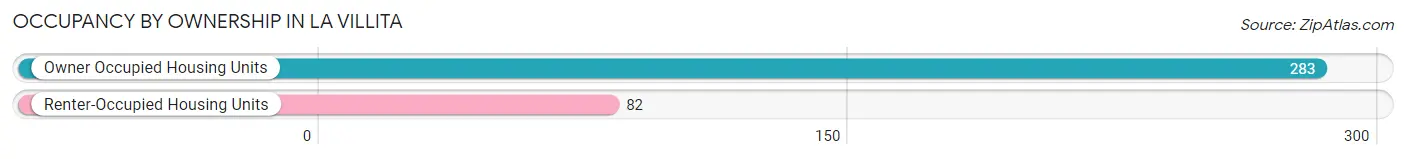
| Occupancy | # Housing Units | % Housing Units |
| Owner Occupied Housing Units | 283 | 77.5% |
| Renter-Occupied Housing Units | 82 | 22.5% |
| Total Occupied Housing Units | 365 | 100.0% |
Occupancy by Household Size in La Villita
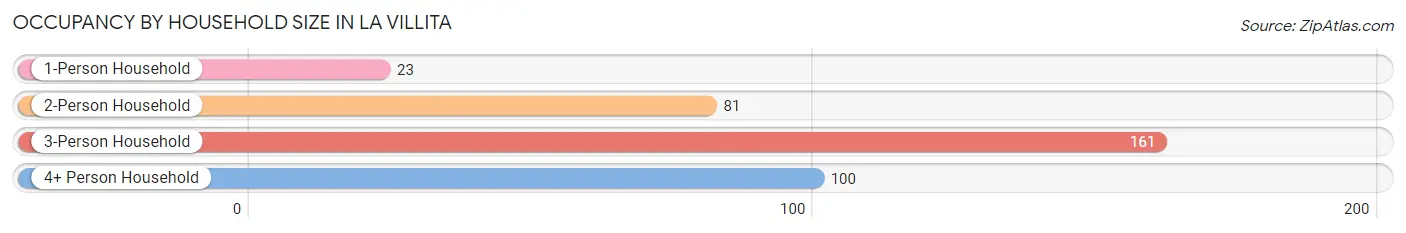
| Household Size | # Housing Units | % Housing Units |
| 1-Person Household | 23 | 6.3% |
| 2-Person Household | 81 | 22.2% |
| 3-Person Household | 161 | 44.1% |
| 4+ Person Household | 100 | 27.4% |
| Total Housing Units | 365 | 100.0% |
Occupancy by Ownership by Household Size in La Villita
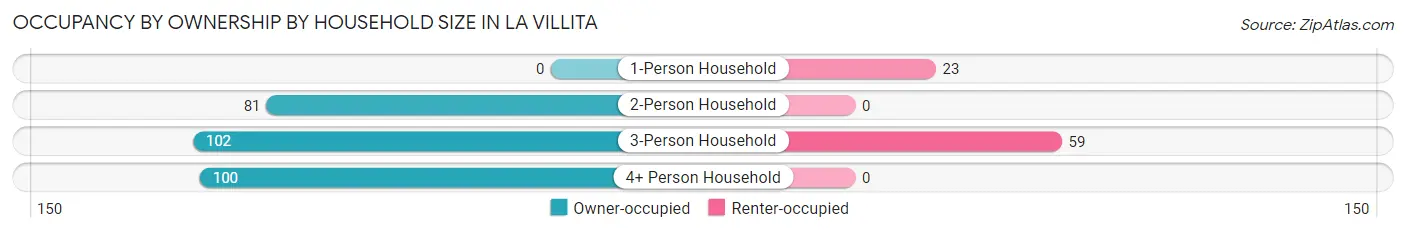
| Household Size | Owner-occupied | Renter-occupied |
| 1-Person Household | 0 (0.0%) | 23 (100.0%) |
| 2-Person Household | 81 (100.0%) | 0 (0.0%) |
| 3-Person Household | 102 (63.3%) | 59 (36.6%) |
| 4+ Person Household | 100 (100.0%) | 0 (0.0%) |
| Total Housing Units | 283 (77.5%) | 82 (22.5%) |
Occupancy by Educational Attainment in La Villita
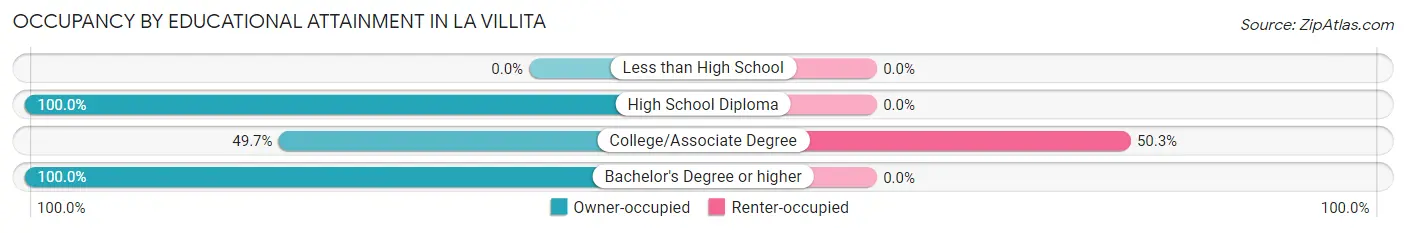
| Household Size | Owner-occupied | Renter-occupied |
| Less than High School | 0 (0.0%) | 0 (0.0%) |
| High School Diploma | 166 (100.0%) | 0 (0.0%) |
| College/Associate Degree | 81 (49.7%) | 82 (50.3%) |
| Bachelor's Degree or higher | 36 (100.0%) | 0 (0.0%) |
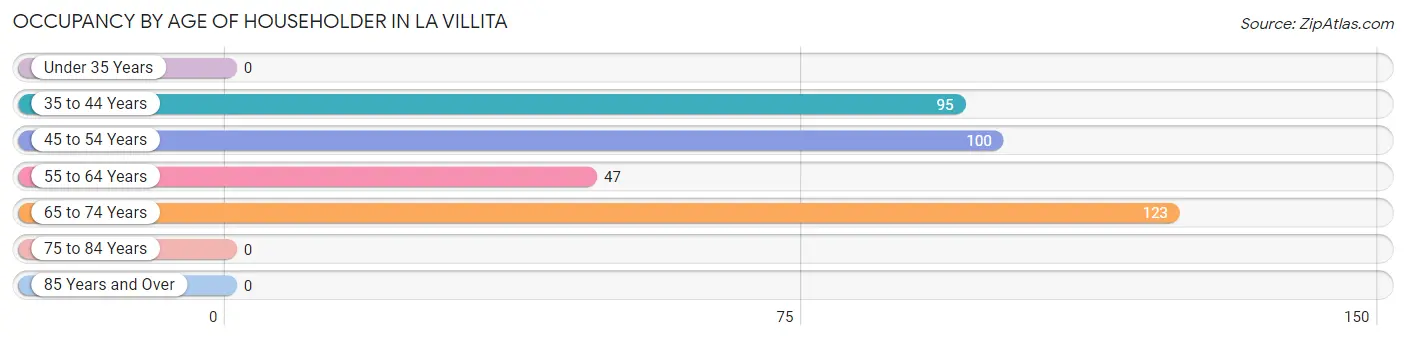
Occupancy by Age of Householder in La Villita
| Age Bracket | # Households | % Households |
| Under 35 Years | 0 | 0.0% |
| 35 to 44 Years | 95 | 26.0% |
| 45 to 54 Years | 100 | 27.4% |
| 55 to 64 Years | 47 | 12.9% |
| 65 to 74 Years | 123 | 33.7% |
| 75 to 84 Years | 0 | 0.0% |
| 85 Years and Over | 0 | 0.0% |
| Total | 365 | 100.0% |
Housing Finances in La Villita
Median Income by Occupancy in La Villita
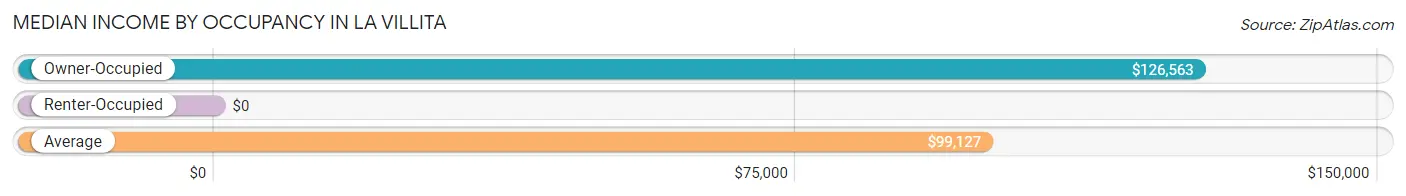
| Occupancy Type | # Households | Median Income |
| Owner-Occupied | 283 (77.5%) | $126,563 |
| Renter-Occupied | 82 (22.5%) | $0 |
| Average | 365 (100.0%) | $99,127 |
Occupancy by Householder Income Bracket in La Villita
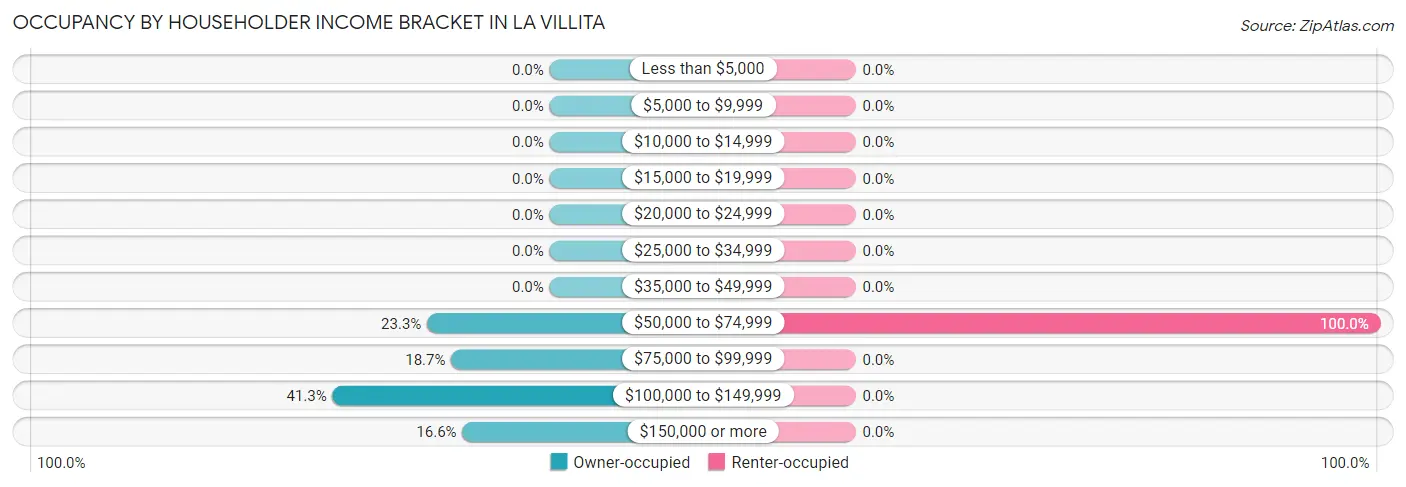
| Income Bracket | Owner-occupied | Renter-occupied |
| Less than $5,000 | 0 (0.0%) | 0 (0.0%) |
| $5,000 to $9,999 | 0 (0.0%) | 0 (0.0%) |
| $10,000 to $14,999 | 0 (0.0%) | 0 (0.0%) |
| $15,000 to $19,999 | 0 (0.0%) | 0 (0.0%) |
| $20,000 to $24,999 | 0 (0.0%) | 0 (0.0%) |
| $25,000 to $34,999 | 0 (0.0%) | 0 (0.0%) |
| $35,000 to $49,999 | 0 (0.0%) | 0 (0.0%) |
| $50,000 to $74,999 | 66 (23.3%) | 82 (100.0%) |
| $75,000 to $99,999 | 53 (18.7%) | 0 (0.0%) |
| $100,000 to $149,999 | 117 (41.3%) | 0 (0.0%) |
| $150,000 or more | 47 (16.6%) | 0 (0.0%) |
| Total | 283 (100.0%) | 82 (100.0%) |
Monthly Housing Cost Tiers in La Villita
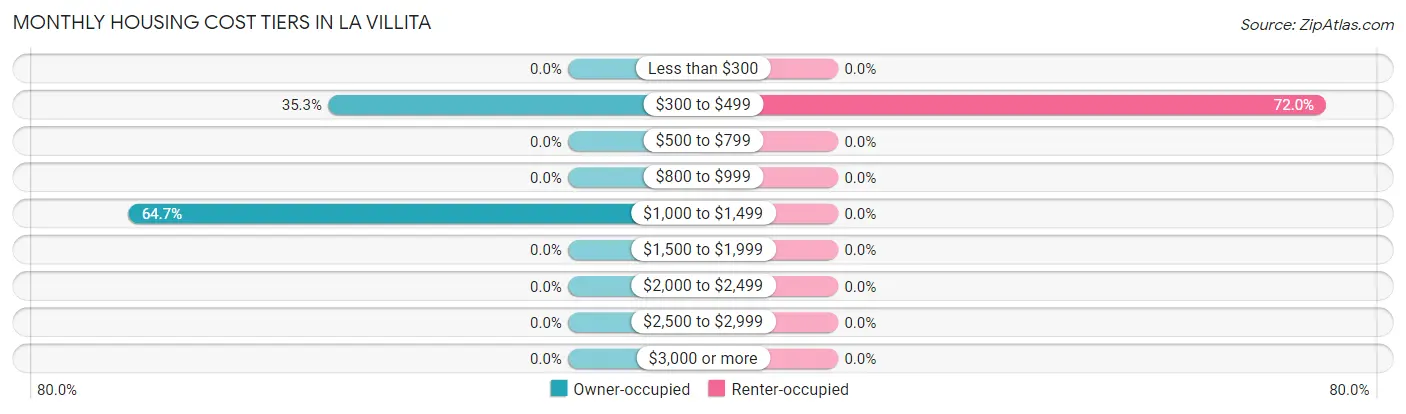
| Monthly Cost | Owner-occupied | Renter-occupied |
| Less than $300 | 0 (0.0%) | 0 (0.0%) |
| $300 to $499 | 100 (35.3%) | 59 (72.0%) |
| $500 to $799 | 0 (0.0%) | 0 (0.0%) |
| $800 to $999 | 0 (0.0%) | 0 (0.0%) |
| $1,000 to $1,499 | 183 (64.7%) | 0 (0.0%) |
| $1,500 to $1,999 | 0 (0.0%) | 0 (0.0%) |
| $2,000 to $2,499 | 0 (0.0%) | 0 (0.0%) |
| $2,500 to $2,999 | 0 (0.0%) | 0 (0.0%) |
| $3,000 or more | 0 (0.0%) | 0 (0.0%) |
| Total | 283 (100.0%) | 82 (100.0%) |
Physical Housing Characteristics in La Villita
Housing Structures in La Villita
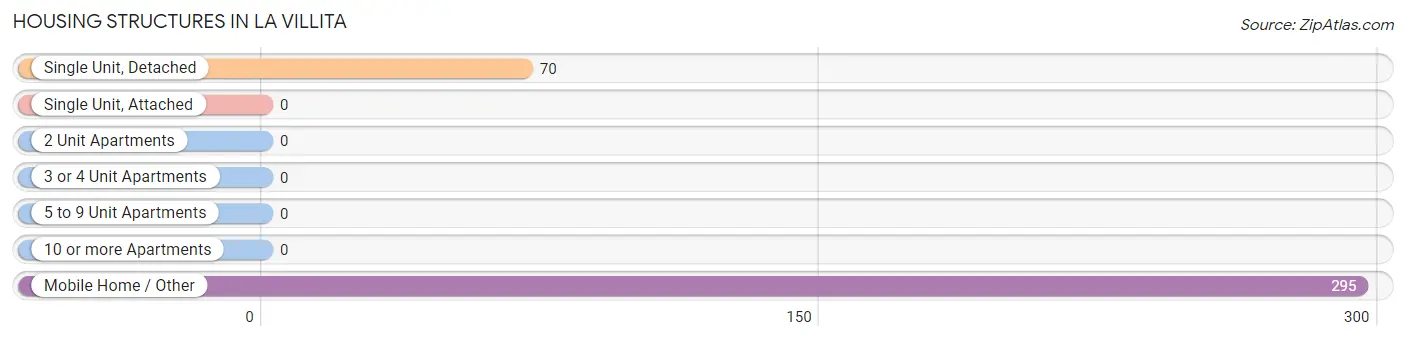
| Structure Type | # Housing Units | % Housing Units |
| Single Unit, Detached | 70 | 19.2% |
| Single Unit, Attached | 0 | 0.0% |
| 2 Unit Apartments | 0 | 0.0% |
| 3 or 4 Unit Apartments | 0 | 0.0% |
| 5 to 9 Unit Apartments | 0 | 0.0% |
| 10 or more Apartments | 0 | 0.0% |
| Mobile Home / Other | 295 | 80.8% |
| Total | 365 | 100.0% |
Housing Structures by Occupancy in La Villita
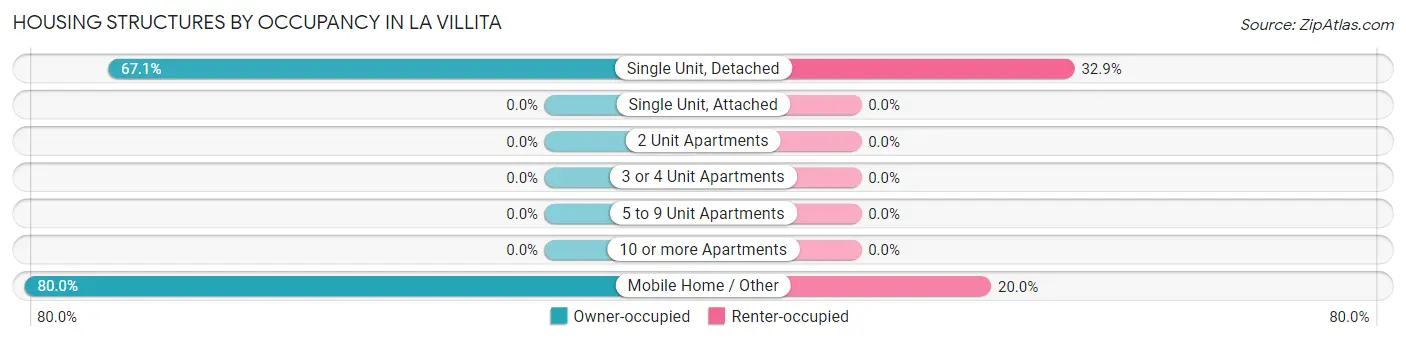
| Structure Type | Owner-occupied | Renter-occupied |
| Single Unit, Detached | 47 (67.1%) | 23 (32.9%) |
| Single Unit, Attached | 0 (0.0%) | 0 (0.0%) |
| 2 Unit Apartments | 0 (0.0%) | 0 (0.0%) |
| 3 or 4 Unit Apartments | 0 (0.0%) | 0 (0.0%) |
| 5 to 9 Unit Apartments | 0 (0.0%) | 0 (0.0%) |
| 10 or more Apartments | 0 (0.0%) | 0 (0.0%) |
| Mobile Home / Other | 236 (80.0%) | 59 (20.0%) |
| Total | 283 (77.5%) | 82 (22.5%) |
Housing Structures by Number of Rooms in La Villita
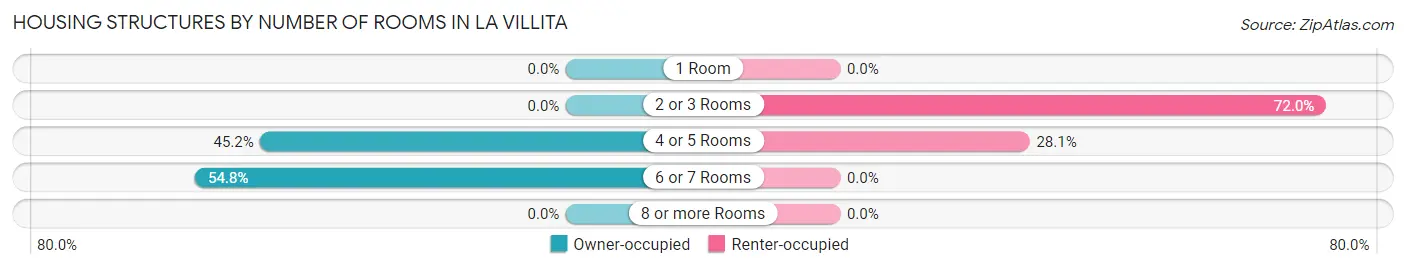
| Number of Rooms | Owner-occupied | Renter-occupied |
| 1 Room | 0 (0.0%) | 0 (0.0%) |
| 2 or 3 Rooms | 0 (0.0%) | 59 (72.0%) |
| 4 or 5 Rooms | 128 (45.2%) | 23 (28.1%) |
| 6 or 7 Rooms | 155 (54.8%) | 0 (0.0%) |
| 8 or more Rooms | 0 (0.0%) | 0 (0.0%) |
| Total | 283 (100.0%) | 82 (100.0%) |
Housing Structure by Heating Type in La Villita
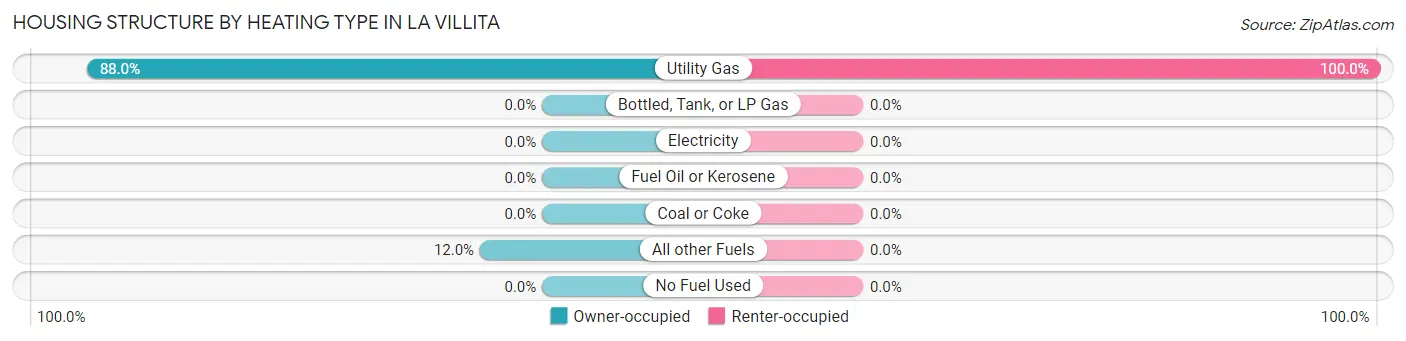
| Heating Type | Owner-occupied | Renter-occupied |
| Utility Gas | 249 (88.0%) | 82 (100.0%) |
| Bottled, Tank, or LP Gas | 0 (0.0%) | 0 (0.0%) |
| Electricity | 0 (0.0%) | 0 (0.0%) |
| Fuel Oil or Kerosene | 0 (0.0%) | 0 (0.0%) |
| Coal or Coke | 0 (0.0%) | 0 (0.0%) |
| All other Fuels | 34 (12.0%) | 0 (0.0%) |
| No Fuel Used | 0 (0.0%) | 0 (0.0%) |
| Total | 283 (100.0%) | 82 (100.0%) |
Household Vehicle Usage in La Villita
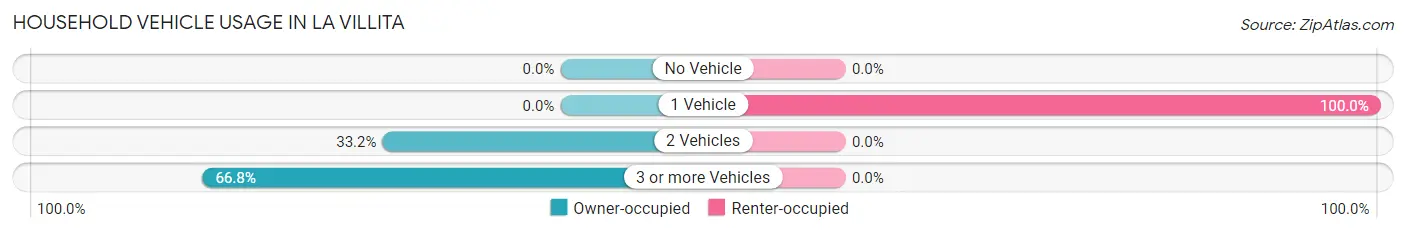
| Vehicles per Household | Owner-occupied | Renter-occupied |
| No Vehicle | 0 (0.0%) | 0 (0.0%) |
| 1 Vehicle | 0 (0.0%) | 82 (100.0%) |
| 2 Vehicles | 94 (33.2%) | 0 (0.0%) |
| 3 or more Vehicles | 189 (66.8%) | 0 (0.0%) |
| Total | 283 (100.0%) | 82 (100.0%) |
Real Estate & Mortgages in La Villita
Real Estate and Mortgage Overview in La Villita
| Characteristic | Without Mortgage | With Mortgage |
| Housing Units | 100 | 183 |
| Median Property Value | - | - |
| Median Household Income | - | - |
| Monthly Housing Costs | - | - |
| Real Estate Taxes | - | - |
Property Value by Mortgage Status in La Villita
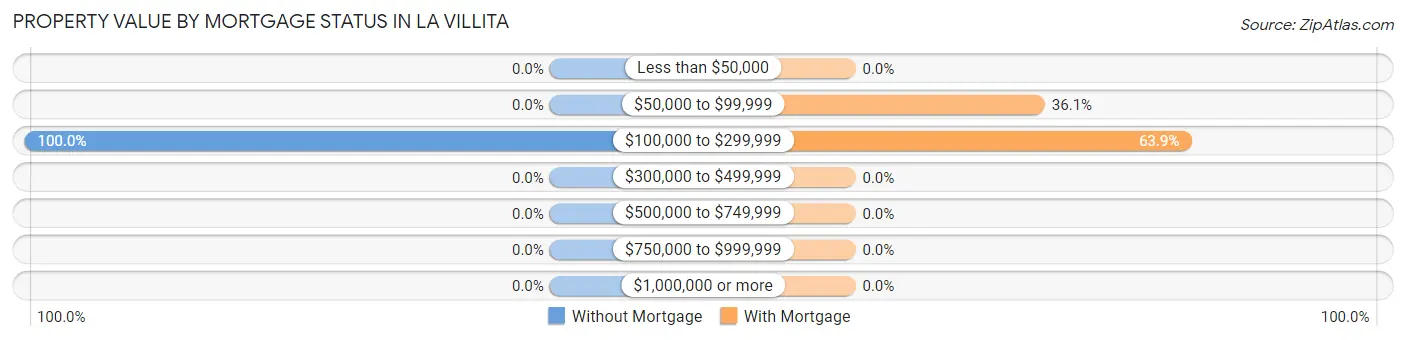
| Property Value | Without Mortgage | With Mortgage |
| Less than $50,000 | 0 (0.0%) | 0 (0.0%) |
| $50,000 to $99,999 | 0 (0.0%) | 66 (36.1%) |
| $100,000 to $299,999 | 100 (100.0%) | 117 (63.9%) |
| $300,000 to $499,999 | 0 (0.0%) | 0 (0.0%) |
| $500,000 to $749,999 | 0 (0.0%) | 0 (0.0%) |
| $750,000 to $999,999 | 0 (0.0%) | 0 (0.0%) |
| $1,000,000 or more | 0 (0.0%) | 0 (0.0%) |
| Total | 100 (100.0%) | 183 (100.0%) |
Household Income by Mortgage Status in La Villita
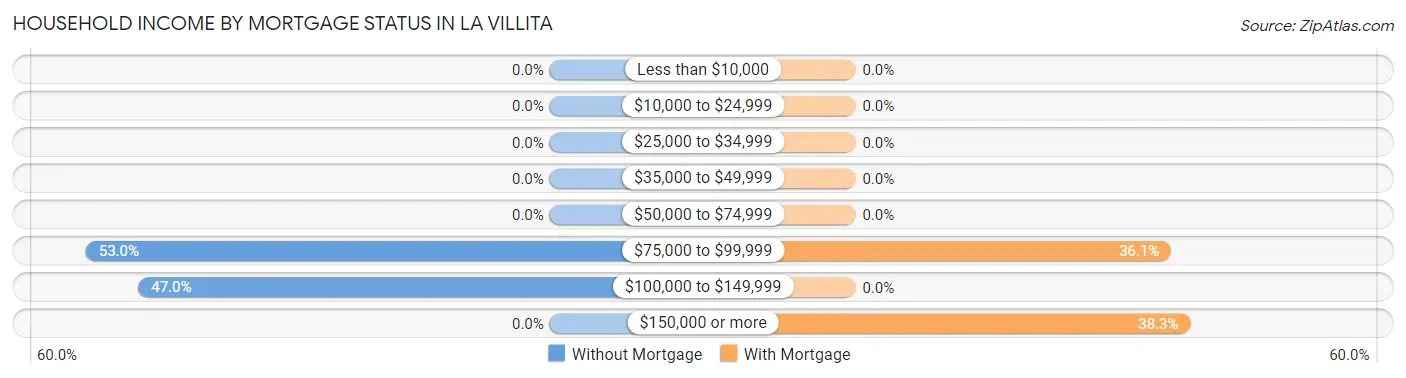
| Household Income | Without Mortgage | With Mortgage |
| Less than $10,000 | 0 (0.0%) | 0 (0.0%) |
| $10,000 to $24,999 | 0 (0.0%) | 0 (0.0%) |
| $25,000 to $34,999 | 0 (0.0%) | 0 (0.0%) |
| $35,000 to $49,999 | 0 (0.0%) | 0 (0.0%) |
| $50,000 to $74,999 | 0 (0.0%) | 0 (0.0%) |
| $75,000 to $99,999 | 53 (53.0%) | 66 (36.1%) |
| $100,000 to $149,999 | 47 (47.0%) | 0 (0.0%) |
| $150,000 or more | 0 (0.0%) | 70 (38.3%) |
| Total | 100 (100.0%) | 183 (100.0%) |
Property Value to Household Income Ratio in La Villita
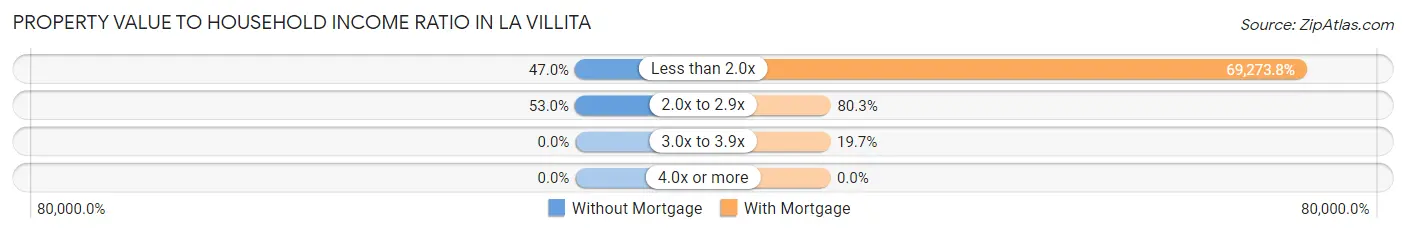
| Value-to-Income Ratio | Without Mortgage | With Mortgage |
| Less than 2.0x | 47 (47.0%) | 126,771 (69,273.8%) |
| 2.0x to 2.9x | 53 (53.0%) | 147 (80.3%) |
| 3.0x to 3.9x | 0 (0.0%) | 36 (19.7%) |
| 4.0x or more | 0 (0.0%) | 0 (0.0%) |
| Total | 100 (100.0%) | 183 (100.0%) |
Real Estate Taxes by Mortgage Status in La Villita
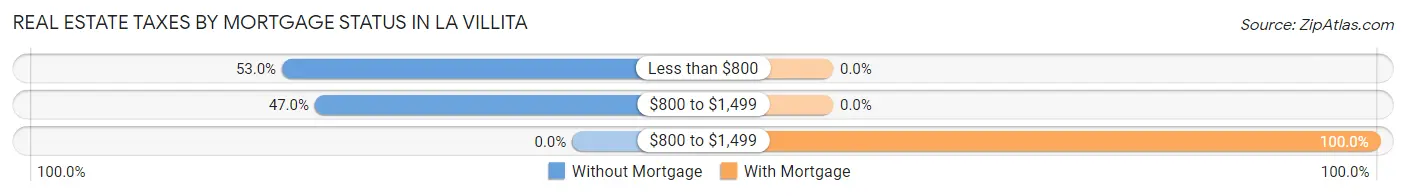
| Property Taxes | Without Mortgage | With Mortgage |
| Less than $800 | 53 (53.0%) | 0 (0.0%) |
| $800 to $1,499 | 47 (47.0%) | 0 (0.0%) |
| $800 to $1,499 | 0 (0.0%) | 183 (100.0%) |
| Total | 100 (100.0%) | 183 (100.0%) |
Health & Disability in La Villita
Health Insurance Coverage by Age in La Villita
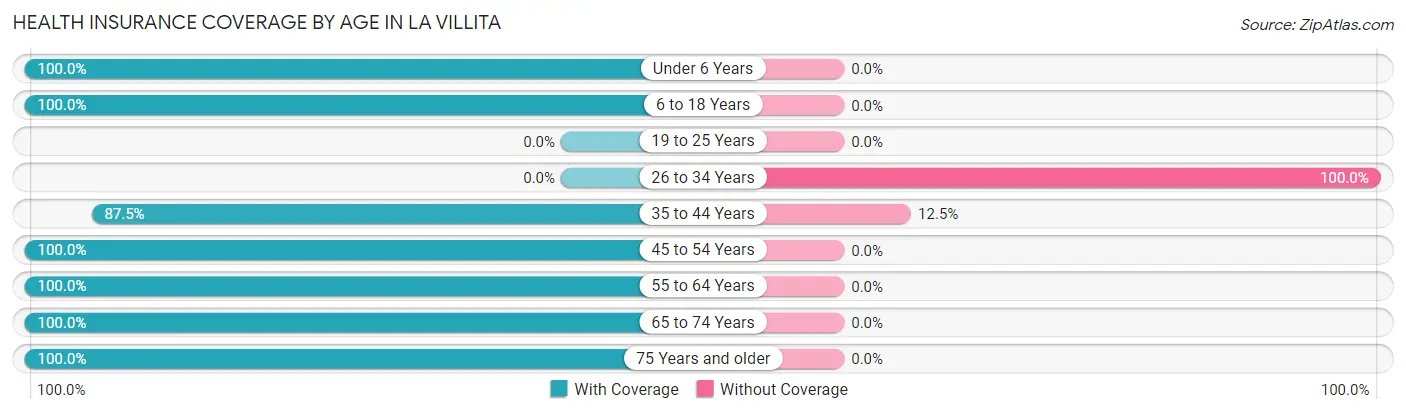
| Age Bracket | With Coverage | Without Coverage |
| Under 6 Years | 76 (100.0%) | 0 (0.0%) |
| 6 to 18 Years | 309 (100.0%) | 0 (0.0%) |
| 19 to 25 Years | 0 (0.0%) | 0 (0.0%) |
| 26 to 34 Years | 0 (0.0%) | 93 (100.0%) |
| 35 to 44 Years | 414 (87.5%) | 59 (12.5%) |
| 45 to 54 Years | 281 (100.0%) | 0 (0.0%) |
| 55 to 64 Years | 47 (100.0%) | 0 (0.0%) |
| 65 to 74 Years | 168 (100.0%) | 0 (0.0%) |
| 75 Years and older | 57 (100.0%) | 0 (0.0%) |
| Total | 1,352 (89.9%) | 152 (10.1%) |
Health Insurance Coverage by Citizenship Status in La Villita
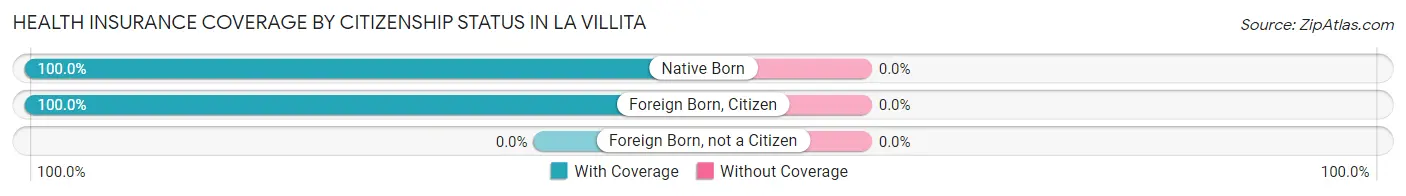
| Citizenship Status | With Coverage | Without Coverage |
| Native Born | 76 (100.0%) | 0 (0.0%) |
| Foreign Born, Citizen | 309 (100.0%) | 0 (0.0%) |
| Foreign Born, not a Citizen | 0 (0.0%) | 0 (0.0%) |
Health Insurance Coverage by Household Income in La Villita
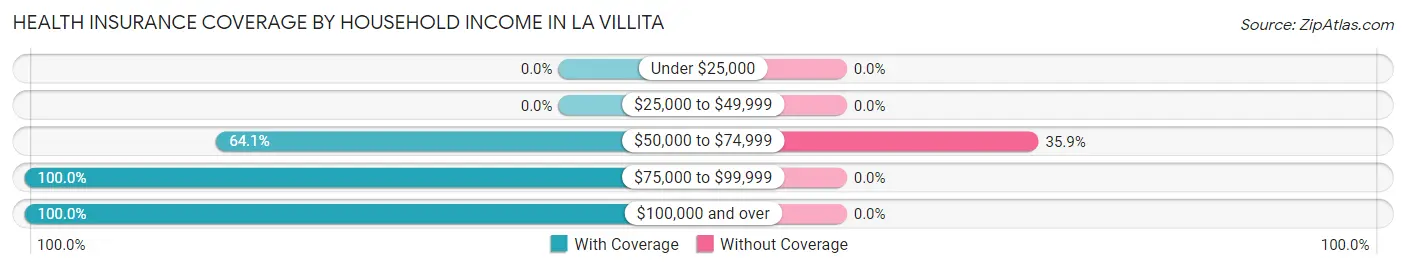
| Household Income | With Coverage | Without Coverage |
| Under $25,000 | 0 (0.0%) | 0 (0.0%) |
| $25,000 to $49,999 | 0 (0.0%) | 0 (0.0%) |
| $50,000 to $74,999 | 271 (64.1%) | 152 (35.9%) |
| $75,000 to $99,999 | 441 (100.0%) | 0 (0.0%) |
| $100,000 and over | 640 (100.0%) | 0 (0.0%) |
Public vs Private Health Insurance Coverage by Age in La Villita
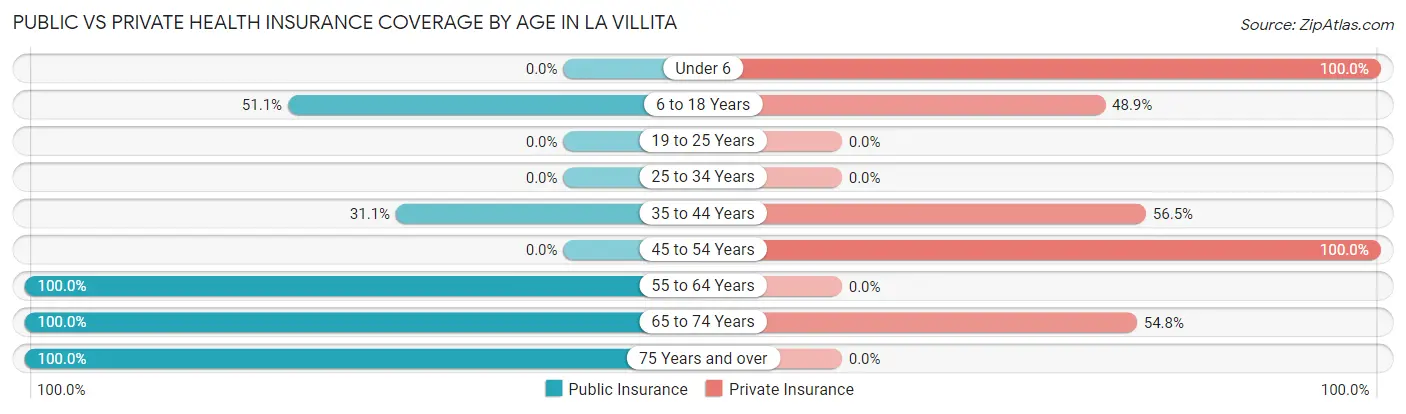
| Age Bracket | Public Insurance | Private Insurance |
| Under 6 | 0 (0.0%) | 76 (100.0%) |
| 6 to 18 Years | 158 (51.1%) | 151 (48.9%) |
| 19 to 25 Years | 0 (0.0%) | 0 (0.0%) |
| 25 to 34 Years | 0 (0.0%) | 0 (0.0%) |
| 35 to 44 Years | 147 (31.1%) | 267 (56.5%) |
| 45 to 54 Years | 0 (0.0%) | 281 (100.0%) |
| 55 to 64 Years | 47 (100.0%) | 0 (0.0%) |
| 65 to 74 Years | 168 (100.0%) | 92 (54.8%) |
| 75 Years and over | 57 (100.0%) | 0 (0.0%) |
| Total | 577 (38.4%) | 867 (57.7%) |
Disability Status by Sex by Age in La Villita
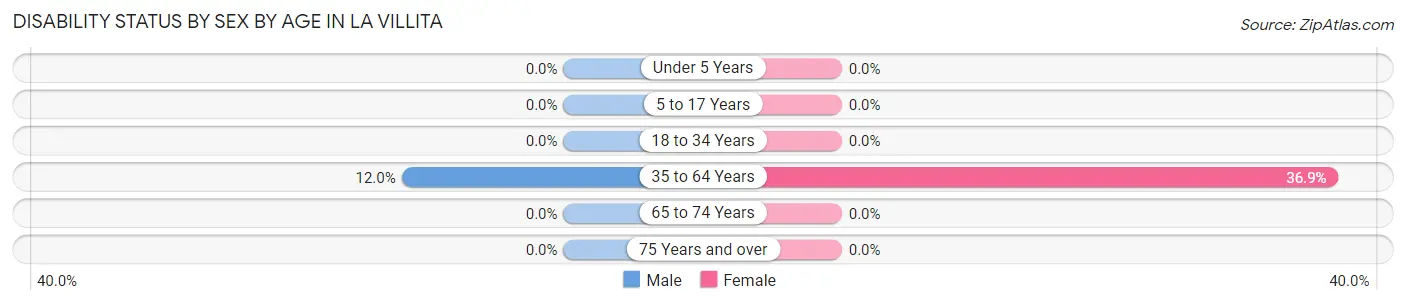
| Age Bracket | Male | Female |
| Under 5 Years | 0 (0.0%) | 0 (0.0%) |
| 5 to 17 Years | 0 (0.0%) | 0 (0.0%) |
| 18 to 34 Years | 0 (0.0%) | 0 (0.0%) |
| 35 to 64 Years | 34 (12.0%) | 191 (36.9%) |
| 65 to 74 Years | 0 (0.0%) | 0 (0.0%) |
| 75 Years and over | 0 (0.0%) | 0 (0.0%) |
Disability Class by Sex by Age in La Villita
Disability Class: Hearing Difficulty
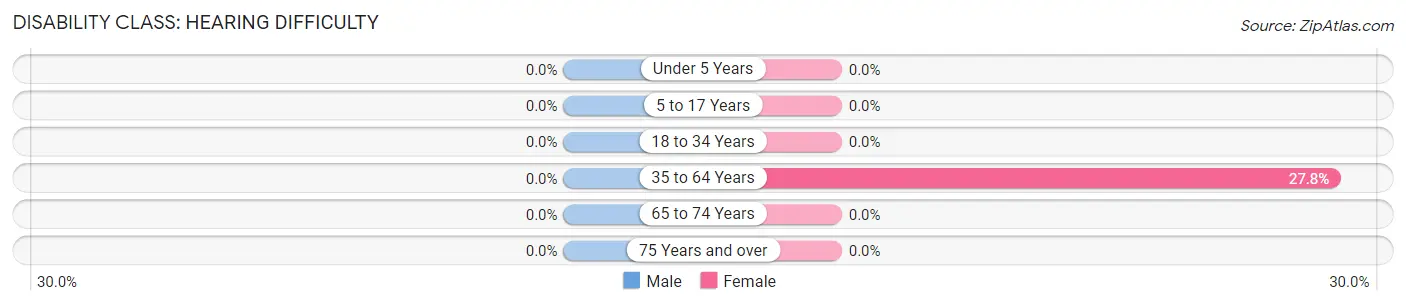
| Age Bracket | Male | Female |
| Under 5 Years | 0 (0.0%) | 0 (0.0%) |
| 5 to 17 Years | 0 (0.0%) | 0 (0.0%) |
| 18 to 34 Years | 0 (0.0%) | 0 (0.0%) |
| 35 to 64 Years | 0 (0.0%) | 144 (27.8%) |
| 65 to 74 Years | 0 (0.0%) | 0 (0.0%) |
| 75 Years and over | 0 (0.0%) | 0 (0.0%) |
Disability Class: Vision Difficulty
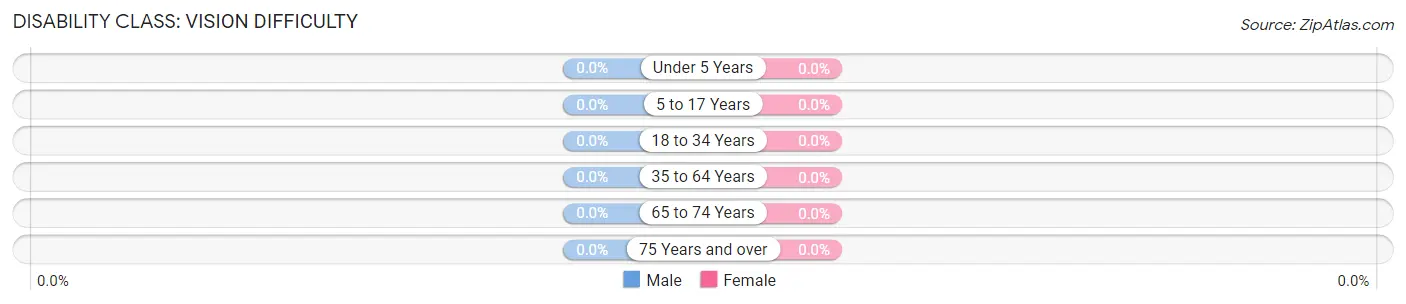
| Age Bracket | Male | Female |
| Under 5 Years | 0 (0.0%) | 0 (0.0%) |
| 5 to 17 Years | 0 (0.0%) | 0 (0.0%) |
| 18 to 34 Years | 0 (0.0%) | 0 (0.0%) |
| 35 to 64 Years | 0 (0.0%) | 0 (0.0%) |
| 65 to 74 Years | 0 (0.0%) | 0 (0.0%) |
| 75 Years and over | 0 (0.0%) | 0 (0.0%) |
Disability Class: Cognitive Difficulty
| Age Bracket | Male | Female |
| 5 to 17 Years | 0 (0.0%) | 0 (0.0%) |
| 18 to 34 Years | 0 (0.0%) | 0 (0.0%) |
| 35 to 64 Years | 0 (0.0%) | 0 (0.0%) |
| 65 to 74 Years | 0 (0.0%) | 0 (0.0%) |
| 75 Years and over | 0 (0.0%) | 0 (0.0%) |
Disability Class: Ambulatory Difficulty
| Age Bracket | Male | Female |
| 5 to 17 Years | 0 (0.0%) | 0 (0.0%) |
| 18 to 34 Years | 0 (0.0%) | 0 (0.0%) |
| 35 to 64 Years | 34 (12.0%) | 47 (9.1%) |
| 65 to 74 Years | 0 (0.0%) | 0 (0.0%) |
| 75 Years and over | 0 (0.0%) | 0 (0.0%) |
Disability Class: Self-Care Difficulty
| Age Bracket | Male | Female |
| 5 to 17 Years | 0 (0.0%) | 0 (0.0%) |
| 18 to 34 Years | 0 (0.0%) | 0 (0.0%) |
| 35 to 64 Years | 0 (0.0%) | 0 (0.0%) |
| 65 to 74 Years | 0 (0.0%) | 0 (0.0%) |
| 75 Years and over | 0 (0.0%) | 0 (0.0%) |
Technology Access in La Villita
Computing Device Access in La Villita
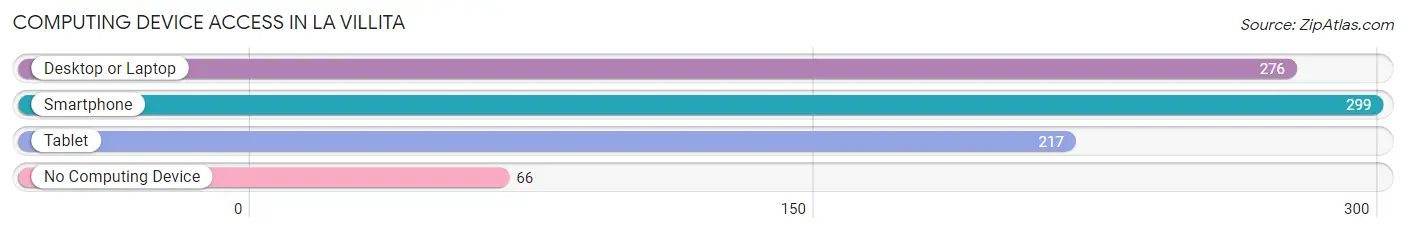
| Device Type | # Households | % Households |
| Desktop or Laptop | 276 | 75.6% |
| Smartphone | 299 | 81.9% |
| Tablet | 217 | 59.5% |
| No Computing Device | 66 | 18.1% |
| Total | 365 | 100.0% |
Internet Access in La Villita
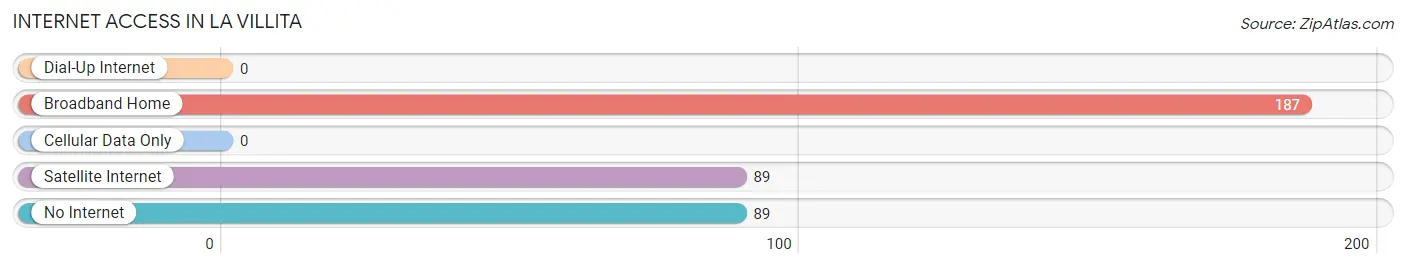
| Internet Type | # Households | % Households |
| Dial-Up Internet | 0 | 0.0% |
| Broadband Home | 187 | 51.2% |
| Cellular Data Only | 0 | 0.0% |
| Satellite Internet | 89 | 24.4% |
| No Internet | 89 | 24.4% |
| Total | 365 | 100.0% |
La Villita Summary
La Villita, NM is a small unincorporated community located in the northern part of the state of New Mexico. It is situated in the foothills of the Sangre de Cristo Mountains, approximately 25 miles north of Santa Fe. The community is home to a population of approximately 500 people, and is known for its rich cultural heritage and unique landscape.
History
La Villita has a long and storied history, dating back to the early 1800s. The area was originally inhabited by the Tewa Indians, who were later displaced by Spanish settlers. The first recorded settlement in the area was established in 1821, when a group of Spanish settlers established a small village near the present-day site of La Villita. The village was named La Villita, which translates to “little village” in Spanish.
The village grew slowly over the years, and by the late 1800s, it had become a thriving community. The village was home to a variety of businesses, including a general store, a blacksmith, a saloon, and a post office. The village also had a school, which was attended by both local children and children from nearby towns.
In the early 1900s, the village began to decline as the population shifted to larger cities. By the mid-1900s, the village had become a ghost town, with only a few residents remaining. In the late 1970s, the village was revitalized when a group of local residents began to restore the buildings and revive the community. Today, La Villita is a vibrant community with a rich cultural heritage.
Geography
La Villita is located in the northern part of the state of New Mexico, in the foothills of the Sangre de Cristo Mountains. The village is situated at an elevation of 6,000 feet, and is surrounded by rolling hills and lush forests. The climate in the area is semi-arid, with hot summers and cold winters.
The village is located approximately 25 miles north of Santa Fe, and is accessible by a network of roads and highways. The nearest major airport is located in Albuquerque, which is approximately 90 miles away.
Economy
The economy of La Villita is largely based on tourism and agriculture. The village is home to a variety of tourist attractions, including the historic La Villita Church, the La Villita Museum, and the La Villita Art Gallery. The village also hosts a variety of festivals and events throughout the year, including the La Villita Fiesta and the La Villita Music Festival.
Agriculture is also an important part of the local economy. The area is home to a variety of farms, which produce a variety of crops, including corn, beans, squash, and chiles.
Demographics
As of the 2010 census, the population of La Villita was 498. The racial makeup of the village was 94.2% Hispanic or Latino, 4.2% White, 0.2% Native American, and 1.4% from other races. The median household income in the village was $25,000, and the median age was 37.
La Villita is a small, close-knit community with a rich cultural heritage. The village is home to a variety of businesses, including restaurants, shops, and galleries. The village also has a variety of recreational activities, including hiking, fishing, and camping. La Villita is a unique and vibrant community, and is a great place to visit or live.
Common Questions
What is Per Capita Income in La Villita?
Per Capita income in La Villita is $34,750.
What is the Median Family Income in La Villita?
Median Family Income in La Villita is $87,170.
What is the Median Household income in La Villita?
Median Household Income in La Villita is $99,127.
What is Income or Wage Gap in La Villita?
Income or Wage Gap in La Villita is 48.3%.
Women in La Villita earn 51.7 cents for every dollar earned by a man.
What is Inequality or Gini Index in La Villita?
Inequality or Gini Index in La Villita is 0.22.
What is the Total Population of La Villita?
Total Population of La Villita is 1,504.
What is the Total Male Population of La Villita?
Total Male Population of La Villita is 756.
What is the Total Female Population of La Villita?
Total Female Population of La Villita is 748.
What is the Ratio of Males per 100 Females in La Villita?
There are 101.07 Males per 100 Females in La Villita.
What is the Ratio of Females per 100 Males in La Villita?
There are 98.94 Females per 100 Males in La Villita.
What is the Median Population Age in La Villita?
Median Population Age in La Villita is 42.6 Years.
What is the Average Family Size in La Villita
Average Family Size in La Villita is 3.9 People.
What is the Average Household Size in La Villita
Average Household Size in La Villita is 4.1 People.
How Large is the Labor Force in La Villita?
There are 805 People in the Labor Forcein in La Villita.
What is the Percentage of People in the Labor Force in La Villita?
66.5% of People are in the Labor Force in La Villita.