Cassville, WV Map & Demographics
Cassville Map
Cassville Overview
$54,503
PER CAPITA INCOME
$147,031
AVG FAMILY INCOME
$85,878
AVG HOUSEHOLD INCOME
14.4%
WAGE / INCOME GAP [ % ]
85.6¢/ $1
WAGE / INCOME GAP [ $ ]
0.34
INEQUALITY / GINI INDEX
1,570
TOTAL POPULATION
825
MALE POPULATION
745
FEMALE POPULATION
110.74
MALES / 100 FEMALES
90.30
FEMALES / 100 MALES
42.4
MEDIAN AGE
2.8
AVG FAMILY SIZE
2.2
AVG HOUSEHOLD SIZE
1,051
LABOR FORCE [ PEOPLE ]
76.8%
PERCENT IN LABOR FORCE
1.9%
UNEMPLOYMENT RATE
Cassville Area Codes
Income in Cassville
Income Overview in Cassville
Per Capita Income in Cassville is $54,503, while median incomes of families and households are $147,031 and $85,878 respectively.
| Characteristic | Number | Measure |
| Per Capita Income | 1,570 | $54,503 |
| Median Family Income | 406 | $147,031 |
| Mean Family Income | 406 | $153,774 |
| Median Household Income | 714 | $85,878 |
| Mean Household Income | 714 | $119,066 |
| Income Deficit | 406 | $0 |
| Wage / Income Gap (%) | 1,570 | 14.36% |
| Wage / Income Gap ($) | 1,570 | 85.64¢ per $1 |
| Gini / Inequality Index | 1,570 | 0.34 |
Earnings by Sex in Cassville
Average Earnings in Cassville are $58,750, $65,943 for men and $56,471 for women, a difference of 14.4%.
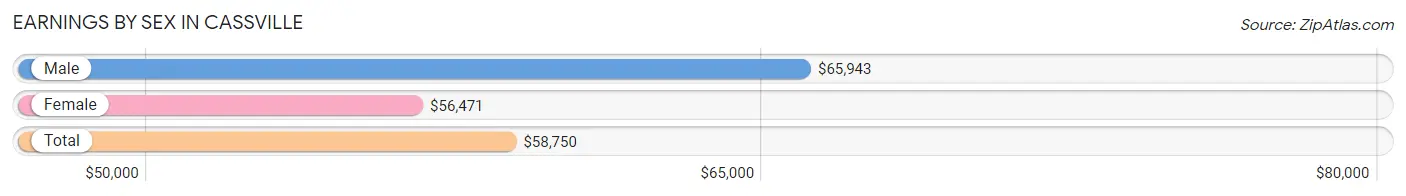
| Sex | Number | Average Earnings |
| Male | 638 (57.4%) | $65,943 |
| Female | 474 (42.6%) | $56,471 |
| Total | 1,112 (100.0%) | $58,750 |
Earnings by Sex by Income Bracket in Cassville
The most common earnings brackets in Cassville are $100,000+ for men (146 | 22.9%) and $35,000 to $39,999 for women (147 | 31.0%).
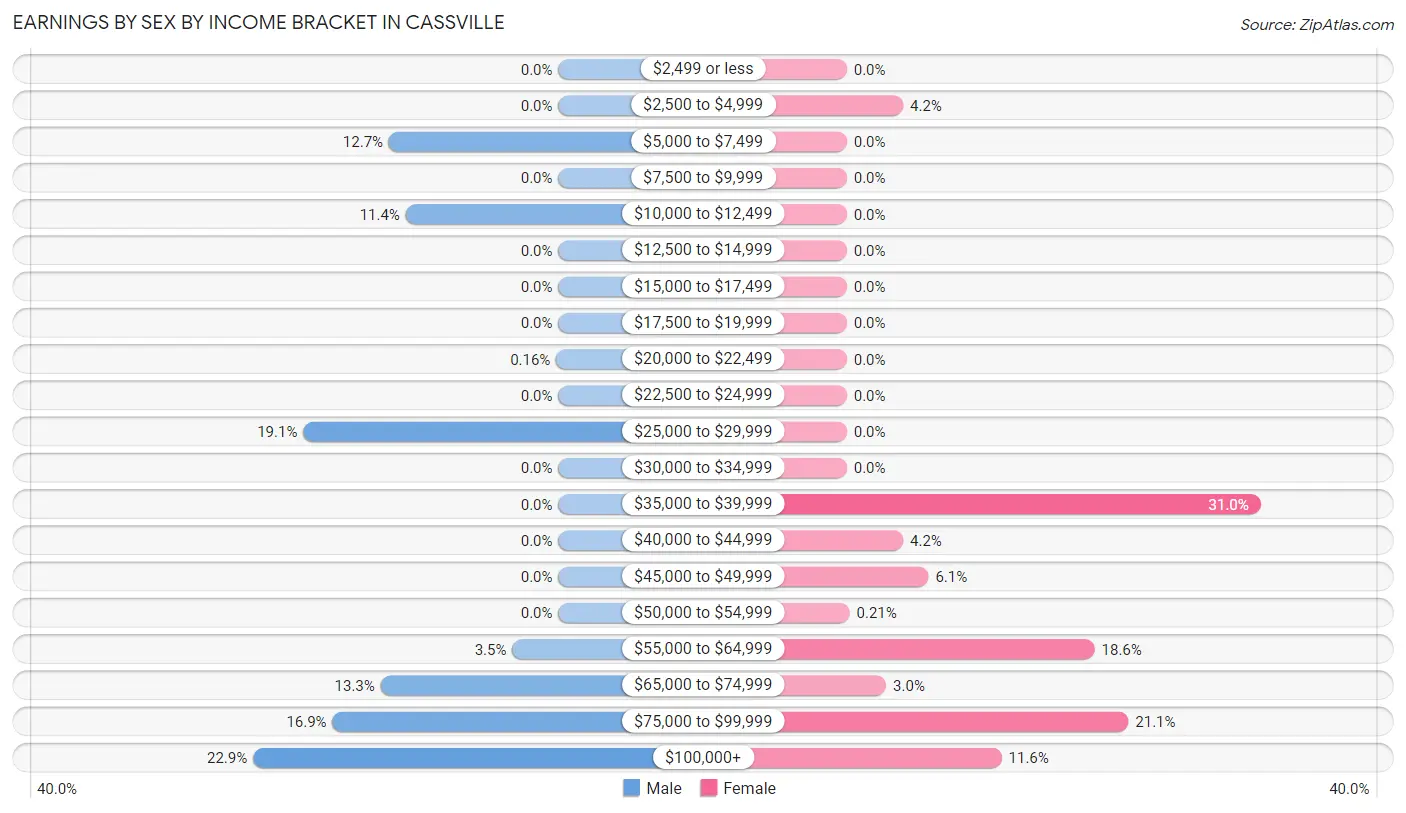
| Income | Male | Female |
| $2,499 or less | 0 (0.0%) | 0 (0.0%) |
| $2,500 to $4,999 | 0 (0.0%) | 20 (4.2%) |
| $5,000 to $7,499 | 81 (12.7%) | 0 (0.0%) |
| $7,500 to $9,999 | 0 (0.0%) | 0 (0.0%) |
| $10,000 to $12,499 | 73 (11.4%) | 0 (0.0%) |
| $12,500 to $14,999 | 0 (0.0%) | 0 (0.0%) |
| $15,000 to $17,499 | 0 (0.0%) | 0 (0.0%) |
| $17,500 to $19,999 | 0 (0.0%) | 0 (0.0%) |
| $20,000 to $22,499 | 1 (0.2%) | 0 (0.0%) |
| $22,500 to $24,999 | 0 (0.0%) | 0 (0.0%) |
| $25,000 to $29,999 | 122 (19.1%) | 0 (0.0%) |
| $30,000 to $34,999 | 0 (0.0%) | 0 (0.0%) |
| $35,000 to $39,999 | 0 (0.0%) | 147 (31.0%) |
| $40,000 to $44,999 | 0 (0.0%) | 20 (4.2%) |
| $45,000 to $49,999 | 0 (0.0%) | 29 (6.1%) |
| $50,000 to $54,999 | 0 (0.0%) | 1 (0.2%) |
| $55,000 to $64,999 | 22 (3.5%) | 88 (18.6%) |
| $65,000 to $74,999 | 85 (13.3%) | 14 (2.9%) |
| $75,000 to $99,999 | 108 (16.9%) | 100 (21.1%) |
| $100,000+ | 146 (22.9%) | 55 (11.6%) |
| Total | 638 (100.0%) | 474 (100.0%) |
Earnings by Sex by Educational Attainment in Cassville
Average earnings in Cassville are $70,938 for men and $56,507 for women, a difference of 20.3%. Men with an educational attainment of graduate degree enjoy the highest average annual earnings of $83,838, while those with college or associate's degree education earn the least with $28,443. Women with an educational attainment of college or associate's degree earn the most with the average annual earnings of $75,511, while those with bachelor's degree education have the smallest earnings of $71,250.
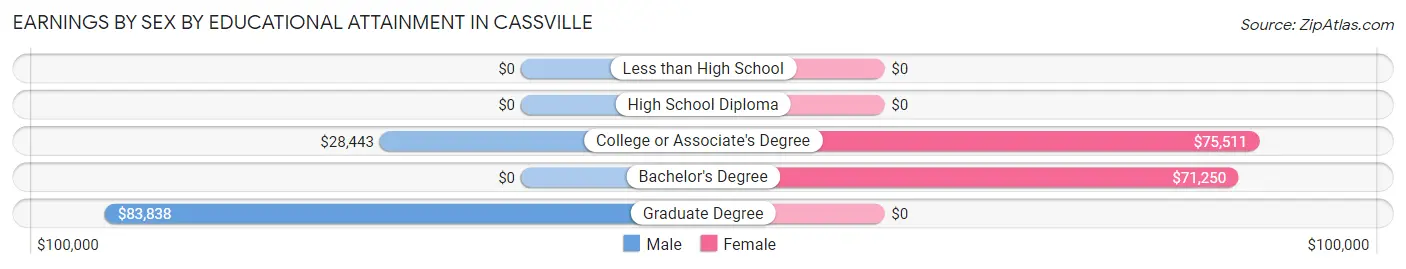
| Educational Attainment | Male Income | Female Income |
| Less than High School | - | - |
| High School Diploma | - | - |
| College or Associate's Degree | $28,443 | $75,511 |
| Bachelor's Degree | - | - |
| Graduate Degree | $83,838 | $0 |
| Total | $70,938 | $56,507 |
Family Income in Cassville
Family Income Brackets in Cassville
According to the Cassville family income data, there are 137 families falling into the $200,000+ income range, which is the most common income bracket and makes up 33.7% of all families.
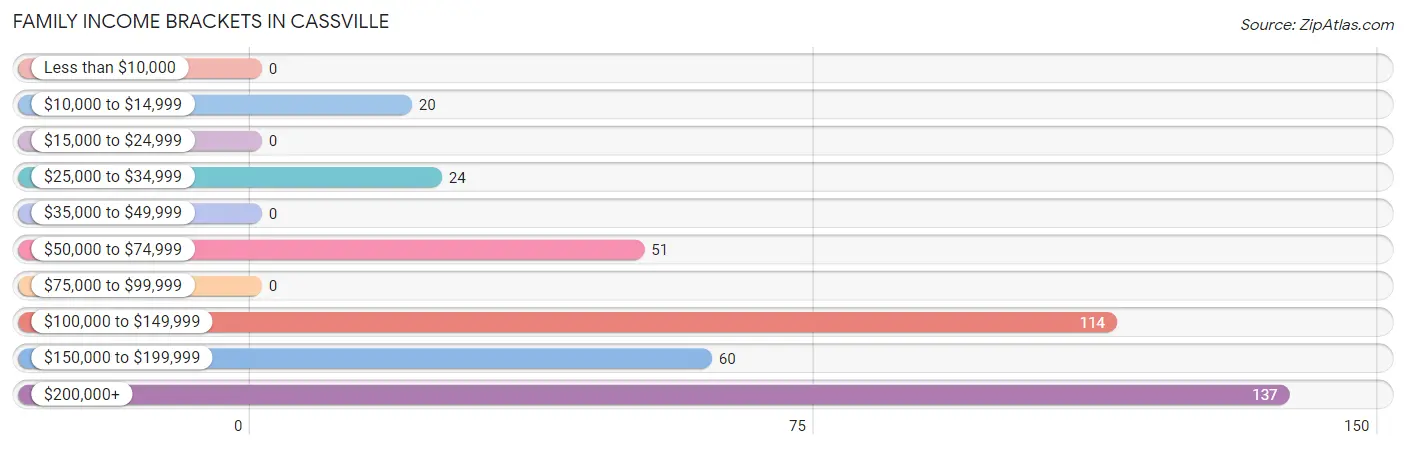
| Income Bracket | # Families | % Families |
| Less than $10,000 | 0 | 0.0% |
| $10,000 to $14,999 | 20 | 4.9% |
| $15,000 to $24,999 | 0 | 0.0% |
| $25,000 to $34,999 | 24 | 5.9% |
| $35,000 to $49,999 | 0 | 0.0% |
| $50,000 to $74,999 | 51 | 12.6% |
| $75,000 to $99,999 | 0 | 0.0% |
| $100,000 to $149,999 | 114 | 28.1% |
| $150,000 to $199,999 | 60 | 14.8% |
| $200,000+ | 137 | 33.7% |
Family Income by Famaliy Size in Cassville
3-person families (192 | 47.3%) account for the highest median family income in Cassville with $197,123 per family, while 3-person families (192 | 47.3%) have the highest median income of $65,708 per family member.
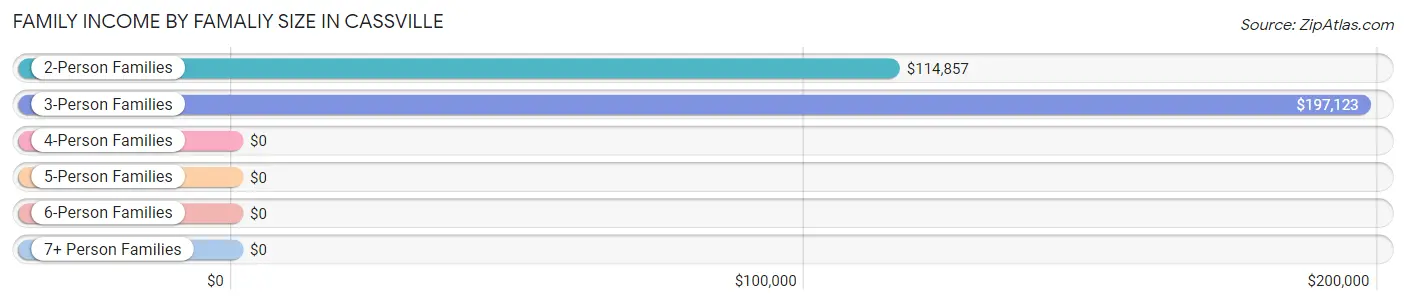
| Income Bracket | # Families | Median Income |
| 2-Person Families | 154 (37.9%) | $114,857 |
| 3-Person Families | 192 (47.3%) | $197,123 |
| 4-Person Families | 60 (14.8%) | $0 |
| 5-Person Families | 0 (0.0%) | $0 |
| 6-Person Families | 0 (0.0%) | $0 |
| 7+ Person Families | 0 (0.0%) | $0 |
| Total | 406 (100.0%) | $147,031 |
Family Income by Number of Earners in Cassville
The median family income in Cassville is $147,031, with families comprising 2 earners (117) having the highest median family income of $219,313, while families with 1 earner (60) have the lowest median family income of $58,750, accounting for 28.8% and 14.8% of families, respectively.
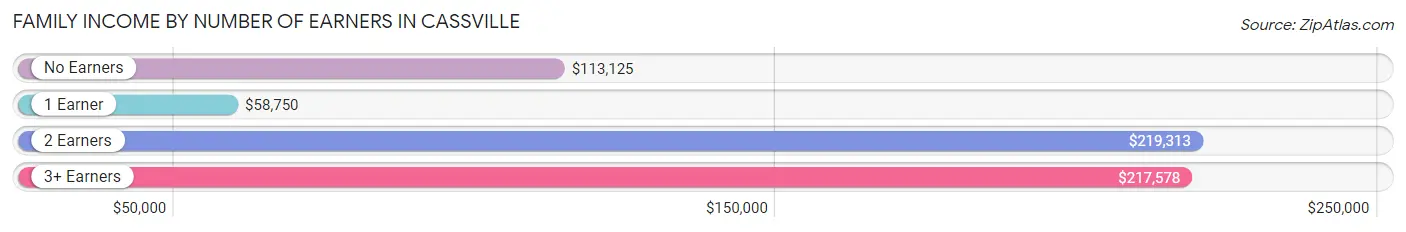
| Number of Earners | # Families | Median Income |
| No Earners | 105 (25.9%) | $113,125 |
| 1 Earner | 60 (14.8%) | $58,750 |
| 2 Earners | 117 (28.8%) | $219,313 |
| 3+ Earners | 124 (30.5%) | $217,578 |
| Total | 406 (100.0%) | $147,031 |
Household Income in Cassville
Household Income Brackets in Cassville
With 193 households falling in the category, the $50,000 to $74,999 income range is the most frequent in Cassville, accounting for 27.0% of all households.
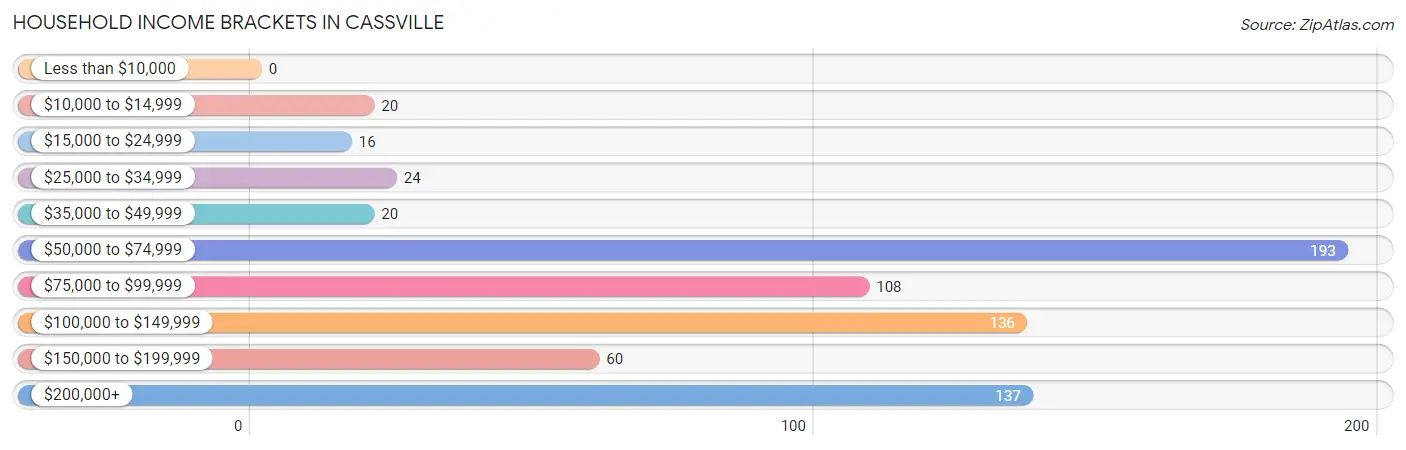
| Income Bracket | # Households | % Households |
| Less than $10,000 | 0 | 0.0% |
| $10,000 to $14,999 | 20 | 2.8% |
| $15,000 to $24,999 | 16 | 2.2% |
| $25,000 to $34,999 | 24 | 3.4% |
| $35,000 to $49,999 | 20 | 2.8% |
| $50,000 to $74,999 | 193 | 27.0% |
| $75,000 to $99,999 | 108 | 15.1% |
| $100,000 to $149,999 | 136 | 19.0% |
| $150,000 to $199,999 | 60 | 8.4% |
| $200,000+ | 137 | 19.2% |
Household Income by Householder Age in Cassville
The median household income in Cassville is $85,878, with the highest median household income of $113,125 found in the 65+ years age bracket for the primary householder. A total of 105 households (14.7%) fall into this category. Meanwhile, the 15 to 24 years age bracket for the primary householder has the lowest median household income of $0, with 16 households (2.2%) in this group.
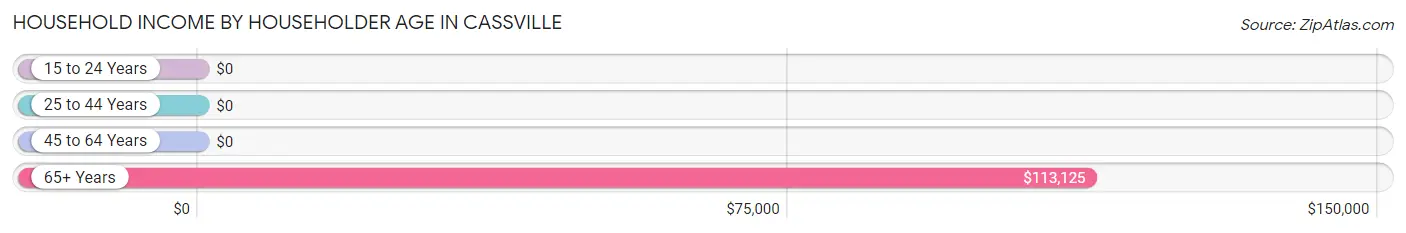
| Income Bracket | # Households | Median Income |
| 15 to 24 Years | 16 (2.2%) | $0 |
| 25 to 44 Years | 222 (31.1%) | $0 |
| 45 to 64 Years | 371 (52.0%) | $0 |
| 65+ Years | 105 (14.7%) | $113,125 |
| Total | 714 (100.0%) | $85,878 |
Poverty in Cassville
Income Below Poverty by Sex and Age in Cassville
With 2.4% poverty level for males and 5.2% for females among the residents of Cassville, under 5 year old males and 12 to 14 year old females are the most vulnerable to poverty, with 20 males (48.8%) and 19 females (100.0%) in their respective age groups living below the poverty level.
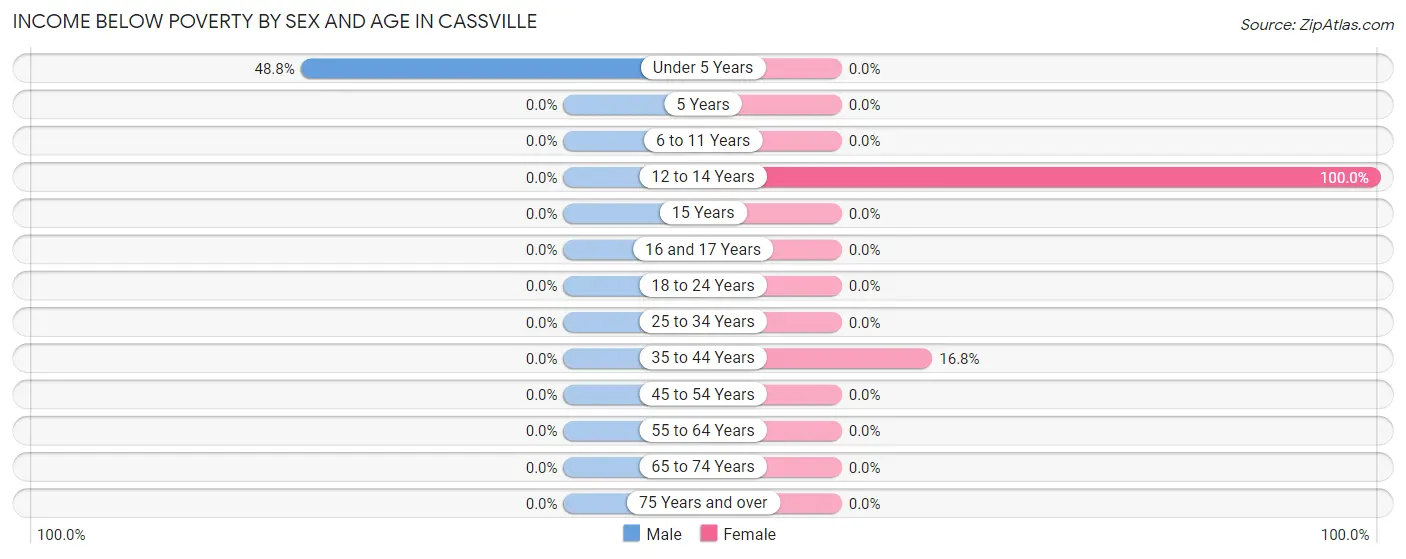
| Age Bracket | Male | Female |
| Under 5 Years | 20 (48.8%) | 0 (0.0%) |
| 5 Years | 0 (0.0%) | 0 (0.0%) |
| 6 to 11 Years | 0 (0.0%) | 0 (0.0%) |
| 12 to 14 Years | 0 (0.0%) | 19 (100.0%) |
| 15 Years | 0 (0.0%) | 0 (0.0%) |
| 16 and 17 Years | 0 (0.0%) | 0 (0.0%) |
| 18 to 24 Years | 0 (0.0%) | 0 (0.0%) |
| 25 to 34 Years | 0 (0.0%) | 0 (0.0%) |
| 35 to 44 Years | 0 (0.0%) | 20 (16.8%) |
| 45 to 54 Years | 0 (0.0%) | 0 (0.0%) |
| 55 to 64 Years | 0 (0.0%) | 0 (0.0%) |
| 65 to 74 Years | 0 (0.0%) | 0 (0.0%) |
| 75 Years and over | 0 (0.0%) | 0 (0.0%) |
| Total | 20 (2.4%) | 39 (5.2%) |
Income Above Poverty by Sex and Age in Cassville
According to the poverty statistics in Cassville, males aged 12 to 14 years and females aged under 5 years are the age groups that are most secure financially, with 100.0% of males and 100.0% of females in these age groups living above the poverty line.
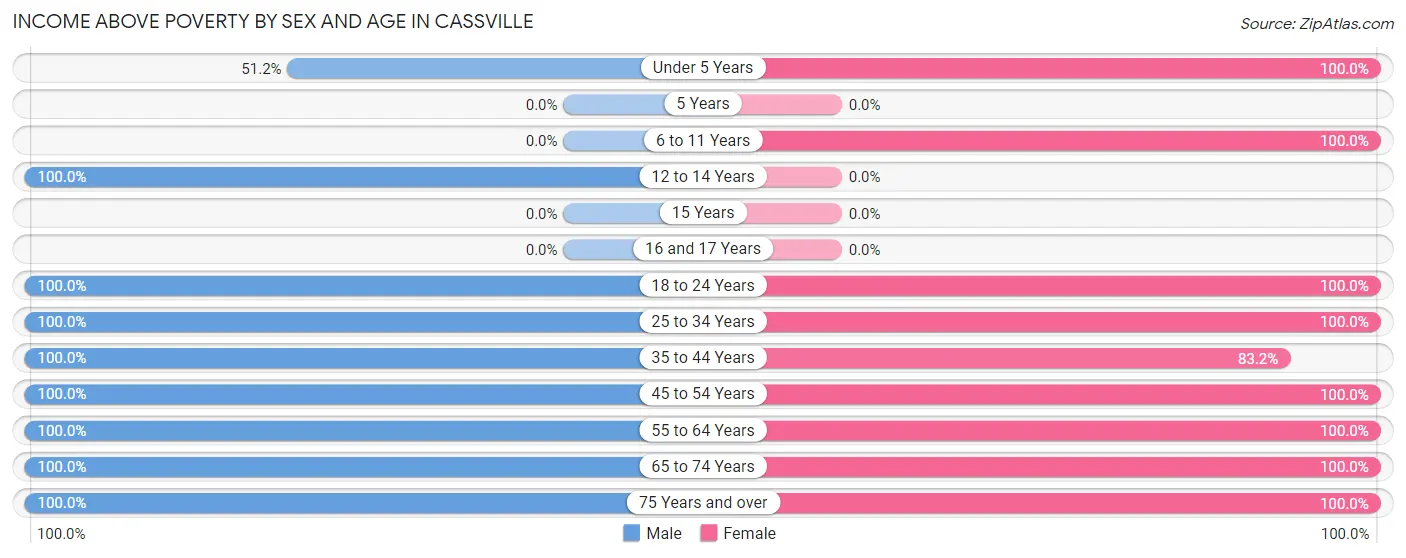
| Age Bracket | Male | Female |
| Under 5 Years | 21 (51.2%) | 82 (100.0%) |
| 5 Years | 0 (0.0%) | 0 (0.0%) |
| 6 to 11 Years | 0 (0.0%) | 38 (100.0%) |
| 12 to 14 Years | 21 (100.0%) | 0 (0.0%) |
| 15 Years | 0 (0.0%) | 0 (0.0%) |
| 16 and 17 Years | 0 (0.0%) | 0 (0.0%) |
| 18 to 24 Years | 90 (100.0%) | 1 (100.0%) |
| 25 to 34 Years | 143 (100.0%) | 95 (100.0%) |
| 35 to 44 Years | 207 (100.0%) | 99 (83.2%) |
| 45 to 54 Years | 165 (100.0%) | 288 (100.0%) |
| 55 to 64 Years | 53 (100.0%) | 22 (100.0%) |
| 65 to 74 Years | 70 (100.0%) | 70 (100.0%) |
| 75 Years and over | 35 (100.0%) | 11 (100.0%) |
| Total | 805 (97.6%) | 706 (94.8%) |
Income Below Poverty Among Married-Couple Families in Cassville
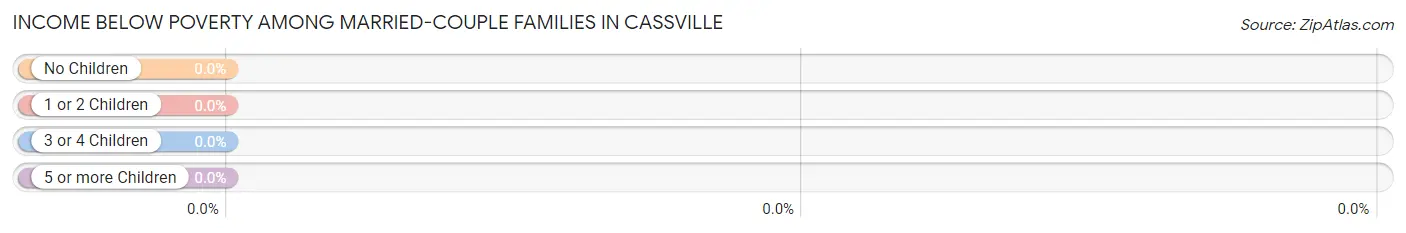
| Children | Above Poverty | Below Poverty |
| No Children | 271 (100.0%) | 0 (0.0%) |
| 1 or 2 Children | 84 (100.0%) | 0 (0.0%) |
| 3 or 4 Children | 0 (0.0%) | 0 (0.0%) |
| 5 or more Children | 0 (0.0%) | 0 (0.0%) |
| Total | 355 (100.0%) | 0 (0.0%) |
Income Below Poverty Among Single-Parent Households in Cassville
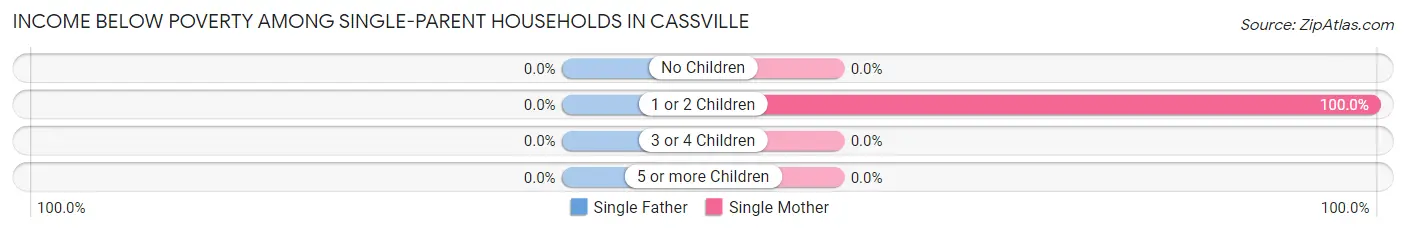
| Children | Single Father | Single Mother |
| No Children | 0 (0.0%) | 0 (0.0%) |
| 1 or 2 Children | 0 (0.0%) | 20 (100.0%) |
| 3 or 4 Children | 0 (0.0%) | 0 (0.0%) |
| 5 or more Children | 0 (0.0%) | 0 (0.0%) |
| Total | 0 (0.0%) | 20 (100.0%) |
Income Below Poverty Among Married-Couple vs Single-Parent Households in Cassville
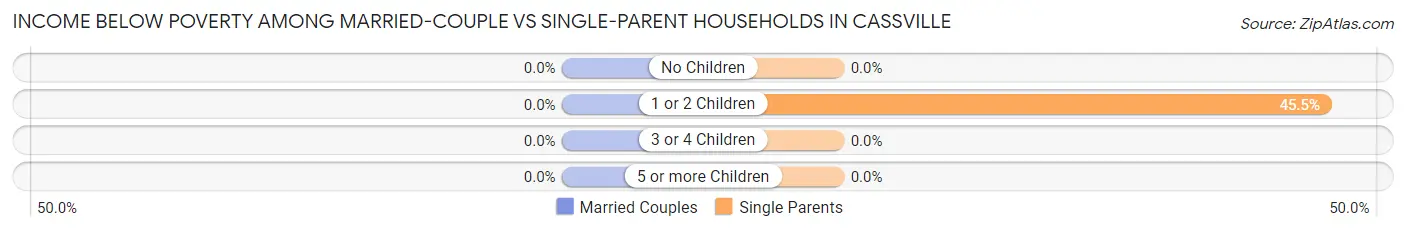
| Children | Married-Couple Families | Single-Parent Households |
| No Children | 0 (0.0%) | 0 (0.0%) |
| 1 or 2 Children | 0 (0.0%) | 20 (45.5%) |
| 3 or 4 Children | 0 (0.0%) | 0 (0.0%) |
| 5 or more Children | 0 (0.0%) | 0 (0.0%) |
| Total | 0 (0.0%) | 20 (39.2%) |
Race in Cassville
The most populous races in Cassville are White / Caucasian (1,561 | 99.4%), and Some other Race (9 | 0.6%).
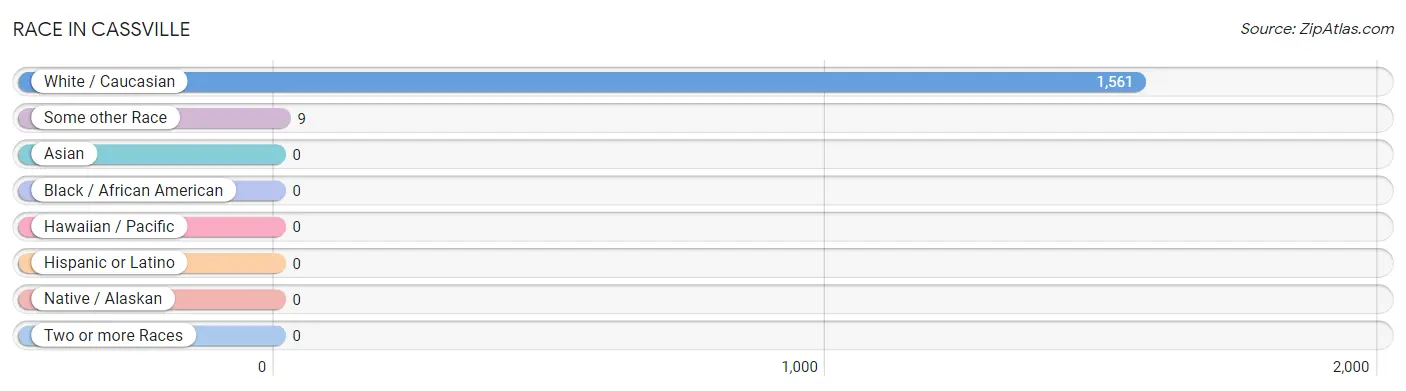
| Race | # Population | % Population |
| Asian | 0 | 0.0% |
| Black / African American | 0 | 0.0% |
| Hawaiian / Pacific | 0 | 0.0% |
| Hispanic or Latino | 0 | 0.0% |
| Native / Alaskan | 0 | 0.0% |
| White / Caucasian | 1,561 | 99.4% |
| Two or more Races | 0 | 0.0% |
| Some other Race | 9 | 0.6% |
| Total | 1,570 | 100.0% |
Ancestry in Cassville
The most populous ancestries reported in Cassville are English (224 | 14.3%), German (199 | 12.7%), Hungarian (140 | 8.9%), Czech (118 | 7.5%), and Slovak (118 | 7.5%), together accounting for 50.9% of all Cassville residents.
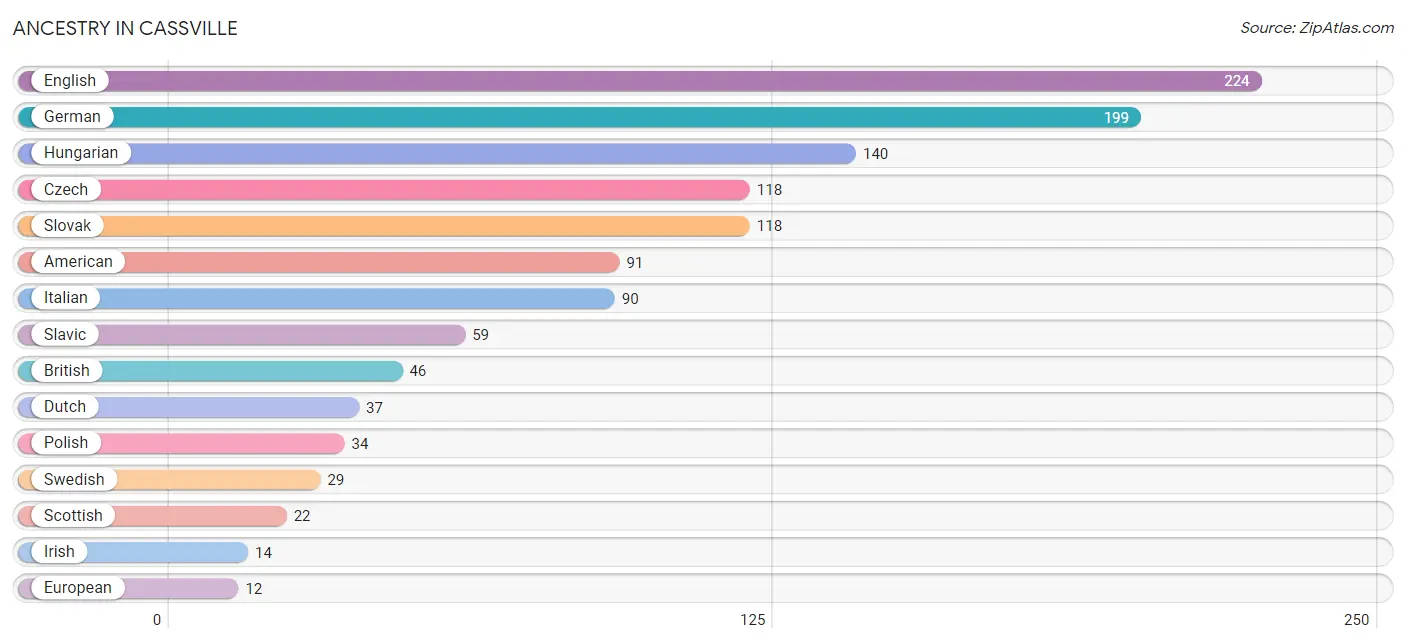
| Ancestry | # Population | % Population |
| American | 91 | 5.8% |
| British | 46 | 2.9% |
| Czech | 118 | 7.5% |
| Dutch | 37 | 2.4% |
| English | 224 | 14.3% |
| European | 12 | 0.8% |
| German | 199 | 12.7% |
| Hungarian | 140 | 8.9% |
| Irish | 14 | 0.9% |
| Italian | 90 | 5.7% |
| Polish | 34 | 2.2% |
| Scottish | 22 | 1.4% |
| Slavic | 59 | 3.8% |
| Slovak | 118 | 7.5% |
| Swedish | 29 | 1.8% | View All 15 Rows |
Immigrants in Cassville

| Immigration Origin | # Population | % Population | View All 0 Rows |
Sex and Age in Cassville
Sex and Age in Cassville
The most populous age groups in Cassville are 40 to 44 Years (150 | 18.2%) for men and 45 to 49 Years (220 | 29.5%) for women.
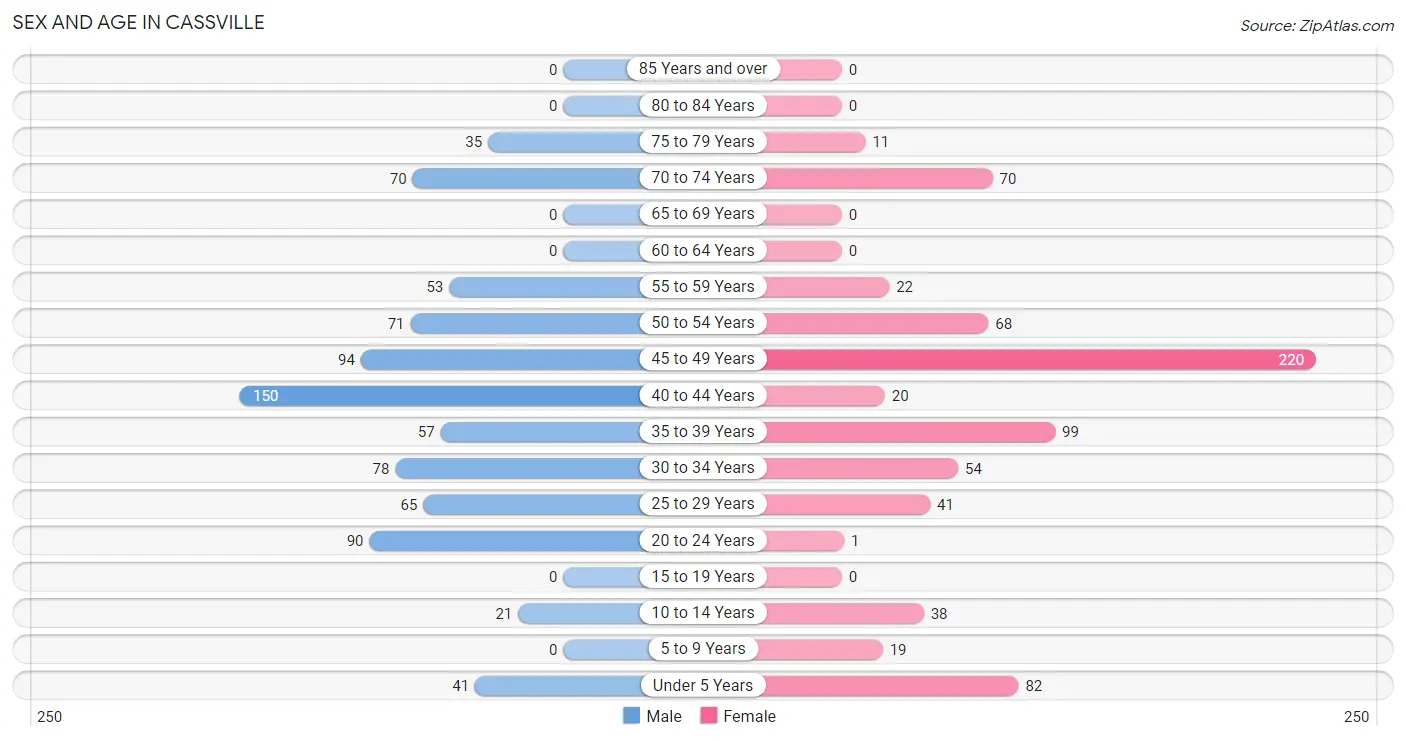
| Age Bracket | Male | Female |
| Under 5 Years | 41 (5.0%) | 82 (11.0%) |
| 5 to 9 Years | 0 (0.0%) | 19 (2.5%) |
| 10 to 14 Years | 21 (2.5%) | 38 (5.1%) |
| 15 to 19 Years | 0 (0.0%) | 0 (0.0%) |
| 20 to 24 Years | 90 (10.9%) | 1 (0.1%) |
| 25 to 29 Years | 65 (7.9%) | 41 (5.5%) |
| 30 to 34 Years | 78 (9.5%) | 54 (7.2%) |
| 35 to 39 Years | 57 (6.9%) | 99 (13.3%) |
| 40 to 44 Years | 150 (18.2%) | 20 (2.7%) |
| 45 to 49 Years | 94 (11.4%) | 220 (29.5%) |
| 50 to 54 Years | 71 (8.6%) | 68 (9.1%) |
| 55 to 59 Years | 53 (6.4%) | 22 (2.9%) |
| 60 to 64 Years | 0 (0.0%) | 0 (0.0%) |
| 65 to 69 Years | 0 (0.0%) | 0 (0.0%) |
| 70 to 74 Years | 70 (8.5%) | 70 (9.4%) |
| 75 to 79 Years | 35 (4.2%) | 11 (1.5%) |
| 80 to 84 Years | 0 (0.0%) | 0 (0.0%) |
| 85 Years and over | 0 (0.0%) | 0 (0.0%) |
| Total | 825 (100.0%) | 745 (100.0%) |
Families and Households in Cassville
Median Family Size in Cassville
The median family size in Cassville is 2.81 persons per family, with single female/mother families (20 | 4.9%) accounting for the largest median family size of 2.95 persons per family. On the other hand, married-couple families (355 | 87.4%) represent the smallest median family size with 2.80 persons per family.
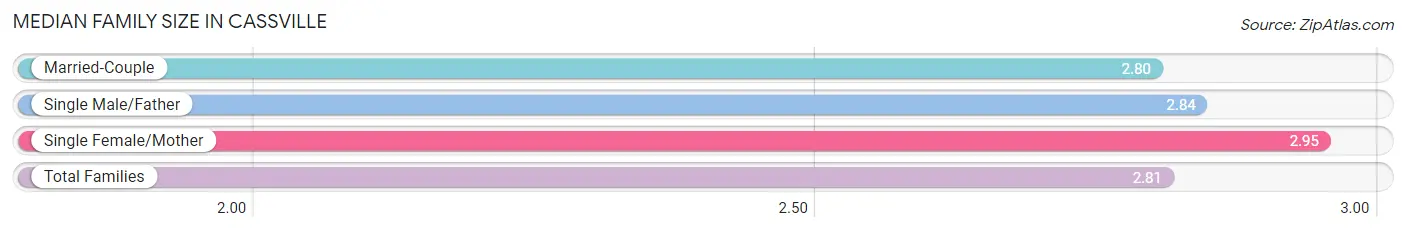
| Family Type | # Families | Family Size |
| Married-Couple | 355 (87.4%) | 2.80 |
| Single Male/Father | 31 (7.6%) | 2.84 |
| Single Female/Mother | 20 (4.9%) | 2.95 |
| Total Families | 406 (100.0%) | 2.81 |
Median Household Size in Cassville
The median household size in Cassville is 2.20 persons per household, with single female/mother households (20 | 2.8%) accounting for the largest median household size of 2.95 persons per household. non-family households (308 | 43.1%) represent the smallest median household size with 1.40 persons per household.
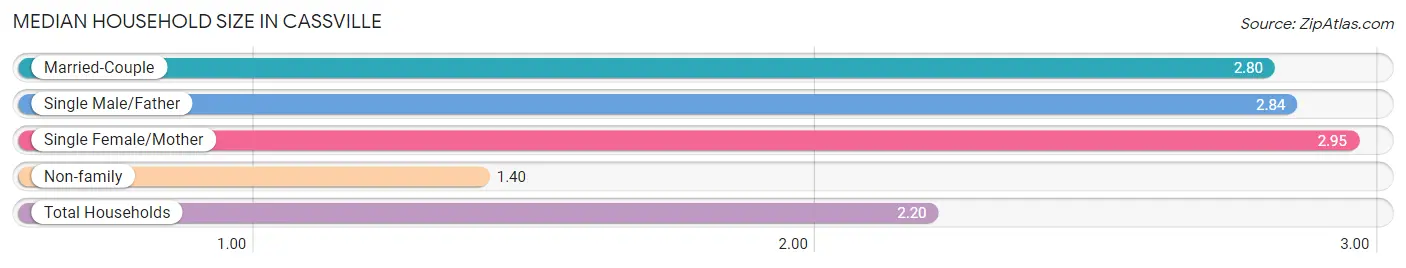
| Household Type | # Households | Household Size |
| Married-Couple | 355 (49.7%) | 2.80 |
| Single Male/Father | 31 (4.3%) | 2.84 |
| Single Female/Mother | 20 (2.8%) | 2.95 |
| Non-family | 308 (43.1%) | 1.40 |
| Total Households | 714 (100.0%) | 2.20 |
Household Size by Marriage Status in Cassville
Out of a total of 714 households in Cassville, 406 (56.9%) are family households, while 308 (43.1%) are nonfamily households. The most numerous type of family households are 3-person households, comprising 192, and the most common type of nonfamily households are 1-person households, comprising 180.
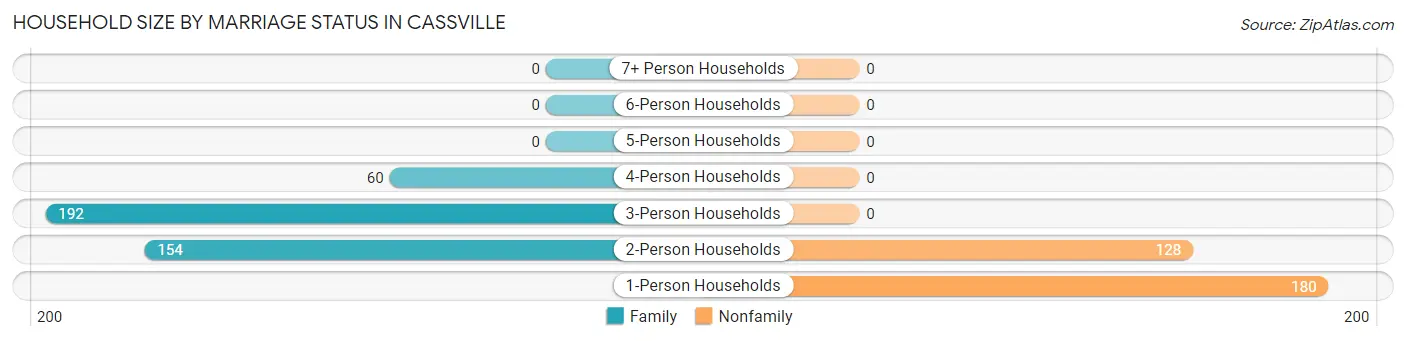
| Household Size | Family Households | Nonfamily Households |
| 1-Person Households | - | 180 (25.2%) |
| 2-Person Households | 154 (21.6%) | 128 (17.9%) |
| 3-Person Households | 192 (26.9%) | 0 (0.0%) |
| 4-Person Households | 60 (8.4%) | 0 (0.0%) |
| 5-Person Households | 0 (0.0%) | 0 (0.0%) |
| 6-Person Households | 0 (0.0%) | 0 (0.0%) |
| 7+ Person Households | 0 (0.0%) | 0 (0.0%) |
| Total | 406 (56.9%) | 308 (43.1%) |
Female Fertility in Cassville
Fertility by Age in Cassville
Average fertility rate in Cassville is 48.0 births per 1,000 women. Women in the age bracket of 20 to 34 years have the highest fertility rate with 219.0 births per 1,000 women. Women in the age bracket of 20 to 34 years acount for 100.0% of all women with births.
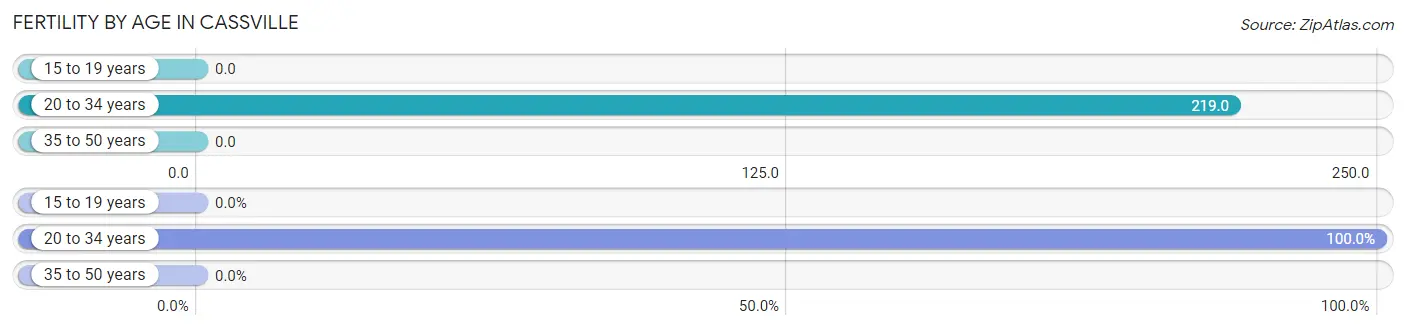
| Age Bracket | Women with Births | Births / 1,000 Women |
| 15 to 19 years | 0 (0.0%) | 0.0 |
| 20 to 34 years | 21 (100.0%) | 219.0 |
| 35 to 50 years | 0 (0.0%) | 0.0 |
| Total | 21 (100.0%) | 48.0 |
Fertility by Age by Marriage Status in Cassville
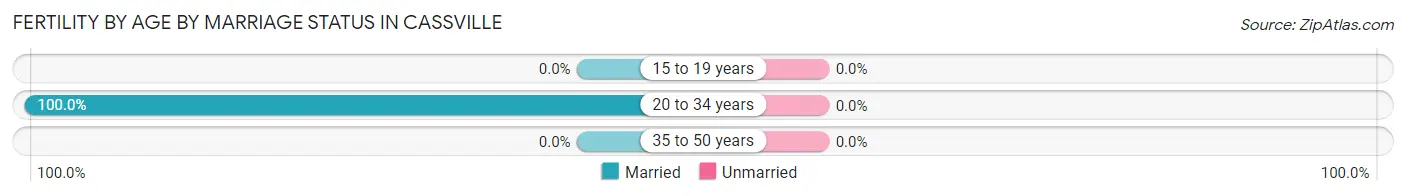
| Age Bracket | Married | Unmarried |
| 15 to 19 years | 0 (0.0%) | 0 (0.0%) |
| 20 to 34 years | 21 (100.0%) | 0 (0.0%) |
| 35 to 50 years | 0 (0.0%) | 0 (0.0%) |
| Total | 21 (100.0%) | 0 (0.0%) |
Fertility by Education in Cassville
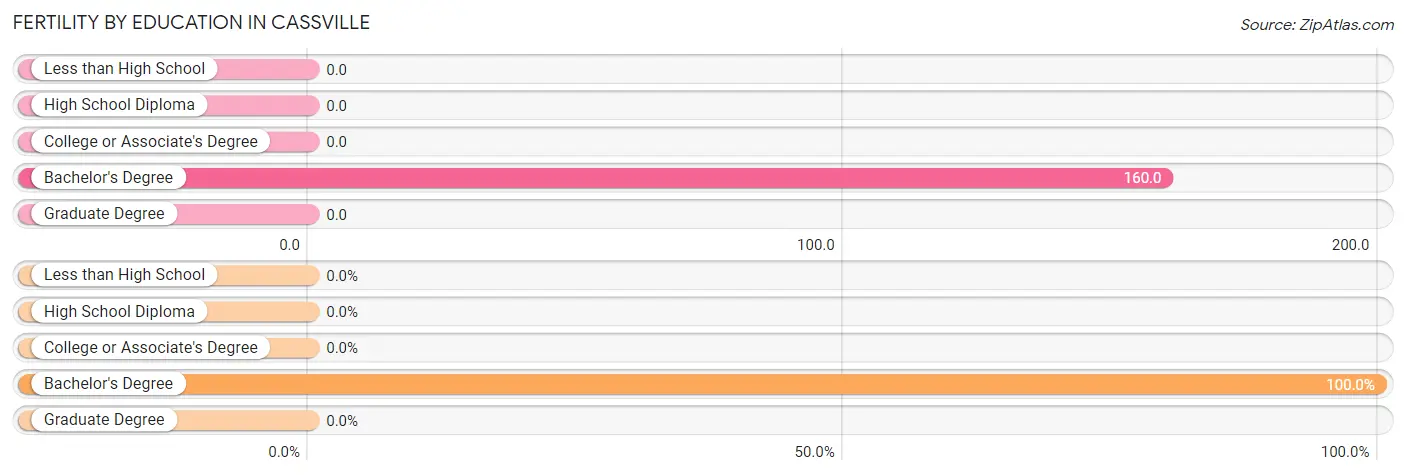
| Educational Attainment | Women with Births | Births / 1,000 Women |
| Less than High School | 0 (0.0%) | 0.0 |
| High School Diploma | 0 (0.0%) | 0.0 |
| College or Associate's Degree | 0 (0.0%) | 0.0 |
| Bachelor's Degree | 21 (100.0%) | 160.0 |
| Graduate Degree | 0 (0.0%) | 0.0 |
| Total | 21 (100.0%) | 48.0 |
Fertility by Education by Marriage Status in Cassville
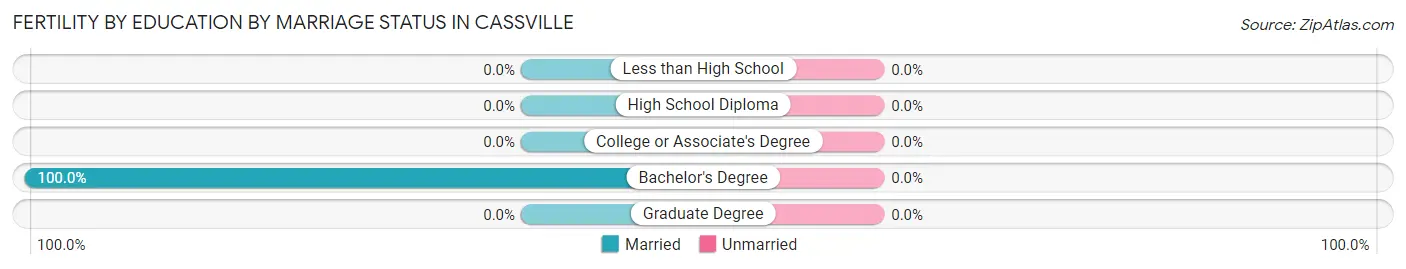
| Educational Attainment | Married | Unmarried |
| Less than High School | 0 (0.0%) | 0 (0.0%) |
| High School Diploma | 0 (0.0%) | 0 (0.0%) |
| College or Associate's Degree | 0 (0.0%) | 0 (0.0%) |
| Bachelor's Degree | 21 (100.0%) | 0 (0.0%) |
| Graduate Degree | 0 (0.0%) | 0 (0.0%) |
| Total | 21 (100.0%) | 0 (0.0%) |
Employment Characteristics in Cassville
Employment by Class of Employer in Cassville
Among the 1,032 employed individuals in Cassville, private company employees (708 | 68.6%), local government employees (128 | 12.4%), and not-for-profit organizations (125 | 12.1%) make up the most common classes of employment.
| Employer Class | # Employees | % Employees |
| Private Company Employees | 708 | 68.6% |
| Self-Employed (Incorporated) | 0 | 0.0% |
| Self-Employed (Not Incorporated) | 0 | 0.0% |
| Not-for-profit Organizations | 125 | 12.1% |
| Local Government Employees | 128 | 12.4% |
| State Government Employees | 64 | 6.2% |
| Federal Government Employees | 7 | 0.7% |
| Unpaid Family Workers | 0 | 0.0% |
| Total | 1,032 | 100.0% |
Employment Status by Age in Cassville
According to the labor force statistics for Cassville, out of the total population over 16 years of age (1,369), 76.8% or 1,051 individuals are in the labor force, with 1.9% or 20 of them unemployed. The age group with the highest labor force participation rate is 30 to 34 years, with 100.0% or 132 individuals in the labor force. Within the labor force, the 25 to 29 years age range has the highest percentage of unemployed individuals, with 23.5% or 20 of them being unemployed.
| Age Bracket | In Labor Force | Unemployed |
| 16 to 19 Years | 0 (0.0%) | 0 (0.0%) |
| 20 to 24 Years | 75 (82.4%) | 0 (0.0%) |
| 25 to 29 Years | 85 (80.2%) | 20 (23.5%) |
| 30 to 34 Years | 132 (100.0%) | 0 (0.0%) |
| 35 to 44 Years | 255 (78.2%) | 0 (0.0%) |
| 45 to 54 Years | 430 (94.9%) | 0 (0.0%) |
| 55 to 59 Years | 75 (100.0%) | 0 (0.0%) |
| 60 to 64 Years | 0 (0.0%) | 0 (0.0%) |
| 65 to 74 Years | 0 (0.0%) | 0 (0.0%) |
| 75 Years and over | 0 (0.0%) | 0 (0.0%) |
| Total | 1,051 (76.8%) | 20 (1.9%) |
Employment Status by Educational Attainment in Cassville
According to labor force statistics for Cassville, 89.5% of individuals (977) out of the total population between 25 and 64 years of age (1,092) are in the labor force, with 2.0% or 20 of them being unemployed. The group with the highest labor force participation rate are those with the educational attainment of college / associate degree, with 94.2% or 327 individuals in the labor force. Within the labor force, individuals with bachelor's degree or higher education have the highest percentage of unemployment, with 4.7% or 20 of them being unemployed.
| Educational Attainment | In Labor Force | Unemployed |
| Less than High School | 0 (0.0%) | 0 (0.0%) |
| High School Diploma | 225 (87.9%) | 0 (0.0%) |
| College / Associate Degree | 327 (94.2%) | 0 (0.0%) |
| Bachelor's Degree or higher | 425 (91.2%) | 22 (4.7%) |
| Total | 977 (89.5%) | 22 (2.0%) |
Employment Occupations by Sex in Cassville
Management, Business, Science and Arts Occupations
The most common Management, Business, Science and Arts occupations in Cassville are Health Diagnosing & Treating (200 | 19.4%), Business & Financial (124 | 12.0%), Computers, Engineering & Science (104 | 10.1%), Life, Physical & Social Science (73 | 7.1%), and Management (57 | 5.5%).
Management, Business, Science and Arts Occupations by Sex
Within the Management, Business, Science and Arts occupations in Cassville, the most male-oriented occupations are Computers, Engineering & Science (100.0%), Computers & Mathematics (100.0%), and Architecture & Engineering (100.0%), while the most female-oriented occupations are Community & Social Service (100.0%), Education, Arts & Media (100.0%), and Education Instruction & Library (100.0%).
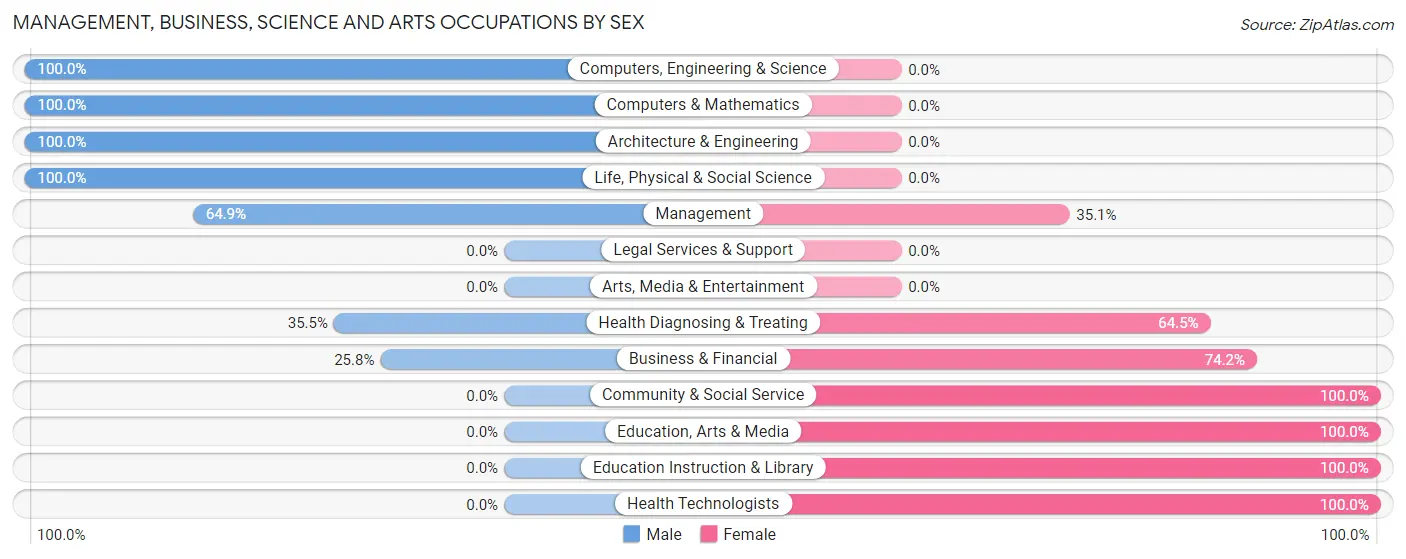
| Occupation | Male | Female |
| Management | 37 (64.9%) | 20 (35.1%) |
| Business & Financial | 32 (25.8%) | 92 (74.2%) |
| Computers, Engineering & Science | 104 (100.0%) | 0 (0.0%) |
| Computers & Mathematics | 7 (100.0%) | 0 (0.0%) |
| Architecture & Engineering | 24 (100.0%) | 0 (0.0%) |
| Life, Physical & Social Science | 73 (100.0%) | 0 (0.0%) |
| Community & Social Service | 0 (0.0%) | 45 (100.0%) |
| Education, Arts & Media | 0 (0.0%) | 32 (100.0%) |
| Legal Services & Support | 0 (0.0%) | 0 (0.0%) |
| Education Instruction & Library | 0 (0.0%) | 13 (100.0%) |
| Arts, Media & Entertainment | 0 (0.0%) | 0 (0.0%) |
| Health Diagnosing & Treating | 71 (35.5%) | 129 (64.5%) |
| Health Technologists | 0 (0.0%) | 34 (100.0%) |
| Total (Category) | 244 (46.0%) | 286 (54.0%) |
| Total (Overall) | 599 (58.0%) | 433 (42.0%) |
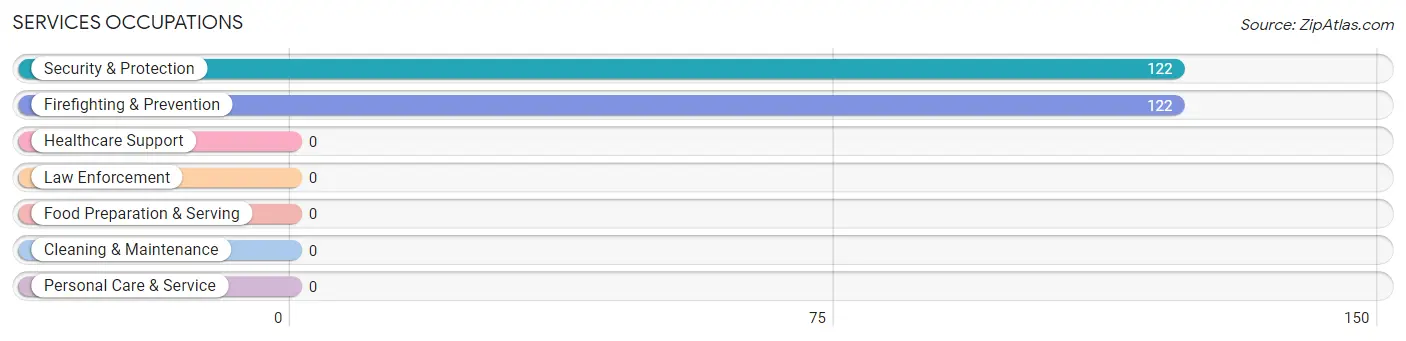
Services Occupations
The most common Services occupations in Cassville are Security & Protection (122 | 11.8%), and Firefighting & Prevention (122 | 11.8%).
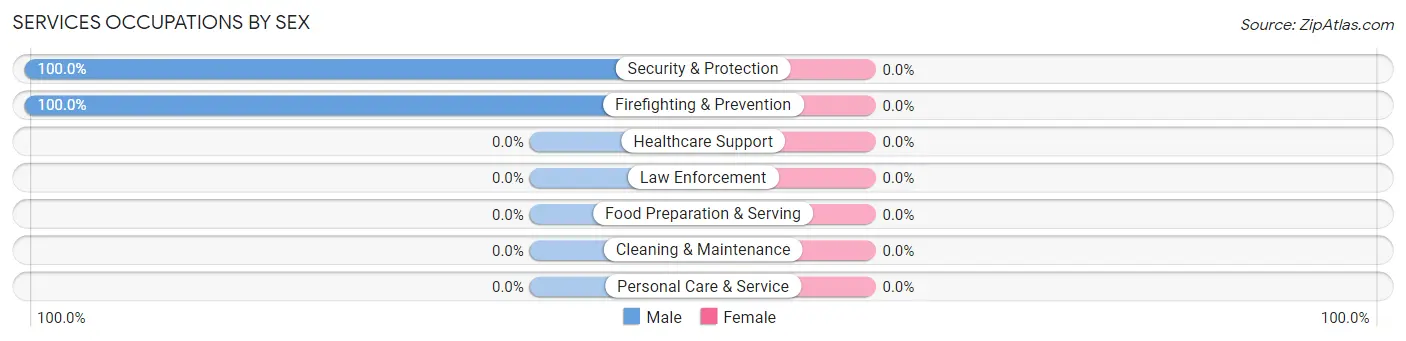
Services Occupations by Sex
| Occupation | Male | Female |
| Healthcare Support | 0 (0.0%) | 0 (0.0%) |
| Security & Protection | 122 (100.0%) | 0 (0.0%) |
| Firefighting & Prevention | 122 (100.0%) | 0 (0.0%) |
| Law Enforcement | 0 (0.0%) | 0 (0.0%) |
| Food Preparation & Serving | 0 (0.0%) | 0 (0.0%) |
| Cleaning & Maintenance | 0 (0.0%) | 0 (0.0%) |
| Personal Care & Service | 0 (0.0%) | 0 (0.0%) |
| Total (Category) | 122 (100.0%) | 0 (0.0%) |
| Total (Overall) | 599 (58.0%) | 433 (42.0%) |
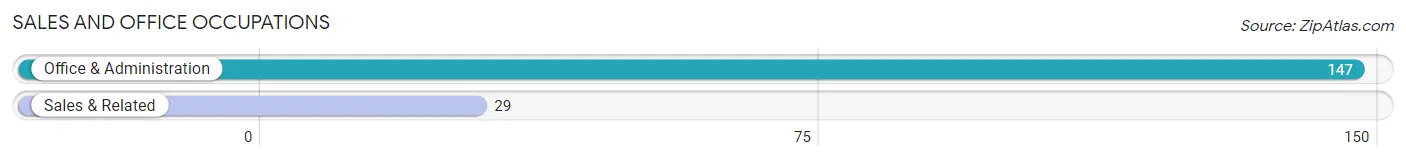
Sales and Office Occupations
The most common Sales and Office occupations in Cassville are Office & Administration (147 | 14.2%), and Sales & Related (29 | 2.8%).
Sales and Office Occupations by Sex

| Occupation | Male | Female |
| Sales & Related | 29 (100.0%) | 0 (0.0%) |
| Office & Administration | 0 (0.0%) | 147 (100.0%) |
| Total (Category) | 29 (16.5%) | 147 (83.5%) |
| Total (Overall) | 599 (58.0%) | 433 (42.0%) |
Natural Resources, Construction and Maintenance Occupations
The most common Natural Resources, Construction and Maintenance occupations in Cassville are , and Construction & Extraction (22 | 2.1%).

Natural Resources, Construction and Maintenance Occupations by Sex

| Occupation | Male | Female |
| Farming, Fishing & Forestry | 0 (0.0%) | 0 (0.0%) |
| Construction & Extraction | 22 (100.0%) | 0 (0.0%) |
| Installation, Maintenance & Repair | 0 (0.0%) | 0 (0.0%) |
| Total (Category) | 22 (100.0%) | 0 (0.0%) |
| Total (Overall) | 599 (58.0%) | 433 (42.0%) |
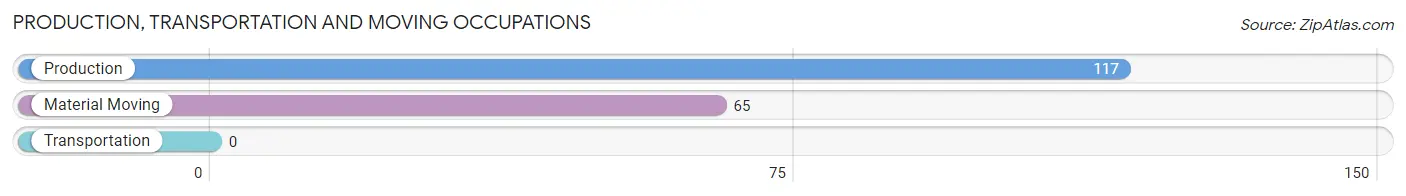
Production, Transportation and Moving Occupations
The most common Production, Transportation and Moving occupations in Cassville are Production (117 | 11.3%), and Material Moving (65 | 6.3%).
Production, Transportation and Moving Occupations by Sex
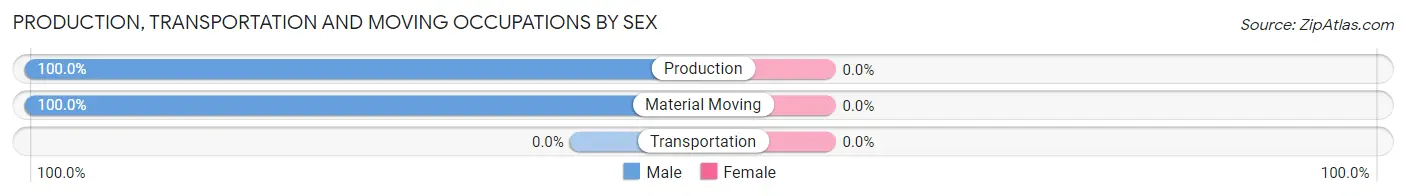
| Occupation | Male | Female |
| Production | 117 (100.0%) | 0 (0.0%) |
| Transportation | 0 (0.0%) | 0 (0.0%) |
| Material Moving | 65 (100.0%) | 0 (0.0%) |
| Total (Category) | 182 (100.0%) | 0 (0.0%) |
| Total (Overall) | 599 (58.0%) | 433 (42.0%) |
Employment Industries by Sex in Cassville
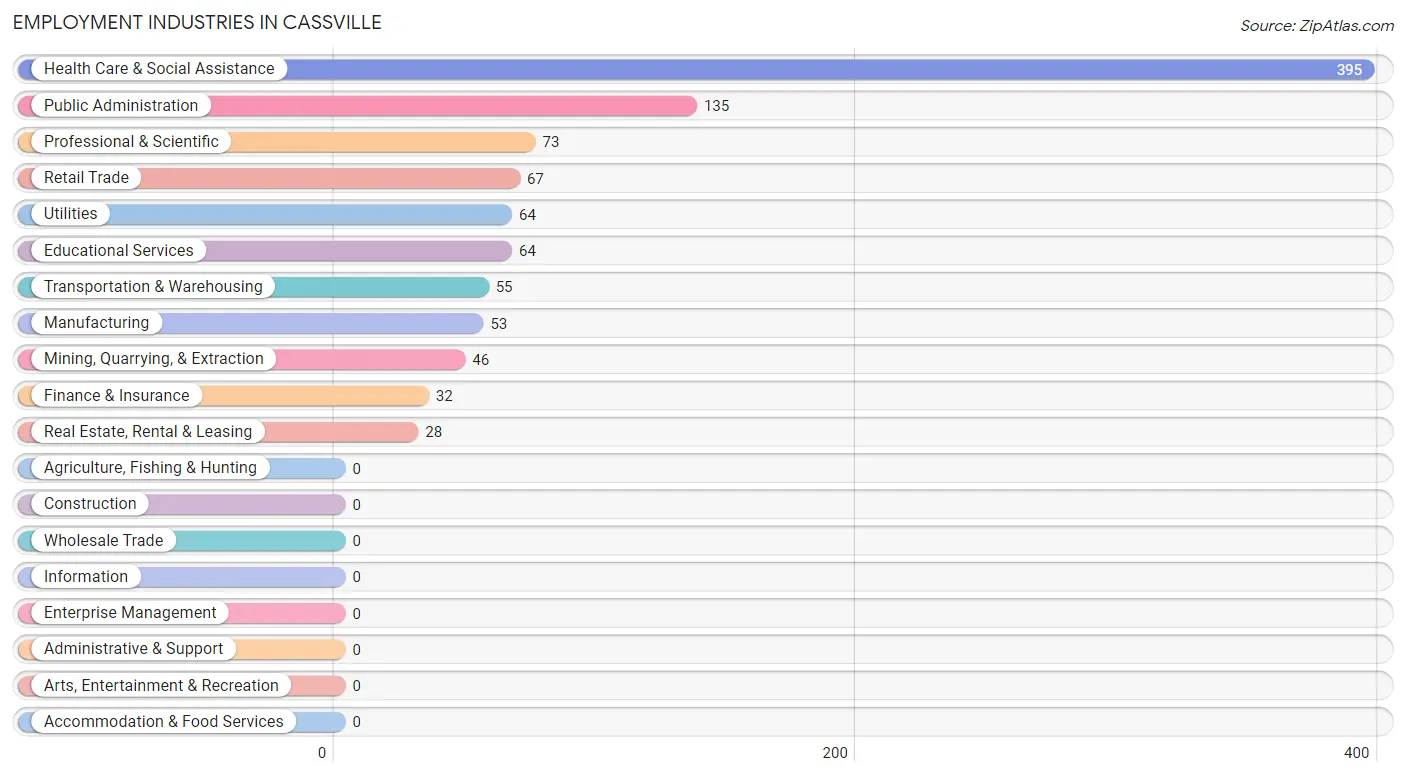
Employment Industries in Cassville
The major employment industries in Cassville include Health Care & Social Assistance (395 | 38.3%), Public Administration (135 | 13.1%), Professional & Scientific (73 | 7.1%), Retail Trade (67 | 6.5%), and Utilities (64 | 6.2%).
Employment Industries by Sex in Cassville
The Cassville industries that see more men than women are Mining, Quarrying, & Extraction (100.0%), Manufacturing (100.0%), and Utilities (100.0%), whereas the industries that tend to have a higher number of women are Transportation & Warehousing (100.0%), Public Administration (94.8%), and Health Care & Social Assistance (51.1%).
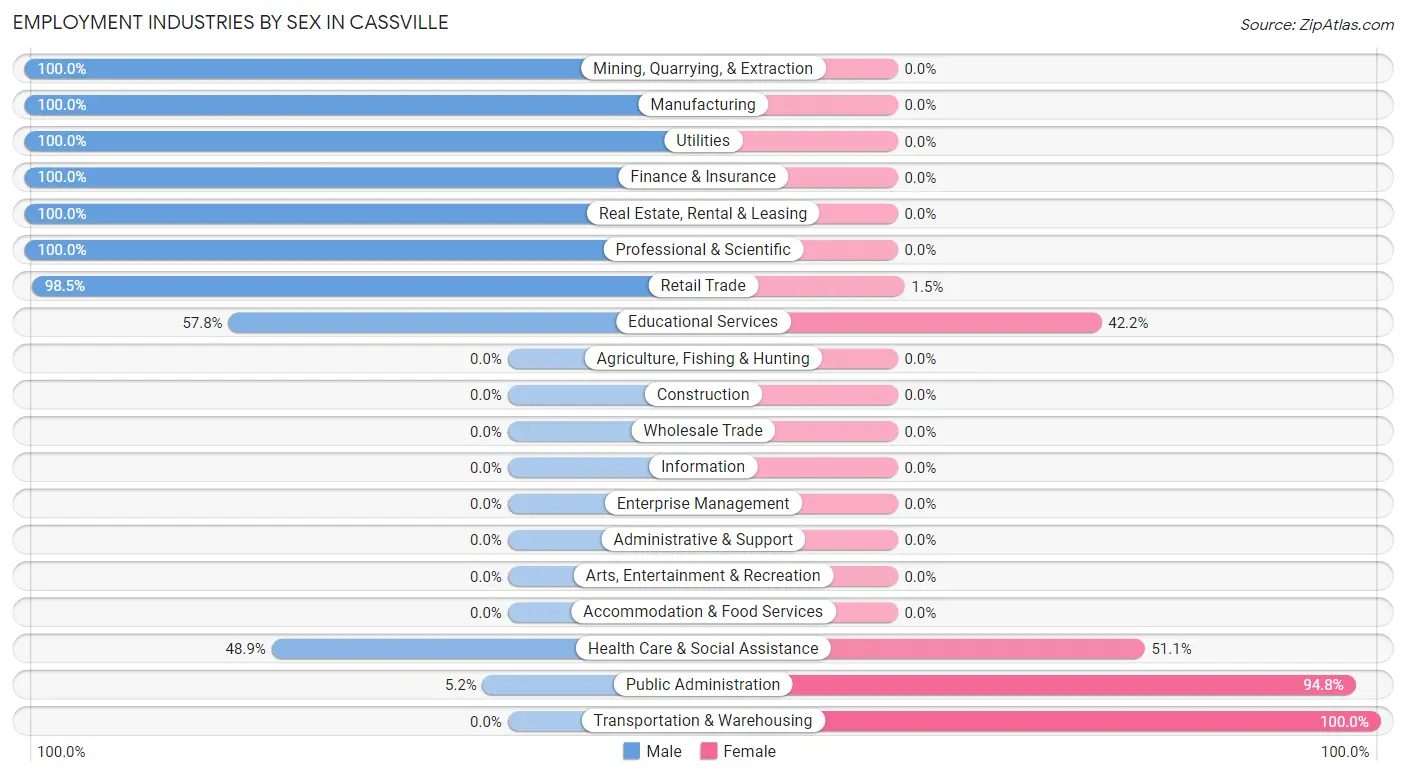
| Industry | Male | Female |
| Agriculture, Fishing & Hunting | 0 (0.0%) | 0 (0.0%) |
| Mining, Quarrying, & Extraction | 46 (100.0%) | 0 (0.0%) |
| Construction | 0 (0.0%) | 0 (0.0%) |
| Manufacturing | 53 (100.0%) | 0 (0.0%) |
| Wholesale Trade | 0 (0.0%) | 0 (0.0%) |
| Retail Trade | 66 (98.5%) | 1 (1.5%) |
| Transportation & Warehousing | 0 (0.0%) | 55 (100.0%) |
| Utilities | 64 (100.0%) | 0 (0.0%) |
| Information | 0 (0.0%) | 0 (0.0%) |
| Finance & Insurance | 32 (100.0%) | 0 (0.0%) |
| Real Estate, Rental & Leasing | 28 (100.0%) | 0 (0.0%) |
| Professional & Scientific | 73 (100.0%) | 0 (0.0%) |
| Enterprise Management | 0 (0.0%) | 0 (0.0%) |
| Administrative & Support | 0 (0.0%) | 0 (0.0%) |
| Educational Services | 37 (57.8%) | 27 (42.2%) |
| Health Care & Social Assistance | 193 (48.9%) | 202 (51.1%) |
| Arts, Entertainment & Recreation | 0 (0.0%) | 0 (0.0%) |
| Accommodation & Food Services | 0 (0.0%) | 0 (0.0%) |
| Public Administration | 7 (5.2%) | 128 (94.8%) |
| Total | 599 (58.0%) | 433 (42.0%) |
Education in Cassville
School Enrollment in Cassville
The most common levels of schooling among the 295 students in Cassville are college / undergraduate (109 | 36.9%), graduate / professional (108 | 36.6%), and middle school (59 | 20.0%).
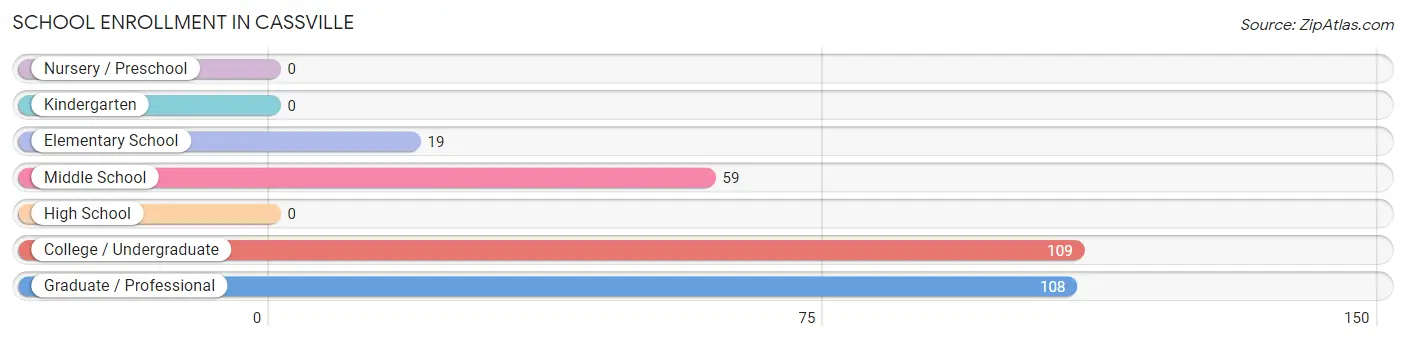
| School Level | # Students | % Students |
| Nursery / Preschool | 0 | 0.0% |
| Kindergarten | 0 | 0.0% |
| Elementary School | 19 | 6.4% |
| Middle School | 59 | 20.0% |
| High School | 0 | 0.0% |
| College / Undergraduate | 109 | 36.9% |
| Graduate / Professional | 108 | 36.6% |
| Total | 295 | 100.0% |
School Enrollment by Age by Funding Source in Cassville
Out of a total of 295 students who are enrolled in schools in Cassville, 37 (12.5%) attend a private institution, while the remaining 258 (87.5%) are enrolled in public schools. The age group of 35 years and over has the highest likelihood of being enrolled in private schools, with 37 (29.1% in the age bracket) enrolled. Conversely, the age group of 5 to 9 year old has the lowest likelihood of being enrolled in a private school, with 19 (100.0% in the age bracket) attending a public institution.
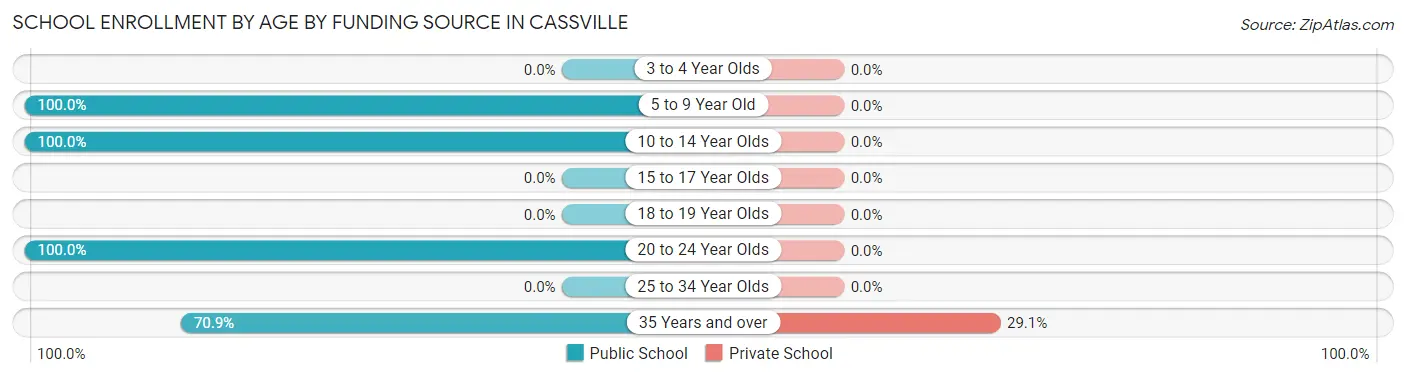
| Age Bracket | Public School | Private School |
| 3 to 4 Year Olds | 0 (0.0%) | 0 (0.0%) |
| 5 to 9 Year Old | 19 (100.0%) | 0 (0.0%) |
| 10 to 14 Year Olds | 59 (100.0%) | 0 (0.0%) |
| 15 to 17 Year Olds | 0 (0.0%) | 0 (0.0%) |
| 18 to 19 Year Olds | 0 (0.0%) | 0 (0.0%) |
| 20 to 24 Year Olds | 90 (100.0%) | 0 (0.0%) |
| 25 to 34 Year Olds | 0 (0.0%) | 0 (0.0%) |
| 35 Years and over | 90 (70.9%) | 37 (29.1%) |
| Total | 258 (87.5%) | 37 (12.5%) |
Educational Attainment by Field of Study in Cassville
Science & technology (198 | 40.7%), engineering (104 | 21.4%), business (89 | 18.3%), social sciences (34 | 7.0%), and bio, nature & agricultural (21 | 4.3%) are the most common fields of study among 486 individuals in Cassville who have obtained a bachelor's degree or higher.
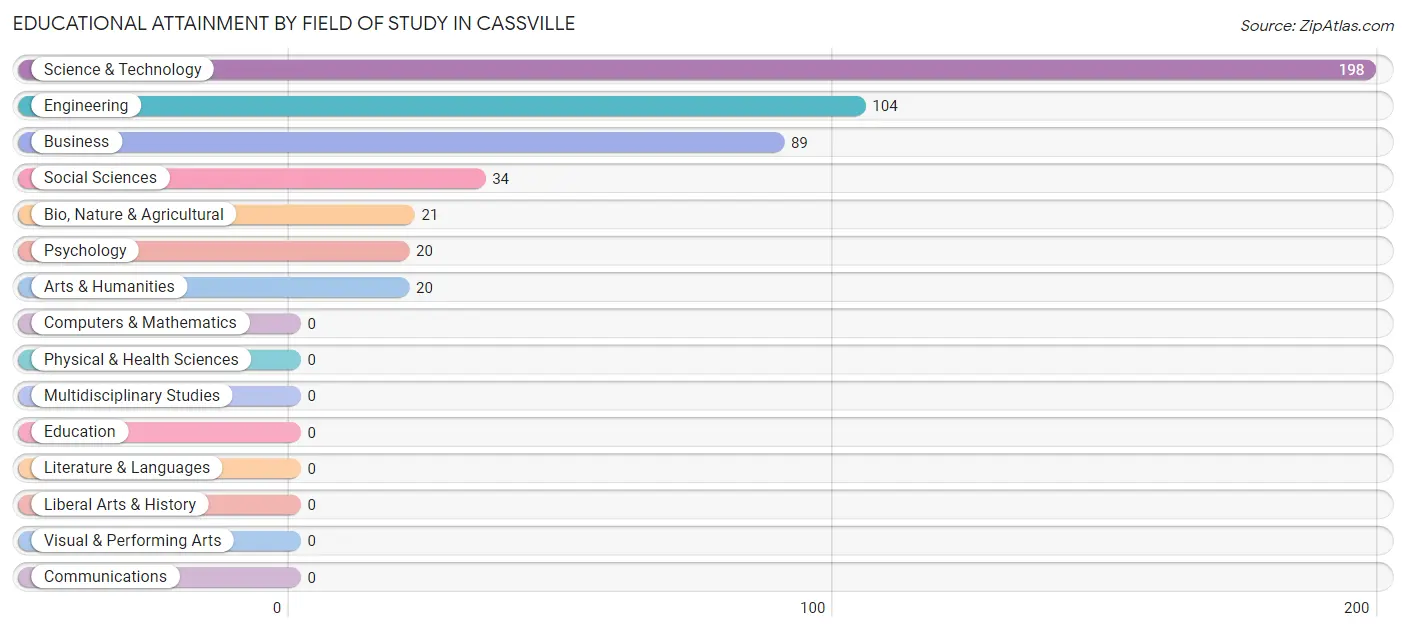
| Field of Study | # Graduates | % Graduates |
| Computers & Mathematics | 0 | 0.0% |
| Bio, Nature & Agricultural | 21 | 4.3% |
| Physical & Health Sciences | 0 | 0.0% |
| Psychology | 20 | 4.1% |
| Social Sciences | 34 | 7.0% |
| Engineering | 104 | 21.4% |
| Multidisciplinary Studies | 0 | 0.0% |
| Science & Technology | 198 | 40.7% |
| Business | 89 | 18.3% |
| Education | 0 | 0.0% |
| Literature & Languages | 0 | 0.0% |
| Liberal Arts & History | 0 | 0.0% |
| Visual & Performing Arts | 0 | 0.0% |
| Communications | 0 | 0.0% |
| Arts & Humanities | 20 | 4.1% |
| Total | 486 | 100.0% |
Transportation & Commute in Cassville
Vehicle Availability by Sex in Cassville
The most prevalent vehicle ownership categories in Cassville are males with 3 vehicles (279, accounting for 46.6%) and females with 3 vehicles (121, making up 64.4%).
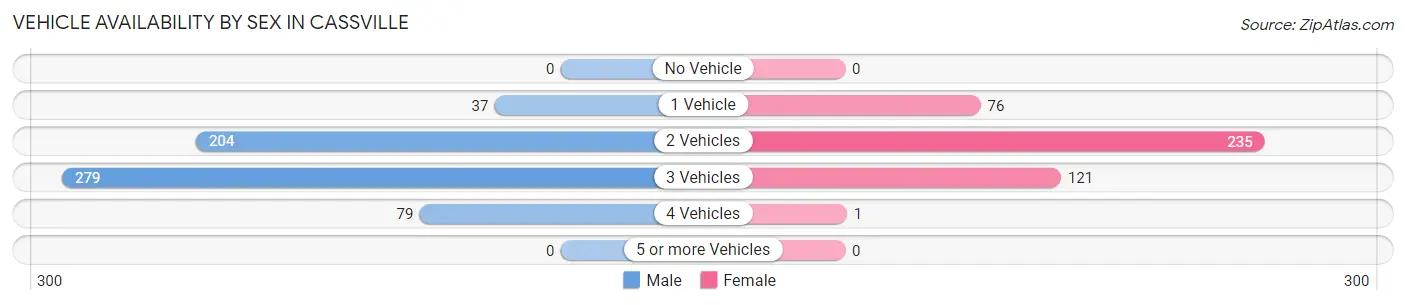
| Vehicles Available | Male | Female |
| No Vehicle | 0 (0.0%) | 0 (0.0%) |
| 1 Vehicle | 37 (6.2%) | 76 (17.5%) |
| 2 Vehicles | 204 (34.1%) | 235 (54.3%) |
| 3 Vehicles | 279 (46.6%) | 121 (27.9%) |
| 4 Vehicles | 79 (13.2%) | 1 (0.2%) |
| 5 or more Vehicles | 0 (0.0%) | 0 (0.0%) |
| Total | 599 (100.0%) | 433 (100.0%) |
Commute Time in Cassville
The most frequently occuring commute durations in Cassville are 20 to 24 minutes (322 commuters, 32.2%), 15 to 19 minutes (320 commuters, 32.0%), and 45 to 59 minutes (130 commuters, 13.0%).
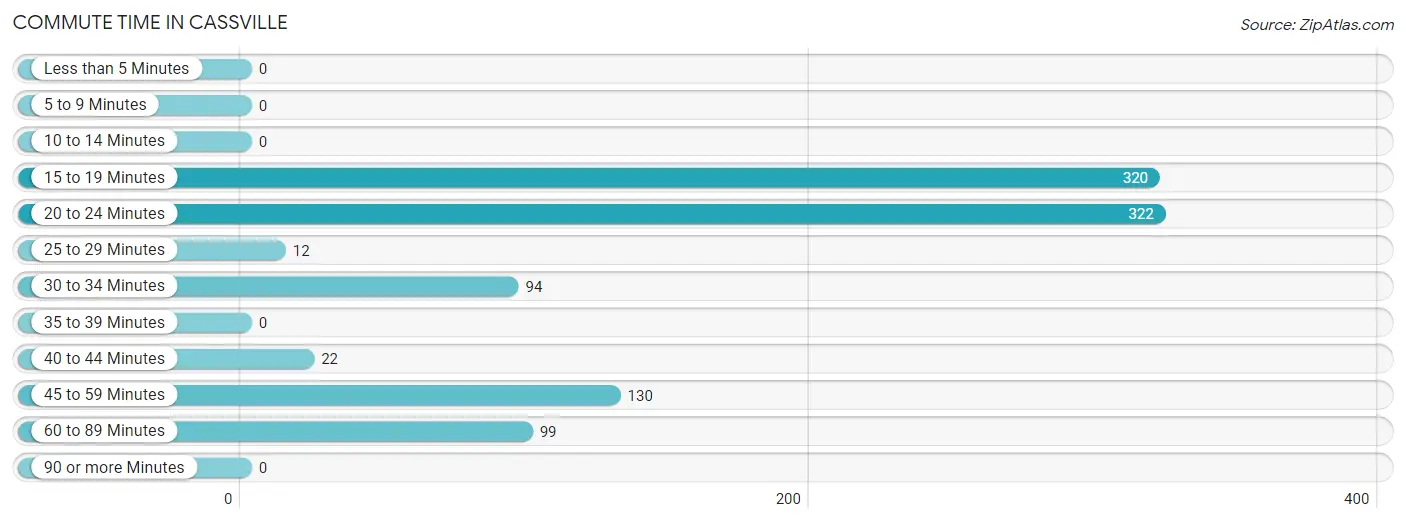
| Commute Time | # Commuters | % Commuters |
| Less than 5 Minutes | 0 | 0.0% |
| 5 to 9 Minutes | 0 | 0.0% |
| 10 to 14 Minutes | 0 | 0.0% |
| 15 to 19 Minutes | 320 | 32.0% |
| 20 to 24 Minutes | 322 | 32.2% |
| 25 to 29 Minutes | 12 | 1.2% |
| 30 to 34 Minutes | 94 | 9.4% |
| 35 to 39 Minutes | 0 | 0.0% |
| 40 to 44 Minutes | 22 | 2.2% |
| 45 to 59 Minutes | 130 | 13.0% |
| 60 to 89 Minutes | 99 | 9.9% |
| 90 or more Minutes | 0 | 0.0% |
Commute Time by Sex in Cassville
The most common commute times in Cassville are 20 to 24 minutes (255 commuters, 42.6%) for males and 15 to 19 minutes (197 commuters, 49.2%) for females.
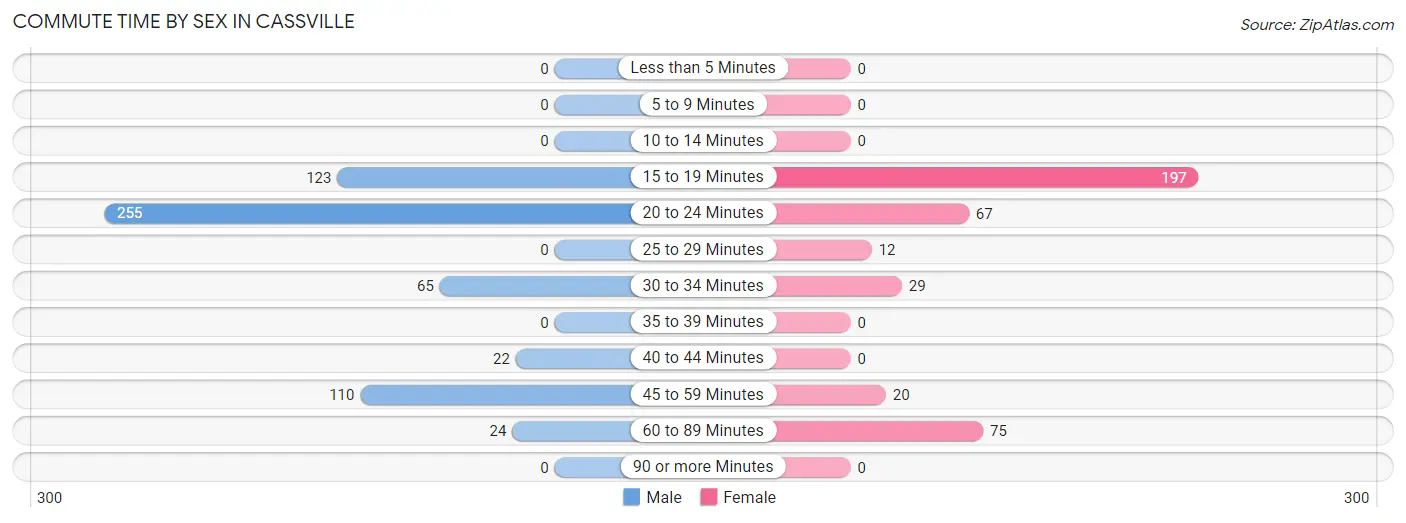
| Commute Time | Male | Female |
| Less than 5 Minutes | 0 (0.0%) | 0 (0.0%) |
| 5 to 9 Minutes | 0 (0.0%) | 0 (0.0%) |
| 10 to 14 Minutes | 0 (0.0%) | 0 (0.0%) |
| 15 to 19 Minutes | 123 (20.5%) | 197 (49.2%) |
| 20 to 24 Minutes | 255 (42.6%) | 67 (16.8%) |
| 25 to 29 Minutes | 0 (0.0%) | 12 (3.0%) |
| 30 to 34 Minutes | 65 (10.8%) | 29 (7.2%) |
| 35 to 39 Minutes | 0 (0.0%) | 0 (0.0%) |
| 40 to 44 Minutes | 22 (3.7%) | 0 (0.0%) |
| 45 to 59 Minutes | 110 (18.4%) | 20 (5.0%) |
| 60 to 89 Minutes | 24 (4.0%) | 75 (18.8%) |
| 90 or more Minutes | 0 (0.0%) | 0 (0.0%) |
Time of Departure to Work by Sex in Cassville
The most frequent times of departure to work in Cassville are 8:00 AM to 8:29 AM (199, 33.2%) for males and 7:00 AM to 7:29 AM (194, 48.5%) for females.
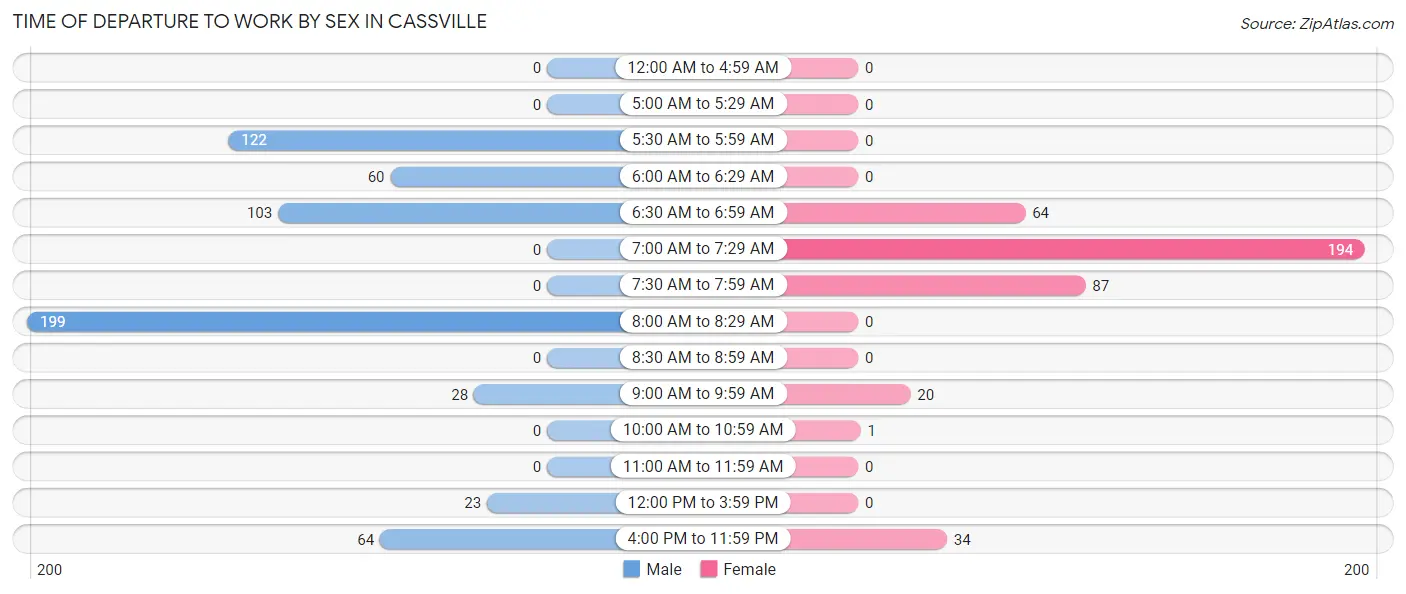
| Time of Departure | Male | Female |
| 12:00 AM to 4:59 AM | 0 (0.0%) | 0 (0.0%) |
| 5:00 AM to 5:29 AM | 0 (0.0%) | 0 (0.0%) |
| 5:30 AM to 5:59 AM | 122 (20.4%) | 0 (0.0%) |
| 6:00 AM to 6:29 AM | 60 (10.0%) | 0 (0.0%) |
| 6:30 AM to 6:59 AM | 103 (17.2%) | 64 (16.0%) |
| 7:00 AM to 7:29 AM | 0 (0.0%) | 194 (48.5%) |
| 7:30 AM to 7:59 AM | 0 (0.0%) | 87 (21.7%) |
| 8:00 AM to 8:29 AM | 199 (33.2%) | 0 (0.0%) |
| 8:30 AM to 8:59 AM | 0 (0.0%) | 0 (0.0%) |
| 9:00 AM to 9:59 AM | 28 (4.7%) | 20 (5.0%) |
| 10:00 AM to 10:59 AM | 0 (0.0%) | 1 (0.3%) |
| 11:00 AM to 11:59 AM | 0 (0.0%) | 0 (0.0%) |
| 12:00 PM to 3:59 PM | 23 (3.8%) | 0 (0.0%) |
| 4:00 PM to 11:59 PM | 64 (10.7%) | 34 (8.5%) |
| Total | 599 (100.0%) | 400 (100.0%) |
Housing Occupancy in Cassville
Occupancy by Ownership in Cassville
Of the total 714 dwellings in Cassville, owner-occupied units account for 698 (97.8%), while renter-occupied units make up 16 (2.2%).
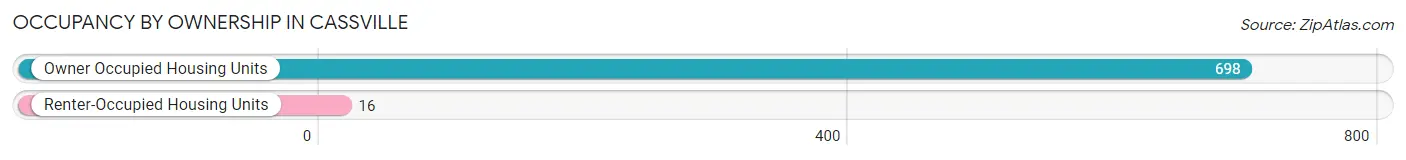
| Occupancy | # Housing Units | % Housing Units |
| Owner Occupied Housing Units | 698 | 97.8% |
| Renter-Occupied Housing Units | 16 | 2.2% |
| Total Occupied Housing Units | 714 | 100.0% |
Occupancy by Household Size in Cassville
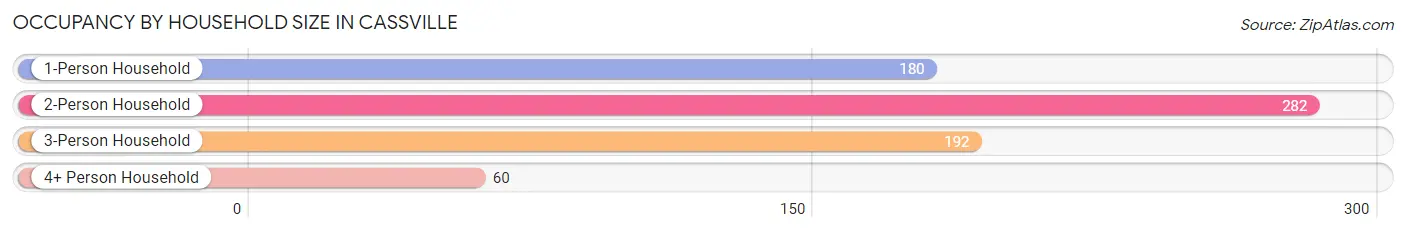
| Household Size | # Housing Units | % Housing Units |
| 1-Person Household | 180 | 25.2% |
| 2-Person Household | 282 | 39.5% |
| 3-Person Household | 192 | 26.9% |
| 4+ Person Household | 60 | 8.4% |
| Total Housing Units | 714 | 100.0% |
Occupancy by Ownership by Household Size in Cassville
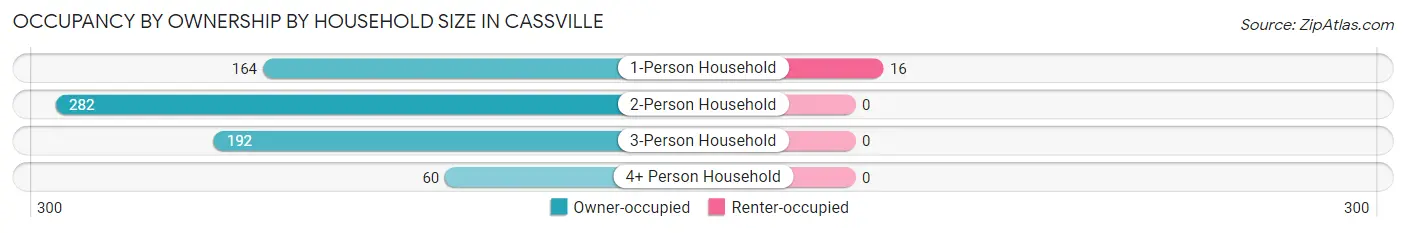
| Household Size | Owner-occupied | Renter-occupied |
| 1-Person Household | 164 (91.1%) | 16 (8.9%) |
| 2-Person Household | 282 (100.0%) | 0 (0.0%) |
| 3-Person Household | 192 (100.0%) | 0 (0.0%) |
| 4+ Person Household | 60 (100.0%) | 0 (0.0%) |
| Total Housing Units | 698 (97.8%) | 16 (2.2%) |
Occupancy by Educational Attainment in Cassville
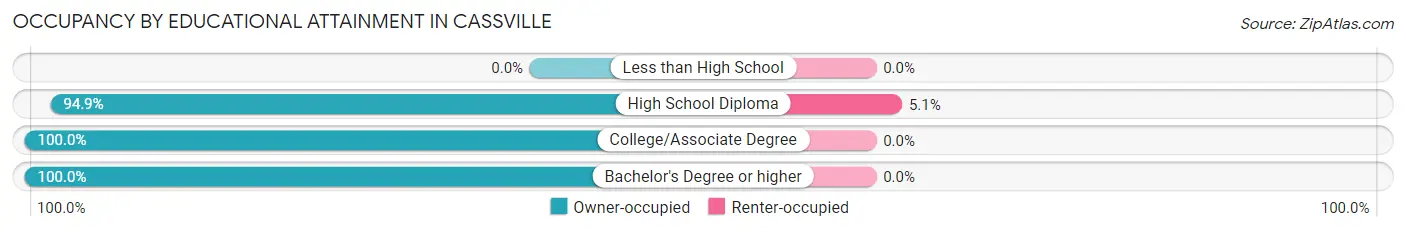
| Household Size | Owner-occupied | Renter-occupied |
| Less than High School | 0 (0.0%) | 0 (0.0%) |
| High School Diploma | 297 (94.9%) | 16 (5.1%) |
| College/Associate Degree | 58 (100.0%) | 0 (0.0%) |
| Bachelor's Degree or higher | 343 (100.0%) | 0 (0.0%) |
Occupancy by Age of Householder in Cassville
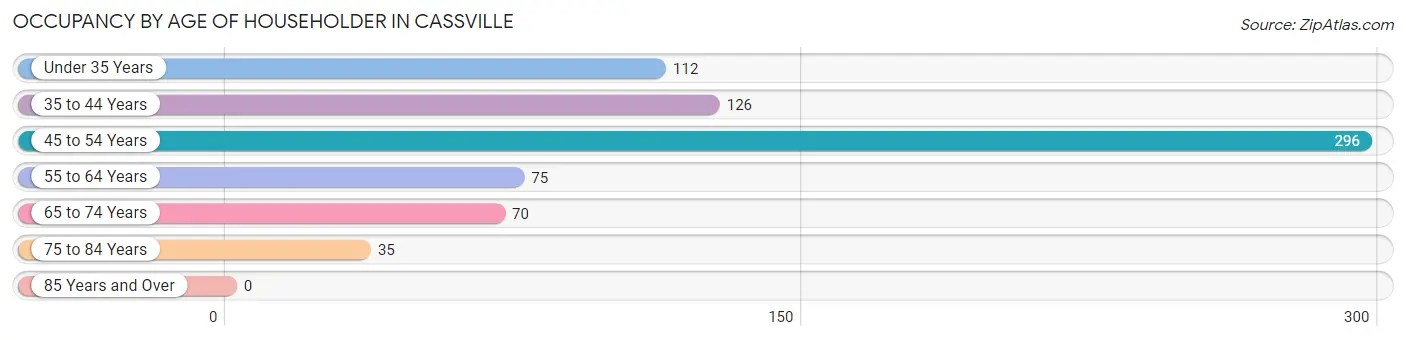
| Age Bracket | # Households | % Households |
| Under 35 Years | 112 | 15.7% |
| 35 to 44 Years | 126 | 17.6% |
| 45 to 54 Years | 296 | 41.5% |
| 55 to 64 Years | 75 | 10.5% |
| 65 to 74 Years | 70 | 9.8% |
| 75 to 84 Years | 35 | 4.9% |
| 85 Years and Over | 0 | 0.0% |
| Total | 714 | 100.0% |
Housing Finances in Cassville
Median Income by Occupancy in Cassville
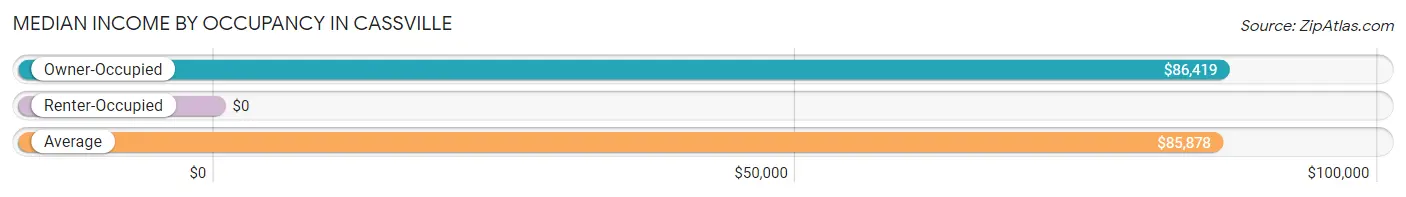
| Occupancy Type | # Households | Median Income |
| Owner-Occupied | 698 (97.8%) | $86,419 |
| Renter-Occupied | 16 (2.2%) | $0 |
| Average | 714 (100.0%) | $85,878 |
Occupancy by Householder Income Bracket in Cassville
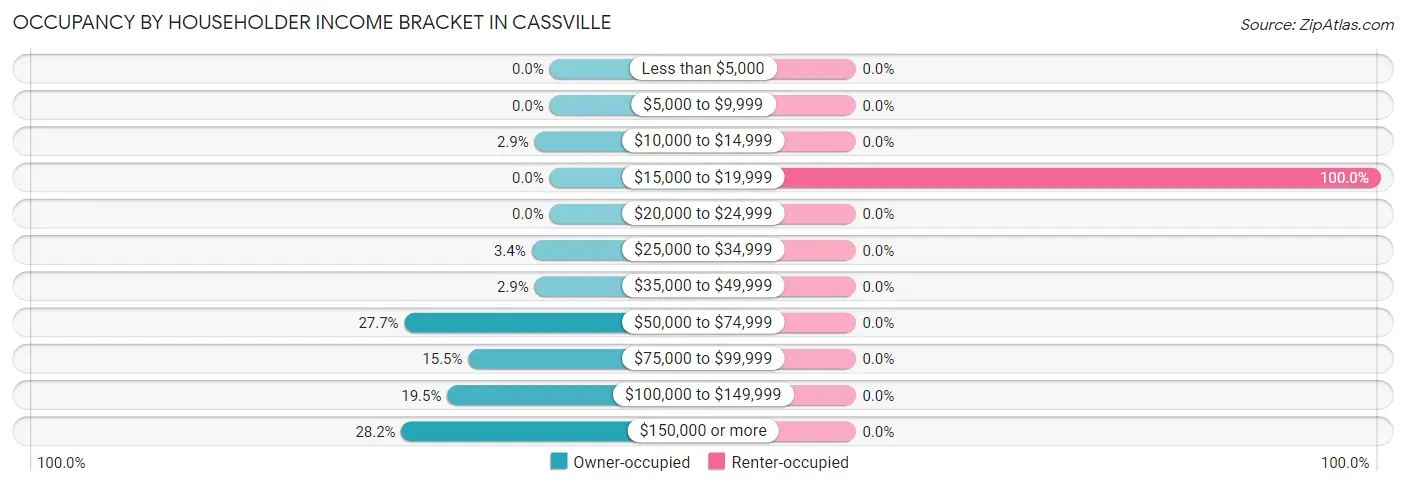
| Income Bracket | Owner-occupied | Renter-occupied |
| Less than $5,000 | 0 (0.0%) | 0 (0.0%) |
| $5,000 to $9,999 | 0 (0.0%) | 0 (0.0%) |
| $10,000 to $14,999 | 20 (2.9%) | 0 (0.0%) |
| $15,000 to $19,999 | 0 (0.0%) | 16 (100.0%) |
| $20,000 to $24,999 | 0 (0.0%) | 0 (0.0%) |
| $25,000 to $34,999 | 24 (3.4%) | 0 (0.0%) |
| $35,000 to $49,999 | 20 (2.9%) | 0 (0.0%) |
| $50,000 to $74,999 | 193 (27.7%) | 0 (0.0%) |
| $75,000 to $99,999 | 108 (15.5%) | 0 (0.0%) |
| $100,000 to $149,999 | 136 (19.5%) | 0 (0.0%) |
| $150,000 or more | 197 (28.2%) | 0 (0.0%) |
| Total | 698 (100.0%) | 16 (100.0%) |
Monthly Housing Cost Tiers in Cassville
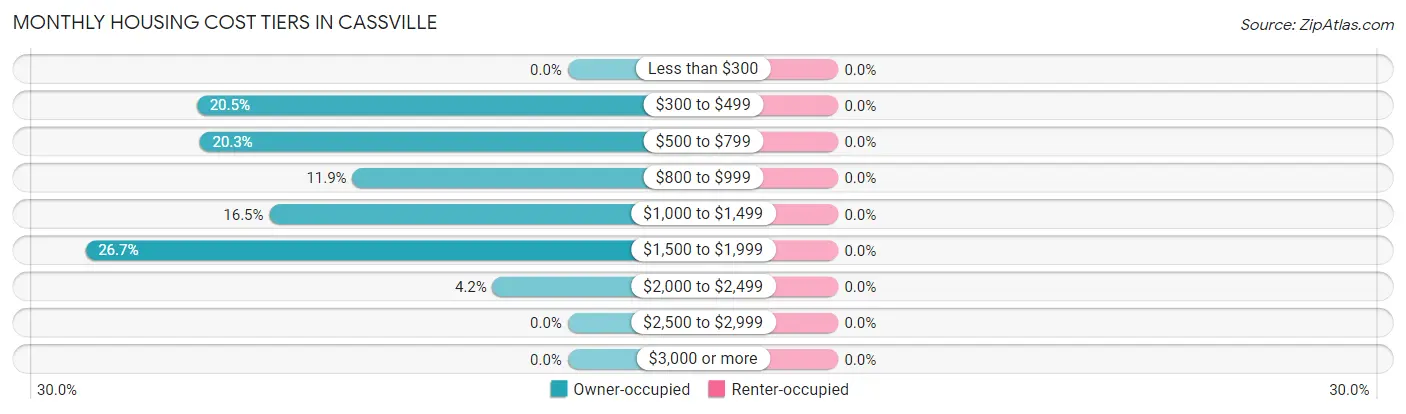
| Monthly Cost | Owner-occupied | Renter-occupied |
| Less than $300 | 0 (0.0%) | 0 (0.0%) |
| $300 to $499 | 143 (20.5%) | 0 (0.0%) |
| $500 to $799 | 142 (20.3%) | 0 (0.0%) |
| $800 to $999 | 83 (11.9%) | 0 (0.0%) |
| $1,000 to $1,499 | 115 (16.5%) | 0 (0.0%) |
| $1,500 to $1,999 | 186 (26.7%) | 0 (0.0%) |
| $2,000 to $2,499 | 29 (4.2%) | 0 (0.0%) |
| $2,500 to $2,999 | 0 (0.0%) | 0 (0.0%) |
| $3,000 or more | 0 (0.0%) | 0 (0.0%) |
| Total | 698 (100.0%) | 16 (100.0%) |
Physical Housing Characteristics in Cassville
Housing Structures in Cassville
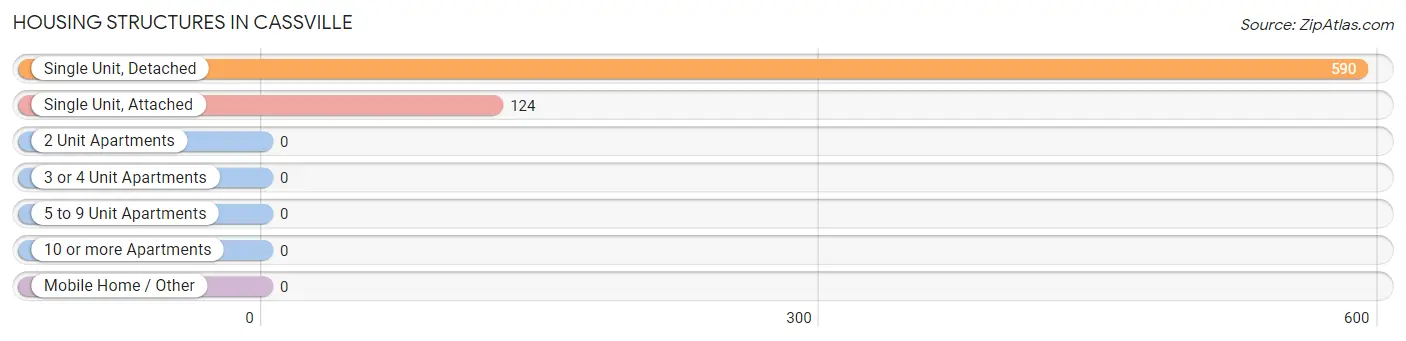
| Structure Type | # Housing Units | % Housing Units |
| Single Unit, Detached | 590 | 82.6% |
| Single Unit, Attached | 124 | 17.4% |
| 2 Unit Apartments | 0 | 0.0% |
| 3 or 4 Unit Apartments | 0 | 0.0% |
| 5 to 9 Unit Apartments | 0 | 0.0% |
| 10 or more Apartments | 0 | 0.0% |
| Mobile Home / Other | 0 | 0.0% |
| Total | 714 | 100.0% |
Housing Structures by Occupancy in Cassville
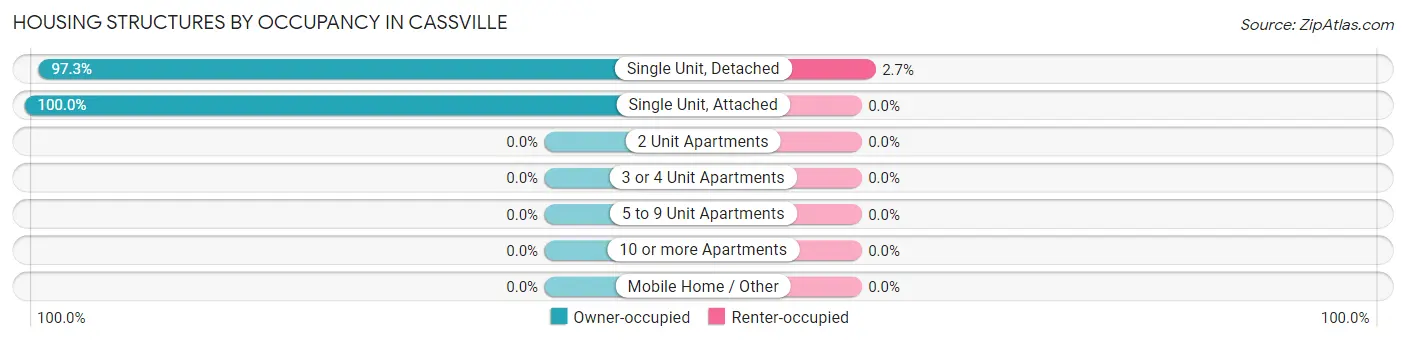
| Structure Type | Owner-occupied | Renter-occupied |
| Single Unit, Detached | 574 (97.3%) | 16 (2.7%) |
| Single Unit, Attached | 124 (100.0%) | 0 (0.0%) |
| 2 Unit Apartments | 0 (0.0%) | 0 (0.0%) |
| 3 or 4 Unit Apartments | 0 (0.0%) | 0 (0.0%) |
| 5 to 9 Unit Apartments | 0 (0.0%) | 0 (0.0%) |
| 10 or more Apartments | 0 (0.0%) | 0 (0.0%) |
| Mobile Home / Other | 0 (0.0%) | 0 (0.0%) |
| Total | 698 (97.8%) | 16 (2.2%) |
Housing Structures by Number of Rooms in Cassville
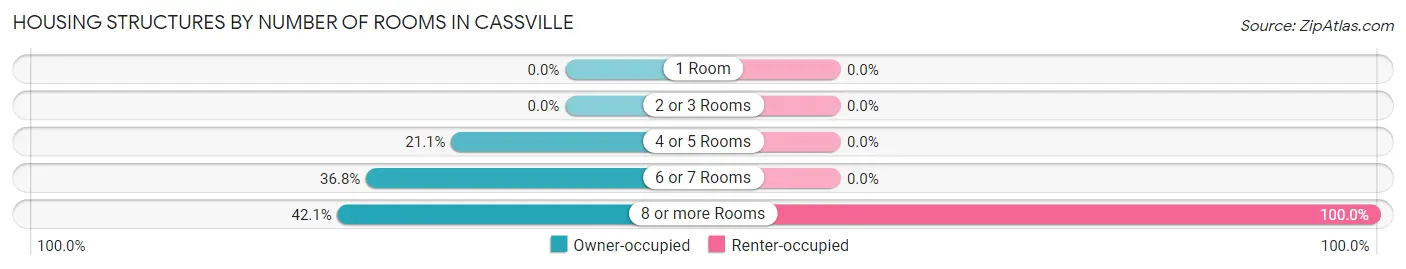
| Number of Rooms | Owner-occupied | Renter-occupied |
| 1 Room | 0 (0.0%) | 0 (0.0%) |
| 2 or 3 Rooms | 0 (0.0%) | 0 (0.0%) |
| 4 or 5 Rooms | 147 (21.1%) | 0 (0.0%) |
| 6 or 7 Rooms | 257 (36.8%) | 0 (0.0%) |
| 8 or more Rooms | 294 (42.1%) | 16 (100.0%) |
| Total | 698 (100.0%) | 16 (100.0%) |
Housing Structure by Heating Type in Cassville
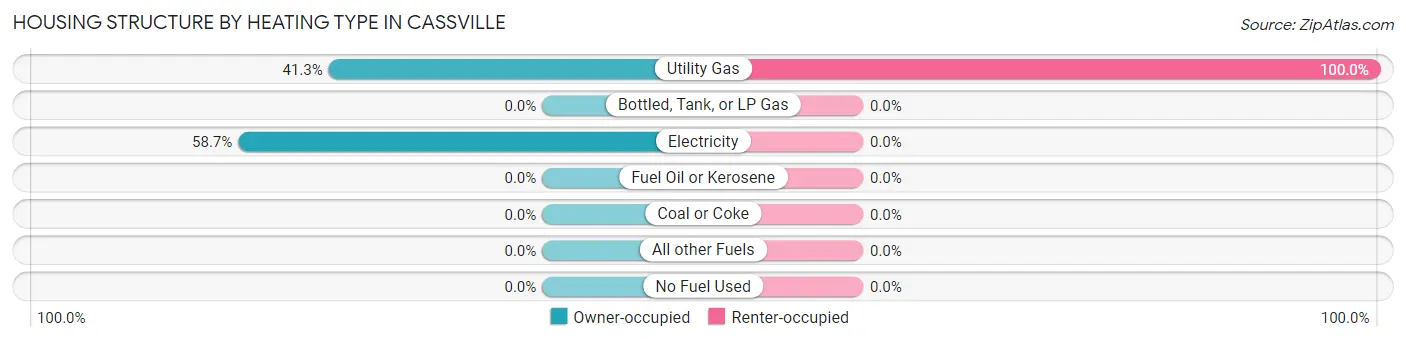
| Heating Type | Owner-occupied | Renter-occupied |
| Utility Gas | 288 (41.3%) | 16 (100.0%) |
| Bottled, Tank, or LP Gas | 0 (0.0%) | 0 (0.0%) |
| Electricity | 410 (58.7%) | 0 (0.0%) |
| Fuel Oil or Kerosene | 0 (0.0%) | 0 (0.0%) |
| Coal or Coke | 0 (0.0%) | 0 (0.0%) |
| All other Fuels | 0 (0.0%) | 0 (0.0%) |
| No Fuel Used | 0 (0.0%) | 0 (0.0%) |
| Total | 698 (100.0%) | 16 (100.0%) |
Household Vehicle Usage in Cassville
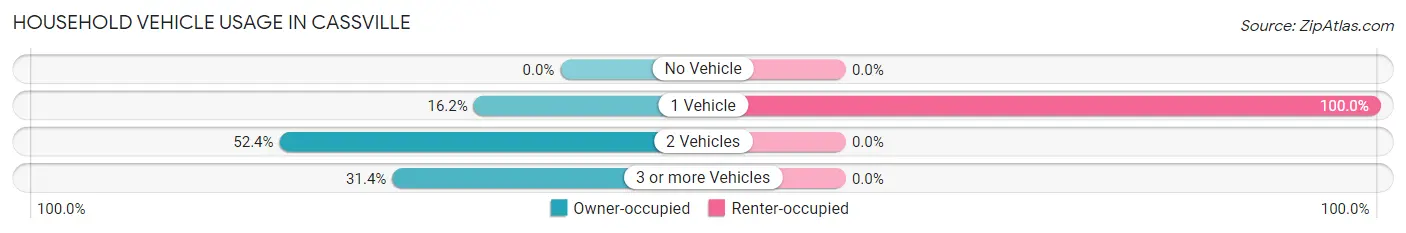
| Vehicles per Household | Owner-occupied | Renter-occupied |
| No Vehicle | 0 (0.0%) | 0 (0.0%) |
| 1 Vehicle | 113 (16.2%) | 16 (100.0%) |
| 2 Vehicles | 366 (52.4%) | 0 (0.0%) |
| 3 or more Vehicles | 219 (31.4%) | 0 (0.0%) |
| Total | 698 (100.0%) | 16 (100.0%) |
Real Estate & Mortgages in Cassville
Real Estate and Mortgage Overview in Cassville
| Characteristic | Without Mortgage | With Mortgage |
| Housing Units | 143 | 555 |
| Median Property Value | $229,100 | $213,900 |
| Median Household Income | - | - |
| Monthly Housing Costs | $421 | $0 |
| Real Estate Taxes | $1,038 | $0 |
Property Value by Mortgage Status in Cassville
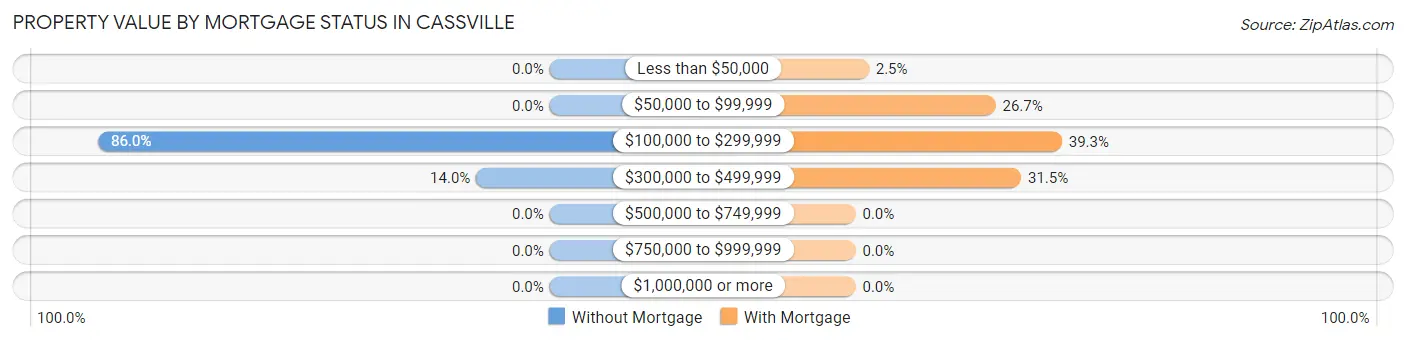
| Property Value | Without Mortgage | With Mortgage |
| Less than $50,000 | 0 (0.0%) | 14 (2.5%) |
| $50,000 to $99,999 | 0 (0.0%) | 148 (26.7%) |
| $100,000 to $299,999 | 123 (86.0%) | 218 (39.3%) |
| $300,000 to $499,999 | 20 (14.0%) | 175 (31.5%) |
| $500,000 to $749,999 | 0 (0.0%) | 0 (0.0%) |
| $750,000 to $999,999 | 0 (0.0%) | 0 (0.0%) |
| $1,000,000 or more | 0 (0.0%) | 0 (0.0%) |
| Total | 143 (100.0%) | 555 (100.0%) |
Household Income by Mortgage Status in Cassville
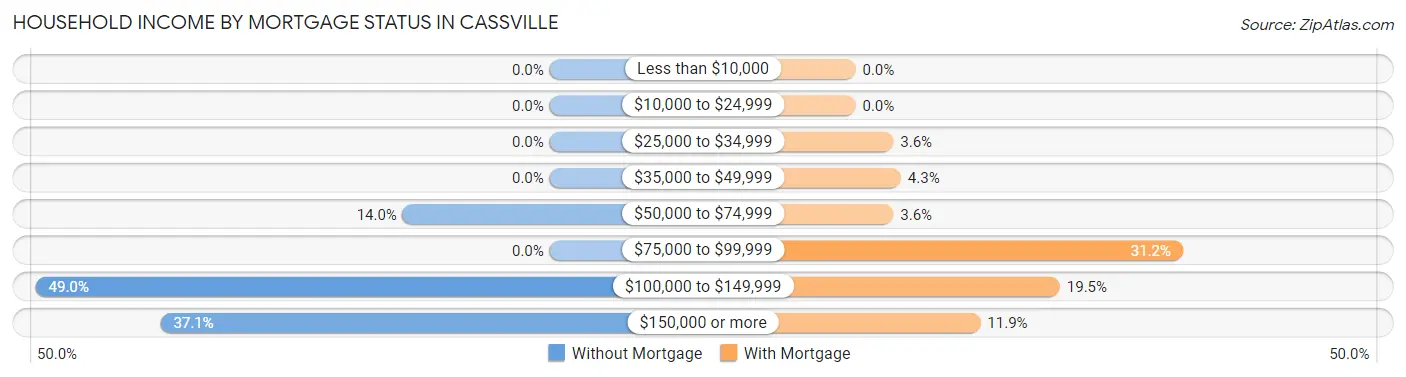
| Household Income | Without Mortgage | With Mortgage |
| Less than $10,000 | 0 (0.0%) | 0 (0.0%) |
| $10,000 to $24,999 | 0 (0.0%) | 0 (0.0%) |
| $25,000 to $34,999 | 0 (0.0%) | 20 (3.6%) |
| $35,000 to $49,999 | 0 (0.0%) | 24 (4.3%) |
| $50,000 to $74,999 | 20 (14.0%) | 20 (3.6%) |
| $75,000 to $99,999 | 0 (0.0%) | 173 (31.2%) |
| $100,000 to $149,999 | 70 (48.9%) | 108 (19.5%) |
| $150,000 or more | 53 (37.1%) | 66 (11.9%) |
| Total | 143 (100.0%) | 555 (100.0%) |
Property Value to Household Income Ratio in Cassville
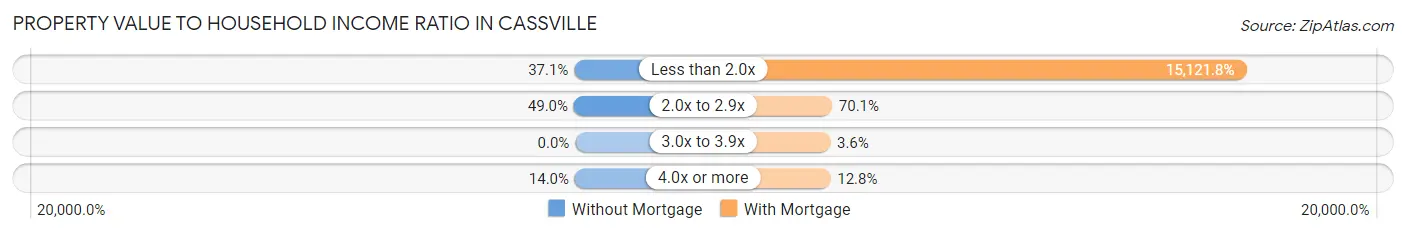
| Value-to-Income Ratio | Without Mortgage | With Mortgage |
| Less than 2.0x | 53 (37.1%) | 83,926 (15,121.8%) |
| 2.0x to 2.9x | 70 (48.9%) | 389 (70.1%) |
| 3.0x to 3.9x | 0 (0.0%) | 20 (3.6%) |
| 4.0x or more | 20 (14.0%) | 71 (12.8%) |
| Total | 143 (100.0%) | 555 (100.0%) |
Real Estate Taxes by Mortgage Status in Cassville
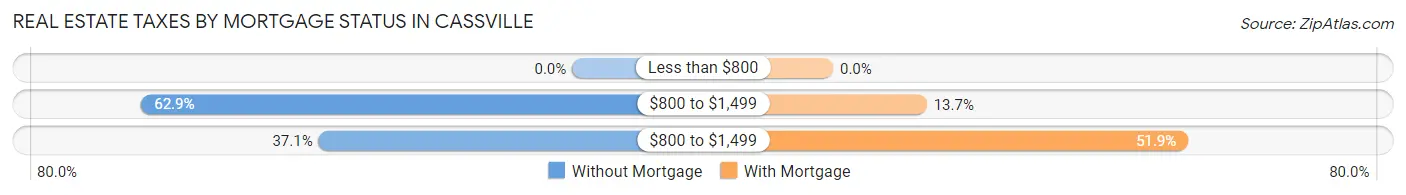
| Property Taxes | Without Mortgage | With Mortgage |
| Less than $800 | 0 (0.0%) | 0 (0.0%) |
| $800 to $1,499 | 90 (62.9%) | 76 (13.7%) |
| $800 to $1,499 | 53 (37.1%) | 288 (51.9%) |
| Total | 143 (100.0%) | 555 (100.0%) |
Health & Disability in Cassville
Health Insurance Coverage by Age in Cassville
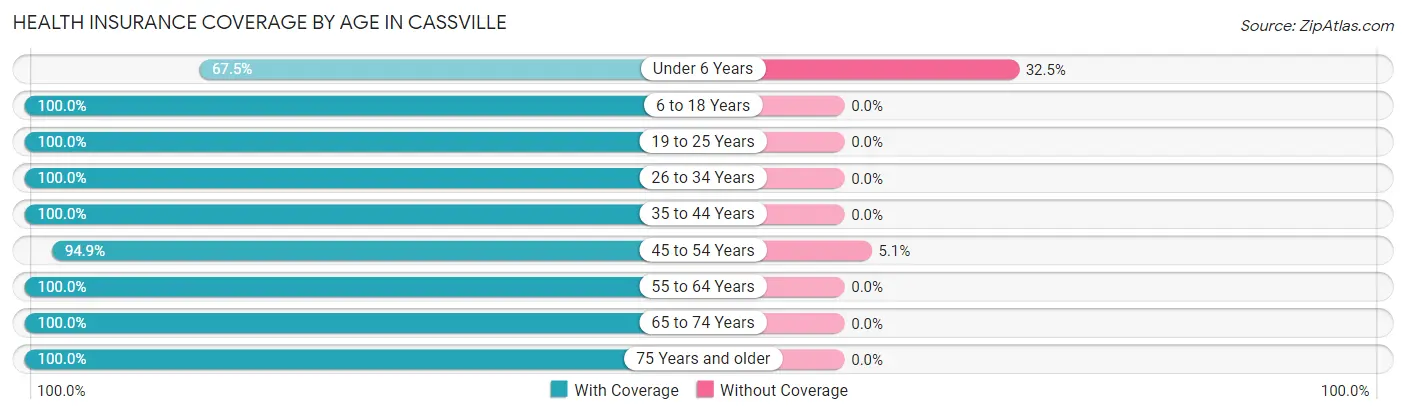
| Age Bracket | With Coverage | Without Coverage |
| Under 6 Years | 83 (67.5%) | 40 (32.5%) |
| 6 to 18 Years | 78 (100.0%) | 0 (0.0%) |
| 19 to 25 Years | 91 (100.0%) | 0 (0.0%) |
| 26 to 34 Years | 238 (100.0%) | 0 (0.0%) |
| 35 to 44 Years | 326 (100.0%) | 0 (0.0%) |
| 45 to 54 Years | 430 (94.9%) | 23 (5.1%) |
| 55 to 64 Years | 75 (100.0%) | 0 (0.0%) |
| 65 to 74 Years | 140 (100.0%) | 0 (0.0%) |
| 75 Years and older | 46 (100.0%) | 0 (0.0%) |
| Total | 1,507 (96.0%) | 63 (4.0%) |
Health Insurance Coverage by Citizenship Status in Cassville

| Citizenship Status | With Coverage | Without Coverage |
| Native Born | 83 (67.5%) | 40 (32.5%) |
| Foreign Born, Citizen | 78 (100.0%) | 0 (0.0%) |
| Foreign Born, not a Citizen | 91 (100.0%) | 0 (0.0%) |
Health Insurance Coverage by Household Income in Cassville
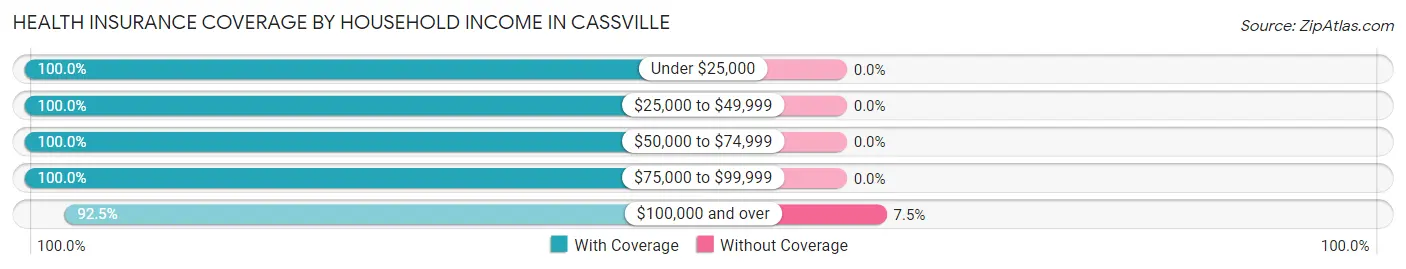
| Household Income | With Coverage | Without Coverage |
| Under $25,000 | 75 (100.0%) | 0 (0.0%) |
| $25,000 to $49,999 | 99 (100.0%) | 0 (0.0%) |
| $50,000 to $74,999 | 444 (100.0%) | 0 (0.0%) |
| $75,000 to $99,999 | 108 (100.0%) | 0 (0.0%) |
| $100,000 and over | 781 (92.5%) | 63 (7.5%) |
Public vs Private Health Insurance Coverage by Age in Cassville
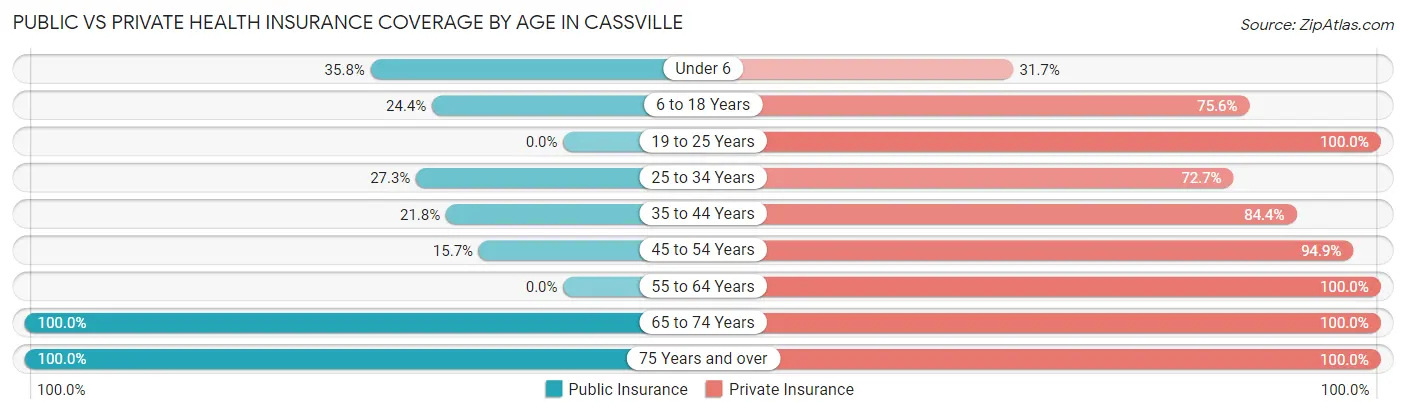
| Age Bracket | Public Insurance | Private Insurance |
| Under 6 | 44 (35.8%) | 39 (31.7%) |
| 6 to 18 Years | 19 (24.4%) | 59 (75.6%) |
| 19 to 25 Years | 0 (0.0%) | 91 (100.0%) |
| 25 to 34 Years | 65 (27.3%) | 173 (72.7%) |
| 35 to 44 Years | 71 (21.8%) | 275 (84.4%) |
| 45 to 54 Years | 71 (15.7%) | 430 (94.9%) |
| 55 to 64 Years | 0 (0.0%) | 75 (100.0%) |
| 65 to 74 Years | 140 (100.0%) | 140 (100.0%) |
| 75 Years and over | 46 (100.0%) | 46 (100.0%) |
| Total | 456 (29.0%) | 1,328 (84.6%) |
Disability Status by Sex by Age in Cassville
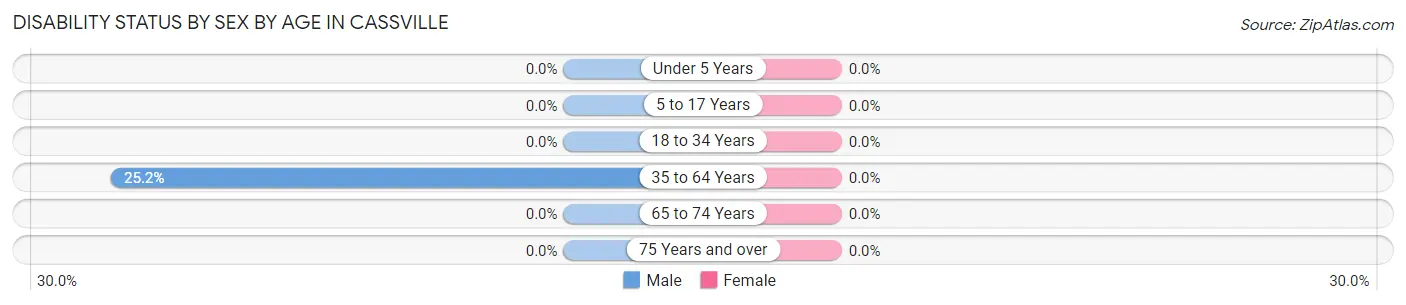
| Age Bracket | Male | Female |
| Under 5 Years | 0 (0.0%) | 0 (0.0%) |
| 5 to 17 Years | 0 (0.0%) | 0 (0.0%) |
| 18 to 34 Years | 0 (0.0%) | 0 (0.0%) |
| 35 to 64 Years | 107 (25.2%) | 0 (0.0%) |
| 65 to 74 Years | 0 (0.0%) | 0 (0.0%) |
| 75 Years and over | 0 (0.0%) | 0 (0.0%) |
Disability Class by Sex by Age in Cassville
Disability Class: Hearing Difficulty
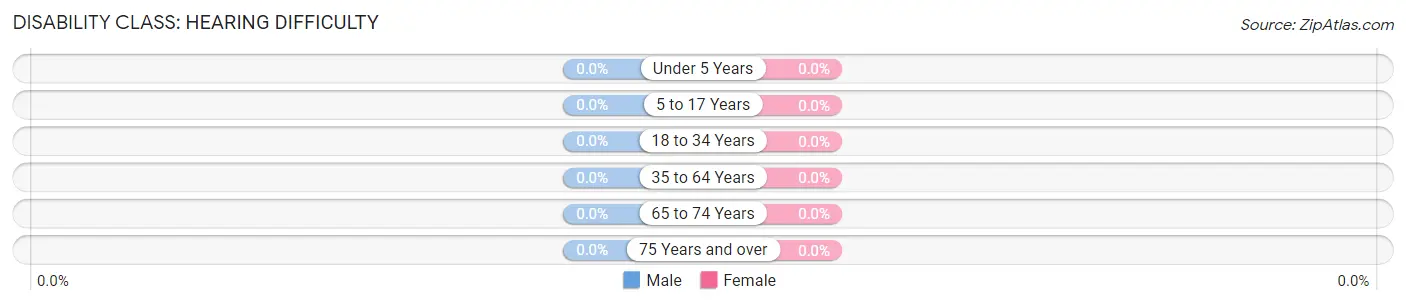
| Age Bracket | Male | Female |
| Under 5 Years | 0 (0.0%) | 0 (0.0%) |
| 5 to 17 Years | 0 (0.0%) | 0 (0.0%) |
| 18 to 34 Years | 0 (0.0%) | 0 (0.0%) |
| 35 to 64 Years | 0 (0.0%) | 0 (0.0%) |
| 65 to 74 Years | 0 (0.0%) | 0 (0.0%) |
| 75 Years and over | 0 (0.0%) | 0 (0.0%) |
Disability Class: Vision Difficulty
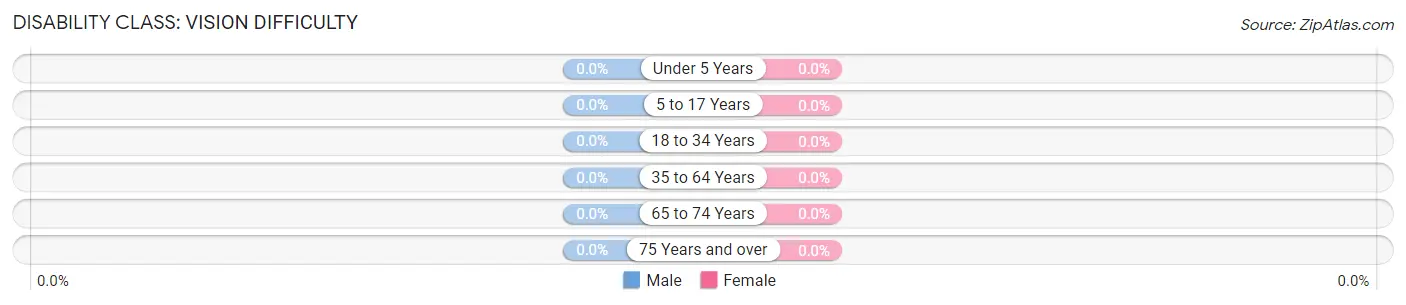
| Age Bracket | Male | Female |
| Under 5 Years | 0 (0.0%) | 0 (0.0%) |
| 5 to 17 Years | 0 (0.0%) | 0 (0.0%) |
| 18 to 34 Years | 0 (0.0%) | 0 (0.0%) |
| 35 to 64 Years | 0 (0.0%) | 0 (0.0%) |
| 65 to 74 Years | 0 (0.0%) | 0 (0.0%) |
| 75 Years and over | 0 (0.0%) | 0 (0.0%) |
Disability Class: Cognitive Difficulty
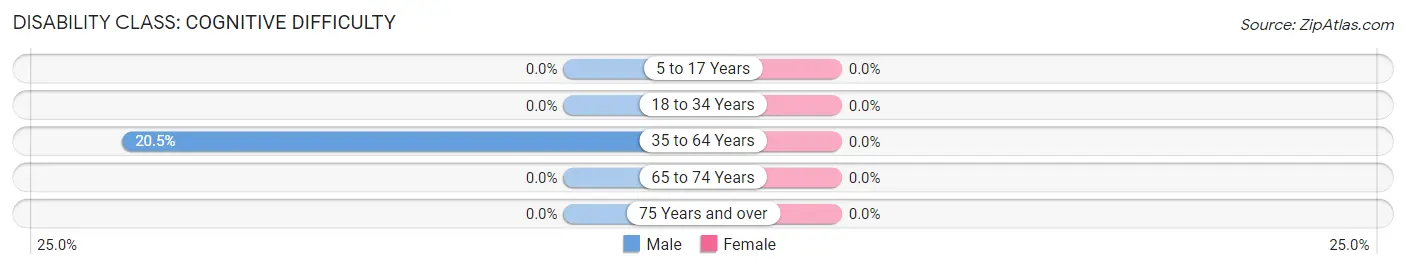
| Age Bracket | Male | Female |
| 5 to 17 Years | 0 (0.0%) | 0 (0.0%) |
| 18 to 34 Years | 0 (0.0%) | 0 (0.0%) |
| 35 to 64 Years | 87 (20.5%) | 0 (0.0%) |
| 65 to 74 Years | 0 (0.0%) | 0 (0.0%) |
| 75 Years and over | 0 (0.0%) | 0 (0.0%) |
Disability Class: Ambulatory Difficulty
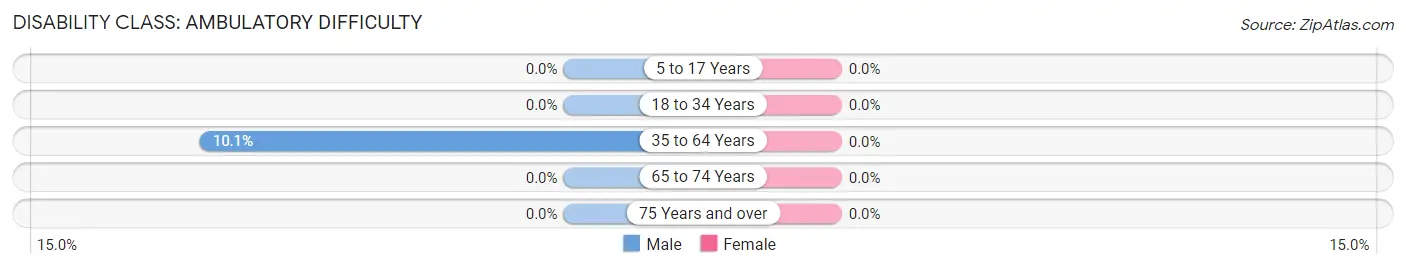
| Age Bracket | Male | Female |
| 5 to 17 Years | 0 (0.0%) | 0 (0.0%) |
| 18 to 34 Years | 0 (0.0%) | 0 (0.0%) |
| 35 to 64 Years | 43 (10.1%) | 0 (0.0%) |
| 65 to 74 Years | 0 (0.0%) | 0 (0.0%) |
| 75 Years and over | 0 (0.0%) | 0 (0.0%) |
Disability Class: Self-Care Difficulty
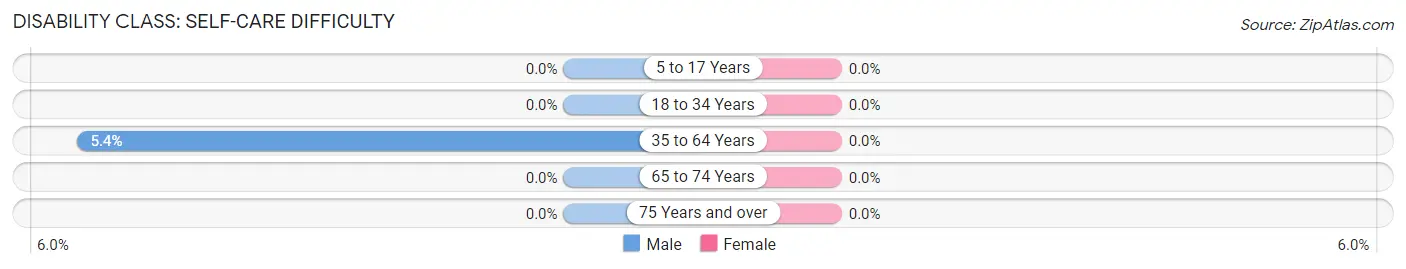
| Age Bracket | Male | Female |
| 5 to 17 Years | 0 (0.0%) | 0 (0.0%) |
| 18 to 34 Years | 0 (0.0%) | 0 (0.0%) |
| 35 to 64 Years | 23 (5.4%) | 0 (0.0%) |
| 65 to 74 Years | 0 (0.0%) | 0 (0.0%) |
| 75 Years and over | 0 (0.0%) | 0 (0.0%) |
Technology Access in Cassville
Computing Device Access in Cassville
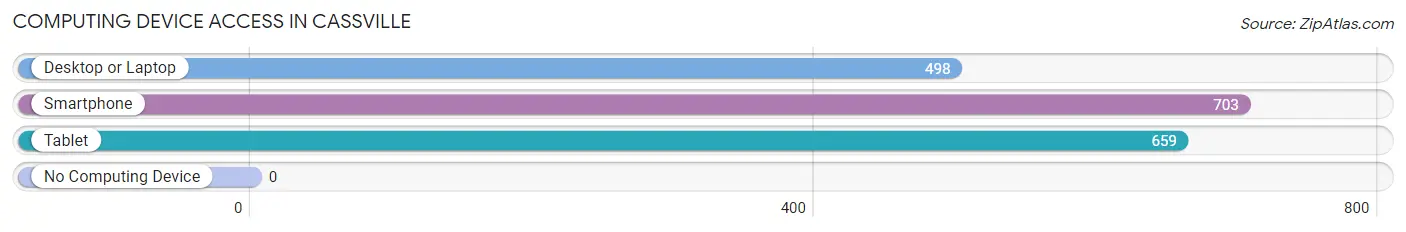
| Device Type | # Households | % Households |
| Desktop or Laptop | 498 | 69.8% |
| Smartphone | 703 | 98.5% |
| Tablet | 659 | 92.3% |
| No Computing Device | 0 | 0.0% |
| Total | 714 | 100.0% |
Internet Access in Cassville
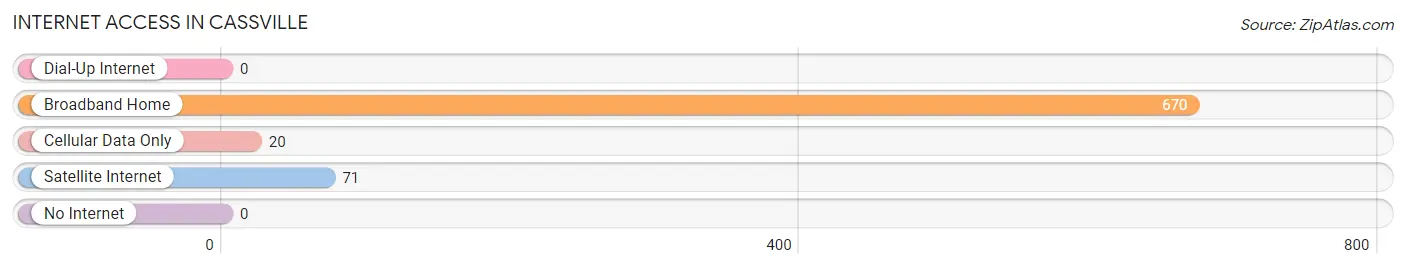
| Internet Type | # Households | % Households |
| Dial-Up Internet | 0 | 0.0% |
| Broadband Home | 670 | 93.8% |
| Cellular Data Only | 20 | 2.8% |
| Satellite Internet | 71 | 9.9% |
| No Internet | 0 | 0.0% |
| Total | 714 | 100.0% |
Cassville Summary
Cassville, West Virginia is a small town located in the eastern part of the state, in the Appalachian Mountains. It is situated in the northern part of Barbour County, and is the county seat. The town was founded in 1832 and was named after General Lewis Cass, a prominent figure in the War of 1812.
History
Cassville was founded in 1832 by a group of settlers from Virginia. The town was named after General Lewis Cass, a prominent figure in the War of 1812. The town was originally a farming community, and the first post office was established in 1837.
In the late 19th century, the town began to grow and develop. The railroad arrived in 1881, and the town was incorporated in 1883. The town was a major hub for the timber industry, and the lumber industry was a major employer in the area.
In the early 20th century, the town began to decline. The timber industry had moved on, and the town was no longer a major hub. The population began to decline, and the town was no longer a major economic center.
Geography
Cassville is located in the northern part of Barbour County, in the Appalachian Mountains. The town is situated on the banks of the Tygart Valley River. The town is surrounded by rolling hills and mountains, and is located in a rural area.
The climate in Cassville is temperate, with hot summers and cold winters. The average temperature in the summer is around 75 degrees Fahrenheit, and the average temperature in the winter is around 35 degrees Fahrenheit.
Economy
The economy of Cassville is largely based on agriculture and tourism. The town is home to several farms, and the surrounding area is known for its apple orchards. The town is also a popular tourist destination, and is home to several historic sites.
The town is also home to several small businesses, including restaurants, shops, and other services. The town is also home to a small manufacturing plant, which produces plastic products.
Demographics
As of the 2010 census, the population of Cassville was 1,845. The population is largely white, with a small minority population. The median household income is $30,000, and the median age is 44.
The town is home to several churches, including the First Baptist Church, the United Methodist Church, and the Church of the Nazarene. The town is also home to several schools, including Cassville Elementary School, Cassville Middle School, and Cassville High School.
Conclusion
Cassville, West Virginia is a small town located in the Appalachian Mountains. The town was founded in 1832 and was named after General Lewis Cass. The town was originally a farming community, and the timber industry was a major employer in the area. The town is now largely based on agriculture and tourism, and is home to several small businesses. The population of Cassville is largely white, with a median household income of $30,000 and a median age of 44.
Common Questions
What is Per Capita Income in Cassville?
Per Capita income in Cassville is $54,503.
What is the Median Family Income in Cassville?
Median Family Income in Cassville is $147,031.
What is the Median Household income in Cassville?
Median Household Income in Cassville is $85,878.
What is Income or Wage Gap in Cassville?
Income or Wage Gap in Cassville is 14.4%.
Women in Cassville earn 85.6 cents for every dollar earned by a man.
What is Inequality or Gini Index in Cassville?
Inequality or Gini Index in Cassville is 0.34.
What is the Total Population of Cassville?
Total Population of Cassville is 1,570.
What is the Total Male Population of Cassville?
Total Male Population of Cassville is 825.
What is the Total Female Population of Cassville?
Total Female Population of Cassville is 745.
What is the Ratio of Males per 100 Females in Cassville?
There are 110.74 Males per 100 Females in Cassville.
What is the Ratio of Females per 100 Males in Cassville?
There are 90.30 Females per 100 Males in Cassville.
What is the Median Population Age in Cassville?
Median Population Age in Cassville is 42.4 Years.
What is the Average Family Size in Cassville
Average Family Size in Cassville is 2.8 People.
What is the Average Household Size in Cassville
Average Household Size in Cassville is 2.2 People.
How Large is the Labor Force in Cassville?
There are 1,051 People in the Labor Forcein in Cassville.
What is the Percentage of People in the Labor Force in Cassville?
76.8% of People are in the Labor Force in Cassville.
What is the Unemployment Rate in Cassville?
Unemployment Rate in Cassville is 1.9%.