Middlebury, IN Map & Demographics
Middlebury Map
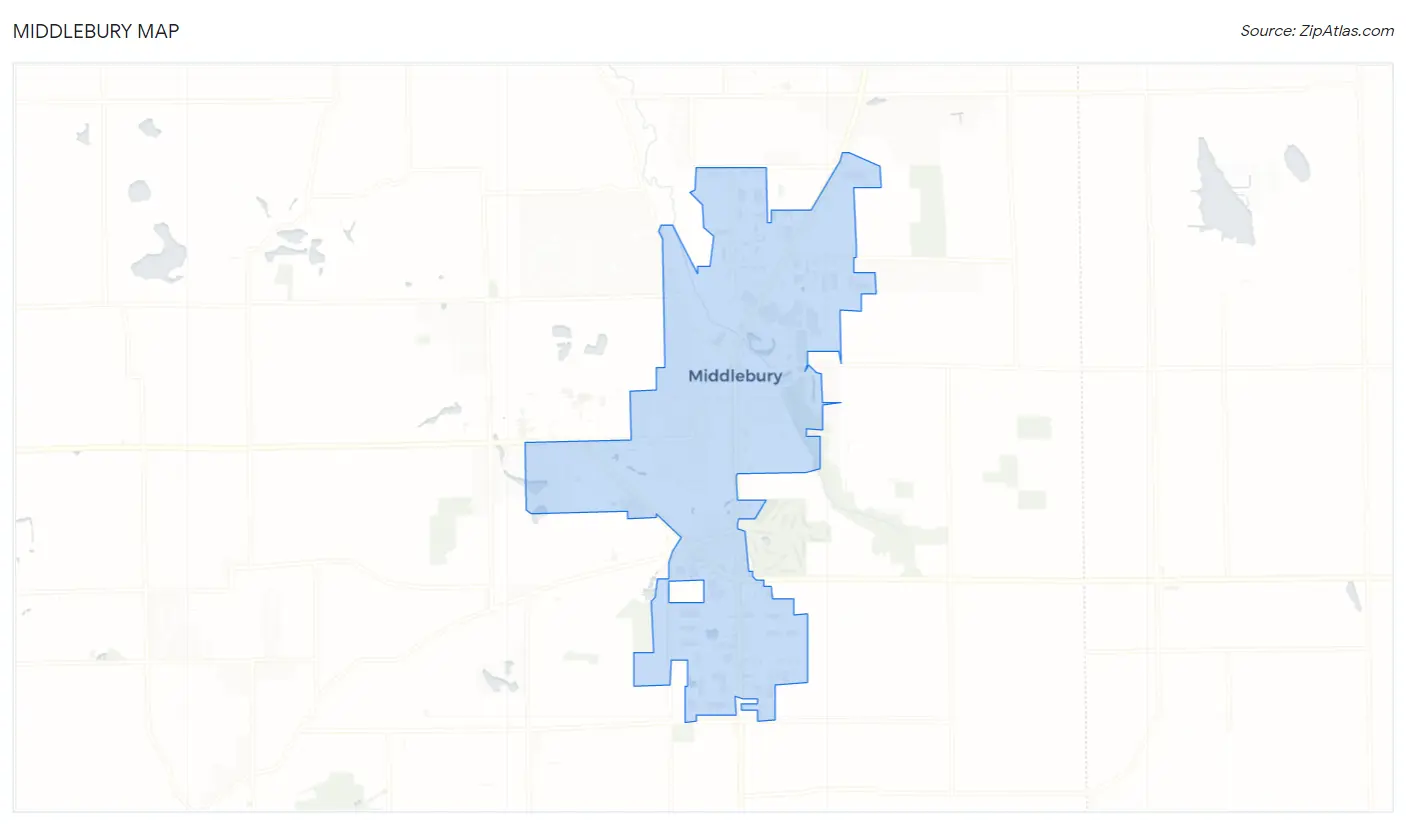
Middlebury Overview
$38,009
PER CAPITA INCOME
$79,278
AVG FAMILY INCOME
$78,056
AVG HOUSEHOLD INCOME
5.1%
WAGE / INCOME GAP [ % ]
94.9¢/ $1
WAGE / INCOME GAP [ $ ]
0.39
INEQUALITY / GINI INDEX
3,677
TOTAL POPULATION
2,009
MALE POPULATION
1,668
FEMALE POPULATION
120.44
MALES / 100 FEMALES
83.03
FEMALES / 100 MALES
43.6
MEDIAN AGE
2.9
AVG FAMILY SIZE
2.7
AVG HOUSEHOLD SIZE
2,051
LABOR FORCE [ PEOPLE ]
70.2%
PERCENT IN LABOR FORCE
5.8%
UNEMPLOYMENT RATE
Middlebury Zip Codes
Middlebury Area Codes
Income in Middlebury
Income Overview in Middlebury
Per Capita Income in Middlebury is $38,009, while median incomes of families and households are $79,278 and $78,056 respectively.
| Characteristic | Number | Measure |
| Per Capita Income | 3,677 | $38,009 |
| Median Family Income | 1,098 | $79,278 |
| Mean Family Income | 1,098 | $109,235 |
| Median Household Income | 1,352 | $78,056 |
| Mean Household Income | 1,352 | $100,940 |
| Income Deficit | 1,098 | $0 |
| Wage / Income Gap (%) | 3,677 | 5.13% |
| Wage / Income Gap ($) | 3,677 | 94.87¢ per $1 |
| Gini / Inequality Index | 3,677 | 0.39 |
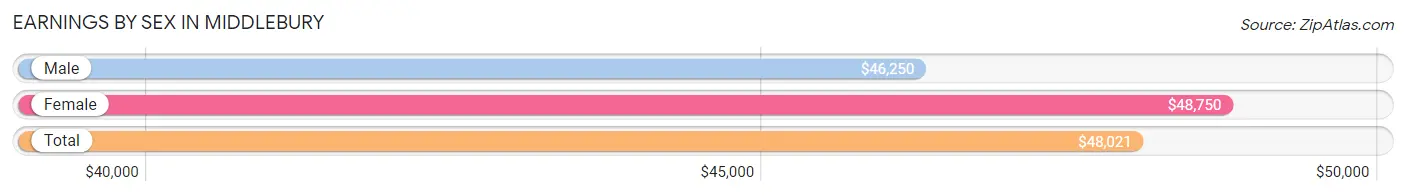
Earnings by Sex in Middlebury
Average Earnings in Middlebury are $48,021, $46,250 for men and $48,750 for women, a difference of 5.1%.
| Sex | Number | Average Earnings |
| Male | 1,231 (58.0%) | $46,250 |
| Female | 893 (42.0%) | $48,750 |
| Total | 2,124 (100.0%) | $48,021 |
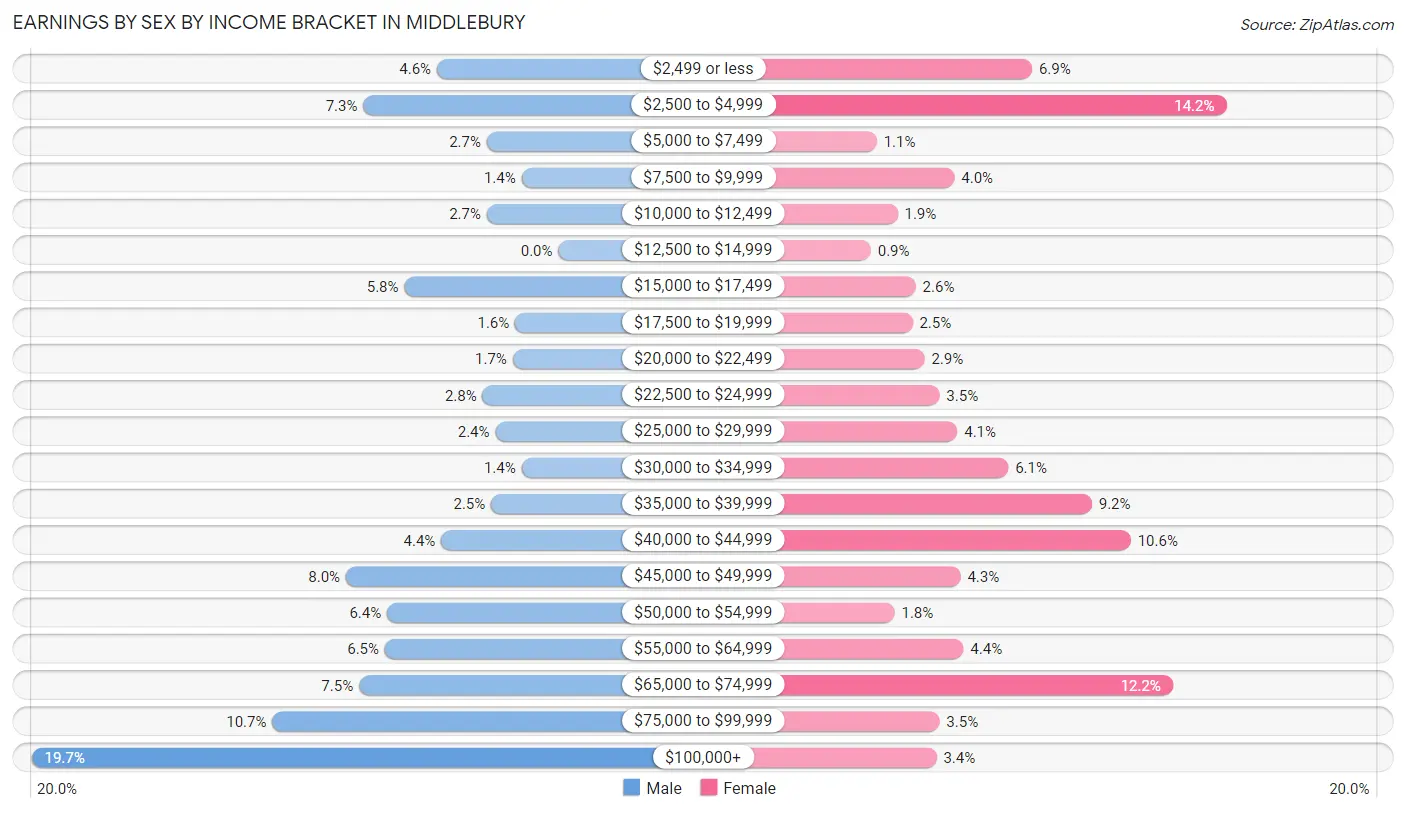
Earnings by Sex by Income Bracket in Middlebury
The most common earnings brackets in Middlebury are $100,000+ for men (243 | 19.7%) and $2,500 to $4,999 for women (127 | 14.2%).
| Income | Male | Female |
| $2,499 or less | 56 (4.5%) | 62 (6.9%) |
| $2,500 to $4,999 | 90 (7.3%) | 127 (14.2%) |
| $5,000 to $7,499 | 33 (2.7%) | 10 (1.1%) |
| $7,500 to $9,999 | 17 (1.4%) | 36 (4.0%) |
| $10,000 to $12,499 | 33 (2.7%) | 17 (1.9%) |
| $12,500 to $14,999 | 0 (0.0%) | 8 (0.9%) |
| $15,000 to $17,499 | 71 (5.8%) | 23 (2.6%) |
| $17,500 to $19,999 | 20 (1.6%) | 22 (2.5%) |
| $20,000 to $22,499 | 21 (1.7%) | 26 (2.9%) |
| $22,500 to $24,999 | 35 (2.8%) | 31 (3.5%) |
| $25,000 to $29,999 | 29 (2.4%) | 37 (4.1%) |
| $30,000 to $34,999 | 17 (1.4%) | 54 (6.0%) |
| $35,000 to $39,999 | 31 (2.5%) | 82 (9.2%) |
| $40,000 to $44,999 | 54 (4.4%) | 95 (10.6%) |
| $45,000 to $49,999 | 98 (8.0%) | 38 (4.3%) |
| $50,000 to $54,999 | 79 (6.4%) | 16 (1.8%) |
| $55,000 to $64,999 | 80 (6.5%) | 39 (4.4%) |
| $65,000 to $74,999 | 92 (7.5%) | 109 (12.2%) |
| $75,000 to $99,999 | 132 (10.7%) | 31 (3.5%) |
| $100,000+ | 243 (19.7%) | 30 (3.4%) |
| Total | 1,231 (100.0%) | 893 (100.0%) |
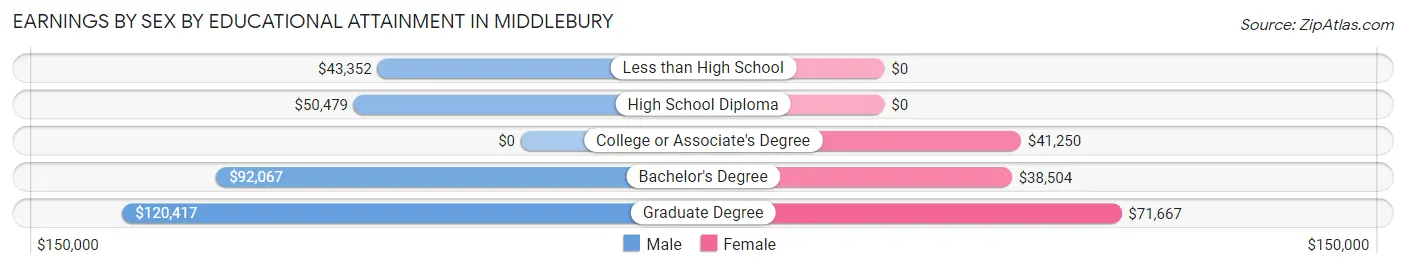
Earnings by Sex by Educational Attainment in Middlebury
Average earnings in Middlebury are $55,250 for men and $38,460 for women, a difference of 30.4%. Men with an educational attainment of graduate degree enjoy the highest average annual earnings of $120,417, while those with less than high school education earn the least with $43,352. Women with an educational attainment of graduate degree earn the most with the average annual earnings of $71,667, while those with bachelor's degree education have the smallest earnings of $38,504.
| Educational Attainment | Male Income | Female Income |
| Less than High School | $43,352 | $0 |
| High School Diploma | $50,479 | $0 |
| College or Associate's Degree | - | - |
| Bachelor's Degree | $92,067 | $38,504 |
| Graduate Degree | $120,417 | $71,667 |
| Total | $55,250 | $38,460 |
Family Income in Middlebury
Family Income Brackets in Middlebury
According to the Middlebury family income data, there are 224 families falling into the $200,000+ income range, which is the most common income bracket and makes up 20.4% of all families.
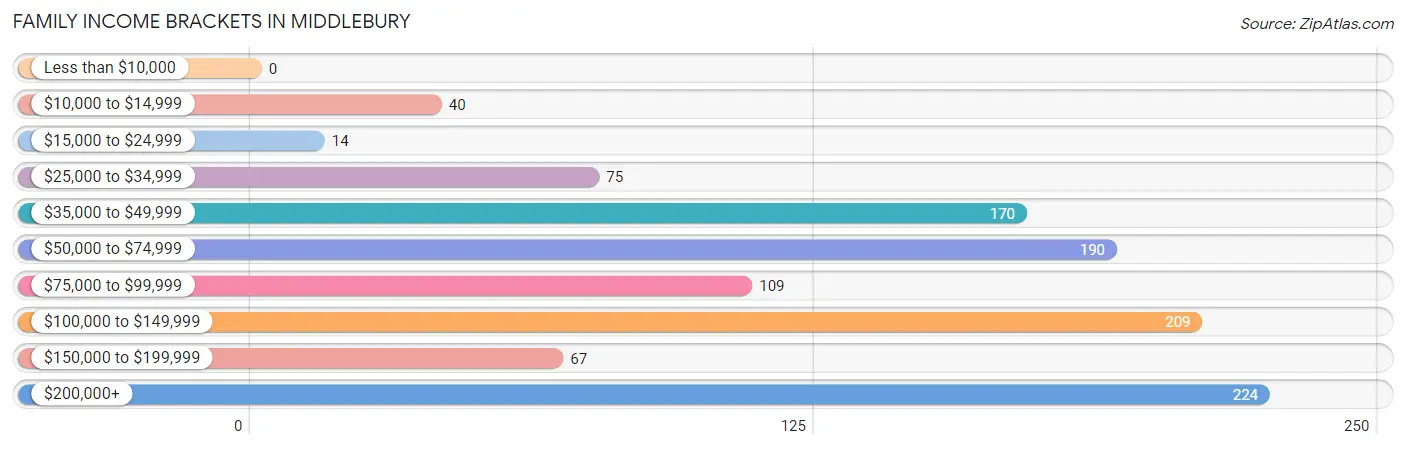
| Income Bracket | # Families | % Families |
| Less than $10,000 | 0 | 0.0% |
| $10,000 to $14,999 | 40 | 3.6% |
| $15,000 to $24,999 | 14 | 1.3% |
| $25,000 to $34,999 | 75 | 6.8% |
| $35,000 to $49,999 | 170 | 15.5% |
| $50,000 to $74,999 | 190 | 17.3% |
| $75,000 to $99,999 | 109 | 9.9% |
| $100,000 to $149,999 | 209 | 19.0% |
| $150,000 to $199,999 | 67 | 6.1% |
| $200,000+ | 224 | 20.4% |
Family Income by Famaliy Size in Middlebury
4-person families (108 | 9.8%) account for the highest median family income in Middlebury with $116,250 per family, while 3-person families (266 | 24.2%) have the highest median income of $37,514 per family member.
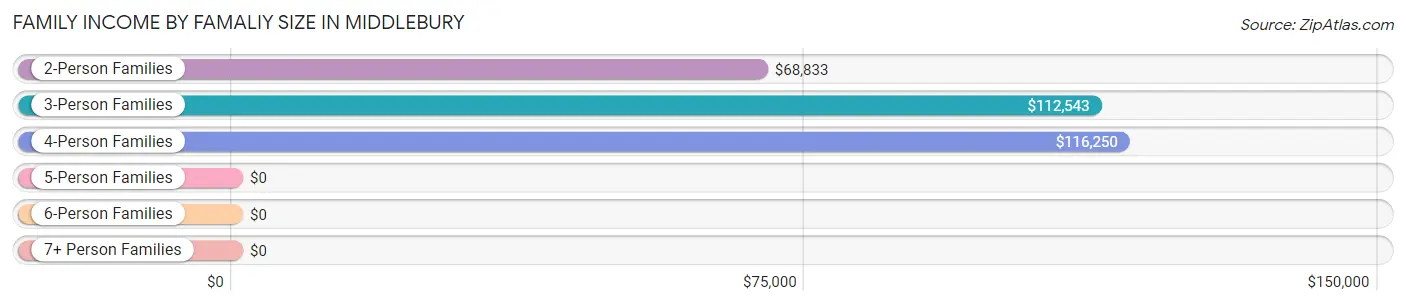
| Income Bracket | # Families | Median Income |
| 2-Person Families | 596 (54.3%) | $68,833 |
| 3-Person Families | 266 (24.2%) | $112,543 |
| 4-Person Families | 108 (9.8%) | $116,250 |
| 5-Person Families | 113 (10.3%) | $0 |
| 6-Person Families | 15 (1.4%) | $0 |
| 7+ Person Families | 0 (0.0%) | $0 |
| Total | 1,098 (100.0%) | $79,278 |
Family Income by Number of Earners in Middlebury
The median family income in Middlebury is $79,278, with families comprising 3+ earners (134) having the highest median family income of $146,316, while families with 1 earner (397) have the lowest median family income of $46,597, accounting for 12.2% and 36.2% of families, respectively.
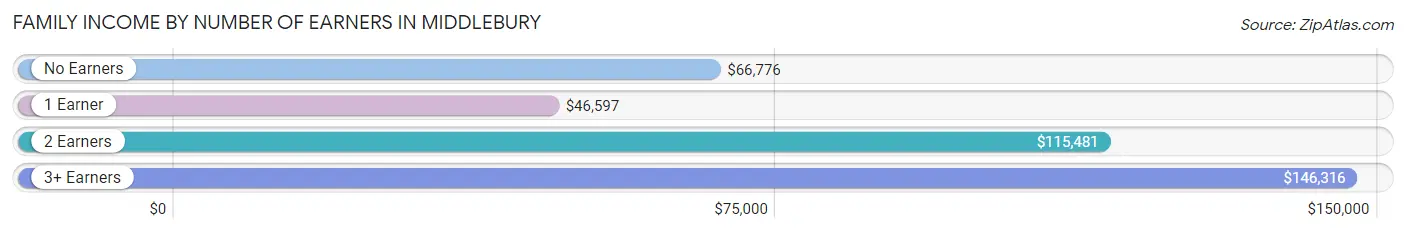
| Number of Earners | # Families | Median Income |
| No Earners | 95 (8.6%) | $66,776 |
| 1 Earner | 397 (36.2%) | $46,597 |
| 2 Earners | 472 (43.0%) | $115,481 |
| 3+ Earners | 134 (12.2%) | $146,316 |
| Total | 1,098 (100.0%) | $79,278 |
Household Income in Middlebury
Household Income Brackets in Middlebury
With 233 households falling in the category, the $200,000+ income range is the most frequent in Middlebury, accounting for 17.2% of all households.
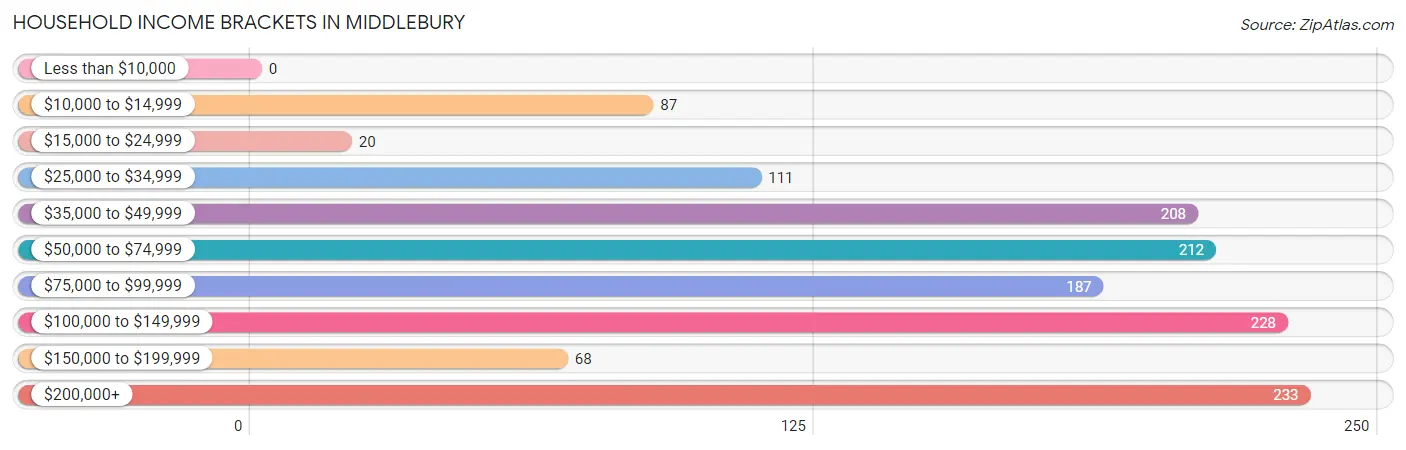
| Income Bracket | # Households | % Households |
| Less than $10,000 | 0 | 0.0% |
| $10,000 to $14,999 | 87 | 6.4% |
| $15,000 to $24,999 | 20 | 1.5% |
| $25,000 to $34,999 | 111 | 8.2% |
| $35,000 to $49,999 | 208 | 15.4% |
| $50,000 to $74,999 | 212 | 15.7% |
| $75,000 to $99,999 | 187 | 13.8% |
| $100,000 to $149,999 | 228 | 16.9% |
| $150,000 to $199,999 | 68 | 5.0% |
| $200,000+ | 233 | 17.2% |
Household Income by Householder Age in Middlebury
The median household income in Middlebury is $78,056, with the highest median household income of $112,974 found in the 45 to 64 years age bracket for the primary householder. A total of 596 households (44.1%) fall into this category. Meanwhile, the 15 to 24 years age bracket for the primary householder has the lowest median household income of $0, with 8 households (0.6%) in this group.
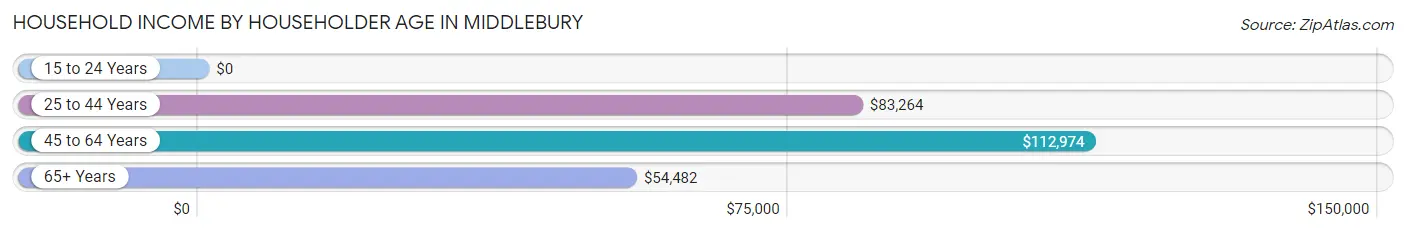
| Income Bracket | # Households | Median Income |
| 15 to 24 Years | 8 (0.6%) | $0 |
| 25 to 44 Years | 405 (30.0%) | $83,264 |
| 45 to 64 Years | 596 (44.1%) | $112,974 |
| 65+ Years | 343 (25.4%) | $54,482 |
| Total | 1,352 (100.0%) | $78,056 |
Poverty in Middlebury
Income Below Poverty by Sex and Age in Middlebury
With 4.8% poverty level for males and 8.3% for females among the residents of Middlebury, 16 and 17 year old males and 75 year old and over females are the most vulnerable to poverty, with 23 males (18.7%) and 25 females (32.1%) in their respective age groups living below the poverty level.
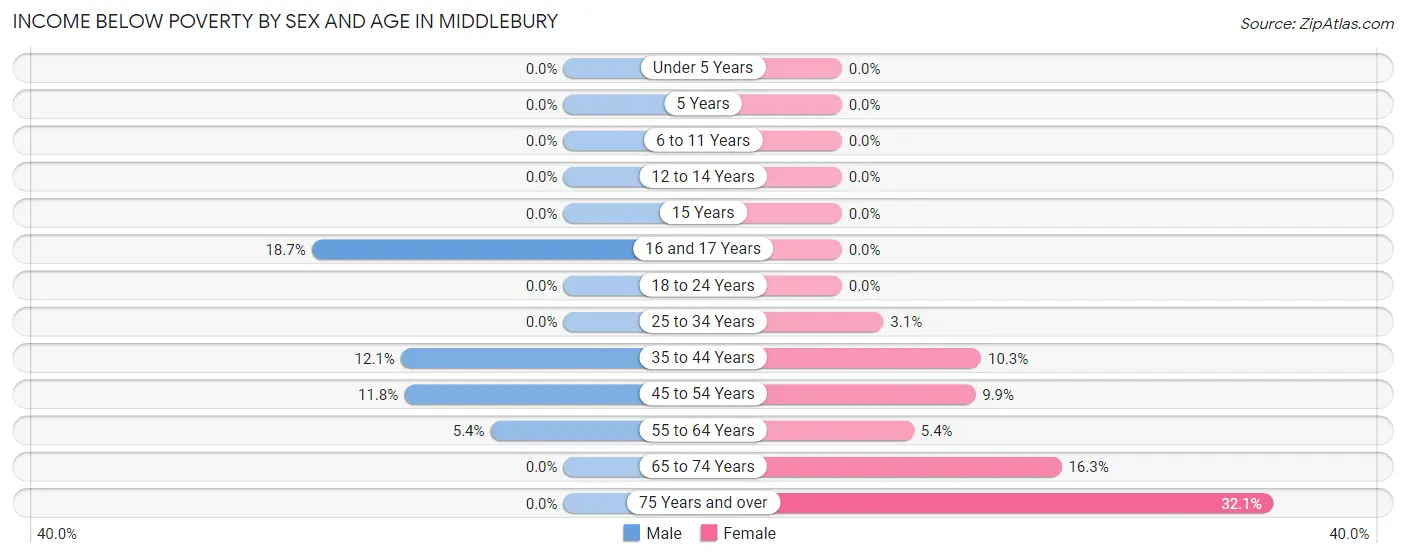
| Age Bracket | Male | Female |
| Under 5 Years | 0 (0.0%) | 0 (0.0%) |
| 5 Years | 0 (0.0%) | 0 (0.0%) |
| 6 to 11 Years | 0 (0.0%) | 0 (0.0%) |
| 12 to 14 Years | 0 (0.0%) | 0 (0.0%) |
| 15 Years | 0 (0.0%) | 0 (0.0%) |
| 16 and 17 Years | 23 (18.7%) | 0 (0.0%) |
| 18 to 24 Years | 0 (0.0%) | 0 (0.0%) |
| 25 to 34 Years | 0 (0.0%) | 3 (3.1%) |
| 35 to 44 Years | 29 (12.1%) | 30 (10.3%) |
| 45 to 54 Years | 22 (11.8%) | 22 (9.9%) |
| 55 to 64 Years | 22 (5.4%) | 20 (5.3%) |
| 65 to 74 Years | 0 (0.0%) | 38 (16.3%) |
| 75 Years and over | 0 (0.0%) | 25 (32.1%) |
| Total | 96 (4.8%) | 138 (8.3%) |
Income Above Poverty by Sex and Age in Middlebury
According to the poverty statistics in Middlebury, males aged under 5 years and females aged under 5 years are the age groups that are most secure financially, with 100.0% of males and 100.0% of females in these age groups living above the poverty line.
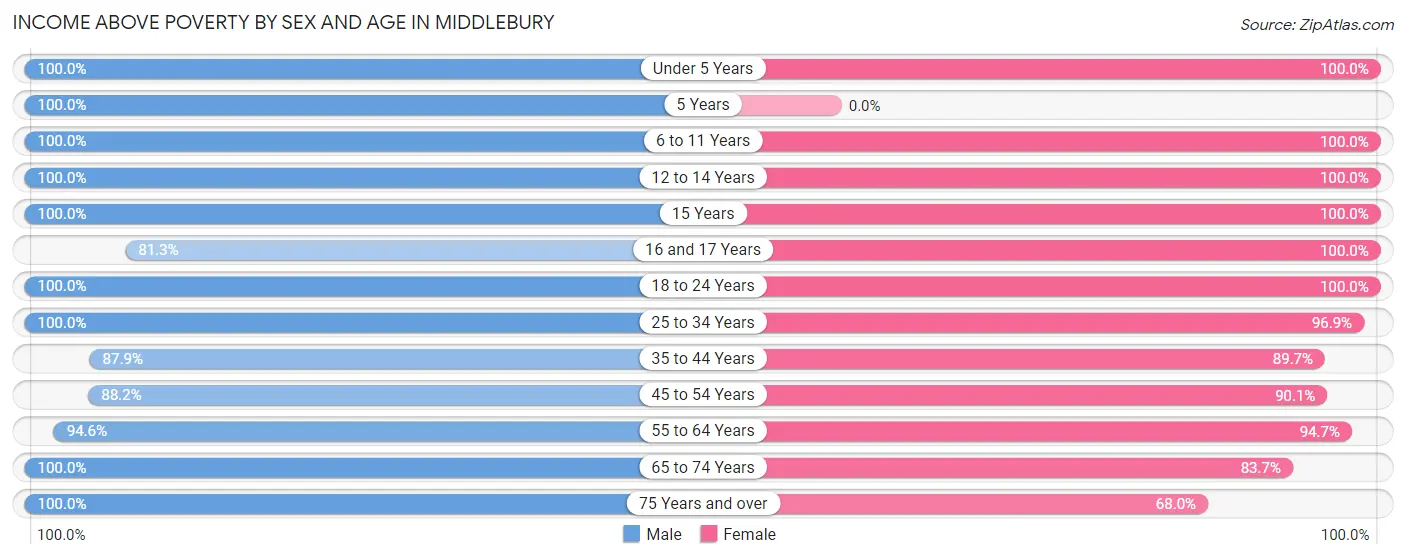
| Age Bracket | Male | Female |
| Under 5 Years | 95 (100.0%) | 73 (100.0%) |
| 5 Years | 47 (100.0%) | 0 (0.0%) |
| 6 to 11 Years | 96 (100.0%) | 113 (100.0%) |
| 12 to 14 Years | 177 (100.0%) | 52 (100.0%) |
| 15 Years | 65 (100.0%) | 38 (100.0%) |
| 16 and 17 Years | 100 (81.3%) | 53 (100.0%) |
| 18 to 24 Years | 83 (100.0%) | 45 (100.0%) |
| 25 to 34 Years | 250 (100.0%) | 94 (96.9%) |
| 35 to 44 Years | 211 (87.9%) | 260 (89.7%) |
| 45 to 54 Years | 164 (88.2%) | 200 (90.1%) |
| 55 to 64 Years | 384 (94.6%) | 354 (94.7%) |
| 65 to 74 Years | 169 (100.0%) | 195 (83.7%) |
| 75 Years and over | 72 (100.0%) | 53 (67.9%) |
| Total | 1,913 (95.2%) | 1,530 (91.7%) |
Income Below Poverty Among Married-Couple Families in Middlebury
The poverty statistics for married-couple families in Middlebury show that 2.2% or 21 of the total 943 families live below the poverty line. Families with no children have the highest poverty rate of 3.5%, comprising of 21 families. On the other hand, families with 1 or 2 children have the lowest poverty rate of 0.0%, which includes 0 families.
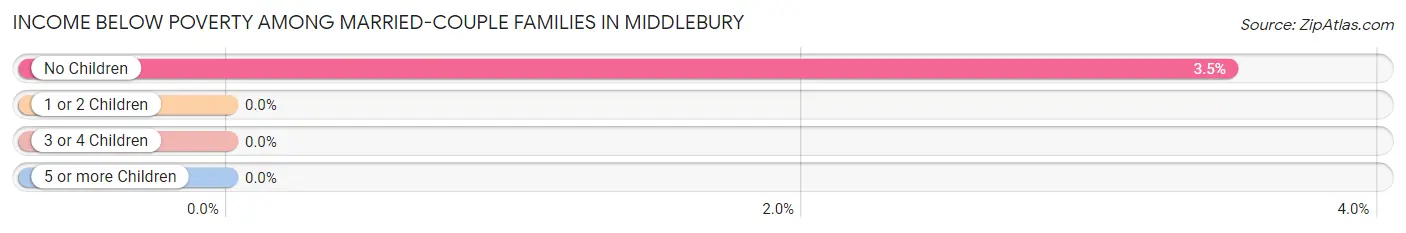
| Children | Above Poverty | Below Poverty |
| No Children | 583 (96.5%) | 21 (3.5%) |
| 1 or 2 Children | 261 (100.0%) | 0 (0.0%) |
| 3 or 4 Children | 78 (100.0%) | 0 (0.0%) |
| 5 or more Children | 0 (0.0%) | 0 (0.0%) |
| Total | 922 (97.8%) | 21 (2.2%) |
Income Below Poverty Among Single-Parent Households in Middlebury
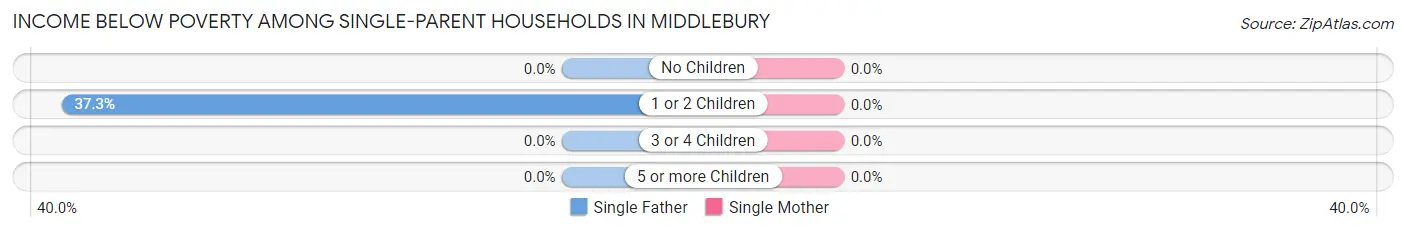
| Children | Single Father | Single Mother |
| No Children | 0 (0.0%) | 0 (0.0%) |
| 1 or 2 Children | 19 (37.2%) | 0 (0.0%) |
| 3 or 4 Children | 0 (0.0%) | 0 (0.0%) |
| 5 or more Children | 0 (0.0%) | 0 (0.0%) |
| Total | 19 (37.2%) | 0 (0.0%) |
Income Below Poverty Among Married-Couple vs Single-Parent Households in Middlebury
The poverty data for Middlebury shows that 21 of the married-couple family households (2.2%) and 19 of the single-parent households (12.3%) are living below the poverty level. Within the married-couple family households, those with no children have the highest poverty rate, with 21 households (3.5%) falling below the poverty line. Among the single-parent households, those with 1 or 2 children have the highest poverty rate, with 19 household (12.3%) living below poverty.
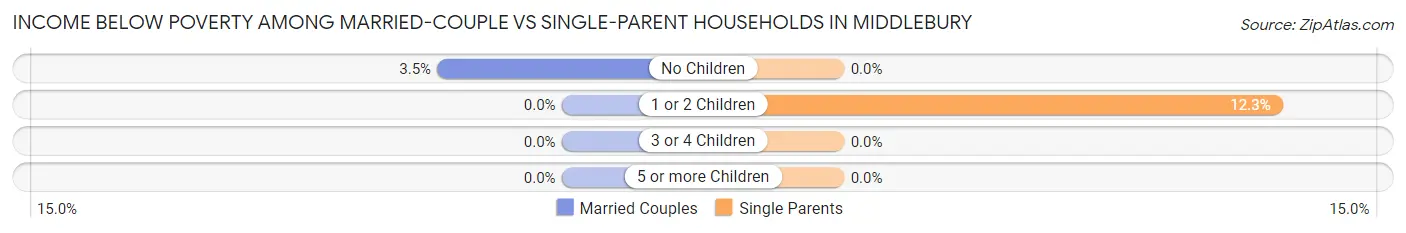
| Children | Married-Couple Families | Single-Parent Households |
| No Children | 21 (3.5%) | 0 (0.0%) |
| 1 or 2 Children | 0 (0.0%) | 19 (12.3%) |
| 3 or 4 Children | 0 (0.0%) | 0 (0.0%) |
| 5 or more Children | 0 (0.0%) | 0 (0.0%) |
| Total | 21 (2.2%) | 19 (12.3%) |
Race in Middlebury
The most populous races in Middlebury are White / Caucasian (3,437 | 93.5%), Black / African American (108 | 2.9%), and Hispanic or Latino (95 | 2.6%).
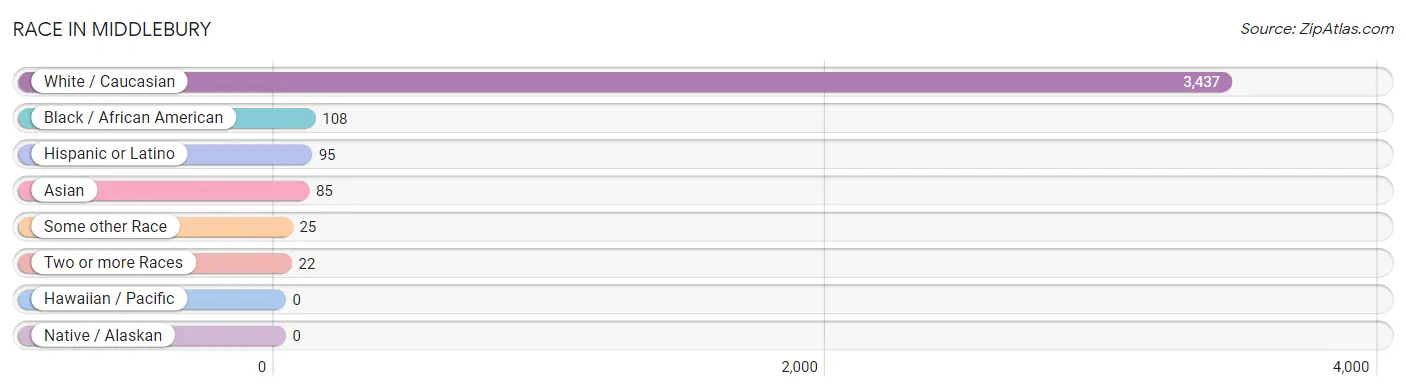
| Race | # Population | % Population |
| Asian | 85 | 2.3% |
| Black / African American | 108 | 2.9% |
| Hawaiian / Pacific | 0 | 0.0% |
| Hispanic or Latino | 95 | 2.6% |
| Native / Alaskan | 0 | 0.0% |
| White / Caucasian | 3,437 | 93.5% |
| Two or more Races | 22 | 0.6% |
| Some other Race | 25 | 0.7% |
| Total | 3,677 | 100.0% |
Ancestry in Middlebury
The most populous ancestries reported in Middlebury are German (901 | 24.5%), English (328 | 8.9%), Irish (323 | 8.8%), European (216 | 5.9%), and American (209 | 5.7%), together accounting for 53.7% of all Middlebury residents.
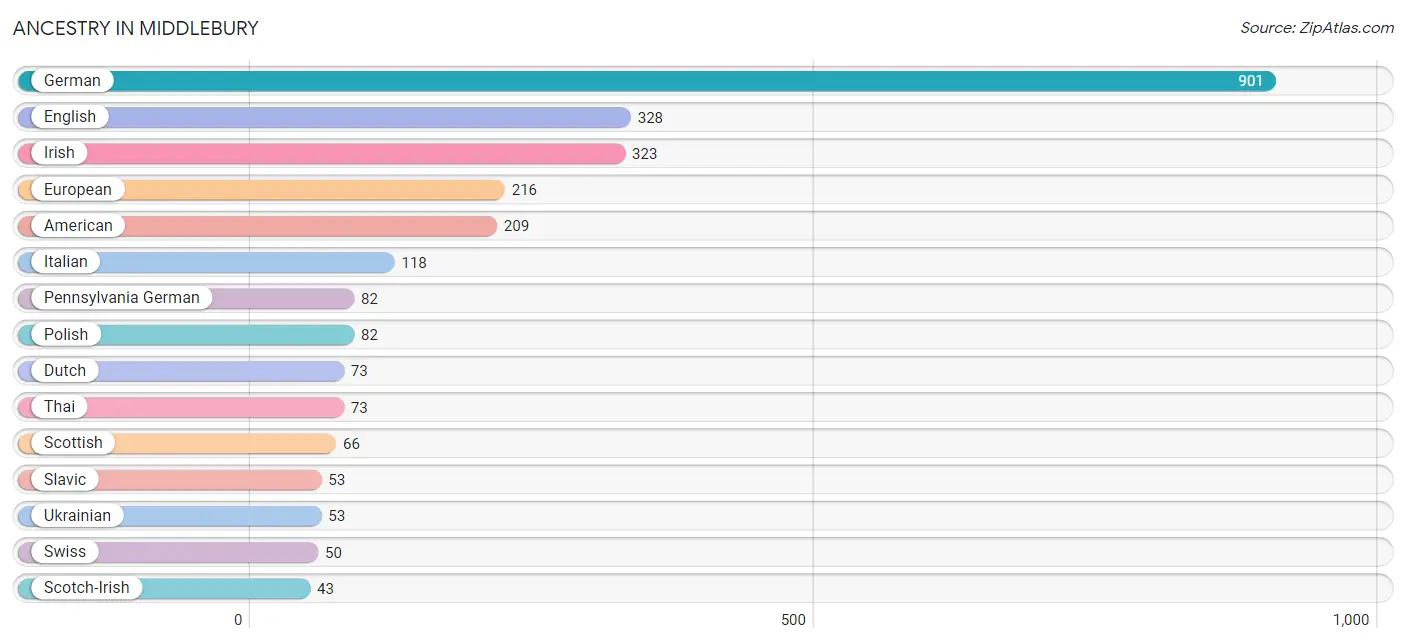
| Ancestry | # Population | % Population |
| American | 209 | 5.7% |
| British | 17 | 0.5% |
| Central American | 41 | 1.1% |
| Dutch | 73 | 2.0% |
| English | 328 | 8.9% |
| European | 216 | 5.9% |
| French | 24 | 0.6% |
| German | 901 | 24.5% |
| Guatemalan | 16 | 0.4% |
| Irish | 323 | 8.8% |
| Italian | 118 | 3.2% |
| Mexican | 25 | 0.7% |
| Norwegian | 26 | 0.7% |
| Pennsylvania German | 82 | 2.2% |
| Polish | 82 | 2.2% |
| Puerto Rican | 29 | 0.8% |
| Russian | 5 | 0.1% |
| Salvadoran | 25 | 0.7% |
| Scotch-Irish | 43 | 1.2% |
| Scottish | 66 | 1.8% |
| Slavic | 53 | 1.4% |
| Swiss | 50 | 1.4% |
| Thai | 73 | 2.0% |
| Ukrainian | 53 | 1.4% | View All 24 Rows |
Immigrants in Middlebury
The most numerous immigrant groups reported in Middlebury came from Central America (83 | 2.3%), Latin America (83 | 2.3%), Asia (59 | 1.6%), South Central Asia (59 | 1.6%), and Eastern Europe (53 | 1.4%), together accounting for 9.2% of all Middlebury residents.
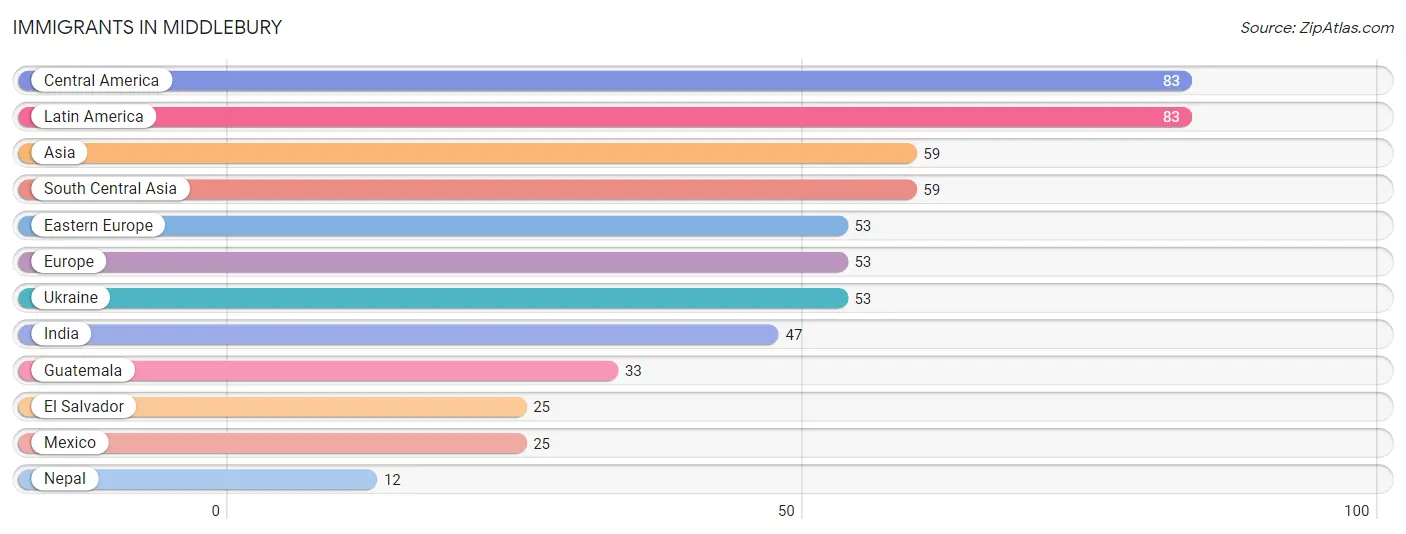
| Immigration Origin | # Population | % Population |
| Asia | 59 | 1.6% |
| Central America | 83 | 2.3% |
| Eastern Europe | 53 | 1.4% |
| El Salvador | 25 | 0.7% |
| Europe | 53 | 1.4% |
| Guatemala | 33 | 0.9% |
| India | 47 | 1.3% |
| Latin America | 83 | 2.3% |
| Mexico | 25 | 0.7% |
| Nepal | 12 | 0.3% |
| South Central Asia | 59 | 1.6% |
| Ukraine | 53 | 1.4% | View All 12 Rows |
Sex and Age in Middlebury
Sex and Age in Middlebury
The most populous age groups in Middlebury are 55 to 59 Years (331 | 16.5%) for men and 60 to 64 Years (192 | 11.5%) for women.
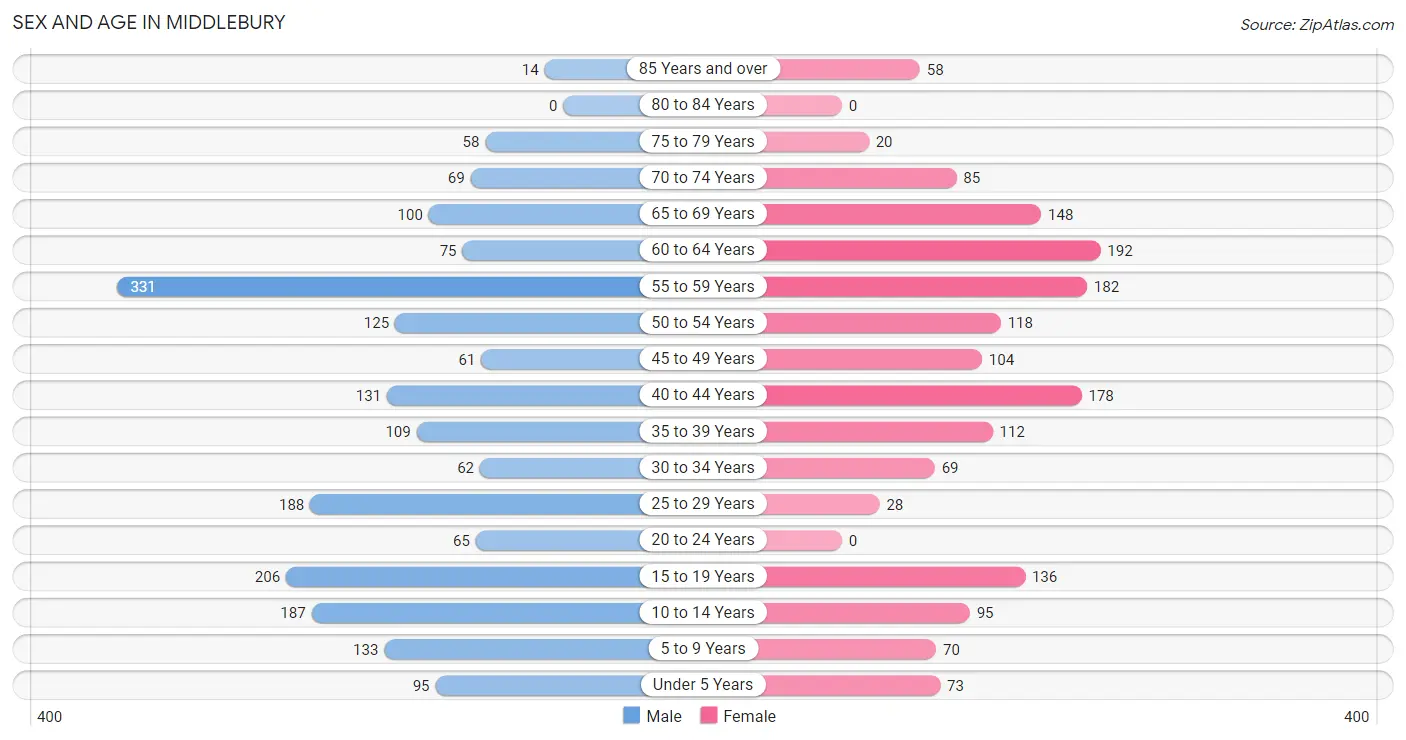
| Age Bracket | Male | Female |
| Under 5 Years | 95 (4.7%) | 73 (4.4%) |
| 5 to 9 Years | 133 (6.6%) | 70 (4.2%) |
| 10 to 14 Years | 187 (9.3%) | 95 (5.7%) |
| 15 to 19 Years | 206 (10.2%) | 136 (8.2%) |
| 20 to 24 Years | 65 (3.2%) | 0 (0.0%) |
| 25 to 29 Years | 188 (9.4%) | 28 (1.7%) |
| 30 to 34 Years | 62 (3.1%) | 69 (4.1%) |
| 35 to 39 Years | 109 (5.4%) | 112 (6.7%) |
| 40 to 44 Years | 131 (6.5%) | 178 (10.7%) |
| 45 to 49 Years | 61 (3.0%) | 104 (6.2%) |
| 50 to 54 Years | 125 (6.2%) | 118 (7.1%) |
| 55 to 59 Years | 331 (16.5%) | 182 (10.9%) |
| 60 to 64 Years | 75 (3.7%) | 192 (11.5%) |
| 65 to 69 Years | 100 (5.0%) | 148 (8.9%) |
| 70 to 74 Years | 69 (3.4%) | 85 (5.1%) |
| 75 to 79 Years | 58 (2.9%) | 20 (1.2%) |
| 80 to 84 Years | 0 (0.0%) | 0 (0.0%) |
| 85 Years and over | 14 (0.7%) | 58 (3.5%) |
| Total | 2,009 (100.0%) | 1,668 (100.0%) |
Families and Households in Middlebury
Median Family Size in Middlebury
The median family size in Middlebury is 2.93 persons per family, with single male/father families (51 | 4.6%) accounting for the largest median family size of 3.1 persons per family. On the other hand, single female/mother families (104 | 9.5%) represent the smallest median family size with 2.42 persons per family.
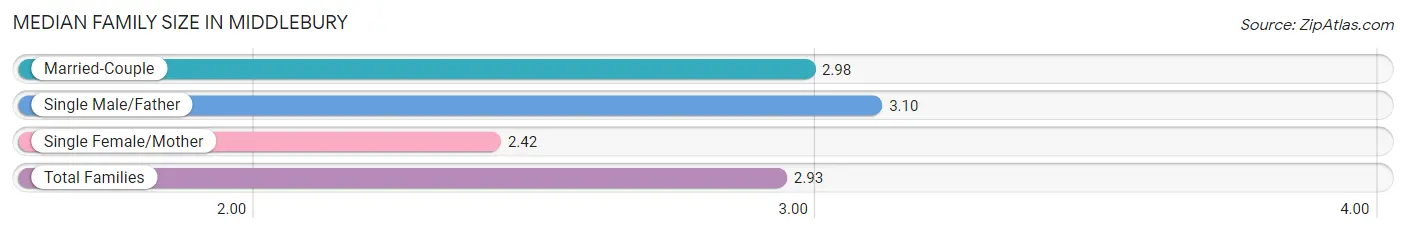
| Family Type | # Families | Family Size |
| Married-Couple | 943 (85.9%) | 2.98 |
| Single Male/Father | 51 (4.6%) | 3.10 |
| Single Female/Mother | 104 (9.5%) | 2.42 |
| Total Families | 1,098 (100.0%) | 2.93 |
Median Household Size in Middlebury
The median household size in Middlebury is 2.71 persons per household, with single male/father households (51 | 3.8%) accounting for the largest median household size of 3.1 persons per household. non-family households (254 | 18.8%) represent the smallest median household size with 1.53 persons per household.
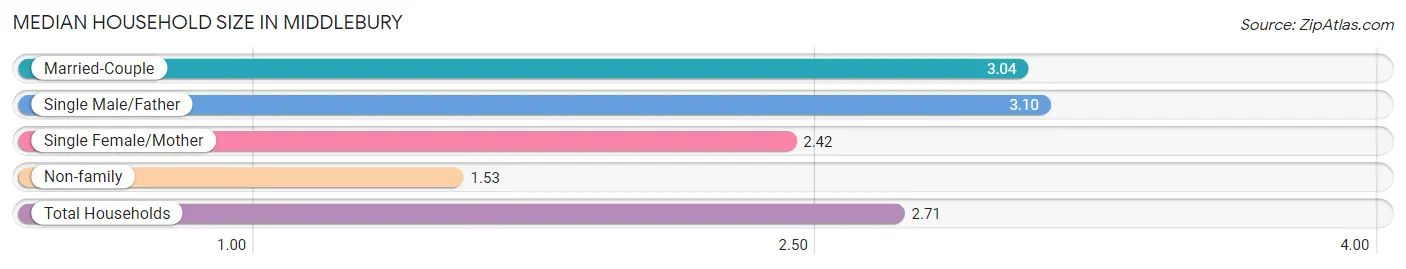
| Household Type | # Households | Household Size |
| Married-Couple | 943 (69.8%) | 3.04 |
| Single Male/Father | 51 (3.8%) | 3.10 |
| Single Female/Mother | 104 (7.7%) | 2.42 |
| Non-family | 254 (18.8%) | 1.53 |
| Total Households | 1,352 (100.0%) | 2.71 |
Household Size by Marriage Status in Middlebury
Out of a total of 1,352 households in Middlebury, 1,098 (81.2%) are family households, while 254 (18.8%) are nonfamily households. The most numerous type of family households are 2-person households, comprising 579, and the most common type of nonfamily households are 1-person households, comprising 169.
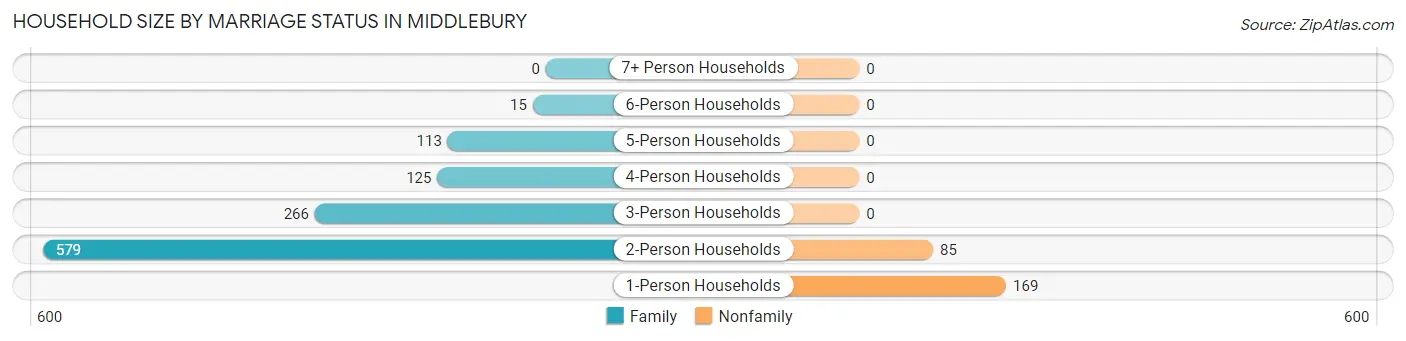
| Household Size | Family Households | Nonfamily Households |
| 1-Person Households | - | 169 (12.5%) |
| 2-Person Households | 579 (42.8%) | 85 (6.3%) |
| 3-Person Households | 266 (19.7%) | 0 (0.0%) |
| 4-Person Households | 125 (9.2%) | 0 (0.0%) |
| 5-Person Households | 113 (8.4%) | 0 (0.0%) |
| 6-Person Households | 15 (1.1%) | 0 (0.0%) |
| 7+ Person Households | 0 (0.0%) | 0 (0.0%) |
| Total | 1,098 (81.2%) | 254 (18.8%) |
Female Fertility in Middlebury
Fertility by Age in Middlebury
Average fertility rate in Middlebury is 46.0 births per 1,000 women. Women in the age bracket of 15 to 19 years have the highest fertility rate with 110.0 births per 1,000 women. Women in the age bracket of 15 to 19 years acount for 50.0% of all women with births.
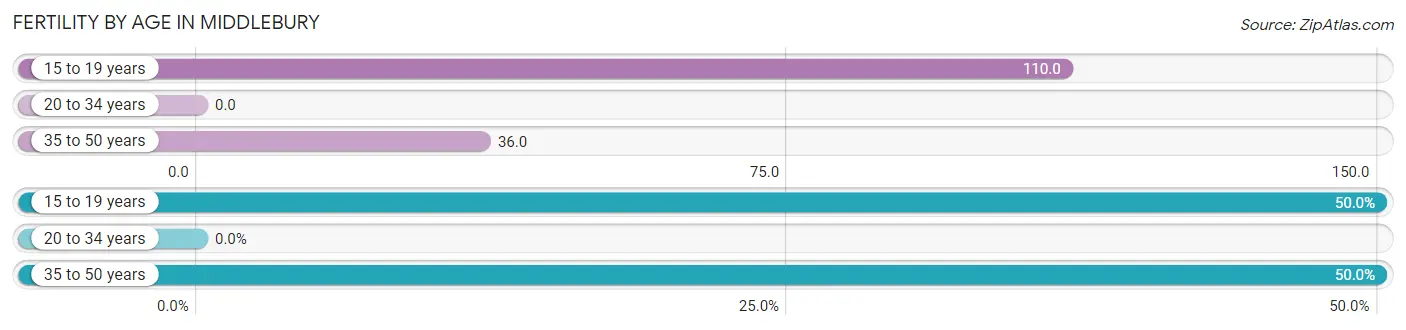
| Age Bracket | Women with Births | Births / 1,000 Women |
| 15 to 19 years | 15 (50.0%) | 110.0 |
| 20 to 34 years | 0 (0.0%) | 0.0 |
| 35 to 50 years | 15 (50.0%) | 36.0 |
| Total | 30 (100.0%) | 46.0 |
Fertility by Age by Marriage Status in Middlebury
50.0% of women with births (30) in Middlebury are married. The highest percentage of unmarried women with births falls into 15 to 19 years age bracket with 100.0% of them unmarried at the time of birth, while the lowest percentage of unmarried women with births belong to 35 to 50 years age bracket with 0.0% of them unmarried.
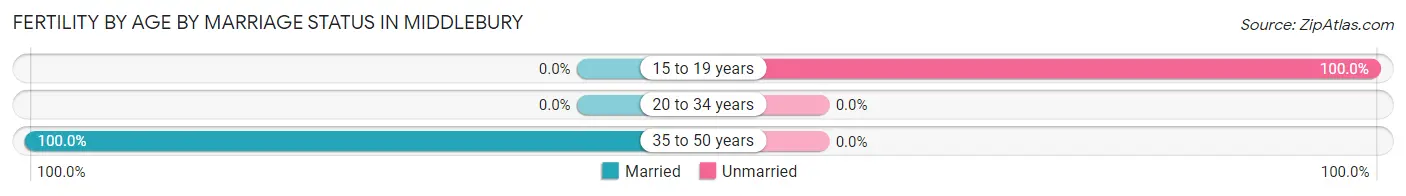
| Age Bracket | Married | Unmarried |
| 15 to 19 years | 0 (0.0%) | 15 (100.0%) |
| 20 to 34 years | 0 (0.0%) | 0 (0.0%) |
| 35 to 50 years | 15 (100.0%) | 0 (0.0%) |
| Total | 15 (50.0%) | 15 (50.0%) |
Fertility by Education in Middlebury
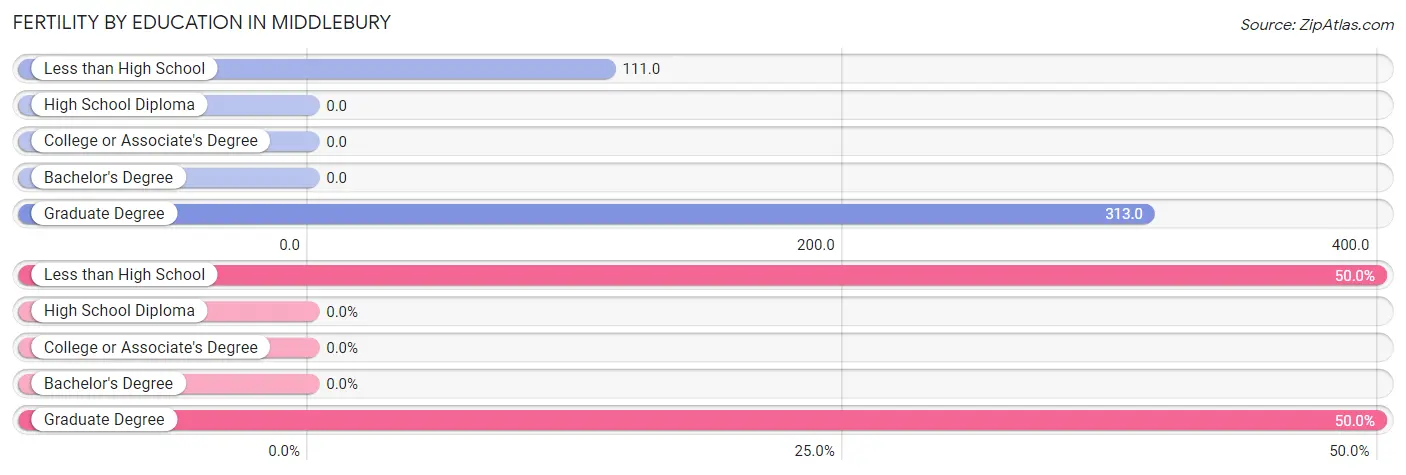
| Educational Attainment | Women with Births | Births / 1,000 Women |
| Less than High School | 15 (50.0%) | 111.0 |
| High School Diploma | 0 (0.0%) | 0.0 |
| College or Associate's Degree | 0 (0.0%) | 0.0 |
| Bachelor's Degree | 0 (0.0%) | 0.0 |
| Graduate Degree | 15 (50.0%) | 313.0 |
| Total | 30 (100.0%) | 46.0 |
Fertility by Education by Marriage Status in Middlebury
50.0% of women with births in Middlebury are unmarried. Women with the educational attainment of graduate degree are most likely to be married with 100.0% of them married at childbirth, while women with the educational attainment of less than high school are least likely to be married with 100.0% of them unmarried at childbirth.
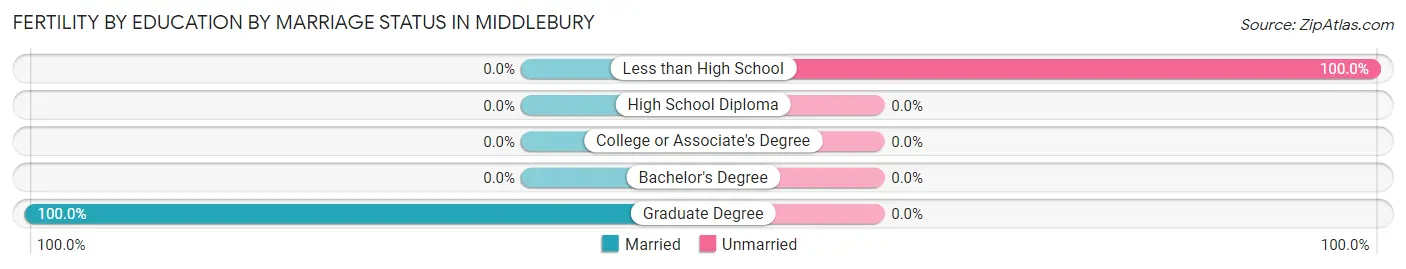
| Educational Attainment | Married | Unmarried |
| Less than High School | 0 (0.0%) | 15 (100.0%) |
| High School Diploma | 0 (0.0%) | 0 (0.0%) |
| College or Associate's Degree | 0 (0.0%) | 0 (0.0%) |
| Bachelor's Degree | 0 (0.0%) | 0 (0.0%) |
| Graduate Degree | 15 (100.0%) | 0 (0.0%) |
| Total | 15 (50.0%) | 15 (50.0%) |
Employment Characteristics in Middlebury
Employment by Class of Employer in Middlebury
Among the 1,932 employed individuals in Middlebury, private company employees (1,438 | 74.4%), local government employees (151 | 7.8%), and not-for-profit organizations (150 | 7.8%) make up the most common classes of employment.
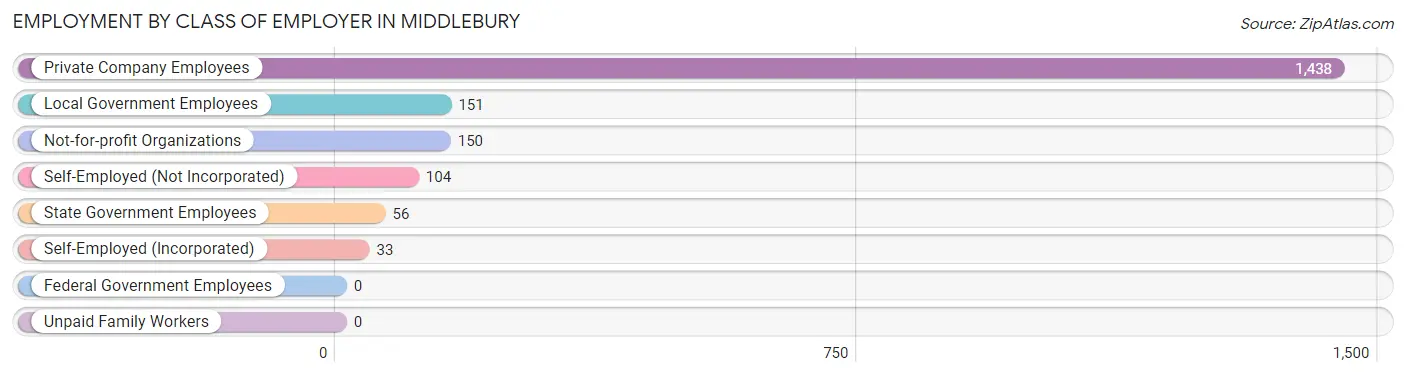
| Employer Class | # Employees | % Employees |
| Private Company Employees | 1,438 | 74.4% |
| Self-Employed (Incorporated) | 33 | 1.7% |
| Self-Employed (Not Incorporated) | 104 | 5.4% |
| Not-for-profit Organizations | 150 | 7.8% |
| Local Government Employees | 151 | 7.8% |
| State Government Employees | 56 | 2.9% |
| Federal Government Employees | 0 | 0.0% |
| Unpaid Family Workers | 0 | 0.0% |
| Total | 1,932 | 100.0% |
Employment Status by Age in Middlebury
According to the labor force statistics for Middlebury, out of the total population over 16 years of age (2,921), 70.2% or 2,051 individuals are in the labor force, with 5.8% or 119 of them unemployed. The age group with the highest labor force participation rate is 20 to 24 years, with 100.0% or 65 individuals in the labor force. Within the labor force, the 25 to 29 years age range has the highest percentage of unemployed individuals, with 27.4% or 26 of them being unemployed.
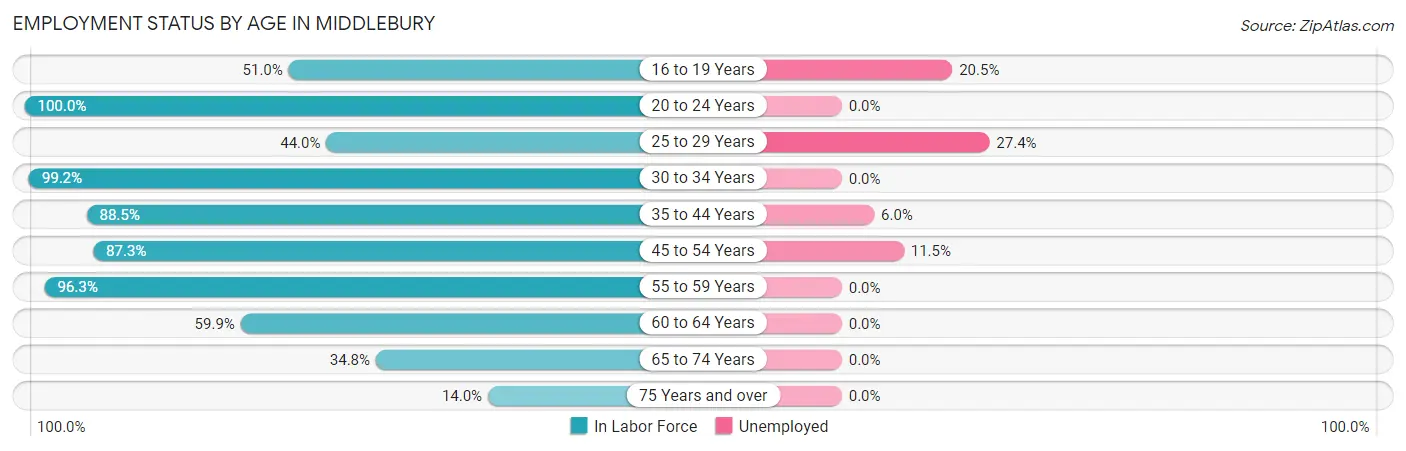
| Age Bracket | In Labor Force | Unemployed |
| 16 to 19 Years | 122 (51.0%) | 25 (20.5%) |
| 20 to 24 Years | 65 (100.0%) | 0 (0.0%) |
| 25 to 29 Years | 95 (44.0%) | 26 (27.4%) |
| 30 to 34 Years | 130 (99.2%) | 0 (0.0%) |
| 35 to 44 Years | 469 (88.5%) | 28 (6.0%) |
| 45 to 54 Years | 356 (87.3%) | 41 (11.5%) |
| 55 to 59 Years | 494 (96.3%) | 0 (0.0%) |
| 60 to 64 Years | 160 (59.9%) | 0 (0.0%) |
| 65 to 74 Years | 140 (34.8%) | 0 (0.0%) |
| 75 Years and over | 21 (14.0%) | 0 (0.0%) |
| Total | 2,051 (70.2%) | 119 (5.8%) |
Employment Status by Educational Attainment in Middlebury
According to labor force statistics for Middlebury, 82.5% of individuals (1,704) out of the total population between 25 and 64 years of age (2,065) are in the labor force, with 5.6% or 95 of them being unemployed. The group with the highest labor force participation rate are those with the educational attainment of less than high school, with 100.0% or 206 individuals in the labor force. Within the labor force, individuals with high school diploma education have the highest percentage of unemployment, with 12.8% or 69 of them being unemployed.
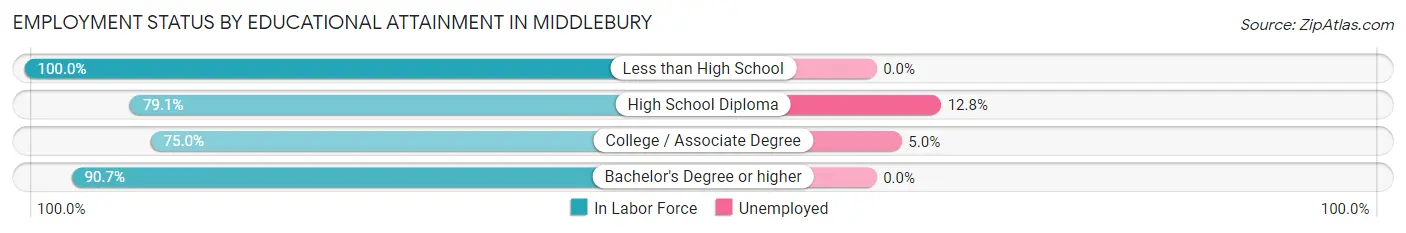
| Educational Attainment | In Labor Force | Unemployed |
| Less than High School | 206 (100.0%) | 0 (0.0%) |
| High School Diploma | 538 (79.1%) | 87 (12.8%) |
| College / Associate Degree | 523 (75.0%) | 35 (5.0%) |
| Bachelor's Degree or higher | 437 (90.7%) | 0 (0.0%) |
| Total | 1,704 (82.5%) | 116 (5.6%) |
Employment Occupations by Sex in Middlebury
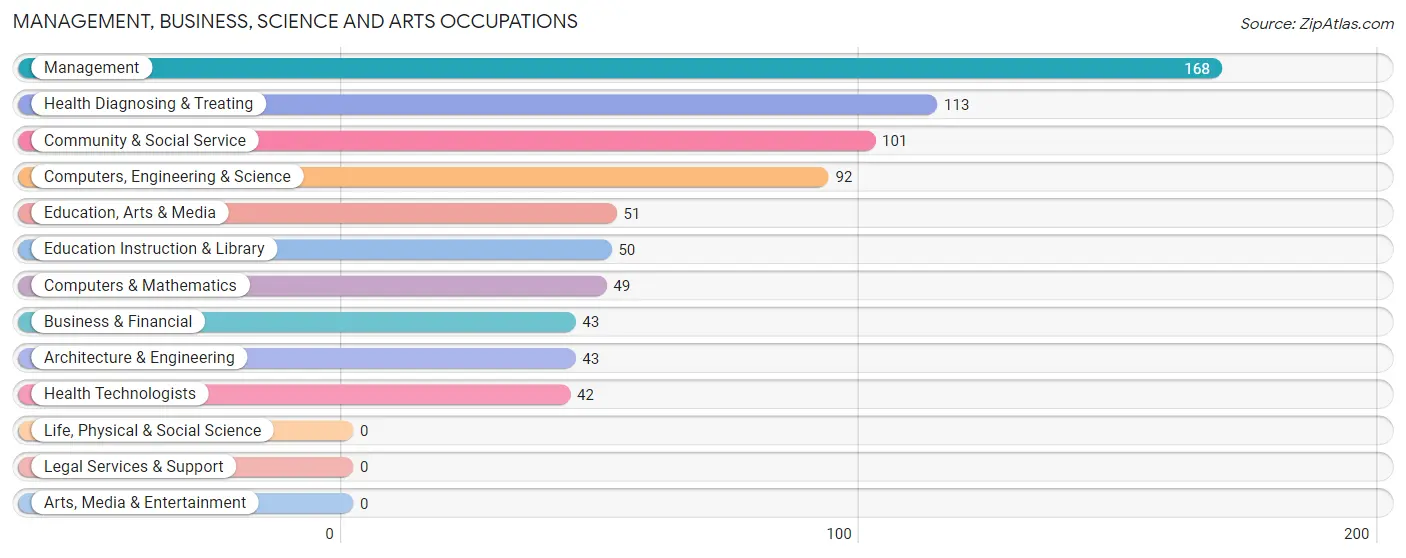
Management, Business, Science and Arts Occupations
The most common Management, Business, Science and Arts occupations in Middlebury are Management (168 | 8.7%), Health Diagnosing & Treating (113 | 5.9%), Community & Social Service (101 | 5.2%), Computers, Engineering & Science (92 | 4.8%), and Education, Arts & Media (51 | 2.6%).
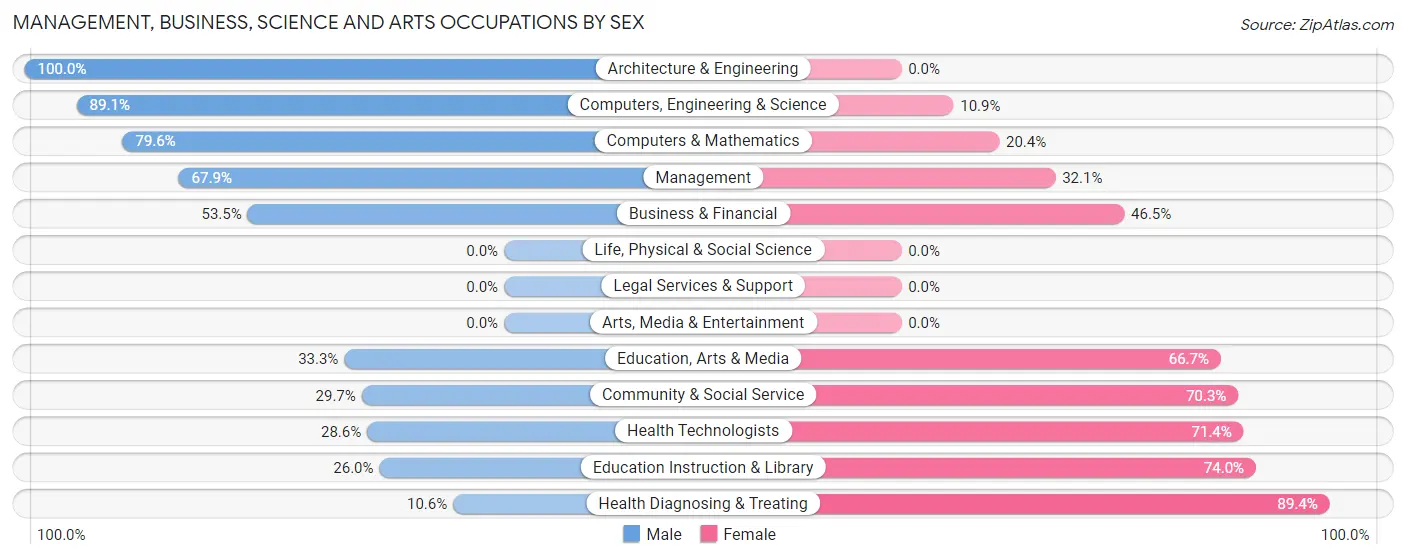
Management, Business, Science and Arts Occupations by Sex
Within the Management, Business, Science and Arts occupations in Middlebury, the most male-oriented occupations are Architecture & Engineering (100.0%), Computers, Engineering & Science (89.1%), and Computers & Mathematics (79.6%), while the most female-oriented occupations are Health Diagnosing & Treating (89.4%), Education Instruction & Library (74.0%), and Health Technologists (71.4%).
| Occupation | Male | Female |
| Management | 114 (67.9%) | 54 (32.1%) |
| Business & Financial | 23 (53.5%) | 20 (46.5%) |
| Computers, Engineering & Science | 82 (89.1%) | 10 (10.9%) |
| Computers & Mathematics | 39 (79.6%) | 10 (20.4%) |
| Architecture & Engineering | 43 (100.0%) | 0 (0.0%) |
| Life, Physical & Social Science | 0 (0.0%) | 0 (0.0%) |
| Community & Social Service | 30 (29.7%) | 71 (70.3%) |
| Education, Arts & Media | 17 (33.3%) | 34 (66.7%) |
| Legal Services & Support | 0 (0.0%) | 0 (0.0%) |
| Education Instruction & Library | 13 (26.0%) | 37 (74.0%) |
| Arts, Media & Entertainment | 0 (0.0%) | 0 (0.0%) |
| Health Diagnosing & Treating | 12 (10.6%) | 101 (89.4%) |
| Health Technologists | 12 (28.6%) | 30 (71.4%) |
| Total (Category) | 261 (50.5%) | 256 (49.5%) |
| Total (Overall) | 1,137 (58.9%) | 795 (41.1%) |
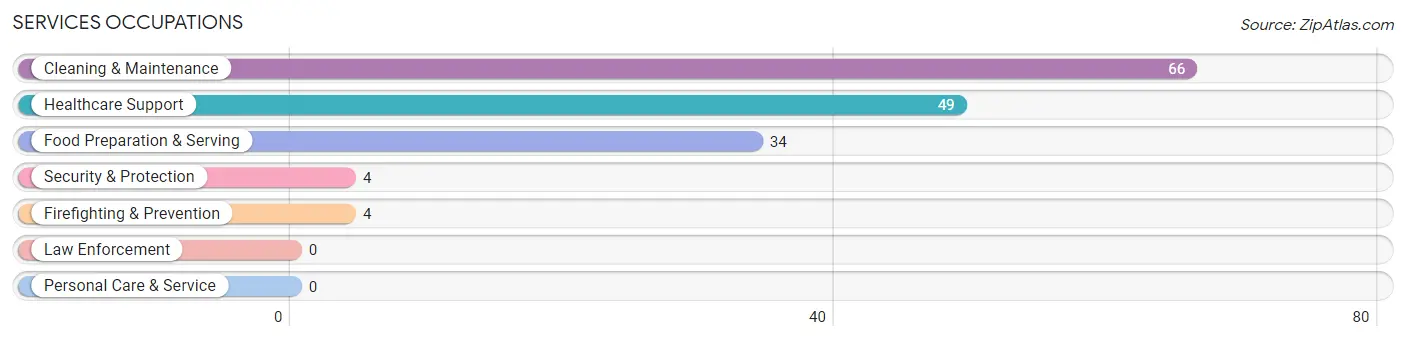
Services Occupations
The most common Services occupations in Middlebury are Cleaning & Maintenance (66 | 3.4%), Healthcare Support (49 | 2.5%), Food Preparation & Serving (34 | 1.8%), Security & Protection (4 | 0.2%), and Firefighting & Prevention (4 | 0.2%).
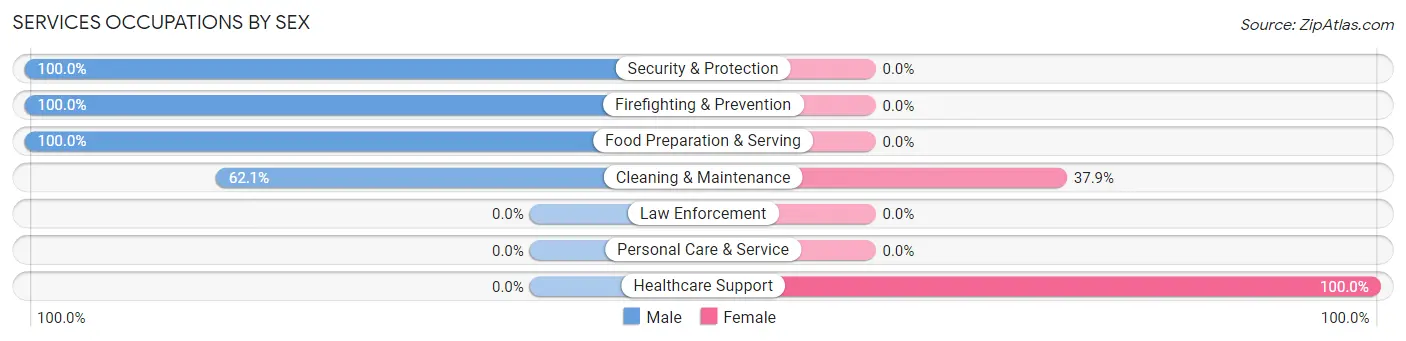
Services Occupations by Sex
Within the Services occupations in Middlebury, the most male-oriented occupations are Security & Protection (100.0%), Firefighting & Prevention (100.0%), and Food Preparation & Serving (100.0%), while the most female-oriented occupations are Healthcare Support (100.0%), and Cleaning & Maintenance (37.9%).
| Occupation | Male | Female |
| Healthcare Support | 0 (0.0%) | 49 (100.0%) |
| Security & Protection | 4 (100.0%) | 0 (0.0%) |
| Firefighting & Prevention | 4 (100.0%) | 0 (0.0%) |
| Law Enforcement | 0 (0.0%) | 0 (0.0%) |
| Food Preparation & Serving | 34 (100.0%) | 0 (0.0%) |
| Cleaning & Maintenance | 41 (62.1%) | 25 (37.9%) |
| Personal Care & Service | 0 (0.0%) | 0 (0.0%) |
| Total (Category) | 79 (51.6%) | 74 (48.4%) |
| Total (Overall) | 1,137 (58.9%) | 795 (41.1%) |
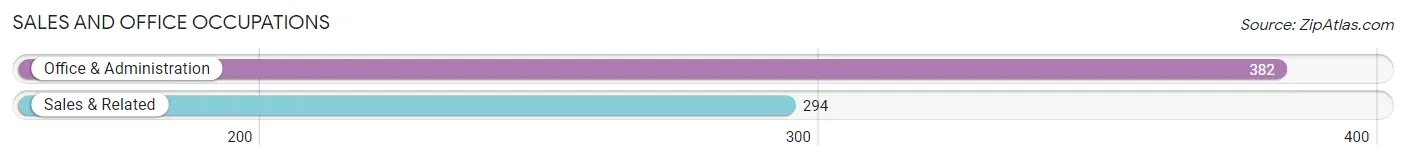
Sales and Office Occupations
The most common Sales and Office occupations in Middlebury are Office & Administration (382 | 19.8%), and Sales & Related (294 | 15.2%).
Sales and Office Occupations by Sex
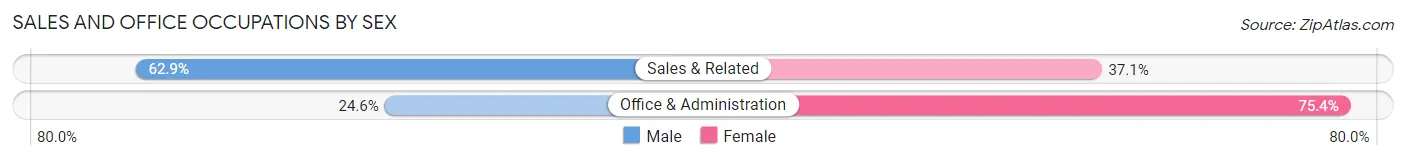
| Occupation | Male | Female |
| Sales & Related | 185 (62.9%) | 109 (37.1%) |
| Office & Administration | 94 (24.6%) | 288 (75.4%) |
| Total (Category) | 279 (41.3%) | 397 (58.7%) |
| Total (Overall) | 1,137 (58.9%) | 795 (41.1%) |
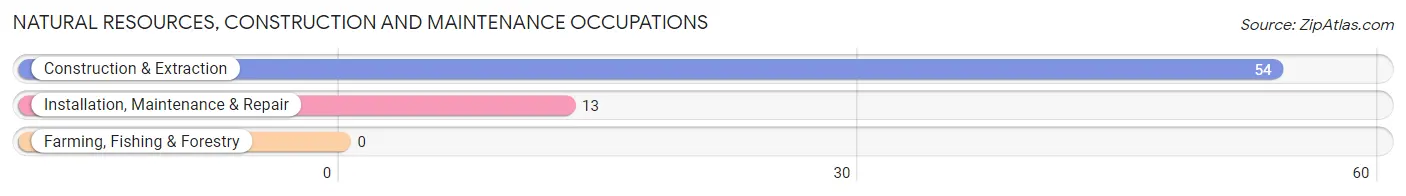
Natural Resources, Construction and Maintenance Occupations
The most common Natural Resources, Construction and Maintenance occupations in Middlebury are Construction & Extraction (54 | 2.8%), and Installation, Maintenance & Repair (13 | 0.7%).
Natural Resources, Construction and Maintenance Occupations by Sex
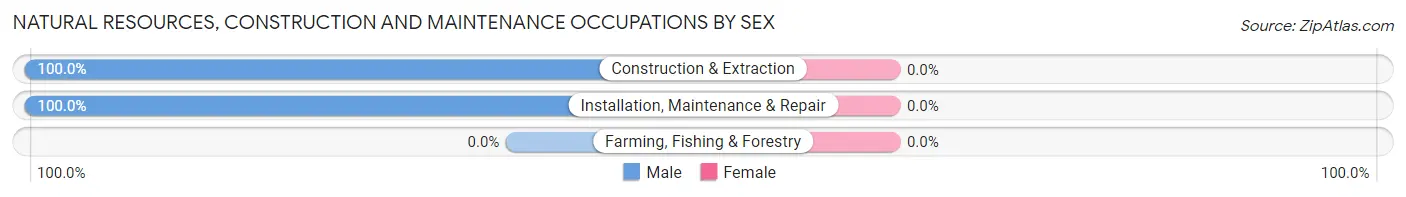
| Occupation | Male | Female |
| Farming, Fishing & Forestry | 0 (0.0%) | 0 (0.0%) |
| Construction & Extraction | 54 (100.0%) | 0 (0.0%) |
| Installation, Maintenance & Repair | 13 (100.0%) | 0 (0.0%) |
| Total (Category) | 67 (100.0%) | 0 (0.0%) |
| Total (Overall) | 1,137 (58.9%) | 795 (41.1%) |
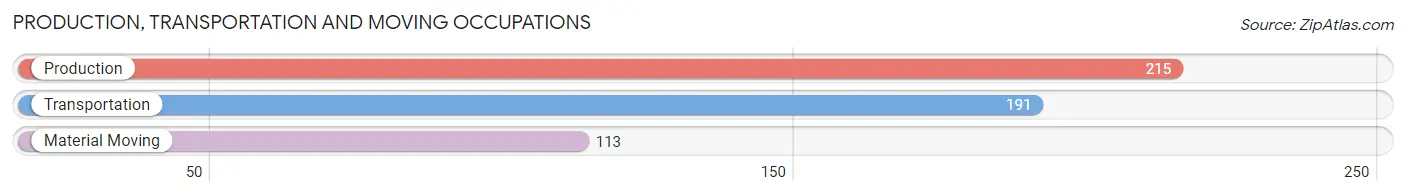
Production, Transportation and Moving Occupations
The most common Production, Transportation and Moving occupations in Middlebury are Production (215 | 11.1%), Transportation (191 | 9.9%), and Material Moving (113 | 5.9%).
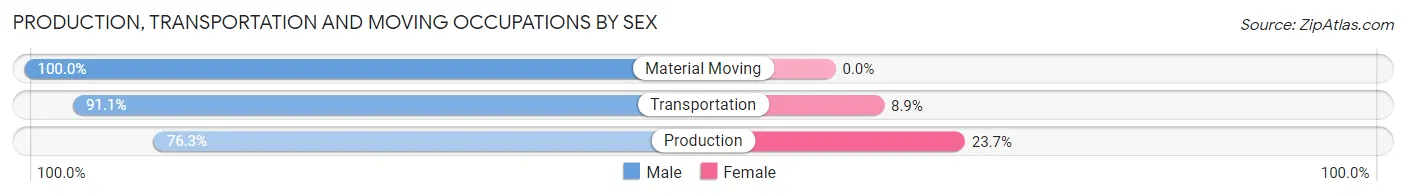
Production, Transportation and Moving Occupations by Sex
| Occupation | Male | Female |
| Production | 164 (76.3%) | 51 (23.7%) |
| Transportation | 174 (91.1%) | 17 (8.9%) |
| Material Moving | 113 (100.0%) | 0 (0.0%) |
| Total (Category) | 451 (86.9%) | 68 (13.1%) |
| Total (Overall) | 1,137 (58.9%) | 795 (41.1%) |
Employment Industries by Sex in Middlebury
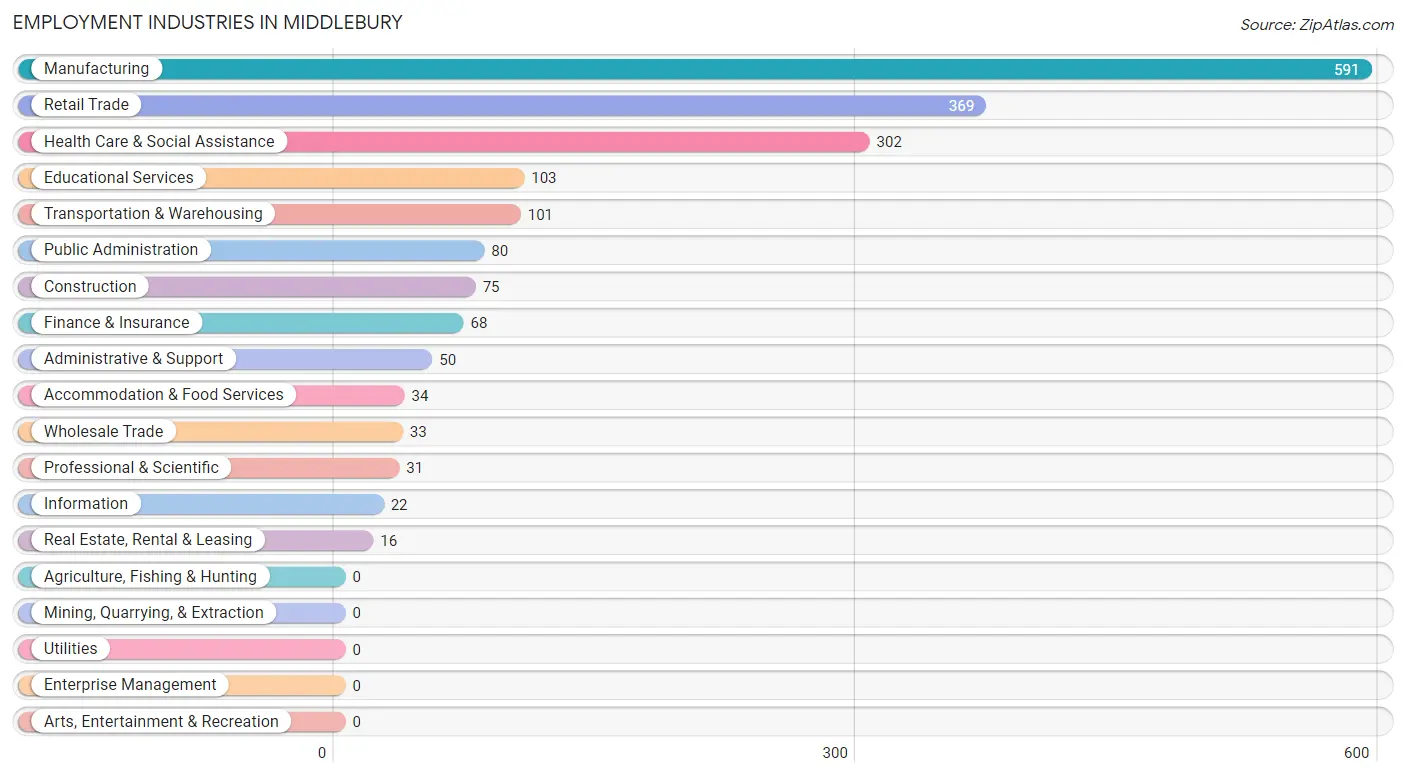
Employment Industries in Middlebury
The major employment industries in Middlebury include Manufacturing (591 | 30.6%), Retail Trade (369 | 19.1%), Health Care & Social Assistance (302 | 15.6%), Educational Services (103 | 5.3%), and Transportation & Warehousing (101 | 5.2%).
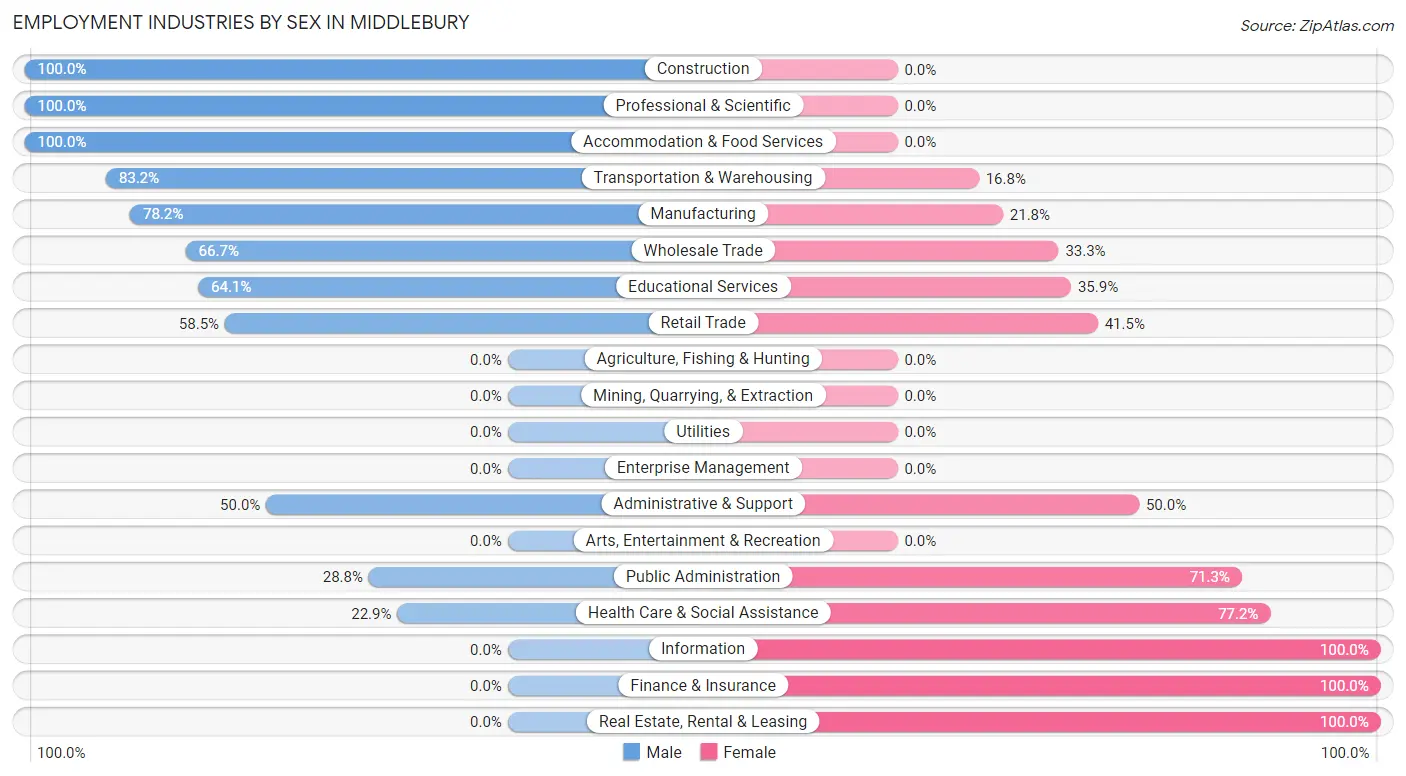
Employment Industries by Sex in Middlebury
The Middlebury industries that see more men than women are Construction (100.0%), Professional & Scientific (100.0%), and Accommodation & Food Services (100.0%), whereas the industries that tend to have a higher number of women are Information (100.0%), Finance & Insurance (100.0%), and Real Estate, Rental & Leasing (100.0%).
| Industry | Male | Female |
| Agriculture, Fishing & Hunting | 0 (0.0%) | 0 (0.0%) |
| Mining, Quarrying, & Extraction | 0 (0.0%) | 0 (0.0%) |
| Construction | 75 (100.0%) | 0 (0.0%) |
| Manufacturing | 462 (78.2%) | 129 (21.8%) |
| Wholesale Trade | 22 (66.7%) | 11 (33.3%) |
| Retail Trade | 216 (58.5%) | 153 (41.5%) |
| Transportation & Warehousing | 84 (83.2%) | 17 (16.8%) |
| Utilities | 0 (0.0%) | 0 (0.0%) |
| Information | 0 (0.0%) | 22 (100.0%) |
| Finance & Insurance | 0 (0.0%) | 68 (100.0%) |
| Real Estate, Rental & Leasing | 0 (0.0%) | 16 (100.0%) |
| Professional & Scientific | 31 (100.0%) | 0 (0.0%) |
| Enterprise Management | 0 (0.0%) | 0 (0.0%) |
| Administrative & Support | 25 (50.0%) | 25 (50.0%) |
| Educational Services | 66 (64.1%) | 37 (35.9%) |
| Health Care & Social Assistance | 69 (22.9%) | 233 (77.1%) |
| Arts, Entertainment & Recreation | 0 (0.0%) | 0 (0.0%) |
| Accommodation & Food Services | 34 (100.0%) | 0 (0.0%) |
| Public Administration | 23 (28.7%) | 57 (71.3%) |
| Total | 1,137 (58.9%) | 795 (41.1%) |
Education in Middlebury
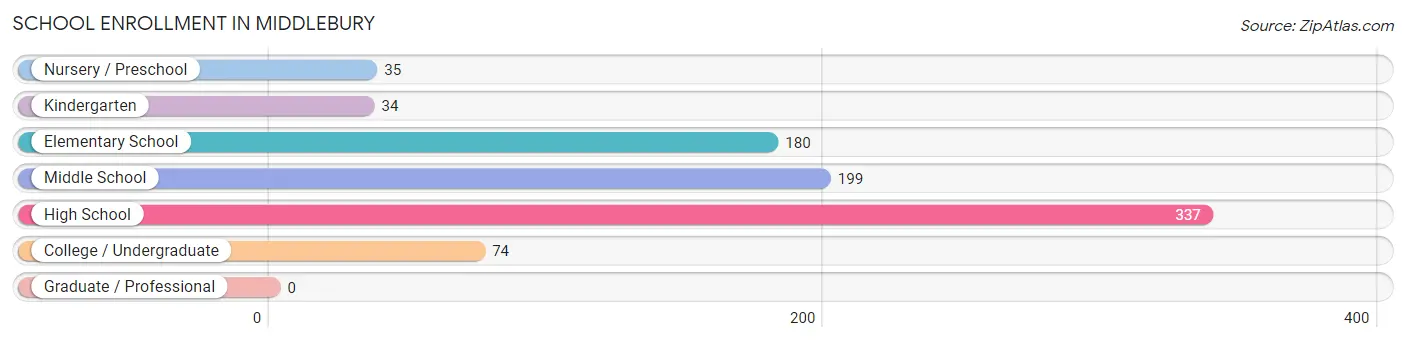
School Enrollment in Middlebury
The most common levels of schooling among the 859 students in Middlebury are high school (337 | 39.2%), middle school (199 | 23.2%), and elementary school (180 | 20.9%).
| School Level | # Students | % Students |
| Nursery / Preschool | 35 | 4.1% |
| Kindergarten | 34 | 4.0% |
| Elementary School | 180 | 20.9% |
| Middle School | 199 | 23.2% |
| High School | 337 | 39.2% |
| College / Undergraduate | 74 | 8.6% |
| Graduate / Professional | 0 | 0.0% |
| Total | 859 | 100.0% |
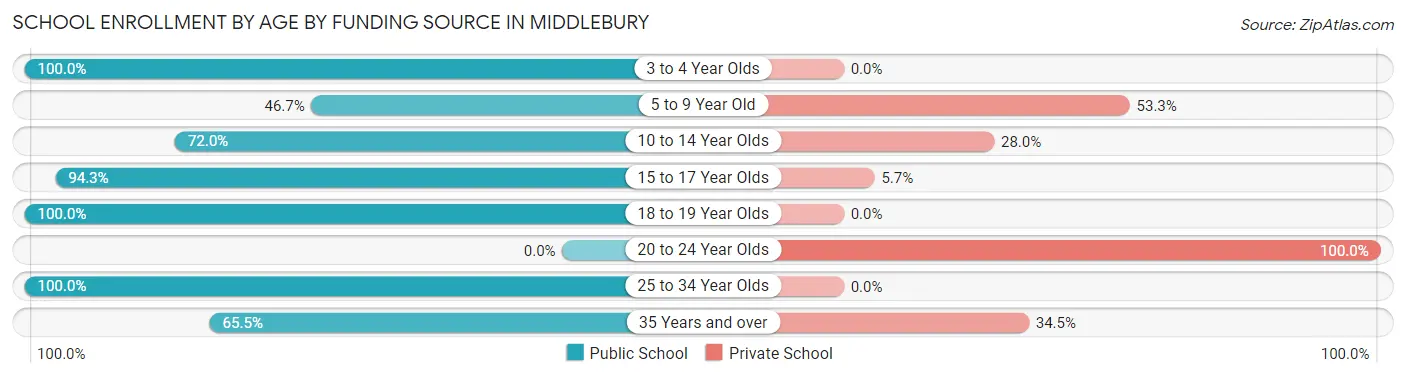
School Enrollment by Age by Funding Source in Middlebury
Out of a total of 859 students who are enrolled in schools in Middlebury, 221 (25.7%) attend a private institution, while the remaining 638 (74.3%) are enrolled in public schools. The age group of 20 to 24 year olds has the highest likelihood of being enrolled in private schools, with 18 (100.0% in the age bracket) enrolled. Conversely, the age group of 3 to 4 year olds has the lowest likelihood of being enrolled in a private school, with 22 (100.0% in the age bracket) attending a public institution.
| Age Bracket | Public School | Private School |
| 3 to 4 Year Olds | 22 (100.0%) | 0 (0.0%) |
| 5 to 9 Year Old | 86 (46.7%) | 98 (53.3%) |
| 10 to 14 Year Olds | 203 (72.0%) | 79 (28.0%) |
| 15 to 17 Year Olds | 263 (94.3%) | 16 (5.7%) |
| 18 to 19 Year Olds | 41 (100.0%) | 0 (0.0%) |
| 20 to 24 Year Olds | 0 (0.0%) | 18 (100.0%) |
| 25 to 34 Year Olds | 4 (100.0%) | 0 (0.0%) |
| 35 Years and over | 19 (65.5%) | 10 (34.5%) |
| Total | 638 (74.3%) | 221 (25.7%) |
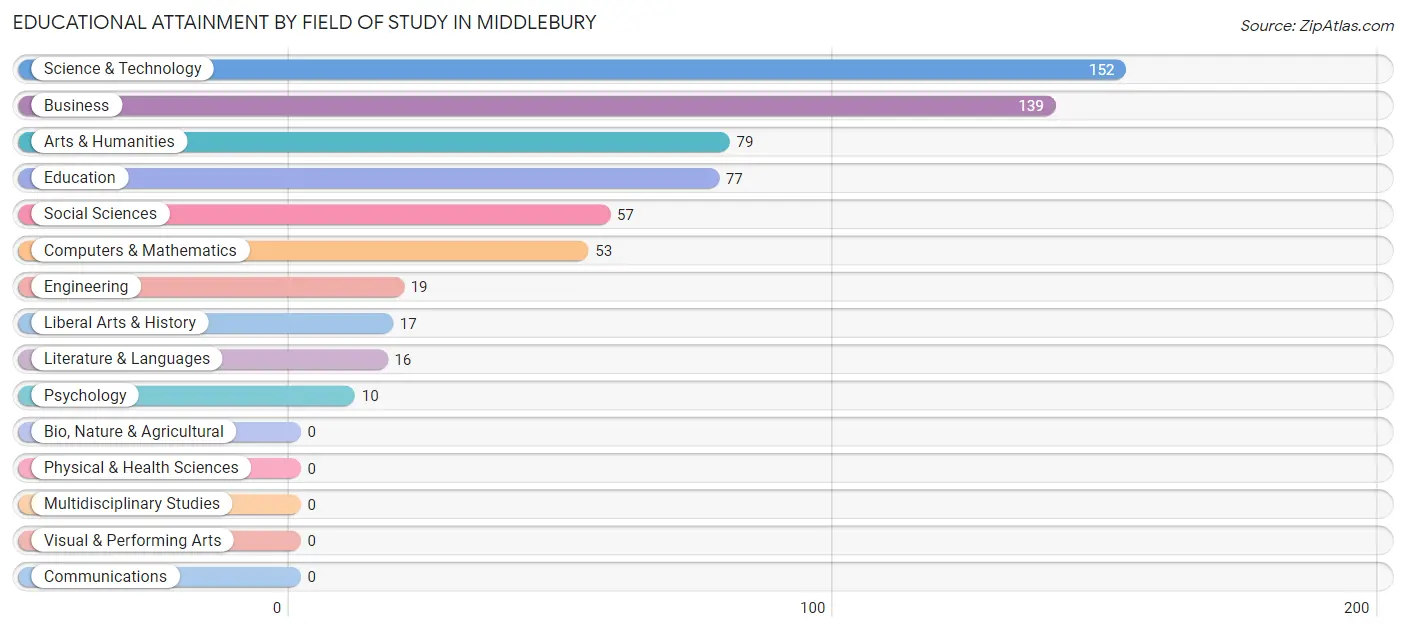
Educational Attainment by Field of Study in Middlebury
Science & technology (152 | 24.6%), business (139 | 22.5%), arts & humanities (79 | 12.8%), education (77 | 12.4%), and social sciences (57 | 9.2%) are the most common fields of study among 619 individuals in Middlebury who have obtained a bachelor's degree or higher.
| Field of Study | # Graduates | % Graduates |
| Computers & Mathematics | 53 | 8.6% |
| Bio, Nature & Agricultural | 0 | 0.0% |
| Physical & Health Sciences | 0 | 0.0% |
| Psychology | 10 | 1.6% |
| Social Sciences | 57 | 9.2% |
| Engineering | 19 | 3.1% |
| Multidisciplinary Studies | 0 | 0.0% |
| Science & Technology | 152 | 24.6% |
| Business | 139 | 22.5% |
| Education | 77 | 12.4% |
| Literature & Languages | 16 | 2.6% |
| Liberal Arts & History | 17 | 2.8% |
| Visual & Performing Arts | 0 | 0.0% |
| Communications | 0 | 0.0% |
| Arts & Humanities | 79 | 12.8% |
| Total | 619 | 100.0% |
Transportation & Commute in Middlebury
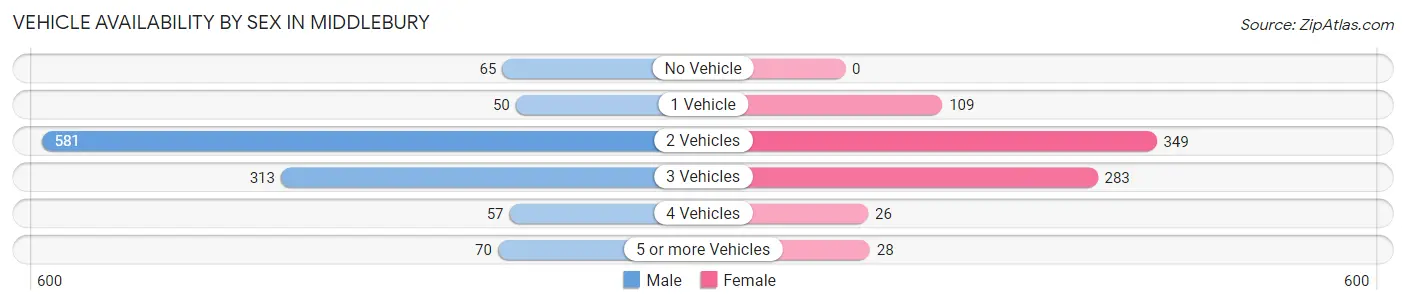
Vehicle Availability by Sex in Middlebury
The most prevalent vehicle ownership categories in Middlebury are males with 2 vehicles (581, accounting for 51.1%) and females with 2 vehicles (349, making up 73.1%).
| Vehicles Available | Male | Female |
| No Vehicle | 65 (5.7%) | 0 (0.0%) |
| 1 Vehicle | 50 (4.4%) | 109 (13.7%) |
| 2 Vehicles | 581 (51.1%) | 349 (43.9%) |
| 3 Vehicles | 313 (27.6%) | 283 (35.6%) |
| 4 Vehicles | 57 (5.0%) | 26 (3.3%) |
| 5 or more Vehicles | 70 (6.2%) | 28 (3.5%) |
| Total | 1,136 (100.0%) | 795 (100.0%) |
Commute Time in Middlebury
The most frequently occuring commute durations in Middlebury are 5 to 9 minutes (477 commuters, 26.1%), 20 to 24 minutes (386 commuters, 21.1%), and 15 to 19 minutes (203 commuters, 11.1%).
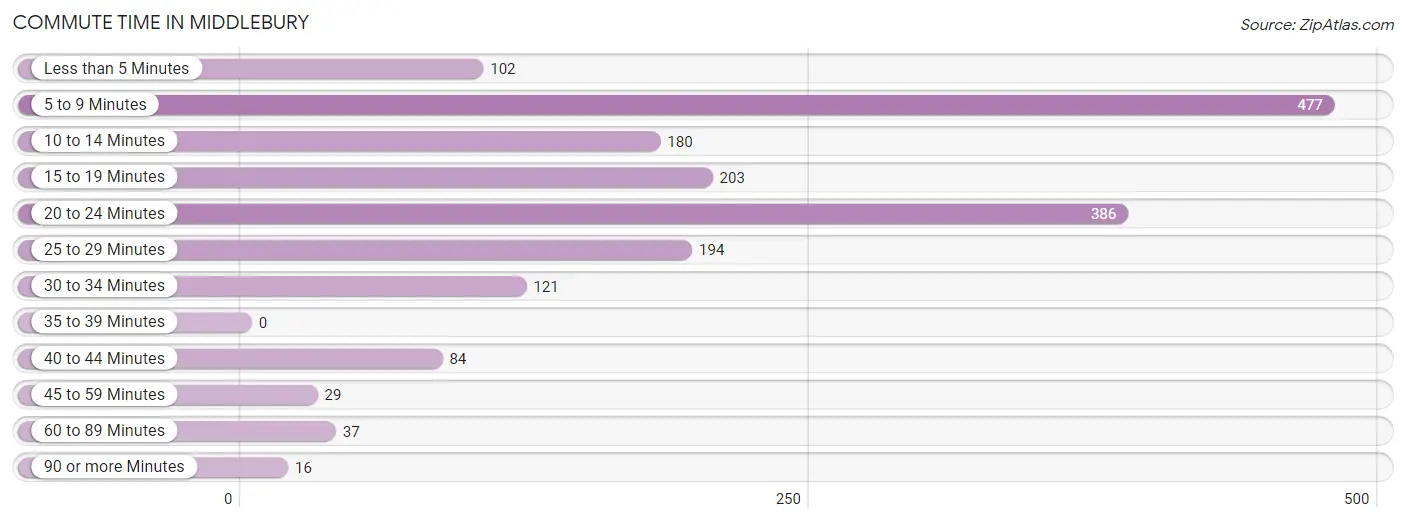
| Commute Time | # Commuters | % Commuters |
| Less than 5 Minutes | 102 | 5.6% |
| 5 to 9 Minutes | 477 | 26.1% |
| 10 to 14 Minutes | 180 | 9.8% |
| 15 to 19 Minutes | 203 | 11.1% |
| 20 to 24 Minutes | 386 | 21.1% |
| 25 to 29 Minutes | 194 | 10.6% |
| 30 to 34 Minutes | 121 | 6.6% |
| 35 to 39 Minutes | 0 | 0.0% |
| 40 to 44 Minutes | 84 | 4.6% |
| 45 to 59 Minutes | 29 | 1.6% |
| 60 to 89 Minutes | 37 | 2.0% |
| 90 or more Minutes | 16 | 0.9% |
Commute Time by Sex in Middlebury
The most common commute times in Middlebury are 5 to 9 minutes (336 commuters, 31.8%) for males and 20 to 24 minutes (246 commuters, 31.9%) for females.
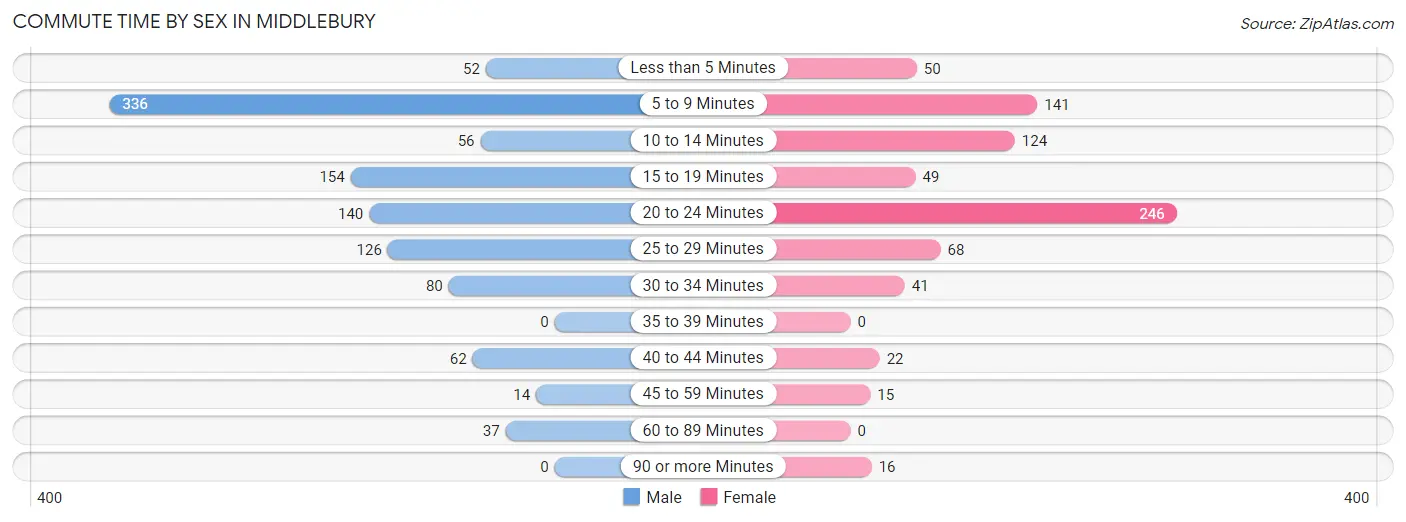
| Commute Time | Male | Female |
| Less than 5 Minutes | 52 (4.9%) | 50 (6.5%) |
| 5 to 9 Minutes | 336 (31.8%) | 141 (18.3%) |
| 10 to 14 Minutes | 56 (5.3%) | 124 (16.1%) |
| 15 to 19 Minutes | 154 (14.6%) | 49 (6.4%) |
| 20 to 24 Minutes | 140 (13.3%) | 246 (31.9%) |
| 25 to 29 Minutes | 126 (11.9%) | 68 (8.8%) |
| 30 to 34 Minutes | 80 (7.6%) | 41 (5.3%) |
| 35 to 39 Minutes | 0 (0.0%) | 0 (0.0%) |
| 40 to 44 Minutes | 62 (5.9%) | 22 (2.9%) |
| 45 to 59 Minutes | 14 (1.3%) | 15 (1.9%) |
| 60 to 89 Minutes | 37 (3.5%) | 0 (0.0%) |
| 90 or more Minutes | 0 (0.0%) | 16 (2.1%) |
Time of Departure to Work by Sex in Middlebury
The most frequent times of departure to work in Middlebury are 12:00 AM to 4:59 AM (180, 17.0%) for males and 7:30 AM to 7:59 AM (138, 17.9%) for females.
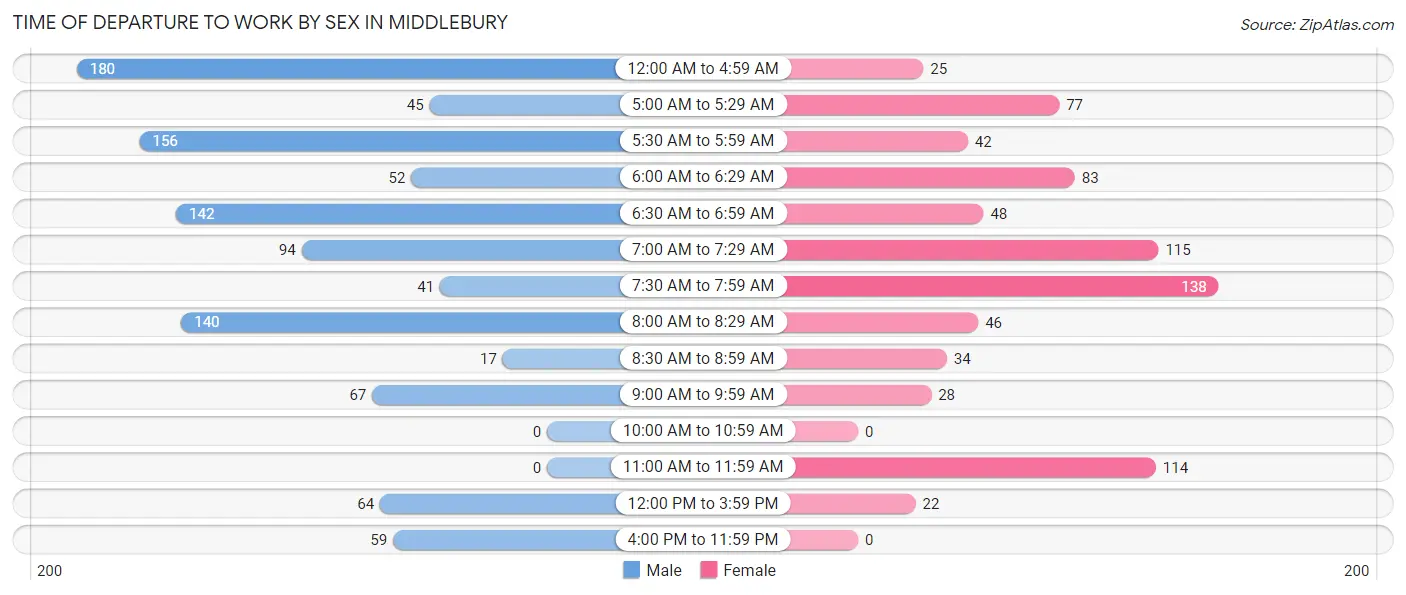
| Time of Departure | Male | Female |
| 12:00 AM to 4:59 AM | 180 (17.0%) | 25 (3.2%) |
| 5:00 AM to 5:29 AM | 45 (4.3%) | 77 (10.0%) |
| 5:30 AM to 5:59 AM | 156 (14.8%) | 42 (5.4%) |
| 6:00 AM to 6:29 AM | 52 (4.9%) | 83 (10.7%) |
| 6:30 AM to 6:59 AM | 142 (13.4%) | 48 (6.2%) |
| 7:00 AM to 7:29 AM | 94 (8.9%) | 115 (14.9%) |
| 7:30 AM to 7:59 AM | 41 (3.9%) | 138 (17.9%) |
| 8:00 AM to 8:29 AM | 140 (13.3%) | 46 (6.0%) |
| 8:30 AM to 8:59 AM | 17 (1.6%) | 34 (4.4%) |
| 9:00 AM to 9:59 AM | 67 (6.3%) | 28 (3.6%) |
| 10:00 AM to 10:59 AM | 0 (0.0%) | 0 (0.0%) |
| 11:00 AM to 11:59 AM | 0 (0.0%) | 114 (14.8%) |
| 12:00 PM to 3:59 PM | 64 (6.0%) | 22 (2.9%) |
| 4:00 PM to 11:59 PM | 59 (5.6%) | 0 (0.0%) |
| Total | 1,057 (100.0%) | 772 (100.0%) |
Housing Occupancy in Middlebury
Occupancy by Ownership in Middlebury
Of the total 65 dwellings in Middlebury, owner-occupied units account for 53 (81.5%), while renter-occupied units make up 12 (18.5%).
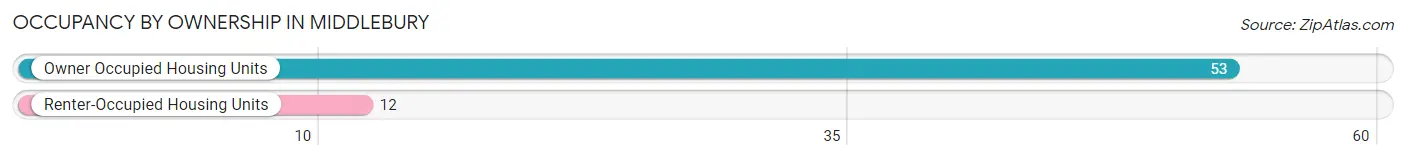
| Occupancy | # Housing Units | % Housing Units |
| Owner Occupied Housing Units | 53 | 81.5% |
| Renter-Occupied Housing Units | 12 | 18.5% |
| Total Occupied Housing Units | 65 | 100.0% |
Occupancy by Household Size in Middlebury
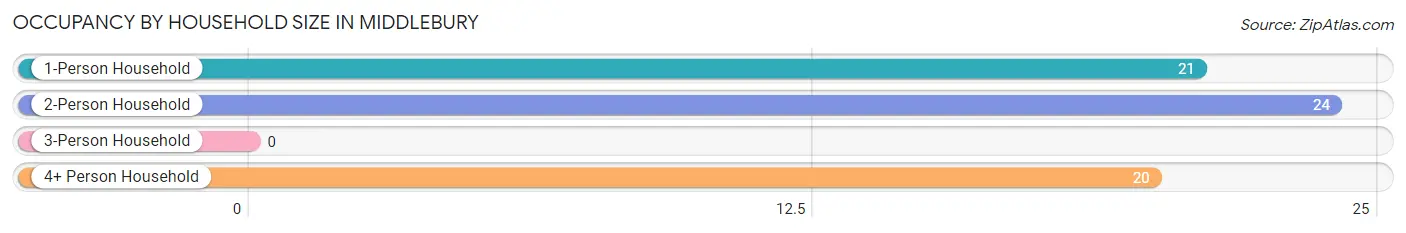
| Household Size | # Housing Units | % Housing Units |
| 1-Person Household | 21 | 32.3% |
| 2-Person Household | 24 | 36.9% |
| 3-Person Household | 0 | 0.0% |
| 4+ Person Household | 20 | 30.8% |
| Total Housing Units | 65 | 100.0% |
Occupancy by Ownership by Household Size in Middlebury
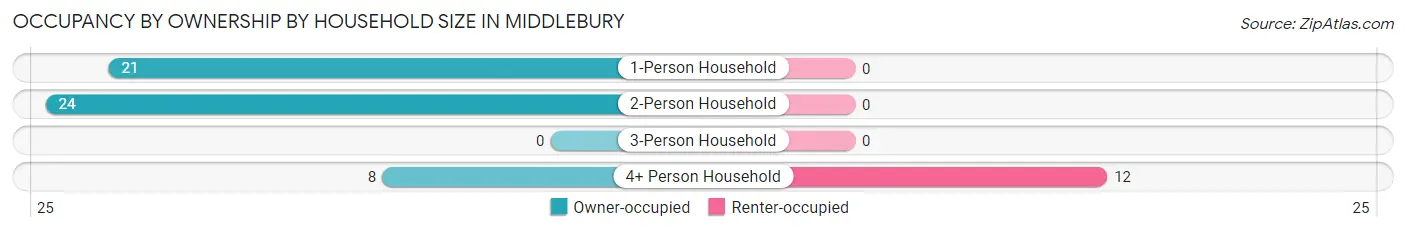
| Household Size | Owner-occupied | Renter-occupied |
| 1-Person Household | 21 (100.0%) | 0 (0.0%) |
| 2-Person Household | 24 (100.0%) | 0 (0.0%) |
| 3-Person Household | 0 (0.0%) | 0 (0.0%) |
| 4+ Person Household | 8 (40.0%) | 12 (60.0%) |
| Total Housing Units | 53 (81.5%) | 12 (18.5%) |
Occupancy by Educational Attainment in Middlebury
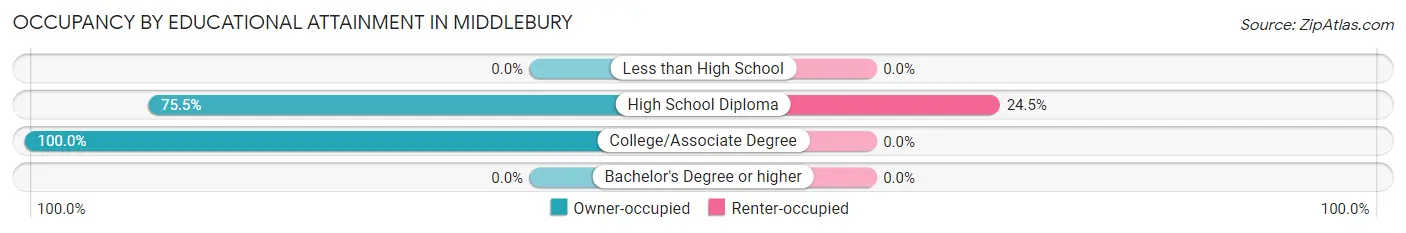
| Household Size | Owner-occupied | Renter-occupied |
| Less than High School | 0 (0.0%) | 0 (0.0%) |
| High School Diploma | 37 (75.5%) | 12 (24.5%) |
| College/Associate Degree | 16 (100.0%) | 0 (0.0%) |
| Bachelor's Degree or higher | 0 (0.0%) | 0 (0.0%) |
Occupancy by Age of Householder in Middlebury
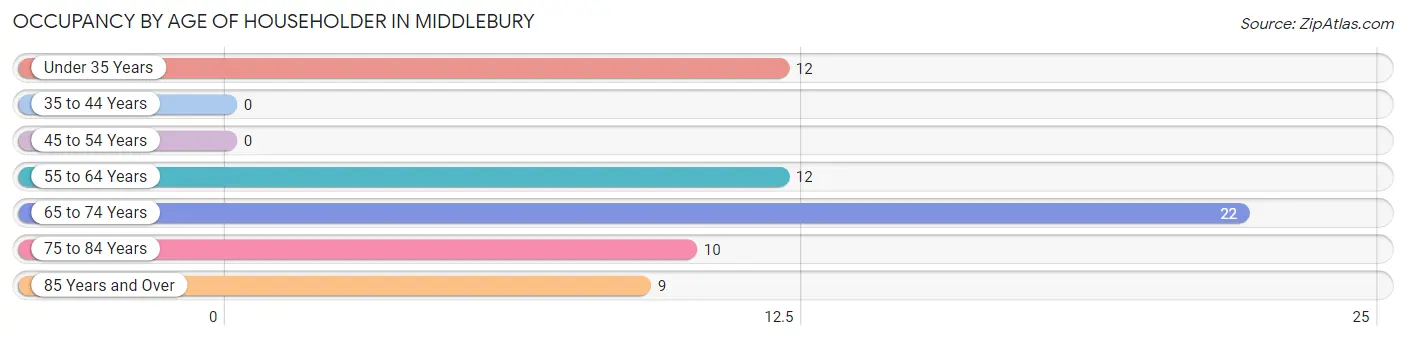
| Age Bracket | # Households | % Households |
| Under 35 Years | 12 | 18.5% |
| 35 to 44 Years | 0 | 0.0% |
| 45 to 54 Years | 0 | 0.0% |
| 55 to 64 Years | 12 | 18.5% |
| 65 to 74 Years | 22 | 33.9% |
| 75 to 84 Years | 10 | 15.4% |
| 85 Years and Over | 9 | 13.9% |
| Total | 65 | 100.0% |
Housing Finances in Middlebury
Median Income by Occupancy in Middlebury
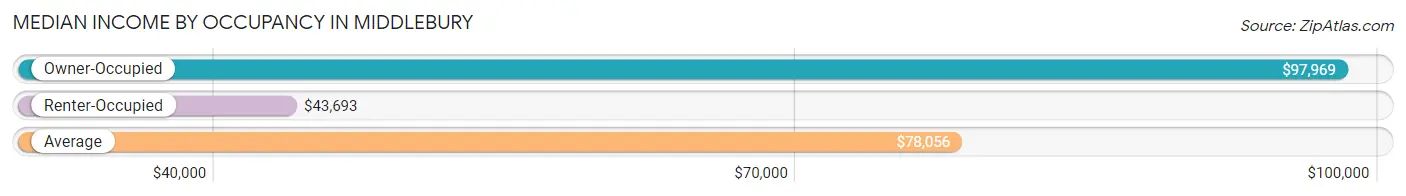
| Occupancy Type | # Households | Median Income |
| Owner-Occupied | 1,080 (79.9%) | $97,969 |
| Renter-Occupied | 272 (20.1%) | $43,693 |
| Average | 1,352 (100.0%) | $78,056 |
Occupancy by Householder Income Bracket in Middlebury
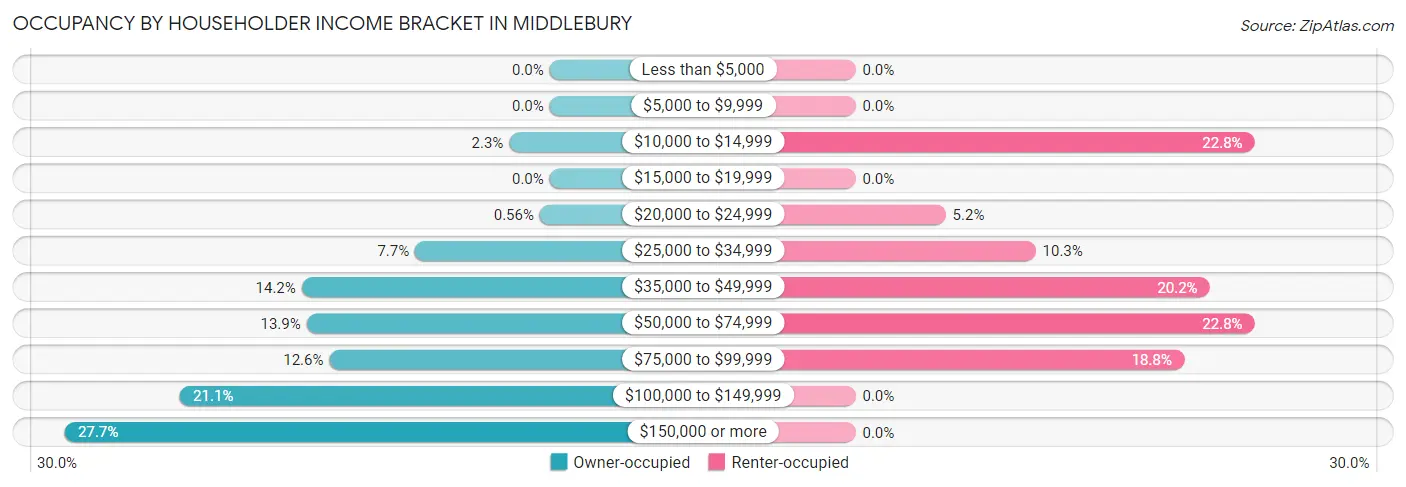
| Income Bracket | Owner-occupied | Renter-occupied |
| Less than $5,000 | 0 (0.0%) | 0 (0.0%) |
| $5,000 to $9,999 | 0 (0.0%) | 0 (0.0%) |
| $10,000 to $14,999 | 25 (2.3%) | 62 (22.8%) |
| $15,000 to $19,999 | 0 (0.0%) | 0 (0.0%) |
| $20,000 to $24,999 | 6 (0.6%) | 14 (5.1%) |
| $25,000 to $34,999 | 83 (7.7%) | 28 (10.3%) |
| $35,000 to $49,999 | 153 (14.2%) | 55 (20.2%) |
| $50,000 to $74,999 | 150 (13.9%) | 62 (22.8%) |
| $75,000 to $99,999 | 136 (12.6%) | 51 (18.8%) |
| $100,000 to $149,999 | 228 (21.1%) | 0 (0.0%) |
| $150,000 or more | 299 (27.7%) | 0 (0.0%) |
| Total | 1,080 (100.0%) | 272 (100.0%) |
Monthly Housing Cost Tiers in Middlebury
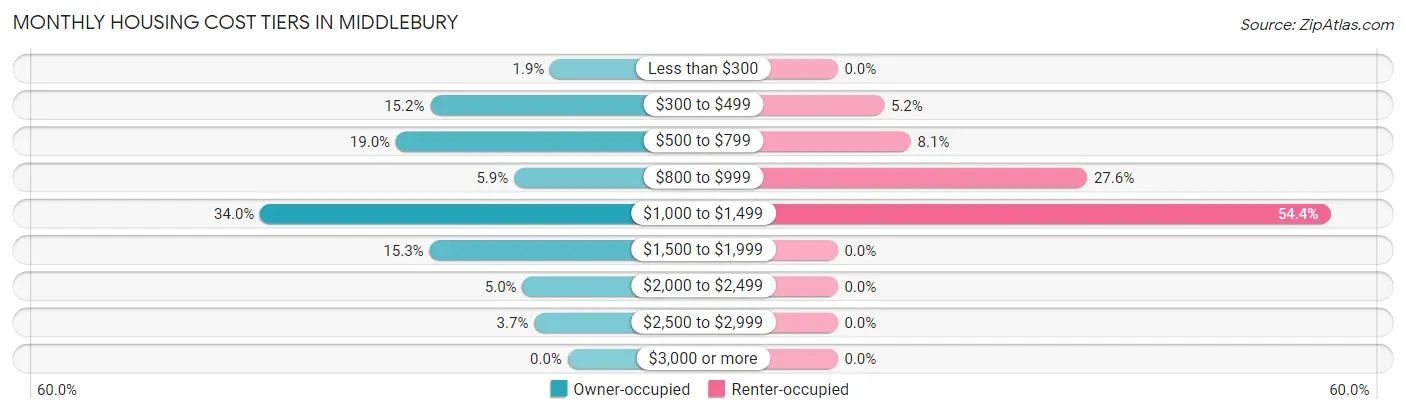
| Monthly Cost | Owner-occupied | Renter-occupied |
| Less than $300 | 21 (1.9%) | 0 (0.0%) |
| $300 to $499 | 164 (15.2%) | 14 (5.1%) |
| $500 to $799 | 205 (19.0%) | 22 (8.1%) |
| $800 to $999 | 64 (5.9%) | 75 (27.6%) |
| $1,000 to $1,499 | 367 (34.0%) | 148 (54.4%) |
| $1,500 to $1,999 | 165 (15.3%) | 0 (0.0%) |
| $2,000 to $2,499 | 54 (5.0%) | 0 (0.0%) |
| $2,500 to $2,999 | 40 (3.7%) | 0 (0.0%) |
| $3,000 or more | 0 (0.0%) | 0 (0.0%) |
| Total | 1,080 (100.0%) | 272 (100.0%) |
Physical Housing Characteristics in Middlebury
Housing Structures in Middlebury
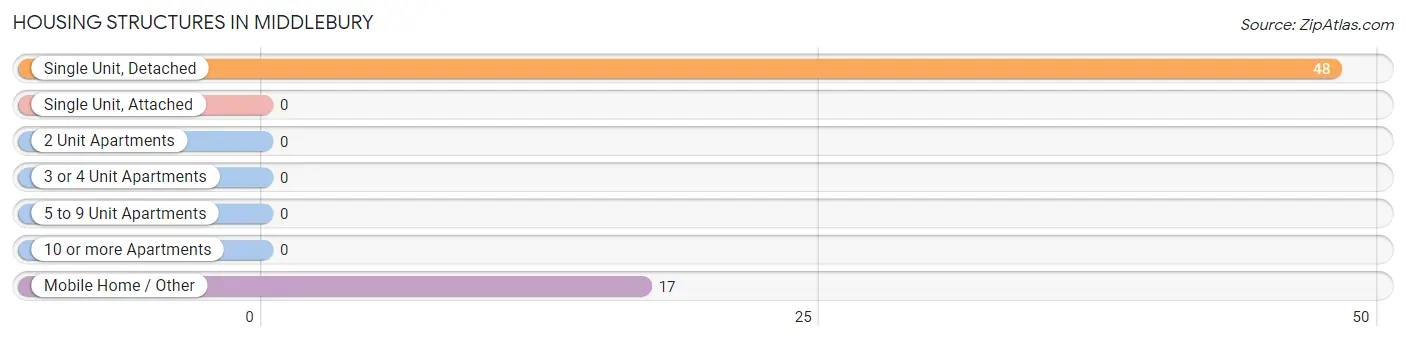
| Structure Type | # Housing Units | % Housing Units |
| Single Unit, Detached | 48 | 73.9% |
| Single Unit, Attached | 0 | 0.0% |
| 2 Unit Apartments | 0 | 0.0% |
| 3 or 4 Unit Apartments | 0 | 0.0% |
| 5 to 9 Unit Apartments | 0 | 0.0% |
| 10 or more Apartments | 0 | 0.0% |
| Mobile Home / Other | 17 | 26.2% |
| Total | 65 | 100.0% |
Housing Structures by Occupancy in Middlebury
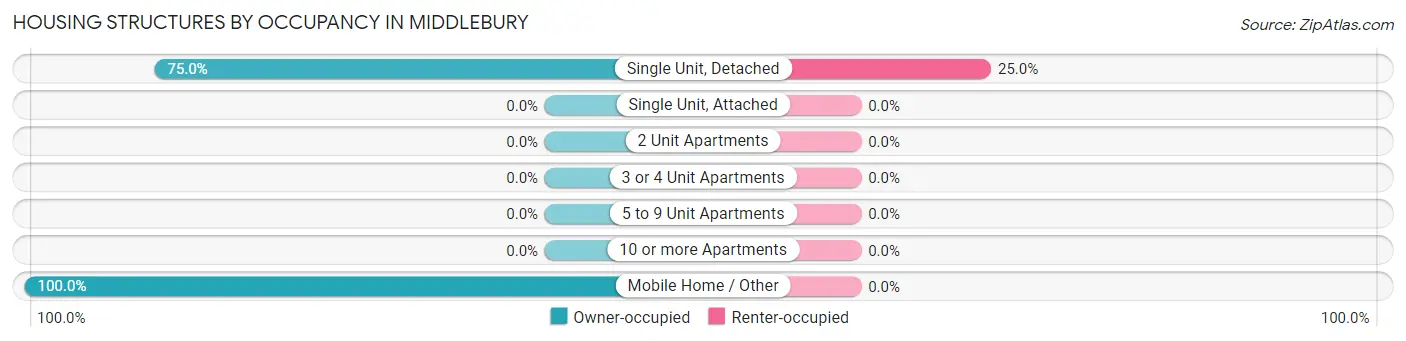
| Structure Type | Owner-occupied | Renter-occupied |
| Single Unit, Detached | 36 (75.0%) | 12 (25.0%) |
| Single Unit, Attached | 0 (0.0%) | 0 (0.0%) |
| 2 Unit Apartments | 0 (0.0%) | 0 (0.0%) |
| 3 or 4 Unit Apartments | 0 (0.0%) | 0 (0.0%) |
| 5 to 9 Unit Apartments | 0 (0.0%) | 0 (0.0%) |
| 10 or more Apartments | 0 (0.0%) | 0 (0.0%) |
| Mobile Home / Other | 17 (100.0%) | 0 (0.0%) |
| Total | 53 (81.5%) | 12 (18.5%) |
Housing Structures by Number of Rooms in Middlebury
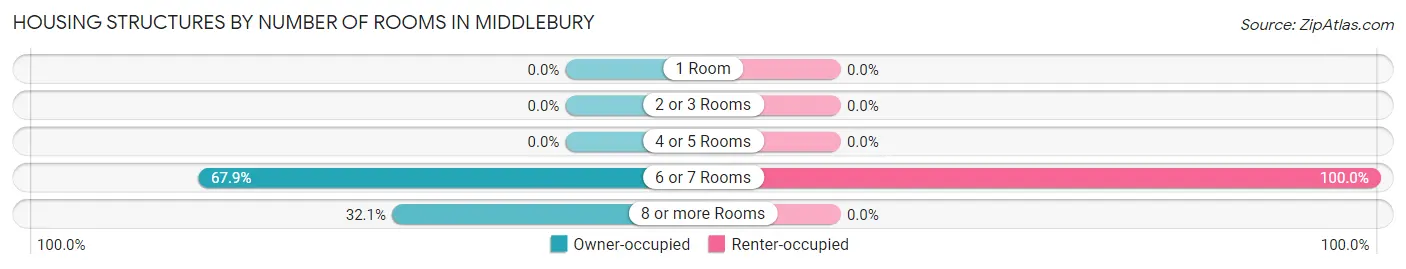
| Number of Rooms | Owner-occupied | Renter-occupied |
| 1 Room | 0 (0.0%) | 0 (0.0%) |
| 2 or 3 Rooms | 0 (0.0%) | 0 (0.0%) |
| 4 or 5 Rooms | 0 (0.0%) | 0 (0.0%) |
| 6 or 7 Rooms | 36 (67.9%) | 12 (100.0%) |
| 8 or more Rooms | 17 (32.1%) | 0 (0.0%) |
| Total | 53 (100.0%) | 12 (100.0%) |
Housing Structure by Heating Type in Middlebury
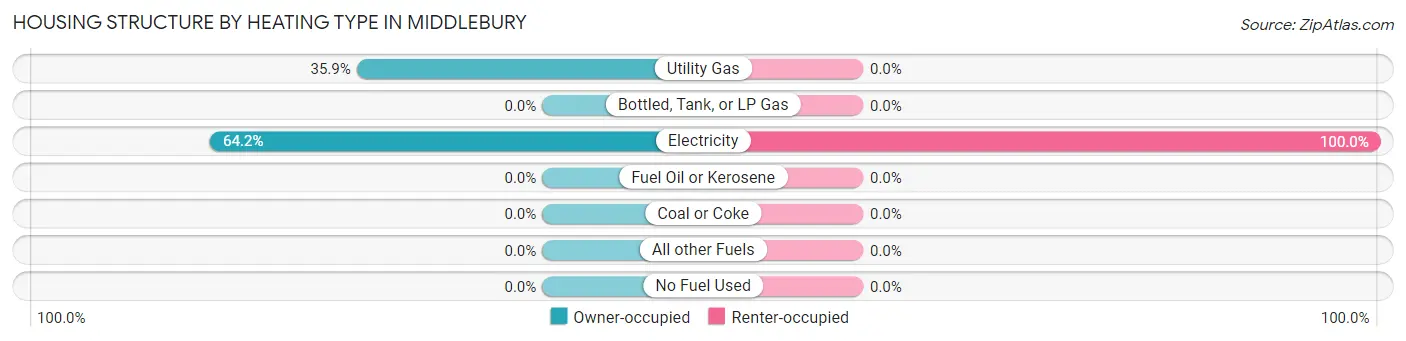
| Heating Type | Owner-occupied | Renter-occupied |
| Utility Gas | 19 (35.8%) | 0 (0.0%) |
| Bottled, Tank, or LP Gas | 0 (0.0%) | 0 (0.0%) |
| Electricity | 34 (64.1%) | 12 (100.0%) |
| Fuel Oil or Kerosene | 0 (0.0%) | 0 (0.0%) |
| Coal or Coke | 0 (0.0%) | 0 (0.0%) |
| All other Fuels | 0 (0.0%) | 0 (0.0%) |
| No Fuel Used | 0 (0.0%) | 0 (0.0%) |
| Total | 53 (100.0%) | 12 (100.0%) |
Household Vehicle Usage in Middlebury
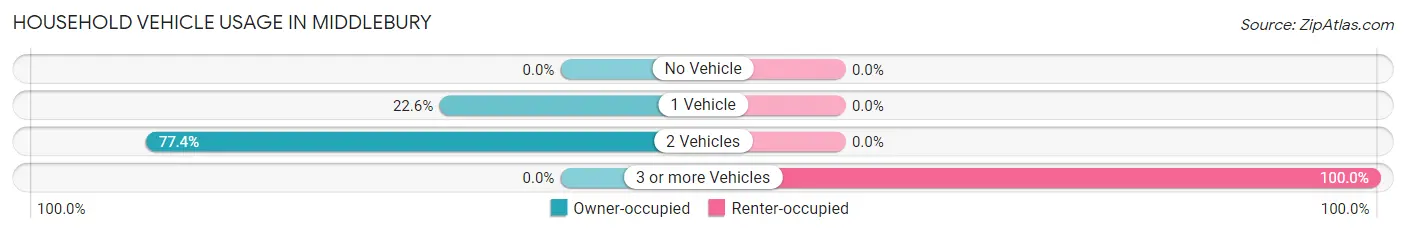
| Vehicles per Household | Owner-occupied | Renter-occupied |
| No Vehicle | 0 (0.0%) | 0 (0.0%) |
| 1 Vehicle | 12 (22.6%) | 0 (0.0%) |
| 2 Vehicles | 41 (77.4%) | 0 (0.0%) |
| 3 or more Vehicles | 0 (0.0%) | 12 (100.0%) |
| Total | 53 (100.0%) | 12 (100.0%) |
Real Estate & Mortgages in Middlebury
Real Estate and Mortgage Overview in Middlebury
| Characteristic | Without Mortgage | With Mortgage |
| Housing Units | 402 | 678 |
| Median Property Value | $208,800 | $238,500 |
| Median Household Income | $76,333 | $232 |
| Monthly Housing Costs | $510 | $0 |
| Real Estate Taxes | $1,448 | $0 |
Property Value by Mortgage Status in Middlebury
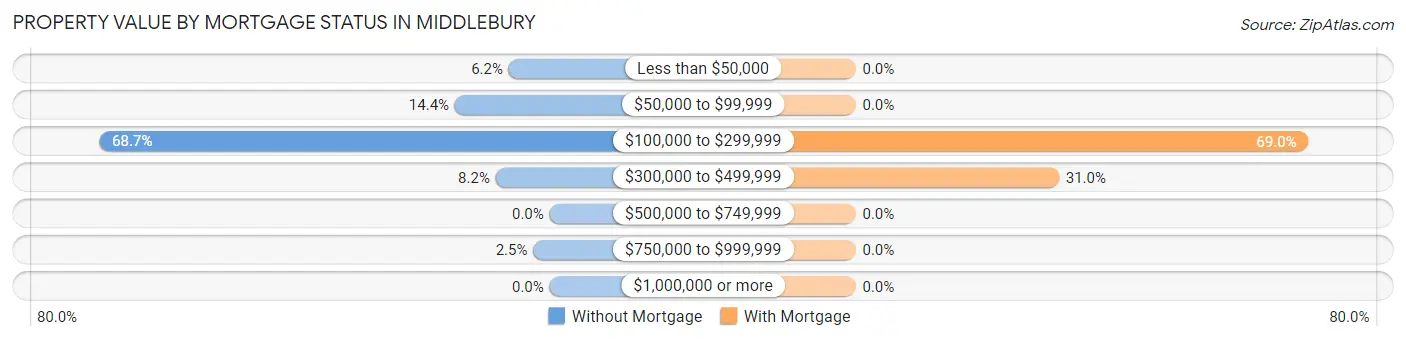
| Property Value | Without Mortgage | With Mortgage |
| Less than $50,000 | 25 (6.2%) | 0 (0.0%) |
| $50,000 to $99,999 | 58 (14.4%) | 0 (0.0%) |
| $100,000 to $299,999 | 276 (68.7%) | 468 (69.0%) |
| $300,000 to $499,999 | 33 (8.2%) | 210 (31.0%) |
| $500,000 to $749,999 | 0 (0.0%) | 0 (0.0%) |
| $750,000 to $999,999 | 10 (2.5%) | 0 (0.0%) |
| $1,000,000 or more | 0 (0.0%) | 0 (0.0%) |
| Total | 402 (100.0%) | 678 (100.0%) |
Household Income by Mortgage Status in Middlebury
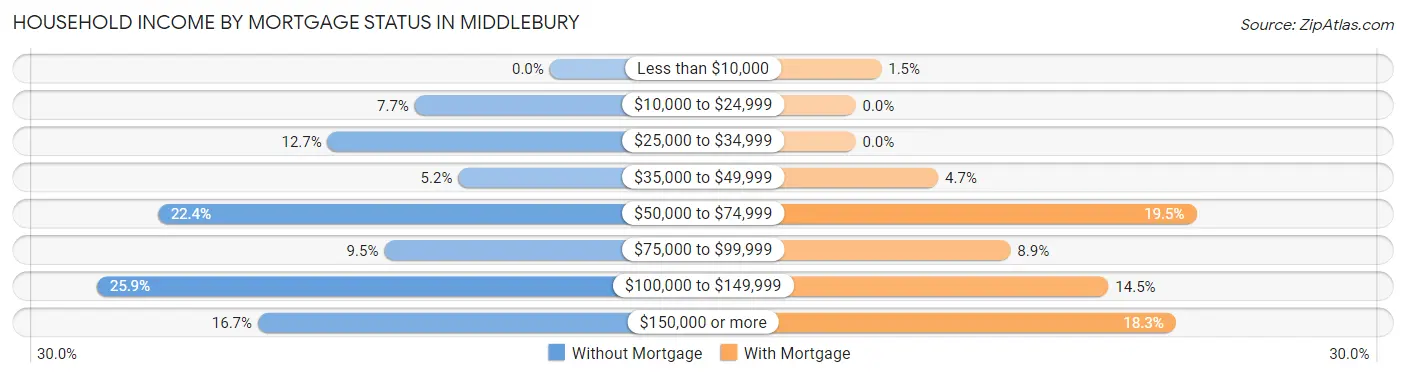
| Household Income | Without Mortgage | With Mortgage |
| Less than $10,000 | 0 (0.0%) | 10 (1.5%) |
| $10,000 to $24,999 | 31 (7.7%) | 0 (0.0%) |
| $25,000 to $34,999 | 51 (12.7%) | 0 (0.0%) |
| $35,000 to $49,999 | 21 (5.2%) | 32 (4.7%) |
| $50,000 to $74,999 | 90 (22.4%) | 132 (19.5%) |
| $75,000 to $99,999 | 38 (9.5%) | 60 (8.8%) |
| $100,000 to $149,999 | 104 (25.9%) | 98 (14.4%) |
| $150,000 or more | 67 (16.7%) | 124 (18.3%) |
| Total | 402 (100.0%) | 678 (100.0%) |
Property Value to Household Income Ratio in Middlebury
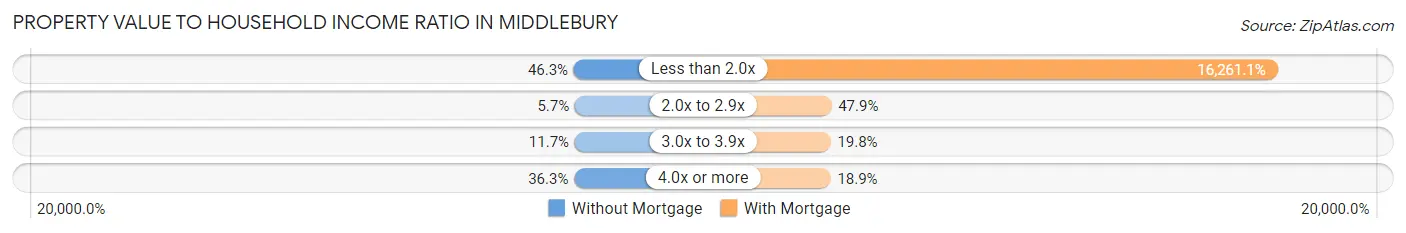
| Value-to-Income Ratio | Without Mortgage | With Mortgage |
| Less than 2.0x | 186 (46.3%) | 110,250 (16,261.1%) |
| 2.0x to 2.9x | 23 (5.7%) | 325 (47.9%) |
| 3.0x to 3.9x | 47 (11.7%) | 134 (19.8%) |
| 4.0x or more | 146 (36.3%) | 128 (18.9%) |
| Total | 402 (100.0%) | 678 (100.0%) |
Real Estate Taxes by Mortgage Status in Middlebury
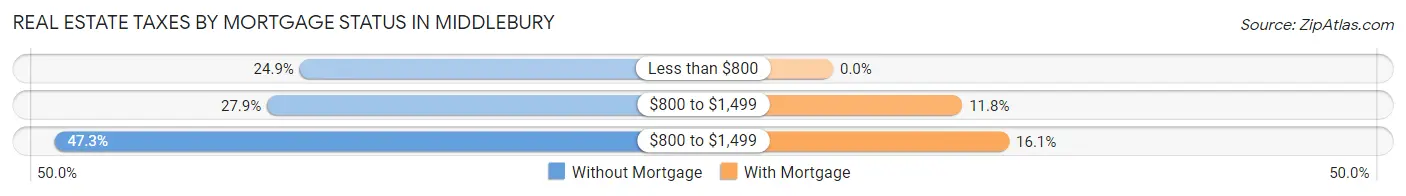
| Property Taxes | Without Mortgage | With Mortgage |
| Less than $800 | 100 (24.9%) | 0 (0.0%) |
| $800 to $1,499 | 112 (27.9%) | 80 (11.8%) |
| $800 to $1,499 | 190 (47.3%) | 109 (16.1%) |
| Total | 402 (100.0%) | 678 (100.0%) |
Health & Disability in Middlebury
Health Insurance Coverage by Age in Middlebury
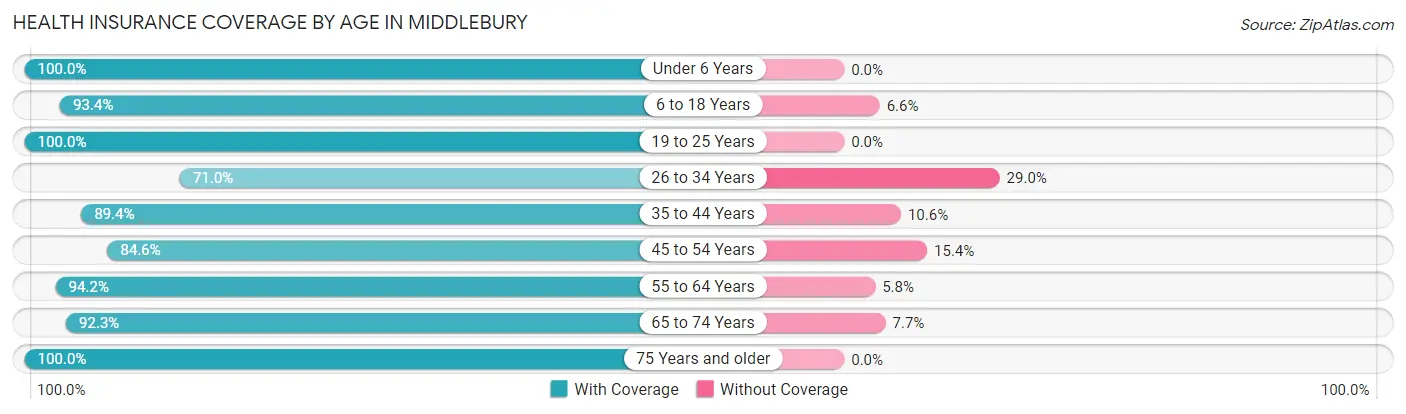
| Age Bracket | With Coverage | Without Coverage |
| Under 6 Years | 215 (100.0%) | 0 (0.0%) |
| 6 to 18 Years | 722 (93.4%) | 51 (6.6%) |
| 19 to 25 Years | 98 (100.0%) | 0 (0.0%) |
| 26 to 34 Years | 228 (71.0%) | 93 (29.0%) |
| 35 to 44 Years | 474 (89.4%) | 56 (10.6%) |
| 45 to 54 Years | 345 (84.6%) | 63 (15.4%) |
| 55 to 64 Years | 735 (94.2%) | 45 (5.8%) |
| 65 to 74 Years | 371 (92.3%) | 31 (7.7%) |
| 75 Years and older | 150 (100.0%) | 0 (0.0%) |
| Total | 3,338 (90.8%) | 339 (9.2%) |
Health Insurance Coverage by Citizenship Status in Middlebury
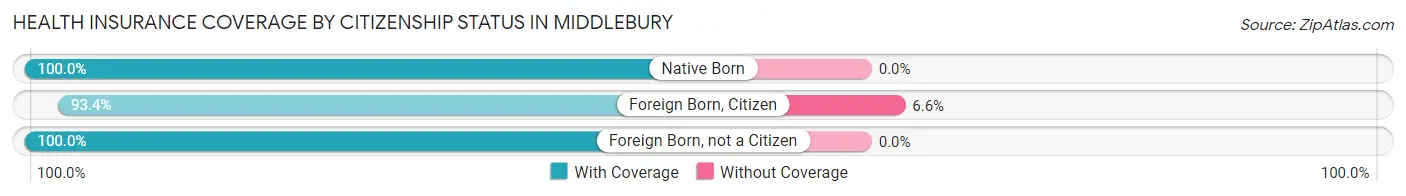
| Citizenship Status | With Coverage | Without Coverage |
| Native Born | 215 (100.0%) | 0 (0.0%) |
| Foreign Born, Citizen | 722 (93.4%) | 51 (6.6%) |
| Foreign Born, not a Citizen | 98 (100.0%) | 0 (0.0%) |
Health Insurance Coverage by Household Income in Middlebury
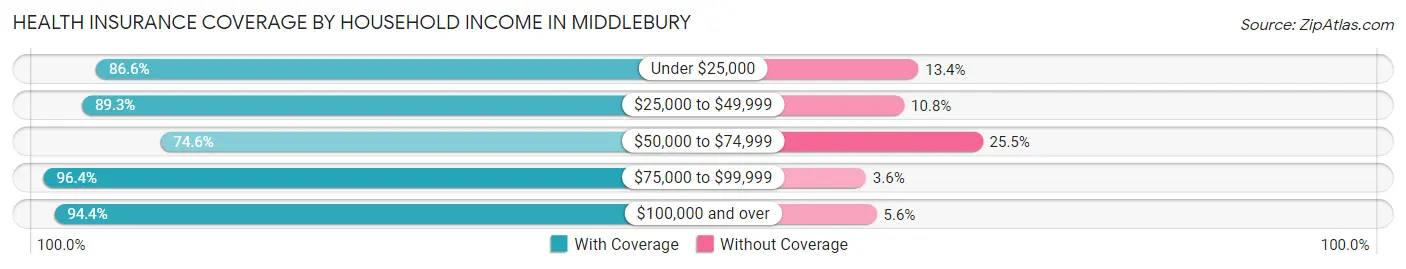
| Household Income | With Coverage | Without Coverage |
| Under $25,000 | 142 (86.6%) | 22 (13.4%) |
| $25,000 to $49,999 | 772 (89.2%) | 93 (10.7%) |
| $50,000 to $74,999 | 328 (74.6%) | 112 (25.5%) |
| $75,000 to $99,999 | 511 (96.4%) | 19 (3.6%) |
| $100,000 and over | 1,575 (94.4%) | 93 (5.6%) |
Public vs Private Health Insurance Coverage by Age in Middlebury
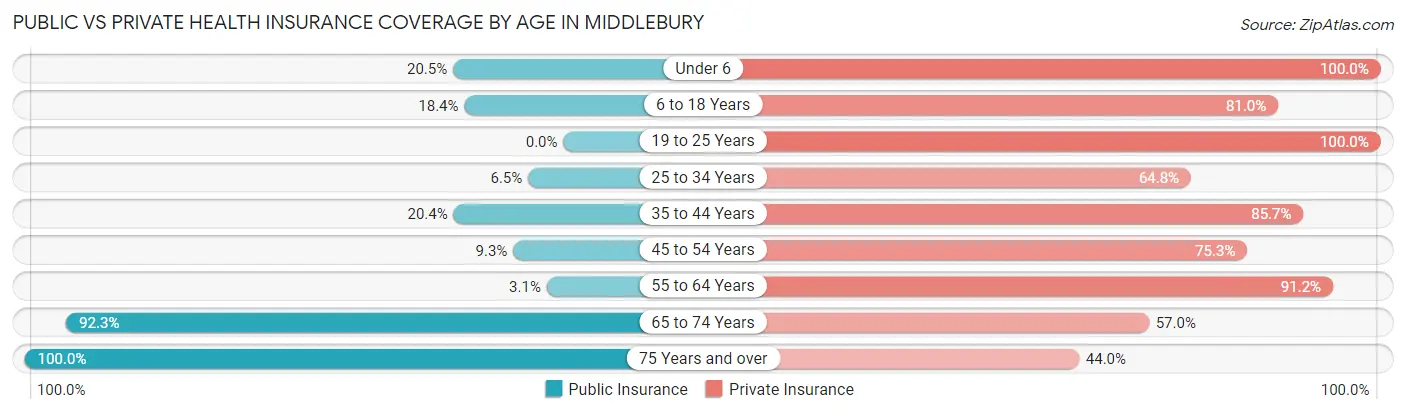
| Age Bracket | Public Insurance | Private Insurance |
| Under 6 | 44 (20.5%) | 215 (100.0%) |
| 6 to 18 Years | 142 (18.4%) | 626 (81.0%) |
| 19 to 25 Years | 0 (0.0%) | 98 (100.0%) |
| 25 to 34 Years | 21 (6.5%) | 208 (64.8%) |
| 35 to 44 Years | 108 (20.4%) | 454 (85.7%) |
| 45 to 54 Years | 38 (9.3%) | 307 (75.2%) |
| 55 to 64 Years | 24 (3.1%) | 711 (91.1%) |
| 65 to 74 Years | 371 (92.3%) | 229 (57.0%) |
| 75 Years and over | 150 (100.0%) | 66 (44.0%) |
| Total | 898 (24.4%) | 2,914 (79.2%) |
Disability Status by Sex by Age in Middlebury
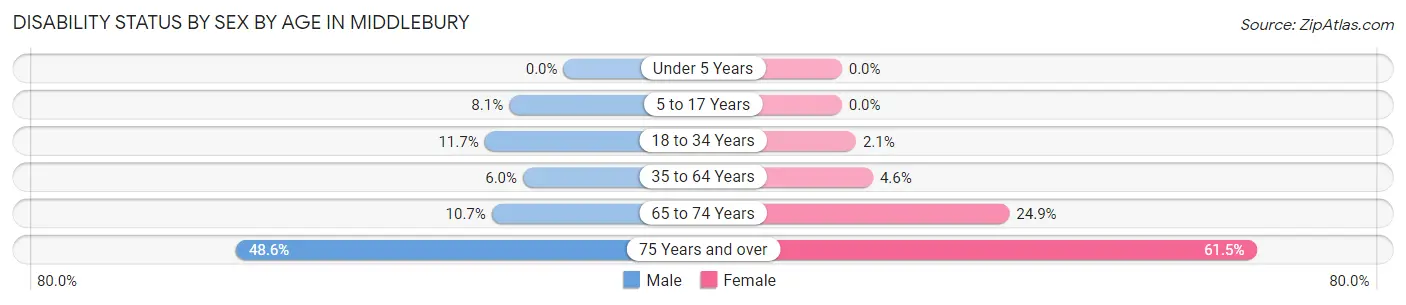
| Age Bracket | Male | Female |
| Under 5 Years | 0 (0.0%) | 0 (0.0%) |
| 5 to 17 Years | 41 (8.1%) | 0 (0.0%) |
| 18 to 34 Years | 39 (11.7%) | 3 (2.1%) |
| 35 to 64 Years | 50 (6.0%) | 41 (4.6%) |
| 65 to 74 Years | 18 (10.6%) | 58 (24.9%) |
| 75 Years and over | 35 (48.6%) | 48 (61.5%) |
Disability Class by Sex by Age in Middlebury
Disability Class: Hearing Difficulty
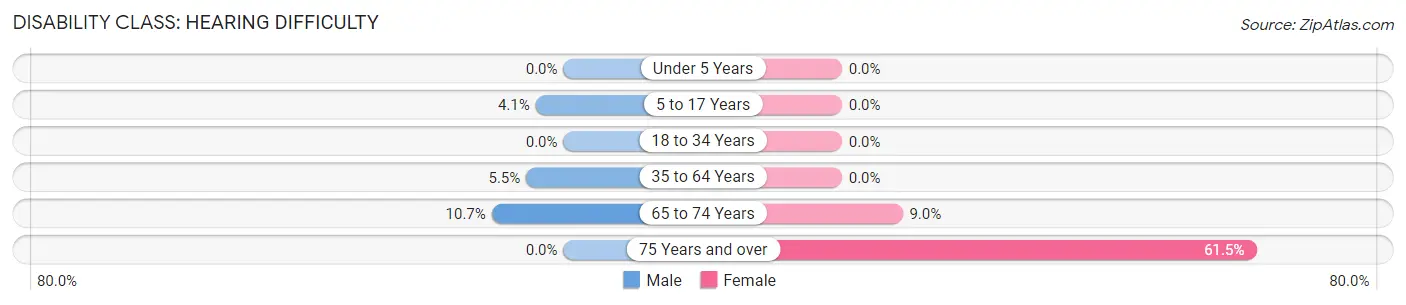
| Age Bracket | Male | Female |
| Under 5 Years | 0 (0.0%) | 0 (0.0%) |
| 5 to 17 Years | 21 (4.1%) | 0 (0.0%) |
| 18 to 34 Years | 0 (0.0%) | 0 (0.0%) |
| 35 to 64 Years | 46 (5.5%) | 0 (0.0%) |
| 65 to 74 Years | 18 (10.6%) | 21 (9.0%) |
| 75 Years and over | 0 (0.0%) | 48 (61.5%) |
Disability Class: Vision Difficulty
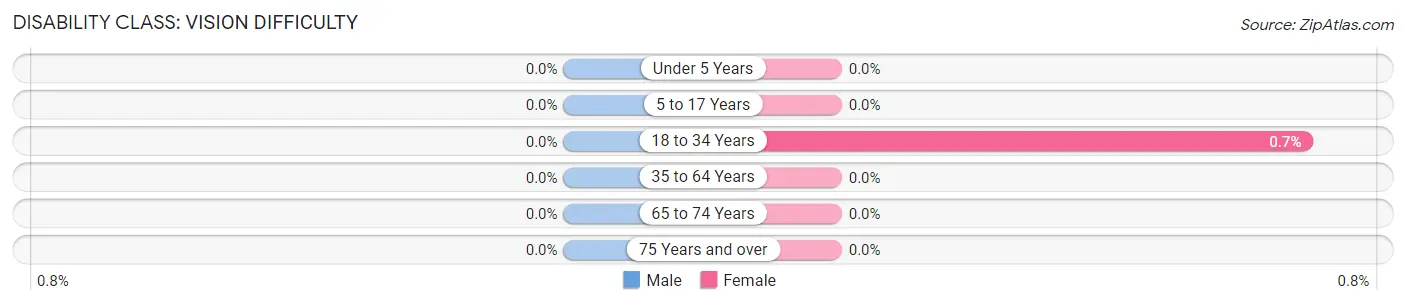
| Age Bracket | Male | Female |
| Under 5 Years | 0 (0.0%) | 0 (0.0%) |
| 5 to 17 Years | 0 (0.0%) | 0 (0.0%) |
| 18 to 34 Years | 0 (0.0%) | 1 (0.7%) |
| 35 to 64 Years | 0 (0.0%) | 0 (0.0%) |
| 65 to 74 Years | 0 (0.0%) | 0 (0.0%) |
| 75 Years and over | 0 (0.0%) | 0 (0.0%) |
Disability Class: Cognitive Difficulty
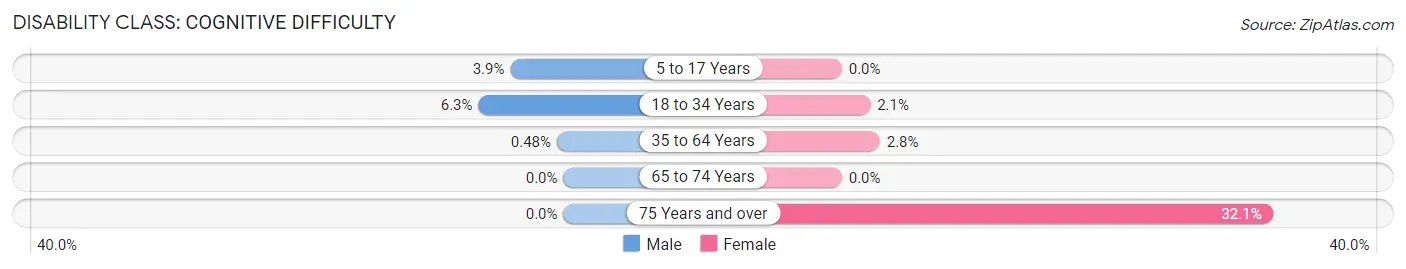
| Age Bracket | Male | Female |
| 5 to 17 Years | 20 (3.9%) | 0 (0.0%) |
| 18 to 34 Years | 21 (6.3%) | 3 (2.1%) |
| 35 to 64 Years | 4 (0.5%) | 25 (2.8%) |
| 65 to 74 Years | 0 (0.0%) | 0 (0.0%) |
| 75 Years and over | 0 (0.0%) | 25 (32.1%) |
Disability Class: Ambulatory Difficulty
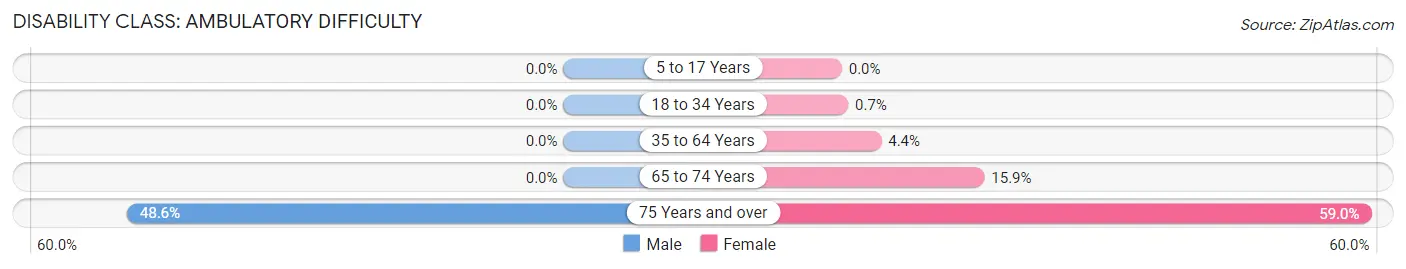
| Age Bracket | Male | Female |
| 5 to 17 Years | 0 (0.0%) | 0 (0.0%) |
| 18 to 34 Years | 0 (0.0%) | 1 (0.7%) |
| 35 to 64 Years | 0 (0.0%) | 39 (4.4%) |
| 65 to 74 Years | 0 (0.0%) | 37 (15.9%) |
| 75 Years and over | 35 (48.6%) | 46 (59.0%) |
Disability Class: Self-Care Difficulty
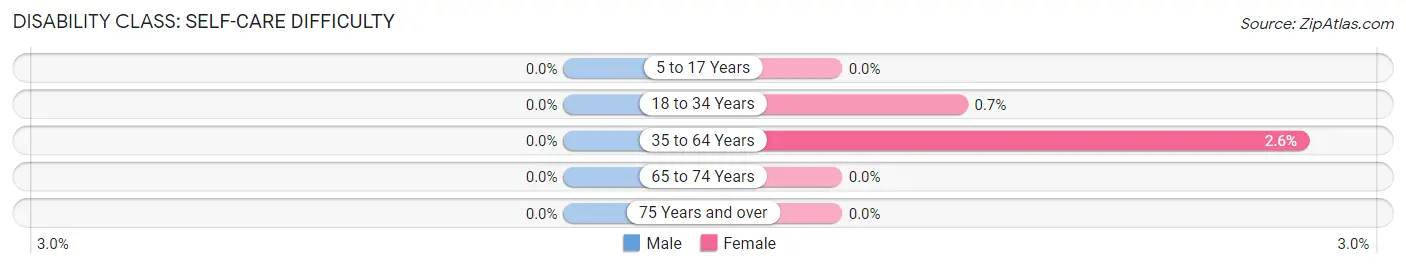
| Age Bracket | Male | Female |
| 5 to 17 Years | 0 (0.0%) | 0 (0.0%) |
| 18 to 34 Years | 0 (0.0%) | 1 (0.7%) |
| 35 to 64 Years | 0 (0.0%) | 23 (2.6%) |
| 65 to 74 Years | 0 (0.0%) | 0 (0.0%) |
| 75 Years and over | 0 (0.0%) | 0 (0.0%) |
Technology Access in Middlebury
Computing Device Access in Middlebury
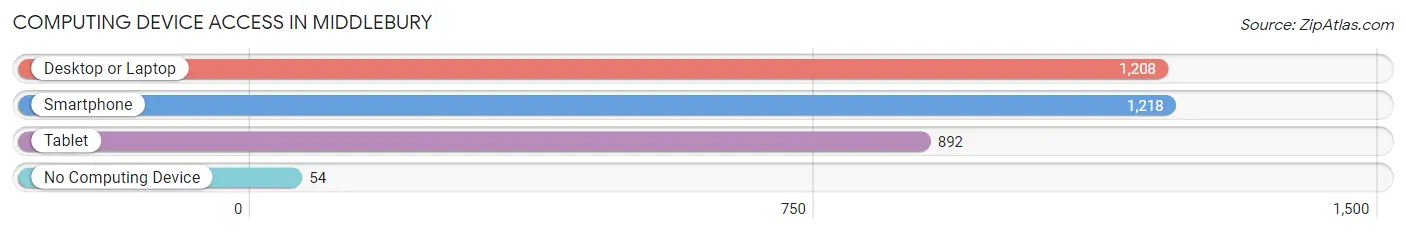
| Device Type | # Households | % Households |
| Desktop or Laptop | 1,208 | 89.3% |
| Smartphone | 1,218 | 90.1% |
| Tablet | 892 | 66.0% |
| No Computing Device | 54 | 4.0% |
| Total | 1,352 | 100.0% |
Internet Access in Middlebury
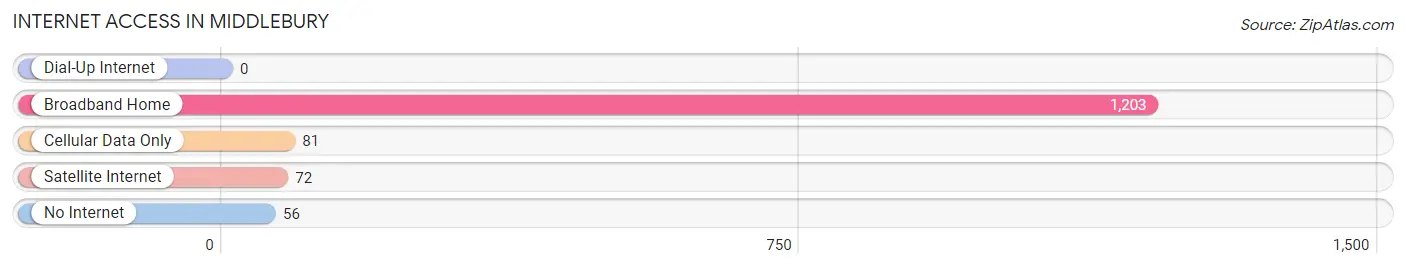
| Internet Type | # Households | % Households |
| Dial-Up Internet | 0 | 0.0% |
| Broadband Home | 1,203 | 89.0% |
| Cellular Data Only | 81 | 6.0% |
| Satellite Internet | 72 | 5.3% |
| No Internet | 56 | 4.1% |
| Total | 1,352 | 100.0% |
Middlebury Summary
History
The town of Middlebury, Indiana is located in Elkhart County, in the northern part of the state. It is situated on the banks of the St. Joseph River, and is part of the larger Elkhart-Goshen metropolitan area. The town was founded in 1836 by a group of settlers from New England, and was originally known as “Newbury”. The name was changed to Middlebury in 1837, in honor of the town of Middlebury, Vermont, which was the hometown of many of the settlers.
Middlebury was an important stop on the Underground Railroad, and was home to several prominent abolitionists, including the Reverend John Rankin and his family. Rankin was a Presbyterian minister who was active in the anti-slavery movement, and his home was a safe haven for escaped slaves. The Rankin House is now a National Historic Landmark, and is open to the public for tours.
Middlebury was also an important stop on the Michigan Road, which was the first major road to connect the northern and southern parts of Indiana. The road was built in the 1830s, and was a major factor in the growth of the town.
Geography
Middlebury is located in the northern part of Elkhart County, in the northern part of Indiana. It is situated on the banks of the St. Joseph River, and is part of the larger Elkhart-Goshen metropolitan area. The town is located about 20 miles east of South Bend, and about 40 miles west of Fort Wayne.
The town is situated in a flat, low-lying area, with an elevation of about 800 feet above sea level. The climate is humid continental, with hot summers and cold winters. The average annual temperature is around 50 degrees Fahrenheit, and the average annual precipitation is around 40 inches.
Economy
The economy of Middlebury is largely based on manufacturing and agriculture. The town is home to several large manufacturing companies, including the Middlebury Manufacturing Company, which produces a variety of products, including furniture, cabinets, and other wood products. The town is also home to several agricultural businesses, including dairy farms, grain farms, and vegetable farms.
The town is also home to several retail businesses, including several antique stores, a variety of restaurants, and several small shops. The town is also home to several small businesses, including a variety of professional services, such as accounting, legal, and medical services.
Demographics
As of the 2010 census, the population of Middlebury was 2,845. The racial makeup of the town was 95.3% White, 0.7% African American, 0.3% Native American, 0.7% Asian, 0.1% Pacific Islander, 1.2% from other races, and 1.7% from two or more races. Hispanic or Latino of any race were 3.2% of the population.
The median household income in Middlebury was $45,938, and the median family income was $51,938. The per capita income was $20,938. About 8.3% of families and 10.2% of the population were below the poverty line, including 14.2% of those under age 18 and 6.2% of those age 65 or over.
Common Questions
What is Per Capita Income in Middlebury?
Per Capita income in Middlebury is $38,009.
What is the Median Family Income in Middlebury?
Median Family Income in Middlebury is $79,278.
What is the Median Household income in Middlebury?
Median Household Income in Middlebury is $78,056.
What is Income or Wage Gap in Middlebury?
Income or Wage Gap in Middlebury is 5.1%.
Women in Middlebury earn 94.9 cents for every dollar earned by a man.
What is Inequality or Gini Index in Middlebury?
Inequality or Gini Index in Middlebury is 0.39.
What is the Total Population of Middlebury?
Total Population of Middlebury is 3,677.
What is the Total Male Population of Middlebury?
Total Male Population of Middlebury is 2,009.
What is the Total Female Population of Middlebury?
Total Female Population of Middlebury is 1,668.
What is the Ratio of Males per 100 Females in Middlebury?
There are 120.44 Males per 100 Females in Middlebury.
What is the Ratio of Females per 100 Males in Middlebury?
There are 83.03 Females per 100 Males in Middlebury.
What is the Median Population Age in Middlebury?
Median Population Age in Middlebury is 43.6 Years.
What is the Average Family Size in Middlebury
Average Family Size in Middlebury is 2.9 People.
What is the Average Household Size in Middlebury
Average Household Size in Middlebury is 2.7 People.
How Large is the Labor Force in Middlebury?
There are 2,051 People in the Labor Forcein in Middlebury.
What is the Percentage of People in the Labor Force in Middlebury?
70.2% of People are in the Labor Force in Middlebury.
What is the Unemployment Rate in Middlebury?
Unemployment Rate in Middlebury is 5.8%.