Indian Hills, CO Map & Demographics
Indian Hills Map
Indian Hills Overview
$76,559
PER CAPITA INCOME
$167,381
AVG FAMILY INCOME
$166,429
AVG HOUSEHOLD INCOME
34.2%
WAGE / INCOME GAP [ % ]
65.8¢/ $1
WAGE / INCOME GAP [ $ ]
0.31
INEQUALITY / GINI INDEX
1,445
TOTAL POPULATION
743
MALE POPULATION
702
FEMALE POPULATION
105.84
MALES / 100 FEMALES
94.48
FEMALES / 100 MALES
49.0
MEDIAN AGE
2.5
AVG FAMILY SIZE
2.4
AVG HOUSEHOLD SIZE
800
LABOR FORCE [ PEOPLE ]
67.9%
PERCENT IN LABOR FORCE
Indian Hills Zip Codes
Indian Hills Area Codes
Income in Indian Hills
Income Overview in Indian Hills
Per Capita Income in Indian Hills is $76,559, while median incomes of families and households are $167,381 and $166,429 respectively.
| Characteristic | Number | Measure |
| Per Capita Income | 1,445 | $76,559 |
| Median Family Income | 564 | $167,381 |
| Mean Family Income | 564 | $181,718 |
| Median Household Income | 612 | $166,429 |
| Mean Household Income | 612 | $173,830 |
| Income Deficit | 564 | $0 |
| Wage / Income Gap (%) | 1,445 | 34.24% |
| Wage / Income Gap ($) | 1,445 | 65.76¢ per $1 |
| Gini / Inequality Index | 1,445 | 0.31 |
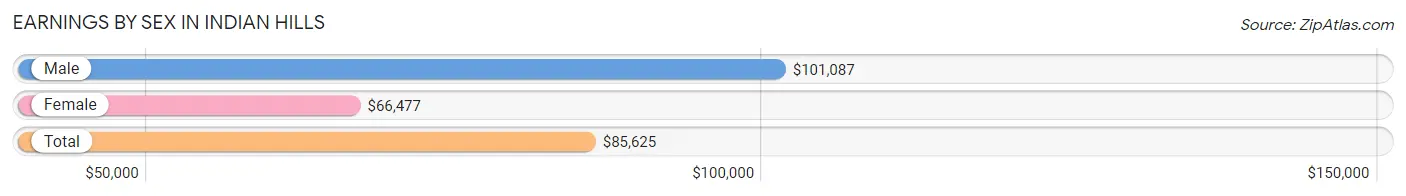
Earnings by Sex in Indian Hills
Average Earnings in Indian Hills are $85,625, $101,087 for men and $66,477 for women, a difference of 34.2%.
| Sex | Number | Average Earnings |
| Male | 512 (59.8%) | $101,087 |
| Female | 344 (40.2%) | $66,477 |
| Total | 856 (100.0%) | $85,625 |
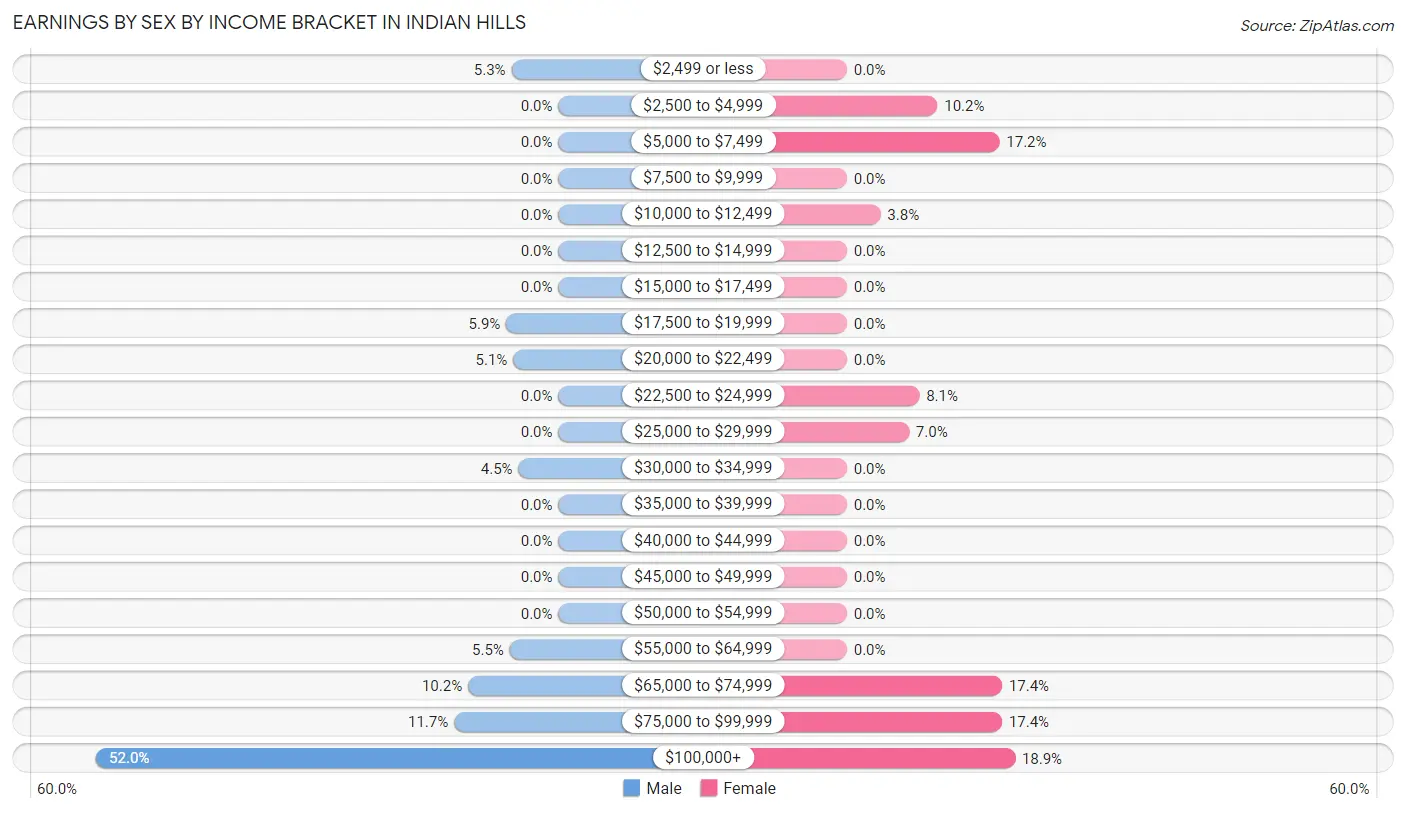
Earnings by Sex by Income Bracket in Indian Hills
The most common earnings brackets in Indian Hills are $100,000+ for men (266 | 51.9%) and $100,000+ for women (65 | 18.9%).
| Income | Male | Female |
| $2,499 or less | 27 (5.3%) | 0 (0.0%) |
| $2,500 to $4,999 | 0 (0.0%) | 35 (10.2%) |
| $5,000 to $7,499 | 0 (0.0%) | 59 (17.2%) |
| $7,500 to $9,999 | 0 (0.0%) | 0 (0.0%) |
| $10,000 to $12,499 | 0 (0.0%) | 13 (3.8%) |
| $12,500 to $14,999 | 0 (0.0%) | 0 (0.0%) |
| $15,000 to $17,499 | 0 (0.0%) | 0 (0.0%) |
| $17,500 to $19,999 | 30 (5.9%) | 0 (0.0%) |
| $20,000 to $22,499 | 26 (5.1%) | 0 (0.0%) |
| $22,500 to $24,999 | 0 (0.0%) | 28 (8.1%) |
| $25,000 to $29,999 | 0 (0.0%) | 24 (7.0%) |
| $30,000 to $34,999 | 23 (4.5%) | 0 (0.0%) |
| $35,000 to $39,999 | 0 (0.0%) | 0 (0.0%) |
| $40,000 to $44,999 | 0 (0.0%) | 0 (0.0%) |
| $45,000 to $49,999 | 0 (0.0%) | 0 (0.0%) |
| $50,000 to $54,999 | 0 (0.0%) | 0 (0.0%) |
| $55,000 to $64,999 | 28 (5.5%) | 0 (0.0%) |
| $65,000 to $74,999 | 52 (10.2%) | 60 (17.4%) |
| $75,000 to $99,999 | 60 (11.7%) | 60 (17.4%) |
| $100,000+ | 266 (51.9%) | 65 (18.9%) |
| Total | 512 (100.0%) | 344 (100.0%) |
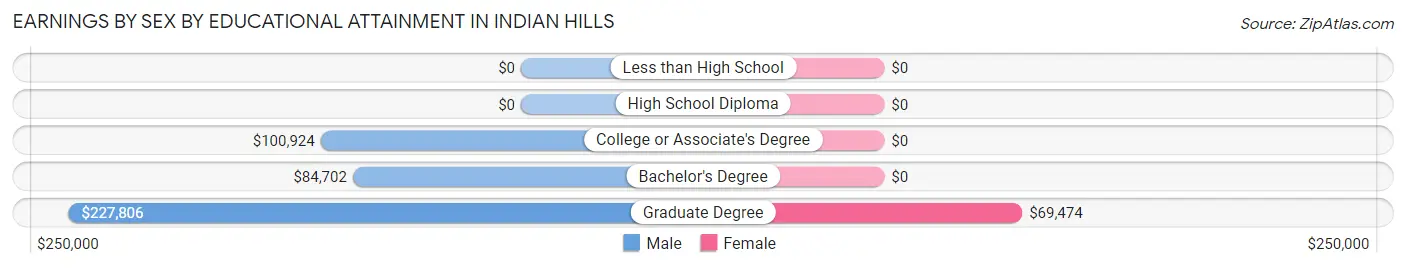
Earnings by Sex by Educational Attainment in Indian Hills
Average earnings in Indian Hills are $115,104 for men and $67,862 for women, a difference of 41.0%. Men with an educational attainment of graduate degree enjoy the highest average annual earnings of $227,806, while those with bachelor's degree education earn the least with $84,702. Women with an educational attainment of graduate degree earn the most with the average annual earnings of $69,474, while those with graduate degree education have the smallest earnings of $69,474.
| Educational Attainment | Male Income | Female Income |
| Less than High School | - | - |
| High School Diploma | - | - |
| College or Associate's Degree | $100,924 | $0 |
| Bachelor's Degree | $84,702 | $0 |
| Graduate Degree | $227,806 | $69,474 |
| Total | $115,104 | $67,862 |
Family Income in Indian Hills
Family Income Brackets in Indian Hills
According to the Indian Hills family income data, there are 268 families falling into the $200,000+ income range, which is the most common income bracket and makes up 47.5% of all families.
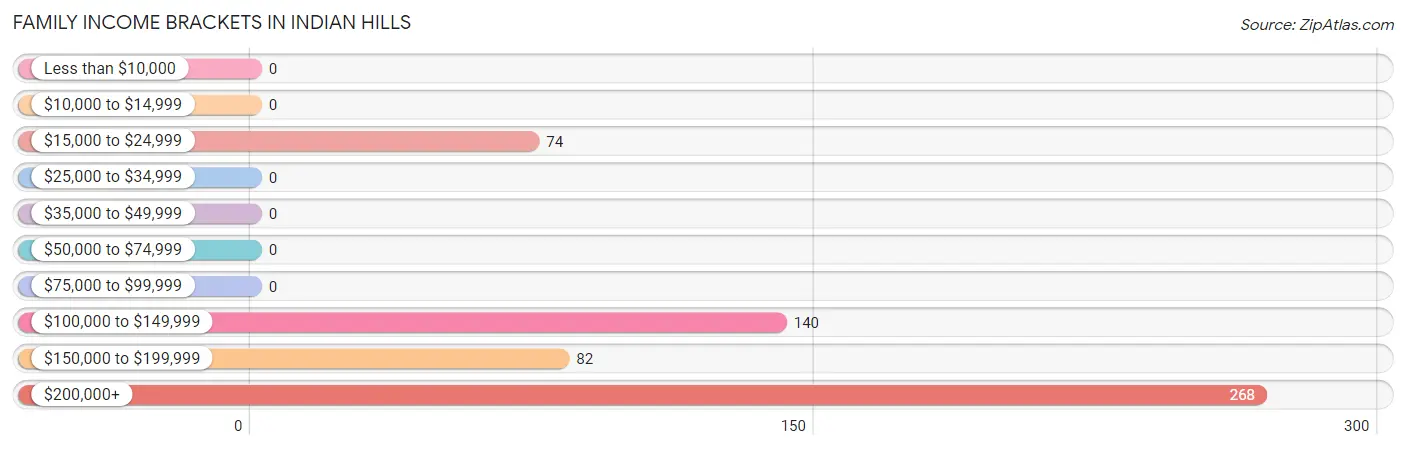
| Income Bracket | # Families | % Families |
| Less than $10,000 | 0 | 0.0% |
| $10,000 to $14,999 | 0 | 0.0% |
| $15,000 to $24,999 | 74 | 13.1% |
| $25,000 to $34,999 | 0 | 0.0% |
| $35,000 to $49,999 | 0 | 0.0% |
| $50,000 to $74,999 | 0 | 0.0% |
| $75,000 to $99,999 | 0 | 0.0% |
| $100,000 to $149,999 | 140 | 24.8% |
| $150,000 to $199,999 | 82 | 14.5% |
| $200,000+ | 268 | 47.5% |
Family Income by Famaliy Size in Indian Hills
4-person families (144 | 25.5%) account for the highest median family income in Indian Hills with $250,001 per family, while 2-person families (326 | 57.8%) have the highest median income of $73,580 per family member.
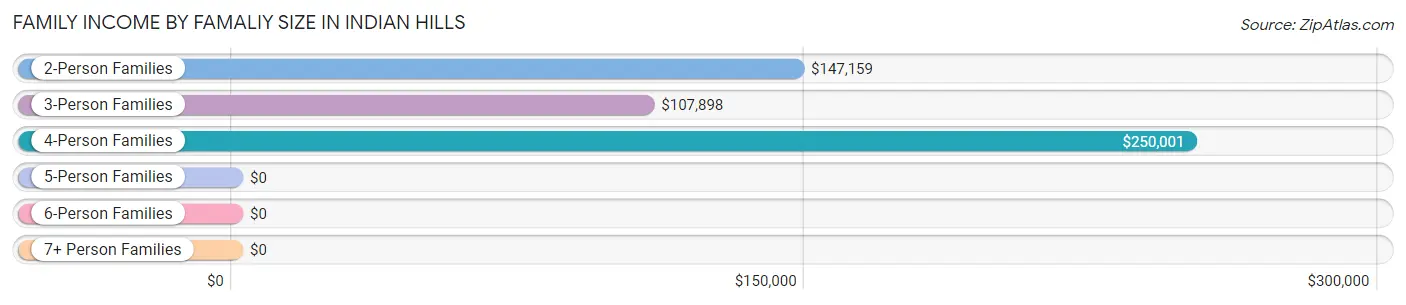
| Income Bracket | # Families | Median Income |
| 2-Person Families | 326 (57.8%) | $147,159 |
| 3-Person Families | 59 (10.5%) | $107,898 |
| 4-Person Families | 144 (25.5%) | $250,001 |
| 5-Person Families | 0 (0.0%) | $0 |
| 6-Person Families | 35 (6.2%) | $0 |
| 7+ Person Families | 0 (0.0%) | $0 |
| Total | 564 (100.0%) | $167,381 |
Family Income by Number of Earners in Indian Hills
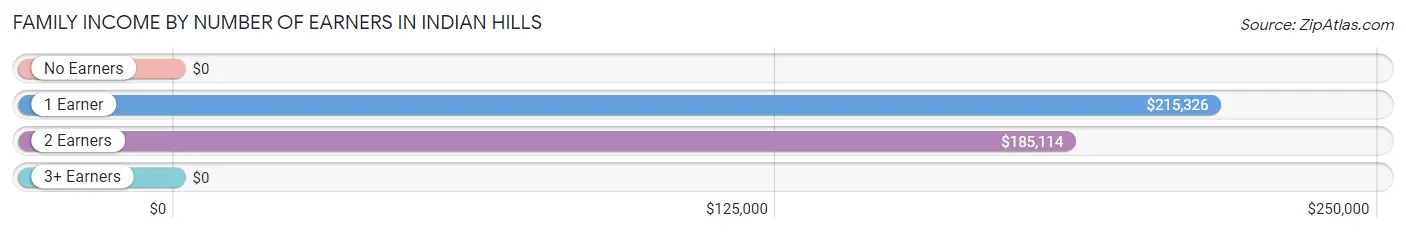
| Number of Earners | # Families | Median Income |
| No Earners | 127 (22.5%) | $0 |
| 1 Earner | 50 (8.9%) | $215,326 |
| 2 Earners | 267 (47.3%) | $185,114 |
| 3+ Earners | 120 (21.3%) | $0 |
| Total | 564 (100.0%) | $167,381 |
Household Income in Indian Hills
Household Income Brackets in Indian Hills
With 268 households falling in the category, the $200,000+ income range is the most frequent in Indian Hills, accounting for 43.8% of all households.
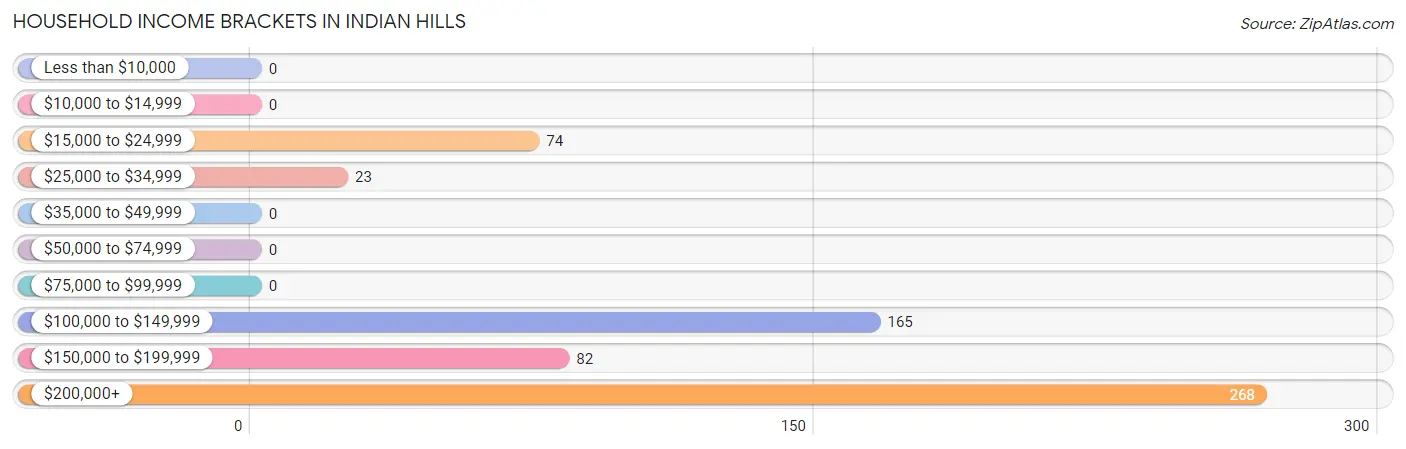
| Income Bracket | # Households | % Households |
| Less than $10,000 | 0 | 0.0% |
| $10,000 to $14,999 | 0 | 0.0% |
| $15,000 to $24,999 | 74 | 12.1% |
| $25,000 to $34,999 | 23 | 3.8% |
| $35,000 to $49,999 | 0 | 0.0% |
| $50,000 to $74,999 | 0 | 0.0% |
| $75,000 to $99,999 | 0 | 0.0% |
| $100,000 to $149,999 | 165 | 27.0% |
| $150,000 to $199,999 | 82 | 13.4% |
| $200,000+ | 268 | 43.8% |
Household Income by Householder Age in Indian Hills
The median household income in Indian Hills is $166,429, with the highest median household income of $227,065 found in the 45 to 64 years age bracket for the primary householder. A total of 274 households (44.8%) fall into this category.
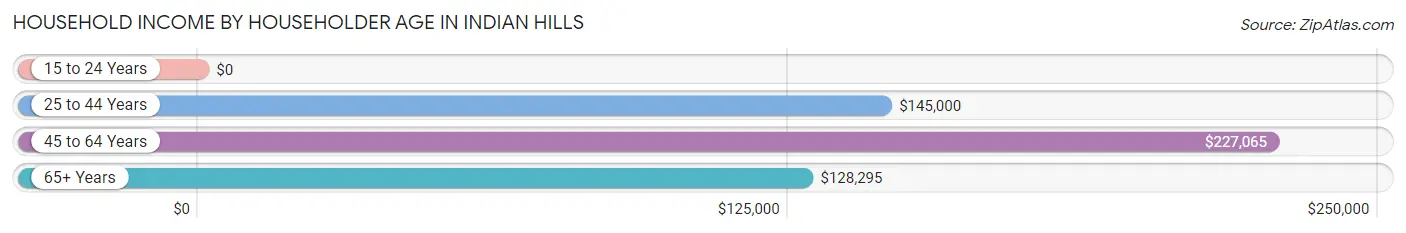
| Income Bracket | # Households | Median Income |
| 15 to 24 Years | 0 (0.0%) | $0 |
| 25 to 44 Years | 142 (23.2%) | $145,000 |
| 45 to 64 Years | 274 (44.8%) | $227,065 |
| 65+ Years | 196 (32.0%) | $128,295 |
| Total | 612 (100.0%) | $166,429 |
Poverty in Indian Hills
Income Below Poverty by Sex and Age in Indian Hills
With 4.0% poverty level for males and 5.0% for females among the residents of Indian Hills, 65 to 74 year old males and 65 to 74 year old females are the most vulnerable to poverty, with 30 males (20.8%) and 35 females (27.8%) in their respective age groups living below the poverty level.
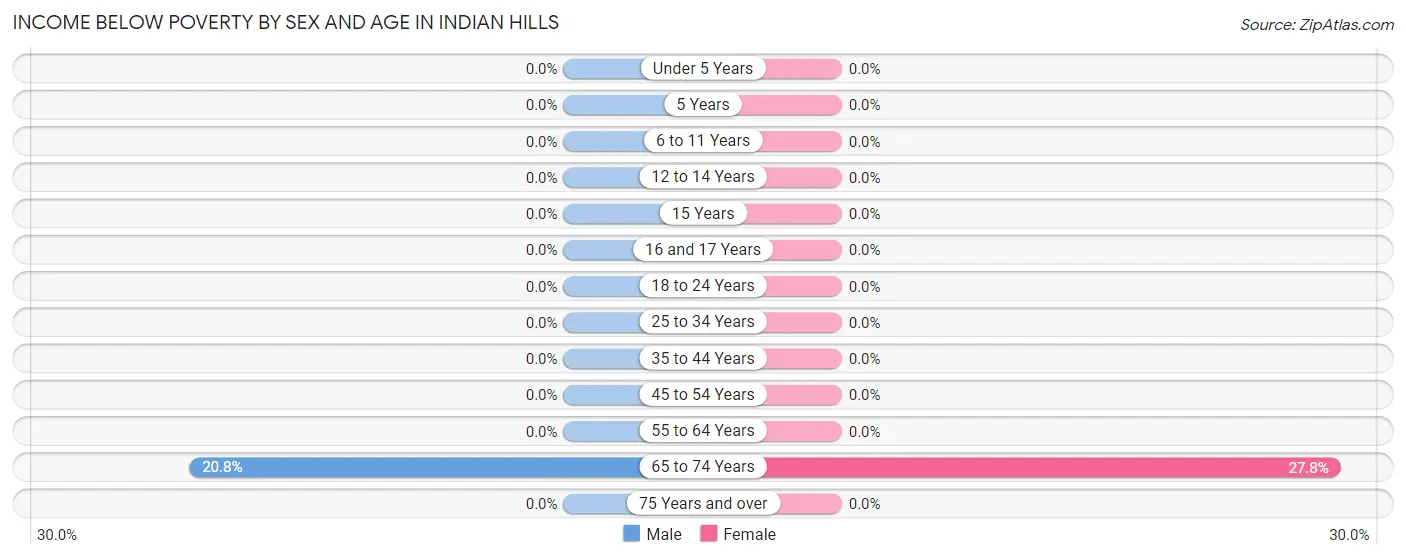
| Age Bracket | Male | Female |
| Under 5 Years | 0 (0.0%) | 0 (0.0%) |
| 5 Years | 0 (0.0%) | 0 (0.0%) |
| 6 to 11 Years | 0 (0.0%) | 0 (0.0%) |
| 12 to 14 Years | 0 (0.0%) | 0 (0.0%) |
| 15 Years | 0 (0.0%) | 0 (0.0%) |
| 16 and 17 Years | 0 (0.0%) | 0 (0.0%) |
| 18 to 24 Years | 0 (0.0%) | 0 (0.0%) |
| 25 to 34 Years | 0 (0.0%) | 0 (0.0%) |
| 35 to 44 Years | 0 (0.0%) | 0 (0.0%) |
| 45 to 54 Years | 0 (0.0%) | 0 (0.0%) |
| 55 to 64 Years | 0 (0.0%) | 0 (0.0%) |
| 65 to 74 Years | 30 (20.8%) | 35 (27.8%) |
| 75 Years and over | 0 (0.0%) | 0 (0.0%) |
| Total | 30 (4.0%) | 35 (5.0%) |
Income Above Poverty by Sex and Age in Indian Hills
According to the poverty statistics in Indian Hills, males aged 6 to 11 years and females aged 5 years are the age groups that are most secure financially, with 100.0% of males and 100.0% of females in these age groups living above the poverty line.
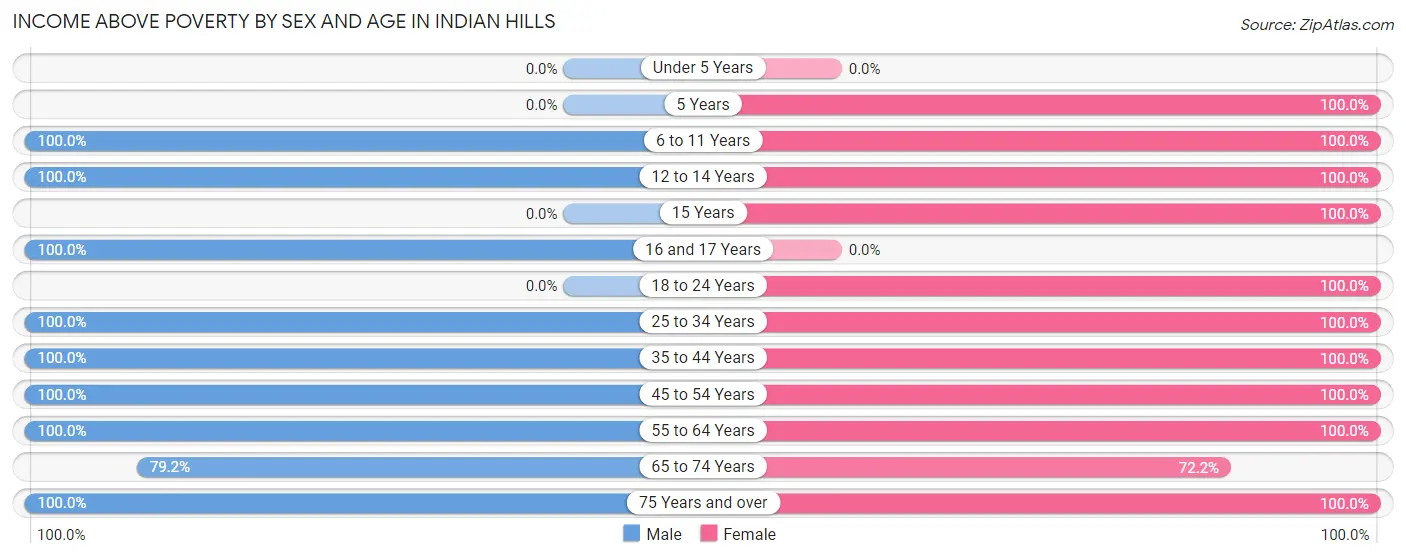
| Age Bracket | Male | Female |
| Under 5 Years | 0 (0.0%) | 0 (0.0%) |
| 5 Years | 0 (0.0%) | 55 (100.0%) |
| 6 to 11 Years | 54 (100.0%) | 69 (100.0%) |
| 12 to 14 Years | 54 (100.0%) | 12 (100.0%) |
| 15 Years | 0 (0.0%) | 23 (100.0%) |
| 16 and 17 Years | 27 (100.0%) | 0 (0.0%) |
| 18 to 24 Years | 0 (0.0%) | 29 (100.0%) |
| 25 to 34 Years | 44 (100.0%) | 43 (100.0%) |
| 35 to 44 Years | 90 (100.0%) | 113 (100.0%) |
| 45 to 54 Years | 168 (100.0%) | 89 (100.0%) |
| 55 to 64 Years | 140 (100.0%) | 119 (100.0%) |
| 65 to 74 Years | 114 (79.2%) | 91 (72.2%) |
| 75 Years and over | 22 (100.0%) | 24 (100.0%) |
| Total | 713 (96.0%) | 667 (95.0%) |
Income Below Poverty Among Married-Couple Families in Indian Hills
The poverty statistics for married-couple families in Indian Hills show that 6.5% or 35 of the total 542 families live below the poverty line. Families with no children have the highest poverty rate of 9.9%, comprising of 35 families. On the other hand, families with 1 or 2 children have the lowest poverty rate of 0.0%, which includes 0 families.
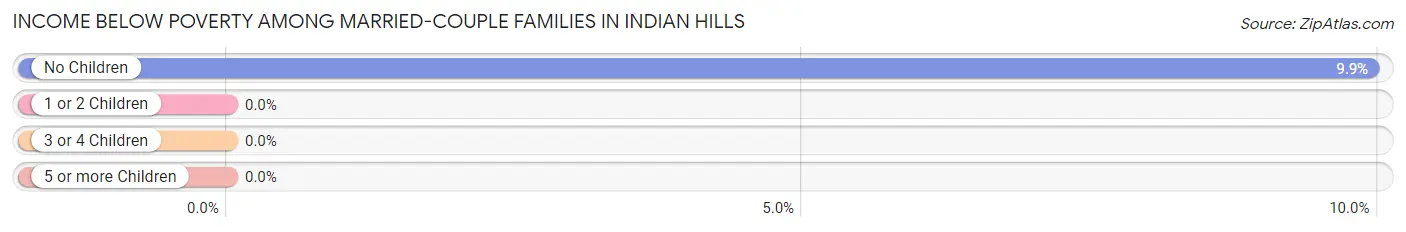
| Children | Above Poverty | Below Poverty |
| No Children | 317 (90.1%) | 35 (9.9%) |
| 1 or 2 Children | 155 (100.0%) | 0 (0.0%) |
| 3 or 4 Children | 35 (100.0%) | 0 (0.0%) |
| 5 or more Children | 0 (0.0%) | 0 (0.0%) |
| Total | 507 (93.5%) | 35 (6.5%) |
Income Below Poverty Among Single-Parent Households in Indian Hills
| Children | Single Father | Single Mother |
| No Children | 0 (0.0%) | 0 (0.0%) |
| 1 or 2 Children | 0 (0.0%) | 0 (0.0%) |
| 3 or 4 Children | 0 (0.0%) | 0 (0.0%) |
| 5 or more Children | 0 (0.0%) | 0 (0.0%) |
| Total | 0 (0.0%) | 0 (0.0%) |
Income Below Poverty Among Married-Couple vs Single-Parent Households in Indian Hills
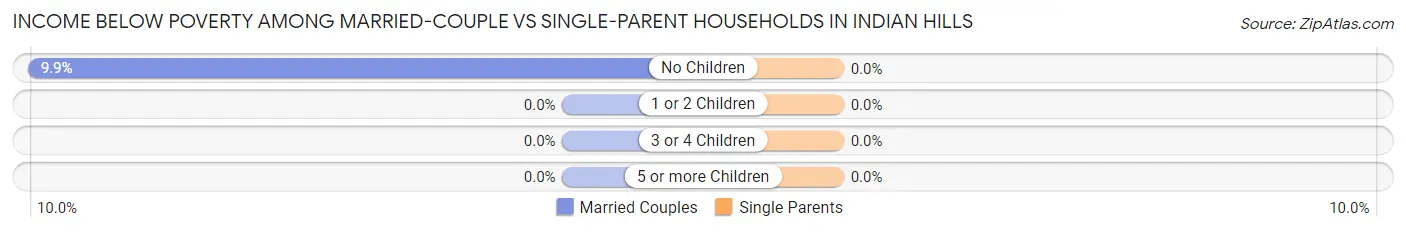
| Children | Married-Couple Families | Single-Parent Households |
| No Children | 35 (9.9%) | 0 (0.0%) |
| 1 or 2 Children | 0 (0.0%) | 0 (0.0%) |
| 3 or 4 Children | 0 (0.0%) | 0 (0.0%) |
| 5 or more Children | 0 (0.0%) | 0 (0.0%) |
| Total | 35 (6.5%) | 0 (0.0%) |
Race in Indian Hills
The most populous races in Indian Hills are White / Caucasian (1,256 | 86.9%), Two or more Races (139 | 9.6%), and Hispanic or Latino (66 | 4.6%).
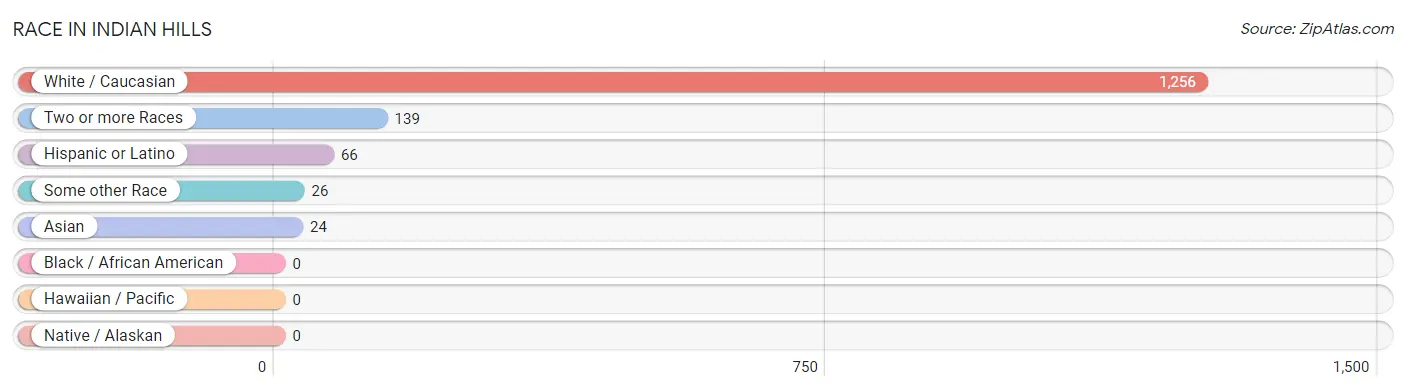
| Race | # Population | % Population |
| Asian | 24 | 1.7% |
| Black / African American | 0 | 0.0% |
| Hawaiian / Pacific | 0 | 0.0% |
| Hispanic or Latino | 66 | 4.6% |
| Native / Alaskan | 0 | 0.0% |
| White / Caucasian | 1,256 | 86.9% |
| Two or more Races | 139 | 9.6% |
| Some other Race | 26 | 1.8% |
| Total | 1,445 | 100.0% |
Ancestry in Indian Hills
The most populous ancestries reported in Indian Hills are German (364 | 25.2%), English (239 | 16.5%), Irish (232 | 16.1%), American (227 | 15.7%), and Scotch-Irish (144 | 10.0%), together accounting for 83.5% of all Indian Hills residents.
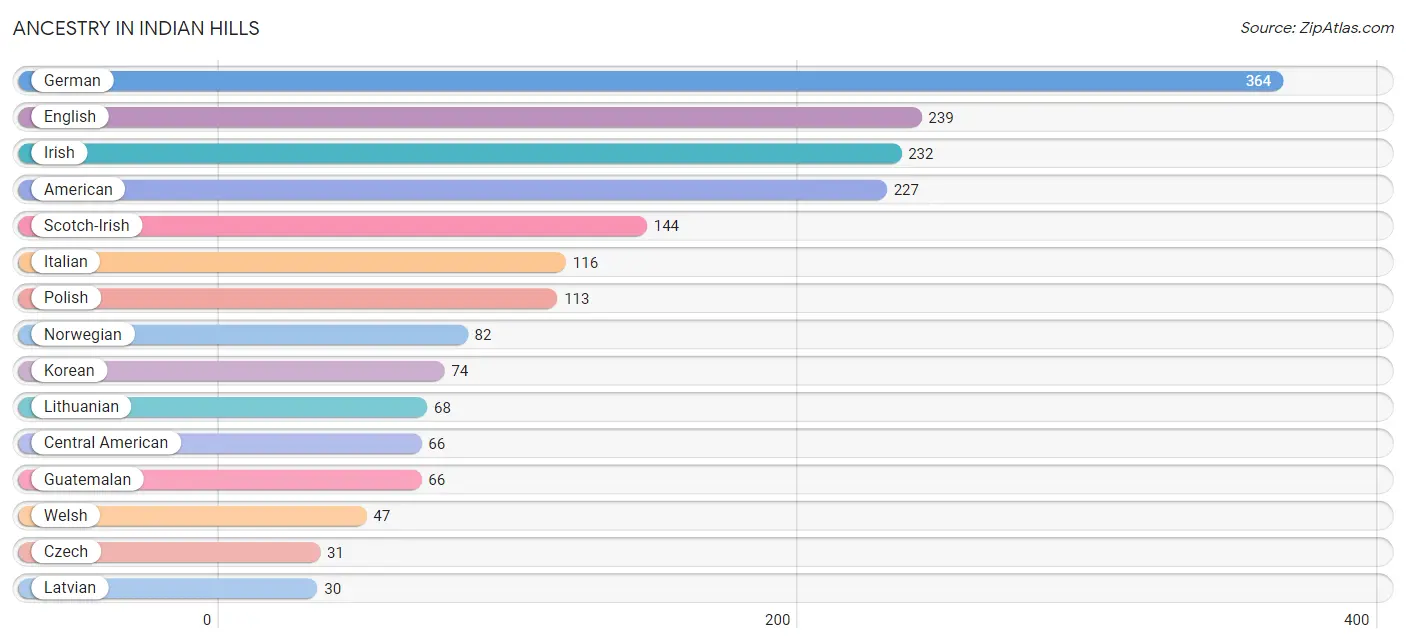
| Ancestry | # Population | % Population |
| American | 227 | 15.7% |
| British | 24 | 1.7% |
| Central American | 66 | 4.6% |
| Czech | 31 | 2.1% |
| English | 239 | 16.5% |
| French | 12 | 0.8% |
| German | 364 | 25.2% |
| Greek | 24 | 1.7% |
| Guatemalan | 66 | 4.6% |
| Irish | 232 | 16.1% |
| Italian | 116 | 8.0% |
| Korean | 74 | 5.1% |
| Latvian | 30 | 2.1% |
| Lithuanian | 68 | 4.7% |
| Norwegian | 82 | 5.7% |
| Pennsylvania German | 30 | 2.1% |
| Polish | 113 | 7.8% |
| Scotch-Irish | 144 | 10.0% |
| Scottish | 23 | 1.6% |
| Tlingit-Haida | 21 | 1.5% |
| Welsh | 47 | 3.3% | View All 21 Rows |
Immigrants in Indian Hills
The most numerous immigrant groups reported in Indian Hills came from Central America (26 | 1.8%), Guatemala (26 | 1.8%), Latin America (26 | 1.8%), Asia (24 | 1.7%), and Philippines (24 | 1.7%), together accounting for 8.7% of all Indian Hills residents.
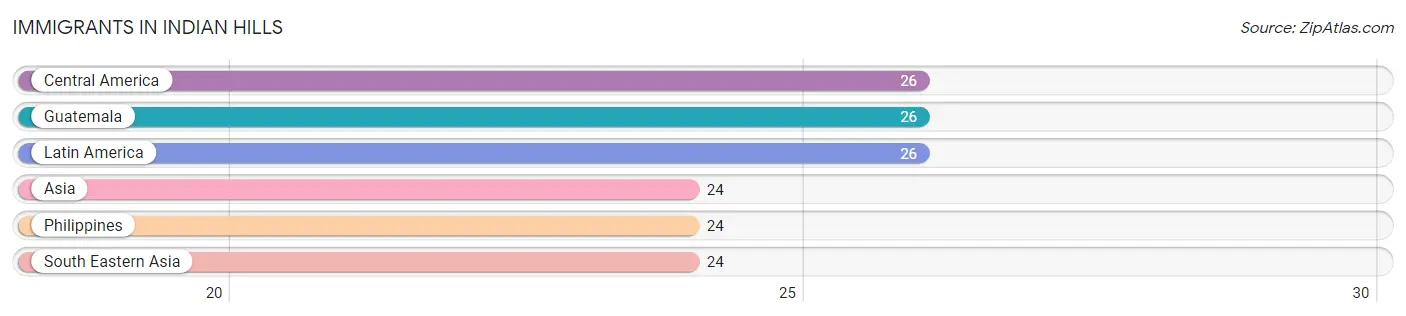
| Immigration Origin | # Population | % Population |
| Asia | 24 | 1.7% |
| Central America | 26 | 1.8% |
| Guatemala | 26 | 1.8% |
| Latin America | 26 | 1.8% |
| Philippines | 24 | 1.7% |
| South Eastern Asia | 24 | 1.7% | View All 6 Rows |
Sex and Age in Indian Hills
Sex and Age in Indian Hills
The most populous age groups in Indian Hills are 45 to 49 Years (168 | 22.6%) for men and 35 to 39 Years (113 | 16.1%) for women.
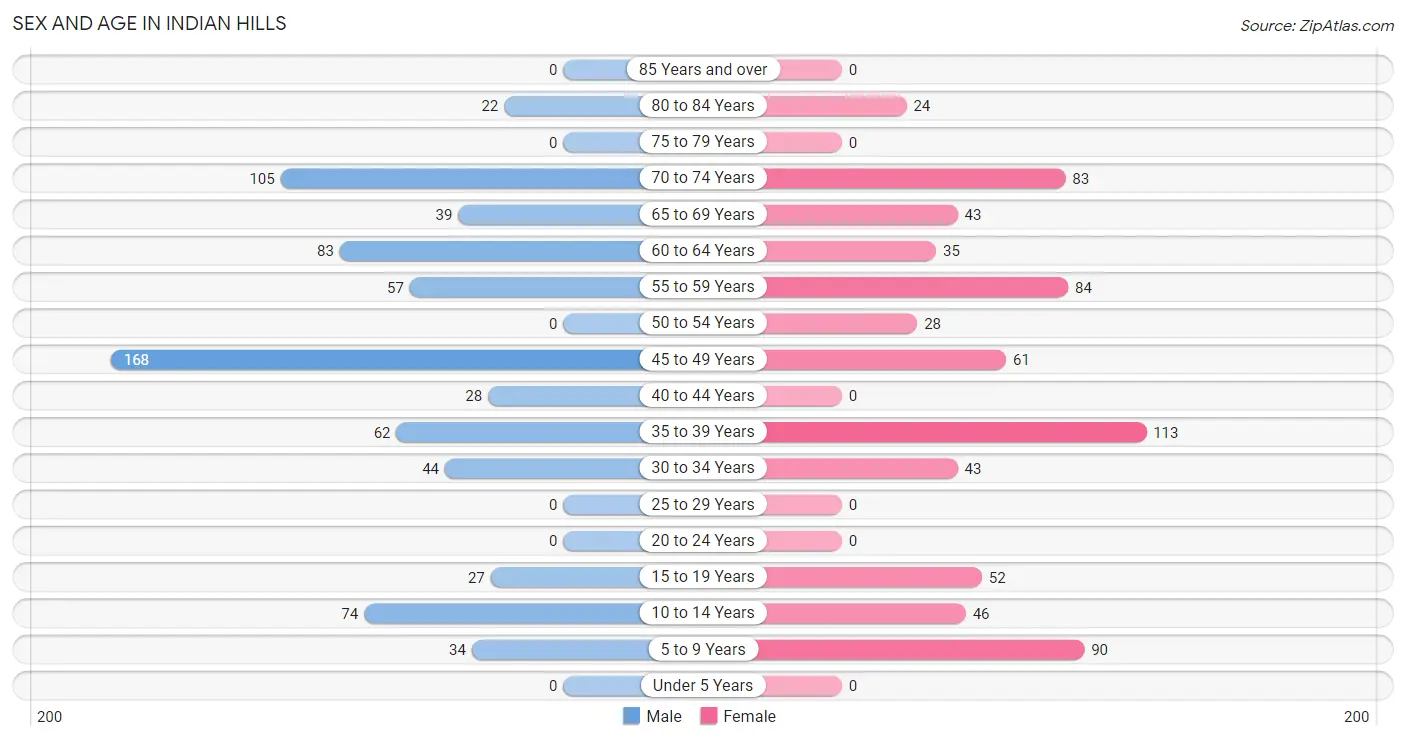
| Age Bracket | Male | Female |
| Under 5 Years | 0 (0.0%) | 0 (0.0%) |
| 5 to 9 Years | 34 (4.6%) | 90 (12.8%) |
| 10 to 14 Years | 74 (10.0%) | 46 (6.6%) |
| 15 to 19 Years | 27 (3.6%) | 52 (7.4%) |
| 20 to 24 Years | 0 (0.0%) | 0 (0.0%) |
| 25 to 29 Years | 0 (0.0%) | 0 (0.0%) |
| 30 to 34 Years | 44 (5.9%) | 43 (6.1%) |
| 35 to 39 Years | 62 (8.3%) | 113 (16.1%) |
| 40 to 44 Years | 28 (3.8%) | 0 (0.0%) |
| 45 to 49 Years | 168 (22.6%) | 61 (8.7%) |
| 50 to 54 Years | 0 (0.0%) | 28 (4.0%) |
| 55 to 59 Years | 57 (7.7%) | 84 (12.0%) |
| 60 to 64 Years | 83 (11.2%) | 35 (5.0%) |
| 65 to 69 Years | 39 (5.2%) | 43 (6.1%) |
| 70 to 74 Years | 105 (14.1%) | 83 (11.8%) |
| 75 to 79 Years | 0 (0.0%) | 0 (0.0%) |
| 80 to 84 Years | 22 (3.0%) | 24 (3.4%) |
| 85 Years and over | 0 (0.0%) | 0 (0.0%) |
| Total | 743 (100.0%) | 702 (100.0%) |
Families and Households in Indian Hills
Median Family Size in Indian Hills
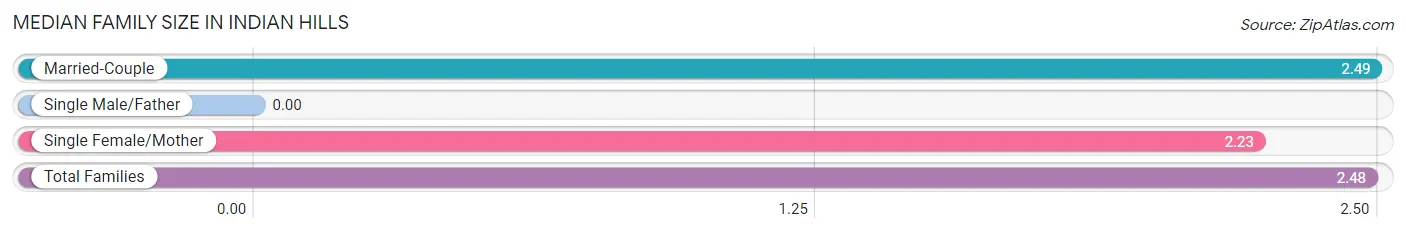
| Family Type | # Families | Family Size |
| Married-Couple | 542 (96.1%) | 2.49 |
| Single Male/Father | 0 (0.0%) | - |
| Single Female/Mother | 22 (3.9%) | 2.23 |
| Total Families | 564 (100.0%) | 2.48 |
Median Household Size in Indian Hills
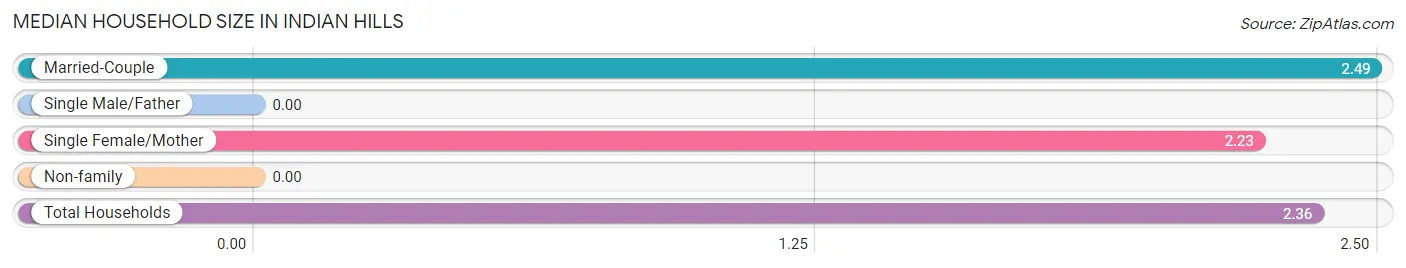
| Household Type | # Households | Household Size |
| Married-Couple | 542 (88.6%) | 2.49 |
| Single Male/Father | 0 (0.0%) | - |
| Single Female/Mother | 22 (3.6%) | 2.23 |
| Non-family | 48 (7.8%) | - |
| Total Households | 612 (100.0%) | 2.36 |
Household Size by Marriage Status in Indian Hills
Out of a total of 612 households in Indian Hills, 564 (92.2%) are family households, while 48 (7.8%) are nonfamily households. The most numerous type of family households are 2-person households, comprising 326, and the most common type of nonfamily households are 1-person households, comprising 48.
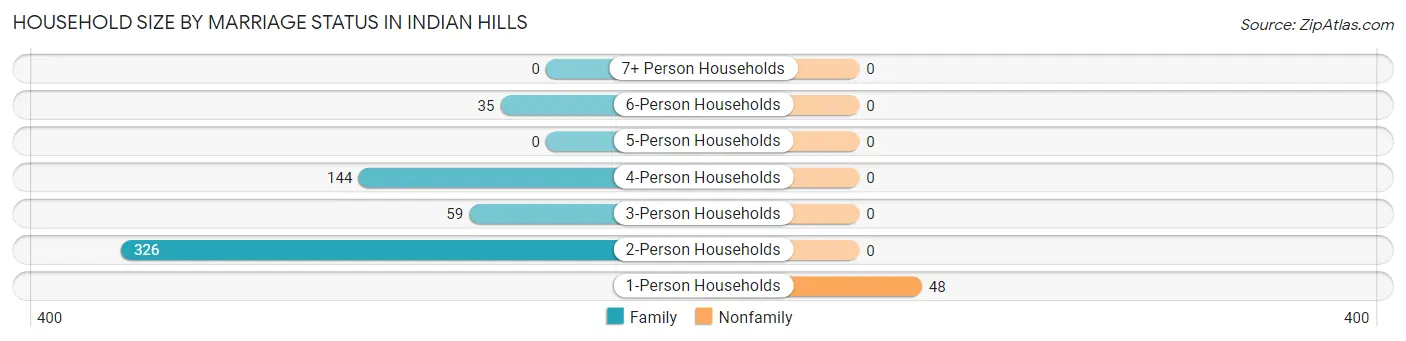
| Household Size | Family Households | Nonfamily Households |
| 1-Person Households | - | 48 (7.8%) |
| 2-Person Households | 326 (53.3%) | 0 (0.0%) |
| 3-Person Households | 59 (9.6%) | 0 (0.0%) |
| 4-Person Households | 144 (23.5%) | 0 (0.0%) |
| 5-Person Households | 0 (0.0%) | 0 (0.0%) |
| 6-Person Households | 35 (5.7%) | 0 (0.0%) |
| 7+ Person Households | 0 (0.0%) | 0 (0.0%) |
| Total | 564 (92.2%) | 48 (7.8%) |
Female Fertility in Indian Hills
Fertility by Age in Indian Hills
| Age Bracket | Women with Births | Births / 1,000 Women |
| 15 to 19 years | 0 (0.0%) | 0.0 |
| 20 to 34 years | 0 (0.0%) | 0.0 |
| 35 to 50 years | 0 (0.0%) | 0.0 |
| Total | 0 (0.0%) | 0.0 |
Fertility by Age by Marriage Status in Indian Hills
| Age Bracket | Married | Unmarried |
| 15 to 19 years | 0 (0.0%) | 0 (0.0%) |
| 20 to 34 years | 0 (0.0%) | 0 (0.0%) |
| 35 to 50 years | 0 (0.0%) | 0 (0.0%) |
| Total | 0 (0.0%) | 0 (0.0%) |
Fertility by Education in Indian Hills
| Educational Attainment | Women with Births | Births / 1,000 Women |
| Less than High School | 0 (0.0%) | 0.0 |
| High School Diploma | 0 (0.0%) | 0.0 |
| College or Associate's Degree | 0 (0.0%) | 0.0 |
| Bachelor's Degree | 0 (0.0%) | 0.0 |
| Graduate Degree | 0 (0.0%) | 0.0 |
| Total | 0 (0.0%) | 0.0 |
Fertility by Education by Marriage Status in Indian Hills
| Educational Attainment | Married | Unmarried |
| Less than High School | 0 (0.0%) | 0 (0.0%) |
| High School Diploma | 0 (0.0%) | 0 (0.0%) |
| College or Associate's Degree | 0 (0.0%) | 0 (0.0%) |
| Bachelor's Degree | 0 (0.0%) | 0 (0.0%) |
| Graduate Degree | 0 (0.0%) | 0 (0.0%) |
| Total | 0 (0.0%) | 0 (0.0%) |
Employment Characteristics in Indian Hills
Employment by Class of Employer in Indian Hills
Among the 773 employed individuals in Indian Hills, private company employees (427 | 55.2%), local government employees (145 | 18.8%), and self-employed (not incorporated) (76 | 9.8%) make up the most common classes of employment.
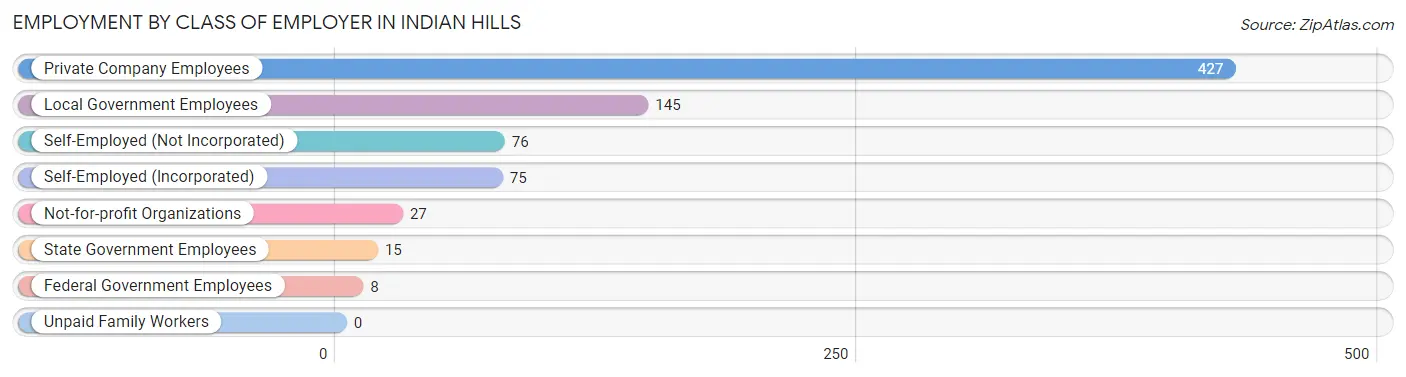
| Employer Class | # Employees | % Employees |
| Private Company Employees | 427 | 55.2% |
| Self-Employed (Incorporated) | 75 | 9.7% |
| Self-Employed (Not Incorporated) | 76 | 9.8% |
| Not-for-profit Organizations | 27 | 3.5% |
| Local Government Employees | 145 | 18.8% |
| State Government Employees | 15 | 1.9% |
| Federal Government Employees | 8 | 1.0% |
| Unpaid Family Workers | 0 | 0.0% |
| Total | 773 | 100.0% |
Employment Status by Age in Indian Hills
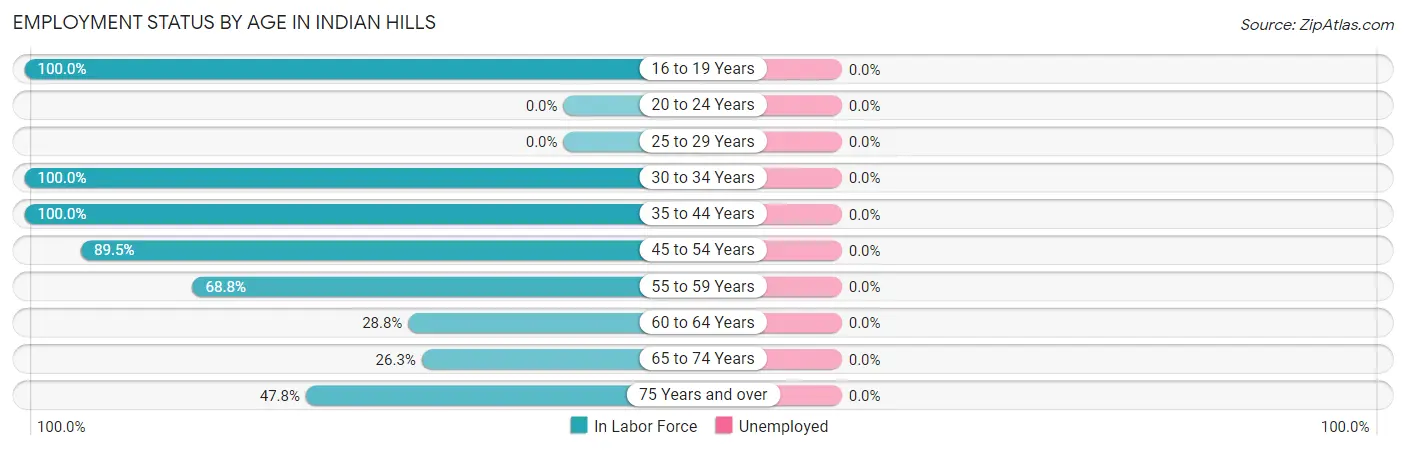
| Age Bracket | In Labor Force | Unemployed |
| 16 to 19 Years | 56 (100.0%) | 0 (0.0%) |
| 20 to 24 Years | 0 (0.0%) | 0 (0.0%) |
| 25 to 29 Years | 0 (0.0%) | 0 (0.0%) |
| 30 to 34 Years | 87 (100.0%) | 0 (0.0%) |
| 35 to 44 Years | 203 (100.0%) | 0 (0.0%) |
| 45 to 54 Years | 230 (89.5%) | 0 (0.0%) |
| 55 to 59 Years | 97 (68.8%) | 0 (0.0%) |
| 60 to 64 Years | 34 (28.8%) | 0 (0.0%) |
| 65 to 74 Years | 71 (26.3%) | 0 (0.0%) |
| 75 Years and over | 22 (47.8%) | 0 (0.0%) |
| Total | 800 (67.9%) | 0 (0.0%) |
Employment Status by Educational Attainment in Indian Hills
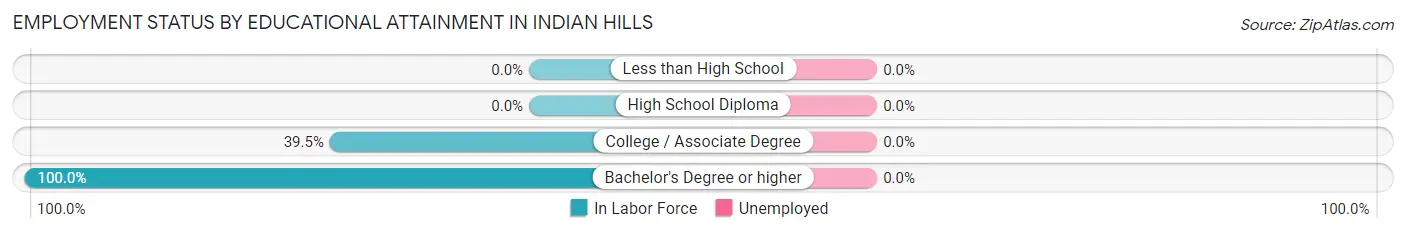
| Educational Attainment | In Labor Force | Unemployed |
| Less than High School | 0 (0.0%) | 0 (0.0%) |
| High School Diploma | 0 (0.0%) | 0 (0.0%) |
| College / Associate Degree | 101 (39.5%) | 0 (0.0%) |
| Bachelor's Degree or higher | 550 (100.0%) | 0 (0.0%) |
| Total | 651 (80.8%) | 0 (0.0%) |
Employment Occupations by Sex in Indian Hills
Management, Business, Science and Arts Occupations
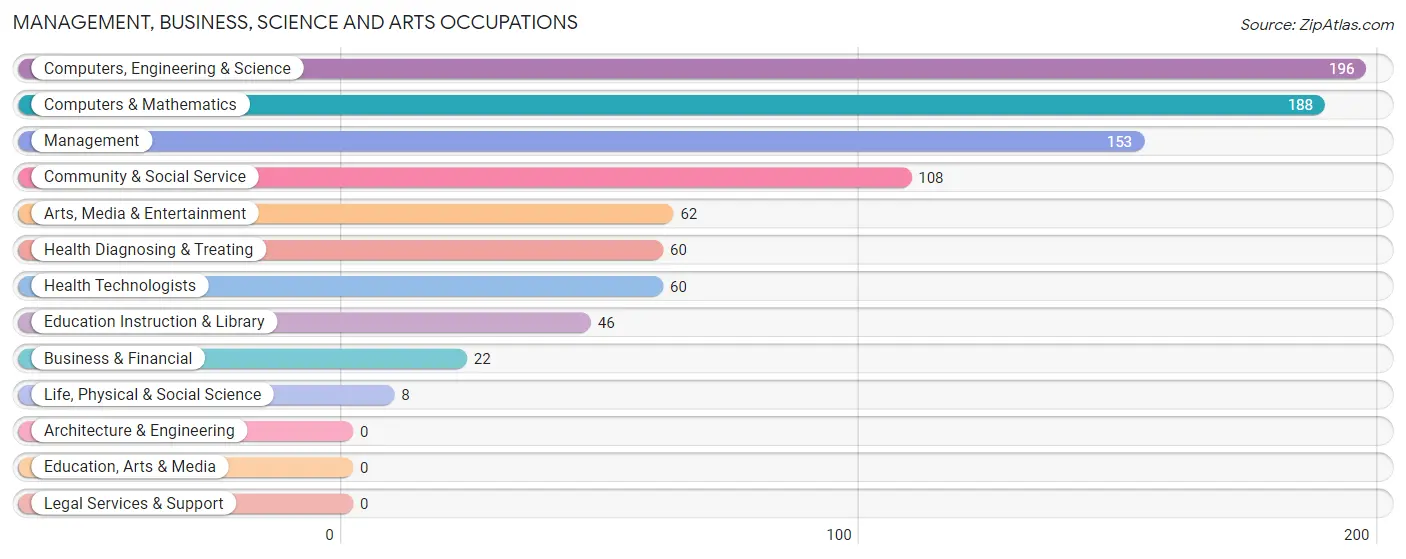
The most common Management, Business, Science and Arts occupations in Indian Hills are Computers, Engineering & Science (196 | 24.5%), Computers & Mathematics (188 | 23.5%), Management (153 | 19.1%), Community & Social Service (108 | 13.5%), and Arts, Media & Entertainment (62 | 7.7%).
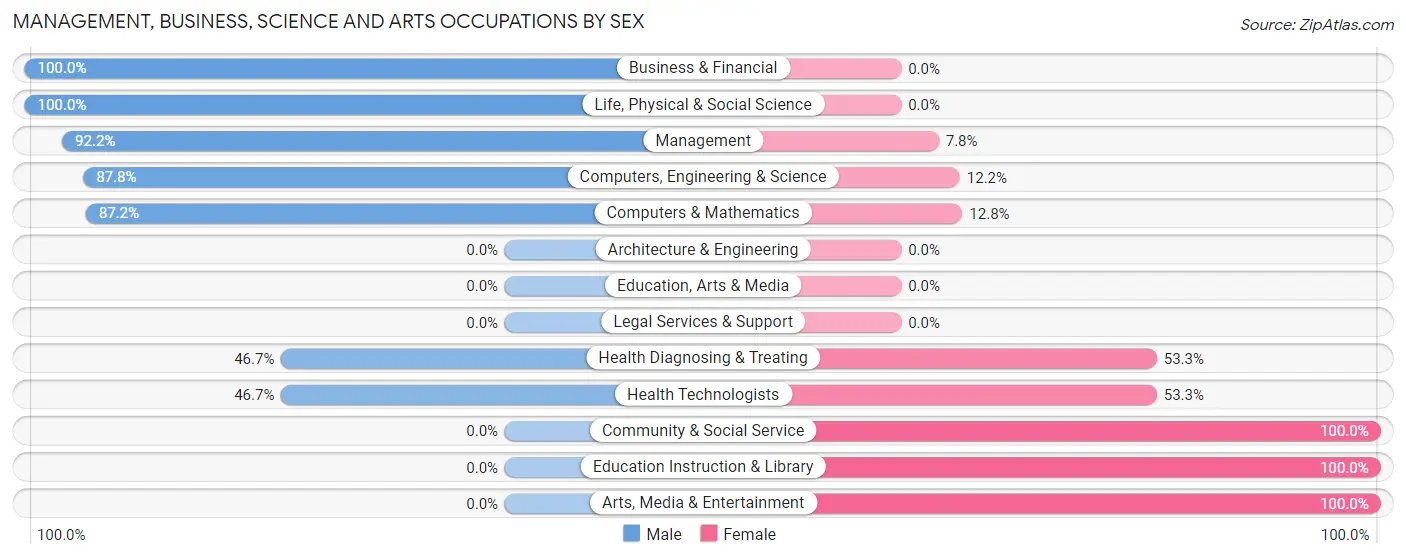
Management, Business, Science and Arts Occupations by Sex
Within the Management, Business, Science and Arts occupations in Indian Hills, the most male-oriented occupations are Business & Financial (100.0%), Life, Physical & Social Science (100.0%), and Management (92.2%), while the most female-oriented occupations are Community & Social Service (100.0%), Education Instruction & Library (100.0%), and Arts, Media & Entertainment (100.0%).
| Occupation | Male | Female |
| Management | 141 (92.2%) | 12 (7.8%) |
| Business & Financial | 22 (100.0%) | 0 (0.0%) |
| Computers, Engineering & Science | 172 (87.8%) | 24 (12.2%) |
| Computers & Mathematics | 164 (87.2%) | 24 (12.8%) |
| Architecture & Engineering | 0 (0.0%) | 0 (0.0%) |
| Life, Physical & Social Science | 8 (100.0%) | 0 (0.0%) |
| Community & Social Service | 0 (0.0%) | 108 (100.0%) |
| Education, Arts & Media | 0 (0.0%) | 0 (0.0%) |
| Legal Services & Support | 0 (0.0%) | 0 (0.0%) |
| Education Instruction & Library | 0 (0.0%) | 46 (100.0%) |
| Arts, Media & Entertainment | 0 (0.0%) | 62 (100.0%) |
| Health Diagnosing & Treating | 28 (46.7%) | 32 (53.3%) |
| Health Technologists | 28 (46.7%) | 32 (53.3%) |
| Total (Category) | 363 (67.3%) | 176 (32.7%) |
| Total (Overall) | 486 (60.8%) | 314 (39.3%) |
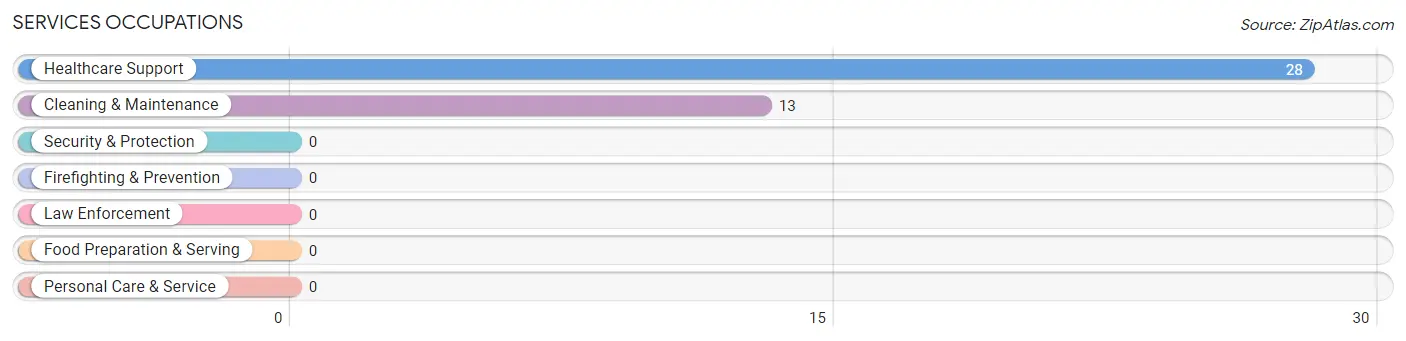
Services Occupations
The most common Services occupations in Indian Hills are Healthcare Support (28 | 3.5%), and Cleaning & Maintenance (13 | 1.6%).
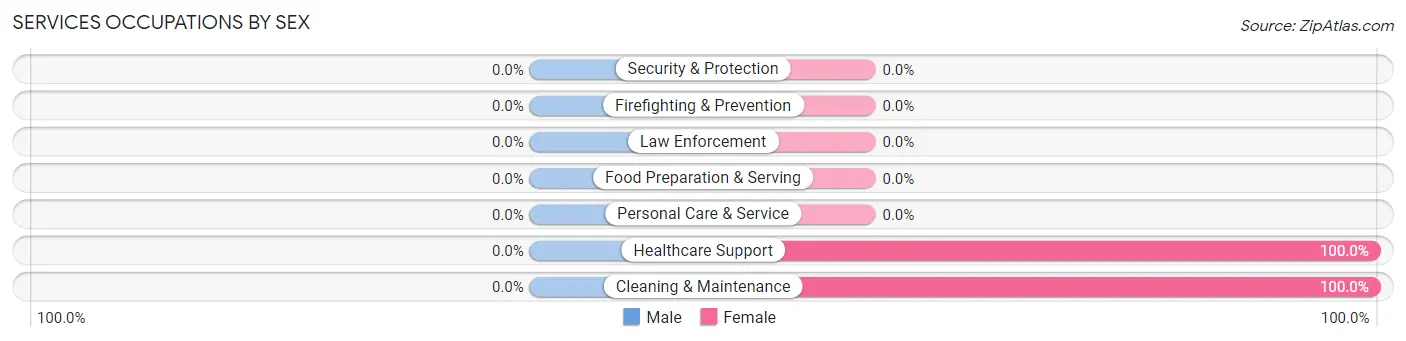
Services Occupations by Sex
| Occupation | Male | Female |
| Healthcare Support | 0 (0.0%) | 28 (100.0%) |
| Security & Protection | 0 (0.0%) | 0 (0.0%) |
| Firefighting & Prevention | 0 (0.0%) | 0 (0.0%) |
| Law Enforcement | 0 (0.0%) | 0 (0.0%) |
| Food Preparation & Serving | 0 (0.0%) | 0 (0.0%) |
| Cleaning & Maintenance | 0 (0.0%) | 13 (100.0%) |
| Personal Care & Service | 0 (0.0%) | 0 (0.0%) |
| Total (Category) | 0 (0.0%) | 41 (100.0%) |
| Total (Overall) | 486 (60.8%) | 314 (39.3%) |
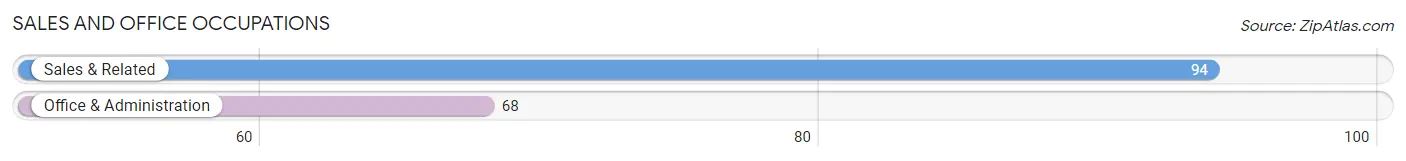
Sales and Office Occupations
The most common Sales and Office occupations in Indian Hills are Sales & Related (94 | 11.7%), and Office & Administration (68 | 8.5%).
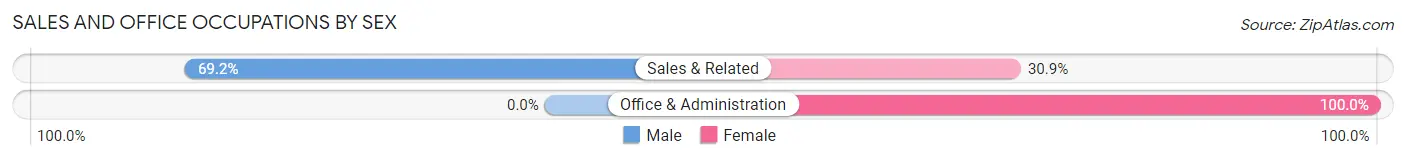
Sales and Office Occupations by Sex
| Occupation | Male | Female |
| Sales & Related | 65 (69.2%) | 29 (30.8%) |
| Office & Administration | 0 (0.0%) | 68 (100.0%) |
| Total (Category) | 65 (40.1%) | 97 (59.9%) |
| Total (Overall) | 486 (60.8%) | 314 (39.3%) |
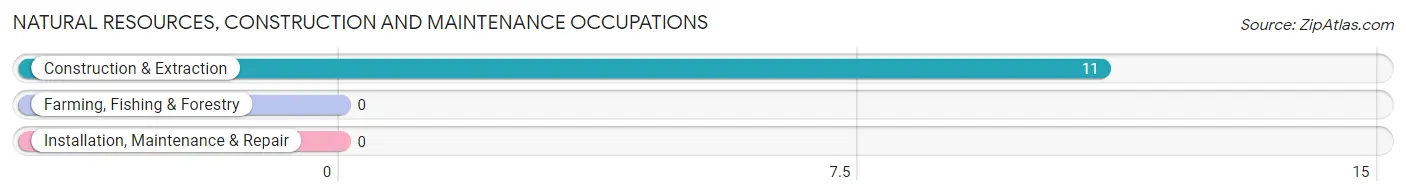
Natural Resources, Construction and Maintenance Occupations
The most common Natural Resources, Construction and Maintenance occupations in Indian Hills are , and Construction & Extraction (11 | 1.4%).
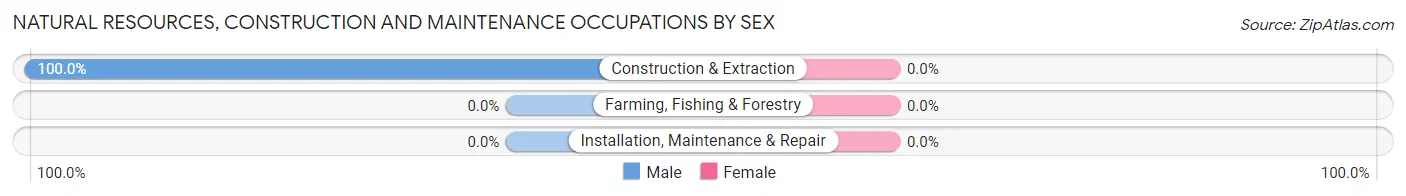
Natural Resources, Construction and Maintenance Occupations by Sex
| Occupation | Male | Female |
| Farming, Fishing & Forestry | 0 (0.0%) | 0 (0.0%) |
| Construction & Extraction | 11 (100.0%) | 0 (0.0%) |
| Installation, Maintenance & Repair | 0 (0.0%) | 0 (0.0%) |
| Total (Category) | 11 (100.0%) | 0 (0.0%) |
| Total (Overall) | 486 (60.8%) | 314 (39.3%) |
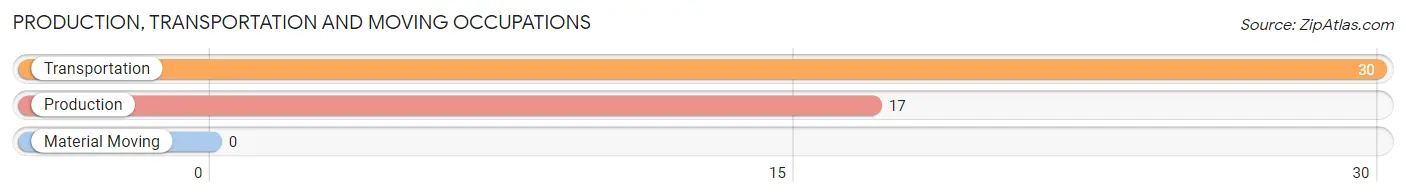
Production, Transportation and Moving Occupations
The most common Production, Transportation and Moving occupations in Indian Hills are Transportation (30 | 3.7%), and Production (17 | 2.1%).
Production, Transportation and Moving Occupations by Sex
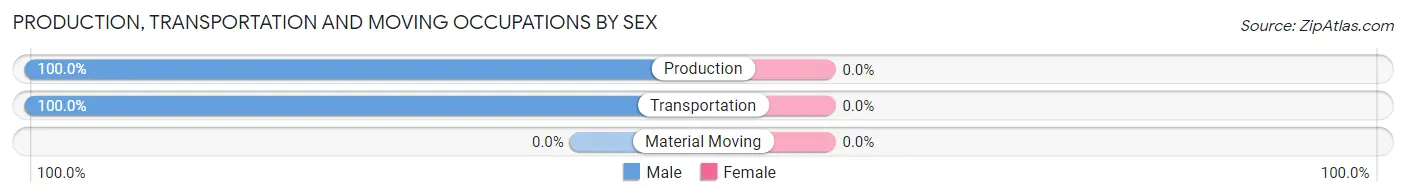
| Occupation | Male | Female |
| Production | 17 (100.0%) | 0 (0.0%) |
| Transportation | 30 (100.0%) | 0 (0.0%) |
| Material Moving | 0 (0.0%) | 0 (0.0%) |
| Total (Category) | 47 (100.0%) | 0 (0.0%) |
| Total (Overall) | 486 (60.8%) | 314 (39.3%) |
Employment Industries by Sex in Indian Hills
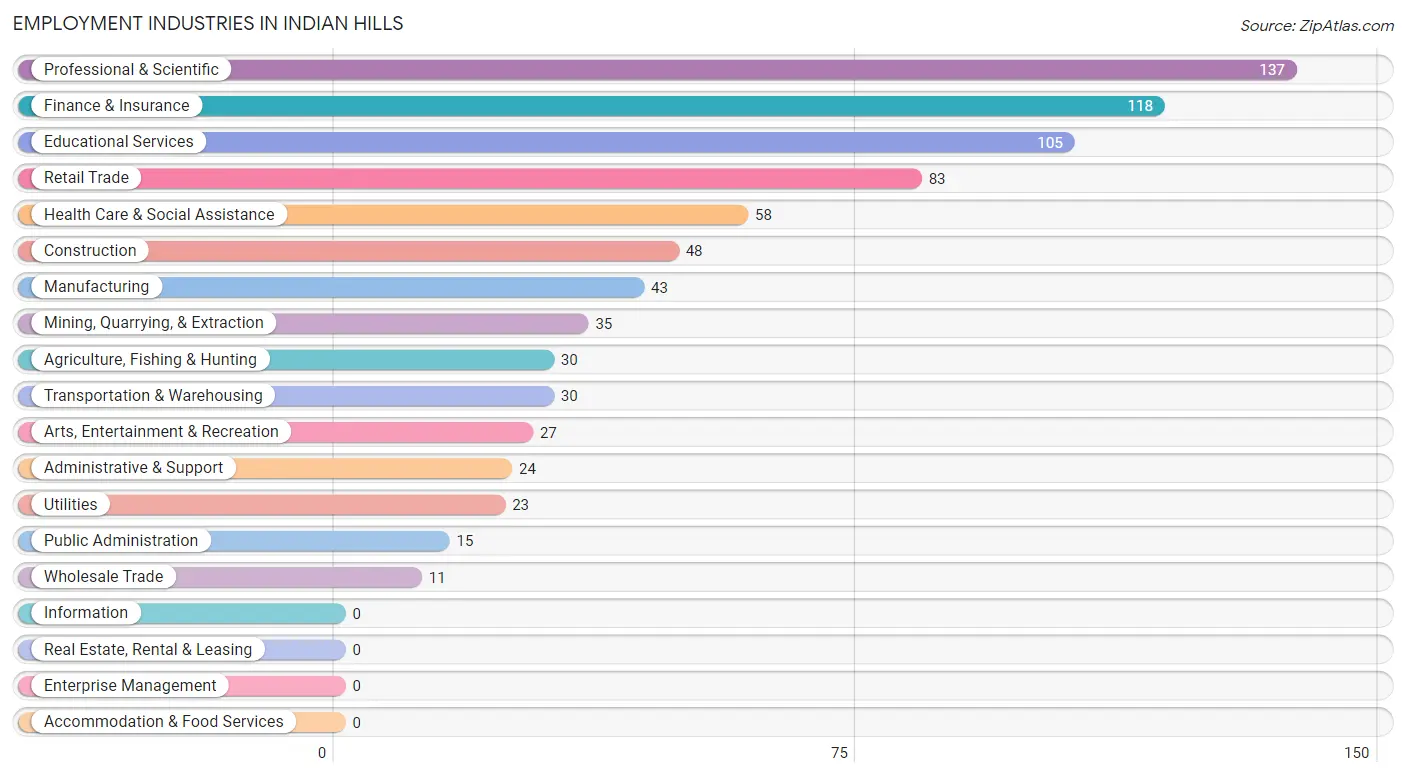
Employment Industries in Indian Hills
The major employment industries in Indian Hills include Professional & Scientific (137 | 17.1%), Finance & Insurance (118 | 14.7%), Educational Services (105 | 13.1%), Retail Trade (83 | 10.4%), and Health Care & Social Assistance (58 | 7.2%).
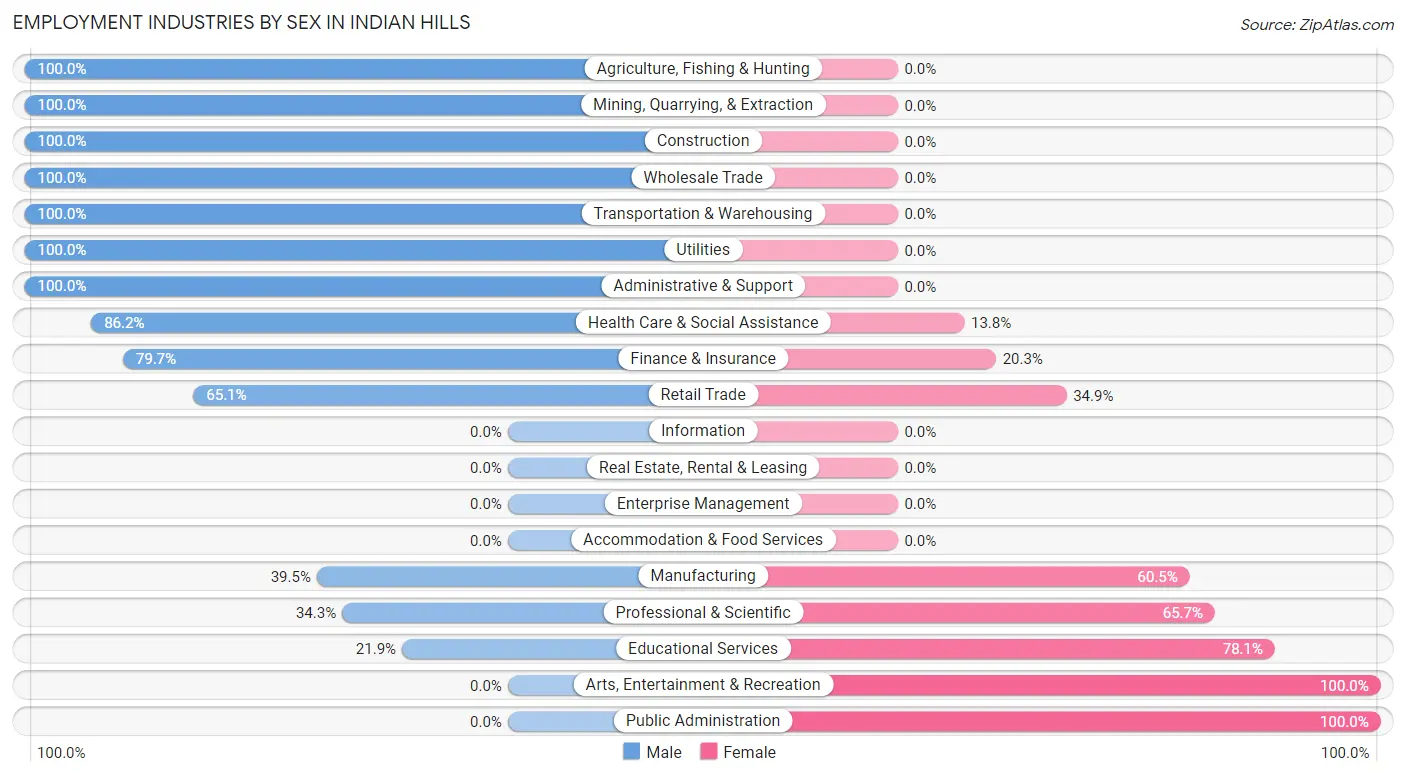
Employment Industries by Sex in Indian Hills
The Indian Hills industries that see more men than women are Agriculture, Fishing & Hunting (100.0%), Mining, Quarrying, & Extraction (100.0%), and Construction (100.0%), whereas the industries that tend to have a higher number of women are Arts, Entertainment & Recreation (100.0%), Public Administration (100.0%), and Educational Services (78.1%).
| Industry | Male | Female |
| Agriculture, Fishing & Hunting | 30 (100.0%) | 0 (0.0%) |
| Mining, Quarrying, & Extraction | 35 (100.0%) | 0 (0.0%) |
| Construction | 48 (100.0%) | 0 (0.0%) |
| Manufacturing | 17 (39.5%) | 26 (60.5%) |
| Wholesale Trade | 11 (100.0%) | 0 (0.0%) |
| Retail Trade | 54 (65.1%) | 29 (34.9%) |
| Transportation & Warehousing | 30 (100.0%) | 0 (0.0%) |
| Utilities | 23 (100.0%) | 0 (0.0%) |
| Information | 0 (0.0%) | 0 (0.0%) |
| Finance & Insurance | 94 (79.7%) | 24 (20.3%) |
| Real Estate, Rental & Leasing | 0 (0.0%) | 0 (0.0%) |
| Professional & Scientific | 47 (34.3%) | 90 (65.7%) |
| Enterprise Management | 0 (0.0%) | 0 (0.0%) |
| Administrative & Support | 24 (100.0%) | 0 (0.0%) |
| Educational Services | 23 (21.9%) | 82 (78.1%) |
| Health Care & Social Assistance | 50 (86.2%) | 8 (13.8%) |
| Arts, Entertainment & Recreation | 0 (0.0%) | 27 (100.0%) |
| Accommodation & Food Services | 0 (0.0%) | 0 (0.0%) |
| Public Administration | 0 (0.0%) | 15 (100.0%) |
| Total | 486 (60.8%) | 314 (39.3%) |
Education in Indian Hills
School Enrollment in Indian Hills
The most common levels of schooling among the 323 students in Indian Hills are elementary school (151 | 46.8%), middle school (66 | 20.4%), and high school (50 | 15.5%).
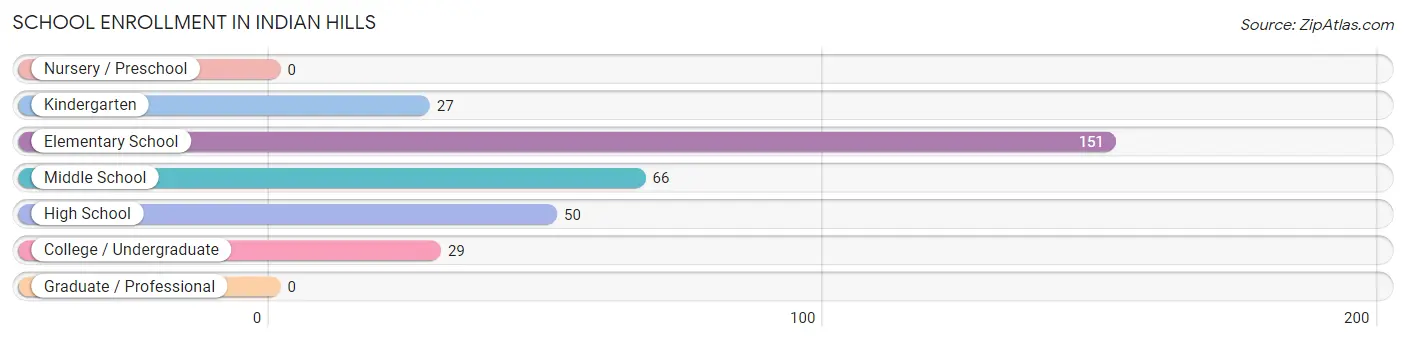
| School Level | # Students | % Students |
| Nursery / Preschool | 0 | 0.0% |
| Kindergarten | 27 | 8.4% |
| Elementary School | 151 | 46.8% |
| Middle School | 66 | 20.4% |
| High School | 50 | 15.5% |
| College / Undergraduate | 29 | 9.0% |
| Graduate / Professional | 0 | 0.0% |
| Total | 323 | 100.0% |
School Enrollment by Age by Funding Source in Indian Hills
Out of a total of 323 students who are enrolled in schools in Indian Hills, 137 (42.4%) attend a private institution, while the remaining 186 (57.6%) are enrolled in public schools. The age group of 10 to 14 year olds has the highest likelihood of being enrolled in private schools, with 68 (56.7% in the age bracket) enrolled. Conversely, the age group of 15 to 17 year olds has the lowest likelihood of being enrolled in a private school, with 50 (100.0% in the age bracket) attending a public institution.
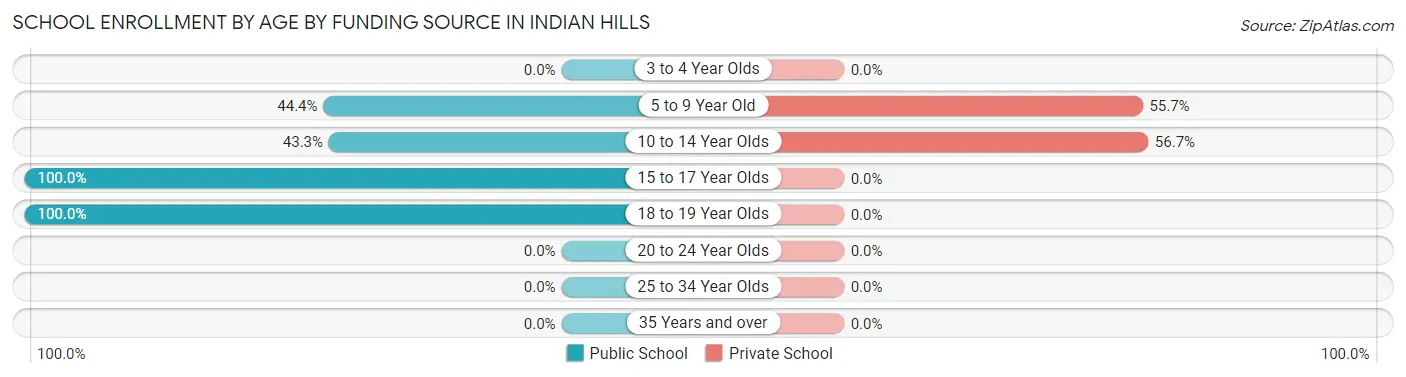
| Age Bracket | Public School | Private School |
| 3 to 4 Year Olds | 0 (0.0%) | 0 (0.0%) |
| 5 to 9 Year Old | 55 (44.4%) | 69 (55.6%) |
| 10 to 14 Year Olds | 52 (43.3%) | 68 (56.7%) |
| 15 to 17 Year Olds | 50 (100.0%) | 0 (0.0%) |
| 18 to 19 Year Olds | 29 (100.0%) | 0 (0.0%) |
| 20 to 24 Year Olds | 0 (0.0%) | 0 (0.0%) |
| 25 to 34 Year Olds | 0 (0.0%) | 0 (0.0%) |
| 35 Years and over | 0 (0.0%) | 0 (0.0%) |
| Total | 186 (57.6%) | 137 (42.4%) |
Educational Attainment by Field of Study in Indian Hills
Engineering (200 | 28.3%), education (118 | 16.7%), social sciences (87 | 12.3%), bio, nature & agricultural (71 | 10.0%), and visual & performing arts (52 | 7.4%) are the most common fields of study among 707 individuals in Indian Hills who have obtained a bachelor's degree or higher.
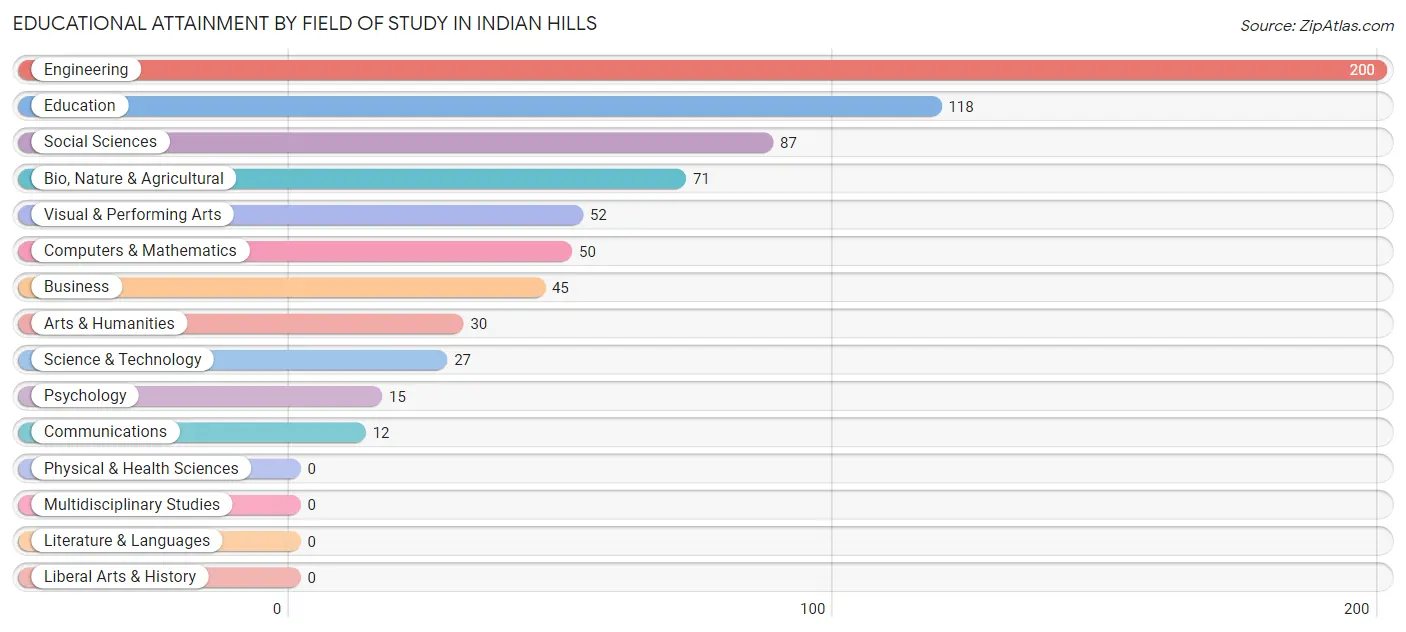
| Field of Study | # Graduates | % Graduates |
| Computers & Mathematics | 50 | 7.1% |
| Bio, Nature & Agricultural | 71 | 10.0% |
| Physical & Health Sciences | 0 | 0.0% |
| Psychology | 15 | 2.1% |
| Social Sciences | 87 | 12.3% |
| Engineering | 200 | 28.3% |
| Multidisciplinary Studies | 0 | 0.0% |
| Science & Technology | 27 | 3.8% |
| Business | 45 | 6.4% |
| Education | 118 | 16.7% |
| Literature & Languages | 0 | 0.0% |
| Liberal Arts & History | 0 | 0.0% |
| Visual & Performing Arts | 52 | 7.4% |
| Communications | 12 | 1.7% |
| Arts & Humanities | 30 | 4.2% |
| Total | 707 | 100.0% |
Transportation & Commute in Indian Hills
Vehicle Availability by Sex in Indian Hills
The most prevalent vehicle ownership categories in Indian Hills are males with 3 vehicles (254, accounting for 55.3%) and females with 3 vehicles (127, making up 80.9%).
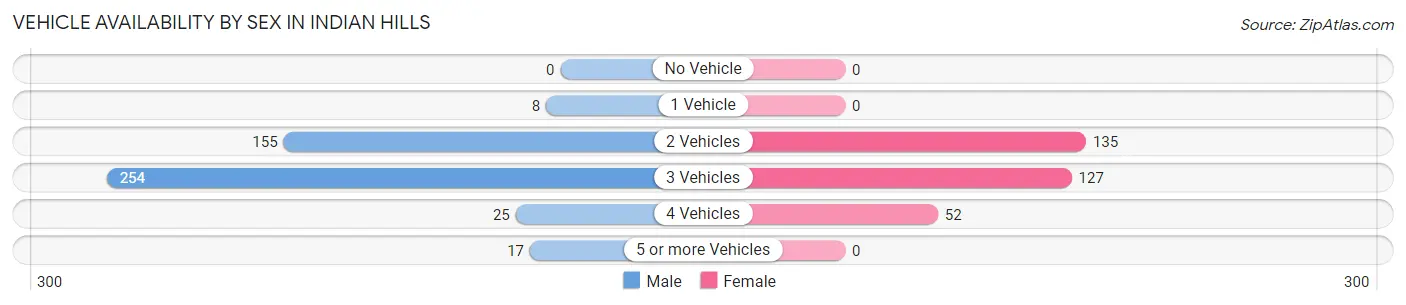
| Vehicles Available | Male | Female |
| No Vehicle | 0 (0.0%) | 0 (0.0%) |
| 1 Vehicle | 8 (1.7%) | 0 (0.0%) |
| 2 Vehicles | 155 (33.8%) | 135 (43.0%) |
| 3 Vehicles | 254 (55.3%) | 127 (40.5%) |
| 4 Vehicles | 25 (5.4%) | 52 (16.6%) |
| 5 or more Vehicles | 17 (3.7%) | 0 (0.0%) |
| Total | 459 (100.0%) | 314 (100.0%) |
Commute Time in Indian Hills
The most frequently occuring commute durations in Indian Hills are 20 to 24 minutes (103 commuters, 25.6%), 30 to 34 minutes (85 commuters, 21.1%), and 15 to 19 minutes (78 commuters, 19.4%).
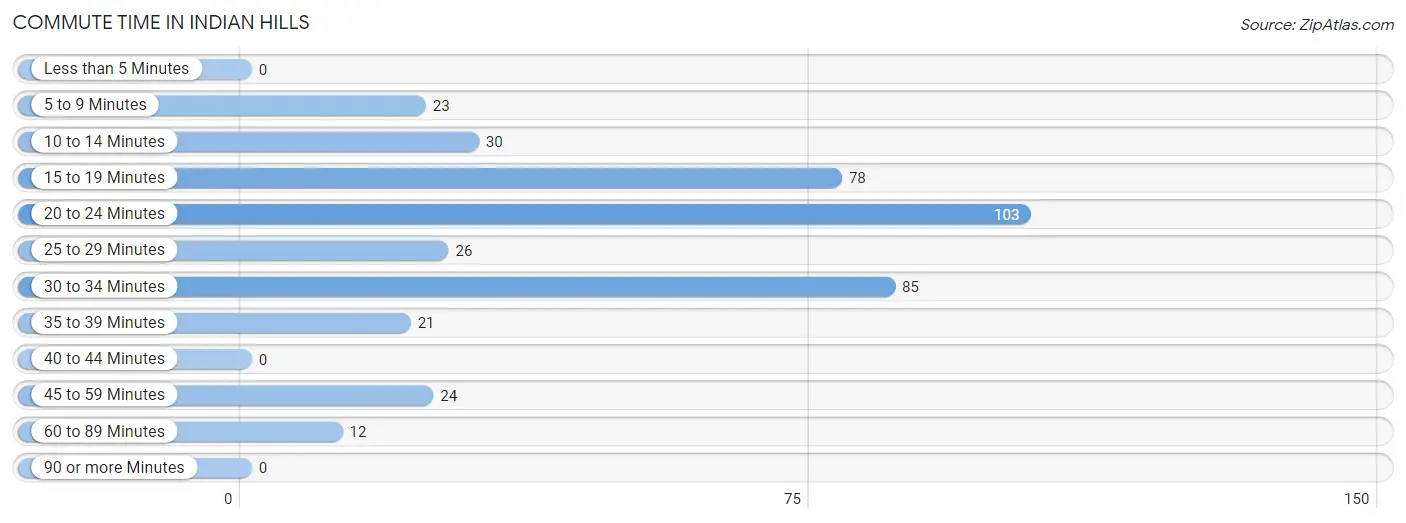
| Commute Time | # Commuters | % Commuters |
| Less than 5 Minutes | 0 | 0.0% |
| 5 to 9 Minutes | 23 | 5.7% |
| 10 to 14 Minutes | 30 | 7.5% |
| 15 to 19 Minutes | 78 | 19.4% |
| 20 to 24 Minutes | 103 | 25.6% |
| 25 to 29 Minutes | 26 | 6.5% |
| 30 to 34 Minutes | 85 | 21.1% |
| 35 to 39 Minutes | 21 | 5.2% |
| 40 to 44 Minutes | 0 | 0.0% |
| 45 to 59 Minutes | 24 | 6.0% |
| 60 to 89 Minutes | 12 | 3.0% |
| 90 or more Minutes | 0 | 0.0% |
Commute Time by Sex in Indian Hills
The most common commute times in Indian Hills are 15 to 19 minutes (78 commuters, 33.1%) for males and 30 to 34 minutes (68 commuters, 41.0%) for females.
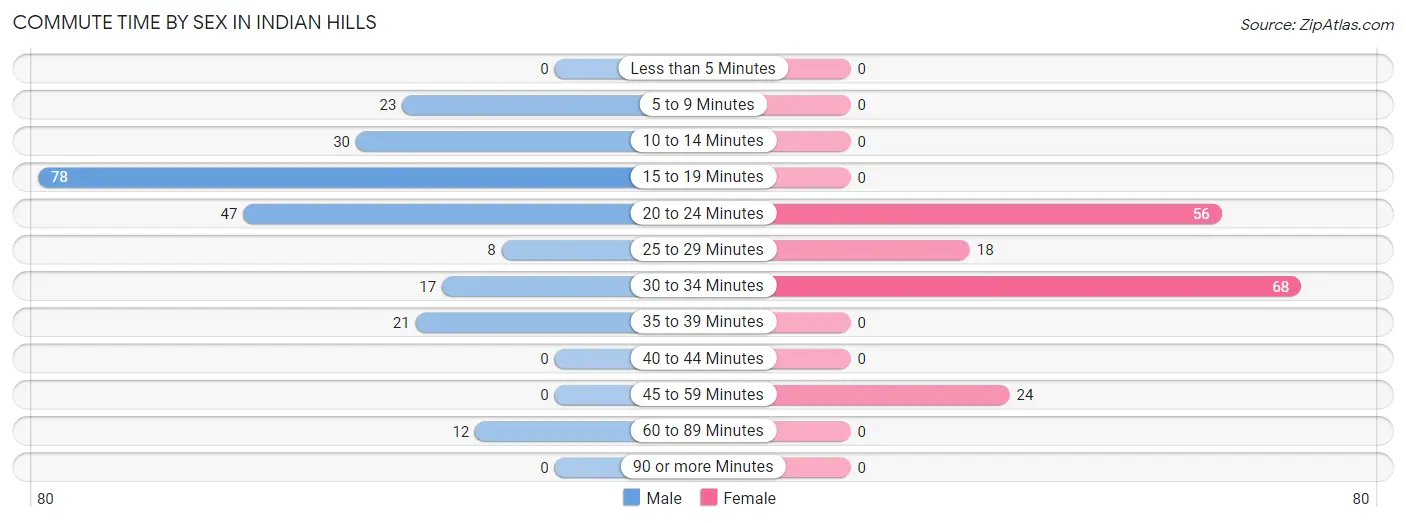
| Commute Time | Male | Female |
| Less than 5 Minutes | 0 (0.0%) | 0 (0.0%) |
| 5 to 9 Minutes | 23 (9.8%) | 0 (0.0%) |
| 10 to 14 Minutes | 30 (12.7%) | 0 (0.0%) |
| 15 to 19 Minutes | 78 (33.1%) | 0 (0.0%) |
| 20 to 24 Minutes | 47 (19.9%) | 56 (33.7%) |
| 25 to 29 Minutes | 8 (3.4%) | 18 (10.8%) |
| 30 to 34 Minutes | 17 (7.2%) | 68 (41.0%) |
| 35 to 39 Minutes | 21 (8.9%) | 0 (0.0%) |
| 40 to 44 Minutes | 0 (0.0%) | 0 (0.0%) |
| 45 to 59 Minutes | 0 (0.0%) | 24 (14.5%) |
| 60 to 89 Minutes | 12 (5.1%) | 0 (0.0%) |
| 90 or more Minutes | 0 (0.0%) | 0 (0.0%) |
Time of Departure to Work by Sex in Indian Hills
The most frequent times of departure to work in Indian Hills are 8:00 AM to 8:29 AM (77, 32.6%) for males and 7:30 AM to 7:59 AM (89, 53.6%) for females.
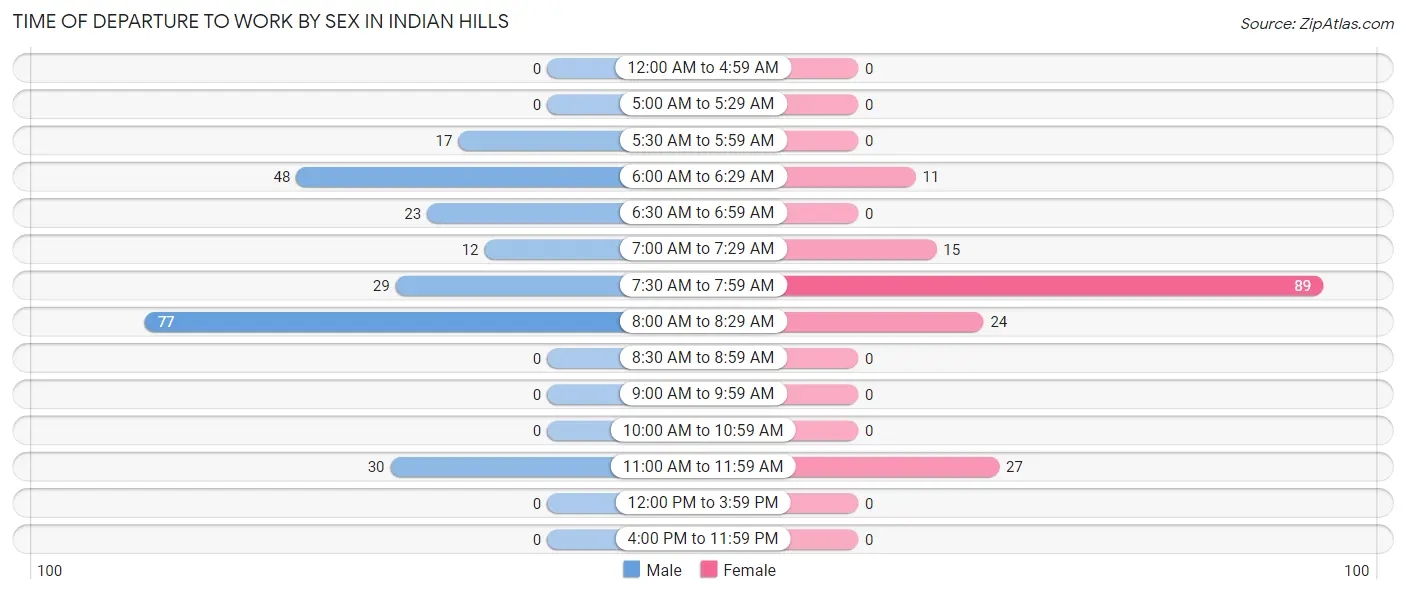
| Time of Departure | Male | Female |
| 12:00 AM to 4:59 AM | 0 (0.0%) | 0 (0.0%) |
| 5:00 AM to 5:29 AM | 0 (0.0%) | 0 (0.0%) |
| 5:30 AM to 5:59 AM | 17 (7.2%) | 0 (0.0%) |
| 6:00 AM to 6:29 AM | 48 (20.3%) | 11 (6.6%) |
| 6:30 AM to 6:59 AM | 23 (9.8%) | 0 (0.0%) |
| 7:00 AM to 7:29 AM | 12 (5.1%) | 15 (9.0%) |
| 7:30 AM to 7:59 AM | 29 (12.3%) | 89 (53.6%) |
| 8:00 AM to 8:29 AM | 77 (32.6%) | 24 (14.5%) |
| 8:30 AM to 8:59 AM | 0 (0.0%) | 0 (0.0%) |
| 9:00 AM to 9:59 AM | 0 (0.0%) | 0 (0.0%) |
| 10:00 AM to 10:59 AM | 0 (0.0%) | 0 (0.0%) |
| 11:00 AM to 11:59 AM | 30 (12.7%) | 27 (16.3%) |
| 12:00 PM to 3:59 PM | 0 (0.0%) | 0 (0.0%) |
| 4:00 PM to 11:59 PM | 0 (0.0%) | 0 (0.0%) |
| Total | 236 (100.0%) | 166 (100.0%) |
Housing Occupancy in Indian Hills
Occupancy by Ownership in Indian Hills
Of the total 612 dwellings in Indian Hills, owner-occupied units account for 589 (96.2%), while renter-occupied units make up 23 (3.8%).
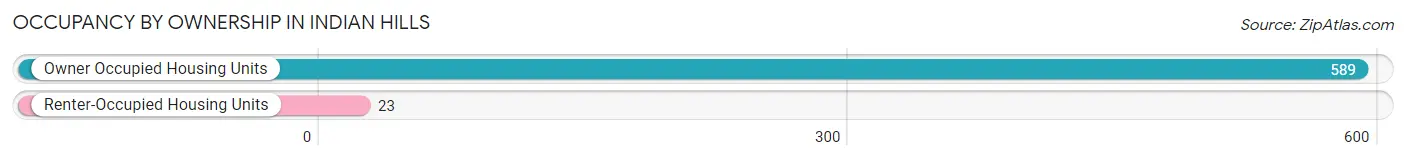
| Occupancy | # Housing Units | % Housing Units |
| Owner Occupied Housing Units | 589 | 96.2% |
| Renter-Occupied Housing Units | 23 | 3.8% |
| Total Occupied Housing Units | 612 | 100.0% |
Occupancy by Household Size in Indian Hills
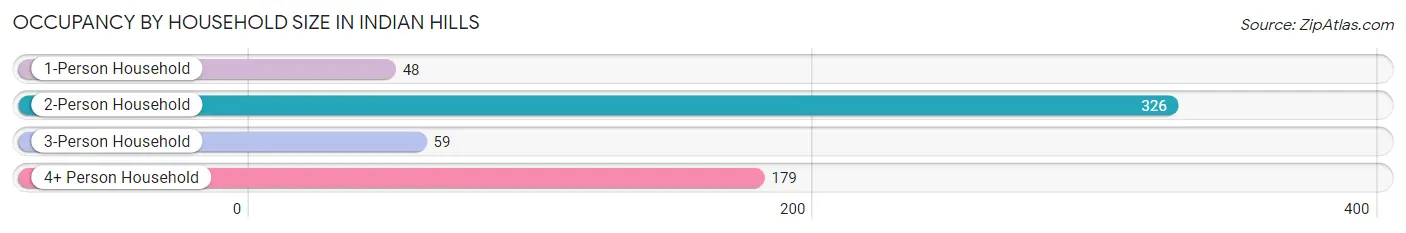
| Household Size | # Housing Units | % Housing Units |
| 1-Person Household | 48 | 7.8% |
| 2-Person Household | 326 | 53.3% |
| 3-Person Household | 59 | 9.6% |
| 4+ Person Household | 179 | 29.2% |
| Total Housing Units | 612 | 100.0% |
Occupancy by Ownership by Household Size in Indian Hills
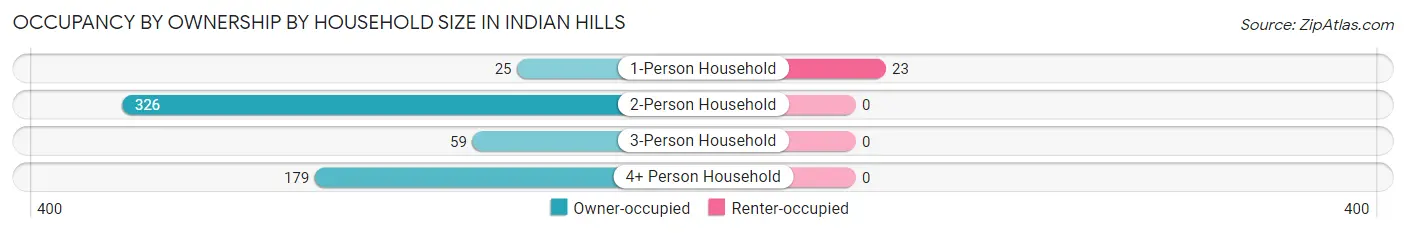
| Household Size | Owner-occupied | Renter-occupied |
| 1-Person Household | 25 (52.1%) | 23 (47.9%) |
| 2-Person Household | 326 (100.0%) | 0 (0.0%) |
| 3-Person Household | 59 (100.0%) | 0 (0.0%) |
| 4+ Person Household | 179 (100.0%) | 0 (0.0%) |
| Total Housing Units | 589 (96.2%) | 23 (3.8%) |
Occupancy by Educational Attainment in Indian Hills
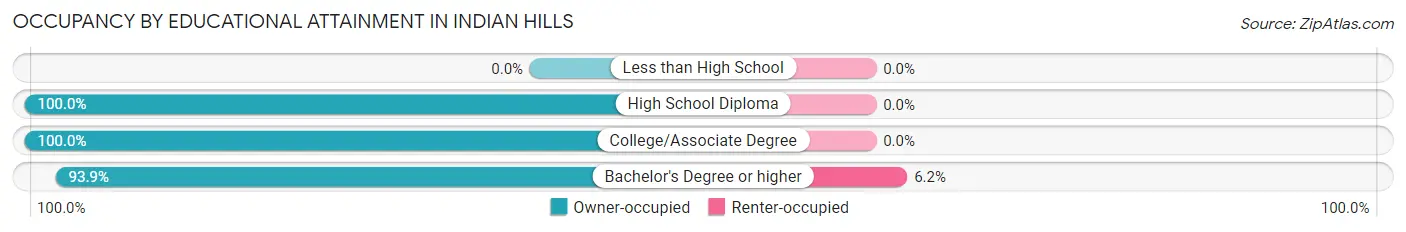
| Household Size | Owner-occupied | Renter-occupied |
| Less than High School | 0 (0.0%) | 0 (0.0%) |
| High School Diploma | 30 (100.0%) | 0 (0.0%) |
| College/Associate Degree | 208 (100.0%) | 0 (0.0%) |
| Bachelor's Degree or higher | 351 (93.9%) | 23 (6.1%) |
Occupancy by Age of Householder in Indian Hills
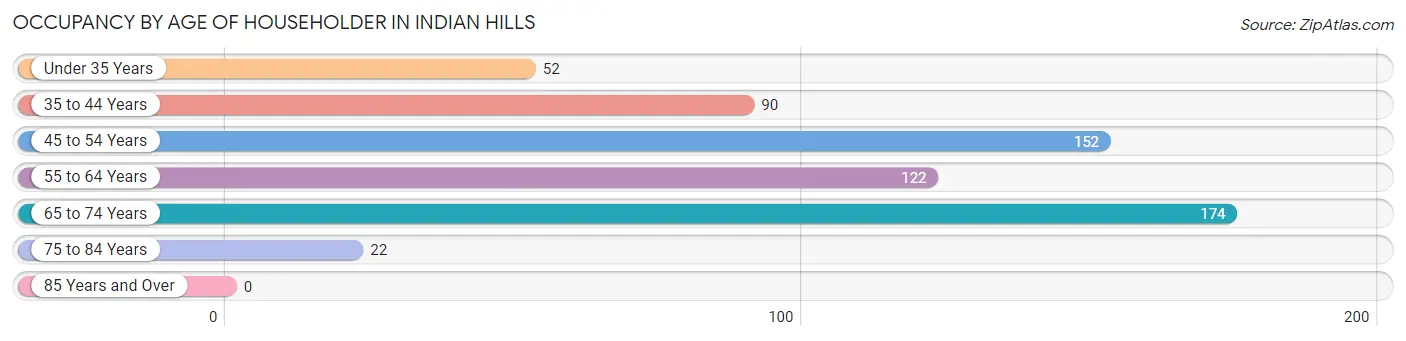
| Age Bracket | # Households | % Households |
| Under 35 Years | 52 | 8.5% |
| 35 to 44 Years | 90 | 14.7% |
| 45 to 54 Years | 152 | 24.8% |
| 55 to 64 Years | 122 | 19.9% |
| 65 to 74 Years | 174 | 28.4% |
| 75 to 84 Years | 22 | 3.6% |
| 85 Years and Over | 0 | 0.0% |
| Total | 612 | 100.0% |
Housing Finances in Indian Hills
Median Income by Occupancy in Indian Hills
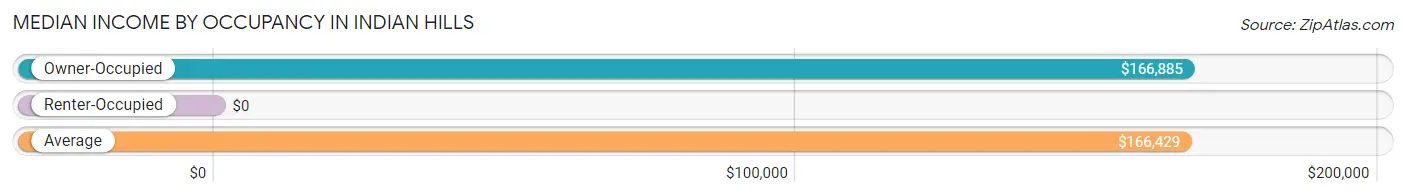
| Occupancy Type | # Households | Median Income |
| Owner-Occupied | 589 (96.2%) | $166,885 |
| Renter-Occupied | 23 (3.8%) | $0 |
| Average | 612 (100.0%) | $166,429 |
Occupancy by Householder Income Bracket in Indian Hills
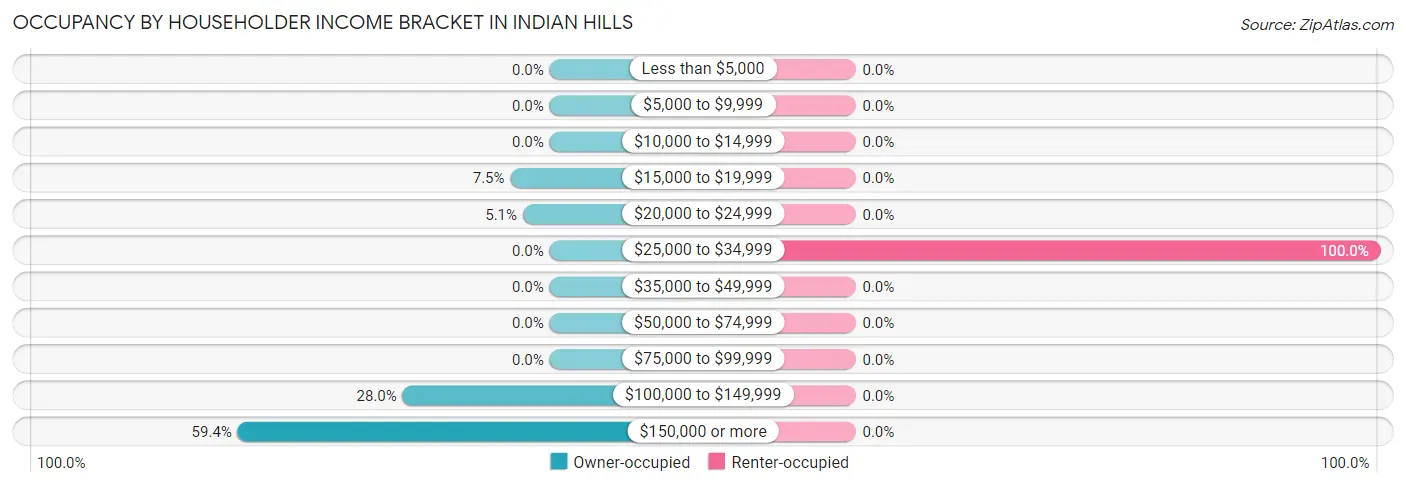
| Income Bracket | Owner-occupied | Renter-occupied |
| Less than $5,000 | 0 (0.0%) | 0 (0.0%) |
| $5,000 to $9,999 | 0 (0.0%) | 0 (0.0%) |
| $10,000 to $14,999 | 0 (0.0%) | 0 (0.0%) |
| $15,000 to $19,999 | 44 (7.5%) | 0 (0.0%) |
| $20,000 to $24,999 | 30 (5.1%) | 0 (0.0%) |
| $25,000 to $34,999 | 0 (0.0%) | 23 (100.0%) |
| $35,000 to $49,999 | 0 (0.0%) | 0 (0.0%) |
| $50,000 to $74,999 | 0 (0.0%) | 0 (0.0%) |
| $75,000 to $99,999 | 0 (0.0%) | 0 (0.0%) |
| $100,000 to $149,999 | 165 (28.0%) | 0 (0.0%) |
| $150,000 or more | 350 (59.4%) | 0 (0.0%) |
| Total | 589 (100.0%) | 23 (100.0%) |
Monthly Housing Cost Tiers in Indian Hills
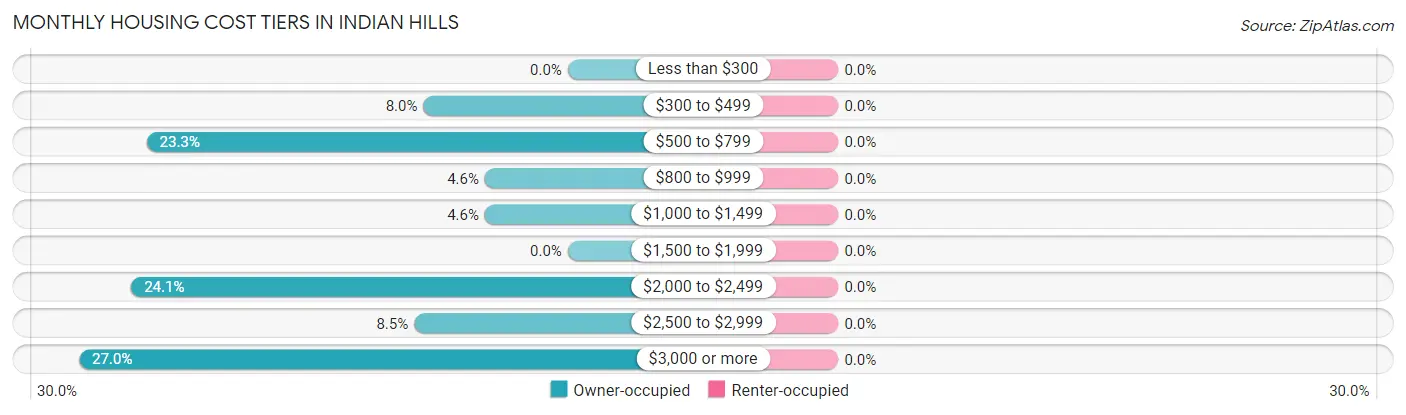
| Monthly Cost | Owner-occupied | Renter-occupied |
| Less than $300 | 0 (0.0%) | 0 (0.0%) |
| $300 to $499 | 47 (8.0%) | 0 (0.0%) |
| $500 to $799 | 137 (23.3%) | 0 (0.0%) |
| $800 to $999 | 27 (4.6%) | 0 (0.0%) |
| $1,000 to $1,499 | 27 (4.6%) | 0 (0.0%) |
| $1,500 to $1,999 | 0 (0.0%) | 0 (0.0%) |
| $2,000 to $2,499 | 142 (24.1%) | 0 (0.0%) |
| $2,500 to $2,999 | 50 (8.5%) | 0 (0.0%) |
| $3,000 or more | 159 (27.0%) | 0 (0.0%) |
| Total | 589 (100.0%) | 23 (100.0%) |
Physical Housing Characteristics in Indian Hills
Housing Structures in Indian Hills
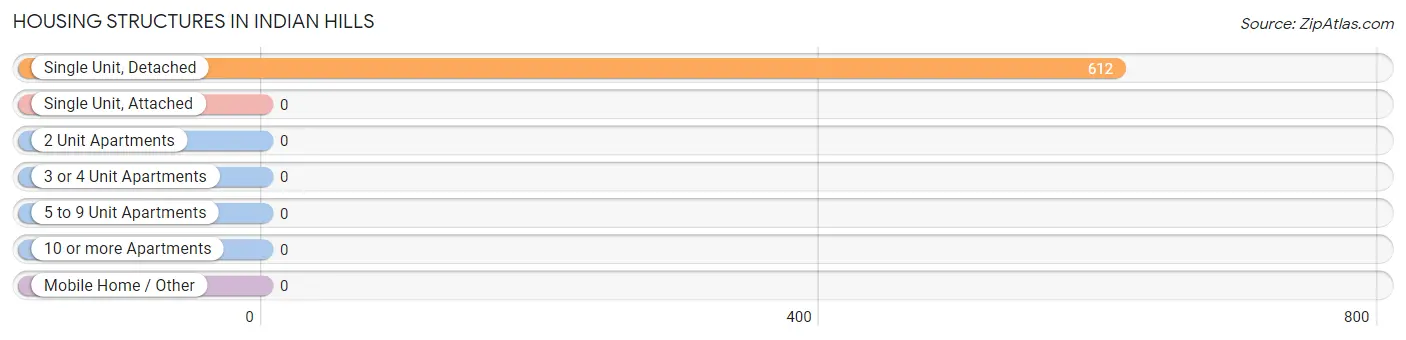
| Structure Type | # Housing Units | % Housing Units |
| Single Unit, Detached | 612 | 100.0% |
| Single Unit, Attached | 0 | 0.0% |
| 2 Unit Apartments | 0 | 0.0% |
| 3 or 4 Unit Apartments | 0 | 0.0% |
| 5 to 9 Unit Apartments | 0 | 0.0% |
| 10 or more Apartments | 0 | 0.0% |
| Mobile Home / Other | 0 | 0.0% |
| Total | 612 | 100.0% |
Housing Structures by Occupancy in Indian Hills
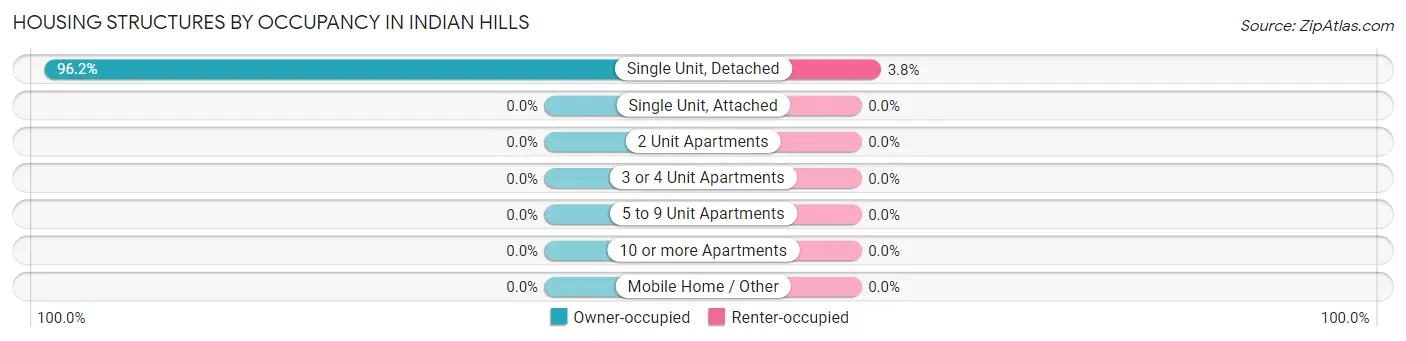
| Structure Type | Owner-occupied | Renter-occupied |
| Single Unit, Detached | 589 (96.2%) | 23 (3.8%) |
| Single Unit, Attached | 0 (0.0%) | 0 (0.0%) |
| 2 Unit Apartments | 0 (0.0%) | 0 (0.0%) |
| 3 or 4 Unit Apartments | 0 (0.0%) | 0 (0.0%) |
| 5 to 9 Unit Apartments | 0 (0.0%) | 0 (0.0%) |
| 10 or more Apartments | 0 (0.0%) | 0 (0.0%) |
| Mobile Home / Other | 0 (0.0%) | 0 (0.0%) |
| Total | 589 (96.2%) | 23 (3.8%) |
Housing Structures by Number of Rooms in Indian Hills
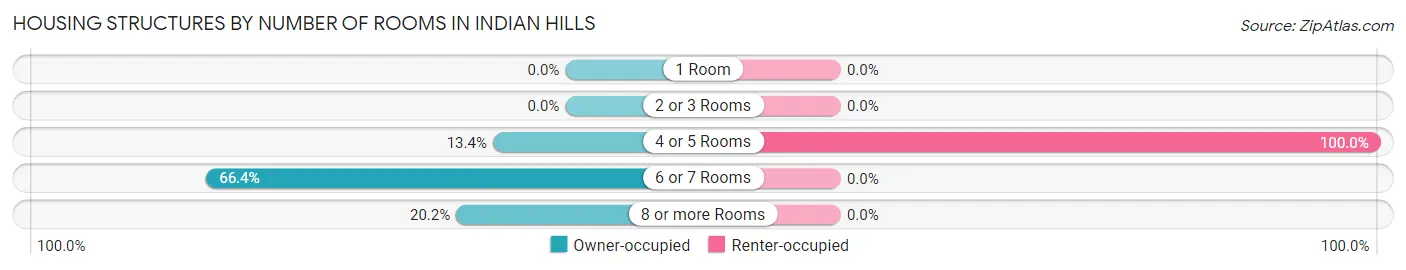
| Number of Rooms | Owner-occupied | Renter-occupied |
| 1 Room | 0 (0.0%) | 0 (0.0%) |
| 2 or 3 Rooms | 0 (0.0%) | 0 (0.0%) |
| 4 or 5 Rooms | 79 (13.4%) | 23 (100.0%) |
| 6 or 7 Rooms | 391 (66.4%) | 0 (0.0%) |
| 8 or more Rooms | 119 (20.2%) | 0 (0.0%) |
| Total | 589 (100.0%) | 23 (100.0%) |
Housing Structure by Heating Type in Indian Hills
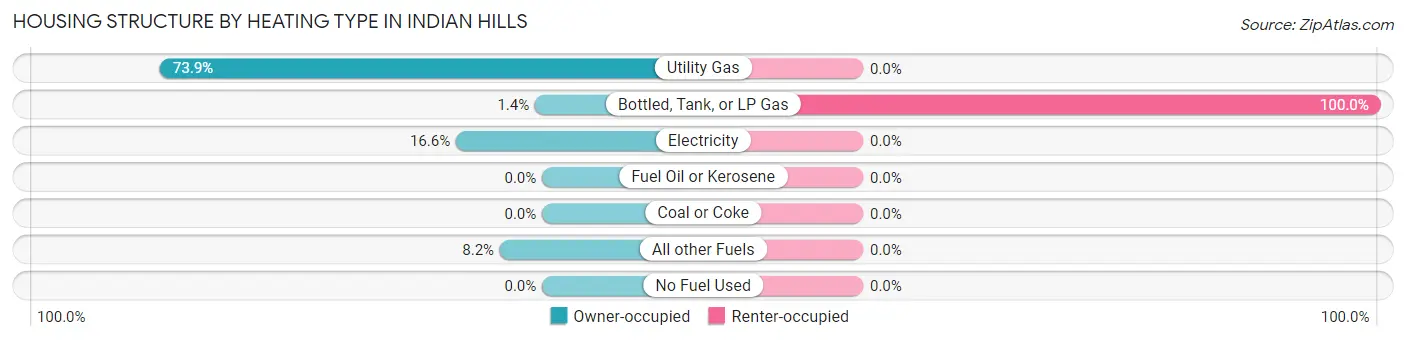
| Heating Type | Owner-occupied | Renter-occupied |
| Utility Gas | 435 (73.9%) | 0 (0.0%) |
| Bottled, Tank, or LP Gas | 8 (1.4%) | 23 (100.0%) |
| Electricity | 98 (16.6%) | 0 (0.0%) |
| Fuel Oil or Kerosene | 0 (0.0%) | 0 (0.0%) |
| Coal or Coke | 0 (0.0%) | 0 (0.0%) |
| All other Fuels | 48 (8.2%) | 0 (0.0%) |
| No Fuel Used | 0 (0.0%) | 0 (0.0%) |
| Total | 589 (100.0%) | 23 (100.0%) |
Household Vehicle Usage in Indian Hills
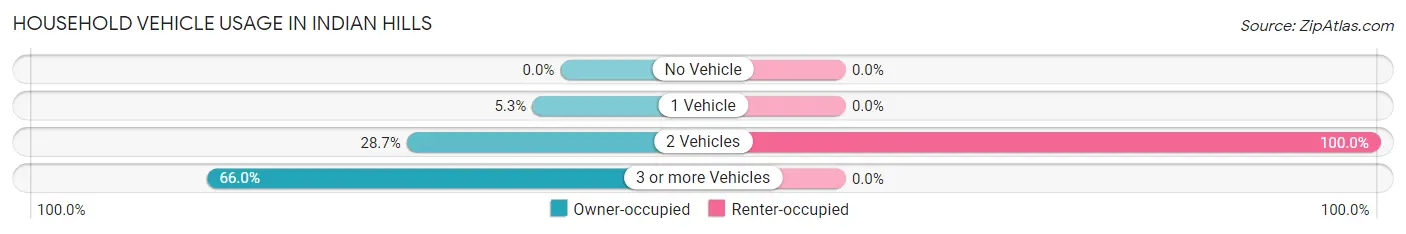
| Vehicles per Household | Owner-occupied | Renter-occupied |
| No Vehicle | 0 (0.0%) | 0 (0.0%) |
| 1 Vehicle | 31 (5.3%) | 0 (0.0%) |
| 2 Vehicles | 169 (28.7%) | 23 (100.0%) |
| 3 or more Vehicles | 389 (66.0%) | 0 (0.0%) |
| Total | 589 (100.0%) | 23 (100.0%) |
Real Estate & Mortgages in Indian Hills
Real Estate and Mortgage Overview in Indian Hills
| Characteristic | Without Mortgage | With Mortgage |
| Housing Units | 211 | 378 |
| Median Property Value | $572,600 | $779,200 |
| Median Household Income | $216,576 | $230 |
| Monthly Housing Costs | $584 | $159 |
| Real Estate Taxes | $3,137 | $0 |
Property Value by Mortgage Status in Indian Hills
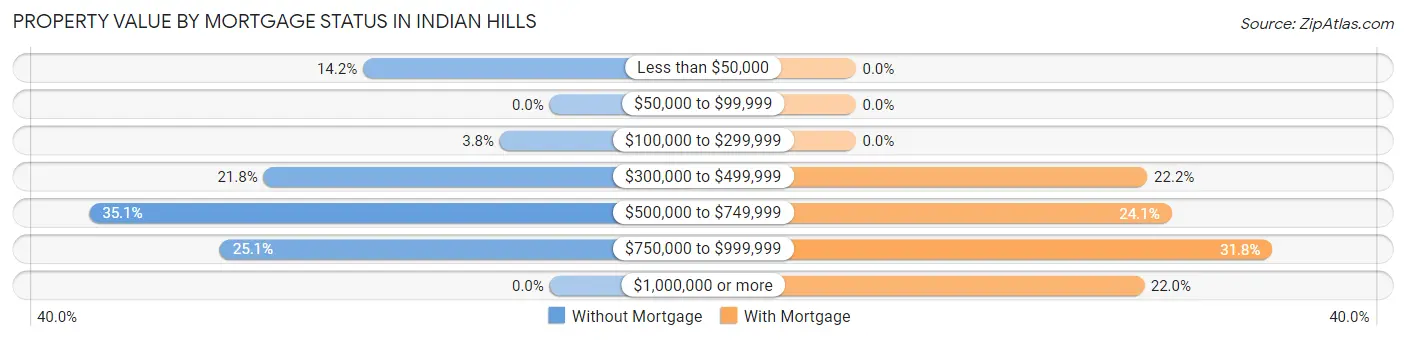
| Property Value | Without Mortgage | With Mortgage |
| Less than $50,000 | 30 (14.2%) | 0 (0.0%) |
| $50,000 to $99,999 | 0 (0.0%) | 0 (0.0%) |
| $100,000 to $299,999 | 8 (3.8%) | 0 (0.0%) |
| $300,000 to $499,999 | 46 (21.8%) | 84 (22.2%) |
| $500,000 to $749,999 | 74 (35.1%) | 91 (24.1%) |
| $750,000 to $999,999 | 53 (25.1%) | 120 (31.8%) |
| $1,000,000 or more | 0 (0.0%) | 83 (22.0%) |
| Total | 211 (100.0%) | 378 (100.0%) |
Household Income by Mortgage Status in Indian Hills
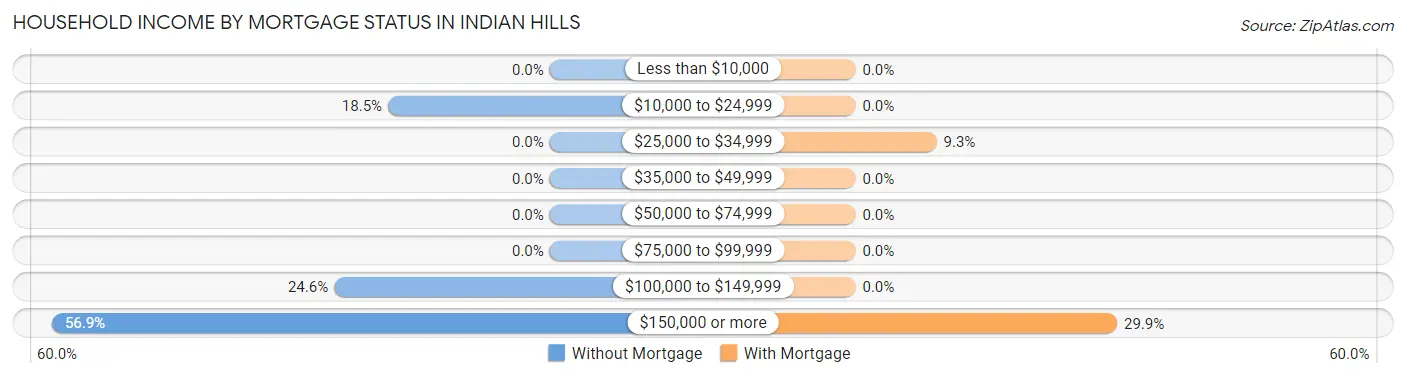
| Household Income | Without Mortgage | With Mortgage |
| Less than $10,000 | 0 (0.0%) | 0 (0.0%) |
| $10,000 to $24,999 | 39 (18.5%) | 0 (0.0%) |
| $25,000 to $34,999 | 0 (0.0%) | 35 (9.3%) |
| $35,000 to $49,999 | 0 (0.0%) | 0 (0.0%) |
| $50,000 to $74,999 | 0 (0.0%) | 0 (0.0%) |
| $75,000 to $99,999 | 0 (0.0%) | 0 (0.0%) |
| $100,000 to $149,999 | 52 (24.6%) | 0 (0.0%) |
| $150,000 or more | 120 (56.9%) | 113 (29.9%) |
| Total | 211 (100.0%) | 378 (100.0%) |
Property Value to Household Income Ratio in Indian Hills
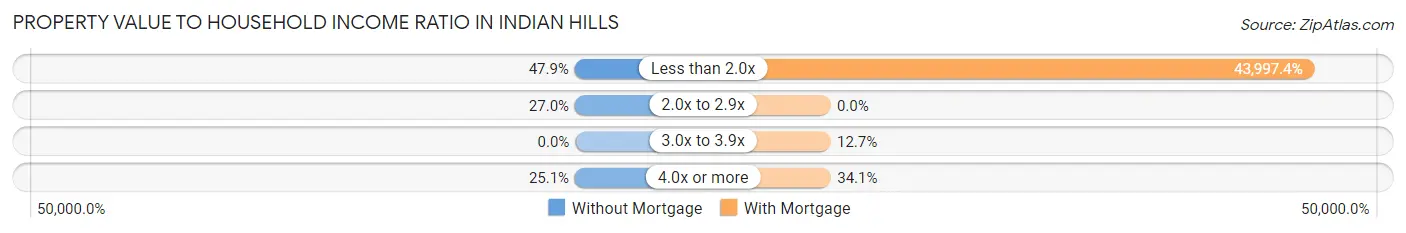
| Value-to-Income Ratio | Without Mortgage | With Mortgage |
| Less than 2.0x | 101 (47.9%) | 166,310 (43,997.4%) |
| 2.0x to 2.9x | 57 (27.0%) | 0 (0.0%) |
| 3.0x to 3.9x | 0 (0.0%) | 48 (12.7%) |
| 4.0x or more | 53 (25.1%) | 129 (34.1%) |
| Total | 211 (100.0%) | 378 (100.0%) |
Real Estate Taxes by Mortgage Status in Indian Hills
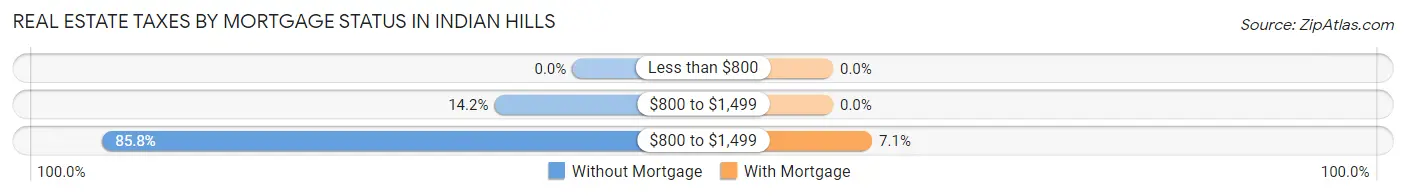
| Property Taxes | Without Mortgage | With Mortgage |
| Less than $800 | 0 (0.0%) | 0 (0.0%) |
| $800 to $1,499 | 30 (14.2%) | 0 (0.0%) |
| $800 to $1,499 | 181 (85.8%) | 27 (7.1%) |
| Total | 211 (100.0%) | 378 (100.0%) |
Health & Disability in Indian Hills
Health Insurance Coverage by Age in Indian Hills
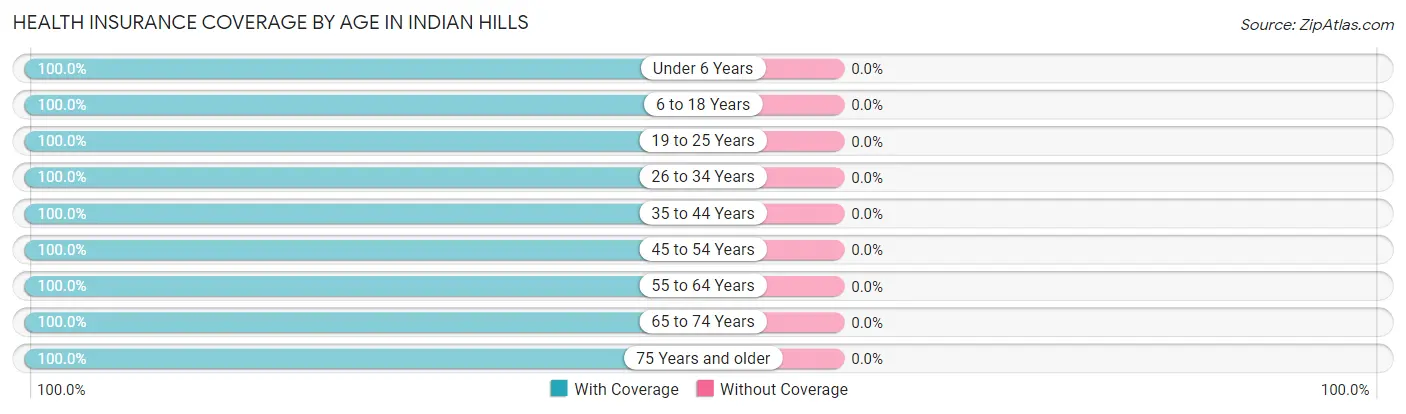
| Age Bracket | With Coverage | Without Coverage |
| Under 6 Years | 55 (100.0%) | 0 (0.0%) |
| 6 to 18 Years | 239 (100.0%) | 0 (0.0%) |
| 19 to 25 Years | 29 (100.0%) | 0 (0.0%) |
| 26 to 34 Years | 87 (100.0%) | 0 (0.0%) |
| 35 to 44 Years | 203 (100.0%) | 0 (0.0%) |
| 45 to 54 Years | 257 (100.0%) | 0 (0.0%) |
| 55 to 64 Years | 259 (100.0%) | 0 (0.0%) |
| 65 to 74 Years | 270 (100.0%) | 0 (0.0%) |
| 75 Years and older | 46 (100.0%) | 0 (0.0%) |
| Total | 1,445 (100.0%) | 0 (0.0%) |
Health Insurance Coverage by Citizenship Status in Indian Hills
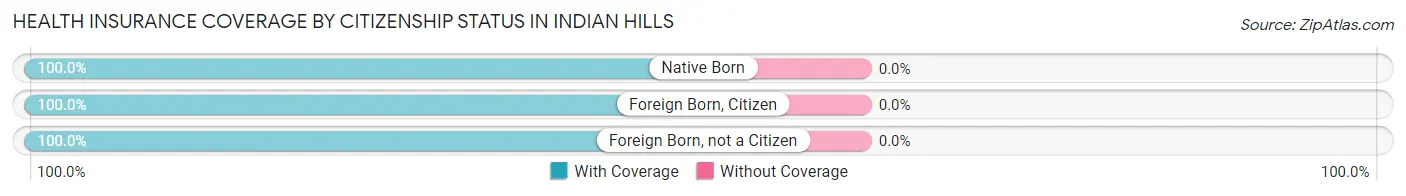
| Citizenship Status | With Coverage | Without Coverage |
| Native Born | 55 (100.0%) | 0 (0.0%) |
| Foreign Born, Citizen | 239 (100.0%) | 0 (0.0%) |
| Foreign Born, not a Citizen | 29 (100.0%) | 0 (0.0%) |
Health Insurance Coverage by Household Income in Indian Hills
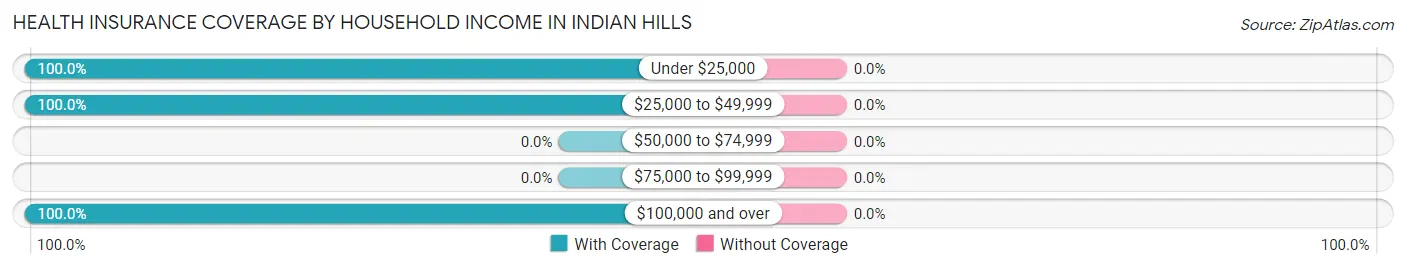
| Household Income | With Coverage | Without Coverage |
| Under $25,000 | 142 (100.0%) | 0 (0.0%) |
| $25,000 to $49,999 | 23 (100.0%) | 0 (0.0%) |
| $50,000 to $74,999 | 0 (0.0%) | 0 (0.0%) |
| $75,000 to $99,999 | 0 (0.0%) | 0 (0.0%) |
| $100,000 and over | 1,280 (100.0%) | 0 (0.0%) |
Public vs Private Health Insurance Coverage by Age in Indian Hills
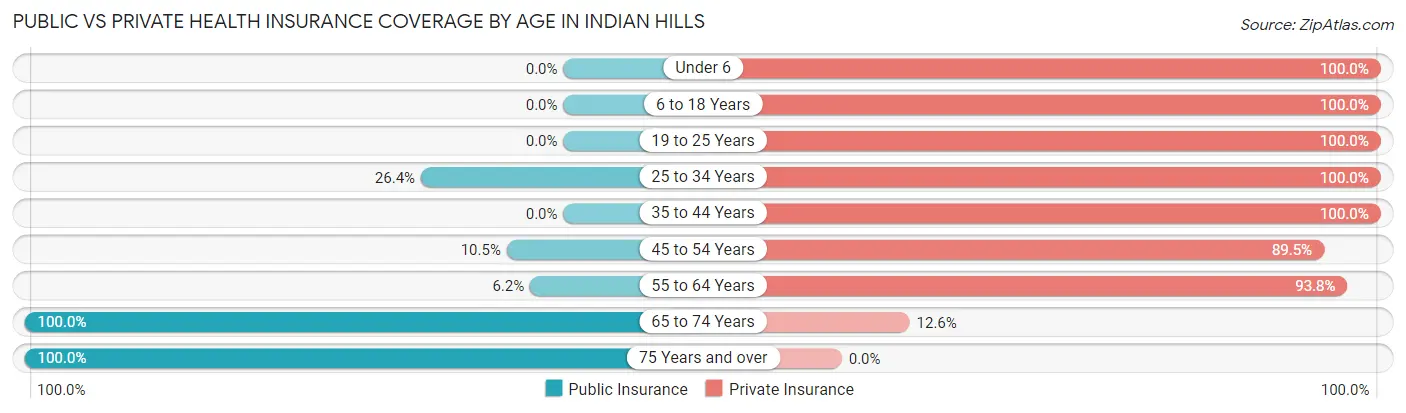
| Age Bracket | Public Insurance | Private Insurance |
| Under 6 | 0 (0.0%) | 55 (100.0%) |
| 6 to 18 Years | 0 (0.0%) | 239 (100.0%) |
| 19 to 25 Years | 0 (0.0%) | 29 (100.0%) |
| 25 to 34 Years | 23 (26.4%) | 87 (100.0%) |
| 35 to 44 Years | 0 (0.0%) | 203 (100.0%) |
| 45 to 54 Years | 27 (10.5%) | 230 (89.5%) |
| 55 to 64 Years | 16 (6.2%) | 243 (93.8%) |
| 65 to 74 Years | 270 (100.0%) | 34 (12.6%) |
| 75 Years and over | 46 (100.0%) | 0 (0.0%) |
| Total | 382 (26.4%) | 1,120 (77.5%) |
Disability Status by Sex by Age in Indian Hills
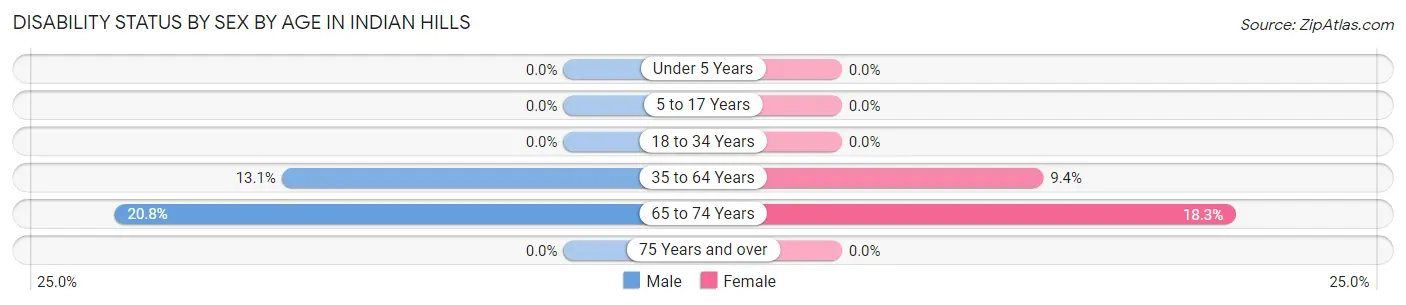
| Age Bracket | Male | Female |
| Under 5 Years | 0 (0.0%) | 0 (0.0%) |
| 5 to 17 Years | 0 (0.0%) | 0 (0.0%) |
| 18 to 34 Years | 0 (0.0%) | 0 (0.0%) |
| 35 to 64 Years | 52 (13.1%) | 30 (9.3%) |
| 65 to 74 Years | 30 (20.8%) | 23 (18.2%) |
| 75 Years and over | 0 (0.0%) | 0 (0.0%) |
Disability Class by Sex by Age in Indian Hills
Disability Class: Hearing Difficulty
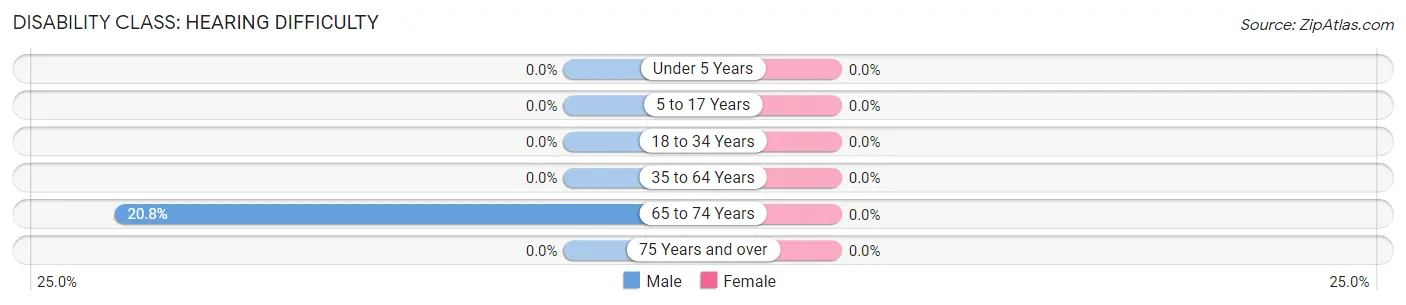
| Age Bracket | Male | Female |
| Under 5 Years | 0 (0.0%) | 0 (0.0%) |
| 5 to 17 Years | 0 (0.0%) | 0 (0.0%) |
| 18 to 34 Years | 0 (0.0%) | 0 (0.0%) |
| 35 to 64 Years | 0 (0.0%) | 0 (0.0%) |
| 65 to 74 Years | 30 (20.8%) | 0 (0.0%) |
| 75 Years and over | 0 (0.0%) | 0 (0.0%) |
Disability Class: Vision Difficulty
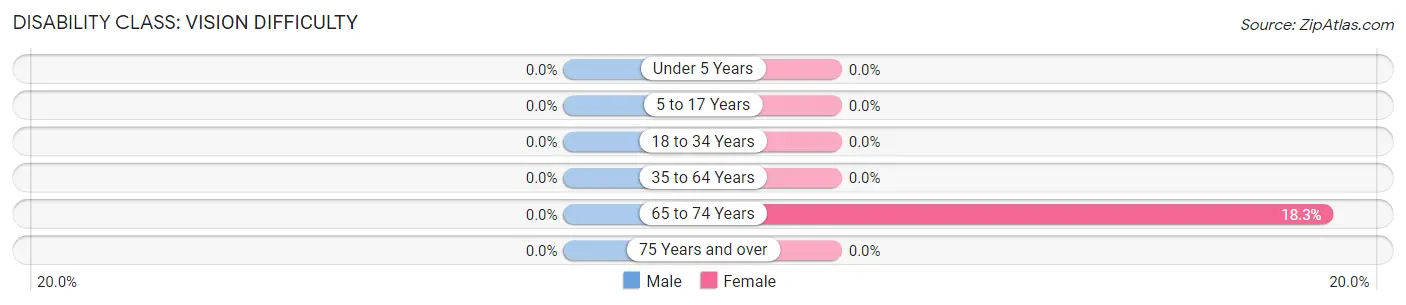
| Age Bracket | Male | Female |
| Under 5 Years | 0 (0.0%) | 0 (0.0%) |
| 5 to 17 Years | 0 (0.0%) | 0 (0.0%) |
| 18 to 34 Years | 0 (0.0%) | 0 (0.0%) |
| 35 to 64 Years | 0 (0.0%) | 0 (0.0%) |
| 65 to 74 Years | 0 (0.0%) | 23 (18.2%) |
| 75 Years and over | 0 (0.0%) | 0 (0.0%) |
Disability Class: Cognitive Difficulty
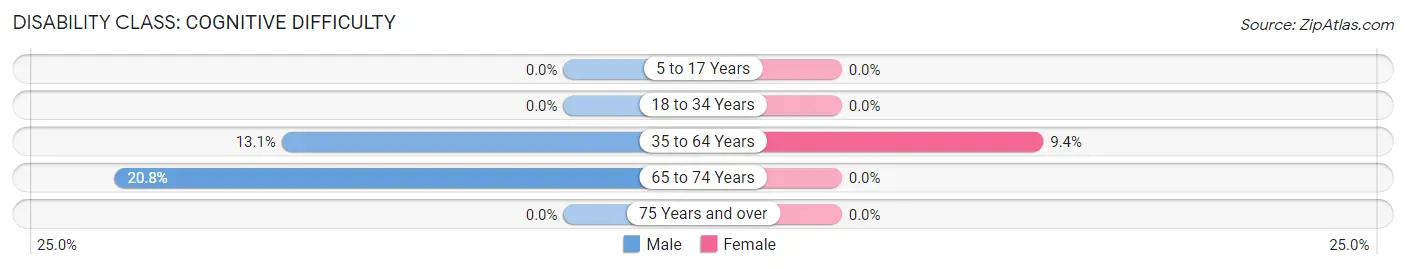
| Age Bracket | Male | Female |
| 5 to 17 Years | 0 (0.0%) | 0 (0.0%) |
| 18 to 34 Years | 0 (0.0%) | 0 (0.0%) |
| 35 to 64 Years | 52 (13.1%) | 30 (9.3%) |
| 65 to 74 Years | 30 (20.8%) | 0 (0.0%) |
| 75 Years and over | 0 (0.0%) | 0 (0.0%) |
Disability Class: Ambulatory Difficulty
| Age Bracket | Male | Female |
| 5 to 17 Years | 0 (0.0%) | 0 (0.0%) |
| 18 to 34 Years | 0 (0.0%) | 0 (0.0%) |
| 35 to 64 Years | 0 (0.0%) | 0 (0.0%) |
| 65 to 74 Years | 0 (0.0%) | 0 (0.0%) |
| 75 Years and over | 0 (0.0%) | 0 (0.0%) |
Disability Class: Self-Care Difficulty
| Age Bracket | Male | Female |
| 5 to 17 Years | 0 (0.0%) | 0 (0.0%) |
| 18 to 34 Years | 0 (0.0%) | 0 (0.0%) |
| 35 to 64 Years | 0 (0.0%) | 0 (0.0%) |
| 65 to 74 Years | 0 (0.0%) | 0 (0.0%) |
| 75 Years and over | 0 (0.0%) | 0 (0.0%) |
Technology Access in Indian Hills
Computing Device Access in Indian Hills
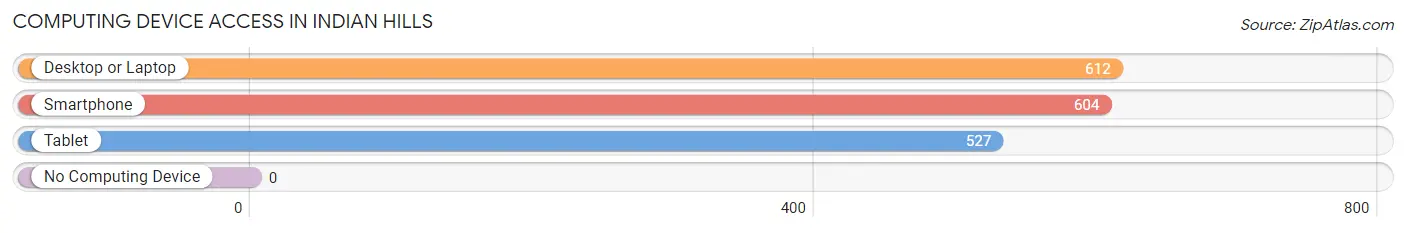
| Device Type | # Households | % Households |
| Desktop or Laptop | 612 | 100.0% |
| Smartphone | 604 | 98.7% |
| Tablet | 527 | 86.1% |
| No Computing Device | 0 | 0.0% |
| Total | 612 | 100.0% |
Internet Access in Indian Hills
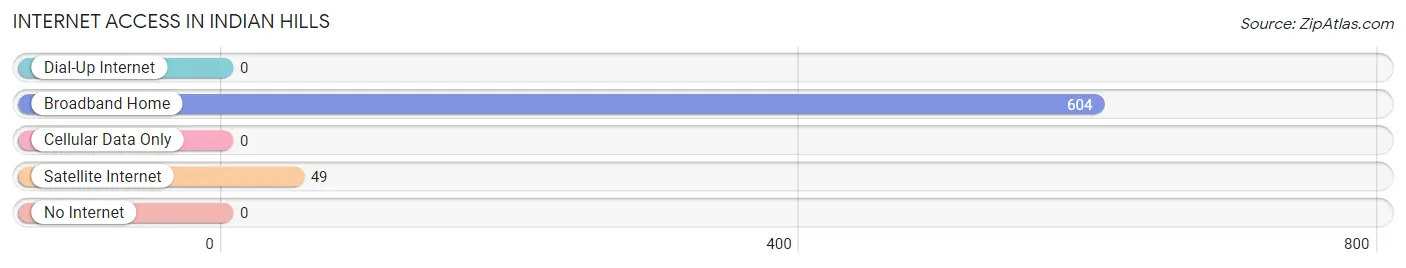
| Internet Type | # Households | % Households |
| Dial-Up Internet | 0 | 0.0% |
| Broadband Home | 604 | 98.7% |
| Cellular Data Only | 0 | 0.0% |
| Satellite Internet | 49 | 8.0% |
| No Internet | 0 | 0.0% |
| Total | 612 | 100.0% |
Indian Hills Summary
History
Indian Hills is an unincorporated community located in Jefferson County, Colorado. It is situated in the foothills of the Rocky Mountains, approximately 25 miles west of Denver. The area was first settled in the late 1800s by miners and ranchers. The town was officially established in 1891 and was named after the nearby Indian Hills, a mountain range that was sacred to the Ute Indians.
The town was originally a small mining and ranching community, but it quickly grew in size and population. By the early 1900s, the town had a post office, a school, a general store, and several other businesses. The town was also home to a number of churches, including the Indian Hills Methodist Church, which was founded in 1892.
In the 1920s, the town began to experience a decline in population as many of the miners and ranchers moved away. However, the town was revitalized in the 1950s when the nearby Denver Mountain Parks system was established. This brought a new influx of tourists and outdoor enthusiasts to the area, and the town began to experience a resurgence.
Today, Indian Hills is a small, rural community with a population of approximately 1,000 people. The town is home to a number of businesses, including a grocery store, a hardware store, a restaurant, and several other small businesses. The town is also home to a number of churches, including the Indian Hills Methodist Church, which is still active today.
Geography
Indian Hills is located in the foothills of the Rocky Mountains, approximately 25 miles west of Denver. The town is situated at an elevation of 6,400 feet above sea level. The area is characterized by rolling hills, open meadows, and dense forests. The nearby Indian Hills mountain range is a popular destination for hikers and outdoor enthusiasts.
The town is located in the South Platte River Valley, which is a major agricultural region. The area is known for its production of hay, wheat, and other crops. The nearby mountains provide a variety of recreational opportunities, including hiking, camping, fishing, and hunting.
Economy
The economy of Indian Hills is largely based on tourism and agriculture. The town is home to a number of businesses, including a grocery store, a hardware store, a restaurant, and several other small businesses. The town is also home to a number of churches, including the Indian Hills Methodist Church, which is still active today.
The nearby Denver Mountain Parks system is a major source of tourism for the area. The parks offer a variety of recreational activities, including hiking, camping, fishing, and hunting. The area is also home to a number of ski resorts, which attract visitors from all over the world.
The area is also known for its production of hay, wheat, and other crops. The nearby mountains provide a variety of recreational opportunities, including hiking, camping, fishing, and hunting.
Demographics
As of the 2010 census, the population of Indian Hills was 1,000 people. The racial makeup of the town was 97.2% White, 0.7% African American, 0.3% Native American, 0.3% Asian, 0.1% Pacific Islander, 0.7% from other races, and 0.9% from two or more races. Hispanic or Latino of any race were 2.3% of the population.
The median household income in Indian Hills was $50,000, and the median family income was $54,000. The per capita income for the town was $25,000. About 8.3% of families and 10.3% of the population were below the poverty line, including 14.3% of those under age 18 and none of those age 65 or over.
Common Questions
What is Per Capita Income in Indian Hills?
Per Capita income in Indian Hills is $76,559.
What is the Median Family Income in Indian Hills?
Median Family Income in Indian Hills is $167,381.
What is the Median Household income in Indian Hills?
Median Household Income in Indian Hills is $166,429.
What is Income or Wage Gap in Indian Hills?
Income or Wage Gap in Indian Hills is 34.2%.
Women in Indian Hills earn 65.8 cents for every dollar earned by a man.
What is Inequality or Gini Index in Indian Hills?
Inequality or Gini Index in Indian Hills is 0.31.
What is the Total Population of Indian Hills?
Total Population of Indian Hills is 1,445.
What is the Total Male Population of Indian Hills?
Total Male Population of Indian Hills is 743.
What is the Total Female Population of Indian Hills?
Total Female Population of Indian Hills is 702.
What is the Ratio of Males per 100 Females in Indian Hills?
There are 105.84 Males per 100 Females in Indian Hills.
What is the Ratio of Females per 100 Males in Indian Hills?
There are 94.48 Females per 100 Males in Indian Hills.
What is the Median Population Age in Indian Hills?
Median Population Age in Indian Hills is 49.0 Years.
What is the Average Family Size in Indian Hills
Average Family Size in Indian Hills is 2.5 People.
What is the Average Household Size in Indian Hills
Average Household Size in Indian Hills is 2.4 People.
How Large is the Labor Force in Indian Hills?
There are 800 People in the Labor Forcein in Indian Hills.
What is the Percentage of People in the Labor Force in Indian Hills?
67.9% of People are in the Labor Force in Indian Hills.