Questa, NM Map & Demographics
Questa Map
Questa Overview
$25,700
PER CAPITA INCOME
$68,846
AVG FAMILY INCOME
$53,047
AVG HOUSEHOLD INCOME
3.2%
WAGE / INCOME GAP [ % ]
96.8¢/ $1
WAGE / INCOME GAP [ $ ]
0.43
INEQUALITY / GINI INDEX
2,179
TOTAL POPULATION
1,296
MALE POPULATION
883
FEMALE POPULATION
146.77
MALES / 100 FEMALES
68.13
FEMALES / 100 MALES
44.9
MEDIAN AGE
3.8
AVG FAMILY SIZE
2.9
AVG HOUSEHOLD SIZE
997
LABOR FORCE [ PEOPLE ]
53.1%
PERCENT IN LABOR FORCE
0.6%
UNEMPLOYMENT RATE
Questa Zip Codes
Questa Area Codes
Income in Questa
Income Overview in Questa
Per Capita Income in Questa is $25,700, while median incomes of families and households are $68,846 and $53,047 respectively.
| Characteristic | Number | Measure |
| Per Capita Income | 2,179 | $25,700 |
| Median Family Income | 460 | $68,846 |
| Mean Family Income | 460 | $80,181 |
| Median Household Income | 757 | $53,047 |
| Mean Household Income | 757 | $62,049 |
| Income Deficit | 460 | $0 |
| Wage / Income Gap (%) | 2,179 | 3.19% |
| Wage / Income Gap ($) | 2,179 | 96.81¢ per $1 |
| Gini / Inequality Index | 2,179 | 0.43 |
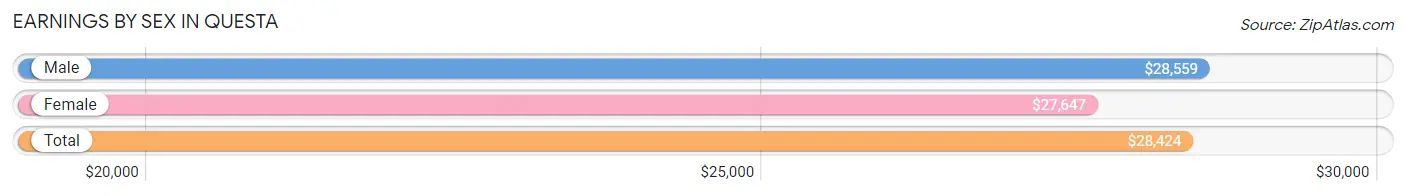
Earnings by Sex in Questa
Average Earnings in Questa are $28,424, $28,559 for men and $27,647 for women, a difference of 3.2%.
| Sex | Number | Average Earnings |
| Male | 633 (61.3%) | $28,559 |
| Female | 400 (38.7%) | $27,647 |
| Total | 1,033 (100.0%) | $28,424 |
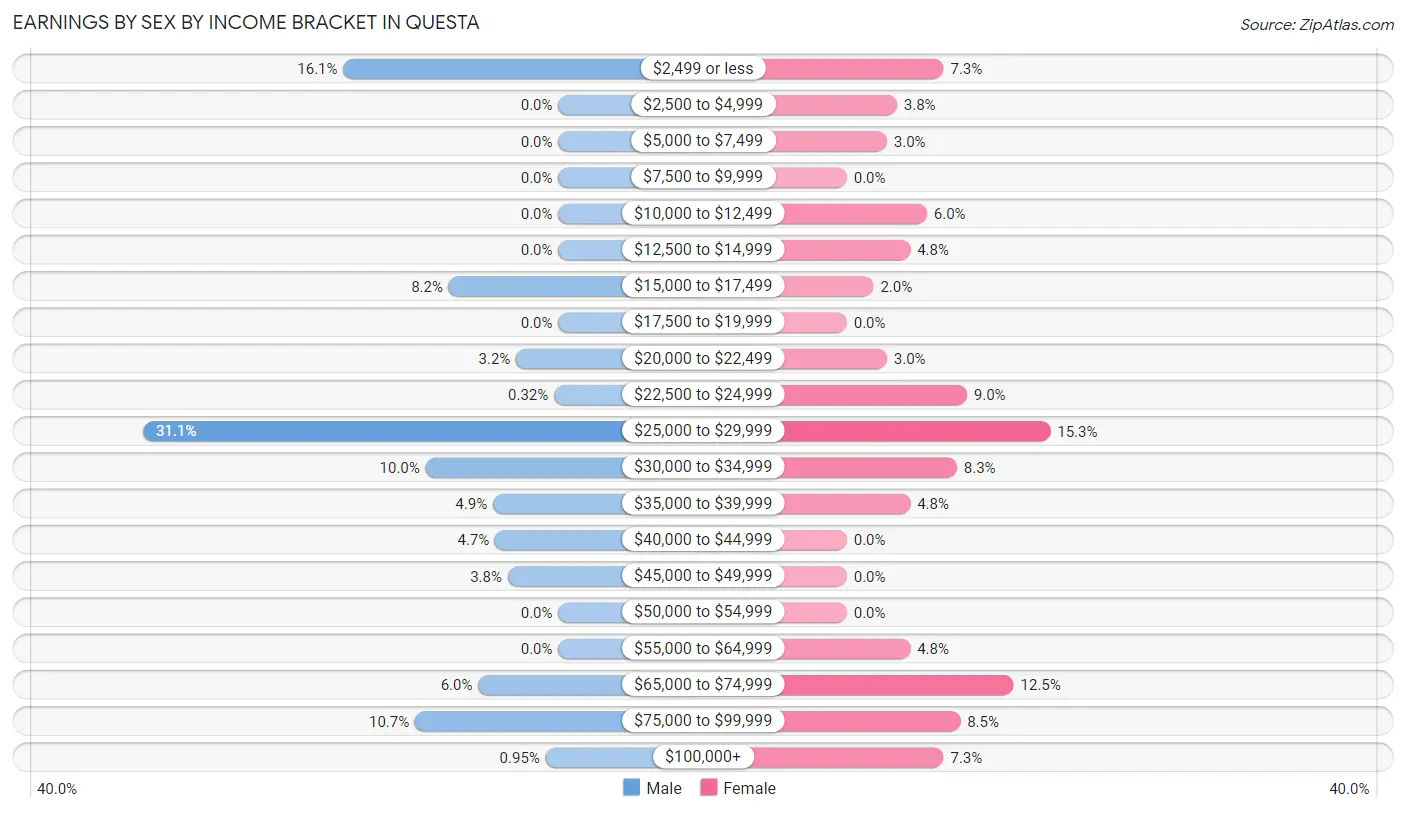
Earnings by Sex by Income Bracket in Questa
The most common earnings brackets in Questa are $25,000 to $29,999 for men (197 | 31.1%) and $25,000 to $29,999 for women (61 | 15.2%).
| Income | Male | Female |
| $2,499 or less | 102 (16.1%) | 29 (7.2%) |
| $2,500 to $4,999 | 0 (0.0%) | 15 (3.7%) |
| $5,000 to $7,499 | 0 (0.0%) | 12 (3.0%) |
| $7,500 to $9,999 | 0 (0.0%) | 0 (0.0%) |
| $10,000 to $12,499 | 0 (0.0%) | 24 (6.0%) |
| $12,500 to $14,999 | 0 (0.0%) | 19 (4.8%) |
| $15,000 to $17,499 | 52 (8.2%) | 8 (2.0%) |
| $17,500 to $19,999 | 0 (0.0%) | 0 (0.0%) |
| $20,000 to $22,499 | 20 (3.2%) | 12 (3.0%) |
| $22,500 to $24,999 | 2 (0.3%) | 36 (9.0%) |
| $25,000 to $29,999 | 197 (31.1%) | 61 (15.2%) |
| $30,000 to $34,999 | 63 (10.0%) | 33 (8.3%) |
| $35,000 to $39,999 | 31 (4.9%) | 19 (4.8%) |
| $40,000 to $44,999 | 30 (4.7%) | 0 (0.0%) |
| $45,000 to $49,999 | 24 (3.8%) | 0 (0.0%) |
| $50,000 to $54,999 | 0 (0.0%) | 0 (0.0%) |
| $55,000 to $64,999 | 0 (0.0%) | 19 (4.8%) |
| $65,000 to $74,999 | 38 (6.0%) | 50 (12.5%) |
| $75,000 to $99,999 | 68 (10.7%) | 34 (8.5%) |
| $100,000+ | 6 (0.9%) | 29 (7.2%) |
| Total | 633 (100.0%) | 400 (100.0%) |
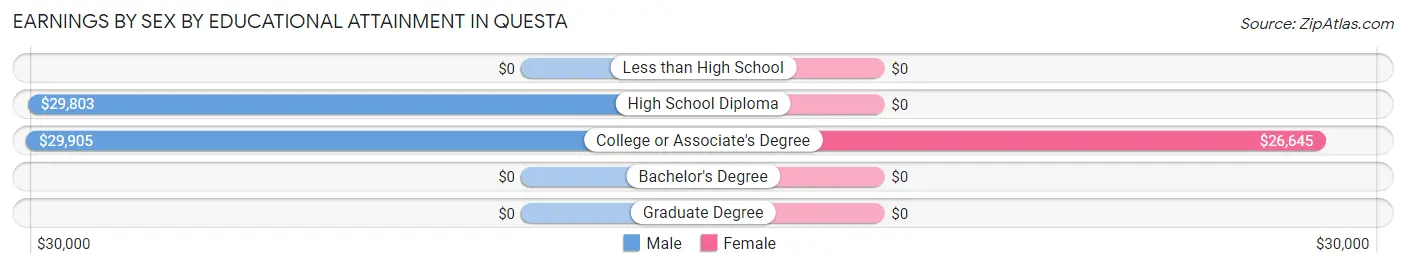
Earnings by Sex by Educational Attainment in Questa
Average earnings in Questa are $29,770 for men and $33,333 for women, a difference of 10.7%. Men with an educational attainment of college or associate's degree enjoy the highest average annual earnings of $29,905, while those with high school diploma education earn the least with $29,803. Women with an educational attainment of college or associate's degree earn the most with the average annual earnings of $26,645, while those with college or associate's degree education have the smallest earnings of $26,645.
| Educational Attainment | Male Income | Female Income |
| Less than High School | - | - |
| High School Diploma | $29,803 | $0 |
| College or Associate's Degree | $29,905 | $26,645 |
| Bachelor's Degree | - | - |
| Graduate Degree | - | - |
| Total | $29,770 | $33,333 |
Family Income in Questa
Family Income Brackets in Questa
According to the Questa family income data, there are 119 families falling into the $50,000 to $74,999 income range, which is the most common income bracket and makes up 25.9% of all families.
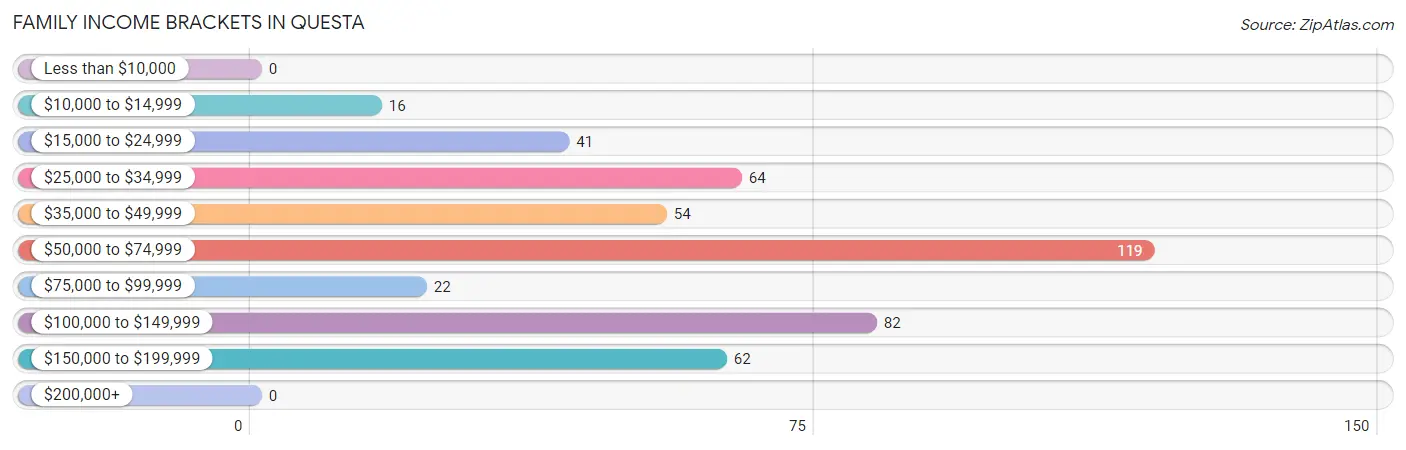
| Income Bracket | # Families | % Families |
| Less than $10,000 | 0 | 0.0% |
| $10,000 to $14,999 | 16 | 3.5% |
| $15,000 to $24,999 | 41 | 8.9% |
| $25,000 to $34,999 | 64 | 13.9% |
| $35,000 to $49,999 | 54 | 11.7% |
| $50,000 to $74,999 | 119 | 25.9% |
| $75,000 to $99,999 | 22 | 4.8% |
| $100,000 to $149,999 | 82 | 17.8% |
| $150,000 to $199,999 | 62 | 13.5% |
| $200,000+ | 0 | 0.0% |
Family Income by Famaliy Size in Questa
4-person families (40 | 8.7%) account for the highest median family income in Questa with $163,625 per family, while 4-person families (40 | 8.7%) have the highest median income of $40,906 per family member.
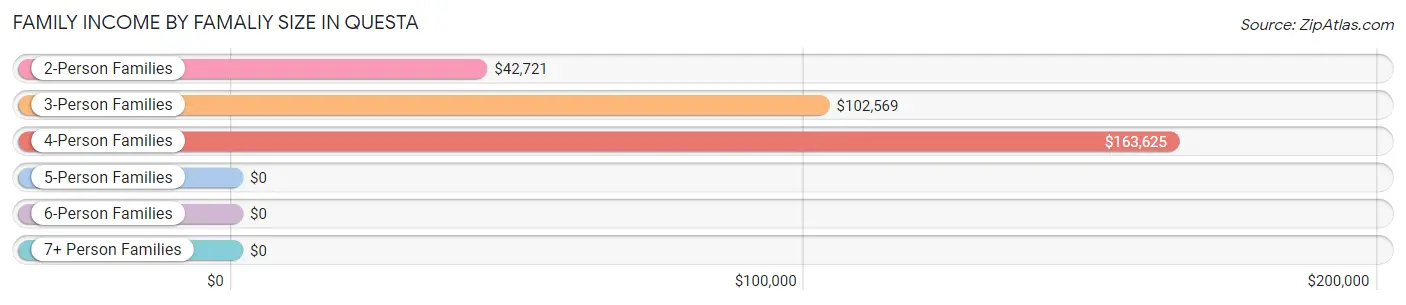
| Income Bracket | # Families | Median Income |
| 2-Person Families | 245 (53.3%) | $42,721 |
| 3-Person Families | 115 (25.0%) | $102,569 |
| 4-Person Families | 40 (8.7%) | $163,625 |
| 5-Person Families | 29 (6.3%) | $0 |
| 6-Person Families | 31 (6.7%) | $0 |
| 7+ Person Families | 0 (0.0%) | $0 |
| Total | 460 (100.0%) | $68,846 |
Family Income by Number of Earners in Questa
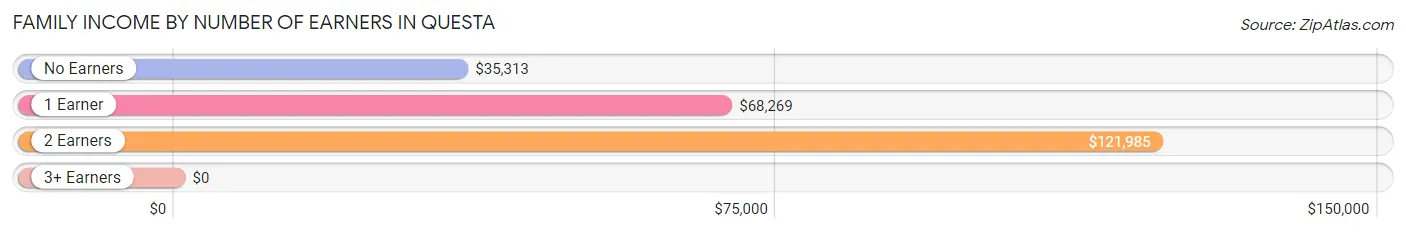
| Number of Earners | # Families | Median Income |
| No Earners | 97 (21.1%) | $35,313 |
| 1 Earner | 194 (42.2%) | $68,269 |
| 2 Earners | 109 (23.7%) | $121,985 |
| 3+ Earners | 60 (13.0%) | $0 |
| Total | 460 (100.0%) | $68,846 |
Household Income in Questa
Household Income Brackets in Questa
With 196 households falling in the category, the $50,000 to $74,999 income range is the most frequent in Questa, accounting for 25.9% of all households.
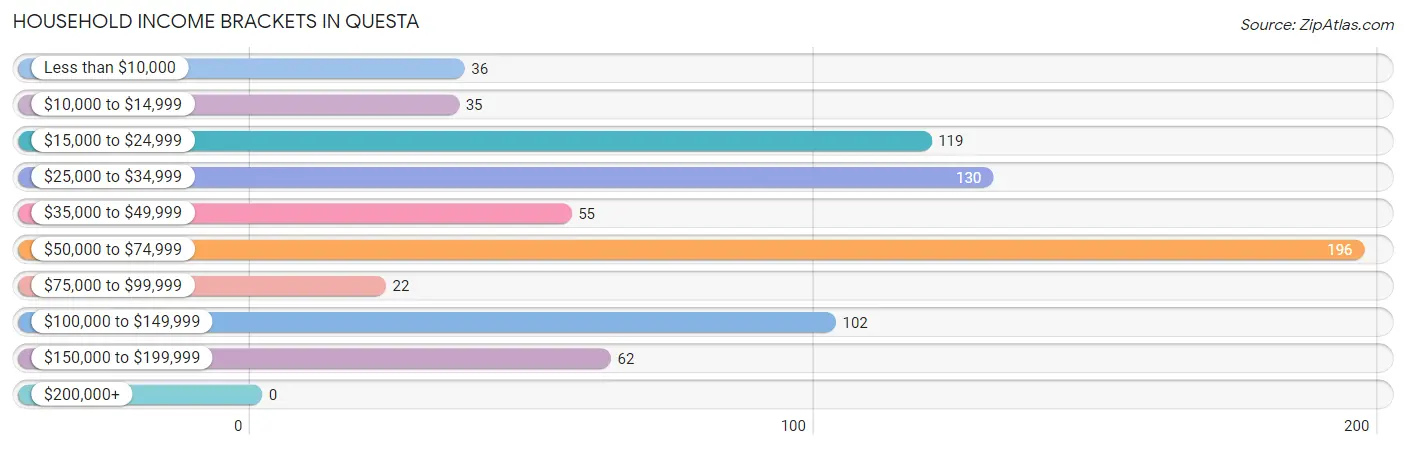
| Income Bracket | # Households | % Households |
| Less than $10,000 | 36 | 4.8% |
| $10,000 to $14,999 | 35 | 4.6% |
| $15,000 to $24,999 | 119 | 15.7% |
| $25,000 to $34,999 | 130 | 17.2% |
| $35,000 to $49,999 | 55 | 7.3% |
| $50,000 to $74,999 | 196 | 25.9% |
| $75,000 to $99,999 | 22 | 2.9% |
| $100,000 to $149,999 | 102 | 13.5% |
| $150,000 to $199,999 | 62 | 8.2% |
| $200,000+ | 0 | 0.0% |
Household Income by Householder Age in Questa
The median household income in Questa is $53,047, with the highest median household income of $60,074 found in the 45 to 64 years age bracket for the primary householder. A total of 307 households (40.6%) fall into this category. Meanwhile, the 15 to 24 years age bracket for the primary householder has the lowest median household income of $0, with 3 households (0.4%) in this group.
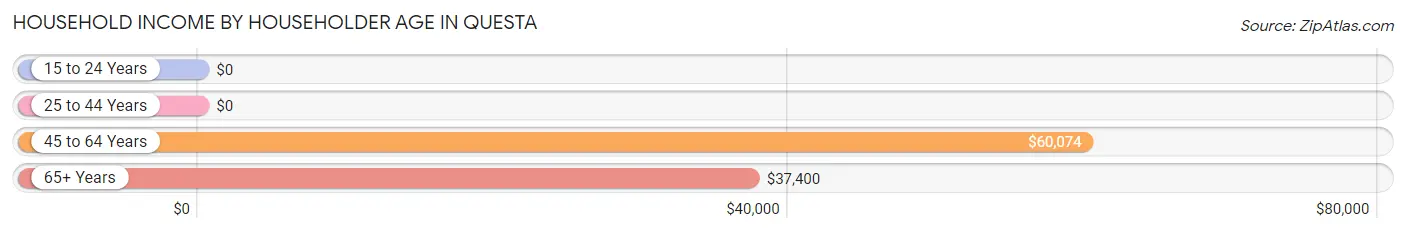
| Income Bracket | # Households | Median Income |
| 15 to 24 Years | 3 (0.4%) | $0 |
| 25 to 44 Years | 231 (30.5%) | $0 |
| 45 to 64 Years | 307 (40.6%) | $60,074 |
| 65+ Years | 216 (28.5%) | $37,400 |
| Total | 757 (100.0%) | $53,047 |
Poverty in Questa
Income Below Poverty by Sex and Age in Questa
With 5.3% poverty level for males and 14.9% for females among the residents of Questa, 65 to 74 year old males and 16 and 17 year old females are the most vulnerable to poverty, with 20 males (27.0%) and 15 females (100.0%) in their respective age groups living below the poverty level.
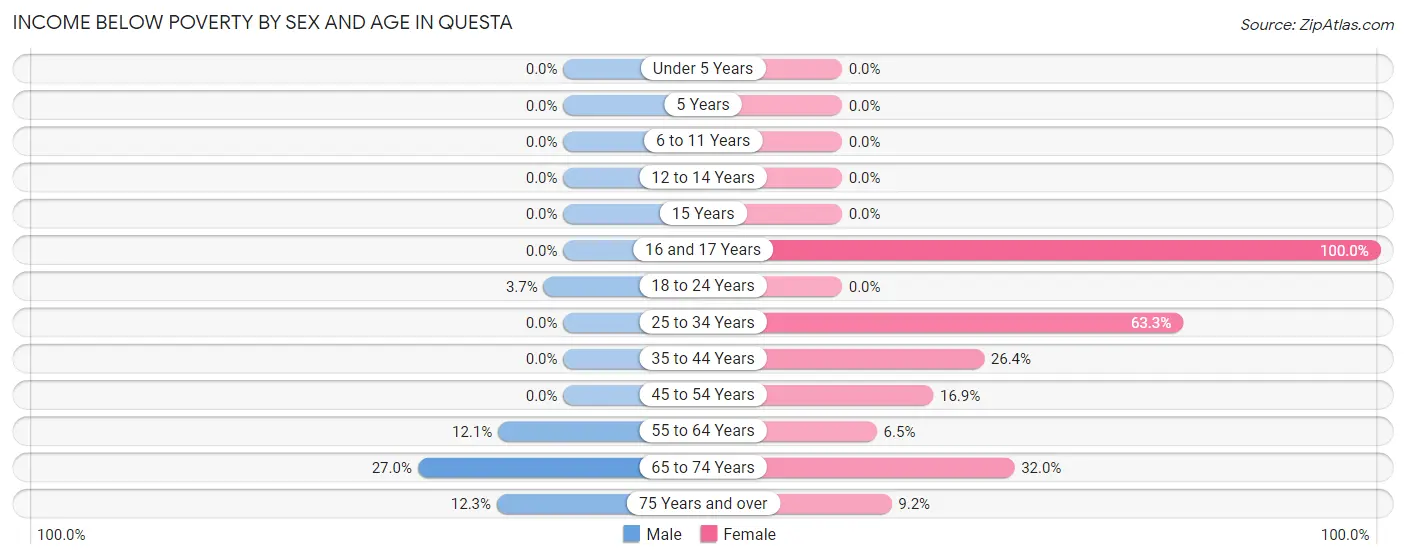
| Age Bracket | Male | Female |
| Under 5 Years | 0 (0.0%) | 0 (0.0%) |
| 5 Years | 0 (0.0%) | 0 (0.0%) |
| 6 to 11 Years | 0 (0.0%) | 0 (0.0%) |
| 12 to 14 Years | 0 (0.0%) | 0 (0.0%) |
| 15 Years | 0 (0.0%) | 0 (0.0%) |
| 16 and 17 Years | 0 (0.0%) | 15 (100.0%) |
| 18 to 24 Years | 6 (3.7%) | 0 (0.0%) |
| 25 to 34 Years | 0 (0.0%) | 19 (63.3%) |
| 35 to 44 Years | 0 (0.0%) | 24 (26.4%) |
| 45 to 54 Years | 0 (0.0%) | 31 (16.9%) |
| 55 to 64 Years | 24 (12.1%) | 11 (6.5%) |
| 65 to 74 Years | 20 (27.0%) | 16 (32.0%) |
| 75 Years and over | 19 (12.3%) | 16 (9.2%) |
| Total | 69 (5.3%) | 132 (14.9%) |
Income Above Poverty by Sex and Age in Questa
According to the poverty statistics in Questa, males aged under 5 years and females aged under 5 years are the age groups that are most secure financially, with 100.0% of males and 100.0% of females in these age groups living above the poverty line.
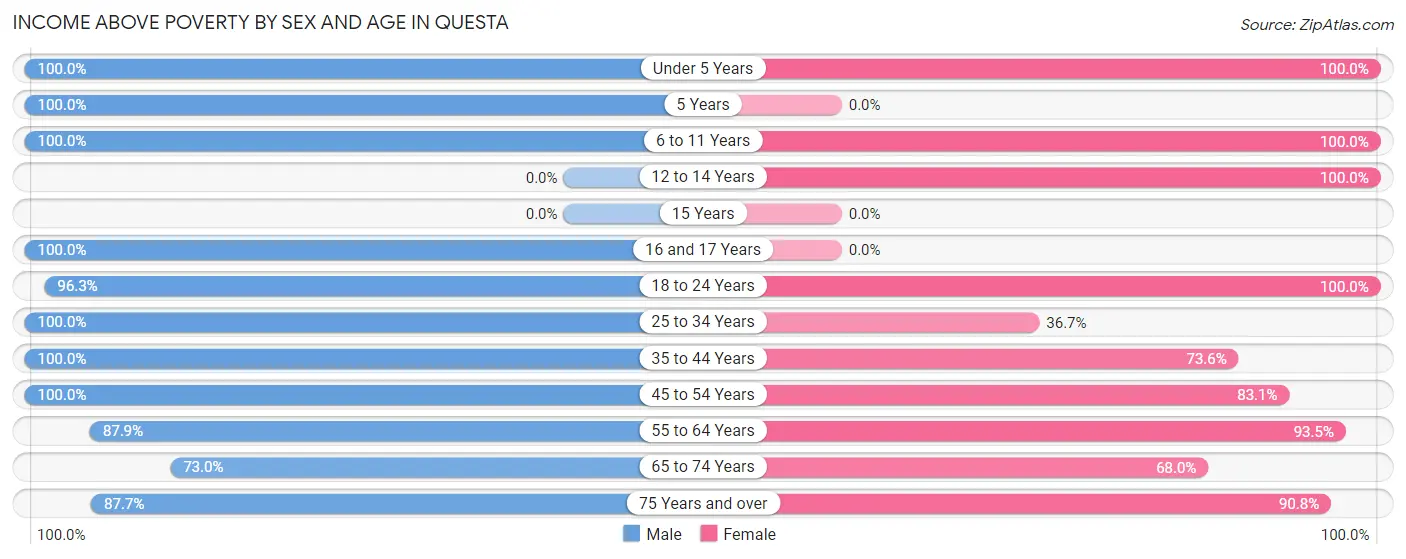
| Age Bracket | Male | Female |
| Under 5 Years | 67 (100.0%) | 31 (100.0%) |
| 5 Years | 36 (100.0%) | 0 (0.0%) |
| 6 to 11 Years | 121 (100.0%) | 30 (100.0%) |
| 12 to 14 Years | 0 (0.0%) | 17 (100.0%) |
| 15 Years | 0 (0.0%) | 0 (0.0%) |
| 16 and 17 Years | 17 (100.0%) | 0 (0.0%) |
| 18 to 24 Years | 157 (96.3%) | 92 (100.0%) |
| 25 to 34 Years | 159 (100.0%) | 11 (36.7%) |
| 35 to 44 Years | 224 (100.0%) | 67 (73.6%) |
| 45 to 54 Years | 83 (100.0%) | 152 (83.1%) |
| 55 to 64 Years | 174 (87.9%) | 159 (93.5%) |
| 65 to 74 Years | 54 (73.0%) | 34 (68.0%) |
| 75 Years and over | 135 (87.7%) | 158 (90.8%) |
| Total | 1,227 (94.7%) | 751 (85.1%) |
Income Below Poverty Among Married-Couple Families in Questa
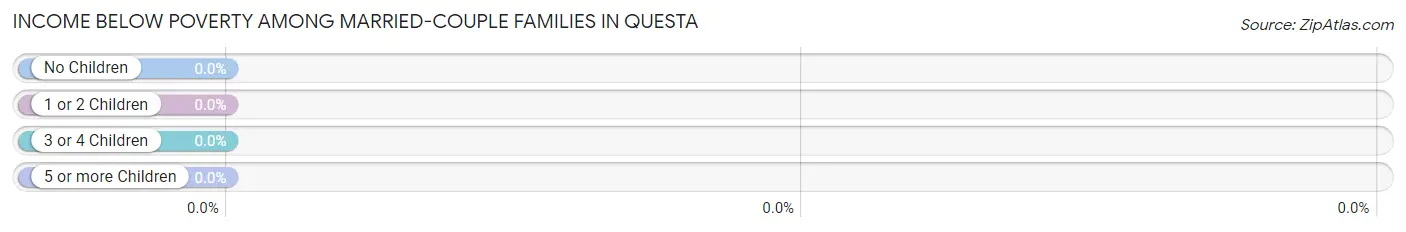
| Children | Above Poverty | Below Poverty |
| No Children | 315 (100.0%) | 0 (0.0%) |
| 1 or 2 Children | 11 (100.0%) | 0 (0.0%) |
| 3 or 4 Children | 60 (100.0%) | 0 (0.0%) |
| 5 or more Children | 0 (0.0%) | 0 (0.0%) |
| Total | 386 (100.0%) | 0 (0.0%) |
Income Below Poverty Among Single-Parent Households in Questa
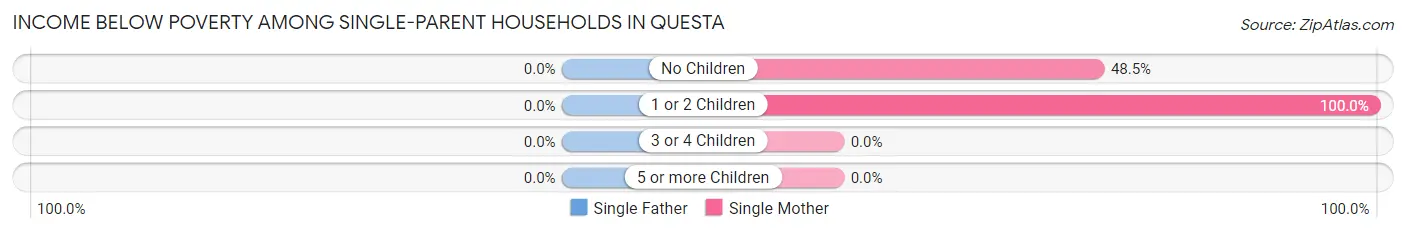
| Children | Single Father | Single Mother |
| No Children | 0 (0.0%) | 16 (48.5%) |
| 1 or 2 Children | 0 (0.0%) | 24 (100.0%) |
| 3 or 4 Children | 0 (0.0%) | 0 (0.0%) |
| 5 or more Children | 0 (0.0%) | 0 (0.0%) |
| Total | 0 (0.0%) | 40 (70.2%) |
Income Below Poverty Among Married-Couple vs Single-Parent Households in Questa
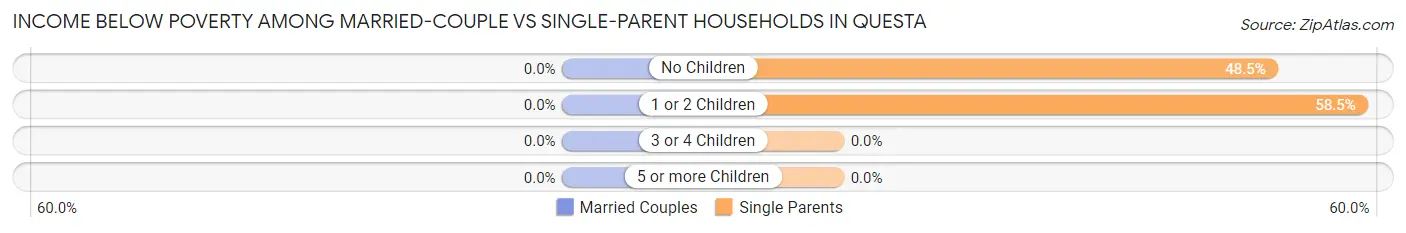
| Children | Married-Couple Families | Single-Parent Households |
| No Children | 0 (0.0%) | 16 (48.5%) |
| 1 or 2 Children | 0 (0.0%) | 24 (58.5%) |
| 3 or 4 Children | 0 (0.0%) | 0 (0.0%) |
| 5 or more Children | 0 (0.0%) | 0 (0.0%) |
| Total | 0 (0.0%) | 40 (54.0%) |
Race in Questa
The most populous races in Questa are Hispanic or Latino (1,977 | 90.7%), White / Caucasian (1,804 | 82.8%), and Some other Race (276 | 12.7%).
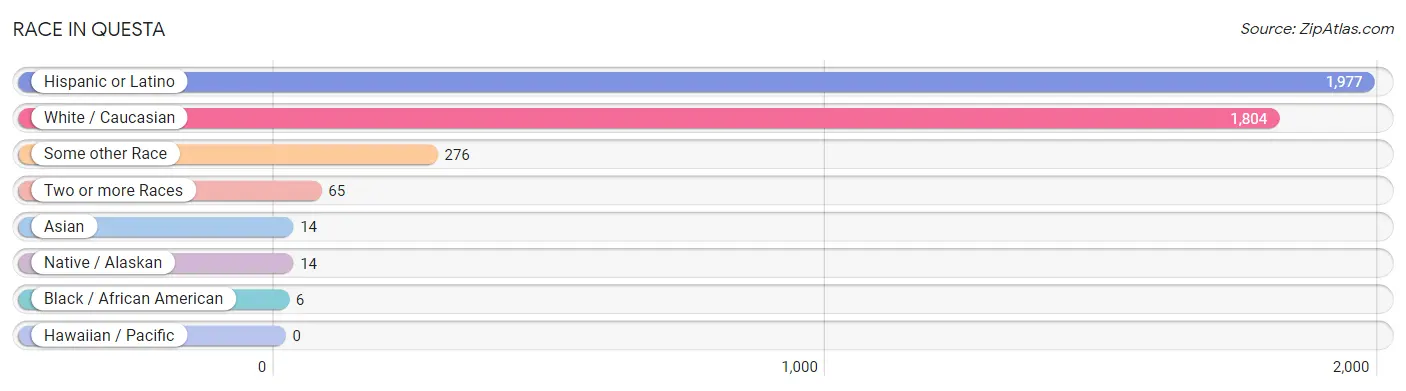
| Race | # Population | % Population |
| Asian | 14 | 0.6% |
| Black / African American | 6 | 0.3% |
| Hawaiian / Pacific | 0 | 0.0% |
| Hispanic or Latino | 1,977 | 90.7% |
| Native / Alaskan | 14 | 0.6% |
| White / Caucasian | 1,804 | 82.8% |
| Two or more Races | 65 | 3.0% |
| Some other Race | 276 | 12.7% |
| Total | 2,179 | 100.0% |
Ancestry in Questa
The most populous ancestries reported in Questa are Spanish (525 | 24.1%), Spaniard (468 | 21.5%), Mexican (339 | 15.6%), Spanish American (228 | 10.5%), and European (51 | 2.3%), together accounting for 73.9% of all Questa residents.
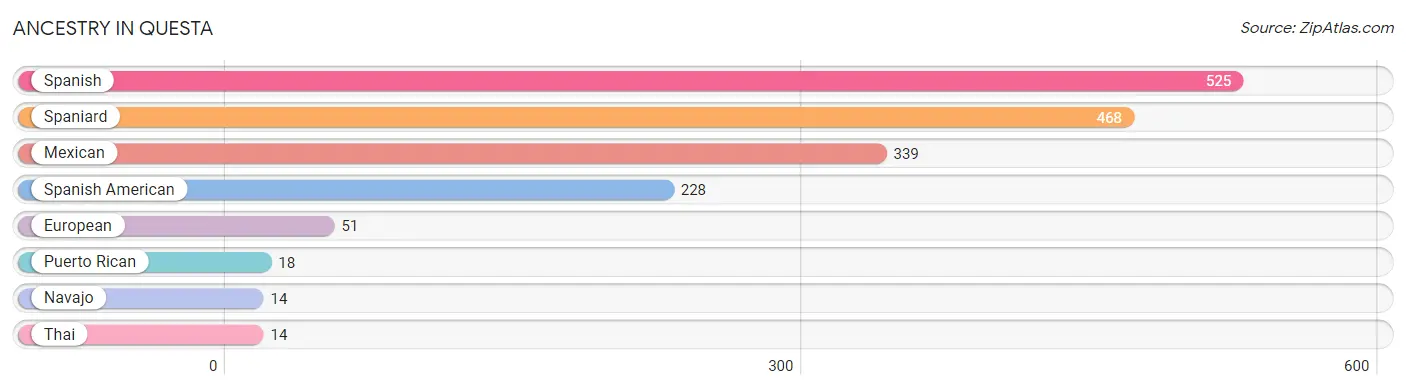
| Ancestry | # Population | % Population |
| European | 51 | 2.3% |
| Mexican | 339 | 15.6% |
| Navajo | 14 | 0.6% |
| Puerto Rican | 18 | 0.8% |
| Spaniard | 468 | 21.5% |
| Spanish | 525 | 24.1% |
| Spanish American | 228 | 10.5% |
| Thai | 14 | 0.6% | View All 8 Rows |
Immigrants in Questa
The most numerous immigrant groups reported in Questa came from Central America (53 | 2.4%), Latin America (53 | 2.4%), Mexico (53 | 2.4%), Africa (14 | 0.6%), and Eastern Africa (14 | 0.6%), together accounting for 8.6% of all Questa residents.
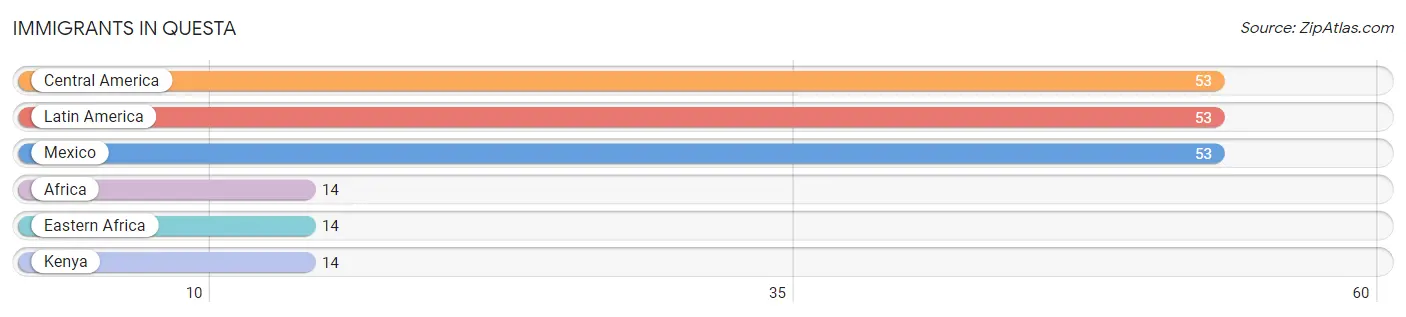
| Immigration Origin | # Population | % Population |
| Africa | 14 | 0.6% |
| Central America | 53 | 2.4% |
| Eastern Africa | 14 | 0.6% |
| Kenya | 14 | 0.6% |
| Latin America | 53 | 2.4% |
| Mexico | 53 | 2.4% | View All 6 Rows |
Sex and Age in Questa
Sex and Age in Questa
The most populous age groups in Questa are 40 to 44 Years (150 | 11.6%) for men and 50 to 54 Years (162 | 18.3%) for women.
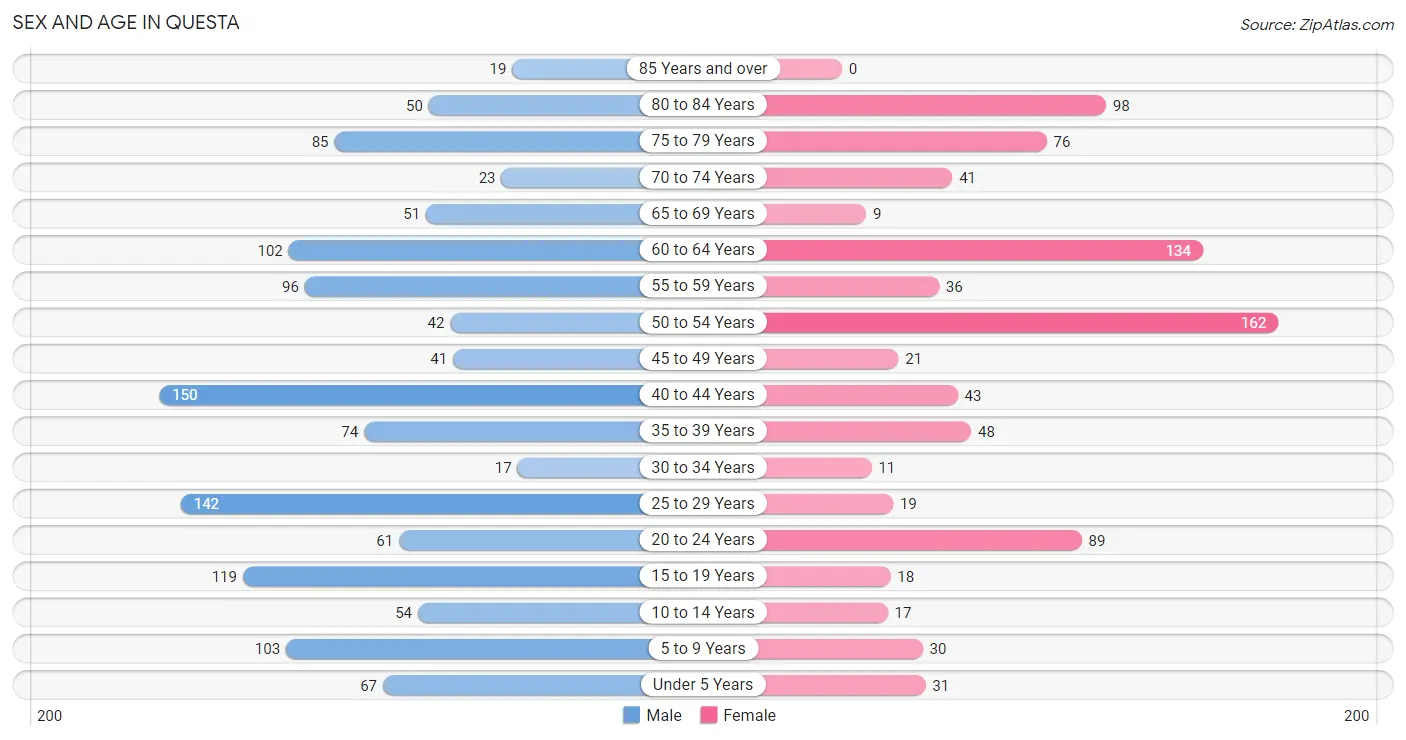
| Age Bracket | Male | Female |
| Under 5 Years | 67 (5.2%) | 31 (3.5%) |
| 5 to 9 Years | 103 (8.0%) | 30 (3.4%) |
| 10 to 14 Years | 54 (4.2%) | 17 (1.9%) |
| 15 to 19 Years | 119 (9.2%) | 18 (2.0%) |
| 20 to 24 Years | 61 (4.7%) | 89 (10.1%) |
| 25 to 29 Years | 142 (11.0%) | 19 (2.1%) |
| 30 to 34 Years | 17 (1.3%) | 11 (1.3%) |
| 35 to 39 Years | 74 (5.7%) | 48 (5.4%) |
| 40 to 44 Years | 150 (11.6%) | 43 (4.9%) |
| 45 to 49 Years | 41 (3.2%) | 21 (2.4%) |
| 50 to 54 Years | 42 (3.2%) | 162 (18.3%) |
| 55 to 59 Years | 96 (7.4%) | 36 (4.1%) |
| 60 to 64 Years | 102 (7.9%) | 134 (15.2%) |
| 65 to 69 Years | 51 (3.9%) | 9 (1.0%) |
| 70 to 74 Years | 23 (1.8%) | 41 (4.6%) |
| 75 to 79 Years | 85 (6.6%) | 76 (8.6%) |
| 80 to 84 Years | 50 (3.9%) | 98 (11.1%) |
| 85 Years and over | 19 (1.5%) | 0 (0.0%) |
| Total | 1,296 (100.0%) | 883 (100.0%) |
Families and Households in Questa
Median Family Size in Questa
The median family size in Questa is 3.84 persons per family, with married-couple families (386 | 83.9%) accounting for the largest median family size of 4.06 persons per family. On the other hand, single male/father families (17 | 3.7%) represent the smallest median family size with 1.94 persons per family.
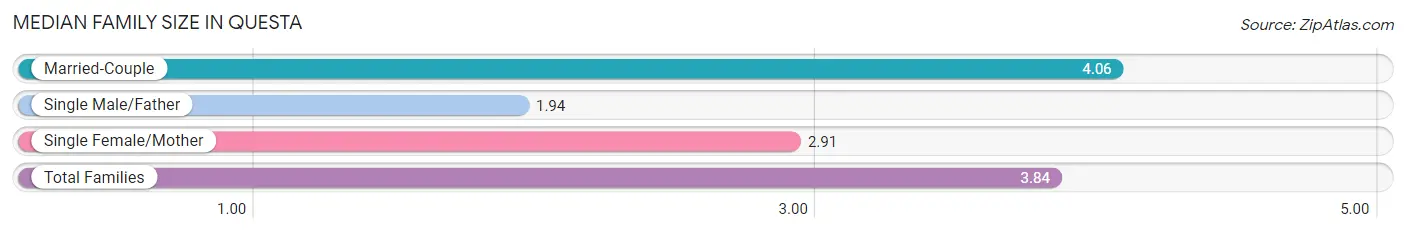
| Family Type | # Families | Family Size |
| Married-Couple | 386 (83.9%) | 4.06 |
| Single Male/Father | 17 (3.7%) | 1.94 |
| Single Female/Mother | 57 (12.4%) | 2.91 |
| Total Families | 460 (100.0%) | 3.84 |
Median Household Size in Questa
The median household size in Questa is 2.88 persons per household, with married-couple households (386 | 51.0%) accounting for the largest median household size of 4.06 persons per household. non-family households (297 | 39.2%) represent the smallest median household size with 1.32 persons per household.
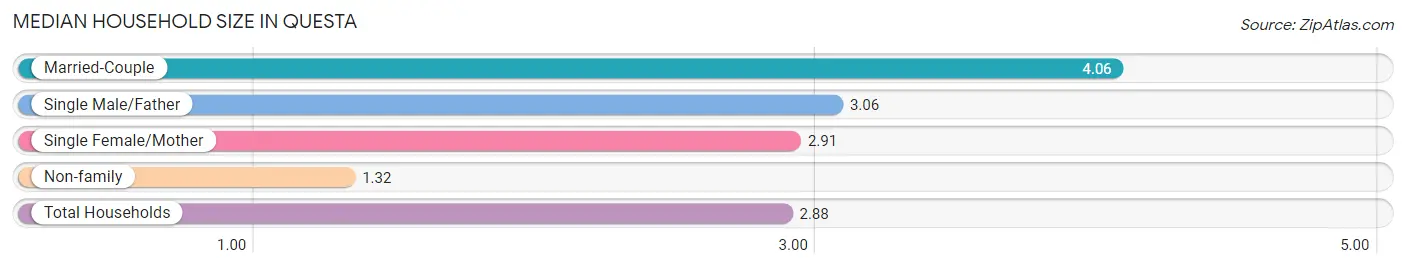
| Household Type | # Households | Household Size |
| Married-Couple | 386 (51.0%) | 4.06 |
| Single Male/Father | 17 (2.2%) | 3.06 |
| Single Female/Mother | 57 (7.5%) | 2.91 |
| Non-family | 297 (39.2%) | 1.32 |
| Total Households | 757 (100.0%) | 2.88 |
Household Size by Marriage Status in Questa
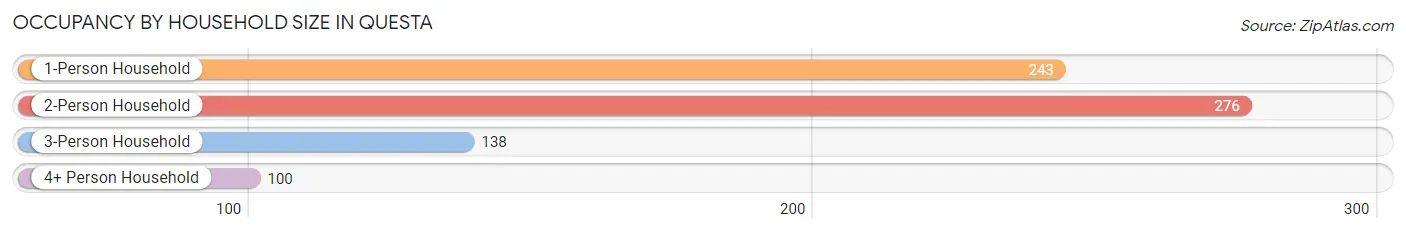
Out of a total of 757 households in Questa, 460 (60.8%) are family households, while 297 (39.2%) are nonfamily households. The most numerous type of family households are 2-person households, comprising 228, and the most common type of nonfamily households are 1-person households, comprising 243.
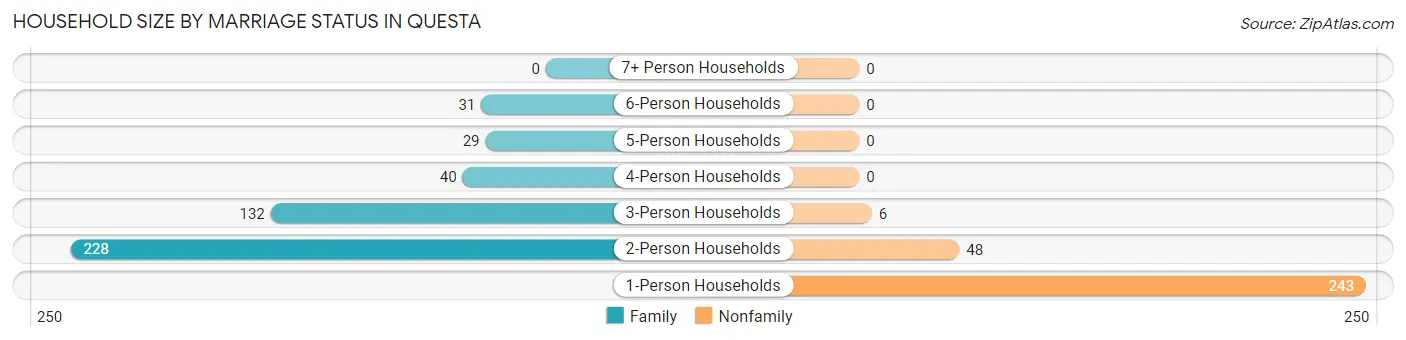
| Household Size | Family Households | Nonfamily Households |
| 1-Person Households | - | 243 (32.1%) |
| 2-Person Households | 228 (30.1%) | 48 (6.3%) |
| 3-Person Households | 132 (17.4%) | 6 (0.8%) |
| 4-Person Households | 40 (5.3%) | 0 (0.0%) |
| 5-Person Households | 29 (3.8%) | 0 (0.0%) |
| 6-Person Households | 31 (4.1%) | 0 (0.0%) |
| 7+ Person Households | 0 (0.0%) | 0 (0.0%) |
| Total | 460 (60.8%) | 297 (39.2%) |
Female Fertility in Questa
Fertility by Age in Questa
| Age Bracket | Women with Births | Births / 1,000 Women |
| 15 to 19 years | 0 (0.0%) | 0.0 |
| 20 to 34 years | 0 (0.0%) | 0.0 |
| 35 to 50 years | 0 (0.0%) | 0.0 |
| Total | 0 (0.0%) | 0.0 |
Fertility by Age by Marriage Status in Questa
| Age Bracket | Married | Unmarried |
| 15 to 19 years | 0 (0.0%) | 0 (0.0%) |
| 20 to 34 years | 0 (0.0%) | 0 (0.0%) |
| 35 to 50 years | 0 (0.0%) | 0 (0.0%) |
| Total | 0 (0.0%) | 0 (0.0%) |
Fertility by Education in Questa
| Educational Attainment | Women with Births | Births / 1,000 Women |
| Less than High School | 0 (0.0%) | 0.0 |
| High School Diploma | 0 (0.0%) | 0.0 |
| College or Associate's Degree | 0 (0.0%) | 0.0 |
| Bachelor's Degree | 0 (0.0%) | 0.0 |
| Graduate Degree | 0 (0.0%) | 0.0 |
| Total | 0 (0.0%) | 0.0 |
Fertility by Education by Marriage Status in Questa
| Educational Attainment | Married | Unmarried |
| Less than High School | 0 (0.0%) | 0 (0.0%) |
| High School Diploma | 0 (0.0%) | 0 (0.0%) |
| College or Associate's Degree | 0 (0.0%) | 0 (0.0%) |
| Bachelor's Degree | 0 (0.0%) | 0 (0.0%) |
| Graduate Degree | 0 (0.0%) | 0 (0.0%) |
| Total | 0 (0.0%) | 0 (0.0%) |
Employment Characteristics in Questa
Employment by Class of Employer in Questa
Among the 991 employed individuals in Questa, private company employees (642 | 64.8%), local government employees (121 | 12.2%), and self-employed (not incorporated) (81 | 8.2%) make up the most common classes of employment.
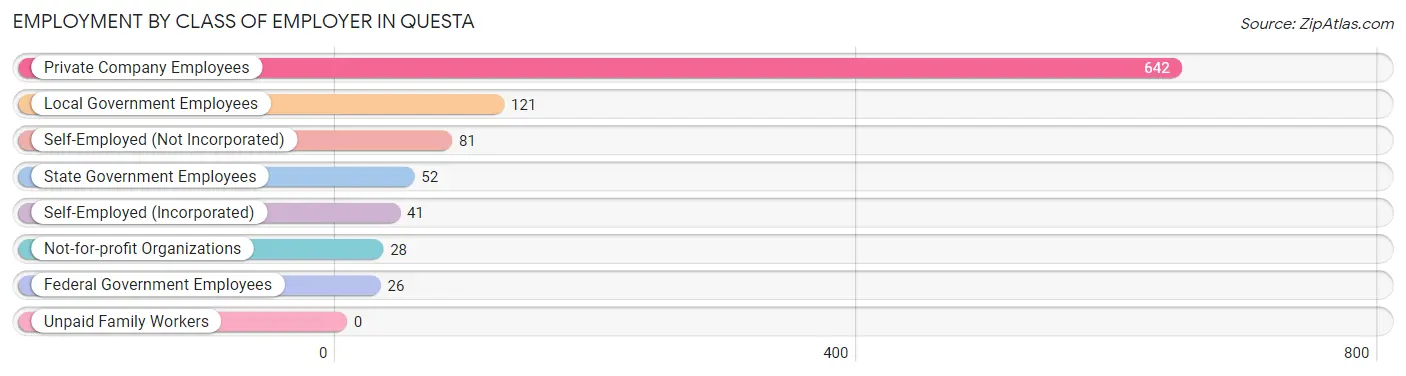
| Employer Class | # Employees | % Employees |
| Private Company Employees | 642 | 64.8% |
| Self-Employed (Incorporated) | 41 | 4.1% |
| Self-Employed (Not Incorporated) | 81 | 8.2% |
| Not-for-profit Organizations | 28 | 2.8% |
| Local Government Employees | 121 | 12.2% |
| State Government Employees | 52 | 5.2% |
| Federal Government Employees | 26 | 2.6% |
| Unpaid Family Workers | 0 | 0.0% |
| Total | 991 | 100.0% |
Employment Status by Age in Questa
According to the labor force statistics for Questa, out of the total population over 16 years of age (1,877), 53.1% or 997 individuals are in the labor force, with 0.6% or 6 of them unemployed. The age group with the highest labor force participation rate is 16 to 19 years, with 100.0% or 137 individuals in the labor force. Within the labor force, the 20 to 24 years age range has the highest percentage of unemployed individuals, with 9.1% or 6 of them being unemployed.
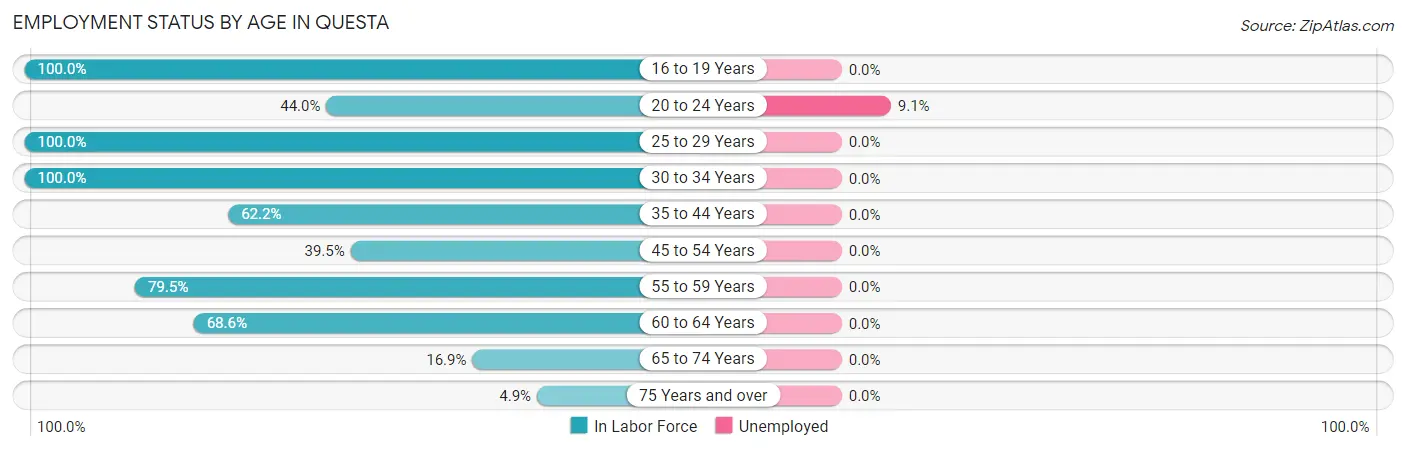
| Age Bracket | In Labor Force | Unemployed |
| 16 to 19 Years | 137 (100.0%) | 0 (0.0%) |
| 20 to 24 Years | 66 (44.0%) | 6 (9.1%) |
| 25 to 29 Years | 161 (100.0%) | 0 (0.0%) |
| 30 to 34 Years | 28 (100.0%) | 0 (0.0%) |
| 35 to 44 Years | 196 (62.2%) | 0 (0.0%) |
| 45 to 54 Years | 105 (39.5%) | 0 (0.0%) |
| 55 to 59 Years | 105 (79.5%) | 0 (0.0%) |
| 60 to 64 Years | 162 (68.6%) | 0 (0.0%) |
| 65 to 74 Years | 21 (16.9%) | 0 (0.0%) |
| 75 Years and over | 16 (4.9%) | 0 (0.0%) |
| Total | 997 (53.1%) | 6 (0.6%) |
Employment Status by Educational Attainment in Questa
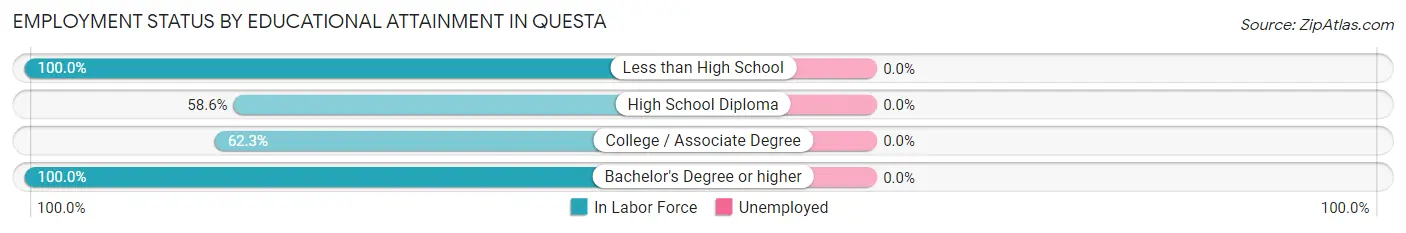
| Educational Attainment | In Labor Force | Unemployed |
| Less than High School | 42 (100.0%) | 0 (0.0%) |
| High School Diploma | 265 (58.6%) | 0 (0.0%) |
| College / Associate Degree | 321 (62.3%) | 0 (0.0%) |
| Bachelor's Degree or higher | 129 (100.0%) | 0 (0.0%) |
| Total | 757 (66.5%) | 0 (0.0%) |
Employment Occupations by Sex in Questa
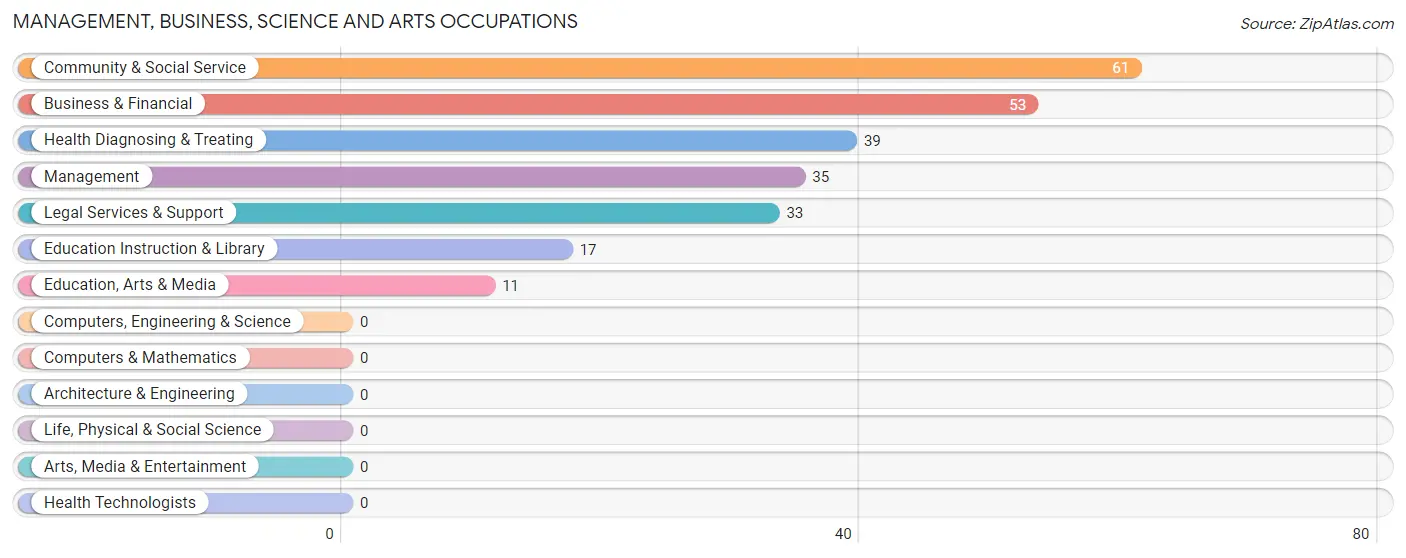
Management, Business, Science and Arts Occupations
The most common Management, Business, Science and Arts occupations in Questa are Community & Social Service (61 | 6.2%), Business & Financial (53 | 5.3%), Health Diagnosing & Treating (39 | 3.9%), Management (35 | 3.5%), and Legal Services & Support (33 | 3.3%).
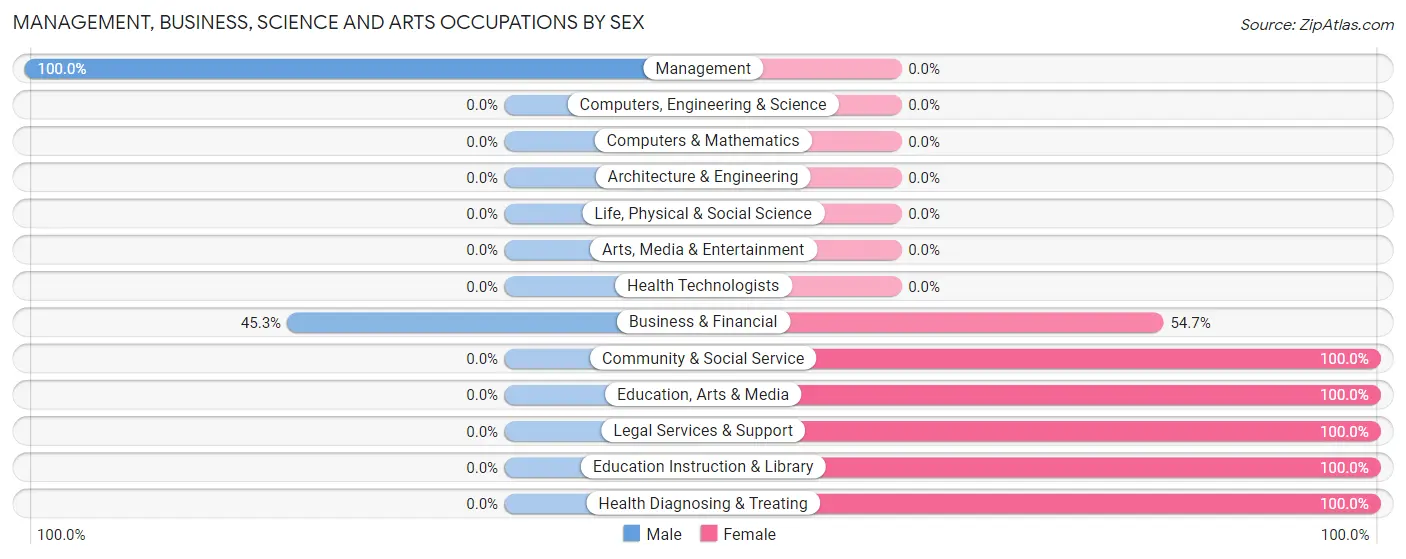
Management, Business, Science and Arts Occupations by Sex
Within the Management, Business, Science and Arts occupations in Questa, the most male-oriented occupations are Management (100.0%), and Business & Financial (45.3%), while the most female-oriented occupations are Community & Social Service (100.0%), Education, Arts & Media (100.0%), and Legal Services & Support (100.0%).
| Occupation | Male | Female |
| Management | 35 (100.0%) | 0 (0.0%) |
| Business & Financial | 24 (45.3%) | 29 (54.7%) |
| Computers, Engineering & Science | 0 (0.0%) | 0 (0.0%) |
| Computers & Mathematics | 0 (0.0%) | 0 (0.0%) |
| Architecture & Engineering | 0 (0.0%) | 0 (0.0%) |
| Life, Physical & Social Science | 0 (0.0%) | 0 (0.0%) |
| Community & Social Service | 0 (0.0%) | 61 (100.0%) |
| Education, Arts & Media | 0 (0.0%) | 11 (100.0%) |
| Legal Services & Support | 0 (0.0%) | 33 (100.0%) |
| Education Instruction & Library | 0 (0.0%) | 17 (100.0%) |
| Arts, Media & Entertainment | 0 (0.0%) | 0 (0.0%) |
| Health Diagnosing & Treating | 0 (0.0%) | 39 (100.0%) |
| Health Technologists | 0 (0.0%) | 0 (0.0%) |
| Total (Category) | 59 (31.4%) | 129 (68.6%) |
| Total (Overall) | 633 (63.9%) | 358 (36.1%) |
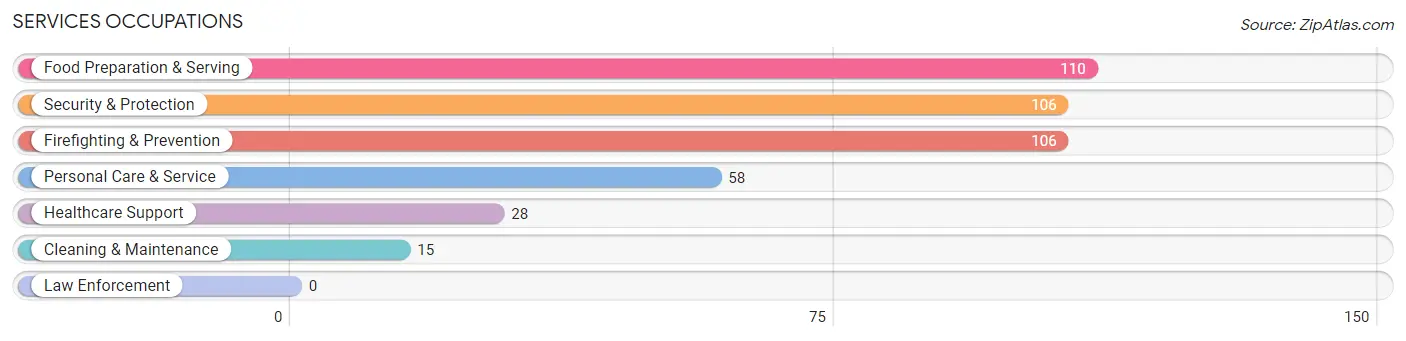
Services Occupations
The most common Services occupations in Questa are Food Preparation & Serving (110 | 11.1%), Security & Protection (106 | 10.7%), Firefighting & Prevention (106 | 10.7%), Personal Care & Service (58 | 5.9%), and Healthcare Support (28 | 2.8%).
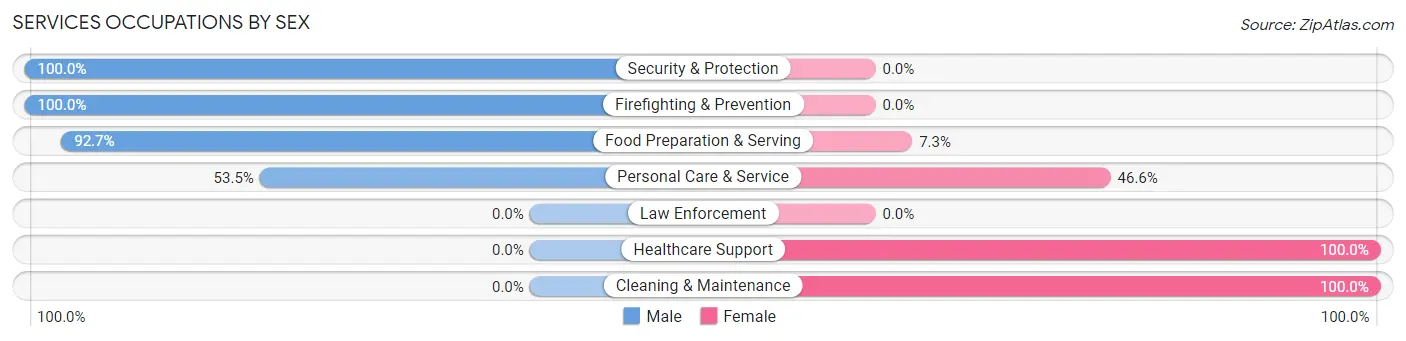
Services Occupations by Sex
Within the Services occupations in Questa, the most male-oriented occupations are Security & Protection (100.0%), Firefighting & Prevention (100.0%), and Food Preparation & Serving (92.7%), while the most female-oriented occupations are Healthcare Support (100.0%), Cleaning & Maintenance (100.0%), and Personal Care & Service (46.6%).
| Occupation | Male | Female |
| Healthcare Support | 0 (0.0%) | 28 (100.0%) |
| Security & Protection | 106 (100.0%) | 0 (0.0%) |
| Firefighting & Prevention | 106 (100.0%) | 0 (0.0%) |
| Law Enforcement | 0 (0.0%) | 0 (0.0%) |
| Food Preparation & Serving | 102 (92.7%) | 8 (7.3%) |
| Cleaning & Maintenance | 0 (0.0%) | 15 (100.0%) |
| Personal Care & Service | 31 (53.4%) | 27 (46.6%) |
| Total (Category) | 239 (75.4%) | 78 (24.6%) |
| Total (Overall) | 633 (63.9%) | 358 (36.1%) |
Sales and Office Occupations
The most common Sales and Office occupations in Questa are Sales & Related (119 | 12.0%), and Office & Administration (42 | 4.2%).
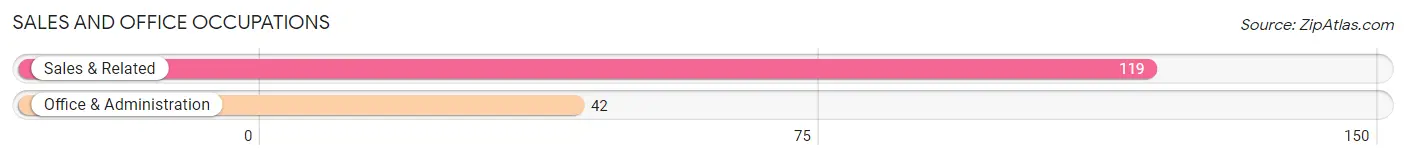
Sales and Office Occupations by Sex
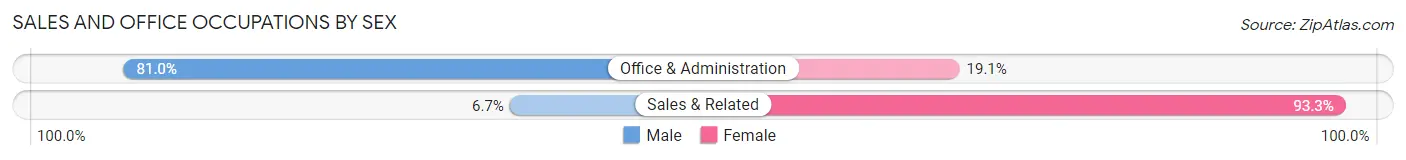
| Occupation | Male | Female |
| Sales & Related | 8 (6.7%) | 111 (93.3%) |
| Office & Administration | 34 (80.9%) | 8 (19.1%) |
| Total (Category) | 42 (26.1%) | 119 (73.9%) |
| Total (Overall) | 633 (63.9%) | 358 (36.1%) |
Natural Resources, Construction and Maintenance Occupations
The most common Natural Resources, Construction and Maintenance occupations in Questa are , and Construction & Extraction (254 | 25.6%).
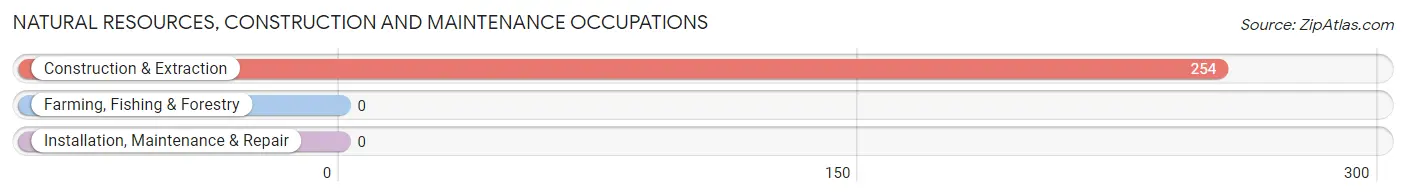
Natural Resources, Construction and Maintenance Occupations by Sex
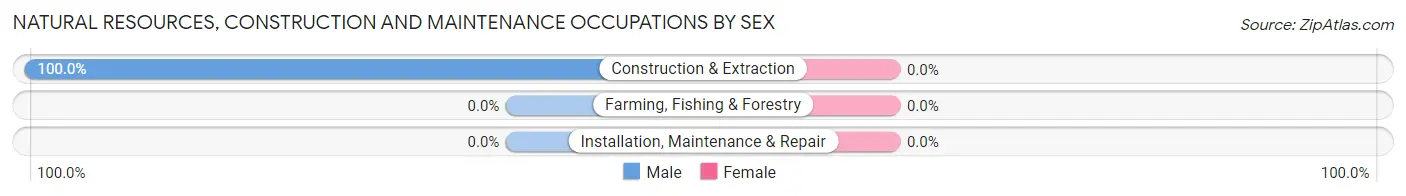
| Occupation | Male | Female |
| Farming, Fishing & Forestry | 0 (0.0%) | 0 (0.0%) |
| Construction & Extraction | 254 (100.0%) | 0 (0.0%) |
| Installation, Maintenance & Repair | 0 (0.0%) | 0 (0.0%) |
| Total (Category) | 254 (100.0%) | 0 (0.0%) |
| Total (Overall) | 633 (63.9%) | 358 (36.1%) |
Production, Transportation and Moving Occupations
The most common Production, Transportation and Moving occupations in Questa are Production (48 | 4.8%), and Material Moving (23 | 2.3%).
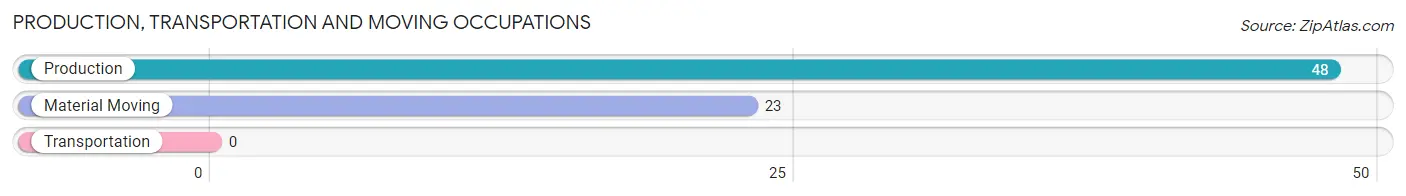
Production, Transportation and Moving Occupations by Sex
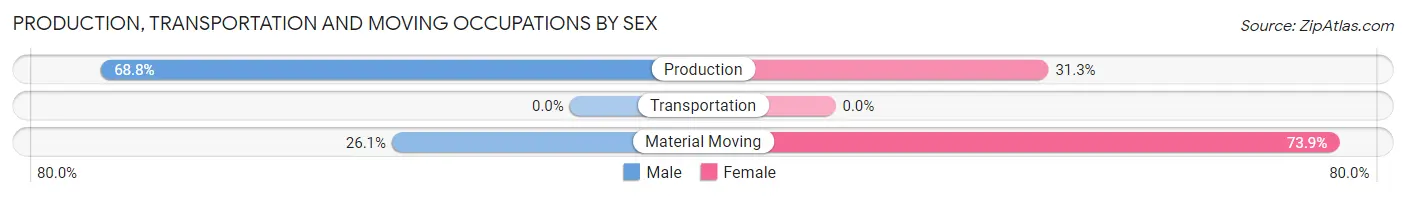
| Occupation | Male | Female |
| Production | 33 (68.8%) | 15 (31.2%) |
| Transportation | 0 (0.0%) | 0 (0.0%) |
| Material Moving | 6 (26.1%) | 17 (73.9%) |
| Total (Category) | 39 (54.9%) | 32 (45.1%) |
| Total (Overall) | 633 (63.9%) | 358 (36.1%) |
Employment Industries by Sex in Questa
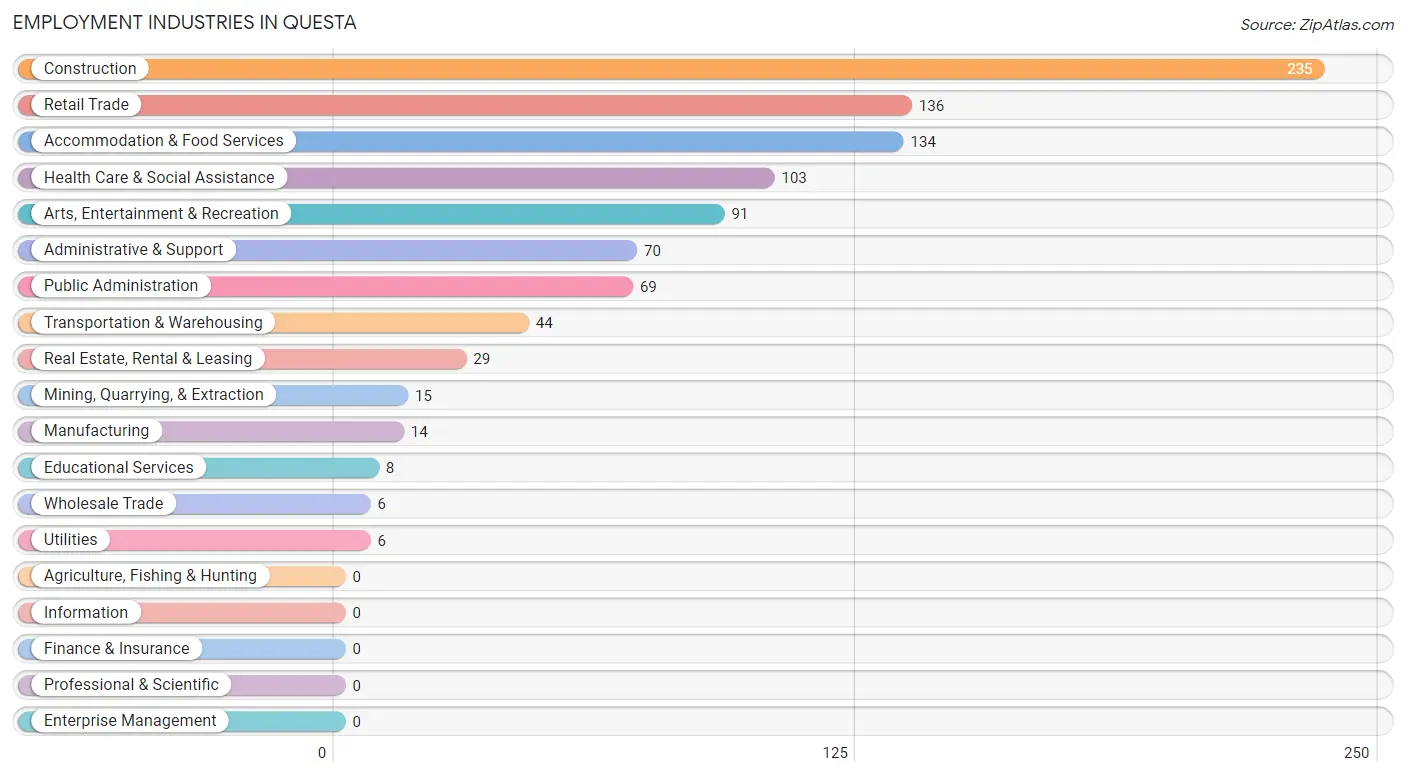
Employment Industries in Questa
The major employment industries in Questa include Construction (235 | 23.7%), Retail Trade (136 | 13.7%), Accommodation & Food Services (134 | 13.5%), Health Care & Social Assistance (103 | 10.4%), and Arts, Entertainment & Recreation (91 | 9.2%).
Employment Industries by Sex in Questa
The Questa industries that see more men than women are Mining, Quarrying, & Extraction (100.0%), Construction (100.0%), and Wholesale Trade (100.0%), whereas the industries that tend to have a higher number of women are Manufacturing (100.0%), Educational Services (100.0%), and Health Care & Social Assistance (100.0%).
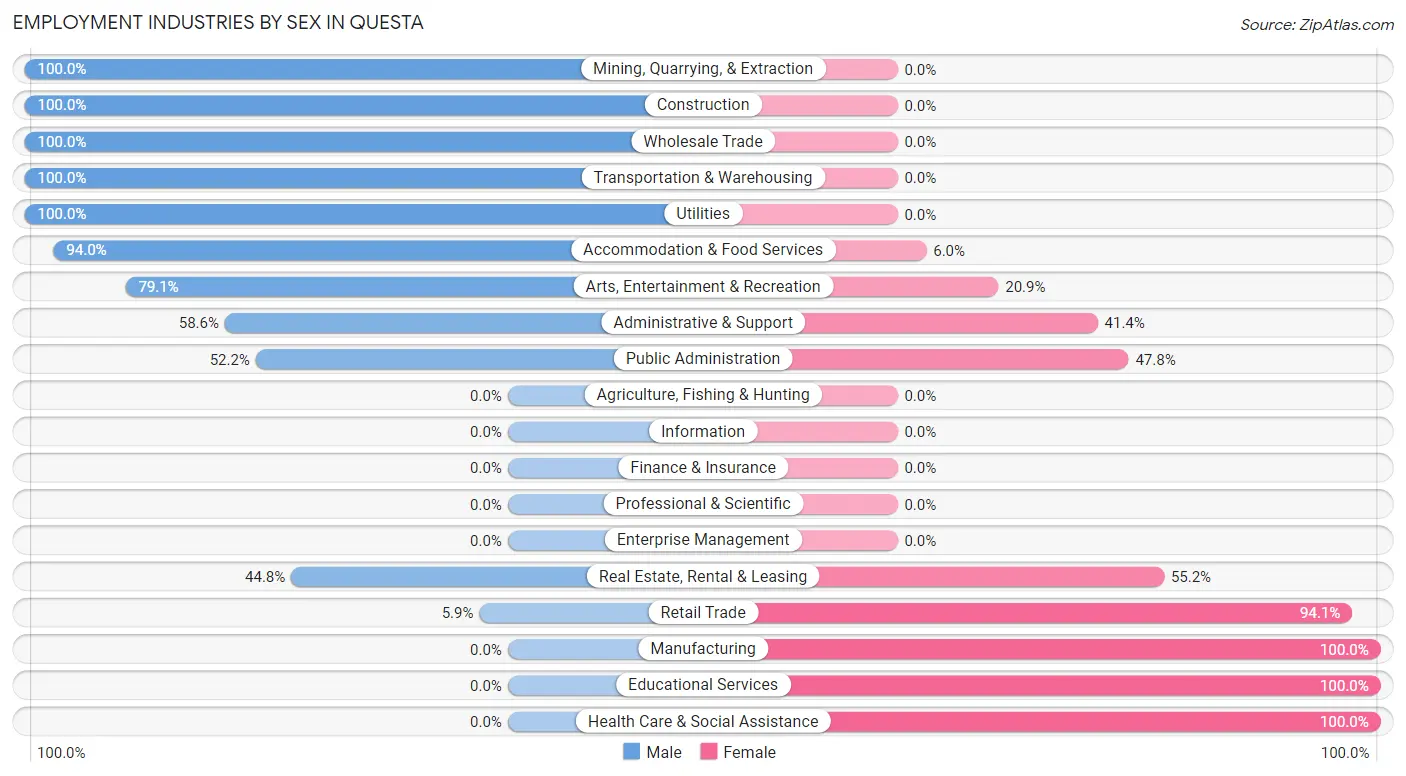
| Industry | Male | Female |
| Agriculture, Fishing & Hunting | 0 (0.0%) | 0 (0.0%) |
| Mining, Quarrying, & Extraction | 15 (100.0%) | 0 (0.0%) |
| Construction | 235 (100.0%) | 0 (0.0%) |
| Manufacturing | 0 (0.0%) | 14 (100.0%) |
| Wholesale Trade | 6 (100.0%) | 0 (0.0%) |
| Retail Trade | 8 (5.9%) | 128 (94.1%) |
| Transportation & Warehousing | 44 (100.0%) | 0 (0.0%) |
| Utilities | 6 (100.0%) | 0 (0.0%) |
| Information | 0 (0.0%) | 0 (0.0%) |
| Finance & Insurance | 0 (0.0%) | 0 (0.0%) |
| Real Estate, Rental & Leasing | 13 (44.8%) | 16 (55.2%) |
| Professional & Scientific | 0 (0.0%) | 0 (0.0%) |
| Enterprise Management | 0 (0.0%) | 0 (0.0%) |
| Administrative & Support | 41 (58.6%) | 29 (41.4%) |
| Educational Services | 0 (0.0%) | 8 (100.0%) |
| Health Care & Social Assistance | 0 (0.0%) | 103 (100.0%) |
| Arts, Entertainment & Recreation | 72 (79.1%) | 19 (20.9%) |
| Accommodation & Food Services | 126 (94.0%) | 8 (6.0%) |
| Public Administration | 36 (52.2%) | 33 (47.8%) |
| Total | 633 (63.9%) | 358 (36.1%) |
Education in Questa
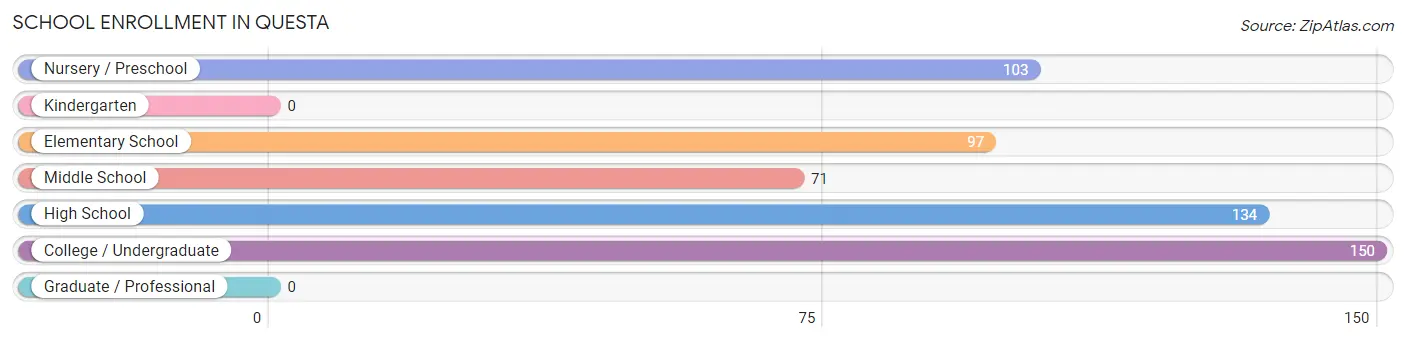
School Enrollment in Questa
The most common levels of schooling among the 555 students in Questa are college / undergraduate (150 | 27.0%), high school (134 | 24.1%), and nursery / preschool (103 | 18.6%).
| School Level | # Students | % Students |
| Nursery / Preschool | 103 | 18.6% |
| Kindergarten | 0 | 0.0% |
| Elementary School | 97 | 17.5% |
| Middle School | 71 | 12.8% |
| High School | 134 | 24.1% |
| College / Undergraduate | 150 | 27.0% |
| Graduate / Professional | 0 | 0.0% |
| Total | 555 | 100.0% |
School Enrollment by Age by Funding Source in Questa
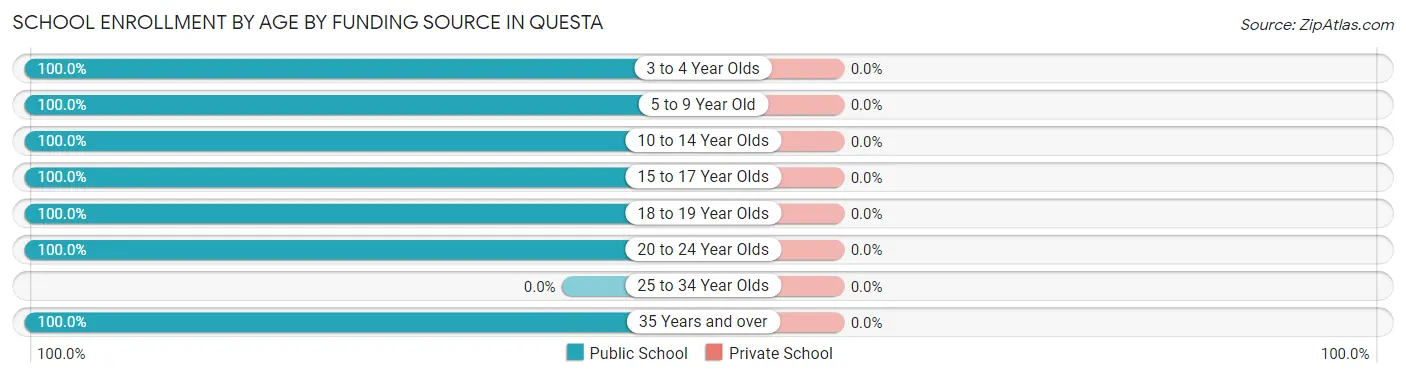
| Age Bracket | Public School | Private School |
| 3 to 4 Year Olds | 67 (100.0%) | 0 (0.0%) |
| 5 to 9 Year Old | 133 (100.0%) | 0 (0.0%) |
| 10 to 14 Year Olds | 71 (100.0%) | 0 (0.0%) |
| 15 to 17 Year Olds | 32 (100.0%) | 0 (0.0%) |
| 18 to 19 Year Olds | 102 (100.0%) | 0 (0.0%) |
| 20 to 24 Year Olds | 84 (100.0%) | 0 (0.0%) |
| 25 to 34 Year Olds | 0 (0.0%) | 0 (0.0%) |
| 35 Years and over | 66 (100.0%) | 0 (0.0%) |
| Total | 555 (100.0%) | 0 (0.0%) |
Educational Attainment by Field of Study in Questa
Business (48 | 22.2%), social sciences (33 | 15.3%), education (33 | 15.3%), engineering (31 | 14.3%), and visual & performing arts (20 | 9.3%) are the most common fields of study among 216 individuals in Questa who have obtained a bachelor's degree or higher.
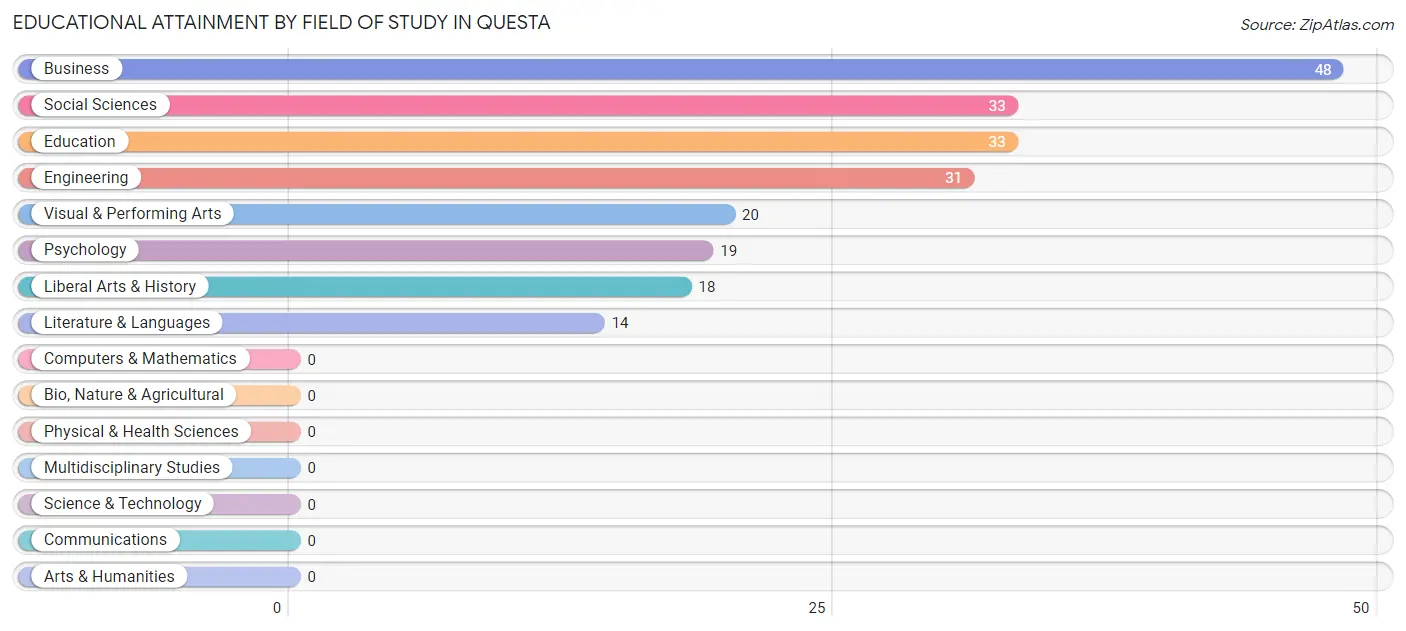
| Field of Study | # Graduates | % Graduates |
| Computers & Mathematics | 0 | 0.0% |
| Bio, Nature & Agricultural | 0 | 0.0% |
| Physical & Health Sciences | 0 | 0.0% |
| Psychology | 19 | 8.8% |
| Social Sciences | 33 | 15.3% |
| Engineering | 31 | 14.3% |
| Multidisciplinary Studies | 0 | 0.0% |
| Science & Technology | 0 | 0.0% |
| Business | 48 | 22.2% |
| Education | 33 | 15.3% |
| Literature & Languages | 14 | 6.5% |
| Liberal Arts & History | 18 | 8.3% |
| Visual & Performing Arts | 20 | 9.3% |
| Communications | 0 | 0.0% |
| Arts & Humanities | 0 | 0.0% |
| Total | 216 | 100.0% |
Transportation & Commute in Questa
Vehicle Availability by Sex in Questa
The most prevalent vehicle ownership categories in Questa are males with 2 vehicles (276, accounting for 43.6%) and females with 2 vehicles (124, making up 77.1%).
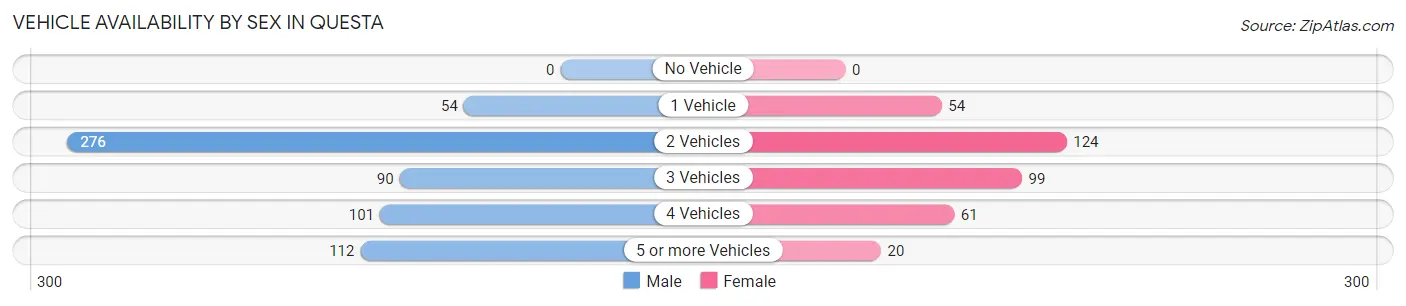
| Vehicles Available | Male | Female |
| No Vehicle | 0 (0.0%) | 0 (0.0%) |
| 1 Vehicle | 54 (8.5%) | 54 (15.1%) |
| 2 Vehicles | 276 (43.6%) | 124 (34.6%) |
| 3 Vehicles | 90 (14.2%) | 99 (27.7%) |
| 4 Vehicles | 101 (16.0%) | 61 (17.0%) |
| 5 or more Vehicles | 112 (17.7%) | 20 (5.6%) |
| Total | 633 (100.0%) | 358 (100.0%) |
Commute Time in Questa
The most frequently occuring commute durations in Questa are 45 to 59 minutes (153 commuters, 20.2%), 30 to 34 minutes (134 commuters, 17.6%), and 5 to 9 minutes (131 commuters, 17.3%).
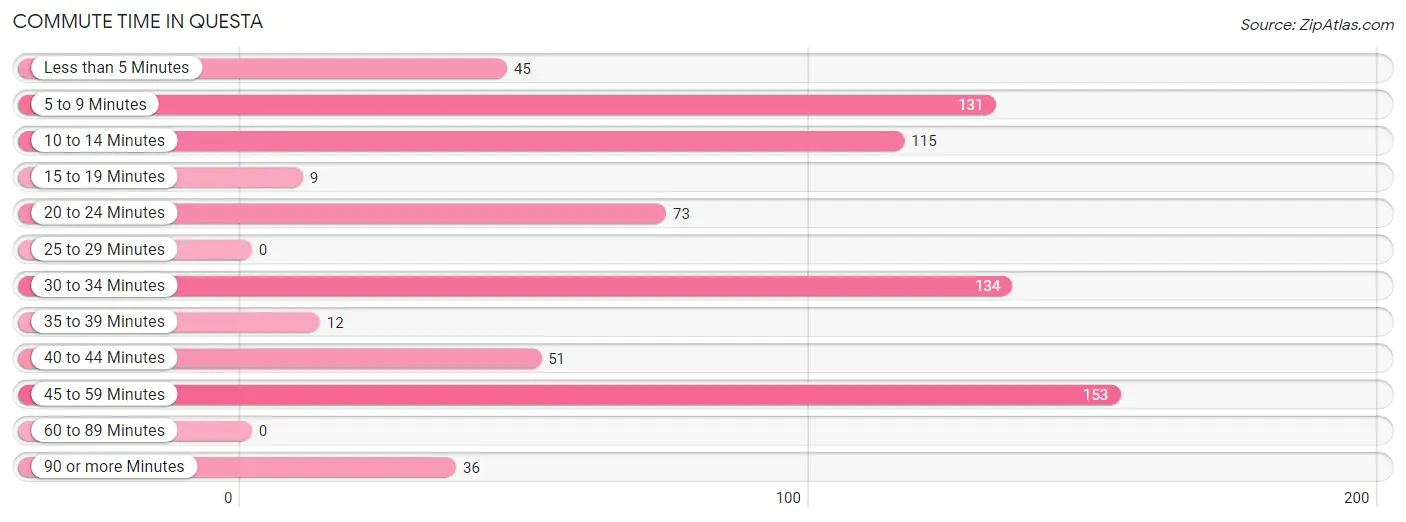
| Commute Time | # Commuters | % Commuters |
| Less than 5 Minutes | 45 | 5.9% |
| 5 to 9 Minutes | 131 | 17.3% |
| 10 to 14 Minutes | 115 | 15.1% |
| 15 to 19 Minutes | 9 | 1.2% |
| 20 to 24 Minutes | 73 | 9.6% |
| 25 to 29 Minutes | 0 | 0.0% |
| 30 to 34 Minutes | 134 | 17.6% |
| 35 to 39 Minutes | 12 | 1.6% |
| 40 to 44 Minutes | 51 | 6.7% |
| 45 to 59 Minutes | 153 | 20.2% |
| 60 to 89 Minutes | 0 | 0.0% |
| 90 or more Minutes | 36 | 4.7% |
Commute Time by Sex in Questa
The most common commute times in Questa are 5 to 9 minutes (102 commuters, 20.7%) for males and 10 to 14 minutes (57 commuters, 21.4%) for females.
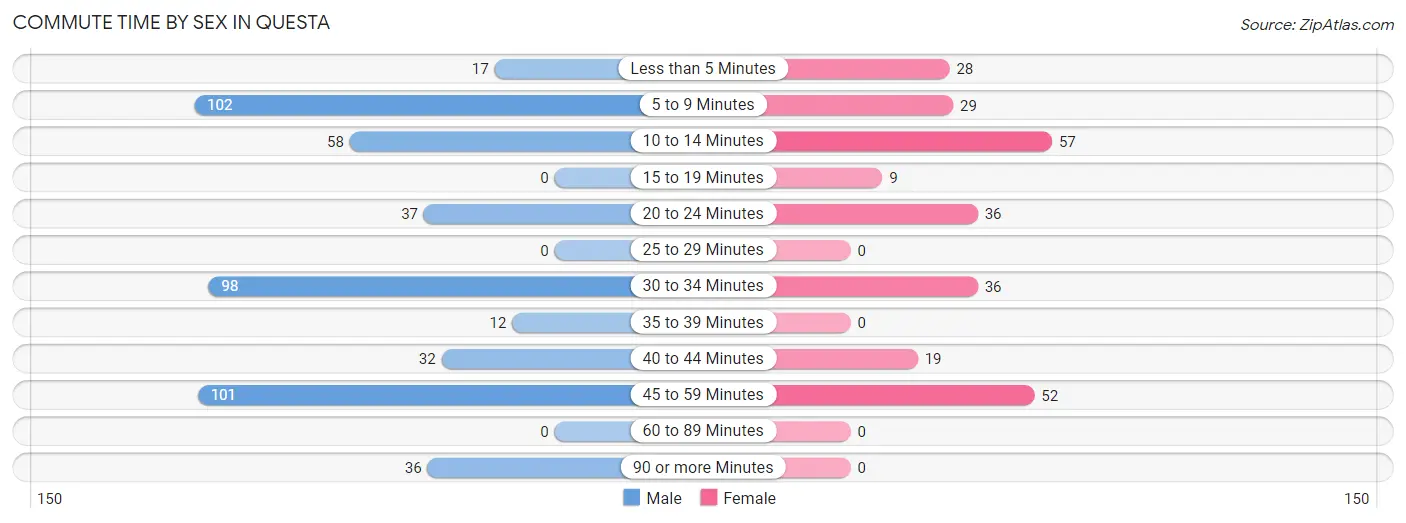
| Commute Time | Male | Female |
| Less than 5 Minutes | 17 (3.5%) | 28 (10.5%) |
| 5 to 9 Minutes | 102 (20.7%) | 29 (10.9%) |
| 10 to 14 Minutes | 58 (11.8%) | 57 (21.4%) |
| 15 to 19 Minutes | 0 (0.0%) | 9 (3.4%) |
| 20 to 24 Minutes | 37 (7.5%) | 36 (13.5%) |
| 25 to 29 Minutes | 0 (0.0%) | 0 (0.0%) |
| 30 to 34 Minutes | 98 (19.9%) | 36 (13.5%) |
| 35 to 39 Minutes | 12 (2.4%) | 0 (0.0%) |
| 40 to 44 Minutes | 32 (6.5%) | 19 (7.1%) |
| 45 to 59 Minutes | 101 (20.5%) | 52 (19.6%) |
| 60 to 89 Minutes | 0 (0.0%) | 0 (0.0%) |
| 90 or more Minutes | 36 (7.3%) | 0 (0.0%) |
Time of Departure to Work by Sex in Questa
The most frequent times of departure to work in Questa are 12:00 AM to 4:59 AM (172, 34.9%) for males and 9:00 AM to 9:59 AM (53, 19.9%) for females.
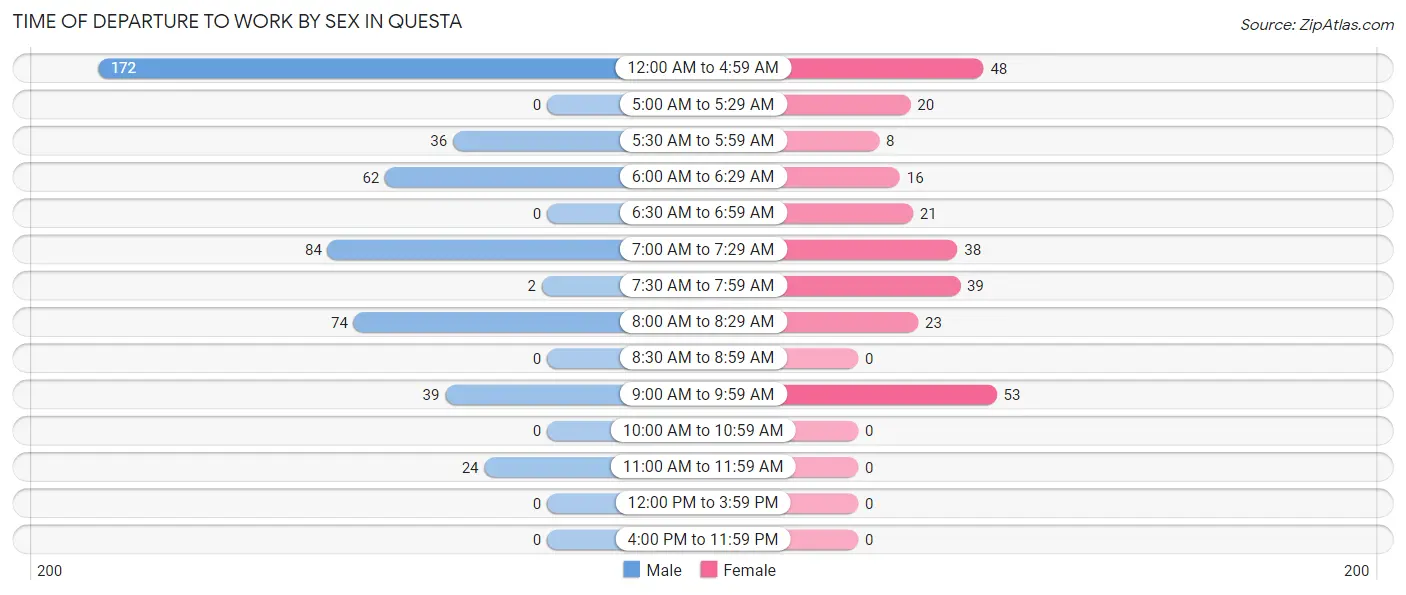
| Time of Departure | Male | Female |
| 12:00 AM to 4:59 AM | 172 (34.9%) | 48 (18.0%) |
| 5:00 AM to 5:29 AM | 0 (0.0%) | 20 (7.5%) |
| 5:30 AM to 5:59 AM | 36 (7.3%) | 8 (3.0%) |
| 6:00 AM to 6:29 AM | 62 (12.6%) | 16 (6.0%) |
| 6:30 AM to 6:59 AM | 0 (0.0%) | 21 (7.9%) |
| 7:00 AM to 7:29 AM | 84 (17.0%) | 38 (14.3%) |
| 7:30 AM to 7:59 AM | 2 (0.4%) | 39 (14.7%) |
| 8:00 AM to 8:29 AM | 74 (15.0%) | 23 (8.6%) |
| 8:30 AM to 8:59 AM | 0 (0.0%) | 0 (0.0%) |
| 9:00 AM to 9:59 AM | 39 (7.9%) | 53 (19.9%) |
| 10:00 AM to 10:59 AM | 0 (0.0%) | 0 (0.0%) |
| 11:00 AM to 11:59 AM | 24 (4.9%) | 0 (0.0%) |
| 12:00 PM to 3:59 PM | 0 (0.0%) | 0 (0.0%) |
| 4:00 PM to 11:59 PM | 0 (0.0%) | 0 (0.0%) |
| Total | 493 (100.0%) | 266 (100.0%) |
Housing Occupancy in Questa
Occupancy by Ownership in Questa
Of the total 757 dwellings in Questa, owner-occupied units account for 646 (85.3%), while renter-occupied units make up 111 (14.7%).
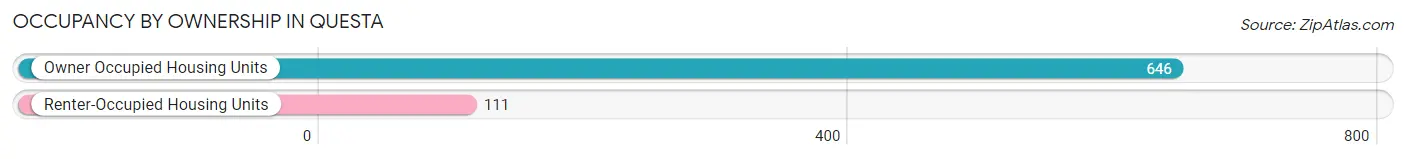
| Occupancy | # Housing Units | % Housing Units |
| Owner Occupied Housing Units | 646 | 85.3% |
| Renter-Occupied Housing Units | 111 | 14.7% |
| Total Occupied Housing Units | 757 | 100.0% |
Occupancy by Household Size in Questa
| Household Size | # Housing Units | % Housing Units |
| 1-Person Household | 243 | 32.1% |
| 2-Person Household | 276 | 36.5% |
| 3-Person Household | 138 | 18.2% |
| 4+ Person Household | 100 | 13.2% |
| Total Housing Units | 757 | 100.0% |
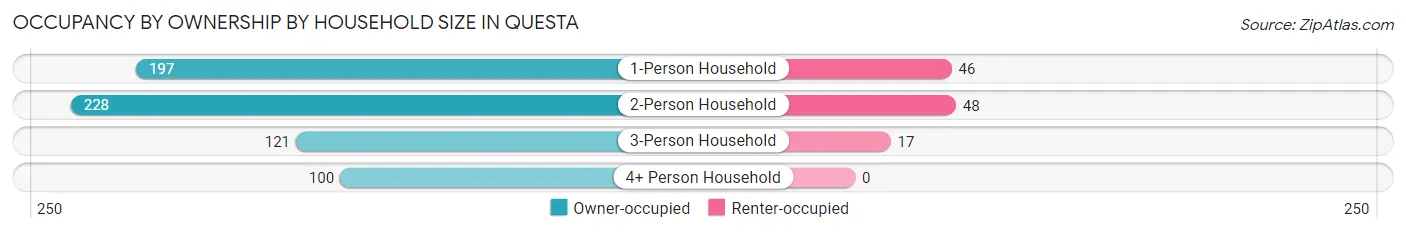
Occupancy by Ownership by Household Size in Questa
| Household Size | Owner-occupied | Renter-occupied |
| 1-Person Household | 197 (81.1%) | 46 (18.9%) |
| 2-Person Household | 228 (82.6%) | 48 (17.4%) |
| 3-Person Household | 121 (87.7%) | 17 (12.3%) |
| 4+ Person Household | 100 (100.0%) | 0 (0.0%) |
| Total Housing Units | 646 (85.3%) | 111 (14.7%) |
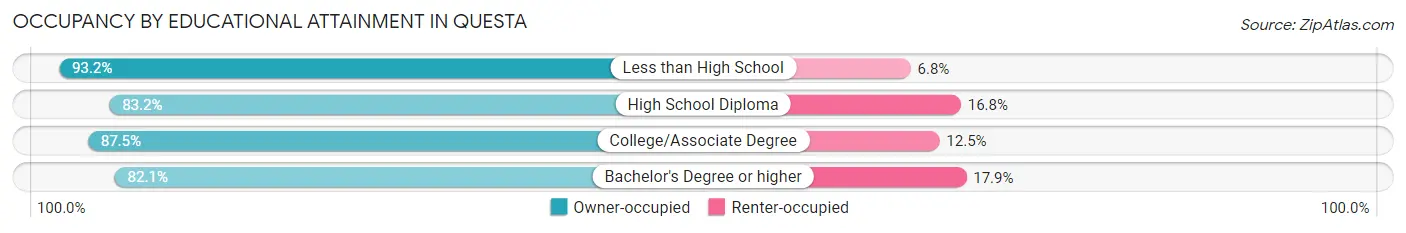
Occupancy by Educational Attainment in Questa
| Household Size | Owner-occupied | Renter-occupied |
| Less than High School | 41 (93.2%) | 3 (6.8%) |
| High School Diploma | 248 (83.2%) | 50 (16.8%) |
| College/Associate Degree | 265 (87.5%) | 38 (12.5%) |
| Bachelor's Degree or higher | 92 (82.1%) | 20 (17.9%) |
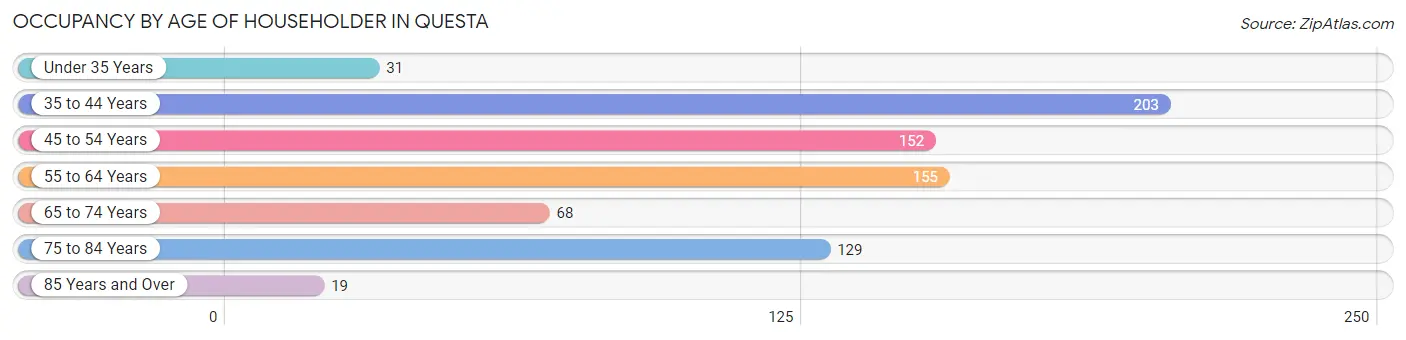
Occupancy by Age of Householder in Questa
| Age Bracket | # Households | % Households |
| Under 35 Years | 31 | 4.1% |
| 35 to 44 Years | 203 | 26.8% |
| 45 to 54 Years | 152 | 20.1% |
| 55 to 64 Years | 155 | 20.5% |
| 65 to 74 Years | 68 | 9.0% |
| 75 to 84 Years | 129 | 17.0% |
| 85 Years and Over | 19 | 2.5% |
| Total | 757 | 100.0% |
Housing Finances in Questa
Median Income by Occupancy in Questa
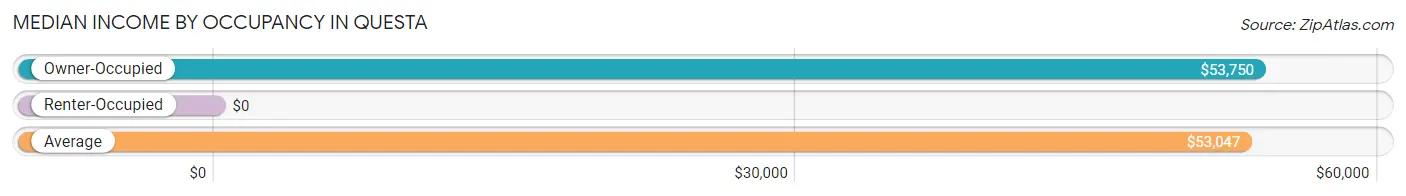
| Occupancy Type | # Households | Median Income |
| Owner-Occupied | 646 (85.3%) | $53,750 |
| Renter-Occupied | 111 (14.7%) | $0 |
| Average | 757 (100.0%) | $53,047 |
Occupancy by Householder Income Bracket in Questa
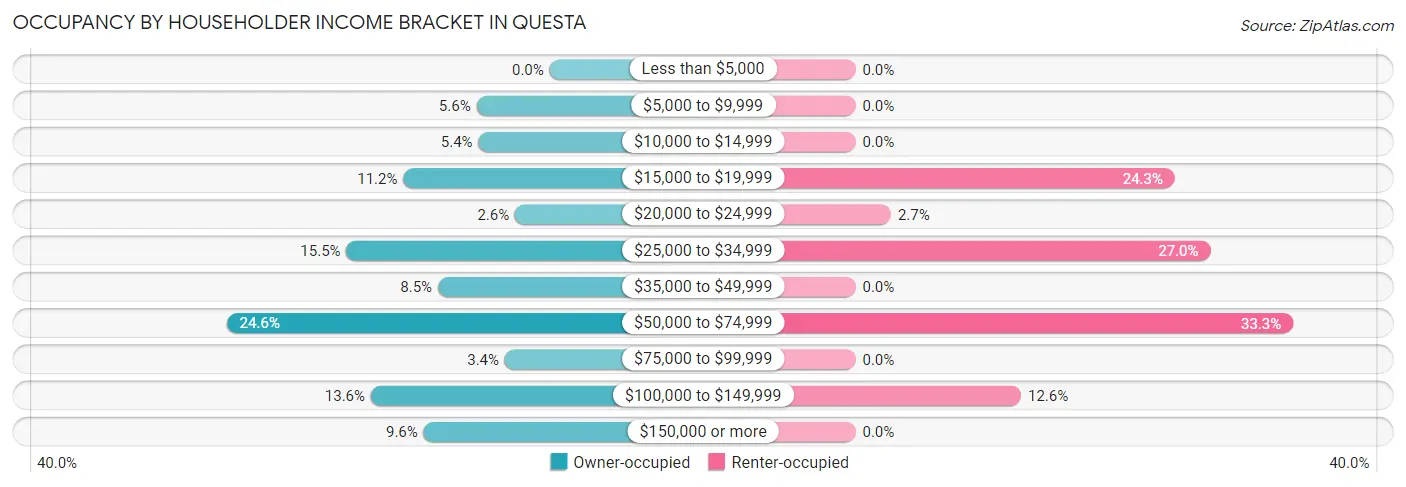
| Income Bracket | Owner-occupied | Renter-occupied |
| Less than $5,000 | 0 (0.0%) | 0 (0.0%) |
| $5,000 to $9,999 | 36 (5.6%) | 0 (0.0%) |
| $10,000 to $14,999 | 35 (5.4%) | 0 (0.0%) |
| $15,000 to $19,999 | 72 (11.2%) | 27 (24.3%) |
| $20,000 to $24,999 | 17 (2.6%) | 3 (2.7%) |
| $25,000 to $34,999 | 100 (15.5%) | 30 (27.0%) |
| $35,000 to $49,999 | 55 (8.5%) | 0 (0.0%) |
| $50,000 to $74,999 | 159 (24.6%) | 37 (33.3%) |
| $75,000 to $99,999 | 22 (3.4%) | 0 (0.0%) |
| $100,000 to $149,999 | 88 (13.6%) | 14 (12.6%) |
| $150,000 or more | 62 (9.6%) | 0 (0.0%) |
| Total | 646 (100.0%) | 111 (100.0%) |
Monthly Housing Cost Tiers in Questa
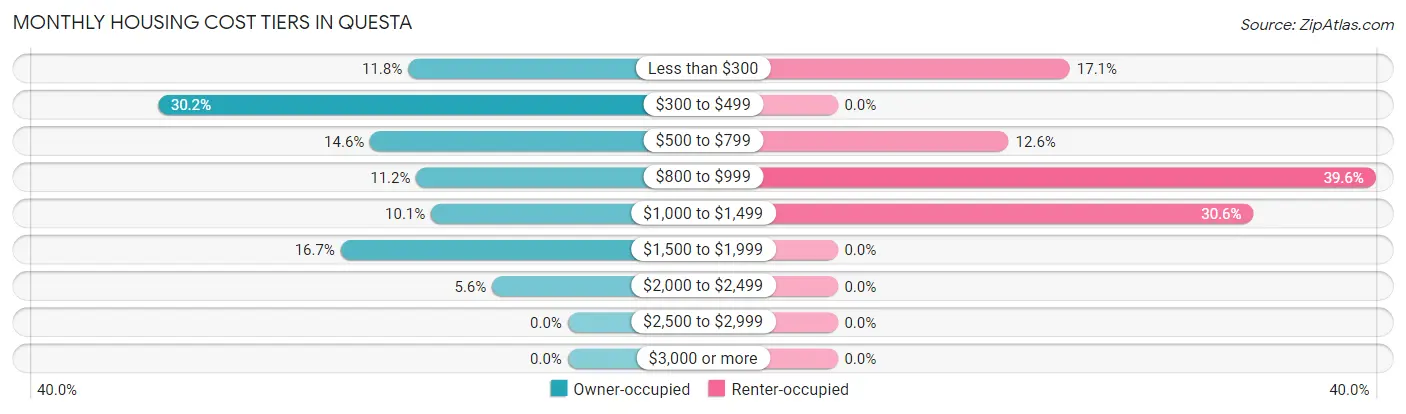
| Monthly Cost | Owner-occupied | Renter-occupied |
| Less than $300 | 76 (11.8%) | 19 (17.1%) |
| $300 to $499 | 195 (30.2%) | 0 (0.0%) |
| $500 to $799 | 94 (14.5%) | 14 (12.6%) |
| $800 to $999 | 72 (11.2%) | 44 (39.6%) |
| $1,000 to $1,499 | 65 (10.1%) | 34 (30.6%) |
| $1,500 to $1,999 | 108 (16.7%) | 0 (0.0%) |
| $2,000 to $2,499 | 36 (5.6%) | 0 (0.0%) |
| $2,500 to $2,999 | 0 (0.0%) | 0 (0.0%) |
| $3,000 or more | 0 (0.0%) | 0 (0.0%) |
| Total | 646 (100.0%) | 111 (100.0%) |
Physical Housing Characteristics in Questa
Housing Structures in Questa
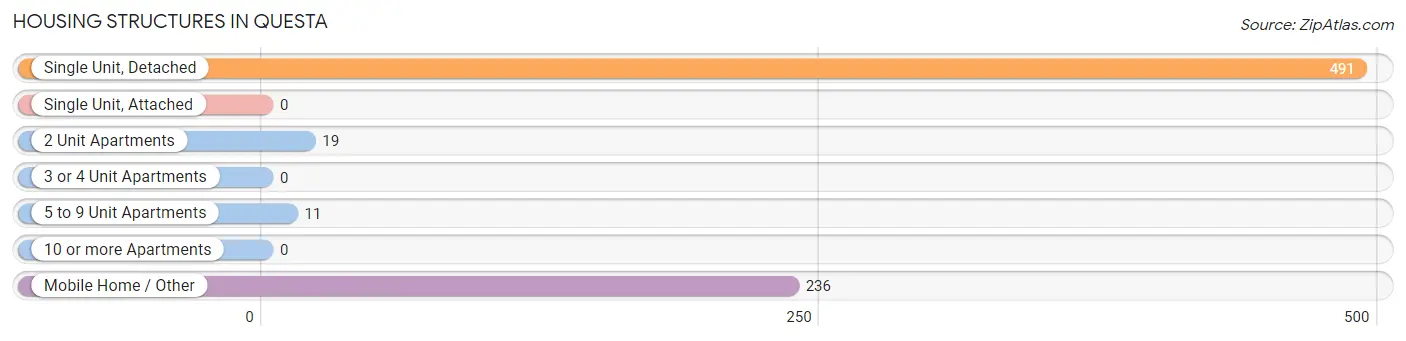
| Structure Type | # Housing Units | % Housing Units |
| Single Unit, Detached | 491 | 64.9% |
| Single Unit, Attached | 0 | 0.0% |
| 2 Unit Apartments | 19 | 2.5% |
| 3 or 4 Unit Apartments | 0 | 0.0% |
| 5 to 9 Unit Apartments | 11 | 1.5% |
| 10 or more Apartments | 0 | 0.0% |
| Mobile Home / Other | 236 | 31.2% |
| Total | 757 | 100.0% |
Housing Structures by Occupancy in Questa
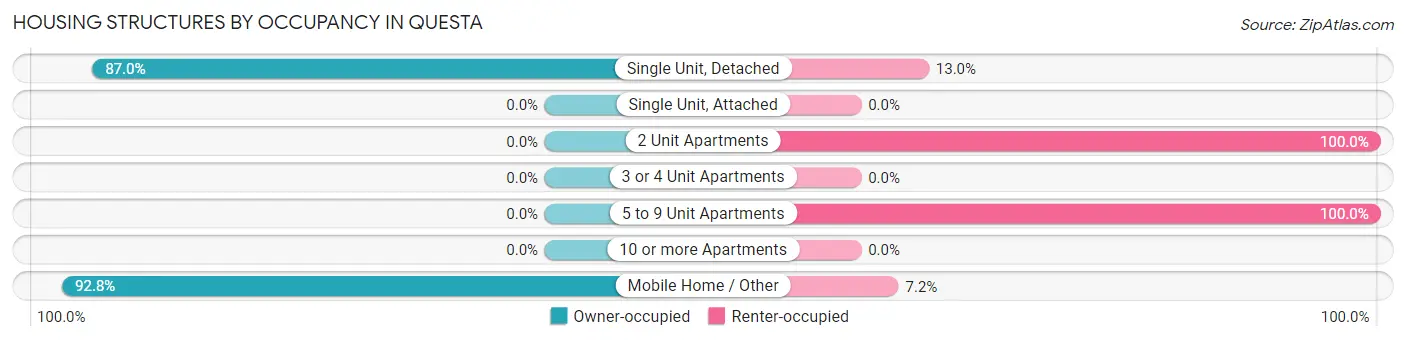
| Structure Type | Owner-occupied | Renter-occupied |
| Single Unit, Detached | 427 (87.0%) | 64 (13.0%) |
| Single Unit, Attached | 0 (0.0%) | 0 (0.0%) |
| 2 Unit Apartments | 0 (0.0%) | 19 (100.0%) |
| 3 or 4 Unit Apartments | 0 (0.0%) | 0 (0.0%) |
| 5 to 9 Unit Apartments | 0 (0.0%) | 11 (100.0%) |
| 10 or more Apartments | 0 (0.0%) | 0 (0.0%) |
| Mobile Home / Other | 219 (92.8%) | 17 (7.2%) |
| Total | 646 (85.3%) | 111 (14.7%) |
Housing Structures by Number of Rooms in Questa
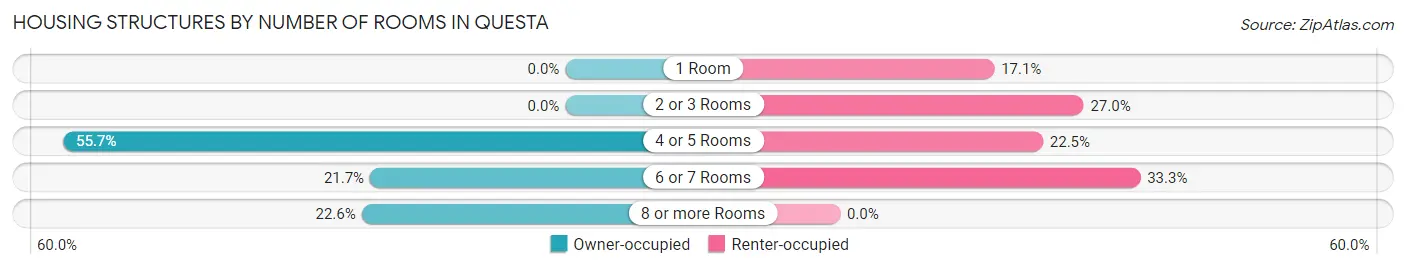
| Number of Rooms | Owner-occupied | Renter-occupied |
| 1 Room | 0 (0.0%) | 19 (17.1%) |
| 2 or 3 Rooms | 0 (0.0%) | 30 (27.0%) |
| 4 or 5 Rooms | 360 (55.7%) | 25 (22.5%) |
| 6 or 7 Rooms | 140 (21.7%) | 37 (33.3%) |
| 8 or more Rooms | 146 (22.6%) | 0 (0.0%) |
| Total | 646 (100.0%) | 111 (100.0%) |
Housing Structure by Heating Type in Questa
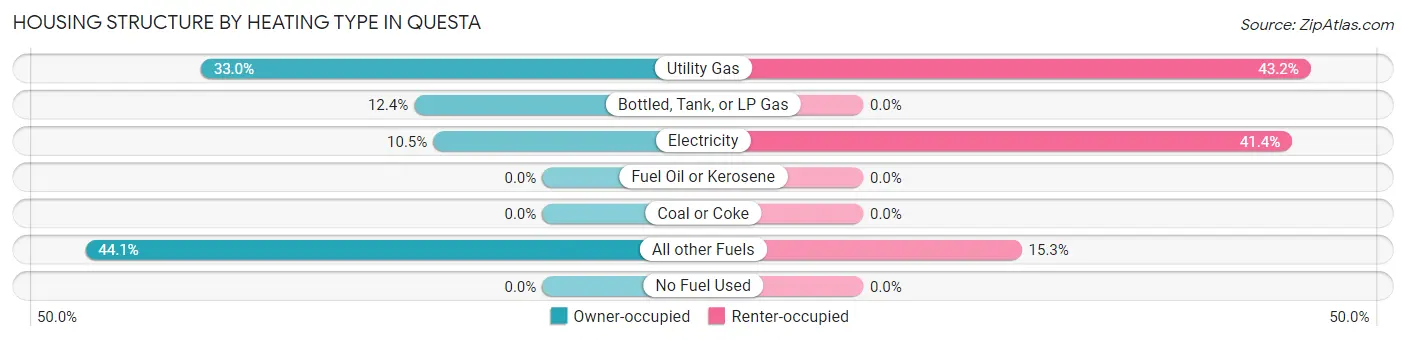
| Heating Type | Owner-occupied | Renter-occupied |
| Utility Gas | 213 (33.0%) | 48 (43.2%) |
| Bottled, Tank, or LP Gas | 80 (12.4%) | 0 (0.0%) |
| Electricity | 68 (10.5%) | 46 (41.4%) |
| Fuel Oil or Kerosene | 0 (0.0%) | 0 (0.0%) |
| Coal or Coke | 0 (0.0%) | 0 (0.0%) |
| All other Fuels | 285 (44.1%) | 17 (15.3%) |
| No Fuel Used | 0 (0.0%) | 0 (0.0%) |
| Total | 646 (100.0%) | 111 (100.0%) |
Household Vehicle Usage in Questa
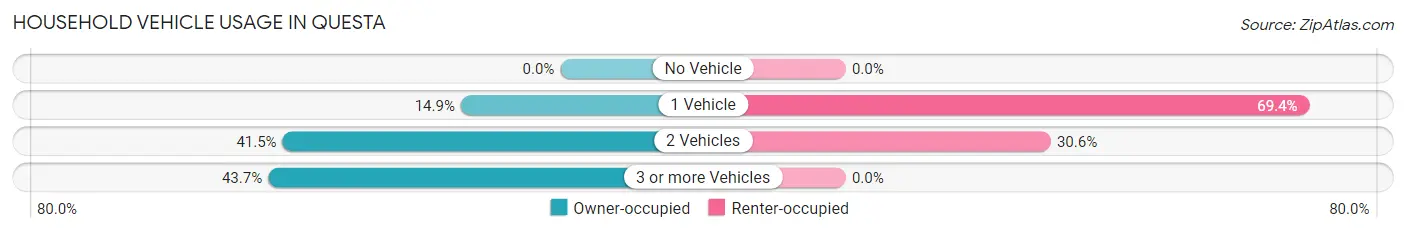
| Vehicles per Household | Owner-occupied | Renter-occupied |
| No Vehicle | 0 (0.0%) | 0 (0.0%) |
| 1 Vehicle | 96 (14.9%) | 77 (69.4%) |
| 2 Vehicles | 268 (41.5%) | 34 (30.6%) |
| 3 or more Vehicles | 282 (43.6%) | 0 (0.0%) |
| Total | 646 (100.0%) | 111 (100.0%) |
Real Estate & Mortgages in Questa
Real Estate and Mortgage Overview in Questa
| Characteristic | Without Mortgage | With Mortgage |
| Housing Units | 382 | 264 |
| Median Property Value | $170,800 | $187,500 |
| Median Household Income | $54,219 | $20 |
| Monthly Housing Costs | $389 | $0 |
| Real Estate Taxes | $817 | $0 |
Property Value by Mortgage Status in Questa
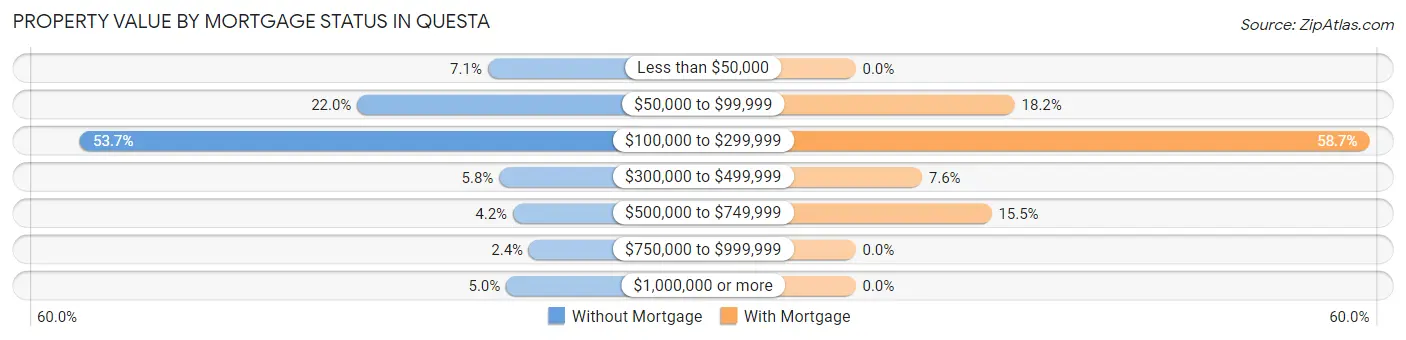
| Property Value | Without Mortgage | With Mortgage |
| Less than $50,000 | 27 (7.1%) | 0 (0.0%) |
| $50,000 to $99,999 | 84 (22.0%) | 48 (18.2%) |
| $100,000 to $299,999 | 205 (53.7%) | 155 (58.7%) |
| $300,000 to $499,999 | 22 (5.8%) | 20 (7.6%) |
| $500,000 to $749,999 | 16 (4.2%) | 41 (15.5%) |
| $750,000 to $999,999 | 9 (2.4%) | 0 (0.0%) |
| $1,000,000 or more | 19 (5.0%) | 0 (0.0%) |
| Total | 382 (100.0%) | 264 (100.0%) |
Household Income by Mortgage Status in Questa
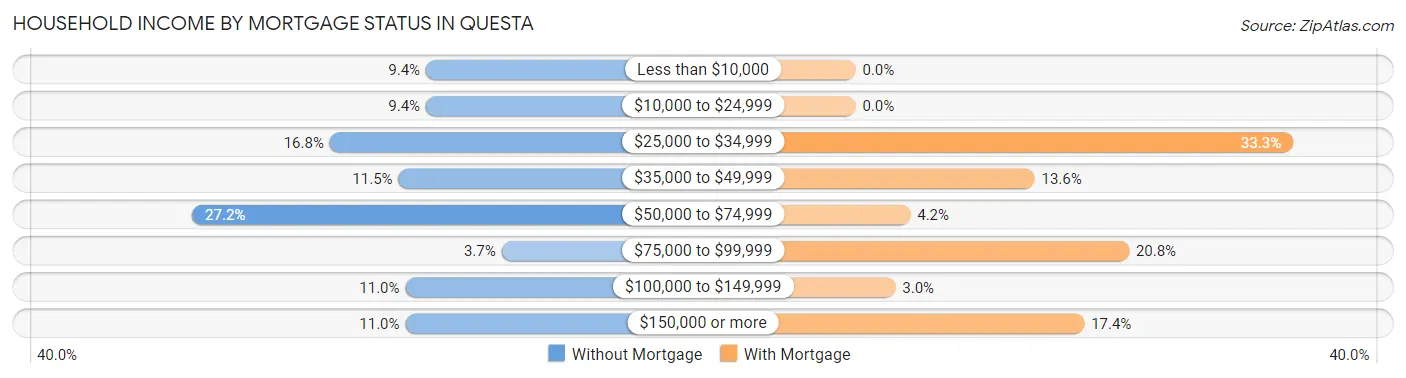
| Household Income | Without Mortgage | With Mortgage |
| Less than $10,000 | 36 (9.4%) | 0 (0.0%) |
| $10,000 to $24,999 | 36 (9.4%) | 0 (0.0%) |
| $25,000 to $34,999 | 64 (16.8%) | 88 (33.3%) |
| $35,000 to $49,999 | 44 (11.5%) | 36 (13.6%) |
| $50,000 to $74,999 | 104 (27.2%) | 11 (4.2%) |
| $75,000 to $99,999 | 14 (3.7%) | 55 (20.8%) |
| $100,000 to $149,999 | 42 (11.0%) | 8 (3.0%) |
| $150,000 or more | 42 (11.0%) | 46 (17.4%) |
| Total | 382 (100.0%) | 264 (100.0%) |
Property Value to Household Income Ratio in Questa
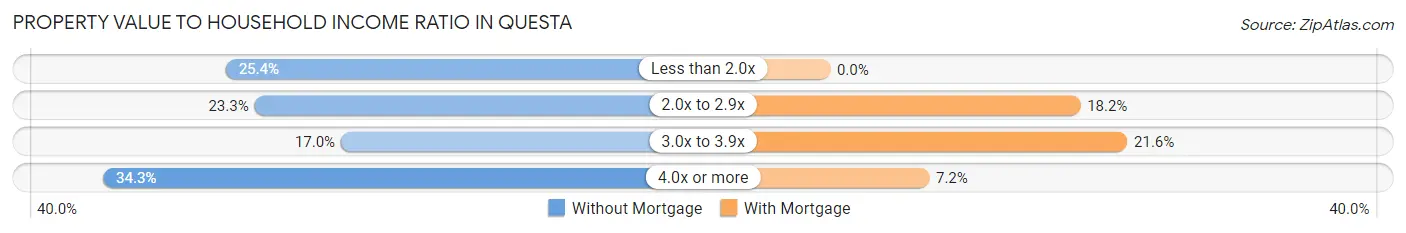
| Value-to-Income Ratio | Without Mortgage | With Mortgage |
| Less than 2.0x | 97 (25.4%) | 0 (0.0%) |
| 2.0x to 2.9x | 89 (23.3%) | 48 (18.2%) |
| 3.0x to 3.9x | 65 (17.0%) | 57 (21.6%) |
| 4.0x or more | 131 (34.3%) | 19 (7.2%) |
| Total | 382 (100.0%) | 264 (100.0%) |
Real Estate Taxes by Mortgage Status in Questa
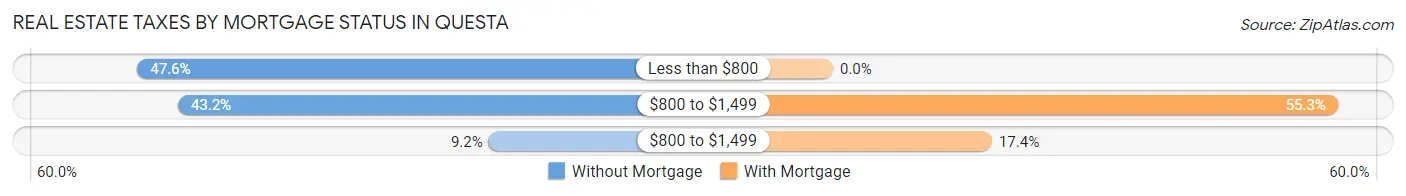
| Property Taxes | Without Mortgage | With Mortgage |
| Less than $800 | 182 (47.6%) | 0 (0.0%) |
| $800 to $1,499 | 165 (43.2%) | 146 (55.3%) |
| $800 to $1,499 | 35 (9.2%) | 46 (17.4%) |
| Total | 382 (100.0%) | 264 (100.0%) |
Health & Disability in Questa
Health Insurance Coverage by Age in Questa
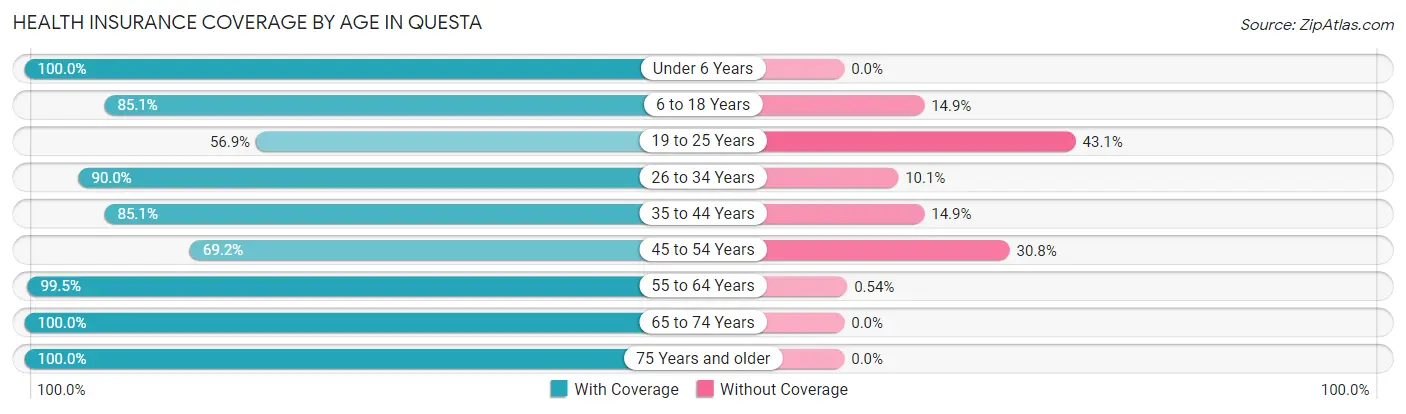
| Age Bracket | With Coverage | Without Coverage |
| Under 6 Years | 134 (100.0%) | 0 (0.0%) |
| 6 to 18 Years | 257 (85.1%) | 45 (14.9%) |
| 19 to 25 Years | 87 (56.9%) | 66 (43.1%) |
| 26 to 34 Years | 170 (89.9%) | 19 (10.1%) |
| 35 to 44 Years | 268 (85.1%) | 47 (14.9%) |
| 45 to 54 Years | 184 (69.2%) | 82 (30.8%) |
| 55 to 64 Years | 366 (99.5%) | 2 (0.5%) |
| 65 to 74 Years | 124 (100.0%) | 0 (0.0%) |
| 75 Years and older | 328 (100.0%) | 0 (0.0%) |
| Total | 1,918 (88.0%) | 261 (12.0%) |
Health Insurance Coverage by Citizenship Status in Questa
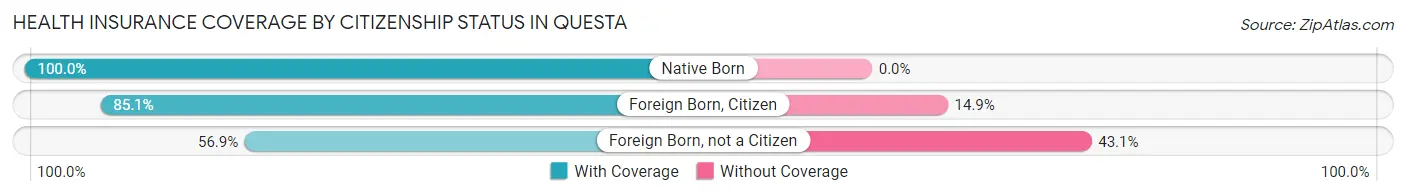
| Citizenship Status | With Coverage | Without Coverage |
| Native Born | 134 (100.0%) | 0 (0.0%) |
| Foreign Born, Citizen | 257 (85.1%) | 45 (14.9%) |
| Foreign Born, not a Citizen | 87 (56.9%) | 66 (43.1%) |
Health Insurance Coverage by Household Income in Questa
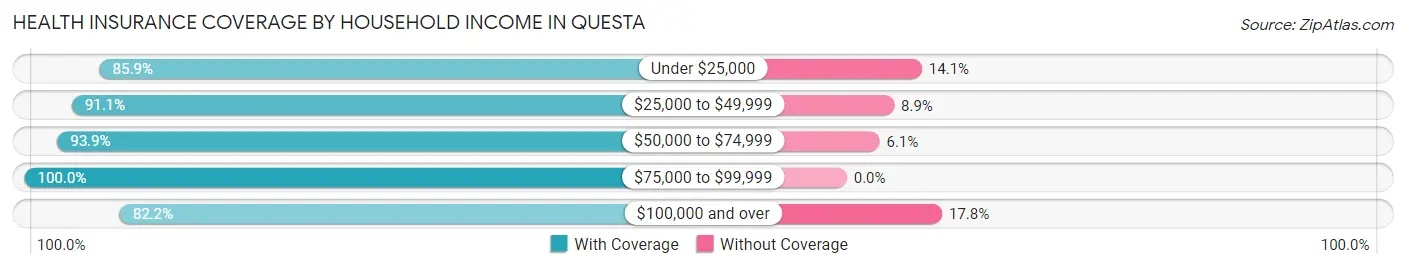
| Household Income | With Coverage | Without Coverage |
| Under $25,000 | 226 (85.9%) | 37 (14.1%) |
| $25,000 to $49,999 | 329 (91.1%) | 32 (8.9%) |
| $50,000 to $74,999 | 613 (93.9%) | 40 (6.1%) |
| $75,000 to $99,999 | 50 (100.0%) | 0 (0.0%) |
| $100,000 and over | 700 (82.2%) | 152 (17.8%) |
Public vs Private Health Insurance Coverage by Age in Questa
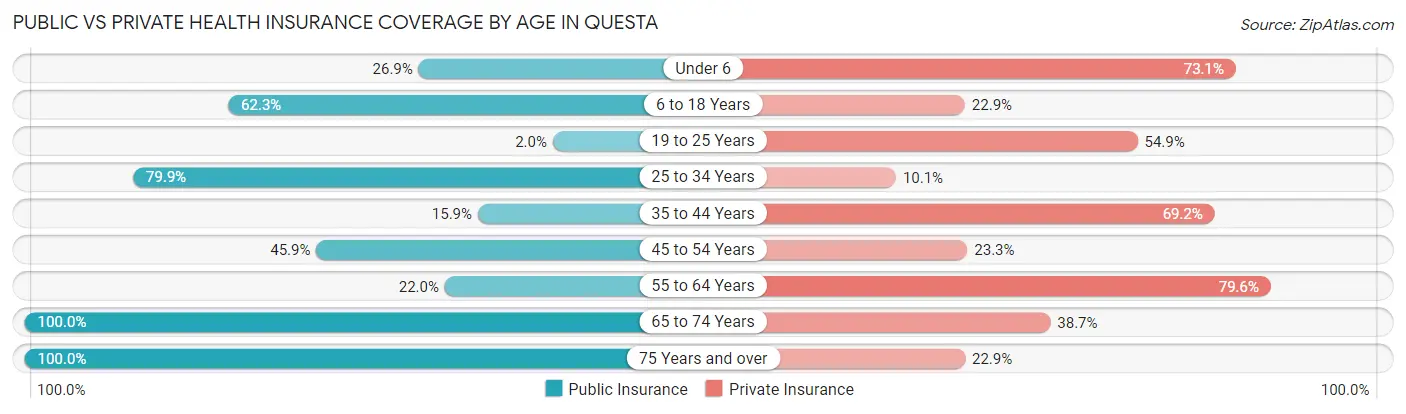
| Age Bracket | Public Insurance | Private Insurance |
| Under 6 | 36 (26.9%) | 98 (73.1%) |
| 6 to 18 Years | 188 (62.3%) | 69 (22.9%) |
| 19 to 25 Years | 3 (2.0%) | 84 (54.9%) |
| 25 to 34 Years | 151 (79.9%) | 19 (10.1%) |
| 35 to 44 Years | 50 (15.9%) | 218 (69.2%) |
| 45 to 54 Years | 122 (45.9%) | 62 (23.3%) |
| 55 to 64 Years | 81 (22.0%) | 293 (79.6%) |
| 65 to 74 Years | 124 (100.0%) | 48 (38.7%) |
| 75 Years and over | 328 (100.0%) | 75 (22.9%) |
| Total | 1,083 (49.7%) | 966 (44.3%) |
Disability Status by Sex by Age in Questa
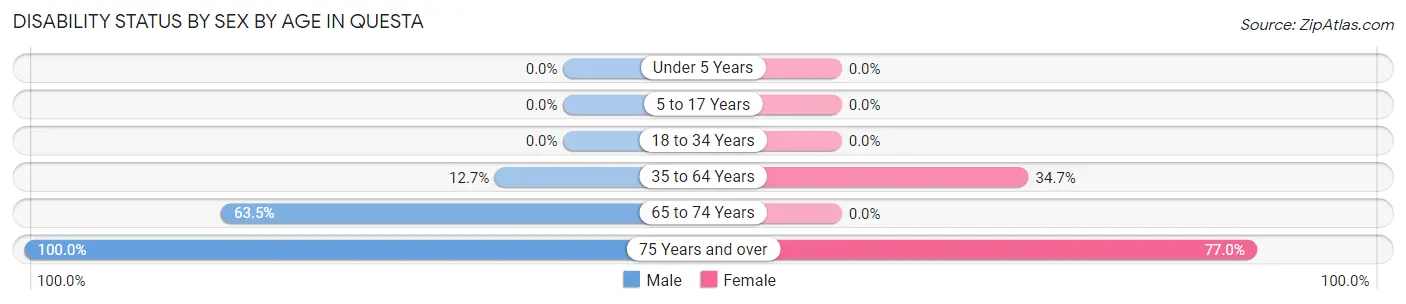
| Age Bracket | Male | Female |
| Under 5 Years | 0 (0.0%) | 0 (0.0%) |
| 5 to 17 Years | 0 (0.0%) | 0 (0.0%) |
| 18 to 34 Years | 0 (0.0%) | 0 (0.0%) |
| 35 to 64 Years | 64 (12.7%) | 154 (34.7%) |
| 65 to 74 Years | 47 (63.5%) | 0 (0.0%) |
| 75 Years and over | 154 (100.0%) | 134 (77.0%) |
Disability Class by Sex by Age in Questa
Disability Class: Hearing Difficulty
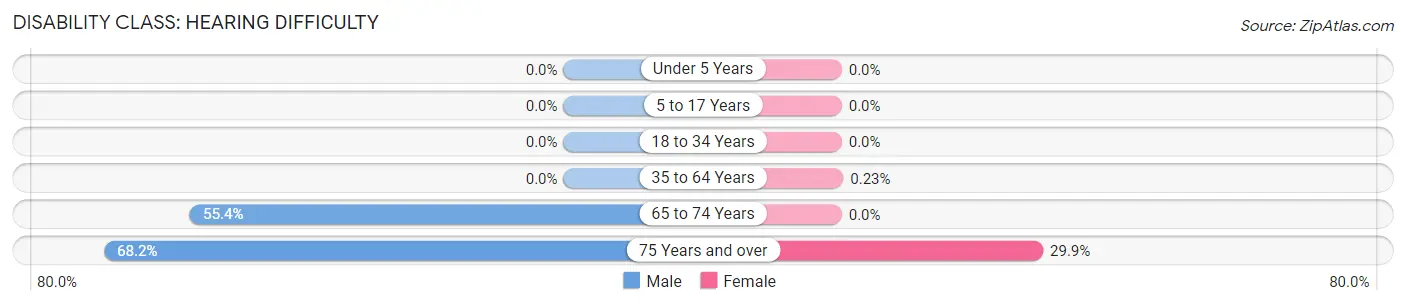
| Age Bracket | Male | Female |
| Under 5 Years | 0 (0.0%) | 0 (0.0%) |
| 5 to 17 Years | 0 (0.0%) | 0 (0.0%) |
| 18 to 34 Years | 0 (0.0%) | 0 (0.0%) |
| 35 to 64 Years | 0 (0.0%) | 1 (0.2%) |
| 65 to 74 Years | 41 (55.4%) | 0 (0.0%) |
| 75 Years and over | 105 (68.2%) | 52 (29.9%) |
Disability Class: Vision Difficulty
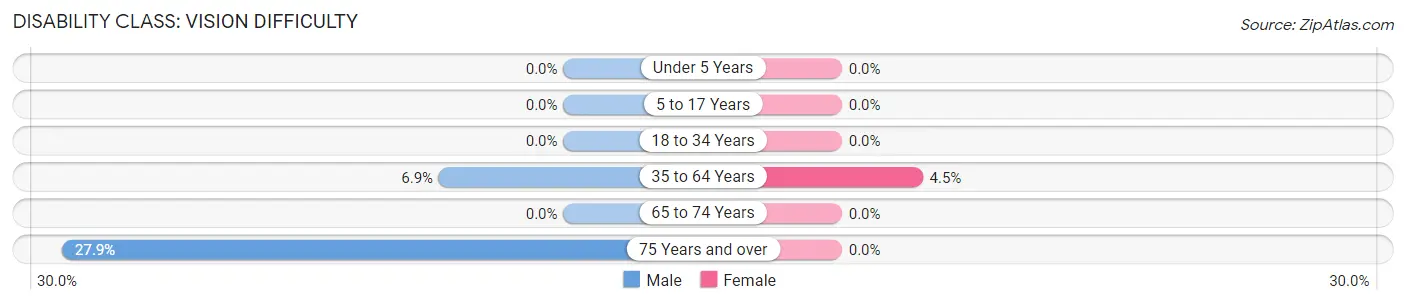
| Age Bracket | Male | Female |
| Under 5 Years | 0 (0.0%) | 0 (0.0%) |
| 5 to 17 Years | 0 (0.0%) | 0 (0.0%) |
| 18 to 34 Years | 0 (0.0%) | 0 (0.0%) |
| 35 to 64 Years | 35 (6.9%) | 20 (4.5%) |
| 65 to 74 Years | 0 (0.0%) | 0 (0.0%) |
| 75 Years and over | 43 (27.9%) | 0 (0.0%) |
Disability Class: Cognitive Difficulty
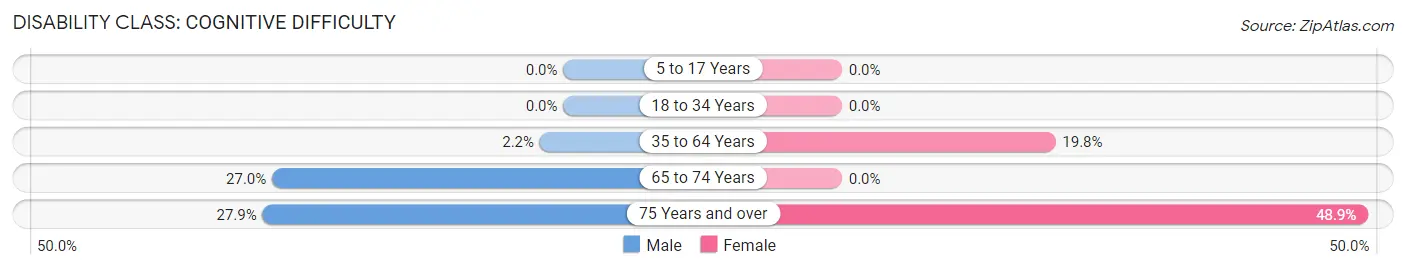
| Age Bracket | Male | Female |
| 5 to 17 Years | 0 (0.0%) | 0 (0.0%) |
| 18 to 34 Years | 0 (0.0%) | 0 (0.0%) |
| 35 to 64 Years | 11 (2.2%) | 88 (19.8%) |
| 65 to 74 Years | 20 (27.0%) | 0 (0.0%) |
| 75 Years and over | 43 (27.9%) | 85 (48.8%) |
Disability Class: Ambulatory Difficulty
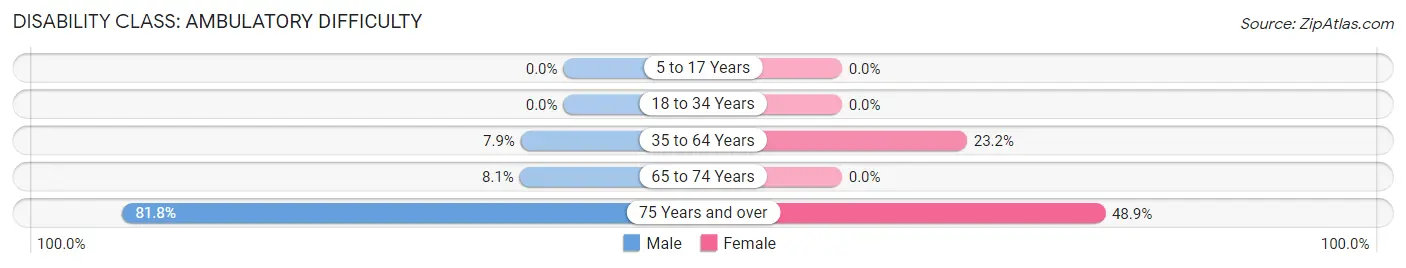
| Age Bracket | Male | Female |
| 5 to 17 Years | 0 (0.0%) | 0 (0.0%) |
| 18 to 34 Years | 0 (0.0%) | 0 (0.0%) |
| 35 to 64 Years | 40 (7.9%) | 103 (23.2%) |
| 65 to 74 Years | 6 (8.1%) | 0 (0.0%) |
| 75 Years and over | 126 (81.8%) | 85 (48.8%) |
Disability Class: Self-Care Difficulty
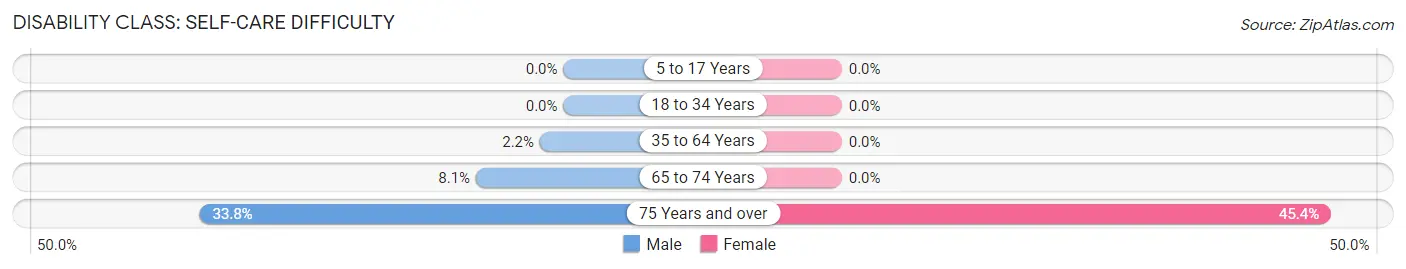
| Age Bracket | Male | Female |
| 5 to 17 Years | 0 (0.0%) | 0 (0.0%) |
| 18 to 34 Years | 0 (0.0%) | 0 (0.0%) |
| 35 to 64 Years | 11 (2.2%) | 0 (0.0%) |
| 65 to 74 Years | 6 (8.1%) | 0 (0.0%) |
| 75 Years and over | 52 (33.8%) | 79 (45.4%) |
Technology Access in Questa
Computing Device Access in Questa
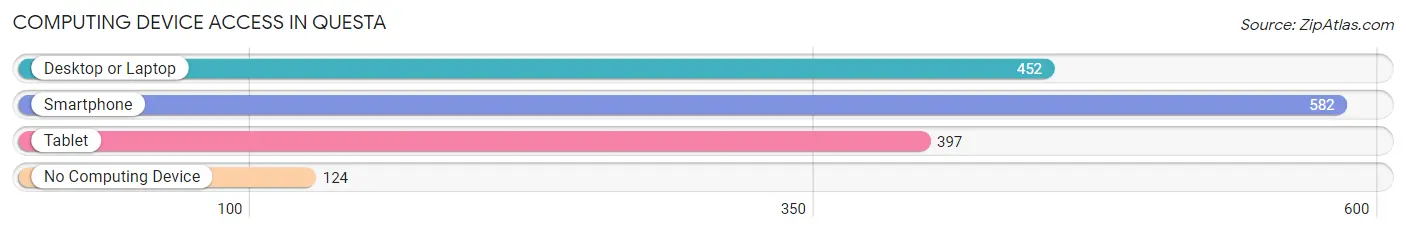
| Device Type | # Households | % Households |
| Desktop or Laptop | 452 | 59.7% |
| Smartphone | 582 | 76.9% |
| Tablet | 397 | 52.4% |
| No Computing Device | 124 | 16.4% |
| Total | 757 | 100.0% |
Internet Access in Questa
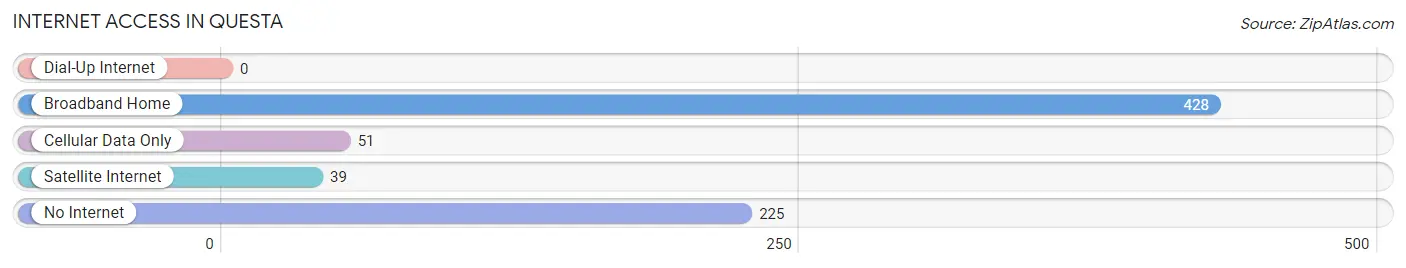
| Internet Type | # Households | % Households |
| Dial-Up Internet | 0 | 0.0% |
| Broadband Home | 428 | 56.5% |
| Cellular Data Only | 51 | 6.7% |
| Satellite Internet | 39 | 5.1% |
| No Internet | 225 | 29.7% |
| Total | 757 | 100.0% |
Questa Summary
Questa is a small village located in the northern part of the state of New Mexico, in the United States. It is situated in Taos County, and is located at the base of the Sangre de Cristo Mountains. The village is located at an elevation of 7,000 feet, and is surrounded by the Carson National Forest. The population of Questa was 1,767 as of the 2010 census.
History
The area that is now Questa was originally inhabited by the Taos Indians, who were part of the Pueblo people. The first European settlers arrived in the area in the late 1700s, and the village was officially established in 1854. The village was named after the nearby Rio de las Questas, which was named by Spanish explorers in the 1700s.
The village was originally a mining town, and the area was home to several large mines, including the Questa Mine, which was the largest in the area. The mine was in operation from 1883 to the early 1900s, and was the main source of employment for the village. The mine was eventually closed due to a lack of ore, and the village began to decline.
In the late 20th century, the village began to experience a resurgence, as it became a popular tourist destination. The village is now home to several art galleries, restaurants, and other attractions.
Geography
Questa is located in the northern part of the state of New Mexico, in Taos County. The village is situated at the base of the Sangre de Cristo Mountains, at an elevation of 7,000 feet. The village is surrounded by the Carson National Forest, and is located near the Rio Grande.
The climate in Questa is semi-arid, with hot summers and cold winters. The average annual temperature is around 50 degrees Fahrenheit, and the average annual precipitation is around 12 inches.
Economy
The economy of Questa is largely based on tourism, as the village is a popular destination for outdoor activities such as hiking, fishing, and camping. The village is also home to several art galleries, restaurants, and other attractions.
The village is also home to several small businesses, including a grocery store, a hardware store, and a gas station. The village is also home to a small manufacturing plant, which produces wood products.
Demographics
As of the 2010 census, the population of Questa was 1,767. The racial makeup of the village was 94.3% White, 0.7% African American, 0.7% Native American, 0.3% Asian, 0.1% Pacific Islander, and 3.0% from other races. The median household income was $30,938, and the median family income was $35,625.
The village is home to a large Hispanic population, with over 70% of the population identifying as Hispanic or Latino. The village is also home to a small Native American population, with around 4% of the population identifying as Native American. The village is also home to a small population of English-speaking residents, with around 5% of the population speaking English as their primary language.
Common Questions
What is Per Capita Income in Questa?
Per Capita income in Questa is $25,700.
What is the Median Family Income in Questa?
Median Family Income in Questa is $68,846.
What is the Median Household income in Questa?
Median Household Income in Questa is $53,047.
What is Income or Wage Gap in Questa?
Income or Wage Gap in Questa is 3.2%.
Women in Questa earn 96.8 cents for every dollar earned by a man.
What is Inequality or Gini Index in Questa?
Inequality or Gini Index in Questa is 0.43.
What is the Total Population of Questa?
Total Population of Questa is 2,179.
What is the Total Male Population of Questa?
Total Male Population of Questa is 1,296.
What is the Total Female Population of Questa?
Total Female Population of Questa is 883.
What is the Ratio of Males per 100 Females in Questa?
There are 146.77 Males per 100 Females in Questa.
What is the Ratio of Females per 100 Males in Questa?
There are 68.13 Females per 100 Males in Questa.
What is the Median Population Age in Questa?
Median Population Age in Questa is 44.9 Years.
What is the Average Family Size in Questa
Average Family Size in Questa is 3.8 People.
What is the Average Household Size in Questa
Average Household Size in Questa is 2.9 People.
How Large is the Labor Force in Questa?
There are 997 People in the Labor Forcein in Questa.
What is the Percentage of People in the Labor Force in Questa?
53.1% of People are in the Labor Force in Questa.
What is the Unemployment Rate in Questa?
Unemployment Rate in Questa is 0.6%.