Tonka Bay, MN Map & Demographics
Tonka Bay Map
Tonka Bay Overview
$115,982
PER CAPITA INCOME
$157,045
AVG FAMILY INCOME
$141,875
AVG HOUSEHOLD INCOME
7.1%
WAGE / INCOME GAP [ % ]
92.9¢/ $1
WAGE / INCOME GAP [ $ ]
0.56
INEQUALITY / GINI INDEX
1,462
TOTAL POPULATION
756
MALE POPULATION
706
FEMALE POPULATION
107.08
MALES / 100 FEMALES
93.39
FEMALES / 100 MALES
57.1
MEDIAN AGE
2.6
AVG FAMILY SIZE
2.4
AVG HOUSEHOLD SIZE
712
LABOR FORCE [ PEOPLE ]
55.7%
PERCENT IN LABOR FORCE
7.6%
UNEMPLOYMENT RATE
Income in Tonka Bay
Income Overview in Tonka Bay
Per Capita Income in Tonka Bay is $115,982, while median incomes of families and households are $157,045 and $141,875 respectively.
| Characteristic | Number | Measure |
| Per Capita Income | 1,462 | $115,982 |
| Median Family Income | 492 | $157,045 |
| Mean Family Income | 492 | $305,701 |
| Median Household Income | 613 | $141,875 |
| Mean Household Income | 613 | $268,623 |
| Income Deficit | 492 | $0 |
| Wage / Income Gap (%) | 1,462 | 7.10% |
| Wage / Income Gap ($) | 1,462 | 92.90¢ per $1 |
| Gini / Inequality Index | 1,462 | 0.56 |
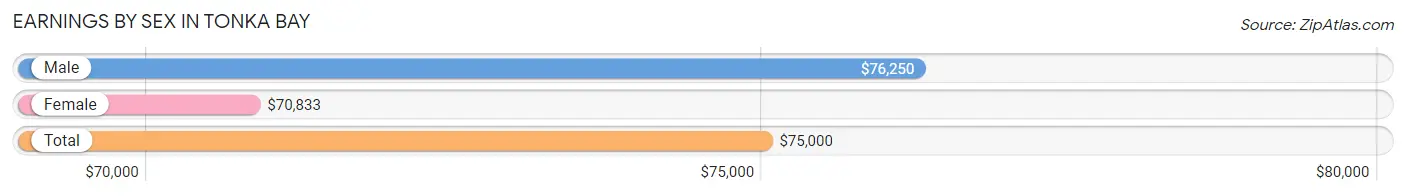
Earnings by Sex in Tonka Bay
Average Earnings in Tonka Bay are $75,000, $76,250 for men and $70,833 for women, a difference of 7.1%.
| Sex | Number | Average Earnings |
| Male | 420 (55.3%) | $76,250 |
| Female | 340 (44.7%) | $70,833 |
| Total | 760 (100.0%) | $75,000 |
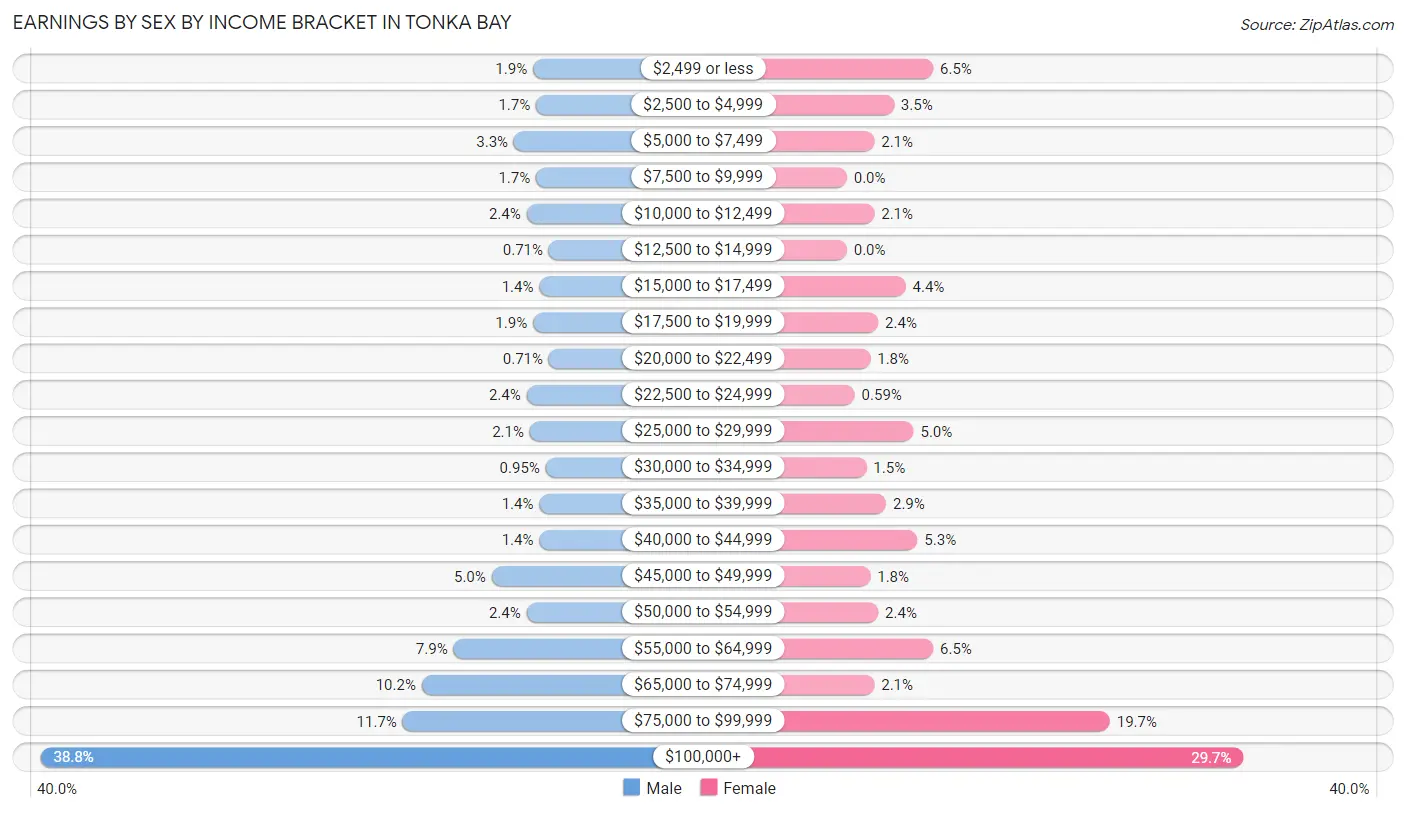
Earnings by Sex by Income Bracket in Tonka Bay
The most common earnings brackets in Tonka Bay are $100,000+ for men (163 | 38.8%) and $100,000+ for women (101 | 29.7%).
| Income | Male | Female |
| $2,499 or less | 8 (1.9%) | 22 (6.5%) |
| $2,500 to $4,999 | 7 (1.7%) | 12 (3.5%) |
| $5,000 to $7,499 | 14 (3.3%) | 7 (2.1%) |
| $7,500 to $9,999 | 7 (1.7%) | 0 (0.0%) |
| $10,000 to $12,499 | 10 (2.4%) | 7 (2.1%) |
| $12,500 to $14,999 | 3 (0.7%) | 0 (0.0%) |
| $15,000 to $17,499 | 6 (1.4%) | 15 (4.4%) |
| $17,500 to $19,999 | 8 (1.9%) | 8 (2.4%) |
| $20,000 to $22,499 | 3 (0.7%) | 6 (1.8%) |
| $22,500 to $24,999 | 10 (2.4%) | 2 (0.6%) |
| $25,000 to $29,999 | 9 (2.1%) | 17 (5.0%) |
| $30,000 to $34,999 | 4 (0.9%) | 5 (1.5%) |
| $35,000 to $39,999 | 6 (1.4%) | 10 (2.9%) |
| $40,000 to $44,999 | 6 (1.4%) | 18 (5.3%) |
| $45,000 to $49,999 | 21 (5.0%) | 6 (1.8%) |
| $50,000 to $54,999 | 10 (2.4%) | 8 (2.4%) |
| $55,000 to $64,999 | 33 (7.9%) | 22 (6.5%) |
| $65,000 to $74,999 | 43 (10.2%) | 7 (2.1%) |
| $75,000 to $99,999 | 49 (11.7%) | 67 (19.7%) |
| $100,000+ | 163 (38.8%) | 101 (29.7%) |
| Total | 420 (100.0%) | 340 (100.0%) |
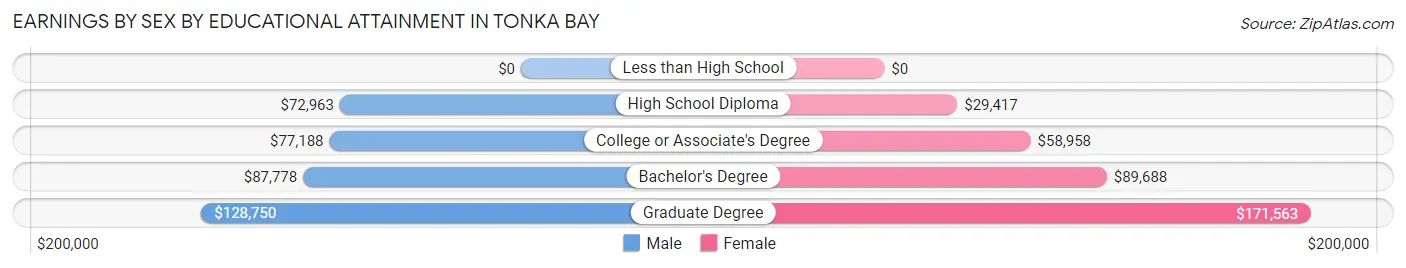
Earnings by Sex by Educational Attainment in Tonka Bay
Average earnings in Tonka Bay are $80,833 for men and $81,000 for women, a difference of 0.2%. Men with an educational attainment of graduate degree enjoy the highest average annual earnings of $128,750, while those with high school diploma education earn the least with $72,963. Women with an educational attainment of graduate degree earn the most with the average annual earnings of $171,563, while those with high school diploma education have the smallest earnings of $29,417.
| Educational Attainment | Male Income | Female Income |
| Less than High School | - | - |
| High School Diploma | $72,963 | $29,417 |
| College or Associate's Degree | $77,188 | $58,958 |
| Bachelor's Degree | $87,778 | $89,688 |
| Graduate Degree | $128,750 | $171,563 |
| Total | $80,833 | $81,000 |
Family Income in Tonka Bay
Family Income Brackets in Tonka Bay
According to the Tonka Bay family income data, there are 209 families falling into the $200,000+ income range, which is the most common income bracket and makes up 42.5% of all families.
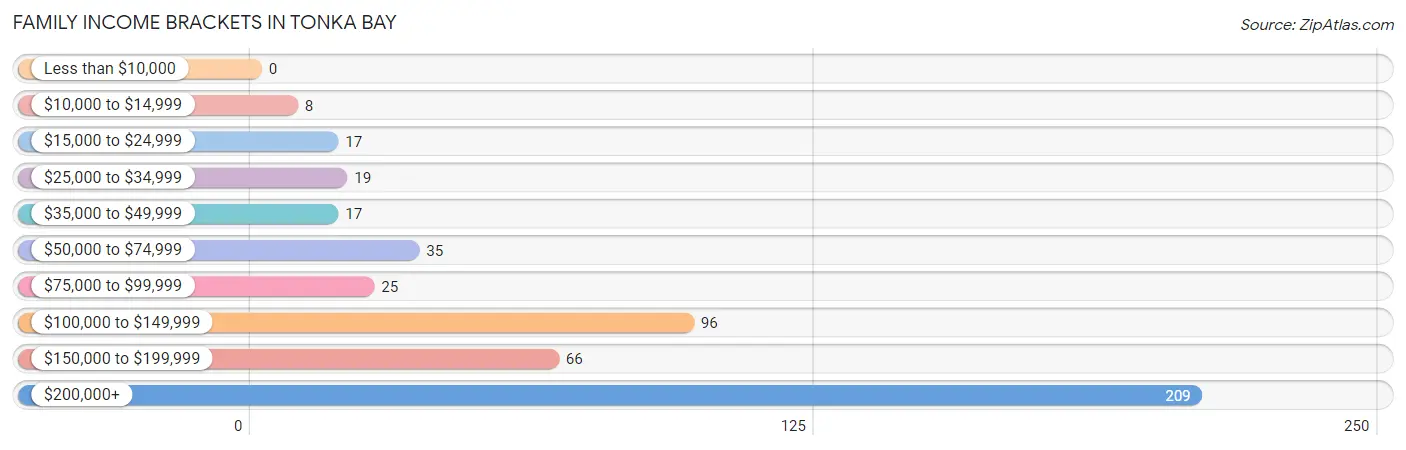
| Income Bracket | # Families | % Families |
| Less than $10,000 | 0 | 0.0% |
| $10,000 to $14,999 | 8 | 1.6% |
| $15,000 to $24,999 | 17 | 3.5% |
| $25,000 to $34,999 | 19 | 3.9% |
| $35,000 to $49,999 | 17 | 3.5% |
| $50,000 to $74,999 | 35 | 7.1% |
| $75,000 to $99,999 | 25 | 5.1% |
| $100,000 to $149,999 | 96 | 19.5% |
| $150,000 to $199,999 | 66 | 13.4% |
| $200,000+ | 209 | 42.5% |
Family Income by Famaliy Size in Tonka Bay
5-person families (14 | 2.9%) account for the highest median family income in Tonka Bay with $250,001 per family, while 2-person families (331 | 67.3%) have the highest median income of $82,578 per family member.
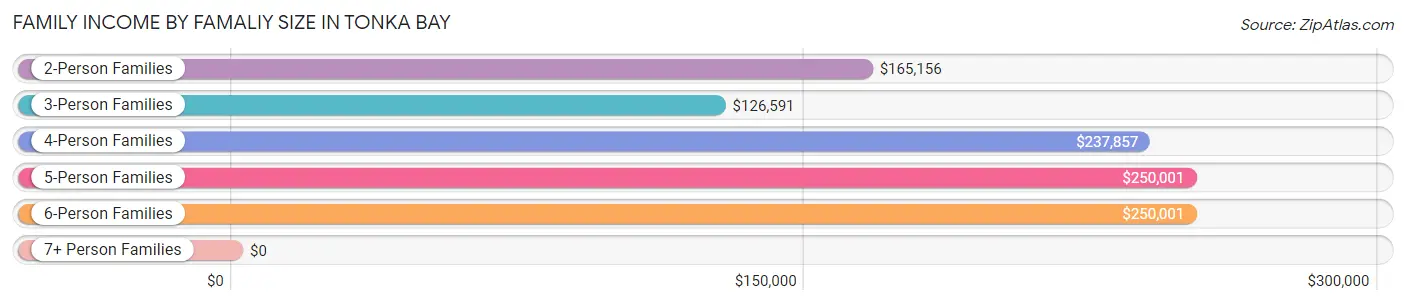
| Income Bracket | # Families | Median Income |
| 2-Person Families | 331 (67.3%) | $165,156 |
| 3-Person Families | 82 (16.7%) | $126,591 |
| 4-Person Families | 44 (8.9%) | $237,857 |
| 5-Person Families | 14 (2.9%) | $250,001 |
| 6-Person Families | 21 (4.3%) | $250,001 |
| 7+ Person Families | 0 (0.0%) | $0 |
| Total | 492 (100.0%) | $157,045 |
Family Income by Number of Earners in Tonka Bay
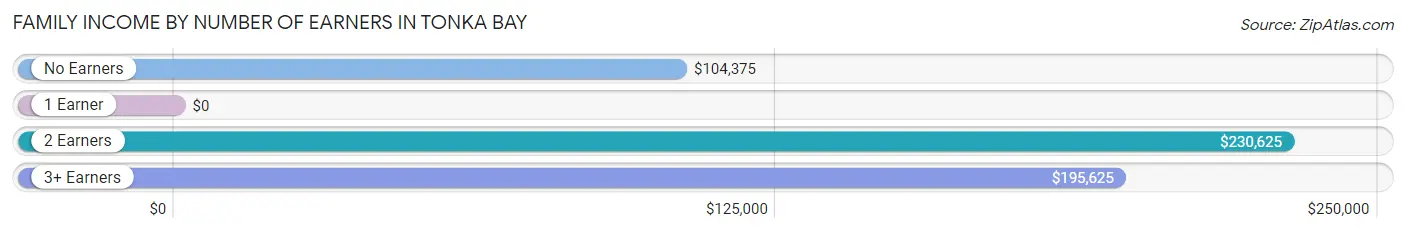
| Number of Earners | # Families | Median Income |
| No Earners | 108 (22.0%) | $104,375 |
| 1 Earner | 154 (31.3%) | $0 |
| 2 Earners | 194 (39.4%) | $230,625 |
| 3+ Earners | 36 (7.3%) | $195,625 |
| Total | 492 (100.0%) | $157,045 |
Household Income in Tonka Bay
Household Income Brackets in Tonka Bay
With 227 households falling in the category, the $200,000+ income range is the most frequent in Tonka Bay, accounting for 37.0% of all households. In contrast, only 5 households (0.8%) fall into the less than $10,000 income bracket, making it the least populous group.
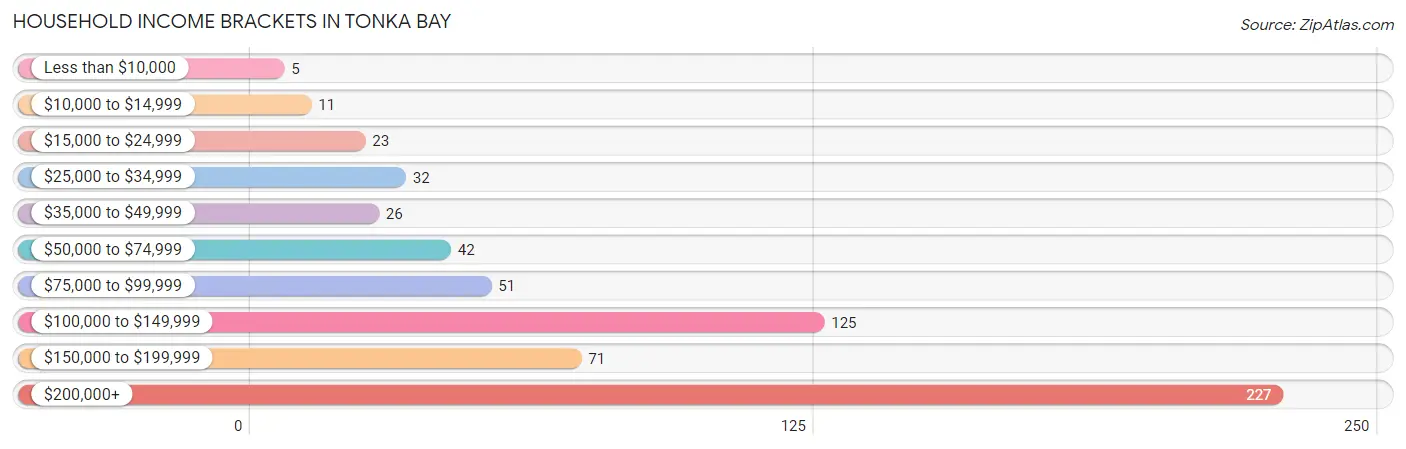
| Income Bracket | # Households | % Households |
| Less than $10,000 | 5 | 0.8% |
| $10,000 to $14,999 | 11 | 1.8% |
| $15,000 to $24,999 | 23 | 3.8% |
| $25,000 to $34,999 | 32 | 5.2% |
| $35,000 to $49,999 | 26 | 4.2% |
| $50,000 to $74,999 | 42 | 6.9% |
| $75,000 to $99,999 | 51 | 8.3% |
| $100,000 to $149,999 | 125 | 20.4% |
| $150,000 to $199,999 | 71 | 11.6% |
| $200,000+ | 227 | 37.0% |
Household Income by Householder Age in Tonka Bay
The median household income in Tonka Bay is $141,875, with the highest median household income of $168,750 found in the 45 to 64 years age bracket for the primary householder. A total of 310 households (50.6%) fall into this category.
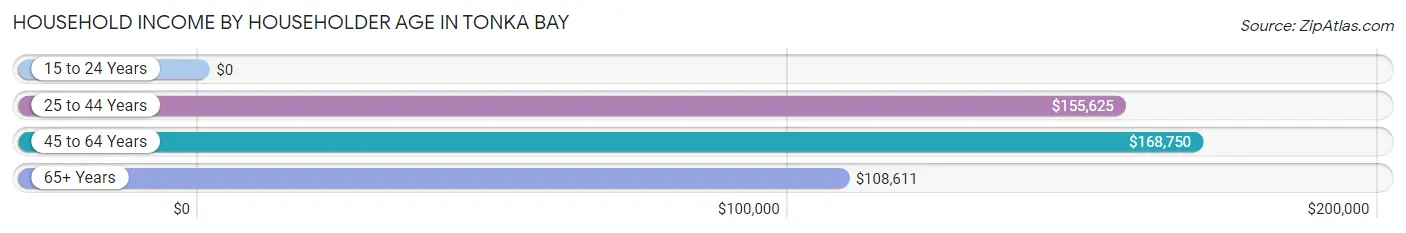
| Income Bracket | # Households | Median Income |
| 15 to 24 Years | 0 (0.0%) | $0 |
| 25 to 44 Years | 61 (10.0%) | $155,625 |
| 45 to 64 Years | 310 (50.6%) | $168,750 |
| 65+ Years | 242 (39.5%) | $108,611 |
| Total | 613 (100.0%) | $141,875 |
Poverty in Tonka Bay
Income Below Poverty by Sex and Age in Tonka Bay
With 10.4% poverty level for males and 6.9% for females among the residents of Tonka Bay, under 5 year old males and 12 to 14 year old females are the most vulnerable to poverty, with 10 males (38.5%) and 10 females (55.6%) in their respective age groups living below the poverty level.
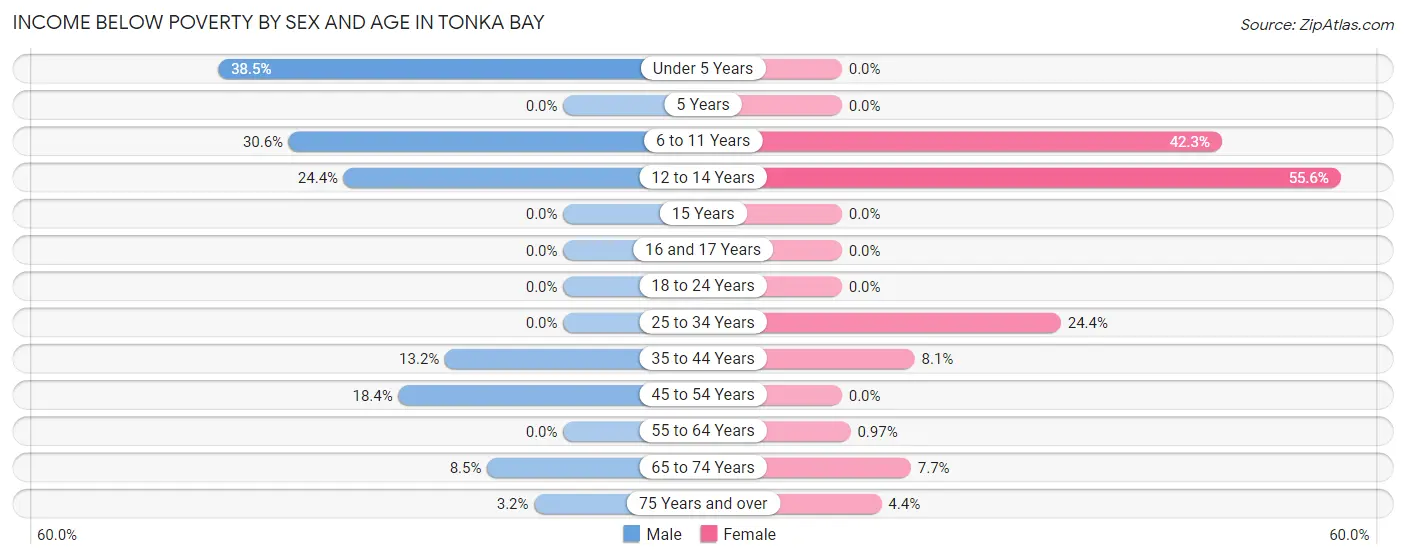
| Age Bracket | Male | Female |
| Under 5 Years | 10 (38.5%) | 0 (0.0%) |
| 5 Years | 0 (0.0%) | 0 (0.0%) |
| 6 to 11 Years | 11 (30.6%) | 11 (42.3%) |
| 12 to 14 Years | 11 (24.4%) | 10 (55.6%) |
| 15 Years | 0 (0.0%) | 0 (0.0%) |
| 16 and 17 Years | 0 (0.0%) | 0 (0.0%) |
| 18 to 24 Years | 0 (0.0%) | 0 (0.0%) |
| 25 to 34 Years | 0 (0.0%) | 10 (24.4%) |
| 35 to 44 Years | 10 (13.2%) | 3 (8.1%) |
| 45 to 54 Years | 20 (18.3%) | 0 (0.0%) |
| 55 to 64 Years | 0 (0.0%) | 2 (1.0%) |
| 65 to 74 Years | 15 (8.5%) | 10 (7.7%) |
| 75 Years and over | 2 (3.2%) | 3 (4.4%) |
| Total | 79 (10.4%) | 49 (6.9%) |
Income Above Poverty by Sex and Age in Tonka Bay
According to the poverty statistics in Tonka Bay, males aged 5 years and females aged 5 years are the age groups that are most secure financially, with 100.0% of males and 100.0% of females in these age groups living above the poverty line.
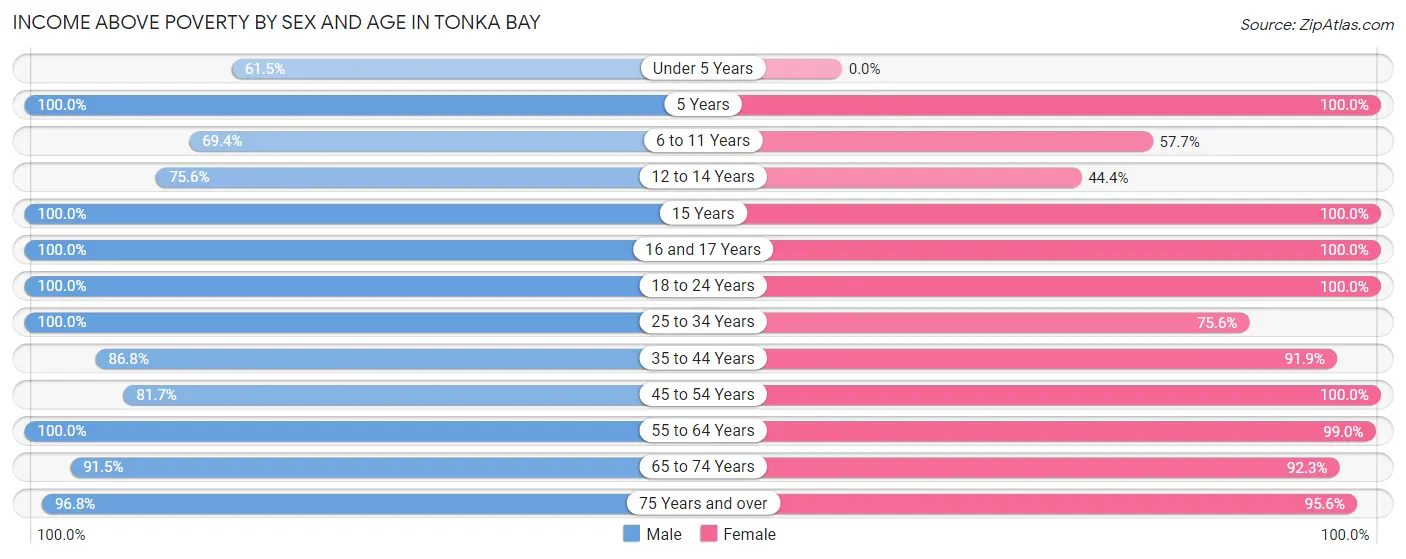
| Age Bracket | Male | Female |
| Under 5 Years | 16 (61.5%) | 0 (0.0%) |
| 5 Years | 2 (100.0%) | 13 (100.0%) |
| 6 to 11 Years | 25 (69.4%) | 15 (57.7%) |
| 12 to 14 Years | 34 (75.6%) | 8 (44.4%) |
| 15 Years | 11 (100.0%) | 6 (100.0%) |
| 16 and 17 Years | 9 (100.0%) | 36 (100.0%) |
| 18 to 24 Years | 31 (100.0%) | 27 (100.0%) |
| 25 to 34 Years | 14 (100.0%) | 31 (75.6%) |
| 35 to 44 Years | 66 (86.8%) | 34 (91.9%) |
| 45 to 54 Years | 89 (81.7%) | 97 (100.0%) |
| 55 to 64 Years | 158 (100.0%) | 205 (99.0%) |
| 65 to 74 Years | 162 (91.5%) | 120 (92.3%) |
| 75 Years and over | 60 (96.8%) | 65 (95.6%) |
| Total | 677 (89.5%) | 657 (93.1%) |
Income Below Poverty Among Married-Couple Families in Tonka Bay
The poverty statistics for married-couple families in Tonka Bay show that 2.3% or 10 of the total 428 families live below the poverty line. Families with no children have the highest poverty rate of 3.0%, comprising of 10 families. On the other hand, families with 1 or 2 children have the lowest poverty rate of 0.0%, which includes 0 families.
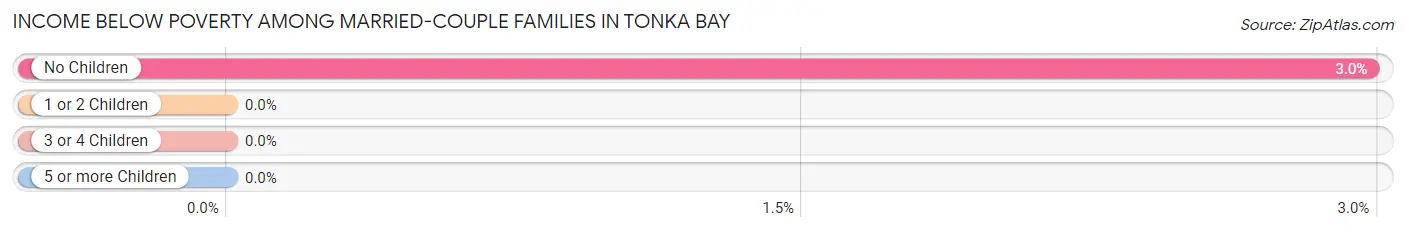
| Children | Above Poverty | Below Poverty |
| No Children | 326 (97.0%) | 10 (3.0%) |
| 1 or 2 Children | 75 (100.0%) | 0 (0.0%) |
| 3 or 4 Children | 17 (100.0%) | 0 (0.0%) |
| 5 or more Children | 0 (0.0%) | 0 (0.0%) |
| Total | 418 (97.7%) | 10 (2.3%) |
Income Below Poverty Among Single-Parent Households in Tonka Bay
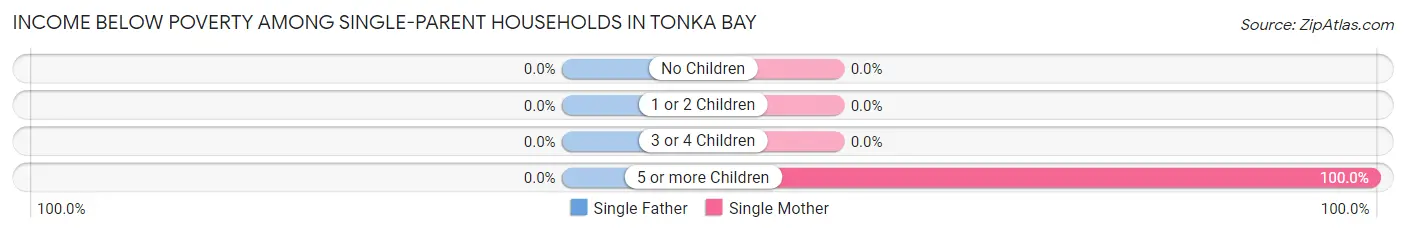
| Children | Single Father | Single Mother |
| No Children | 0 (0.0%) | 0 (0.0%) |
| 1 or 2 Children | 0 (0.0%) | 0 (0.0%) |
| 3 or 4 Children | 0 (0.0%) | 0 (0.0%) |
| 5 or more Children | 0 (0.0%) | 10 (100.0%) |
| Total | 0 (0.0%) | 10 (21.3%) |
Income Below Poverty Among Married-Couple vs Single-Parent Households in Tonka Bay
The poverty data for Tonka Bay shows that 10 of the married-couple family households (2.3%) and 10 of the single-parent households (15.6%) are living below the poverty level. Within the married-couple family households, those with no children have the highest poverty rate, with 10 households (3.0%) falling below the poverty line. Among the single-parent households, those with 5 or more children have the highest poverty rate, with 10 household (100.0%) living below poverty.
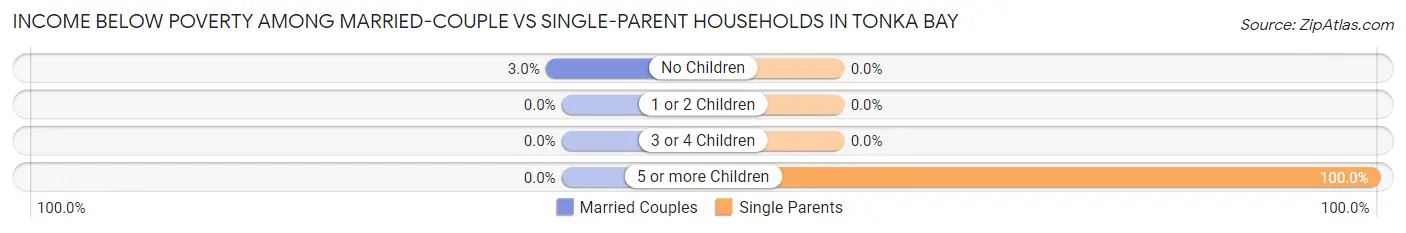
| Children | Married-Couple Families | Single-Parent Households |
| No Children | 10 (3.0%) | 0 (0.0%) |
| 1 or 2 Children | 0 (0.0%) | 0 (0.0%) |
| 3 or 4 Children | 0 (0.0%) | 0 (0.0%) |
| 5 or more Children | 0 (0.0%) | 10 (100.0%) |
| Total | 10 (2.3%) | 10 (15.6%) |
Race in Tonka Bay
The most populous races in Tonka Bay are White / Caucasian (1,286 | 88.0%), Two or more Races (97 | 6.6%), and Black / African American (73 | 5.0%).
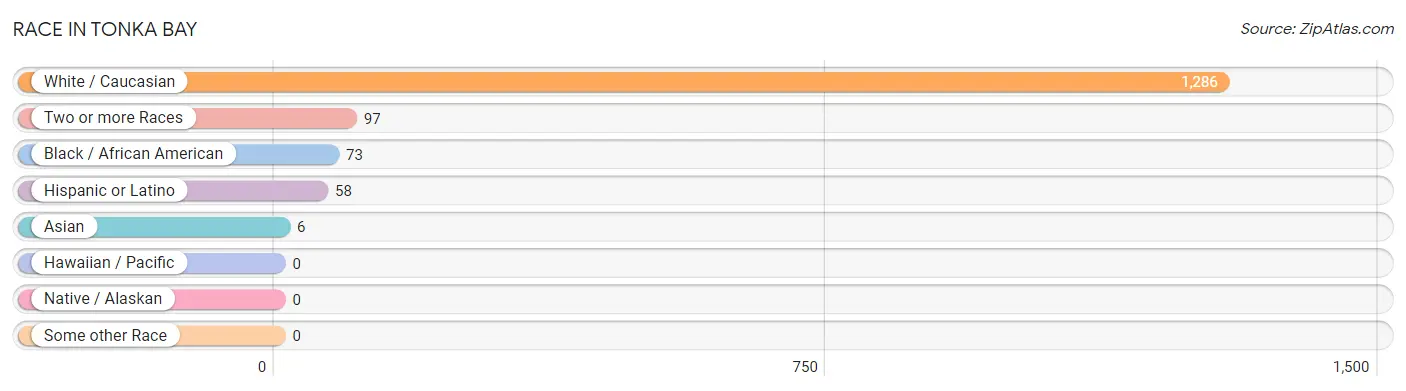
| Race | # Population | % Population |
| Asian | 6 | 0.4% |
| Black / African American | 73 | 5.0% |
| Hawaiian / Pacific | 0 | 0.0% |
| Hispanic or Latino | 58 | 4.0% |
| Native / Alaskan | 0 | 0.0% |
| White / Caucasian | 1,286 | 88.0% |
| Two or more Races | 97 | 6.6% |
| Some other Race | 0 | 0.0% |
| Total | 1,462 | 100.0% |
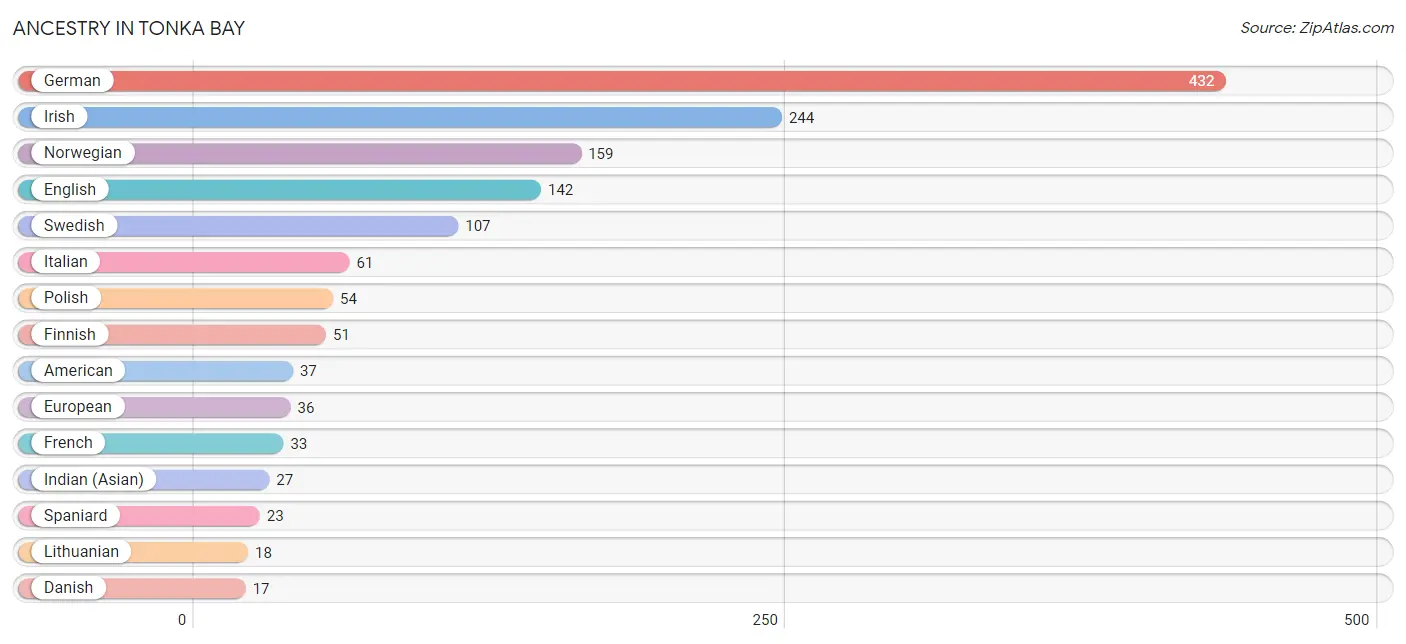
Ancestry in Tonka Bay
The most populous ancestries reported in Tonka Bay are German (432 | 29.5%), Irish (244 | 16.7%), Norwegian (159 | 10.9%), English (142 | 9.7%), and Swedish (107 | 7.3%), together accounting for 74.1% of all Tonka Bay residents.
| Ancestry | # Population | % Population |
| American | 37 | 2.5% |
| Austrian | 3 | 0.2% |
| Belgian | 10 | 0.7% |
| British | 6 | 0.4% |
| Burmese | 3 | 0.2% |
| Canadian | 11 | 0.7% |
| Central American | 2 | 0.1% |
| Chippewa | 5 | 0.3% |
| Choctaw | 14 | 1.0% |
| Croatian | 3 | 0.2% |
| Czech | 6 | 0.4% |
| Danish | 17 | 1.2% |
| Dutch | 11 | 0.7% |
| Eastern European | 9 | 0.6% |
| English | 142 | 9.7% |
| European | 36 | 2.5% |
| Finnish | 51 | 3.5% |
| French | 33 | 2.3% |
| French Canadian | 5 | 0.3% |
| German | 432 | 29.5% |
| Greek | 6 | 0.4% |
| Haitian | 2 | 0.1% |
| Hungarian | 9 | 0.6% |
| Indian (Asian) | 27 | 1.8% |
| Irish | 244 | 16.7% |
| Italian | 61 | 4.2% |
| Korean | 3 | 0.2% |
| Lithuanian | 18 | 1.2% |
| Luxembourger | 5 | 0.3% |
| Macedonian | 13 | 0.9% |
| Mexican | 4 | 0.3% |
| Native Hawaiian | 5 | 0.3% |
| Northern European | 9 | 0.6% |
| Norwegian | 159 | 10.9% |
| Panamanian | 2 | 0.1% |
| Polish | 54 | 3.7% |
| Puerto Rican | 3 | 0.2% |
| Romanian | 3 | 0.2% |
| Russian | 4 | 0.3% |
| Scandinavian | 6 | 0.4% |
| Scotch-Irish | 6 | 0.4% |
| Scottish | 12 | 0.8% |
| Serbian | 1 | 0.1% |
| Slovene | 3 | 0.2% |
| Spaniard | 23 | 1.6% |
| Swedish | 107 | 7.3% |
| Swiss | 7 | 0.5% |
| Ukrainian | 2 | 0.1% |
| Welsh | 2 | 0.1% | View All 49 Rows |
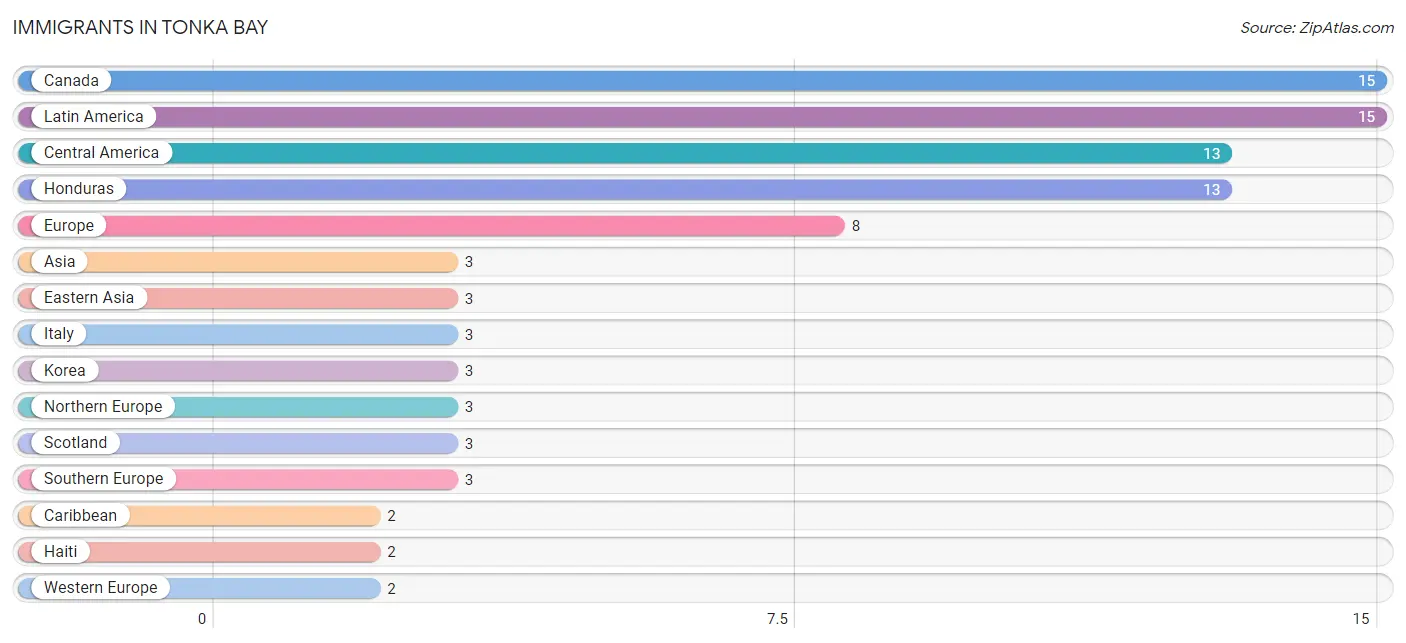
Immigrants in Tonka Bay
The most numerous immigrant groups reported in Tonka Bay came from Canada (15 | 1.0%), Latin America (15 | 1.0%), Central America (13 | 0.9%), Honduras (13 | 0.9%), and Europe (8 | 0.5%), together accounting for 4.4% of all Tonka Bay residents.
| Immigration Origin | # Population | % Population |
| Asia | 3 | 0.2% |
| Canada | 15 | 1.0% |
| Caribbean | 2 | 0.1% |
| Central America | 13 | 0.9% |
| Eastern Asia | 3 | 0.2% |
| Europe | 8 | 0.5% |
| France | 1 | 0.1% |
| Haiti | 2 | 0.1% |
| Honduras | 13 | 0.9% |
| Italy | 3 | 0.2% |
| Korea | 3 | 0.2% |
| Latin America | 15 | 1.0% |
| Netherlands | 1 | 0.1% |
| Northern Europe | 3 | 0.2% |
| Scotland | 3 | 0.2% |
| Southern Europe | 3 | 0.2% |
| Western Europe | 2 | 0.1% | View All 17 Rows |
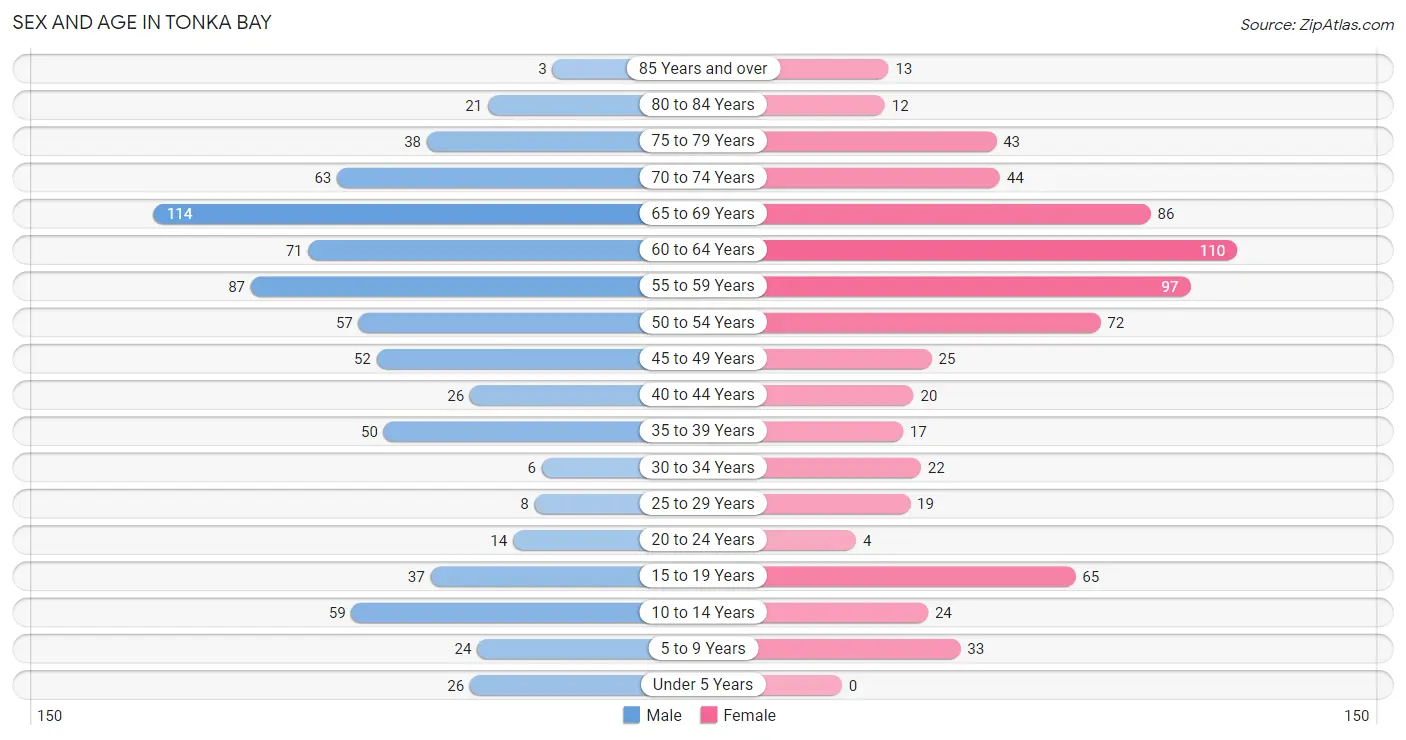
Sex and Age in Tonka Bay
Sex and Age in Tonka Bay
The most populous age groups in Tonka Bay are 65 to 69 Years (114 | 15.1%) for men and 60 to 64 Years (110 | 15.6%) for women.
| Age Bracket | Male | Female |
| Under 5 Years | 26 (3.4%) | 0 (0.0%) |
| 5 to 9 Years | 24 (3.2%) | 33 (4.7%) |
| 10 to 14 Years | 59 (7.8%) | 24 (3.4%) |
| 15 to 19 Years | 37 (4.9%) | 65 (9.2%) |
| 20 to 24 Years | 14 (1.8%) | 4 (0.6%) |
| 25 to 29 Years | 8 (1.1%) | 19 (2.7%) |
| 30 to 34 Years | 6 (0.8%) | 22 (3.1%) |
| 35 to 39 Years | 50 (6.6%) | 17 (2.4%) |
| 40 to 44 Years | 26 (3.4%) | 20 (2.8%) |
| 45 to 49 Years | 52 (6.9%) | 25 (3.5%) |
| 50 to 54 Years | 57 (7.5%) | 72 (10.2%) |
| 55 to 59 Years | 87 (11.5%) | 97 (13.7%) |
| 60 to 64 Years | 71 (9.4%) | 110 (15.6%) |
| 65 to 69 Years | 114 (15.1%) | 86 (12.2%) |
| 70 to 74 Years | 63 (8.3%) | 44 (6.2%) |
| 75 to 79 Years | 38 (5.0%) | 43 (6.1%) |
| 80 to 84 Years | 21 (2.8%) | 12 (1.7%) |
| 85 Years and over | 3 (0.4%) | 13 (1.8%) |
| Total | 756 (100.0%) | 706 (100.0%) |
Families and Households in Tonka Bay
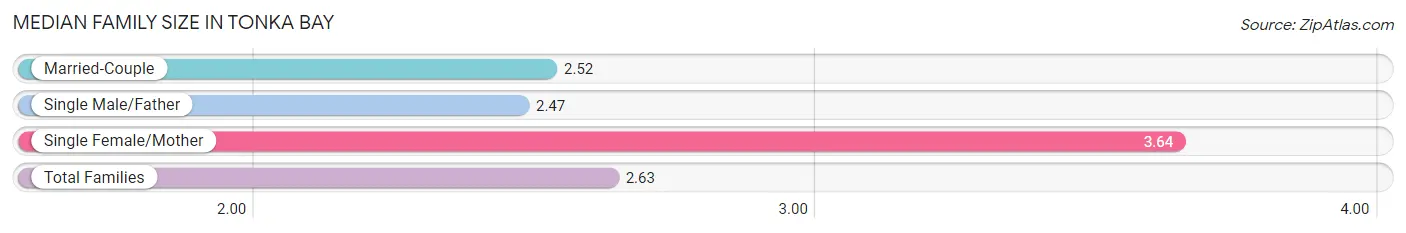
Median Family Size in Tonka Bay
The median family size in Tonka Bay is 2.63 persons per family, with single female/mother families (47 | 9.6%) accounting for the largest median family size of 3.64 persons per family. On the other hand, single male/father families (17 | 3.5%) represent the smallest median family size with 2.47 persons per family.
| Family Type | # Families | Family Size |
| Married-Couple | 428 (87.0%) | 2.52 |
| Single Male/Father | 17 (3.5%) | 2.47 |
| Single Female/Mother | 47 (9.6%) | 3.64 |
| Total Families | 492 (100.0%) | 2.63 |
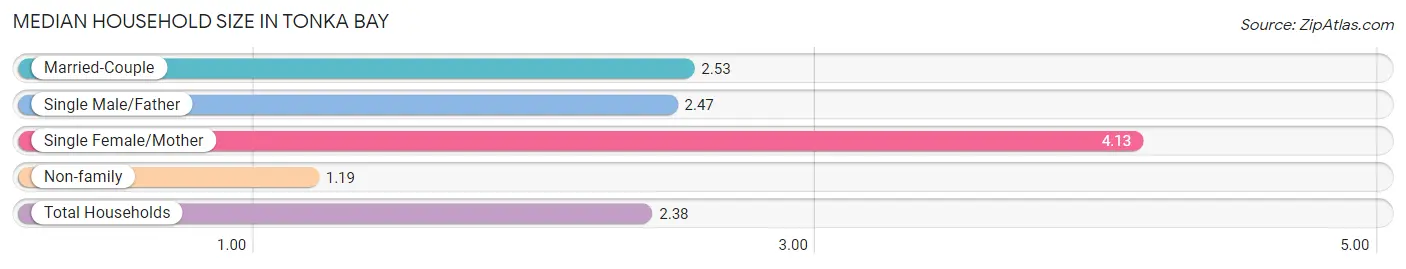
Median Household Size in Tonka Bay
The median household size in Tonka Bay is 2.38 persons per household, with single female/mother households (47 | 7.7%) accounting for the largest median household size of 4.13 persons per household. non-family households (121 | 19.7%) represent the smallest median household size with 1.19 persons per household.
| Household Type | # Households | Household Size |
| Married-Couple | 428 (69.8%) | 2.53 |
| Single Male/Father | 17 (2.8%) | 2.47 |
| Single Female/Mother | 47 (7.7%) | 4.13 |
| Non-family | 121 (19.7%) | 1.19 |
| Total Households | 613 (100.0%) | 2.38 |
Household Size by Marriage Status in Tonka Bay
Out of a total of 613 households in Tonka Bay, 492 (80.3%) are family households, while 121 (19.7%) are nonfamily households. The most numerous type of family households are 2-person households, comprising 331, and the most common type of nonfamily households are 1-person households, comprising 97.
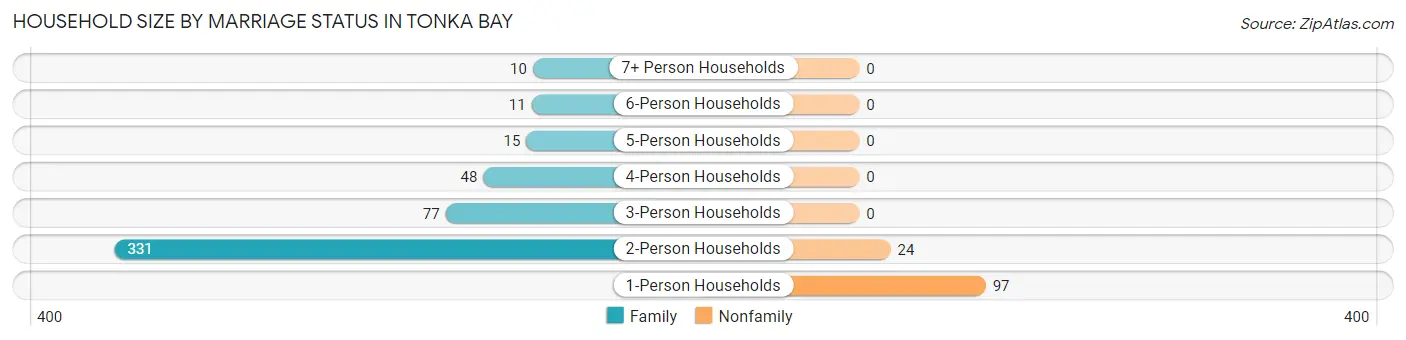
| Household Size | Family Households | Nonfamily Households |
| 1-Person Households | - | 97 (15.8%) |
| 2-Person Households | 331 (54.0%) | 24 (3.9%) |
| 3-Person Households | 77 (12.6%) | 0 (0.0%) |
| 4-Person Households | 48 (7.8%) | 0 (0.0%) |
| 5-Person Households | 15 (2.5%) | 0 (0.0%) |
| 6-Person Households | 11 (1.8%) | 0 (0.0%) |
| 7+ Person Households | 10 (1.6%) | 0 (0.0%) |
| Total | 492 (80.3%) | 121 (19.7%) |
Female Fertility in Tonka Bay
Fertility by Age in Tonka Bay
Average fertility rate in Tonka Bay is 21.0 births per 1,000 women. Women in the age bracket of 35 to 50 years have the highest fertility rate with 48.0 births per 1,000 women. Women in the age bracket of 35 to 50 years acount for 100.0% of all women with births.
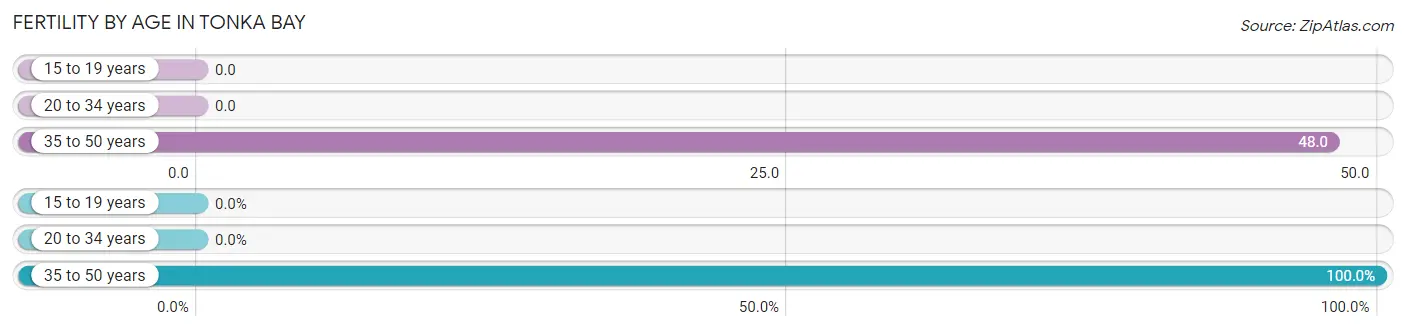
| Age Bracket | Women with Births | Births / 1,000 Women |
| 15 to 19 years | 0 (0.0%) | 0.0 |
| 20 to 34 years | 0 (0.0%) | 0.0 |
| 35 to 50 years | 4 (100.0%) | 48.0 |
| Total | 4 (100.0%) | 21.0 |
Fertility by Age by Marriage Status in Tonka Bay
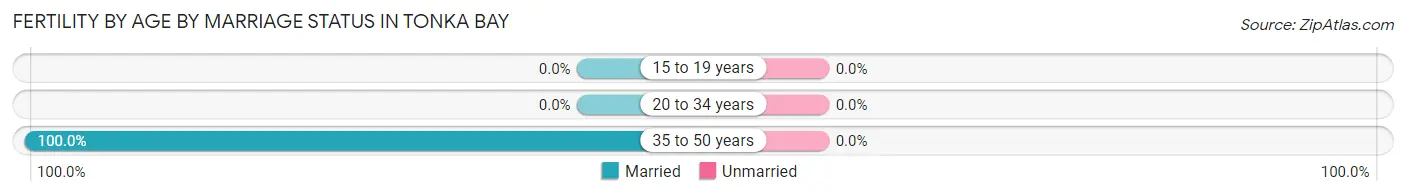
| Age Bracket | Married | Unmarried |
| 15 to 19 years | 0 (0.0%) | 0 (0.0%) |
| 20 to 34 years | 0 (0.0%) | 0 (0.0%) |
| 35 to 50 years | 4 (100.0%) | 0 (0.0%) |
| Total | 4 (100.0%) | 0 (0.0%) |
Fertility by Education in Tonka Bay
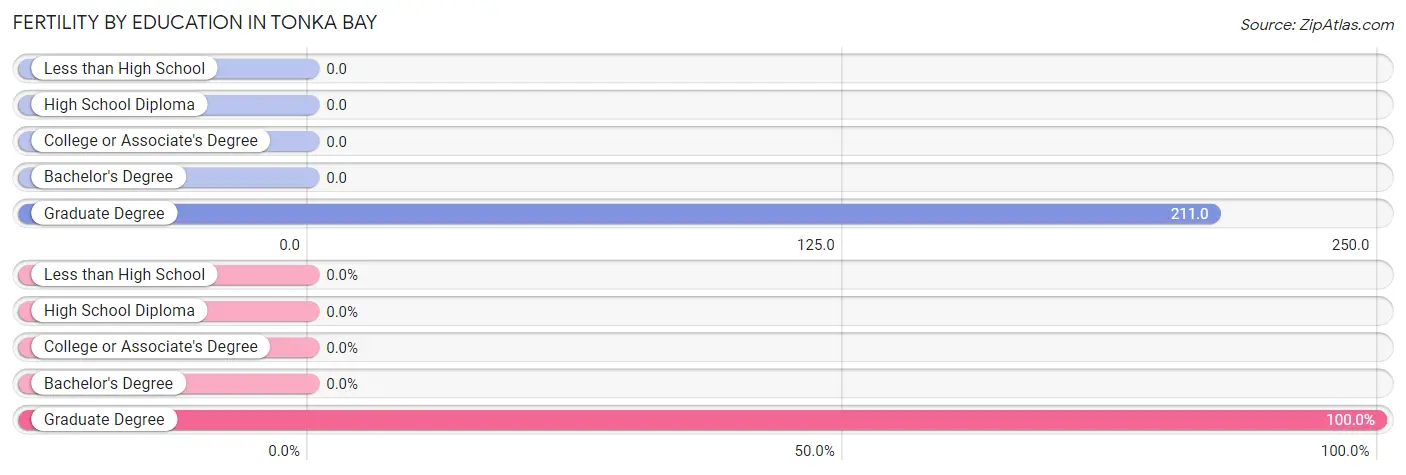
| Educational Attainment | Women with Births | Births / 1,000 Women |
| Less than High School | 0 (0.0%) | 0.0 |
| High School Diploma | 0 (0.0%) | 0.0 |
| College or Associate's Degree | 0 (0.0%) | 0.0 |
| Bachelor's Degree | 0 (0.0%) | 0.0 |
| Graduate Degree | 4 (100.0%) | 211.0 |
| Total | 4 (100.0%) | 21.0 |
Fertility by Education by Marriage Status in Tonka Bay
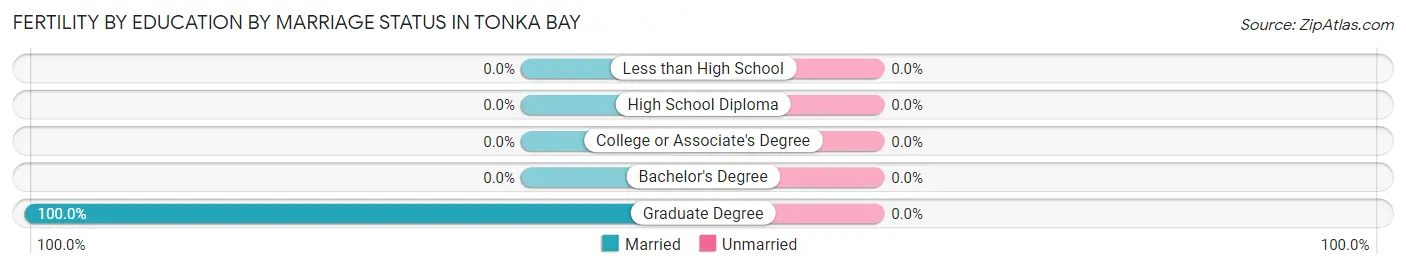
| Educational Attainment | Married | Unmarried |
| Less than High School | 0 (0.0%) | 0 (0.0%) |
| High School Diploma | 0 (0.0%) | 0 (0.0%) |
| College or Associate's Degree | 0 (0.0%) | 0 (0.0%) |
| Bachelor's Degree | 0 (0.0%) | 0 (0.0%) |
| Graduate Degree | 4 (100.0%) | 0 (0.0%) |
| Total | 4 (100.0%) | 0 (0.0%) |
Employment Characteristics in Tonka Bay
Employment by Class of Employer in Tonka Bay
Among the 646 employed individuals in Tonka Bay, private company employees (425 | 65.8%), self-employed (incorporated) (84 | 13.0%), and self-employed (not incorporated) (56 | 8.7%) make up the most common classes of employment.
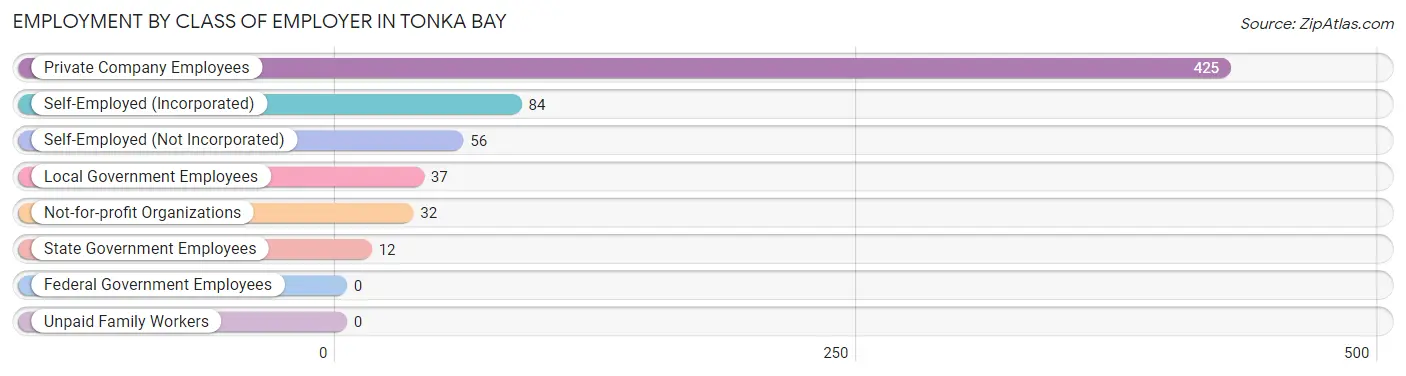
| Employer Class | # Employees | % Employees |
| Private Company Employees | 425 | 65.8% |
| Self-Employed (Incorporated) | 84 | 13.0% |
| Self-Employed (Not Incorporated) | 56 | 8.7% |
| Not-for-profit Organizations | 32 | 5.0% |
| Local Government Employees | 37 | 5.7% |
| State Government Employees | 12 | 1.9% |
| Federal Government Employees | 0 | 0.0% |
| Unpaid Family Workers | 0 | 0.0% |
| Total | 646 | 100.0% |
Employment Status by Age in Tonka Bay
According to the labor force statistics for Tonka Bay, out of the total population over 16 years of age (1,279), 55.7% or 712 individuals are in the labor force, with 7.6% or 54 of them unemployed. The age group with the highest labor force participation rate is 30 to 34 years, with 100.0% or 28 individuals in the labor force. Within the labor force, the 65 to 74 years age range has the highest percentage of unemployed individuals, with 21.8% or 27 of them being unemployed.
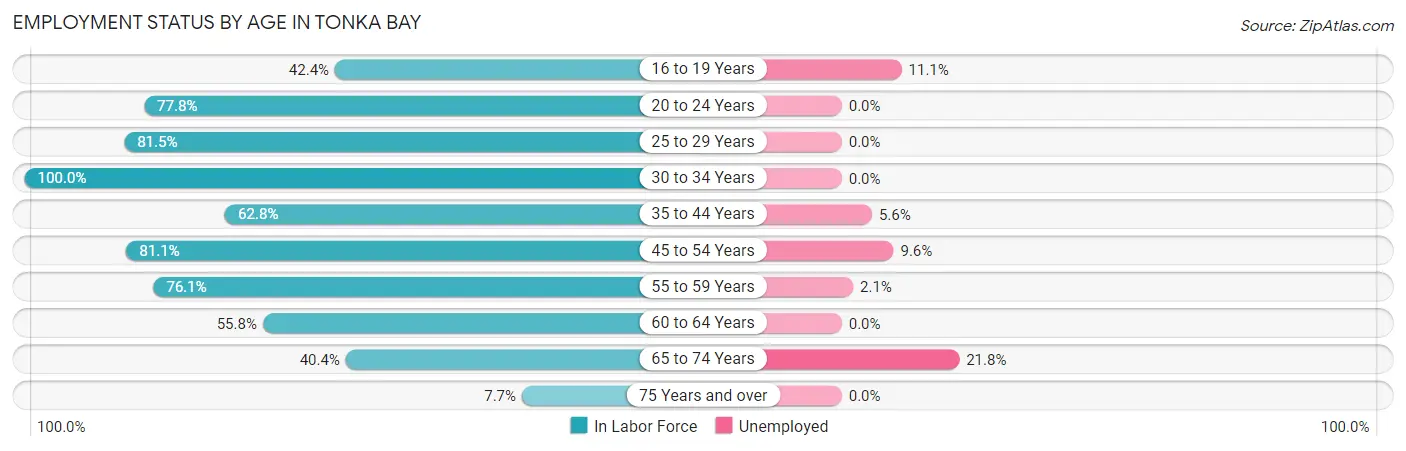
| Age Bracket | In Labor Force | Unemployed |
| 16 to 19 Years | 36 (42.4%) | 4 (11.1%) |
| 20 to 24 Years | 14 (77.8%) | 0 (0.0%) |
| 25 to 29 Years | 22 (81.5%) | 0 (0.0%) |
| 30 to 34 Years | 28 (100.0%) | 0 (0.0%) |
| 35 to 44 Years | 71 (62.8%) | 4 (5.6%) |
| 45 to 54 Years | 167 (81.1%) | 16 (9.6%) |
| 55 to 59 Years | 140 (76.1%) | 3 (2.1%) |
| 60 to 64 Years | 101 (55.8%) | 0 (0.0%) |
| 65 to 74 Years | 124 (40.4%) | 27 (21.8%) |
| 75 Years and over | 10 (7.7%) | 0 (0.0%) |
| Total | 712 (55.7%) | 54 (7.6%) |
Employment Status by Educational Attainment in Tonka Bay
According to labor force statistics for Tonka Bay, 71.6% of individuals (529) out of the total population between 25 and 64 years of age (739) are in the labor force, with 4.3% or 23 of them being unemployed. The group with the highest labor force participation rate are those with the educational attainment of less than high school, with 100.0% or 8 individuals in the labor force. Within the labor force, individuals with high school diploma education have the highest percentage of unemployment, with 29.4% or 15 of them being unemployed.
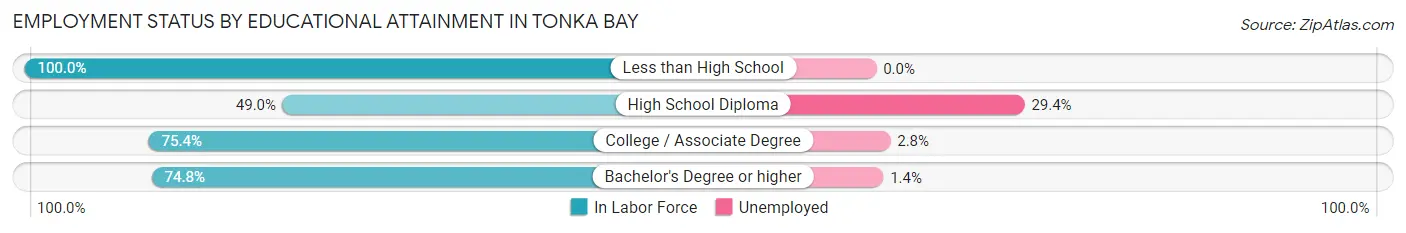
| Educational Attainment | In Labor Force | Unemployed |
| Less than High School | 8 (100.0%) | 0 (0.0%) |
| High School Diploma | 51 (49.0%) | 31 (29.4%) |
| College / Associate Degree | 107 (75.4%) | 4 (2.8%) |
| Bachelor's Degree or higher | 363 (74.8%) | 7 (1.4%) |
| Total | 529 (71.6%) | 32 (4.3%) |
Employment Occupations by Sex in Tonka Bay
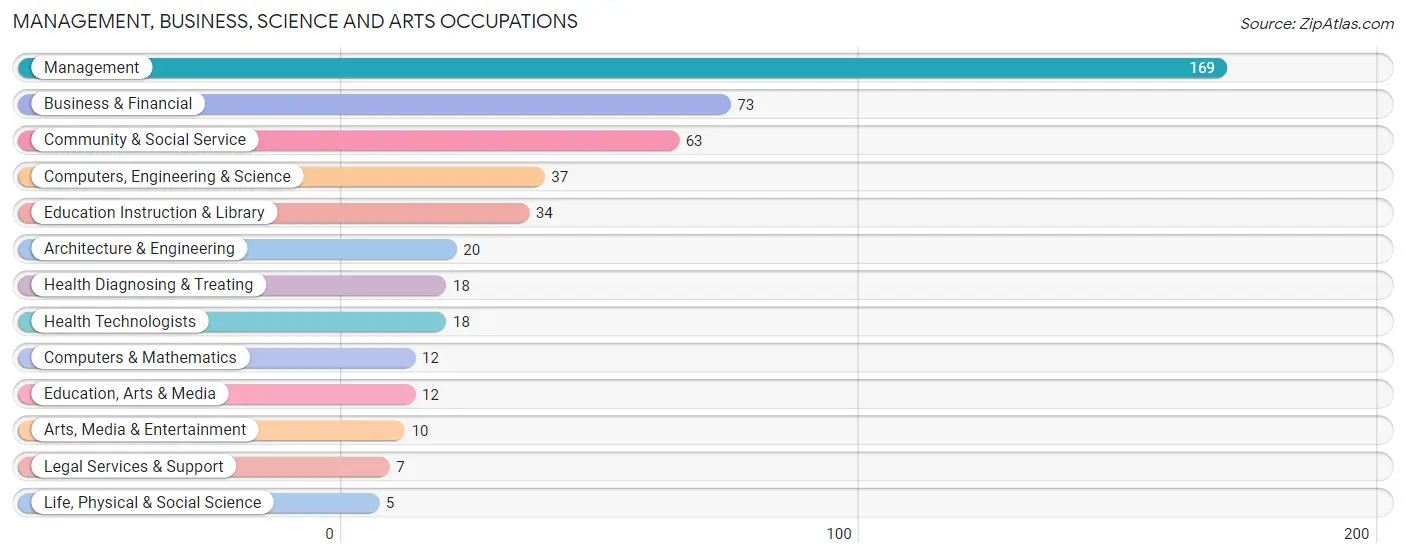
Management, Business, Science and Arts Occupations
The most common Management, Business, Science and Arts occupations in Tonka Bay are Management (169 | 25.6%), Business & Financial (73 | 11.1%), Community & Social Service (63 | 9.6%), Computers, Engineering & Science (37 | 5.6%), and Education Instruction & Library (34 | 5.2%).
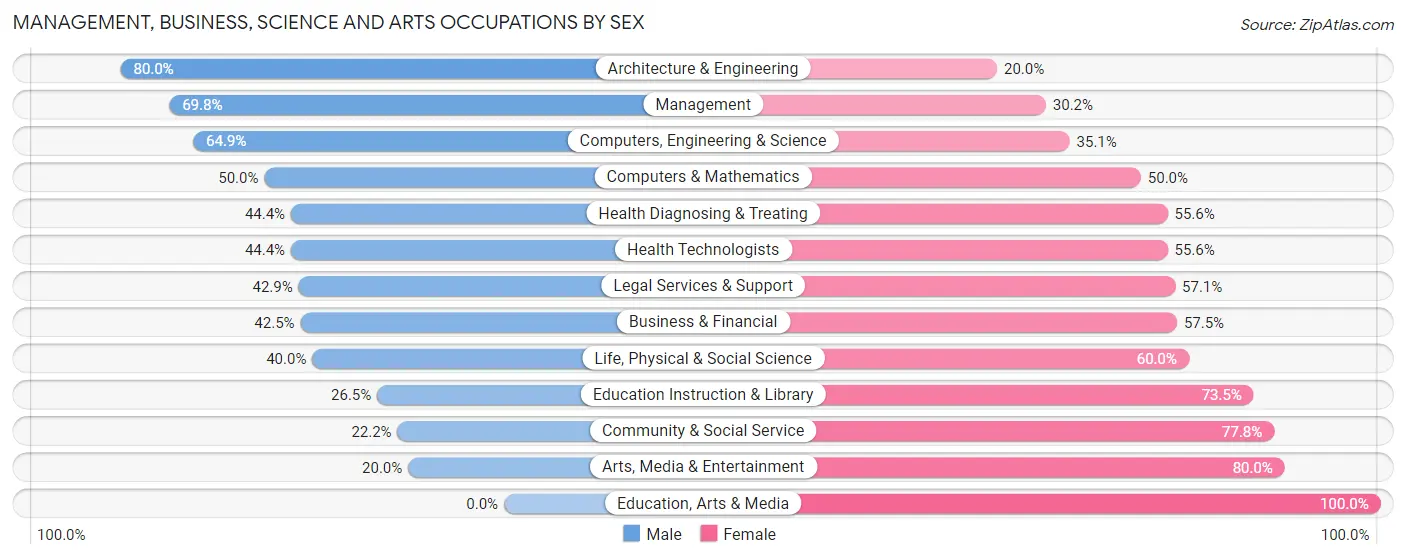
Management, Business, Science and Arts Occupations by Sex
Within the Management, Business, Science and Arts occupations in Tonka Bay, the most male-oriented occupations are Architecture & Engineering (80.0%), Management (69.8%), and Computers, Engineering & Science (64.9%), while the most female-oriented occupations are Education, Arts & Media (100.0%), Arts, Media & Entertainment (80.0%), and Community & Social Service (77.8%).
| Occupation | Male | Female |
| Management | 118 (69.8%) | 51 (30.2%) |
| Business & Financial | 31 (42.5%) | 42 (57.5%) |
| Computers, Engineering & Science | 24 (64.9%) | 13 (35.1%) |
| Computers & Mathematics | 6 (50.0%) | 6 (50.0%) |
| Architecture & Engineering | 16 (80.0%) | 4 (20.0%) |
| Life, Physical & Social Science | 2 (40.0%) | 3 (60.0%) |
| Community & Social Service | 14 (22.2%) | 49 (77.8%) |
| Education, Arts & Media | 0 (0.0%) | 12 (100.0%) |
| Legal Services & Support | 3 (42.9%) | 4 (57.1%) |
| Education Instruction & Library | 9 (26.5%) | 25 (73.5%) |
| Arts, Media & Entertainment | 2 (20.0%) | 8 (80.0%) |
| Health Diagnosing & Treating | 8 (44.4%) | 10 (55.6%) |
| Health Technologists | 8 (44.4%) | 10 (55.6%) |
| Total (Category) | 195 (54.2%) | 165 (45.8%) |
| Total (Overall) | 354 (53.7%) | 305 (46.3%) |
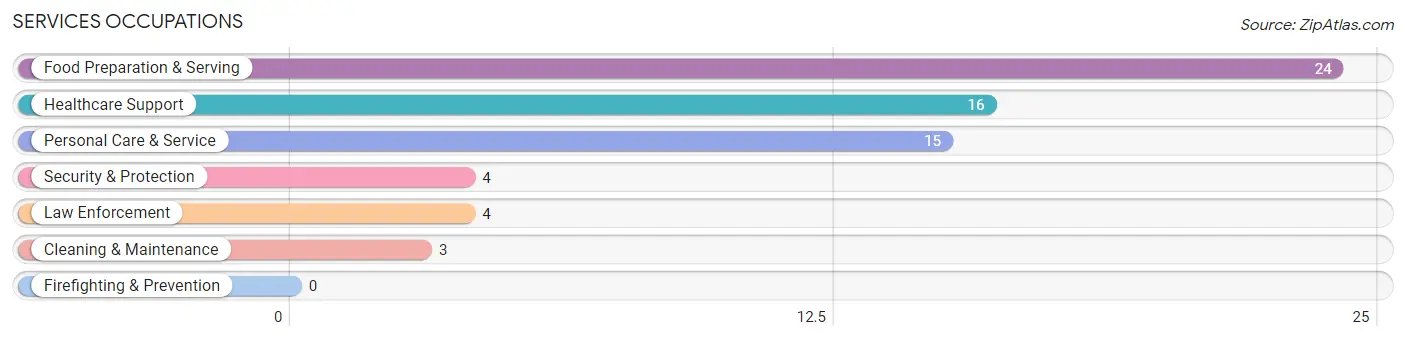
Services Occupations
The most common Services occupations in Tonka Bay are Food Preparation & Serving (24 | 3.6%), Healthcare Support (16 | 2.4%), Personal Care & Service (15 | 2.3%), Security & Protection (4 | 0.6%), and Law Enforcement (4 | 0.6%).
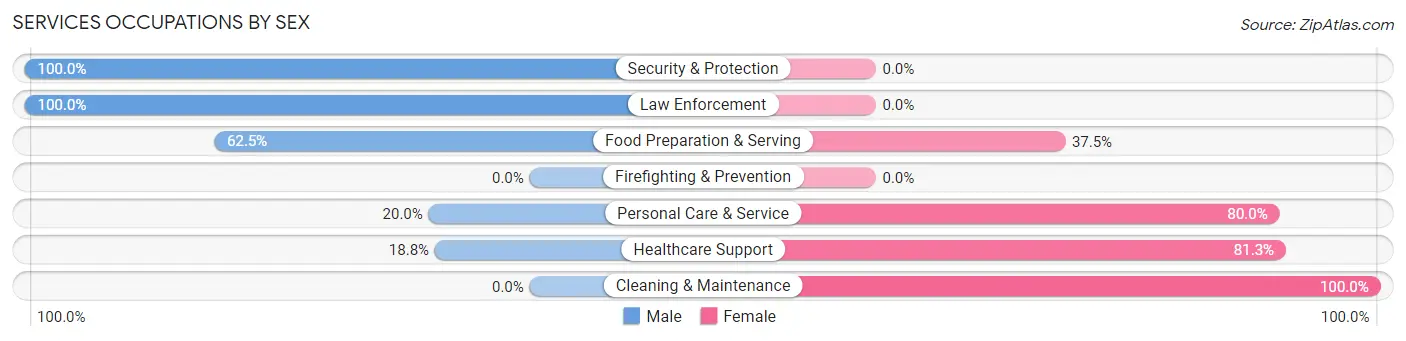
Services Occupations by Sex
Within the Services occupations in Tonka Bay, the most male-oriented occupations are Security & Protection (100.0%), Law Enforcement (100.0%), and Food Preparation & Serving (62.5%), while the most female-oriented occupations are Cleaning & Maintenance (100.0%), Healthcare Support (81.2%), and Personal Care & Service (80.0%).
| Occupation | Male | Female |
| Healthcare Support | 3 (18.8%) | 13 (81.2%) |
| Security & Protection | 4 (100.0%) | 0 (0.0%) |
| Firefighting & Prevention | 0 (0.0%) | 0 (0.0%) |
| Law Enforcement | 4 (100.0%) | 0 (0.0%) |
| Food Preparation & Serving | 15 (62.5%) | 9 (37.5%) |
| Cleaning & Maintenance | 0 (0.0%) | 3 (100.0%) |
| Personal Care & Service | 3 (20.0%) | 12 (80.0%) |
| Total (Category) | 25 (40.3%) | 37 (59.7%) |
| Total (Overall) | 354 (53.7%) | 305 (46.3%) |
Sales and Office Occupations
The most common Sales and Office occupations in Tonka Bay are Sales & Related (128 | 19.4%), and Office & Administration (56 | 8.5%).
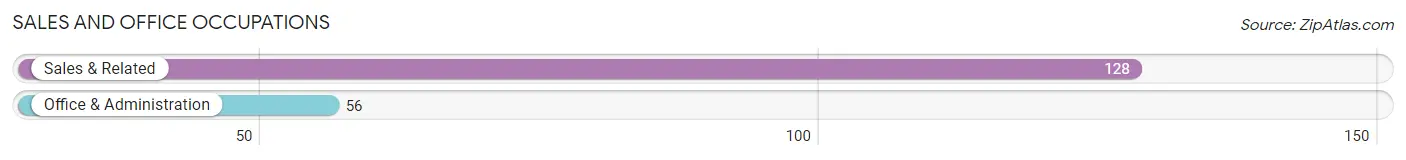
Sales and Office Occupations by Sex
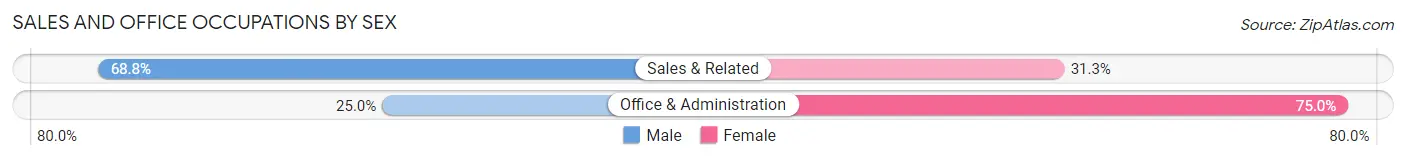
| Occupation | Male | Female |
| Sales & Related | 88 (68.8%) | 40 (31.2%) |
| Office & Administration | 14 (25.0%) | 42 (75.0%) |
| Total (Category) | 102 (55.4%) | 82 (44.6%) |
| Total (Overall) | 354 (53.7%) | 305 (46.3%) |
Natural Resources, Construction and Maintenance Occupations
The most common Natural Resources, Construction and Maintenance occupations in Tonka Bay are Construction & Extraction (11 | 1.7%), and Installation, Maintenance & Repair (8 | 1.2%).
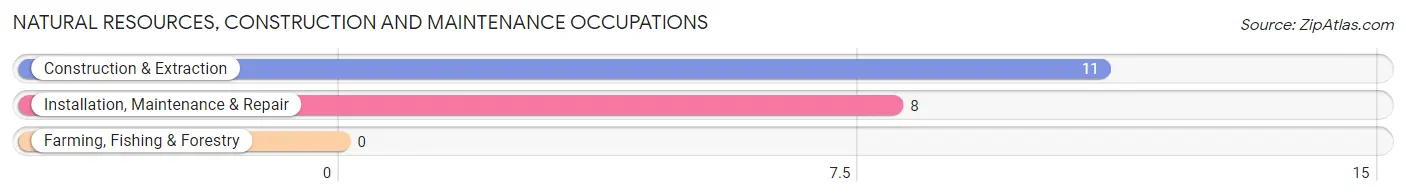
Natural Resources, Construction and Maintenance Occupations by Sex
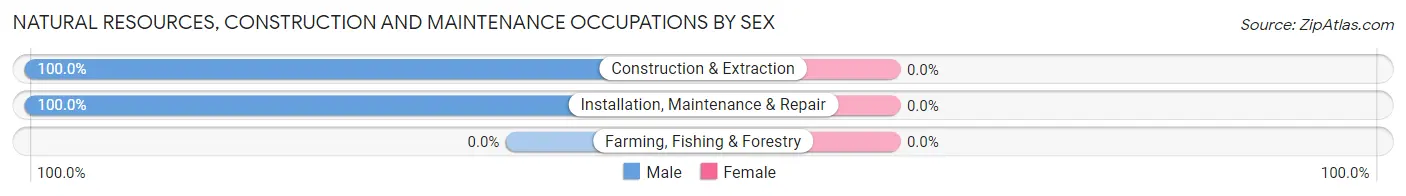
| Occupation | Male | Female |
| Farming, Fishing & Forestry | 0 (0.0%) | 0 (0.0%) |
| Construction & Extraction | 11 (100.0%) | 0 (0.0%) |
| Installation, Maintenance & Repair | 8 (100.0%) | 0 (0.0%) |
| Total (Category) | 19 (100.0%) | 0 (0.0%) |
| Total (Overall) | 354 (53.7%) | 305 (46.3%) |
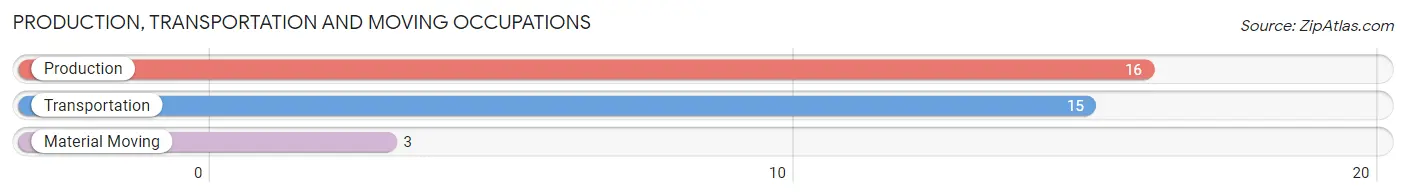
Production, Transportation and Moving Occupations
The most common Production, Transportation and Moving occupations in Tonka Bay are Production (16 | 2.4%), Transportation (15 | 2.3%), and Material Moving (3 | 0.5%).
Production, Transportation and Moving Occupations by Sex
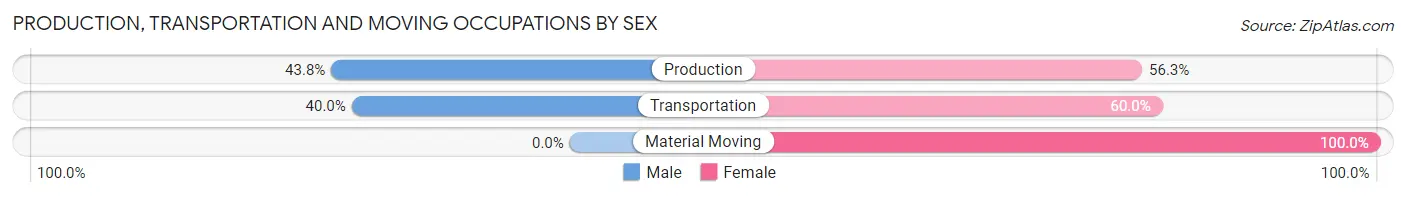
| Occupation | Male | Female |
| Production | 7 (43.8%) | 9 (56.2%) |
| Transportation | 6 (40.0%) | 9 (60.0%) |
| Material Moving | 0 (0.0%) | 3 (100.0%) |
| Total (Category) | 13 (38.2%) | 21 (61.8%) |
| Total (Overall) | 354 (53.7%) | 305 (46.3%) |
Employment Industries by Sex in Tonka Bay
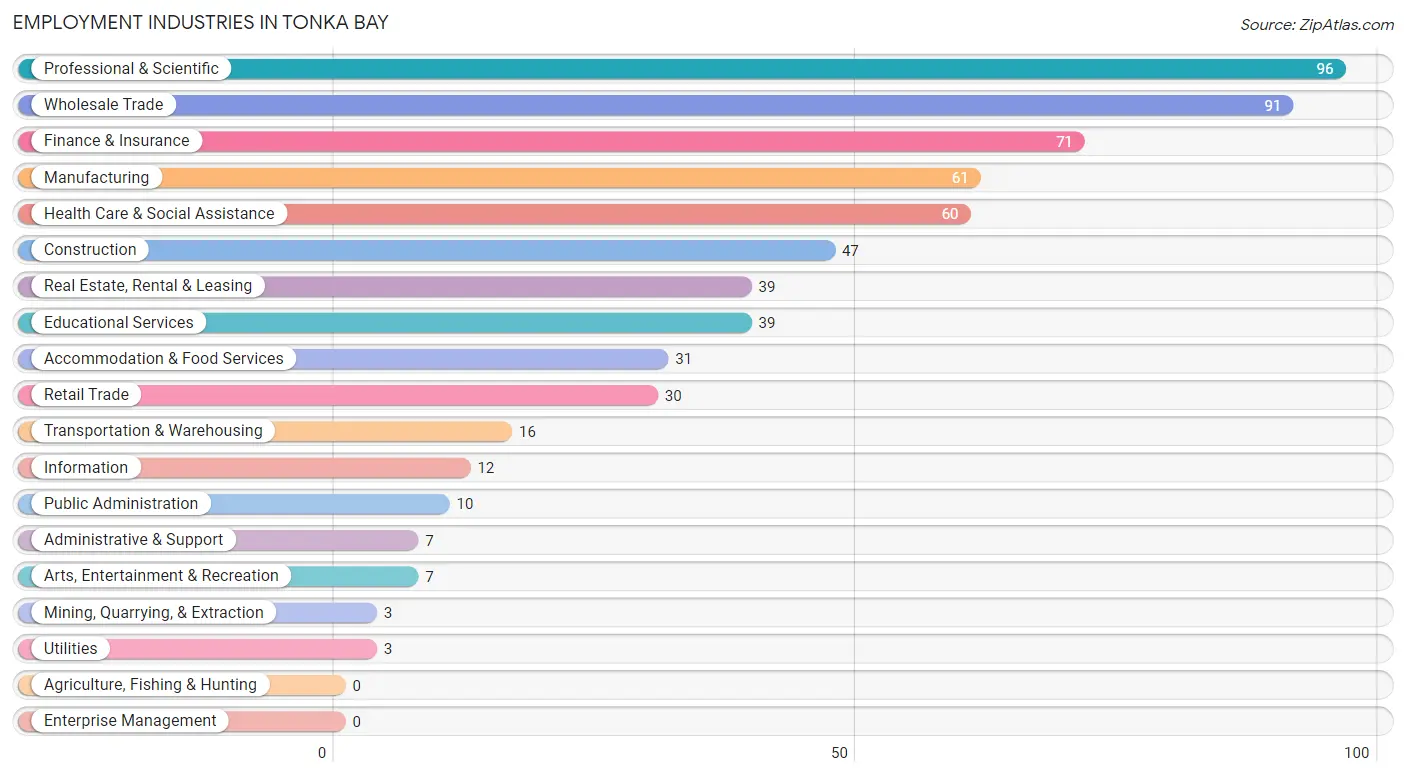
Employment Industries in Tonka Bay
The major employment industries in Tonka Bay include Professional & Scientific (96 | 14.6%), Wholesale Trade (91 | 13.8%), Finance & Insurance (71 | 10.8%), Manufacturing (61 | 9.3%), and Health Care & Social Assistance (60 | 9.1%).
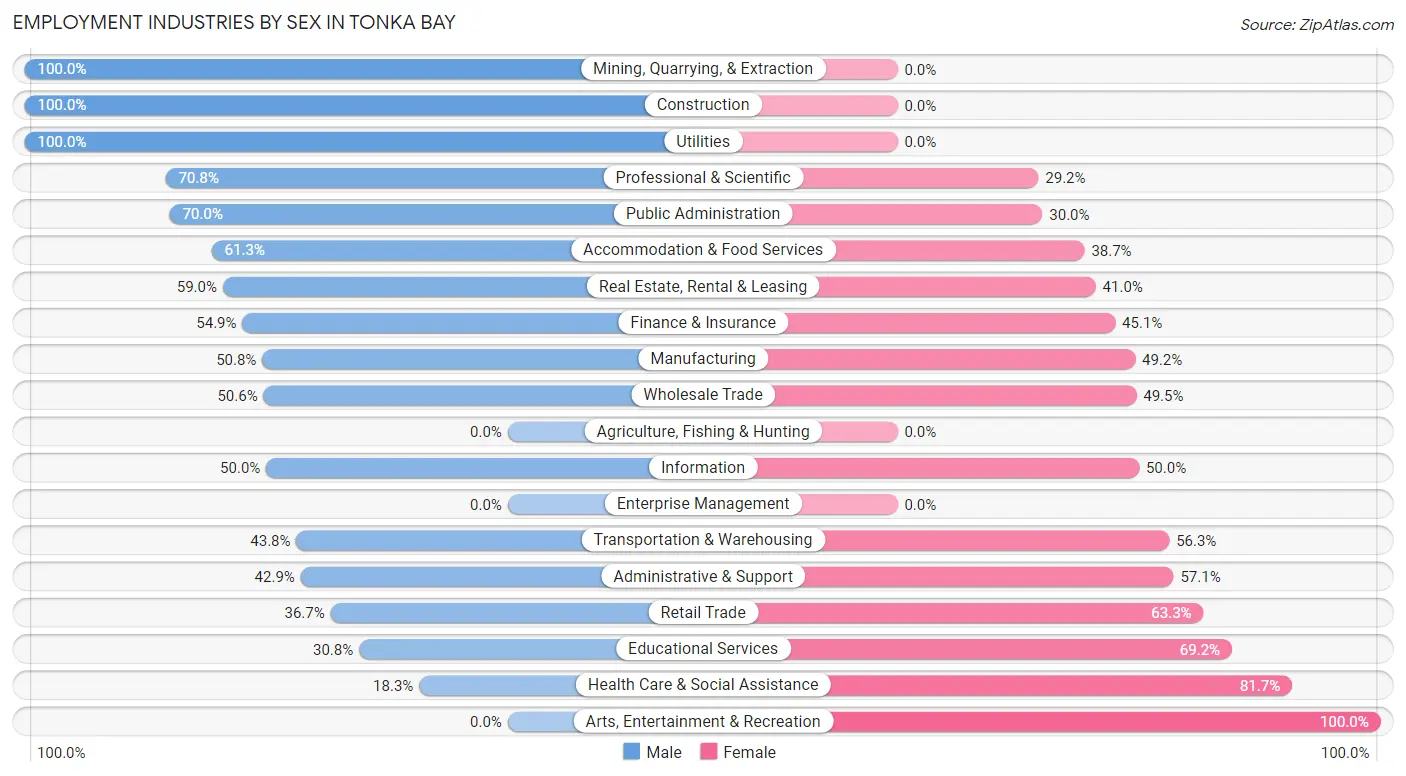
Employment Industries by Sex in Tonka Bay
The Tonka Bay industries that see more men than women are Mining, Quarrying, & Extraction (100.0%), Construction (100.0%), and Utilities (100.0%), whereas the industries that tend to have a higher number of women are Arts, Entertainment & Recreation (100.0%), Health Care & Social Assistance (81.7%), and Educational Services (69.2%).
| Industry | Male | Female |
| Agriculture, Fishing & Hunting | 0 (0.0%) | 0 (0.0%) |
| Mining, Quarrying, & Extraction | 3 (100.0%) | 0 (0.0%) |
| Construction | 47 (100.0%) | 0 (0.0%) |
| Manufacturing | 31 (50.8%) | 30 (49.2%) |
| Wholesale Trade | 46 (50.5%) | 45 (49.4%) |
| Retail Trade | 11 (36.7%) | 19 (63.3%) |
| Transportation & Warehousing | 7 (43.8%) | 9 (56.2%) |
| Utilities | 3 (100.0%) | 0 (0.0%) |
| Information | 6 (50.0%) | 6 (50.0%) |
| Finance & Insurance | 39 (54.9%) | 32 (45.1%) |
| Real Estate, Rental & Leasing | 23 (59.0%) | 16 (41.0%) |
| Professional & Scientific | 68 (70.8%) | 28 (29.2%) |
| Enterprise Management | 0 (0.0%) | 0 (0.0%) |
| Administrative & Support | 3 (42.9%) | 4 (57.1%) |
| Educational Services | 12 (30.8%) | 27 (69.2%) |
| Health Care & Social Assistance | 11 (18.3%) | 49 (81.7%) |
| Arts, Entertainment & Recreation | 0 (0.0%) | 7 (100.0%) |
| Accommodation & Food Services | 19 (61.3%) | 12 (38.7%) |
| Public Administration | 7 (70.0%) | 3 (30.0%) |
| Total | 354 (53.7%) | 305 (46.3%) |
Education in Tonka Bay
School Enrollment in Tonka Bay
The most common levels of schooling among the 269 students in Tonka Bay are high school (89 | 33.1%), middle school (73 | 27.1%), and elementary school (46 | 17.1%).
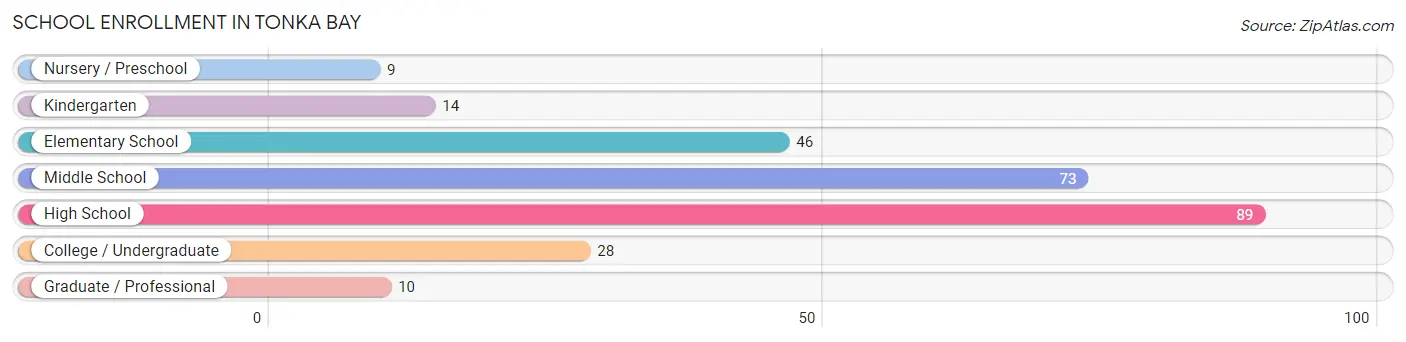
| School Level | # Students | % Students |
| Nursery / Preschool | 9 | 3.4% |
| Kindergarten | 14 | 5.2% |
| Elementary School | 46 | 17.1% |
| Middle School | 73 | 27.1% |
| High School | 89 | 33.1% |
| College / Undergraduate | 28 | 10.4% |
| Graduate / Professional | 10 | 3.7% |
| Total | 269 | 100.0% |
School Enrollment by Age by Funding Source in Tonka Bay
Out of a total of 269 students who are enrolled in schools in Tonka Bay, 19 (7.1%) attend a private institution, while the remaining 250 (92.9%) are enrolled in public schools. The age group of 3 to 4 year olds has the highest likelihood of being enrolled in private schools, with 3 (100.0% in the age bracket) enrolled. Conversely, the age group of 5 to 9 year old has the lowest likelihood of being enrolled in a private school, with 57 (100.0% in the age bracket) attending a public institution.
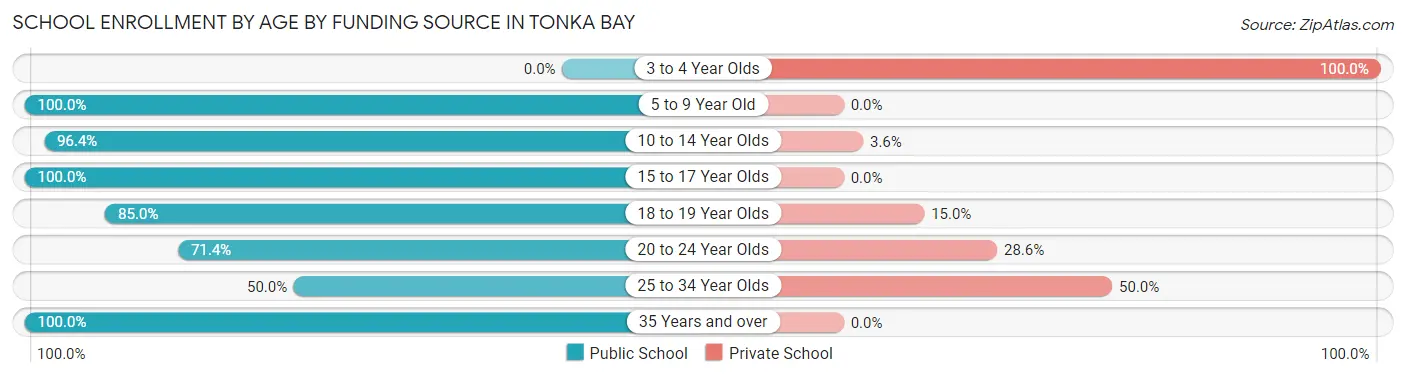
| Age Bracket | Public School | Private School |
| 3 to 4 Year Olds | 0 (0.0%) | 3 (100.0%) |
| 5 to 9 Year Old | 57 (100.0%) | 0 (0.0%) |
| 10 to 14 Year Olds | 80 (96.4%) | 3 (3.6%) |
| 15 to 17 Year Olds | 62 (100.0%) | 0 (0.0%) |
| 18 to 19 Year Olds | 34 (85.0%) | 6 (15.0%) |
| 20 to 24 Year Olds | 5 (71.4%) | 2 (28.6%) |
| 25 to 34 Year Olds | 5 (50.0%) | 5 (50.0%) |
| 35 Years and over | 7 (100.0%) | 0 (0.0%) |
| Total | 250 (92.9%) | 19 (7.1%) |
Educational Attainment by Field of Study in Tonka Bay
Business (176 | 22.7%), communications (92 | 11.9%), education (78 | 10.1%), social sciences (71 | 9.2%), and bio, nature & agricultural (60 | 7.7%) are the most common fields of study among 774 individuals in Tonka Bay who have obtained a bachelor's degree or higher.
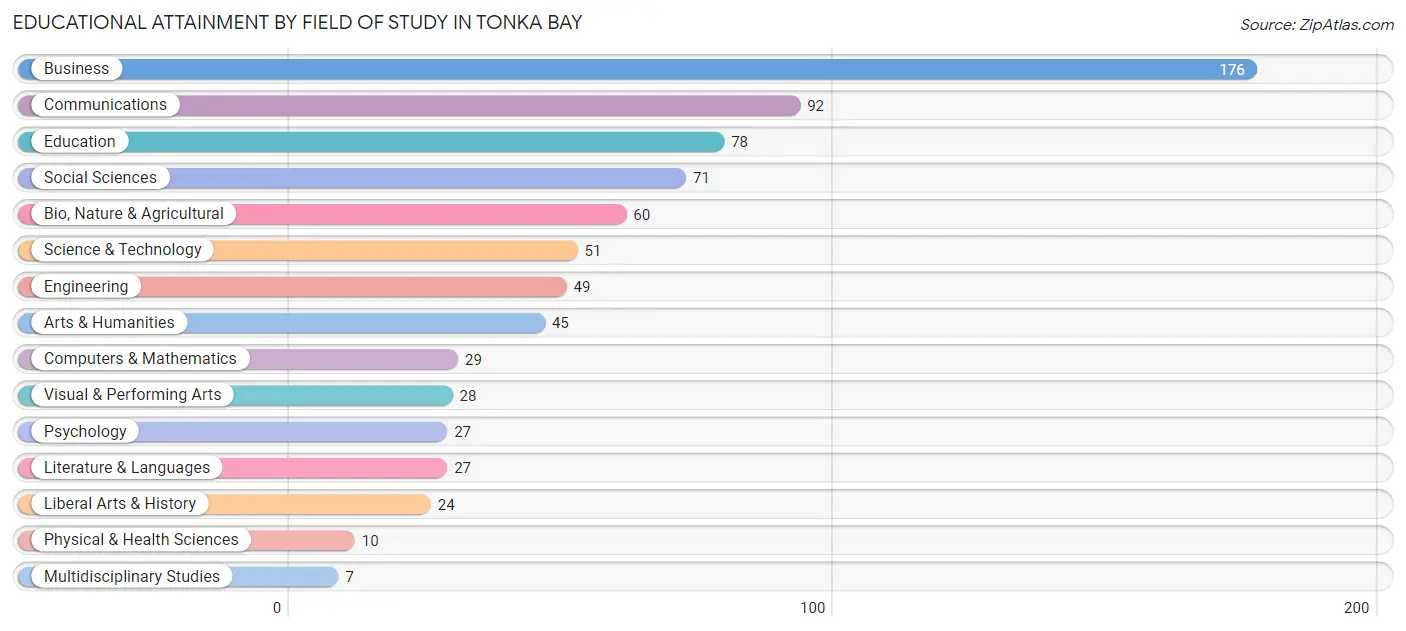
| Field of Study | # Graduates | % Graduates |
| Computers & Mathematics | 29 | 3.7% |
| Bio, Nature & Agricultural | 60 | 7.7% |
| Physical & Health Sciences | 10 | 1.3% |
| Psychology | 27 | 3.5% |
| Social Sciences | 71 | 9.2% |
| Engineering | 49 | 6.3% |
| Multidisciplinary Studies | 7 | 0.9% |
| Science & Technology | 51 | 6.6% |
| Business | 176 | 22.7% |
| Education | 78 | 10.1% |
| Literature & Languages | 27 | 3.5% |
| Liberal Arts & History | 24 | 3.1% |
| Visual & Performing Arts | 28 | 3.6% |
| Communications | 92 | 11.9% |
| Arts & Humanities | 45 | 5.8% |
| Total | 774 | 100.0% |
Transportation & Commute in Tonka Bay
Vehicle Availability by Sex in Tonka Bay
The most prevalent vehicle ownership categories in Tonka Bay are males with 2 vehicles (160, accounting for 46.9%) and females with 2 vehicles (150, making up 52.5%).
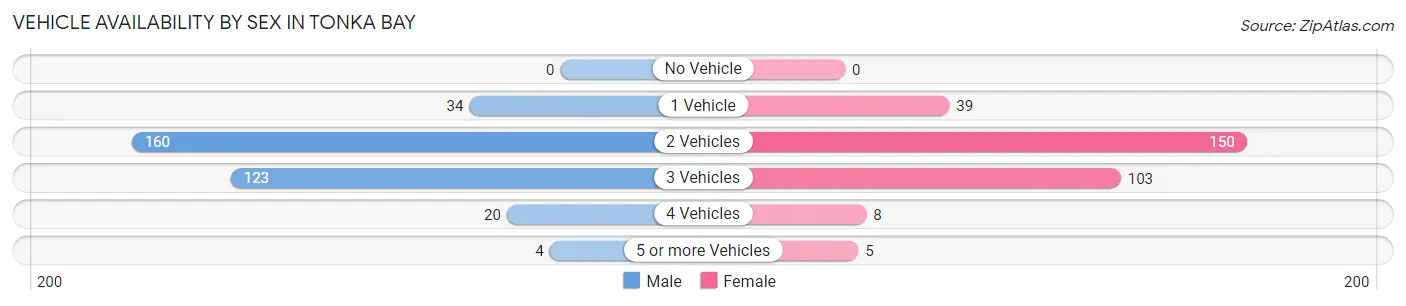
| Vehicles Available | Male | Female |
| No Vehicle | 0 (0.0%) | 0 (0.0%) |
| 1 Vehicle | 34 (10.0%) | 39 (12.8%) |
| 2 Vehicles | 160 (46.9%) | 150 (49.2%) |
| 3 Vehicles | 123 (36.1%) | 103 (33.8%) |
| 4 Vehicles | 20 (5.9%) | 8 (2.6%) |
| 5 or more Vehicles | 4 (1.2%) | 5 (1.6%) |
| Total | 341 (100.0%) | 305 (100.0%) |
Commute Time in Tonka Bay
The most frequently occuring commute durations in Tonka Bay are 20 to 24 minutes (93 commuters, 19.5%), 30 to 34 minutes (86 commuters, 18.0%), and 25 to 29 minutes (66 commuters, 13.8%).
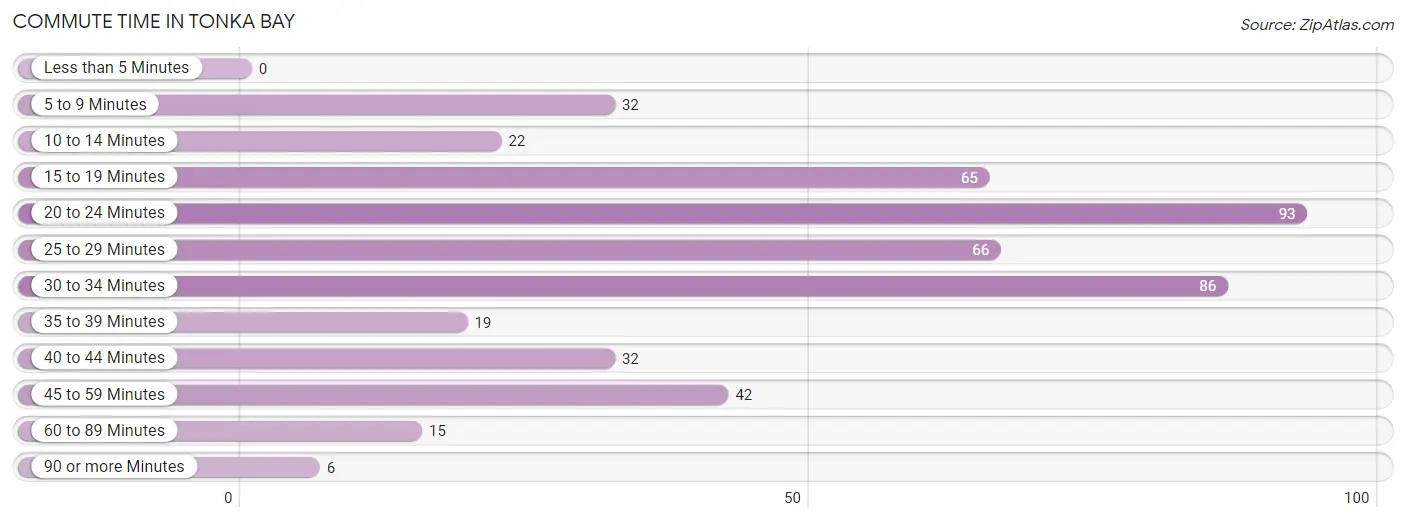
| Commute Time | # Commuters | % Commuters |
| Less than 5 Minutes | 0 | 0.0% |
| 5 to 9 Minutes | 32 | 6.7% |
| 10 to 14 Minutes | 22 | 4.6% |
| 15 to 19 Minutes | 65 | 13.6% |
| 20 to 24 Minutes | 93 | 19.5% |
| 25 to 29 Minutes | 66 | 13.8% |
| 30 to 34 Minutes | 86 | 18.0% |
| 35 to 39 Minutes | 19 | 4.0% |
| 40 to 44 Minutes | 32 | 6.7% |
| 45 to 59 Minutes | 42 | 8.8% |
| 60 to 89 Minutes | 15 | 3.1% |
| 90 or more Minutes | 6 | 1.3% |
Commute Time by Sex in Tonka Bay
The most common commute times in Tonka Bay are 30 to 34 minutes (65 commuters, 26.0%) for males and 15 to 19 minutes (44 commuters, 19.3%) for females.
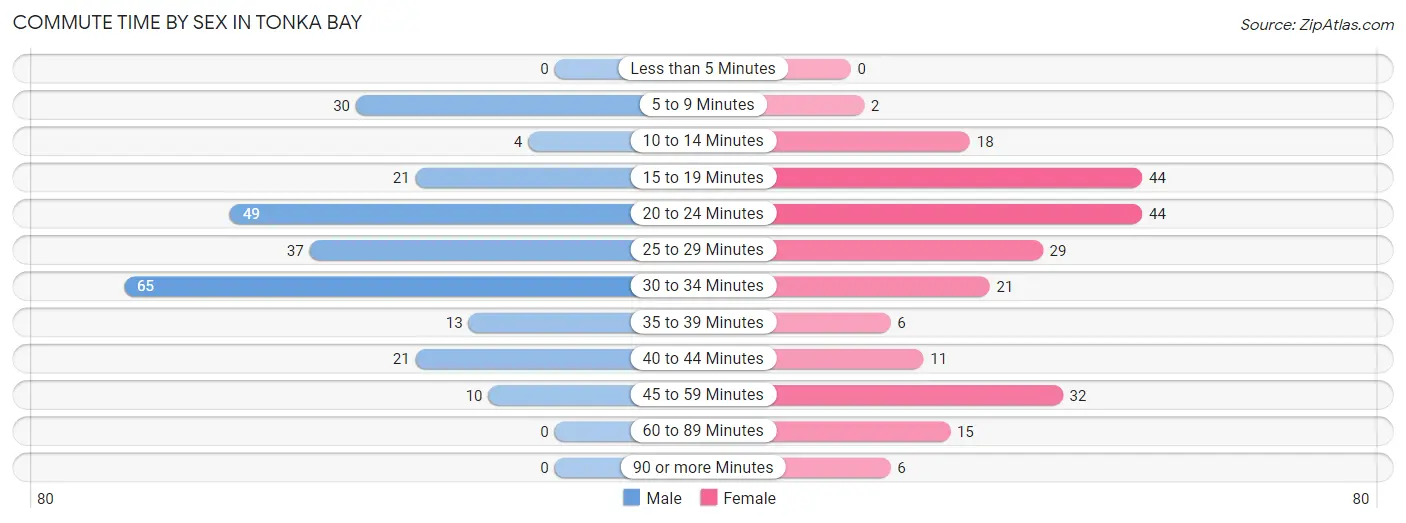
| Commute Time | Male | Female |
| Less than 5 Minutes | 0 (0.0%) | 0 (0.0%) |
| 5 to 9 Minutes | 30 (12.0%) | 2 (0.9%) |
| 10 to 14 Minutes | 4 (1.6%) | 18 (7.9%) |
| 15 to 19 Minutes | 21 (8.4%) | 44 (19.3%) |
| 20 to 24 Minutes | 49 (19.6%) | 44 (19.3%) |
| 25 to 29 Minutes | 37 (14.8%) | 29 (12.7%) |
| 30 to 34 Minutes | 65 (26.0%) | 21 (9.2%) |
| 35 to 39 Minutes | 13 (5.2%) | 6 (2.6%) |
| 40 to 44 Minutes | 21 (8.4%) | 11 (4.8%) |
| 45 to 59 Minutes | 10 (4.0%) | 32 (14.0%) |
| 60 to 89 Minutes | 0 (0.0%) | 15 (6.6%) |
| 90 or more Minutes | 0 (0.0%) | 6 (2.6%) |
Time of Departure to Work by Sex in Tonka Bay
The most frequent times of departure to work in Tonka Bay are 8:00 AM to 8:29 AM (57, 22.8%) for males and 7:00 AM to 7:29 AM (32, 14.0%) for females.
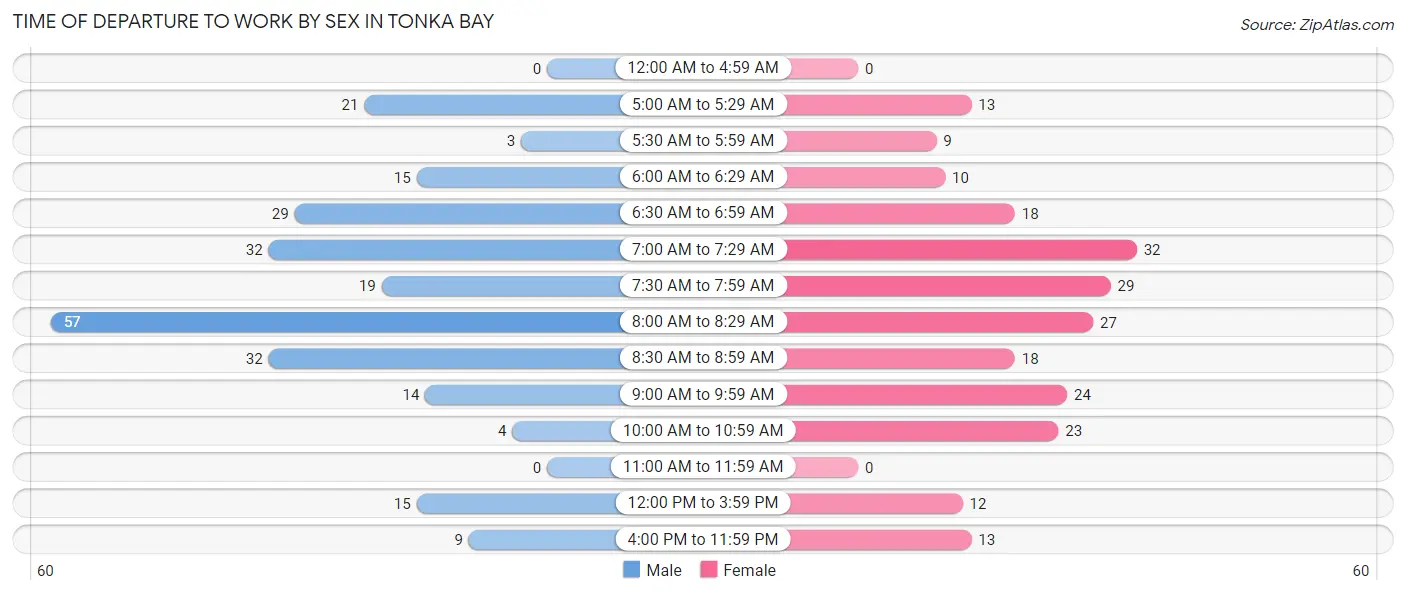
| Time of Departure | Male | Female |
| 12:00 AM to 4:59 AM | 0 (0.0%) | 0 (0.0%) |
| 5:00 AM to 5:29 AM | 21 (8.4%) | 13 (5.7%) |
| 5:30 AM to 5:59 AM | 3 (1.2%) | 9 (4.0%) |
| 6:00 AM to 6:29 AM | 15 (6.0%) | 10 (4.4%) |
| 6:30 AM to 6:59 AM | 29 (11.6%) | 18 (7.9%) |
| 7:00 AM to 7:29 AM | 32 (12.8%) | 32 (14.0%) |
| 7:30 AM to 7:59 AM | 19 (7.6%) | 29 (12.7%) |
| 8:00 AM to 8:29 AM | 57 (22.8%) | 27 (11.8%) |
| 8:30 AM to 8:59 AM | 32 (12.8%) | 18 (7.9%) |
| 9:00 AM to 9:59 AM | 14 (5.6%) | 24 (10.5%) |
| 10:00 AM to 10:59 AM | 4 (1.6%) | 23 (10.1%) |
| 11:00 AM to 11:59 AM | 0 (0.0%) | 0 (0.0%) |
| 12:00 PM to 3:59 PM | 15 (6.0%) | 12 (5.3%) |
| 4:00 PM to 11:59 PM | 9 (3.6%) | 13 (5.7%) |
| Total | 250 (100.0%) | 228 (100.0%) |
Housing Occupancy in Tonka Bay
Occupancy by Ownership in Tonka Bay
Of the total 613 dwellings in Tonka Bay, owner-occupied units account for 531 (86.6%), while renter-occupied units make up 82 (13.4%).
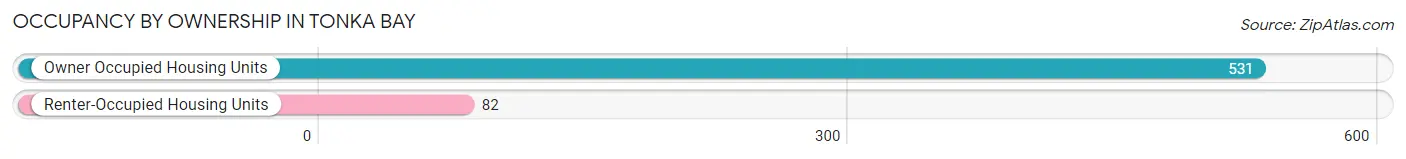
| Occupancy | # Housing Units | % Housing Units |
| Owner Occupied Housing Units | 531 | 86.6% |
| Renter-Occupied Housing Units | 82 | 13.4% |
| Total Occupied Housing Units | 613 | 100.0% |
Occupancy by Household Size in Tonka Bay
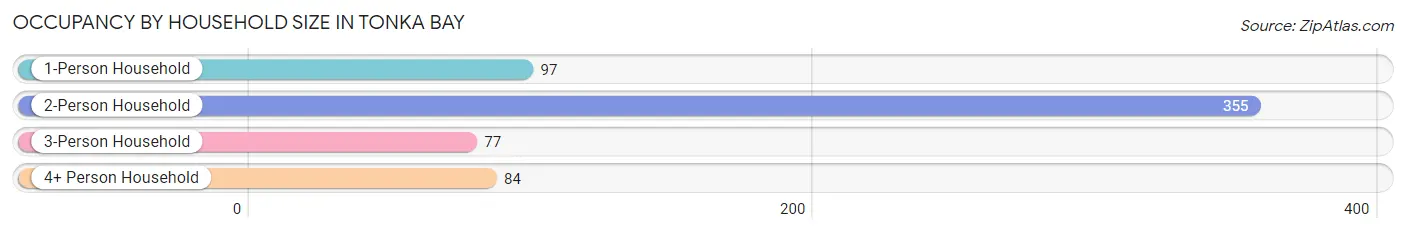
| Household Size | # Housing Units | % Housing Units |
| 1-Person Household | 97 | 15.8% |
| 2-Person Household | 355 | 57.9% |
| 3-Person Household | 77 | 12.6% |
| 4+ Person Household | 84 | 13.7% |
| Total Housing Units | 613 | 100.0% |
Occupancy by Ownership by Household Size in Tonka Bay
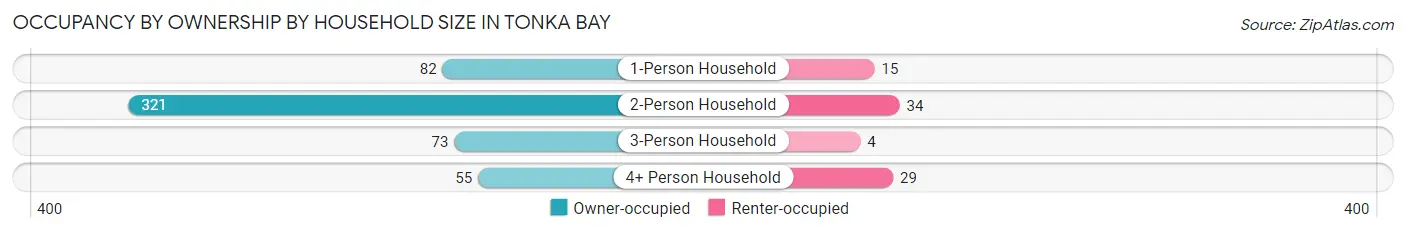
| Household Size | Owner-occupied | Renter-occupied |
| 1-Person Household | 82 (84.5%) | 15 (15.5%) |
| 2-Person Household | 321 (90.4%) | 34 (9.6%) |
| 3-Person Household | 73 (94.8%) | 4 (5.2%) |
| 4+ Person Household | 55 (65.5%) | 29 (34.5%) |
| Total Housing Units | 531 (86.6%) | 82 (13.4%) |
Occupancy by Educational Attainment in Tonka Bay
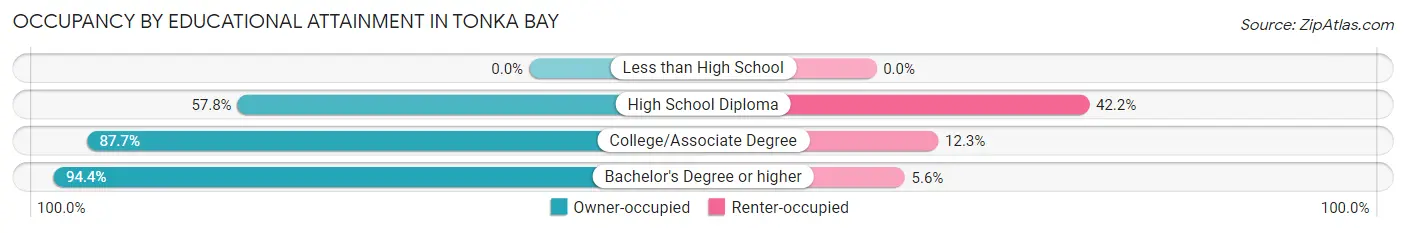
| Household Size | Owner-occupied | Renter-occupied |
| Less than High School | 0 (0.0%) | 0 (0.0%) |
| High School Diploma | 63 (57.8%) | 46 (42.2%) |
| College/Associate Degree | 100 (87.7%) | 14 (12.3%) |
| Bachelor's Degree or higher | 368 (94.4%) | 22 (5.6%) |
Occupancy by Age of Householder in Tonka Bay
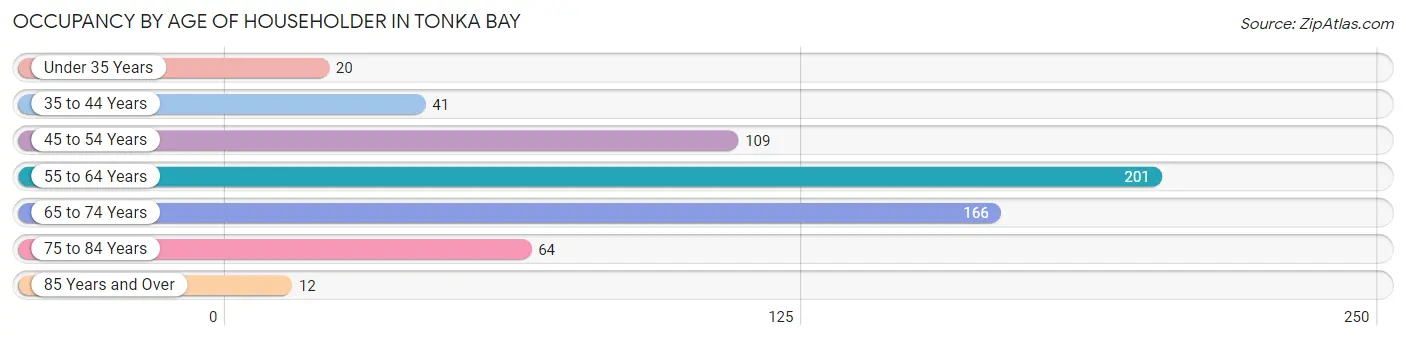
| Age Bracket | # Households | % Households |
| Under 35 Years | 20 | 3.3% |
| 35 to 44 Years | 41 | 6.7% |
| 45 to 54 Years | 109 | 17.8% |
| 55 to 64 Years | 201 | 32.8% |
| 65 to 74 Years | 166 | 27.1% |
| 75 to 84 Years | 64 | 10.4% |
| 85 Years and Over | 12 | 2.0% |
| Total | 613 | 100.0% |
Housing Finances in Tonka Bay
Median Income by Occupancy in Tonka Bay
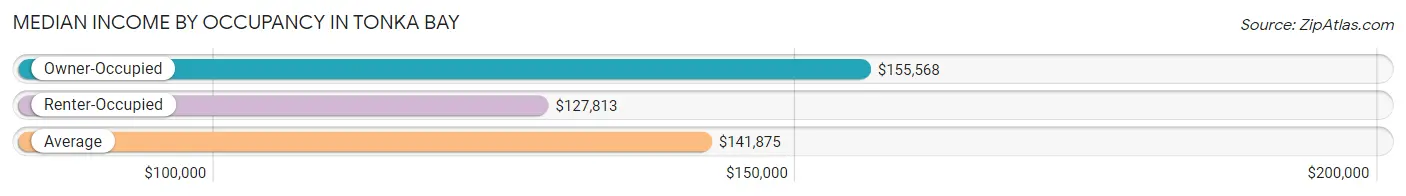
| Occupancy Type | # Households | Median Income |
| Owner-Occupied | 531 (86.6%) | $155,568 |
| Renter-Occupied | 82 (13.4%) | $127,813 |
| Average | 613 (100.0%) | $141,875 |
Occupancy by Householder Income Bracket in Tonka Bay
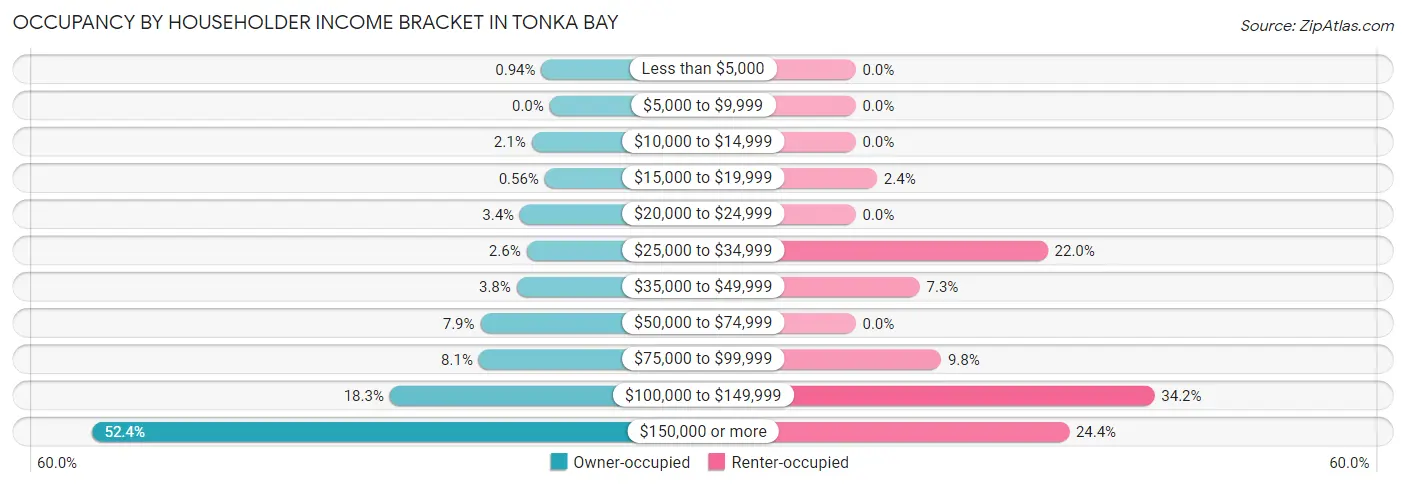
| Income Bracket | Owner-occupied | Renter-occupied |
| Less than $5,000 | 5 (0.9%) | 0 (0.0%) |
| $5,000 to $9,999 | 0 (0.0%) | 0 (0.0%) |
| $10,000 to $14,999 | 11 (2.1%) | 0 (0.0%) |
| $15,000 to $19,999 | 3 (0.6%) | 2 (2.4%) |
| $20,000 to $24,999 | 18 (3.4%) | 0 (0.0%) |
| $25,000 to $34,999 | 14 (2.6%) | 18 (22.0%) |
| $35,000 to $49,999 | 20 (3.8%) | 6 (7.3%) |
| $50,000 to $74,999 | 42 (7.9%) | 0 (0.0%) |
| $75,000 to $99,999 | 43 (8.1%) | 8 (9.8%) |
| $100,000 to $149,999 | 97 (18.3%) | 28 (34.2%) |
| $150,000 or more | 278 (52.3%) | 20 (24.4%) |
| Total | 531 (100.0%) | 82 (100.0%) |
Monthly Housing Cost Tiers in Tonka Bay
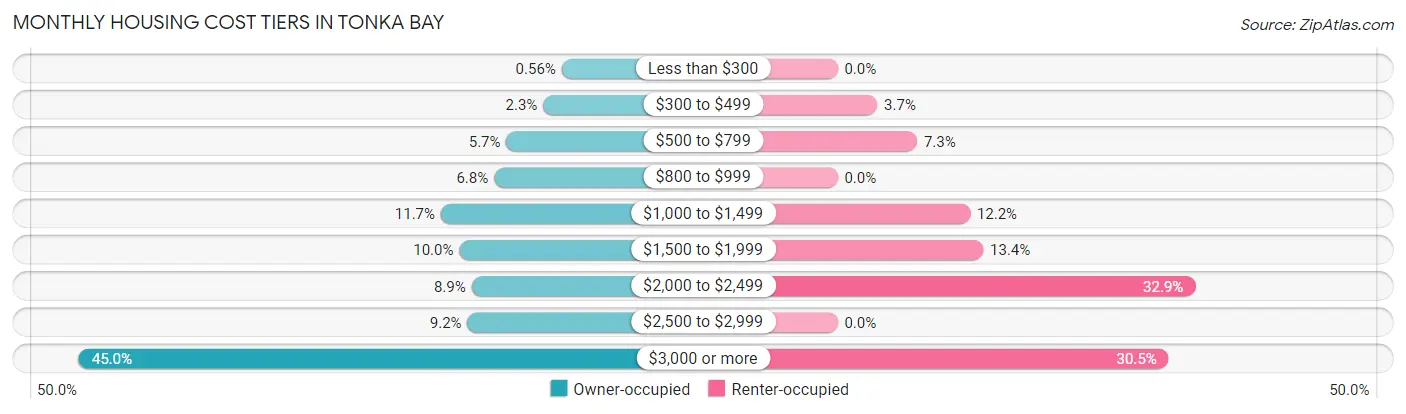
| Monthly Cost | Owner-occupied | Renter-occupied |
| Less than $300 | 3 (0.6%) | 0 (0.0%) |
| $300 to $499 | 12 (2.3%) | 3 (3.7%) |
| $500 to $799 | 30 (5.7%) | 6 (7.3%) |
| $800 to $999 | 36 (6.8%) | 0 (0.0%) |
| $1,000 to $1,499 | 62 (11.7%) | 10 (12.2%) |
| $1,500 to $1,999 | 53 (10.0%) | 11 (13.4%) |
| $2,000 to $2,499 | 47 (8.8%) | 27 (32.9%) |
| $2,500 to $2,999 | 49 (9.2%) | 0 (0.0%) |
| $3,000 or more | 239 (45.0%) | 25 (30.5%) |
| Total | 531 (100.0%) | 82 (100.0%) |
Physical Housing Characteristics in Tonka Bay
Housing Structures in Tonka Bay
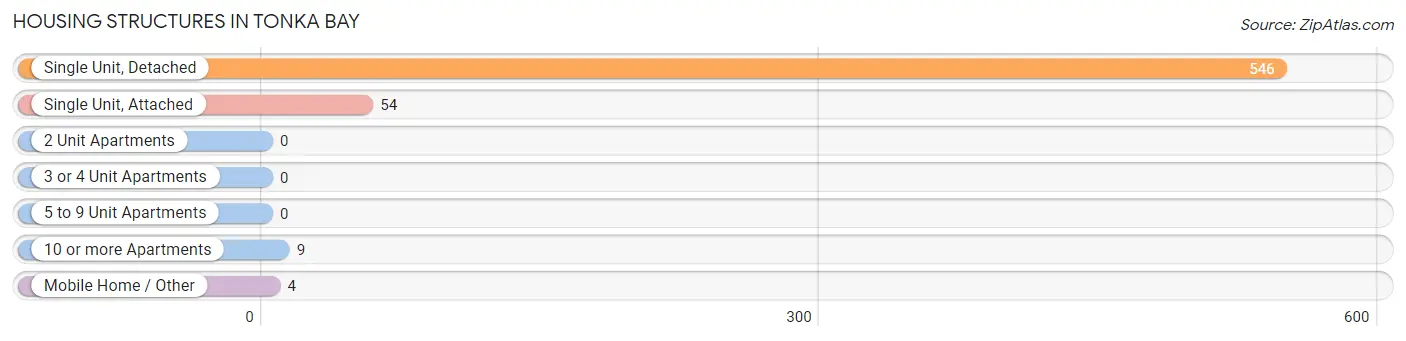
| Structure Type | # Housing Units | % Housing Units |
| Single Unit, Detached | 546 | 89.1% |
| Single Unit, Attached | 54 | 8.8% |
| 2 Unit Apartments | 0 | 0.0% |
| 3 or 4 Unit Apartments | 0 | 0.0% |
| 5 to 9 Unit Apartments | 0 | 0.0% |
| 10 or more Apartments | 9 | 1.5% |
| Mobile Home / Other | 4 | 0.6% |
| Total | 613 | 100.0% |
Housing Structures by Occupancy in Tonka Bay
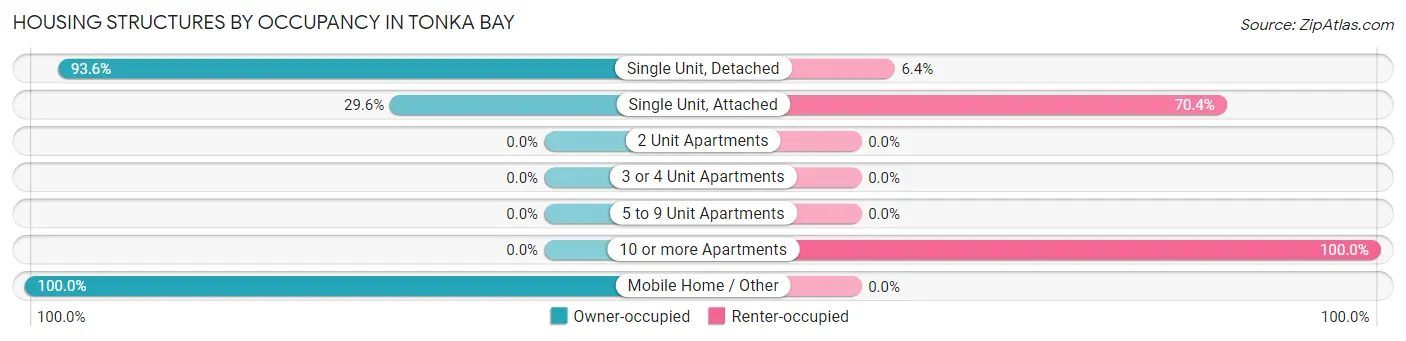
| Structure Type | Owner-occupied | Renter-occupied |
| Single Unit, Detached | 511 (93.6%) | 35 (6.4%) |
| Single Unit, Attached | 16 (29.6%) | 38 (70.4%) |
| 2 Unit Apartments | 0 (0.0%) | 0 (0.0%) |
| 3 or 4 Unit Apartments | 0 (0.0%) | 0 (0.0%) |
| 5 to 9 Unit Apartments | 0 (0.0%) | 0 (0.0%) |
| 10 or more Apartments | 0 (0.0%) | 9 (100.0%) |
| Mobile Home / Other | 4 (100.0%) | 0 (0.0%) |
| Total | 531 (86.6%) | 82 (13.4%) |
Housing Structures by Number of Rooms in Tonka Bay
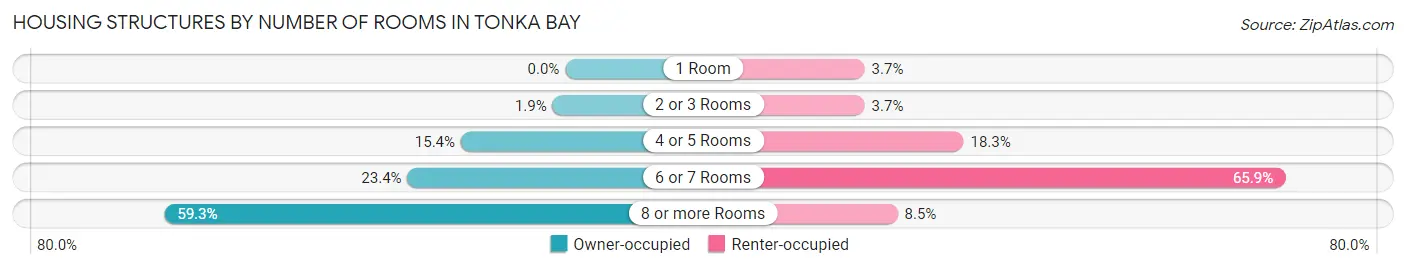
| Number of Rooms | Owner-occupied | Renter-occupied |
| 1 Room | 0 (0.0%) | 3 (3.7%) |
| 2 or 3 Rooms | 10 (1.9%) | 3 (3.7%) |
| 4 or 5 Rooms | 82 (15.4%) | 15 (18.3%) |
| 6 or 7 Rooms | 124 (23.4%) | 54 (65.8%) |
| 8 or more Rooms | 315 (59.3%) | 7 (8.5%) |
| Total | 531 (100.0%) | 82 (100.0%) |
Housing Structure by Heating Type in Tonka Bay
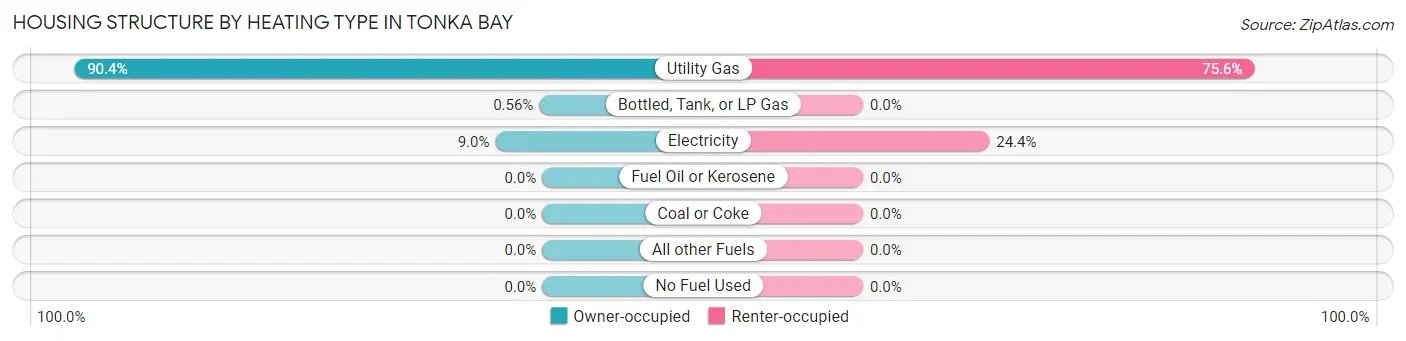
| Heating Type | Owner-occupied | Renter-occupied |
| Utility Gas | 480 (90.4%) | 62 (75.6%) |
| Bottled, Tank, or LP Gas | 3 (0.6%) | 0 (0.0%) |
| Electricity | 48 (9.0%) | 20 (24.4%) |
| Fuel Oil or Kerosene | 0 (0.0%) | 0 (0.0%) |
| Coal or Coke | 0 (0.0%) | 0 (0.0%) |
| All other Fuels | 0 (0.0%) | 0 (0.0%) |
| No Fuel Used | 0 (0.0%) | 0 (0.0%) |
| Total | 531 (100.0%) | 82 (100.0%) |
Household Vehicle Usage in Tonka Bay
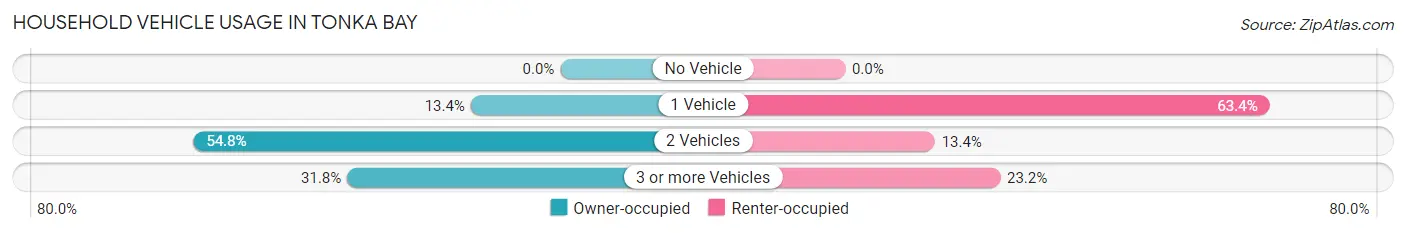
| Vehicles per Household | Owner-occupied | Renter-occupied |
| No Vehicle | 0 (0.0%) | 0 (0.0%) |
| 1 Vehicle | 71 (13.4%) | 52 (63.4%) |
| 2 Vehicles | 291 (54.8%) | 11 (13.4%) |
| 3 or more Vehicles | 169 (31.8%) | 19 (23.2%) |
| Total | 531 (100.0%) | 82 (100.0%) |
Real Estate & Mortgages in Tonka Bay
Real Estate and Mortgage Overview in Tonka Bay
| Characteristic | Without Mortgage | With Mortgage |
| Housing Units | 194 | 337 |
| Median Property Value | $743,900 | $829,500 |
| Median Household Income | $160,000 | $169 |
| Monthly Housing Costs | $1,350 | $202 |
| Real Estate Taxes | $9,716 | $3 |
Property Value by Mortgage Status in Tonka Bay
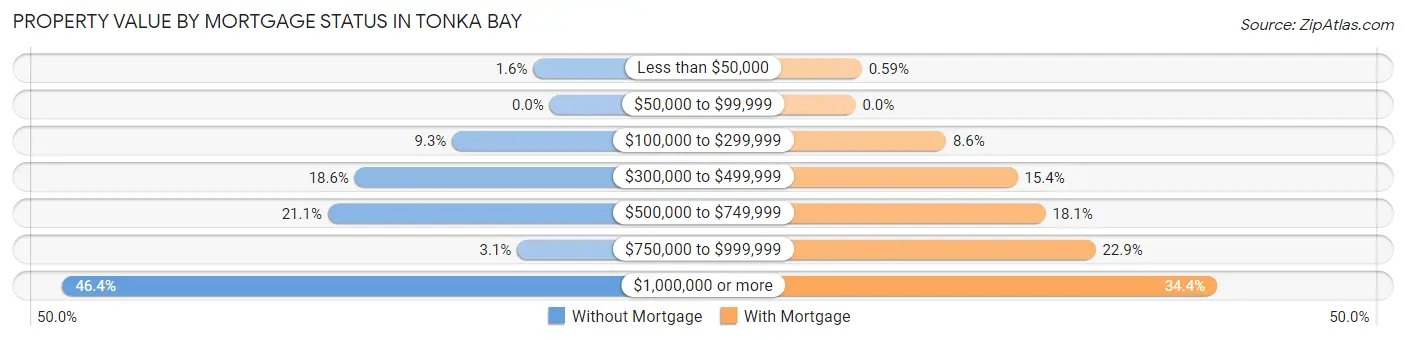
| Property Value | Without Mortgage | With Mortgage |
| Less than $50,000 | 3 (1.5%) | 2 (0.6%) |
| $50,000 to $99,999 | 0 (0.0%) | 0 (0.0%) |
| $100,000 to $299,999 | 18 (9.3%) | 29 (8.6%) |
| $300,000 to $499,999 | 36 (18.6%) | 52 (15.4%) |
| $500,000 to $749,999 | 41 (21.1%) | 61 (18.1%) |
| $750,000 to $999,999 | 6 (3.1%) | 77 (22.9%) |
| $1,000,000 or more | 90 (46.4%) | 116 (34.4%) |
| Total | 194 (100.0%) | 337 (100.0%) |
Household Income by Mortgage Status in Tonka Bay
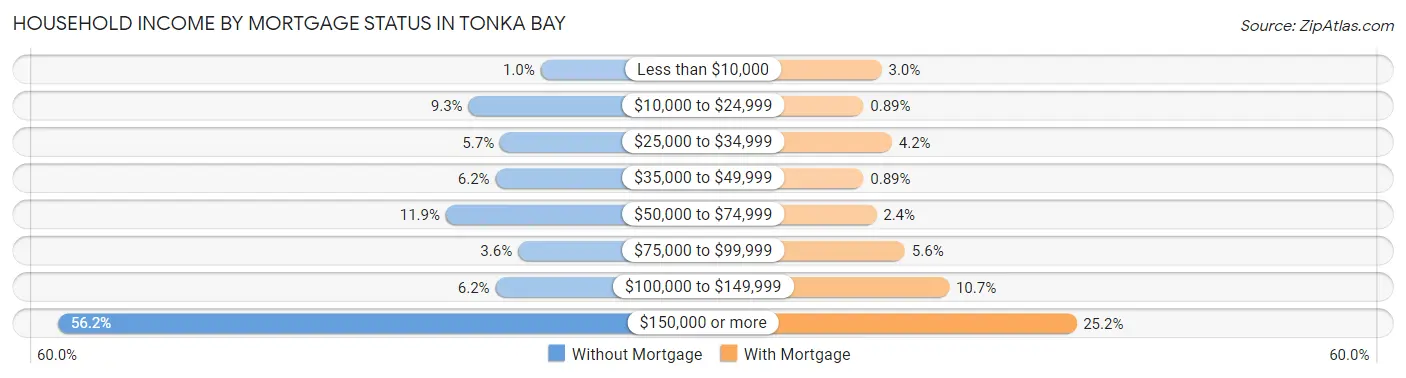
| Household Income | Without Mortgage | With Mortgage |
| Less than $10,000 | 2 (1.0%) | 10 (3.0%) |
| $10,000 to $24,999 | 18 (9.3%) | 3 (0.9%) |
| $25,000 to $34,999 | 11 (5.7%) | 14 (4.2%) |
| $35,000 to $49,999 | 12 (6.2%) | 3 (0.9%) |
| $50,000 to $74,999 | 23 (11.9%) | 8 (2.4%) |
| $75,000 to $99,999 | 7 (3.6%) | 19 (5.6%) |
| $100,000 to $149,999 | 12 (6.2%) | 36 (10.7%) |
| $150,000 or more | 109 (56.2%) | 85 (25.2%) |
| Total | 194 (100.0%) | 337 (100.0%) |
Property Value to Household Income Ratio in Tonka Bay
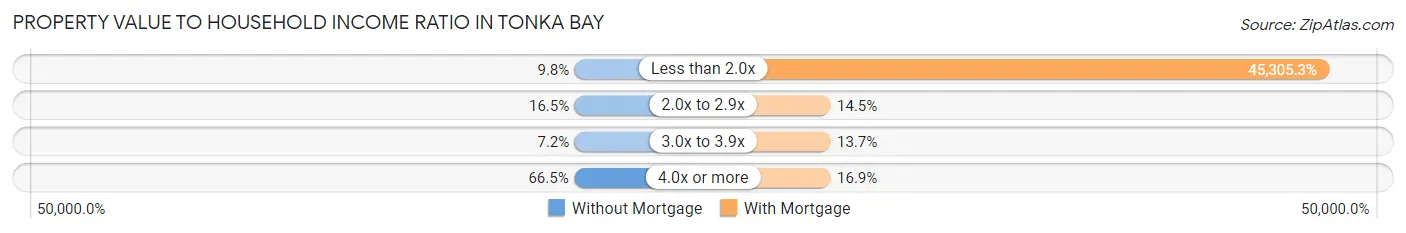
| Value-to-Income Ratio | Without Mortgage | With Mortgage |
| Less than 2.0x | 19 (9.8%) | 152,679 (45,305.3%) |
| 2.0x to 2.9x | 32 (16.5%) | 49 (14.5%) |
| 3.0x to 3.9x | 14 (7.2%) | 46 (13.7%) |
| 4.0x or more | 129 (66.5%) | 57 (16.9%) |
| Total | 194 (100.0%) | 337 (100.0%) |
Real Estate Taxes by Mortgage Status in Tonka Bay
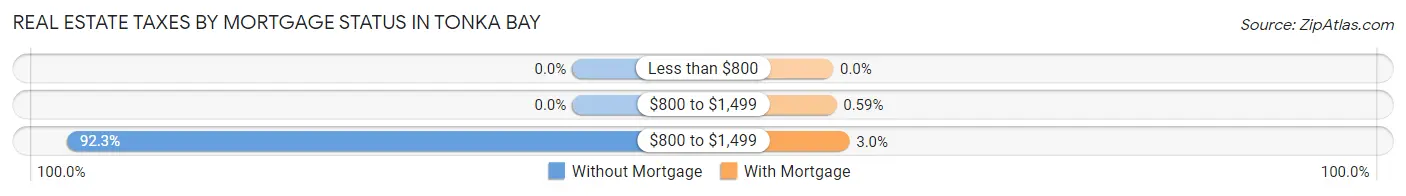
| Property Taxes | Without Mortgage | With Mortgage |
| Less than $800 | 0 (0.0%) | 0 (0.0%) |
| $800 to $1,499 | 0 (0.0%) | 2 (0.6%) |
| $800 to $1,499 | 179 (92.3%) | 10 (3.0%) |
| Total | 194 (100.0%) | 337 (100.0%) |
Health & Disability in Tonka Bay
Health Insurance Coverage by Age in Tonka Bay
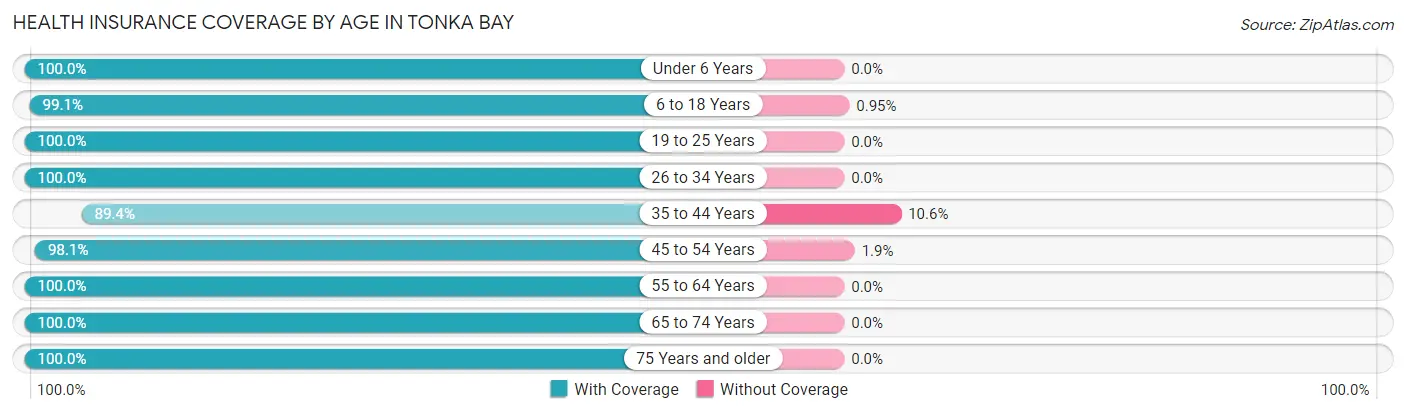
| Age Bracket | With Coverage | Without Coverage |
| Under 6 Years | 41 (100.0%) | 0 (0.0%) |
| 6 to 18 Years | 208 (99.1%) | 2 (0.9%) |
| 19 to 25 Years | 45 (100.0%) | 0 (0.0%) |
| 26 to 34 Years | 45 (100.0%) | 0 (0.0%) |
| 35 to 44 Years | 101 (89.4%) | 12 (10.6%) |
| 45 to 54 Years | 202 (98.1%) | 4 (1.9%) |
| 55 to 64 Years | 365 (100.0%) | 0 (0.0%) |
| 65 to 74 Years | 307 (100.0%) | 0 (0.0%) |
| 75 Years and older | 130 (100.0%) | 0 (0.0%) |
| Total | 1,444 (98.8%) | 18 (1.2%) |
Health Insurance Coverage by Citizenship Status in Tonka Bay
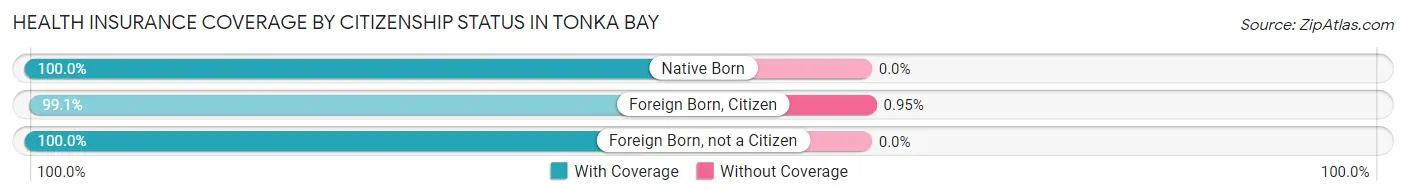
| Citizenship Status | With Coverage | Without Coverage |
| Native Born | 41 (100.0%) | 0 (0.0%) |
| Foreign Born, Citizen | 208 (99.1%) | 2 (0.9%) |
| Foreign Born, not a Citizen | 45 (100.0%) | 0 (0.0%) |
Health Insurance Coverage by Household Income in Tonka Bay
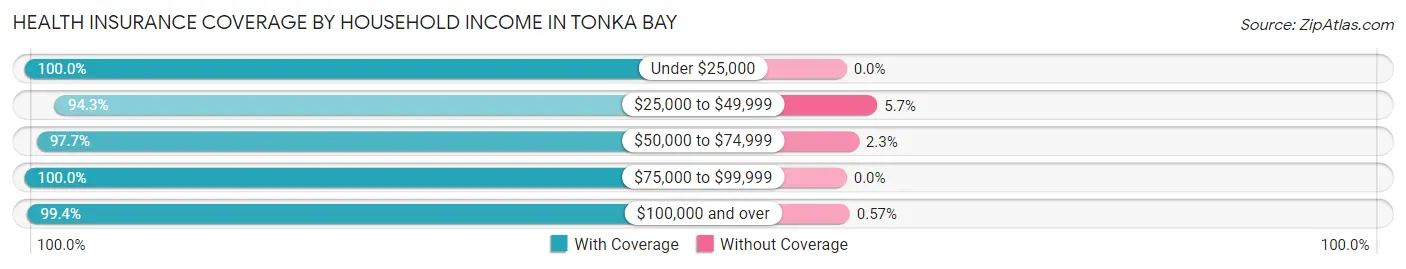
| Household Income | With Coverage | Without Coverage |
| Under $25,000 | 69 (100.0%) | 0 (0.0%) |
| $25,000 to $49,999 | 165 (94.3%) | 10 (5.7%) |
| $50,000 to $74,999 | 86 (97.7%) | 2 (2.3%) |
| $75,000 to $99,999 | 81 (100.0%) | 0 (0.0%) |
| $100,000 and over | 1,043 (99.4%) | 6 (0.6%) |
Public vs Private Health Insurance Coverage by Age in Tonka Bay
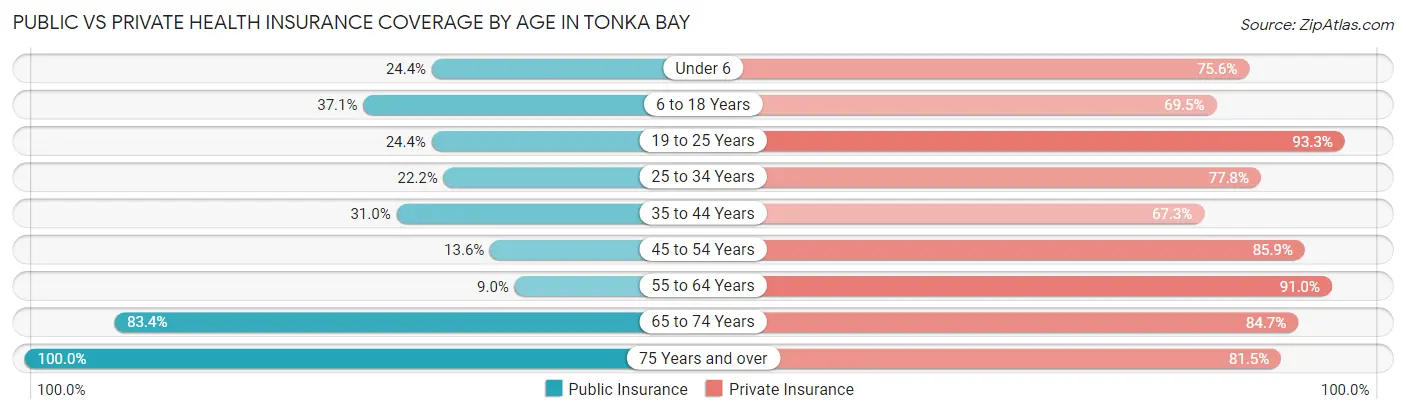
| Age Bracket | Public Insurance | Private Insurance |
| Under 6 | 10 (24.4%) | 31 (75.6%) |
| 6 to 18 Years | 78 (37.1%) | 146 (69.5%) |
| 19 to 25 Years | 11 (24.4%) | 42 (93.3%) |
| 25 to 34 Years | 10 (22.2%) | 35 (77.8%) |
| 35 to 44 Years | 35 (31.0%) | 76 (67.3%) |
| 45 to 54 Years | 28 (13.6%) | 177 (85.9%) |
| 55 to 64 Years | 33 (9.0%) | 332 (91.0%) |
| 65 to 74 Years | 256 (83.4%) | 260 (84.7%) |
| 75 Years and over | 130 (100.0%) | 106 (81.5%) |
| Total | 591 (40.4%) | 1,205 (82.4%) |
Disability Status by Sex by Age in Tonka Bay
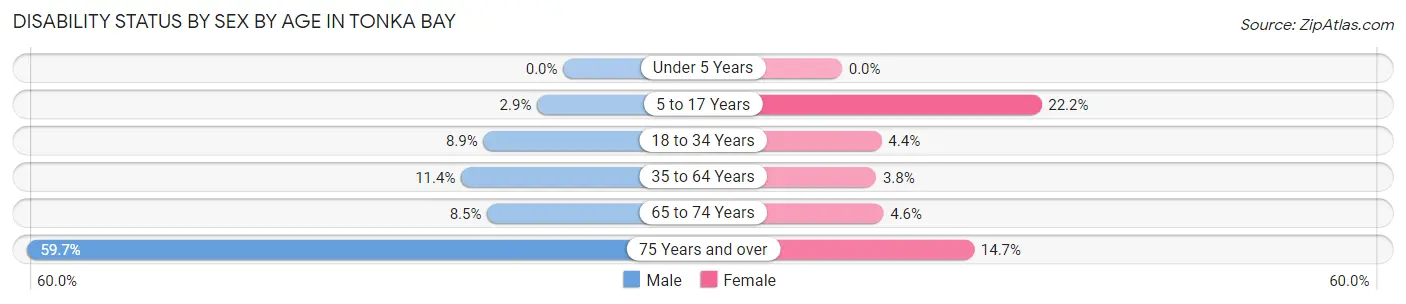
| Age Bracket | Male | Female |
| Under 5 Years | 0 (0.0%) | 0 (0.0%) |
| 5 to 17 Years | 3 (2.9%) | 22 (22.2%) |
| 18 to 34 Years | 4 (8.9%) | 3 (4.4%) |
| 35 to 64 Years | 39 (11.4%) | 13 (3.8%) |
| 65 to 74 Years | 15 (8.5%) | 6 (4.6%) |
| 75 Years and over | 37 (59.7%) | 10 (14.7%) |
Disability Class by Sex by Age in Tonka Bay
Disability Class: Hearing Difficulty
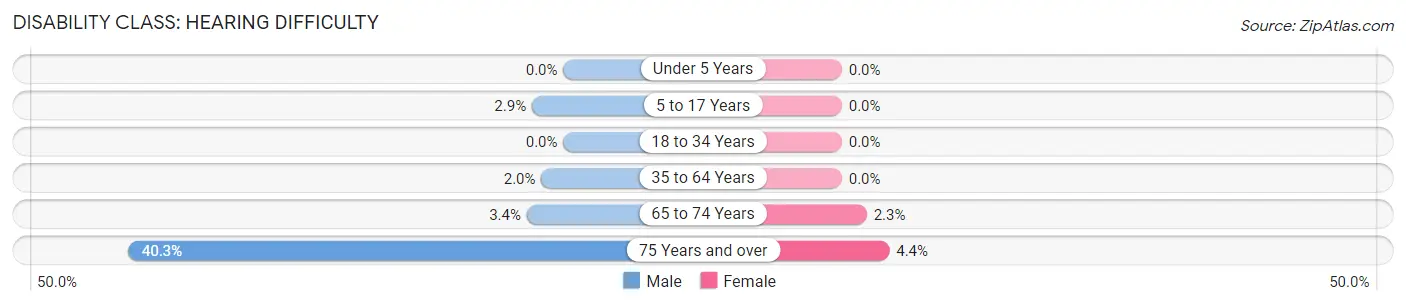
| Age Bracket | Male | Female |
| Under 5 Years | 0 (0.0%) | 0 (0.0%) |
| 5 to 17 Years | 3 (2.9%) | 0 (0.0%) |
| 18 to 34 Years | 0 (0.0%) | 0 (0.0%) |
| 35 to 64 Years | 7 (2.0%) | 0 (0.0%) |
| 65 to 74 Years | 6 (3.4%) | 3 (2.3%) |
| 75 Years and over | 25 (40.3%) | 3 (4.4%) |
Disability Class: Vision Difficulty
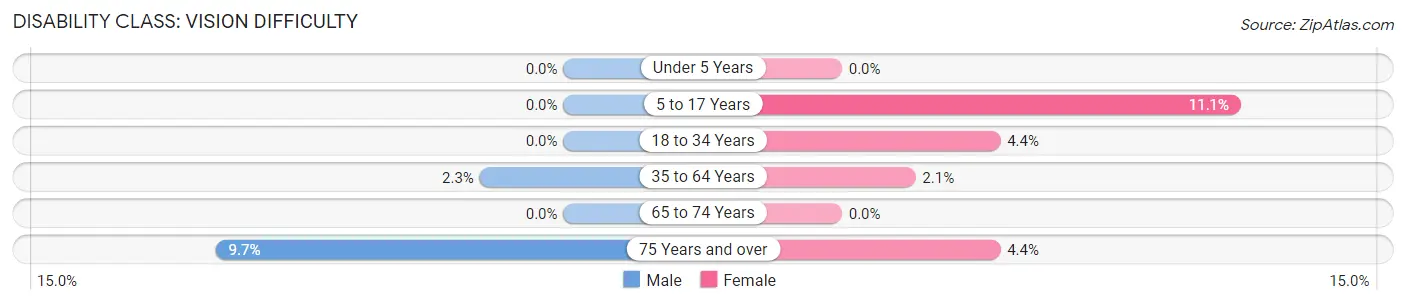
| Age Bracket | Male | Female |
| Under 5 Years | 0 (0.0%) | 0 (0.0%) |
| 5 to 17 Years | 0 (0.0%) | 11 (11.1%) |
| 18 to 34 Years | 0 (0.0%) | 3 (4.4%) |
| 35 to 64 Years | 8 (2.3%) | 7 (2.1%) |
| 65 to 74 Years | 0 (0.0%) | 0 (0.0%) |
| 75 Years and over | 6 (9.7%) | 3 (4.4%) |
Disability Class: Cognitive Difficulty
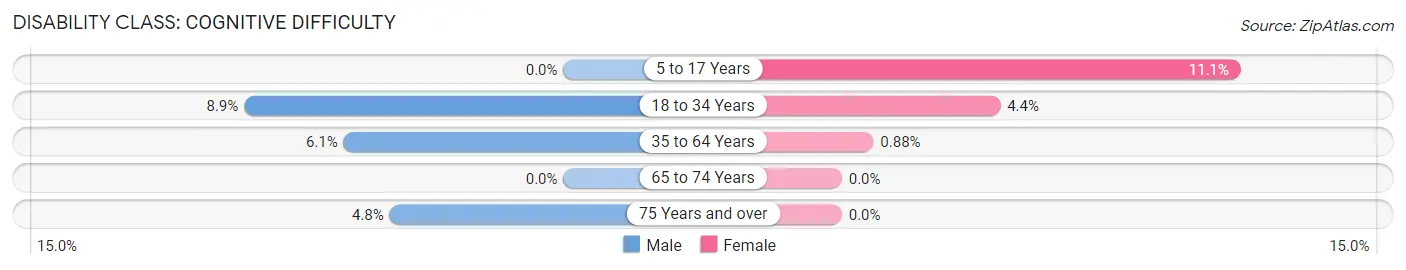
| Age Bracket | Male | Female |
| 5 to 17 Years | 0 (0.0%) | 11 (11.1%) |
| 18 to 34 Years | 4 (8.9%) | 3 (4.4%) |
| 35 to 64 Years | 21 (6.1%) | 3 (0.9%) |
| 65 to 74 Years | 0 (0.0%) | 0 (0.0%) |
| 75 Years and over | 3 (4.8%) | 0 (0.0%) |
Disability Class: Ambulatory Difficulty
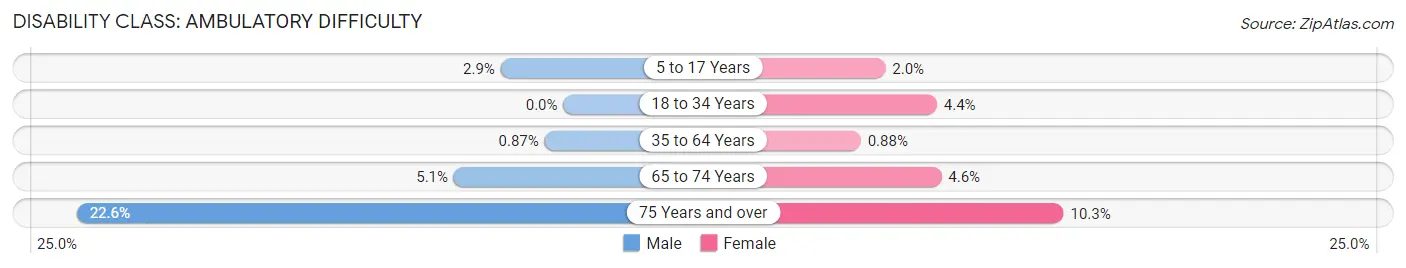
| Age Bracket | Male | Female |
| 5 to 17 Years | 3 (2.9%) | 2 (2.0%) |
| 18 to 34 Years | 0 (0.0%) | 3 (4.4%) |
| 35 to 64 Years | 3 (0.9%) | 3 (0.9%) |
| 65 to 74 Years | 9 (5.1%) | 6 (4.6%) |
| 75 Years and over | 14 (22.6%) | 7 (10.3%) |
Disability Class: Self-Care Difficulty
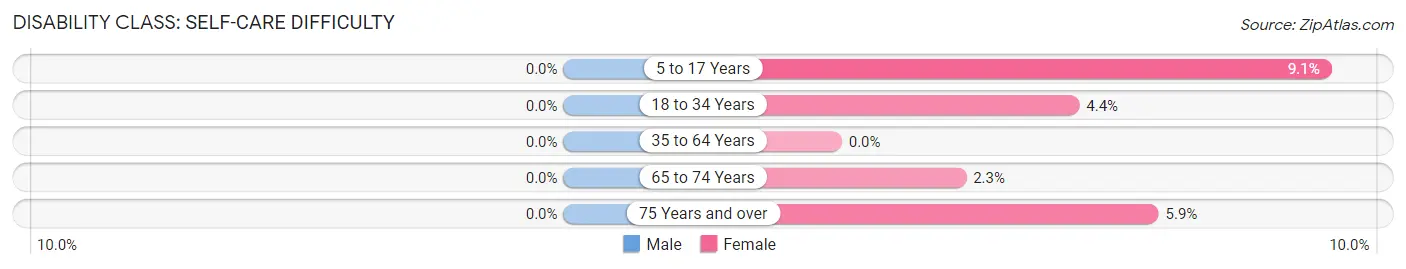
| Age Bracket | Male | Female |
| 5 to 17 Years | 0 (0.0%) | 9 (9.1%) |
| 18 to 34 Years | 0 (0.0%) | 3 (4.4%) |
| 35 to 64 Years | 0 (0.0%) | 0 (0.0%) |
| 65 to 74 Years | 0 (0.0%) | 3 (2.3%) |
| 75 Years and over | 0 (0.0%) | 4 (5.9%) |
Technology Access in Tonka Bay
Computing Device Access in Tonka Bay
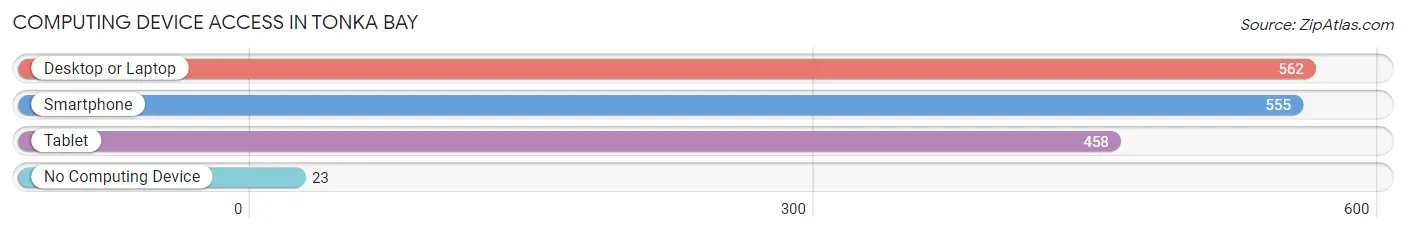
| Device Type | # Households | % Households |
| Desktop or Laptop | 562 | 91.7% |
| Smartphone | 555 | 90.5% |
| Tablet | 458 | 74.7% |
| No Computing Device | 23 | 3.7% |
| Total | 613 | 100.0% |
Internet Access in Tonka Bay
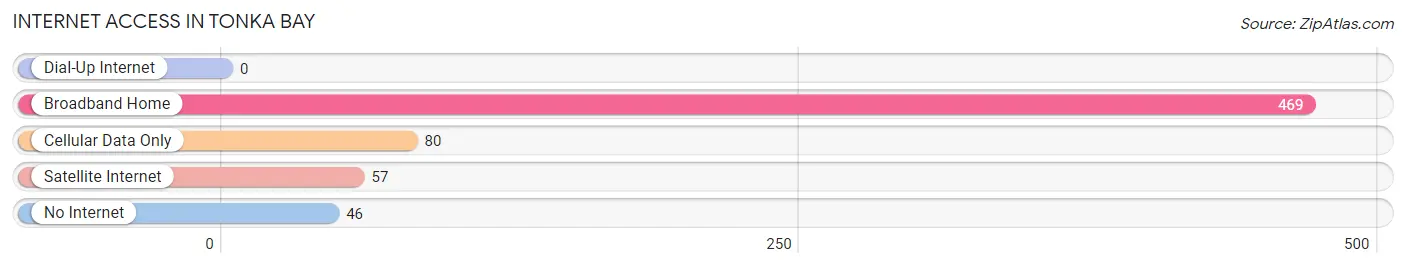
| Internet Type | # Households | % Households |
| Dial-Up Internet | 0 | 0.0% |
| Broadband Home | 469 | 76.5% |
| Cellular Data Only | 80 | 13.1% |
| Satellite Internet | 57 | 9.3% |
| No Internet | 46 | 7.5% |
| Total | 613 | 100.0% |
Tonka Bay Summary
Tonka Bay is a small city located in Hennepin County, Minnesota, United States. It is situated on the western shore of Lake Minnetonka, about 20 miles west of Minneapolis. The city has a population of 2,521 as of the 2010 census.
History
The area that is now Tonka Bay was first settled in the mid-1800s by a group of Swedish immigrants. The area was originally known as “Tonka”, which is derived from the Dakota word for “big water”. The area was later renamed “Tonka Bay” in 1887 when the post office was established.
The city was incorporated in 1949 and has since grown to become a popular destination for tourists and locals alike. The city is home to a number of parks, beaches, and marinas, as well as a variety of restaurants and shops.
Geography
Tonka Bay is located at the western end of Lake Minnetonka, about 20 miles west of Minneapolis. The city has a total area of 1.2 square miles, all of which is land. The city is bordered by the cities of Minnetonka, Excelsior, and Shorewood.
The city is situated on a peninsula that juts out into Lake Minnetonka. The lake is the largest lake in the Twin Cities metropolitan area and is a popular destination for fishing, boating, and other recreational activities.
Economy
Tonka Bay’s economy is largely based on tourism and recreation. The city is home to a number of parks, beaches, and marinas, as well as a variety of restaurants and shops. The city is also home to a number of corporate offices, including those of the Tonka Bay Marina and the Tonka Bay Yacht Club.
Demographics
As of the 2010 census, the city had a population of 2,521. The racial makeup of the city was 94.3% White, 1.2% African American, 0.3% Native American, 1.2% Asian, 0.1% Pacific Islander, 1.2% from other races, and 1.9% from two or more races. Hispanic or Latino of any race were 3.2% of the population.
The median income for a household in the city was $76,944, and the median income for a family was $90,944. The per capita income for the city was $37,944. About 4.2% of families and 5.2% of the population were below the poverty line, including 6.2% of those under age 18 and 4.2% of those age 65 or over.
Conclusion
Tonka Bay is a small city located in Hennepin County, Minnesota, United States. It is situated on the western shore of Lake Minnetonka, about 20 miles west of Minneapolis. The city has a population of 2,521 as of the 2010 census. The city’s economy is largely based on tourism and recreation, and it is home to a number of parks, beaches, and marinas, as well as a variety of restaurants and shops. The city has a diverse population, with a median income of $76,944 for households and $90,944 for families.
Common Questions
What is Per Capita Income in Tonka Bay?
Per Capita income in Tonka Bay is $115,982.
What is the Median Family Income in Tonka Bay?
Median Family Income in Tonka Bay is $157,045.
What is the Median Household income in Tonka Bay?
Median Household Income in Tonka Bay is $141,875.
What is Income or Wage Gap in Tonka Bay?
Income or Wage Gap in Tonka Bay is 7.1%.
Women in Tonka Bay earn 92.9 cents for every dollar earned by a man.
What is Inequality or Gini Index in Tonka Bay?
Inequality or Gini Index in Tonka Bay is 0.56.
What is the Total Population of Tonka Bay?
Total Population of Tonka Bay is 1,462.
What is the Total Male Population of Tonka Bay?
Total Male Population of Tonka Bay is 756.
What is the Total Female Population of Tonka Bay?
Total Female Population of Tonka Bay is 706.
What is the Ratio of Males per 100 Females in Tonka Bay?
There are 107.08 Males per 100 Females in Tonka Bay.
What is the Ratio of Females per 100 Males in Tonka Bay?
There are 93.39 Females per 100 Males in Tonka Bay.
What is the Median Population Age in Tonka Bay?
Median Population Age in Tonka Bay is 57.1 Years.
What is the Average Family Size in Tonka Bay
Average Family Size in Tonka Bay is 2.6 People.
What is the Average Household Size in Tonka Bay
Average Household Size in Tonka Bay is 2.4 People.
How Large is the Labor Force in Tonka Bay?
There are 712 People in the Labor Forcein in Tonka Bay.
What is the Percentage of People in the Labor Force in Tonka Bay?
55.7% of People are in the Labor Force in Tonka Bay.
What is the Unemployment Rate in Tonka Bay?
Unemployment Rate in Tonka Bay is 7.6%.