Argo, AL Map & Demographics
Argo Map
Argo Overview
$35,152
PER CAPITA INCOME
$99,052
AVG FAMILY INCOME
$87,134
AVG HOUSEHOLD INCOME
16.8%
WAGE / INCOME GAP [ % ]
83.2¢/ $1
WAGE / INCOME GAP [ $ ]
0.34
INEQUALITY / GINI INDEX
4,416
TOTAL POPULATION
2,269
MALE POPULATION
2,147
FEMALE POPULATION
105.68
MALES / 100 FEMALES
94.62
FEMALES / 100 MALES
29.9
MEDIAN AGE
3.1
AVG FAMILY SIZE
2.9
AVG HOUSEHOLD SIZE
2,451
LABOR FORCE [ PEOPLE ]
76.2%
PERCENT IN LABOR FORCE
0.4%
UNEMPLOYMENT RATE
Income in Argo
Income Overview in Argo
Per Capita Income in Argo is $35,152, while median incomes of families and households are $99,052 and $87,134 respectively.
| Characteristic | Number | Measure |
| Per Capita Income | 4,416 | $35,152 |
| Median Family Income | 1,333 | $99,052 |
| Mean Family Income | 1,333 | $115,663 |
| Median Household Income | 1,537 | $87,134 |
| Mean Household Income | 1,537 | $105,235 |
| Income Deficit | 1,333 | $0 |
| Wage / Income Gap (%) | 4,416 | 16.81% |
| Wage / Income Gap ($) | 4,416 | 83.19¢ per $1 |
| Gini / Inequality Index | 4,416 | 0.34 |
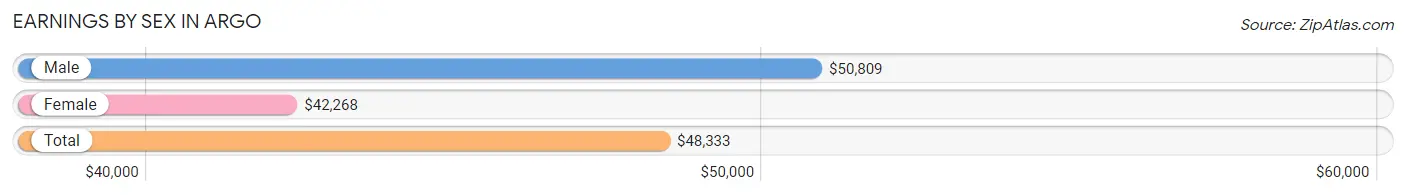
Earnings by Sex in Argo
Average Earnings in Argo are $48,333, $50,809 for men and $42,268 for women, a difference of 16.8%.
| Sex | Number | Average Earnings |
| Male | 1,470 (58.4%) | $50,809 |
| Female | 1,048 (41.6%) | $42,268 |
| Total | 2,518 (100.0%) | $48,333 |
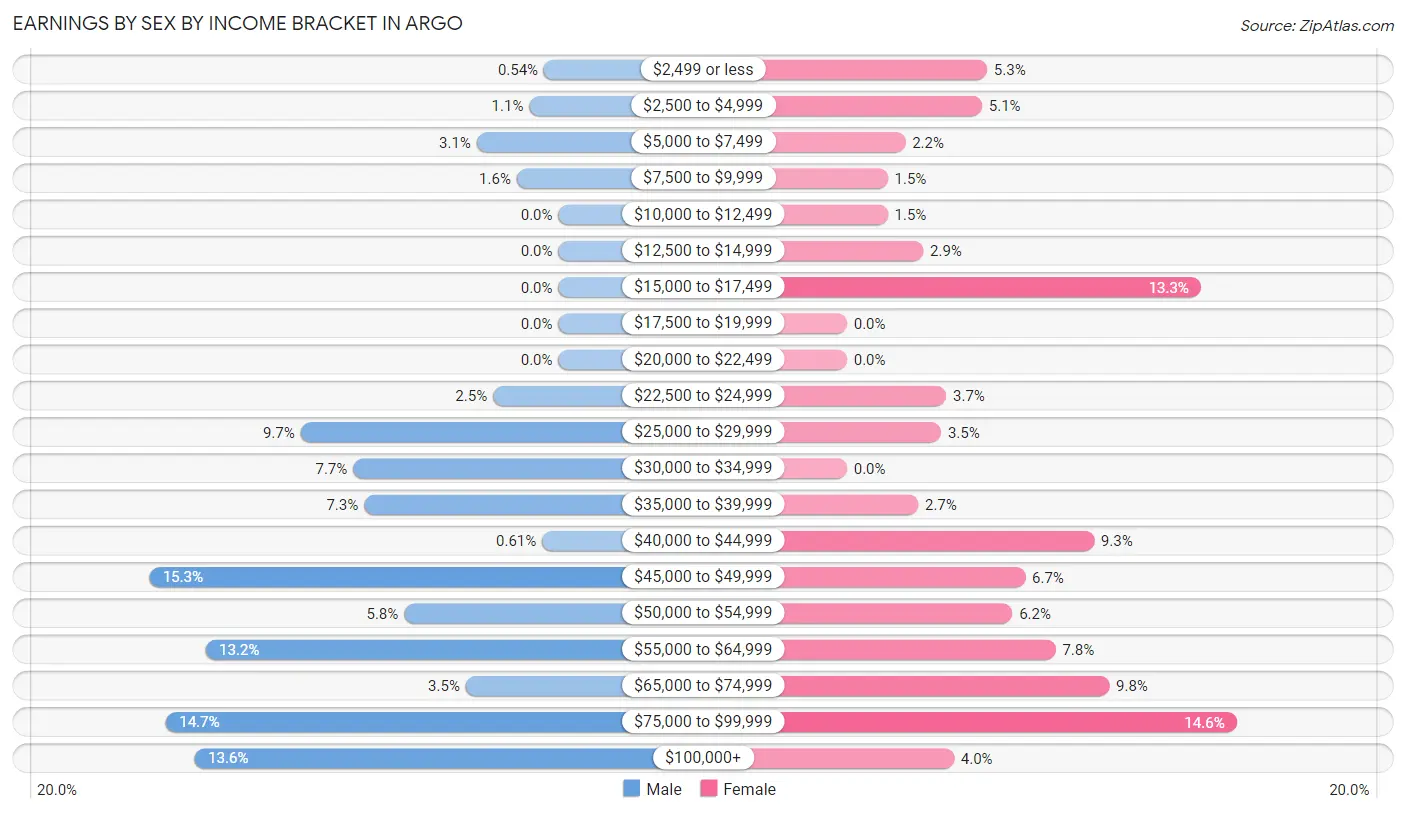
Earnings by Sex by Income Bracket in Argo
The most common earnings brackets in Argo are $45,000 to $49,999 for men (225 | 15.3%) and $75,000 to $99,999 for women (153 | 14.6%).
| Income | Male | Female |
| $2,499 or less | 8 (0.5%) | 55 (5.2%) |
| $2,500 to $4,999 | 16 (1.1%) | 53 (5.1%) |
| $5,000 to $7,499 | 45 (3.1%) | 23 (2.2%) |
| $7,500 to $9,999 | 23 (1.6%) | 16 (1.5%) |
| $10,000 to $12,499 | 0 (0.0%) | 16 (1.5%) |
| $12,500 to $14,999 | 0 (0.0%) | 30 (2.9%) |
| $15,000 to $17,499 | 0 (0.0%) | 139 (13.3%) |
| $17,500 to $19,999 | 0 (0.0%) | 0 (0.0%) |
| $20,000 to $22,499 | 0 (0.0%) | 0 (0.0%) |
| $22,500 to $24,999 | 36 (2.5%) | 39 (3.7%) |
| $25,000 to $29,999 | 142 (9.7%) | 37 (3.5%) |
| $30,000 to $34,999 | 113 (7.7%) | 0 (0.0%) |
| $35,000 to $39,999 | 107 (7.3%) | 28 (2.7%) |
| $40,000 to $44,999 | 9 (0.6%) | 97 (9.3%) |
| $45,000 to $49,999 | 225 (15.3%) | 70 (6.7%) |
| $50,000 to $54,999 | 85 (5.8%) | 65 (6.2%) |
| $55,000 to $64,999 | 194 (13.2%) | 82 (7.8%) |
| $65,000 to $74,999 | 51 (3.5%) | 103 (9.8%) |
| $75,000 to $99,999 | 216 (14.7%) | 153 (14.6%) |
| $100,000+ | 200 (13.6%) | 42 (4.0%) |
| Total | 1,470 (100.0%) | 1,048 (100.0%) |
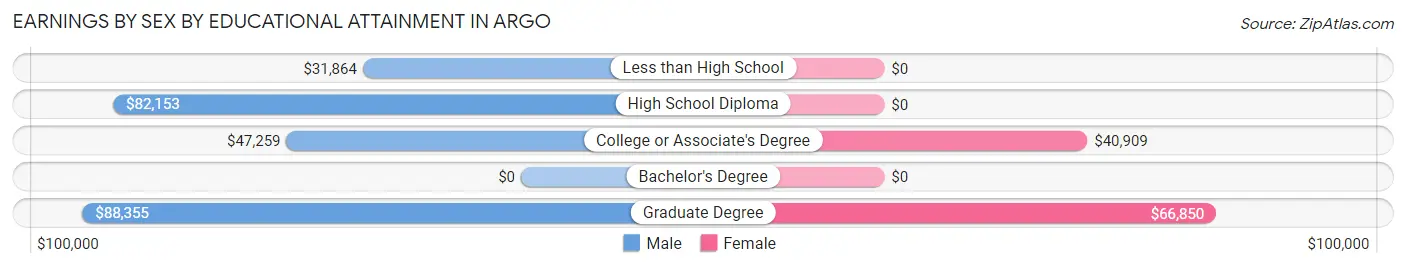
Earnings by Sex by Educational Attainment in Argo
Average earnings in Argo are $54,020 for men and $47,813 for women, a difference of 11.5%. Men with an educational attainment of graduate degree enjoy the highest average annual earnings of $88,355, while those with less than high school education earn the least with $31,864. Women with an educational attainment of graduate degree earn the most with the average annual earnings of $66,850, while those with college or associate's degree education have the smallest earnings of $40,909.
| Educational Attainment | Male Income | Female Income |
| Less than High School | $31,864 | $0 |
| High School Diploma | $82,153 | $0 |
| College or Associate's Degree | $47,259 | $40,909 |
| Bachelor's Degree | - | - |
| Graduate Degree | $88,355 | $66,850 |
| Total | $54,020 | $47,813 |
Family Income in Argo
Family Income Brackets in Argo
According to the Argo family income data, there are 351 families falling into the $75,000 to $99,999 income range, which is the most common income bracket and makes up 26.3% of all families.
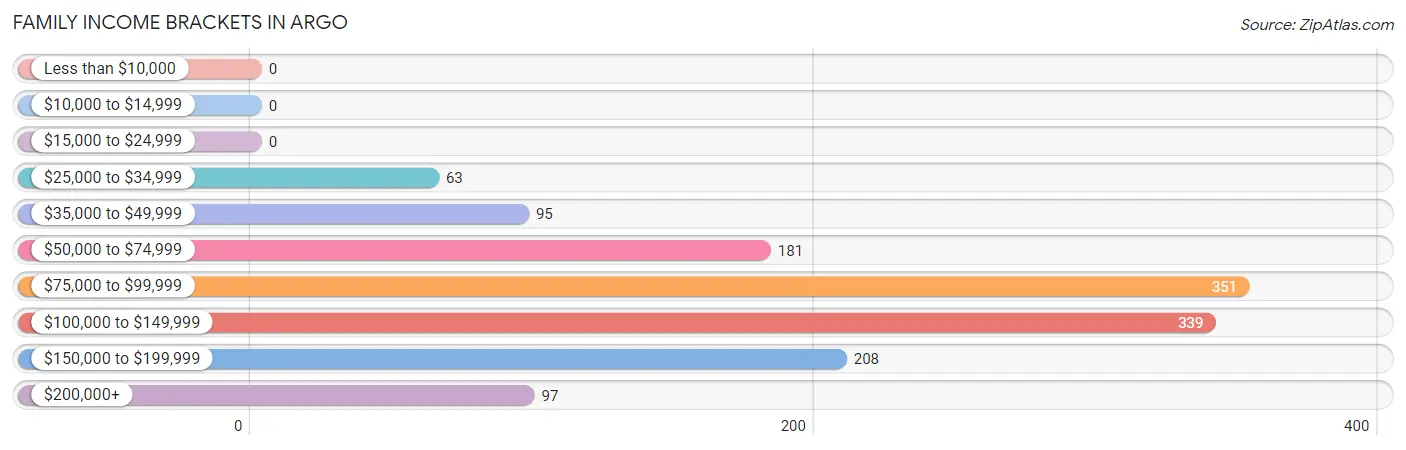
| Income Bracket | # Families | % Families |
| Less than $10,000 | 0 | 0.0% |
| $10,000 to $14,999 | 0 | 0.0% |
| $15,000 to $24,999 | 0 | 0.0% |
| $25,000 to $34,999 | 63 | 4.7% |
| $35,000 to $49,999 | 95 | 7.1% |
| $50,000 to $74,999 | 181 | 13.6% |
| $75,000 to $99,999 | 351 | 26.3% |
| $100,000 to $149,999 | 339 | 25.4% |
| $150,000 to $199,999 | 208 | 15.6% |
| $200,000+ | 97 | 7.3% |
Family Income by Famaliy Size in Argo
3-person families (262 | 19.7%) account for the highest median family income in Argo with $116,212 per family, while 2-person families (357 | 26.8%) have the highest median income of $42,994 per family member.
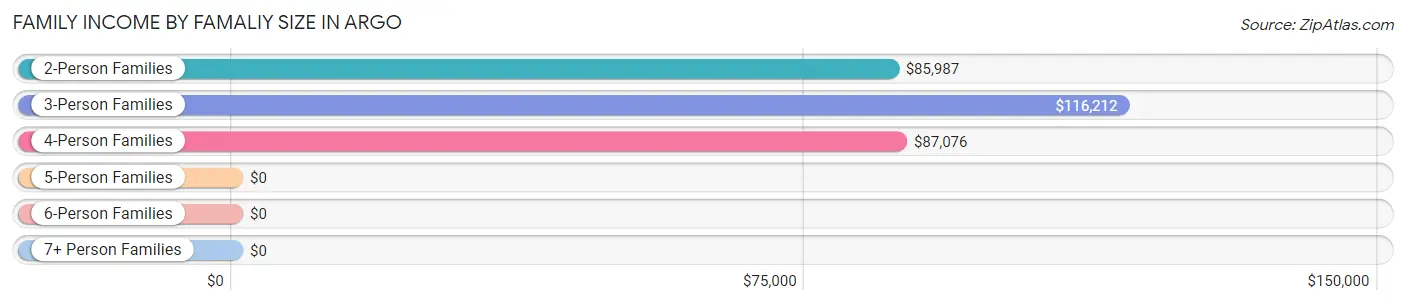
| Income Bracket | # Families | Median Income |
| 2-Person Families | 357 (26.8%) | $85,987 |
| 3-Person Families | 262 (19.7%) | $116,212 |
| 4-Person Families | 547 (41.0%) | $87,076 |
| 5-Person Families | 150 (11.3%) | $0 |
| 6-Person Families | 0 (0.0%) | $0 |
| 7+ Person Families | 17 (1.3%) | $0 |
| Total | 1,333 (100.0%) | $99,052 |
Family Income by Number of Earners in Argo
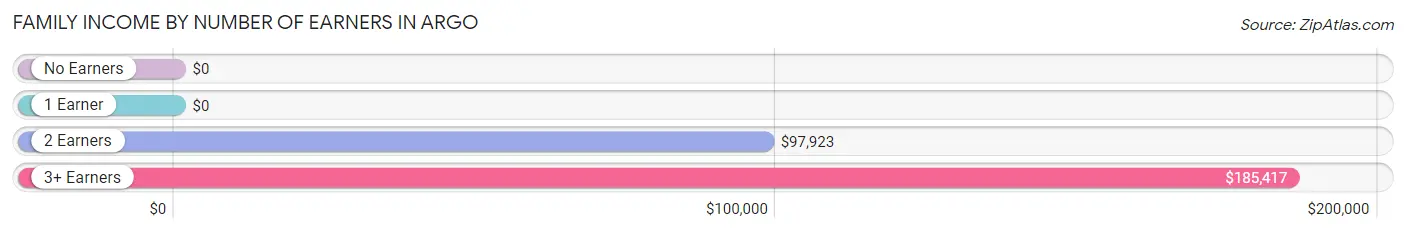
| Number of Earners | # Families | Median Income |
| No Earners | 59 (4.4%) | $0 |
| 1 Earner | 341 (25.6%) | $0 |
| 2 Earners | 751 (56.3%) | $97,923 |
| 3+ Earners | 182 (13.7%) | $185,417 |
| Total | 1,333 (100.0%) | $99,052 |
Household Income in Argo
Household Income Brackets in Argo
With 357 households falling in the category, the $75,000 to $99,999 income range is the most frequent in Argo, accounting for 23.2% of all households.
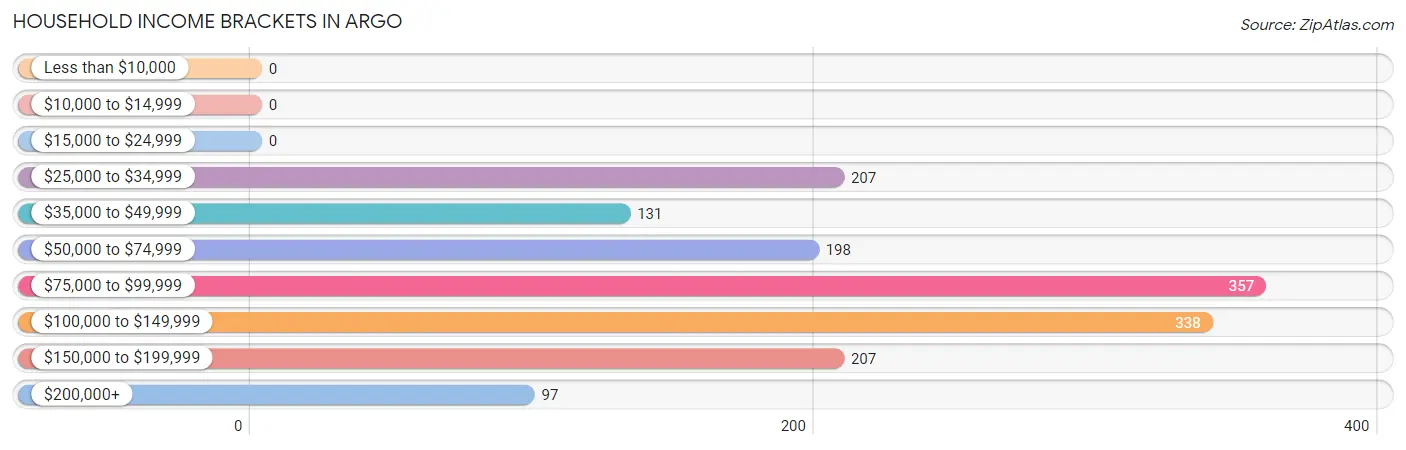
| Income Bracket | # Households | % Households |
| Less than $10,000 | 0 | 0.0% |
| $10,000 to $14,999 | 0 | 0.0% |
| $15,000 to $24,999 | 0 | 0.0% |
| $25,000 to $34,999 | 207 | 13.5% |
| $35,000 to $49,999 | 131 | 8.5% |
| $50,000 to $74,999 | 198 | 12.9% |
| $75,000 to $99,999 | 357 | 23.2% |
| $100,000 to $149,999 | 338 | 22.0% |
| $150,000 to $199,999 | 207 | 13.5% |
| $200,000+ | 97 | 6.3% |
Household Income by Householder Age in Argo
The median household income in Argo is $87,134, with the highest median household income of $133,125 found in the 45 to 64 years age bracket for the primary householder. A total of 464 households (30.2%) fall into this category.
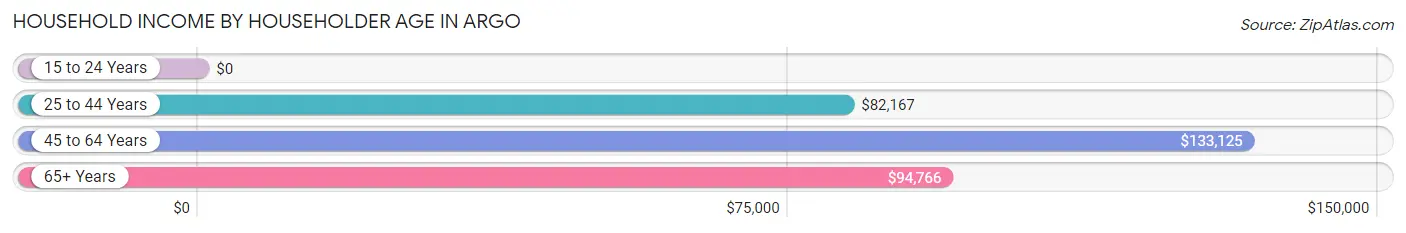
| Income Bracket | # Households | Median Income |
| 15 to 24 Years | 0 (0.0%) | $0 |
| 25 to 44 Years | 874 (56.9%) | $82,167 |
| 45 to 64 Years | 464 (30.2%) | $133,125 |
| 65+ Years | 199 (13.0%) | $94,766 |
| Total | 1,537 (100.0%) | $87,134 |
Poverty in Argo
Income Below Poverty by Sex and Age in Argo
With 5.2% poverty level for males and 3.7% for females among the residents of Argo, 6 to 11 year old males and 25 to 34 year old females are the most vulnerable to poverty, with 62 males (41.9%) and 47 females (10.2%) in their respective age groups living below the poverty level.
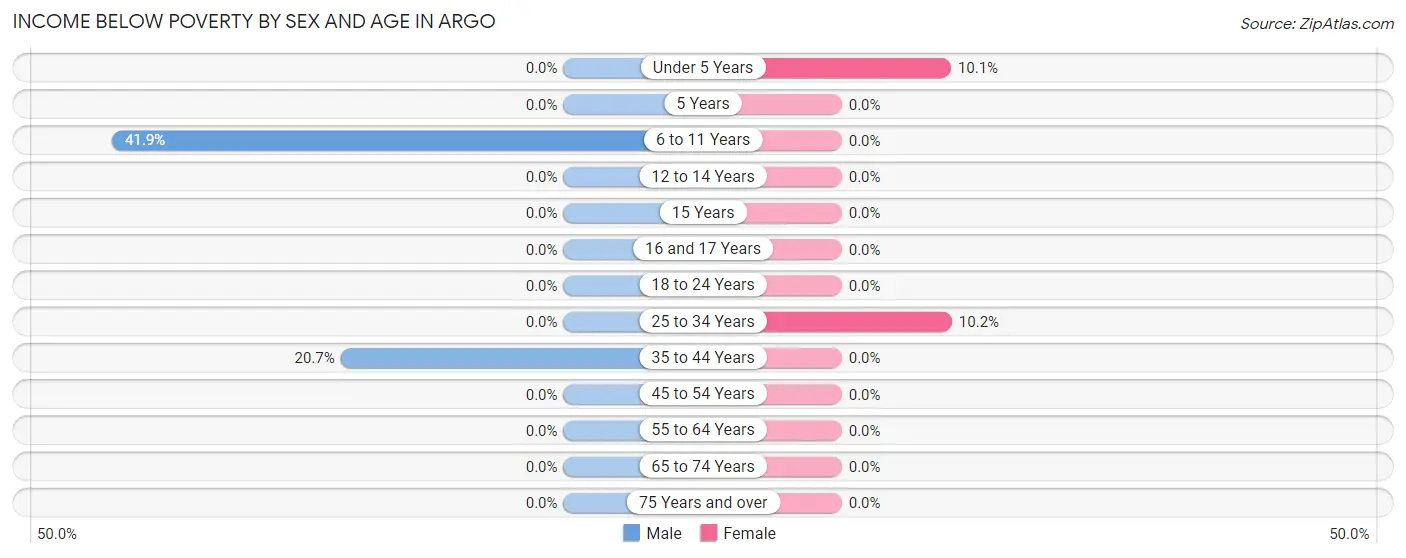
| Age Bracket | Male | Female |
| Under 5 Years | 0 (0.0%) | 32 (10.1%) |
| 5 Years | 0 (0.0%) | 0 (0.0%) |
| 6 to 11 Years | 62 (41.9%) | 0 (0.0%) |
| 12 to 14 Years | 0 (0.0%) | 0 (0.0%) |
| 15 Years | 0 (0.0%) | 0 (0.0%) |
| 16 and 17 Years | 0 (0.0%) | 0 (0.0%) |
| 18 to 24 Years | 0 (0.0%) | 0 (0.0%) |
| 25 to 34 Years | 0 (0.0%) | 47 (10.2%) |
| 35 to 44 Years | 55 (20.7%) | 0 (0.0%) |
| 45 to 54 Years | 0 (0.0%) | 0 (0.0%) |
| 55 to 64 Years | 0 (0.0%) | 0 (0.0%) |
| 65 to 74 Years | 0 (0.0%) | 0 (0.0%) |
| 75 Years and over | 0 (0.0%) | 0 (0.0%) |
| Total | 117 (5.2%) | 79 (3.7%) |
Income Above Poverty by Sex and Age in Argo
According to the poverty statistics in Argo, males aged under 5 years and females aged 5 years are the age groups that are most secure financially, with 100.0% of males and 100.0% of females in these age groups living above the poverty line.
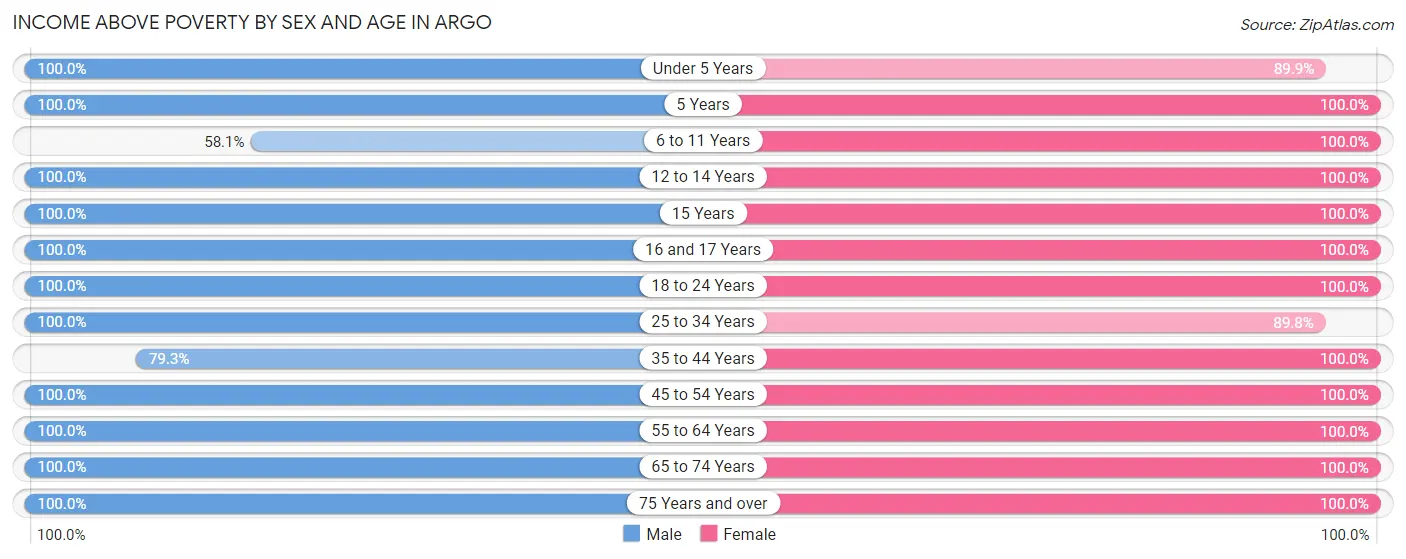
| Age Bracket | Male | Female |
| Under 5 Years | 141 (100.0%) | 284 (89.9%) |
| 5 Years | 106 (100.0%) | 41 (100.0%) |
| 6 to 11 Years | 86 (58.1%) | 106 (100.0%) |
| 12 to 14 Years | 108 (100.0%) | 98 (100.0%) |
| 15 Years | 63 (100.0%) | 73 (100.0%) |
| 16 and 17 Years | 39 (100.0%) | 70 (100.0%) |
| 18 to 24 Years | 192 (100.0%) | 141 (100.0%) |
| 25 to 34 Years | 606 (100.0%) | 413 (89.8%) |
| 35 to 44 Years | 211 (79.3%) | 242 (100.0%) |
| 45 to 54 Years | 323 (100.0%) | 297 (100.0%) |
| 55 to 64 Years | 68 (100.0%) | 125 (100.0%) |
| 65 to 74 Years | 170 (100.0%) | 148 (100.0%) |
| 75 Years and over | 39 (100.0%) | 30 (100.0%) |
| Total | 2,152 (94.8%) | 2,068 (96.3%) |
Income Below Poverty Among Married-Couple Families in Argo
The poverty statistics for married-couple families in Argo show that 3.8% or 47 of the total 1,250 families live below the poverty line. Families with 3 or 4 children have the highest poverty rate of 43.9%, comprising of 47 families. On the other hand, families with no children have the lowest poverty rate of 0.0%, which includes 0 families.
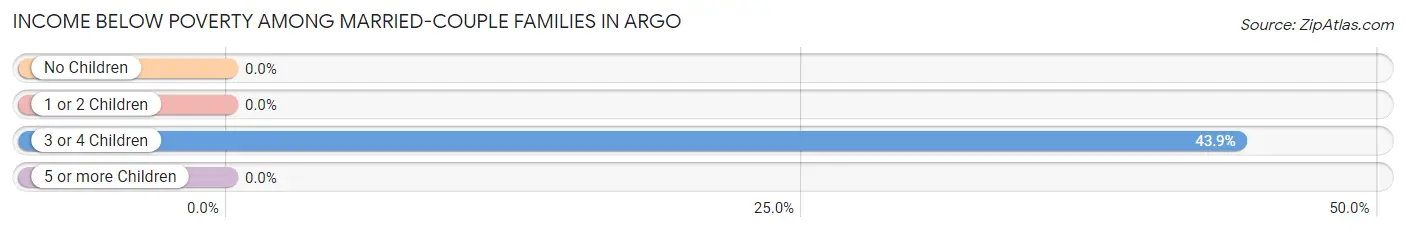
| Children | Above Poverty | Below Poverty |
| No Children | 511 (100.0%) | 0 (0.0%) |
| 1 or 2 Children | 632 (100.0%) | 0 (0.0%) |
| 3 or 4 Children | 60 (56.1%) | 47 (43.9%) |
| 5 or more Children | 0 (0.0%) | 0 (0.0%) |
| Total | 1,203 (96.2%) | 47 (3.8%) |
Income Below Poverty Among Single-Parent Households in Argo
| Children | Single Father | Single Mother |
| No Children | 0 (0.0%) | 0 (0.0%) |
| 1 or 2 Children | 0 (0.0%) | 0 (0.0%) |
| 3 or 4 Children | 0 (0.0%) | 0 (0.0%) |
| 5 or more Children | 0 (0.0%) | 0 (0.0%) |
| Total | 0 (0.0%) | 0 (0.0%) |
Income Below Poverty Among Married-Couple vs Single-Parent Households in Argo
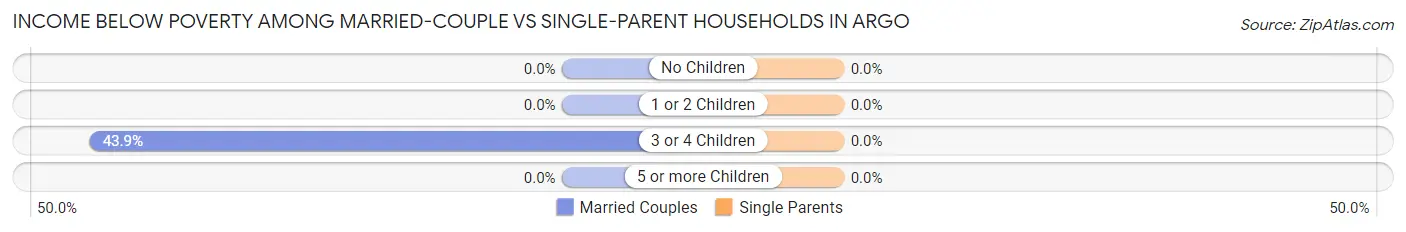
| Children | Married-Couple Families | Single-Parent Households |
| No Children | 0 (0.0%) | 0 (0.0%) |
| 1 or 2 Children | 0 (0.0%) | 0 (0.0%) |
| 3 or 4 Children | 47 (43.9%) | 0 (0.0%) |
| 5 or more Children | 0 (0.0%) | 0 (0.0%) |
| Total | 47 (3.8%) | 0 (0.0%) |
Race in Argo
The most populous races in Argo are White / Caucasian (3,800 | 86.1%), Black / African American (369 | 8.4%), and Hispanic or Latino (252 | 5.7%).
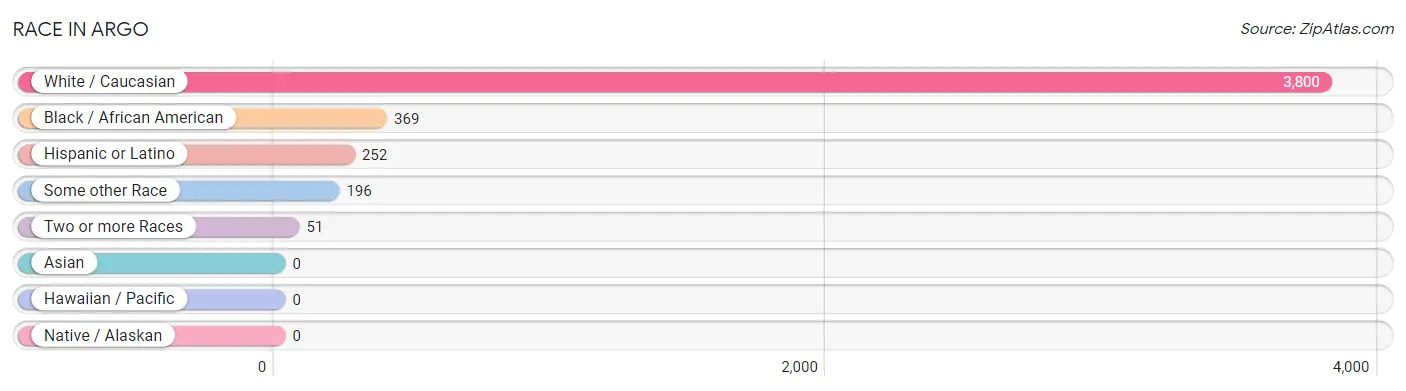
| Race | # Population | % Population |
| Asian | 0 | 0.0% |
| Black / African American | 369 | 8.4% |
| Hawaiian / Pacific | 0 | 0.0% |
| Hispanic or Latino | 252 | 5.7% |
| Native / Alaskan | 0 | 0.0% |
| White / Caucasian | 3,800 | 86.1% |
| Two or more Races | 51 | 1.1% |
| Some other Race | 196 | 4.4% |
| Total | 4,416 | 100.0% |
Ancestry in Argo
The most populous ancestries reported in Argo are American (1,012 | 22.9%), Irish (625 | 14.1%), English (546 | 12.4%), German (416 | 9.4%), and Mexican (196 | 4.4%), together accounting for 63.3% of all Argo residents.
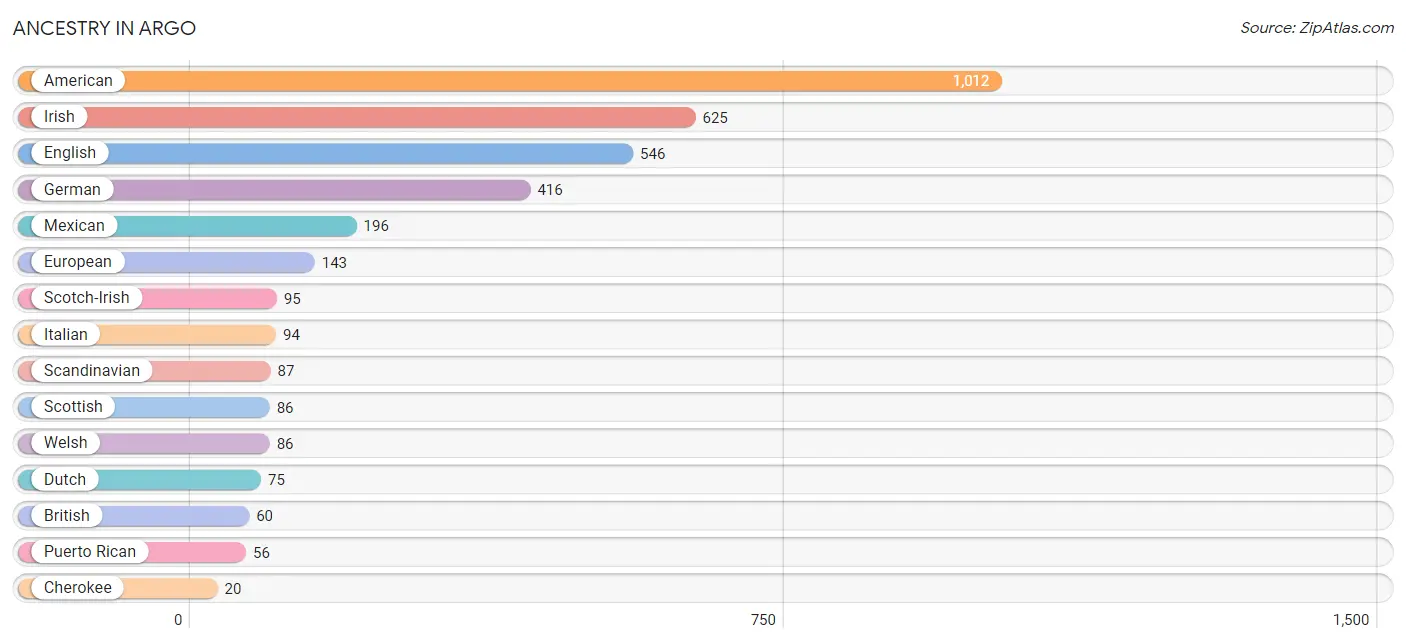
| Ancestry | # Population | % Population |
| American | 1,012 | 22.9% |
| British | 60 | 1.4% |
| Cherokee | 20 | 0.4% |
| Dutch | 75 | 1.7% |
| English | 546 | 12.4% |
| European | 143 | 3.2% |
| French | 15 | 0.3% |
| German | 416 | 9.4% |
| Irish | 625 | 14.1% |
| Italian | 94 | 2.1% |
| Mexican | 196 | 4.4% |
| Puerto Rican | 56 | 1.3% |
| Scandinavian | 87 | 2.0% |
| Scotch-Irish | 95 | 2.1% |
| Scottish | 86 | 1.9% |
| Welsh | 86 | 1.9% | View All 16 Rows |
Immigrants in Argo
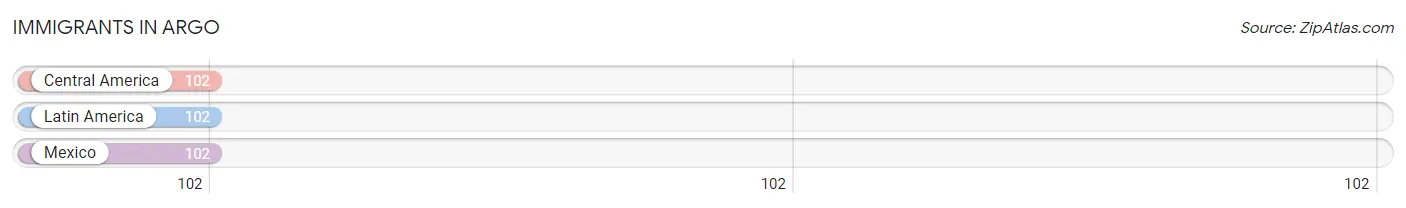
The most numerous immigrant groups reported in Argo came from Central America (102 | 2.3%), Latin America (102 | 2.3%), and Mexico (102 | 2.3%), together accounting for 6.9% of all Argo residents.
| Immigration Origin | # Population | % Population |
| Central America | 102 | 2.3% |
| Latin America | 102 | 2.3% |
| Mexico | 102 | 2.3% | View All 3 Rows |
Sex and Age in Argo
Sex and Age in Argo
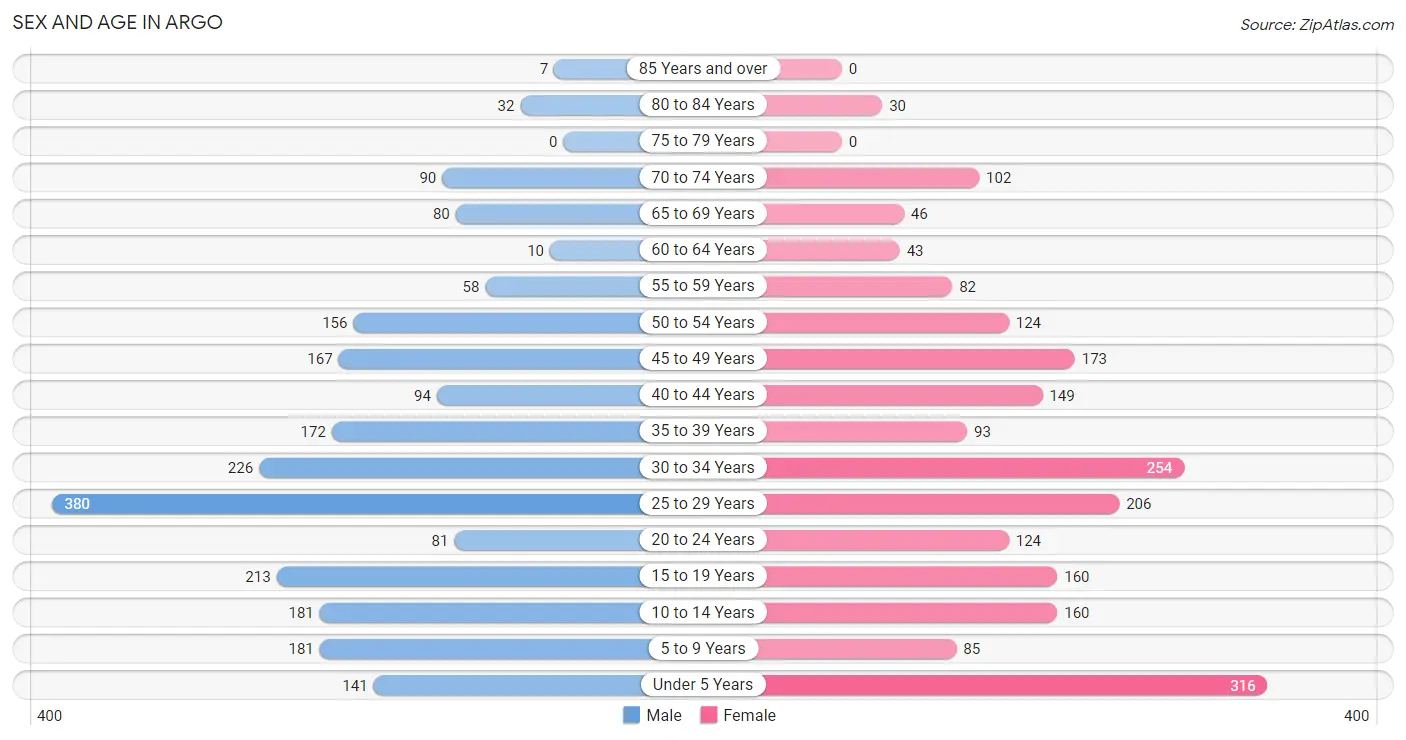
The most populous age groups in Argo are 25 to 29 Years (380 | 16.8%) for men and Under 5 Years (316 | 14.7%) for women.
| Age Bracket | Male | Female |
| Under 5 Years | 141 (6.2%) | 316 (14.7%) |
| 5 to 9 Years | 181 (8.0%) | 85 (4.0%) |
| 10 to 14 Years | 181 (8.0%) | 160 (7.4%) |
| 15 to 19 Years | 213 (9.4%) | 160 (7.4%) |
| 20 to 24 Years | 81 (3.6%) | 124 (5.8%) |
| 25 to 29 Years | 380 (16.8%) | 206 (9.6%) |
| 30 to 34 Years | 226 (10.0%) | 254 (11.8%) |
| 35 to 39 Years | 172 (7.6%) | 93 (4.3%) |
| 40 to 44 Years | 94 (4.1%) | 149 (6.9%) |
| 45 to 49 Years | 167 (7.4%) | 173 (8.1%) |
| 50 to 54 Years | 156 (6.9%) | 124 (5.8%) |
| 55 to 59 Years | 58 (2.6%) | 82 (3.8%) |
| 60 to 64 Years | 10 (0.4%) | 43 (2.0%) |
| 65 to 69 Years | 80 (3.5%) | 46 (2.1%) |
| 70 to 74 Years | 90 (4.0%) | 102 (4.8%) |
| 75 to 79 Years | 0 (0.0%) | 0 (0.0%) |
| 80 to 84 Years | 32 (1.4%) | 30 (1.4%) |
| 85 Years and over | 7 (0.3%) | 0 (0.0%) |
| Total | 2,269 (100.0%) | 2,147 (100.0%) |
Families and Households in Argo
Median Family Size in Argo
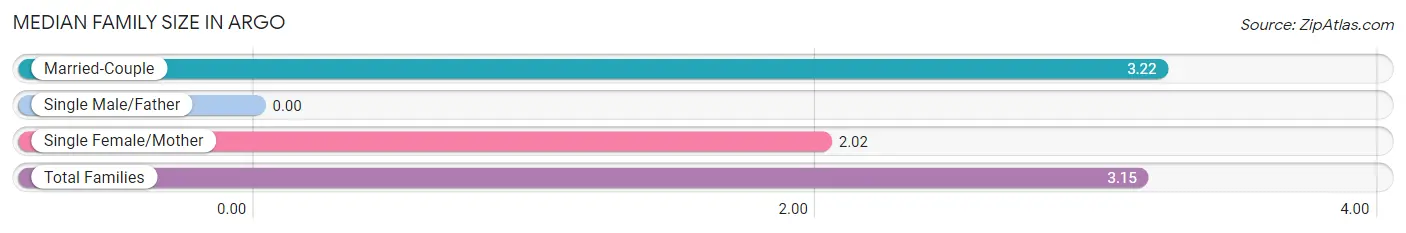
| Family Type | # Families | Family Size |
| Married-Couple | 1,250 (93.8%) | 3.22 |
| Single Male/Father | 0 (0.0%) | - |
| Single Female/Mother | 83 (6.2%) | 2.02 |
| Total Families | 1,333 (100.0%) | 3.15 |
Median Household Size in Argo
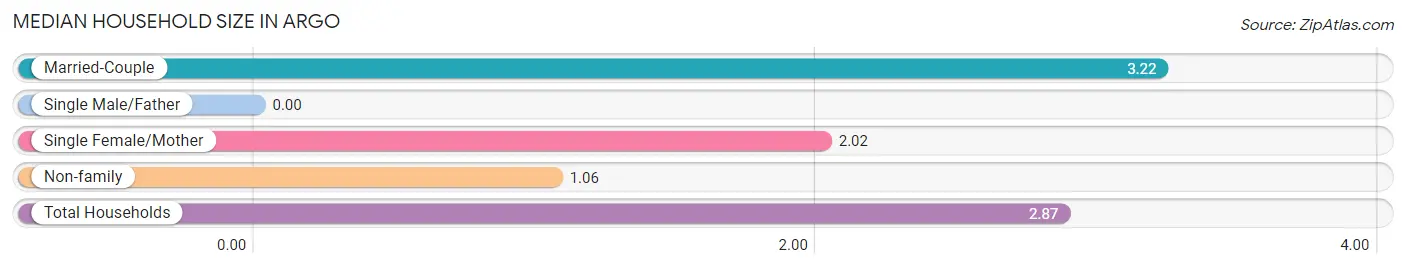
| Household Type | # Households | Household Size |
| Married-Couple | 1,250 (81.3%) | 3.22 |
| Single Male/Father | 0 (0.0%) | - |
| Single Female/Mother | 83 (5.4%) | 2.02 |
| Non-family | 204 (13.3%) | 1.06 |
| Total Households | 1,537 (100.0%) | 2.87 |
Household Size by Marriage Status in Argo
Out of a total of 1,537 households in Argo, 1,333 (86.7%) are family households, while 204 (13.3%) are nonfamily households. The most numerous type of family households are 4-person households, comprising 547, and the most common type of nonfamily households are 1-person households, comprising 195.
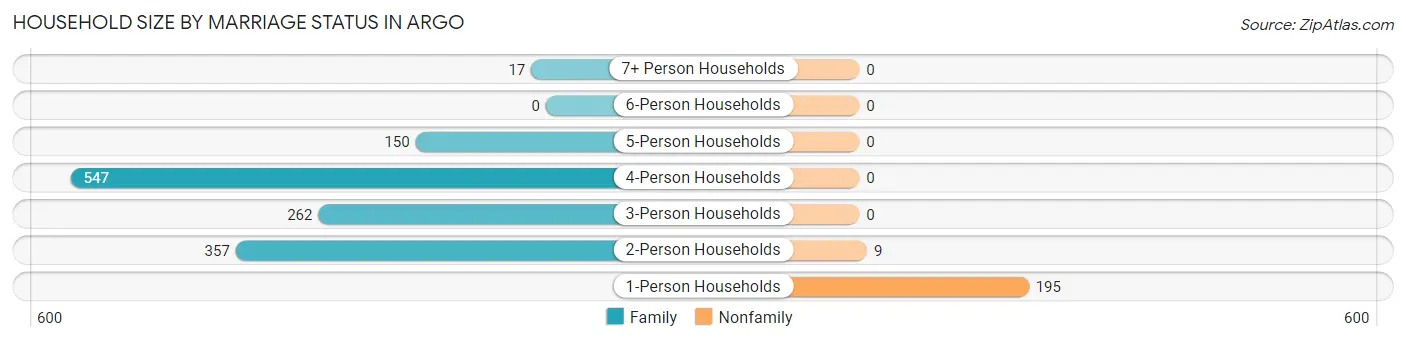
| Household Size | Family Households | Nonfamily Households |
| 1-Person Households | - | 195 (12.7%) |
| 2-Person Households | 357 (23.2%) | 9 (0.6%) |
| 3-Person Households | 262 (17.1%) | 0 (0.0%) |
| 4-Person Households | 547 (35.6%) | 0 (0.0%) |
| 5-Person Households | 150 (9.8%) | 0 (0.0%) |
| 6-Person Households | 0 (0.0%) | 0 (0.0%) |
| 7+ Person Households | 17 (1.1%) | 0 (0.0%) |
| Total | 1,333 (86.7%) | 204 (13.3%) |
Female Fertility in Argo
Fertility by Age in Argo
Average fertility rate in Argo is 172.0 births per 1,000 women. Women in the age bracket of 20 to 34 years have the highest fertility rate with 267.0 births per 1,000 women. Women in the age bracket of 20 to 34 years acount for 78.4% of all women with births.
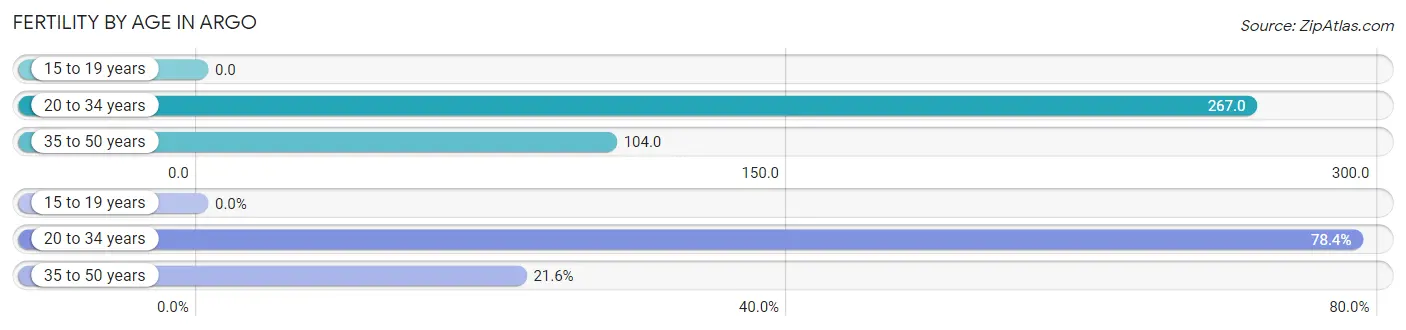
| Age Bracket | Women with Births | Births / 1,000 Women |
| 15 to 19 years | 0 (0.0%) | 0.0 |
| 20 to 34 years | 156 (78.4%) | 267.0 |
| 35 to 50 years | 43 (21.6%) | 104.0 |
| Total | 199 (100.0%) | 172.0 |
Fertility by Age by Marriage Status in Argo
77.4% of women with births (199) in Argo are married. The highest percentage of unmarried women with births falls into 20 to 34 years age bracket with 28.8% of them unmarried at the time of birth, while the lowest percentage of unmarried women with births belong to 35 to 50 years age bracket with 0.0% of them unmarried.
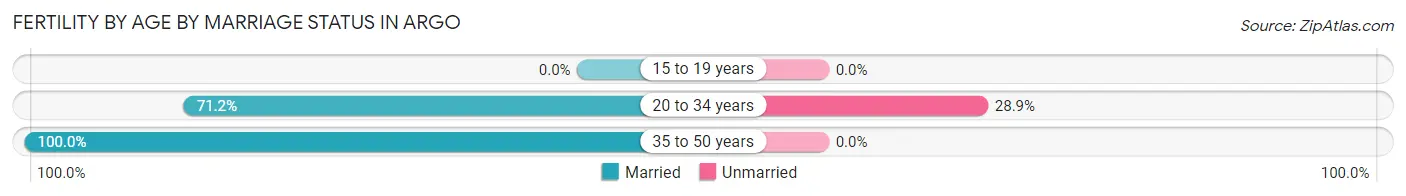
| Age Bracket | Married | Unmarried |
| 15 to 19 years | 0 (0.0%) | 0 (0.0%) |
| 20 to 34 years | 111 (71.2%) | 45 (28.8%) |
| 35 to 50 years | 43 (100.0%) | 0 (0.0%) |
| Total | 154 (77.4%) | 45 (22.6%) |
Fertility by Education in Argo
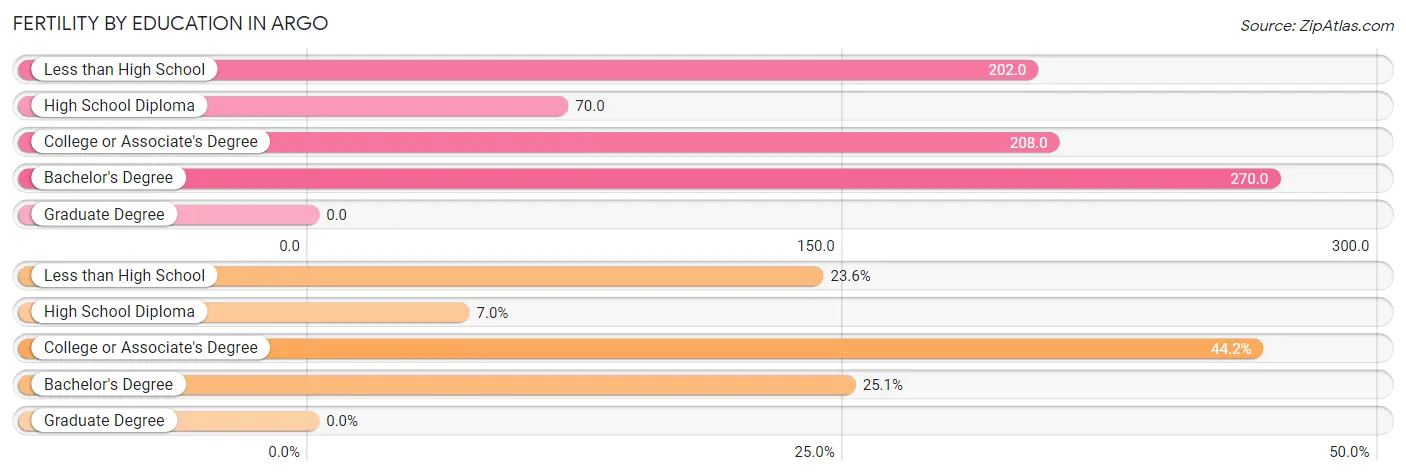
| Educational Attainment | Women with Births | Births / 1,000 Women |
| Less than High School | 47 (23.6%) | 202.0 |
| High School Diploma | 14 (7.0%) | 70.0 |
| College or Associate's Degree | 88 (44.2%) | 208.0 |
| Bachelor's Degree | 50 (25.1%) | 270.0 |
| Graduate Degree | 0 (0.0%) | 0.0 |
| Total | 199 (100.0%) | 172.0 |
Fertility by Education by Marriage Status in Argo
22.6% of women with births in Argo are unmarried. Women with the educational attainment of less than high school are most likely to be married with 100.0% of them married at childbirth, while women with the educational attainment of college or associate's degree are least likely to be married with 51.1% of them unmarried at childbirth.
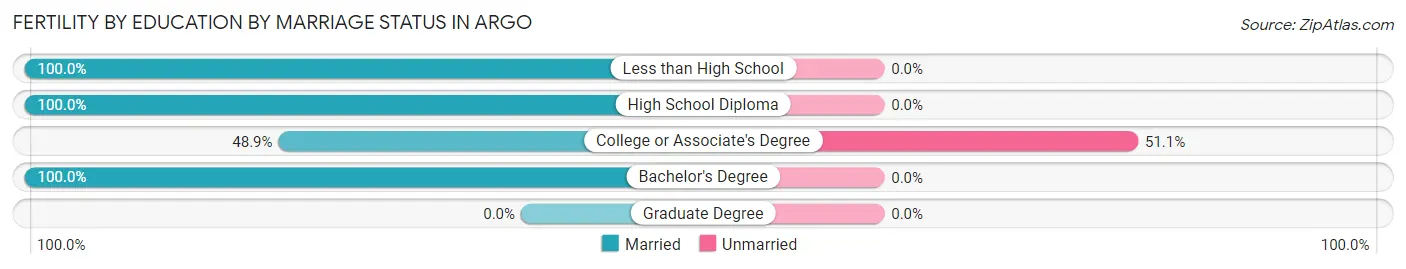
| Educational Attainment | Married | Unmarried |
| Less than High School | 47 (100.0%) | 0 (0.0%) |
| High School Diploma | 14 (100.0%) | 0 (0.0%) |
| College or Associate's Degree | 43 (48.9%) | 45 (51.1%) |
| Bachelor's Degree | 50 (100.0%) | 0 (0.0%) |
| Graduate Degree | 0 (0.0%) | 0 (0.0%) |
| Total | 154 (77.4%) | 45 (22.6%) |
Employment Characteristics in Argo
Employment by Class of Employer in Argo
Among the 2,441 employed individuals in Argo, private company employees (1,931 | 79.1%), local government employees (304 | 12.4%), and not-for-profit organizations (102 | 4.2%) make up the most common classes of employment.
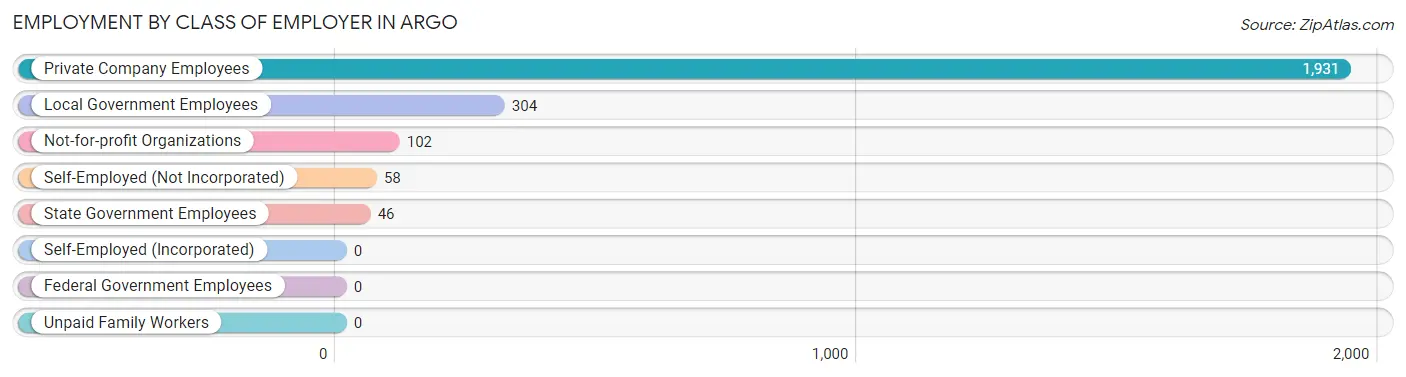
| Employer Class | # Employees | % Employees |
| Private Company Employees | 1,931 | 79.1% |
| Self-Employed (Incorporated) | 0 | 0.0% |
| Self-Employed (Not Incorporated) | 58 | 2.4% |
| Not-for-profit Organizations | 102 | 4.2% |
| Local Government Employees | 304 | 12.4% |
| State Government Employees | 46 | 1.9% |
| Federal Government Employees | 0 | 0.0% |
| Unpaid Family Workers | 0 | 0.0% |
| Total | 2,441 | 100.0% |
Employment Status by Age in Argo
According to the labor force statistics for Argo, out of the total population over 16 years of age (3,216), 76.2% or 2,451 individuals are in the labor force, with 0.4% or 10 of them unemployed. The age group with the highest labor force participation rate is 55 to 59 years, with 100.0% or 140 individuals in the labor force. Within the labor force, the 25 to 29 years age range has the highest percentage of unemployed individuals, with 1.7% or 9 of them being unemployed.
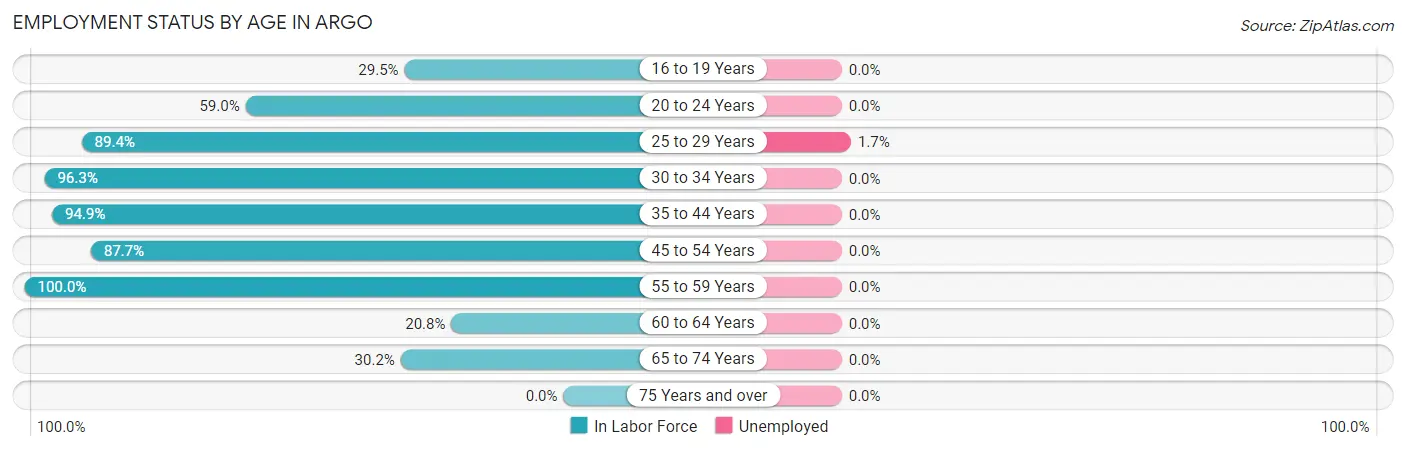
| Age Bracket | In Labor Force | Unemployed |
| 16 to 19 Years | 70 (29.5%) | 0 (0.0%) |
| 20 to 24 Years | 121 (59.0%) | 0 (0.0%) |
| 25 to 29 Years | 524 (89.4%) | 9 (1.7%) |
| 30 to 34 Years | 462 (96.3%) | 0 (0.0%) |
| 35 to 44 Years | 482 (94.9%) | 0 (0.0%) |
| 45 to 54 Years | 544 (87.7%) | 0 (0.0%) |
| 55 to 59 Years | 140 (100.0%) | 0 (0.0%) |
| 60 to 64 Years | 11 (20.8%) | 0 (0.0%) |
| 65 to 74 Years | 96 (30.2%) | 0 (0.0%) |
| 75 Years and over | 0 (0.0%) | 0 (0.0%) |
| Total | 2,451 (76.2%) | 10 (0.4%) |
Employment Status by Educational Attainment in Argo
According to labor force statistics for Argo, 90.6% of individuals (2,163) out of the total population between 25 and 64 years of age (2,387) are in the labor force, with 0.4% or 9 of them being unemployed. The group with the highest labor force participation rate are those with the educational attainment of bachelor's degree or higher, with 100.0% or 536 individuals in the labor force. Within the labor force, individuals with bachelor's degree or higher education have the highest percentage of unemployment, with 1.7% or 9 of them being unemployed.
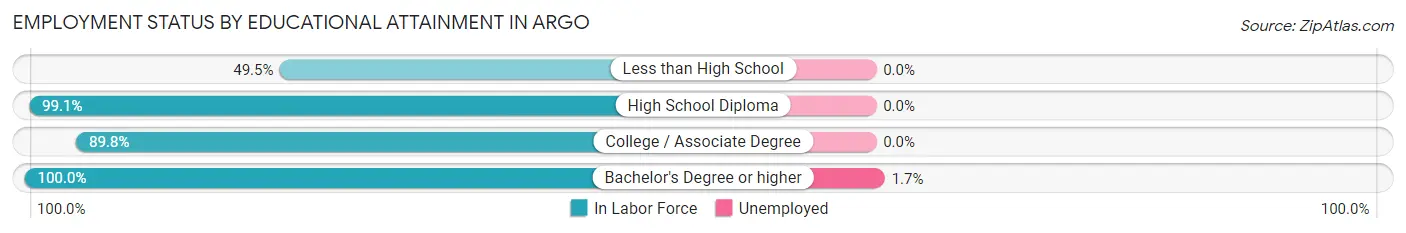
| Educational Attainment | In Labor Force | Unemployed |
| Less than High School | 94 (49.5%) | 0 (0.0%) |
| High School Diploma | 439 (99.1%) | 0 (0.0%) |
| College / Associate Degree | 1,094 (89.8%) | 0 (0.0%) |
| Bachelor's Degree or higher | 536 (100.0%) | 9 (1.7%) |
| Total | 2,163 (90.6%) | 10 (0.4%) |
Employment Occupations by Sex in Argo
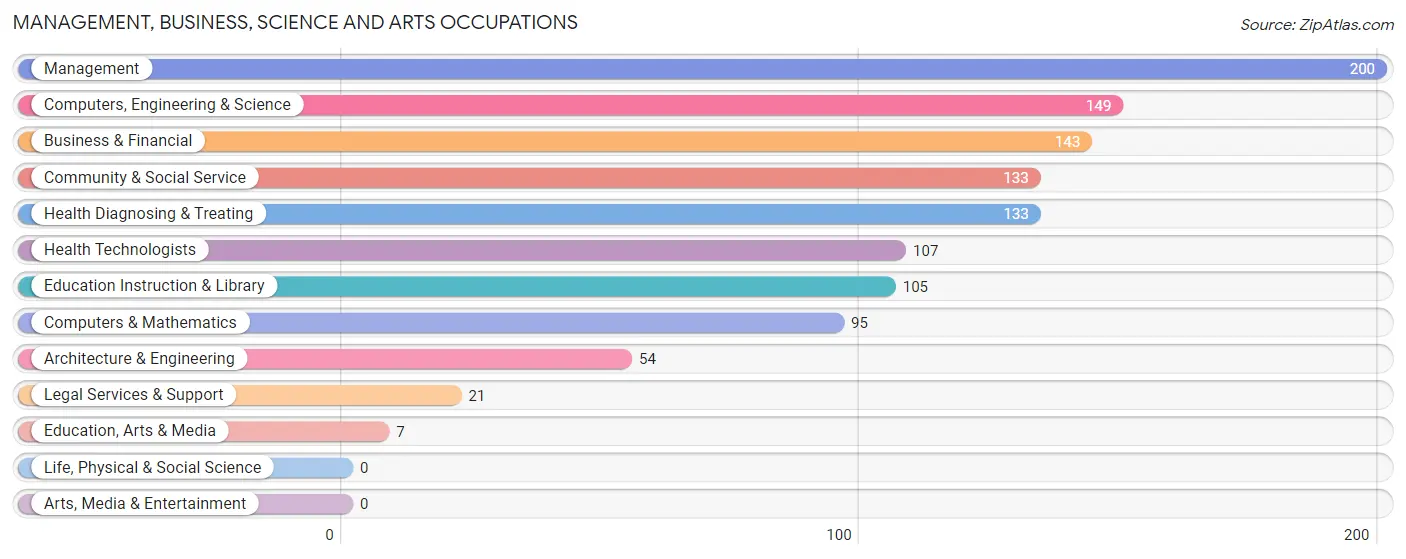
Management, Business, Science and Arts Occupations
The most common Management, Business, Science and Arts occupations in Argo are Management (200 | 8.2%), Computers, Engineering & Science (149 | 6.1%), Business & Financial (143 | 5.9%), Community & Social Service (133 | 5.4%), and Health Diagnosing & Treating (133 | 5.4%).
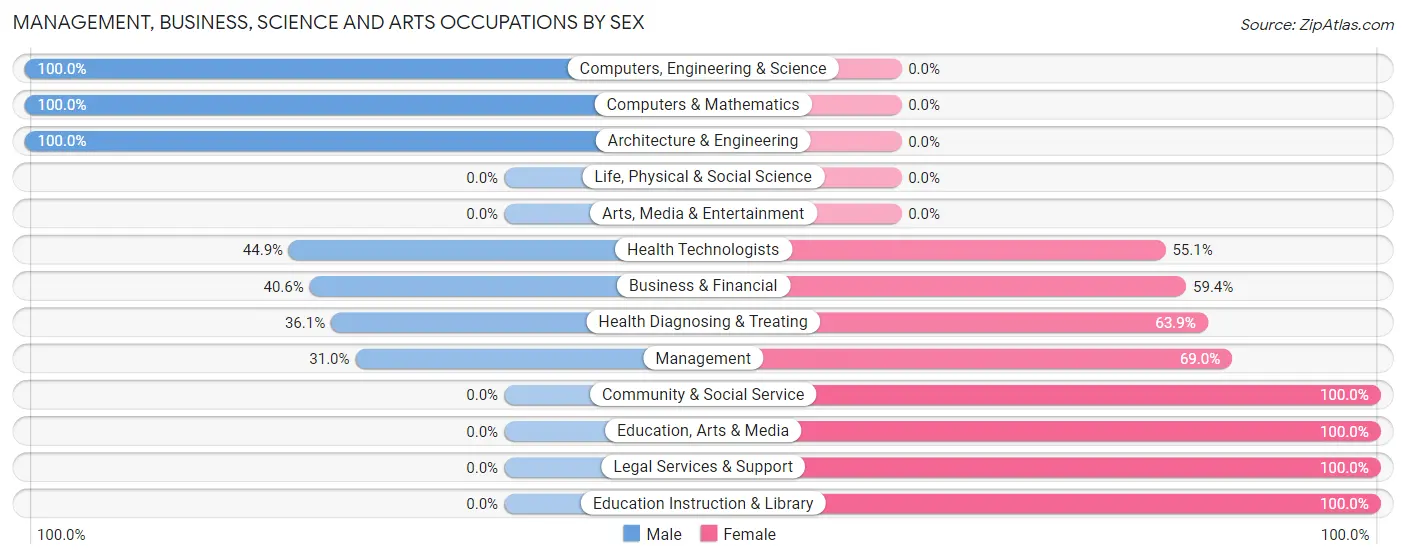
Management, Business, Science and Arts Occupations by Sex
Within the Management, Business, Science and Arts occupations in Argo, the most male-oriented occupations are Computers, Engineering & Science (100.0%), Computers & Mathematics (100.0%), and Architecture & Engineering (100.0%), while the most female-oriented occupations are Community & Social Service (100.0%), Education, Arts & Media (100.0%), and Legal Services & Support (100.0%).
| Occupation | Male | Female |
| Management | 62 (31.0%) | 138 (69.0%) |
| Business & Financial | 58 (40.6%) | 85 (59.4%) |
| Computers, Engineering & Science | 149 (100.0%) | 0 (0.0%) |
| Computers & Mathematics | 95 (100.0%) | 0 (0.0%) |
| Architecture & Engineering | 54 (100.0%) | 0 (0.0%) |
| Life, Physical & Social Science | 0 (0.0%) | 0 (0.0%) |
| Community & Social Service | 0 (0.0%) | 133 (100.0%) |
| Education, Arts & Media | 0 (0.0%) | 7 (100.0%) |
| Legal Services & Support | 0 (0.0%) | 21 (100.0%) |
| Education Instruction & Library | 0 (0.0%) | 105 (100.0%) |
| Arts, Media & Entertainment | 0 (0.0%) | 0 (0.0%) |
| Health Diagnosing & Treating | 48 (36.1%) | 85 (63.9%) |
| Health Technologists | 48 (44.9%) | 59 (55.1%) |
| Total (Category) | 317 (41.8%) | 441 (58.2%) |
| Total (Overall) | 1,445 (59.2%) | 996 (40.8%) |
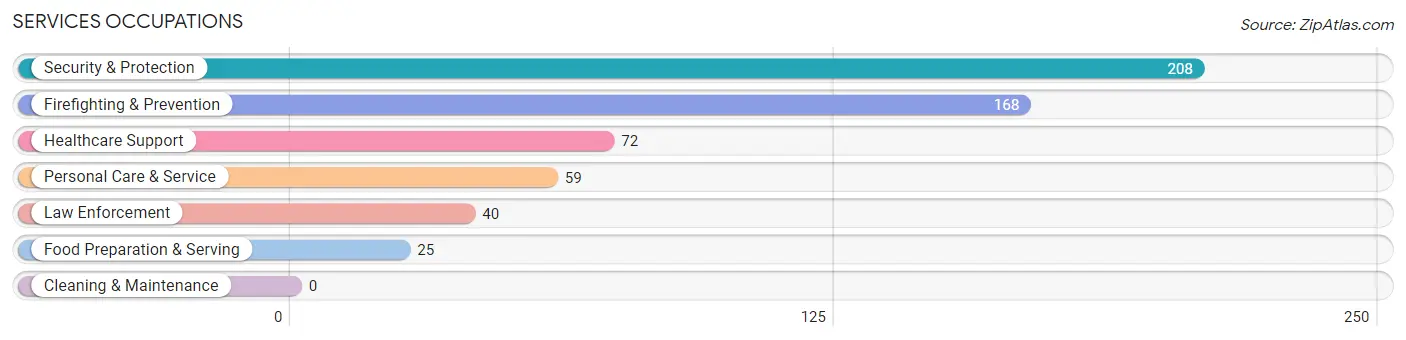
Services Occupations
The most common Services occupations in Argo are Security & Protection (208 | 8.5%), Firefighting & Prevention (168 | 6.9%), Healthcare Support (72 | 2.9%), Personal Care & Service (59 | 2.4%), and Law Enforcement (40 | 1.6%).
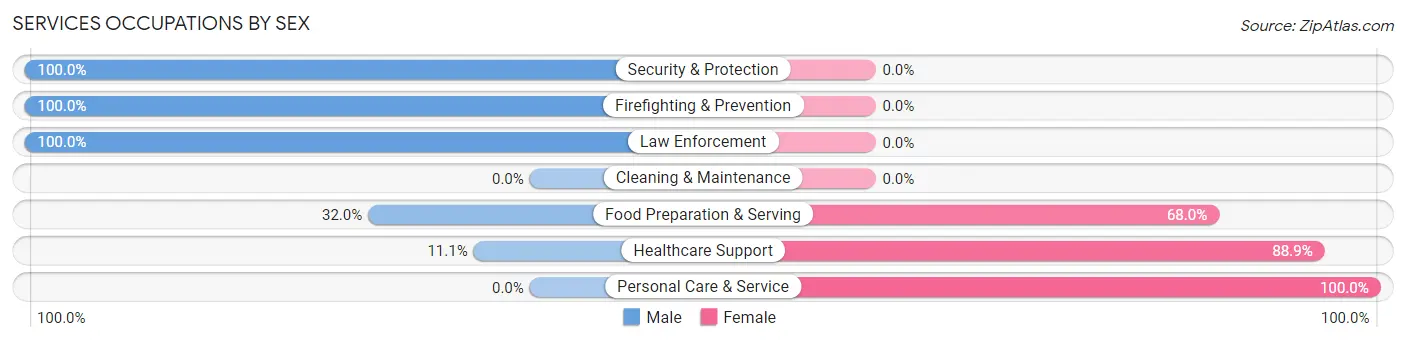
Services Occupations by Sex
Within the Services occupations in Argo, the most male-oriented occupations are Security & Protection (100.0%), Firefighting & Prevention (100.0%), and Law Enforcement (100.0%), while the most female-oriented occupations are Personal Care & Service (100.0%), Healthcare Support (88.9%), and Food Preparation & Serving (68.0%).
| Occupation | Male | Female |
| Healthcare Support | 8 (11.1%) | 64 (88.9%) |
| Security & Protection | 208 (100.0%) | 0 (0.0%) |
| Firefighting & Prevention | 168 (100.0%) | 0 (0.0%) |
| Law Enforcement | 40 (100.0%) | 0 (0.0%) |
| Food Preparation & Serving | 8 (32.0%) | 17 (68.0%) |
| Cleaning & Maintenance | 0 (0.0%) | 0 (0.0%) |
| Personal Care & Service | 0 (0.0%) | 59 (100.0%) |
| Total (Category) | 224 (61.5%) | 140 (38.5%) |
| Total (Overall) | 1,445 (59.2%) | 996 (40.8%) |
Sales and Office Occupations
The most common Sales and Office occupations in Argo are Office & Administration (441 | 18.1%), and Sales & Related (169 | 6.9%).
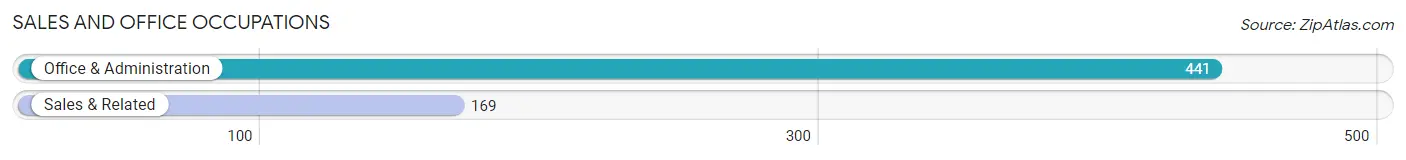
Sales and Office Occupations by Sex

| Occupation | Male | Female |
| Sales & Related | 101 (59.8%) | 68 (40.2%) |
| Office & Administration | 132 (29.9%) | 309 (70.1%) |
| Total (Category) | 233 (38.2%) | 377 (61.8%) |
| Total (Overall) | 1,445 (59.2%) | 996 (40.8%) |
Natural Resources, Construction and Maintenance Occupations
The most common Natural Resources, Construction and Maintenance occupations in Argo are Installation, Maintenance & Repair (247 | 10.1%), and Construction & Extraction (143 | 5.9%).
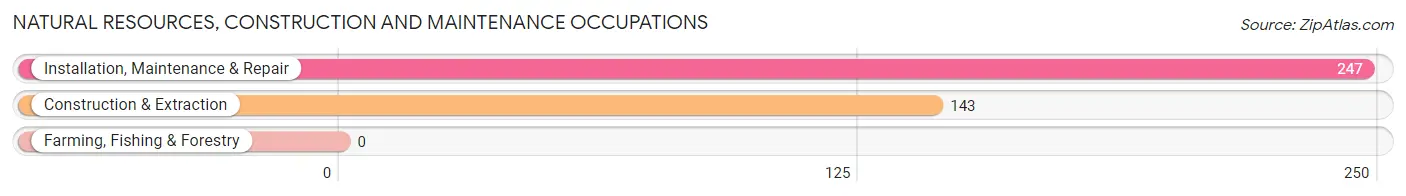
Natural Resources, Construction and Maintenance Occupations by Sex
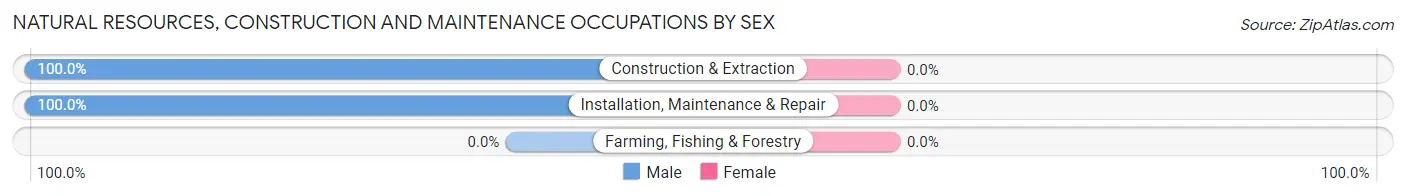
| Occupation | Male | Female |
| Farming, Fishing & Forestry | 0 (0.0%) | 0 (0.0%) |
| Construction & Extraction | 143 (100.0%) | 0 (0.0%) |
| Installation, Maintenance & Repair | 247 (100.0%) | 0 (0.0%) |
| Total (Category) | 390 (100.0%) | 0 (0.0%) |
| Total (Overall) | 1,445 (59.2%) | 996 (40.8%) |
Production, Transportation and Moving Occupations
The most common Production, Transportation and Moving occupations in Argo are Transportation (140 | 5.7%), Production (124 | 5.1%), and Material Moving (55 | 2.2%).
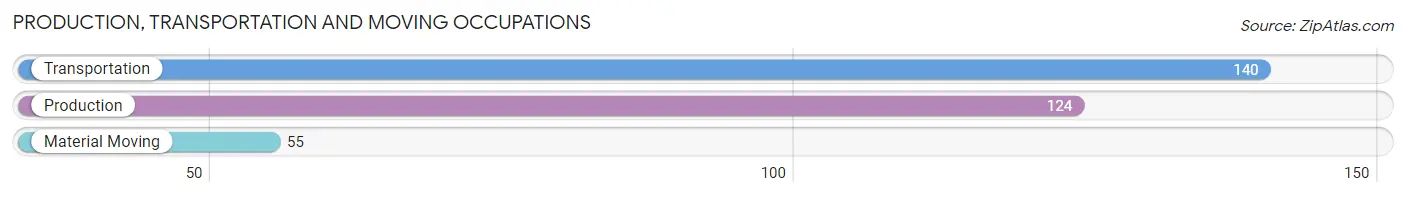
Production, Transportation and Moving Occupations by Sex
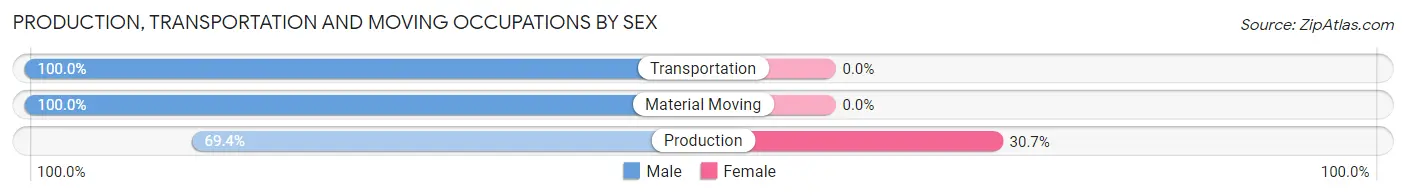
| Occupation | Male | Female |
| Production | 86 (69.4%) | 38 (30.6%) |
| Transportation | 140 (100.0%) | 0 (0.0%) |
| Material Moving | 55 (100.0%) | 0 (0.0%) |
| Total (Category) | 281 (88.1%) | 38 (11.9%) |
| Total (Overall) | 1,445 (59.2%) | 996 (40.8%) |
Employment Industries by Sex in Argo
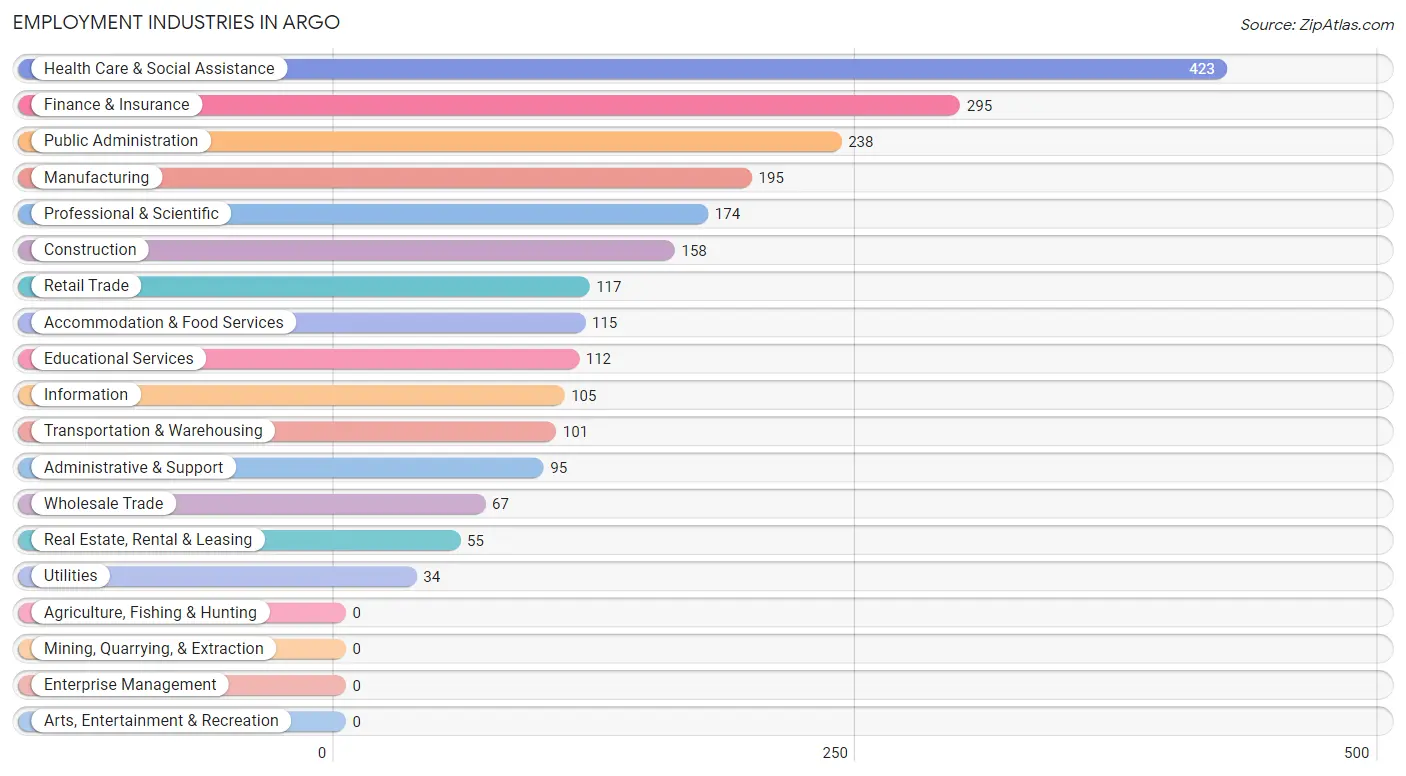
Employment Industries in Argo
The major employment industries in Argo include Health Care & Social Assistance (423 | 17.3%), Finance & Insurance (295 | 12.1%), Public Administration (238 | 9.8%), Manufacturing (195 | 8.0%), and Professional & Scientific (174 | 7.1%).
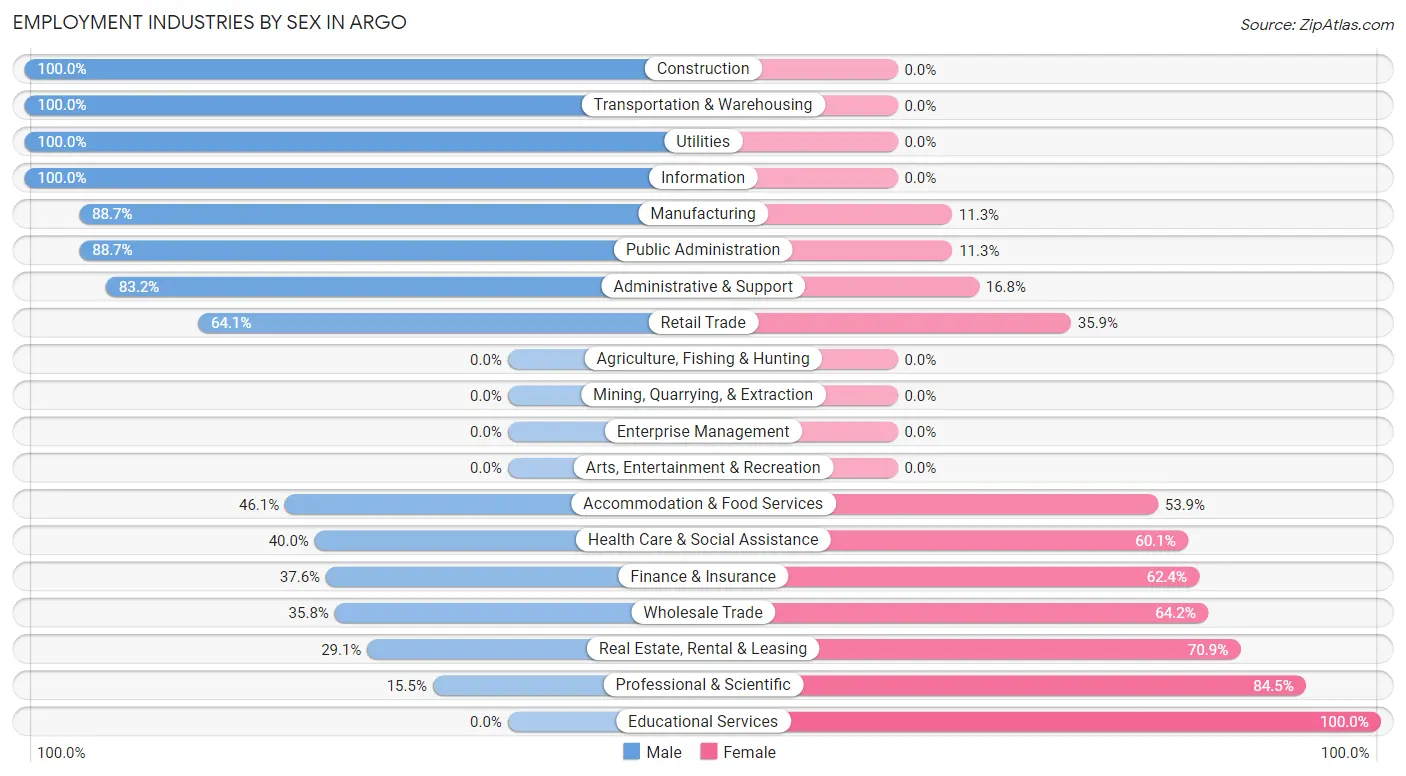
Employment Industries by Sex in Argo
The Argo industries that see more men than women are Construction (100.0%), Transportation & Warehousing (100.0%), and Utilities (100.0%), whereas the industries that tend to have a higher number of women are Educational Services (100.0%), Professional & Scientific (84.5%), and Real Estate, Rental & Leasing (70.9%).
| Industry | Male | Female |
| Agriculture, Fishing & Hunting | 0 (0.0%) | 0 (0.0%) |
| Mining, Quarrying, & Extraction | 0 (0.0%) | 0 (0.0%) |
| Construction | 158 (100.0%) | 0 (0.0%) |
| Manufacturing | 173 (88.7%) | 22 (11.3%) |
| Wholesale Trade | 24 (35.8%) | 43 (64.2%) |
| Retail Trade | 75 (64.1%) | 42 (35.9%) |
| Transportation & Warehousing | 101 (100.0%) | 0 (0.0%) |
| Utilities | 34 (100.0%) | 0 (0.0%) |
| Information | 105 (100.0%) | 0 (0.0%) |
| Finance & Insurance | 111 (37.6%) | 184 (62.4%) |
| Real Estate, Rental & Leasing | 16 (29.1%) | 39 (70.9%) |
| Professional & Scientific | 27 (15.5%) | 147 (84.5%) |
| Enterprise Management | 0 (0.0%) | 0 (0.0%) |
| Administrative & Support | 79 (83.2%) | 16 (16.8%) |
| Educational Services | 0 (0.0%) | 112 (100.0%) |
| Health Care & Social Assistance | 169 (40.0%) | 254 (60.1%) |
| Arts, Entertainment & Recreation | 0 (0.0%) | 0 (0.0%) |
| Accommodation & Food Services | 53 (46.1%) | 62 (53.9%) |
| Public Administration | 211 (88.7%) | 27 (11.3%) |
| Total | 1,445 (59.2%) | 996 (40.8%) |
Education in Argo
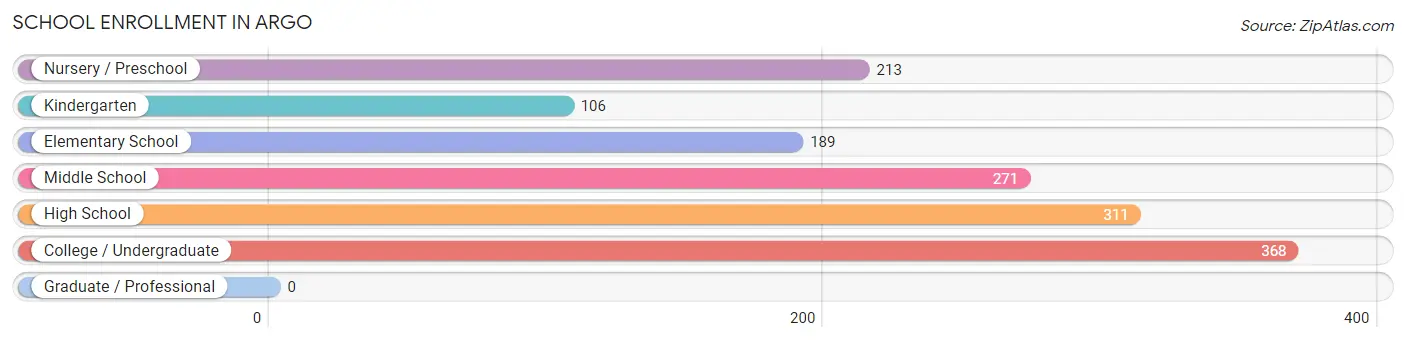
School Enrollment in Argo
The most common levels of schooling among the 1,458 students in Argo are college / undergraduate (368 | 25.2%), high school (311 | 21.3%), and middle school (271 | 18.6%).
| School Level | # Students | % Students |
| Nursery / Preschool | 213 | 14.6% |
| Kindergarten | 106 | 7.3% |
| Elementary School | 189 | 13.0% |
| Middle School | 271 | 18.6% |
| High School | 311 | 21.3% |
| College / Undergraduate | 368 | 25.2% |
| Graduate / Professional | 0 | 0.0% |
| Total | 1,458 | 100.0% |
School Enrollment by Age by Funding Source in Argo
Out of a total of 1,458 students who are enrolled in schools in Argo, 112 (7.7%) attend a private institution, while the remaining 1,346 (92.3%) are enrolled in public schools. The age group of 35 years and over has the highest likelihood of being enrolled in private schools, with 16 (100.0% in the age bracket) enrolled. Conversely, the age group of 10 to 14 year olds has the lowest likelihood of being enrolled in a private school, with 341 (100.0% in the age bracket) attending a public institution.
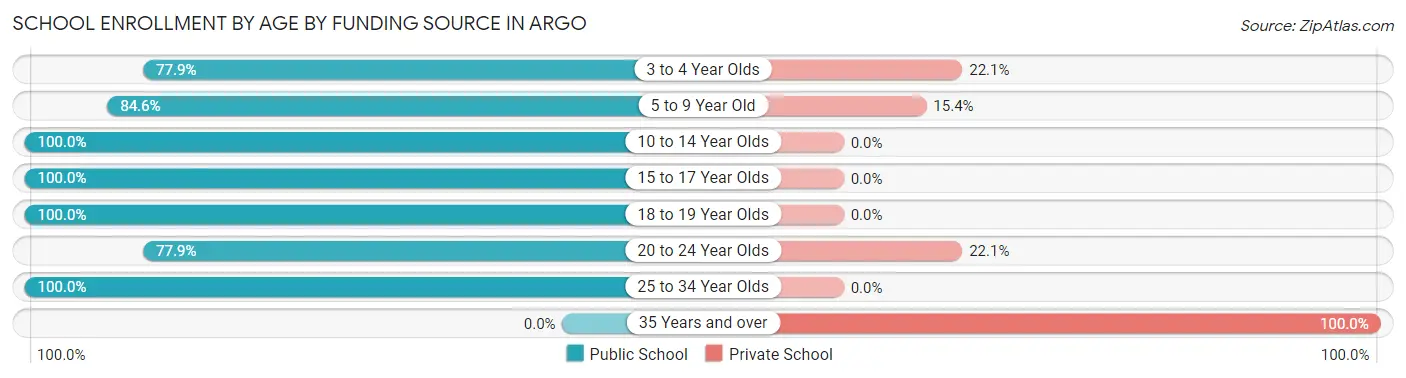
| Age Bracket | Public School | Private School |
| 3 to 4 Year Olds | 134 (77.9%) | 38 (22.1%) |
| 5 to 9 Year Old | 225 (84.6%) | 41 (15.4%) |
| 10 to 14 Year Olds | 341 (100.0%) | 0 (0.0%) |
| 15 to 17 Year Olds | 245 (100.0%) | 0 (0.0%) |
| 18 to 19 Year Olds | 83 (100.0%) | 0 (0.0%) |
| 20 to 24 Year Olds | 60 (77.9%) | 17 (22.1%) |
| 25 to 34 Year Olds | 258 (100.0%) | 0 (0.0%) |
| 35 Years and over | 0 (0.0%) | 16 (100.0%) |
| Total | 1,346 (92.3%) | 112 (7.7%) |
Educational Attainment by Field of Study in Argo
Education (168 | 23.1%), business (167 | 23.0%), science & technology (127 | 17.5%), bio, nature & agricultural (49 | 6.7%), and arts & humanities (49 | 6.7%) are the most common fields of study among 727 individuals in Argo who have obtained a bachelor's degree or higher.
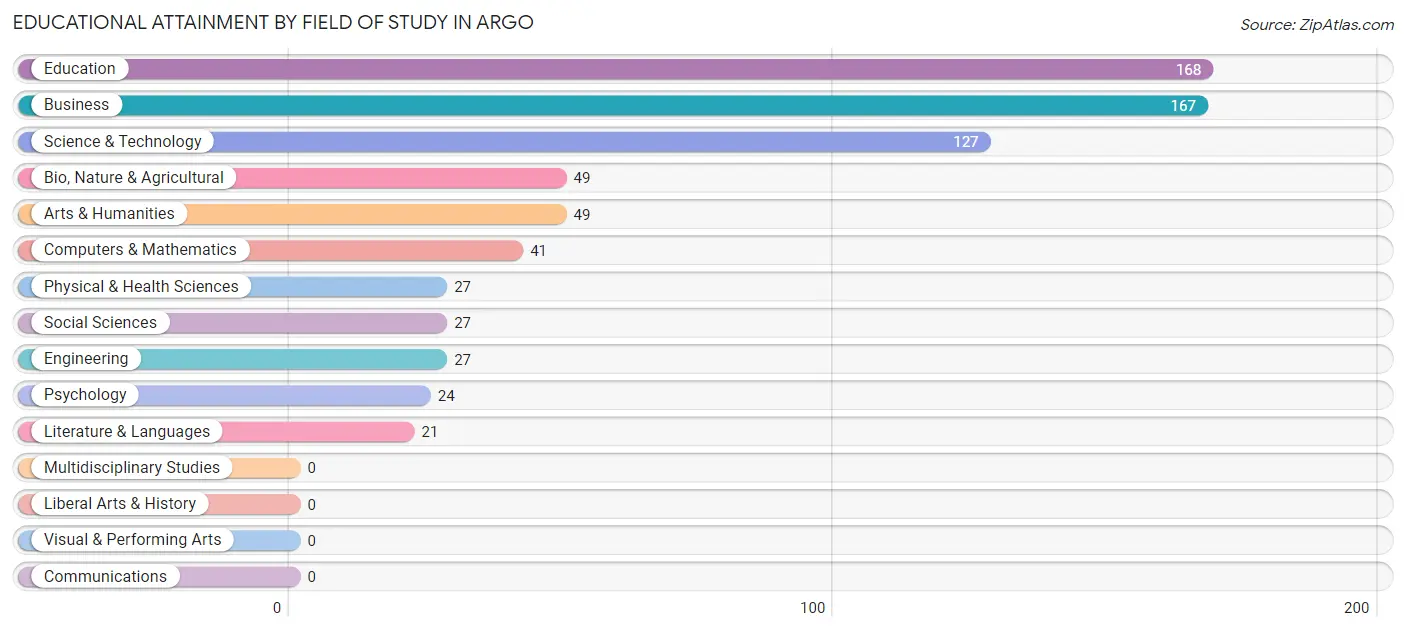
| Field of Study | # Graduates | % Graduates |
| Computers & Mathematics | 41 | 5.6% |
| Bio, Nature & Agricultural | 49 | 6.7% |
| Physical & Health Sciences | 27 | 3.7% |
| Psychology | 24 | 3.3% |
| Social Sciences | 27 | 3.7% |
| Engineering | 27 | 3.7% |
| Multidisciplinary Studies | 0 | 0.0% |
| Science & Technology | 127 | 17.5% |
| Business | 167 | 23.0% |
| Education | 168 | 23.1% |
| Literature & Languages | 21 | 2.9% |
| Liberal Arts & History | 0 | 0.0% |
| Visual & Performing Arts | 0 | 0.0% |
| Communications | 0 | 0.0% |
| Arts & Humanities | 49 | 6.7% |
| Total | 727 | 100.0% |
Transportation & Commute in Argo
Vehicle Availability by Sex in Argo
The most prevalent vehicle ownership categories in Argo are males with 2 vehicles (698, accounting for 48.3%) and females with 2 vehicles (485, making up 70.1%).
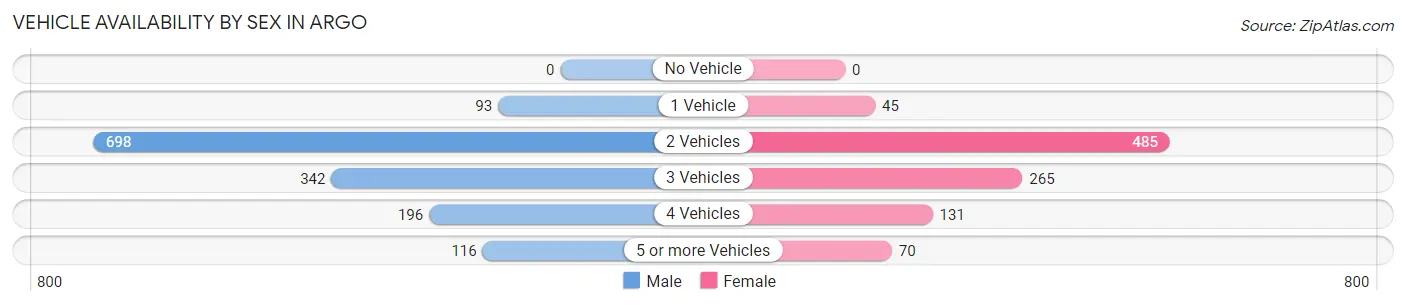
| Vehicles Available | Male | Female |
| No Vehicle | 0 (0.0%) | 0 (0.0%) |
| 1 Vehicle | 93 (6.4%) | 45 (4.5%) |
| 2 Vehicles | 698 (48.3%) | 485 (48.7%) |
| 3 Vehicles | 342 (23.7%) | 265 (26.6%) |
| 4 Vehicles | 196 (13.6%) | 131 (13.2%) |
| 5 or more Vehicles | 116 (8.0%) | 70 (7.0%) |
| Total | 1,445 (100.0%) | 996 (100.0%) |
Commute Time in Argo
The most frequently occuring commute durations in Argo are 45 to 59 minutes (654 commuters, 28.5%), 30 to 34 minutes (395 commuters, 17.2%), and 10 to 14 minutes (250 commuters, 10.9%).
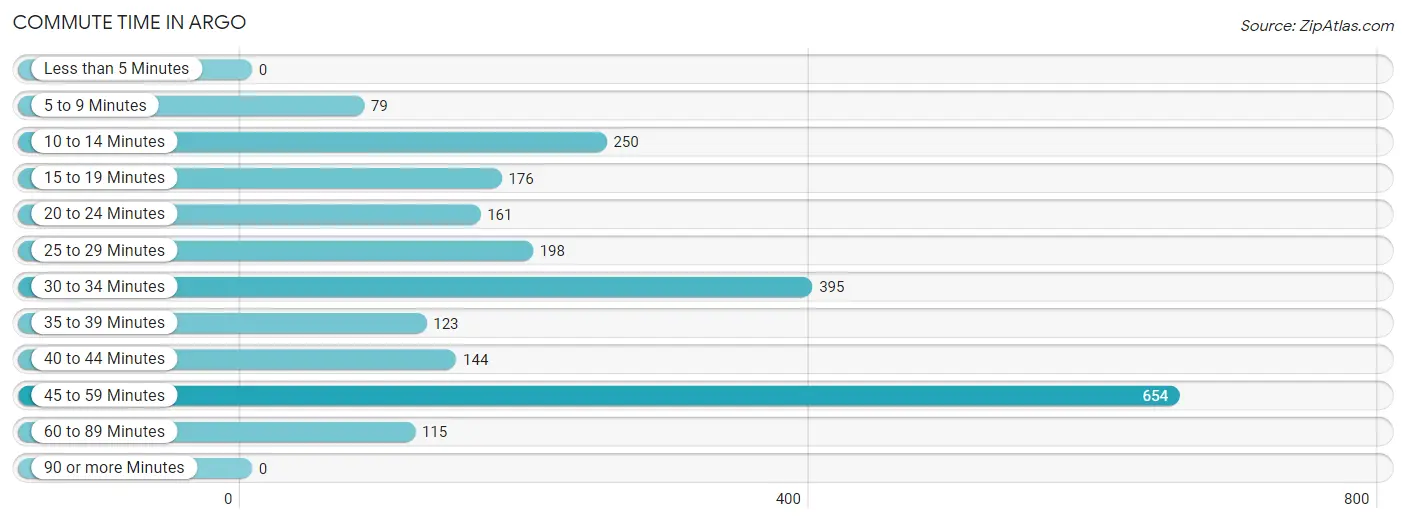
| Commute Time | # Commuters | % Commuters |
| Less than 5 Minutes | 0 | 0.0% |
| 5 to 9 Minutes | 79 | 3.4% |
| 10 to 14 Minutes | 250 | 10.9% |
| 15 to 19 Minutes | 176 | 7.7% |
| 20 to 24 Minutes | 161 | 7.0% |
| 25 to 29 Minutes | 198 | 8.6% |
| 30 to 34 Minutes | 395 | 17.2% |
| 35 to 39 Minutes | 123 | 5.4% |
| 40 to 44 Minutes | 144 | 6.3% |
| 45 to 59 Minutes | 654 | 28.5% |
| 60 to 89 Minutes | 115 | 5.0% |
| 90 or more Minutes | 0 | 0.0% |
Commute Time by Sex in Argo
The most common commute times in Argo are 45 to 59 minutes (350 commuters, 25.3%) for males and 45 to 59 minutes (304 commuters, 33.3%) for females.
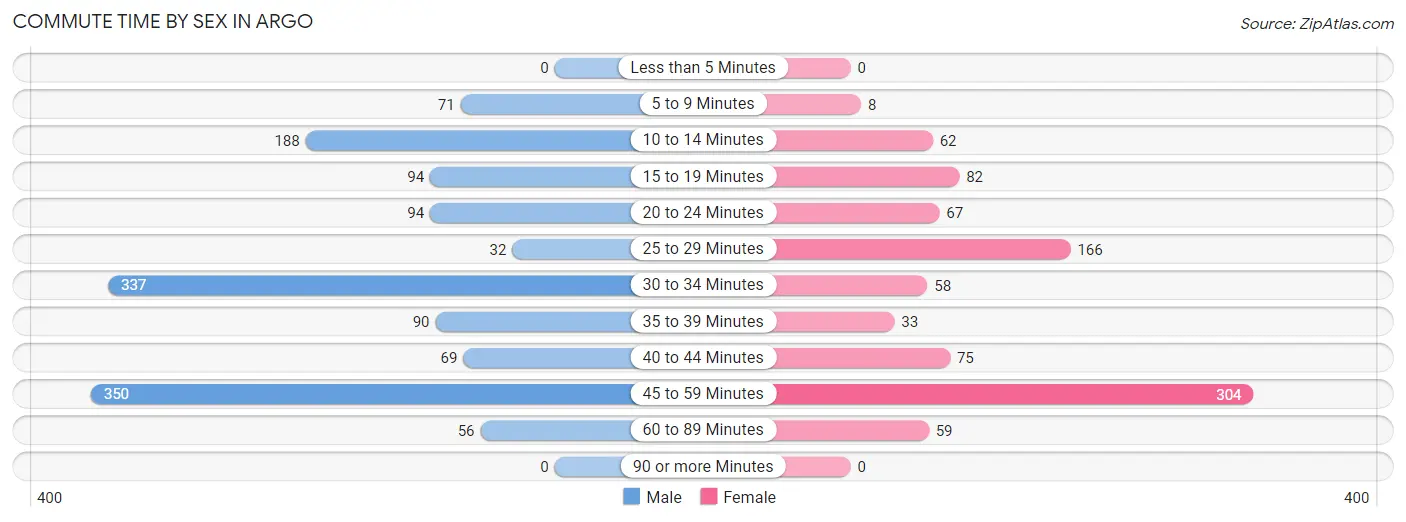
| Commute Time | Male | Female |
| Less than 5 Minutes | 0 (0.0%) | 0 (0.0%) |
| 5 to 9 Minutes | 71 (5.1%) | 8 (0.9%) |
| 10 to 14 Minutes | 188 (13.6%) | 62 (6.8%) |
| 15 to 19 Minutes | 94 (6.8%) | 82 (9.0%) |
| 20 to 24 Minutes | 94 (6.8%) | 67 (7.3%) |
| 25 to 29 Minutes | 32 (2.3%) | 166 (18.2%) |
| 30 to 34 Minutes | 337 (24.4%) | 58 (6.4%) |
| 35 to 39 Minutes | 90 (6.5%) | 33 (3.6%) |
| 40 to 44 Minutes | 69 (5.0%) | 75 (8.2%) |
| 45 to 59 Minutes | 350 (25.3%) | 304 (33.3%) |
| 60 to 89 Minutes | 56 (4.1%) | 59 (6.5%) |
| 90 or more Minutes | 0 (0.0%) | 0 (0.0%) |
Time of Departure to Work by Sex in Argo
The most frequent times of departure to work in Argo are 6:30 AM to 6:59 AM (264, 19.1%) for males and 7:30 AM to 7:59 AM (182, 19.9%) for females.
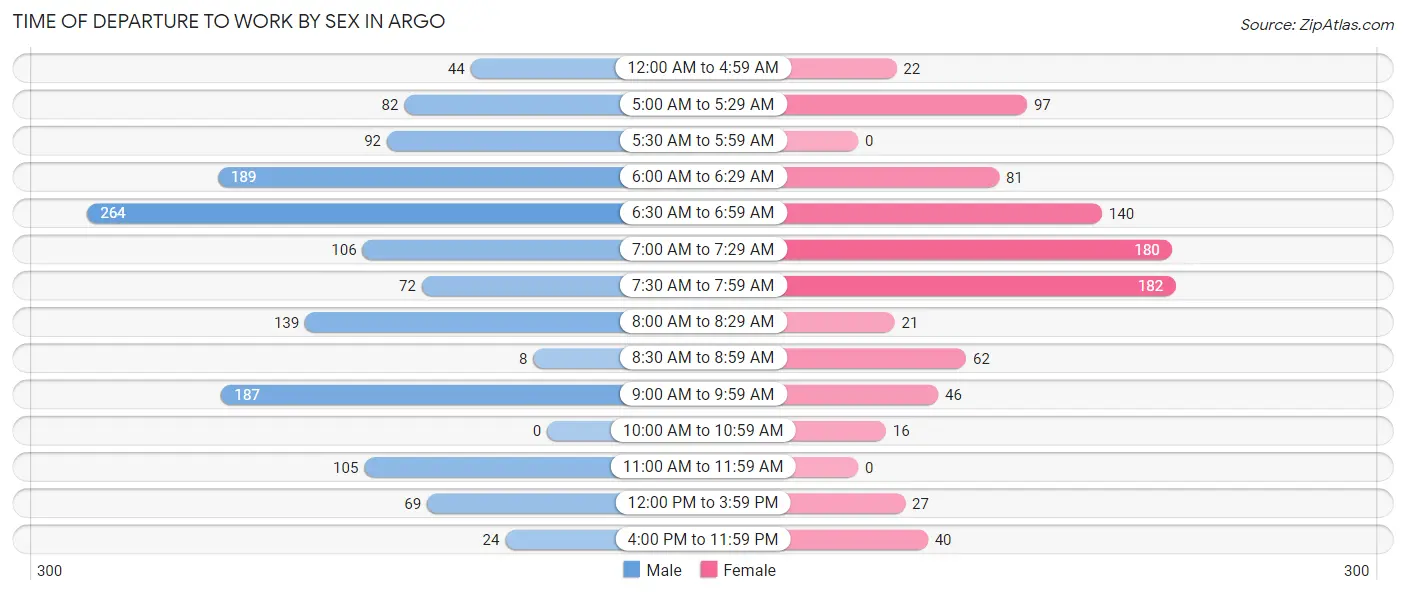
| Time of Departure | Male | Female |
| 12:00 AM to 4:59 AM | 44 (3.2%) | 22 (2.4%) |
| 5:00 AM to 5:29 AM | 82 (5.9%) | 97 (10.6%) |
| 5:30 AM to 5:59 AM | 92 (6.7%) | 0 (0.0%) |
| 6:00 AM to 6:29 AM | 189 (13.7%) | 81 (8.9%) |
| 6:30 AM to 6:59 AM | 264 (19.1%) | 140 (15.3%) |
| 7:00 AM to 7:29 AM | 106 (7.7%) | 180 (19.7%) |
| 7:30 AM to 7:59 AM | 72 (5.2%) | 182 (19.9%) |
| 8:00 AM to 8:29 AM | 139 (10.1%) | 21 (2.3%) |
| 8:30 AM to 8:59 AM | 8 (0.6%) | 62 (6.8%) |
| 9:00 AM to 9:59 AM | 187 (13.5%) | 46 (5.0%) |
| 10:00 AM to 10:59 AM | 0 (0.0%) | 16 (1.8%) |
| 11:00 AM to 11:59 AM | 105 (7.6%) | 0 (0.0%) |
| 12:00 PM to 3:59 PM | 69 (5.0%) | 27 (2.9%) |
| 4:00 PM to 11:59 PM | 24 (1.7%) | 40 (4.4%) |
| Total | 1,381 (100.0%) | 914 (100.0%) |
Housing Occupancy in Argo
Occupancy by Ownership in Argo
Of the total 1,537 dwellings in Argo, owner-occupied units account for 1,341 (87.3%), while renter-occupied units make up 196 (12.8%).
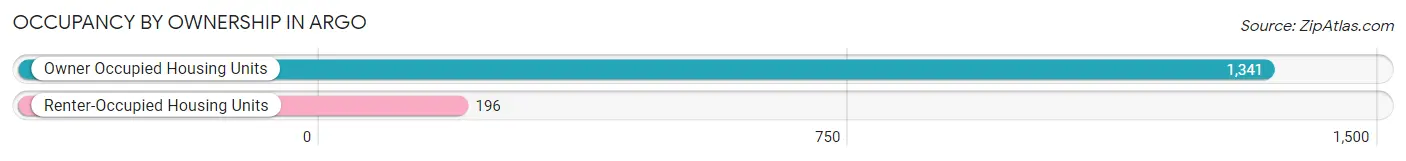
| Occupancy | # Housing Units | % Housing Units |
| Owner Occupied Housing Units | 1,341 | 87.3% |
| Renter-Occupied Housing Units | 196 | 12.8% |
| Total Occupied Housing Units | 1,537 | 100.0% |
Occupancy by Household Size in Argo
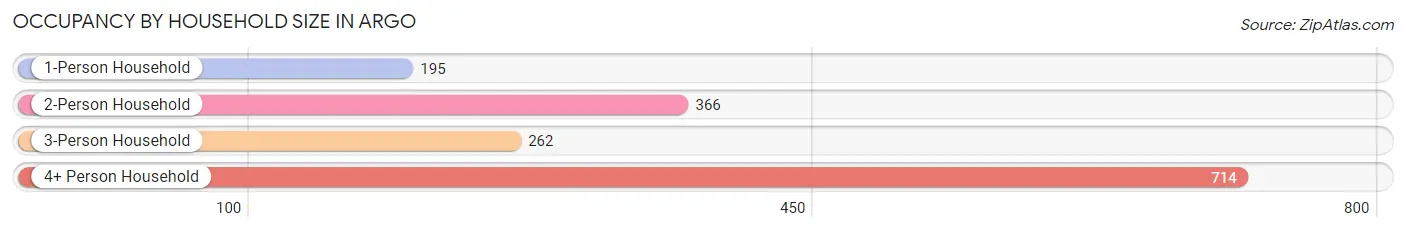
| Household Size | # Housing Units | % Housing Units |
| 1-Person Household | 195 | 12.7% |
| 2-Person Household | 366 | 23.8% |
| 3-Person Household | 262 | 17.1% |
| 4+ Person Household | 714 | 46.5% |
| Total Housing Units | 1,537 | 100.0% |
Occupancy by Ownership by Household Size in Argo
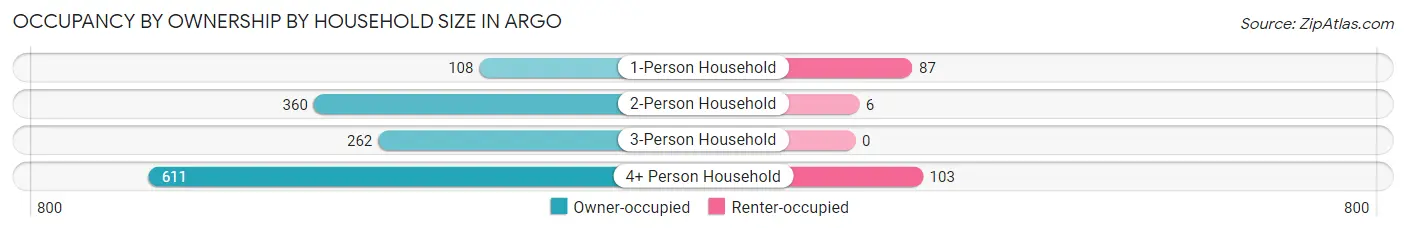
| Household Size | Owner-occupied | Renter-occupied |
| 1-Person Household | 108 (55.4%) | 87 (44.6%) |
| 2-Person Household | 360 (98.4%) | 6 (1.6%) |
| 3-Person Household | 262 (100.0%) | 0 (0.0%) |
| 4+ Person Household | 611 (85.6%) | 103 (14.4%) |
| Total Housing Units | 1,341 (87.3%) | 196 (12.8%) |
Occupancy by Educational Attainment in Argo
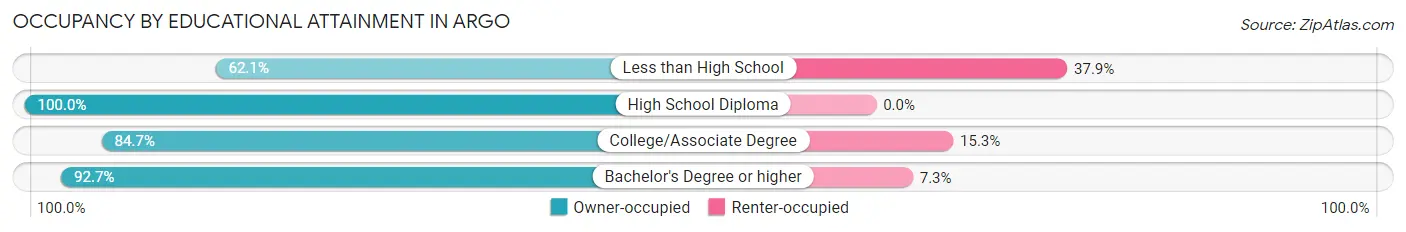
| Household Size | Owner-occupied | Renter-occupied |
| Less than High School | 64 (62.1%) | 39 (37.9%) |
| High School Diploma | 210 (100.0%) | 0 (0.0%) |
| College/Associate Degree | 722 (84.7%) | 130 (15.3%) |
| Bachelor's Degree or higher | 345 (92.7%) | 27 (7.3%) |
Occupancy by Age of Householder in Argo
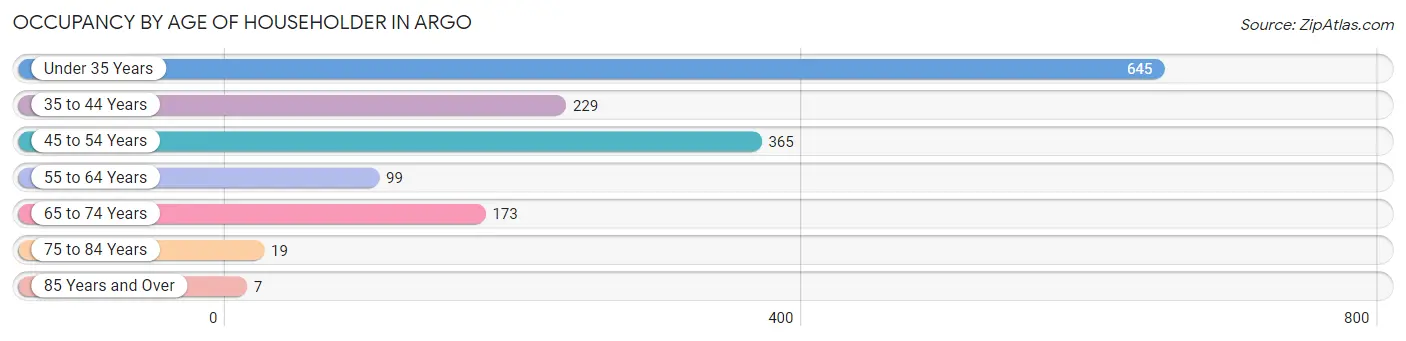
| Age Bracket | # Households | % Households |
| Under 35 Years | 645 | 42.0% |
| 35 to 44 Years | 229 | 14.9% |
| 45 to 54 Years | 365 | 23.7% |
| 55 to 64 Years | 99 | 6.4% |
| 65 to 74 Years | 173 | 11.3% |
| 75 to 84 Years | 19 | 1.2% |
| 85 Years and Over | 7 | 0.5% |
| Total | 1,537 | 100.0% |
Housing Finances in Argo
Median Income by Occupancy in Argo
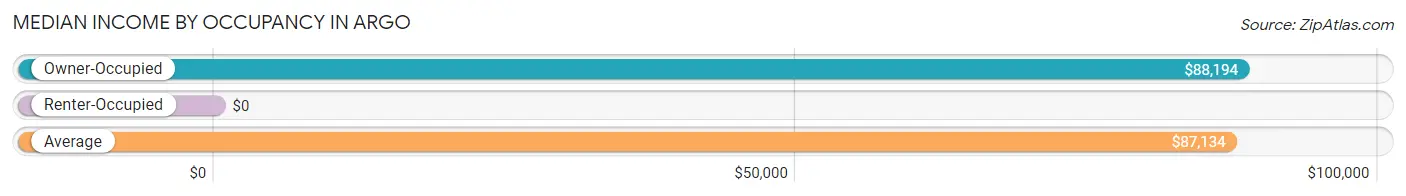
| Occupancy Type | # Households | Median Income |
| Owner-Occupied | 1,341 (87.3%) | $88,194 |
| Renter-Occupied | 196 (12.8%) | $0 |
| Average | 1,537 (100.0%) | $87,134 |
Occupancy by Householder Income Bracket in Argo
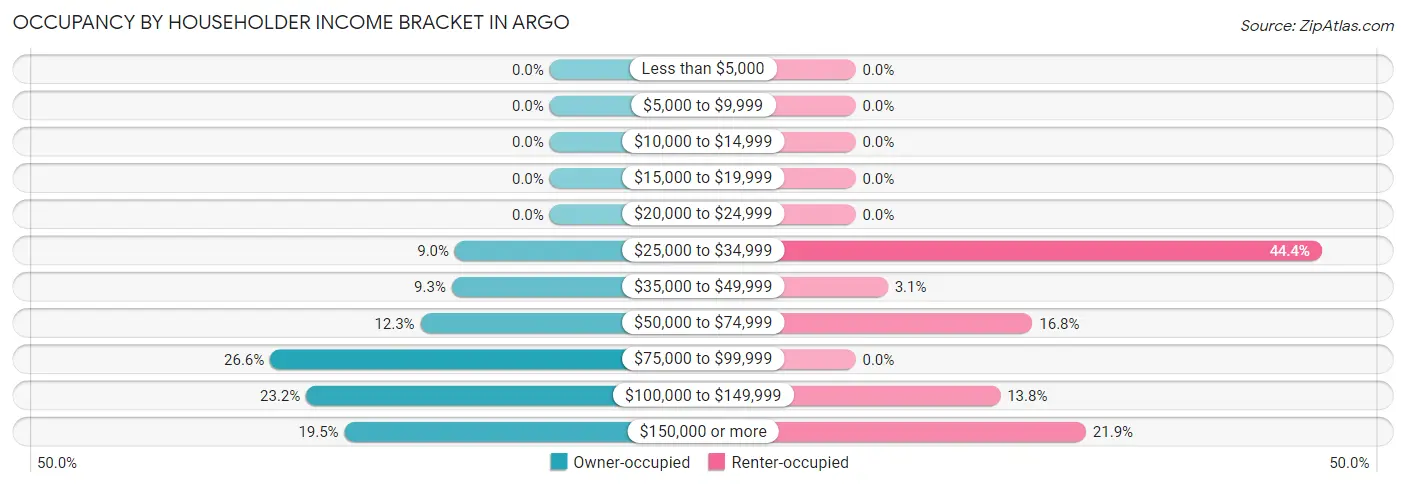
| Income Bracket | Owner-occupied | Renter-occupied |
| Less than $5,000 | 0 (0.0%) | 0 (0.0%) |
| $5,000 to $9,999 | 0 (0.0%) | 0 (0.0%) |
| $10,000 to $14,999 | 0 (0.0%) | 0 (0.0%) |
| $15,000 to $19,999 | 0 (0.0%) | 0 (0.0%) |
| $20,000 to $24,999 | 0 (0.0%) | 0 (0.0%) |
| $25,000 to $34,999 | 121 (9.0%) | 87 (44.4%) |
| $35,000 to $49,999 | 125 (9.3%) | 6 (3.1%) |
| $50,000 to $74,999 | 165 (12.3%) | 33 (16.8%) |
| $75,000 to $99,999 | 357 (26.6%) | 0 (0.0%) |
| $100,000 to $149,999 | 311 (23.2%) | 27 (13.8%) |
| $150,000 or more | 262 (19.5%) | 43 (21.9%) |
| Total | 1,341 (100.0%) | 196 (100.0%) |
Monthly Housing Cost Tiers in Argo
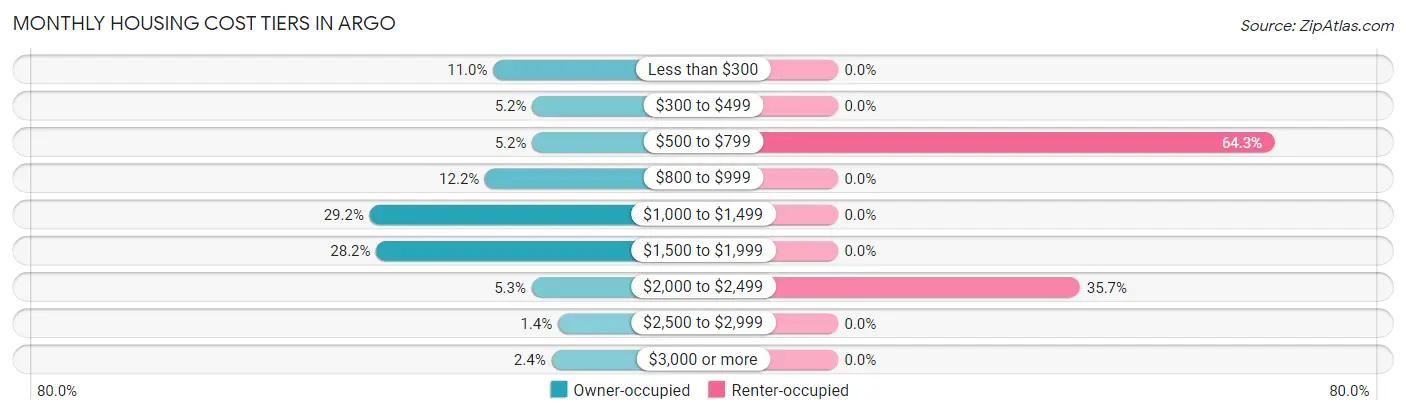
| Monthly Cost | Owner-occupied | Renter-occupied |
| Less than $300 | 147 (11.0%) | 0 (0.0%) |
| $300 to $499 | 70 (5.2%) | 0 (0.0%) |
| $500 to $799 | 70 (5.2%) | 126 (64.3%) |
| $800 to $999 | 163 (12.2%) | 0 (0.0%) |
| $1,000 to $1,499 | 391 (29.2%) | 0 (0.0%) |
| $1,500 to $1,999 | 378 (28.2%) | 0 (0.0%) |
| $2,000 to $2,499 | 71 (5.3%) | 70 (35.7%) |
| $2,500 to $2,999 | 19 (1.4%) | 0 (0.0%) |
| $3,000 or more | 32 (2.4%) | 0 (0.0%) |
| Total | 1,341 (100.0%) | 196 (100.0%) |
Physical Housing Characteristics in Argo
Housing Structures in Argo
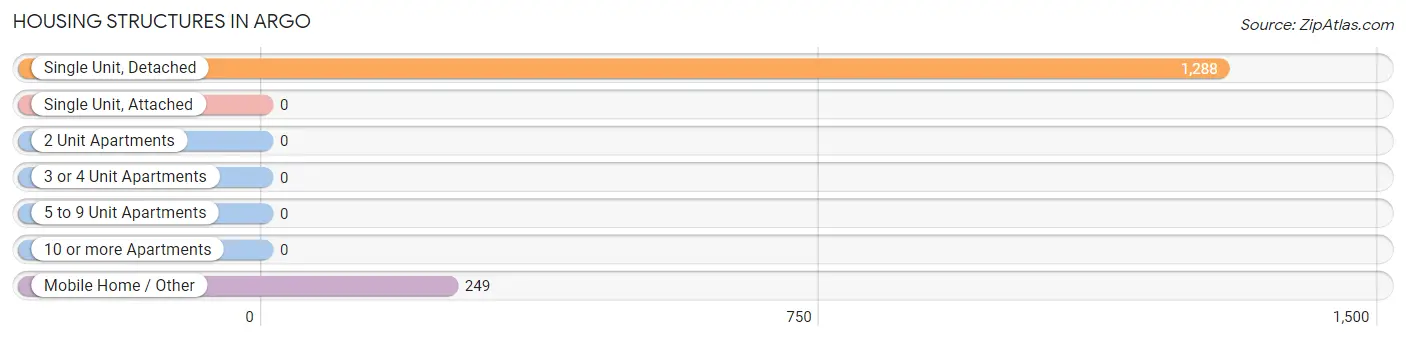
| Structure Type | # Housing Units | % Housing Units |
| Single Unit, Detached | 1,288 | 83.8% |
| Single Unit, Attached | 0 | 0.0% |
| 2 Unit Apartments | 0 | 0.0% |
| 3 or 4 Unit Apartments | 0 | 0.0% |
| 5 to 9 Unit Apartments | 0 | 0.0% |
| 10 or more Apartments | 0 | 0.0% |
| Mobile Home / Other | 249 | 16.2% |
| Total | 1,537 | 100.0% |
Housing Structures by Occupancy in Argo

| Structure Type | Owner-occupied | Renter-occupied |
| Single Unit, Detached | 1,092 (84.8%) | 196 (15.2%) |
| Single Unit, Attached | 0 (0.0%) | 0 (0.0%) |
| 2 Unit Apartments | 0 (0.0%) | 0 (0.0%) |
| 3 or 4 Unit Apartments | 0 (0.0%) | 0 (0.0%) |
| 5 to 9 Unit Apartments | 0 (0.0%) | 0 (0.0%) |
| 10 or more Apartments | 0 (0.0%) | 0 (0.0%) |
| Mobile Home / Other | 249 (100.0%) | 0 (0.0%) |
| Total | 1,341 (87.3%) | 196 (12.8%) |
Housing Structures by Number of Rooms in Argo
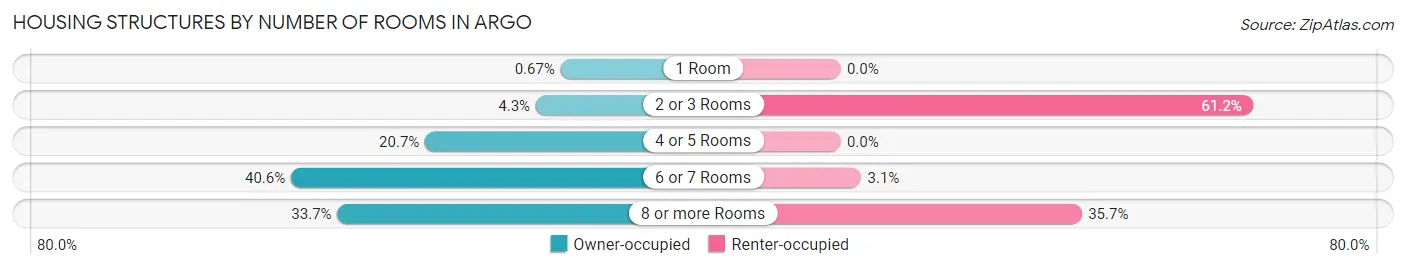
| Number of Rooms | Owner-occupied | Renter-occupied |
| 1 Room | 9 (0.7%) | 0 (0.0%) |
| 2 or 3 Rooms | 58 (4.3%) | 120 (61.2%) |
| 4 or 5 Rooms | 278 (20.7%) | 0 (0.0%) |
| 6 or 7 Rooms | 544 (40.6%) | 6 (3.1%) |
| 8 or more Rooms | 452 (33.7%) | 70 (35.7%) |
| Total | 1,341 (100.0%) | 196 (100.0%) |
Housing Structure by Heating Type in Argo
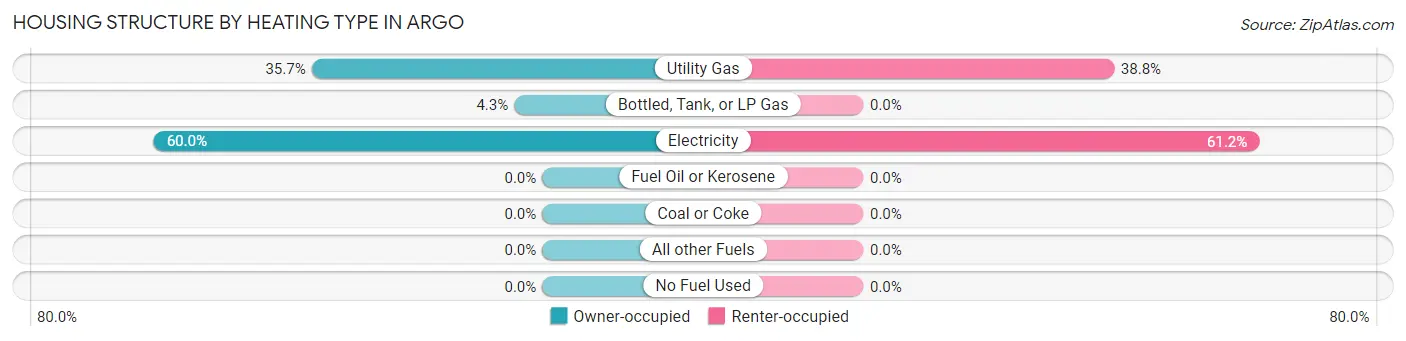
| Heating Type | Owner-occupied | Renter-occupied |
| Utility Gas | 478 (35.6%) | 76 (38.8%) |
| Bottled, Tank, or LP Gas | 58 (4.3%) | 0 (0.0%) |
| Electricity | 805 (60.0%) | 120 (61.2%) |
| Fuel Oil or Kerosene | 0 (0.0%) | 0 (0.0%) |
| Coal or Coke | 0 (0.0%) | 0 (0.0%) |
| All other Fuels | 0 (0.0%) | 0 (0.0%) |
| No Fuel Used | 0 (0.0%) | 0 (0.0%) |
| Total | 1,341 (100.0%) | 196 (100.0%) |
Household Vehicle Usage in Argo
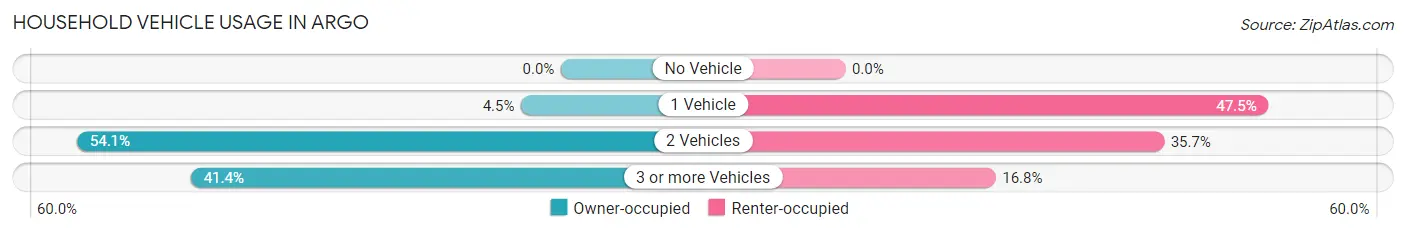
| Vehicles per Household | Owner-occupied | Renter-occupied |
| No Vehicle | 0 (0.0%) | 0 (0.0%) |
| 1 Vehicle | 60 (4.5%) | 93 (47.4%) |
| 2 Vehicles | 726 (54.1%) | 70 (35.7%) |
| 3 or more Vehicles | 555 (41.4%) | 33 (16.8%) |
| Total | 1,341 (100.0%) | 196 (100.0%) |
Real Estate & Mortgages in Argo
Real Estate and Mortgage Overview in Argo
| Characteristic | Without Mortgage | With Mortgage |
| Housing Units | 264 | 1,077 |
| Median Property Value | - | - |
| Median Household Income | $38,224 | $252 |
| Monthly Housing Costs | $295 | $32 |
| Real Estate Taxes | - | - |
Property Value by Mortgage Status in Argo
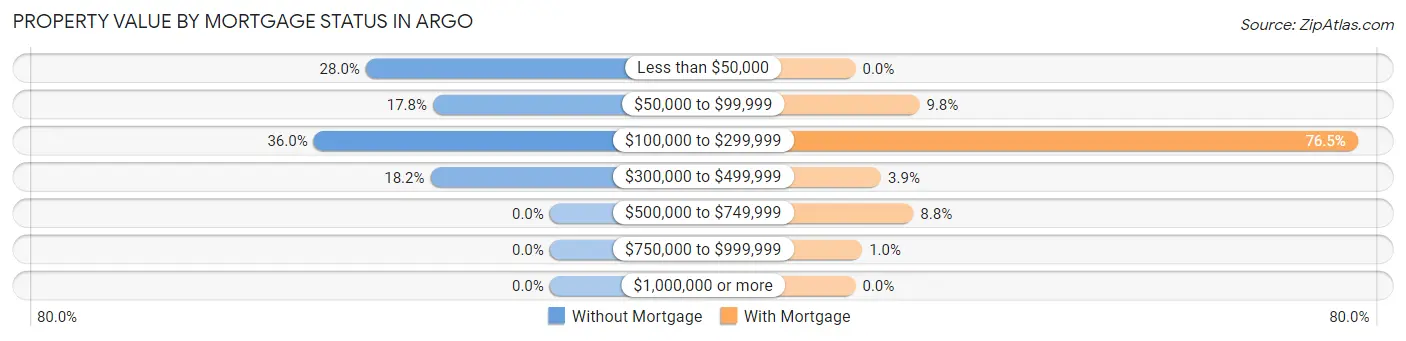
| Property Value | Without Mortgage | With Mortgage |
| Less than $50,000 | 74 (28.0%) | 0 (0.0%) |
| $50,000 to $99,999 | 47 (17.8%) | 105 (9.8%) |
| $100,000 to $299,999 | 95 (36.0%) | 824 (76.5%) |
| $300,000 to $499,999 | 48 (18.2%) | 42 (3.9%) |
| $500,000 to $749,999 | 0 (0.0%) | 95 (8.8%) |
| $750,000 to $999,999 | 0 (0.0%) | 11 (1.0%) |
| $1,000,000 or more | 0 (0.0%) | 0 (0.0%) |
| Total | 264 (100.0%) | 1,077 (100.0%) |
Household Income by Mortgage Status in Argo
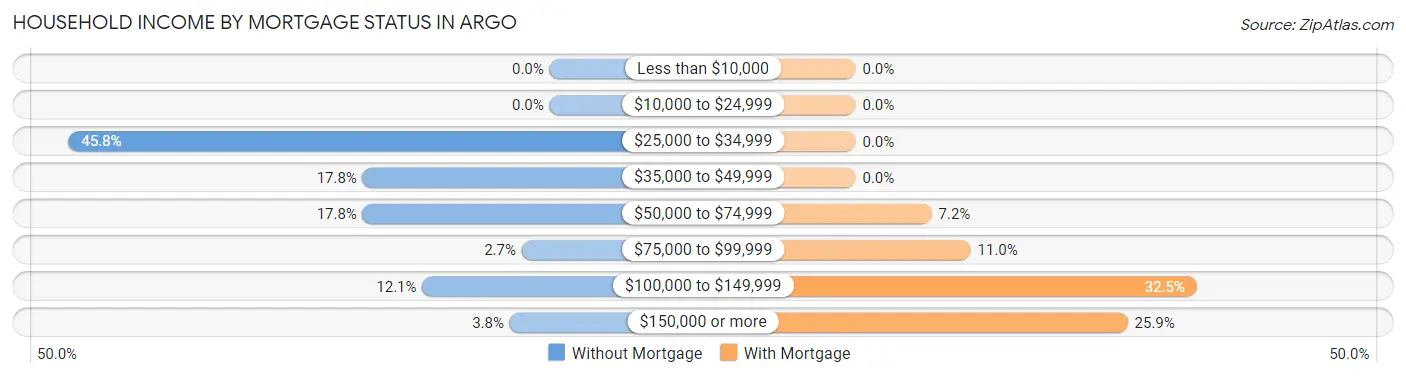
| Household Income | Without Mortgage | With Mortgage |
| Less than $10,000 | 0 (0.0%) | 0 (0.0%) |
| $10,000 to $24,999 | 0 (0.0%) | 0 (0.0%) |
| $25,000 to $34,999 | 121 (45.8%) | 0 (0.0%) |
| $35,000 to $49,999 | 47 (17.8%) | 0 (0.0%) |
| $50,000 to $74,999 | 47 (17.8%) | 78 (7.2%) |
| $75,000 to $99,999 | 7 (2.6%) | 118 (11.0%) |
| $100,000 to $149,999 | 32 (12.1%) | 350 (32.5%) |
| $150,000 or more | 10 (3.8%) | 279 (25.9%) |
| Total | 264 (100.0%) | 1,077 (100.0%) |
Property Value to Household Income Ratio in Argo
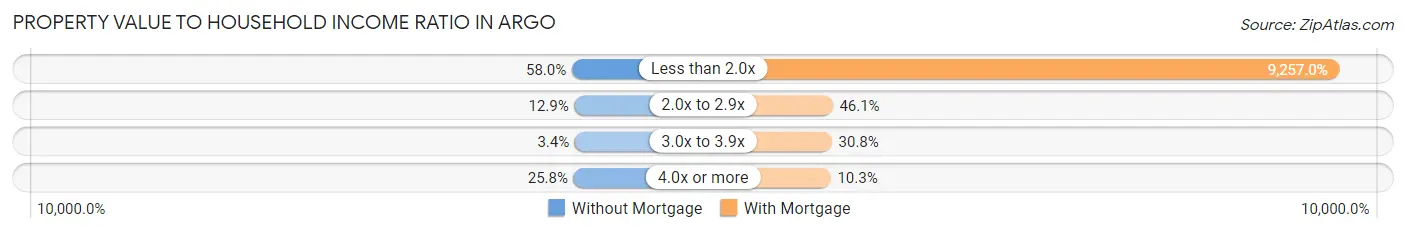
| Value-to-Income Ratio | Without Mortgage | With Mortgage |
| Less than 2.0x | 153 (58.0%) | 99,698 (9,257.0%) |
| 2.0x to 2.9x | 34 (12.9%) | 496 (46.1%) |
| 3.0x to 3.9x | 9 (3.4%) | 332 (30.8%) |
| 4.0x or more | 68 (25.8%) | 111 (10.3%) |
| Total | 264 (100.0%) | 1,077 (100.0%) |
Real Estate Taxes by Mortgage Status in Argo
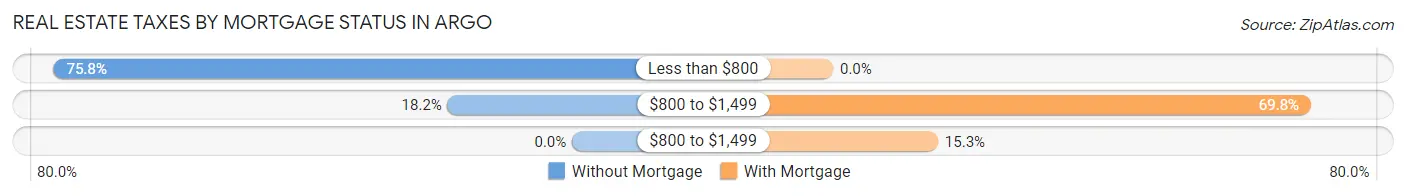
| Property Taxes | Without Mortgage | With Mortgage |
| Less than $800 | 200 (75.8%) | 0 (0.0%) |
| $800 to $1,499 | 48 (18.2%) | 752 (69.8%) |
| $800 to $1,499 | 0 (0.0%) | 165 (15.3%) |
| Total | 264 (100.0%) | 1,077 (100.0%) |
Health & Disability in Argo
Health Insurance Coverage by Age in Argo
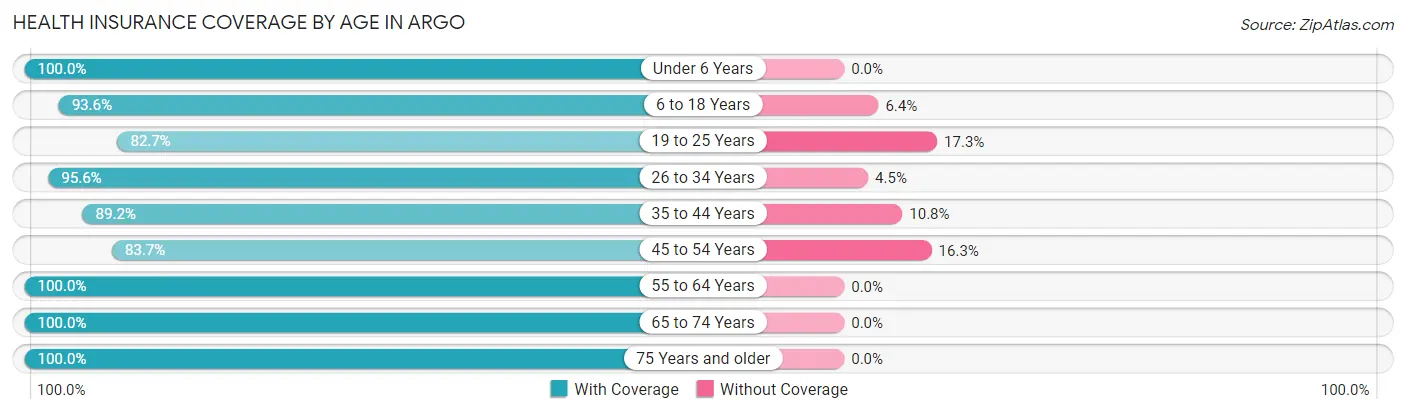
| Age Bracket | With Coverage | Without Coverage |
| Under 6 Years | 604 (100.0%) | 0 (0.0%) |
| 6 to 18 Years | 764 (93.6%) | 52 (6.4%) |
| 19 to 25 Years | 191 (82.7%) | 40 (17.3%) |
| 26 to 34 Years | 1,010 (95.6%) | 47 (4.4%) |
| 35 to 44 Years | 453 (89.2%) | 55 (10.8%) |
| 45 to 54 Years | 519 (83.7%) | 101 (16.3%) |
| 55 to 64 Years | 193 (100.0%) | 0 (0.0%) |
| 65 to 74 Years | 318 (100.0%) | 0 (0.0%) |
| 75 Years and older | 69 (100.0%) | 0 (0.0%) |
| Total | 4,121 (93.3%) | 295 (6.7%) |
Health Insurance Coverage by Citizenship Status in Argo
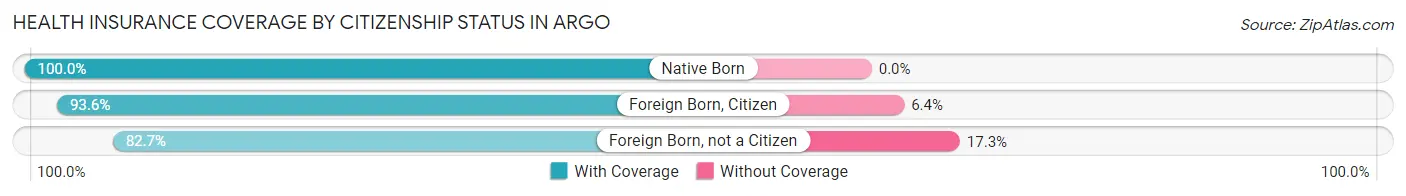
| Citizenship Status | With Coverage | Without Coverage |
| Native Born | 604 (100.0%) | 0 (0.0%) |
| Foreign Born, Citizen | 764 (93.6%) | 52 (6.4%) |
| Foreign Born, not a Citizen | 191 (82.7%) | 40 (17.3%) |
Health Insurance Coverage by Household Income in Argo
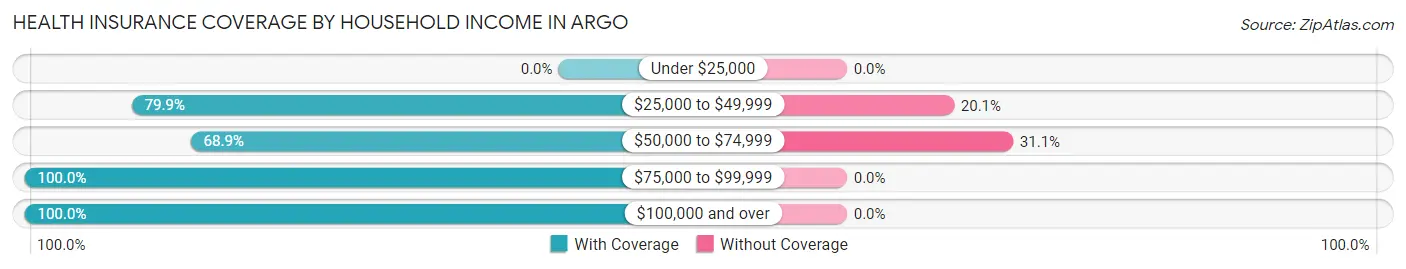
| Household Income | With Coverage | Without Coverage |
| Under $25,000 | 0 (0.0%) | 0 (0.0%) |
| $25,000 to $49,999 | 558 (79.9%) | 140 (20.1%) |
| $50,000 to $74,999 | 343 (68.9%) | 155 (31.1%) |
| $75,000 to $99,999 | 1,036 (100.0%) | 0 (0.0%) |
| $100,000 and over | 2,184 (100.0%) | 0 (0.0%) |
Public vs Private Health Insurance Coverage by Age in Argo
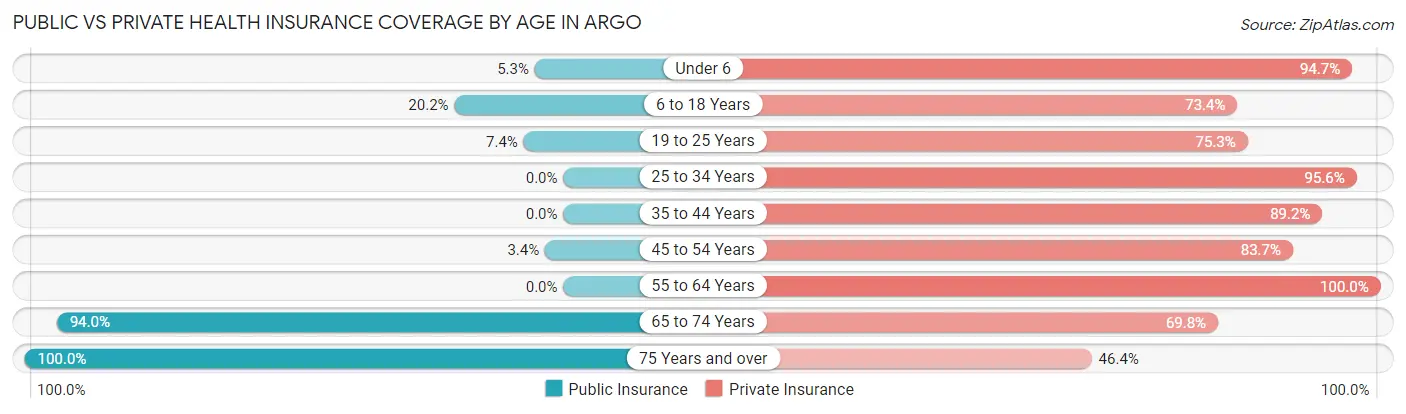
| Age Bracket | Public Insurance | Private Insurance |
| Under 6 | 32 (5.3%) | 572 (94.7%) |
| 6 to 18 Years | 165 (20.2%) | 599 (73.4%) |
| 19 to 25 Years | 17 (7.4%) | 174 (75.3%) |
| 25 to 34 Years | 0 (0.0%) | 1,010 (95.6%) |
| 35 to 44 Years | 0 (0.0%) | 453 (89.2%) |
| 45 to 54 Years | 21 (3.4%) | 519 (83.7%) |
| 55 to 64 Years | 0 (0.0%) | 193 (100.0%) |
| 65 to 74 Years | 299 (94.0%) | 222 (69.8%) |
| 75 Years and over | 69 (100.0%) | 32 (46.4%) |
| Total | 603 (13.7%) | 3,774 (85.5%) |
Disability Status by Sex by Age in Argo
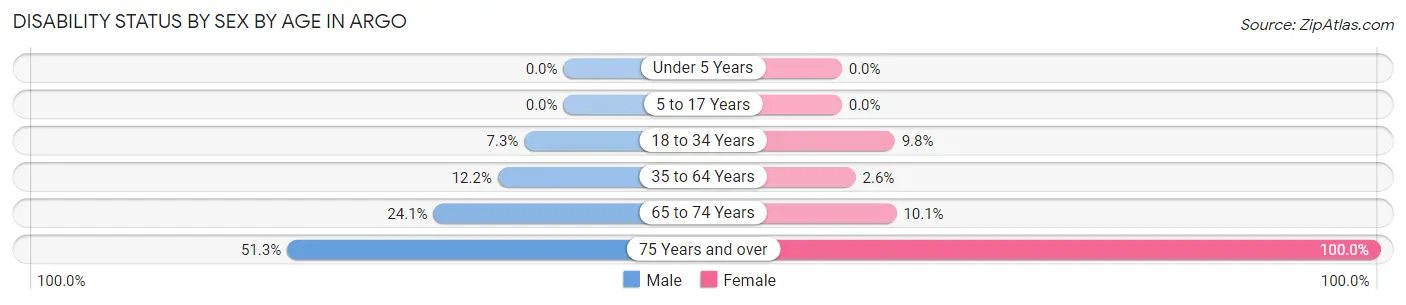
| Age Bracket | Male | Female |
| Under 5 Years | 0 (0.0%) | 0 (0.0%) |
| 5 to 17 Years | 0 (0.0%) | 0 (0.0%) |
| 18 to 34 Years | 58 (7.3%) | 59 (9.8%) |
| 35 to 64 Years | 80 (12.2%) | 17 (2.6%) |
| 65 to 74 Years | 41 (24.1%) | 15 (10.1%) |
| 75 Years and over | 20 (51.3%) | 30 (100.0%) |
Disability Class by Sex by Age in Argo
Disability Class: Hearing Difficulty
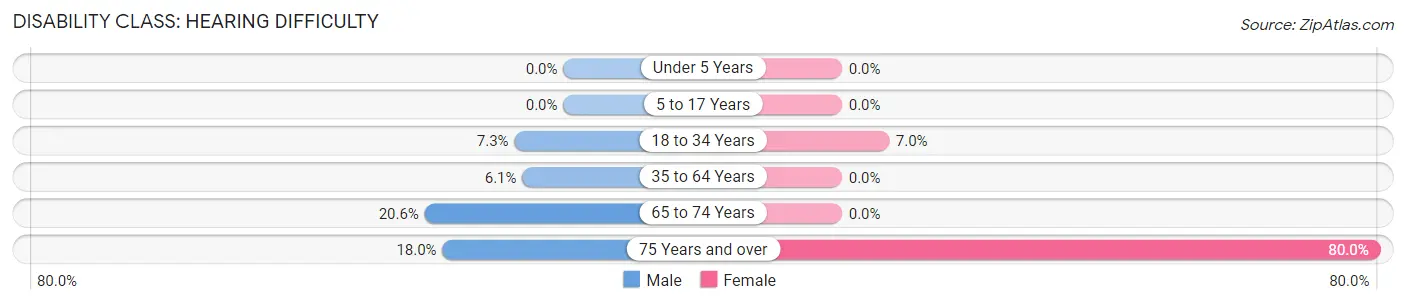
| Age Bracket | Male | Female |
| Under 5 Years | 0 (0.0%) | 0 (0.0%) |
| 5 to 17 Years | 0 (0.0%) | 0 (0.0%) |
| 18 to 34 Years | 58 (7.3%) | 42 (7.0%) |
| 35 to 64 Years | 40 (6.1%) | 0 (0.0%) |
| 65 to 74 Years | 35 (20.6%) | 0 (0.0%) |
| 75 Years and over | 7 (17.9%) | 24 (80.0%) |
Disability Class: Vision Difficulty
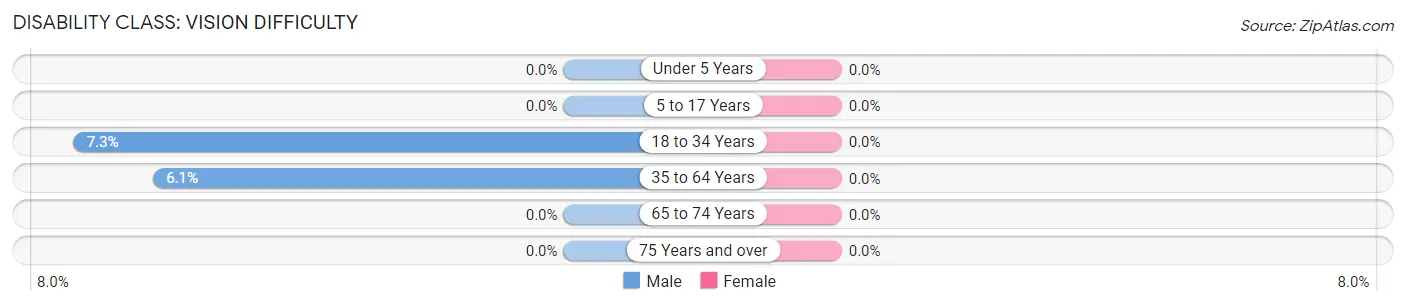
| Age Bracket | Male | Female |
| Under 5 Years | 0 (0.0%) | 0 (0.0%) |
| 5 to 17 Years | 0 (0.0%) | 0 (0.0%) |
| 18 to 34 Years | 58 (7.3%) | 0 (0.0%) |
| 35 to 64 Years | 40 (6.1%) | 0 (0.0%) |
| 65 to 74 Years | 0 (0.0%) | 0 (0.0%) |
| 75 Years and over | 0 (0.0%) | 0 (0.0%) |
Disability Class: Cognitive Difficulty
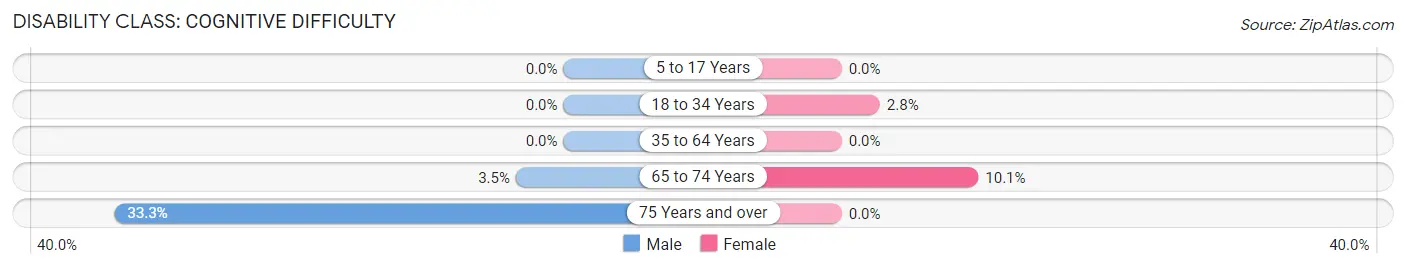
| Age Bracket | Male | Female |
| 5 to 17 Years | 0 (0.0%) | 0 (0.0%) |
| 18 to 34 Years | 0 (0.0%) | 17 (2.8%) |
| 35 to 64 Years | 0 (0.0%) | 0 (0.0%) |
| 65 to 74 Years | 6 (3.5%) | 15 (10.1%) |
| 75 Years and over | 13 (33.3%) | 0 (0.0%) |
Disability Class: Ambulatory Difficulty
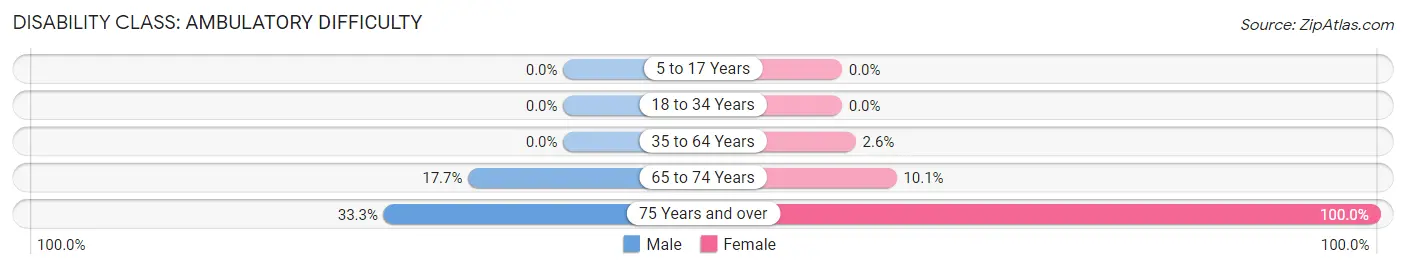
| Age Bracket | Male | Female |
| 5 to 17 Years | 0 (0.0%) | 0 (0.0%) |
| 18 to 34 Years | 0 (0.0%) | 0 (0.0%) |
| 35 to 64 Years | 0 (0.0%) | 17 (2.6%) |
| 65 to 74 Years | 30 (17.6%) | 15 (10.1%) |
| 75 Years and over | 13 (33.3%) | 30 (100.0%) |
Disability Class: Self-Care Difficulty
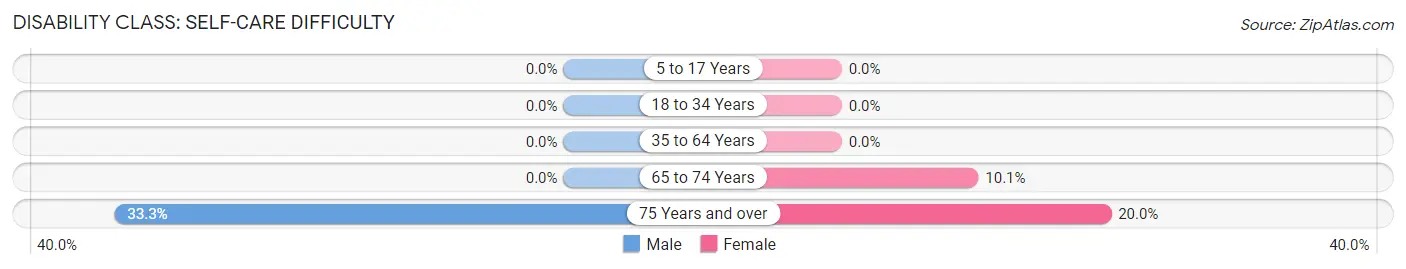
| Age Bracket | Male | Female |
| 5 to 17 Years | 0 (0.0%) | 0 (0.0%) |
| 18 to 34 Years | 0 (0.0%) | 0 (0.0%) |
| 35 to 64 Years | 0 (0.0%) | 0 (0.0%) |
| 65 to 74 Years | 0 (0.0%) | 15 (10.1%) |
| 75 Years and over | 13 (33.3%) | 6 (20.0%) |
Technology Access in Argo
Computing Device Access in Argo
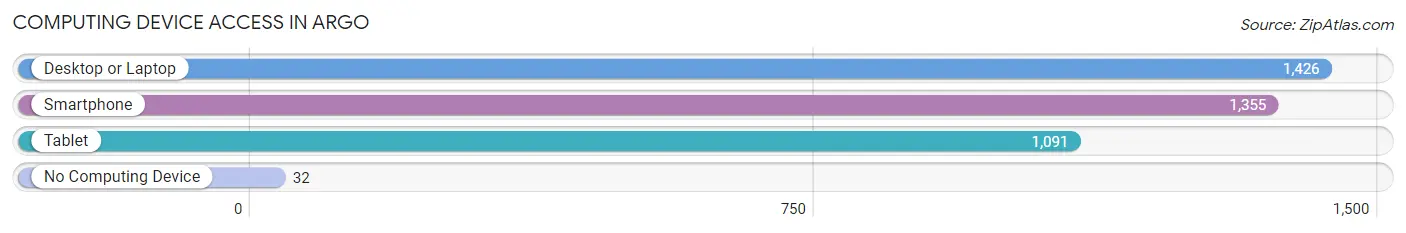
| Device Type | # Households | % Households |
| Desktop or Laptop | 1,426 | 92.8% |
| Smartphone | 1,355 | 88.2% |
| Tablet | 1,091 | 71.0% |
| No Computing Device | 32 | 2.1% |
| Total | 1,537 | 100.0% |
Internet Access in Argo
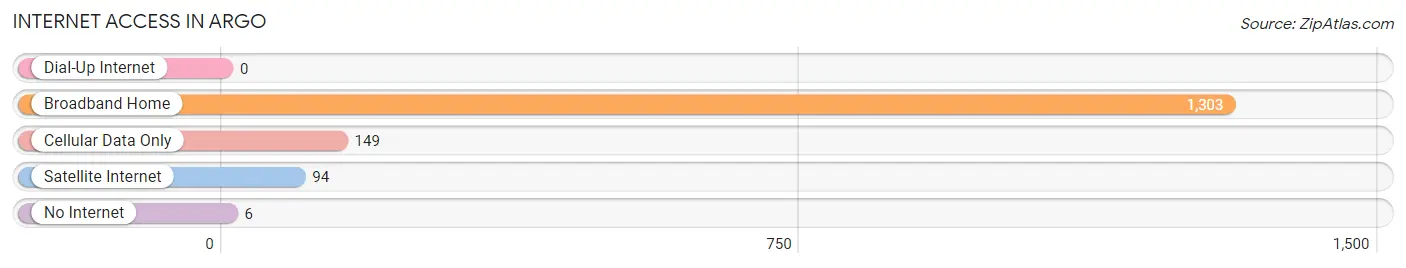
| Internet Type | # Households | % Households |
| Dial-Up Internet | 0 | 0.0% |
| Broadband Home | 1,303 | 84.8% |
| Cellular Data Only | 149 | 9.7% |
| Satellite Internet | 94 | 6.1% |
| No Internet | 6 | 0.4% |
| Total | 1,537 | 100.0% |
Argo Summary
Argo is a small town located in Jefferson County, Alabama. It is situated in the foothills of the Appalachian Mountains, approximately 20 miles northeast of Birmingham. The town was founded in 1887 and incorporated in 1901. As of the 2010 census, the population of Argo was 1,867.
Geography
Argo is located at 33°45'25"N 86°30'45"W (33.7569, -86.5125). It is situated in the foothills of the Appalachian Mountains, approximately 20 miles northeast of Birmingham. The town is located in the Jones Valley, which is part of the larger Appalachian Valley and Ridge region. The terrain is characterized by rolling hills and valleys, with elevations ranging from 500 to 1,000 feet above sea level. The town is situated on the banks of the Locust Fork of the Black Warrior River.
Climate
Argo has a humid subtropical climate, with hot, humid summers and mild winters. The average annual temperature is 64°F, with an average high of 87°F in July and an average low of 41°F in January. The average annual precipitation is 56 inches, with an average of 5.5 inches of snowfall per year.
Demographics
As of the 2010 census, the population of Argo was 1,867. The racial makeup of the town was 94.3% White, 3.2% African American, 0.3% Native American, 0.3% Asian, 0.2% from other races, and 1.7% from two or more races. Hispanic or Latino of any race were 1.2% of the population.
Economy
Argo’s economy is largely based on agriculture and manufacturing. The town is home to several small businesses, including a feed mill, a lumber mill, and a furniture factory. The town is also home to a number of farms, which produce a variety of crops, including corn, soybeans, and cotton.
Argo is also home to several large employers, including the Argo-Cullman Medical Center, the Argo-Cullman Regional Airport, and the Argo-Cullman Industrial Park. The town is also home to several retail stores, restaurants, and other businesses.
Education
Argo is served by the Argo-Cullman City School District. The district operates two elementary schools, one middle school, and one high school. The town is also home to several private schools, including the Argo Christian Academy and the Argo Academy of Arts and Sciences.
Argo is also home to the University of Alabama at Birmingham, which is located approximately 20 miles away in Birmingham. The university offers a variety of undergraduate and graduate degree programs, as well as a number of professional and continuing education programs.
Conclusion
Argo is a small town located in Jefferson County, Alabama. It is situated in the foothills of the Appalachian Mountains, approximately 20 miles northeast of Birmingham. The town was founded in 1887 and incorporated in 1901. As of the 2010 census, the population of Argo was 1,867. The town’s economy is largely based on agriculture and manufacturing, and it is home to several large employers, including the Argo-Cullman Medical Center, the Argo-Cullman Regional Airport, and the Argo-Cullman Industrial Park. The town is served by the Argo-Cullman City School District, and it is also home to the University of Alabama at Birmingham.
Common Questions
What is Per Capita Income in Argo?
Per Capita income in Argo is $35,152.
What is the Median Family Income in Argo?
Median Family Income in Argo is $99,052.
What is the Median Household income in Argo?
Median Household Income in Argo is $87,134.
What is Income or Wage Gap in Argo?
Income or Wage Gap in Argo is 16.8%.
Women in Argo earn 83.2 cents for every dollar earned by a man.
What is Inequality or Gini Index in Argo?
Inequality or Gini Index in Argo is 0.34.
What is the Total Population of Argo?
Total Population of Argo is 4,416.
What is the Total Male Population of Argo?
Total Male Population of Argo is 2,269.
What is the Total Female Population of Argo?
Total Female Population of Argo is 2,147.
What is the Ratio of Males per 100 Females in Argo?
There are 105.68 Males per 100 Females in Argo.
What is the Ratio of Females per 100 Males in Argo?
There are 94.62 Females per 100 Males in Argo.
What is the Median Population Age in Argo?
Median Population Age in Argo is 29.9 Years.
What is the Average Family Size in Argo
Average Family Size in Argo is 3.1 People.
What is the Average Household Size in Argo
Average Household Size in Argo is 2.9 People.
How Large is the Labor Force in Argo?
There are 2,451 People in the Labor Forcein in Argo.
What is the Percentage of People in the Labor Force in Argo?
76.2% of People are in the Labor Force in Argo.
What is the Unemployment Rate in Argo?
Unemployment Rate in Argo is 0.4%.