Midway North, TX Map & Demographics
Midway North Map
Midway North Overview
$17,599
PER CAPITA INCOME
$55,556
AVG FAMILY INCOME
$51,648
AVG HOUSEHOLD INCOME
7.6%
WAGE / INCOME GAP [ % ]
92.4¢/ $1
WAGE / INCOME GAP [ $ ]
0.48
INEQUALITY / GINI INDEX
4,033
TOTAL POPULATION
2,014
MALE POPULATION
2,019
FEMALE POPULATION
99.75
MALES / 100 FEMALES
100.25
FEMALES / 100 MALES
27.5
MEDIAN AGE
4.5
AVG FAMILY SIZE
4.1
AVG HOUSEHOLD SIZE
1,865
LABOR FORCE [ PEOPLE ]
62.1%
PERCENT IN LABOR FORCE
10.2%
UNEMPLOYMENT RATE
Income in Midway North
Income Overview in Midway North
Per Capita Income in Midway North is $17,599, while median incomes of families and households are $55,556 and $51,648 respectively.
| Characteristic | Number | Measure |
| Per Capita Income | 4,033 | $17,599 |
| Median Family Income | 838 | $55,556 |
| Mean Family Income | 838 | $72,857 |
| Median Household Income | 977 | $51,648 |
| Mean Household Income | 977 | $67,912 |
| Income Deficit | 838 | $0 |
| Wage / Income Gap (%) | 4,033 | 7.55% |
| Wage / Income Gap ($) | 4,033 | 92.45¢ per $1 |
| Gini / Inequality Index | 4,033 | 0.48 |
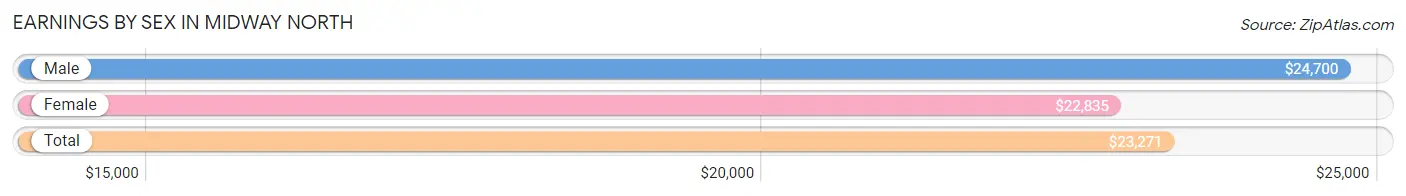
Earnings by Sex in Midway North
Average Earnings in Midway North are $23,271, $24,700 for men and $22,835 for women, a difference of 7.5%.
| Sex | Number | Average Earnings |
| Male | 1,166 (58.6%) | $24,700 |
| Female | 824 (41.4%) | $22,835 |
| Total | 1,990 (100.0%) | $23,271 |
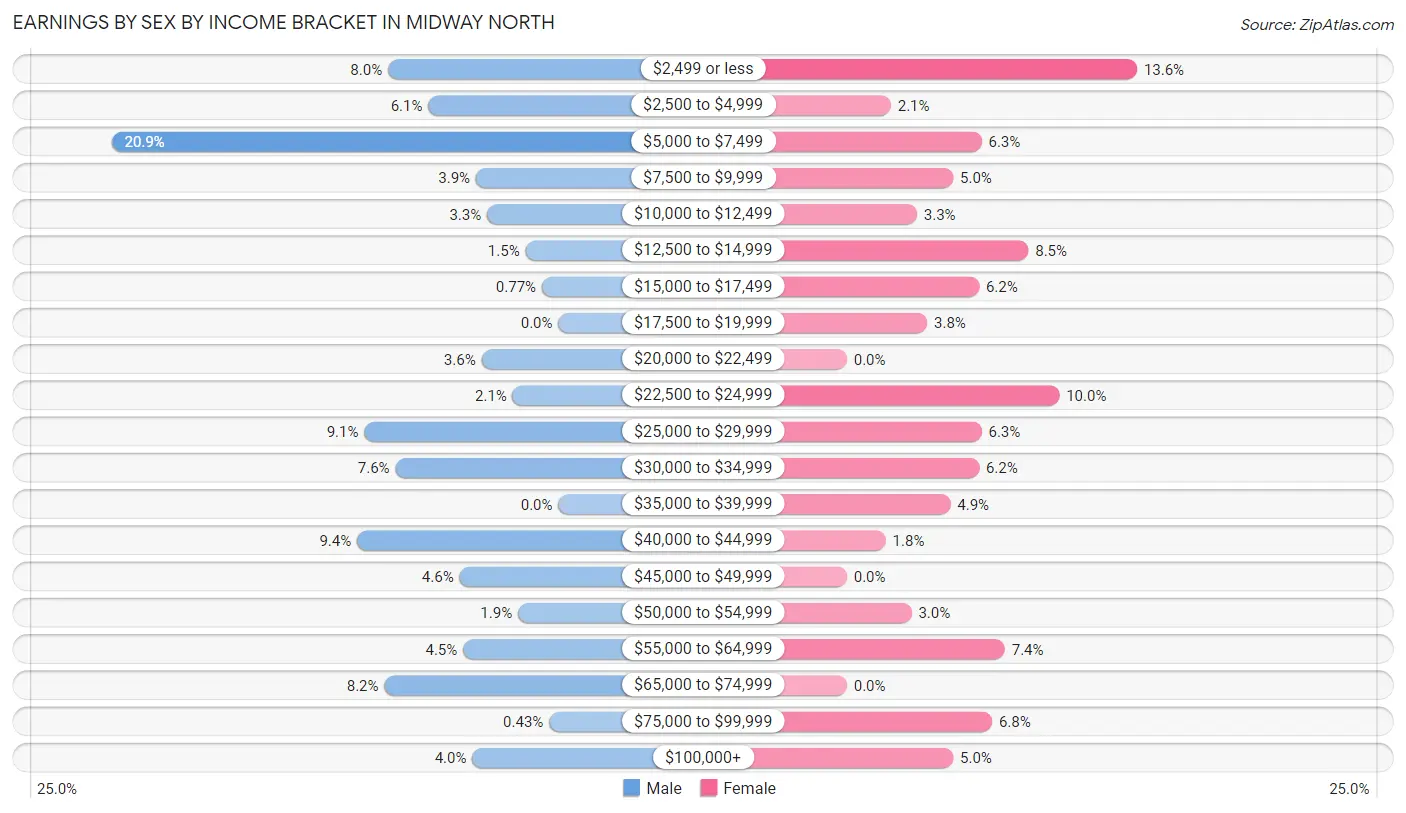
Earnings by Sex by Income Bracket in Midway North
The most common earnings brackets in Midway North are $5,000 to $7,499 for men (244 | 20.9%) and $2,499 or less for women (112 | 13.6%).
| Income | Male | Female |
| $2,499 or less | 93 (8.0%) | 112 (13.6%) |
| $2,500 to $4,999 | 71 (6.1%) | 17 (2.1%) |
| $5,000 to $7,499 | 244 (20.9%) | 52 (6.3%) |
| $7,500 to $9,999 | 45 (3.9%) | 41 (5.0%) |
| $10,000 to $12,499 | 39 (3.3%) | 27 (3.3%) |
| $12,500 to $14,999 | 18 (1.5%) | 70 (8.5%) |
| $15,000 to $17,499 | 9 (0.8%) | 51 (6.2%) |
| $17,500 to $19,999 | 0 (0.0%) | 31 (3.8%) |
| $20,000 to $22,499 | 42 (3.6%) | 0 (0.0%) |
| $22,500 to $24,999 | 25 (2.1%) | 82 (10.0%) |
| $25,000 to $29,999 | 106 (9.1%) | 52 (6.3%) |
| $30,000 to $34,999 | 89 (7.6%) | 51 (6.2%) |
| $35,000 to $39,999 | 0 (0.0%) | 40 (4.9%) |
| $40,000 to $44,999 | 110 (9.4%) | 15 (1.8%) |
| $45,000 to $49,999 | 54 (4.6%) | 0 (0.0%) |
| $50,000 to $54,999 | 22 (1.9%) | 25 (3.0%) |
| $55,000 to $64,999 | 52 (4.5%) | 61 (7.4%) |
| $65,000 to $74,999 | 95 (8.2%) | 0 (0.0%) |
| $75,000 to $99,999 | 5 (0.4%) | 56 (6.8%) |
| $100,000+ | 47 (4.0%) | 41 (5.0%) |
| Total | 1,166 (100.0%) | 824 (100.0%) |
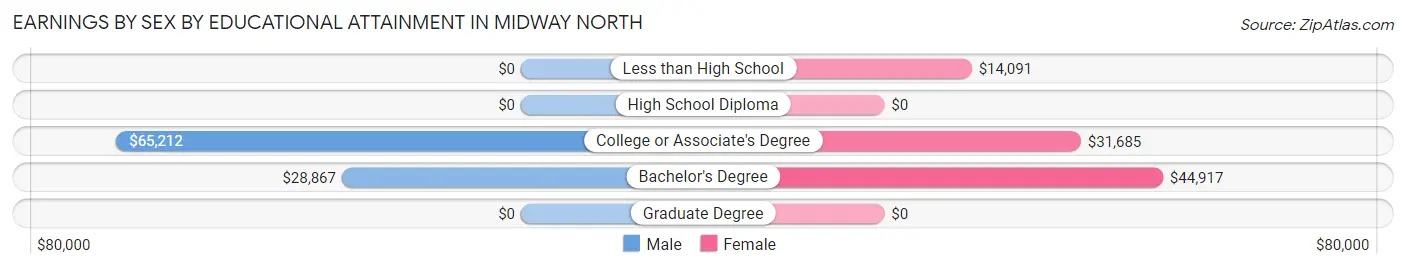
Earnings by Sex by Educational Attainment in Midway North
Average earnings in Midway North are $30,972 for men and $24,299 for women, a difference of 21.5%. Men with an educational attainment of college or associate's degree enjoy the highest average annual earnings of $65,212, while those with bachelor's degree education earn the least with $28,867. Women with an educational attainment of bachelor's degree earn the most with the average annual earnings of $44,917, while those with less than high school education have the smallest earnings of $14,091.
| Educational Attainment | Male Income | Female Income |
| Less than High School | - | - |
| High School Diploma | - | - |
| College or Associate's Degree | $65,212 | $31,685 |
| Bachelor's Degree | $28,867 | $44,917 |
| Graduate Degree | - | - |
| Total | $30,972 | $24,299 |
Family Income in Midway North
Family Income Brackets in Midway North
According to the Midway North family income data, there are 208 families falling into the $50,000 to $74,999 income range, which is the most common income bracket and makes up 24.8% of all families. Conversely, the $200,000+ income bracket is the least frequent group with only 41 families (4.9%) belonging to this category.
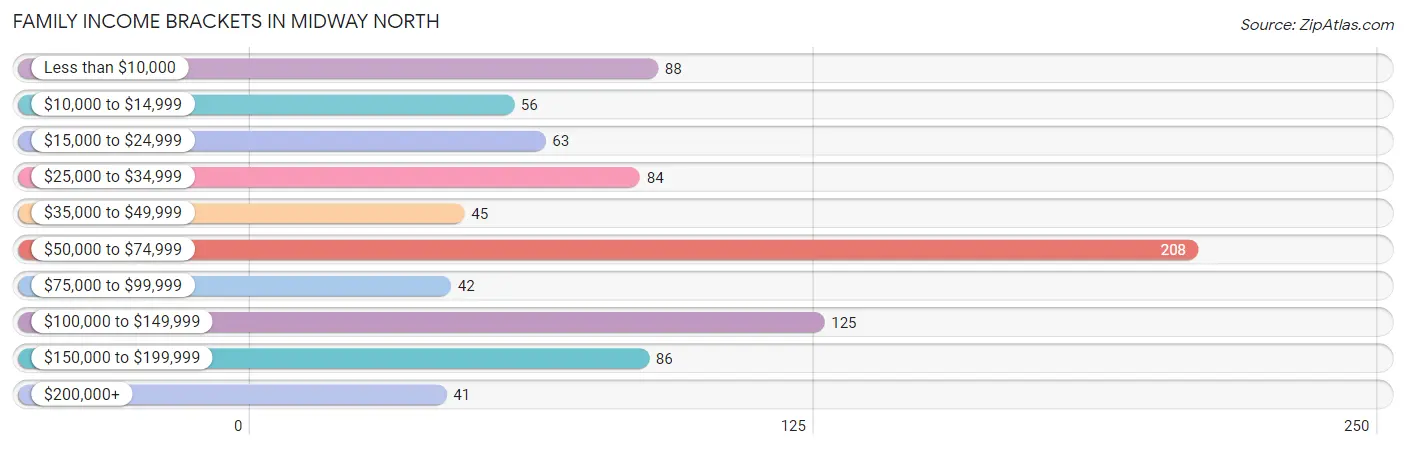
| Income Bracket | # Families | % Families |
| Less than $10,000 | 88 | 10.5% |
| $10,000 to $14,999 | 56 | 6.7% |
| $15,000 to $24,999 | 63 | 7.5% |
| $25,000 to $34,999 | 84 | 10.0% |
| $35,000 to $49,999 | 45 | 5.4% |
| $50,000 to $74,999 | 208 | 24.8% |
| $75,000 to $99,999 | 42 | 5.0% |
| $100,000 to $149,999 | 125 | 14.9% |
| $150,000 to $199,999 | 86 | 10.3% |
| $200,000+ | 41 | 4.9% |
Family Income by Famaliy Size in Midway North
6-person families (82 | 9.8%) account for the highest median family income in Midway North with $107,895 per family, while 3-person families (61 | 7.3%) have the highest median income of $23,652 per family member.
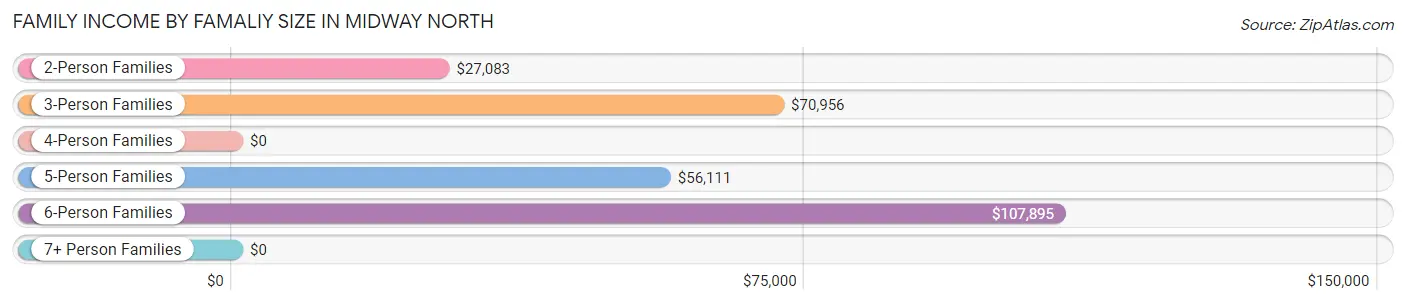
| Income Bracket | # Families | Median Income |
| 2-Person Families | 234 (27.9%) | $27,083 |
| 3-Person Families | 61 (7.3%) | $70,956 |
| 4-Person Families | 274 (32.7%) | $0 |
| 5-Person Families | 88 (10.5%) | $56,111 |
| 6-Person Families | 82 (9.8%) | $107,895 |
| 7+ Person Families | 99 (11.8%) | $0 |
| Total | 838 (100.0%) | $55,556 |
Family Income by Number of Earners in Midway North
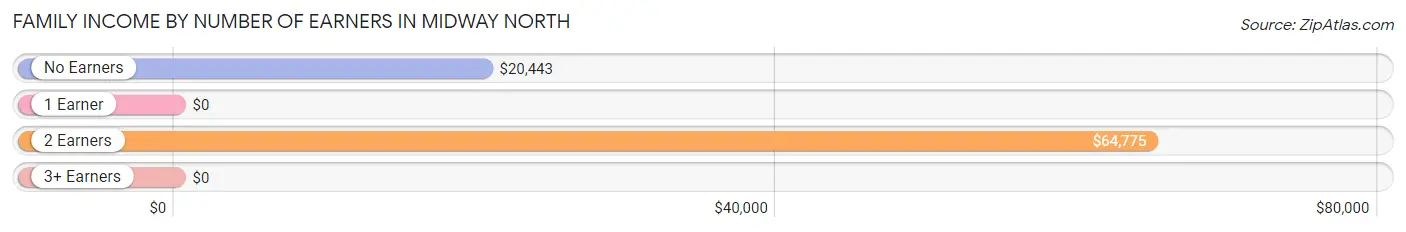
| Number of Earners | # Families | Median Income |
| No Earners | 79 (9.4%) | $20,443 |
| 1 Earner | 163 (19.5%) | $0 |
| 2 Earners | 367 (43.8%) | $64,775 |
| 3+ Earners | 229 (27.3%) | $0 |
| Total | 838 (100.0%) | $55,556 |
Household Income in Midway North
Household Income Brackets in Midway North
With 186 households falling in the category, the $50,000 to $74,999 income range is the most frequent in Midway North, accounting for 19.0% of all households. In contrast, only 41 households (4.2%) fall into the $200,000+ income bracket, making it the least populous group.
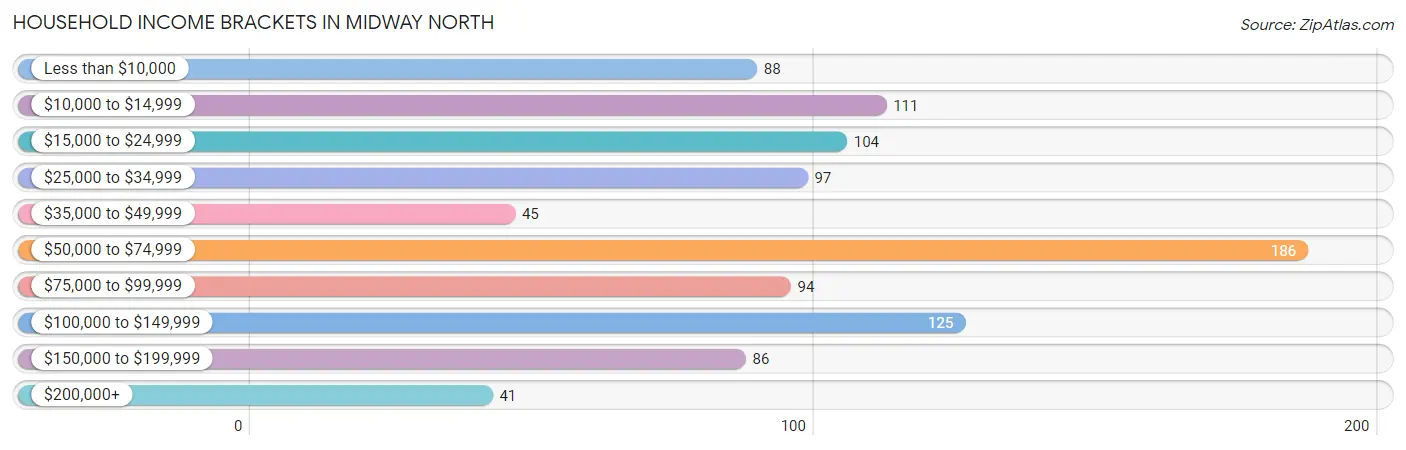
| Income Bracket | # Households | % Households |
| Less than $10,000 | 88 | 9.0% |
| $10,000 to $14,999 | 111 | 11.4% |
| $15,000 to $24,999 | 104 | 10.6% |
| $25,000 to $34,999 | 97 | 9.9% |
| $35,000 to $49,999 | 45 | 4.6% |
| $50,000 to $74,999 | 186 | 19.0% |
| $75,000 to $99,999 | 94 | 9.6% |
| $100,000 to $149,999 | 125 | 12.8% |
| $150,000 to $199,999 | 86 | 8.8% |
| $200,000+ | 41 | 4.2% |
Household Income by Householder Age in Midway North
The median household income in Midway North is $51,648, with the highest median household income of $88,458 found in the 25 to 44 years age bracket for the primary householder. A total of 431 households (44.1%) fall into this category.
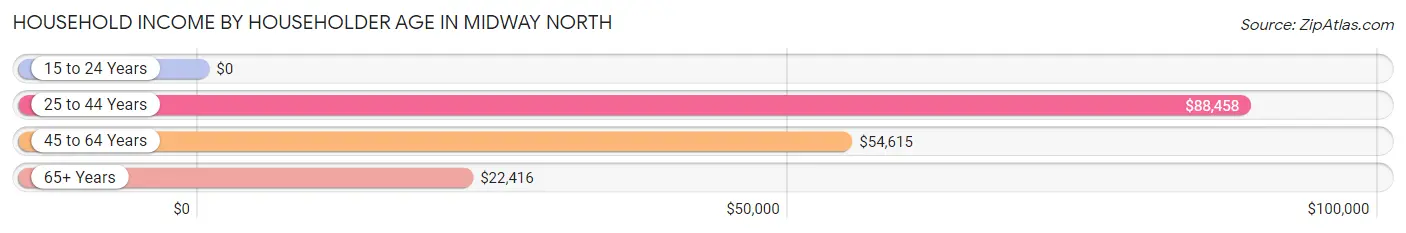
| Income Bracket | # Households | Median Income |
| 15 to 24 Years | 0 (0.0%) | $0 |
| 25 to 44 Years | 431 (44.1%) | $88,458 |
| 45 to 64 Years | 354 (36.2%) | $54,615 |
| 65+ Years | 192 (19.7%) | $22,416 |
| Total | 977 (100.0%) | $51,648 |
Poverty in Midway North
Income Below Poverty by Sex and Age in Midway North
With 24.0% poverty level for males and 26.5% for females among the residents of Midway North, 6 to 11 year old males and 6 to 11 year old females are the most vulnerable to poverty, with 121 males (38.2%) and 92 females (65.7%) in their respective age groups living below the poverty level.
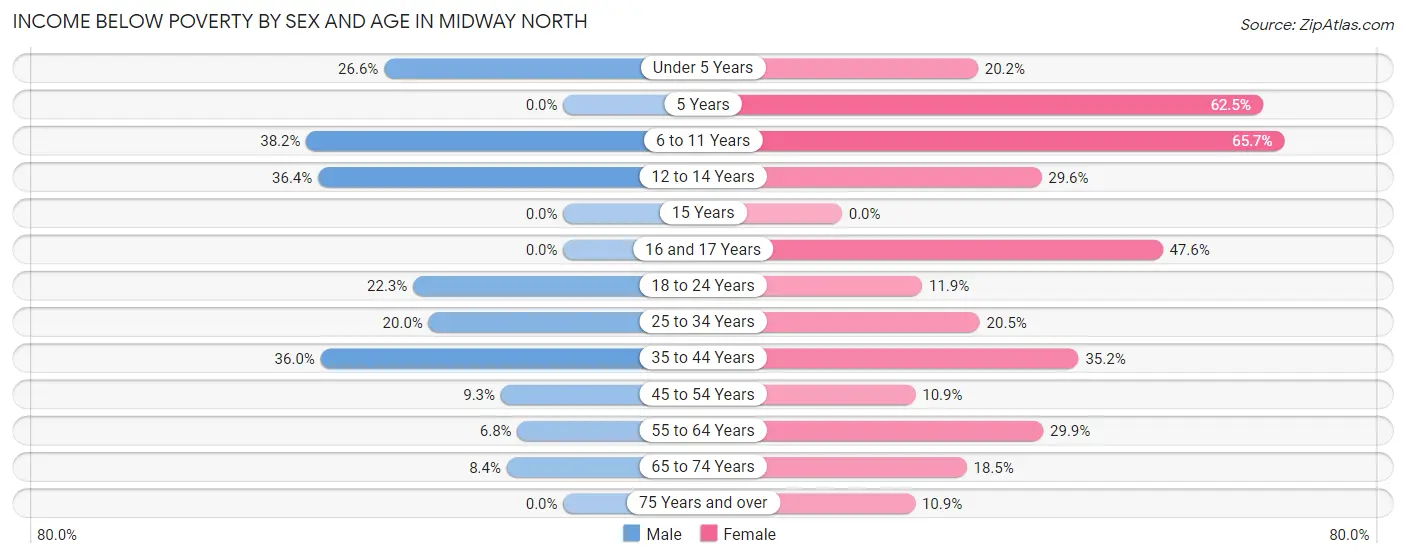
| Age Bracket | Male | Female |
| Under 5 Years | 29 (26.6%) | 20 (20.2%) |
| 5 Years | 0 (0.0%) | 20 (62.5%) |
| 6 to 11 Years | 121 (38.2%) | 92 (65.7%) |
| 12 to 14 Years | 55 (36.4%) | 32 (29.6%) |
| 15 Years | 0 (0.0%) | 0 (0.0%) |
| 16 and 17 Years | 0 (0.0%) | 70 (47.6%) |
| 18 to 24 Years | 58 (22.3%) | 23 (11.9%) |
| 25 to 34 Years | 67 (20.0%) | 79 (20.5%) |
| 35 to 44 Years | 120 (36.0%) | 84 (35.1%) |
| 45 to 54 Years | 18 (9.3%) | 24 (10.9%) |
| 55 to 64 Years | 6 (6.8%) | 55 (29.9%) |
| 65 to 74 Years | 10 (8.4%) | 30 (18.5%) |
| 75 Years and over | 0 (0.0%) | 5 (10.9%) |
| Total | 484 (24.0%) | 534 (26.5%) |
Income Above Poverty by Sex and Age in Midway North
According to the poverty statistics in Midway North, males aged 5 years and females aged 15 years are the age groups that are most secure financially, with 100.0% of males and 100.0% of females in these age groups living above the poverty line.
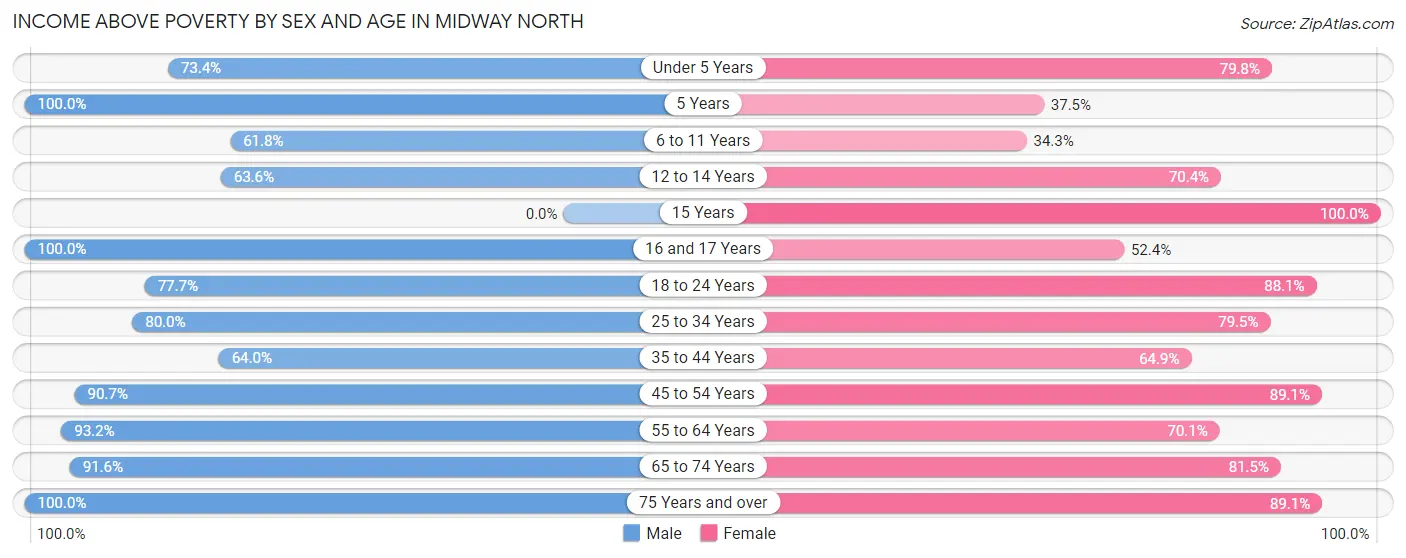
| Age Bracket | Male | Female |
| Under 5 Years | 80 (73.4%) | 79 (79.8%) |
| 5 Years | 10 (100.0%) | 12 (37.5%) |
| 6 to 11 Years | 196 (61.8%) | 48 (34.3%) |
| 12 to 14 Years | 96 (63.6%) | 76 (70.4%) |
| 15 Years | 0 (0.0%) | 63 (100.0%) |
| 16 and 17 Years | 89 (100.0%) | 77 (52.4%) |
| 18 to 24 Years | 202 (77.7%) | 170 (88.1%) |
| 25 to 34 Years | 268 (80.0%) | 307 (79.5%) |
| 35 to 44 Years | 213 (64.0%) | 155 (64.8%) |
| 45 to 54 Years | 176 (90.7%) | 196 (89.1%) |
| 55 to 64 Years | 82 (93.2%) | 129 (70.1%) |
| 65 to 74 Years | 109 (91.6%) | 132 (81.5%) |
| 75 Years and over | 9 (100.0%) | 41 (89.1%) |
| Total | 1,530 (76.0%) | 1,485 (73.6%) |
Income Below Poverty Among Married-Couple Families in Midway North
The poverty statistics for married-couple families in Midway North show that 16.0% or 99 of the total 618 families live below the poverty line. Families with 3 or 4 children have the highest poverty rate of 44.9%, comprising of 71 families. On the other hand, families with no children have the lowest poverty rate of 4.4%, which includes 10 families.
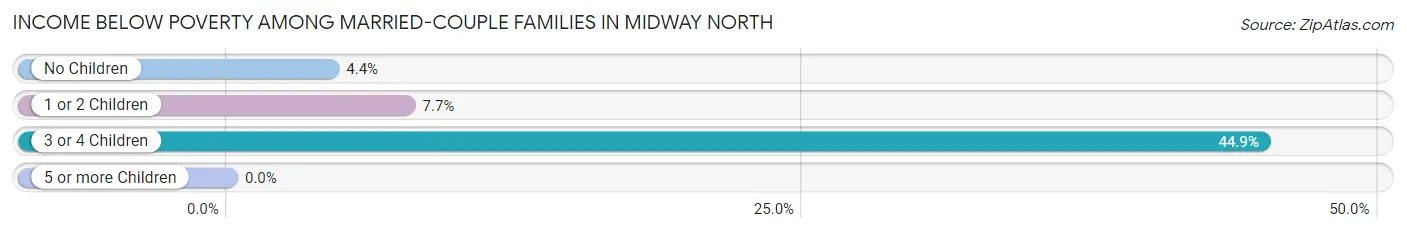
| Children | Above Poverty | Below Poverty |
| No Children | 217 (95.6%) | 10 (4.4%) |
| 1 or 2 Children | 215 (92.3%) | 18 (7.7%) |
| 3 or 4 Children | 87 (55.1%) | 71 (44.9%) |
| 5 or more Children | 0 (0.0%) | 0 (0.0%) |
| Total | 519 (84.0%) | 99 (16.0%) |
Income Below Poverty Among Single-Parent Households in Midway North
According to the poverty data in Midway North, 69.0% or 49 single-father households and 31.5% or 47 single-mother households are living below the poverty line. Among single-father households, those with 1 or 2 children have the highest poverty rate, with 49 households (69.0%) experiencing poverty. Likewise, among single-mother households, those with 3 or 4 children have the highest poverty rate, with 42 households (100.0%) falling below the poverty line.
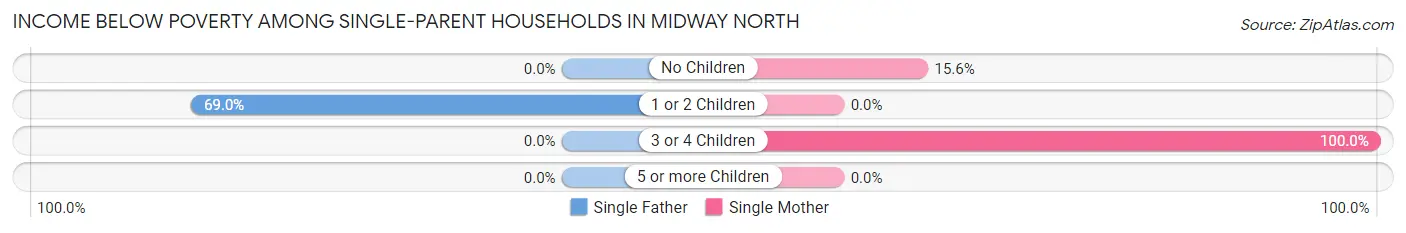
| Children | Single Father | Single Mother |
| No Children | 0 (0.0%) | 5 (15.6%) |
| 1 or 2 Children | 49 (69.0%) | 0 (0.0%) |
| 3 or 4 Children | 0 (0.0%) | 42 (100.0%) |
| 5 or more Children | 0 (0.0%) | 0 (0.0%) |
| Total | 49 (69.0%) | 47 (31.5%) |
Income Below Poverty Among Married-Couple vs Single-Parent Households in Midway North
The poverty data for Midway North shows that 99 of the married-couple family households (16.0%) and 96 of the single-parent households (43.6%) are living below the poverty level. Within the married-couple family households, those with 3 or 4 children have the highest poverty rate, with 71 households (44.9%) falling below the poverty line. Among the single-parent households, those with 3 or 4 children have the highest poverty rate, with 42 household (100.0%) living below poverty.
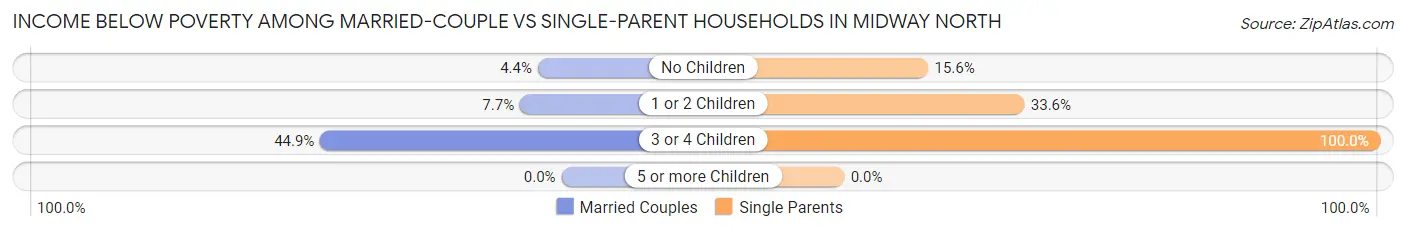
| Children | Married-Couple Families | Single-Parent Households |
| No Children | 10 (4.4%) | 5 (15.6%) |
| 1 or 2 Children | 18 (7.7%) | 49 (33.6%) |
| 3 or 4 Children | 71 (44.9%) | 42 (100.0%) |
| 5 or more Children | 0 (0.0%) | 0 (0.0%) |
| Total | 99 (16.0%) | 96 (43.6%) |
Race in Midway North
The most populous races in Midway North are Hispanic or Latino (3,885 | 96.3%), White / Caucasian (2,638 | 65.4%), and Two or more Races (864 | 21.4%).
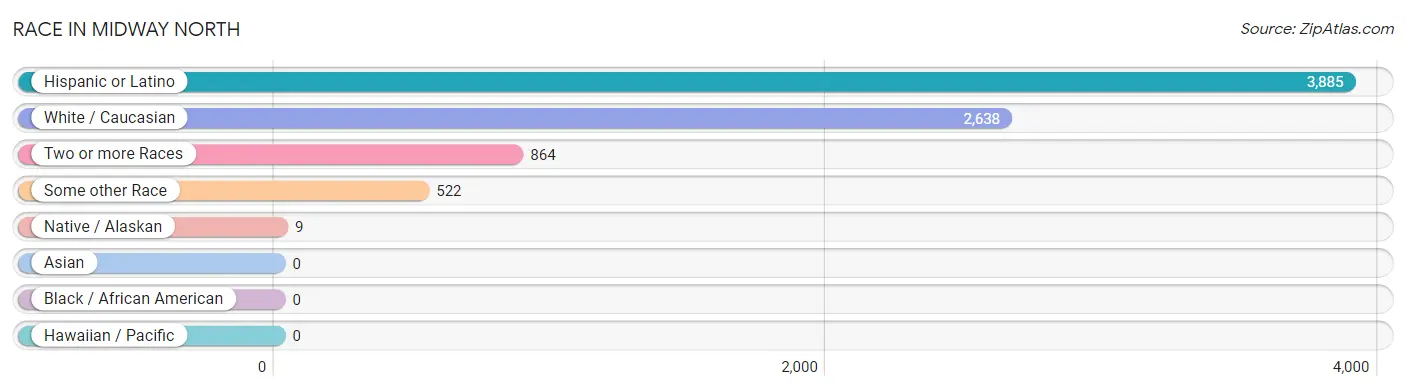
| Race | # Population | % Population |
| Asian | 0 | 0.0% |
| Black / African American | 0 | 0.0% |
| Hawaiian / Pacific | 0 | 0.0% |
| Hispanic or Latino | 3,885 | 96.3% |
| Native / Alaskan | 9 | 0.2% |
| White / Caucasian | 2,638 | 65.4% |
| Two or more Races | 864 | 21.4% |
| Some other Race | 522 | 12.9% |
| Total | 4,033 | 100.0% |
Ancestry in Midway North
The most populous ancestries reported in Midway North are Mexican (3,837 | 95.1%), American (111 | 2.8%), Italian (104 | 2.6%), English (43 | 1.1%), and Mexican American Indian (9 | 0.2%), together accounting for 101.8% of all Midway North residents.
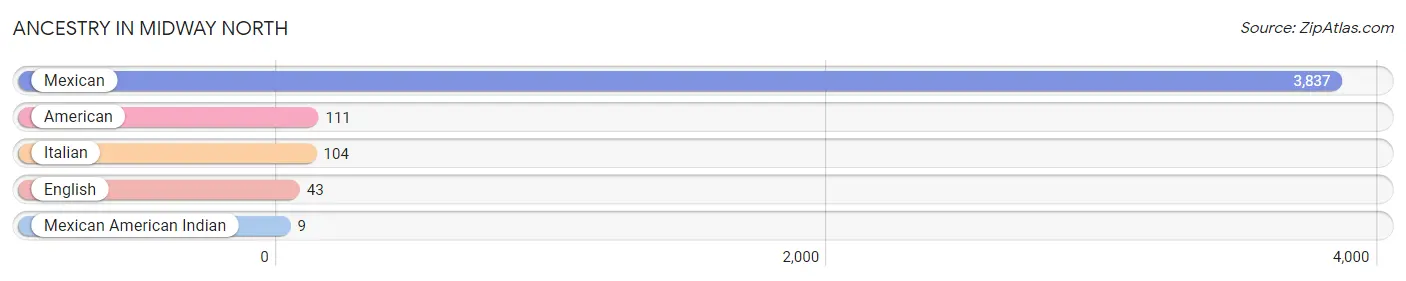
| Ancestry | # Population | % Population |
| American | 111 | 2.8% |
| English | 43 | 1.1% |
| Italian | 104 | 2.6% |
| Mexican | 3,837 | 95.1% |
| Mexican American Indian | 9 | 0.2% | View All 5 Rows |
Immigrants in Midway North
The most numerous immigrant groups reported in Midway North came from Central America (1,181 | 29.3%), Latin America (1,181 | 29.3%), and Mexico (1,181 | 29.3%), together accounting for 87.8% of all Midway North residents.
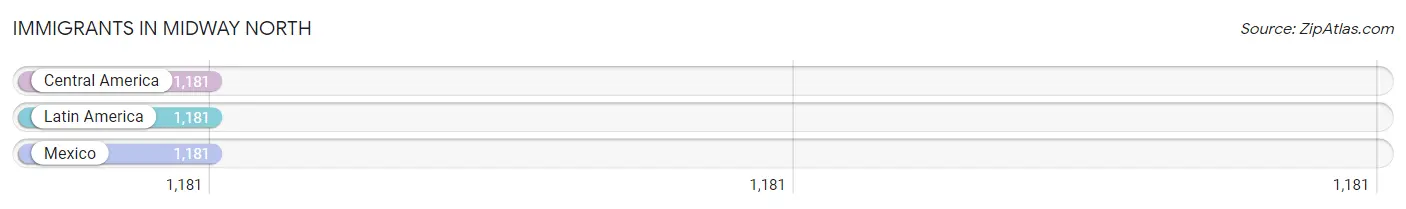
| Immigration Origin | # Population | % Population |
| Central America | 1,181 | 29.3% |
| Latin America | 1,181 | 29.3% |
| Mexico | 1,181 | 29.3% | View All 3 Rows |
Sex and Age in Midway North
Sex and Age in Midway North
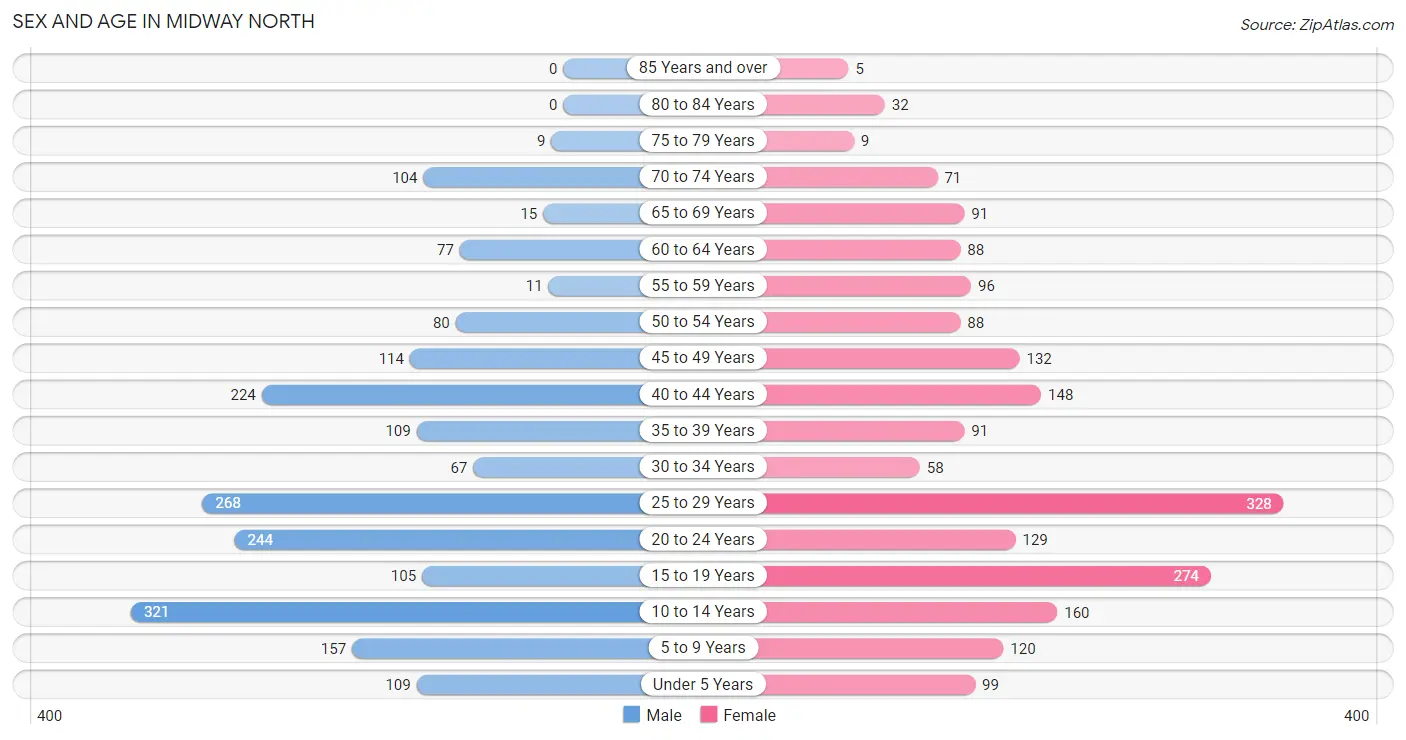
The most populous age groups in Midway North are 10 to 14 Years (321 | 15.9%) for men and 25 to 29 Years (328 | 16.3%) for women.
| Age Bracket | Male | Female |
| Under 5 Years | 109 (5.4%) | 99 (4.9%) |
| 5 to 9 Years | 157 (7.8%) | 120 (5.9%) |
| 10 to 14 Years | 321 (15.9%) | 160 (7.9%) |
| 15 to 19 Years | 105 (5.2%) | 274 (13.6%) |
| 20 to 24 Years | 244 (12.1%) | 129 (6.4%) |
| 25 to 29 Years | 268 (13.3%) | 328 (16.3%) |
| 30 to 34 Years | 67 (3.3%) | 58 (2.9%) |
| 35 to 39 Years | 109 (5.4%) | 91 (4.5%) |
| 40 to 44 Years | 224 (11.1%) | 148 (7.3%) |
| 45 to 49 Years | 114 (5.7%) | 132 (6.5%) |
| 50 to 54 Years | 80 (4.0%) | 88 (4.4%) |
| 55 to 59 Years | 11 (0.5%) | 96 (4.8%) |
| 60 to 64 Years | 77 (3.8%) | 88 (4.4%) |
| 65 to 69 Years | 15 (0.7%) | 91 (4.5%) |
| 70 to 74 Years | 104 (5.2%) | 71 (3.5%) |
| 75 to 79 Years | 9 (0.4%) | 9 (0.4%) |
| 80 to 84 Years | 0 (0.0%) | 32 (1.6%) |
| 85 Years and over | 0 (0.0%) | 5 (0.3%) |
| Total | 2,014 (100.0%) | 2,019 (100.0%) |
Families and Households in Midway North
Median Family Size in Midway North
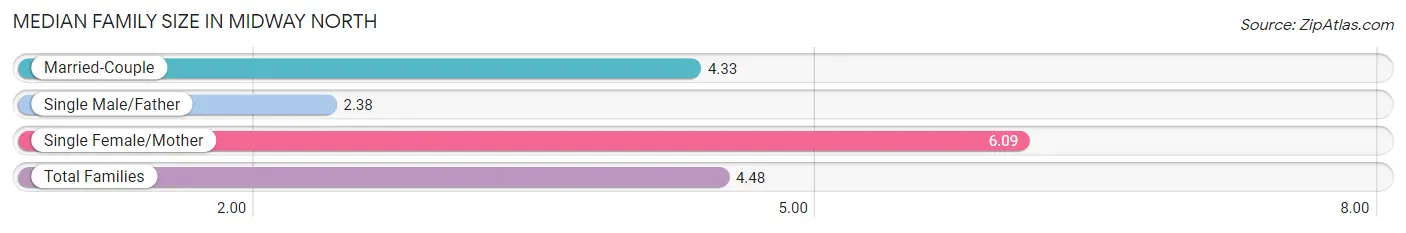
The median family size in Midway North is 4.48 persons per family, with single female/mother families (149 | 17.8%) accounting for the largest median family size of 6.09 persons per family. On the other hand, single male/father families (71 | 8.5%) represent the smallest median family size with 2.38 persons per family.
| Family Type | # Families | Family Size |
| Married-Couple | 618 (73.8%) | 4.33 |
| Single Male/Father | 71 (8.5%) | 2.38 |
| Single Female/Mother | 149 (17.8%) | 6.09 |
| Total Families | 838 (100.0%) | 4.48 |
Median Household Size in Midway North
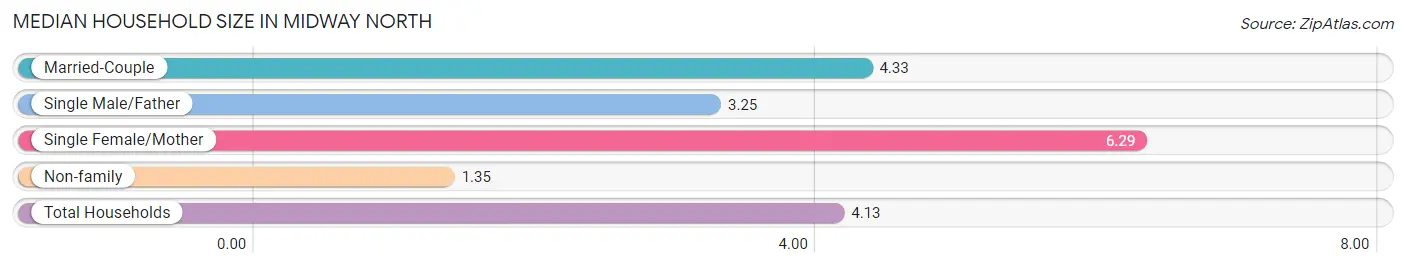
The median household size in Midway North is 4.13 persons per household, with single female/mother households (149 | 15.2%) accounting for the largest median household size of 6.29 persons per household. non-family households (139 | 14.2%) represent the smallest median household size with 1.35 persons per household.
| Household Type | # Households | Household Size |
| Married-Couple | 618 (63.2%) | 4.33 |
| Single Male/Father | 71 (7.3%) | 3.25 |
| Single Female/Mother | 149 (15.2%) | 6.29 |
| Non-family | 139 (14.2%) | 1.35 |
| Total Households | 977 (100.0%) | 4.13 |
Household Size by Marriage Status in Midway North
Out of a total of 977 households in Midway North, 838 (85.8%) are family households, while 139 (14.2%) are nonfamily households. The most numerous type of family households are 4-person households, comprising 252, and the most common type of nonfamily households are 1-person households, comprising 96.
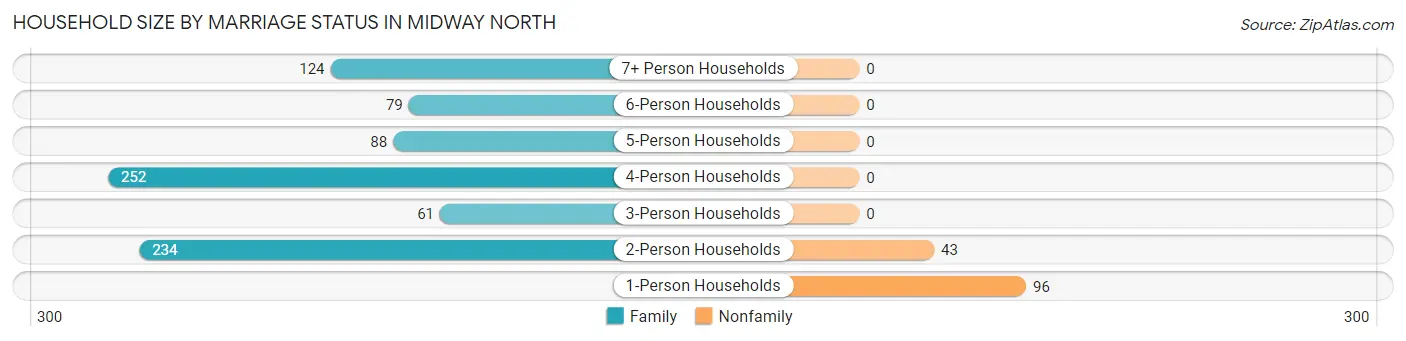
| Household Size | Family Households | Nonfamily Households |
| 1-Person Households | - | 96 (9.8%) |
| 2-Person Households | 234 (23.9%) | 43 (4.4%) |
| 3-Person Households | 61 (6.2%) | 0 (0.0%) |
| 4-Person Households | 252 (25.8%) | 0 (0.0%) |
| 5-Person Households | 88 (9.0%) | 0 (0.0%) |
| 6-Person Households | 79 (8.1%) | 0 (0.0%) |
| 7+ Person Households | 124 (12.7%) | 0 (0.0%) |
| Total | 838 (85.8%) | 139 (14.2%) |
Female Fertility in Midway North
Fertility by Age in Midway North
Average fertility rate in Midway North is 70.0 births per 1,000 women. Women in the age bracket of 20 to 34 years have the highest fertility rate with 105.0 births per 1,000 women. Women in the age bracket of 20 to 34 years acount for 65.8% of all women with births.
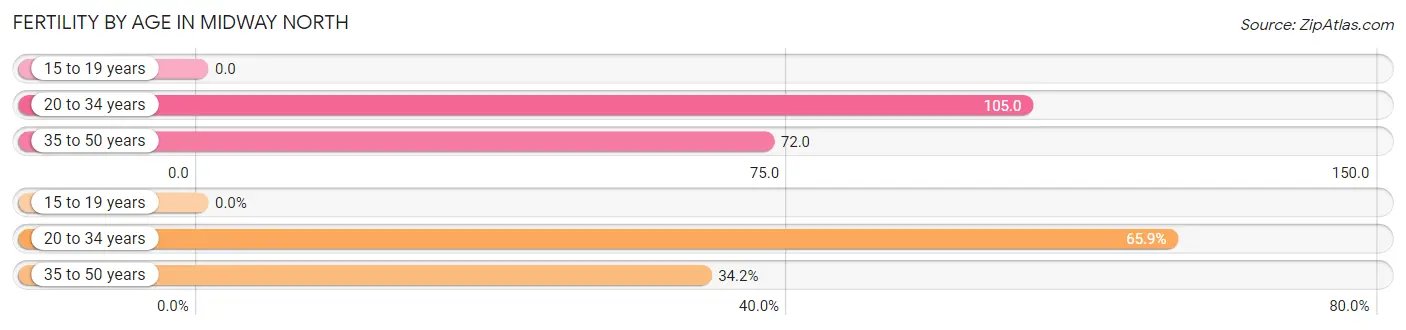
| Age Bracket | Women with Births | Births / 1,000 Women |
| 15 to 19 years | 0 (0.0%) | 0.0 |
| 20 to 34 years | 54 (65.8%) | 105.0 |
| 35 to 50 years | 28 (34.2%) | 72.0 |
| Total | 82 (100.0%) | 70.0 |
Fertility by Age by Marriage Status in Midway North
50.0% of women with births (82) in Midway North are married. The highest percentage of unmarried women with births falls into 20 to 34 years age bracket with 75.9% of them unmarried at the time of birth, while the lowest percentage of unmarried women with births belong to 35 to 50 years age bracket with 0.0% of them unmarried.
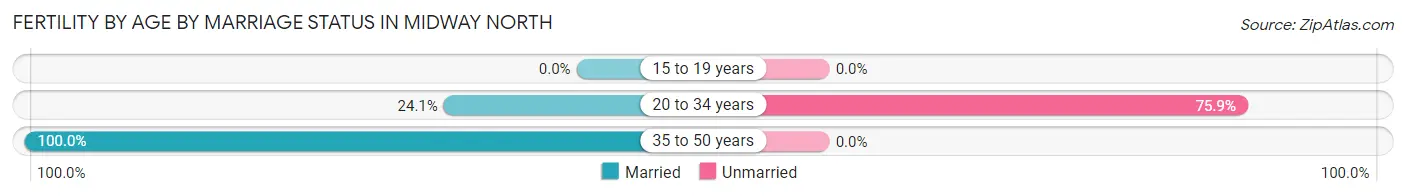
| Age Bracket | Married | Unmarried |
| 15 to 19 years | 0 (0.0%) | 0 (0.0%) |
| 20 to 34 years | 13 (24.1%) | 41 (75.9%) |
| 35 to 50 years | 28 (100.0%) | 0 (0.0%) |
| Total | 41 (50.0%) | 41 (50.0%) |
Fertility by Education in Midway North

| Educational Attainment | Women with Births | Births / 1,000 Women |
| Less than High School | 28 (34.2%) | 46.0 |
| High School Diploma | 41 (50.0%) | 160.0 |
| College or Associate's Degree | 0 (0.0%) | 0.0 |
| Bachelor's Degree | 13 (15.9%) | 90.0 |
| Graduate Degree | 0 (0.0%) | 0.0 |
| Total | 82 (100.0%) | 70.0 |
Fertility by Education by Marriage Status in Midway North
50.0% of women with births in Midway North are unmarried. Women with the educational attainment of less than high school are most likely to be married with 100.0% of them married at childbirth, while women with the educational attainment of high school diploma are least likely to be married with 100.0% of them unmarried at childbirth.
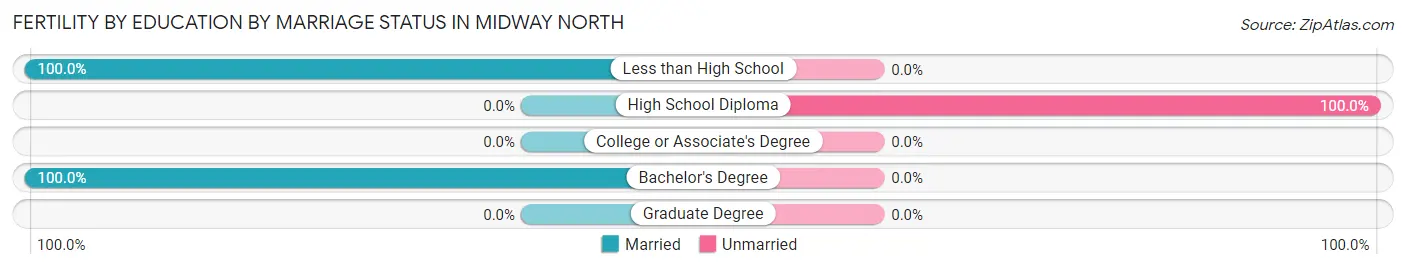
| Educational Attainment | Married | Unmarried |
| Less than High School | 28 (100.0%) | 0 (0.0%) |
| High School Diploma | 0 (0.0%) | 41 (100.0%) |
| College or Associate's Degree | 0 (0.0%) | 0 (0.0%) |
| Bachelor's Degree | 13 (100.0%) | 0 (0.0%) |
| Graduate Degree | 0 (0.0%) | 0 (0.0%) |
| Total | 41 (50.0%) | 41 (50.0%) |
Employment Characteristics in Midway North
Employment by Class of Employer in Midway North
Among the 1,644 employed individuals in Midway North, private company employees (969 | 58.9%), self-employed (not incorporated) (233 | 14.2%), and state government employees (232 | 14.1%) make up the most common classes of employment.
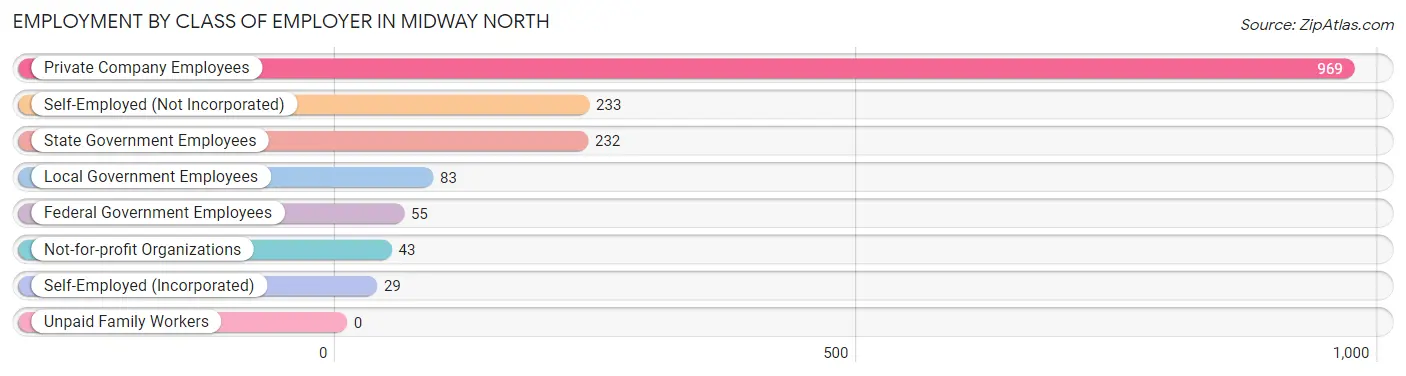
| Employer Class | # Employees | % Employees |
| Private Company Employees | 969 | 58.9% |
| Self-Employed (Incorporated) | 29 | 1.8% |
| Self-Employed (Not Incorporated) | 233 | 14.2% |
| Not-for-profit Organizations | 43 | 2.6% |
| Local Government Employees | 83 | 5.1% |
| State Government Employees | 232 | 14.1% |
| Federal Government Employees | 55 | 3.4% |
| Unpaid Family Workers | 0 | 0.0% |
| Total | 1,644 | 100.0% |
Employment Status by Age in Midway North
According to the labor force statistics for Midway North, out of the total population over 16 years of age (3,004), 62.1% or 1,865 individuals are in the labor force, with 10.2% or 190 of them unemployed. The age group with the highest labor force participation rate is 45 to 54 years, with 82.9% or 343 individuals in the labor force. Within the labor force, the 55 to 59 years age range has the highest percentage of unemployed individuals, with 45.8% or 11 of them being unemployed.
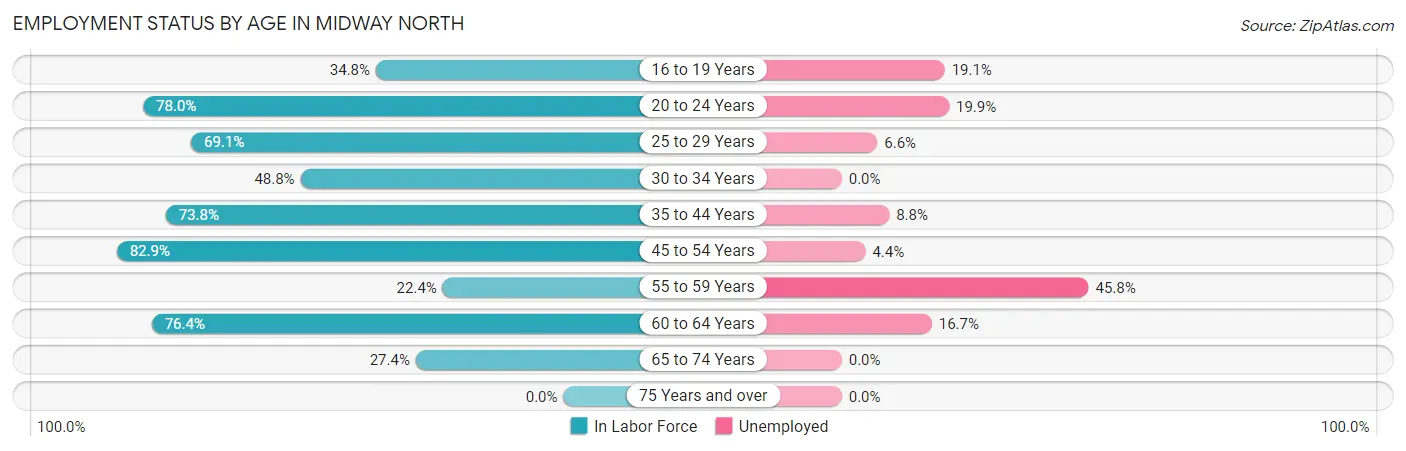
| Age Bracket | In Labor Force | Unemployed |
| 16 to 19 Years | 110 (34.8%) | 21 (19.1%) |
| 20 to 24 Years | 291 (78.0%) | 58 (19.9%) |
| 25 to 29 Years | 412 (69.1%) | 27 (6.6%) |
| 30 to 34 Years | 61 (48.8%) | 0 (0.0%) |
| 35 to 44 Years | 422 (73.8%) | 37 (8.8%) |
| 45 to 54 Years | 343 (82.9%) | 15 (4.4%) |
| 55 to 59 Years | 24 (22.4%) | 11 (45.8%) |
| 60 to 64 Years | 126 (76.4%) | 21 (16.7%) |
| 65 to 74 Years | 77 (27.4%) | 0 (0.0%) |
| 75 Years and over | 0 (0.0%) | 0 (0.0%) |
| Total | 1,865 (62.1%) | 190 (10.2%) |
Employment Status by Educational Attainment in Midway North
According to labor force statistics for Midway North, 70.1% of individuals (1,387) out of the total population between 25 and 64 years of age (1,979) are in the labor force, with 8.0% or 111 of them being unemployed. The group with the highest labor force participation rate are those with the educational attainment of high school diploma, with 89.1% or 466 individuals in the labor force. Within the labor force, individuals with less than high school education have the highest percentage of unemployment, with 23.6% or 67 of them being unemployed.
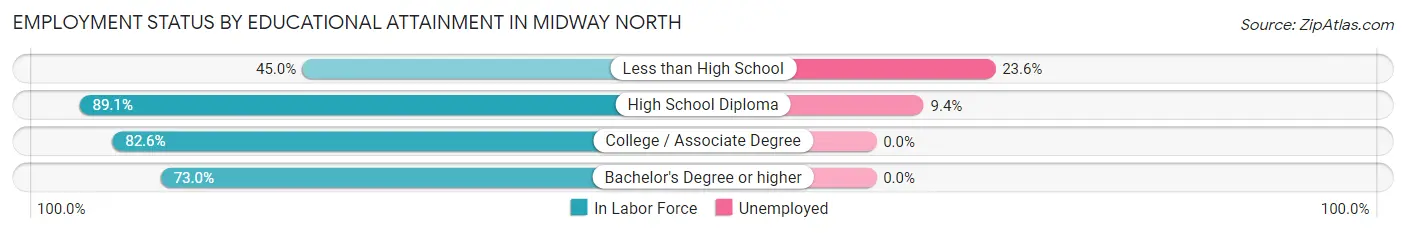
| Educational Attainment | In Labor Force | Unemployed |
| Less than High School | 284 (45.0%) | 149 (23.6%) |
| High School Diploma | 466 (89.1%) | 49 (9.4%) |
| College / Associate Degree | 308 (82.6%) | 0 (0.0%) |
| Bachelor's Degree or higher | 330 (73.0%) | 0 (0.0%) |
| Total | 1,387 (70.1%) | 158 (8.0%) |
Employment Occupations by Sex in Midway North
Management, Business, Science and Arts Occupations
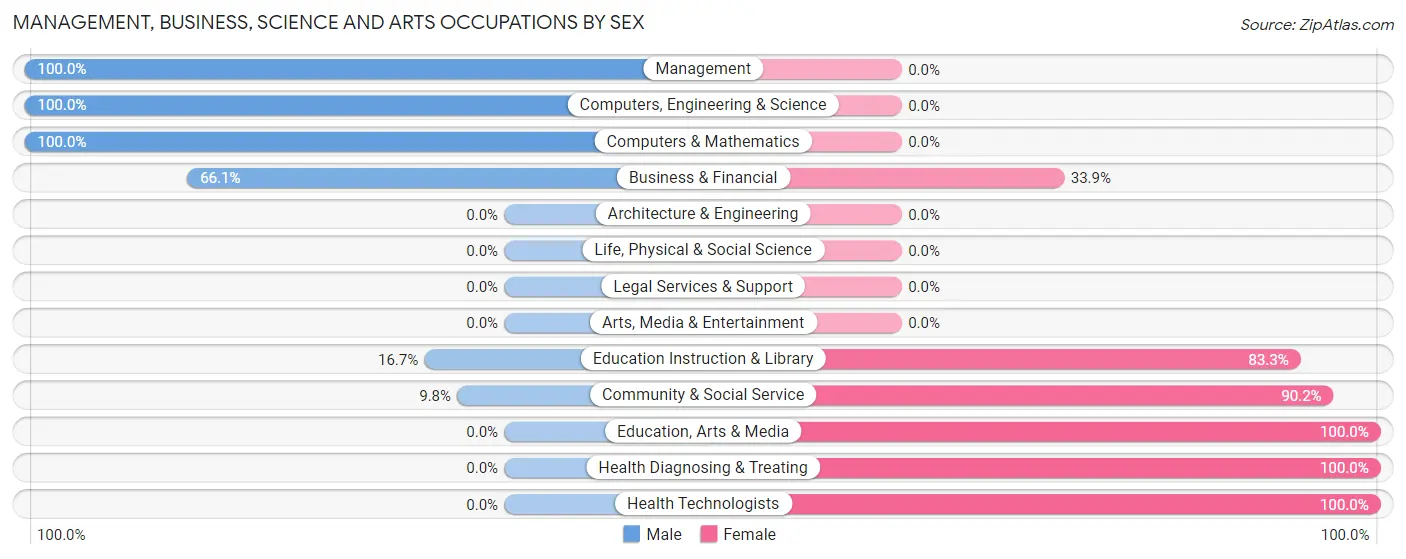
The most common Management, Business, Science and Arts occupations in Midway North are Community & Social Service (173 | 10.3%), Education Instruction & Library (102 | 6.1%), Education, Arts & Media (71 | 4.2%), Management (62 | 3.7%), and Business & Financial (56 | 3.3%).
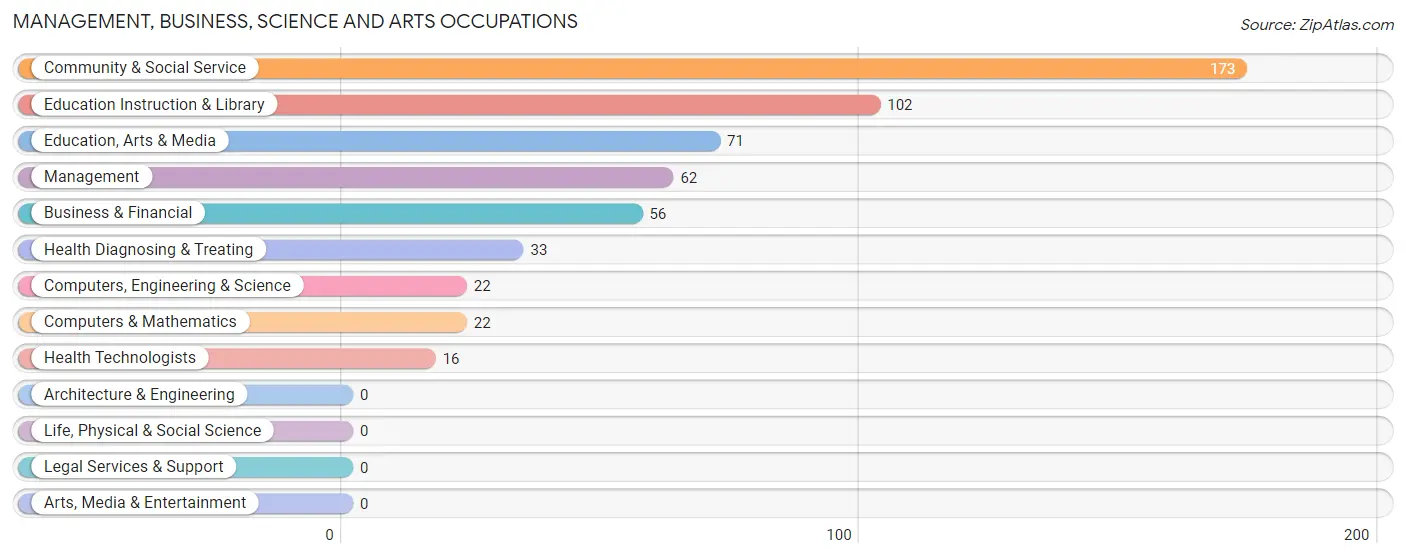
Management, Business, Science and Arts Occupations by Sex
Within the Management, Business, Science and Arts occupations in Midway North, the most male-oriented occupations are Management (100.0%), Computers, Engineering & Science (100.0%), and Computers & Mathematics (100.0%), while the most female-oriented occupations are Education, Arts & Media (100.0%), Health Diagnosing & Treating (100.0%), and Health Technologists (100.0%).
| Occupation | Male | Female |
| Management | 62 (100.0%) | 0 (0.0%) |
| Business & Financial | 37 (66.1%) | 19 (33.9%) |
| Computers, Engineering & Science | 22 (100.0%) | 0 (0.0%) |
| Computers & Mathematics | 22 (100.0%) | 0 (0.0%) |
| Architecture & Engineering | 0 (0.0%) | 0 (0.0%) |
| Life, Physical & Social Science | 0 (0.0%) | 0 (0.0%) |
| Community & Social Service | 17 (9.8%) | 156 (90.2%) |
| Education, Arts & Media | 0 (0.0%) | 71 (100.0%) |
| Legal Services & Support | 0 (0.0%) | 0 (0.0%) |
| Education Instruction & Library | 17 (16.7%) | 85 (83.3%) |
| Arts, Media & Entertainment | 0 (0.0%) | 0 (0.0%) |
| Health Diagnosing & Treating | 0 (0.0%) | 33 (100.0%) |
| Health Technologists | 0 (0.0%) | 16 (100.0%) |
| Total (Category) | 138 (39.9%) | 208 (60.1%) |
| Total (Overall) | 973 (58.1%) | 703 (41.9%) |
Services Occupations
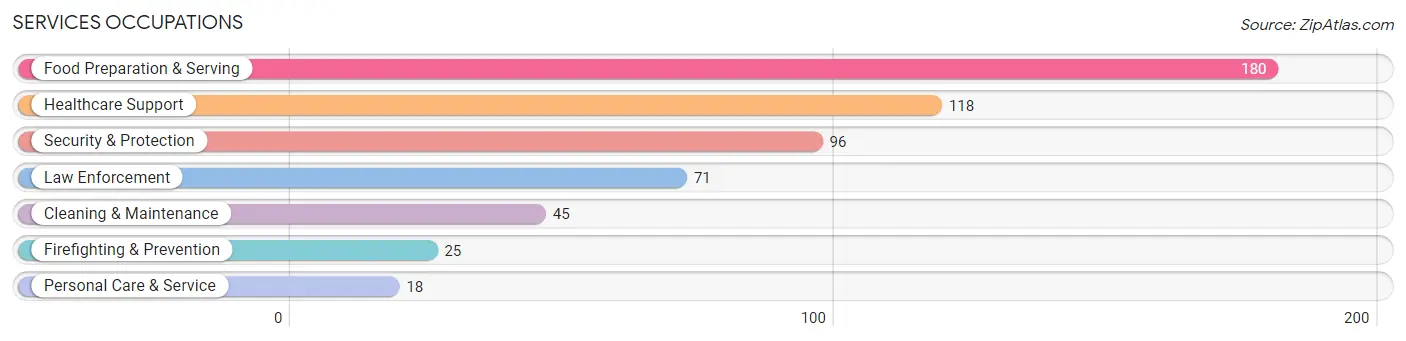
The most common Services occupations in Midway North are Food Preparation & Serving (180 | 10.7%), Healthcare Support (118 | 7.0%), Security & Protection (96 | 5.7%), Law Enforcement (71 | 4.2%), and Cleaning & Maintenance (45 | 2.7%).
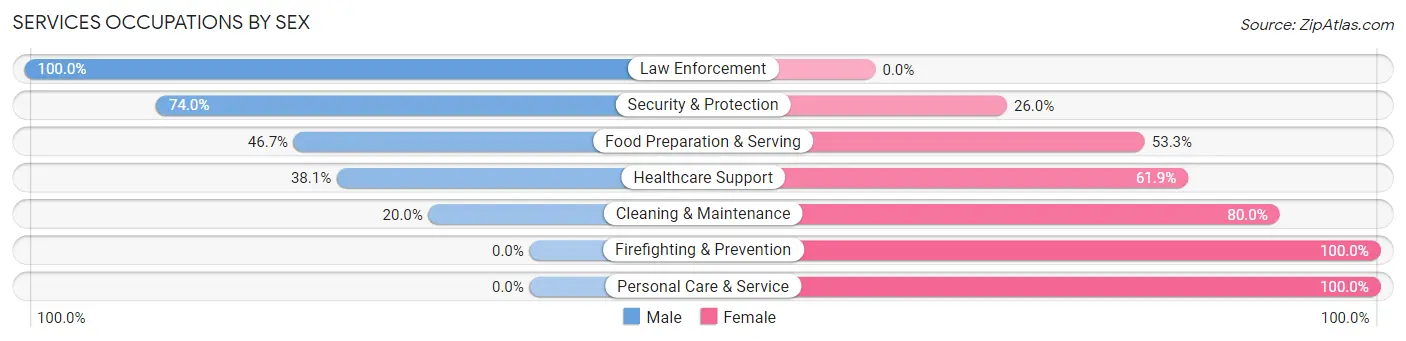
Services Occupations by Sex
Within the Services occupations in Midway North, the most male-oriented occupations are Law Enforcement (100.0%), Security & Protection (74.0%), and Food Preparation & Serving (46.7%), while the most female-oriented occupations are Firefighting & Prevention (100.0%), Personal Care & Service (100.0%), and Cleaning & Maintenance (80.0%).
| Occupation | Male | Female |
| Healthcare Support | 45 (38.1%) | 73 (61.9%) |
| Security & Protection | 71 (74.0%) | 25 (26.0%) |
| Firefighting & Prevention | 0 (0.0%) | 25 (100.0%) |
| Law Enforcement | 71 (100.0%) | 0 (0.0%) |
| Food Preparation & Serving | 84 (46.7%) | 96 (53.3%) |
| Cleaning & Maintenance | 9 (20.0%) | 36 (80.0%) |
| Personal Care & Service | 0 (0.0%) | 18 (100.0%) |
| Total (Category) | 209 (45.7%) | 248 (54.3%) |
| Total (Overall) | 973 (58.1%) | 703 (41.9%) |
Sales and Office Occupations
The most common Sales and Office occupations in Midway North are Office & Administration (160 | 9.6%), and Sales & Related (66 | 3.9%).

Sales and Office Occupations by Sex

| Occupation | Male | Female |
| Sales & Related | 30 (45.5%) | 36 (54.5%) |
| Office & Administration | 15 (9.4%) | 145 (90.6%) |
| Total (Category) | 45 (19.9%) | 181 (80.1%) |
| Total (Overall) | 973 (58.1%) | 703 (41.9%) |
Natural Resources, Construction and Maintenance Occupations
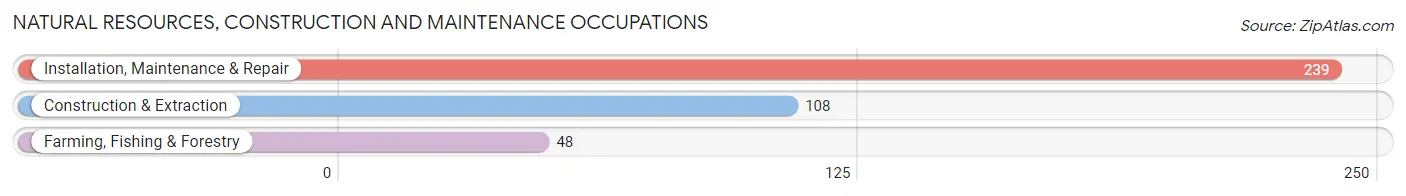
The most common Natural Resources, Construction and Maintenance occupations in Midway North are Installation, Maintenance & Repair (239 | 14.3%), Construction & Extraction (108 | 6.4%), and Farming, Fishing & Forestry (48 | 2.9%).
Natural Resources, Construction and Maintenance Occupations by Sex

| Occupation | Male | Female |
| Farming, Fishing & Forestry | 36 (75.0%) | 12 (25.0%) |
| Construction & Extraction | 108 (100.0%) | 0 (0.0%) |
| Installation, Maintenance & Repair | 239 (100.0%) | 0 (0.0%) |
| Total (Category) | 383 (97.0%) | 12 (3.0%) |
| Total (Overall) | 973 (58.1%) | 703 (41.9%) |
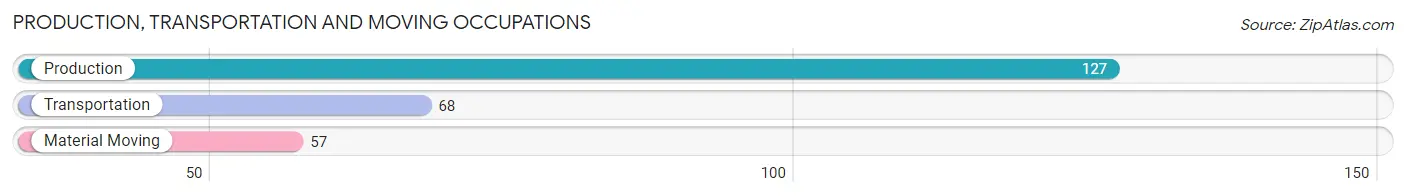
Production, Transportation and Moving Occupations
The most common Production, Transportation and Moving occupations in Midway North are Production (127 | 7.6%), Transportation (68 | 4.1%), and Material Moving (57 | 3.4%).
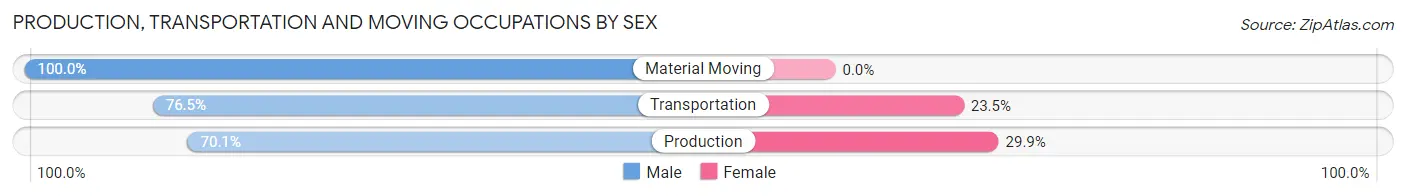
Production, Transportation and Moving Occupations by Sex
| Occupation | Male | Female |
| Production | 89 (70.1%) | 38 (29.9%) |
| Transportation | 52 (76.5%) | 16 (23.5%) |
| Material Moving | 57 (100.0%) | 0 (0.0%) |
| Total (Category) | 198 (78.6%) | 54 (21.4%) |
| Total (Overall) | 973 (58.1%) | 703 (41.9%) |
Employment Industries by Sex in Midway North
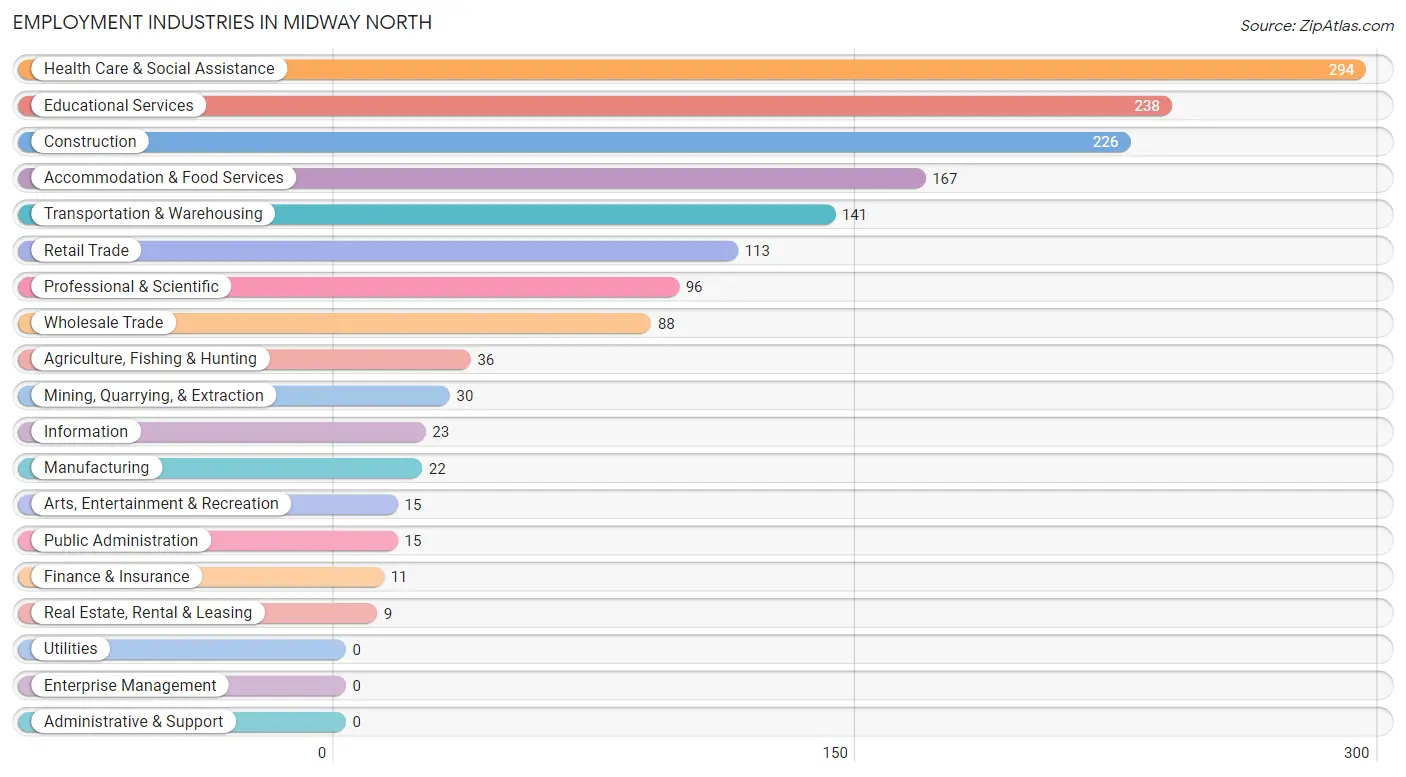
Employment Industries in Midway North
The major employment industries in Midway North include Health Care & Social Assistance (294 | 17.5%), Educational Services (238 | 14.2%), Construction (226 | 13.5%), Accommodation & Food Services (167 | 10.0%), and Transportation & Warehousing (141 | 8.4%).
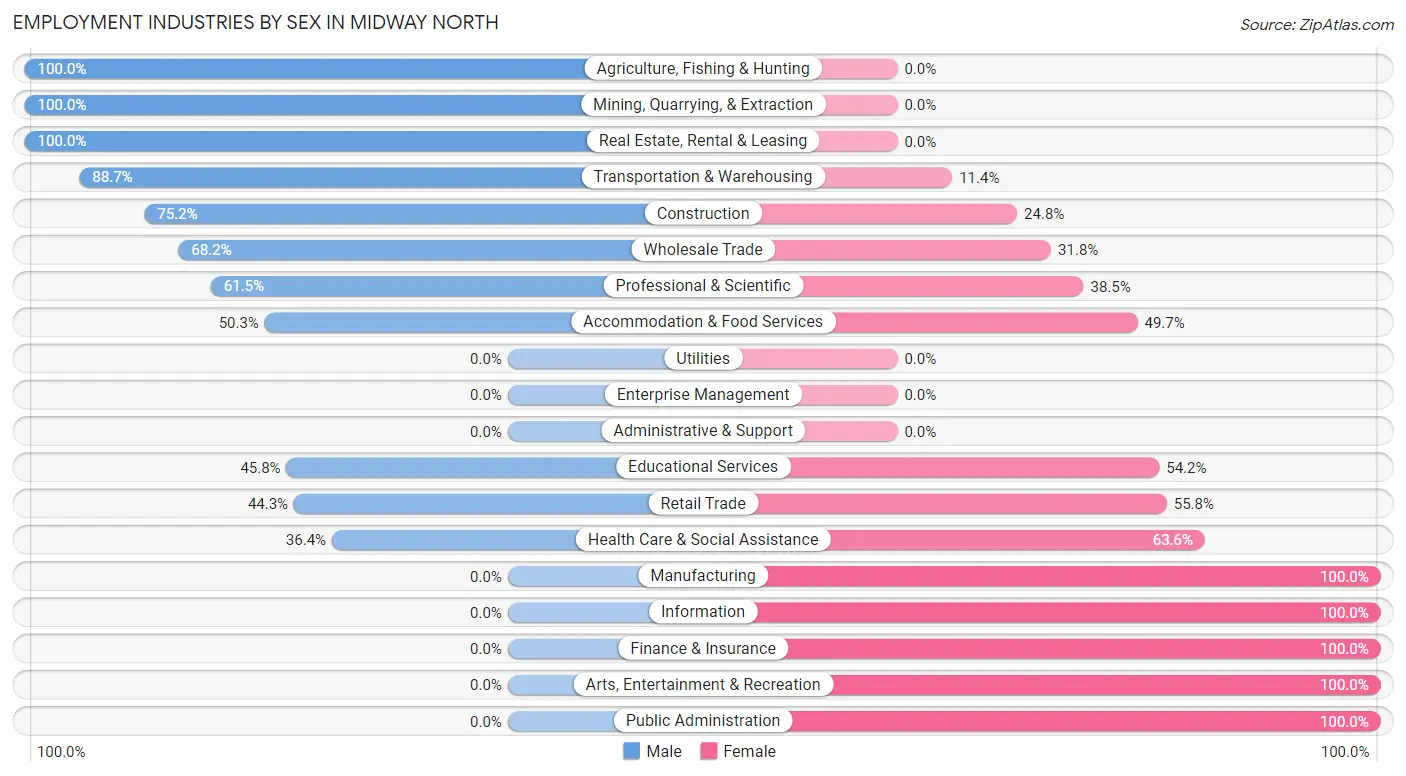
Employment Industries by Sex in Midway North
The Midway North industries that see more men than women are Agriculture, Fishing & Hunting (100.0%), Mining, Quarrying, & Extraction (100.0%), and Real Estate, Rental & Leasing (100.0%), whereas the industries that tend to have a higher number of women are Manufacturing (100.0%), Information (100.0%), and Finance & Insurance (100.0%).
| Industry | Male | Female |
| Agriculture, Fishing & Hunting | 36 (100.0%) | 0 (0.0%) |
| Mining, Quarrying, & Extraction | 30 (100.0%) | 0 (0.0%) |
| Construction | 170 (75.2%) | 56 (24.8%) |
| Manufacturing | 0 (0.0%) | 22 (100.0%) |
| Wholesale Trade | 60 (68.2%) | 28 (31.8%) |
| Retail Trade | 50 (44.3%) | 63 (55.7%) |
| Transportation & Warehousing | 125 (88.6%) | 16 (11.4%) |
| Utilities | 0 (0.0%) | 0 (0.0%) |
| Information | 0 (0.0%) | 23 (100.0%) |
| Finance & Insurance | 0 (0.0%) | 11 (100.0%) |
| Real Estate, Rental & Leasing | 9 (100.0%) | 0 (0.0%) |
| Professional & Scientific | 59 (61.5%) | 37 (38.5%) |
| Enterprise Management | 0 (0.0%) | 0 (0.0%) |
| Administrative & Support | 0 (0.0%) | 0 (0.0%) |
| Educational Services | 109 (45.8%) | 129 (54.2%) |
| Health Care & Social Assistance | 107 (36.4%) | 187 (63.6%) |
| Arts, Entertainment & Recreation | 0 (0.0%) | 15 (100.0%) |
| Accommodation & Food Services | 84 (50.3%) | 83 (49.7%) |
| Public Administration | 0 (0.0%) | 15 (100.0%) |
| Total | 973 (58.1%) | 703 (41.9%) |
Education in Midway North
School Enrollment in Midway North
The most common levels of schooling among the 1,313 students in Midway North are high school (378 | 28.8%), middle school (370 | 28.2%), and elementary school (304 | 23.2%).
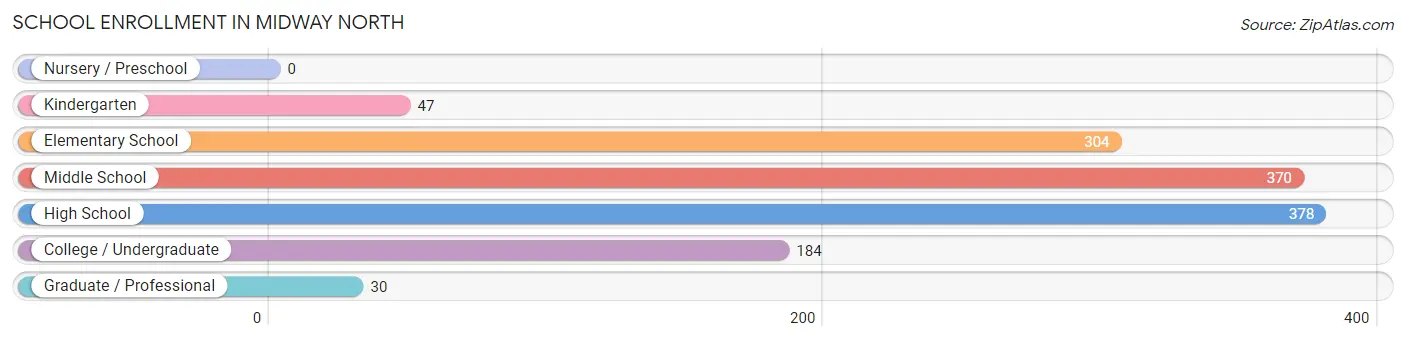
| School Level | # Students | % Students |
| Nursery / Preschool | 0 | 0.0% |
| Kindergarten | 47 | 3.6% |
| Elementary School | 304 | 23.2% |
| Middle School | 370 | 28.2% |
| High School | 378 | 28.8% |
| College / Undergraduate | 184 | 14.0% |
| Graduate / Professional | 30 | 2.3% |
| Total | 1,313 | 100.0% |
School Enrollment by Age by Funding Source in Midway North
Out of a total of 1,313 students who are enrolled in schools in Midway North, 71 (5.4%) attend a private institution, while the remaining 1,242 (94.6%) are enrolled in public schools. The age group of 20 to 24 year olds has the highest likelihood of being enrolled in private schools, with 71 (42.5% in the age bracket) enrolled. Conversely, the age group of 3 to 4 year olds has the lowest likelihood of being enrolled in a private school, with 5 (100.0% in the age bracket) attending a public institution.
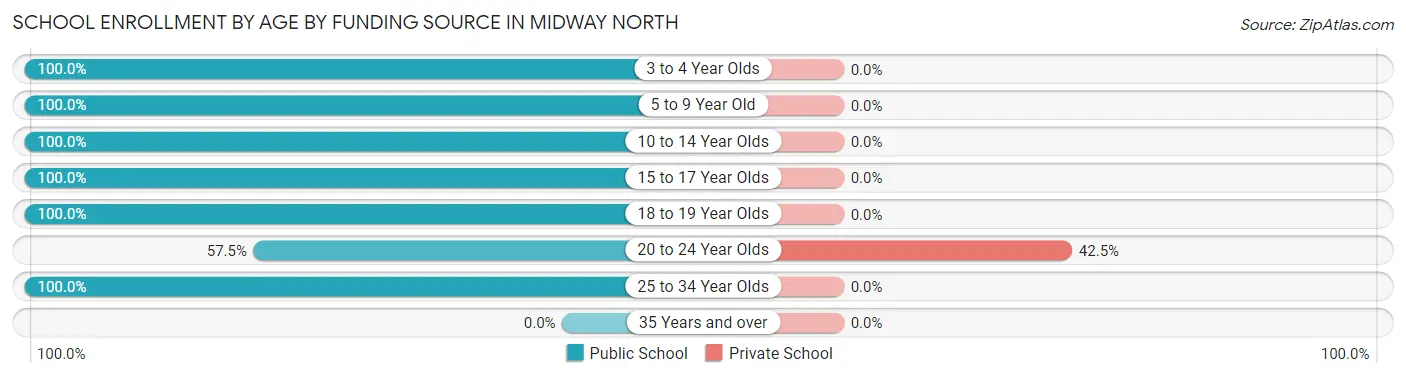
| Age Bracket | Public School | Private School |
| 3 to 4 Year Olds | 5 (100.0%) | 0 (0.0%) |
| 5 to 9 Year Old | 277 (100.0%) | 0 (0.0%) |
| 10 to 14 Year Olds | 454 (100.0%) | 0 (0.0%) |
| 15 to 17 Year Olds | 299 (100.0%) | 0 (0.0%) |
| 18 to 19 Year Olds | 64 (100.0%) | 0 (0.0%) |
| 20 to 24 Year Olds | 96 (57.5%) | 71 (42.5%) |
| 25 to 34 Year Olds | 47 (100.0%) | 0 (0.0%) |
| 35 Years and over | 0 (0.0%) | 0 (0.0%) |
| Total | 1,242 (94.6%) | 71 (5.4%) |
Educational Attainment by Field of Study in Midway North
Engineering (105 | 20.4%), arts & humanities (105 | 20.4%), science & technology (66 | 12.8%), education (55 | 10.7%), and bio, nature & agricultural (32 | 6.2%) are the most common fields of study among 514 individuals in Midway North who have obtained a bachelor's degree or higher.
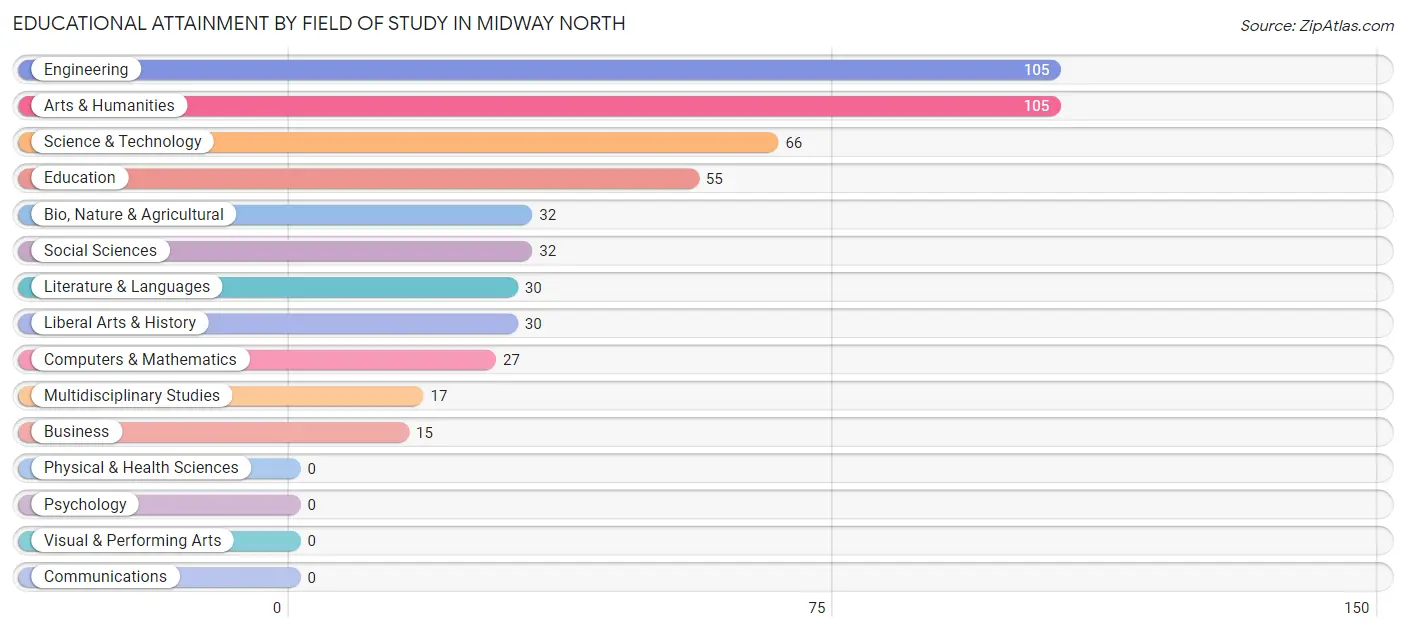
| Field of Study | # Graduates | % Graduates |
| Computers & Mathematics | 27 | 5.2% |
| Bio, Nature & Agricultural | 32 | 6.2% |
| Physical & Health Sciences | 0 | 0.0% |
| Psychology | 0 | 0.0% |
| Social Sciences | 32 | 6.2% |
| Engineering | 105 | 20.4% |
| Multidisciplinary Studies | 17 | 3.3% |
| Science & Technology | 66 | 12.8% |
| Business | 15 | 2.9% |
| Education | 55 | 10.7% |
| Literature & Languages | 30 | 5.8% |
| Liberal Arts & History | 30 | 5.8% |
| Visual & Performing Arts | 0 | 0.0% |
| Communications | 0 | 0.0% |
| Arts & Humanities | 105 | 20.4% |
| Total | 514 | 100.0% |
Transportation & Commute in Midway North
Vehicle Availability by Sex in Midway North
The most prevalent vehicle ownership categories in Midway North are males with 2 vehicles (366, accounting for 37.6%) and females with 2 vehicles (213, making up 54.5%).
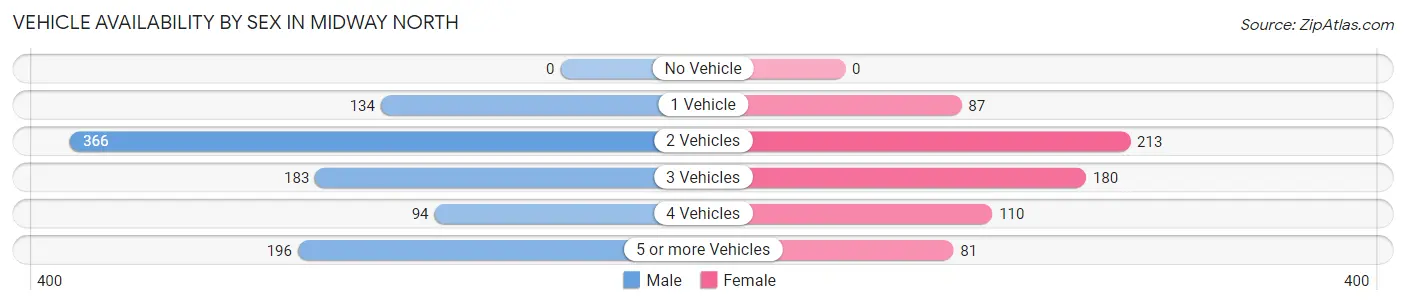
| Vehicles Available | Male | Female |
| No Vehicle | 0 (0.0%) | 0 (0.0%) |
| 1 Vehicle | 134 (13.8%) | 87 (13.0%) |
| 2 Vehicles | 366 (37.6%) | 213 (31.7%) |
| 3 Vehicles | 183 (18.8%) | 180 (26.8%) |
| 4 Vehicles | 94 (9.7%) | 110 (16.4%) |
| 5 or more Vehicles | 196 (20.1%) | 81 (12.1%) |
| Total | 973 (100.0%) | 671 (100.0%) |
Commute Time in Midway North
The most frequently occuring commute durations in Midway North are 10 to 14 minutes (346 commuters, 24.1%), 90 or more minutes (225 commuters, 15.7%), and 15 to 19 minutes (184 commuters, 12.8%).
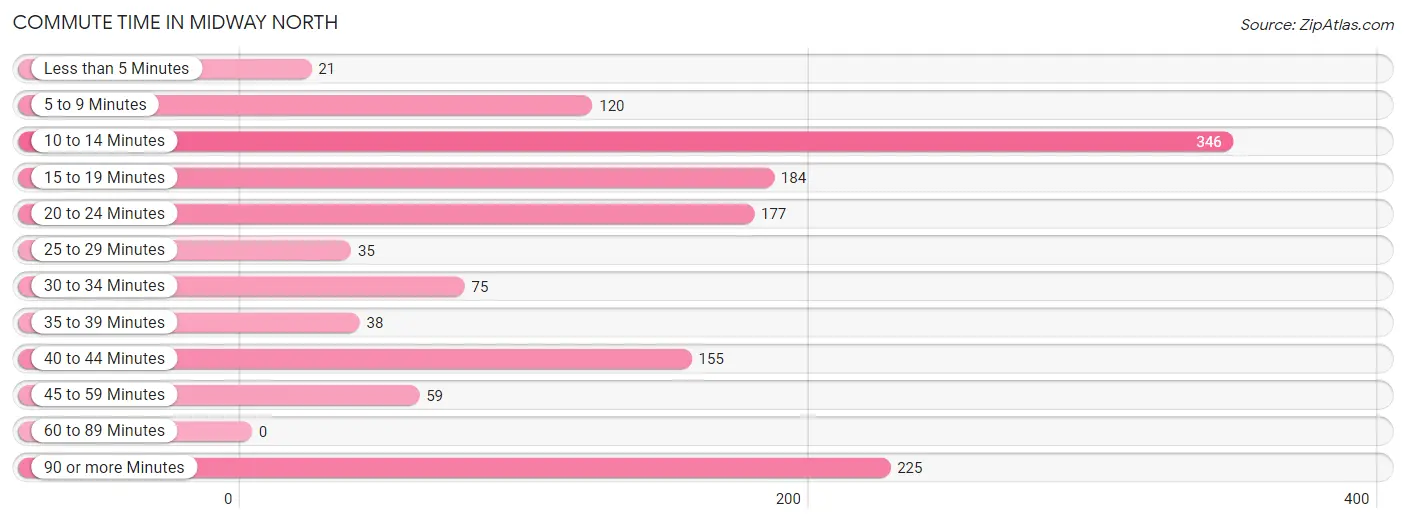
| Commute Time | # Commuters | % Commuters |
| Less than 5 Minutes | 21 | 1.5% |
| 5 to 9 Minutes | 120 | 8.4% |
| 10 to 14 Minutes | 346 | 24.1% |
| 15 to 19 Minutes | 184 | 12.8% |
| 20 to 24 Minutes | 177 | 12.3% |
| 25 to 29 Minutes | 35 | 2.4% |
| 30 to 34 Minutes | 75 | 5.2% |
| 35 to 39 Minutes | 38 | 2.6% |
| 40 to 44 Minutes | 155 | 10.8% |
| 45 to 59 Minutes | 59 | 4.1% |
| 60 to 89 Minutes | 0 | 0.0% |
| 90 or more Minutes | 225 | 15.7% |
Commute Time by Sex in Midway North
The most common commute times in Midway North are 90 or more minutes (225 commuters, 28.5%) for males and 10 to 14 minutes (203 commuters, 31.4%) for females.
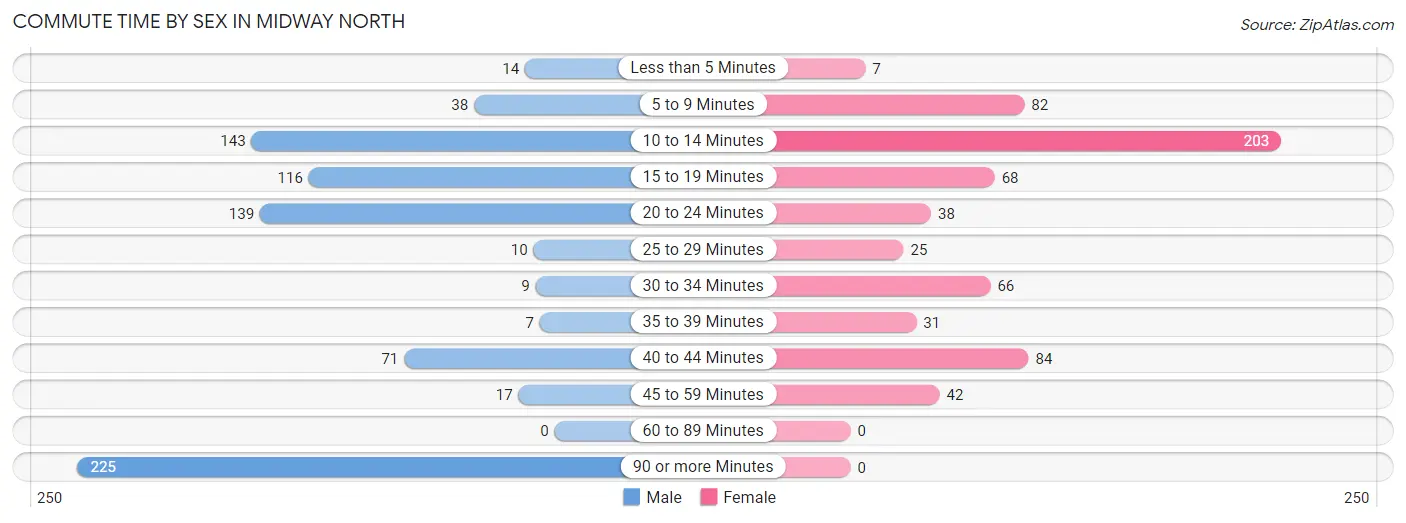
| Commute Time | Male | Female |
| Less than 5 Minutes | 14 (1.8%) | 7 (1.1%) |
| 5 to 9 Minutes | 38 (4.8%) | 82 (12.7%) |
| 10 to 14 Minutes | 143 (18.1%) | 203 (31.4%) |
| 15 to 19 Minutes | 116 (14.7%) | 68 (10.5%) |
| 20 to 24 Minutes | 139 (17.6%) | 38 (5.9%) |
| 25 to 29 Minutes | 10 (1.3%) | 25 (3.9%) |
| 30 to 34 Minutes | 9 (1.1%) | 66 (10.2%) |
| 35 to 39 Minutes | 7 (0.9%) | 31 (4.8%) |
| 40 to 44 Minutes | 71 (9.0%) | 84 (13.0%) |
| 45 to 59 Minutes | 17 (2.1%) | 42 (6.5%) |
| 60 to 89 Minutes | 0 (0.0%) | 0 (0.0%) |
| 90 or more Minutes | 225 (28.5%) | 0 (0.0%) |
Time of Departure to Work by Sex in Midway North
The most frequent times of departure to work in Midway North are 7:00 AM to 7:29 AM (183, 23.2%) for males and 7:00 AM to 7:29 AM (200, 31.0%) for females.
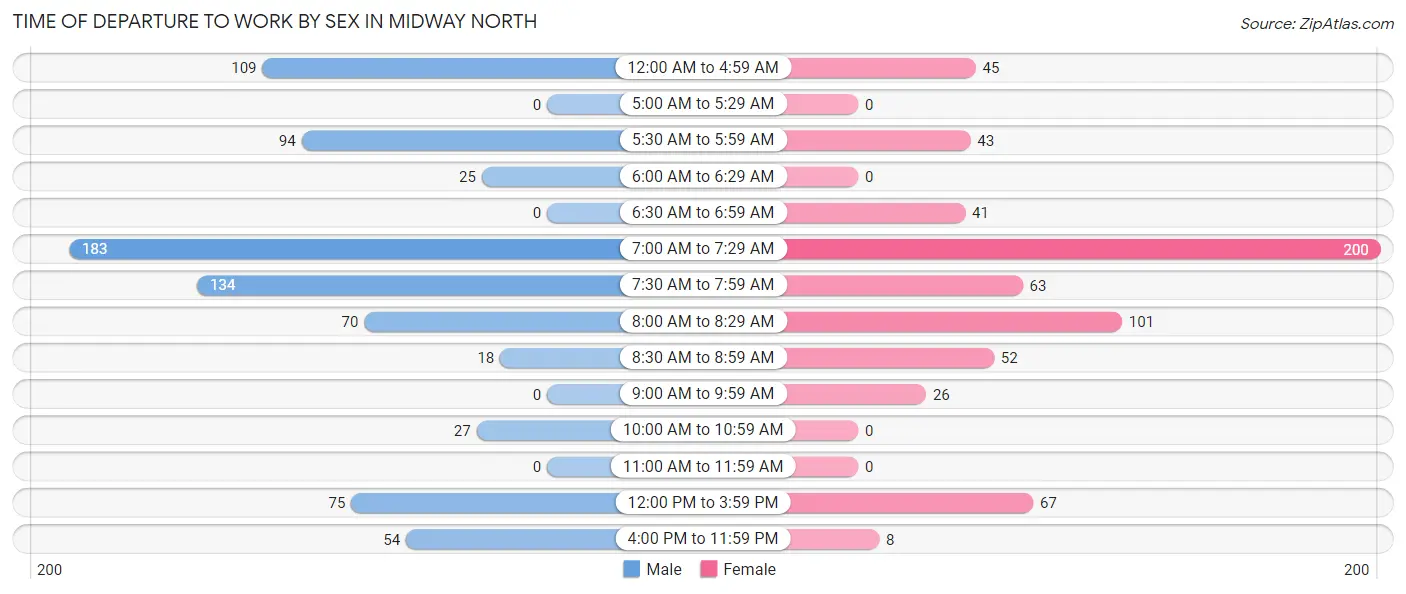
| Time of Departure | Male | Female |
| 12:00 AM to 4:59 AM | 109 (13.8%) | 45 (7.0%) |
| 5:00 AM to 5:29 AM | 0 (0.0%) | 0 (0.0%) |
| 5:30 AM to 5:59 AM | 94 (11.9%) | 43 (6.7%) |
| 6:00 AM to 6:29 AM | 25 (3.2%) | 0 (0.0%) |
| 6:30 AM to 6:59 AM | 0 (0.0%) | 41 (6.4%) |
| 7:00 AM to 7:29 AM | 183 (23.2%) | 200 (31.0%) |
| 7:30 AM to 7:59 AM | 134 (17.0%) | 63 (9.8%) |
| 8:00 AM to 8:29 AM | 70 (8.9%) | 101 (15.6%) |
| 8:30 AM to 8:59 AM | 18 (2.3%) | 52 (8.1%) |
| 9:00 AM to 9:59 AM | 0 (0.0%) | 26 (4.0%) |
| 10:00 AM to 10:59 AM | 27 (3.4%) | 0 (0.0%) |
| 11:00 AM to 11:59 AM | 0 (0.0%) | 0 (0.0%) |
| 12:00 PM to 3:59 PM | 75 (9.5%) | 67 (10.4%) |
| 4:00 PM to 11:59 PM | 54 (6.8%) | 8 (1.2%) |
| Total | 789 (100.0%) | 646 (100.0%) |
Housing Occupancy in Midway North
Occupancy by Ownership in Midway North
Of the total 977 dwellings in Midway North, owner-occupied units account for 851 (87.1%), while renter-occupied units make up 126 (12.9%).
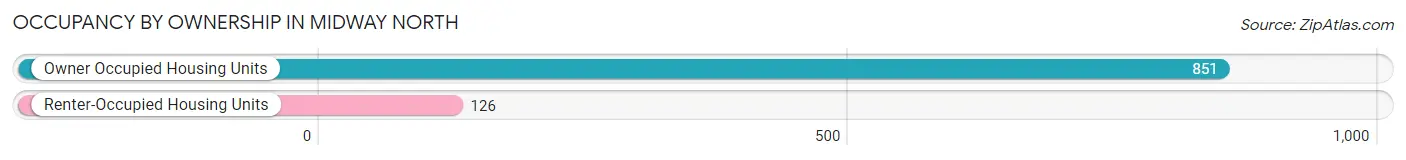
| Occupancy | # Housing Units | % Housing Units |
| Owner Occupied Housing Units | 851 | 87.1% |
| Renter-Occupied Housing Units | 126 | 12.9% |
| Total Occupied Housing Units | 977 | 100.0% |
Occupancy by Household Size in Midway North
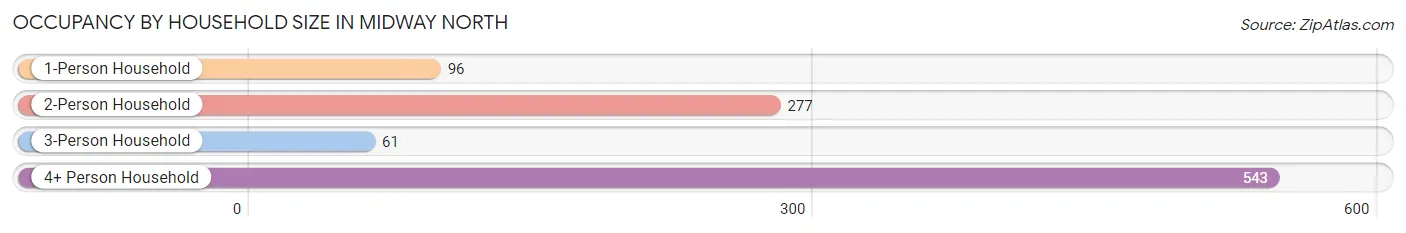
| Household Size | # Housing Units | % Housing Units |
| 1-Person Household | 96 | 9.8% |
| 2-Person Household | 277 | 28.3% |
| 3-Person Household | 61 | 6.2% |
| 4+ Person Household | 543 | 55.6% |
| Total Housing Units | 977 | 100.0% |
Occupancy by Ownership by Household Size in Midway North
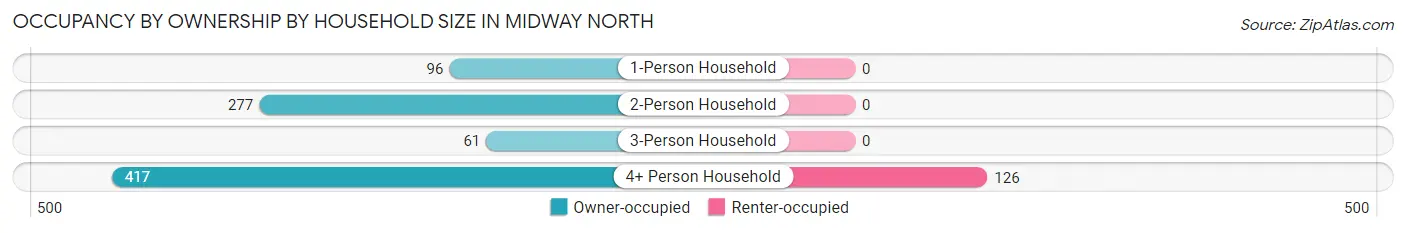
| Household Size | Owner-occupied | Renter-occupied |
| 1-Person Household | 96 (100.0%) | 0 (0.0%) |
| 2-Person Household | 277 (100.0%) | 0 (0.0%) |
| 3-Person Household | 61 (100.0%) | 0 (0.0%) |
| 4+ Person Household | 417 (76.8%) | 126 (23.2%) |
| Total Housing Units | 851 (87.1%) | 126 (12.9%) |
Occupancy by Educational Attainment in Midway North
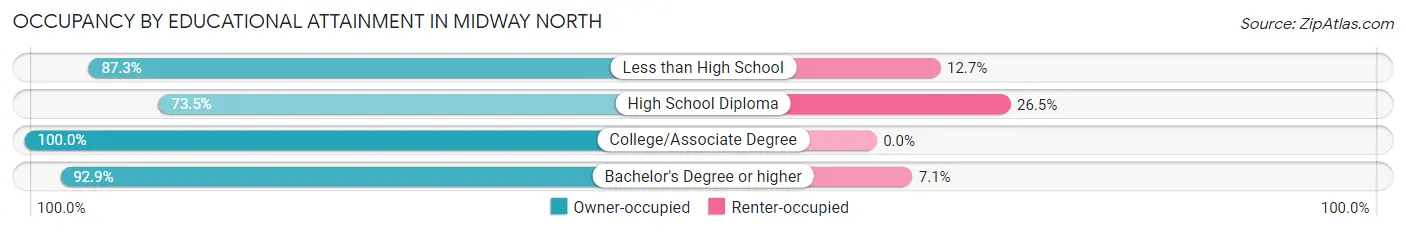
| Household Size | Owner-occupied | Renter-occupied |
| Less than High School | 393 (87.3%) | 57 (12.7%) |
| High School Diploma | 155 (73.5%) | 56 (26.5%) |
| College/Associate Degree | 132 (100.0%) | 0 (0.0%) |
| Bachelor's Degree or higher | 171 (92.9%) | 13 (7.1%) |
Occupancy by Age of Householder in Midway North
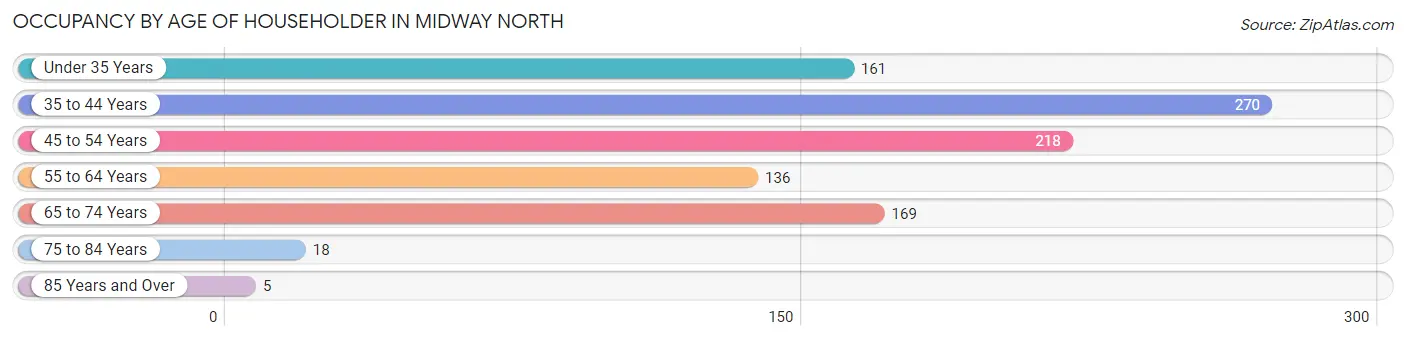
| Age Bracket | # Households | % Households |
| Under 35 Years | 161 | 16.5% |
| 35 to 44 Years | 270 | 27.6% |
| 45 to 54 Years | 218 | 22.3% |
| 55 to 64 Years | 136 | 13.9% |
| 65 to 74 Years | 169 | 17.3% |
| 75 to 84 Years | 18 | 1.8% |
| 85 Years and Over | 5 | 0.5% |
| Total | 977 | 100.0% |
Housing Finances in Midway North
Median Income by Occupancy in Midway North
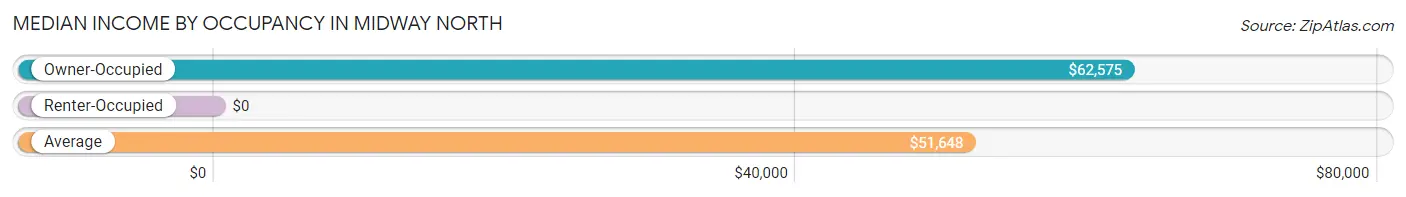
| Occupancy Type | # Households | Median Income |
| Owner-Occupied | 851 (87.1%) | $62,575 |
| Renter-Occupied | 126 (12.9%) | $0 |
| Average | 977 (100.0%) | $51,648 |
Occupancy by Householder Income Bracket in Midway North
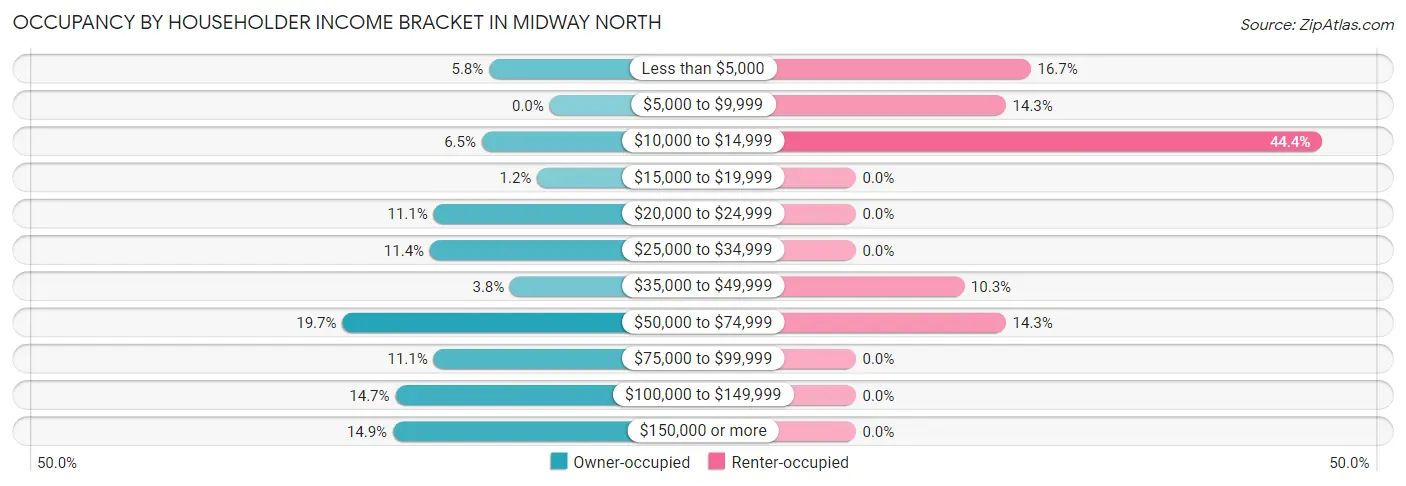
| Income Bracket | Owner-occupied | Renter-occupied |
| Less than $5,000 | 49 (5.8%) | 21 (16.7%) |
| $5,000 to $9,999 | 0 (0.0%) | 18 (14.3%) |
| $10,000 to $14,999 | 55 (6.5%) | 56 (44.4%) |
| $15,000 to $19,999 | 10 (1.2%) | 0 (0.0%) |
| $20,000 to $24,999 | 94 (11.1%) | 0 (0.0%) |
| $25,000 to $34,999 | 97 (11.4%) | 0 (0.0%) |
| $35,000 to $49,999 | 32 (3.8%) | 13 (10.3%) |
| $50,000 to $74,999 | 168 (19.7%) | 18 (14.3%) |
| $75,000 to $99,999 | 94 (11.1%) | 0 (0.0%) |
| $100,000 to $149,999 | 125 (14.7%) | 0 (0.0%) |
| $150,000 or more | 127 (14.9%) | 0 (0.0%) |
| Total | 851 (100.0%) | 126 (100.0%) |
Monthly Housing Cost Tiers in Midway North
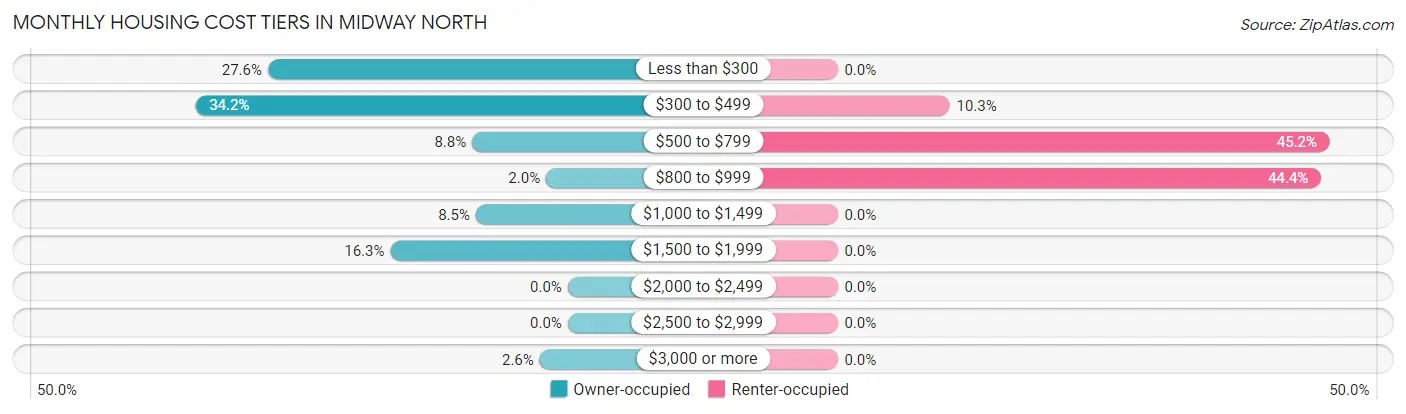
| Monthly Cost | Owner-occupied | Renter-occupied |
| Less than $300 | 235 (27.6%) | 0 (0.0%) |
| $300 to $499 | 291 (34.2%) | 13 (10.3%) |
| $500 to $799 | 75 (8.8%) | 57 (45.2%) |
| $800 to $999 | 17 (2.0%) | 56 (44.4%) |
| $1,000 to $1,499 | 72 (8.5%) | 0 (0.0%) |
| $1,500 to $1,999 | 139 (16.3%) | 0 (0.0%) |
| $2,000 to $2,499 | 0 (0.0%) | 0 (0.0%) |
| $2,500 to $2,999 | 0 (0.0%) | 0 (0.0%) |
| $3,000 or more | 22 (2.6%) | 0 (0.0%) |
| Total | 851 (100.0%) | 126 (100.0%) |
Physical Housing Characteristics in Midway North
Housing Structures in Midway North
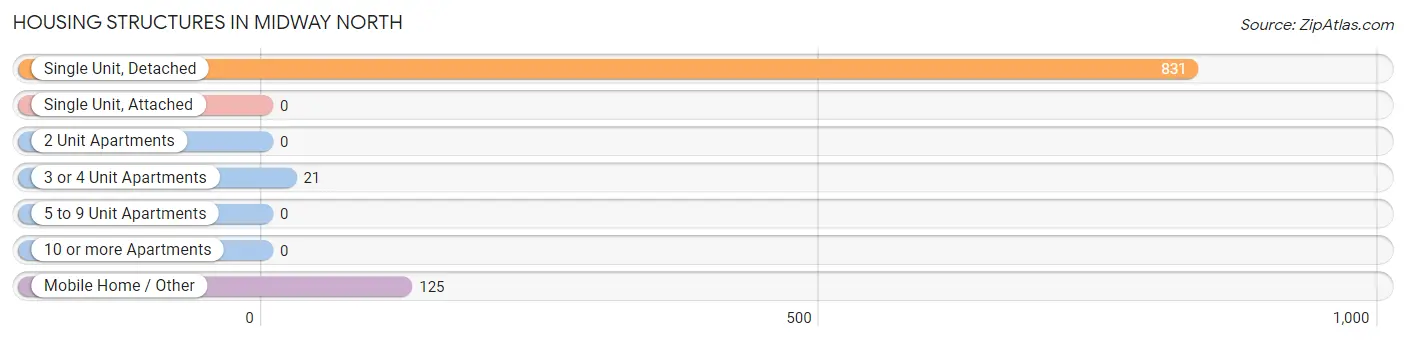
| Structure Type | # Housing Units | % Housing Units |
| Single Unit, Detached | 831 | 85.1% |
| Single Unit, Attached | 0 | 0.0% |
| 2 Unit Apartments | 0 | 0.0% |
| 3 or 4 Unit Apartments | 21 | 2.1% |
| 5 to 9 Unit Apartments | 0 | 0.0% |
| 10 or more Apartments | 0 | 0.0% |
| Mobile Home / Other | 125 | 12.8% |
| Total | 977 | 100.0% |
Housing Structures by Occupancy in Midway North
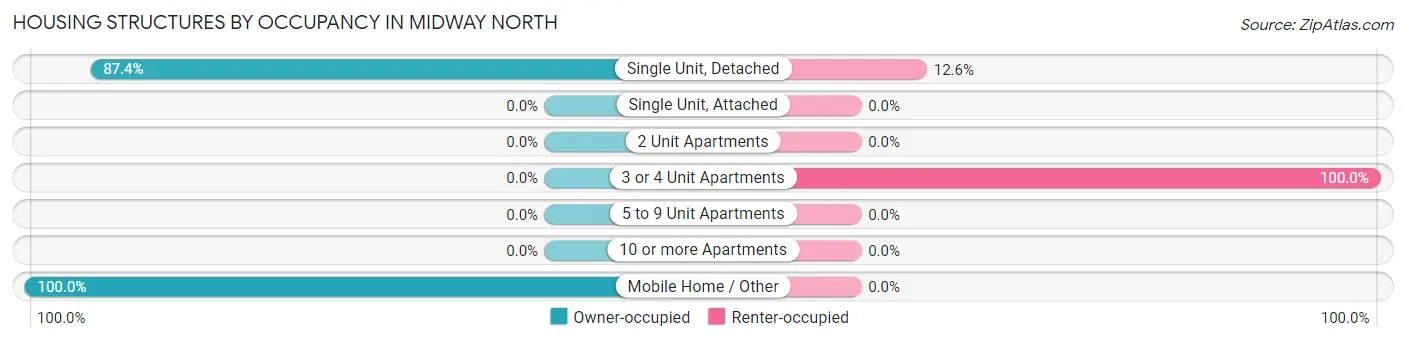
| Structure Type | Owner-occupied | Renter-occupied |
| Single Unit, Detached | 726 (87.4%) | 105 (12.6%) |
| Single Unit, Attached | 0 (0.0%) | 0 (0.0%) |
| 2 Unit Apartments | 0 (0.0%) | 0 (0.0%) |
| 3 or 4 Unit Apartments | 0 (0.0%) | 21 (100.0%) |
| 5 to 9 Unit Apartments | 0 (0.0%) | 0 (0.0%) |
| 10 or more Apartments | 0 (0.0%) | 0 (0.0%) |
| Mobile Home / Other | 125 (100.0%) | 0 (0.0%) |
| Total | 851 (87.1%) | 126 (12.9%) |
Housing Structures by Number of Rooms in Midway North
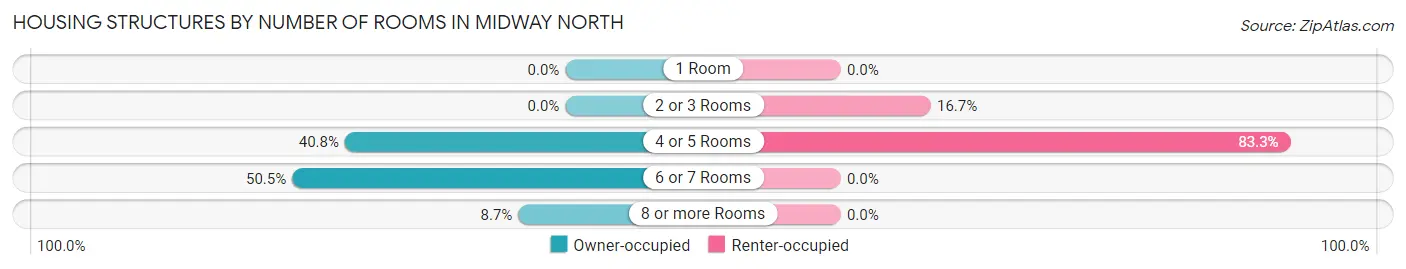
| Number of Rooms | Owner-occupied | Renter-occupied |
| 1 Room | 0 (0.0%) | 0 (0.0%) |
| 2 or 3 Rooms | 0 (0.0%) | 21 (16.7%) |
| 4 or 5 Rooms | 347 (40.8%) | 105 (83.3%) |
| 6 or 7 Rooms | 430 (50.5%) | 0 (0.0%) |
| 8 or more Rooms | 74 (8.7%) | 0 (0.0%) |
| Total | 851 (100.0%) | 126 (100.0%) |
Housing Structure by Heating Type in Midway North
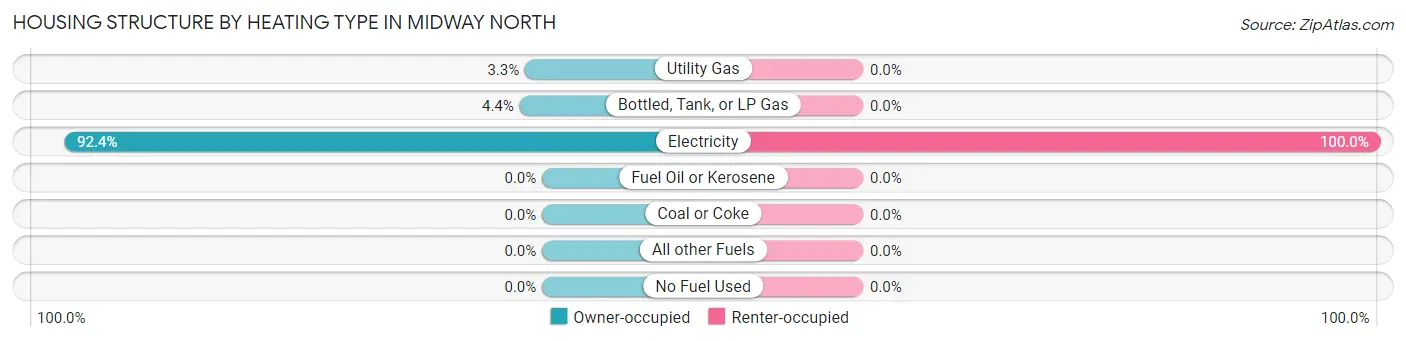
| Heating Type | Owner-occupied | Renter-occupied |
| Utility Gas | 28 (3.3%) | 0 (0.0%) |
| Bottled, Tank, or LP Gas | 37 (4.3%) | 0 (0.0%) |
| Electricity | 786 (92.4%) | 126 (100.0%) |
| Fuel Oil or Kerosene | 0 (0.0%) | 0 (0.0%) |
| Coal or Coke | 0 (0.0%) | 0 (0.0%) |
| All other Fuels | 0 (0.0%) | 0 (0.0%) |
| No Fuel Used | 0 (0.0%) | 0 (0.0%) |
| Total | 851 (100.0%) | 126 (100.0%) |
Household Vehicle Usage in Midway North
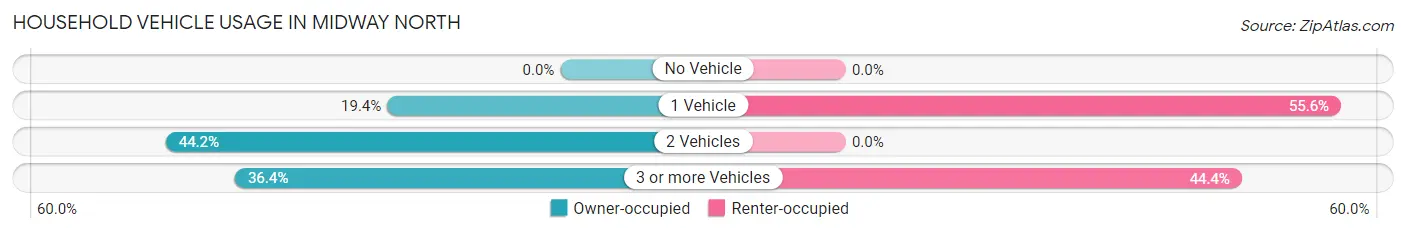
| Vehicles per Household | Owner-occupied | Renter-occupied |
| No Vehicle | 0 (0.0%) | 0 (0.0%) |
| 1 Vehicle | 165 (19.4%) | 70 (55.6%) |
| 2 Vehicles | 376 (44.2%) | 0 (0.0%) |
| 3 or more Vehicles | 310 (36.4%) | 56 (44.4%) |
| Total | 851 (100.0%) | 126 (100.0%) |
Real Estate & Mortgages in Midway North
Real Estate and Mortgage Overview in Midway North
| Characteristic | Without Mortgage | With Mortgage |
| Housing Units | 595 | 256 |
| Median Property Value | $81,800 | $165,900 |
| Median Household Income | $36,359 | $97 |
| Monthly Housing Costs | $356 | $22 |
| Real Estate Taxes | $1,567 | $0 |
Property Value by Mortgage Status in Midway North
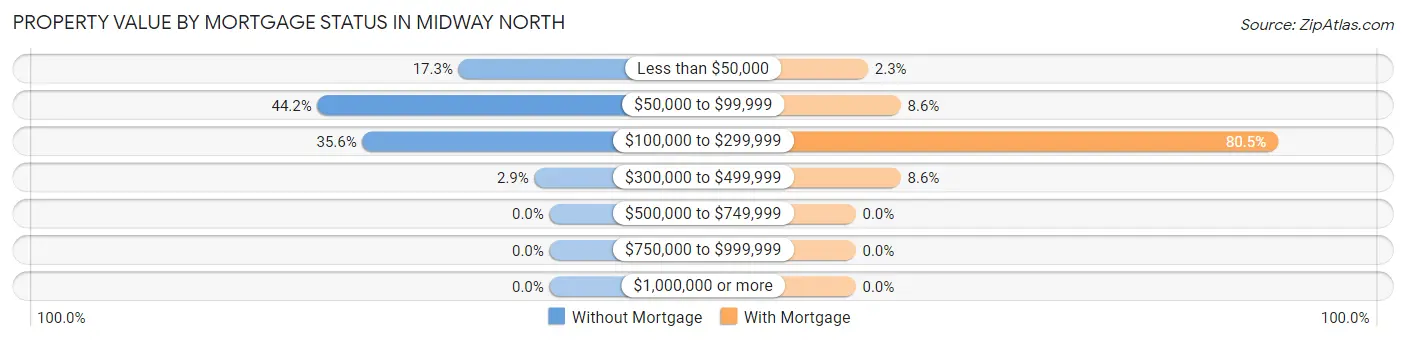
| Property Value | Without Mortgage | With Mortgage |
| Less than $50,000 | 103 (17.3%) | 6 (2.3%) |
| $50,000 to $99,999 | 263 (44.2%) | 22 (8.6%) |
| $100,000 to $299,999 | 212 (35.6%) | 206 (80.5%) |
| $300,000 to $499,999 | 17 (2.9%) | 22 (8.6%) |
| $500,000 to $749,999 | 0 (0.0%) | 0 (0.0%) |
| $750,000 to $999,999 | 0 (0.0%) | 0 (0.0%) |
| $1,000,000 or more | 0 (0.0%) | 0 (0.0%) |
| Total | 595 (100.0%) | 256 (100.0%) |
Household Income by Mortgage Status in Midway North
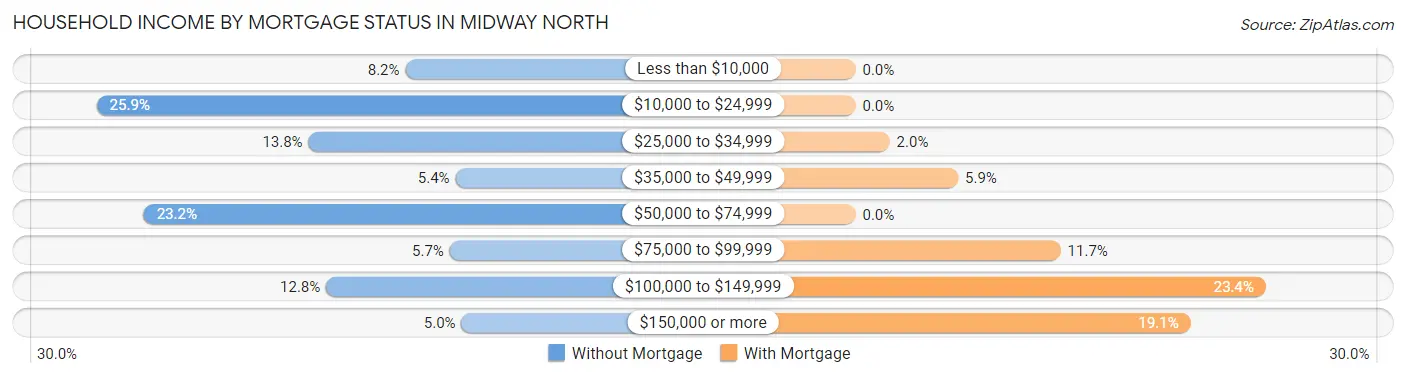
| Household Income | Without Mortgage | With Mortgage |
| Less than $10,000 | 49 (8.2%) | 0 (0.0%) |
| $10,000 to $24,999 | 154 (25.9%) | 0 (0.0%) |
| $25,000 to $34,999 | 82 (13.8%) | 5 (1.9%) |
| $35,000 to $49,999 | 32 (5.4%) | 15 (5.9%) |
| $50,000 to $74,999 | 138 (23.2%) | 0 (0.0%) |
| $75,000 to $99,999 | 34 (5.7%) | 30 (11.7%) |
| $100,000 to $149,999 | 76 (12.8%) | 60 (23.4%) |
| $150,000 or more | 30 (5.0%) | 49 (19.1%) |
| Total | 595 (100.0%) | 256 (100.0%) |
Property Value to Household Income Ratio in Midway North
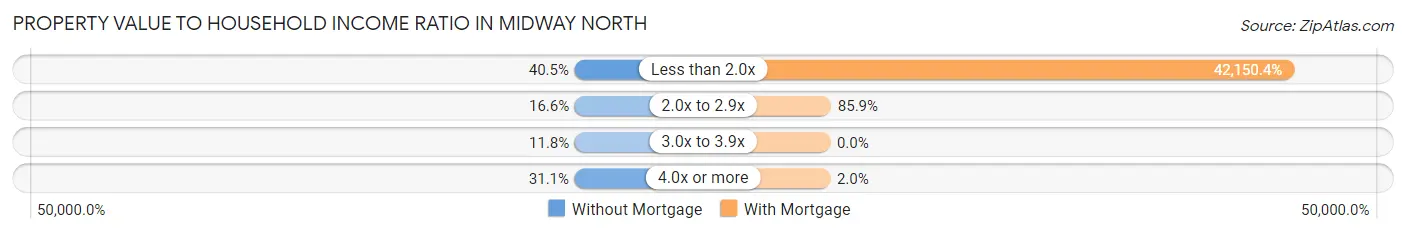
| Value-to-Income Ratio | Without Mortgage | With Mortgage |
| Less than 2.0x | 241 (40.5%) | 107,905 (42,150.4%) |
| 2.0x to 2.9x | 99 (16.6%) | 220 (85.9%) |
| 3.0x to 3.9x | 70 (11.8%) | 0 (0.0%) |
| 4.0x or more | 185 (31.1%) | 5 (1.9%) |
| Total | 595 (100.0%) | 256 (100.0%) |
Real Estate Taxes by Mortgage Status in Midway North
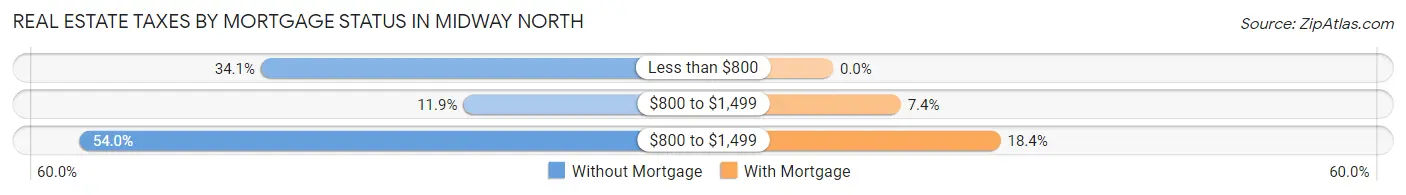
| Property Taxes | Without Mortgage | With Mortgage |
| Less than $800 | 203 (34.1%) | 0 (0.0%) |
| $800 to $1,499 | 71 (11.9%) | 19 (7.4%) |
| $800 to $1,499 | 321 (53.9%) | 47 (18.4%) |
| Total | 595 (100.0%) | 256 (100.0%) |
Health & Disability in Midway North
Health Insurance Coverage by Age in Midway North
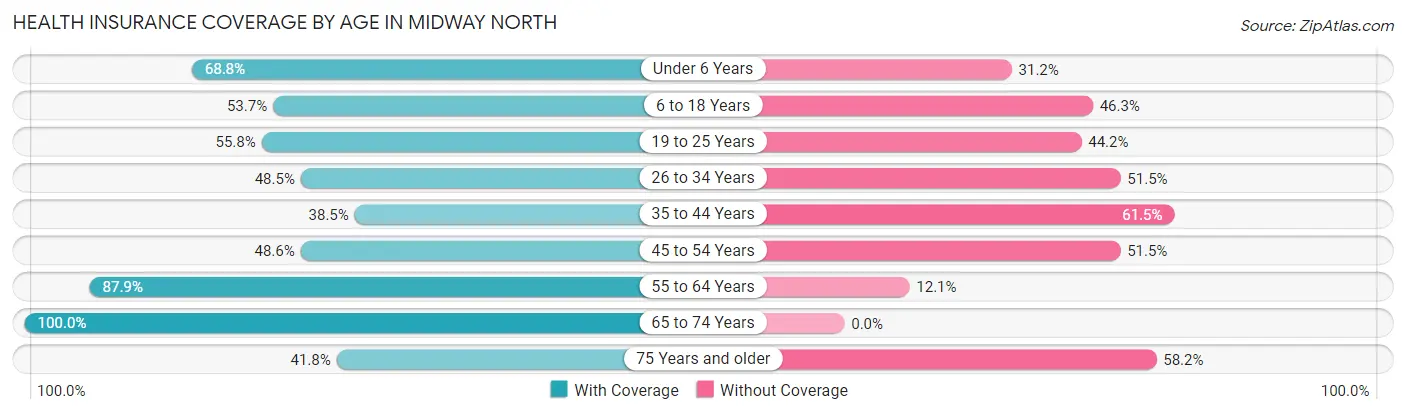
| Age Bracket | With Coverage | Without Coverage |
| Under 6 Years | 172 (68.8%) | 78 (31.2%) |
| 6 to 18 Years | 562 (53.7%) | 485 (46.3%) |
| 19 to 25 Years | 245 (55.8%) | 194 (44.2%) |
| 26 to 34 Years | 341 (48.5%) | 362 (51.5%) |
| 35 to 44 Years | 220 (38.5%) | 352 (61.5%) |
| 45 to 54 Years | 201 (48.5%) | 213 (51.4%) |
| 55 to 64 Years | 239 (87.9%) | 33 (12.1%) |
| 65 to 74 Years | 281 (100.0%) | 0 (0.0%) |
| 75 Years and older | 23 (41.8%) | 32 (58.2%) |
| Total | 2,284 (56.6%) | 1,749 (43.4%) |
Health Insurance Coverage by Citizenship Status in Midway North
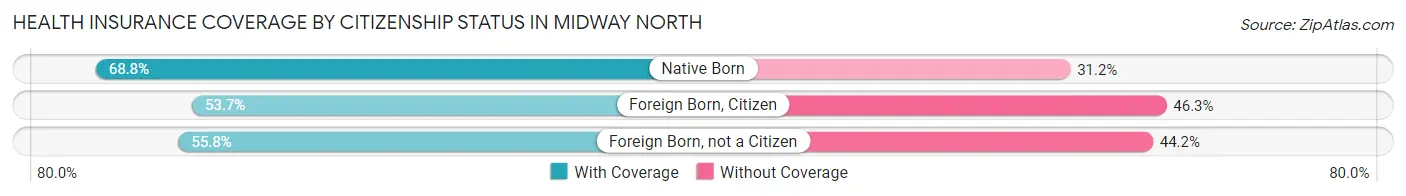
| Citizenship Status | With Coverage | Without Coverage |
| Native Born | 172 (68.8%) | 78 (31.2%) |
| Foreign Born, Citizen | 562 (53.7%) | 485 (46.3%) |
| Foreign Born, not a Citizen | 245 (55.8%) | 194 (44.2%) |
Health Insurance Coverage by Household Income in Midway North
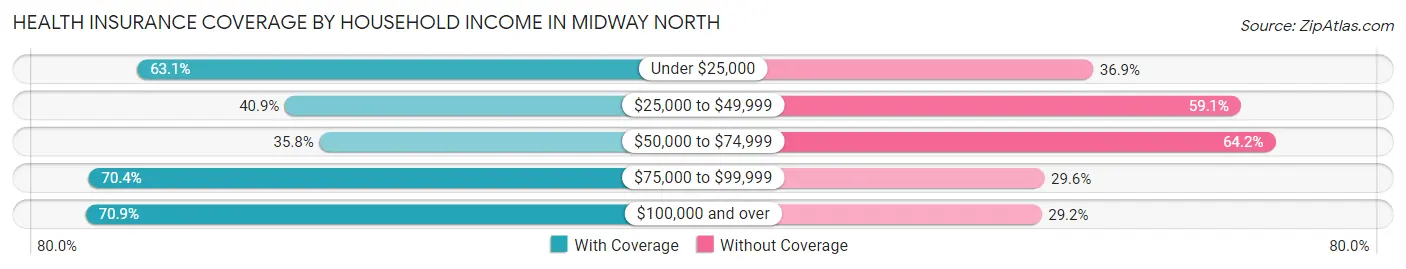
| Household Income | With Coverage | Without Coverage |
| Under $25,000 | 534 (63.1%) | 312 (36.9%) |
| $25,000 to $49,999 | 244 (40.9%) | 352 (59.1%) |
| $50,000 to $74,999 | 335 (35.8%) | 601 (64.2%) |
| $75,000 to $99,999 | 262 (70.4%) | 110 (29.6%) |
| $100,000 and over | 909 (70.9%) | 374 (29.1%) |
Public vs Private Health Insurance Coverage by Age in Midway North
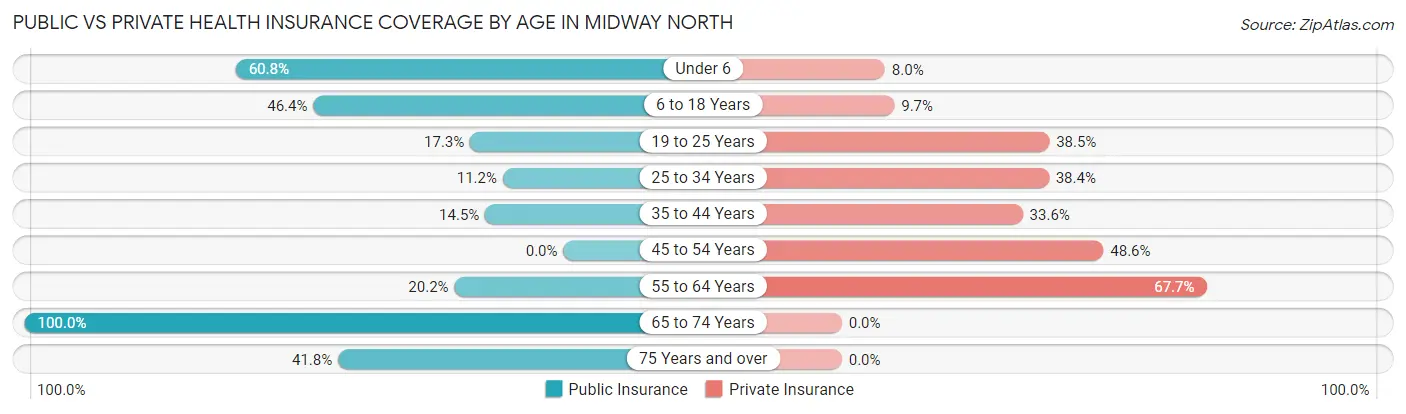
| Age Bracket | Public Insurance | Private Insurance |
| Under 6 | 152 (60.8%) | 20 (8.0%) |
| 6 to 18 Years | 486 (46.4%) | 102 (9.7%) |
| 19 to 25 Years | 76 (17.3%) | 169 (38.5%) |
| 25 to 34 Years | 79 (11.2%) | 270 (38.4%) |
| 35 to 44 Years | 83 (14.5%) | 192 (33.6%) |
| 45 to 54 Years | 0 (0.0%) | 201 (48.5%) |
| 55 to 64 Years | 55 (20.2%) | 184 (67.6%) |
| 65 to 74 Years | 281 (100.0%) | 0 (0.0%) |
| 75 Years and over | 23 (41.8%) | 0 (0.0%) |
| Total | 1,235 (30.6%) | 1,138 (28.2%) |
Disability Status by Sex by Age in Midway North
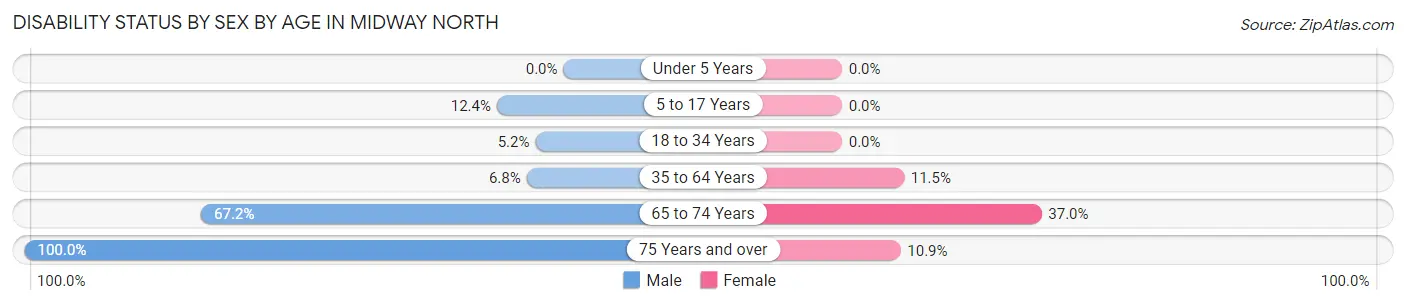
| Age Bracket | Male | Female |
| Under 5 Years | 0 (0.0%) | 0 (0.0%) |
| 5 to 17 Years | 70 (12.3%) | 0 (0.0%) |
| 18 to 34 Years | 31 (5.2%) | 0 (0.0%) |
| 35 to 64 Years | 42 (6.8%) | 74 (11.5%) |
| 65 to 74 Years | 80 (67.2%) | 60 (37.0%) |
| 75 Years and over | 9 (100.0%) | 5 (10.9%) |
Disability Class by Sex by Age in Midway North
Disability Class: Hearing Difficulty
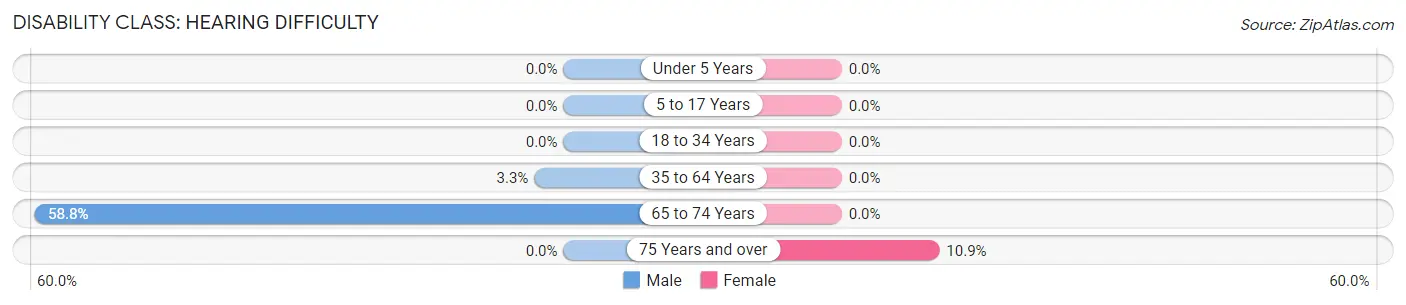
| Age Bracket | Male | Female |
| Under 5 Years | 0 (0.0%) | 0 (0.0%) |
| 5 to 17 Years | 0 (0.0%) | 0 (0.0%) |
| 18 to 34 Years | 0 (0.0%) | 0 (0.0%) |
| 35 to 64 Years | 20 (3.3%) | 0 (0.0%) |
| 65 to 74 Years | 70 (58.8%) | 0 (0.0%) |
| 75 Years and over | 0 (0.0%) | 5 (10.9%) |
Disability Class: Vision Difficulty
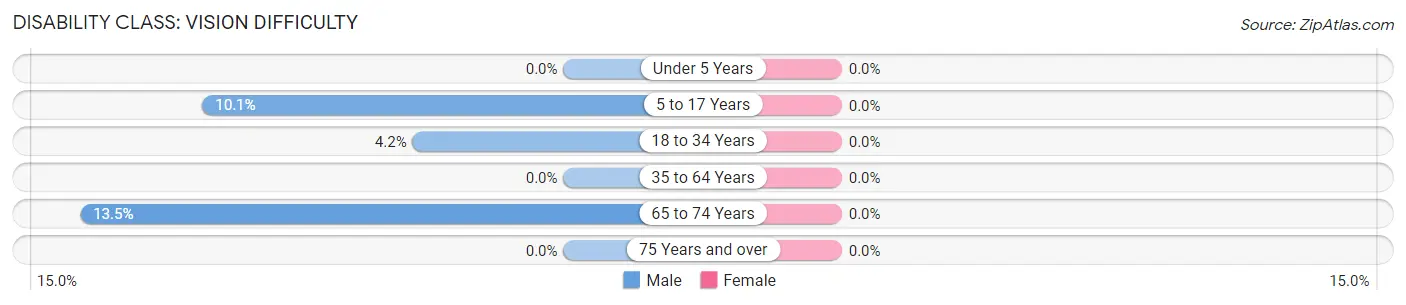
| Age Bracket | Male | Female |
| Under 5 Years | 0 (0.0%) | 0 (0.0%) |
| 5 to 17 Years | 57 (10.1%) | 0 (0.0%) |
| 18 to 34 Years | 25 (4.2%) | 0 (0.0%) |
| 35 to 64 Years | 0 (0.0%) | 0 (0.0%) |
| 65 to 74 Years | 16 (13.5%) | 0 (0.0%) |
| 75 Years and over | 0 (0.0%) | 0 (0.0%) |
Disability Class: Cognitive Difficulty
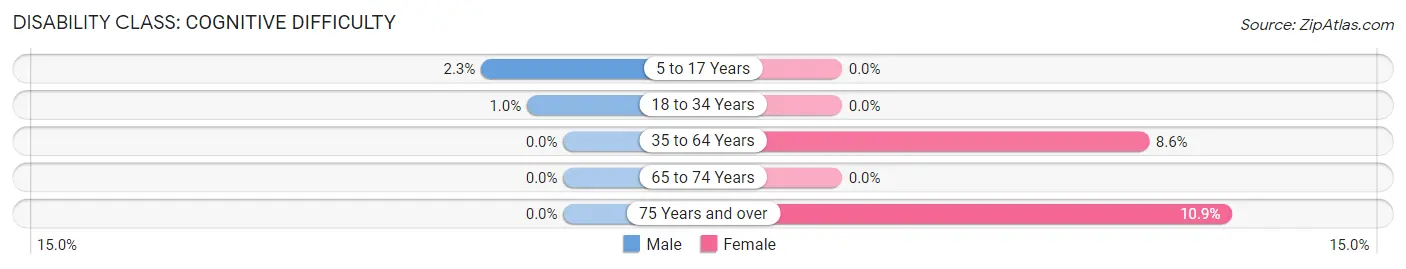
| Age Bracket | Male | Female |
| 5 to 17 Years | 13 (2.3%) | 0 (0.0%) |
| 18 to 34 Years | 6 (1.0%) | 0 (0.0%) |
| 35 to 64 Years | 0 (0.0%) | 55 (8.6%) |
| 65 to 74 Years | 0 (0.0%) | 0 (0.0%) |
| 75 Years and over | 0 (0.0%) | 5 (10.9%) |
Disability Class: Ambulatory Difficulty
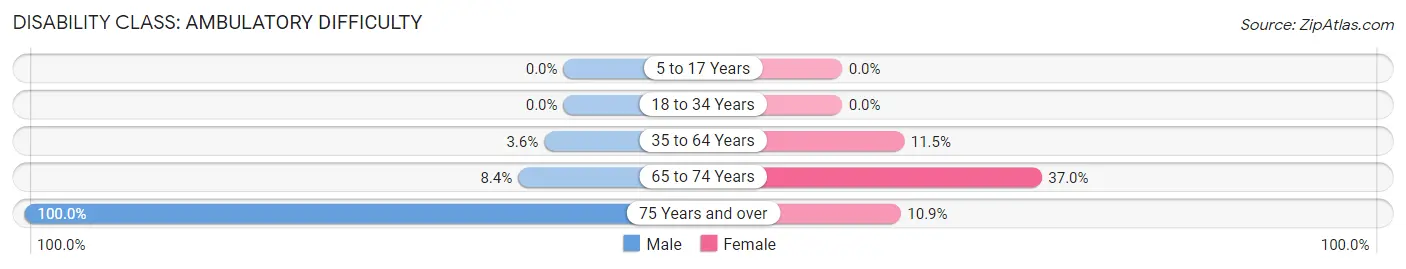
| Age Bracket | Male | Female |
| 5 to 17 Years | 0 (0.0%) | 0 (0.0%) |
| 18 to 34 Years | 0 (0.0%) | 0 (0.0%) |
| 35 to 64 Years | 22 (3.6%) | 74 (11.5%) |
| 65 to 74 Years | 10 (8.4%) | 60 (37.0%) |
| 75 Years and over | 9 (100.0%) | 5 (10.9%) |
Disability Class: Self-Care Difficulty
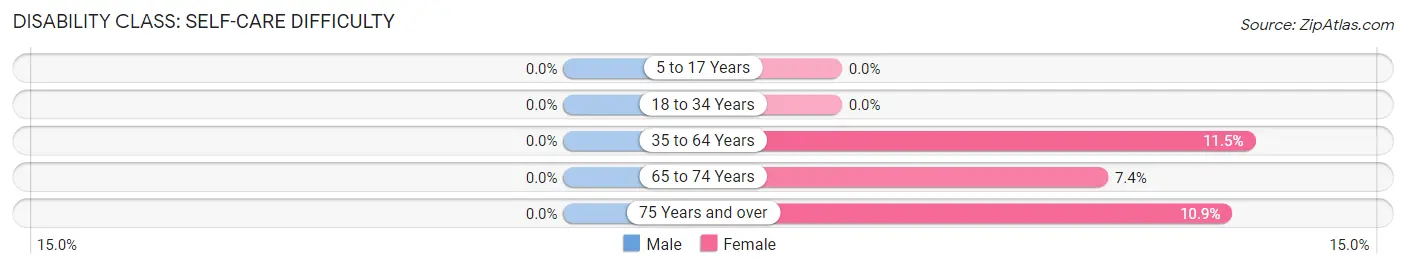
| Age Bracket | Male | Female |
| 5 to 17 Years | 0 (0.0%) | 0 (0.0%) |
| 18 to 34 Years | 0 (0.0%) | 0 (0.0%) |
| 35 to 64 Years | 0 (0.0%) | 74 (11.5%) |
| 65 to 74 Years | 0 (0.0%) | 12 (7.4%) |
| 75 Years and over | 0 (0.0%) | 5 (10.9%) |
Technology Access in Midway North
Computing Device Access in Midway North
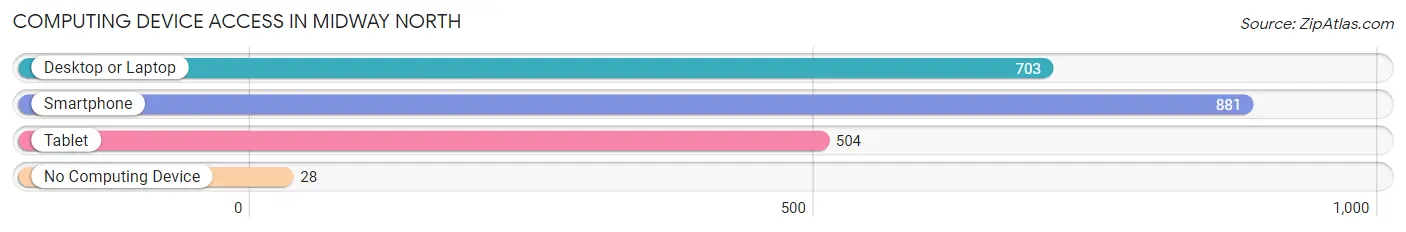
| Device Type | # Households | % Households |
| Desktop or Laptop | 703 | 72.0% |
| Smartphone | 881 | 90.2% |
| Tablet | 504 | 51.6% |
| No Computing Device | 28 | 2.9% |
| Total | 977 | 100.0% |
Internet Access in Midway North
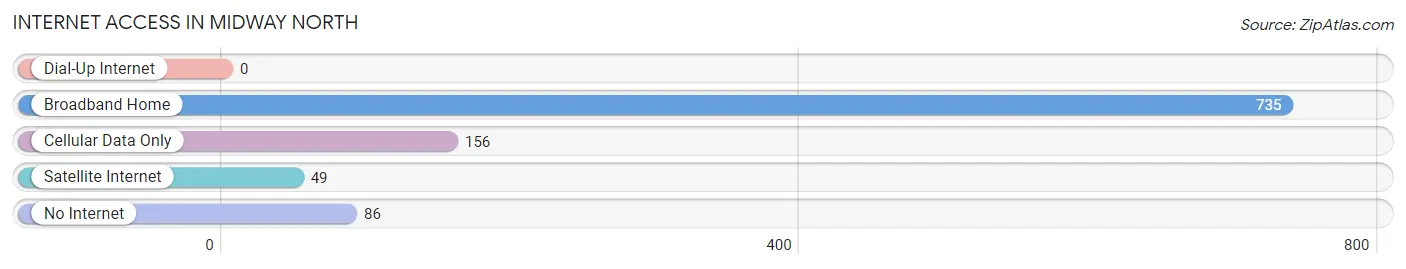
| Internet Type | # Households | % Households |
| Dial-Up Internet | 0 | 0.0% |
| Broadband Home | 735 | 75.2% |
| Cellular Data Only | 156 | 16.0% |
| Satellite Internet | 49 | 5.0% |
| No Internet | 86 | 8.8% |
| Total | 977 | 100.0% |
Midway North Summary
Midway North is a small unincorporated community located in Collin County, Texas, United States. It is situated approximately 25 miles north of Dallas and is part of the Dallas-Fort Worth-Arlington metropolitan area. The population of Midway North was estimated to be 1,845 in 2019.
History
Midway North was originally settled in the late 1800s by a group of German immigrants. The community was named after the nearby Midway Church, which was established in 1876. The church was named after the nearby Midway School, which was established in 1872.
The first post office in Midway North was established in 1883. The community was incorporated in 1891 and the first mayor was elected in 1892.
In the early 1900s, Midway North was a thriving agricultural community. The town was home to several cotton gins, a cottonseed oil mill, and a cottonseed huller. The town also had a general store, a blacksmith shop, and a hotel.
In the 1920s, Midway North began to experience a decline in population as many of the town's residents moved to larger cities in search of better job opportunities. The population of Midway North continued to decline until the 1950s when the town began to experience a resurgence in population growth.
Geography
Midway North is located in Collin County, Texas, approximately 25 miles north of Dallas. The town is situated on the western edge of the Blackland Prairie, a region of Texas known for its fertile soil and abundant wildlife.
The town is bordered by the cities of McKinney to the north, Plano to the east, and Frisco to the south. The town is also located near several major highways, including Interstate 35, US Highway 75, and State Highway 121.
Economy
Midway North is primarily a residential community, with most of its residents commuting to nearby cities for work. The town is home to several small businesses, including a grocery store, a gas station, and a few restaurants.
The town is also home to several industrial and manufacturing businesses, including a plastics manufacturer, a metal fabrication company, and a printing company.
Demographics
As of 2019, the population of Midway North was estimated to be 1,845. The town has a median age of 37.7 years and a median household income of $63,945.
The racial makeup of Midway North is 79.2% White, 11.2% Hispanic or Latino, 5.2% African American, and 4.4% Asian. The town has a population of 1,845 people, with a population density of 1,845 people per square mile.
Conclusion
Midway North is a small unincorporated community located in Collin County, Texas, approximately 25 miles north of Dallas. The town was originally settled in the late 1800s by a group of German immigrants and was incorporated in 1891. The town is primarily a residential community, with most of its residents commuting to nearby cities for work. The population of Midway North was estimated to be 1,845 in 2019. The town has a median age of 37.7 years and a median household income of $63,945. The racial makeup of Midway North is 79.2% White, 11.2% Hispanic or Latino, 5.2% African American, and 4.4% Asian.
Common Questions
What is Per Capita Income in Midway North?
Per Capita income in Midway North is $17,599.
What is the Median Family Income in Midway North?
Median Family Income in Midway North is $55,556.
What is the Median Household income in Midway North?
Median Household Income in Midway North is $51,648.
What is Income or Wage Gap in Midway North?
Income or Wage Gap in Midway North is 7.6%.
Women in Midway North earn 92.4 cents for every dollar earned by a man.
What is Inequality or Gini Index in Midway North?
Inequality or Gini Index in Midway North is 0.48.
What is the Total Population of Midway North?
Total Population of Midway North is 4,033.
What is the Total Male Population of Midway North?
Total Male Population of Midway North is 2,014.
What is the Total Female Population of Midway North?
Total Female Population of Midway North is 2,019.
What is the Ratio of Males per 100 Females in Midway North?
There are 99.75 Males per 100 Females in Midway North.
What is the Ratio of Females per 100 Males in Midway North?
There are 100.25 Females per 100 Males in Midway North.
What is the Median Population Age in Midway North?
Median Population Age in Midway North is 27.5 Years.
What is the Average Family Size in Midway North
Average Family Size in Midway North is 4.5 People.
What is the Average Household Size in Midway North
Average Household Size in Midway North is 4.1 People.
How Large is the Labor Force in Midway North?
There are 1,865 People in the Labor Forcein in Midway North.
What is the Percentage of People in the Labor Force in Midway North?
62.1% of People are in the Labor Force in Midway North.
What is the Unemployment Rate in Midway North?
Unemployment Rate in Midway North is 10.2%.