Parowan, UT Map & Demographics
Parowan Map
Parowan Overview
$23,205
PER CAPITA INCOME
$68,958
AVG FAMILY INCOME
$47,974
AVG HOUSEHOLD INCOME
0.45
INEQUALITY / GINI INDEX
3,036
TOTAL POPULATION
1,602
MALE POPULATION
1,434
FEMALE POPULATION
111.72
MALES / 100 FEMALES
89.51
FEMALES / 100 MALES
34.0
MEDIAN AGE
4.0
AVG FAMILY SIZE
3.1
AVG HOUSEHOLD SIZE
1,256
LABOR FORCE [ PEOPLE ]
58.4%
PERCENT IN LABOR FORCE
8.2%
UNEMPLOYMENT RATE
Parowan Zip Codes
Parowan Area Codes
Income in Parowan
Income Overview in Parowan
Per Capita Income in Parowan is $23,205, while median incomes of families and households are $68,958 and $47,974 respectively.
| Characteristic | Number | Measure |
| Per Capita Income | 3,036 | $23,205 |
| Median Family Income | 645 | $68,958 |
| Mean Family Income | 645 | $89,608 |
| Median Household Income | 978 | $47,974 |
| Mean Household Income | 978 | $69,451 |
| Income Deficit | 645 | $0 |
| Wage / Income Gap (%) | 3,036 | 0.00% |
| Wage / Income Gap ($) | 3,036 | 100.00¢ per $1 |
| Gini / Inequality Index | 3,036 | 0.45 |
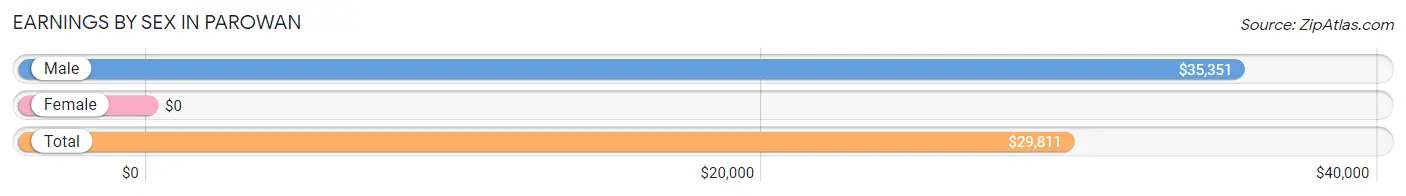
Earnings by Sex in Parowan
| Sex | Number | Average Earnings |
| Male | 651 (50.7%) | $35,351 |
| Female | 634 (49.3%) | $0 |
| Total | 1,285 (100.0%) | $29,811 |
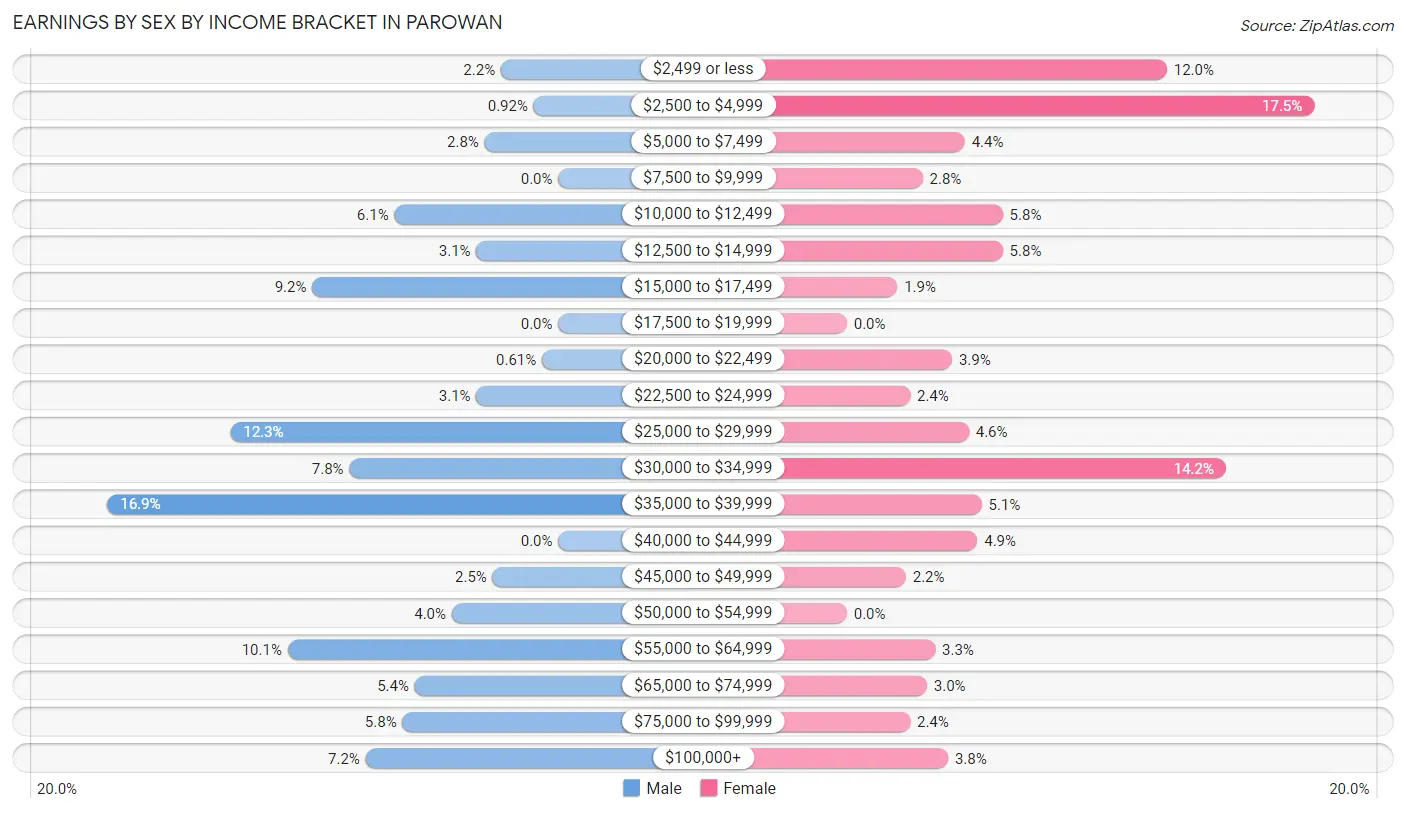
Earnings by Sex by Income Bracket in Parowan
The most common earnings brackets in Parowan are $35,000 to $39,999 for men (110 | 16.9%) and $2,500 to $4,999 for women (111 | 17.5%).
| Income | Male | Female |
| $2,499 or less | 14 (2.1%) | 76 (12.0%) |
| $2,500 to $4,999 | 6 (0.9%) | 111 (17.5%) |
| $5,000 to $7,499 | 18 (2.8%) | 28 (4.4%) |
| $7,500 to $9,999 | 0 (0.0%) | 18 (2.8%) |
| $10,000 to $12,499 | 40 (6.1%) | 37 (5.8%) |
| $12,500 to $14,999 | 20 (3.1%) | 37 (5.8%) |
| $15,000 to $17,499 | 60 (9.2%) | 12 (1.9%) |
| $17,500 to $19,999 | 0 (0.0%) | 0 (0.0%) |
| $20,000 to $22,499 | 4 (0.6%) | 25 (3.9%) |
| $22,500 to $24,999 | 20 (3.1%) | 15 (2.4%) |
| $25,000 to $29,999 | 80 (12.3%) | 29 (4.6%) |
| $30,000 to $34,999 | 51 (7.8%) | 90 (14.2%) |
| $35,000 to $39,999 | 110 (16.9%) | 32 (5.1%) |
| $40,000 to $44,999 | 0 (0.0%) | 31 (4.9%) |
| $45,000 to $49,999 | 16 (2.5%) | 14 (2.2%) |
| $50,000 to $54,999 | 26 (4.0%) | 0 (0.0%) |
| $55,000 to $64,999 | 66 (10.1%) | 21 (3.3%) |
| $65,000 to $74,999 | 35 (5.4%) | 19 (3.0%) |
| $75,000 to $99,999 | 38 (5.8%) | 15 (2.4%) |
| $100,000+ | 47 (7.2%) | 24 (3.8%) |
| Total | 651 (100.0%) | 634 (100.0%) |
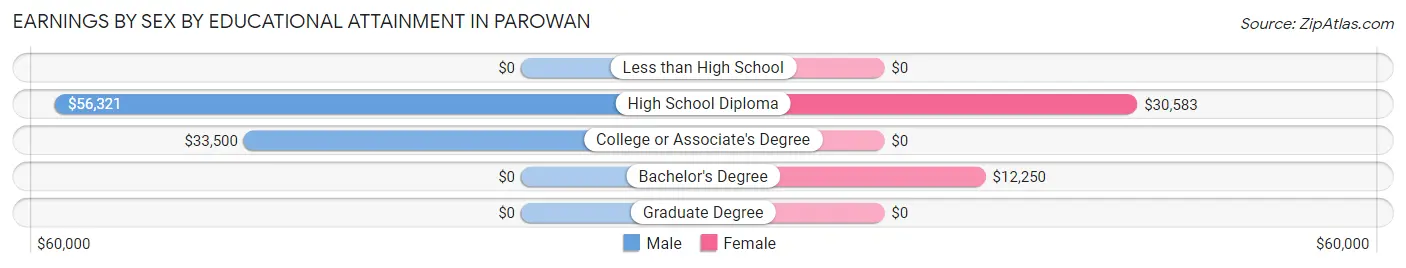
Earnings by Sex by Educational Attainment in Parowan
| Educational Attainment | Male Income | Female Income |
| Less than High School | - | - |
| High School Diploma | $56,321 | $30,583 |
| College or Associate's Degree | $33,500 | $0 |
| Bachelor's Degree | - | - |
| Graduate Degree | - | - |
| Total | $37,205 | $0 |
Family Income in Parowan
Family Income Brackets in Parowan
According to the Parowan family income data, there are 124 families falling into the $25,000 to $34,999 income range, which is the most common income bracket and makes up 19.2% of all families.
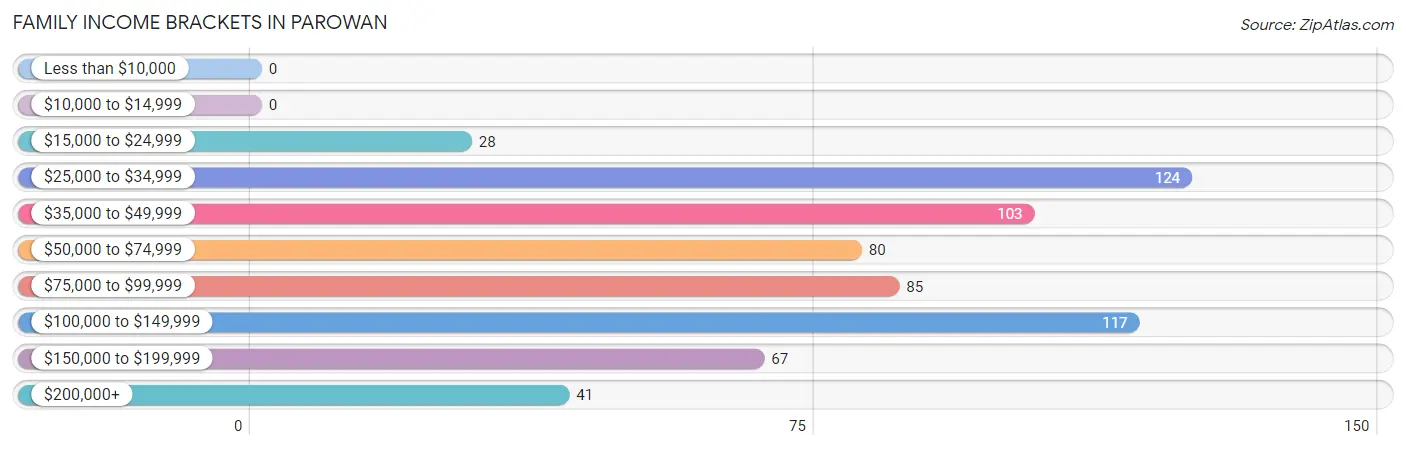
| Income Bracket | # Families | % Families |
| Less than $10,000 | 0 | 0.0% |
| $10,000 to $14,999 | 0 | 0.0% |
| $15,000 to $24,999 | 28 | 4.3% |
| $25,000 to $34,999 | 124 | 19.2% |
| $35,000 to $49,999 | 103 | 16.0% |
| $50,000 to $74,999 | 80 | 12.4% |
| $75,000 to $99,999 | 85 | 13.2% |
| $100,000 to $149,999 | 117 | 18.1% |
| $150,000 to $199,999 | 67 | 10.4% |
| $200,000+ | 41 | 6.4% |
Family Income by Famaliy Size in Parowan
3-person families (107 | 16.6%) account for the highest median family income in Parowan with $113,646 per family, while 3-person families (107 | 16.6%) have the highest median income of $37,882 per family member.
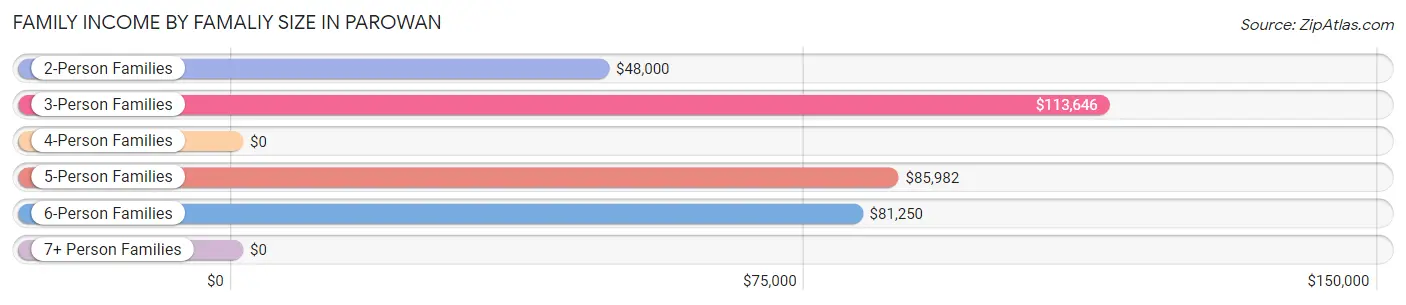
| Income Bracket | # Families | Median Income |
| 2-Person Families | 236 (36.6%) | $48,000 |
| 3-Person Families | 107 (16.6%) | $113,646 |
| 4-Person Families | 29 (4.5%) | $0 |
| 5-Person Families | 176 (27.3%) | $85,982 |
| 6-Person Families | 47 (7.3%) | $81,250 |
| 7+ Person Families | 50 (7.7%) | $0 |
| Total | 645 (100.0%) | $68,958 |
Family Income by Number of Earners in Parowan
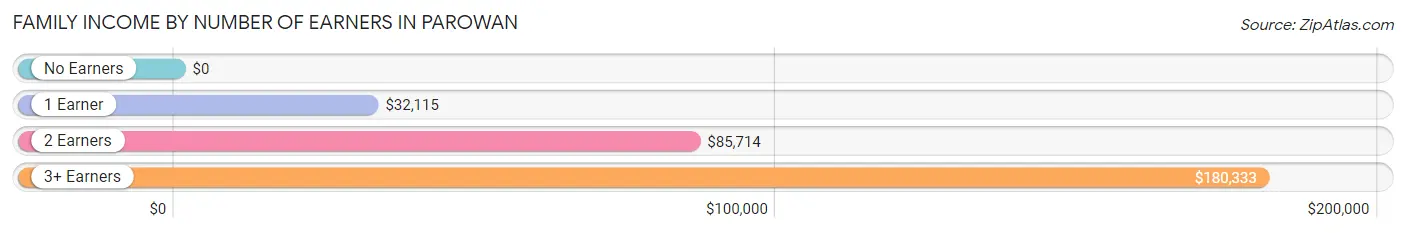
| Number of Earners | # Families | Median Income |
| No Earners | 85 (13.2%) | $0 |
| 1 Earner | 192 (29.8%) | $32,115 |
| 2 Earners | 288 (44.7%) | $85,714 |
| 3+ Earners | 80 (12.4%) | $180,333 |
| Total | 645 (100.0%) | $68,958 |
Household Income in Parowan
Household Income Brackets in Parowan
With 271 households falling in the category, the $35,000 to $49,999 income range is the most frequent in Parowan, accounting for 27.7% of all households.
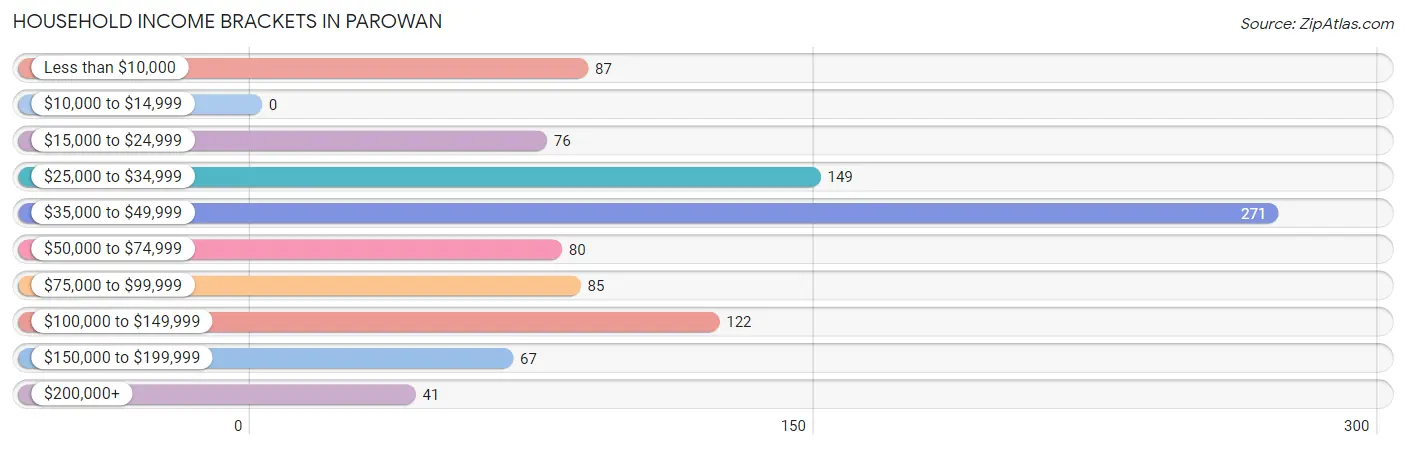
| Income Bracket | # Households | % Households |
| Less than $10,000 | 87 | 8.9% |
| $10,000 to $14,999 | 0 | 0.0% |
| $15,000 to $24,999 | 76 | 7.8% |
| $25,000 to $34,999 | 149 | 15.2% |
| $35,000 to $49,999 | 271 | 27.7% |
| $50,000 to $74,999 | 80 | 8.2% |
| $75,000 to $99,999 | 85 | 8.7% |
| $100,000 to $149,999 | 122 | 12.5% |
| $150,000 to $199,999 | 67 | 6.9% |
| $200,000+ | 41 | 4.2% |
Household Income by Householder Age in Parowan
The median household income in Parowan is $47,974, with the highest median household income of $85,625 found in the 15 to 24 years age bracket for the primary householder. A total of 66 households (6.8%) fall into this category. Meanwhile, the 25 to 44 years age bracket for the primary householder has the lowest median household income of $46,719, with 270 households (27.6%) in this group.
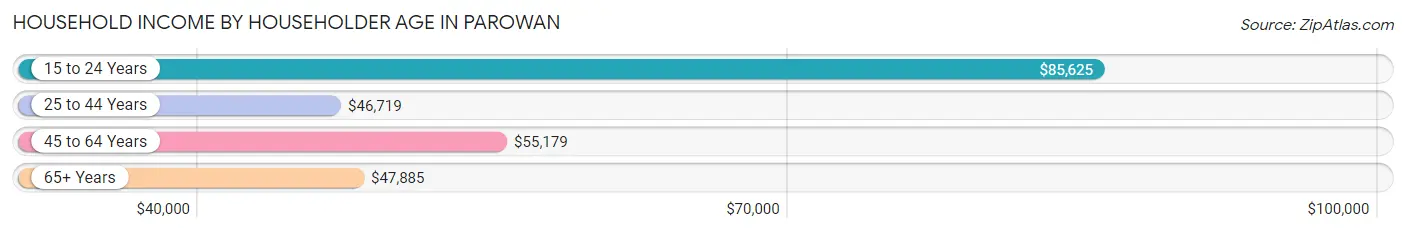
| Income Bracket | # Households | Median Income |
| 15 to 24 Years | 66 (6.8%) | $85,625 |
| 25 to 44 Years | 270 (27.6%) | $46,719 |
| 45 to 64 Years | 390 (39.9%) | $55,179 |
| 65+ Years | 252 (25.8%) | $47,885 |
| Total | 978 (100.0%) | $47,974 |
Poverty in Parowan
Income Below Poverty by Sex and Age in Parowan
With 18.6% poverty level for males and 14.0% for females among the residents of Parowan, 15 year old males and 15 year old females are the most vulnerable to poverty, with 19 males (100.0%) and 32 females (100.0%) in their respective age groups living below the poverty level.
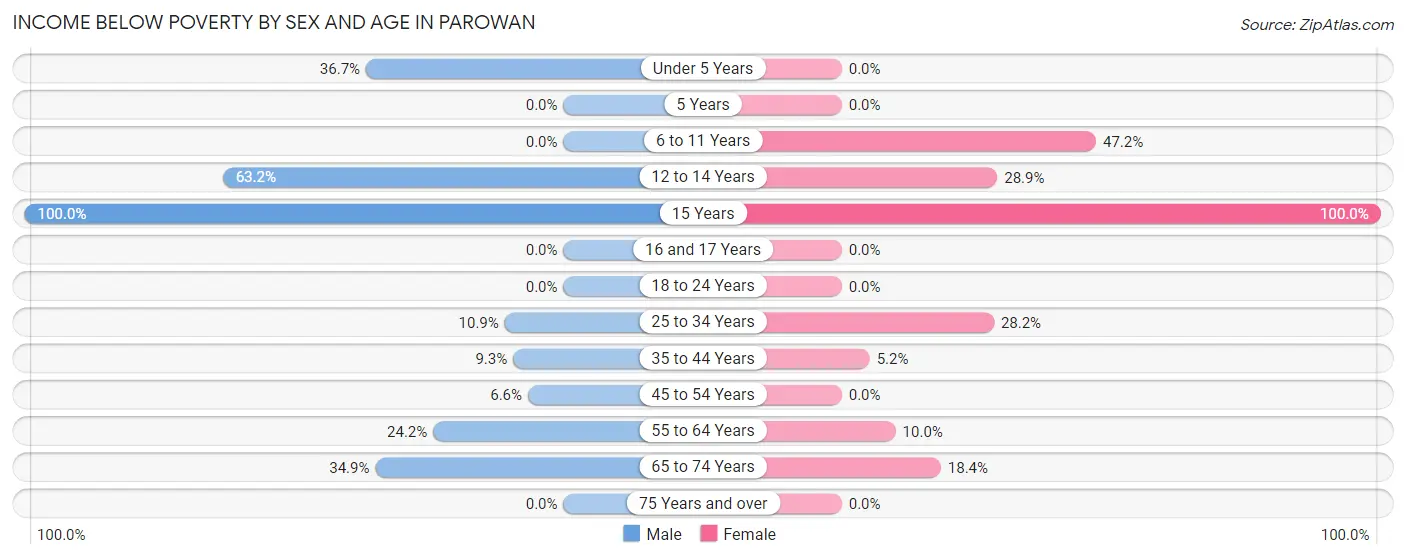
| Age Bracket | Male | Female |
| Under 5 Years | 59 (36.6%) | 0 (0.0%) |
| 5 Years | 0 (0.0%) | 0 (0.0%) |
| 6 to 11 Years | 0 (0.0%) | 42 (47.2%) |
| 12 to 14 Years | 55 (63.2%) | 41 (28.9%) |
| 15 Years | 19 (100.0%) | 32 (100.0%) |
| 16 and 17 Years | 0 (0.0%) | 0 (0.0%) |
| 18 to 24 Years | 0 (0.0%) | 0 (0.0%) |
| 25 to 34 Years | 23 (10.9%) | 37 (28.2%) |
| 35 to 44 Years | 17 (9.3%) | 12 (5.2%) |
| 45 to 54 Years | 6 (6.6%) | 0 (0.0%) |
| 55 to 64 Years | 44 (24.2%) | 18 (10.0%) |
| 65 to 74 Years | 74 (34.9%) | 16 (18.4%) |
| 75 Years and over | 0 (0.0%) | 0 (0.0%) |
| Total | 297 (18.6%) | 198 (14.0%) |
Income Above Poverty by Sex and Age in Parowan
According to the poverty statistics in Parowan, males aged 5 years and females aged under 5 years are the age groups that are most secure financially, with 100.0% of males and 100.0% of females in these age groups living above the poverty line.
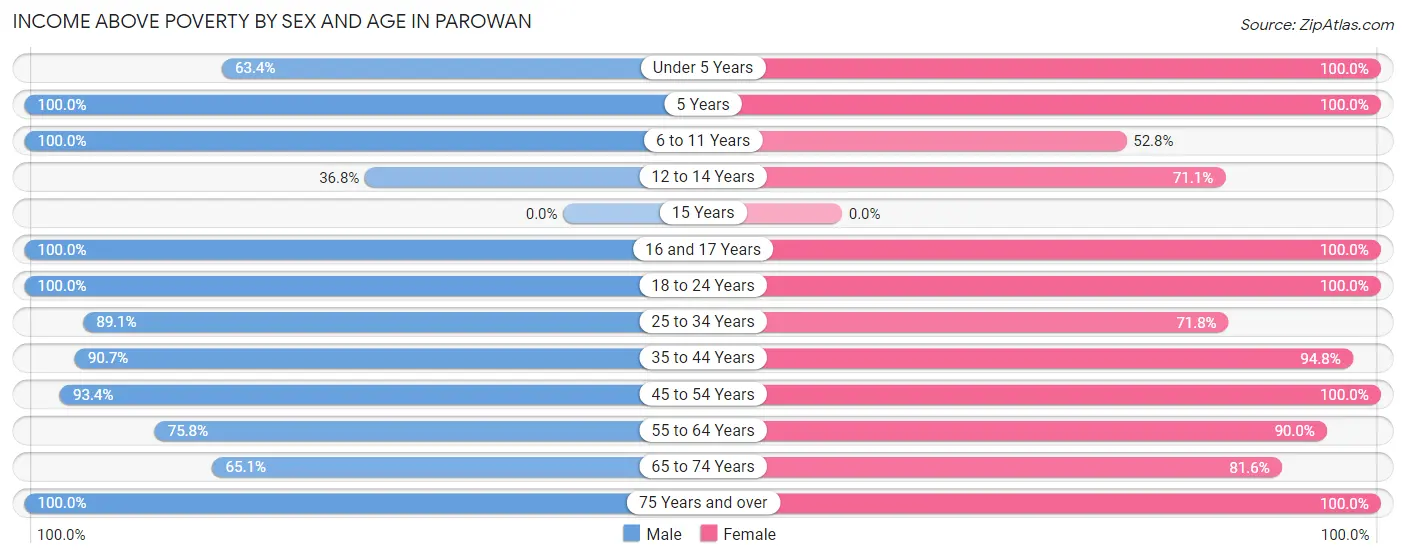
| Age Bracket | Male | Female |
| Under 5 Years | 102 (63.3%) | 33 (100.0%) |
| 5 Years | 28 (100.0%) | 150 (100.0%) |
| 6 to 11 Years | 140 (100.0%) | 47 (52.8%) |
| 12 to 14 Years | 32 (36.8%) | 101 (71.1%) |
| 15 Years | 0 (0.0%) | 0 (0.0%) |
| 16 and 17 Years | 13 (100.0%) | 59 (100.0%) |
| 18 to 24 Years | 166 (100.0%) | 60 (100.0%) |
| 25 to 34 Years | 188 (89.1%) | 94 (71.8%) |
| 35 to 44 Years | 165 (90.7%) | 219 (94.8%) |
| 45 to 54 Years | 85 (93.4%) | 143 (100.0%) |
| 55 to 64 Years | 138 (75.8%) | 162 (90.0%) |
| 65 to 74 Years | 138 (65.1%) | 71 (81.6%) |
| 75 Years and over | 106 (100.0%) | 77 (100.0%) |
| Total | 1,301 (81.4%) | 1,216 (86.0%) |
Income Below Poverty Among Married-Couple Families in Parowan
The poverty statistics for married-couple families in Parowan show that 9.3% or 51 of the total 550 families live below the poverty line. Families with 5 or more children have the highest poverty rate of 100.0%, comprising of 35 families. On the other hand, families with 1 or 2 children have the lowest poverty rate of 0.0%, which includes 0 families.
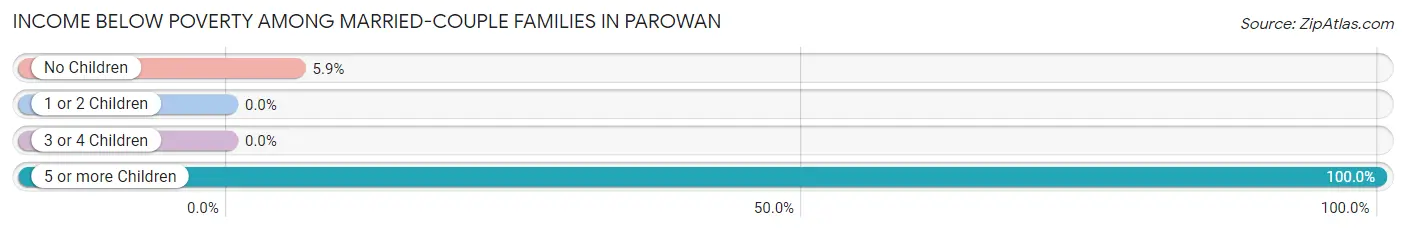
| Children | Above Poverty | Below Poverty |
| No Children | 256 (94.1%) | 16 (5.9%) |
| 1 or 2 Children | 109 (100.0%) | 0 (0.0%) |
| 3 or 4 Children | 134 (100.0%) | 0 (0.0%) |
| 5 or more Children | 0 (0.0%) | 35 (100.0%) |
| Total | 499 (90.7%) | 51 (9.3%) |
Income Below Poverty Among Single-Parent Households in Parowan
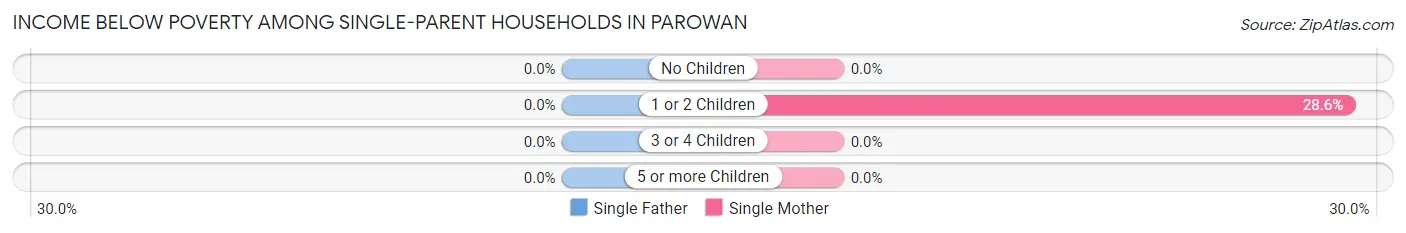
| Children | Single Father | Single Mother |
| No Children | 0 (0.0%) | 0 (0.0%) |
| 1 or 2 Children | 0 (0.0%) | 12 (28.6%) |
| 3 or 4 Children | 0 (0.0%) | 0 (0.0%) |
| 5 or more Children | 0 (0.0%) | 0 (0.0%) |
| Total | 0 (0.0%) | 12 (22.2%) |
Income Below Poverty Among Married-Couple vs Single-Parent Households in Parowan
The poverty data for Parowan shows that 51 of the married-couple family households (9.3%) and 12 of the single-parent households (12.6%) are living below the poverty level. Within the married-couple family households, those with 5 or more children have the highest poverty rate, with 35 households (100.0%) falling below the poverty line. Among the single-parent households, those with 1 or 2 children have the highest poverty rate, with 12 household (17.1%) living below poverty.
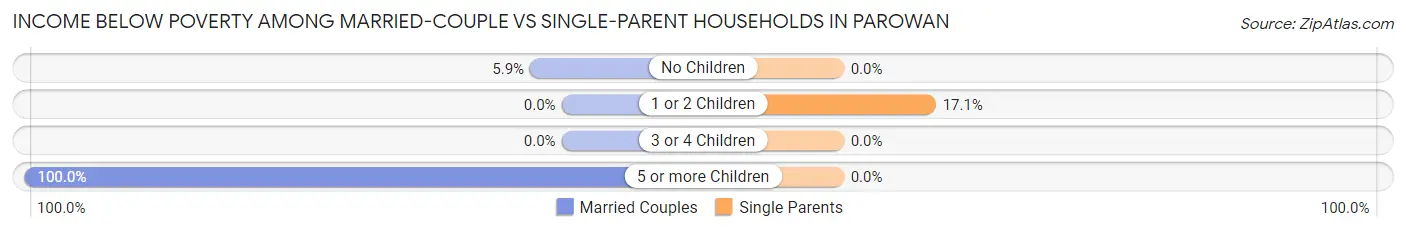
| Children | Married-Couple Families | Single-Parent Households |
| No Children | 16 (5.9%) | 0 (0.0%) |
| 1 or 2 Children | 0 (0.0%) | 12 (17.1%) |
| 3 or 4 Children | 0 (0.0%) | 0 (0.0%) |
| 5 or more Children | 35 (100.0%) | 0 (0.0%) |
| Total | 51 (9.3%) | 12 (12.6%) |
Race in Parowan
The most populous races in Parowan are White / Caucasian (2,737 | 90.1%), Native / Alaskan (208 | 6.9%), and Hispanic or Latino (77 | 2.5%).
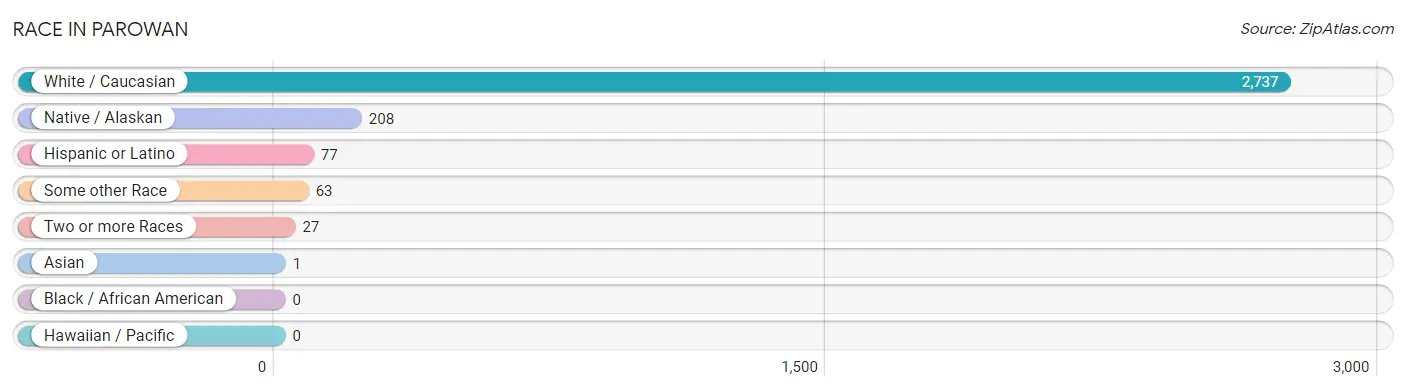
| Race | # Population | % Population |
| Asian | 1 | 0.0% |
| Black / African American | 0 | 0.0% |
| Hawaiian / Pacific | 0 | 0.0% |
| Hispanic or Latino | 77 | 2.5% |
| Native / Alaskan | 208 | 6.9% |
| White / Caucasian | 2,737 | 90.1% |
| Two or more Races | 27 | 0.9% |
| Some other Race | 63 | 2.1% |
| Total | 3,036 | 100.0% |
Ancestry in Parowan
The most populous ancestries reported in Parowan are English (1,437 | 47.3%), German (376 | 12.4%), Irish (283 | 9.3%), European (231 | 7.6%), and Mexican American Indian (208 | 6.9%), together accounting for 83.5% of all Parowan residents.
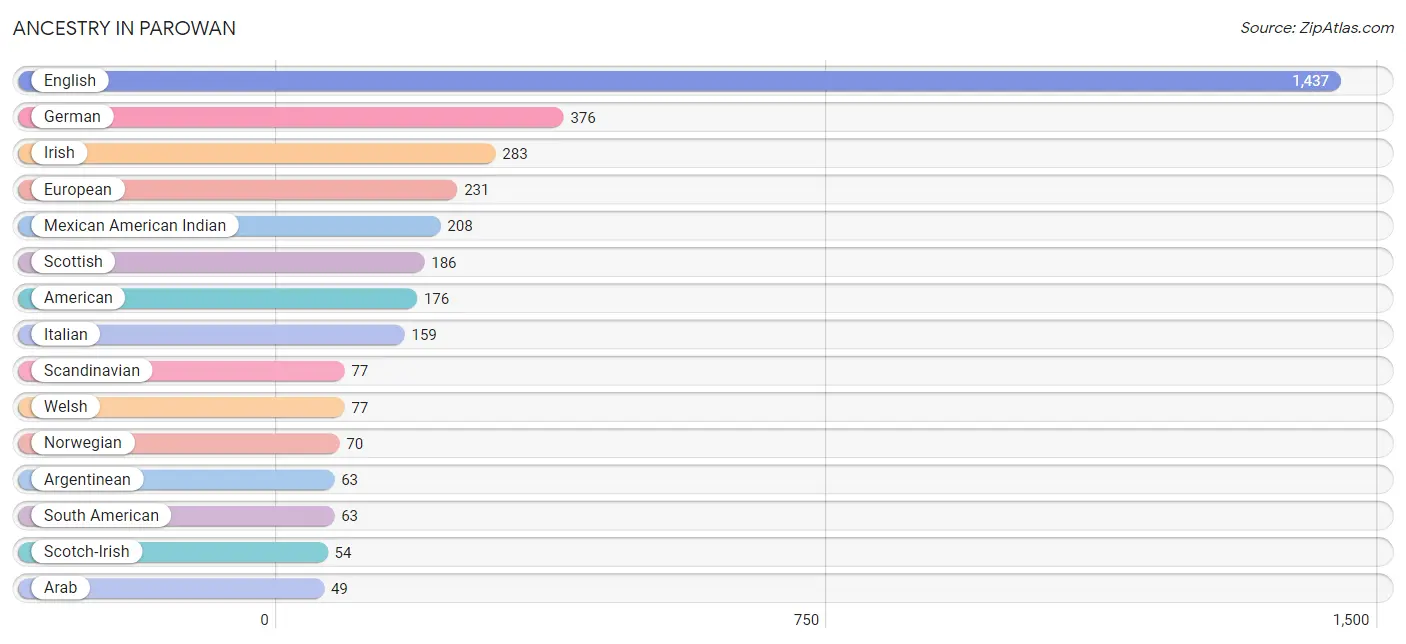
| Ancestry | # Population | % Population |
| American | 176 | 5.8% |
| Arab | 49 | 1.6% |
| Argentinean | 63 | 2.1% |
| Armenian | 1 | 0.0% |
| Burmese | 1 | 0.0% |
| Croatian | 22 | 0.7% |
| Danish | 5 | 0.2% |
| Dutch | 28 | 0.9% |
| English | 1,437 | 47.3% |
| European | 231 | 7.6% |
| German | 376 | 12.4% |
| Irish | 283 | 9.3% |
| Italian | 159 | 5.2% |
| Lebanese | 49 | 1.6% |
| Lithuanian | 10 | 0.3% |
| Mexican | 14 | 0.5% |
| Mexican American Indian | 208 | 6.9% |
| Northern European | 23 | 0.8% |
| Norwegian | 70 | 2.3% |
| Polish | 13 | 0.4% |
| Portuguese | 17 | 0.6% |
| Scandinavian | 77 | 2.5% |
| Scotch-Irish | 54 | 1.8% |
| Scottish | 186 | 6.1% |
| South American | 63 | 2.1% |
| Swedish | 11 | 0.4% |
| Swiss | 48 | 1.6% |
| Welsh | 77 | 2.5% |
| Yugoslavian | 20 | 0.7% | View All 29 Rows |
Immigrants in Parowan
The most numerous immigrant groups reported in Parowan came from Central America (42 | 1.4%), Latin America (42 | 1.4%), Mexico (42 | 1.4%), Asia (1 | 0.0%), and Eastern Asia (1 | 0.0%), together accounting for 4.2% of all Parowan residents.
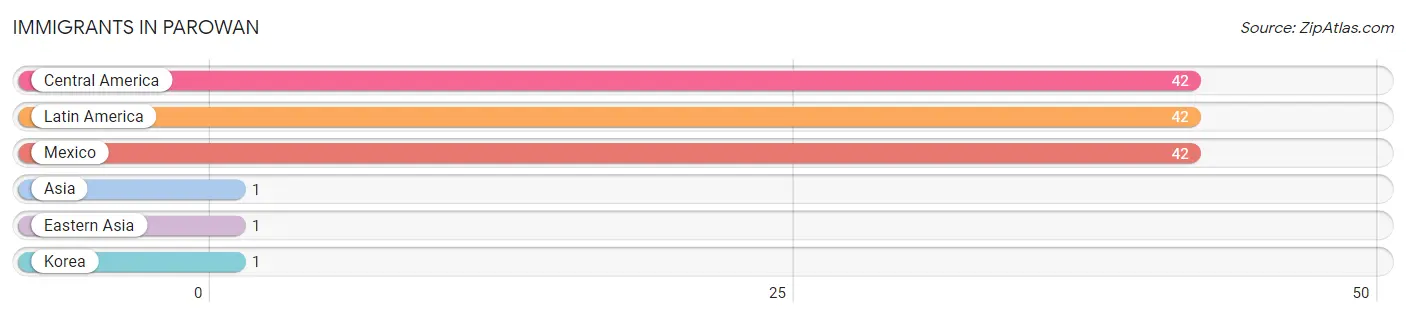
| Immigration Origin | # Population | % Population |
| Asia | 1 | 0.0% |
| Central America | 42 | 1.4% |
| Eastern Asia | 1 | 0.0% |
| Korea | 1 | 0.0% |
| Latin America | 42 | 1.4% |
| Mexico | 42 | 1.4% | View All 6 Rows |
Sex and Age in Parowan
Sex and Age in Parowan
The most populous age groups in Parowan are 5 to 9 Years (168 | 10.5%) for men and 5 to 9 Years (239 | 16.7%) for women.
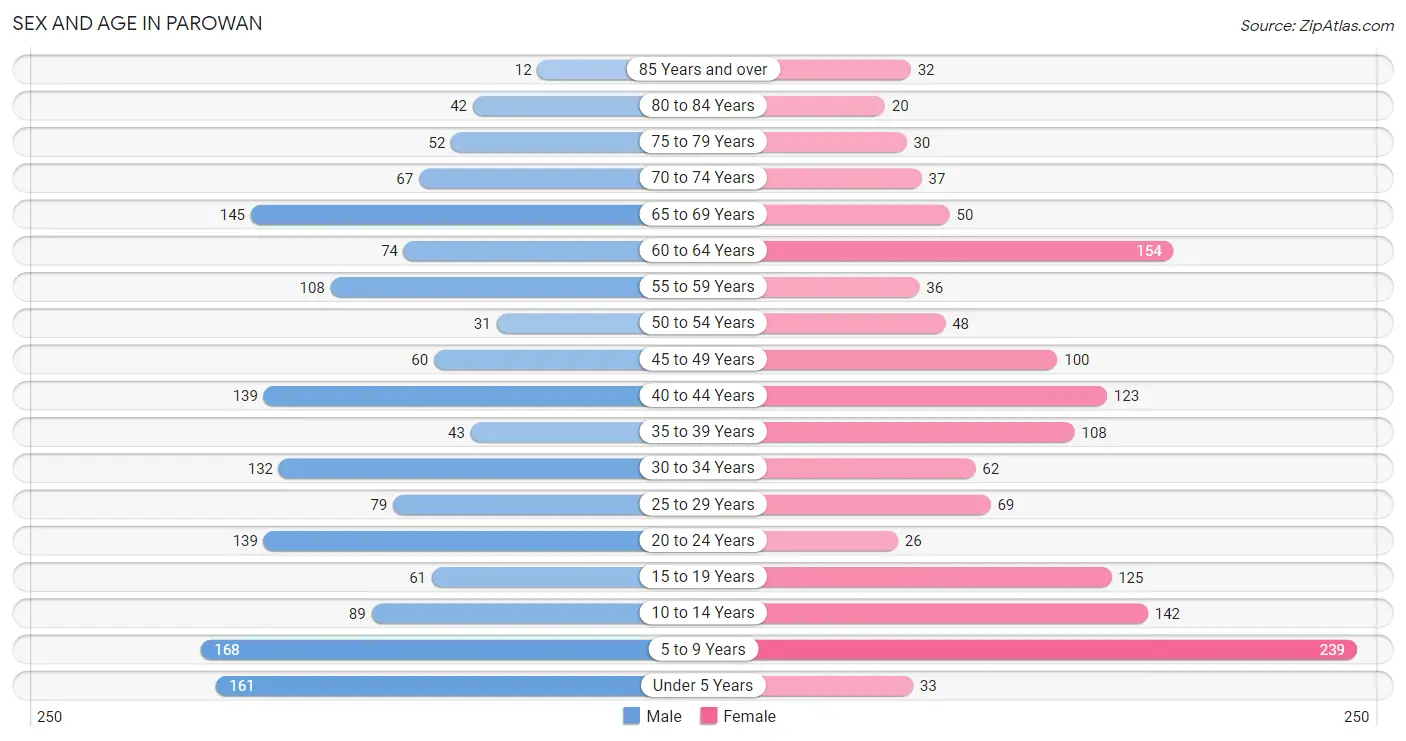
| Age Bracket | Male | Female |
| Under 5 Years | 161 (10.1%) | 33 (2.3%) |
| 5 to 9 Years | 168 (10.5%) | 239 (16.7%) |
| 10 to 14 Years | 89 (5.6%) | 142 (9.9%) |
| 15 to 19 Years | 61 (3.8%) | 125 (8.7%) |
| 20 to 24 Years | 139 (8.7%) | 26 (1.8%) |
| 25 to 29 Years | 79 (4.9%) | 69 (4.8%) |
| 30 to 34 Years | 132 (8.2%) | 62 (4.3%) |
| 35 to 39 Years | 43 (2.7%) | 108 (7.5%) |
| 40 to 44 Years | 139 (8.7%) | 123 (8.6%) |
| 45 to 49 Years | 60 (3.7%) | 100 (7.0%) |
| 50 to 54 Years | 31 (1.9%) | 48 (3.4%) |
| 55 to 59 Years | 108 (6.7%) | 36 (2.5%) |
| 60 to 64 Years | 74 (4.6%) | 154 (10.7%) |
| 65 to 69 Years | 145 (9.0%) | 50 (3.5%) |
| 70 to 74 Years | 67 (4.2%) | 37 (2.6%) |
| 75 to 79 Years | 52 (3.3%) | 30 (2.1%) |
| 80 to 84 Years | 42 (2.6%) | 20 (1.4%) |
| 85 Years and over | 12 (0.7%) | 32 (2.2%) |
| Total | 1,602 (100.0%) | 1,434 (100.0%) |
Families and Households in Parowan
Median Family Size in Parowan
The median family size in Parowan is 3.99 persons per family, with single male/father families (41 | 6.4%) accounting for the largest median family size of 6.39 persons per family. On the other hand, single female/mother families (54 | 8.4%) represent the smallest median family size with 2.69 persons per family.
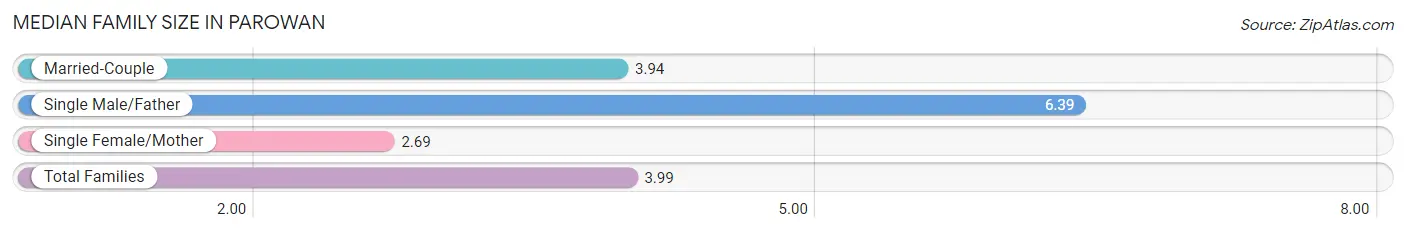
| Family Type | # Families | Family Size |
| Married-Couple | 550 (85.3%) | 3.94 |
| Single Male/Father | 41 (6.4%) | 6.39 |
| Single Female/Mother | 54 (8.4%) | 2.69 |
| Total Families | 645 (100.0%) | 3.99 |
Median Household Size in Parowan
The median household size in Parowan is 3.08 persons per household, with single male/father households (41 | 4.2%) accounting for the largest median household size of 6.39 persons per household. non-family households (333 | 34.1%) represent the smallest median household size with 1.24 persons per household.
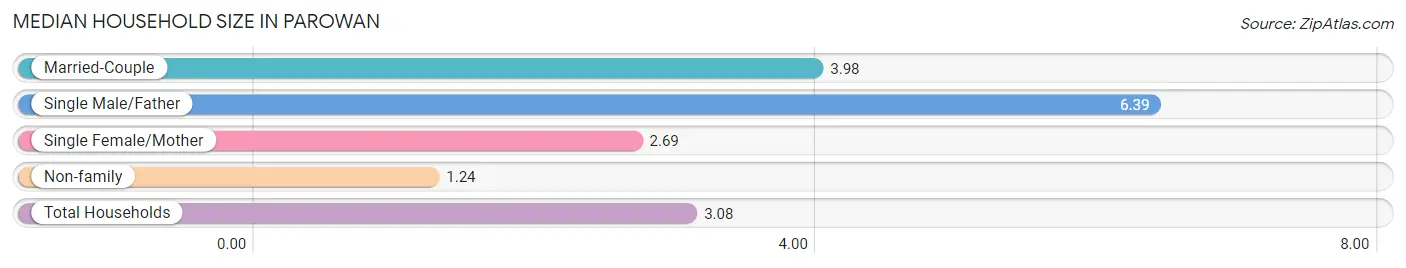
| Household Type | # Households | Household Size |
| Married-Couple | 550 (56.2%) | 3.98 |
| Single Male/Father | 41 (4.2%) | 6.39 |
| Single Female/Mother | 54 (5.5%) | 2.69 |
| Non-family | 333 (34.1%) | 1.24 |
| Total Households | 978 (100.0%) | 3.08 |
Household Size by Marriage Status in Parowan
Out of a total of 978 households in Parowan, 645 (65.9%) are family households, while 333 (34.1%) are nonfamily households. The most numerous type of family households are 2-person households, comprising 236, and the most common type of nonfamily households are 1-person households, comprising 241.
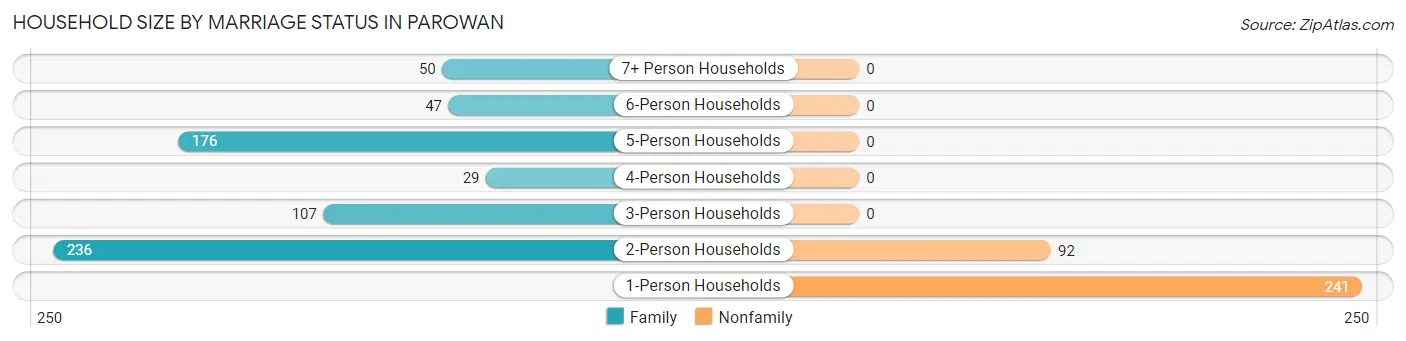
| Household Size | Family Households | Nonfamily Households |
| 1-Person Households | - | 241 (24.6%) |
| 2-Person Households | 236 (24.1%) | 92 (9.4%) |
| 3-Person Households | 107 (10.9%) | 0 (0.0%) |
| 4-Person Households | 29 (3.0%) | 0 (0.0%) |
| 5-Person Households | 176 (18.0%) | 0 (0.0%) |
| 6-Person Households | 47 (4.8%) | 0 (0.0%) |
| 7+ Person Households | 50 (5.1%) | 0 (0.0%) |
| Total | 645 (65.9%) | 333 (34.1%) |
Female Fertility in Parowan
Fertility by Age in Parowan
| Age Bracket | Women with Births | Births / 1,000 Women |
| 15 to 19 years | 0 (0.0%) | 0.0 |
| 20 to 34 years | 0 (0.0%) | 0.0 |
| 35 to 50 years | 0 (0.0%) | 0.0 |
| Total | 0 (0.0%) | 0.0 |
Fertility by Age by Marriage Status in Parowan
| Age Bracket | Married | Unmarried |
| 15 to 19 years | 0 (0.0%) | 0 (0.0%) |
| 20 to 34 years | 0 (0.0%) | 0 (0.0%) |
| 35 to 50 years | 0 (0.0%) | 0 (0.0%) |
| Total | 0 (0.0%) | 0 (0.0%) |
Fertility by Education in Parowan
| Educational Attainment | Women with Births | Births / 1,000 Women |
| Less than High School | 0 (0.0%) | 0.0 |
| High School Diploma | 0 (0.0%) | 0.0 |
| College or Associate's Degree | 0 (0.0%) | 0.0 |
| Bachelor's Degree | 0 (0.0%) | 0.0 |
| Graduate Degree | 0 (0.0%) | 0.0 |
| Total | 0 (0.0%) | 0.0 |
Fertility by Education by Marriage Status in Parowan
| Educational Attainment | Married | Unmarried |
| Less than High School | 0 (0.0%) | 0 (0.0%) |
| High School Diploma | 0 (0.0%) | 0 (0.0%) |
| College or Associate's Degree | 0 (0.0%) | 0 (0.0%) |
| Bachelor's Degree | 0 (0.0%) | 0 (0.0%) |
| Graduate Degree | 0 (0.0%) | 0 (0.0%) |
| Total | 0 (0.0%) | 0 (0.0%) |
Employment Characteristics in Parowan
Employment by Class of Employer in Parowan
Among the 1,091 employed individuals in Parowan, private company employees (667 | 61.1%), federal government employees (153 | 14.0%), and local government employees (98 | 9.0%) make up the most common classes of employment.
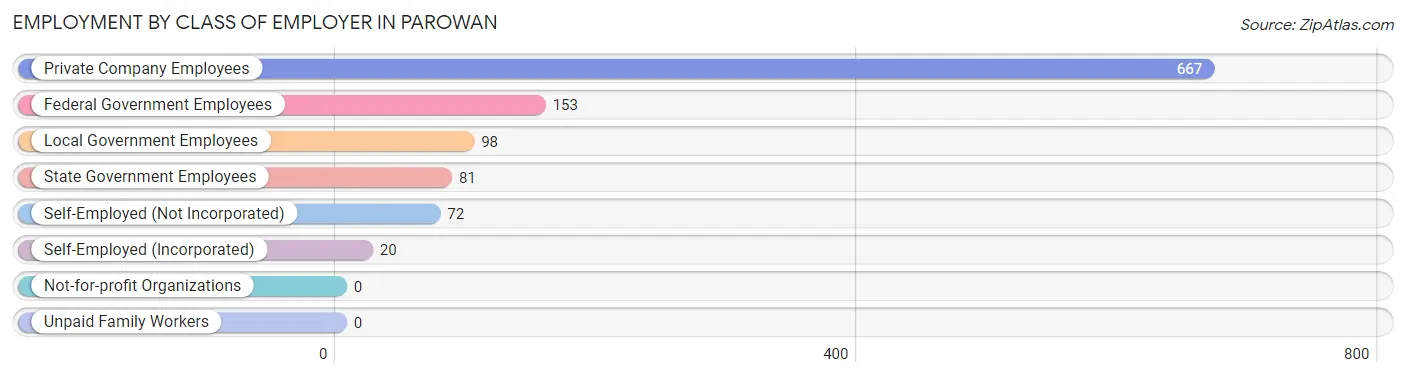
| Employer Class | # Employees | % Employees |
| Private Company Employees | 667 | 61.1% |
| Self-Employed (Incorporated) | 20 | 1.8% |
| Self-Employed (Not Incorporated) | 72 | 6.6% |
| Not-for-profit Organizations | 0 | 0.0% |
| Local Government Employees | 98 | 9.0% |
| State Government Employees | 81 | 7.4% |
| Federal Government Employees | 153 | 14.0% |
| Unpaid Family Workers | 0 | 0.0% |
| Total | 1,091 | 100.0% |
Employment Status by Age in Parowan
According to the labor force statistics for Parowan, out of the total population over 16 years of age (2,151), 58.4% or 1,256 individuals are in the labor force, with 8.2% or 103 of them unemployed. The age group with the highest labor force participation rate is 35 to 44 years, with 92.0% or 380 individuals in the labor force. Within the labor force, the 55 to 59 years age range has the highest percentage of unemployed individuals, with 38.0% or 41 of them being unemployed.
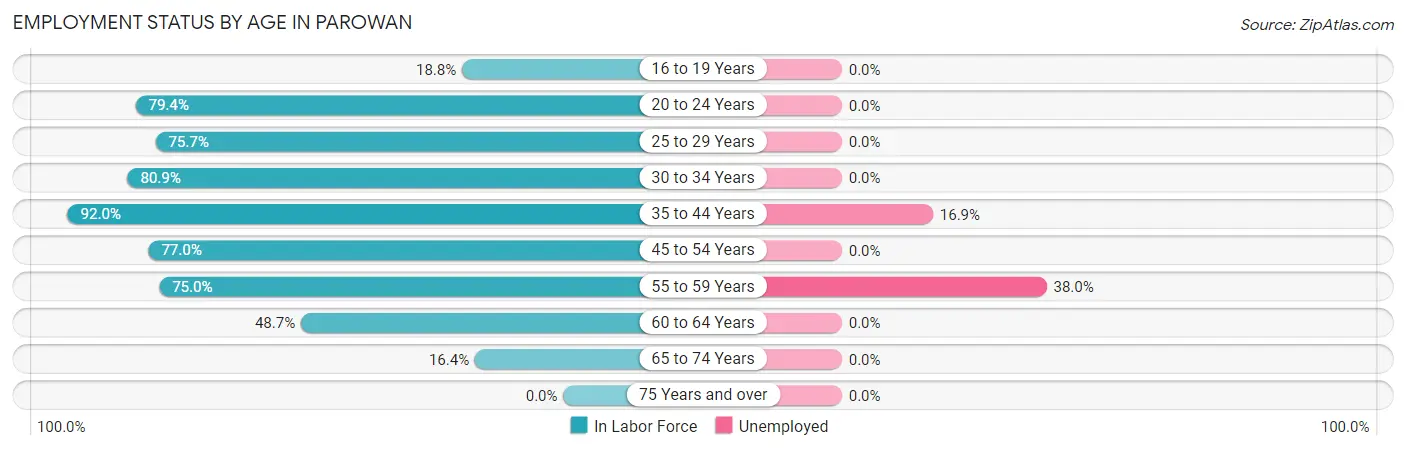
| Age Bracket | In Labor Force | Unemployed |
| 16 to 19 Years | 25 (18.8%) | 0 (0.0%) |
| 20 to 24 Years | 131 (79.4%) | 0 (0.0%) |
| 25 to 29 Years | 112 (75.7%) | 0 (0.0%) |
| 30 to 34 Years | 157 (80.9%) | 0 (0.0%) |
| 35 to 44 Years | 380 (92.0%) | 64 (16.9%) |
| 45 to 54 Years | 184 (77.0%) | 0 (0.0%) |
| 55 to 59 Years | 108 (75.0%) | 41 (38.0%) |
| 60 to 64 Years | 111 (48.7%) | 0 (0.0%) |
| 65 to 74 Years | 49 (16.4%) | 0 (0.0%) |
| 75 Years and over | 0 (0.0%) | 0 (0.0%) |
| Total | 1,256 (58.4%) | 103 (8.2%) |
Employment Status by Educational Attainment in Parowan
According to labor force statistics for Parowan, 77.0% of individuals (1,052) out of the total population between 25 and 64 years of age (1,366) are in the labor force, with 9.8% or 103 of them being unemployed. The group with the highest labor force participation rate are those with the educational attainment of college / associate degree, with 84.4% or 680 individuals in the labor force. Within the labor force, individuals with college / associate degree education have the highest percentage of unemployment, with 15.4% or 105 of them being unemployed.
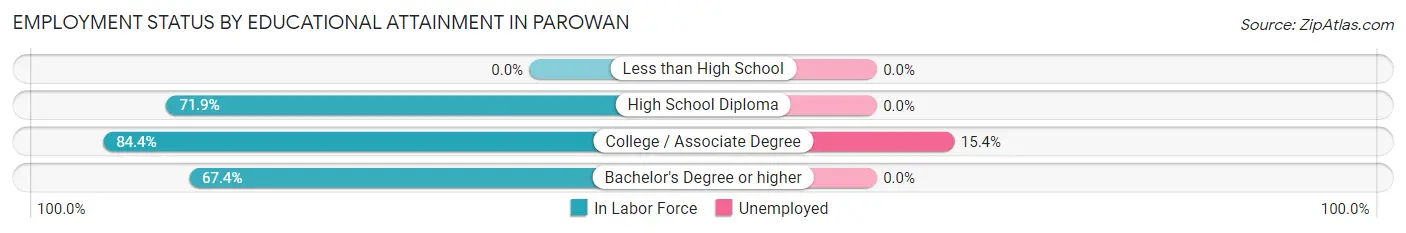
| Educational Attainment | In Labor Force | Unemployed |
| Less than High School | 0 (0.0%) | 0 (0.0%) |
| High School Diploma | 225 (71.9%) | 0 (0.0%) |
| College / Associate Degree | 680 (84.4%) | 124 (15.4%) |
| Bachelor's Degree or higher | 147 (67.4%) | 0 (0.0%) |
| Total | 1,052 (77.0%) | 134 (9.8%) |
Employment Occupations by Sex in Parowan
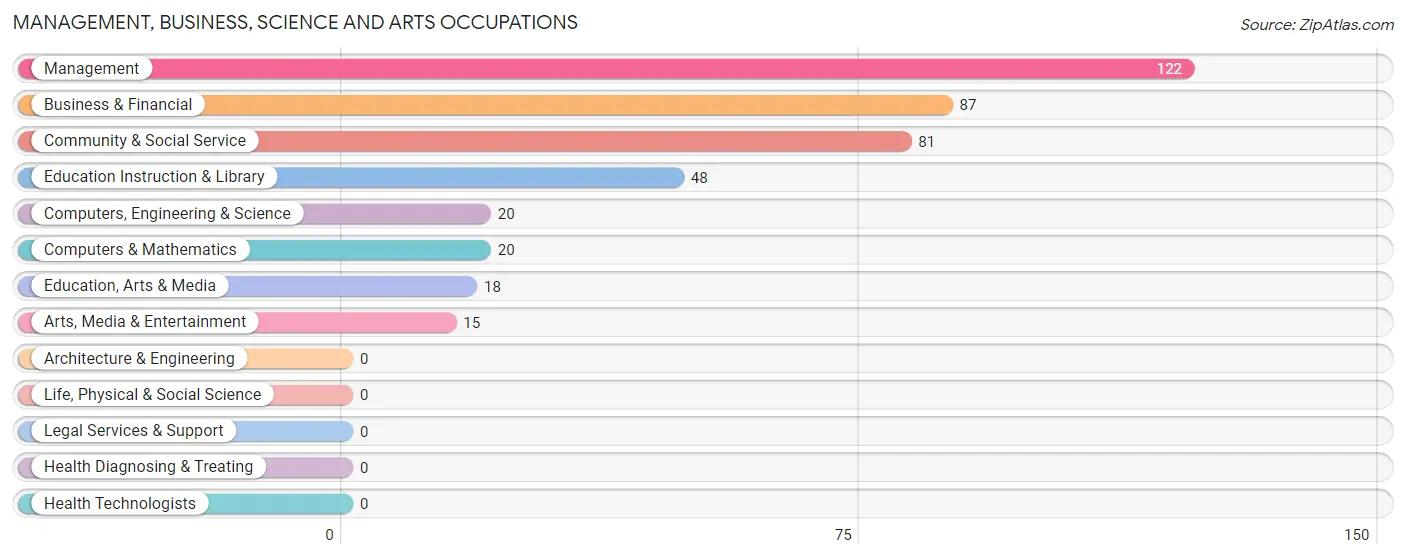
Management, Business, Science and Arts Occupations
The most common Management, Business, Science and Arts occupations in Parowan are Management (122 | 10.8%), Business & Financial (87 | 7.7%), Community & Social Service (81 | 7.2%), Education Instruction & Library (48 | 4.3%), and Computers, Engineering & Science (20 | 1.8%).
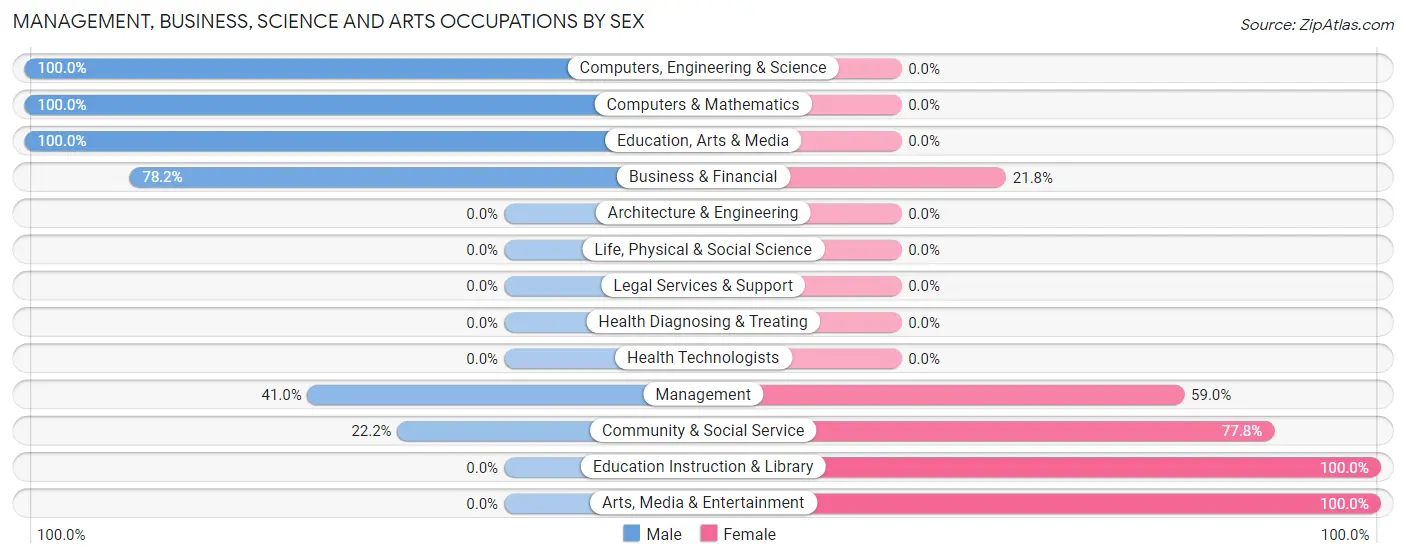
Management, Business, Science and Arts Occupations by Sex
Within the Management, Business, Science and Arts occupations in Parowan, the most male-oriented occupations are Computers, Engineering & Science (100.0%), Computers & Mathematics (100.0%), and Education, Arts & Media (100.0%), while the most female-oriented occupations are Education Instruction & Library (100.0%), Arts, Media & Entertainment (100.0%), and Community & Social Service (77.8%).
| Occupation | Male | Female |
| Management | 50 (41.0%) | 72 (59.0%) |
| Business & Financial | 68 (78.2%) | 19 (21.8%) |
| Computers, Engineering & Science | 20 (100.0%) | 0 (0.0%) |
| Computers & Mathematics | 20 (100.0%) | 0 (0.0%) |
| Architecture & Engineering | 0 (0.0%) | 0 (0.0%) |
| Life, Physical & Social Science | 0 (0.0%) | 0 (0.0%) |
| Community & Social Service | 18 (22.2%) | 63 (77.8%) |
| Education, Arts & Media | 18 (100.0%) | 0 (0.0%) |
| Legal Services & Support | 0 (0.0%) | 0 (0.0%) |
| Education Instruction & Library | 0 (0.0%) | 48 (100.0%) |
| Arts, Media & Entertainment | 0 (0.0%) | 15 (100.0%) |
| Health Diagnosing & Treating | 0 (0.0%) | 0 (0.0%) |
| Health Technologists | 0 (0.0%) | 0 (0.0%) |
| Total (Category) | 156 (50.3%) | 154 (49.7%) |
| Total (Overall) | 522 (46.2%) | 608 (53.8%) |
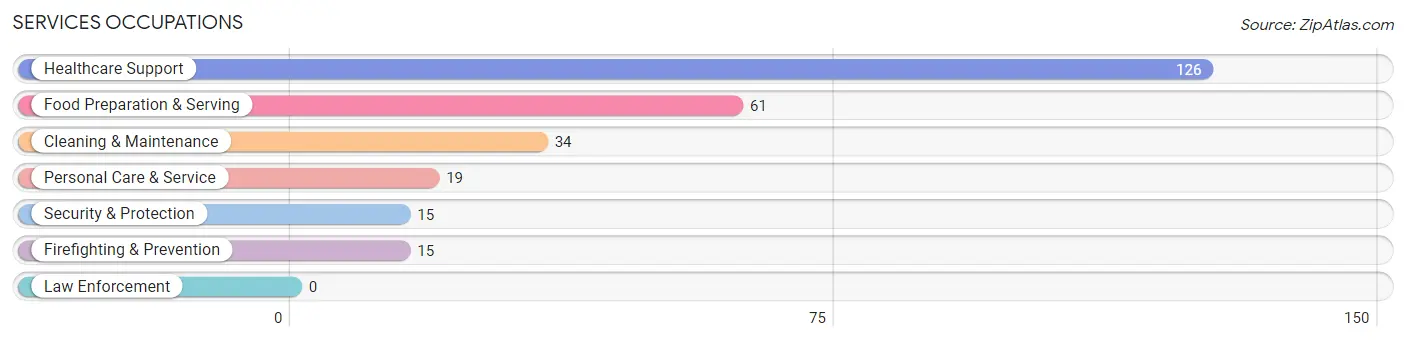
Services Occupations
The most common Services occupations in Parowan are Healthcare Support (126 | 11.2%), Food Preparation & Serving (61 | 5.4%), Cleaning & Maintenance (34 | 3.0%), Personal Care & Service (19 | 1.7%), and Security & Protection (15 | 1.3%).
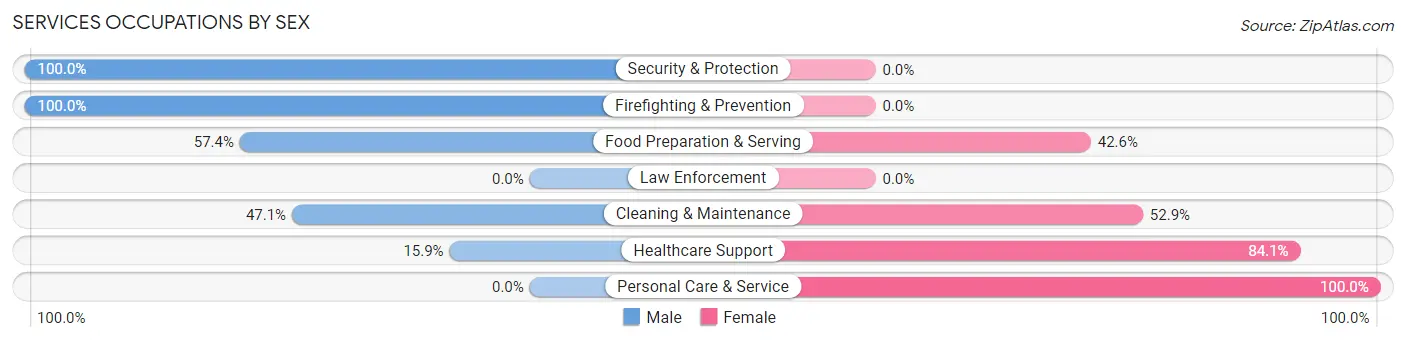
Services Occupations by Sex
Within the Services occupations in Parowan, the most male-oriented occupations are Security & Protection (100.0%), Firefighting & Prevention (100.0%), and Food Preparation & Serving (57.4%), while the most female-oriented occupations are Personal Care & Service (100.0%), Healthcare Support (84.1%), and Cleaning & Maintenance (52.9%).
| Occupation | Male | Female |
| Healthcare Support | 20 (15.9%) | 106 (84.1%) |
| Security & Protection | 15 (100.0%) | 0 (0.0%) |
| Firefighting & Prevention | 15 (100.0%) | 0 (0.0%) |
| Law Enforcement | 0 (0.0%) | 0 (0.0%) |
| Food Preparation & Serving | 35 (57.4%) | 26 (42.6%) |
| Cleaning & Maintenance | 16 (47.1%) | 18 (52.9%) |
| Personal Care & Service | 0 (0.0%) | 19 (100.0%) |
| Total (Category) | 86 (33.7%) | 169 (66.3%) |
| Total (Overall) | 522 (46.2%) | 608 (53.8%) |
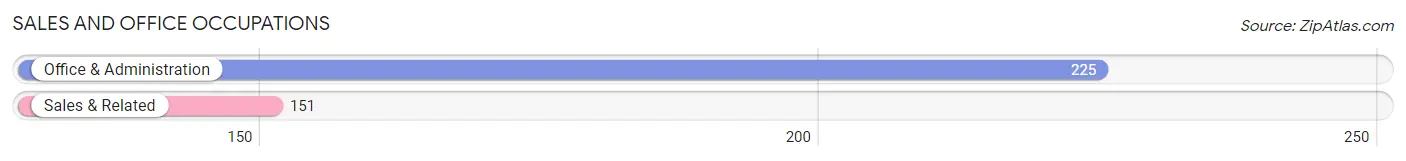
Sales and Office Occupations
The most common Sales and Office occupations in Parowan are Office & Administration (225 | 19.9%), and Sales & Related (151 | 13.4%).
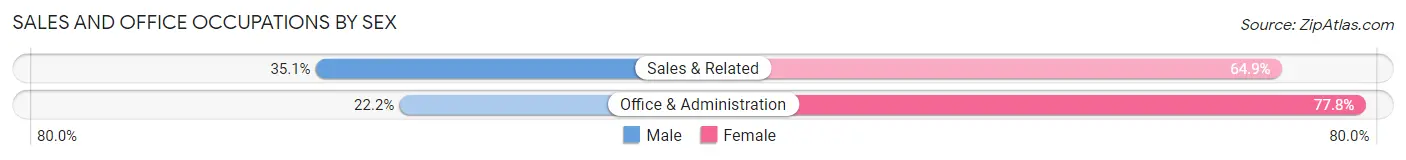
Sales and Office Occupations by Sex
| Occupation | Male | Female |
| Sales & Related | 53 (35.1%) | 98 (64.9%) |
| Office & Administration | 50 (22.2%) | 175 (77.8%) |
| Total (Category) | 103 (27.4%) | 273 (72.6%) |
| Total (Overall) | 522 (46.2%) | 608 (53.8%) |
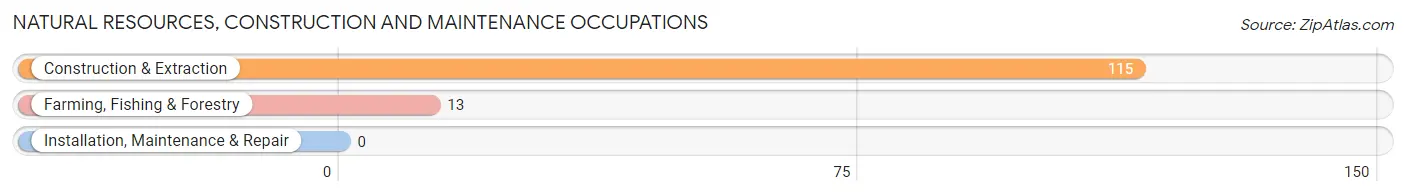
Natural Resources, Construction and Maintenance Occupations
The most common Natural Resources, Construction and Maintenance occupations in Parowan are Construction & Extraction (115 | 10.2%), and Farming, Fishing & Forestry (13 | 1.1%).
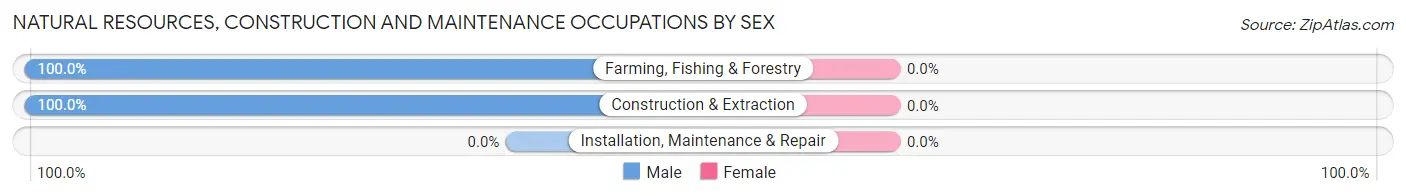
Natural Resources, Construction and Maintenance Occupations by Sex
| Occupation | Male | Female |
| Farming, Fishing & Forestry | 13 (100.0%) | 0 (0.0%) |
| Construction & Extraction | 115 (100.0%) | 0 (0.0%) |
| Installation, Maintenance & Repair | 0 (0.0%) | 0 (0.0%) |
| Total (Category) | 128 (100.0%) | 0 (0.0%) |
| Total (Overall) | 522 (46.2%) | 608 (53.8%) |
Production, Transportation and Moving Occupations
The most common Production, Transportation and Moving occupations in Parowan are Production (57 | 5.0%), and Transportation (4 | 0.4%).
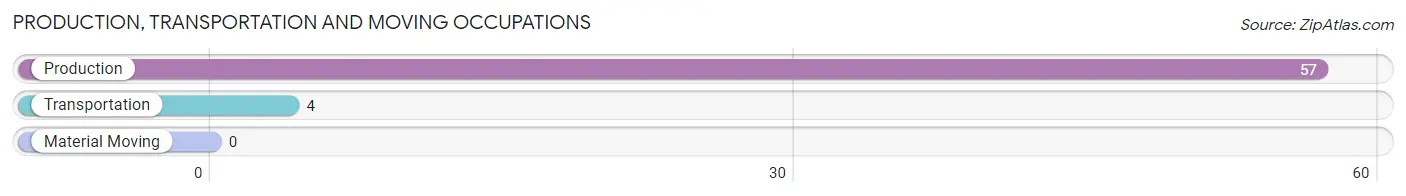
Production, Transportation and Moving Occupations by Sex
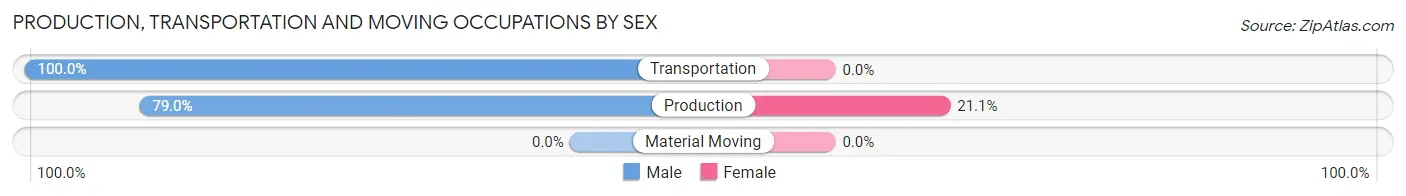
| Occupation | Male | Female |
| Production | 45 (78.9%) | 12 (21.0%) |
| Transportation | 4 (100.0%) | 0 (0.0%) |
| Material Moving | 0 (0.0%) | 0 (0.0%) |
| Total (Category) | 49 (80.3%) | 12 (19.7%) |
| Total (Overall) | 522 (46.2%) | 608 (53.8%) |
Employment Industries by Sex in Parowan
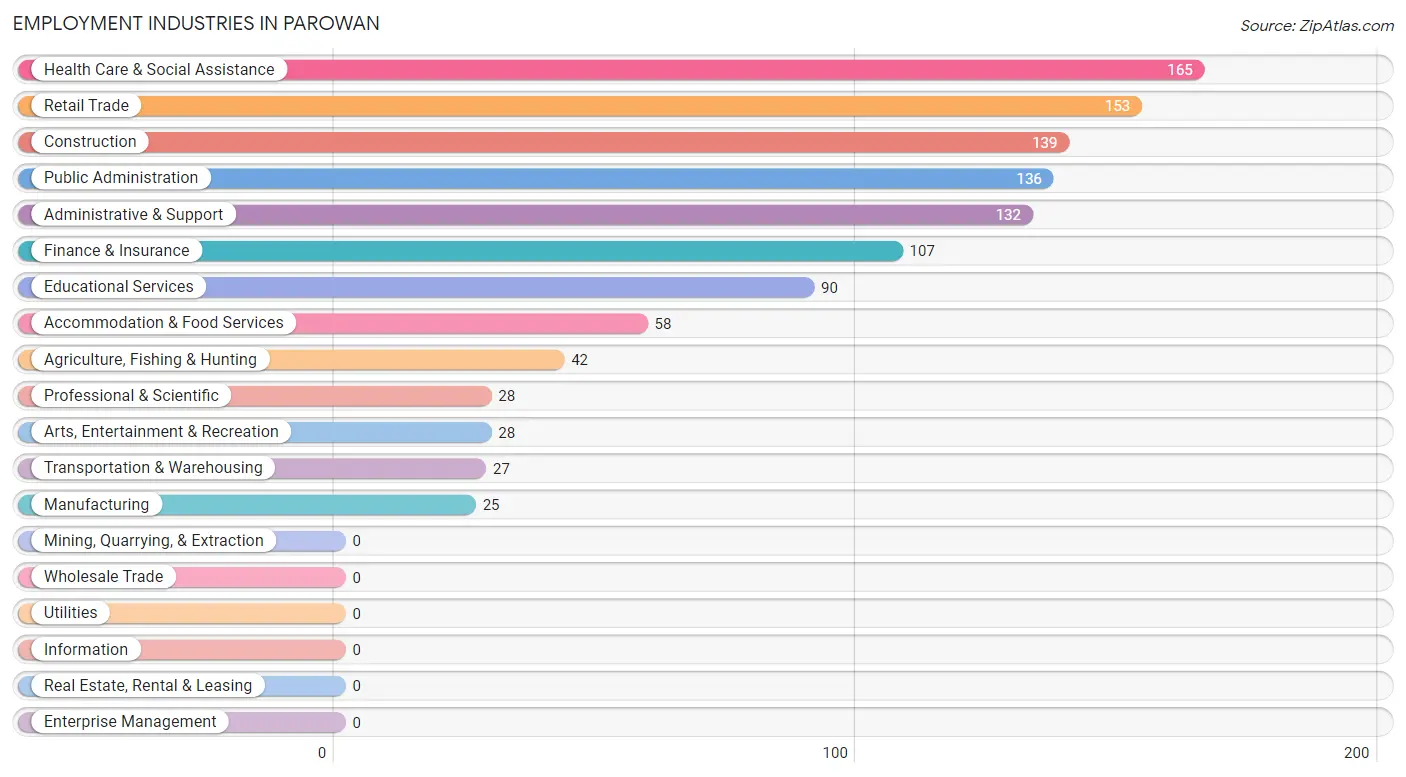
Employment Industries in Parowan
The major employment industries in Parowan include Health Care & Social Assistance (165 | 14.6%), Retail Trade (153 | 13.5%), Construction (139 | 12.3%), Public Administration (136 | 12.0%), and Administrative & Support (132 | 11.7%).
Employment Industries by Sex in Parowan
The Parowan industries that see more men than women are Agriculture, Fishing & Hunting (100.0%), Construction (100.0%), and Manufacturing (100.0%), whereas the industries that tend to have a higher number of women are Educational Services (100.0%), Arts, Entertainment & Recreation (100.0%), and Retail Trade (90.2%).
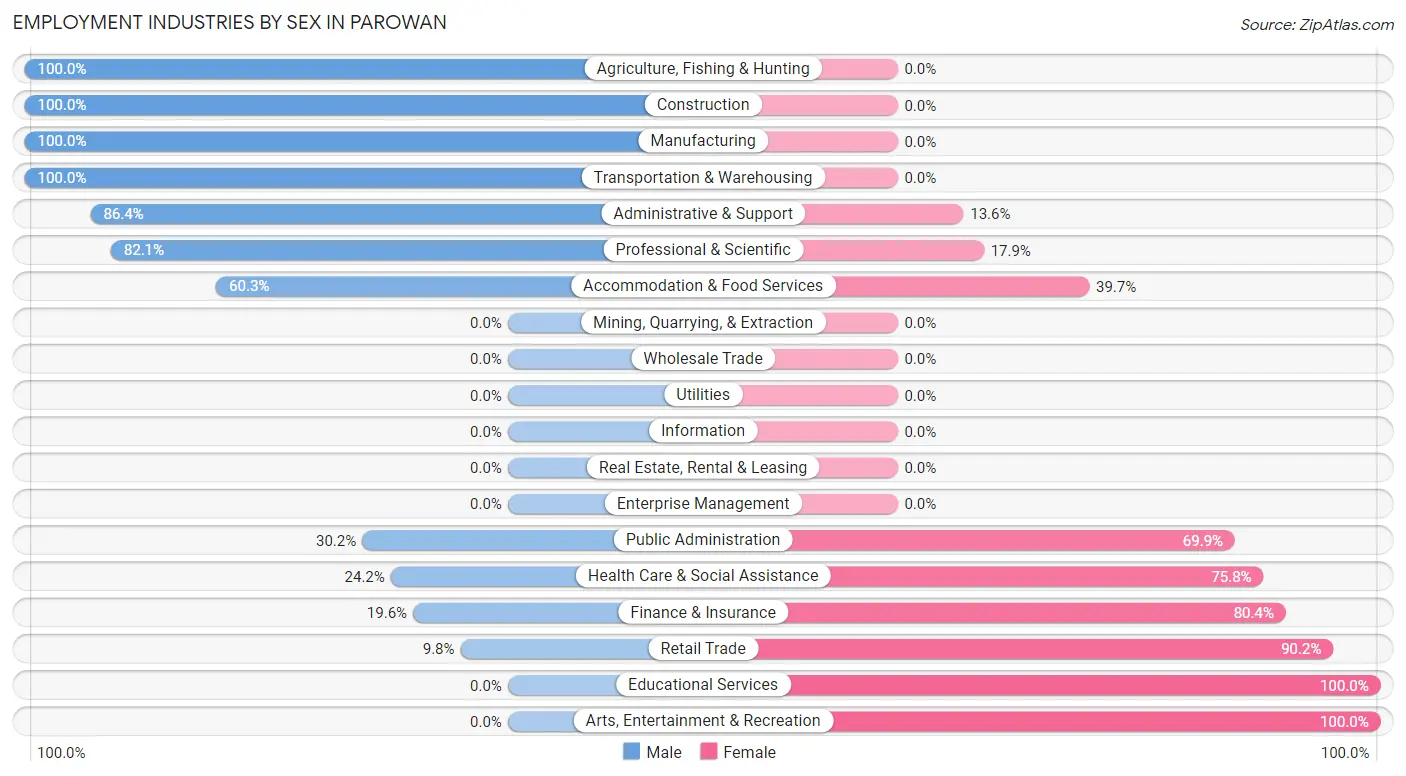
| Industry | Male | Female |
| Agriculture, Fishing & Hunting | 42 (100.0%) | 0 (0.0%) |
| Mining, Quarrying, & Extraction | 0 (0.0%) | 0 (0.0%) |
| Construction | 139 (100.0%) | 0 (0.0%) |
| Manufacturing | 25 (100.0%) | 0 (0.0%) |
| Wholesale Trade | 0 (0.0%) | 0 (0.0%) |
| Retail Trade | 15 (9.8%) | 138 (90.2%) |
| Transportation & Warehousing | 27 (100.0%) | 0 (0.0%) |
| Utilities | 0 (0.0%) | 0 (0.0%) |
| Information | 0 (0.0%) | 0 (0.0%) |
| Finance & Insurance | 21 (19.6%) | 86 (80.4%) |
| Real Estate, Rental & Leasing | 0 (0.0%) | 0 (0.0%) |
| Professional & Scientific | 23 (82.1%) | 5 (17.9%) |
| Enterprise Management | 0 (0.0%) | 0 (0.0%) |
| Administrative & Support | 114 (86.4%) | 18 (13.6%) |
| Educational Services | 0 (0.0%) | 90 (100.0%) |
| Health Care & Social Assistance | 40 (24.2%) | 125 (75.8%) |
| Arts, Entertainment & Recreation | 0 (0.0%) | 28 (100.0%) |
| Accommodation & Food Services | 35 (60.3%) | 23 (39.7%) |
| Public Administration | 41 (30.1%) | 95 (69.9%) |
| Total | 522 (46.2%) | 608 (53.8%) |
Education in Parowan
School Enrollment in Parowan
The most common levels of schooling among the 809 students in Parowan are high school (246 | 30.4%), elementary school (217 | 26.8%), and middle school (146 | 18.0%).
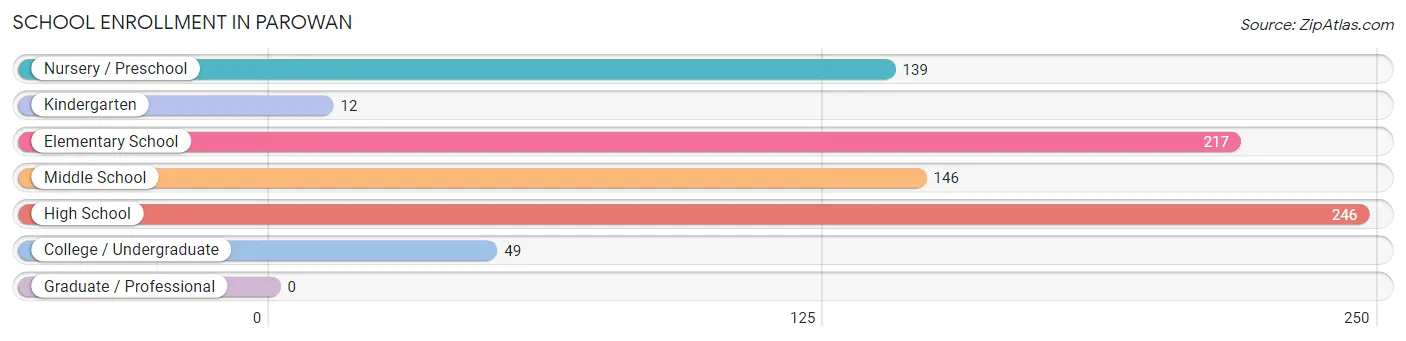
| School Level | # Students | % Students |
| Nursery / Preschool | 139 | 17.2% |
| Kindergarten | 12 | 1.5% |
| Elementary School | 217 | 26.8% |
| Middle School | 146 | 18.0% |
| High School | 246 | 30.4% |
| College / Undergraduate | 49 | 6.1% |
| Graduate / Professional | 0 | 0.0% |
| Total | 809 | 100.0% |
School Enrollment by Age by Funding Source in Parowan
Out of a total of 809 students who are enrolled in schools in Parowan, 3 (0.4%) attend a private institution, while the remaining 806 (99.6%) are enrolled in public schools. The age group of 15 to 17 year olds has the highest likelihood of being enrolled in private schools, with 2 (1.6% in the age bracket) enrolled. Conversely, the age group of 5 to 9 year old has the lowest likelihood of being enrolled in a private school, with 368 (100.0% in the age bracket) attending a public institution.
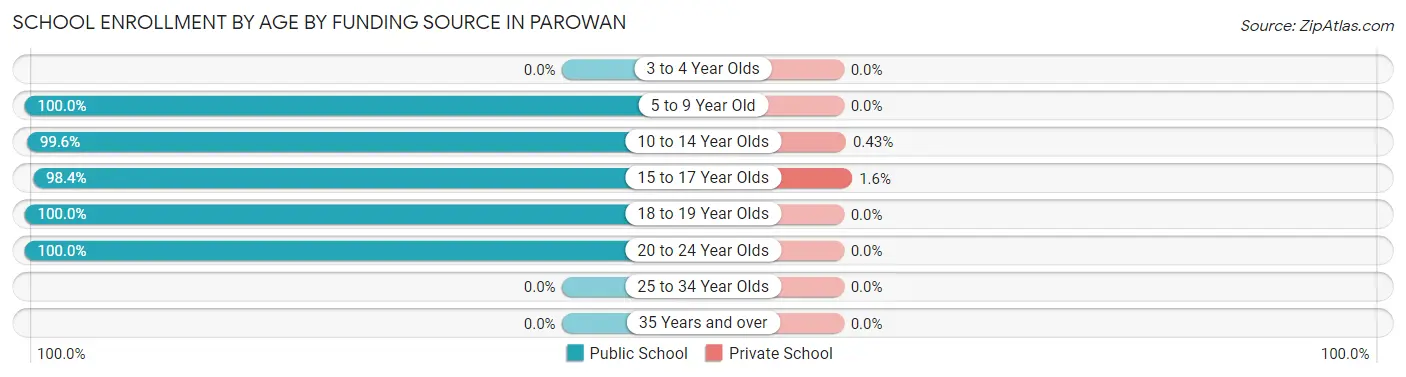
| Age Bracket | Public School | Private School |
| 3 to 4 Year Olds | 0 (0.0%) | 0 (0.0%) |
| 5 to 9 Year Old | 368 (100.0%) | 0 (0.0%) |
| 10 to 14 Year Olds | 230 (99.6%) | 1 (0.4%) |
| 15 to 17 Year Olds | 123 (98.4%) | 2 (1.6%) |
| 18 to 19 Year Olds | 36 (100.0%) | 0 (0.0%) |
| 20 to 24 Year Olds | 49 (100.0%) | 0 (0.0%) |
| 25 to 34 Year Olds | 0 (0.0%) | 0 (0.0%) |
| 35 Years and over | 0 (0.0%) | 0 (0.0%) |
| Total | 806 (99.6%) | 3 (0.4%) |
Educational Attainment by Field of Study in Parowan
Education (101 | 24.6%), business (96 | 23.4%), literature & languages (62 | 15.1%), social sciences (36 | 8.8%), and communications (35 | 8.5%) are the most common fields of study among 411 individuals in Parowan who have obtained a bachelor's degree or higher.
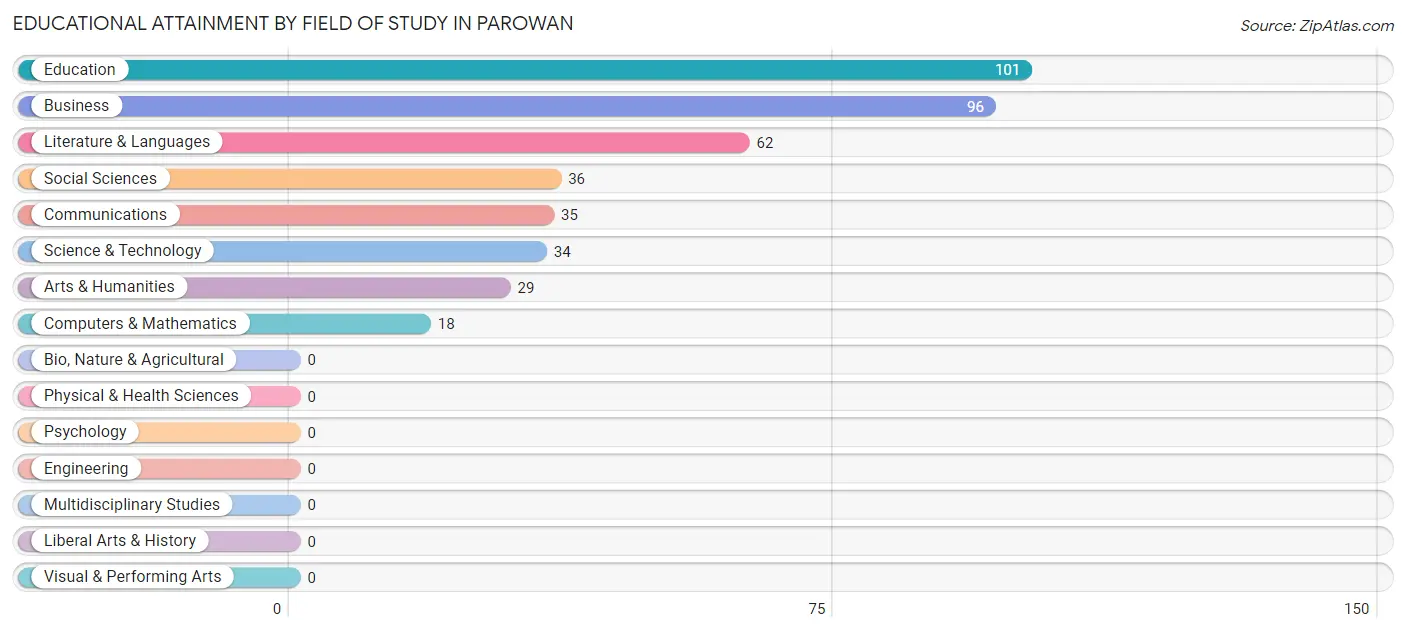
| Field of Study | # Graduates | % Graduates |
| Computers & Mathematics | 18 | 4.4% |
| Bio, Nature & Agricultural | 0 | 0.0% |
| Physical & Health Sciences | 0 | 0.0% |
| Psychology | 0 | 0.0% |
| Social Sciences | 36 | 8.8% |
| Engineering | 0 | 0.0% |
| Multidisciplinary Studies | 0 | 0.0% |
| Science & Technology | 34 | 8.3% |
| Business | 96 | 23.4% |
| Education | 101 | 24.6% |
| Literature & Languages | 62 | 15.1% |
| Liberal Arts & History | 0 | 0.0% |
| Visual & Performing Arts | 0 | 0.0% |
| Communications | 35 | 8.5% |
| Arts & Humanities | 29 | 7.1% |
| Total | 411 | 100.0% |
Transportation & Commute in Parowan
Vehicle Availability by Sex in Parowan
The most prevalent vehicle ownership categories in Parowan are males with 2 vehicles (259, accounting for 47.6%) and females with 2 vehicles (278, making up 47.7%).
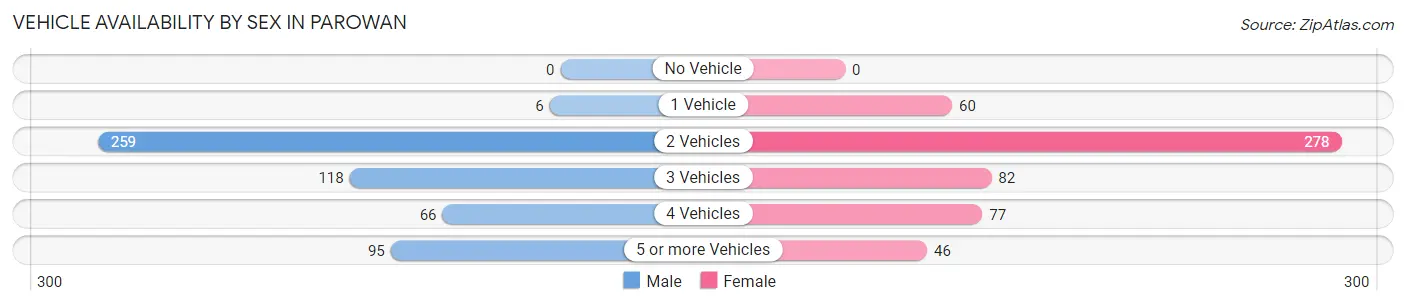
| Vehicles Available | Male | Female |
| No Vehicle | 0 (0.0%) | 0 (0.0%) |
| 1 Vehicle | 6 (1.1%) | 60 (11.1%) |
| 2 Vehicles | 259 (47.6%) | 278 (51.2%) |
| 3 Vehicles | 118 (21.7%) | 82 (15.1%) |
| 4 Vehicles | 66 (12.1%) | 77 (14.2%) |
| 5 or more Vehicles | 95 (17.5%) | 46 (8.5%) |
| Total | 544 (100.0%) | 543 (100.0%) |
Commute Time in Parowan
The most frequently occuring commute durations in Parowan are 30 to 34 minutes (149 commuters, 17.5%), 5 to 9 minutes (147 commuters, 17.3%), and 20 to 24 minutes (131 commuters, 15.4%).
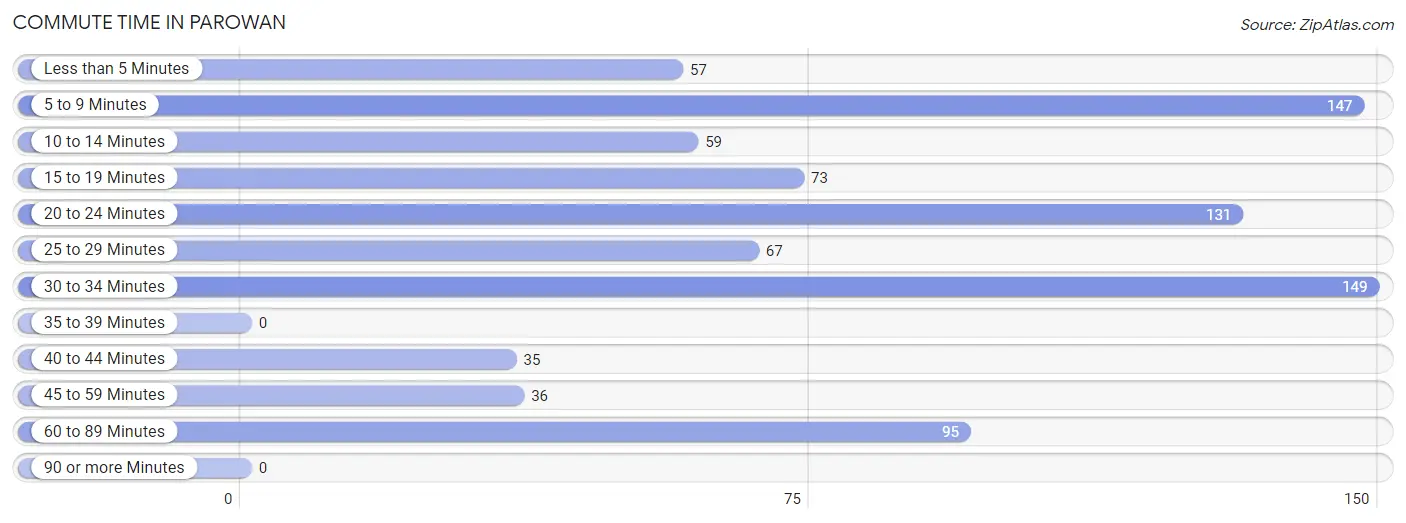
| Commute Time | # Commuters | % Commuters |
| Less than 5 Minutes | 57 | 6.7% |
| 5 to 9 Minutes | 147 | 17.3% |
| 10 to 14 Minutes | 59 | 7.0% |
| 15 to 19 Minutes | 73 | 8.6% |
| 20 to 24 Minutes | 131 | 15.4% |
| 25 to 29 Minutes | 67 | 7.9% |
| 30 to 34 Minutes | 149 | 17.5% |
| 35 to 39 Minutes | 0 | 0.0% |
| 40 to 44 Minutes | 35 | 4.1% |
| 45 to 59 Minutes | 36 | 4.2% |
| 60 to 89 Minutes | 95 | 11.2% |
| 90 or more Minutes | 0 | 0.0% |
Commute Time by Sex in Parowan
The most common commute times in Parowan are 30 to 34 minutes (134 commuters, 30.9%) for males and 5 to 9 minutes (101 commuters, 24.3%) for females.
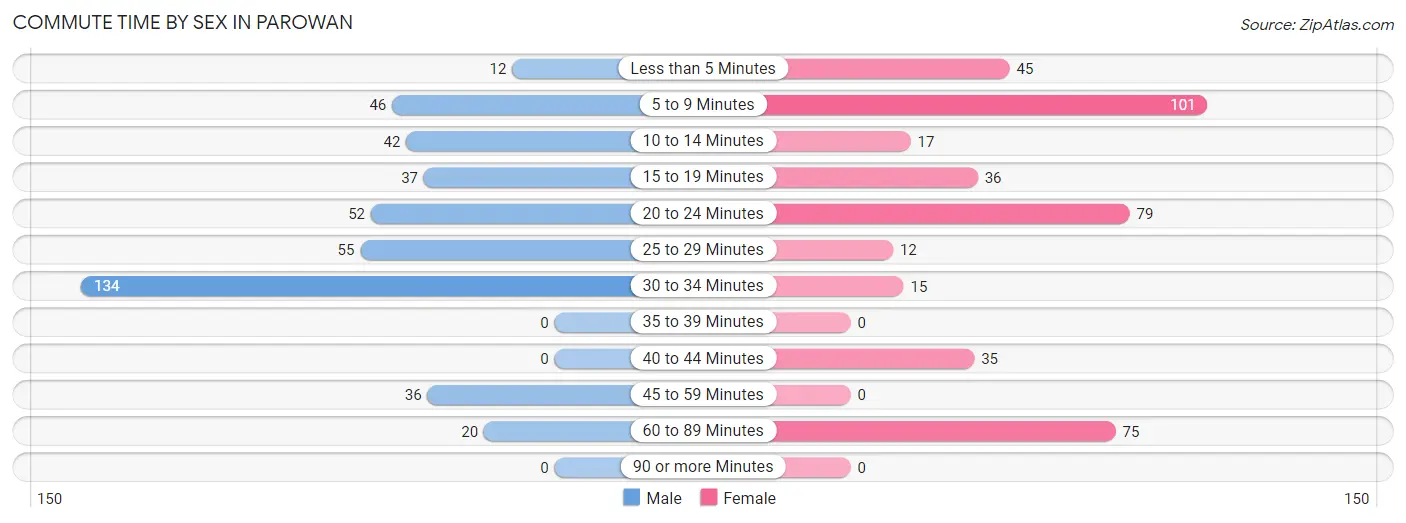
| Commute Time | Male | Female |
| Less than 5 Minutes | 12 (2.8%) | 45 (10.8%) |
| 5 to 9 Minutes | 46 (10.6%) | 101 (24.3%) |
| 10 to 14 Minutes | 42 (9.7%) | 17 (4.1%) |
| 15 to 19 Minutes | 37 (8.5%) | 36 (8.7%) |
| 20 to 24 Minutes | 52 (12.0%) | 79 (19.0%) |
| 25 to 29 Minutes | 55 (12.7%) | 12 (2.9%) |
| 30 to 34 Minutes | 134 (30.9%) | 15 (3.6%) |
| 35 to 39 Minutes | 0 (0.0%) | 0 (0.0%) |
| 40 to 44 Minutes | 0 (0.0%) | 35 (8.4%) |
| 45 to 59 Minutes | 36 (8.3%) | 0 (0.0%) |
| 60 to 89 Minutes | 20 (4.6%) | 75 (18.1%) |
| 90 or more Minutes | 0 (0.0%) | 0 (0.0%) |
Time of Departure to Work by Sex in Parowan
The most frequent times of departure to work in Parowan are 9:00 AM to 9:59 AM (96, 22.1%) for males and 7:30 AM to 7:59 AM (86, 20.7%) for females.
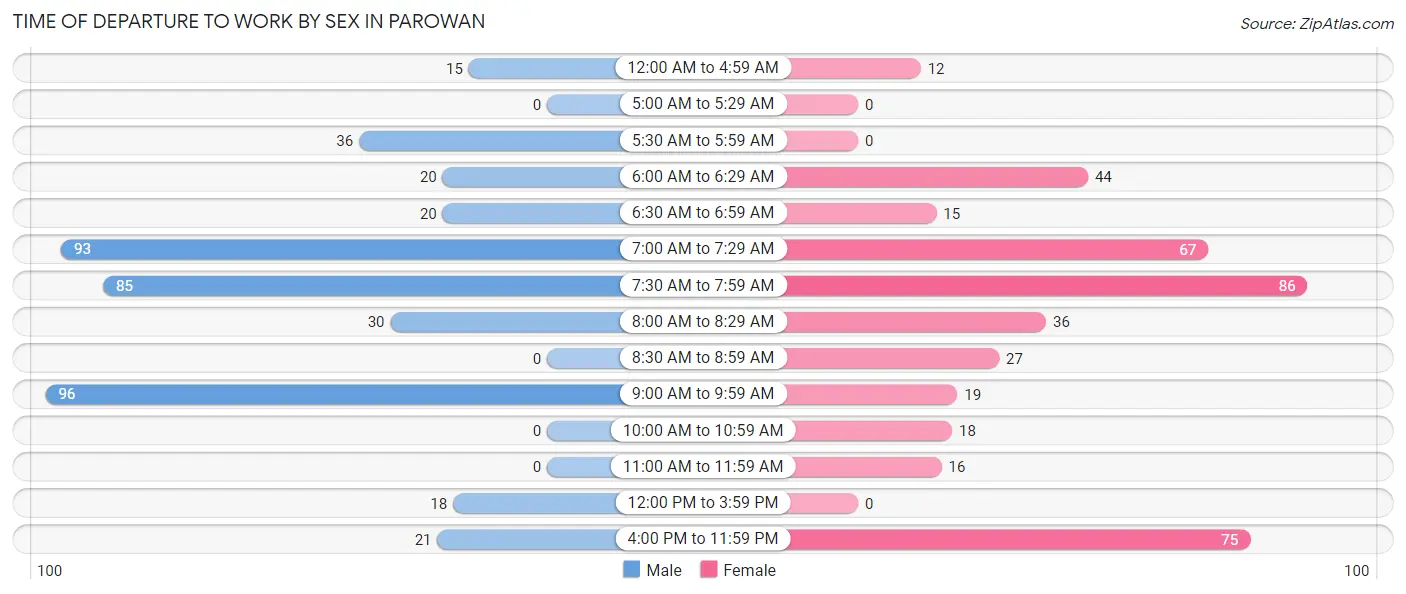
| Time of Departure | Male | Female |
| 12:00 AM to 4:59 AM | 15 (3.5%) | 12 (2.9%) |
| 5:00 AM to 5:29 AM | 0 (0.0%) | 0 (0.0%) |
| 5:30 AM to 5:59 AM | 36 (8.3%) | 0 (0.0%) |
| 6:00 AM to 6:29 AM | 20 (4.6%) | 44 (10.6%) |
| 6:30 AM to 6:59 AM | 20 (4.6%) | 15 (3.6%) |
| 7:00 AM to 7:29 AM | 93 (21.4%) | 67 (16.1%) |
| 7:30 AM to 7:59 AM | 85 (19.6%) | 86 (20.7%) |
| 8:00 AM to 8:29 AM | 30 (6.9%) | 36 (8.7%) |
| 8:30 AM to 8:59 AM | 0 (0.0%) | 27 (6.5%) |
| 9:00 AM to 9:59 AM | 96 (22.1%) | 19 (4.6%) |
| 10:00 AM to 10:59 AM | 0 (0.0%) | 18 (4.3%) |
| 11:00 AM to 11:59 AM | 0 (0.0%) | 16 (3.9%) |
| 12:00 PM to 3:59 PM | 18 (4.2%) | 0 (0.0%) |
| 4:00 PM to 11:59 PM | 21 (4.8%) | 75 (18.1%) |
| Total | 434 (100.0%) | 415 (100.0%) |
Housing Occupancy in Parowan
Occupancy by Ownership in Parowan
Of the total 978 dwellings in Parowan, owner-occupied units account for 613 (62.7%), while renter-occupied units make up 365 (37.3%).
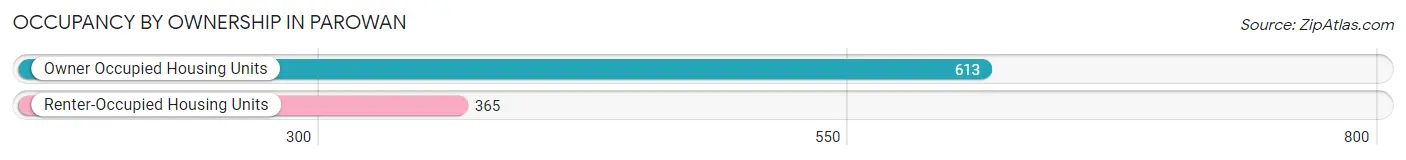
| Occupancy | # Housing Units | % Housing Units |
| Owner Occupied Housing Units | 613 | 62.7% |
| Renter-Occupied Housing Units | 365 | 37.3% |
| Total Occupied Housing Units | 978 | 100.0% |
Occupancy by Household Size in Parowan
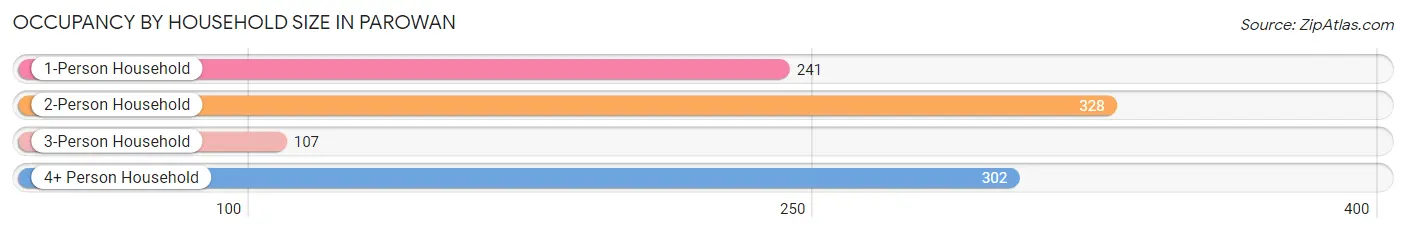
| Household Size | # Housing Units | % Housing Units |
| 1-Person Household | 241 | 24.6% |
| 2-Person Household | 328 | 33.5% |
| 3-Person Household | 107 | 10.9% |
| 4+ Person Household | 302 | 30.9% |
| Total Housing Units | 978 | 100.0% |
Occupancy by Ownership by Household Size in Parowan
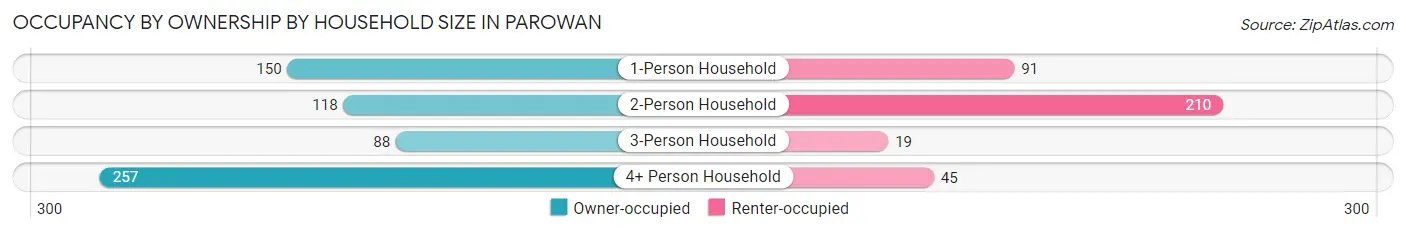
| Household Size | Owner-occupied | Renter-occupied |
| 1-Person Household | 150 (62.2%) | 91 (37.8%) |
| 2-Person Household | 118 (36.0%) | 210 (64.0%) |
| 3-Person Household | 88 (82.2%) | 19 (17.8%) |
| 4+ Person Household | 257 (85.1%) | 45 (14.9%) |
| Total Housing Units | 613 (62.7%) | 365 (37.3%) |
Occupancy by Educational Attainment in Parowan
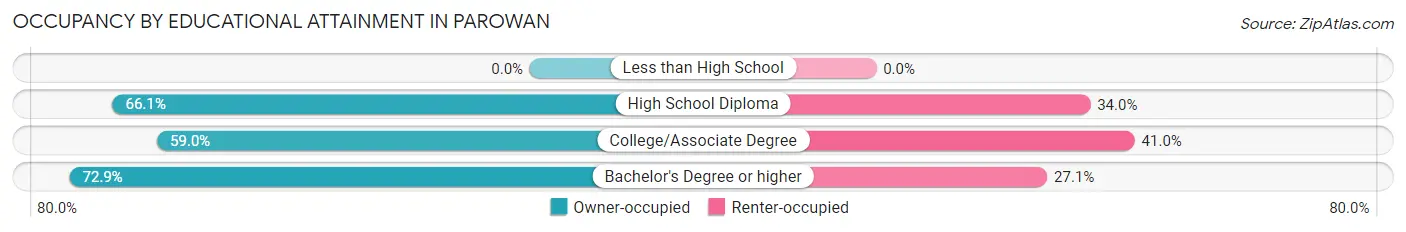
| Household Size | Owner-occupied | Renter-occupied |
| Less than High School | 0 (0.0%) | 0 (0.0%) |
| High School Diploma | 107 (66.0%) | 55 (34.0%) |
| College/Associate Degree | 377 (59.0%) | 262 (41.0%) |
| Bachelor's Degree or higher | 129 (72.9%) | 48 (27.1%) |
Occupancy by Age of Householder in Parowan
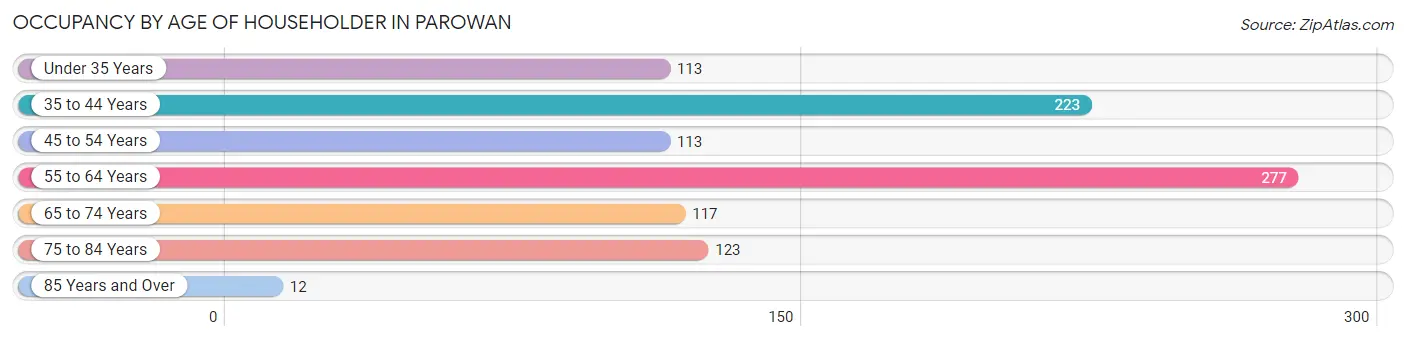
| Age Bracket | # Households | % Households |
| Under 35 Years | 113 | 11.6% |
| 35 to 44 Years | 223 | 22.8% |
| 45 to 54 Years | 113 | 11.6% |
| 55 to 64 Years | 277 | 28.3% |
| 65 to 74 Years | 117 | 12.0% |
| 75 to 84 Years | 123 | 12.6% |
| 85 Years and Over | 12 | 1.2% |
| Total | 978 | 100.0% |
Housing Finances in Parowan
Median Income by Occupancy in Parowan
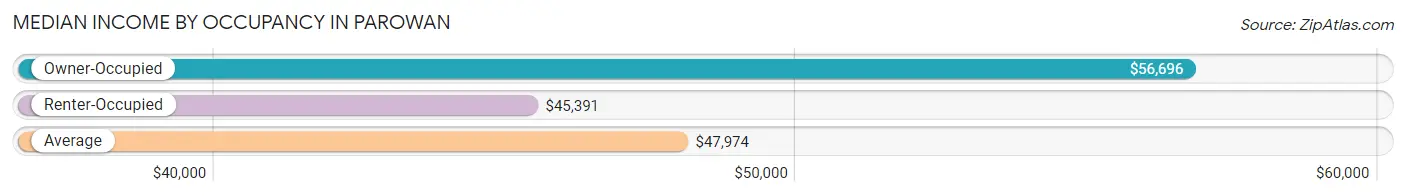
| Occupancy Type | # Households | Median Income |
| Owner-Occupied | 613 (62.7%) | $56,696 |
| Renter-Occupied | 365 (37.3%) | $45,391 |
| Average | 978 (100.0%) | $47,974 |
Occupancy by Householder Income Bracket in Parowan
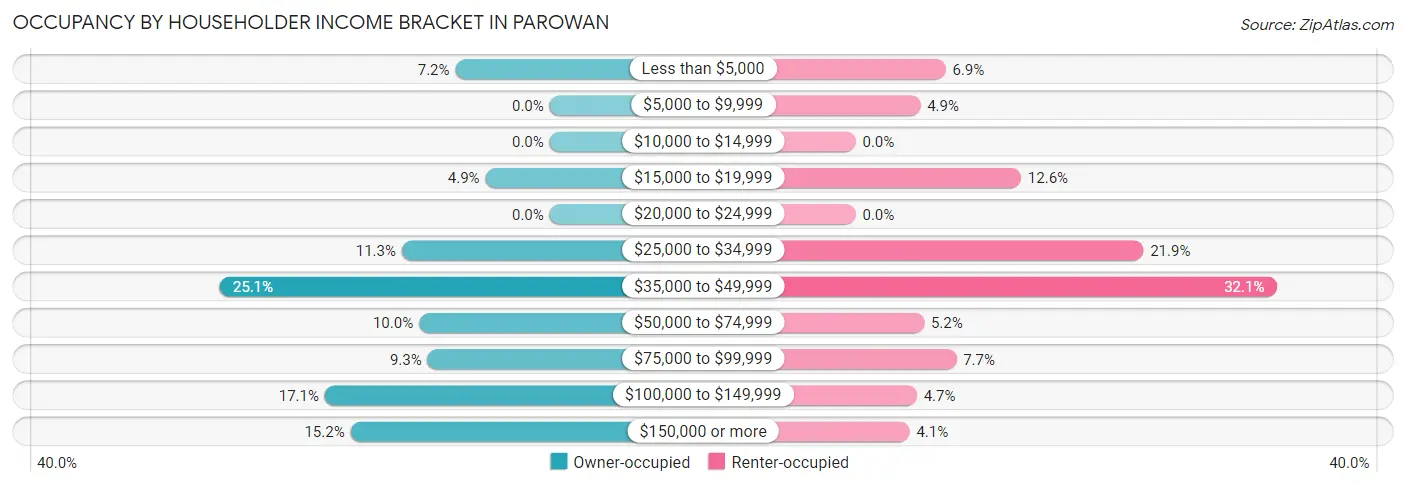
| Income Bracket | Owner-occupied | Renter-occupied |
| Less than $5,000 | 44 (7.2%) | 25 (6.9%) |
| $5,000 to $9,999 | 0 (0.0%) | 18 (4.9%) |
| $10,000 to $14,999 | 0 (0.0%) | 0 (0.0%) |
| $15,000 to $19,999 | 30 (4.9%) | 46 (12.6%) |
| $20,000 to $24,999 | 0 (0.0%) | 0 (0.0%) |
| $25,000 to $34,999 | 69 (11.3%) | 80 (21.9%) |
| $35,000 to $49,999 | 154 (25.1%) | 117 (32.1%) |
| $50,000 to $74,999 | 61 (10.0%) | 19 (5.2%) |
| $75,000 to $99,999 | 57 (9.3%) | 28 (7.7%) |
| $100,000 to $149,999 | 105 (17.1%) | 17 (4.7%) |
| $150,000 or more | 93 (15.2%) | 15 (4.1%) |
| Total | 613 (100.0%) | 365 (100.0%) |
Monthly Housing Cost Tiers in Parowan
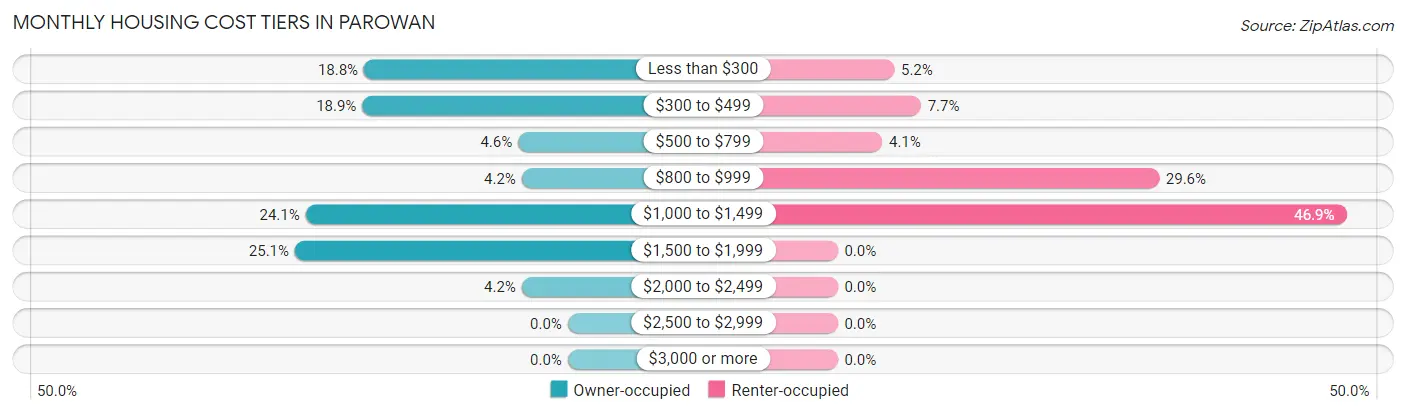
| Monthly Cost | Owner-occupied | Renter-occupied |
| Less than $300 | 115 (18.8%) | 19 (5.2%) |
| $300 to $499 | 116 (18.9%) | 28 (7.7%) |
| $500 to $799 | 28 (4.6%) | 15 (4.1%) |
| $800 to $999 | 26 (4.2%) | 108 (29.6%) |
| $1,000 to $1,499 | 148 (24.1%) | 171 (46.9%) |
| $1,500 to $1,999 | 154 (25.1%) | 0 (0.0%) |
| $2,000 to $2,499 | 26 (4.2%) | 0 (0.0%) |
| $2,500 to $2,999 | 0 (0.0%) | 0 (0.0%) |
| $3,000 or more | 0 (0.0%) | 0 (0.0%) |
| Total | 613 (100.0%) | 365 (100.0%) |
Physical Housing Characteristics in Parowan
Housing Structures in Parowan
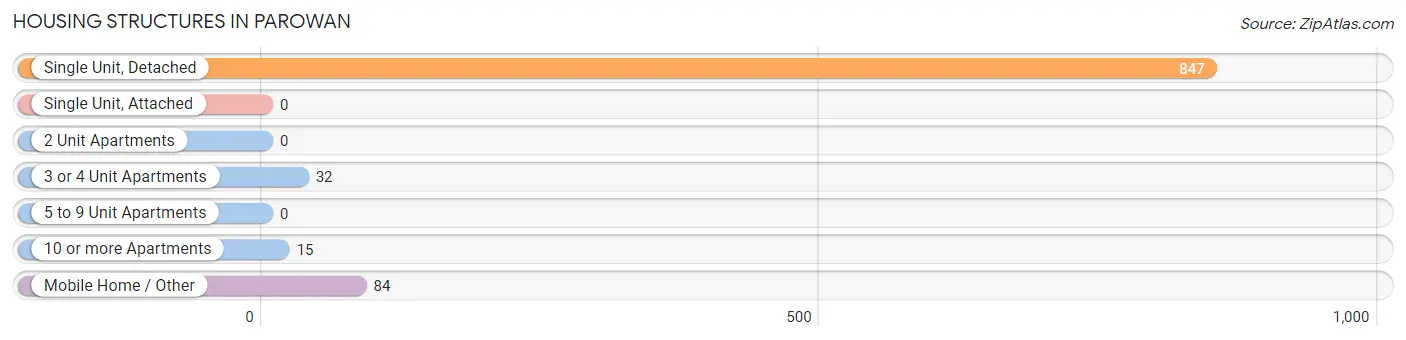
| Structure Type | # Housing Units | % Housing Units |
| Single Unit, Detached | 847 | 86.6% |
| Single Unit, Attached | 0 | 0.0% |
| 2 Unit Apartments | 0 | 0.0% |
| 3 or 4 Unit Apartments | 32 | 3.3% |
| 5 to 9 Unit Apartments | 0 | 0.0% |
| 10 or more Apartments | 15 | 1.5% |
| Mobile Home / Other | 84 | 8.6% |
| Total | 978 | 100.0% |
Housing Structures by Occupancy in Parowan
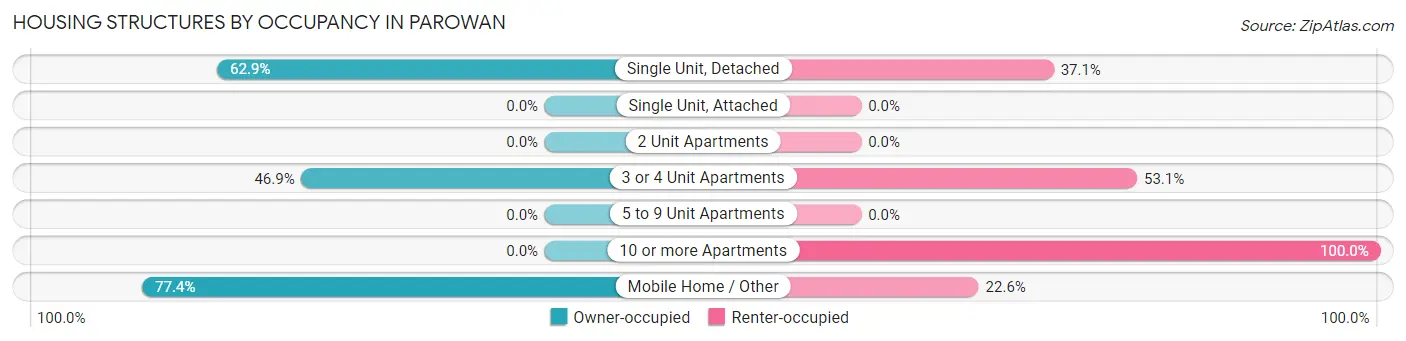
| Structure Type | Owner-occupied | Renter-occupied |
| Single Unit, Detached | 533 (62.9%) | 314 (37.1%) |
| Single Unit, Attached | 0 (0.0%) | 0 (0.0%) |
| 2 Unit Apartments | 0 (0.0%) | 0 (0.0%) |
| 3 or 4 Unit Apartments | 15 (46.9%) | 17 (53.1%) |
| 5 to 9 Unit Apartments | 0 (0.0%) | 0 (0.0%) |
| 10 or more Apartments | 0 (0.0%) | 15 (100.0%) |
| Mobile Home / Other | 65 (77.4%) | 19 (22.6%) |
| Total | 613 (62.7%) | 365 (37.3%) |
Housing Structures by Number of Rooms in Parowan
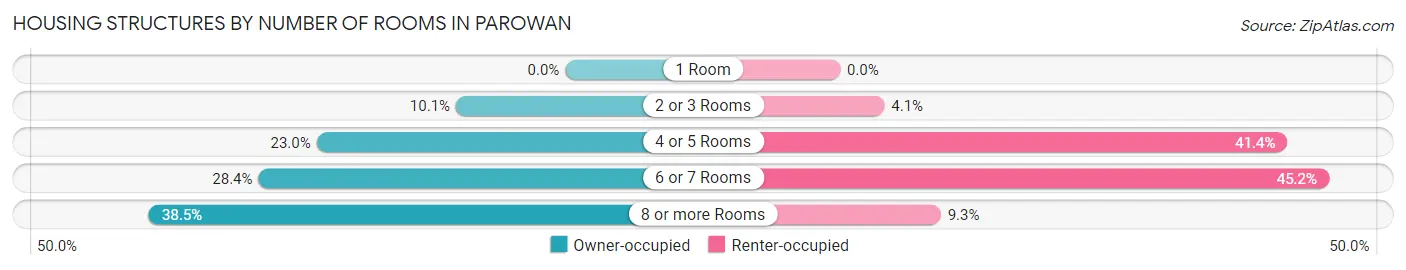
| Number of Rooms | Owner-occupied | Renter-occupied |
| 1 Room | 0 (0.0%) | 0 (0.0%) |
| 2 or 3 Rooms | 62 (10.1%) | 15 (4.1%) |
| 4 or 5 Rooms | 141 (23.0%) | 151 (41.4%) |
| 6 or 7 Rooms | 174 (28.4%) | 165 (45.2%) |
| 8 or more Rooms | 236 (38.5%) | 34 (9.3%) |
| Total | 613 (100.0%) | 365 (100.0%) |
Housing Structure by Heating Type in Parowan
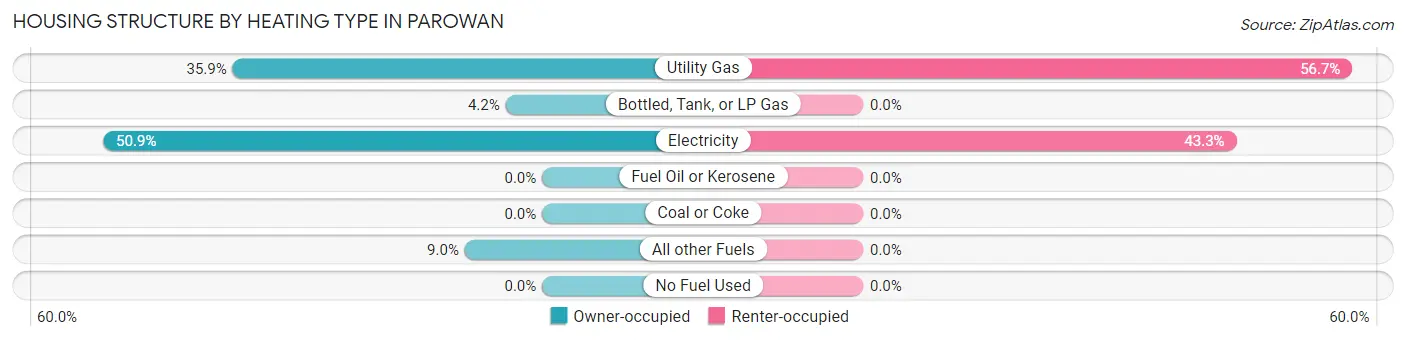
| Heating Type | Owner-occupied | Renter-occupied |
| Utility Gas | 220 (35.9%) | 207 (56.7%) |
| Bottled, Tank, or LP Gas | 26 (4.2%) | 0 (0.0%) |
| Electricity | 312 (50.9%) | 158 (43.3%) |
| Fuel Oil or Kerosene | 0 (0.0%) | 0 (0.0%) |
| Coal or Coke | 0 (0.0%) | 0 (0.0%) |
| All other Fuels | 55 (9.0%) | 0 (0.0%) |
| No Fuel Used | 0 (0.0%) | 0 (0.0%) |
| Total | 613 (100.0%) | 365 (100.0%) |
Household Vehicle Usage in Parowan
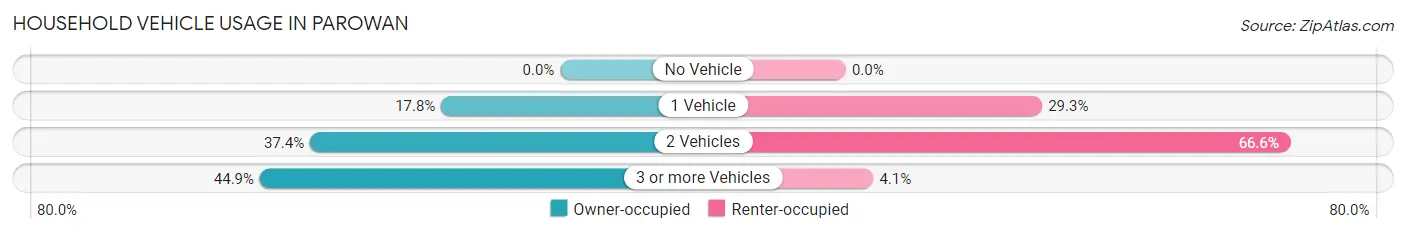
| Vehicles per Household | Owner-occupied | Renter-occupied |
| No Vehicle | 0 (0.0%) | 0 (0.0%) |
| 1 Vehicle | 109 (17.8%) | 107 (29.3%) |
| 2 Vehicles | 229 (37.4%) | 243 (66.6%) |
| 3 or more Vehicles | 275 (44.9%) | 15 (4.1%) |
| Total | 613 (100.0%) | 365 (100.0%) |
Real Estate & Mortgages in Parowan
Real Estate and Mortgage Overview in Parowan
| Characteristic | Without Mortgage | With Mortgage |
| Housing Units | 258 | 355 |
| Median Property Value | $291,100 | $234,900 |
| Median Household Income | $48,462 | $51 |
| Monthly Housing Costs | $316 | $0 |
| Real Estate Taxes | $1,123 | $0 |
Property Value by Mortgage Status in Parowan
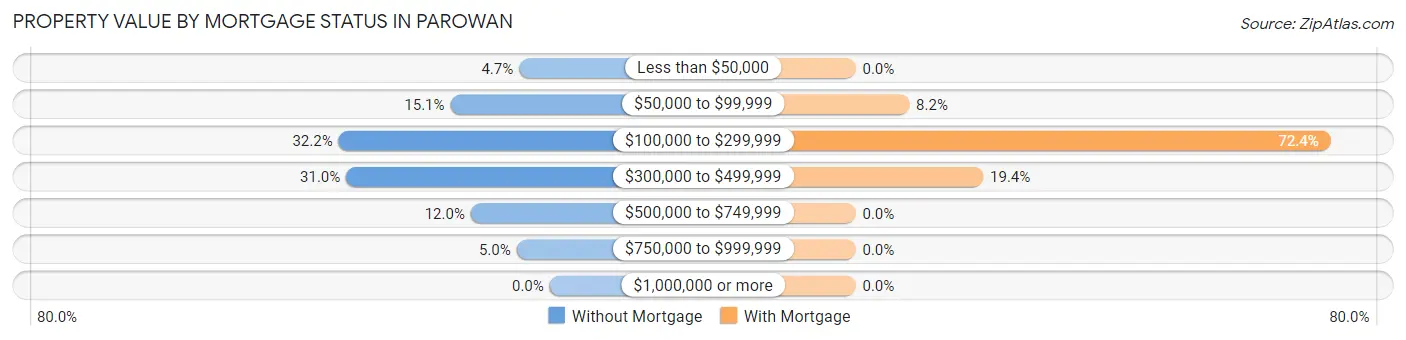
| Property Value | Without Mortgage | With Mortgage |
| Less than $50,000 | 12 (4.6%) | 0 (0.0%) |
| $50,000 to $99,999 | 39 (15.1%) | 29 (8.2%) |
| $100,000 to $299,999 | 83 (32.2%) | 257 (72.4%) |
| $300,000 to $499,999 | 80 (31.0%) | 69 (19.4%) |
| $500,000 to $749,999 | 31 (12.0%) | 0 (0.0%) |
| $750,000 to $999,999 | 13 (5.0%) | 0 (0.0%) |
| $1,000,000 or more | 0 (0.0%) | 0 (0.0%) |
| Total | 258 (100.0%) | 355 (100.0%) |
Household Income by Mortgage Status in Parowan
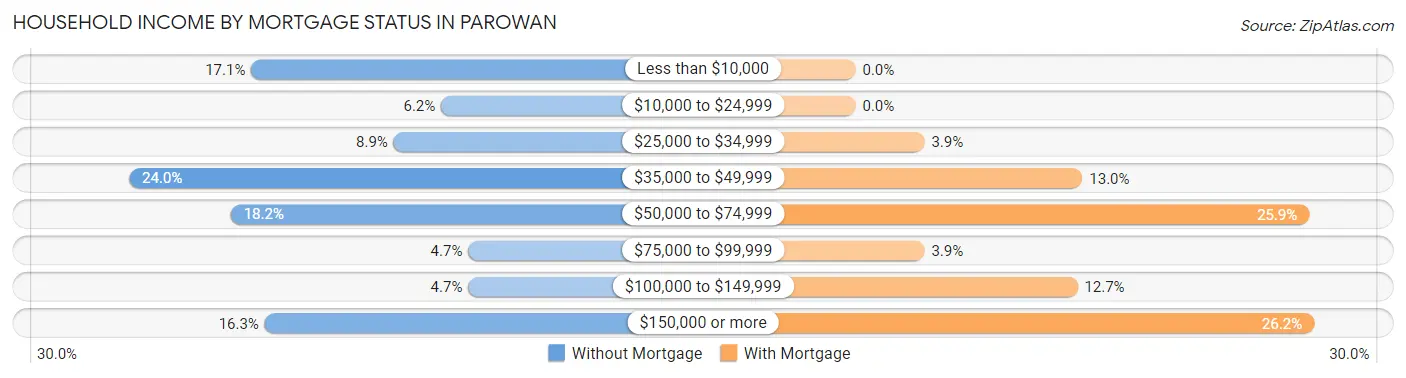
| Household Income | Without Mortgage | With Mortgage |
| Less than $10,000 | 44 (17.1%) | 0 (0.0%) |
| $10,000 to $24,999 | 16 (6.2%) | 0 (0.0%) |
| $25,000 to $34,999 | 23 (8.9%) | 14 (3.9%) |
| $35,000 to $49,999 | 62 (24.0%) | 46 (13.0%) |
| $50,000 to $74,999 | 47 (18.2%) | 92 (25.9%) |
| $75,000 to $99,999 | 12 (4.6%) | 14 (3.9%) |
| $100,000 to $149,999 | 12 (4.6%) | 45 (12.7%) |
| $150,000 or more | 42 (16.3%) | 93 (26.2%) |
| Total | 258 (100.0%) | 355 (100.0%) |
Property Value to Household Income Ratio in Parowan
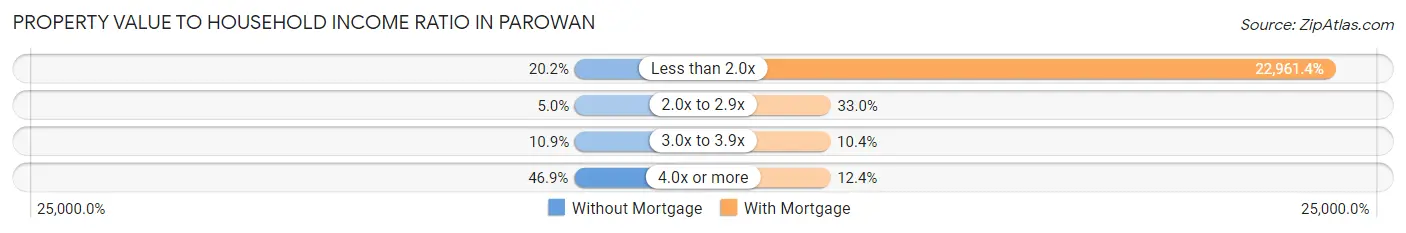
| Value-to-Income Ratio | Without Mortgage | With Mortgage |
| Less than 2.0x | 52 (20.2%) | 81,513 (22,961.4%) |
| 2.0x to 2.9x | 13 (5.0%) | 117 (33.0%) |
| 3.0x to 3.9x | 28 (10.8%) | 37 (10.4%) |
| 4.0x or more | 121 (46.9%) | 44 (12.4%) |
| Total | 258 (100.0%) | 355 (100.0%) |
Real Estate Taxes by Mortgage Status in Parowan
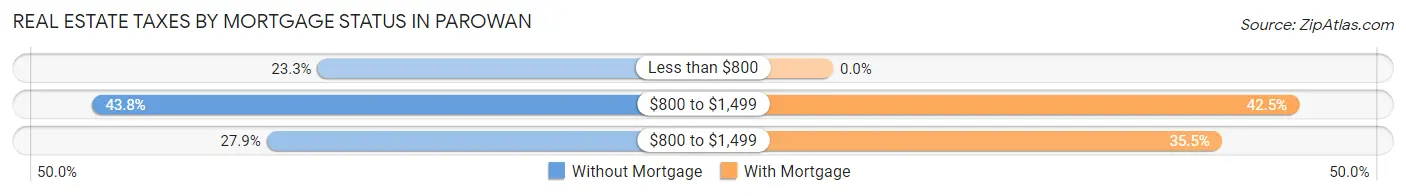
| Property Taxes | Without Mortgage | With Mortgage |
| Less than $800 | 60 (23.3%) | 0 (0.0%) |
| $800 to $1,499 | 113 (43.8%) | 151 (42.5%) |
| $800 to $1,499 | 72 (27.9%) | 126 (35.5%) |
| Total | 258 (100.0%) | 355 (100.0%) |
Health & Disability in Parowan
Health Insurance Coverage by Age in Parowan
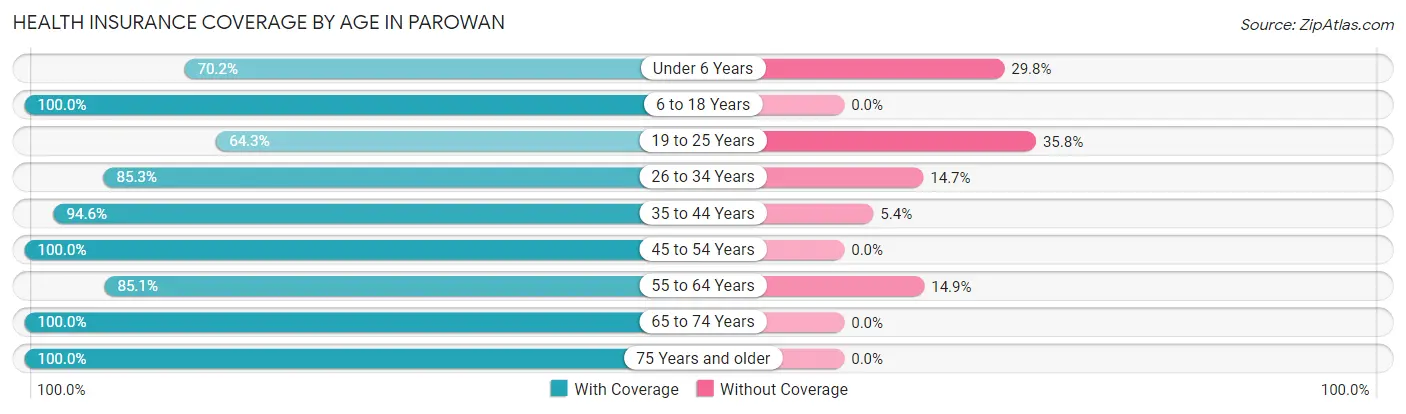
| Age Bracket | With Coverage | Without Coverage |
| Under 6 Years | 261 (70.2%) | 111 (29.8%) |
| 6 to 18 Years | 630 (100.0%) | 0 (0.0%) |
| 19 to 25 Years | 133 (64.2%) | 74 (35.7%) |
| 26 to 34 Years | 266 (85.3%) | 46 (14.7%) |
| 35 to 44 Years | 366 (94.6%) | 21 (5.4%) |
| 45 to 54 Years | 234 (100.0%) | 0 (0.0%) |
| 55 to 64 Years | 308 (85.1%) | 54 (14.9%) |
| 65 to 74 Years | 299 (100.0%) | 0 (0.0%) |
| 75 Years and older | 183 (100.0%) | 0 (0.0%) |
| Total | 2,680 (89.7%) | 306 (10.2%) |
Health Insurance Coverage by Citizenship Status in Parowan
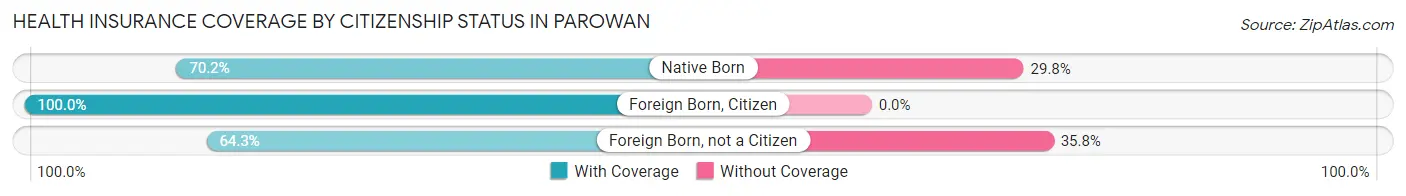
| Citizenship Status | With Coverage | Without Coverage |
| Native Born | 261 (70.2%) | 111 (29.8%) |
| Foreign Born, Citizen | 630 (100.0%) | 0 (0.0%) |
| Foreign Born, not a Citizen | 133 (64.2%) | 74 (35.7%) |
Health Insurance Coverage by Household Income in Parowan
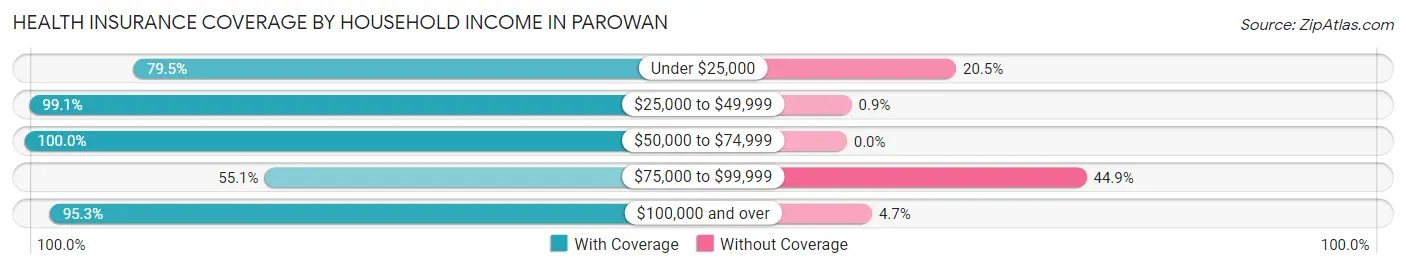
| Household Income | With Coverage | Without Coverage |
| Under $25,000 | 171 (79.5%) | 44 (20.5%) |
| $25,000 to $49,999 | 1,103 (99.1%) | 10 (0.9%) |
| $50,000 to $74,999 | 258 (100.0%) | 0 (0.0%) |
| $75,000 to $99,999 | 255 (55.1%) | 208 (44.9%) |
| $100,000 and over | 889 (95.3%) | 44 (4.7%) |
Public vs Private Health Insurance Coverage by Age in Parowan
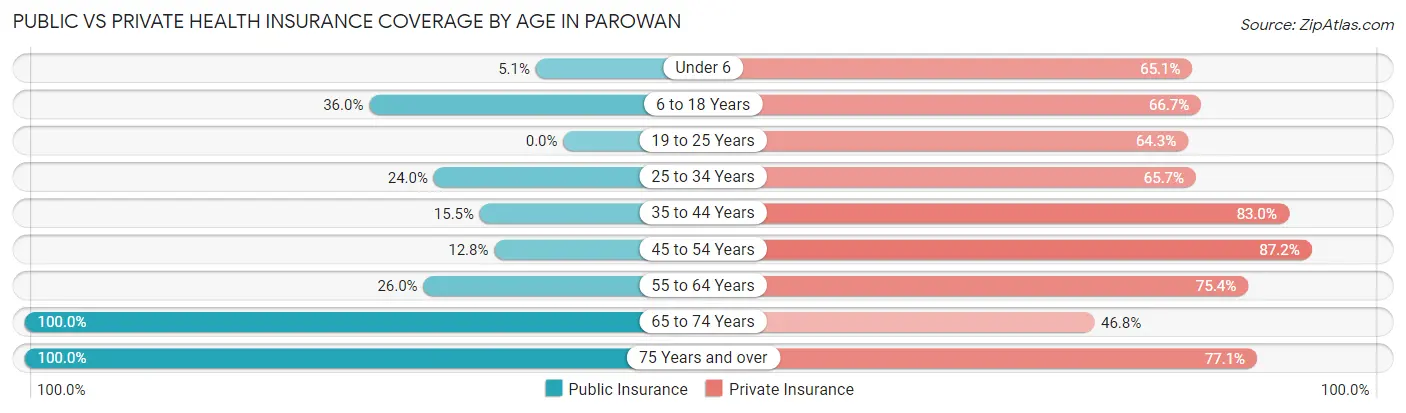
| Age Bracket | Public Insurance | Private Insurance |
| Under 6 | 19 (5.1%) | 242 (65.0%) |
| 6 to 18 Years | 227 (36.0%) | 420 (66.7%) |
| 19 to 25 Years | 0 (0.0%) | 133 (64.2%) |
| 25 to 34 Years | 75 (24.0%) | 205 (65.7%) |
| 35 to 44 Years | 60 (15.5%) | 321 (83.0%) |
| 45 to 54 Years | 30 (12.8%) | 204 (87.2%) |
| 55 to 64 Years | 94 (26.0%) | 273 (75.4%) |
| 65 to 74 Years | 299 (100.0%) | 140 (46.8%) |
| 75 Years and over | 183 (100.0%) | 141 (77.0%) |
| Total | 987 (33.1%) | 2,079 (69.6%) |
Disability Status by Sex by Age in Parowan
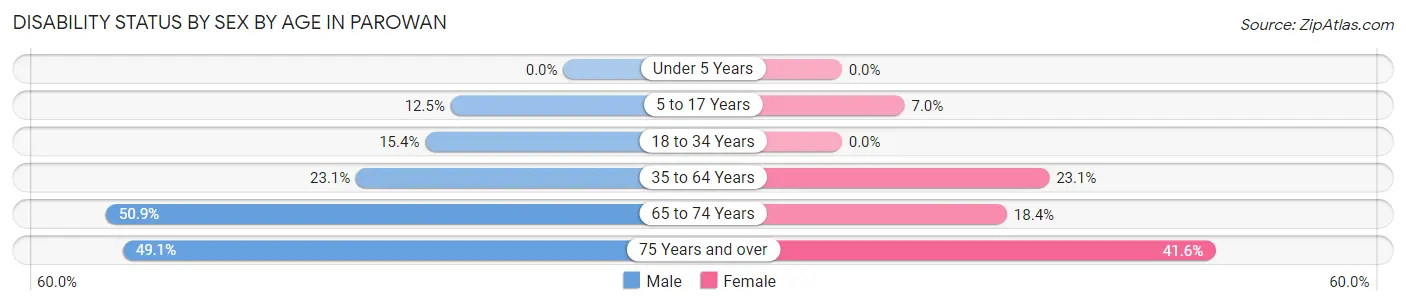
| Age Bracket | Male | Female |
| Under 5 Years | 0 (0.0%) | 0 (0.0%) |
| 5 to 17 Years | 36 (12.5%) | 33 (7.0%) |
| 18 to 34 Years | 58 (15.4%) | 0 (0.0%) |
| 35 to 64 Years | 99 (23.1%) | 128 (23.1%) |
| 65 to 74 Years | 108 (50.9%) | 16 (18.4%) |
| 75 Years and over | 52 (49.1%) | 32 (41.6%) |
Disability Class by Sex by Age in Parowan
Disability Class: Hearing Difficulty
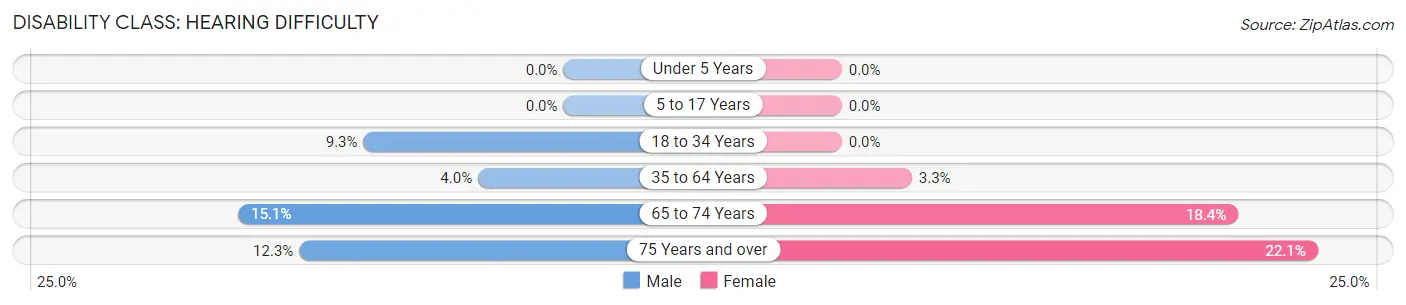
| Age Bracket | Male | Female |
| Under 5 Years | 0 (0.0%) | 0 (0.0%) |
| 5 to 17 Years | 0 (0.0%) | 0 (0.0%) |
| 18 to 34 Years | 35 (9.3%) | 0 (0.0%) |
| 35 to 64 Years | 17 (4.0%) | 18 (3.3%) |
| 65 to 74 Years | 32 (15.1%) | 16 (18.4%) |
| 75 Years and over | 13 (12.3%) | 17 (22.1%) |
Disability Class: Vision Difficulty
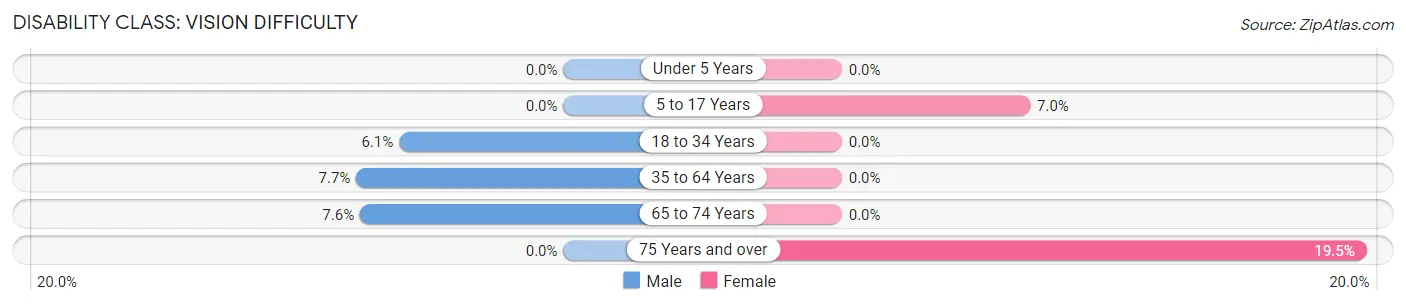
| Age Bracket | Male | Female |
| Under 5 Years | 0 (0.0%) | 0 (0.0%) |
| 5 to 17 Years | 0 (0.0%) | 33 (7.0%) |
| 18 to 34 Years | 23 (6.1%) | 0 (0.0%) |
| 35 to 64 Years | 33 (7.7%) | 0 (0.0%) |
| 65 to 74 Years | 16 (7.5%) | 0 (0.0%) |
| 75 Years and over | 0 (0.0%) | 15 (19.5%) |
Disability Class: Cognitive Difficulty
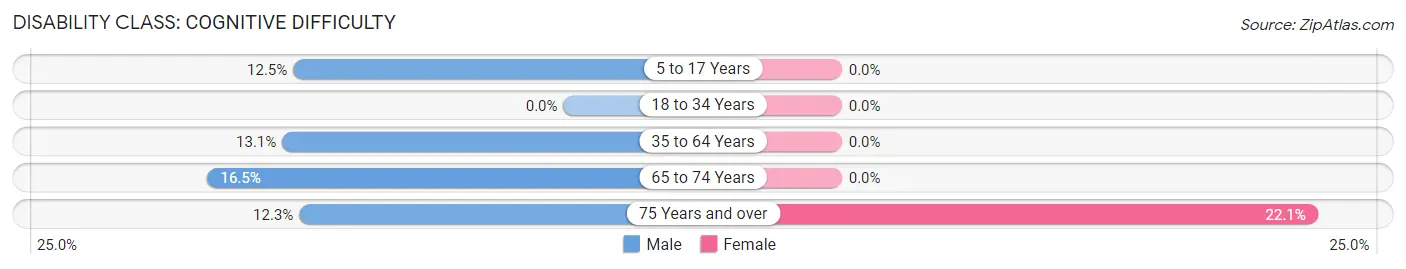
| Age Bracket | Male | Female |
| 5 to 17 Years | 36 (12.5%) | 0 (0.0%) |
| 18 to 34 Years | 0 (0.0%) | 0 (0.0%) |
| 35 to 64 Years | 56 (13.1%) | 0 (0.0%) |
| 65 to 74 Years | 35 (16.5%) | 0 (0.0%) |
| 75 Years and over | 13 (12.3%) | 17 (22.1%) |
Disability Class: Ambulatory Difficulty
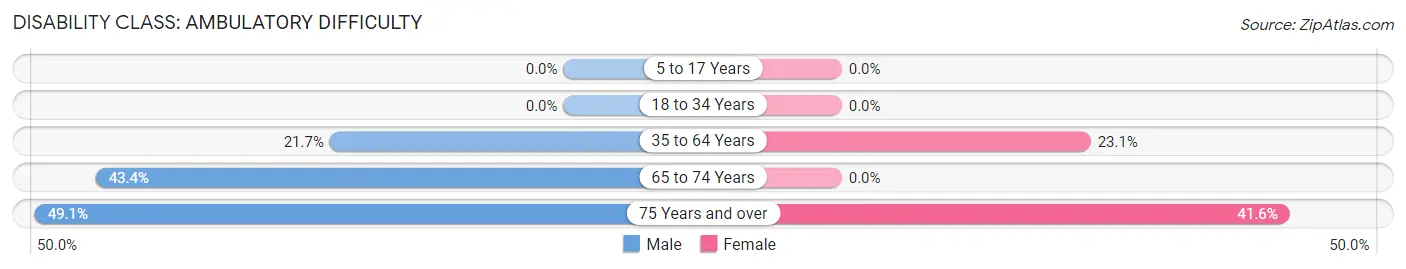
| Age Bracket | Male | Female |
| 5 to 17 Years | 0 (0.0%) | 0 (0.0%) |
| 18 to 34 Years | 0 (0.0%) | 0 (0.0%) |
| 35 to 64 Years | 93 (21.7%) | 128 (23.1%) |
| 65 to 74 Years | 92 (43.4%) | 0 (0.0%) |
| 75 Years and over | 52 (49.1%) | 32 (41.6%) |
Disability Class: Self-Care Difficulty
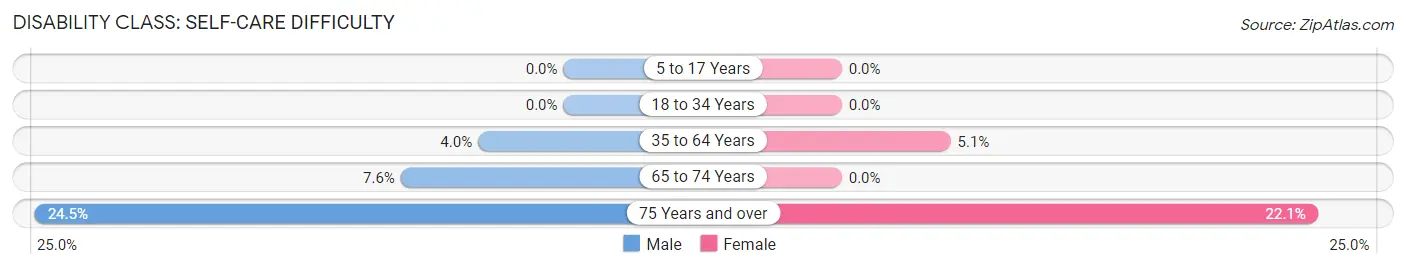
| Age Bracket | Male | Female |
| 5 to 17 Years | 0 (0.0%) | 0 (0.0%) |
| 18 to 34 Years | 0 (0.0%) | 0 (0.0%) |
| 35 to 64 Years | 17 (4.0%) | 28 (5.1%) |
| 65 to 74 Years | 16 (7.5%) | 0 (0.0%) |
| 75 Years and over | 26 (24.5%) | 17 (22.1%) |
Technology Access in Parowan
Computing Device Access in Parowan
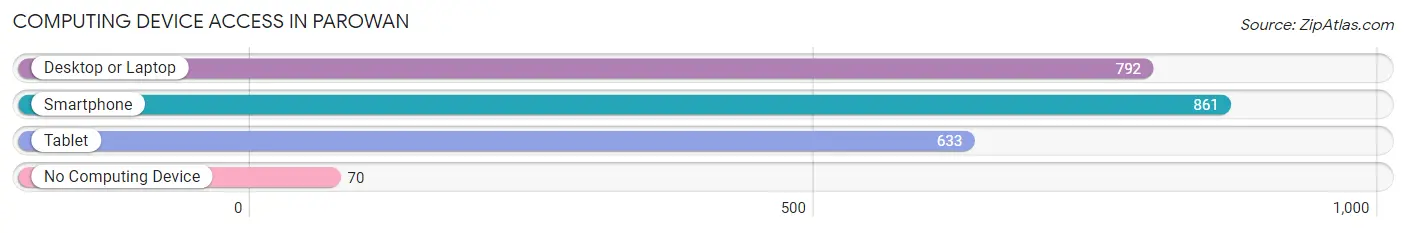
| Device Type | # Households | % Households |
| Desktop or Laptop | 792 | 81.0% |
| Smartphone | 861 | 88.0% |
| Tablet | 633 | 64.7% |
| No Computing Device | 70 | 7.2% |
| Total | 978 | 100.0% |
Internet Access in Parowan
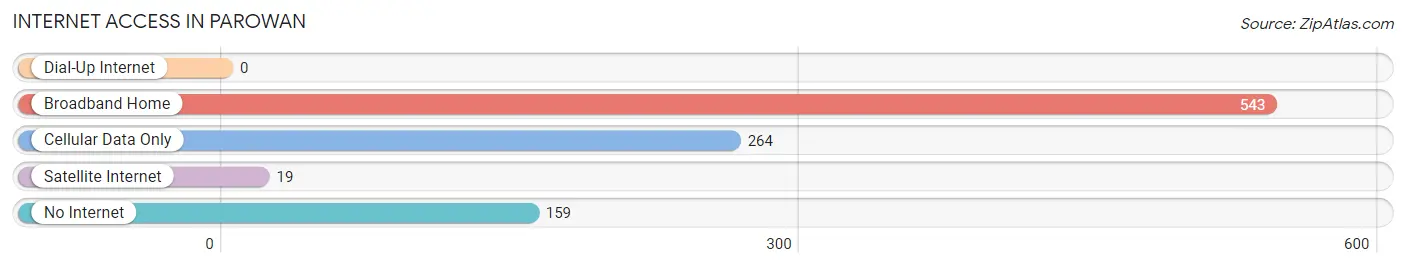
| Internet Type | # Households | % Households |
| Dial-Up Internet | 0 | 0.0% |
| Broadband Home | 543 | 55.5% |
| Cellular Data Only | 264 | 27.0% |
| Satellite Internet | 19 | 1.9% |
| No Internet | 159 | 16.3% |
| Total | 978 | 100.0% |
Parowan Summary
Parowan is a city located in Iron County, Utah, United States. It is the county seat of Iron County and is located in the southwestern part of the state. The population was 2,790 at the 2010 census.
History
Parowan was first settled in 1851 by a group of Mormon pioneers led by James Pace. The settlers named the area Parowan, which is a Native American term meaning “water running through the valley”. The settlers were sent to the area to establish an iron works, which was completed in 1852. The iron works was used to produce tools and weapons for the Mormon settlers.
In 1853, Parowan was designated as the county seat of Iron County. The city was incorporated in 1855 and has remained the county seat ever since.
In the late 19th century, Parowan was a major stop on the Pony Express. The city was also a major stop on the Overland Stage Line, which ran from Salt Lake City to Los Angeles.
Geography
Parowan is located in southwestern Utah at an elevation of 5,400 feet (1,646 m). It is situated in the Parowan Valley, which is surrounded by the Pine Valley Mountains to the east and the Markagunt Plateau to the west.
The city is located along Interstate 15, which runs north-south through the city. U.S. Route 89 also runs through the city, connecting it to Cedar City to the north and St. George to the south.
Parowan has a total area of 4 2 square miles 10 8 km2 all of which is land
Economy
The economy of Parowan is largely based on agriculture and tourism. The city is home to several farms and ranches, which produce hay, alfalfa, wheat, and other crops.
Parowan is also a popular tourist destination, due to its proximity to several national parks and monuments, including Zion National Park, Bryce Canyon National Park, and Cedar Breaks National Monument. The city is also home to several historic sites, including the Parowan Gap Petroglyphs and the Parowan Gap Dinosaur Tracks.
Demographics
As of the 2010 census, there were 2,790 people, 890 households, and 645 families residing in the city. The population density was 667.2 people per square mile (257.7/km2). There were 990 housing units at an average density of 237.2 per square mile (91.5/km2). The racial makeup of the city was 94.2% White, 0.3% African American, 1.2% Native American, 0.3% Asian, 0.1% Pacific Islander, 2.2% from other races, and 1.7% from two or more races. Hispanic or Latino of any race were 5.2% of the population.
There were 890 households, out of which 37.2% had children under the age of 18 living with them, 57.3% were married couples living together, 10.3% had a female householder with no husband present, and 27.2% were non-families. 22.2% of all households were made up of individuals, and 9.2% had someone living alone who was 65 years of age or older. The average household size was 2.90 and the average family size was 3.41.
In the city, the population was spread out, with 30.2% under the age of 18, 8.7% from 18 to 24, 24.2% from 25 to 44, 22.7% from 45 to 64, and 14.2% who were 65 years of age or older. The median age was 34 years. For every 100 females, there were 97.2 males. For every 100 females age 18 and over, there were 94.2 males.
The median income for a household in the city was $37,917, and the median income for a family was $41,964. Males had a median income of $31,250 versus $20,938 for females. The per capita income for the city was $15,845. About 8.2% of families and 10.3% of the population were below the poverty line, including 13.2% of those under age 18 and 8.2% of those age 65 or over.
Common Questions
What is Per Capita Income in Parowan?
Per Capita income in Parowan is $23,205.
What is the Median Family Income in Parowan?
Median Family Income in Parowan is $68,958.
What is the Median Household income in Parowan?
Median Household Income in Parowan is $47,974.
What is Inequality or Gini Index in Parowan?
Inequality or Gini Index in Parowan is 0.45.
What is the Total Population of Parowan?
Total Population of Parowan is 3,036.
What is the Total Male Population of Parowan?
Total Male Population of Parowan is 1,602.
What is the Total Female Population of Parowan?
Total Female Population of Parowan is 1,434.
What is the Ratio of Males per 100 Females in Parowan?
There are 111.72 Males per 100 Females in Parowan.
What is the Ratio of Females per 100 Males in Parowan?
There are 89.51 Females per 100 Males in Parowan.
What is the Median Population Age in Parowan?
Median Population Age in Parowan is 34.0 Years.
What is the Average Family Size in Parowan
Average Family Size in Parowan is 4.0 People.
What is the Average Household Size in Parowan
Average Household Size in Parowan is 3.1 People.
How Large is the Labor Force in Parowan?
There are 1,256 People in the Labor Forcein in Parowan.
What is the Percentage of People in the Labor Force in Parowan?
58.4% of People are in the Labor Force in Parowan.
What is the Unemployment Rate in Parowan?
Unemployment Rate in Parowan is 8.2%.