Montverde, FL Map & Demographics
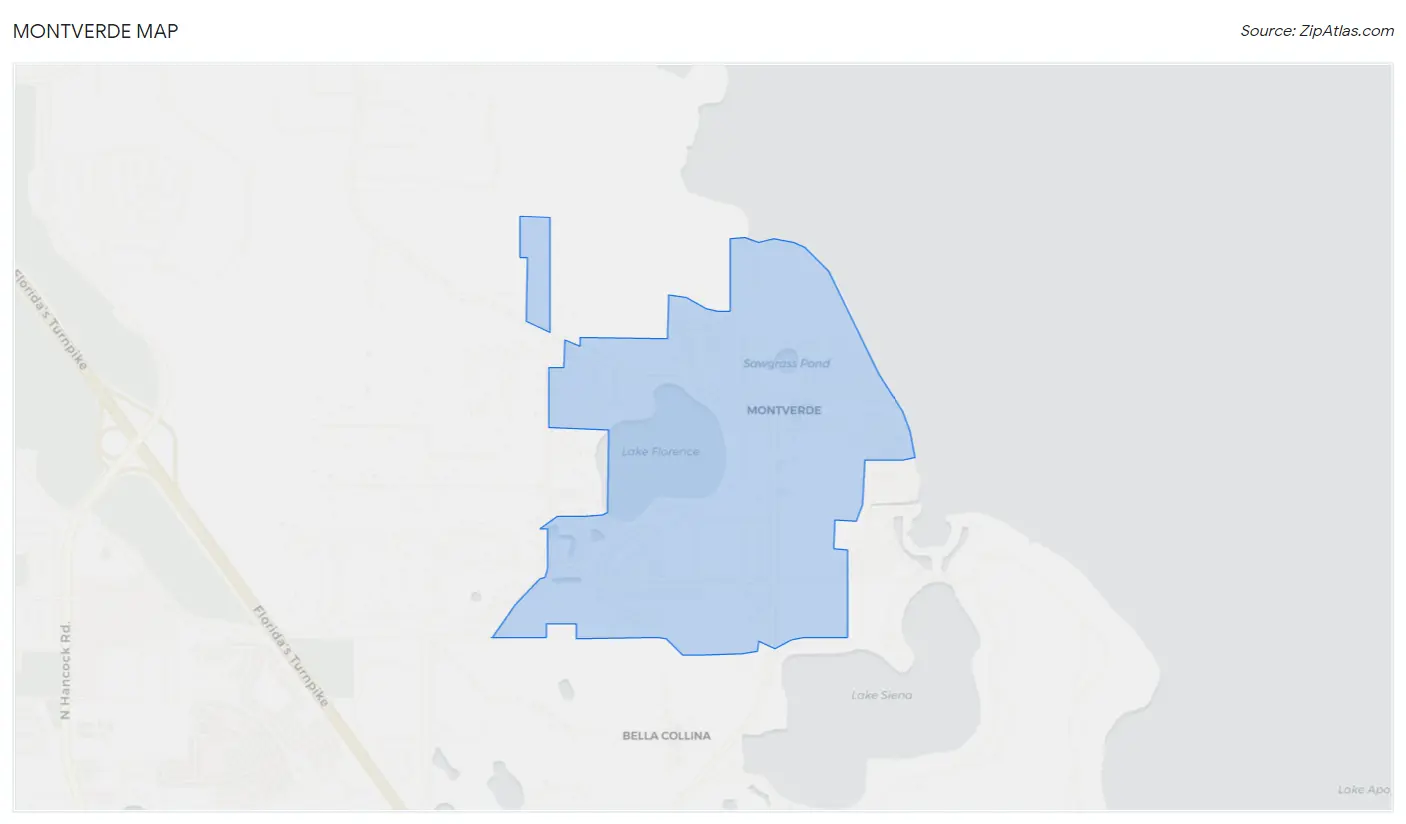
Montverde Map
Montverde Overview
$44,315
PER CAPITA INCOME
$106,786
AVG FAMILY INCOME
$97,614
AVG HOUSEHOLD INCOME
34.7%
WAGE / INCOME GAP [ % ]
65.3¢/ $1
WAGE / INCOME GAP [ $ ]
0.36
INEQUALITY / GINI INDEX
1,782
TOTAL POPULATION
938
MALE POPULATION
844
FEMALE POPULATION
111.14
MALES / 100 FEMALES
89.98
FEMALES / 100 MALES
45.0
MEDIAN AGE
3.2
AVG FAMILY SIZE
2.8
AVG HOUSEHOLD SIZE
951
LABOR FORCE [ PEOPLE ]
66.3%
PERCENT IN LABOR FORCE
2.1%
UNEMPLOYMENT RATE
Montverde Zip Codes
Income in Montverde
Income Overview in Montverde
Per Capita Income in Montverde is $44,315, while median incomes of families and households are $106,786 and $97,614 respectively.
| Characteristic | Number | Measure |
| Per Capita Income | 1,782 | $44,315 |
| Median Family Income | 490 | $106,786 |
| Mean Family Income | 490 | $126,706 |
| Median Household Income | 641 | $97,614 |
| Mean Household Income | 641 | $117,679 |
| Income Deficit | 490 | $0 |
| Wage / Income Gap (%) | 1,782 | 34.66% |
| Wage / Income Gap ($) | 1,782 | 65.34¢ per $1 |
| Gini / Inequality Index | 1,782 | 0.36 |
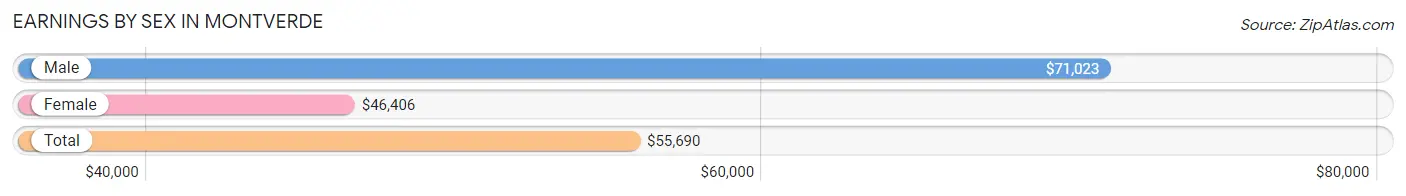
Earnings by Sex in Montverde
Average Earnings in Montverde are $55,690, $71,023 for men and $46,406 for women, a difference of 34.7%.
| Sex | Number | Average Earnings |
| Male | 517 (54.3%) | $71,023 |
| Female | 435 (45.7%) | $46,406 |
| Total | 952 (100.0%) | $55,690 |
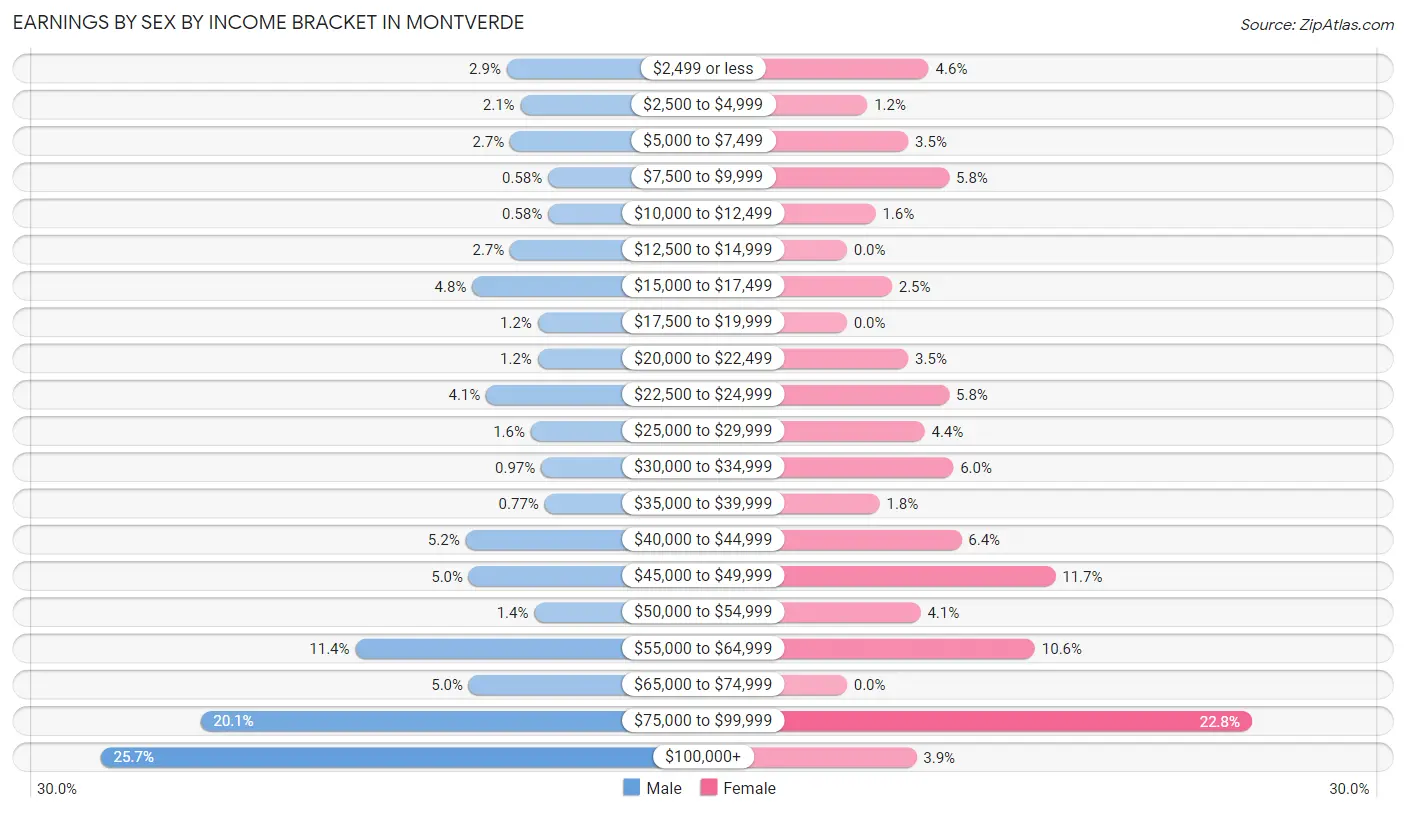
Earnings by Sex by Income Bracket in Montverde
The most common earnings brackets in Montverde are $100,000+ for men (133 | 25.7%) and $75,000 to $99,999 for women (99 | 22.8%).
| Income | Male | Female |
| $2,499 or less | 15 (2.9%) | 20 (4.6%) |
| $2,500 to $4,999 | 11 (2.1%) | 5 (1.1%) |
| $5,000 to $7,499 | 14 (2.7%) | 15 (3.5%) |
| $7,500 to $9,999 | 3 (0.6%) | 25 (5.8%) |
| $10,000 to $12,499 | 3 (0.6%) | 7 (1.6%) |
| $12,500 to $14,999 | 14 (2.7%) | 0 (0.0%) |
| $15,000 to $17,499 | 25 (4.8%) | 11 (2.5%) |
| $17,500 to $19,999 | 6 (1.2%) | 0 (0.0%) |
| $20,000 to $22,499 | 6 (1.2%) | 15 (3.5%) |
| $22,500 to $24,999 | 21 (4.1%) | 25 (5.8%) |
| $25,000 to $29,999 | 8 (1.5%) | 19 (4.4%) |
| $30,000 to $34,999 | 5 (1.0%) | 26 (6.0%) |
| $35,000 to $39,999 | 4 (0.8%) | 8 (1.8%) |
| $40,000 to $44,999 | 27 (5.2%) | 28 (6.4%) |
| $45,000 to $49,999 | 26 (5.0%) | 51 (11.7%) |
| $50,000 to $54,999 | 7 (1.3%) | 18 (4.1%) |
| $55,000 to $64,999 | 59 (11.4%) | 46 (10.6%) |
| $65,000 to $74,999 | 26 (5.0%) | 0 (0.0%) |
| $75,000 to $99,999 | 104 (20.1%) | 99 (22.8%) |
| $100,000+ | 133 (25.7%) | 17 (3.9%) |
| Total | 517 (100.0%) | 435 (100.0%) |
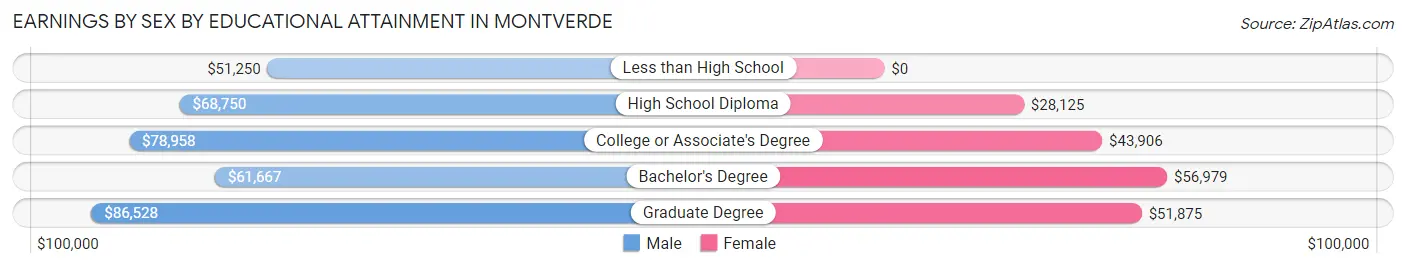
Earnings by Sex by Educational Attainment in Montverde
Average earnings in Montverde are $76,500 for men and $47,188 for women, a difference of 38.3%. Men with an educational attainment of graduate degree enjoy the highest average annual earnings of $86,528, while those with less than high school education earn the least with $51,250. Women with an educational attainment of bachelor's degree earn the most with the average annual earnings of $56,979, while those with high school diploma education have the smallest earnings of $28,125.
| Educational Attainment | Male Income | Female Income |
| Less than High School | $51,250 | $0 |
| High School Diploma | $68,750 | $28,125 |
| College or Associate's Degree | $78,958 | $43,906 |
| Bachelor's Degree | $61,667 | $56,979 |
| Graduate Degree | $86,528 | $51,875 |
| Total | $76,500 | $47,188 |
Family Income in Montverde
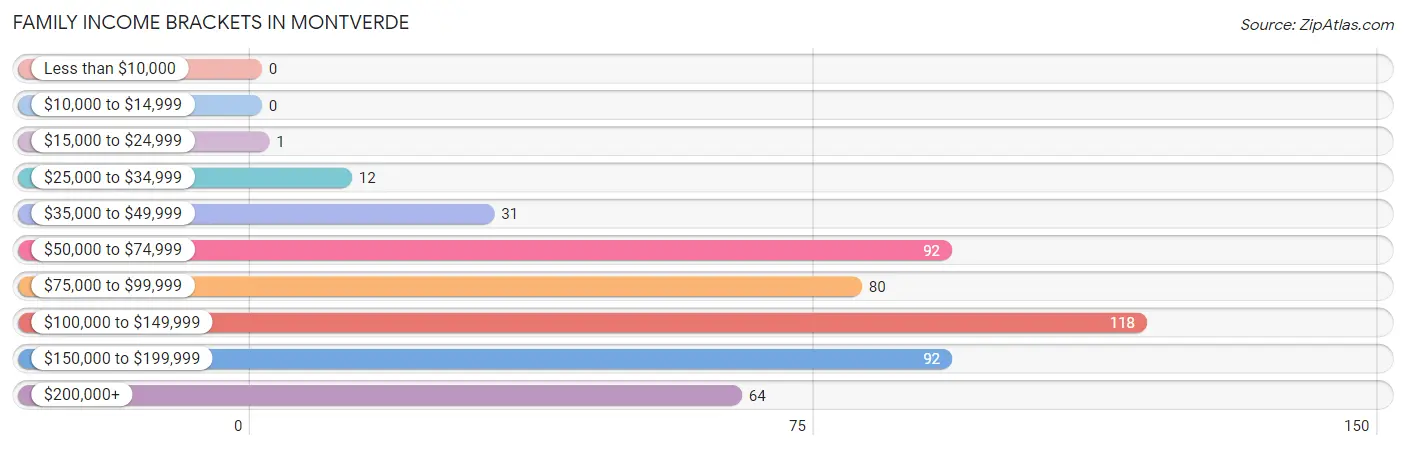
Family Income Brackets in Montverde
According to the Montverde family income data, there are 118 families falling into the $100,000 to $149,999 income range, which is the most common income bracket and makes up 24.1% of all families.
| Income Bracket | # Families | % Families |
| Less than $10,000 | 0 | 0.0% |
| $10,000 to $14,999 | 0 | 0.0% |
| $15,000 to $24,999 | 1 | 0.2% |
| $25,000 to $34,999 | 12 | 2.4% |
| $35,000 to $49,999 | 31 | 6.3% |
| $50,000 to $74,999 | 92 | 18.8% |
| $75,000 to $99,999 | 80 | 16.3% |
| $100,000 to $149,999 | 118 | 24.1% |
| $150,000 to $199,999 | 92 | 18.8% |
| $200,000+ | 64 | 13.1% |
Family Income by Famaliy Size in Montverde
3-person families (135 | 27.6%) account for the highest median family income in Montverde with $140,417 per family, while 2-person families (216 | 44.1%) have the highest median income of $54,062 per family member.
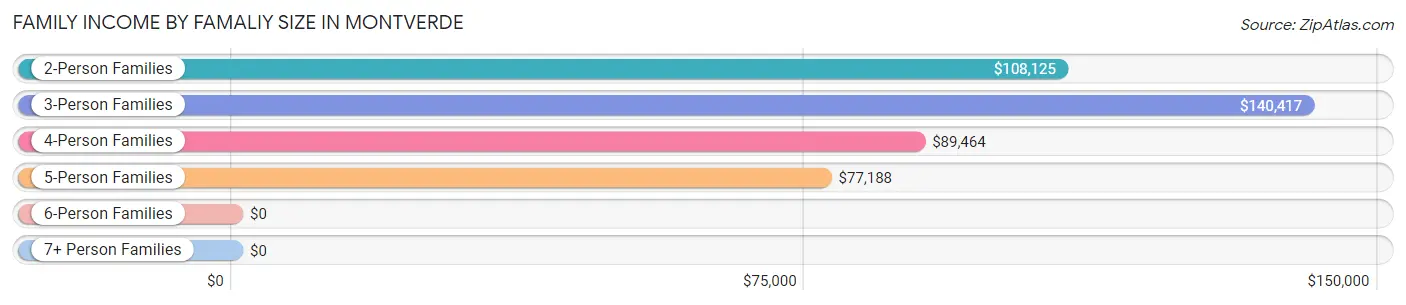
| Income Bracket | # Families | Median Income |
| 2-Person Families | 216 (44.1%) | $108,125 |
| 3-Person Families | 135 (27.6%) | $140,417 |
| 4-Person Families | 76 (15.5%) | $89,464 |
| 5-Person Families | 40 (8.2%) | $77,188 |
| 6-Person Families | 12 (2.5%) | $0 |
| 7+ Person Families | 11 (2.2%) | $0 |
| Total | 490 (100.0%) | $106,786 |
Family Income by Number of Earners in Montverde
The median family income in Montverde is $106,786, with families comprising 3+ earners (50) having the highest median family income of $176,500, while families with no earners (78) have the lowest median family income of $64,583, accounting for 10.2% and 15.9% of families, respectively.
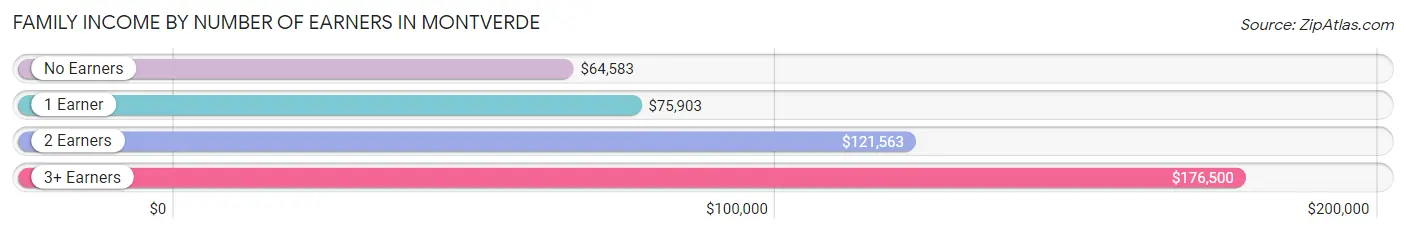
| Number of Earners | # Families | Median Income |
| No Earners | 78 (15.9%) | $64,583 |
| 1 Earner | 105 (21.4%) | $75,903 |
| 2 Earners | 257 (52.4%) | $121,563 |
| 3+ Earners | 50 (10.2%) | $176,500 |
| Total | 490 (100.0%) | $106,786 |
Household Income in Montverde
Household Income Brackets in Montverde
With 118 households falling in the category, the $100,000 to $149,999 income range is the most frequent in Montverde, accounting for 18.4% of all households. In contrast, only 2 households (0.3%) fall into the $10,000 to $14,999 income bracket, making it the least populous group.
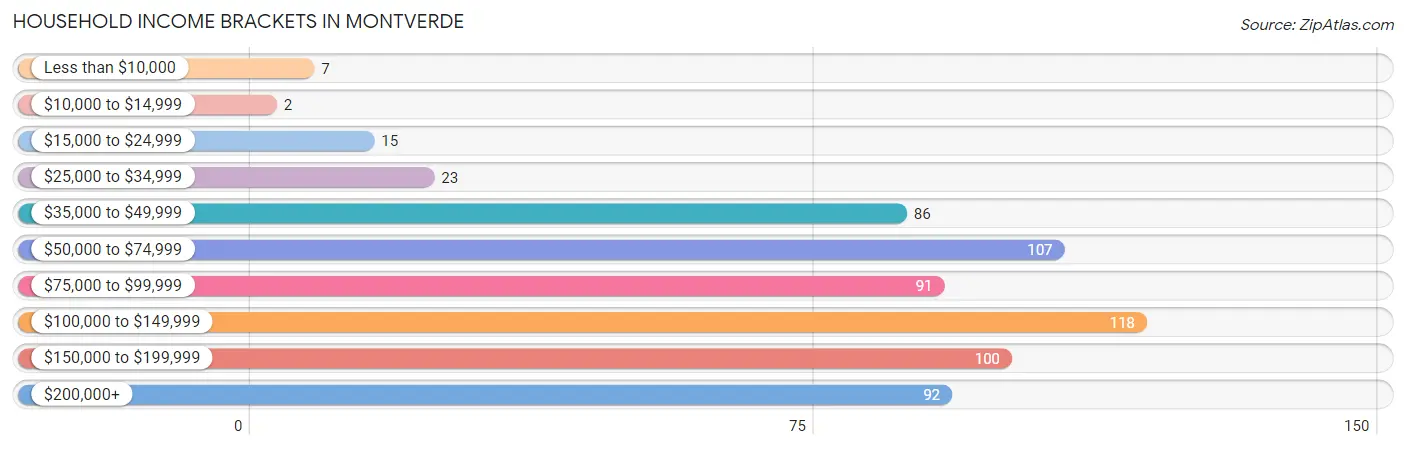
| Income Bracket | # Households | % Households |
| Less than $10,000 | 7 | 1.1% |
| $10,000 to $14,999 | 2 | 0.3% |
| $15,000 to $24,999 | 15 | 2.3% |
| $25,000 to $34,999 | 23 | 3.6% |
| $35,000 to $49,999 | 86 | 13.4% |
| $50,000 to $74,999 | 107 | 16.7% |
| $75,000 to $99,999 | 91 | 14.2% |
| $100,000 to $149,999 | 118 | 18.4% |
| $150,000 to $199,999 | 100 | 15.6% |
| $200,000+ | 92 | 14.4% |
Household Income by Householder Age in Montverde
The median household income in Montverde is $97,614, with the highest median household income of $112,500 found in the 25 to 44 years age bracket for the primary householder. A total of 156 households (24.3%) fall into this category. Meanwhile, the 15 to 24 years age bracket for the primary householder has the lowest median household income of $0, with 7 households (1.1%) in this group.
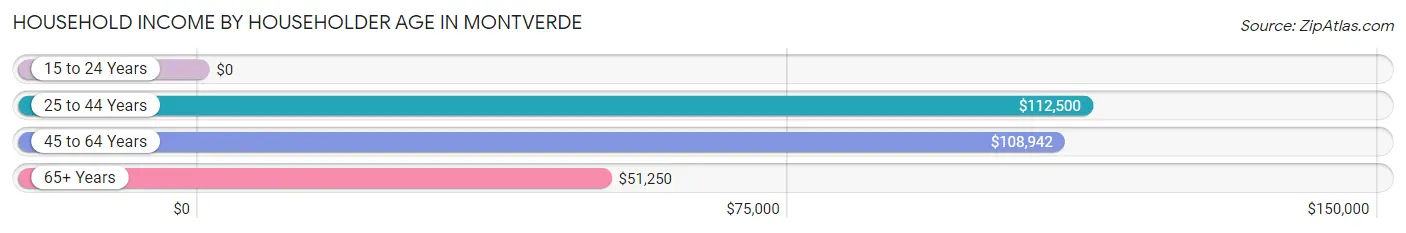
| Income Bracket | # Households | Median Income |
| 15 to 24 Years | 7 (1.1%) | $0 |
| 25 to 44 Years | 156 (24.3%) | $112,500 |
| 45 to 64 Years | 307 (47.9%) | $108,942 |
| 65+ Years | 171 (26.7%) | $51,250 |
| Total | 641 (100.0%) | $97,614 |
Poverty in Montverde
Income Below Poverty by Sex and Age in Montverde
With 1.1% poverty level for males and 2.1% for females among the residents of Montverde, 65 to 74 year old males and 75 year old and over females are the most vulnerable to poverty, with 3 males (3.9%) and 7 females (9.6%) in their respective age groups living below the poverty level.
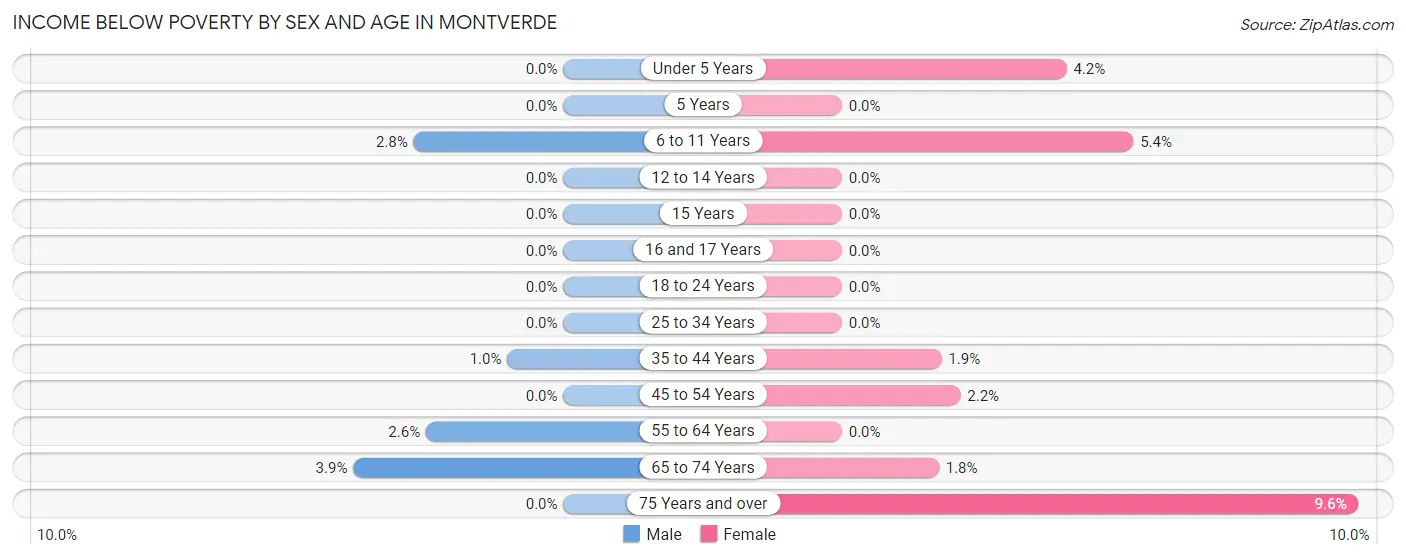
| Age Bracket | Male | Female |
| Under 5 Years | 0 (0.0%) | 1 (4.2%) |
| 5 Years | 0 (0.0%) | 0 (0.0%) |
| 6 to 11 Years | 2 (2.8%) | 2 (5.4%) |
| 12 to 14 Years | 0 (0.0%) | 0 (0.0%) |
| 15 Years | 0 (0.0%) | 0 (0.0%) |
| 16 and 17 Years | 0 (0.0%) | 0 (0.0%) |
| 18 to 24 Years | 0 (0.0%) | 0 (0.0%) |
| 25 to 34 Years | 0 (0.0%) | 0 (0.0%) |
| 35 to 44 Years | 1 (1.0%) | 2 (1.8%) |
| 45 to 54 Years | 0 (0.0%) | 4 (2.2%) |
| 55 to 64 Years | 4 (2.5%) | 0 (0.0%) |
| 65 to 74 Years | 3 (3.9%) | 2 (1.8%) |
| 75 Years and over | 0 (0.0%) | 7 (9.6%) |
| Total | 10 (1.1%) | 18 (2.1%) |
Income Above Poverty by Sex and Age in Montverde
According to the poverty statistics in Montverde, males aged under 5 years and females aged 12 to 14 years are the age groups that are most secure financially, with 100.0% of males and 100.0% of females in these age groups living above the poverty line.
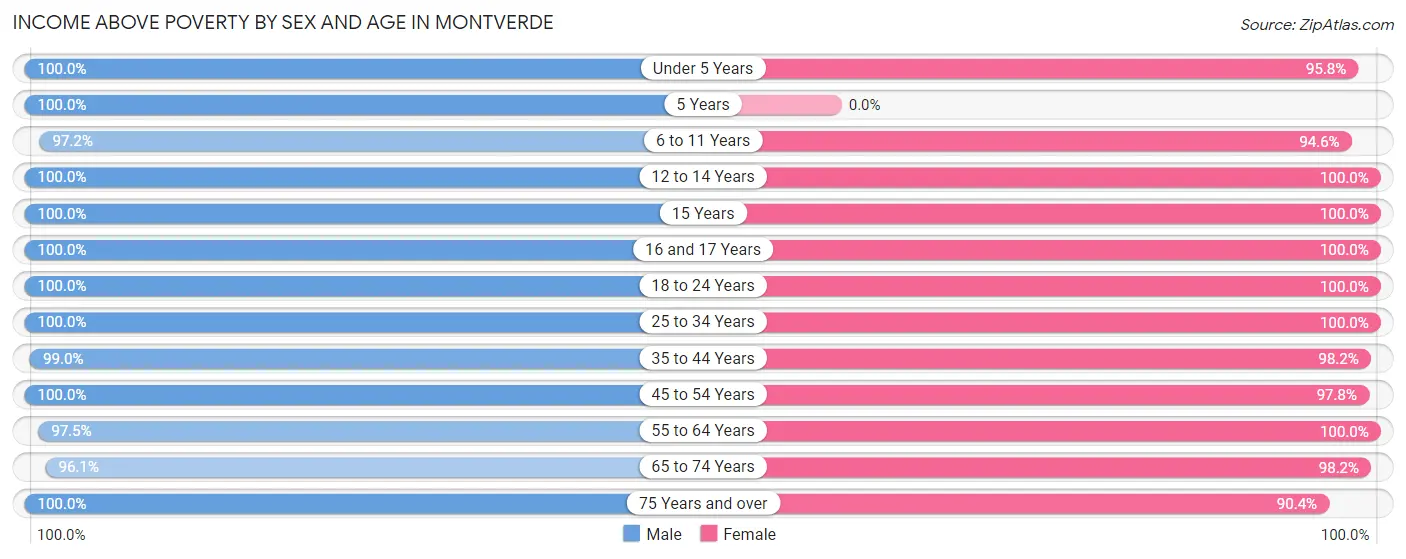
| Age Bracket | Male | Female |
| Under 5 Years | 78 (100.0%) | 23 (95.8%) |
| 5 Years | 23 (100.0%) | 0 (0.0%) |
| 6 to 11 Years | 70 (97.2%) | 35 (94.6%) |
| 12 to 14 Years | 27 (100.0%) | 33 (100.0%) |
| 15 Years | 44 (100.0%) | 10 (100.0%) |
| 16 and 17 Years | 17 (100.0%) | 18 (100.0%) |
| 18 to 24 Years | 84 (100.0%) | 33 (100.0%) |
| 25 to 34 Years | 74 (100.0%) | 112 (100.0%) |
| 35 to 44 Years | 95 (99.0%) | 106 (98.2%) |
| 45 to 54 Years | 147 (100.0%) | 178 (97.8%) |
| 55 to 64 Years | 153 (97.5%) | 103 (100.0%) |
| 65 to 74 Years | 74 (96.1%) | 109 (98.2%) |
| 75 Years and over | 42 (100.0%) | 66 (90.4%) |
| Total | 928 (98.9%) | 826 (97.9%) |
Income Below Poverty Among Married-Couple Families in Montverde
The poverty statistics for married-couple families in Montverde show that 0.7% or 3 of the total 404 families live below the poverty line. Families with 3 or 4 children have the highest poverty rate of 11.1%, comprising of 2 families. On the other hand, families with 1 or 2 children have the lowest poverty rate of 0.0%, which includes 0 families.
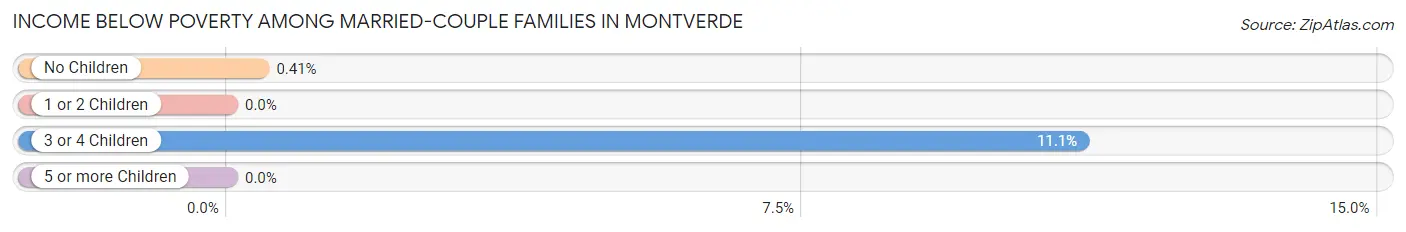
| Children | Above Poverty | Below Poverty |
| No Children | 244 (99.6%) | 1 (0.4%) |
| 1 or 2 Children | 141 (100.0%) | 0 (0.0%) |
| 3 or 4 Children | 16 (88.9%) | 2 (11.1%) |
| 5 or more Children | 0 (0.0%) | 0 (0.0%) |
| Total | 401 (99.3%) | 3 (0.7%) |
Income Below Poverty Among Single-Parent Households in Montverde
| Children | Single Father | Single Mother |
| No Children | 0 (0.0%) | 0 (0.0%) |
| 1 or 2 Children | 0 (0.0%) | 0 (0.0%) |
| 3 or 4 Children | 0 (0.0%) | 0 (0.0%) |
| 5 or more Children | 0 (0.0%) | 0 (0.0%) |
| Total | 0 (0.0%) | 0 (0.0%) |
Income Below Poverty Among Married-Couple vs Single-Parent Households in Montverde
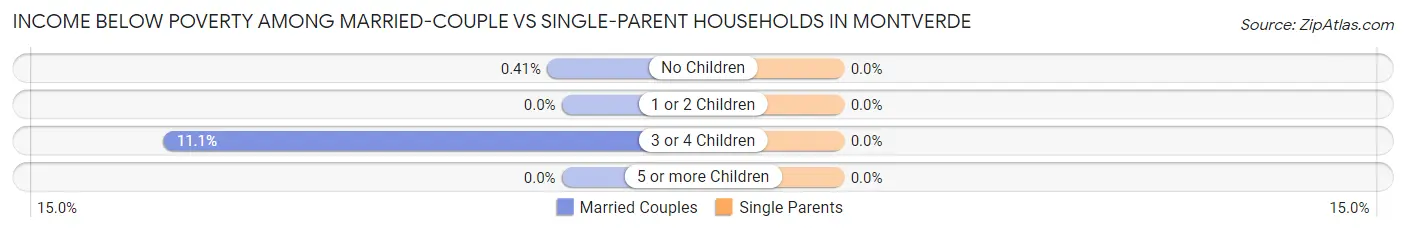
| Children | Married-Couple Families | Single-Parent Households |
| No Children | 1 (0.4%) | 0 (0.0%) |
| 1 or 2 Children | 0 (0.0%) | 0 (0.0%) |
| 3 or 4 Children | 2 (11.1%) | 0 (0.0%) |
| 5 or more Children | 0 (0.0%) | 0 (0.0%) |
| Total | 3 (0.7%) | 0 (0.0%) |
Race in Montverde
The most populous races in Montverde are White / Caucasian (1,466 | 82.3%), Hispanic or Latino (219 | 12.3%), and Two or more Races (145 | 8.1%).
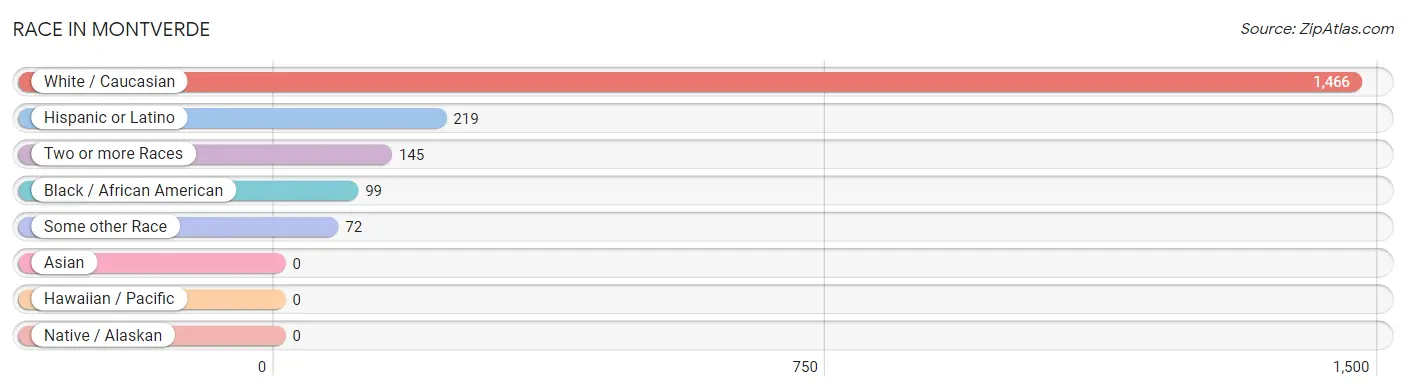
| Race | # Population | % Population |
| Asian | 0 | 0.0% |
| Black / African American | 99 | 5.6% |
| Hawaiian / Pacific | 0 | 0.0% |
| Hispanic or Latino | 219 | 12.3% |
| Native / Alaskan | 0 | 0.0% |
| White / Caucasian | 1,466 | 82.3% |
| Two or more Races | 145 | 8.1% |
| Some other Race | 72 | 4.0% |
| Total | 1,782 | 100.0% |
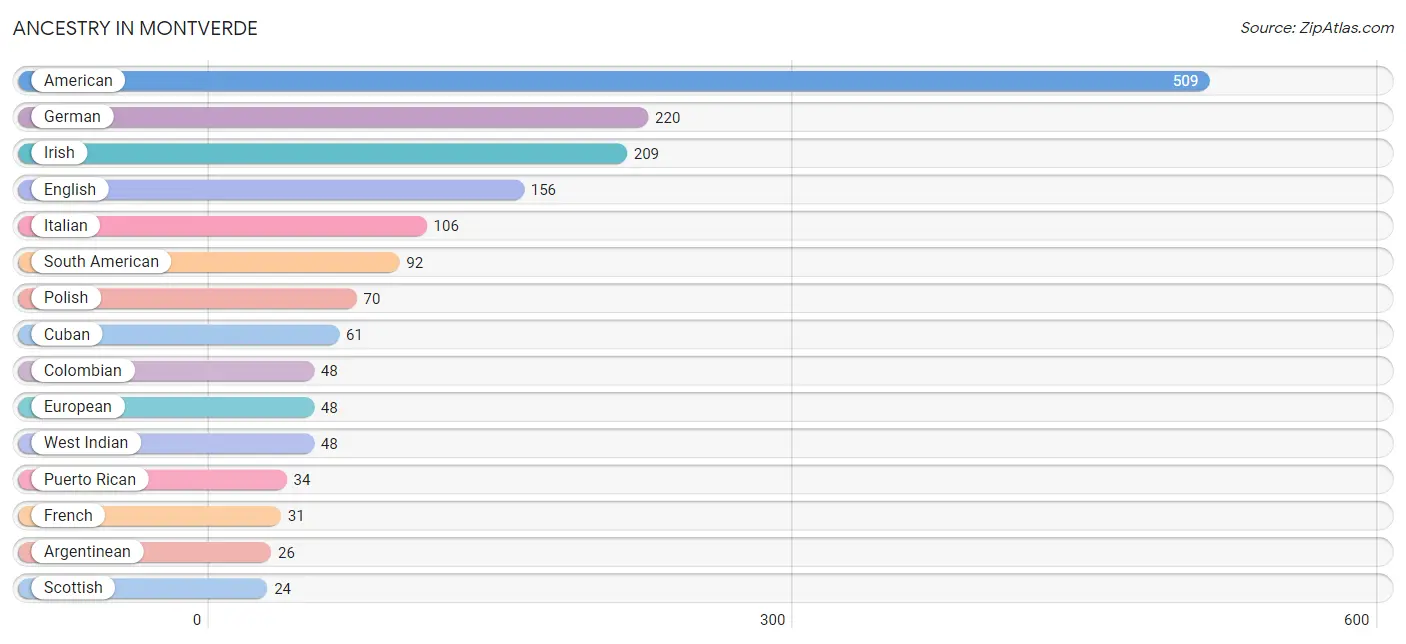
Ancestry in Montverde
The most populous ancestries reported in Montverde are American (509 | 28.6%), German (220 | 12.3%), Irish (209 | 11.7%), English (156 | 8.7%), and Italian (106 | 5.9%), together accounting for 67.3% of all Montverde residents.
| Ancestry | # Population | % Population |
| African | 12 | 0.7% |
| American | 509 | 28.6% |
| Argentinean | 26 | 1.5% |
| Armenian | 4 | 0.2% |
| British | 8 | 0.4% |
| Canadian | 7 | 0.4% |
| Central American | 10 | 0.6% |
| Cherokee | 6 | 0.3% |
| Colombian | 48 | 2.7% |
| Cree | 3 | 0.2% |
| Cuban | 61 | 3.4% |
| Czech | 7 | 0.4% |
| Dominican | 4 | 0.2% |
| Dutch | 9 | 0.5% |
| English | 156 | 8.7% |
| European | 48 | 2.7% |
| French | 31 | 1.7% |
| French Canadian | 12 | 0.7% |
| German | 220 | 12.3% |
| Greek | 3 | 0.2% |
| Guyanese | 9 | 0.5% |
| Honduran | 10 | 0.6% |
| Hungarian | 21 | 1.2% |
| Indian (Asian) | 21 | 1.2% |
| Irish | 209 | 11.7% |
| Italian | 106 | 5.9% |
| Jamaican | 3 | 0.2% |
| Lithuanian | 4 | 0.2% |
| Norwegian | 18 | 1.0% |
| Polish | 70 | 3.9% |
| Puerto Rican | 34 | 1.9% |
| Romanian | 5 | 0.3% |
| Scandinavian | 11 | 0.6% |
| Scotch-Irish | 9 | 0.5% |
| Scottish | 24 | 1.3% |
| Slovene | 5 | 0.3% |
| South American | 92 | 5.2% |
| Spaniard | 18 | 1.0% |
| Subsaharan African | 12 | 0.7% |
| Swedish | 15 | 0.8% |
| Ukrainian | 4 | 0.2% |
| Venezuelan | 18 | 1.0% |
| Welsh | 4 | 0.2% |
| West Indian | 48 | 2.7% | View All 44 Rows |
Immigrants in Montverde
The most numerous immigrant groups reported in Montverde came from Latin America (125 | 7.0%), South America (69 | 3.9%), Caribbean (56 | 3.1%), St. Vincent and the Grenadines (44 | 2.5%), and Europe (29 | 1.6%), together accounting for 18.1% of all Montverde residents.
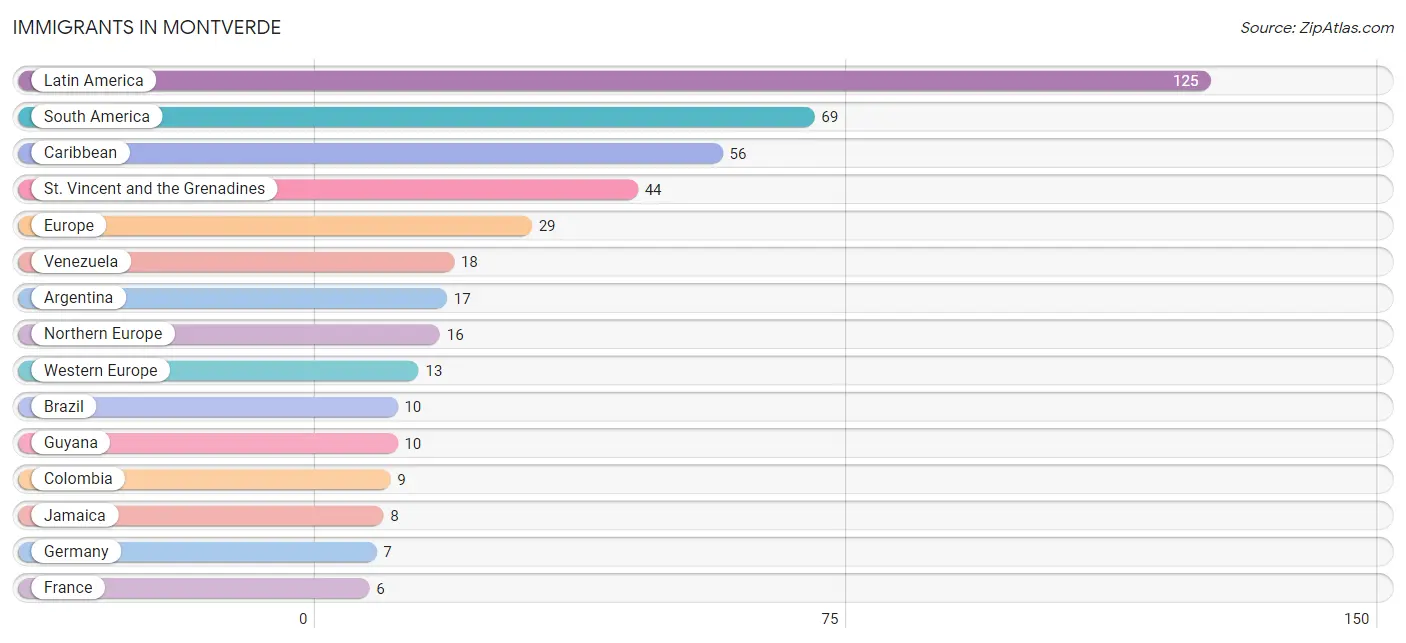
| Immigration Origin | # Population | % Population |
| Argentina | 17 | 0.9% |
| Brazil | 10 | 0.6% |
| Caribbean | 56 | 3.1% |
| Colombia | 9 | 0.5% |
| Ecuador | 5 | 0.3% |
| Europe | 29 | 1.6% |
| France | 6 | 0.3% |
| Germany | 7 | 0.4% |
| Guyana | 10 | 0.6% |
| Jamaica | 8 | 0.4% |
| Latin America | 125 | 7.0% |
| Northern Europe | 16 | 0.9% |
| South America | 69 | 3.9% |
| St. Vincent and the Grenadines | 44 | 2.5% |
| Venezuela | 18 | 1.0% |
| Western Europe | 13 | 0.7% | View All 16 Rows |
Sex and Age in Montverde
Sex and Age in Montverde
The most populous age groups in Montverde are 15 to 19 Years (111 | 11.8%) for men and 50 to 54 Years (120 | 14.2%) for women.
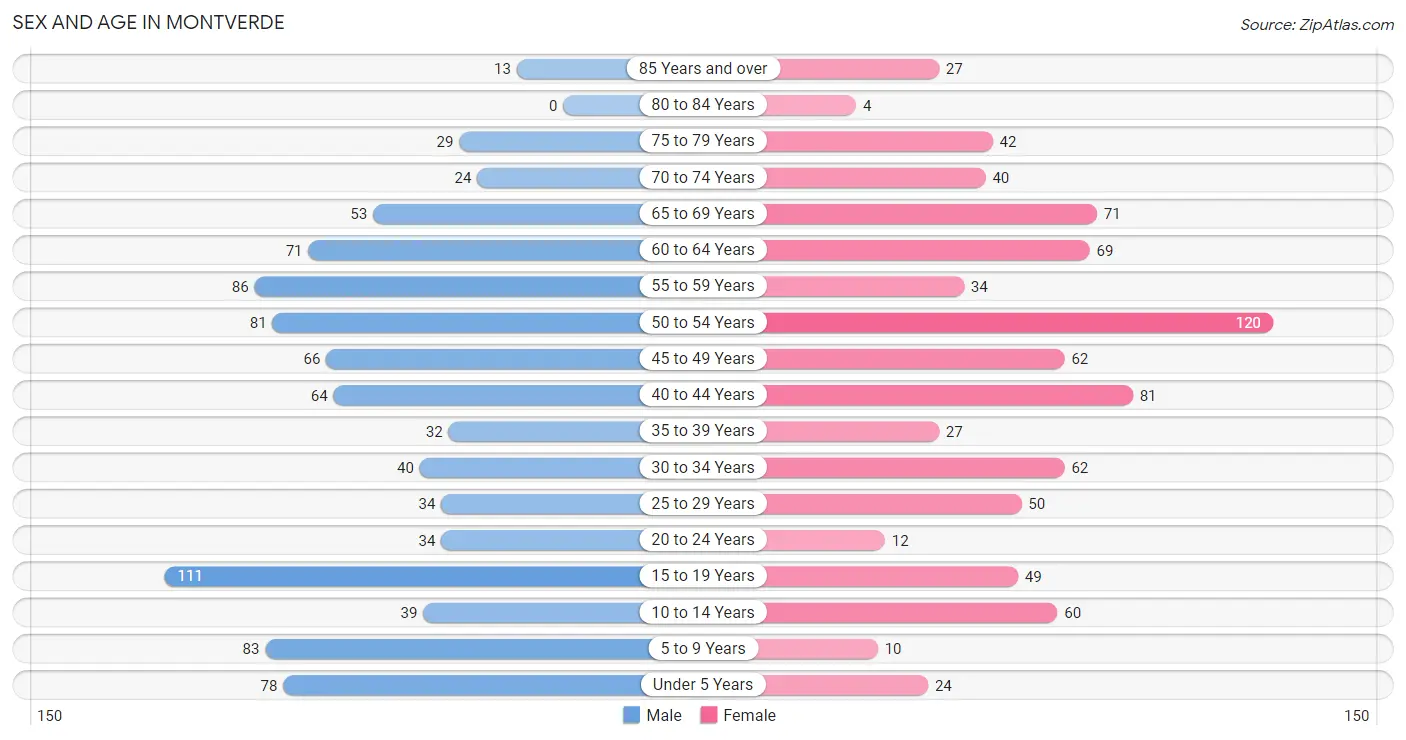
| Age Bracket | Male | Female |
| Under 5 Years | 78 (8.3%) | 24 (2.8%) |
| 5 to 9 Years | 83 (8.8%) | 10 (1.2%) |
| 10 to 14 Years | 39 (4.2%) | 60 (7.1%) |
| 15 to 19 Years | 111 (11.8%) | 49 (5.8%) |
| 20 to 24 Years | 34 (3.6%) | 12 (1.4%) |
| 25 to 29 Years | 34 (3.6%) | 50 (5.9%) |
| 30 to 34 Years | 40 (4.3%) | 62 (7.3%) |
| 35 to 39 Years | 32 (3.4%) | 27 (3.2%) |
| 40 to 44 Years | 64 (6.8%) | 81 (9.6%) |
| 45 to 49 Years | 66 (7.0%) | 62 (7.3%) |
| 50 to 54 Years | 81 (8.6%) | 120 (14.2%) |
| 55 to 59 Years | 86 (9.2%) | 34 (4.0%) |
| 60 to 64 Years | 71 (7.6%) | 69 (8.2%) |
| 65 to 69 Years | 53 (5.7%) | 71 (8.4%) |
| 70 to 74 Years | 24 (2.6%) | 40 (4.7%) |
| 75 to 79 Years | 29 (3.1%) | 42 (5.0%) |
| 80 to 84 Years | 0 (0.0%) | 4 (0.5%) |
| 85 Years and over | 13 (1.4%) | 27 (3.2%) |
| Total | 938 (100.0%) | 844 (100.0%) |
Families and Households in Montverde
Median Family Size in Montverde
The median family size in Montverde is 3.22 persons per family, with single female/mother families (61 | 12.4%) accounting for the largest median family size of 3.98 persons per family. On the other hand, single male/father families (25 | 5.1%) represent the smallest median family size with 2.48 persons per family.
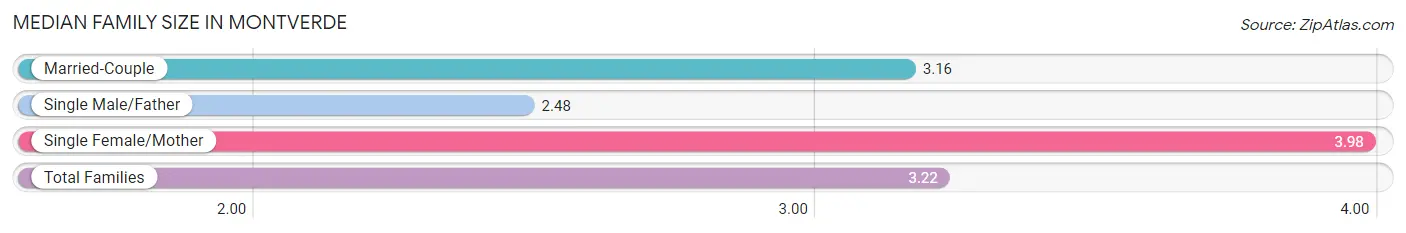
| Family Type | # Families | Family Size |
| Married-Couple | 404 (82.5%) | 3.16 |
| Single Male/Father | 25 (5.1%) | 2.48 |
| Single Female/Mother | 61 (12.4%) | 3.98 |
| Total Families | 490 (100.0%) | 3.22 |
Median Household Size in Montverde
The median household size in Montverde is 2.78 persons per household, with single female/mother households (61 | 9.5%) accounting for the largest median household size of 4.08 persons per household. non-family households (151 | 23.6%) represent the smallest median household size with 1.16 persons per household.
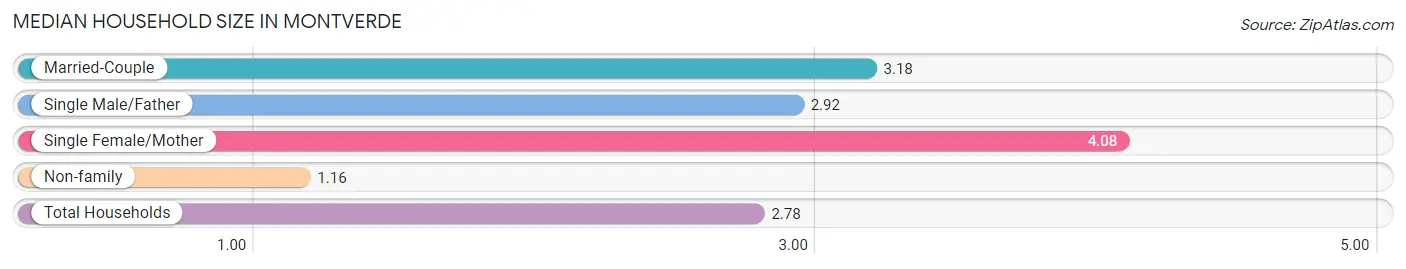
| Household Type | # Households | Household Size |
| Married-Couple | 404 (63.0%) | 3.18 |
| Single Male/Father | 25 (3.9%) | 2.92 |
| Single Female/Mother | 61 (9.5%) | 4.08 |
| Non-family | 151 (23.6%) | 1.16 |
| Total Households | 641 (100.0%) | 2.78 |
Household Size by Marriage Status in Montverde
Out of a total of 641 households in Montverde, 490 (76.4%) are family households, while 151 (23.6%) are nonfamily households. The most numerous type of family households are 2-person households, comprising 203, and the most common type of nonfamily households are 1-person households, comprising 130.
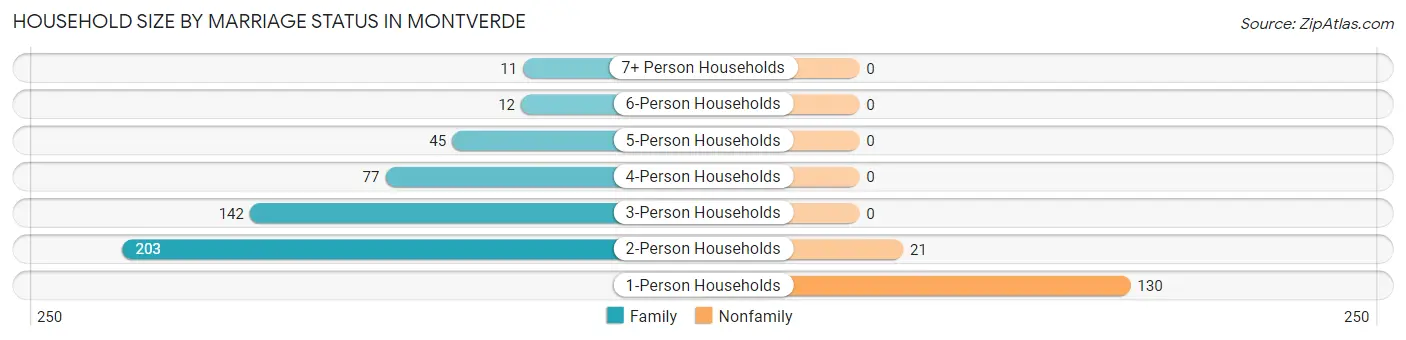
| Household Size | Family Households | Nonfamily Households |
| 1-Person Households | - | 130 (20.3%) |
| 2-Person Households | 203 (31.7%) | 21 (3.3%) |
| 3-Person Households | 142 (22.2%) | 0 (0.0%) |
| 4-Person Households | 77 (12.0%) | 0 (0.0%) |
| 5-Person Households | 45 (7.0%) | 0 (0.0%) |
| 6-Person Households | 12 (1.9%) | 0 (0.0%) |
| 7+ Person Households | 11 (1.7%) | 0 (0.0%) |
| Total | 490 (76.4%) | 151 (23.6%) |
Female Fertility in Montverde
Fertility by Age in Montverde
Average fertility rate in Montverde is 25.0 births per 1,000 women. Women in the age bracket of 20 to 34 years have the highest fertility rate with 32.0 births per 1,000 women. Women in the age bracket of 35 to 50 years acount for 55.6% of all women with births.
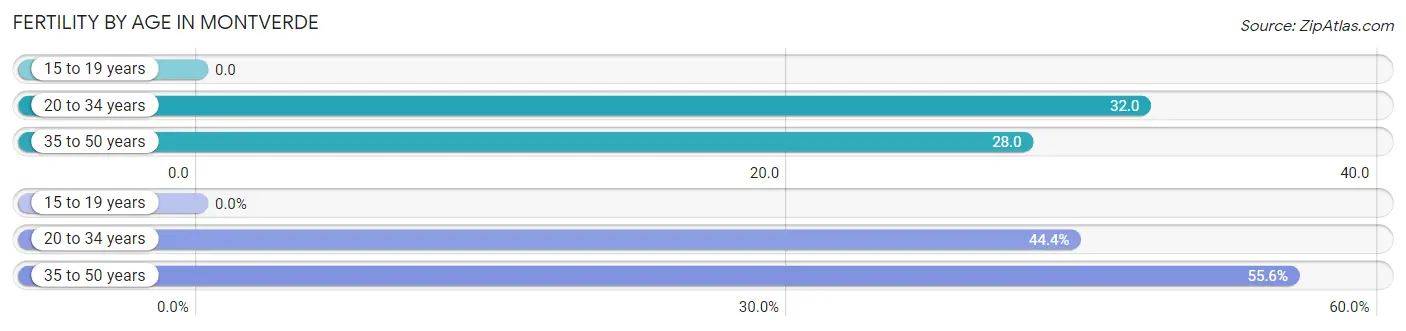
| Age Bracket | Women with Births | Births / 1,000 Women |
| 15 to 19 years | 0 (0.0%) | 0.0 |
| 20 to 34 years | 4 (44.4%) | 32.0 |
| 35 to 50 years | 5 (55.6%) | 28.0 |
| Total | 9 (100.0%) | 25.0 |
Fertility by Age by Marriage Status in Montverde
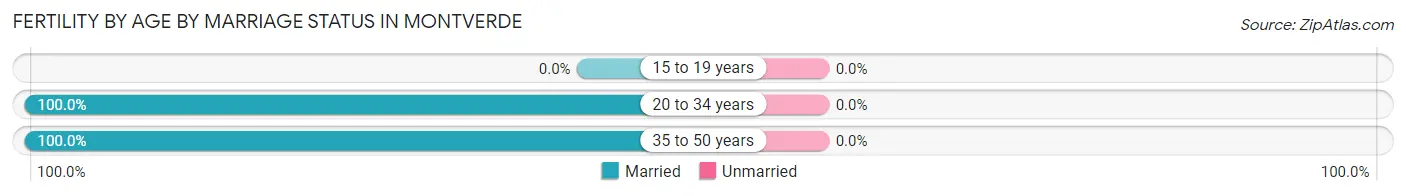
| Age Bracket | Married | Unmarried |
| 15 to 19 years | 0 (0.0%) | 0 (0.0%) |
| 20 to 34 years | 4 (100.0%) | 0 (0.0%) |
| 35 to 50 years | 5 (100.0%) | 0 (0.0%) |
| Total | 9 (100.0%) | 0 (0.0%) |
Fertility by Education in Montverde
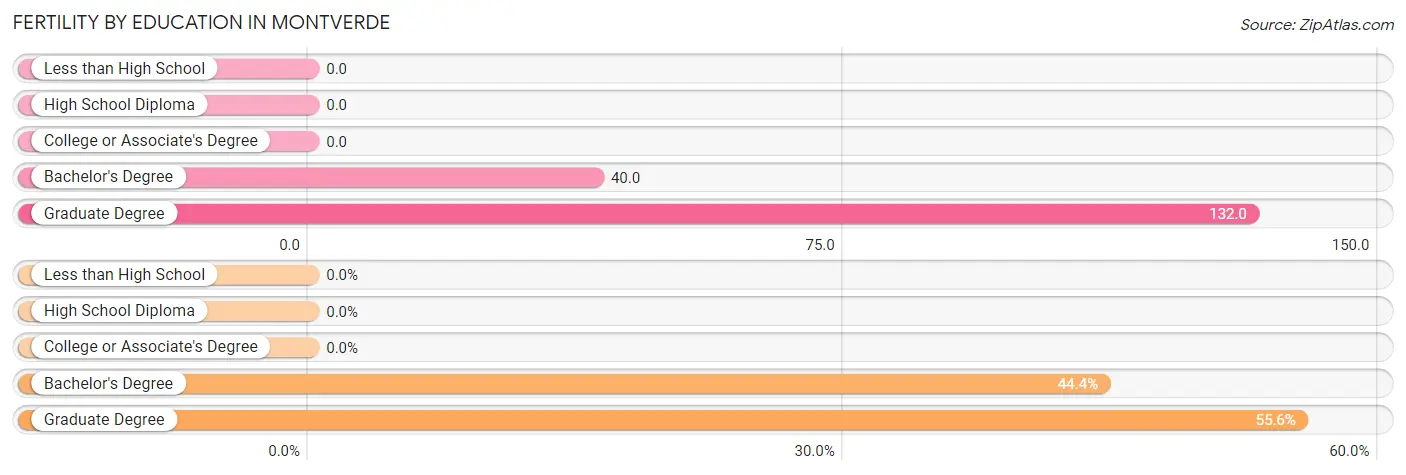
| Educational Attainment | Women with Births | Births / 1,000 Women |
| Less than High School | 0 (0.0%) | 0.0 |
| High School Diploma | 0 (0.0%) | 0.0 |
| College or Associate's Degree | 0 (0.0%) | 0.0 |
| Bachelor's Degree | 4 (44.4%) | 40.0 |
| Graduate Degree | 5 (55.6%) | 132.0 |
| Total | 9 (100.0%) | 25.0 |
Fertility by Education by Marriage Status in Montverde
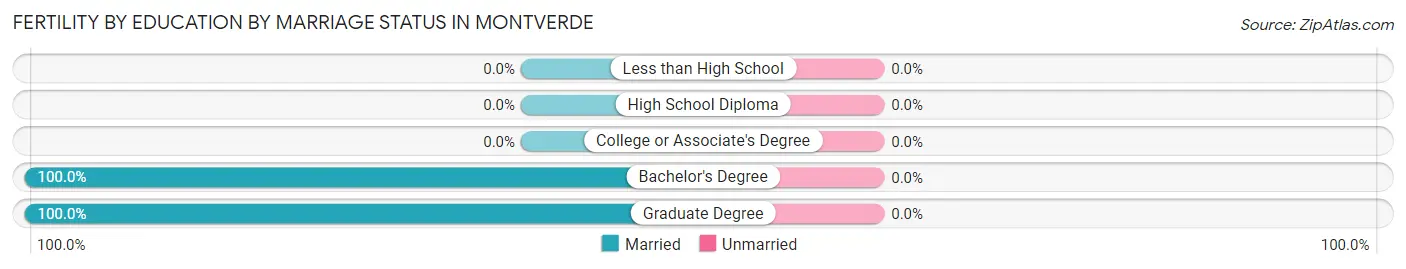
| Educational Attainment | Married | Unmarried |
| Less than High School | 0 (0.0%) | 0 (0.0%) |
| High School Diploma | 0 (0.0%) | 0 (0.0%) |
| College or Associate's Degree | 0 (0.0%) | 0 (0.0%) |
| Bachelor's Degree | 4 (100.0%) | 0 (0.0%) |
| Graduate Degree | 5 (100.0%) | 0 (0.0%) |
| Total | 9 (100.0%) | 0 (0.0%) |
Employment Characteristics in Montverde
Employment by Class of Employer in Montverde
Among the 914 employed individuals in Montverde, private company employees (640 | 70.0%), not-for-profit organizations (97 | 10.6%), and local government employees (73 | 8.0%) make up the most common classes of employment.
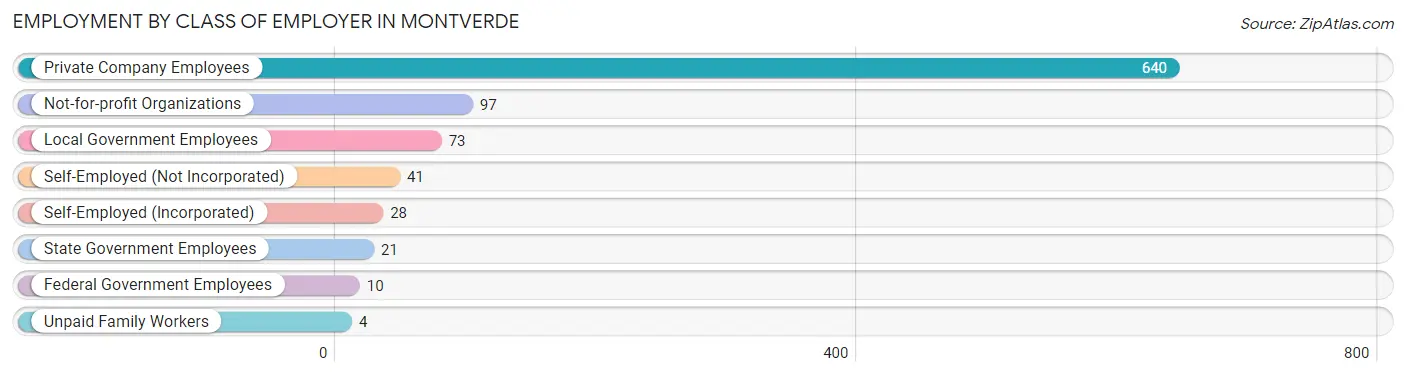
| Employer Class | # Employees | % Employees |
| Private Company Employees | 640 | 70.0% |
| Self-Employed (Incorporated) | 28 | 3.1% |
| Self-Employed (Not Incorporated) | 41 | 4.5% |
| Not-for-profit Organizations | 97 | 10.6% |
| Local Government Employees | 73 | 8.0% |
| State Government Employees | 21 | 2.3% |
| Federal Government Employees | 10 | 1.1% |
| Unpaid Family Workers | 4 | 0.4% |
| Total | 914 | 100.0% |
Employment Status by Age in Montverde
According to the labor force statistics for Montverde, out of the total population over 16 years of age (1,434), 66.3% or 951 individuals are in the labor force, with 2.1% or 20 of them unemployed. The age group with the highest labor force participation rate is 35 to 44 years, with 99.0% or 202 individuals in the labor force. Within the labor force, the 30 to 34 years age range has the highest percentage of unemployed individuals, with 19.0% or 12 of them being unemployed.
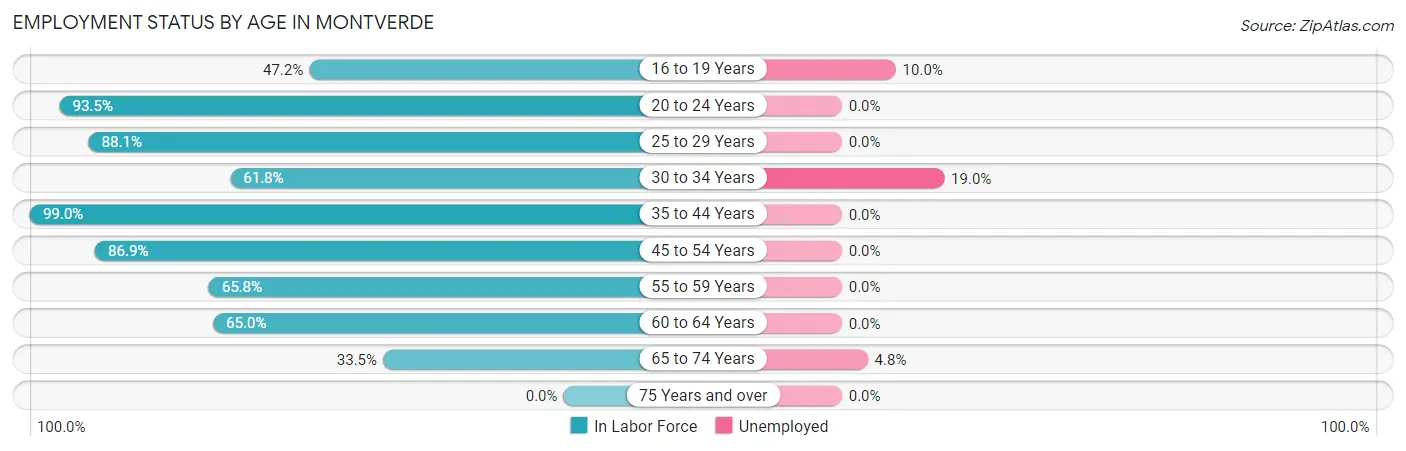
| Age Bracket | In Labor Force | Unemployed |
| 16 to 19 Years | 50 (47.2%) | 5 (10.0%) |
| 20 to 24 Years | 43 (93.5%) | 0 (0.0%) |
| 25 to 29 Years | 74 (88.1%) | 0 (0.0%) |
| 30 to 34 Years | 63 (61.8%) | 12 (19.0%) |
| 35 to 44 Years | 202 (99.0%) | 0 (0.0%) |
| 45 to 54 Years | 286 (86.9%) | 0 (0.0%) |
| 55 to 59 Years | 79 (65.8%) | 0 (0.0%) |
| 60 to 64 Years | 91 (65.0%) | 0 (0.0%) |
| 65 to 74 Years | 63 (33.5%) | 3 (4.8%) |
| 75 Years and over | 0 (0.0%) | 0 (0.0%) |
| Total | 951 (66.3%) | 20 (2.1%) |
Employment Status by Educational Attainment in Montverde
According to labor force statistics for Montverde, 81.2% of individuals (795) out of the total population between 25 and 64 years of age (979) are in the labor force, with 1.5% or 12 of them being unemployed. The group with the highest labor force participation rate are those with the educational attainment of bachelor's degree or higher, with 94.3% or 349 individuals in the labor force. Within the labor force, individuals with less than high school education have the highest percentage of unemployment, with 19.4% or 7 of them being unemployed.
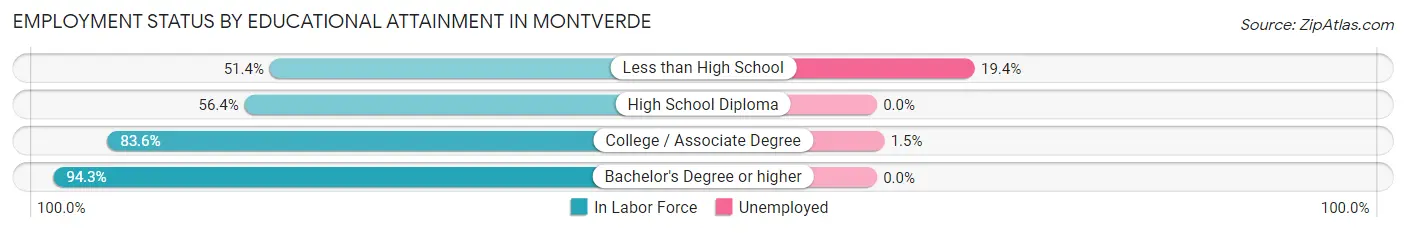
| Educational Attainment | In Labor Force | Unemployed |
| Less than High School | 36 (51.4%) | 14 (19.4%) |
| High School Diploma | 84 (56.4%) | 0 (0.0%) |
| College / Associate Degree | 326 (83.6%) | 6 (1.5%) |
| Bachelor's Degree or higher | 349 (94.3%) | 0 (0.0%) |
| Total | 795 (81.2%) | 15 (1.5%) |
Employment Occupations by Sex in Montverde
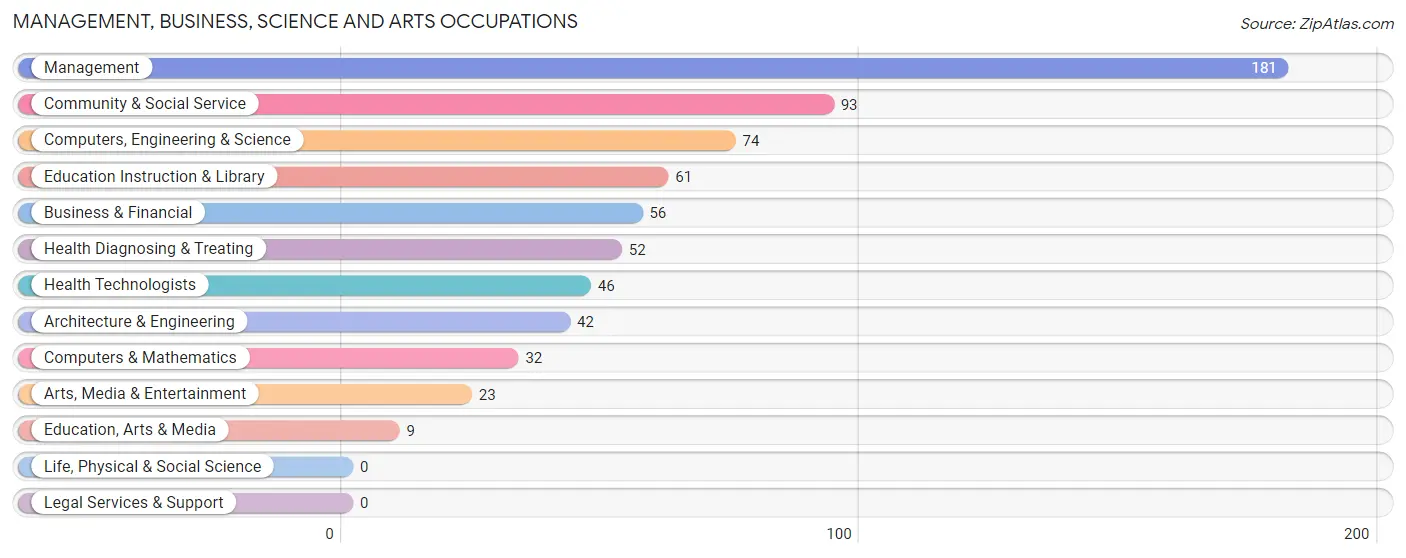
Management, Business, Science and Arts Occupations
The most common Management, Business, Science and Arts occupations in Montverde are Management (181 | 19.4%), Community & Social Service (93 | 10.0%), Computers, Engineering & Science (74 | 8.0%), Education Instruction & Library (61 | 6.6%), and Business & Financial (56 | 6.0%).
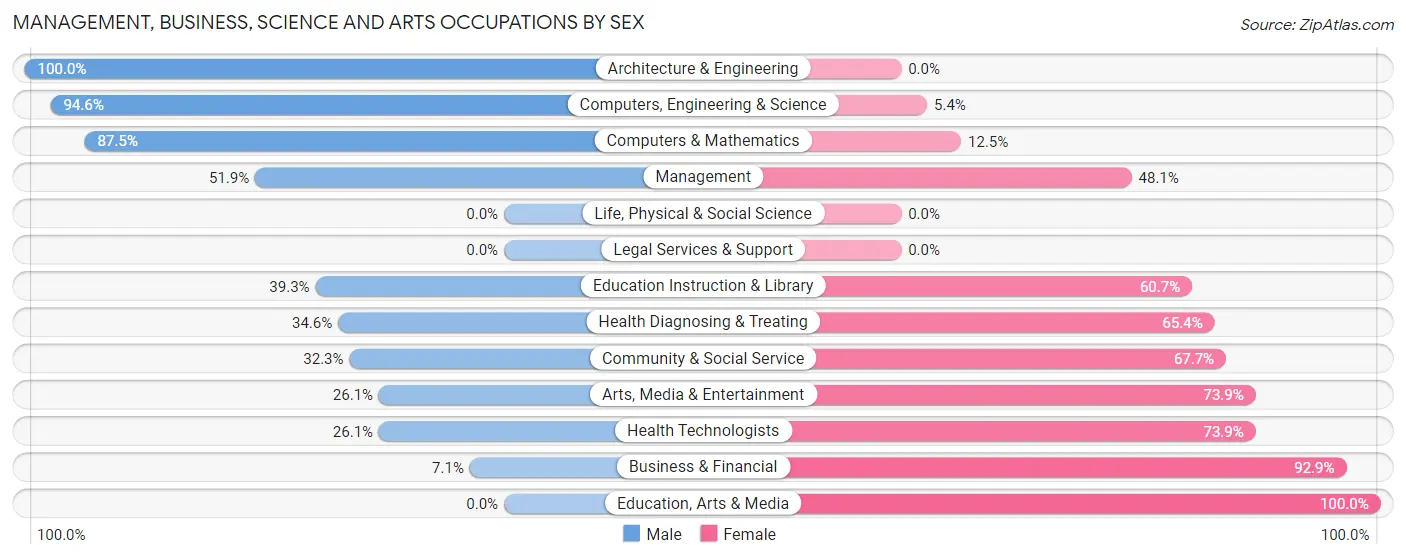
Management, Business, Science and Arts Occupations by Sex
Within the Management, Business, Science and Arts occupations in Montverde, the most male-oriented occupations are Architecture & Engineering (100.0%), Computers, Engineering & Science (94.6%), and Computers & Mathematics (87.5%), while the most female-oriented occupations are Education, Arts & Media (100.0%), Business & Financial (92.9%), and Arts, Media & Entertainment (73.9%).
| Occupation | Male | Female |
| Management | 94 (51.9%) | 87 (48.1%) |
| Business & Financial | 4 (7.1%) | 52 (92.9%) |
| Computers, Engineering & Science | 70 (94.6%) | 4 (5.4%) |
| Computers & Mathematics | 28 (87.5%) | 4 (12.5%) |
| Architecture & Engineering | 42 (100.0%) | 0 (0.0%) |
| Life, Physical & Social Science | 0 (0.0%) | 0 (0.0%) |
| Community & Social Service | 30 (32.3%) | 63 (67.7%) |
| Education, Arts & Media | 0 (0.0%) | 9 (100.0%) |
| Legal Services & Support | 0 (0.0%) | 0 (0.0%) |
| Education Instruction & Library | 24 (39.3%) | 37 (60.7%) |
| Arts, Media & Entertainment | 6 (26.1%) | 17 (73.9%) |
| Health Diagnosing & Treating | 18 (34.6%) | 34 (65.4%) |
| Health Technologists | 12 (26.1%) | 34 (73.9%) |
| Total (Category) | 216 (47.4%) | 240 (52.6%) |
| Total (Overall) | 502 (53.9%) | 429 (46.1%) |
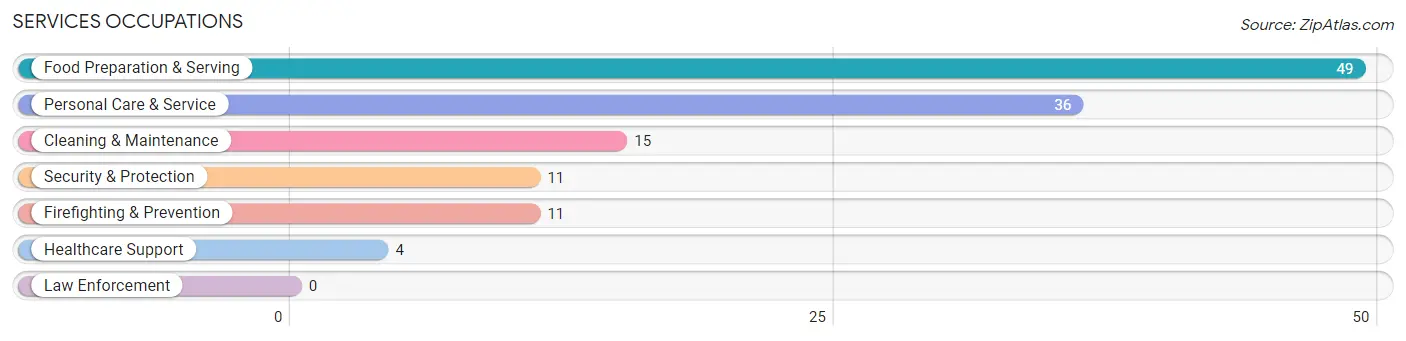
Services Occupations
The most common Services occupations in Montverde are Food Preparation & Serving (49 | 5.3%), Personal Care & Service (36 | 3.9%), Cleaning & Maintenance (15 | 1.6%), Security & Protection (11 | 1.2%), and Firefighting & Prevention (11 | 1.2%).
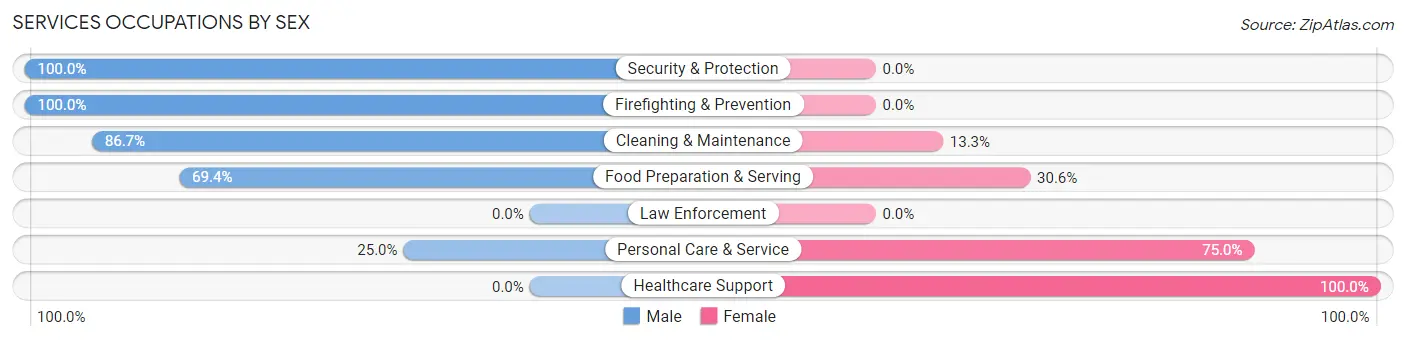
Services Occupations by Sex
Within the Services occupations in Montverde, the most male-oriented occupations are Security & Protection (100.0%), Firefighting & Prevention (100.0%), and Cleaning & Maintenance (86.7%), while the most female-oriented occupations are Healthcare Support (100.0%), Personal Care & Service (75.0%), and Food Preparation & Serving (30.6%).
| Occupation | Male | Female |
| Healthcare Support | 0 (0.0%) | 4 (100.0%) |
| Security & Protection | 11 (100.0%) | 0 (0.0%) |
| Firefighting & Prevention | 11 (100.0%) | 0 (0.0%) |
| Law Enforcement | 0 (0.0%) | 0 (0.0%) |
| Food Preparation & Serving | 34 (69.4%) | 15 (30.6%) |
| Cleaning & Maintenance | 13 (86.7%) | 2 (13.3%) |
| Personal Care & Service | 9 (25.0%) | 27 (75.0%) |
| Total (Category) | 67 (58.3%) | 48 (41.7%) |
| Total (Overall) | 502 (53.9%) | 429 (46.1%) |
Sales and Office Occupations
The most common Sales and Office occupations in Montverde are Sales & Related (114 | 12.2%), and Office & Administration (96 | 10.3%).

Sales and Office Occupations by Sex
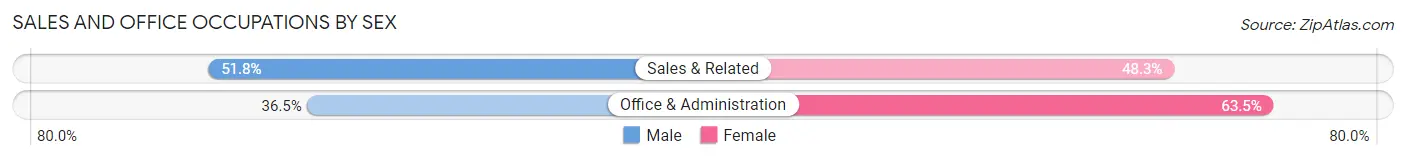
| Occupation | Male | Female |
| Sales & Related | 59 (51.7%) | 55 (48.2%) |
| Office & Administration | 35 (36.5%) | 61 (63.5%) |
| Total (Category) | 94 (44.8%) | 116 (55.2%) |
| Total (Overall) | 502 (53.9%) | 429 (46.1%) |
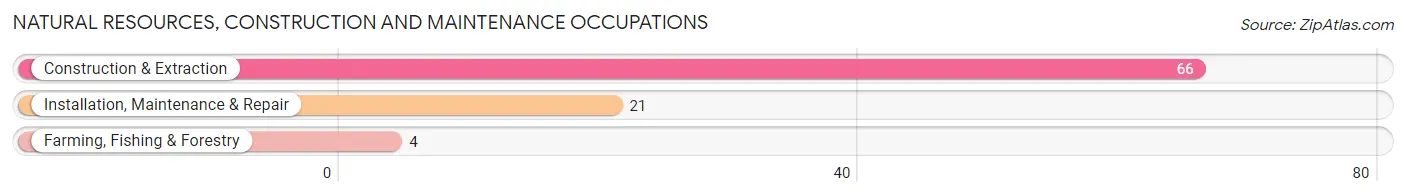
Natural Resources, Construction and Maintenance Occupations
The most common Natural Resources, Construction and Maintenance occupations in Montverde are Construction & Extraction (66 | 7.1%), Installation, Maintenance & Repair (21 | 2.3%), and Farming, Fishing & Forestry (4 | 0.4%).
Natural Resources, Construction and Maintenance Occupations by Sex
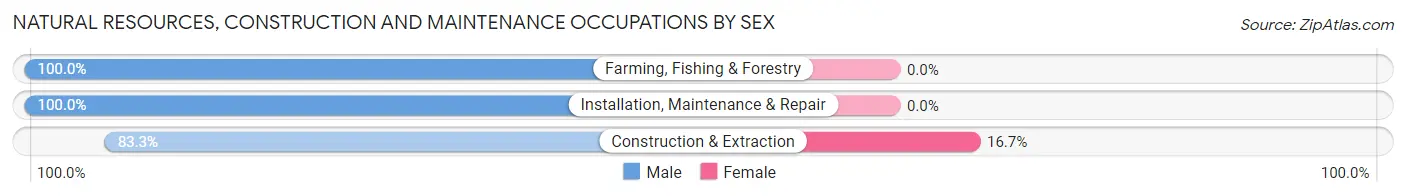
| Occupation | Male | Female |
| Farming, Fishing & Forestry | 4 (100.0%) | 0 (0.0%) |
| Construction & Extraction | 55 (83.3%) | 11 (16.7%) |
| Installation, Maintenance & Repair | 21 (100.0%) | 0 (0.0%) |
| Total (Category) | 80 (87.9%) | 11 (12.1%) |
| Total (Overall) | 502 (53.9%) | 429 (46.1%) |
Production, Transportation and Moving Occupations
The most common Production, Transportation and Moving occupations in Montverde are Material Moving (23 | 2.5%), Production (22 | 2.4%), and Transportation (14 | 1.5%).
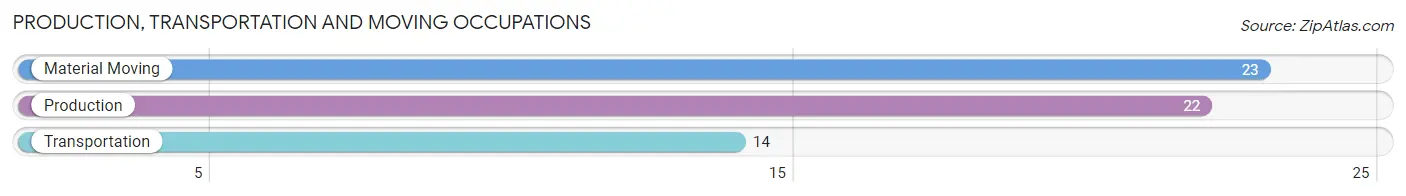
Production, Transportation and Moving Occupations by Sex
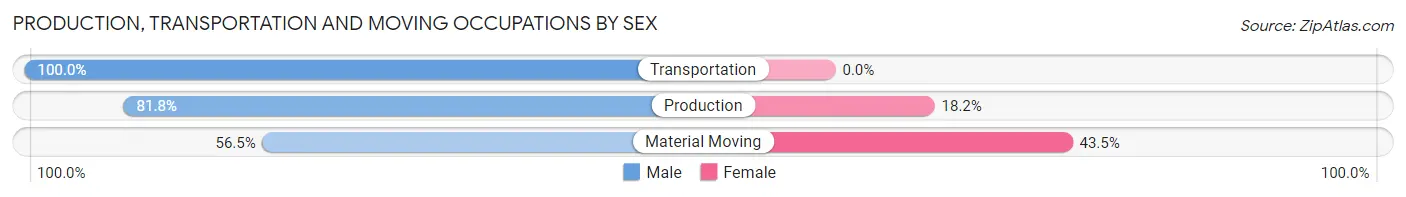
| Occupation | Male | Female |
| Production | 18 (81.8%) | 4 (18.2%) |
| Transportation | 14 (100.0%) | 0 (0.0%) |
| Material Moving | 13 (56.5%) | 10 (43.5%) |
| Total (Category) | 45 (76.3%) | 14 (23.7%) |
| Total (Overall) | 502 (53.9%) | 429 (46.1%) |
Employment Industries by Sex in Montverde
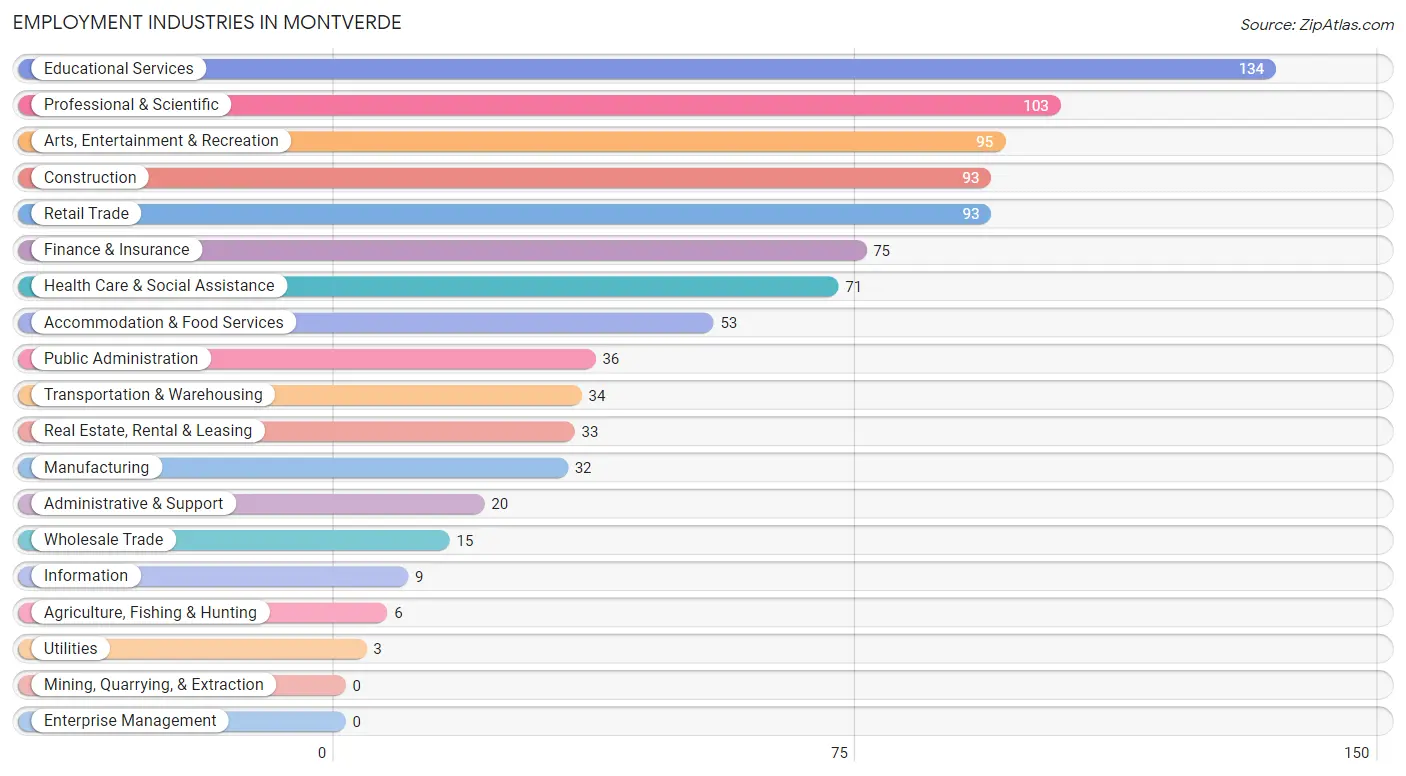
Employment Industries in Montverde
The major employment industries in Montverde include Educational Services (134 | 14.4%), Professional & Scientific (103 | 11.1%), Arts, Entertainment & Recreation (95 | 10.2%), Construction (93 | 10.0%), and Retail Trade (93 | 10.0%).
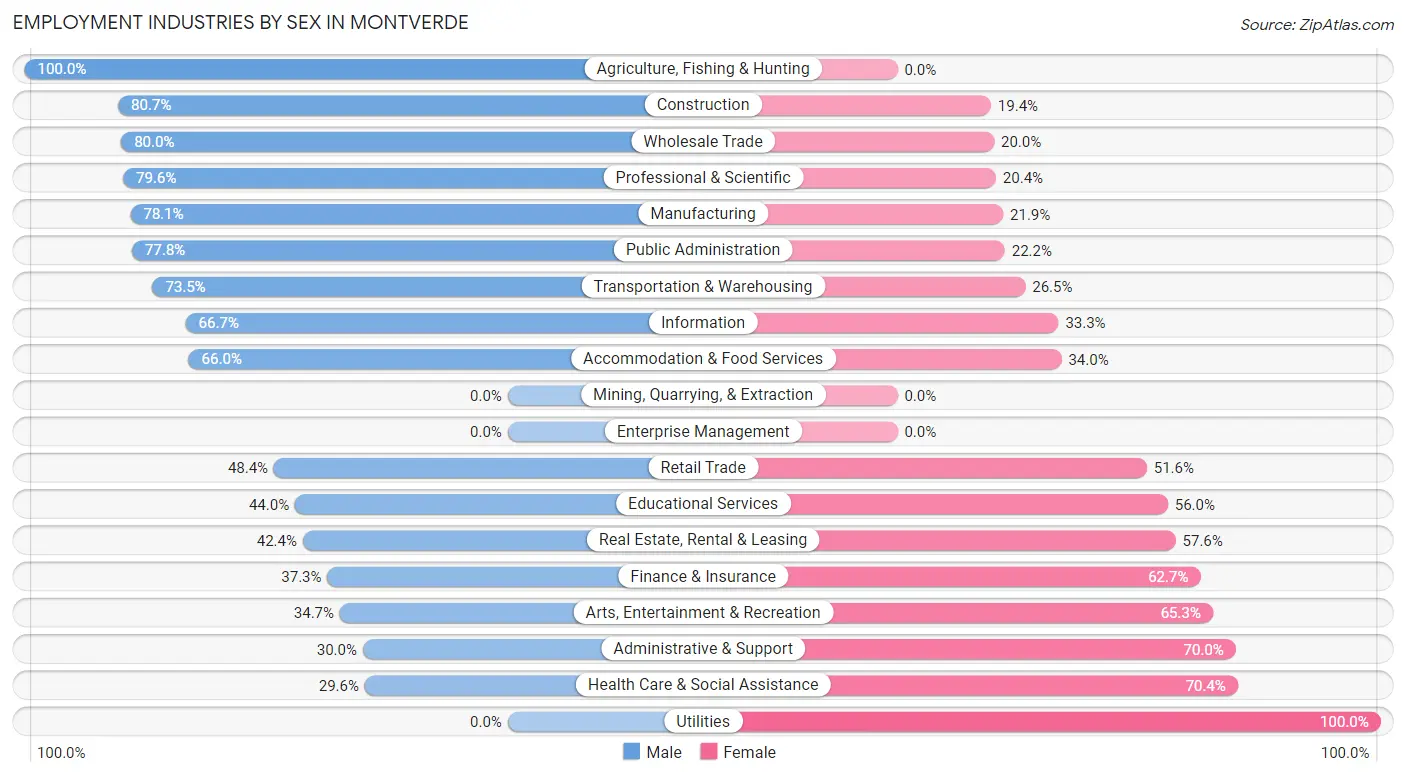
Employment Industries by Sex in Montverde
The Montverde industries that see more men than women are Agriculture, Fishing & Hunting (100.0%), Construction (80.6%), and Wholesale Trade (80.0%), whereas the industries that tend to have a higher number of women are Utilities (100.0%), Health Care & Social Assistance (70.4%), and Administrative & Support (70.0%).
| Industry | Male | Female |
| Agriculture, Fishing & Hunting | 6 (100.0%) | 0 (0.0%) |
| Mining, Quarrying, & Extraction | 0 (0.0%) | 0 (0.0%) |
| Construction | 75 (80.6%) | 18 (19.4%) |
| Manufacturing | 25 (78.1%) | 7 (21.9%) |
| Wholesale Trade | 12 (80.0%) | 3 (20.0%) |
| Retail Trade | 45 (48.4%) | 48 (51.6%) |
| Transportation & Warehousing | 25 (73.5%) | 9 (26.5%) |
| Utilities | 0 (0.0%) | 3 (100.0%) |
| Information | 6 (66.7%) | 3 (33.3%) |
| Finance & Insurance | 28 (37.3%) | 47 (62.7%) |
| Real Estate, Rental & Leasing | 14 (42.4%) | 19 (57.6%) |
| Professional & Scientific | 82 (79.6%) | 21 (20.4%) |
| Enterprise Management | 0 (0.0%) | 0 (0.0%) |
| Administrative & Support | 6 (30.0%) | 14 (70.0%) |
| Educational Services | 59 (44.0%) | 75 (56.0%) |
| Health Care & Social Assistance | 21 (29.6%) | 50 (70.4%) |
| Arts, Entertainment & Recreation | 33 (34.7%) | 62 (65.3%) |
| Accommodation & Food Services | 35 (66.0%) | 18 (34.0%) |
| Public Administration | 28 (77.8%) | 8 (22.2%) |
| Total | 502 (53.9%) | 429 (46.1%) |
Education in Montverde
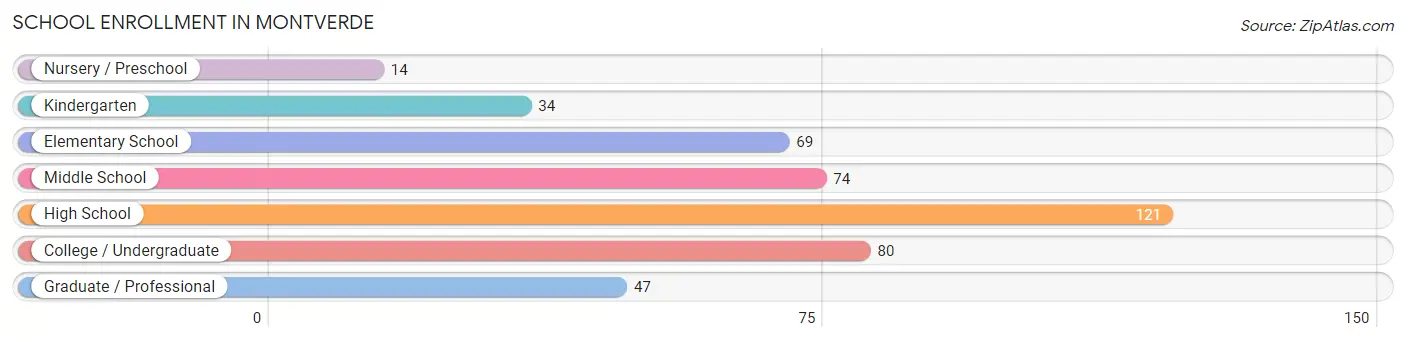
School Enrollment in Montverde
The most common levels of schooling among the 439 students in Montverde are high school (121 | 27.6%), college / undergraduate (80 | 18.2%), and middle school (74 | 16.9%).
| School Level | # Students | % Students |
| Nursery / Preschool | 14 | 3.2% |
| Kindergarten | 34 | 7.7% |
| Elementary School | 69 | 15.7% |
| Middle School | 74 | 16.9% |
| High School | 121 | 27.6% |
| College / Undergraduate | 80 | 18.2% |
| Graduate / Professional | 47 | 10.7% |
| Total | 439 | 100.0% |
School Enrollment by Age by Funding Source in Montverde
Out of a total of 439 students who are enrolled in schools in Montverde, 98 (22.3%) attend a private institution, while the remaining 341 (77.7%) are enrolled in public schools. The age group of 3 to 4 year olds has the highest likelihood of being enrolled in private schools, with 10 (100.0% in the age bracket) enrolled. Conversely, the age group of 20 to 24 year olds has the lowest likelihood of being enrolled in a private school, with 29 (100.0% in the age bracket) attending a public institution.
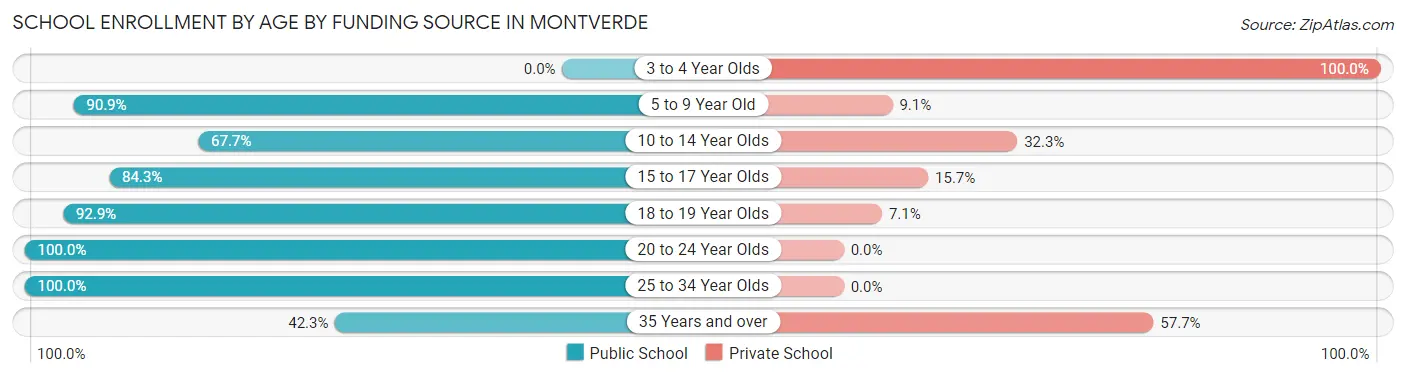
| Age Bracket | Public School | Private School |
| 3 to 4 Year Olds | 0 (0.0%) | 10 (100.0%) |
| 5 to 9 Year Old | 80 (90.9%) | 8 (9.1%) |
| 10 to 14 Year Olds | 67 (67.7%) | 32 (32.3%) |
| 15 to 17 Year Olds | 75 (84.3%) | 14 (15.7%) |
| 18 to 19 Year Olds | 52 (92.9%) | 4 (7.1%) |
| 20 to 24 Year Olds | 29 (100.0%) | 0 (0.0%) |
| 25 to 34 Year Olds | 16 (100.0%) | 0 (0.0%) |
| 35 Years and over | 22 (42.3%) | 30 (57.7%) |
| Total | 341 (77.7%) | 98 (22.3%) |
Educational Attainment by Field of Study in Montverde
Business (116 | 25.2%), education (46 | 10.0%), arts & humanities (43 | 9.3%), engineering (41 | 8.9%), and science & technology (39 | 8.5%) are the most common fields of study among 461 individuals in Montverde who have obtained a bachelor's degree or higher.
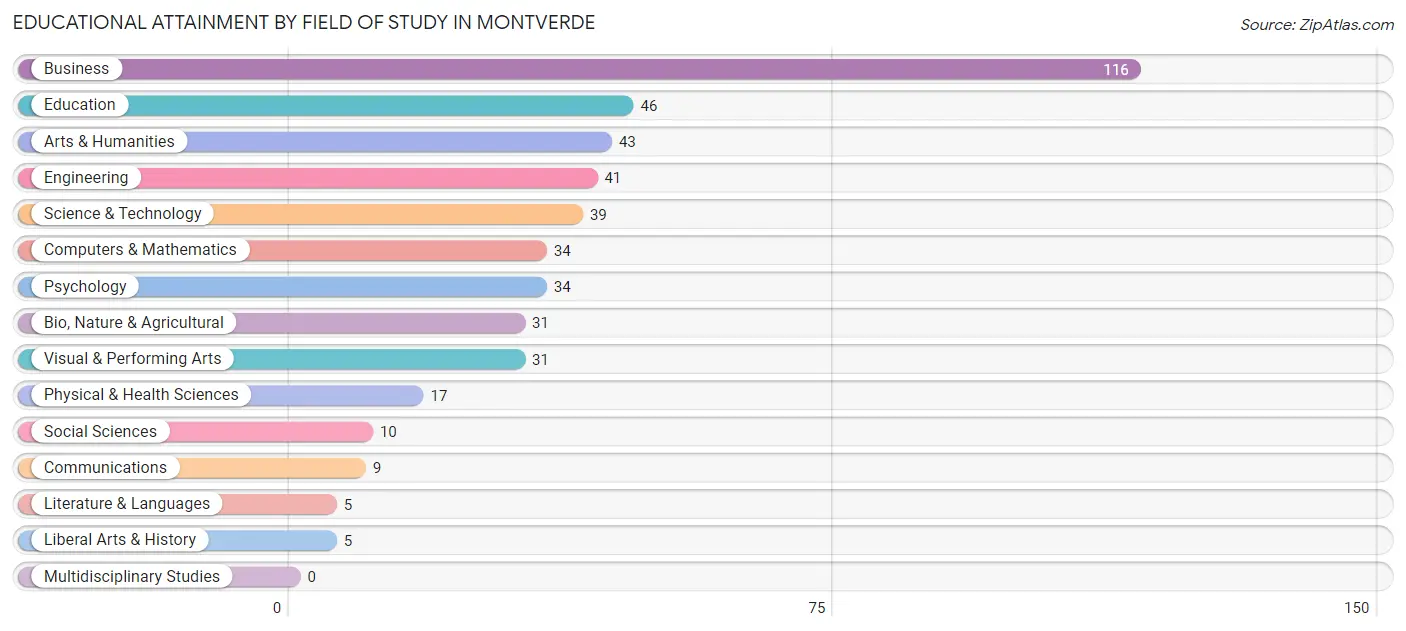
| Field of Study | # Graduates | % Graduates |
| Computers & Mathematics | 34 | 7.4% |
| Bio, Nature & Agricultural | 31 | 6.7% |
| Physical & Health Sciences | 17 | 3.7% |
| Psychology | 34 | 7.4% |
| Social Sciences | 10 | 2.2% |
| Engineering | 41 | 8.9% |
| Multidisciplinary Studies | 0 | 0.0% |
| Science & Technology | 39 | 8.5% |
| Business | 116 | 25.2% |
| Education | 46 | 10.0% |
| Literature & Languages | 5 | 1.1% |
| Liberal Arts & History | 5 | 1.1% |
| Visual & Performing Arts | 31 | 6.7% |
| Communications | 9 | 1.9% |
| Arts & Humanities | 43 | 9.3% |
| Total | 461 | 100.0% |
Transportation & Commute in Montverde
Vehicle Availability by Sex in Montverde
The most prevalent vehicle ownership categories in Montverde are males with 2 vehicles (232, accounting for 46.2%) and females with 2 vehicles (181, making up 56.3%).
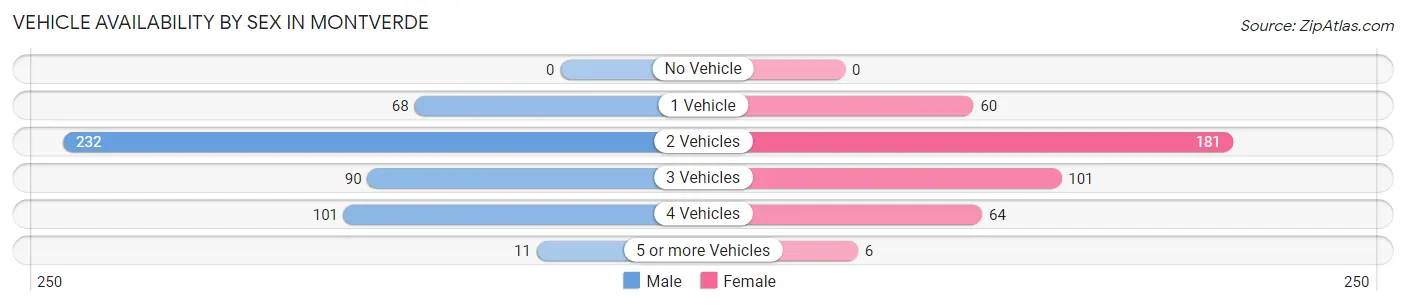
| Vehicles Available | Male | Female |
| No Vehicle | 0 (0.0%) | 0 (0.0%) |
| 1 Vehicle | 68 (13.6%) | 60 (14.6%) |
| 2 Vehicles | 232 (46.2%) | 181 (43.9%) |
| 3 Vehicles | 90 (17.9%) | 101 (24.5%) |
| 4 Vehicles | 101 (20.1%) | 64 (15.5%) |
| 5 or more Vehicles | 11 (2.2%) | 6 (1.5%) |
| Total | 502 (100.0%) | 412 (100.0%) |
Commute Time in Montverde
The most frequently occuring commute durations in Montverde are 45 to 59 minutes (113 commuters, 15.9%), 30 to 34 minutes (103 commuters, 14.4%), and less than 5 minutes (79 commuters, 11.1%).
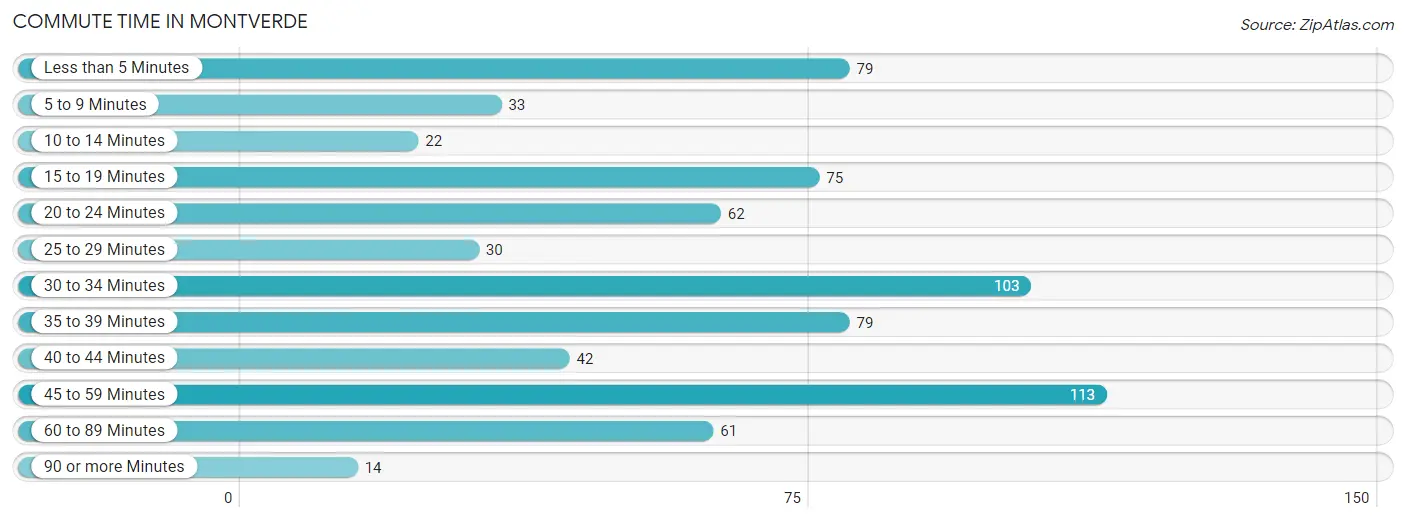
| Commute Time | # Commuters | % Commuters |
| Less than 5 Minutes | 79 | 11.1% |
| 5 to 9 Minutes | 33 | 4.6% |
| 10 to 14 Minutes | 22 | 3.1% |
| 15 to 19 Minutes | 75 | 10.5% |
| 20 to 24 Minutes | 62 | 8.7% |
| 25 to 29 Minutes | 30 | 4.2% |
| 30 to 34 Minutes | 103 | 14.4% |
| 35 to 39 Minutes | 79 | 11.1% |
| 40 to 44 Minutes | 42 | 5.9% |
| 45 to 59 Minutes | 113 | 15.9% |
| 60 to 89 Minutes | 61 | 8.6% |
| 90 or more Minutes | 14 | 2.0% |
Commute Time by Sex in Montverde
The most common commute times in Montverde are 30 to 34 minutes (67 commuters, 16.7%) for males and 45 to 59 minutes (50 commuters, 16.1%) for females.
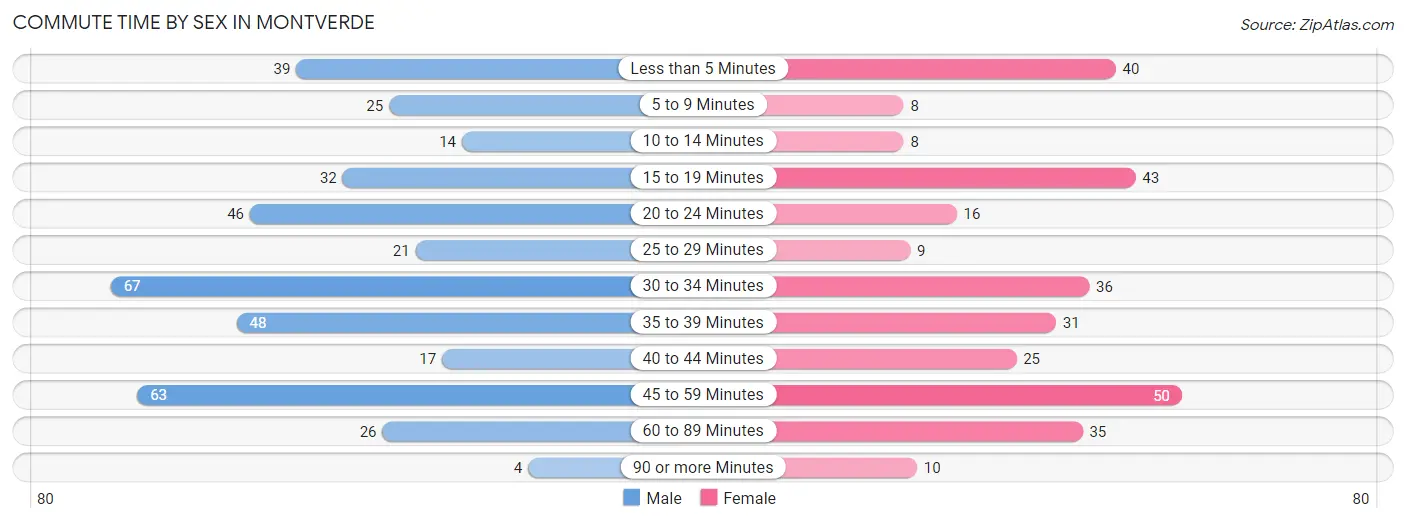
| Commute Time | Male | Female |
| Less than 5 Minutes | 39 (9.7%) | 40 (12.9%) |
| 5 to 9 Minutes | 25 (6.2%) | 8 (2.6%) |
| 10 to 14 Minutes | 14 (3.5%) | 8 (2.6%) |
| 15 to 19 Minutes | 32 (8.0%) | 43 (13.8%) |
| 20 to 24 Minutes | 46 (11.4%) | 16 (5.1%) |
| 25 to 29 Minutes | 21 (5.2%) | 9 (2.9%) |
| 30 to 34 Minutes | 67 (16.7%) | 36 (11.6%) |
| 35 to 39 Minutes | 48 (11.9%) | 31 (10.0%) |
| 40 to 44 Minutes | 17 (4.2%) | 25 (8.0%) |
| 45 to 59 Minutes | 63 (15.7%) | 50 (16.1%) |
| 60 to 89 Minutes | 26 (6.5%) | 35 (11.3%) |
| 90 or more Minutes | 4 (1.0%) | 10 (3.2%) |
Time of Departure to Work by Sex in Montverde
The most frequent times of departure to work in Montverde are 12:00 PM to 3:59 PM (74, 18.4%) for males and 7:00 AM to 7:29 AM (86, 27.7%) for females.
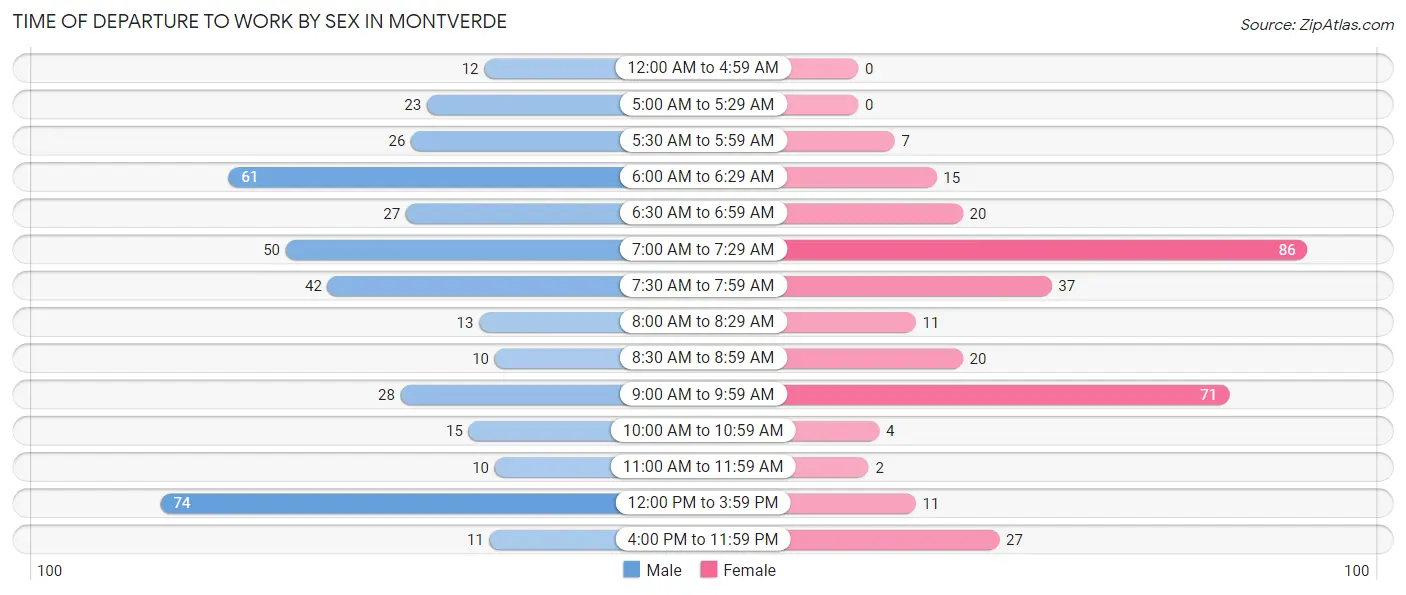
| Time of Departure | Male | Female |
| 12:00 AM to 4:59 AM | 12 (3.0%) | 0 (0.0%) |
| 5:00 AM to 5:29 AM | 23 (5.7%) | 0 (0.0%) |
| 5:30 AM to 5:59 AM | 26 (6.5%) | 7 (2.2%) |
| 6:00 AM to 6:29 AM | 61 (15.2%) | 15 (4.8%) |
| 6:30 AM to 6:59 AM | 27 (6.7%) | 20 (6.4%) |
| 7:00 AM to 7:29 AM | 50 (12.4%) | 86 (27.7%) |
| 7:30 AM to 7:59 AM | 42 (10.4%) | 37 (11.9%) |
| 8:00 AM to 8:29 AM | 13 (3.2%) | 11 (3.5%) |
| 8:30 AM to 8:59 AM | 10 (2.5%) | 20 (6.4%) |
| 9:00 AM to 9:59 AM | 28 (7.0%) | 71 (22.8%) |
| 10:00 AM to 10:59 AM | 15 (3.7%) | 4 (1.3%) |
| 11:00 AM to 11:59 AM | 10 (2.5%) | 2 (0.6%) |
| 12:00 PM to 3:59 PM | 74 (18.4%) | 11 (3.5%) |
| 4:00 PM to 11:59 PM | 11 (2.7%) | 27 (8.7%) |
| Total | 402 (100.0%) | 311 (100.0%) |
Housing Occupancy in Montverde
Occupancy by Ownership in Montverde
Of the total 641 dwellings in Montverde, owner-occupied units account for 530 (82.7%), while renter-occupied units make up 111 (17.3%).
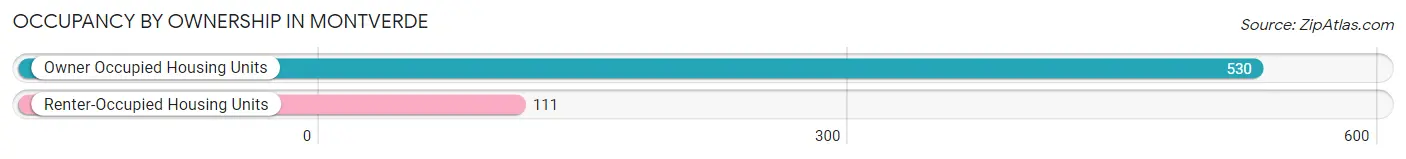
| Occupancy | # Housing Units | % Housing Units |
| Owner Occupied Housing Units | 530 | 82.7% |
| Renter-Occupied Housing Units | 111 | 17.3% |
| Total Occupied Housing Units | 641 | 100.0% |
Occupancy by Household Size in Montverde
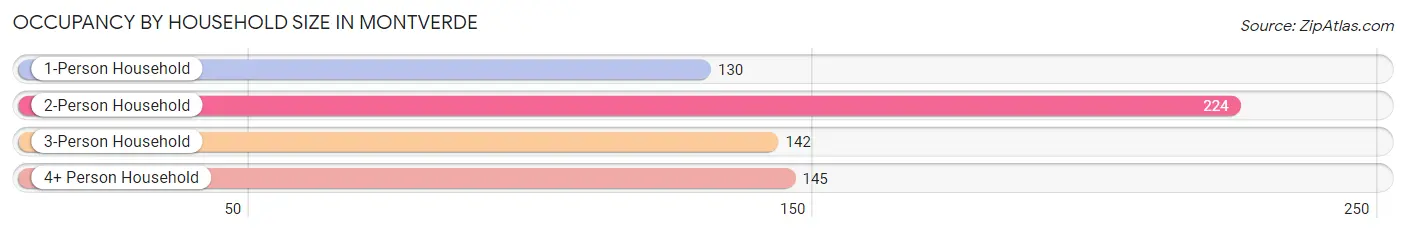
| Household Size | # Housing Units | % Housing Units |
| 1-Person Household | 130 | 20.3% |
| 2-Person Household | 224 | 34.9% |
| 3-Person Household | 142 | 22.2% |
| 4+ Person Household | 145 | 22.6% |
| Total Housing Units | 641 | 100.0% |
Occupancy by Ownership by Household Size in Montverde
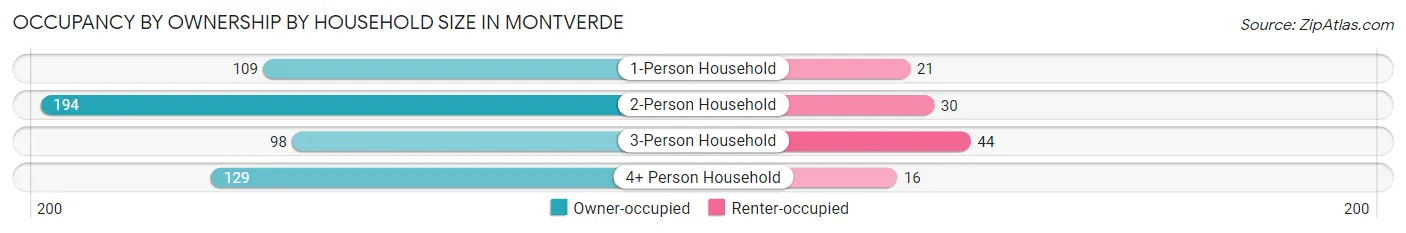
| Household Size | Owner-occupied | Renter-occupied |
| 1-Person Household | 109 (83.9%) | 21 (16.2%) |
| 2-Person Household | 194 (86.6%) | 30 (13.4%) |
| 3-Person Household | 98 (69.0%) | 44 (31.0%) |
| 4+ Person Household | 129 (89.0%) | 16 (11.0%) |
| Total Housing Units | 530 (82.7%) | 111 (17.3%) |
Occupancy by Educational Attainment in Montverde
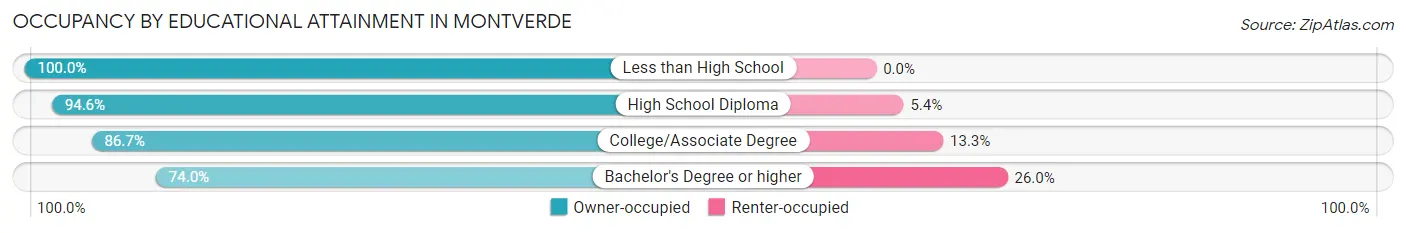
| Household Size | Owner-occupied | Renter-occupied |
| Less than High School | 16 (100.0%) | 0 (0.0%) |
| High School Diploma | 105 (94.6%) | 6 (5.4%) |
| College/Associate Degree | 196 (86.7%) | 30 (13.3%) |
| Bachelor's Degree or higher | 213 (74.0%) | 75 (26.0%) |
Occupancy by Age of Householder in Montverde
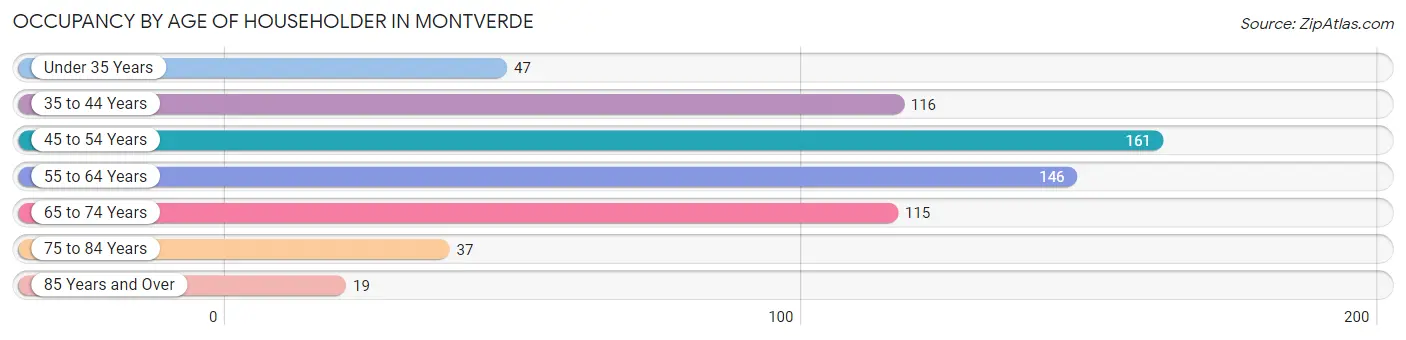
| Age Bracket | # Households | % Households |
| Under 35 Years | 47 | 7.3% |
| 35 to 44 Years | 116 | 18.1% |
| 45 to 54 Years | 161 | 25.1% |
| 55 to 64 Years | 146 | 22.8% |
| 65 to 74 Years | 115 | 17.9% |
| 75 to 84 Years | 37 | 5.8% |
| 85 Years and Over | 19 | 3.0% |
| Total | 641 | 100.0% |
Housing Finances in Montverde
Median Income by Occupancy in Montverde
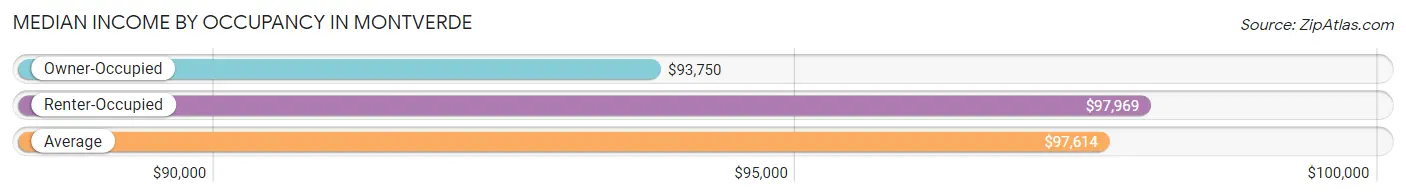
| Occupancy Type | # Households | Median Income |
| Owner-Occupied | 530 (82.7%) | $93,750 |
| Renter-Occupied | 111 (17.3%) | $97,969 |
| Average | 641 (100.0%) | $97,614 |
Occupancy by Householder Income Bracket in Montverde
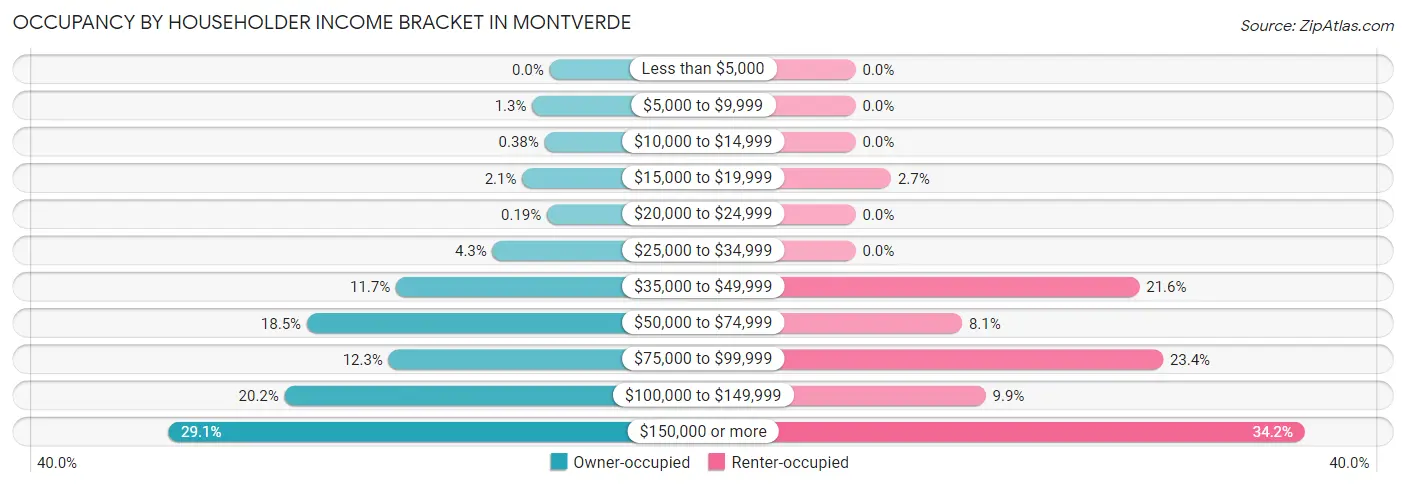
| Income Bracket | Owner-occupied | Renter-occupied |
| Less than $5,000 | 0 (0.0%) | 0 (0.0%) |
| $5,000 to $9,999 | 7 (1.3%) | 0 (0.0%) |
| $10,000 to $14,999 | 2 (0.4%) | 0 (0.0%) |
| $15,000 to $19,999 | 11 (2.1%) | 3 (2.7%) |
| $20,000 to $24,999 | 1 (0.2%) | 0 (0.0%) |
| $25,000 to $34,999 | 23 (4.3%) | 0 (0.0%) |
| $35,000 to $49,999 | 62 (11.7%) | 24 (21.6%) |
| $50,000 to $74,999 | 98 (18.5%) | 9 (8.1%) |
| $75,000 to $99,999 | 65 (12.3%) | 26 (23.4%) |
| $100,000 to $149,999 | 107 (20.2%) | 11 (9.9%) |
| $150,000 or more | 154 (29.1%) | 38 (34.2%) |
| Total | 530 (100.0%) | 111 (100.0%) |
Monthly Housing Cost Tiers in Montverde
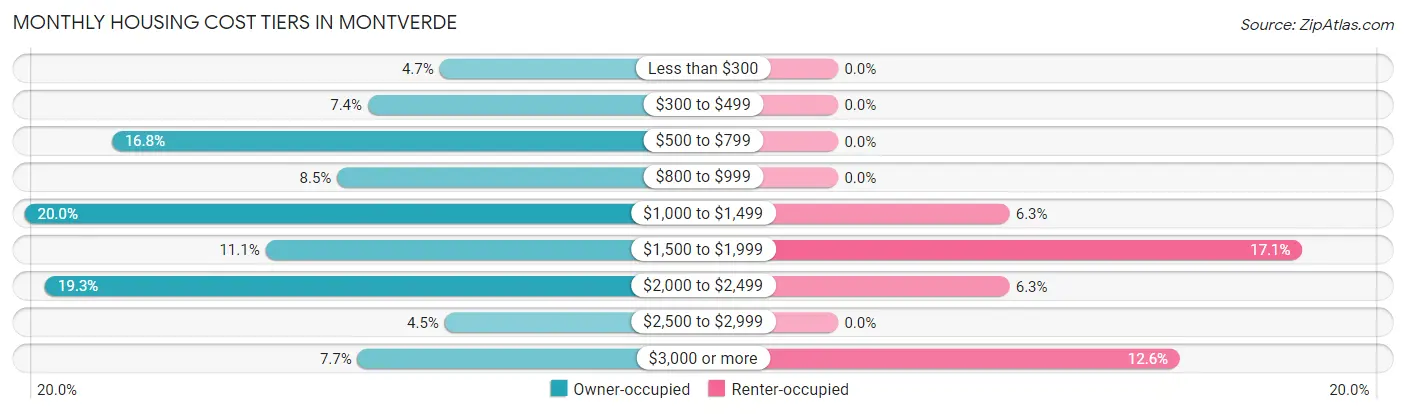
| Monthly Cost | Owner-occupied | Renter-occupied |
| Less than $300 | 25 (4.7%) | 0 (0.0%) |
| $300 to $499 | 39 (7.4%) | 0 (0.0%) |
| $500 to $799 | 89 (16.8%) | 0 (0.0%) |
| $800 to $999 | 45 (8.5%) | 0 (0.0%) |
| $1,000 to $1,499 | 106 (20.0%) | 7 (6.3%) |
| $1,500 to $1,999 | 59 (11.1%) | 19 (17.1%) |
| $2,000 to $2,499 | 102 (19.3%) | 7 (6.3%) |
| $2,500 to $2,999 | 24 (4.5%) | 0 (0.0%) |
| $3,000 or more | 41 (7.7%) | 14 (12.6%) |
| Total | 530 (100.0%) | 111 (100.0%) |
Physical Housing Characteristics in Montverde
Housing Structures in Montverde
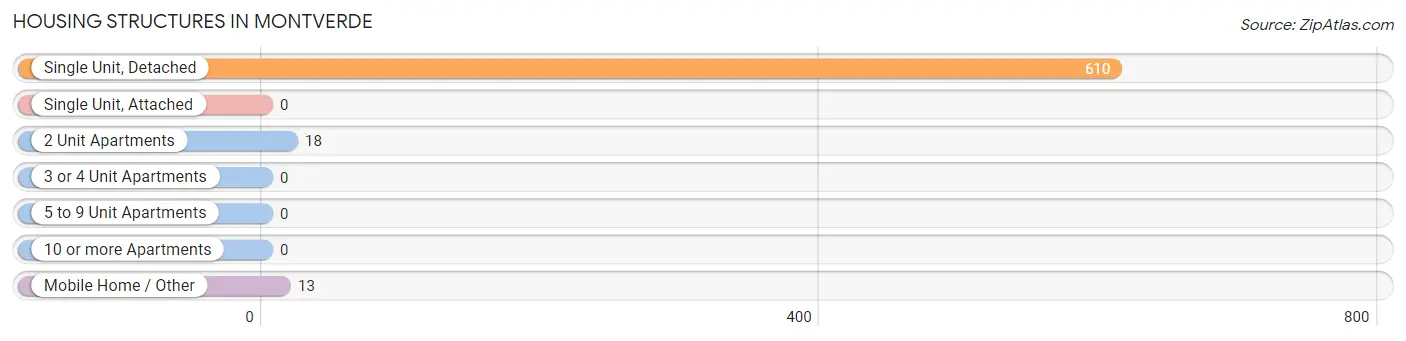
| Structure Type | # Housing Units | % Housing Units |
| Single Unit, Detached | 610 | 95.2% |
| Single Unit, Attached | 0 | 0.0% |
| 2 Unit Apartments | 18 | 2.8% |
| 3 or 4 Unit Apartments | 0 | 0.0% |
| 5 to 9 Unit Apartments | 0 | 0.0% |
| 10 or more Apartments | 0 | 0.0% |
| Mobile Home / Other | 13 | 2.0% |
| Total | 641 | 100.0% |
Housing Structures by Occupancy in Montverde
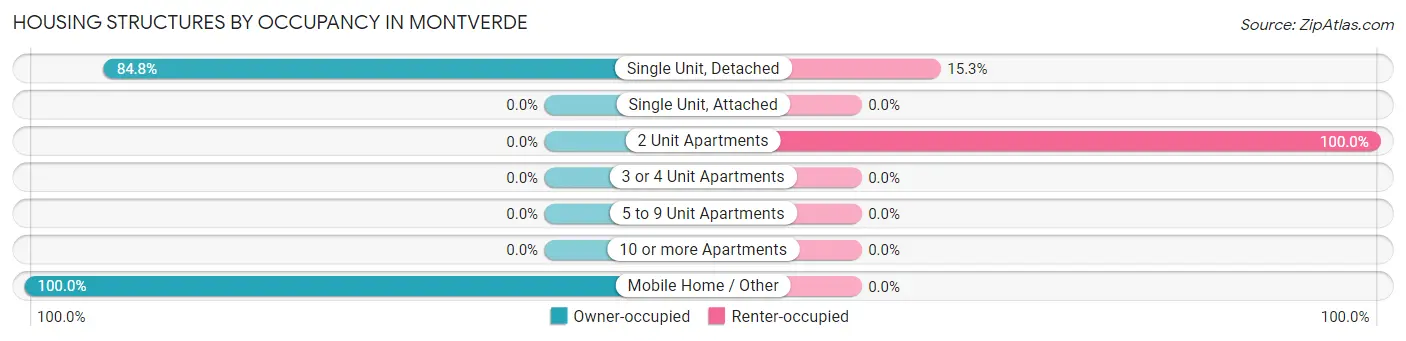
| Structure Type | Owner-occupied | Renter-occupied |
| Single Unit, Detached | 517 (84.8%) | 93 (15.2%) |
| Single Unit, Attached | 0 (0.0%) | 0 (0.0%) |
| 2 Unit Apartments | 0 (0.0%) | 18 (100.0%) |
| 3 or 4 Unit Apartments | 0 (0.0%) | 0 (0.0%) |
| 5 to 9 Unit Apartments | 0 (0.0%) | 0 (0.0%) |
| 10 or more Apartments | 0 (0.0%) | 0 (0.0%) |
| Mobile Home / Other | 13 (100.0%) | 0 (0.0%) |
| Total | 530 (82.7%) | 111 (17.3%) |
Housing Structures by Number of Rooms in Montverde
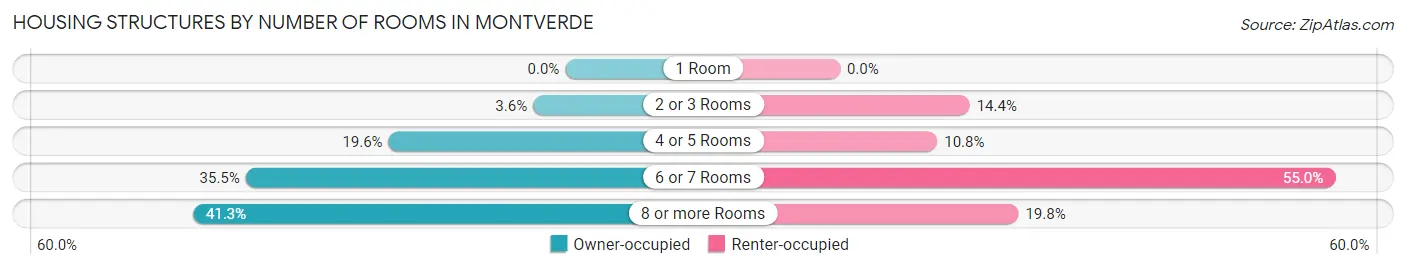
| Number of Rooms | Owner-occupied | Renter-occupied |
| 1 Room | 0 (0.0%) | 0 (0.0%) |
| 2 or 3 Rooms | 19 (3.6%) | 16 (14.4%) |
| 4 or 5 Rooms | 104 (19.6%) | 12 (10.8%) |
| 6 or 7 Rooms | 188 (35.5%) | 61 (54.9%) |
| 8 or more Rooms | 219 (41.3%) | 22 (19.8%) |
| Total | 530 (100.0%) | 111 (100.0%) |
Housing Structure by Heating Type in Montverde
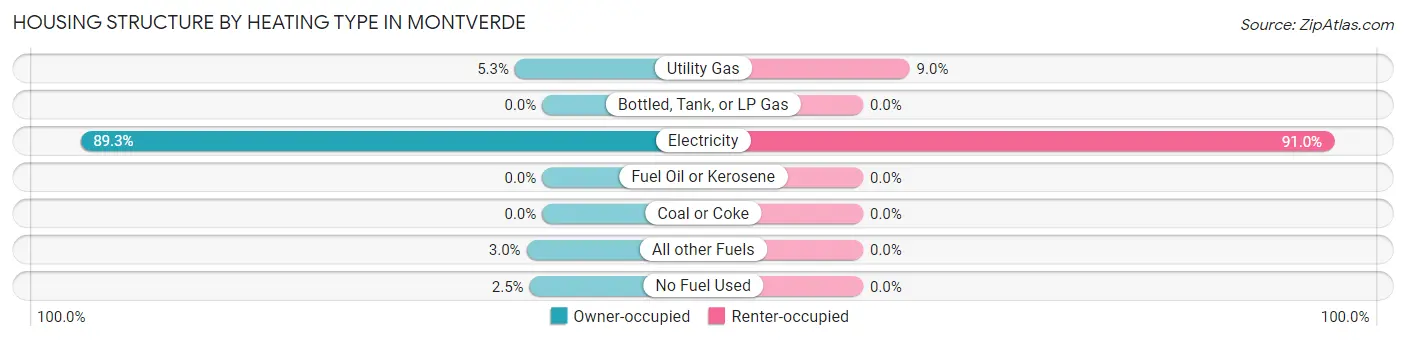
| Heating Type | Owner-occupied | Renter-occupied |
| Utility Gas | 28 (5.3%) | 10 (9.0%) |
| Bottled, Tank, or LP Gas | 0 (0.0%) | 0 (0.0%) |
| Electricity | 473 (89.2%) | 101 (91.0%) |
| Fuel Oil or Kerosene | 0 (0.0%) | 0 (0.0%) |
| Coal or Coke | 0 (0.0%) | 0 (0.0%) |
| All other Fuels | 16 (3.0%) | 0 (0.0%) |
| No Fuel Used | 13 (2.5%) | 0 (0.0%) |
| Total | 530 (100.0%) | 111 (100.0%) |
Household Vehicle Usage in Montverde
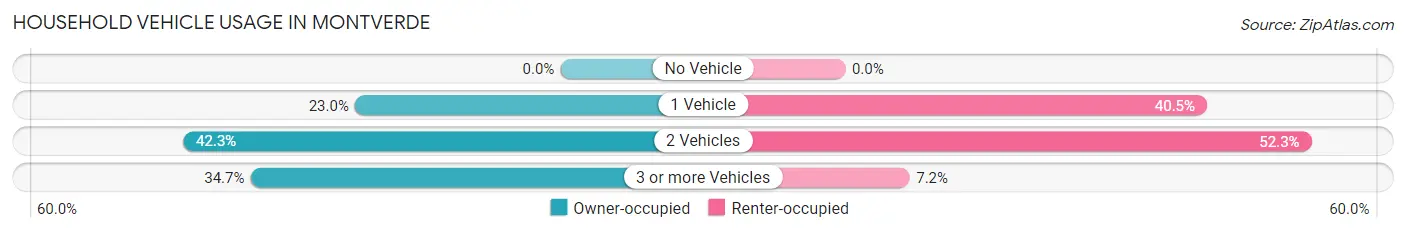
| Vehicles per Household | Owner-occupied | Renter-occupied |
| No Vehicle | 0 (0.0%) | 0 (0.0%) |
| 1 Vehicle | 122 (23.0%) | 45 (40.5%) |
| 2 Vehicles | 224 (42.3%) | 58 (52.2%) |
| 3 or more Vehicles | 184 (34.7%) | 8 (7.2%) |
| Total | 530 (100.0%) | 111 (100.0%) |
Real Estate & Mortgages in Montverde
Real Estate and Mortgage Overview in Montverde
| Characteristic | Without Mortgage | With Mortgage |
| Housing Units | 177 | 353 |
| Median Property Value | $445,900 | $405,400 |
| Median Household Income | $60,375 | $108 |
| Monthly Housing Costs | $703 | $41 |
| Real Estate Taxes | $3,203 | $4 |
Property Value by Mortgage Status in Montverde
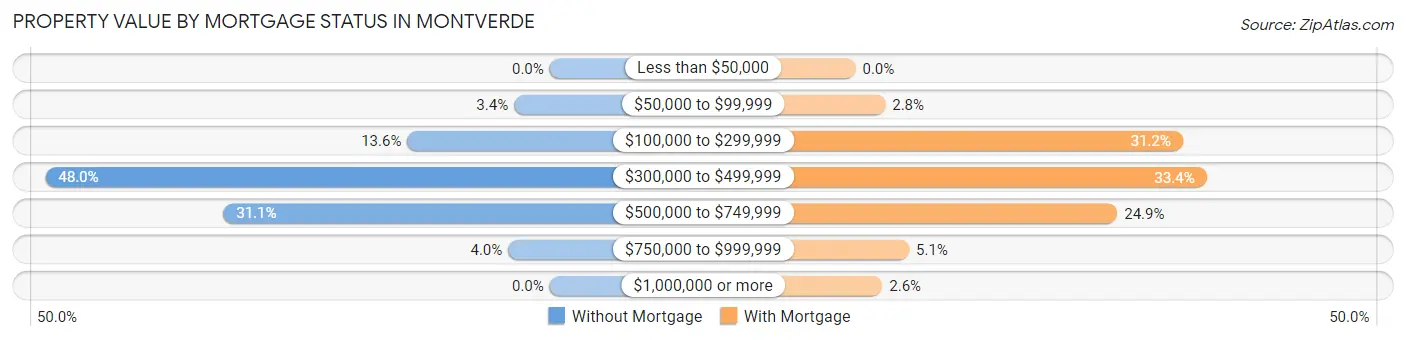
| Property Value | Without Mortgage | With Mortgage |
| Less than $50,000 | 0 (0.0%) | 0 (0.0%) |
| $50,000 to $99,999 | 6 (3.4%) | 10 (2.8%) |
| $100,000 to $299,999 | 24 (13.6%) | 110 (31.2%) |
| $300,000 to $499,999 | 85 (48.0%) | 118 (33.4%) |
| $500,000 to $749,999 | 55 (31.1%) | 88 (24.9%) |
| $750,000 to $999,999 | 7 (4.0%) | 18 (5.1%) |
| $1,000,000 or more | 0 (0.0%) | 9 (2.5%) |
| Total | 177 (100.0%) | 353 (100.0%) |
Household Income by Mortgage Status in Montverde
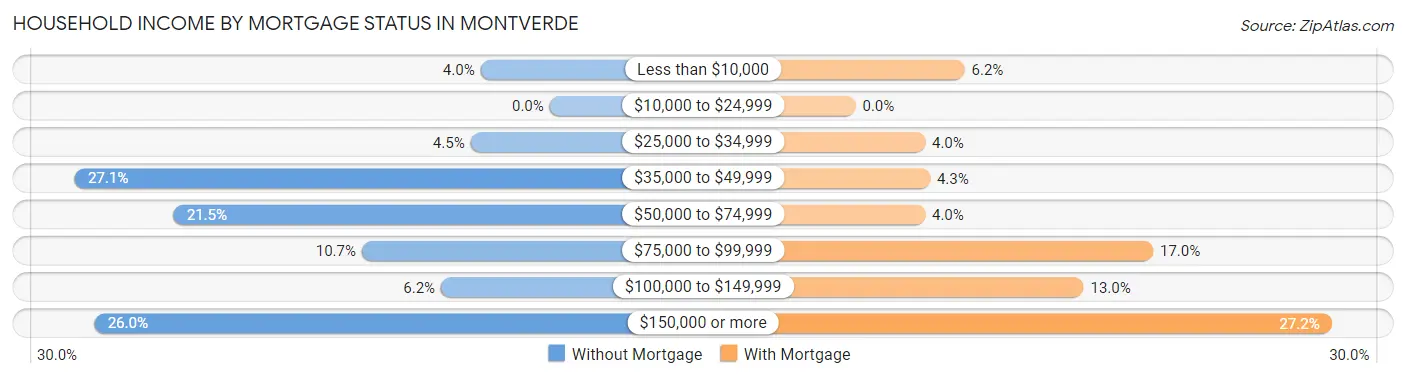
| Household Income | Without Mortgage | With Mortgage |
| Less than $10,000 | 7 (4.0%) | 22 (6.2%) |
| $10,000 to $24,999 | 0 (0.0%) | 0 (0.0%) |
| $25,000 to $34,999 | 8 (4.5%) | 14 (4.0%) |
| $35,000 to $49,999 | 48 (27.1%) | 15 (4.3%) |
| $50,000 to $74,999 | 38 (21.5%) | 14 (4.0%) |
| $75,000 to $99,999 | 19 (10.7%) | 60 (17.0%) |
| $100,000 to $149,999 | 11 (6.2%) | 46 (13.0%) |
| $150,000 or more | 46 (26.0%) | 96 (27.2%) |
| Total | 177 (100.0%) | 353 (100.0%) |
Property Value to Household Income Ratio in Montverde
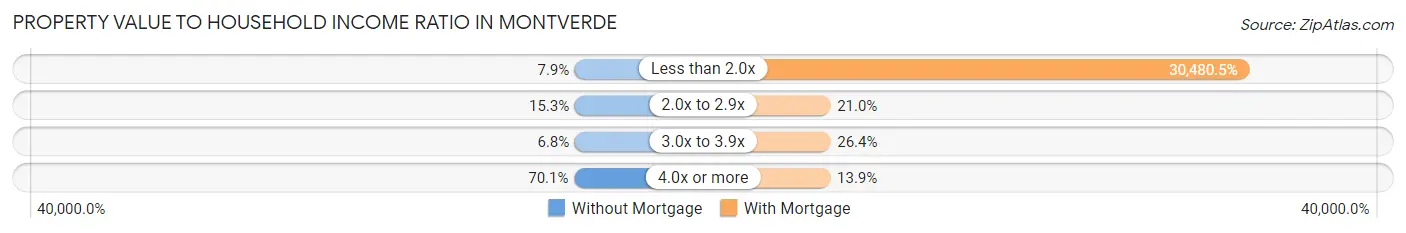
| Value-to-Income Ratio | Without Mortgage | With Mortgage |
| Less than 2.0x | 14 (7.9%) | 107,596 (30,480.5%) |
| 2.0x to 2.9x | 27 (15.2%) | 74 (21.0%) |
| 3.0x to 3.9x | 12 (6.8%) | 93 (26.4%) |
| 4.0x or more | 124 (70.1%) | 49 (13.9%) |
| Total | 177 (100.0%) | 353 (100.0%) |
Real Estate Taxes by Mortgage Status in Montverde
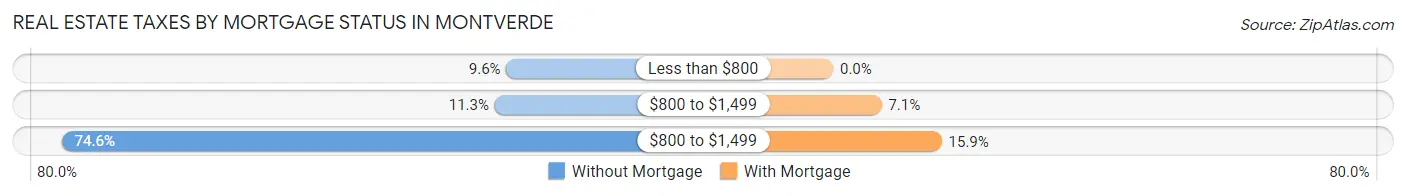
| Property Taxes | Without Mortgage | With Mortgage |
| Less than $800 | 17 (9.6%) | 0 (0.0%) |
| $800 to $1,499 | 20 (11.3%) | 25 (7.1%) |
| $800 to $1,499 | 132 (74.6%) | 56 (15.9%) |
| Total | 177 (100.0%) | 353 (100.0%) |
Health & Disability in Montverde
Health Insurance Coverage by Age in Montverde
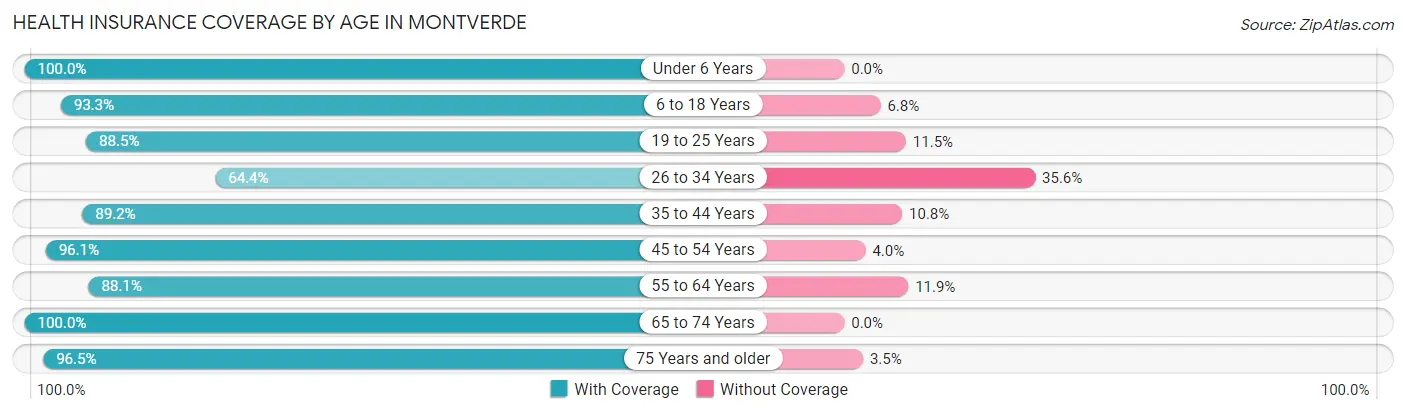
| Age Bracket | With Coverage | Without Coverage |
| Under 6 Years | 125 (100.0%) | 0 (0.0%) |
| 6 to 18 Years | 290 (93.2%) | 21 (6.8%) |
| 19 to 25 Years | 77 (88.5%) | 10 (11.5%) |
| 26 to 34 Years | 105 (64.4%) | 58 (35.6%) |
| 35 to 44 Years | 182 (89.2%) | 22 (10.8%) |
| 45 to 54 Years | 316 (96.1%) | 13 (4.0%) |
| 55 to 64 Years | 229 (88.1%) | 31 (11.9%) |
| 65 to 74 Years | 188 (100.0%) | 0 (0.0%) |
| 75 Years and older | 111 (96.5%) | 4 (3.5%) |
| Total | 1,623 (91.1%) | 159 (8.9%) |
Health Insurance Coverage by Citizenship Status in Montverde
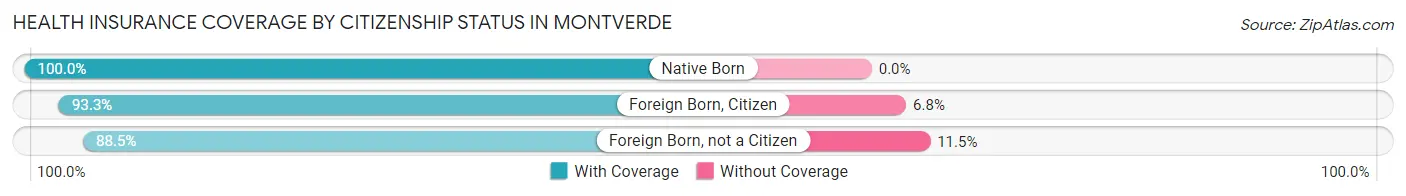
| Citizenship Status | With Coverage | Without Coverage |
| Native Born | 125 (100.0%) | 0 (0.0%) |
| Foreign Born, Citizen | 290 (93.2%) | 21 (6.8%) |
| Foreign Born, not a Citizen | 77 (88.5%) | 10 (11.5%) |
Health Insurance Coverage by Household Income in Montverde
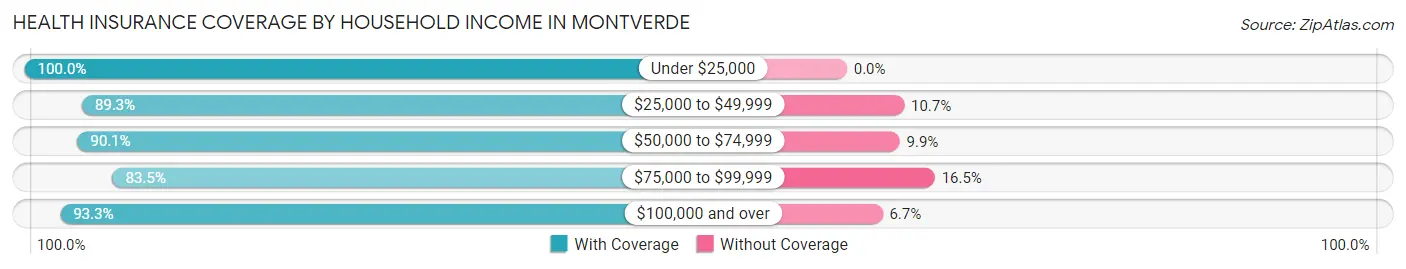
| Household Income | With Coverage | Without Coverage |
| Under $25,000 | 31 (100.0%) | 0 (0.0%) |
| $25,000 to $49,999 | 183 (89.3%) | 22 (10.7%) |
| $50,000 to $74,999 | 246 (90.1%) | 27 (9.9%) |
| $75,000 to $99,999 | 213 (83.5%) | 42 (16.5%) |
| $100,000 and over | 950 (93.3%) | 68 (6.7%) |
Public vs Private Health Insurance Coverage by Age in Montverde
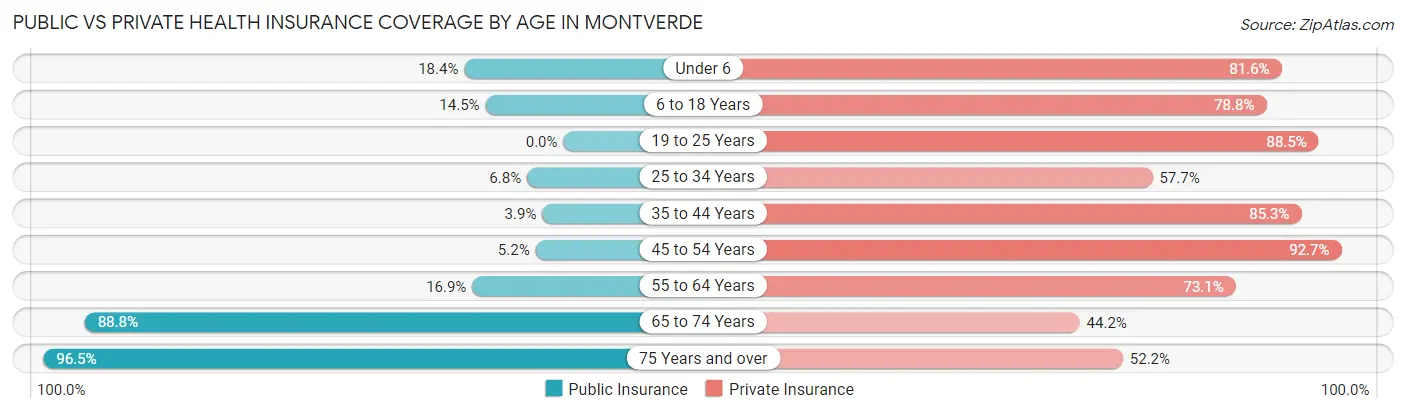
| Age Bracket | Public Insurance | Private Insurance |
| Under 6 | 23 (18.4%) | 102 (81.6%) |
| 6 to 18 Years | 45 (14.5%) | 245 (78.8%) |
| 19 to 25 Years | 0 (0.0%) | 77 (88.5%) |
| 25 to 34 Years | 11 (6.8%) | 94 (57.7%) |
| 35 to 44 Years | 8 (3.9%) | 174 (85.3%) |
| 45 to 54 Years | 17 (5.2%) | 305 (92.7%) |
| 55 to 64 Years | 44 (16.9%) | 190 (73.1%) |
| 65 to 74 Years | 167 (88.8%) | 83 (44.2%) |
| 75 Years and over | 111 (96.5%) | 60 (52.2%) |
| Total | 426 (23.9%) | 1,330 (74.6%) |
Disability Status by Sex by Age in Montverde
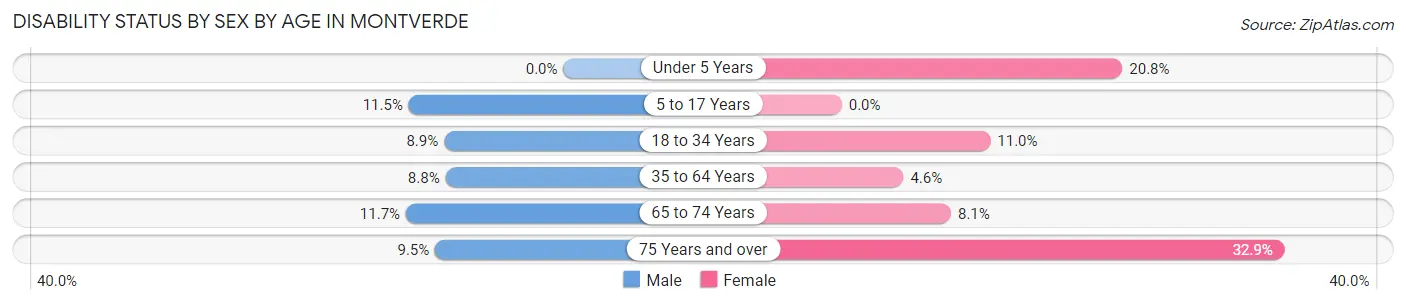
| Age Bracket | Male | Female |
| Under 5 Years | 0 (0.0%) | 5 (20.8%) |
| 5 to 17 Years | 21 (11.5%) | 0 (0.0%) |
| 18 to 34 Years | 14 (8.9%) | 16 (11.0%) |
| 35 to 64 Years | 35 (8.7%) | 18 (4.6%) |
| 65 to 74 Years | 9 (11.7%) | 9 (8.1%) |
| 75 Years and over | 4 (9.5%) | 24 (32.9%) |
Disability Class by Sex by Age in Montverde
Disability Class: Hearing Difficulty
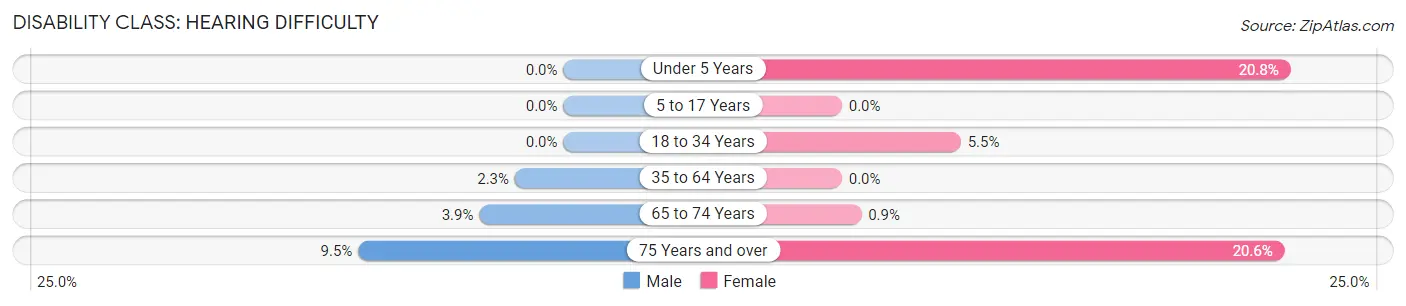
| Age Bracket | Male | Female |
| Under 5 Years | 0 (0.0%) | 5 (20.8%) |
| 5 to 17 Years | 0 (0.0%) | 0 (0.0%) |
| 18 to 34 Years | 0 (0.0%) | 8 (5.5%) |
| 35 to 64 Years | 9 (2.2%) | 0 (0.0%) |
| 65 to 74 Years | 3 (3.9%) | 1 (0.9%) |
| 75 Years and over | 4 (9.5%) | 15 (20.5%) |
Disability Class: Vision Difficulty
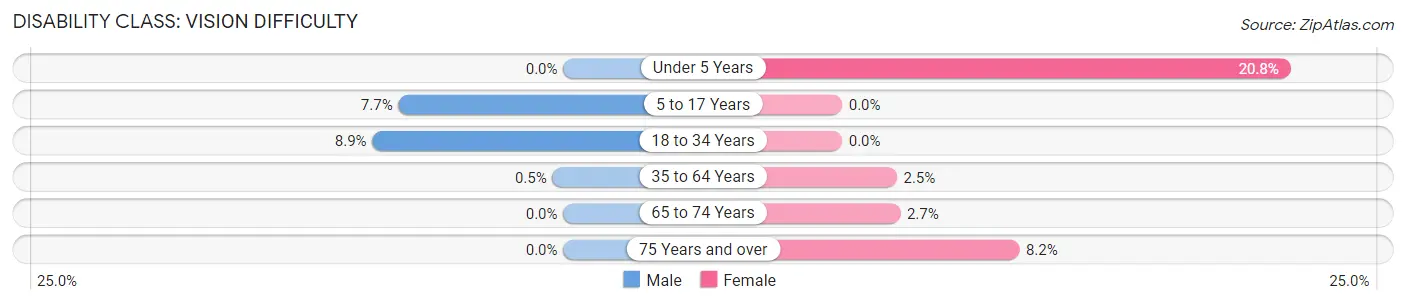
| Age Bracket | Male | Female |
| Under 5 Years | 0 (0.0%) | 5 (20.8%) |
| 5 to 17 Years | 14 (7.6%) | 0 (0.0%) |
| 18 to 34 Years | 14 (8.9%) | 0 (0.0%) |
| 35 to 64 Years | 2 (0.5%) | 10 (2.5%) |
| 65 to 74 Years | 0 (0.0%) | 3 (2.7%) |
| 75 Years and over | 0 (0.0%) | 6 (8.2%) |
Disability Class: Cognitive Difficulty
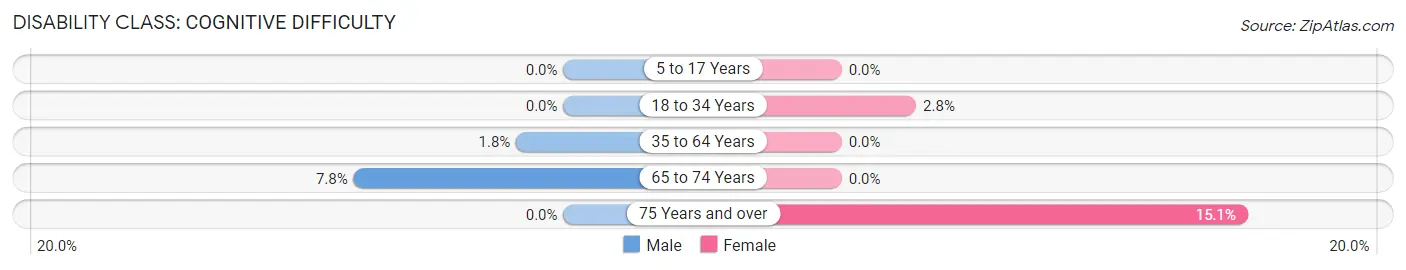
| Age Bracket | Male | Female |
| 5 to 17 Years | 0 (0.0%) | 0 (0.0%) |
| 18 to 34 Years | 0 (0.0%) | 4 (2.8%) |
| 35 to 64 Years | 7 (1.8%) | 0 (0.0%) |
| 65 to 74 Years | 6 (7.8%) | 0 (0.0%) |
| 75 Years and over | 0 (0.0%) | 11 (15.1%) |
Disability Class: Ambulatory Difficulty
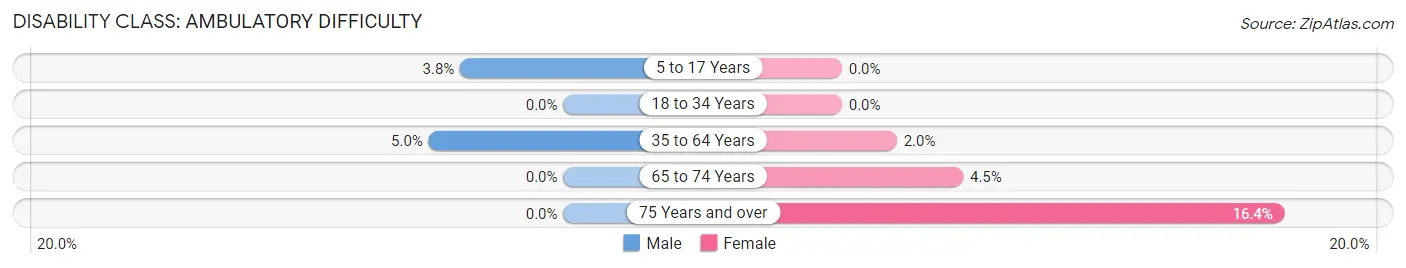
| Age Bracket | Male | Female |
| 5 to 17 Years | 7 (3.8%) | 0 (0.0%) |
| 18 to 34 Years | 0 (0.0%) | 0 (0.0%) |
| 35 to 64 Years | 20 (5.0%) | 8 (2.0%) |
| 65 to 74 Years | 0 (0.0%) | 5 (4.5%) |
| 75 Years and over | 0 (0.0%) | 12 (16.4%) |
Disability Class: Self-Care Difficulty
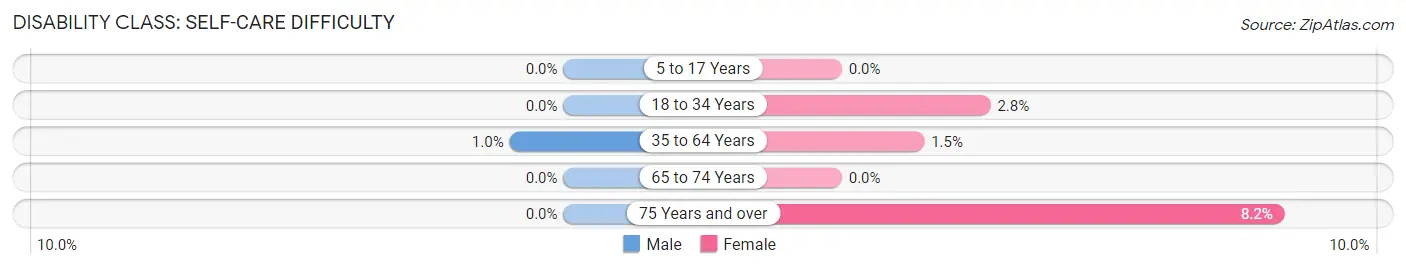
| Age Bracket | Male | Female |
| 5 to 17 Years | 0 (0.0%) | 0 (0.0%) |
| 18 to 34 Years | 0 (0.0%) | 4 (2.8%) |
| 35 to 64 Years | 4 (1.0%) | 6 (1.5%) |
| 65 to 74 Years | 0 (0.0%) | 0 (0.0%) |
| 75 Years and over | 0 (0.0%) | 6 (8.2%) |
Technology Access in Montverde
Computing Device Access in Montverde
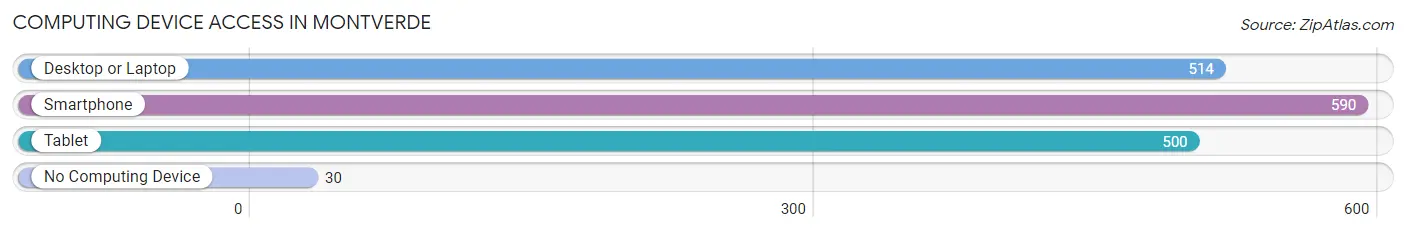
| Device Type | # Households | % Households |
| Desktop or Laptop | 514 | 80.2% |
| Smartphone | 590 | 92.0% |
| Tablet | 500 | 78.0% |
| No Computing Device | 30 | 4.7% |
| Total | 641 | 100.0% |
Internet Access in Montverde
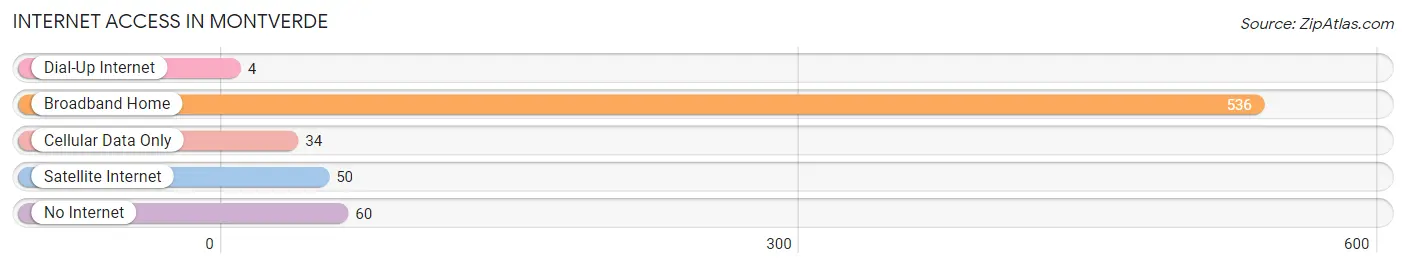
| Internet Type | # Households | % Households |
| Dial-Up Internet | 4 | 0.6% |
| Broadband Home | 536 | 83.6% |
| Cellular Data Only | 34 | 5.3% |
| Satellite Internet | 50 | 7.8% |
| No Internet | 60 | 9.4% |
| Total | 641 | 100.0% |
Montverde Summary
Montverde, Florida is a small town located in Lake County, Florida. It is situated on the eastern shore of Lake Apopka, about 25 miles northwest of Orlando. The town has a population of approximately 1,500 people and is part of the Orlando-Kissimmee-Sanford Metropolitan Statistical Area.
History
Montverde was founded in 1887 by a group of settlers from the Midwest. The town was named after the nearby Montverde Mountains, which were named after the Spanish word for “green mountain.” The town was originally a farming community, and the main crops grown were citrus, cotton, and vegetables.
In the early 1900s, the town began to grow and develop. The first school was built in 1910, and the first post office was established in 1911. The town also had a train station, which was used to transport goods and passengers to and from the nearby cities of Orlando and Sanford.
In the 1920s, the town began to experience a population boom. This was due to the influx of people from the Midwest who were looking for a better life in Florida. The population of Montverde grew to over 1,000 people by the end of the decade.
Geography
Montverde is located in Lake County, Florida. It is situated on the eastern shore of Lake Apopka, about 25 miles northwest of Orlando. The town is surrounded by rolling hills and is located in a rural area. The town is located in a humid subtropical climate zone, with hot, humid summers and mild winters.
Economy
The economy of Montverde is largely based on agriculture. The main crops grown in the area are citrus, cotton, and vegetables. The town also has a few small businesses, such as restaurants, shops, and a gas station.
Demographics
As of the 2010 census, the population of Montverde was 1,521. The racial makeup of the town was 94.3% White, 2.2% African American, 0.3% Native American, 0.7% Asian, 0.1% Pacific Islander, 1.2% from other races, and 1.3% from two or more races. Hispanic or Latino of any race were 4.2% of the population.
The median household income in Montverde was $41,250, and the median family income was $45,625. The per capita income for the town was $19,945. About 11.2% of families and 13.2% of the population were below the poverty line, including 17.2% of those under age 18 and 8.3% of those age 65 or over.
Conclusion
Montverde, Florida is a small town located in Lake County, Florida. It is situated on the eastern shore of Lake Apopka, about 25 miles northwest of Orlando. The town has a population of approximately 1,500 people and is part of the Orlando-Kissimmee-Sanford Metropolitan Statistical Area. The economy of Montverde is largely based on agriculture, and the main crops grown in the area are citrus, cotton, and vegetables. The racial makeup of the town is 94.3% White, 2.2% African American, 0.3% Native American, 0.7% Asian, 0.1% Pacific Islander, 1.2% from other races, and 1.3% from two or more races. The median household income in Montverde was $41,250, and the median family income was $45,625.
Common Questions
What is Per Capita Income in Montverde?
Per Capita income in Montverde is $44,315.
What is the Median Family Income in Montverde?
Median Family Income in Montverde is $106,786.
What is the Median Household income in Montverde?
Median Household Income in Montverde is $97,614.
What is Income or Wage Gap in Montverde?
Income or Wage Gap in Montverde is 34.7%.
Women in Montverde earn 65.3 cents for every dollar earned by a man.
What is Inequality or Gini Index in Montverde?
Inequality or Gini Index in Montverde is 0.36.
What is the Total Population of Montverde?
Total Population of Montverde is 1,782.
What is the Total Male Population of Montverde?
Total Male Population of Montverde is 938.
What is the Total Female Population of Montverde?
Total Female Population of Montverde is 844.
What is the Ratio of Males per 100 Females in Montverde?
There are 111.14 Males per 100 Females in Montverde.
What is the Ratio of Females per 100 Males in Montverde?
There are 89.98 Females per 100 Males in Montverde.
What is the Median Population Age in Montverde?
Median Population Age in Montverde is 45.0 Years.
What is the Average Family Size in Montverde
Average Family Size in Montverde is 3.2 People.
What is the Average Household Size in Montverde
Average Household Size in Montverde is 2.8 People.
How Large is the Labor Force in Montverde?
There are 951 People in the Labor Forcein in Montverde.
What is the Percentage of People in the Labor Force in Montverde?
66.3% of People are in the Labor Force in Montverde.
What is the Unemployment Rate in Montverde?
Unemployment Rate in Montverde is 2.1%.