Yates County, NY Map & Demographics
Yates County Map
Yates County Overview
$32,291
PER CAPITA INCOME
$79,139
AVG FAMILY INCOME
$63,974
AVG HOUSEHOLD INCOME
26.7%
WAGE / INCOME GAP [ % ]
73.3¢/ $1
WAGE / INCOME GAP [ $ ]
$11,928
FAMILY INCOME DEFICIT
0.45
INEQUALITY / GINI INDEX
24,713
TOTAL POPULATION
12,105
MALE POPULATION
12,608
FEMALE POPULATION
96.01
MALES / 100 FEMALES
104.16
FEMALES / 100 MALES
41.7
MEDIAN AGE
3.3
AVG FAMILY SIZE
2.6
AVG HOUSEHOLD SIZE
11,192
LABOR FORCE [ PEOPLE ]
56.3%
PERCENT IN LABOR FORCE
3.2%
UNEMPLOYMENT RATE
Income in Yates County
Income Overview in Yates County
Per Capita Income in Yates County is $32,291, while median incomes of families and households are $79,139 and $63,974 respectively.
| Characteristic | Number | Measure |
| Per Capita Income | 24,713 | $32,291 |
| Median Family Income | 5,780 | $79,139 |
| Mean Family Income | 5,780 | $101,706 |
| Median Household Income | 8,882 | $63,974 |
| Mean Household Income | 8,882 | $84,877 |
| Income Deficit | 5,780 | $11,928 |
| Wage / Income Gap (%) | 24,713 | 26.66% |
| Wage / Income Gap ($) | 24,713 | 73.34¢ per $1 |
| Gini / Inequality Index | 24,713 | 0.45 |
Earnings by Sex in Yates County
Average Earnings in Yates County are $33,864, $38,546 for men and $28,271 for women, a difference of 26.7%.
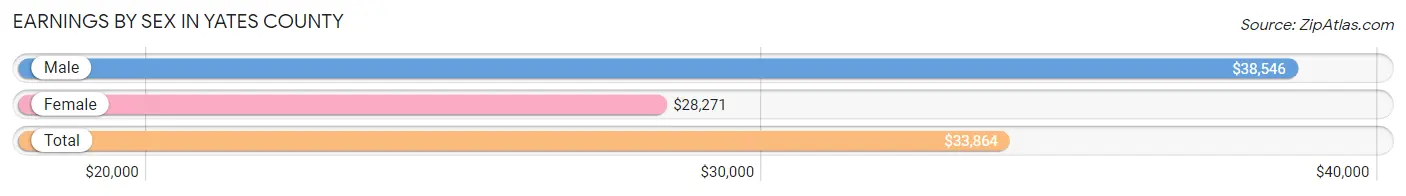
| Sex | Number | Average Earnings |
| Male | 6,509 (53.2%) | $38,546 |
| Female | 5,715 (46.8%) | $28,271 |
| Total | 12,224 (100.0%) | $33,864 |
Earnings by Sex by Income Bracket in Yates County
The most common earnings brackets in Yates County are $100,000+ for men (563 | 8.6%) and $2,499 or less for women (542 | 9.5%).
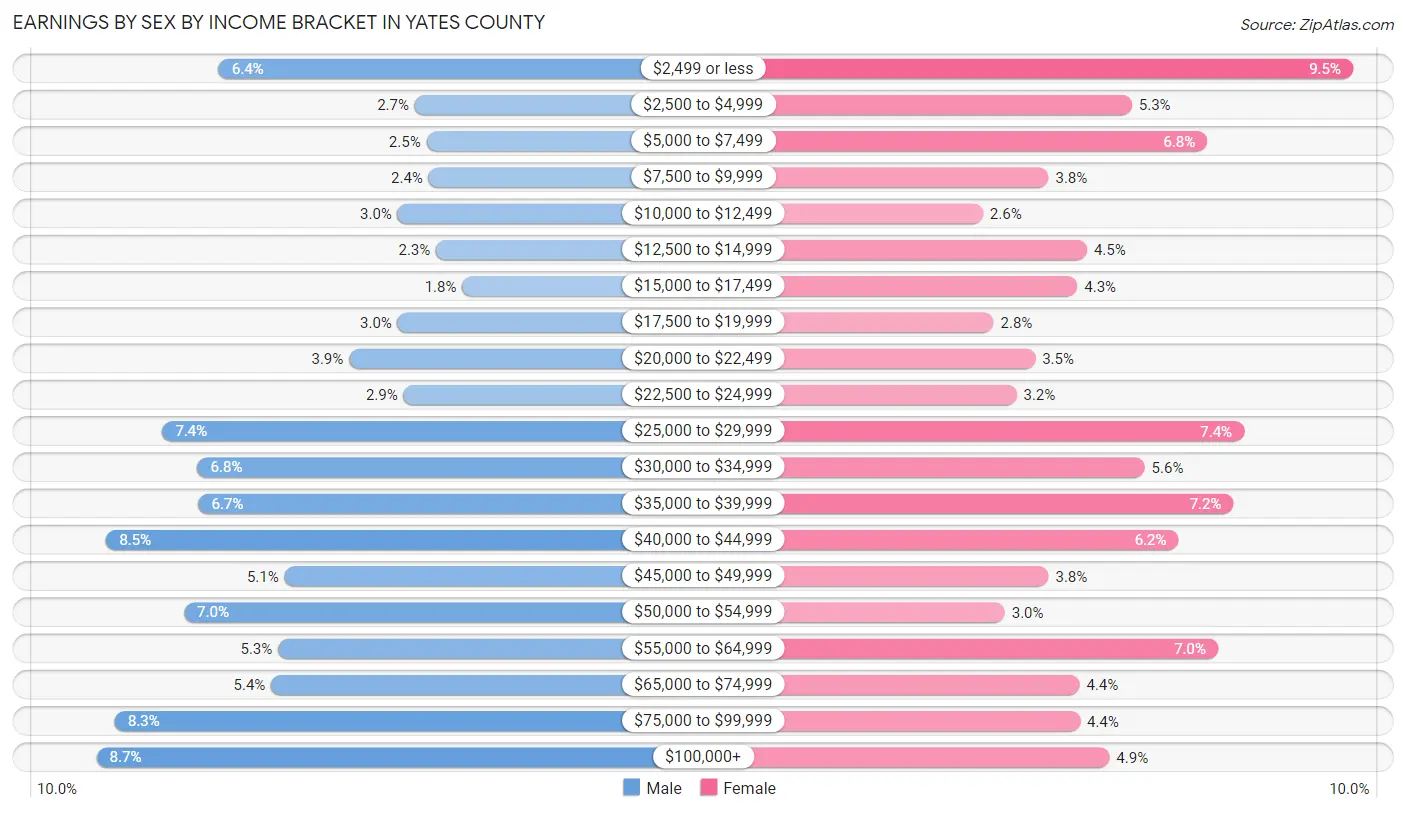
| Income | Male | Female |
| $2,499 or less | 414 (6.4%) | 542 (9.5%) |
| $2,500 to $4,999 | 175 (2.7%) | 305 (5.3%) |
| $5,000 to $7,499 | 161 (2.5%) | 386 (6.8%) |
| $7,500 to $9,999 | 158 (2.4%) | 216 (3.8%) |
| $10,000 to $12,499 | 196 (3.0%) | 146 (2.5%) |
| $12,500 to $14,999 | 149 (2.3%) | 257 (4.5%) |
| $15,000 to $17,499 | 117 (1.8%) | 247 (4.3%) |
| $17,500 to $19,999 | 196 (3.0%) | 157 (2.8%) |
| $20,000 to $22,499 | 255 (3.9%) | 202 (3.5%) |
| $22,500 to $24,999 | 189 (2.9%) | 182 (3.2%) |
| $25,000 to $29,999 | 483 (7.4%) | 425 (7.4%) |
| $30,000 to $34,999 | 440 (6.8%) | 319 (5.6%) |
| $35,000 to $39,999 | 439 (6.7%) | 414 (7.2%) |
| $40,000 to $44,999 | 551 (8.5%) | 355 (6.2%) |
| $45,000 to $49,999 | 334 (5.1%) | 216 (3.8%) |
| $50,000 to $54,999 | 456 (7.0%) | 169 (3.0%) |
| $55,000 to $64,999 | 342 (5.2%) | 397 (7.0%) |
| $65,000 to $74,999 | 350 (5.4%) | 249 (4.4%) |
| $75,000 to $99,999 | 541 (8.3%) | 250 (4.4%) |
| $100,000+ | 563 (8.6%) | 281 (4.9%) |
| Total | 6,509 (100.0%) | 5,715 (100.0%) |
Earnings by Sex by Educational Attainment in Yates County
Average earnings in Yates County are $42,522 for men and $35,058 for women, a difference of 17.5%. Men with an educational attainment of graduate degree enjoy the highest average annual earnings of $70,054, while those with high school diploma education earn the least with $39,964. Women with an educational attainment of graduate degree earn the most with the average annual earnings of $64,271, while those with less than high school education have the smallest earnings of $20,596.
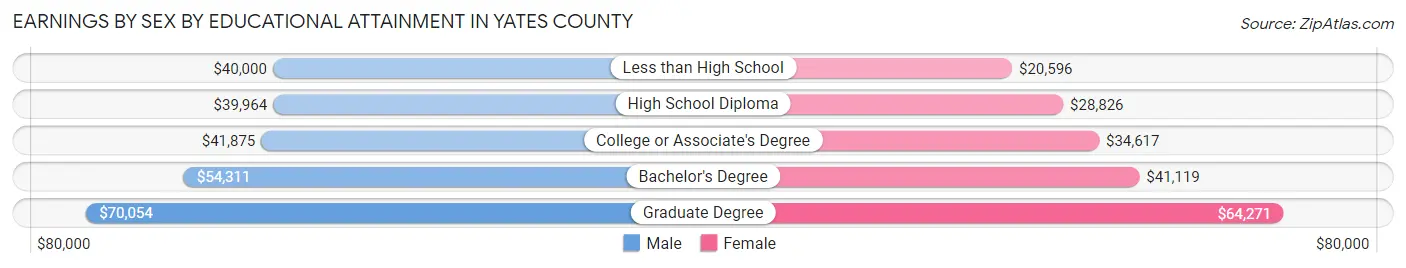
| Educational Attainment | Male Income | Female Income |
| Less than High School | $40,000 | $20,596 |
| High School Diploma | $39,964 | $28,826 |
| College or Associate's Degree | $41,875 | $34,617 |
| Bachelor's Degree | $54,311 | $41,119 |
| Graduate Degree | $70,054 | $64,271 |
| Total | $42,522 | $35,058 |
Family Income in Yates County
Family Income Brackets in Yates County
According to the Yates County family income data, there are 1,225 families falling into the $100,000 to $149,999 income range, which is the most common income bracket and makes up 21.2% of all families. Conversely, the $10,000 to $14,999 income bracket is the least frequent group with only 75 families (1.3%) belonging to this category.
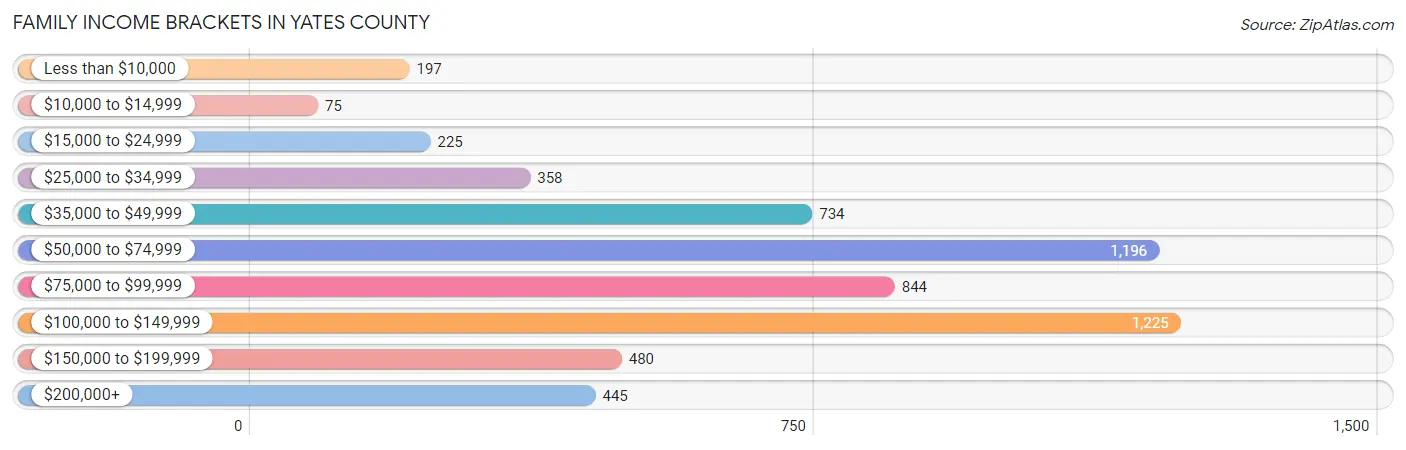
| Income Bracket | # Families | % Families |
| Less than $10,000 | 197 | 3.4% |
| $10,000 to $14,999 | 75 | 1.3% |
| $15,000 to $24,999 | 225 | 3.9% |
| $25,000 to $34,999 | 358 | 6.2% |
| $35,000 to $49,999 | 734 | 12.7% |
| $50,000 to $74,999 | 1,196 | 20.7% |
| $75,000 to $99,999 | 844 | 14.6% |
| $100,000 to $149,999 | 1,225 | 21.2% |
| $150,000 to $199,999 | 480 | 8.3% |
| $200,000+ | 445 | 7.7% |
Family Income by Famaliy Size in Yates County
6-person families (177 | 3.1%) account for the highest median family income in Yates County with $138,125 per family, while 2-person families (3,184 | 55.1%) have the highest median income of $35,390 per family member.
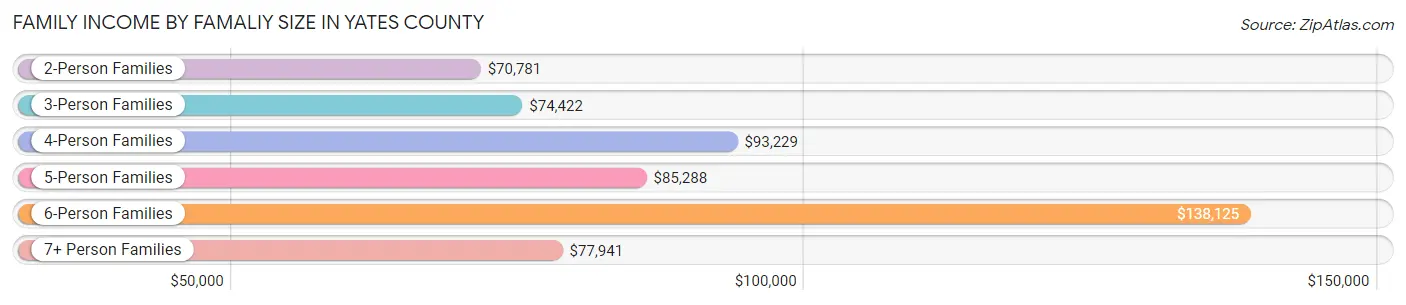
| Income Bracket | # Families | Median Income |
| 2-Person Families | 3,184 (55.1%) | $70,781 |
| 3-Person Families | 971 (16.8%) | $74,422 |
| 4-Person Families | 749 (13.0%) | $93,229 |
| 5-Person Families | 421 (7.3%) | $85,288 |
| 6-Person Families | 177 (3.1%) | $138,125 |
| 7+ Person Families | 278 (4.8%) | $77,941 |
| Total | 5,780 (100.0%) | $79,139 |
Family Income by Number of Earners in Yates County
The median family income in Yates County is $79,139, with families comprising 3+ earners (803) having the highest median family income of $120,625, while families with no earners (1,191) have the lowest median family income of $55,710, accounting for 13.9% and 20.6% of families, respectively.
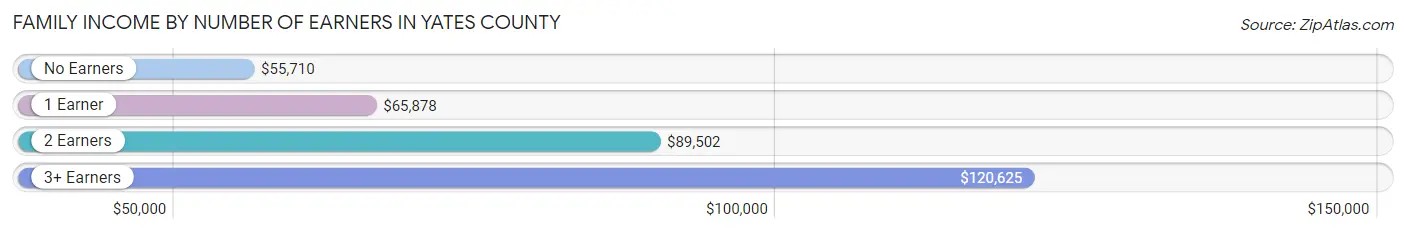
| Number of Earners | # Families | Median Income |
| No Earners | 1,191 (20.6%) | $55,710 |
| 1 Earner | 1,839 (31.8%) | $65,878 |
| 2 Earners | 1,947 (33.7%) | $89,502 |
| 3+ Earners | 803 (13.9%) | $120,625 |
| Total | 5,780 (100.0%) | $79,139 |
Household Income in Yates County
Household Income Brackets in Yates County
With 1,821 households falling in the category, the $50,000 to $74,999 income range is the most frequent in Yates County, accounting for 20.5% of all households. In contrast, only 382 households (4.3%) fall into the $10,000 to $14,999 income bracket, making it the least populous group.
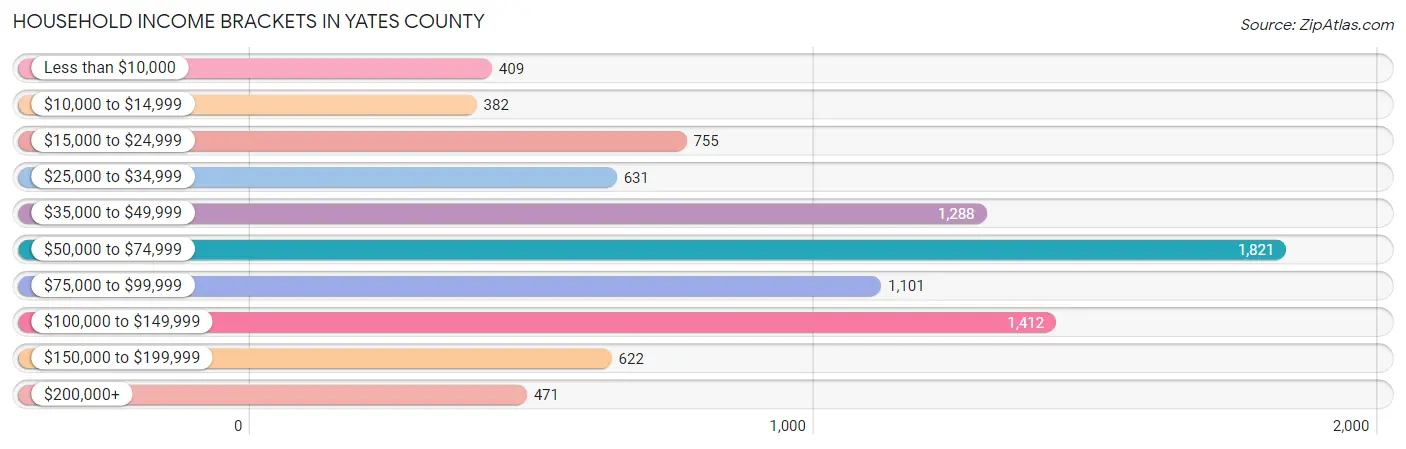
| Income Bracket | # Households | % Households |
| Less than $10,000 | 409 | 4.6% |
| $10,000 to $14,999 | 382 | 4.3% |
| $15,000 to $24,999 | 755 | 8.5% |
| $25,000 to $34,999 | 631 | 7.1% |
| $35,000 to $49,999 | 1,288 | 14.5% |
| $50,000 to $74,999 | 1,821 | 20.5% |
| $75,000 to $99,999 | 1,101 | 12.4% |
| $100,000 to $149,999 | 1,412 | 15.9% |
| $150,000 to $199,999 | 622 | 7.0% |
| $200,000+ | 471 | 5.3% |
Household Income by Householder Age in Yates County
The median household income in Yates County is $63,974, with the highest median household income of $75,444 found in the 45 to 64 years age bracket for the primary householder. A total of 3,340 households (37.6%) fall into this category. Meanwhile, the 15 to 24 years age bracket for the primary householder has the lowest median household income of $29,427, with 308 households (3.5%) in this group.
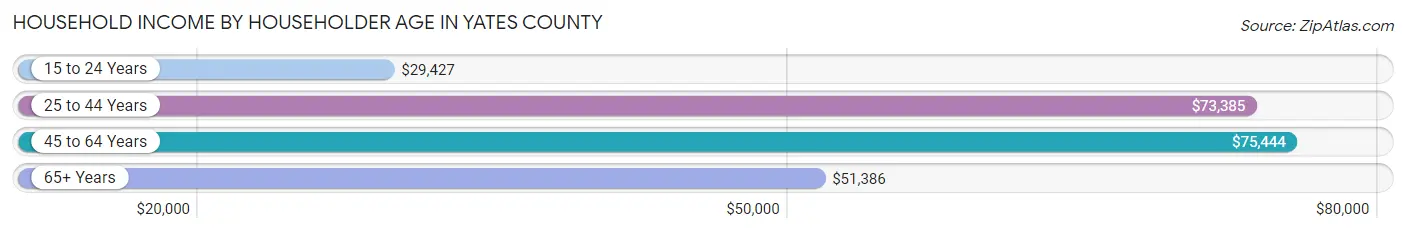
| Income Bracket | # Households | Median Income |
| 15 to 24 Years | 308 (3.5%) | $29,427 |
| 25 to 44 Years | 2,016 (22.7%) | $73,385 |
| 45 to 64 Years | 3,340 (37.6%) | $75,444 |
| 65+ Years | 3,218 (36.2%) | $51,386 |
| Total | 8,882 (100.0%) | $63,974 |
Poverty in Yates County
Income Below Poverty by Sex and Age in Yates County
With 13.5% poverty level for males and 14.9% for females among the residents of Yates County, 5 year old males and 6 to 11 year old females are the most vulnerable to poverty, with 37 males (34.3%) and 270 females (27.4%) in their respective age groups living below the poverty level.
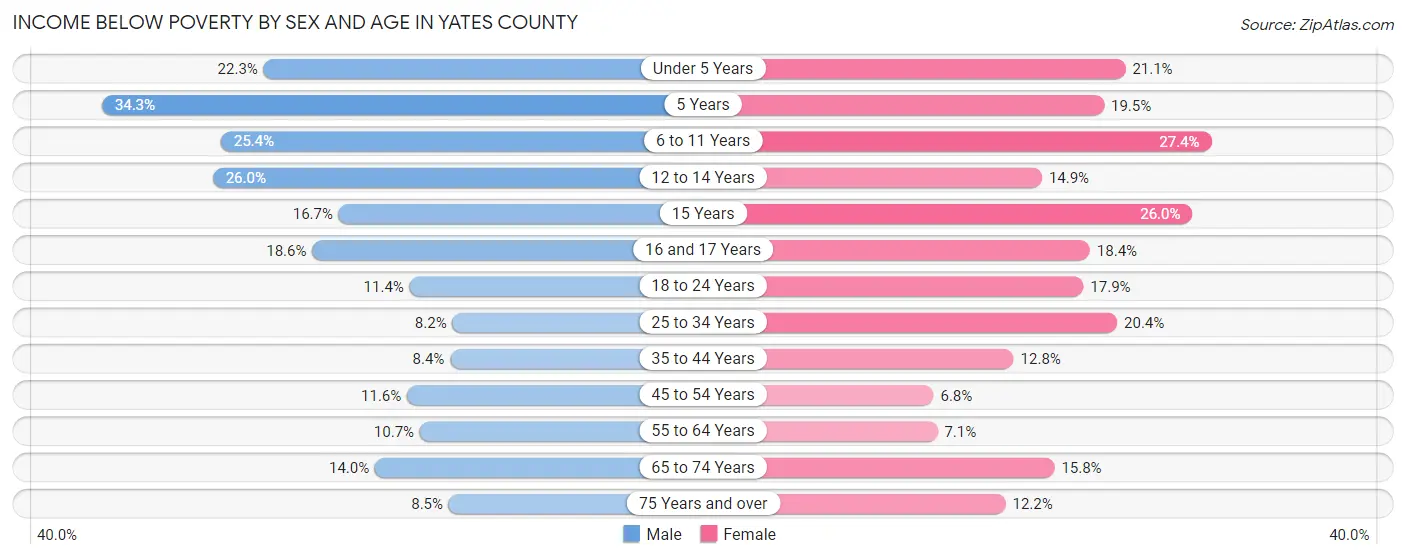
| Age Bracket | Male | Female |
| Under 5 Years | 176 (22.3%) | 143 (21.1%) |
| 5 Years | 37 (34.3%) | 22 (19.5%) |
| 6 to 11 Years | 235 (25.4%) | 270 (27.4%) |
| 12 to 14 Years | 95 (26.0%) | 63 (14.9%) |
| 15 Years | 23 (16.7%) | 51 (26.0%) |
| 16 and 17 Years | 55 (18.6%) | 56 (18.4%) |
| 18 to 24 Years | 98 (11.4%) | 157 (17.9%) |
| 25 to 34 Years | 115 (8.2%) | 259 (20.4%) |
| 35 to 44 Years | 97 (8.4%) | 151 (12.8%) |
| 45 to 54 Years | 150 (11.6%) | 88 (6.8%) |
| 55 to 64 Years | 191 (10.6%) | 141 (7.1%) |
| 65 to 74 Years | 220 (14.0%) | 248 (15.8%) |
| 75 Years and over | 78 (8.5%) | 128 (12.2%) |
| Total | 1,570 (13.5%) | 1,777 (14.9%) |
Income Above Poverty by Sex and Age in Yates County
According to the poverty statistics in Yates County, males aged 25 to 34 years and females aged 45 to 54 years are the age groups that are most secure financially, with 91.8% of males and 93.2% of females in these age groups living above the poverty line.
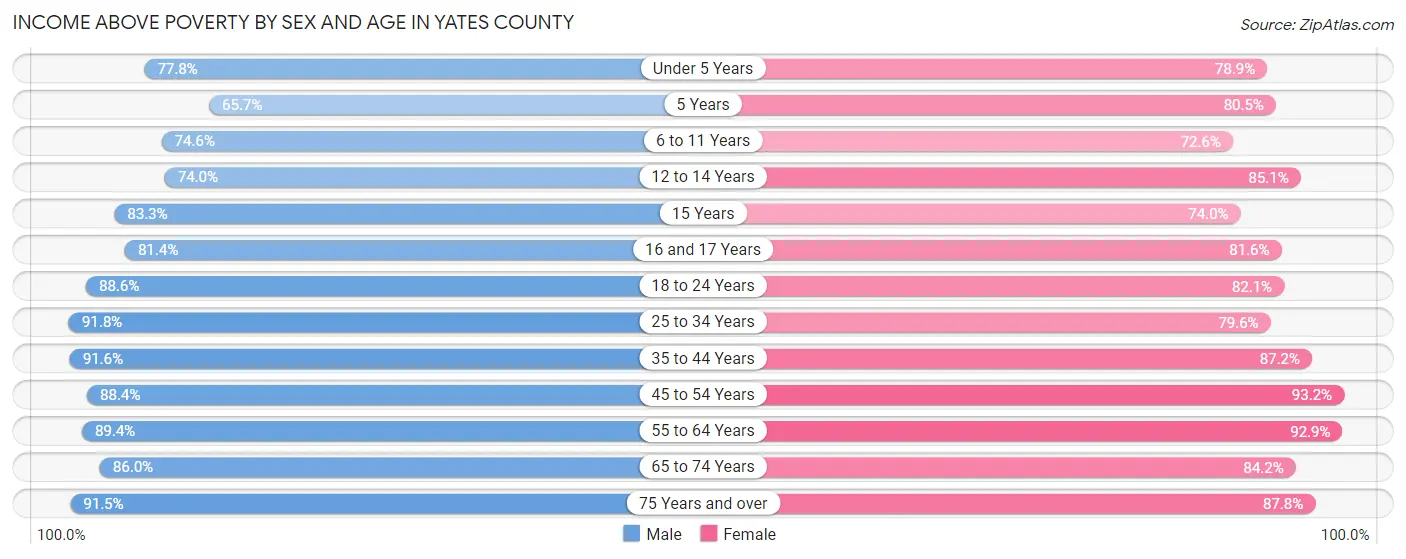
| Age Bracket | Male | Female |
| Under 5 Years | 615 (77.7%) | 536 (78.9%) |
| 5 Years | 71 (65.7%) | 91 (80.5%) |
| 6 to 11 Years | 689 (74.6%) | 714 (72.6%) |
| 12 to 14 Years | 270 (74.0%) | 361 (85.1%) |
| 15 Years | 115 (83.3%) | 145 (74.0%) |
| 16 and 17 Years | 240 (81.4%) | 248 (81.6%) |
| 18 to 24 Years | 761 (88.6%) | 718 (82.1%) |
| 25 to 34 Years | 1,283 (91.8%) | 1,008 (79.6%) |
| 35 to 44 Years | 1,058 (91.6%) | 1,032 (87.2%) |
| 45 to 54 Years | 1,143 (88.4%) | 1,204 (93.2%) |
| 55 to 64 Years | 1,602 (89.3%) | 1,844 (92.9%) |
| 65 to 74 Years | 1,354 (86.0%) | 1,323 (84.2%) |
| 75 Years and over | 840 (91.5%) | 925 (87.8%) |
| Total | 10,041 (86.5%) | 10,149 (85.1%) |
Income Below Poverty Among Married-Couple Families in Yates County
The poverty statistics for married-couple families in Yates County show that 7.1% or 336 of the total 4,753 families live below the poverty line. Families with 5 or more children have the highest poverty rate of 33.9%, comprising of 76 families. On the other hand, families with no children have the lowest poverty rate of 3.4%, which includes 108 families.
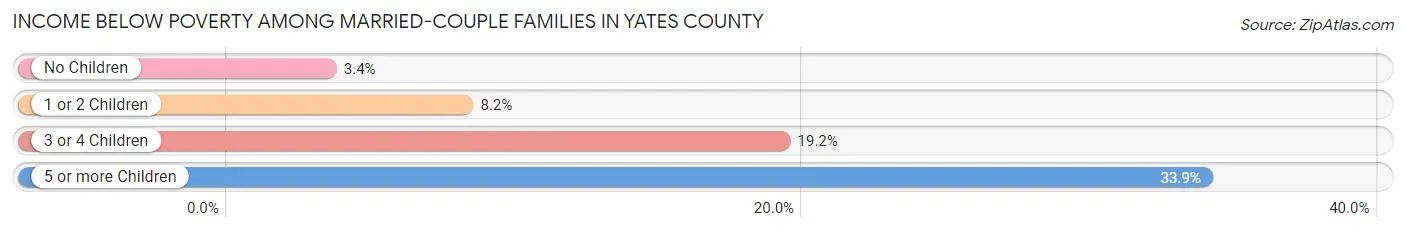
| Children | Above Poverty | Below Poverty |
| No Children | 3,029 (96.6%) | 108 (3.4%) |
| 1 or 2 Children | 963 (91.8%) | 86 (8.2%) |
| 3 or 4 Children | 277 (80.8%) | 66 (19.2%) |
| 5 or more Children | 148 (66.1%) | 76 (33.9%) |
| Total | 4,417 (92.9%) | 336 (7.1%) |
Income Below Poverty Among Single-Parent Households in Yates County
According to the poverty data in Yates County, 8.1% or 23 single-father households and 24.0% or 178 single-mother households are living below the poverty line. Among single-father households, those with no children have the highest poverty rate, with 23 households (25.3%) experiencing poverty. Likewise, among single-mother households, those with 5 or more children have the highest poverty rate, with 16 households (100.0%) falling below the poverty line.
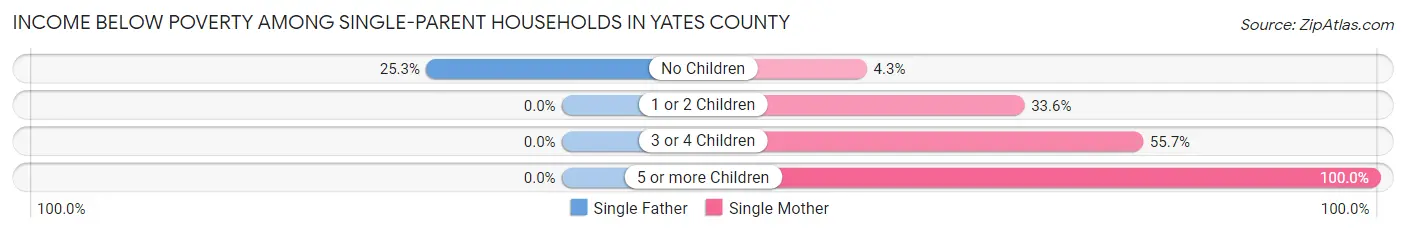
| Children | Single Father | Single Mother |
| No Children | 23 (25.3%) | 14 (4.3%) |
| 1 or 2 Children | 0 (0.0%) | 114 (33.6%) |
| 3 or 4 Children | 0 (0.0%) | 34 (55.7%) |
| 5 or more Children | 0 (0.0%) | 16 (100.0%) |
| Total | 23 (8.1%) | 178 (24.0%) |
Income Below Poverty Among Married-Couple vs Single-Parent Households in Yates County
The poverty data for Yates County shows that 336 of the married-couple family households (7.1%) and 201 of the single-parent households (19.6%) are living below the poverty level. Within the married-couple family households, those with 5 or more children have the highest poverty rate, with 76 households (33.9%) falling below the poverty line. Among the single-parent households, those with 5 or more children have the highest poverty rate, with 16 household (100.0%) living below poverty.
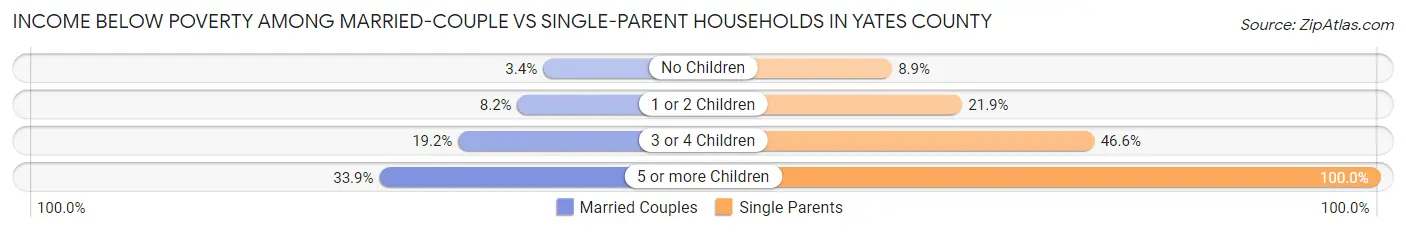
| Children | Married-Couple Families | Single-Parent Households |
| No Children | 108 (3.4%) | 37 (8.8%) |
| 1 or 2 Children | 86 (8.2%) | 114 (21.9%) |
| 3 or 4 Children | 66 (19.2%) | 34 (46.6%) |
| 5 or more Children | 76 (33.9%) | 16 (100.0%) |
| Total | 336 (7.1%) | 201 (19.6%) |
Race in Yates County
The most populous races in Yates County are White / Caucasian (23,683 | 95.8%), Hispanic or Latino (544 | 2.2%), and Two or more Races (454 | 1.8%).
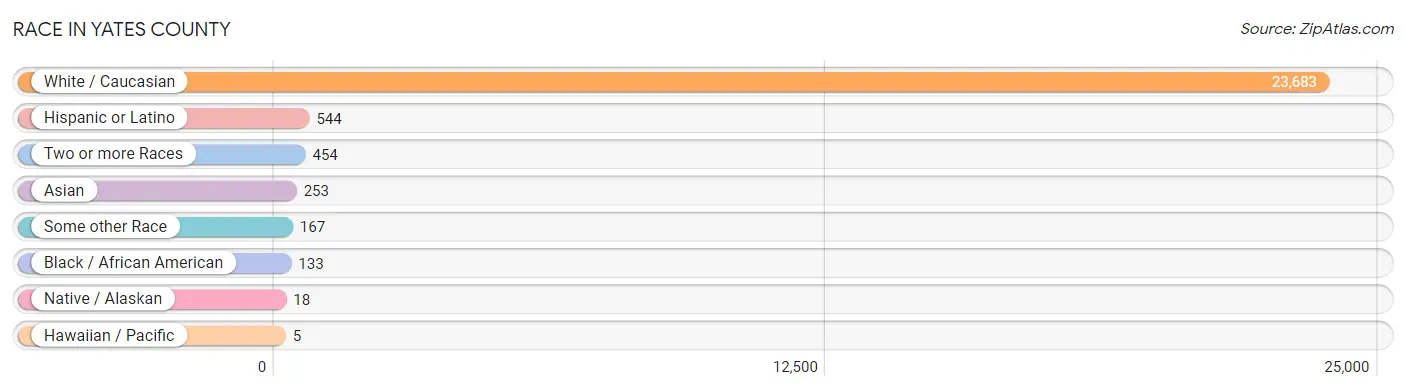
| Race | # Population | % Population |
| Asian | 253 | 1.0% |
| Black / African American | 133 | 0.5% |
| Hawaiian / Pacific | 5 | 0.0% |
| Hispanic or Latino | 544 | 2.2% |
| Native / Alaskan | 18 | 0.1% |
| White / Caucasian | 23,683 | 95.8% |
| Two or more Races | 454 | 1.8% |
| Some other Race | 167 | 0.7% |
| Total | 24,713 | 100.0% |
Ancestry in Yates County
The most populous ancestries reported in Yates County are German (4,833 | 19.6%), English (3,492 | 14.1%), Irish (2,804 | 11.4%), American (1,592 | 6.4%), and Italian (1,465 | 5.9%), together accounting for 57.4% of all Yates County residents.
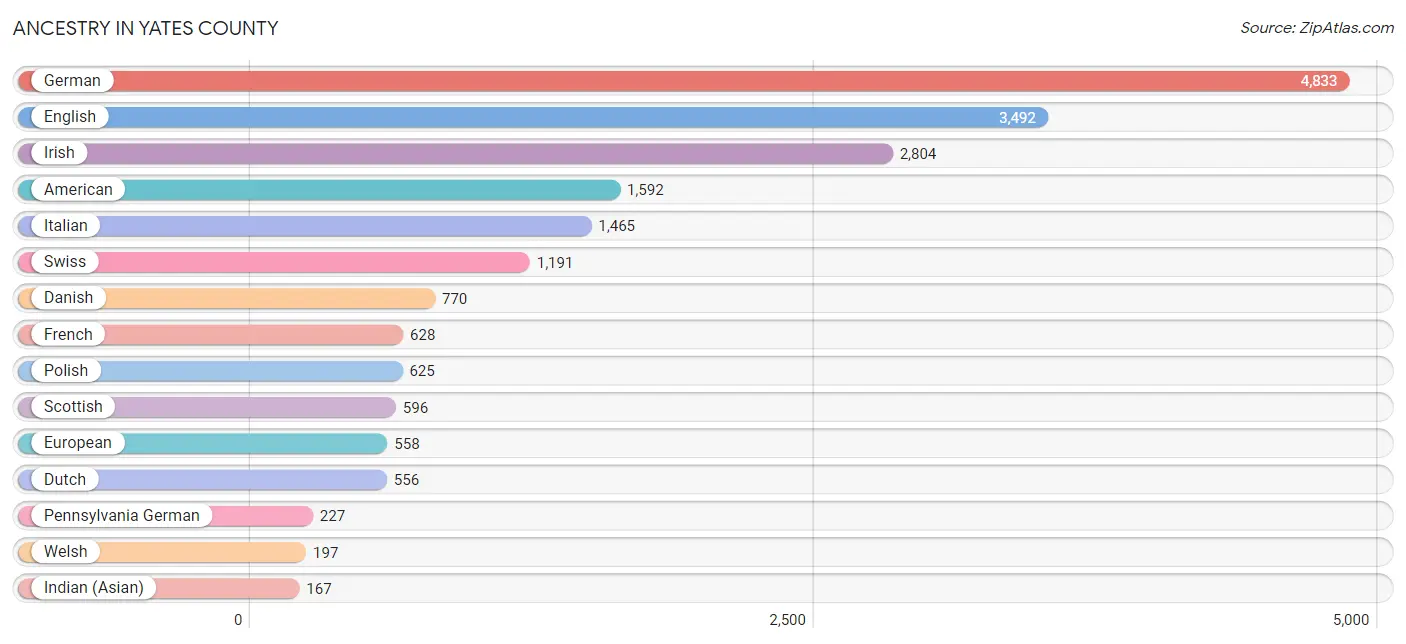
| Ancestry | # Population | % Population |
| Afghan | 1 | 0.0% |
| Albanian | 10 | 0.0% |
| American | 1,592 | 6.4% |
| Arab | 24 | 0.1% |
| Austrian | 32 | 0.1% |
| Belgian | 7 | 0.0% |
| Bhutanese | 2 | 0.0% |
| Blackfeet | 14 | 0.1% |
| Brazilian | 5 | 0.0% |
| British | 56 | 0.2% |
| Burmese | 4 | 0.0% |
| Cajun | 6 | 0.0% |
| Canadian | 38 | 0.2% |
| Central American | 34 | 0.1% |
| Cherokee | 34 | 0.1% |
| Chilean | 26 | 0.1% |
| Colombian | 17 | 0.1% |
| Croatian | 4 | 0.0% |
| Cuban | 14 | 0.1% |
| Czech | 40 | 0.2% |
| Czechoslovakian | 5 | 0.0% |
| Danish | 770 | 3.1% |
| Dominican | 20 | 0.1% |
| Dutch | 556 | 2.2% |
| Eastern European | 43 | 0.2% |
| Ecuadorian | 29 | 0.1% |
| Egyptian | 6 | 0.0% |
| English | 3,492 | 14.1% |
| European | 558 | 2.3% |
| Finnish | 7 | 0.0% |
| French | 628 | 2.5% |
| French Canadian | 146 | 0.6% |
| German | 4,833 | 19.6% |
| German Russian | 1 | 0.0% |
| Greek | 113 | 0.5% |
| Honduran | 26 | 0.1% |
| Hungarian | 34 | 0.1% |
| Indian (Asian) | 167 | 0.7% |
| Irish | 2,804 | 11.4% |
| Iroquois | 40 | 0.2% |
| Italian | 1,465 | 5.9% |
| Korean | 78 | 0.3% |
| Latvian | 2 | 0.0% |
| Lebanese | 3 | 0.0% |
| Lithuanian | 21 | 0.1% |
| Macedonian | 4 | 0.0% |
| Maltese | 2 | 0.0% |
| Mexican | 167 | 0.7% |
| Northern European | 35 | 0.1% |
| Norwegian | 42 | 0.2% |
| Pennsylvania German | 227 | 0.9% |
| Peruvian | 4 | 0.0% |
| Polish | 625 | 2.5% |
| Portuguese | 89 | 0.4% |
| Puerto Rican | 105 | 0.4% |
| Romanian | 7 | 0.0% |
| Russian | 37 | 0.2% |
| Salvadoran | 8 | 0.0% |
| Samoan | 5 | 0.0% |
| Scandinavian | 62 | 0.3% |
| Scotch-Irish | 63 | 0.3% |
| Scottish | 596 | 2.4% |
| Slavic | 43 | 0.2% |
| Slovak | 20 | 0.1% |
| South American | 76 | 0.3% |
| Spaniard | 23 | 0.1% |
| Sri Lankan | 8 | 0.0% |
| Subsaharan African | 7 | 0.0% |
| Swedish | 117 | 0.5% |
| Swiss | 1,191 | 4.8% |
| Syrian | 15 | 0.1% |
| Ukrainian | 43 | 0.2% |
| Welsh | 197 | 0.8% | View All 73 Rows |
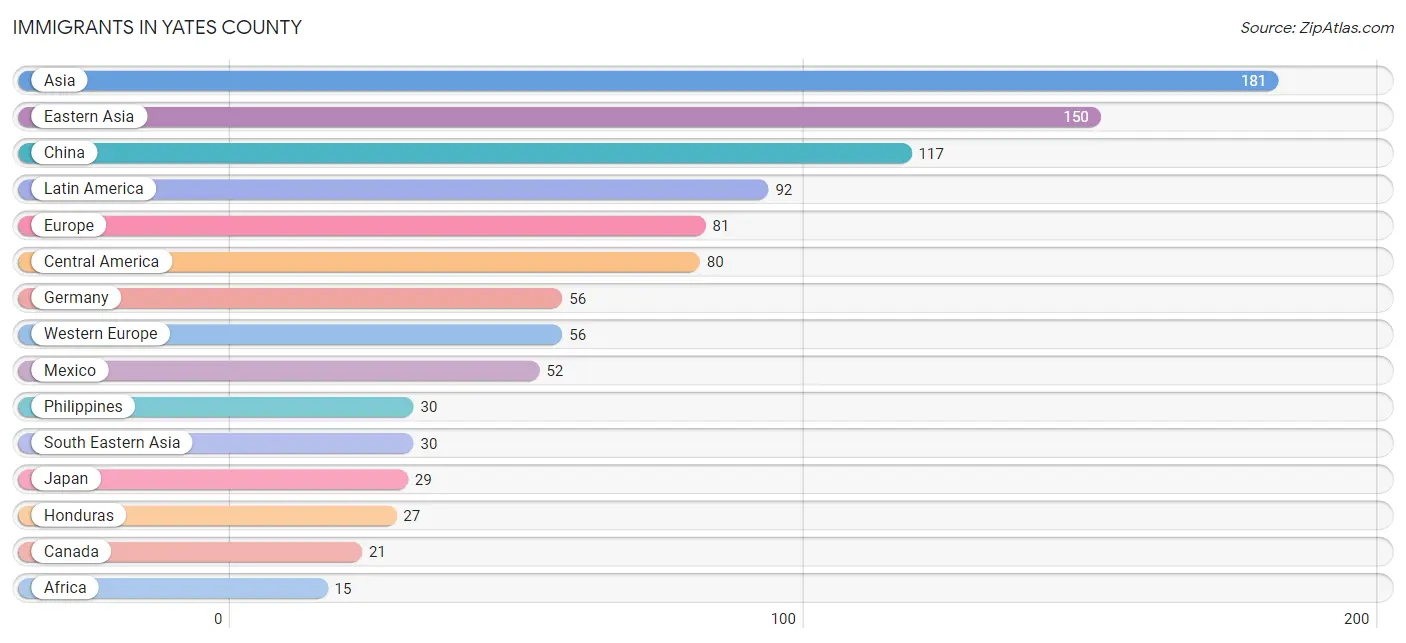
Immigrants in Yates County
The most numerous immigrant groups reported in Yates County came from Asia (181 | 0.7%), Eastern Asia (150 | 0.6%), China (117 | 0.5%), Latin America (92 | 0.4%), and Europe (81 | 0.3%), together accounting for 2.5% of all Yates County residents.
| Immigration Origin | # Population | % Population |
| Afghanistan | 1 | 0.0% |
| Africa | 15 | 0.1% |
| Asia | 181 | 0.7% |
| Canada | 21 | 0.1% |
| Central America | 80 | 0.3% |
| Chile | 8 | 0.0% |
| China | 117 | 0.5% |
| Eastern Asia | 150 | 0.6% |
| Eastern Europe | 9 | 0.0% |
| Egypt | 8 | 0.0% |
| El Salvador | 1 | 0.0% |
| Europe | 81 | 0.3% |
| Germany | 56 | 0.2% |
| Guyana | 2 | 0.0% |
| Honduras | 27 | 0.1% |
| Ireland | 2 | 0.0% |
| Italy | 14 | 0.1% |
| Japan | 29 | 0.1% |
| Korea | 4 | 0.0% |
| Latin America | 92 | 0.4% |
| Mexico | 52 | 0.2% |
| Middle Africa | 7 | 0.0% |
| Northern Africa | 8 | 0.0% |
| Northern Europe | 2 | 0.0% |
| Peru | 2 | 0.0% |
| Philippines | 30 | 0.1% |
| Poland | 2 | 0.0% |
| Romania | 7 | 0.0% |
| South America | 12 | 0.1% |
| South Central Asia | 1 | 0.0% |
| South Eastern Asia | 30 | 0.1% |
| Southern Europe | 14 | 0.1% |
| Western Europe | 56 | 0.2% |
| Zaire | 7 | 0.0% | View All 34 Rows |
Sex and Age in Yates County
Sex and Age in Yates County
The most populous age groups in Yates County are 55 to 59 Years (1,007 | 8.3%) for men and 60 to 64 Years (1,066 | 8.5%) for women.
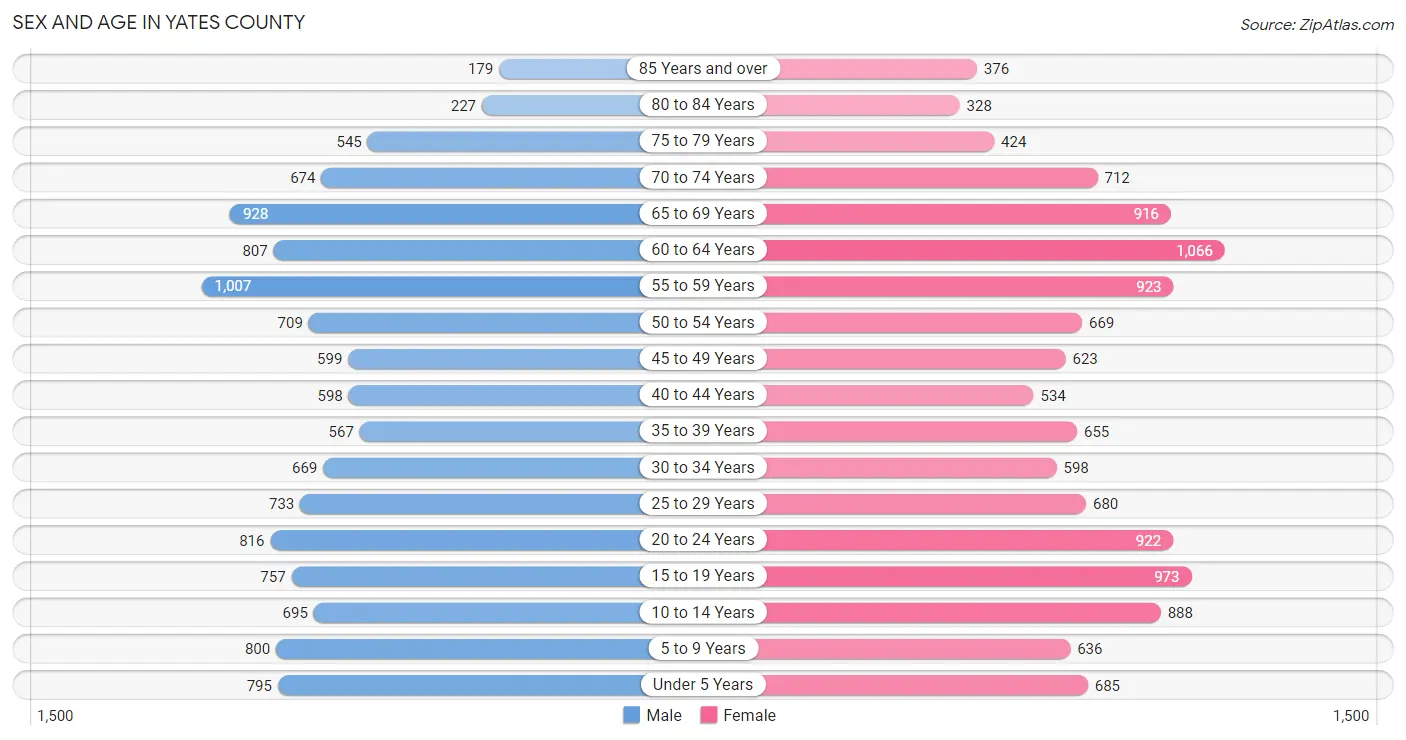
| Age Bracket | Male | Female |
| Under 5 Years | 795 (6.6%) | 685 (5.4%) |
| 5 to 9 Years | 800 (6.6%) | 636 (5.0%) |
| 10 to 14 Years | 695 (5.7%) | 888 (7.0%) |
| 15 to 19 Years | 757 (6.2%) | 973 (7.7%) |
| 20 to 24 Years | 816 (6.7%) | 922 (7.3%) |
| 25 to 29 Years | 733 (6.1%) | 680 (5.4%) |
| 30 to 34 Years | 669 (5.5%) | 598 (4.7%) |
| 35 to 39 Years | 567 (4.7%) | 655 (5.2%) |
| 40 to 44 Years | 598 (4.9%) | 534 (4.2%) |
| 45 to 49 Years | 599 (5.0%) | 623 (4.9%) |
| 50 to 54 Years | 709 (5.9%) | 669 (5.3%) |
| 55 to 59 Years | 1,007 (8.3%) | 923 (7.3%) |
| 60 to 64 Years | 807 (6.7%) | 1,066 (8.5%) |
| 65 to 69 Years | 928 (7.7%) | 916 (7.3%) |
| 70 to 74 Years | 674 (5.6%) | 712 (5.7%) |
| 75 to 79 Years | 545 (4.5%) | 424 (3.4%) |
| 80 to 84 Years | 227 (1.9%) | 328 (2.6%) |
| 85 Years and over | 179 (1.5%) | 376 (3.0%) |
| Total | 12,105 (100.0%) | 12,608 (100.0%) |
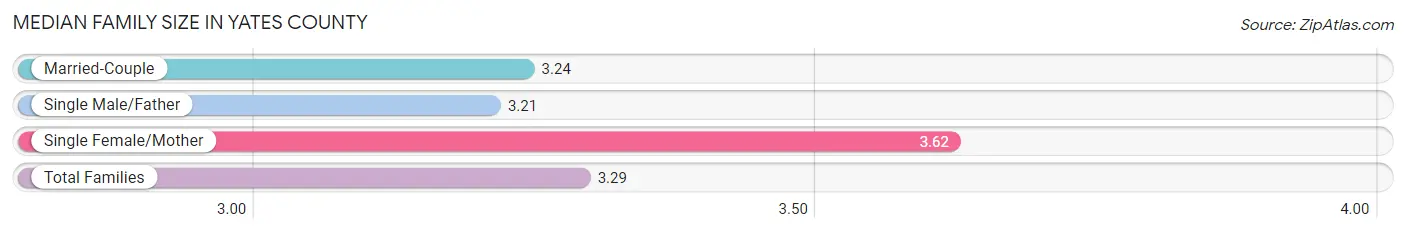
Families and Households in Yates County
Median Family Size in Yates County
The median family size in Yates County is 3.29 persons per family, with single female/mother families (743 | 12.9%) accounting for the largest median family size of 3.62 persons per family. On the other hand, single male/father families (284 | 4.9%) represent the smallest median family size with 3.21 persons per family.
| Family Type | # Families | Family Size |
| Married-Couple | 4,753 (82.2%) | 3.24 |
| Single Male/Father | 284 (4.9%) | 3.21 |
| Single Female/Mother | 743 (12.9%) | 3.62 |
| Total Families | 5,780 (100.0%) | 3.29 |
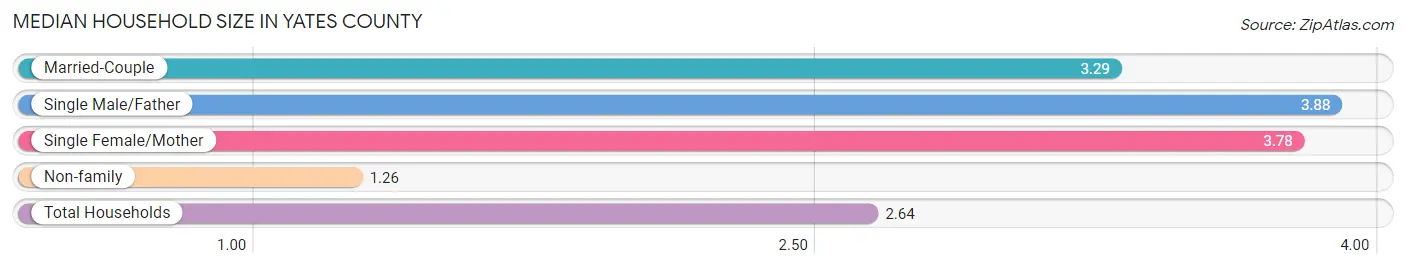
Median Household Size in Yates County
The median household size in Yates County is 2.64 persons per household, with single male/father households (284 | 3.2%) accounting for the largest median household size of 3.88 persons per household. non-family households (3,102 | 34.9%) represent the smallest median household size with 1.26 persons per household.
| Household Type | # Households | Household Size |
| Married-Couple | 4,753 (53.5%) | 3.29 |
| Single Male/Father | 284 (3.2%) | 3.88 |
| Single Female/Mother | 743 (8.4%) | 3.78 |
| Non-family | 3,102 (34.9%) | 1.26 |
| Total Households | 8,882 (100.0%) | 2.64 |
Household Size by Marriage Status in Yates County
Out of a total of 8,882 households in Yates County, 5,780 (65.1%) are family households, while 3,102 (34.9%) are nonfamily households. The most numerous type of family households are 2-person households, comprising 3,046, and the most common type of nonfamily households are 1-person households, comprising 2,635.
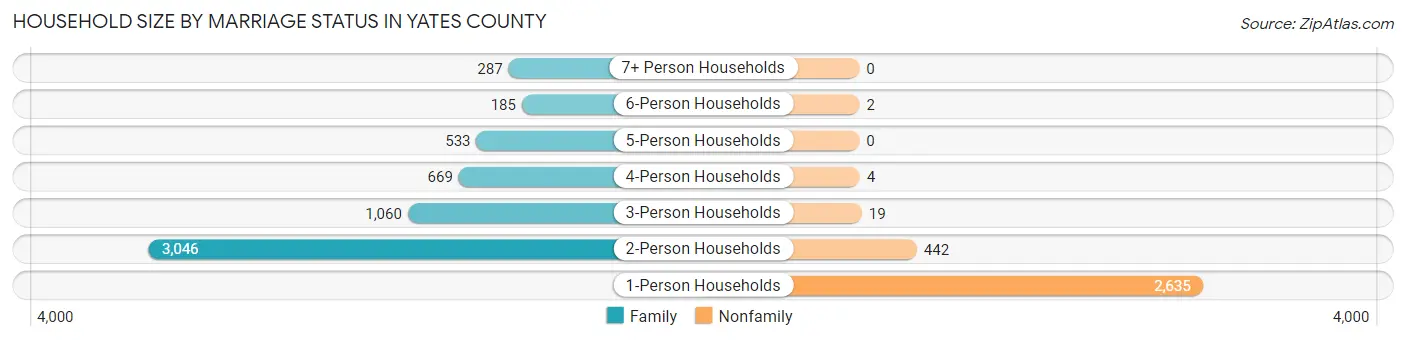
| Household Size | Family Households | Nonfamily Households |
| 1-Person Households | - | 2,635 (29.7%) |
| 2-Person Households | 3,046 (34.3%) | 442 (5.0%) |
| 3-Person Households | 1,060 (11.9%) | 19 (0.2%) |
| 4-Person Households | 669 (7.5%) | 4 (0.1%) |
| 5-Person Households | 533 (6.0%) | 0 (0.0%) |
| 6-Person Households | 185 (2.1%) | 2 (0.0%) |
| 7+ Person Households | 287 (3.2%) | 0 (0.0%) |
| Total | 5,780 (65.1%) | 3,102 (34.9%) |
Female Fertility in Yates County
Fertility by Age in Yates County
Average fertility rate in Yates County is 73.0 births per 1,000 women. Women in the age bracket of 20 to 34 years have the highest fertility rate with 140.0 births per 1,000 women. Women in the age bracket of 20 to 34 years acount for 83.2% of all women with births.
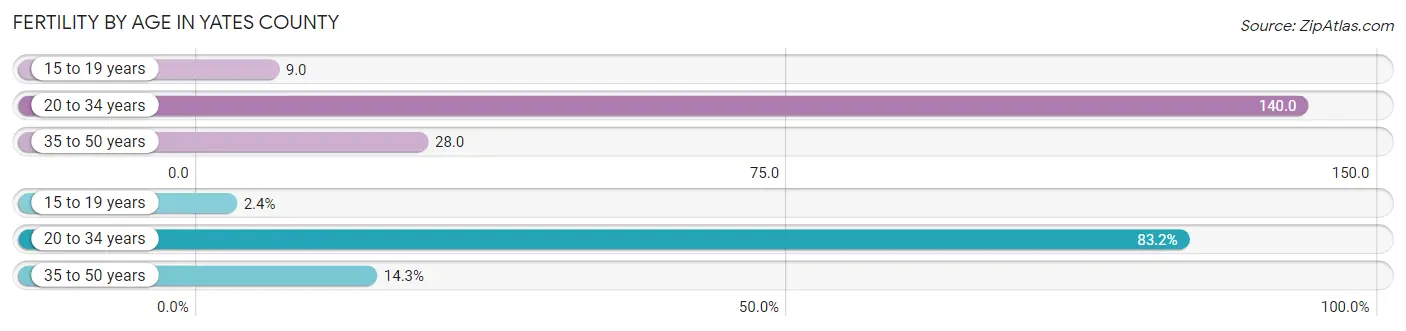
| Age Bracket | Women with Births | Births / 1,000 Women |
| 15 to 19 years | 9 (2.4%) | 9.0 |
| 20 to 34 years | 308 (83.2%) | 140.0 |
| 35 to 50 years | 53 (14.3%) | 28.0 |
| Total | 370 (100.0%) | 73.0 |
Fertility by Age by Marriage Status in Yates County
83.2% of women with births (370) in Yates County are married. The highest percentage of unmarried women with births falls into 15 to 19 years age bracket with 100.0% of them unmarried at the time of birth, while the lowest percentage of unmarried women with births belong to 20 to 34 years age bracket with 10.1% of them unmarried.
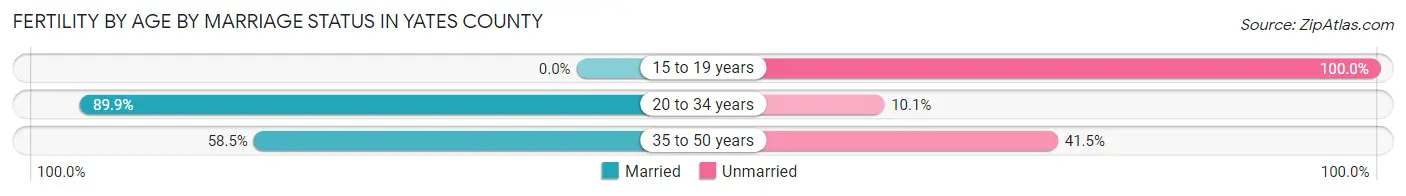
| Age Bracket | Married | Unmarried |
| 15 to 19 years | 0 (0.0%) | 9 (100.0%) |
| 20 to 34 years | 277 (89.9%) | 31 (10.1%) |
| 35 to 50 years | 31 (58.5%) | 22 (41.5%) |
| Total | 308 (83.2%) | 62 (16.8%) |
Fertility by Education in Yates County
Average fertility rate in Yates County is 73.0 births per 1,000 women. Women with the education attainment of bachelor's degree have the highest fertility rate of 157.0 births per 1,000 women, while women with the education attainment of college or associate's degree have the lowest fertility at 44.0 births per 1,000 women. Women with the education attainment of less than high school represent 35.7% of all women with births.
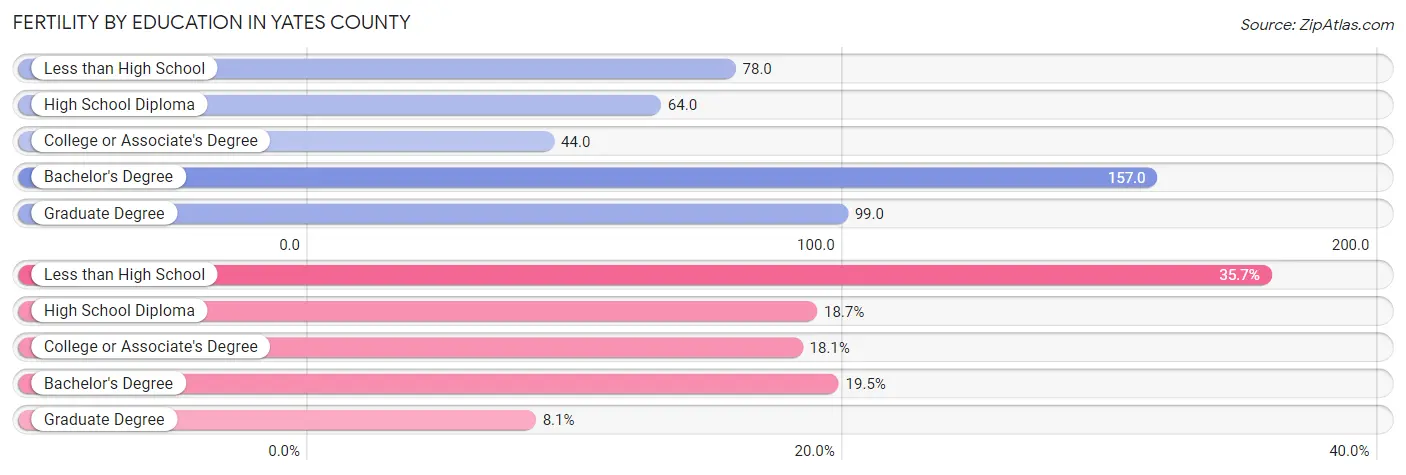
| Educational Attainment | Women with Births | Births / 1,000 Women |
| Less than High School | 132 (35.7%) | 78.0 |
| High School Diploma | 69 (18.6%) | 64.0 |
| College or Associate's Degree | 67 (18.1%) | 44.0 |
| Bachelor's Degree | 72 (19.5%) | 157.0 |
| Graduate Degree | 30 (8.1%) | 99.0 |
| Total | 370 (100.0%) | 73.0 |
Fertility by Education by Marriage Status in Yates County
16.8% of women with births in Yates County are unmarried. Women with the educational attainment of less than high school are most likely to be married with 97.0% of them married at childbirth, while women with the educational attainment of high school diploma are least likely to be married with 34.8% of them unmarried at childbirth.
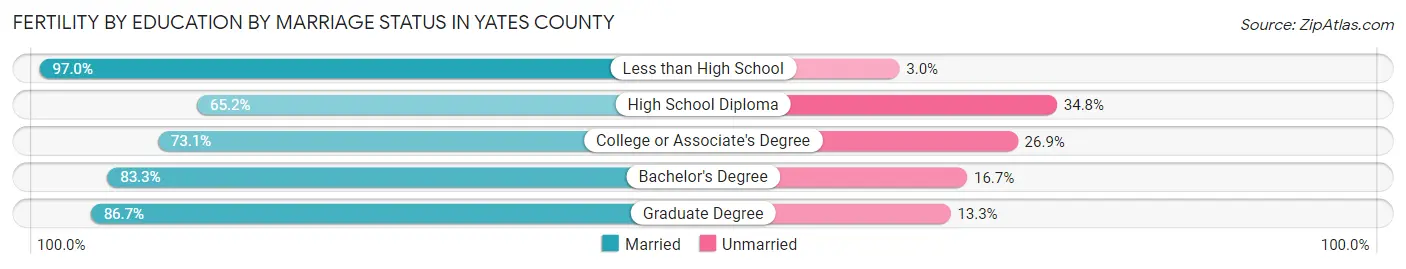
| Educational Attainment | Married | Unmarried |
| Less than High School | 128 (97.0%) | 4 (3.0%) |
| High School Diploma | 45 (65.2%) | 24 (34.8%) |
| College or Associate's Degree | 49 (73.1%) | 18 (26.9%) |
| Bachelor's Degree | 60 (83.3%) | 12 (16.7%) |
| Graduate Degree | 26 (86.7%) | 4 (13.3%) |
| Total | 308 (83.2%) | 62 (16.8%) |
Employment Characteristics in Yates County
Employment by Class of Employer in Yates County
Among the 10,662 employed individuals in Yates County, private company employees (5,726 | 53.7%), self-employed (not incorporated) (1,640 | 15.4%), and not-for-profit organizations (1,518 | 14.2%) make up the most common classes of employment.
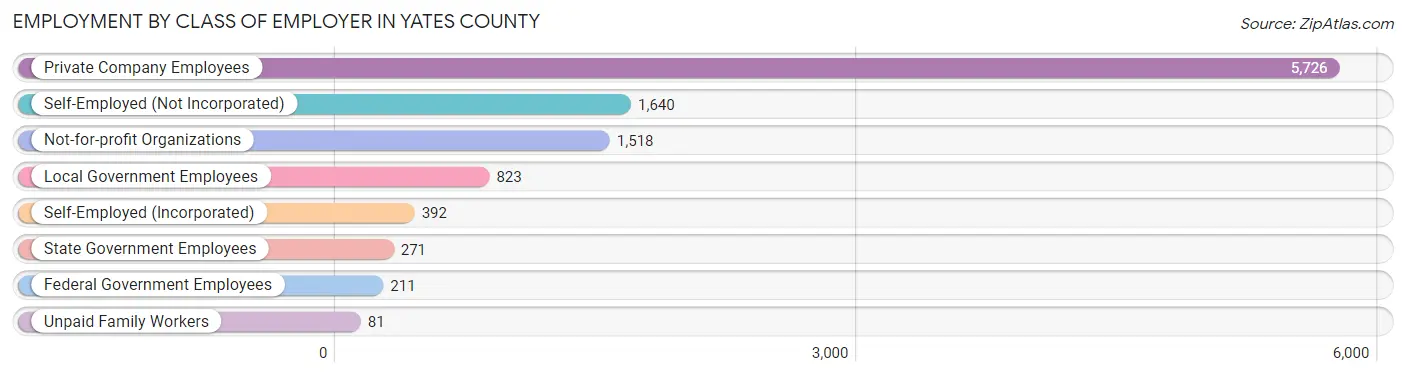
| Employer Class | # Employees | % Employees |
| Private Company Employees | 5,726 | 53.7% |
| Self-Employed (Incorporated) | 392 | 3.7% |
| Self-Employed (Not Incorporated) | 1,640 | 15.4% |
| Not-for-profit Organizations | 1,518 | 14.2% |
| Local Government Employees | 823 | 7.7% |
| State Government Employees | 271 | 2.5% |
| Federal Government Employees | 211 | 2.0% |
| Unpaid Family Workers | 81 | 0.8% |
| Total | 10,662 | 100.0% |
Employment Status by Age in Yates County
According to the labor force statistics for Yates County, out of the total population over 16 years of age (19,880), 56.3% or 11,192 individuals are in the labor force, with 3.2% or 358 of them unemployed. The age group with the highest labor force participation rate is 35 to 44 years, with 84.0% or 1,977 individuals in the labor force. Within the labor force, the 16 to 19 years age range has the highest percentage of unemployed individuals, with 10.4% or 76 of them being unemployed.
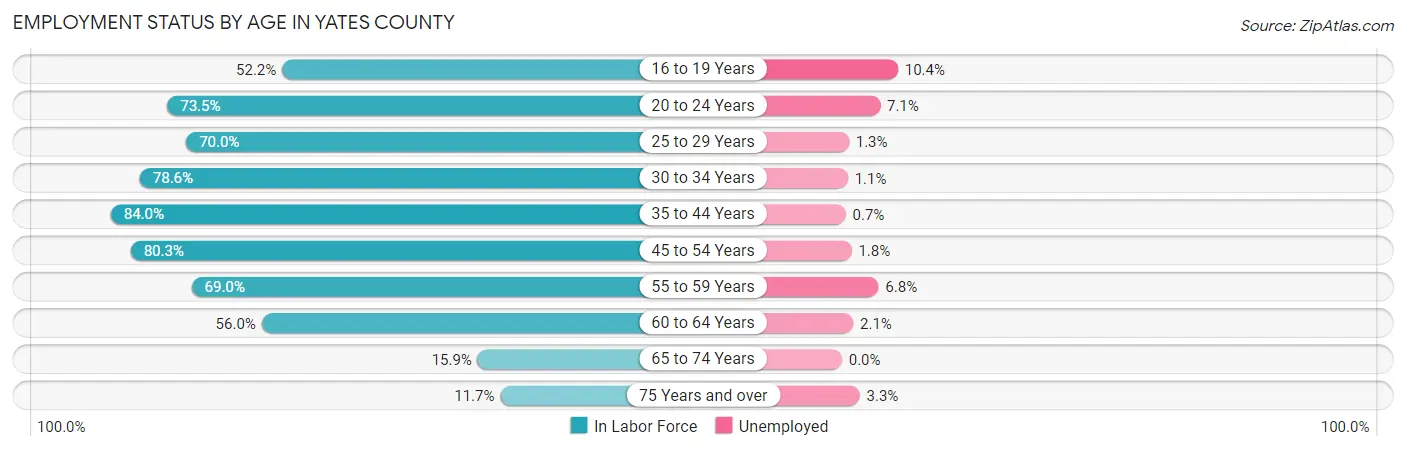
| Age Bracket | In Labor Force | Unemployed |
| 16 to 19 Years | 729 (52.2%) | 76 (10.4%) |
| 20 to 24 Years | 1,277 (73.5%) | 91 (7.1%) |
| 25 to 29 Years | 989 (70.0%) | 13 (1.3%) |
| 30 to 34 Years | 996 (78.6%) | 11 (1.1%) |
| 35 to 44 Years | 1,977 (84.0%) | 14 (0.7%) |
| 45 to 54 Years | 2,088 (80.3%) | 38 (1.8%) |
| 55 to 59 Years | 1,332 (69.0%) | 91 (6.8%) |
| 60 to 64 Years | 1,049 (56.0%) | 22 (2.1%) |
| 65 to 74 Years | 514 (15.9%) | 0 (0.0%) |
| 75 Years and over | 243 (11.7%) | 8 (3.3%) |
| Total | 11,192 (56.3%) | 358 (3.2%) |
Employment Status by Educational Attainment in Yates County
According to labor force statistics for Yates County, 73.7% of individuals (8,429) out of the total population between 25 and 64 years of age (11,437) are in the labor force, with 2.2% or 185 of them being unemployed. The group with the highest labor force participation rate are those with the educational attainment of bachelor's degree or higher, with 85.5% or 2,136 individuals in the labor force. Within the labor force, individuals with high school diploma education have the highest percentage of unemployment, with 3.0% or 81 of them being unemployed.
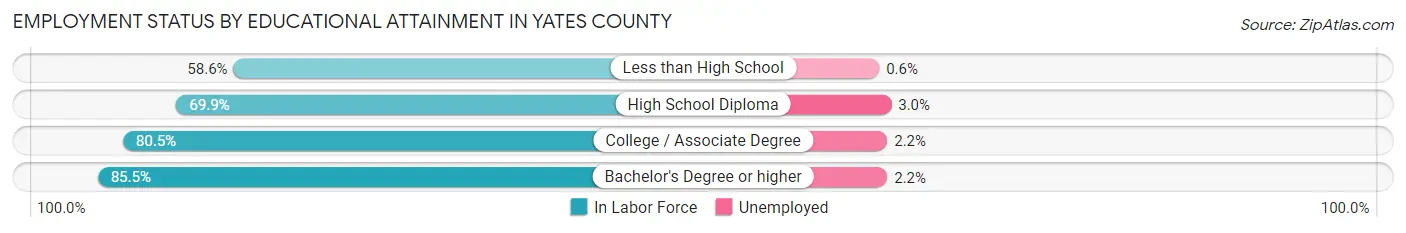
| Educational Attainment | In Labor Force | Unemployed |
| Less than High School | 1,323 (58.6%) | 14 (0.6%) |
| High School Diploma | 2,690 (69.9%) | 115 (3.0%) |
| College / Associate Degree | 2,281 (80.5%) | 62 (2.2%) |
| Bachelor's Degree or higher | 2,136 (85.5%) | 55 (2.2%) |
| Total | 8,429 (73.7%) | 252 (2.2%) |
Employment Occupations by Sex in Yates County
Management, Business, Science and Arts Occupations
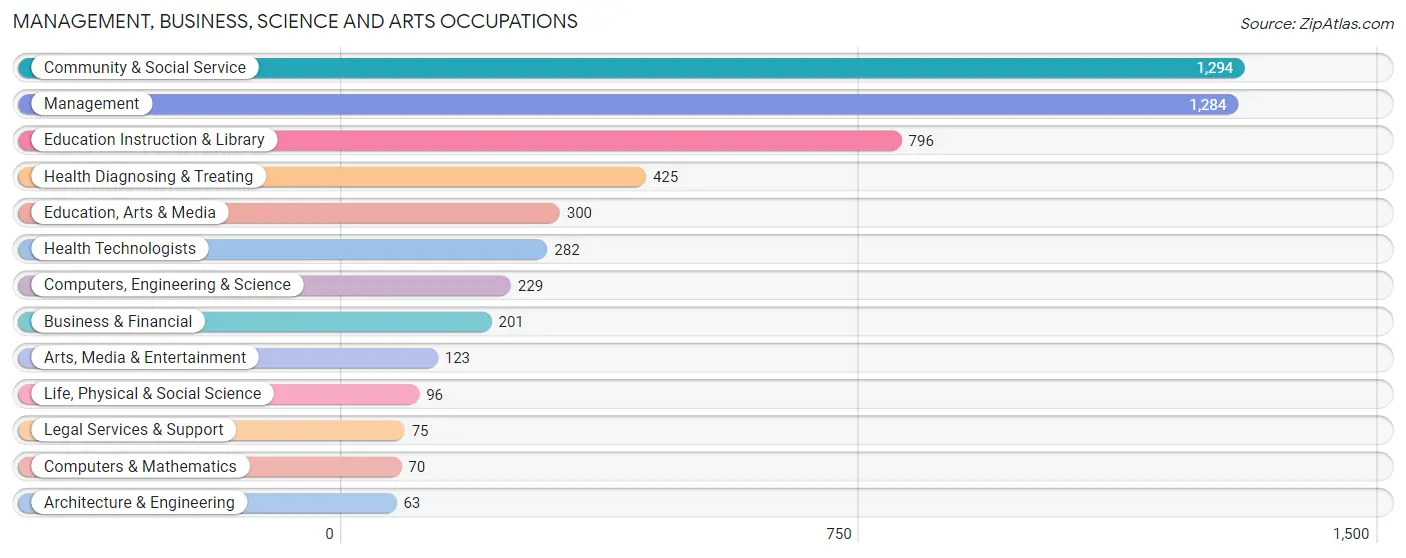
The most common Management, Business, Science and Arts occupations in Yates County are Community & Social Service (1,294 | 12.0%), Management (1,284 | 11.9%), Education Instruction & Library (796 | 7.4%), Health Diagnosing & Treating (425 | 3.9%), and Education, Arts & Media (300 | 2.8%).
Management, Business, Science and Arts Occupations by Sex
Within the Management, Business, Science and Arts occupations in Yates County, the most male-oriented occupations are Architecture & Engineering (100.0%), Computers, Engineering & Science (70.3%), and Management (69.2%), while the most female-oriented occupations are Health Diagnosing & Treating (88.2%), Health Technologists (85.8%), and Business & Financial (85.6%).
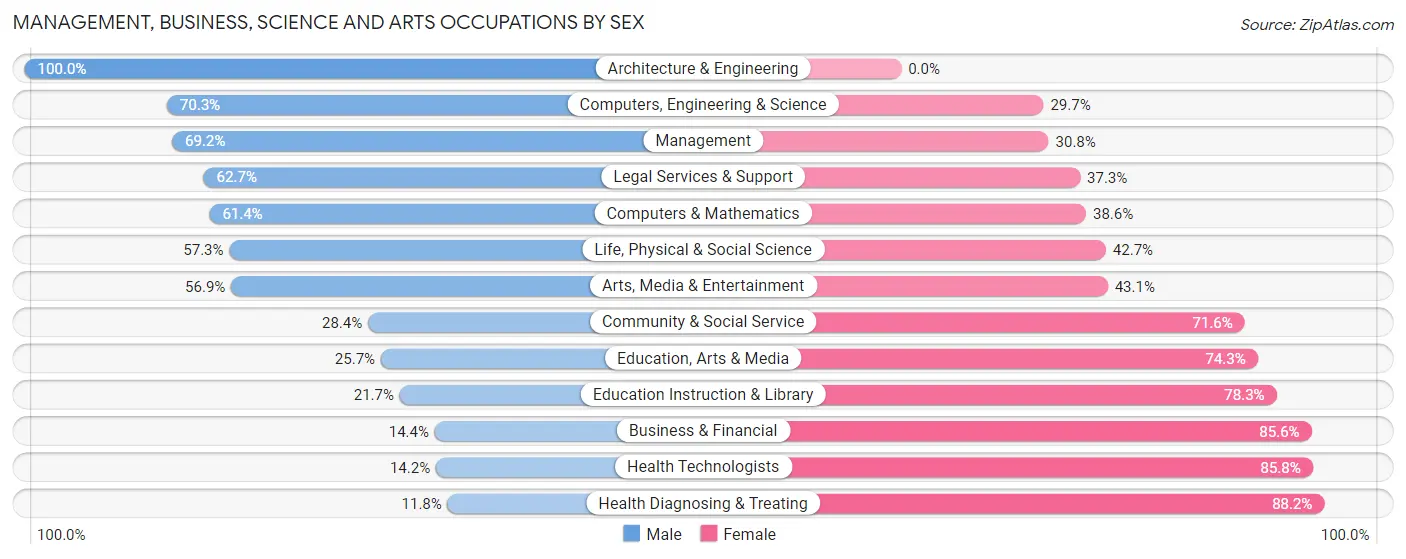
| Occupation | Male | Female |
| Management | 889 (69.2%) | 395 (30.8%) |
| Business & Financial | 29 (14.4%) | 172 (85.6%) |
| Computers, Engineering & Science | 161 (70.3%) | 68 (29.7%) |
| Computers & Mathematics | 43 (61.4%) | 27 (38.6%) |
| Architecture & Engineering | 63 (100.0%) | 0 (0.0%) |
| Life, Physical & Social Science | 55 (57.3%) | 41 (42.7%) |
| Community & Social Service | 367 (28.4%) | 927 (71.6%) |
| Education, Arts & Media | 77 (25.7%) | 223 (74.3%) |
| Legal Services & Support | 47 (62.7%) | 28 (37.3%) |
| Education Instruction & Library | 173 (21.7%) | 623 (78.3%) |
| Arts, Media & Entertainment | 70 (56.9%) | 53 (43.1%) |
| Health Diagnosing & Treating | 50 (11.8%) | 375 (88.2%) |
| Health Technologists | 40 (14.2%) | 242 (85.8%) |
| Total (Category) | 1,496 (43.6%) | 1,937 (56.4%) |
| Total (Overall) | 5,852 (54.1%) | 4,955 (45.9%) |
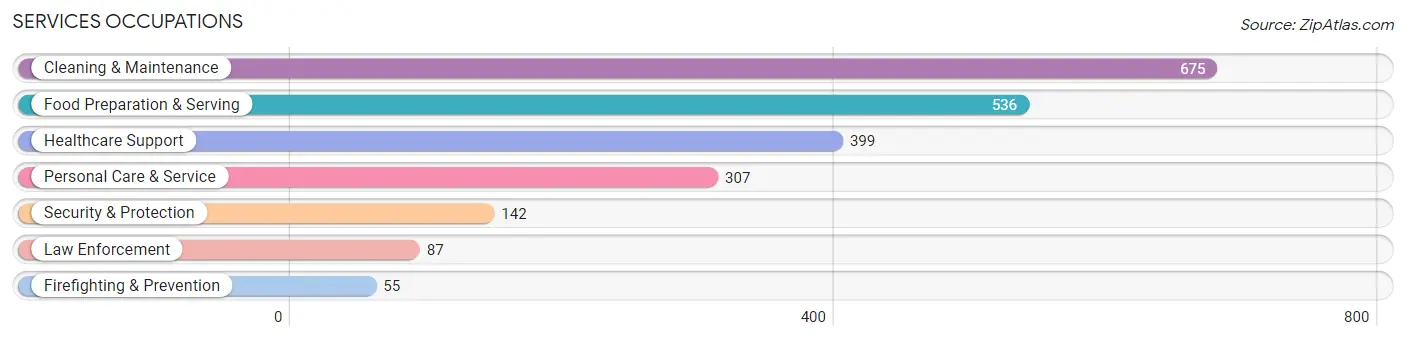
Services Occupations
The most common Services occupations in Yates County are Cleaning & Maintenance (675 | 6.2%), Food Preparation & Serving (536 | 5.0%), Healthcare Support (399 | 3.7%), Personal Care & Service (307 | 2.8%), and Security & Protection (142 | 1.3%).
Services Occupations by Sex
Within the Services occupations in Yates County, the most male-oriented occupations are Law Enforcement (78.2%), Security & Protection (76.1%), and Firefighting & Prevention (72.7%), while the most female-oriented occupations are Healthcare Support (93.5%), Personal Care & Service (75.6%), and Food Preparation & Serving (58.2%).
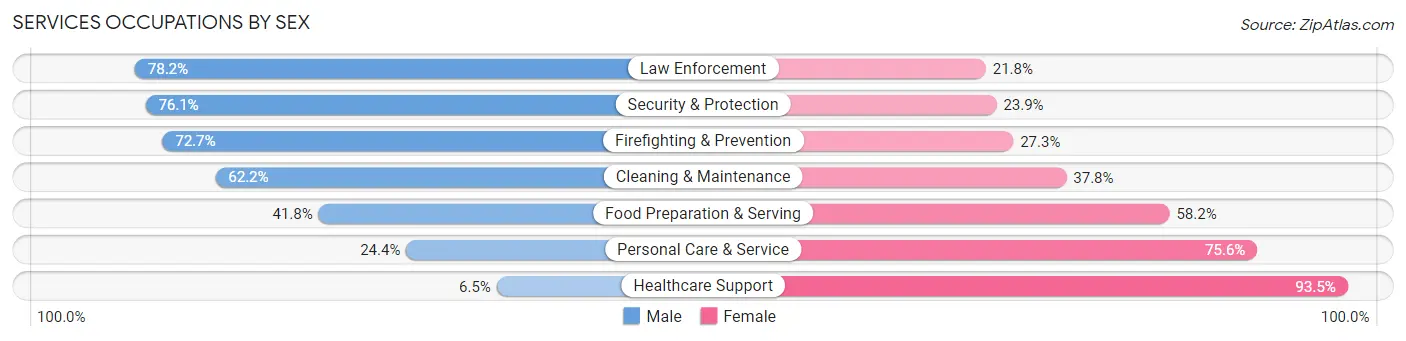
| Occupation | Male | Female |
| Healthcare Support | 26 (6.5%) | 373 (93.5%) |
| Security & Protection | 108 (76.1%) | 34 (23.9%) |
| Firefighting & Prevention | 40 (72.7%) | 15 (27.3%) |
| Law Enforcement | 68 (78.2%) | 19 (21.8%) |
| Food Preparation & Serving | 224 (41.8%) | 312 (58.2%) |
| Cleaning & Maintenance | 420 (62.2%) | 255 (37.8%) |
| Personal Care & Service | 75 (24.4%) | 232 (75.6%) |
| Total (Category) | 853 (41.4%) | 1,206 (58.6%) |
| Total (Overall) | 5,852 (54.1%) | 4,955 (45.9%) |
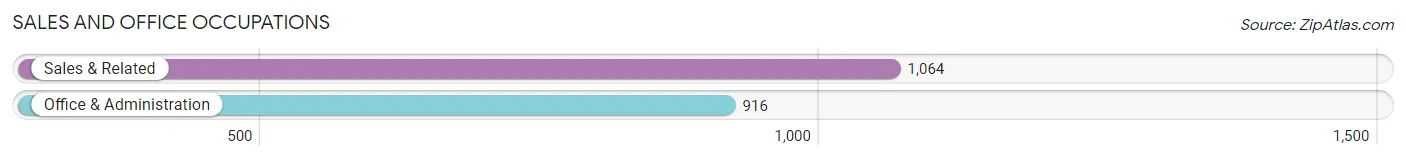
Sales and Office Occupations
The most common Sales and Office occupations in Yates County are Sales & Related (1,064 | 9.9%), and Office & Administration (916 | 8.5%).
Sales and Office Occupations by Sex
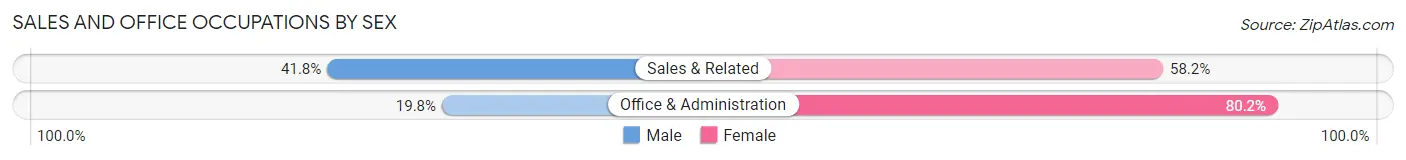
| Occupation | Male | Female |
| Sales & Related | 445 (41.8%) | 619 (58.2%) |
| Office & Administration | 181 (19.8%) | 735 (80.2%) |
| Total (Category) | 626 (31.6%) | 1,354 (68.4%) |
| Total (Overall) | 5,852 (54.1%) | 4,955 (45.9%) |
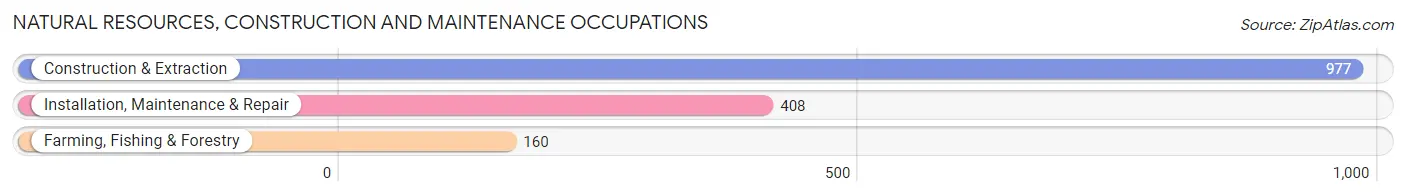
Natural Resources, Construction and Maintenance Occupations
The most common Natural Resources, Construction and Maintenance occupations in Yates County are Construction & Extraction (977 | 9.0%), Installation, Maintenance & Repair (408 | 3.8%), and Farming, Fishing & Forestry (160 | 1.5%).
Natural Resources, Construction and Maintenance Occupations by Sex
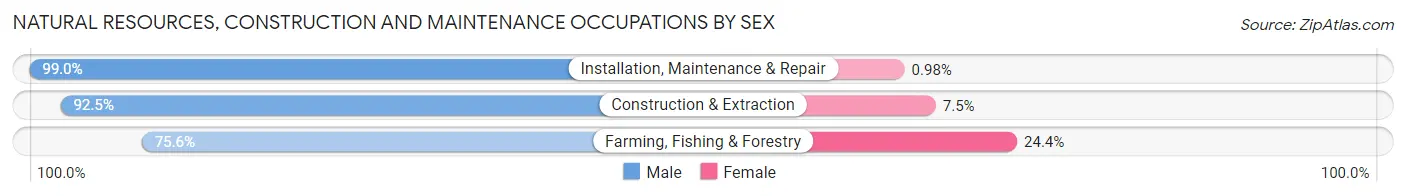
| Occupation | Male | Female |
| Farming, Fishing & Forestry | 121 (75.6%) | 39 (24.4%) |
| Construction & Extraction | 904 (92.5%) | 73 (7.5%) |
| Installation, Maintenance & Repair | 404 (99.0%) | 4 (1.0%) |
| Total (Category) | 1,429 (92.5%) | 116 (7.5%) |
| Total (Overall) | 5,852 (54.1%) | 4,955 (45.9%) |
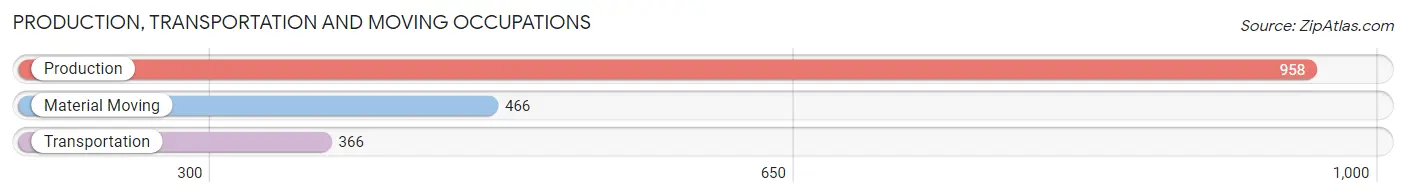
Production, Transportation and Moving Occupations
The most common Production, Transportation and Moving occupations in Yates County are Production (958 | 8.9%), Material Moving (466 | 4.3%), and Transportation (366 | 3.4%).
Production, Transportation and Moving Occupations by Sex
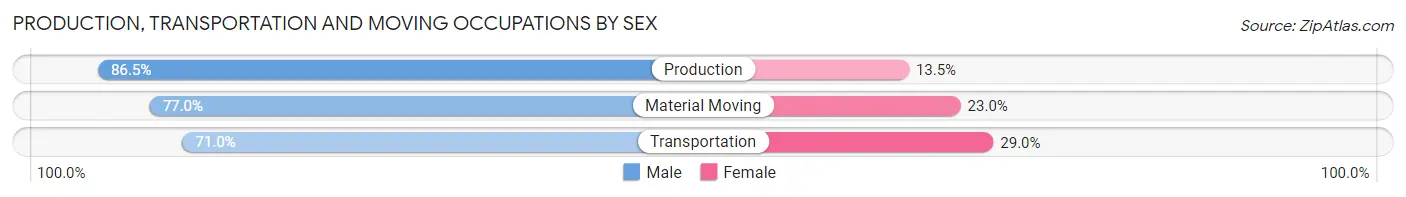
| Occupation | Male | Female |
| Production | 829 (86.5%) | 129 (13.5%) |
| Transportation | 260 (71.0%) | 106 (29.0%) |
| Material Moving | 359 (77.0%) | 107 (23.0%) |
| Total (Category) | 1,448 (80.9%) | 342 (19.1%) |
| Total (Overall) | 5,852 (54.1%) | 4,955 (45.9%) |
Employment Industries by Sex in Yates County
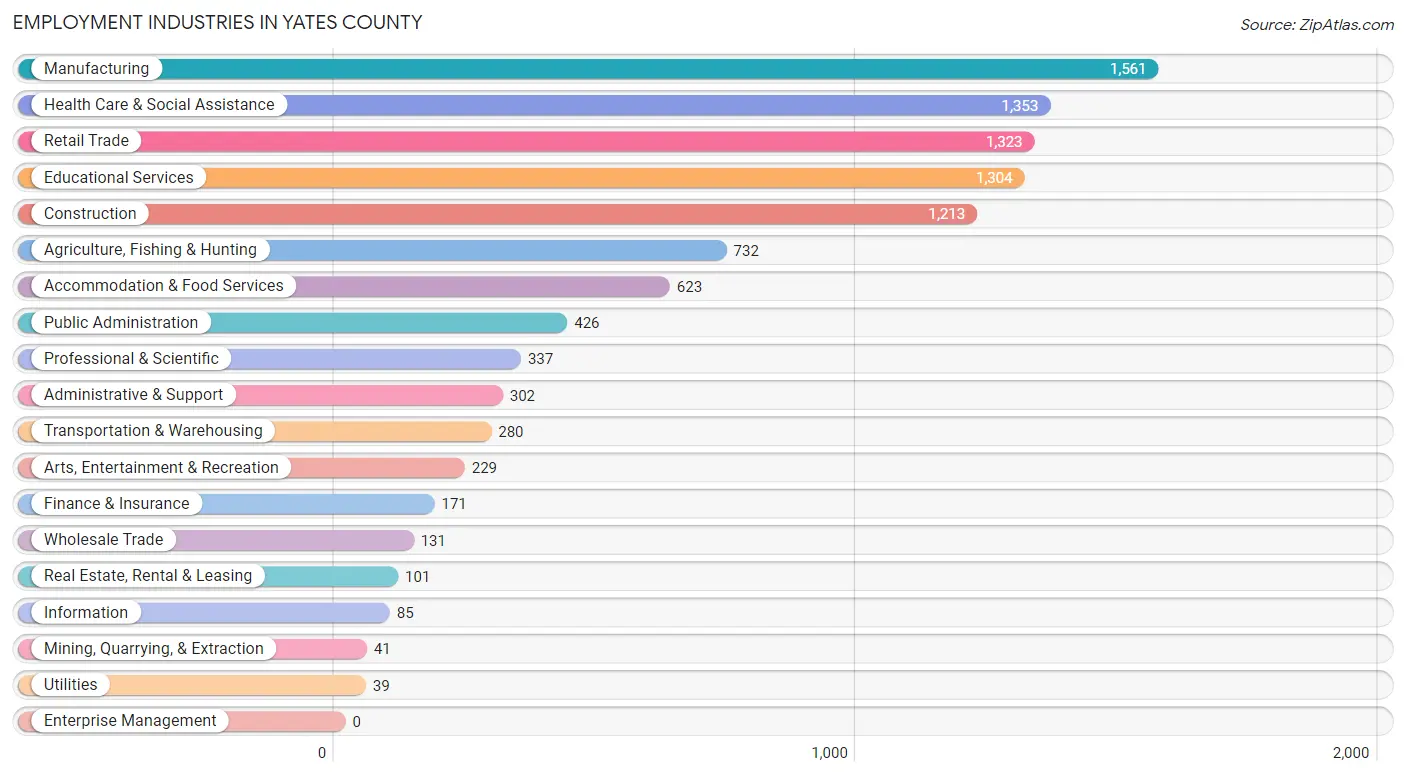
Employment Industries in Yates County
The major employment industries in Yates County include Manufacturing (1,561 | 14.4%), Health Care & Social Assistance (1,353 | 12.5%), Retail Trade (1,323 | 12.2%), Educational Services (1,304 | 12.1%), and Construction (1,213 | 11.2%).
Employment Industries by Sex in Yates County
The Yates County industries that see more men than women are Utilities (100.0%), Mining, Quarrying, & Extraction (95.1%), and Construction (91.1%), whereas the industries that tend to have a higher number of women are Information (92.9%), Health Care & Social Assistance (84.9%), and Educational Services (73.7%).
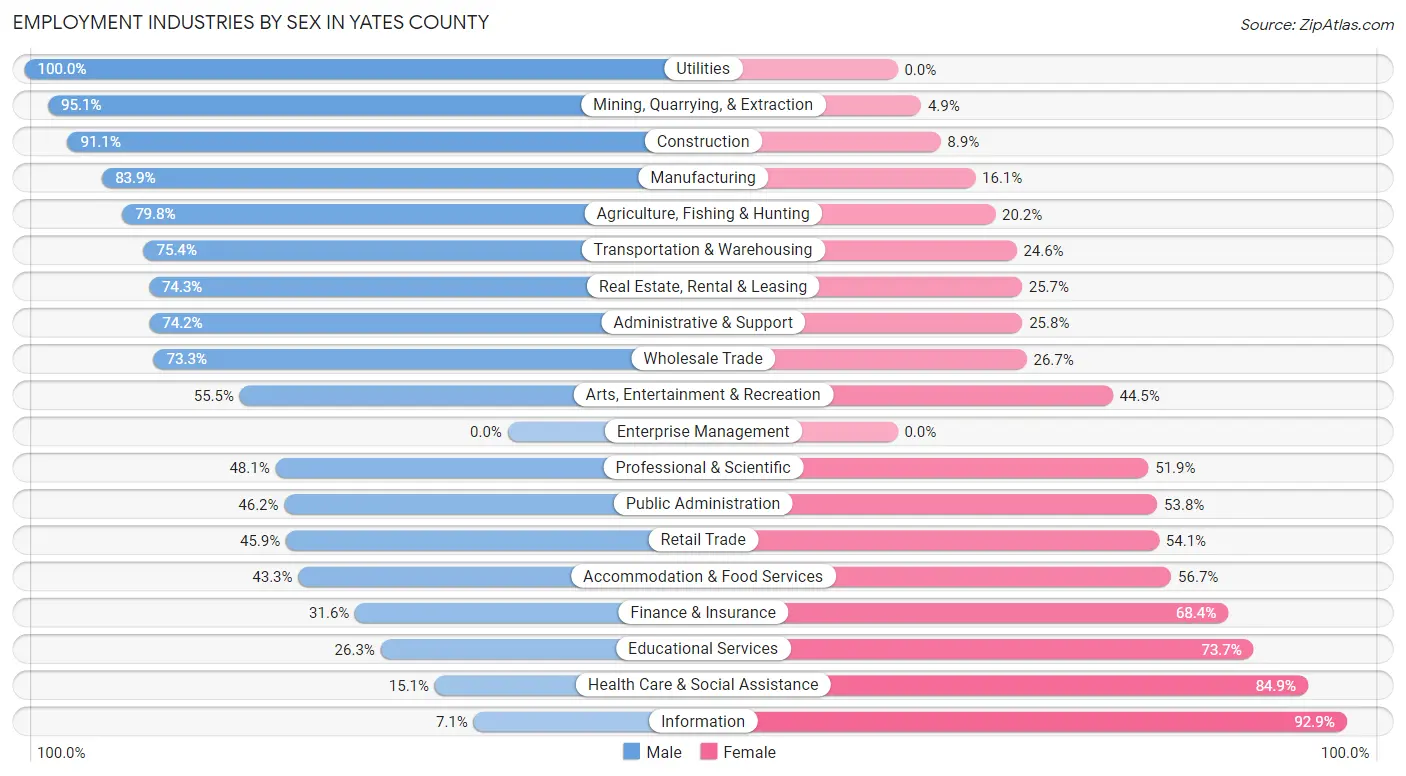
| Industry | Male | Female |
| Agriculture, Fishing & Hunting | 584 (79.8%) | 148 (20.2%) |
| Mining, Quarrying, & Extraction | 39 (95.1%) | 2 (4.9%) |
| Construction | 1,105 (91.1%) | 108 (8.9%) |
| Manufacturing | 1,310 (83.9%) | 251 (16.1%) |
| Wholesale Trade | 96 (73.3%) | 35 (26.7%) |
| Retail Trade | 607 (45.9%) | 716 (54.1%) |
| Transportation & Warehousing | 211 (75.4%) | 69 (24.6%) |
| Utilities | 39 (100.0%) | 0 (0.0%) |
| Information | 6 (7.1%) | 79 (92.9%) |
| Finance & Insurance | 54 (31.6%) | 117 (68.4%) |
| Real Estate, Rental & Leasing | 75 (74.3%) | 26 (25.7%) |
| Professional & Scientific | 162 (48.1%) | 175 (51.9%) |
| Enterprise Management | 0 (0.0%) | 0 (0.0%) |
| Administrative & Support | 224 (74.2%) | 78 (25.8%) |
| Educational Services | 343 (26.3%) | 961 (73.7%) |
| Health Care & Social Assistance | 204 (15.1%) | 1,149 (84.9%) |
| Arts, Entertainment & Recreation | 127 (55.5%) | 102 (44.5%) |
| Accommodation & Food Services | 270 (43.3%) | 353 (56.7%) |
| Public Administration | 197 (46.2%) | 229 (53.8%) |
| Total | 5,852 (54.1%) | 4,955 (45.9%) |
Education in Yates County
School Enrollment in Yates County
The most common levels of schooling among the 4,914 students in Yates County are middle school (1,263 | 25.7%), elementary school (1,214 | 24.7%), and college / undergraduate (1,184 | 24.1%).
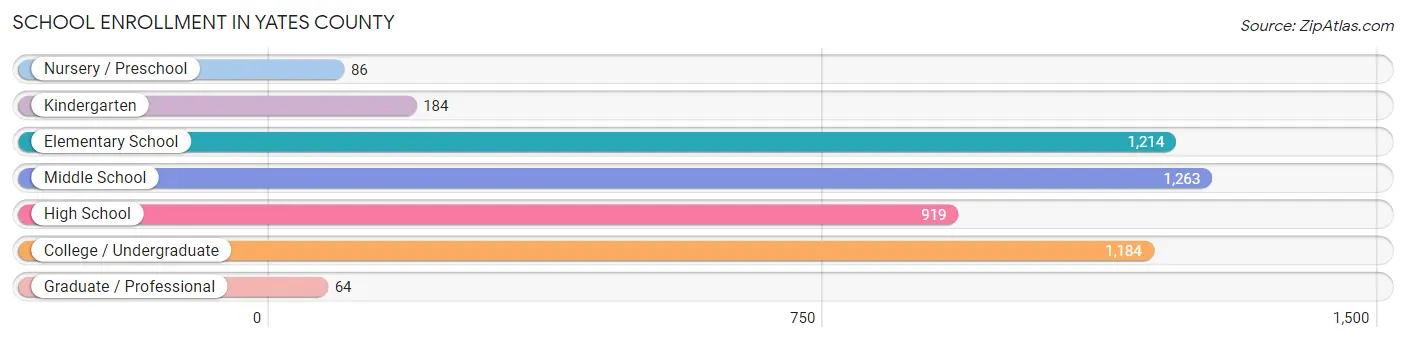
| School Level | # Students | % Students |
| Nursery / Preschool | 86 | 1.8% |
| Kindergarten | 184 | 3.7% |
| Elementary School | 1,214 | 24.7% |
| Middle School | 1,263 | 25.7% |
| High School | 919 | 18.7% |
| College / Undergraduate | 1,184 | 24.1% |
| Graduate / Professional | 64 | 1.3% |
| Total | 4,914 | 100.0% |
School Enrollment by Age by Funding Source in Yates County
Out of a total of 4,914 students who are enrolled in schools in Yates County, 1,956 (39.8%) attend a private institution, while the remaining 2,958 (60.2%) are enrolled in public schools. The age group of 20 to 24 year olds has the highest likelihood of being enrolled in private schools, with 558 (83.8% in the age bracket) enrolled. Conversely, the age group of 15 to 17 year olds has the lowest likelihood of being enrolled in a private school, with 651 (93.9% in the age bracket) attending a public institution.
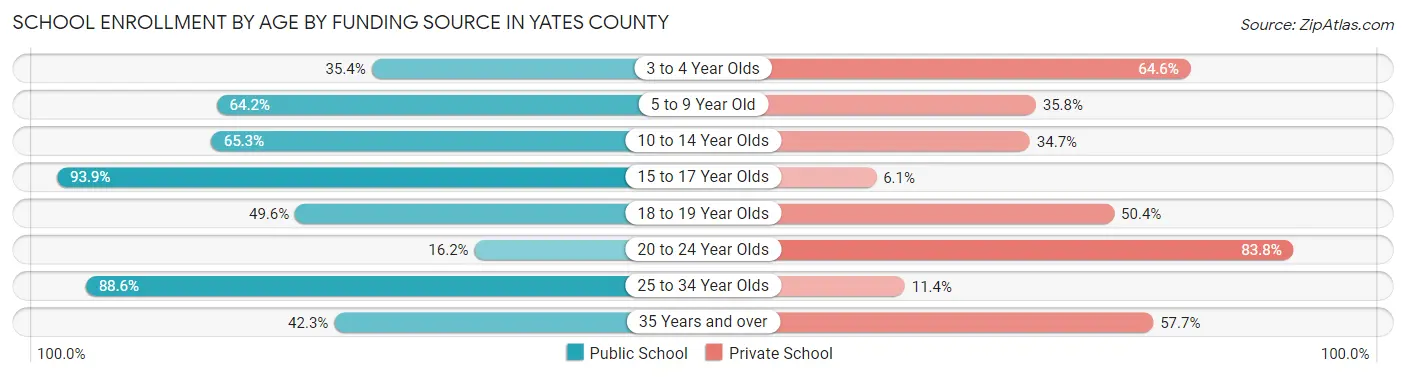
| Age Bracket | Public School | Private School |
| 3 to 4 Year Olds | 23 (35.4%) | 42 (64.6%) |
| 5 to 9 Year Old | 815 (64.2%) | 454 (35.8%) |
| 10 to 14 Year Olds | 979 (65.3%) | 520 (34.7%) |
| 15 to 17 Year Olds | 651 (93.9%) | 42 (6.1%) |
| 18 to 19 Year Olds | 264 (49.6%) | 268 (50.4%) |
| 20 to 24 Year Olds | 108 (16.2%) | 558 (83.8%) |
| 25 to 34 Year Olds | 70 (88.6%) | 9 (11.4%) |
| 35 Years and over | 47 (42.3%) | 64 (57.7%) |
| Total | 2,958 (60.2%) | 1,956 (39.8%) |
Educational Attainment by Field of Study in Yates County
Education (830 | 19.0%), business (573 | 13.1%), science & technology (450 | 10.3%), bio, nature & agricultural (350 | 8.0%), and social sciences (344 | 7.9%) are the most common fields of study among 4,367 individuals in Yates County who have obtained a bachelor's degree or higher.
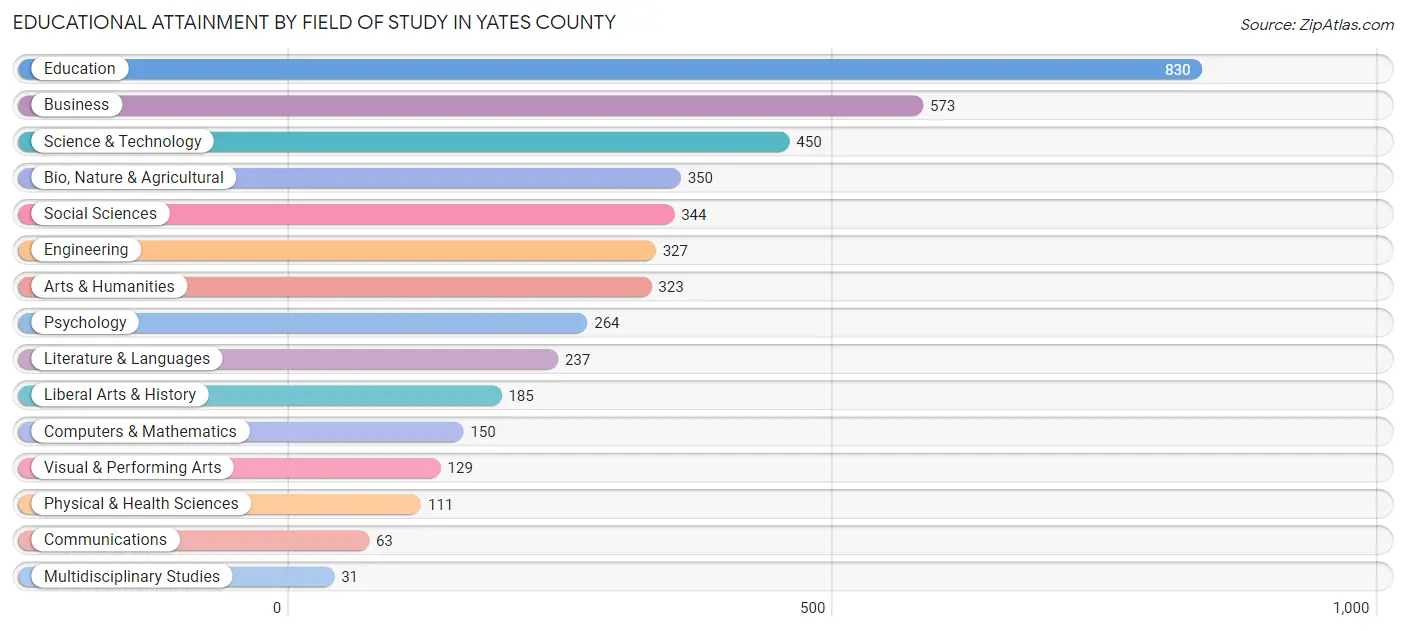
| Field of Study | # Graduates | % Graduates |
| Computers & Mathematics | 150 | 3.4% |
| Bio, Nature & Agricultural | 350 | 8.0% |
| Physical & Health Sciences | 111 | 2.5% |
| Psychology | 264 | 6.0% |
| Social Sciences | 344 | 7.9% |
| Engineering | 327 | 7.5% |
| Multidisciplinary Studies | 31 | 0.7% |
| Science & Technology | 450 | 10.3% |
| Business | 573 | 13.1% |
| Education | 830 | 19.0% |
| Literature & Languages | 237 | 5.4% |
| Liberal Arts & History | 185 | 4.2% |
| Visual & Performing Arts | 129 | 2.9% |
| Communications | 63 | 1.4% |
| Arts & Humanities | 323 | 7.4% |
| Total | 4,367 | 100.0% |
Transportation & Commute in Yates County
Vehicle Availability by Sex in Yates County
The most prevalent vehicle ownership categories in Yates County are males with 2 vehicles (2,048, accounting for 36.1%) and females with 2 vehicles (1,701, making up 44.2%).
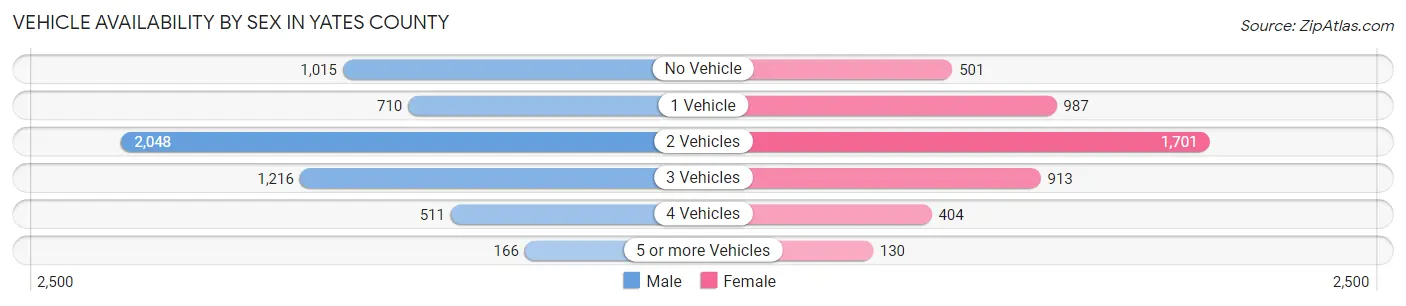
| Vehicles Available | Male | Female |
| No Vehicle | 1,015 (17.9%) | 501 (10.8%) |
| 1 Vehicle | 710 (12.5%) | 987 (21.3%) |
| 2 Vehicles | 2,048 (36.1%) | 1,701 (36.7%) |
| 3 Vehicles | 1,216 (21.5%) | 913 (19.7%) |
| 4 Vehicles | 511 (9.0%) | 404 (8.7%) |
| 5 or more Vehicles | 166 (2.9%) | 130 (2.8%) |
| Total | 5,666 (100.0%) | 4,636 (100.0%) |
Commute Time in Yates County
The most frequently occuring commute durations in Yates County are 5 to 9 minutes (1,701 commuters, 18.2%), 10 to 14 minutes (1,206 commuters, 12.9%), and 15 to 19 minutes (1,112 commuters, 11.9%).
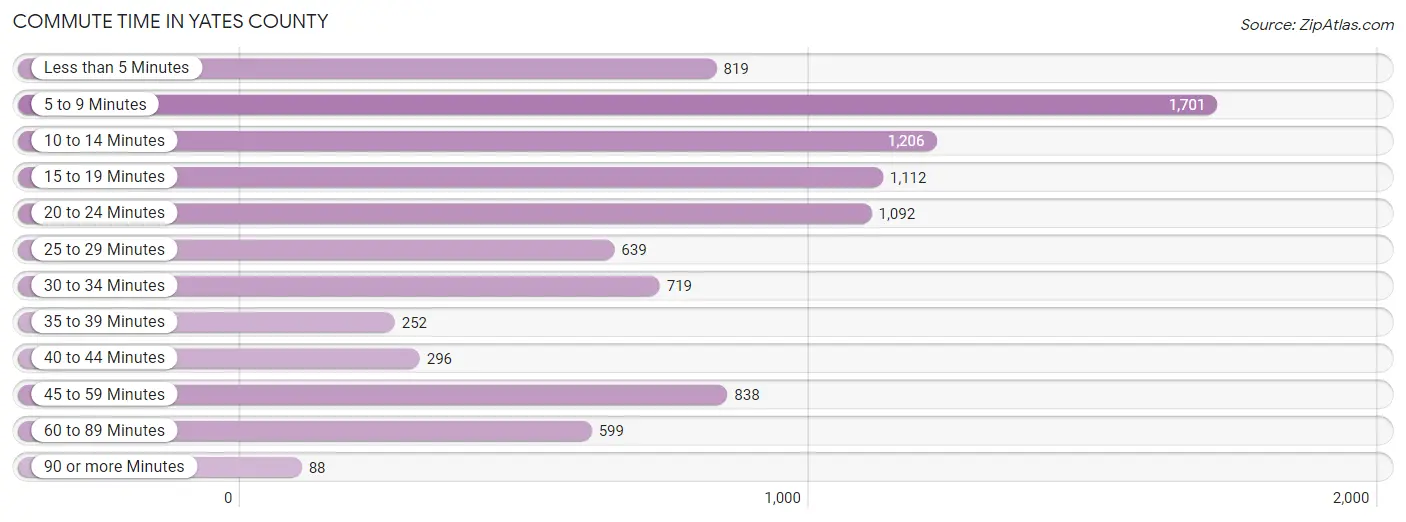
| Commute Time | # Commuters | % Commuters |
| Less than 5 Minutes | 819 | 8.7% |
| 5 to 9 Minutes | 1,701 | 18.2% |
| 10 to 14 Minutes | 1,206 | 12.9% |
| 15 to 19 Minutes | 1,112 | 11.9% |
| 20 to 24 Minutes | 1,092 | 11.7% |
| 25 to 29 Minutes | 639 | 6.8% |
| 30 to 34 Minutes | 719 | 7.7% |
| 35 to 39 Minutes | 252 | 2.7% |
| 40 to 44 Minutes | 296 | 3.2% |
| 45 to 59 Minutes | 838 | 8.9% |
| 60 to 89 Minutes | 599 | 6.4% |
| 90 or more Minutes | 88 | 0.9% |
Commute Time by Sex in Yates County
The most common commute times in Yates County are 15 to 19 minutes (664 commuters, 13.0%) for males and 5 to 9 minutes (1,072 commuters, 25.2%) for females.
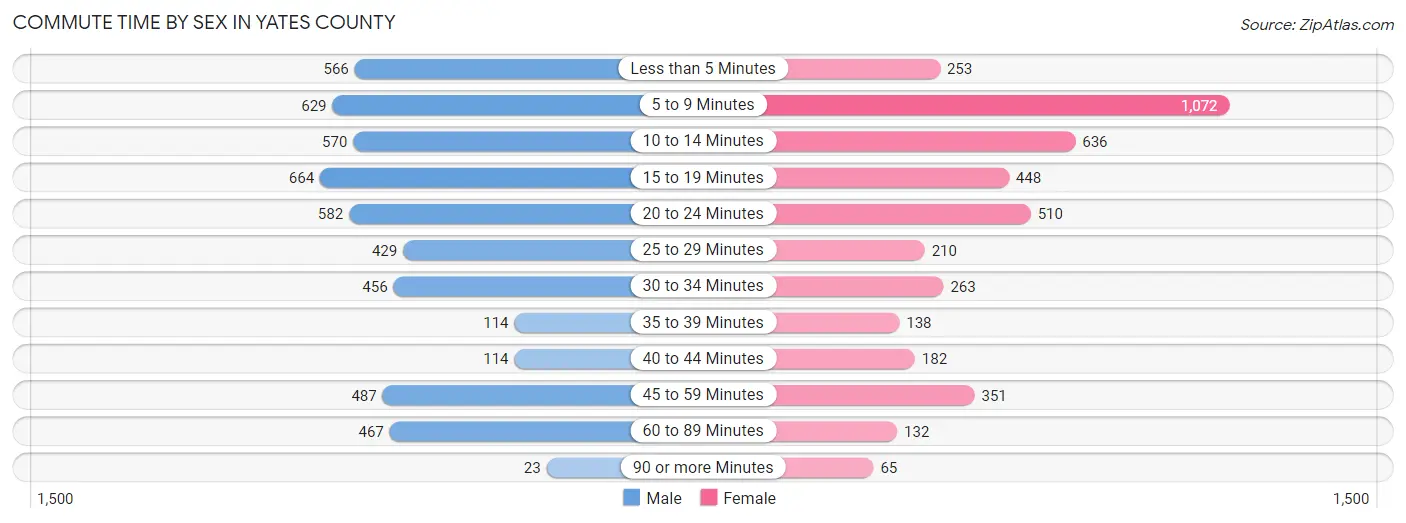
| Commute Time | Male | Female |
| Less than 5 Minutes | 566 (11.1%) | 253 (5.9%) |
| 5 to 9 Minutes | 629 (12.3%) | 1,072 (25.2%) |
| 10 to 14 Minutes | 570 (11.2%) | 636 (14.9%) |
| 15 to 19 Minutes | 664 (13.0%) | 448 (10.5%) |
| 20 to 24 Minutes | 582 (11.4%) | 510 (12.0%) |
| 25 to 29 Minutes | 429 (8.4%) | 210 (4.9%) |
| 30 to 34 Minutes | 456 (8.9%) | 263 (6.2%) |
| 35 to 39 Minutes | 114 (2.2%) | 138 (3.2%) |
| 40 to 44 Minutes | 114 (2.2%) | 182 (4.3%) |
| 45 to 59 Minutes | 487 (9.6%) | 351 (8.2%) |
| 60 to 89 Minutes | 467 (9.2%) | 132 (3.1%) |
| 90 or more Minutes | 23 (0.4%) | 65 (1.5%) |
Time of Departure to Work by Sex in Yates County
The most frequent times of departure to work in Yates County are 7:00 AM to 7:29 AM (1,188, 23.3%) for males and 7:00 AM to 7:29 AM (1,017, 23.9%) for females.
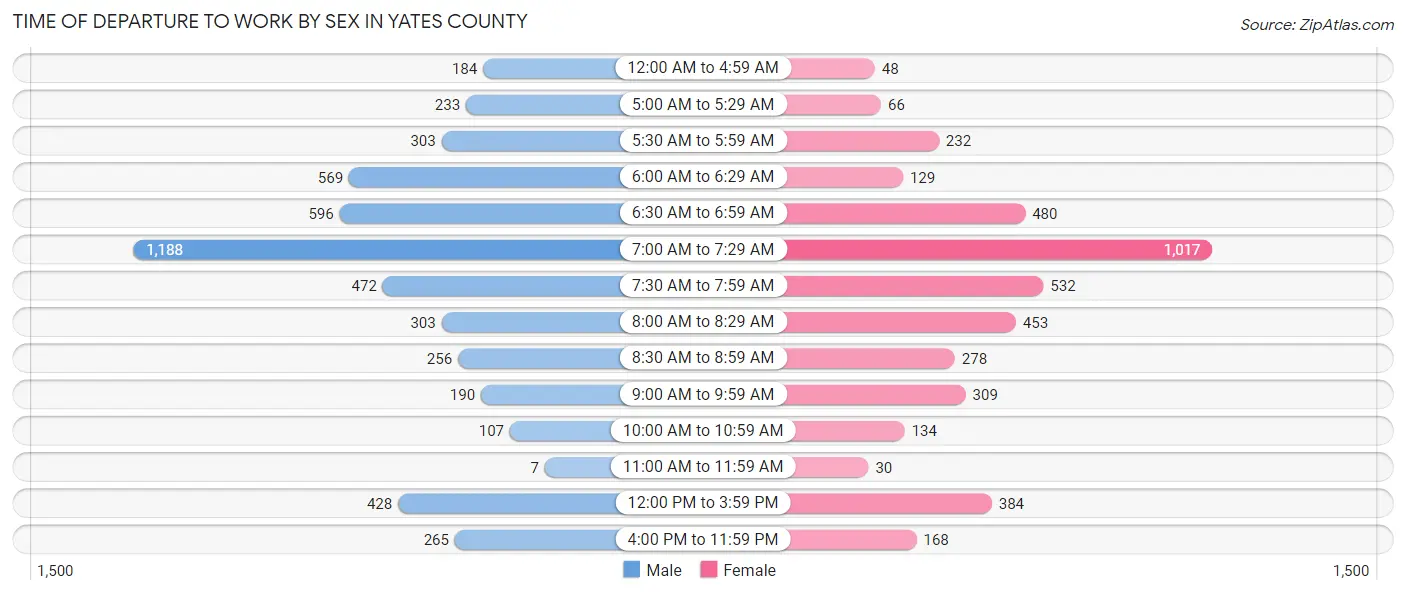
| Time of Departure | Male | Female |
| 12:00 AM to 4:59 AM | 184 (3.6%) | 48 (1.1%) |
| 5:00 AM to 5:29 AM | 233 (4.6%) | 66 (1.5%) |
| 5:30 AM to 5:59 AM | 303 (5.9%) | 232 (5.4%) |
| 6:00 AM to 6:29 AM | 569 (11.2%) | 129 (3.0%) |
| 6:30 AM to 6:59 AM | 596 (11.7%) | 480 (11.3%) |
| 7:00 AM to 7:29 AM | 1,188 (23.3%) | 1,017 (23.9%) |
| 7:30 AM to 7:59 AM | 472 (9.2%) | 532 (12.5%) |
| 8:00 AM to 8:29 AM | 303 (5.9%) | 453 (10.6%) |
| 8:30 AM to 8:59 AM | 256 (5.0%) | 278 (6.5%) |
| 9:00 AM to 9:59 AM | 190 (3.7%) | 309 (7.2%) |
| 10:00 AM to 10:59 AM | 107 (2.1%) | 134 (3.2%) |
| 11:00 AM to 11:59 AM | 7 (0.1%) | 30 (0.7%) |
| 12:00 PM to 3:59 PM | 428 (8.4%) | 384 (9.0%) |
| 4:00 PM to 11:59 PM | 265 (5.2%) | 168 (3.9%) |
| Total | 5,101 (100.0%) | 4,260 (100.0%) |
Housing Occupancy in Yates County
Occupancy by Ownership in Yates County
Of the total 8,882 dwellings in Yates County, owner-occupied units account for 6,862 (77.3%), while renter-occupied units make up 2,020 (22.7%).
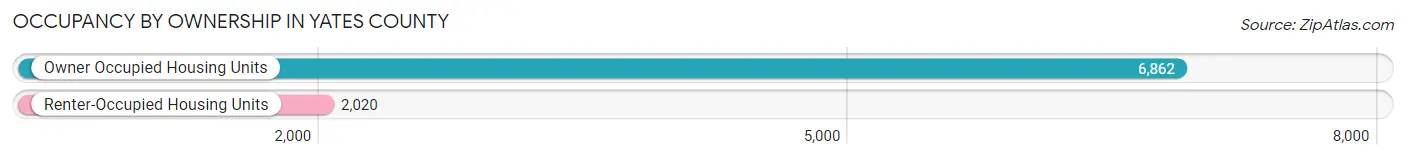
| Occupancy | # Housing Units | % Housing Units |
| Owner Occupied Housing Units | 6,862 | 77.3% |
| Renter-Occupied Housing Units | 2,020 | 22.7% |
| Total Occupied Housing Units | 8,882 | 100.0% |
Occupancy by Household Size in Yates County
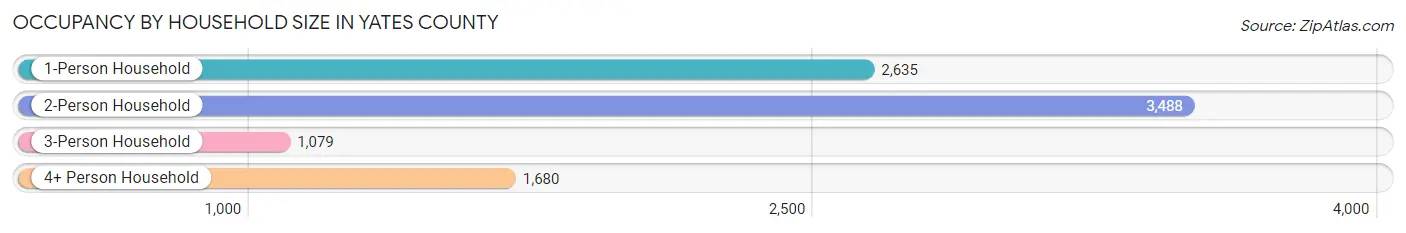
| Household Size | # Housing Units | % Housing Units |
| 1-Person Household | 2,635 | 29.7% |
| 2-Person Household | 3,488 | 39.3% |
| 3-Person Household | 1,079 | 12.1% |
| 4+ Person Household | 1,680 | 18.9% |
| Total Housing Units | 8,882 | 100.0% |
Occupancy by Ownership by Household Size in Yates County
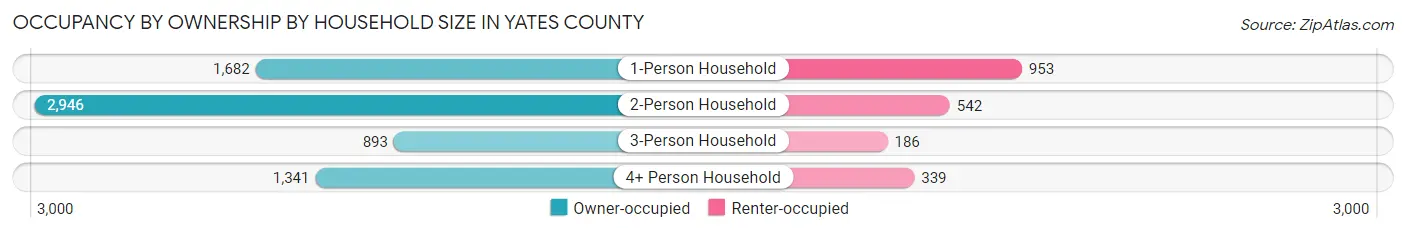
| Household Size | Owner-occupied | Renter-occupied |
| 1-Person Household | 1,682 (63.8%) | 953 (36.2%) |
| 2-Person Household | 2,946 (84.5%) | 542 (15.5%) |
| 3-Person Household | 893 (82.8%) | 186 (17.2%) |
| 4+ Person Household | 1,341 (79.8%) | 339 (20.2%) |
| Total Housing Units | 6,862 (77.3%) | 2,020 (22.7%) |
Occupancy by Educational Attainment in Yates County
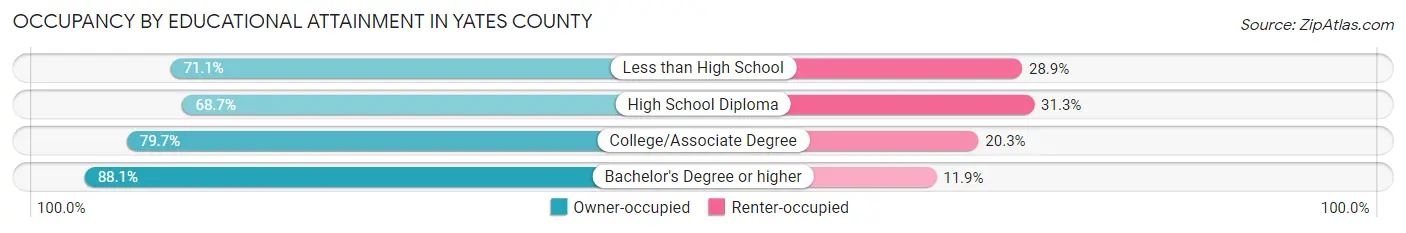
| Household Size | Owner-occupied | Renter-occupied |
| Less than High School | 747 (71.1%) | 304 (28.9%) |
| High School Diploma | 2,127 (68.7%) | 970 (31.3%) |
| College/Associate Degree | 1,735 (79.7%) | 441 (20.3%) |
| Bachelor's Degree or higher | 2,253 (88.1%) | 305 (11.9%) |
Occupancy by Age of Householder in Yates County
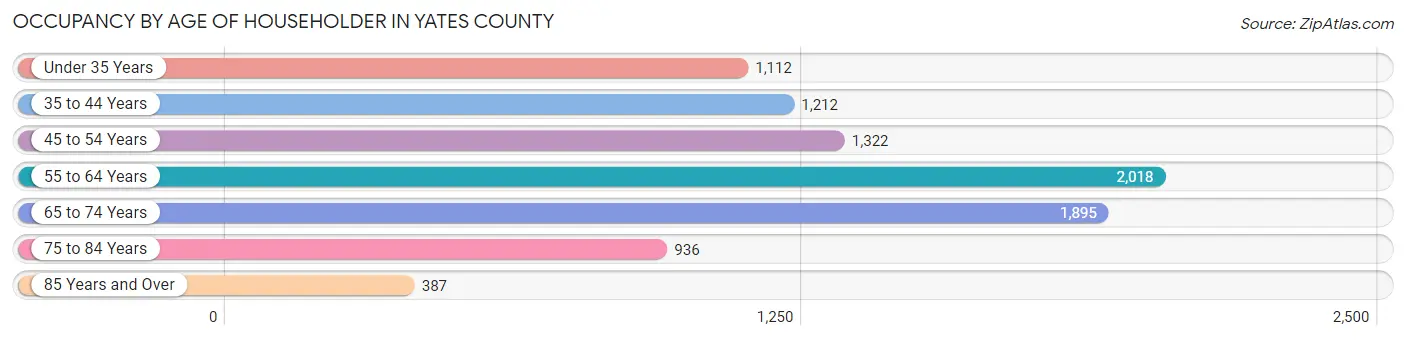
| Age Bracket | # Households | % Households |
| Under 35 Years | 1,112 | 12.5% |
| 35 to 44 Years | 1,212 | 13.7% |
| 45 to 54 Years | 1,322 | 14.9% |
| 55 to 64 Years | 2,018 | 22.7% |
| 65 to 74 Years | 1,895 | 21.3% |
| 75 to 84 Years | 936 | 10.5% |
| 85 Years and Over | 387 | 4.4% |
| Total | 8,882 | 100.0% |
Housing Finances in Yates County
Median Income by Occupancy in Yates County
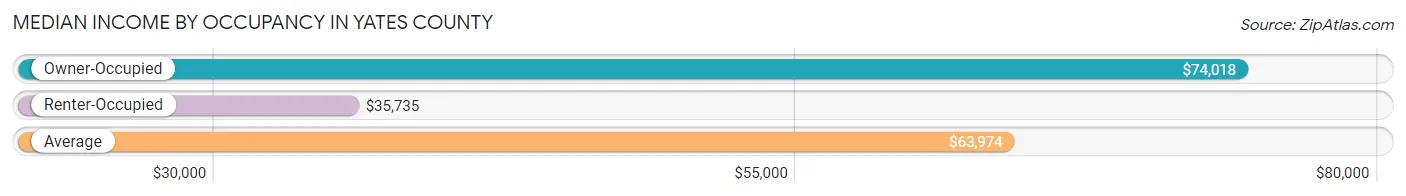
| Occupancy Type | # Households | Median Income |
| Owner-Occupied | 6,862 (77.3%) | $74,018 |
| Renter-Occupied | 2,020 (22.7%) | $35,735 |
| Average | 8,882 (100.0%) | $63,974 |
Occupancy by Householder Income Bracket in Yates County
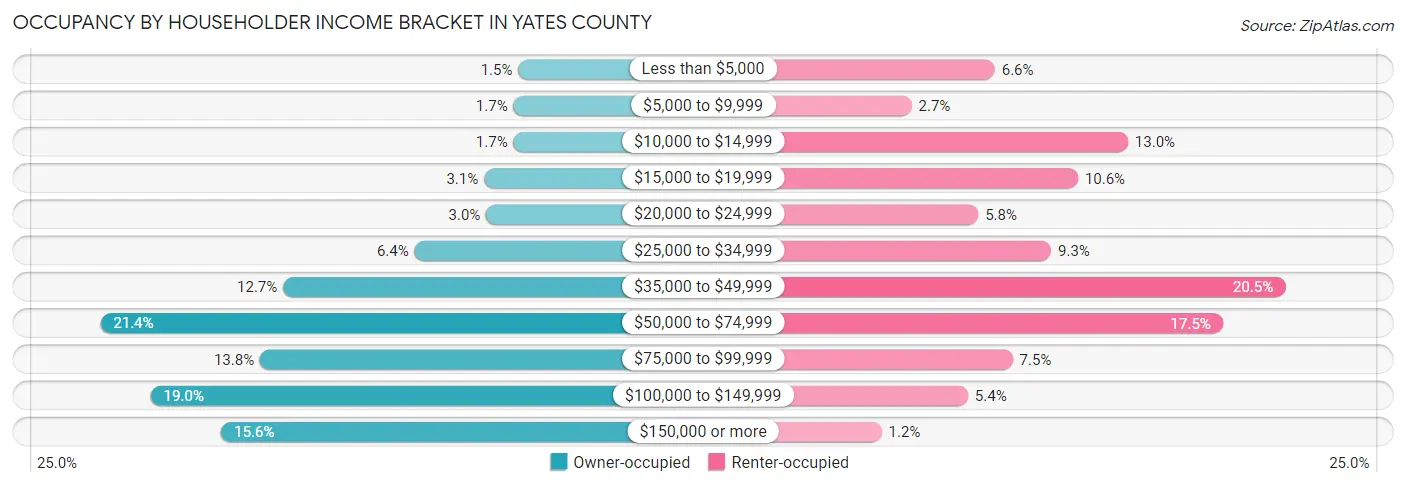
| Income Bracket | Owner-occupied | Renter-occupied |
| Less than $5,000 | 102 (1.5%) | 134 (6.6%) |
| $5,000 to $9,999 | 118 (1.7%) | 54 (2.7%) |
| $10,000 to $14,999 | 118 (1.7%) | 262 (13.0%) |
| $15,000 to $19,999 | 214 (3.1%) | 214 (10.6%) |
| $20,000 to $24,999 | 207 (3.0%) | 118 (5.8%) |
| $25,000 to $34,999 | 441 (6.4%) | 188 (9.3%) |
| $35,000 to $49,999 | 871 (12.7%) | 413 (20.4%) |
| $50,000 to $74,999 | 1,468 (21.4%) | 353 (17.5%) |
| $75,000 to $99,999 | 946 (13.8%) | 151 (7.5%) |
| $100,000 to $149,999 | 1,304 (19.0%) | 108 (5.3%) |
| $150,000 or more | 1,073 (15.6%) | 25 (1.2%) |
| Total | 6,862 (100.0%) | 2,020 (100.0%) |
Monthly Housing Cost Tiers in Yates County
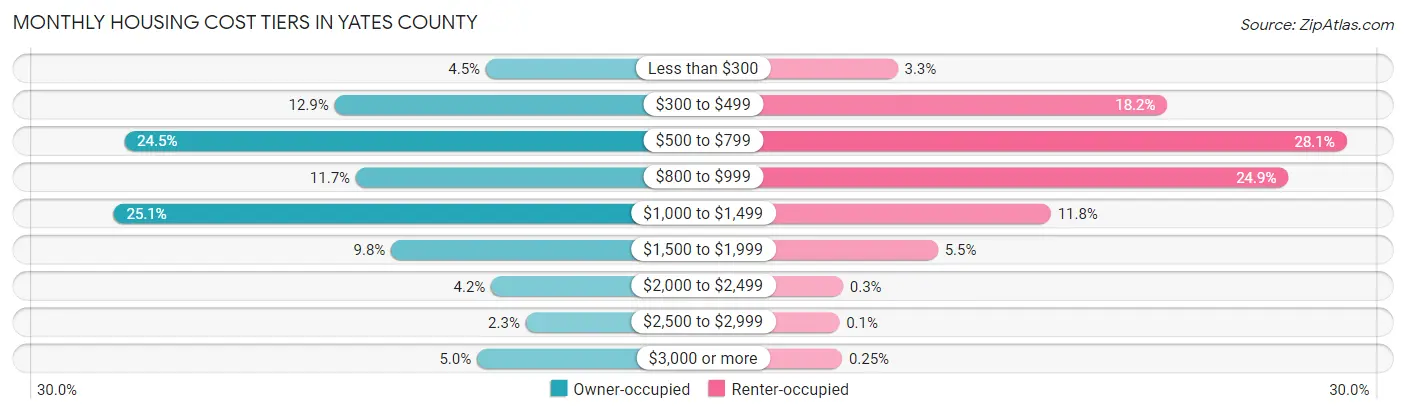
| Monthly Cost | Owner-occupied | Renter-occupied |
| Less than $300 | 310 (4.5%) | 67 (3.3%) |
| $300 to $499 | 884 (12.9%) | 368 (18.2%) |
| $500 to $799 | 1,681 (24.5%) | 568 (28.1%) |
| $800 to $999 | 803 (11.7%) | 503 (24.9%) |
| $1,000 to $1,499 | 1,722 (25.1%) | 238 (11.8%) |
| $1,500 to $1,999 | 669 (9.8%) | 112 (5.5%) |
| $2,000 to $2,499 | 290 (4.2%) | 6 (0.3%) |
| $2,500 to $2,999 | 159 (2.3%) | 2 (0.1%) |
| $3,000 or more | 344 (5.0%) | 5 (0.3%) |
| Total | 6,862 (100.0%) | 2,020 (100.0%) |
Physical Housing Characteristics in Yates County
Housing Structures in Yates County
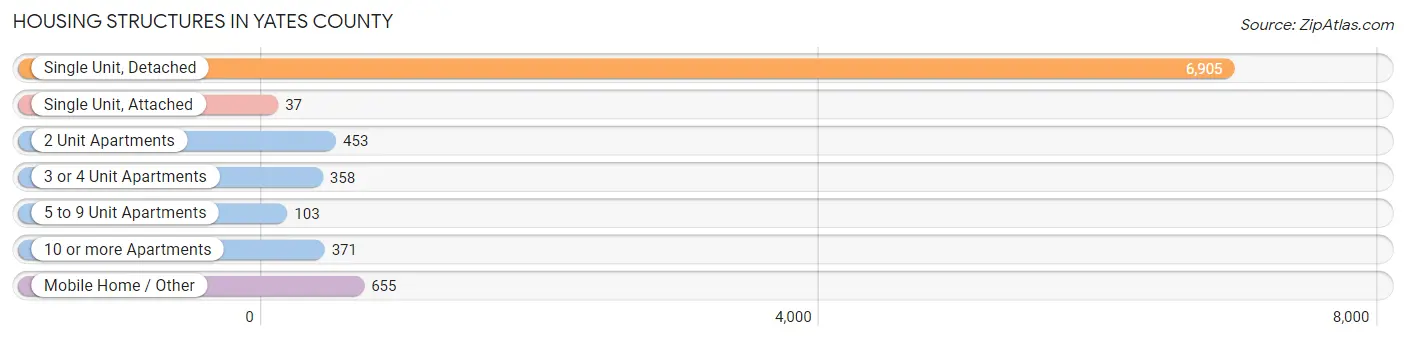
| Structure Type | # Housing Units | % Housing Units |
| Single Unit, Detached | 6,905 | 77.7% |
| Single Unit, Attached | 37 | 0.4% |
| 2 Unit Apartments | 453 | 5.1% |
| 3 or 4 Unit Apartments | 358 | 4.0% |
| 5 to 9 Unit Apartments | 103 | 1.2% |
| 10 or more Apartments | 371 | 4.2% |
| Mobile Home / Other | 655 | 7.4% |
| Total | 8,882 | 100.0% |
Housing Structures by Occupancy in Yates County
| Structure Type | Owner-occupied | Renter-occupied |
| Single Unit, Detached | 6,257 (90.6%) | 648 (9.4%) |
| Single Unit, Attached | 27 (73.0%) | 10 (27.0%) |
| 2 Unit Apartments | 36 (8.0%) | 417 (92.0%) |
| 3 or 4 Unit Apartments | 8 (2.2%) | 350 (97.8%) |
| 5 to 9 Unit Apartments | 0 (0.0%) | 103 (100.0%) |
| 10 or more Apartments | 3 (0.8%) | 368 (99.2%) |
| Mobile Home / Other | 531 (81.1%) | 124 (18.9%) |
| Total | 6,862 (77.3%) | 2,020 (22.7%) |
Housing Structures by Number of Rooms in Yates County
| Number of Rooms | Owner-occupied | Renter-occupied |
| 1 Room | 41 (0.6%) | 29 (1.4%) |
| 2 or 3 Rooms | 180 (2.6%) | 516 (25.5%) |
| 4 or 5 Rooms | 1,485 (21.6%) | 839 (41.5%) |
| 6 or 7 Rooms | 2,533 (36.9%) | 375 (18.6%) |
| 8 or more Rooms | 2,623 (38.2%) | 261 (12.9%) |
| Total | 6,862 (100.0%) | 2,020 (100.0%) |
Housing Structure by Heating Type in Yates County
| Heating Type | Owner-occupied | Renter-occupied |
| Utility Gas | 2,035 (29.7%) | 532 (26.3%) |
| Bottled, Tank, or LP Gas | 1,797 (26.2%) | 301 (14.9%) |
| Electricity | 1,009 (14.7%) | 944 (46.7%) |
| Fuel Oil or Kerosene | 664 (9.7%) | 125 (6.2%) |
| Coal or Coke | 271 (4.0%) | 19 (0.9%) |
| All other Fuels | 1,011 (14.7%) | 99 (4.9%) |
| No Fuel Used | 75 (1.1%) | 0 (0.0%) |
| Total | 6,862 (100.0%) | 2,020 (100.0%) |
Household Vehicle Usage in Yates County
| Vehicles per Household | Owner-occupied | Renter-occupied |
| No Vehicle | 707 (10.3%) | 452 (22.4%) |
| 1 Vehicle | 1,841 (26.8%) | 1,003 (49.6%) |
| 2 Vehicles | 2,729 (39.8%) | 424 (21.0%) |
| 3 or more Vehicles | 1,585 (23.1%) | 141 (7.0%) |
| Total | 6,862 (100.0%) | 2,020 (100.0%) |
Real Estate & Mortgages in Yates County
Real Estate and Mortgage Overview in Yates County
| Characteristic | Without Mortgage | With Mortgage |
| Housing Units | 3,368 | 3,494 |
| Median Property Value | $158,300 | $161,100 |
| Median Household Income | $65,056 | $631 |
| Monthly Housing Costs | $582 | $316 |
| Real Estate Taxes | $3,123 | $162 |
Property Value by Mortgage Status in Yates County
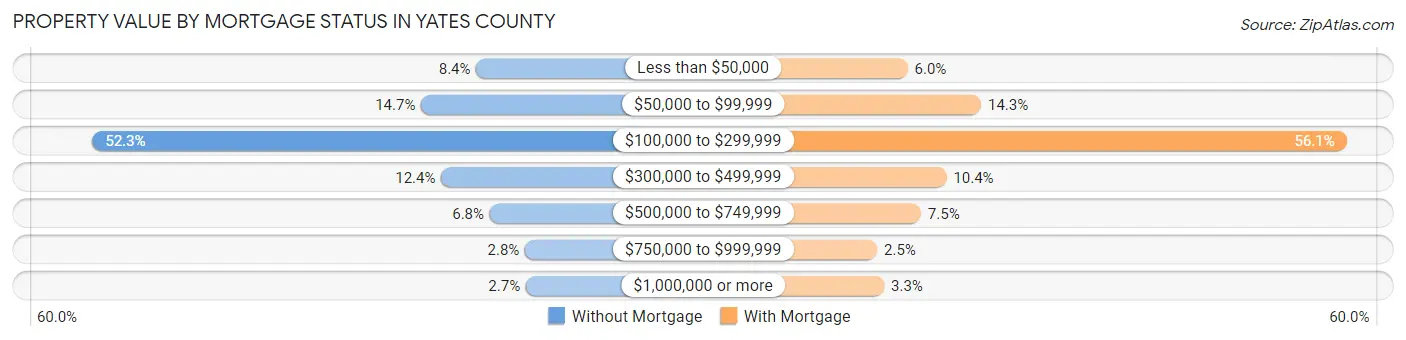
| Property Value | Without Mortgage | With Mortgage |
| Less than $50,000 | 282 (8.4%) | 208 (5.9%) |
| $50,000 to $99,999 | 494 (14.7%) | 501 (14.3%) |
| $100,000 to $299,999 | 1,760 (52.3%) | 1,961 (56.1%) |
| $300,000 to $499,999 | 417 (12.4%) | 363 (10.4%) |
| $500,000 to $749,999 | 230 (6.8%) | 261 (7.5%) |
| $750,000 to $999,999 | 94 (2.8%) | 86 (2.5%) |
| $1,000,000 or more | 91 (2.7%) | 114 (3.3%) |
| Total | 3,368 (100.0%) | 3,494 (100.0%) |
Household Income by Mortgage Status in Yates County
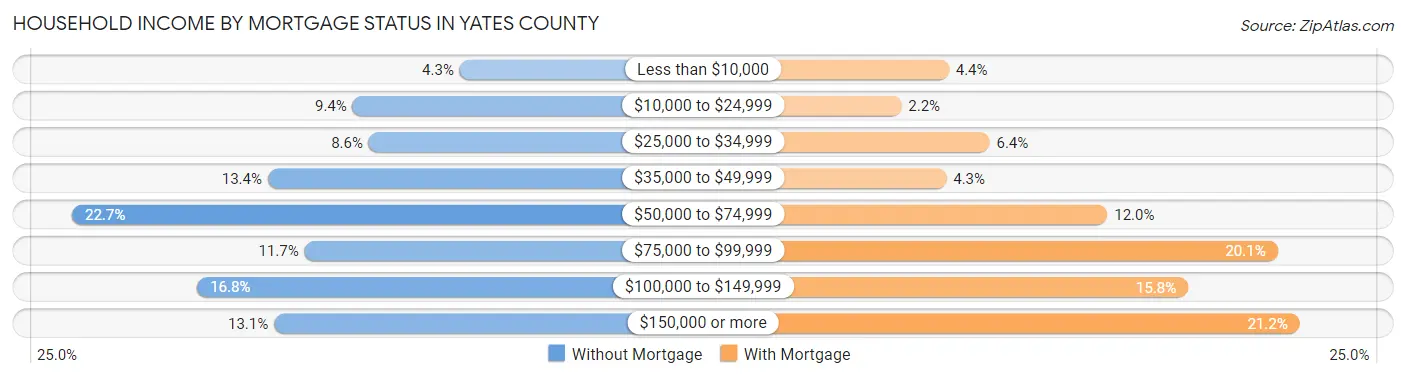
| Household Income | Without Mortgage | With Mortgage |
| Less than $10,000 | 144 (4.3%) | 155 (4.4%) |
| $10,000 to $24,999 | 316 (9.4%) | 76 (2.2%) |
| $25,000 to $34,999 | 290 (8.6%) | 223 (6.4%) |
| $35,000 to $49,999 | 452 (13.4%) | 151 (4.3%) |
| $50,000 to $74,999 | 766 (22.7%) | 419 (12.0%) |
| $75,000 to $99,999 | 393 (11.7%) | 702 (20.1%) |
| $100,000 to $149,999 | 565 (16.8%) | 553 (15.8%) |
| $150,000 or more | 442 (13.1%) | 739 (21.1%) |
| Total | 3,368 (100.0%) | 3,494 (100.0%) |
Property Value to Household Income Ratio in Yates County
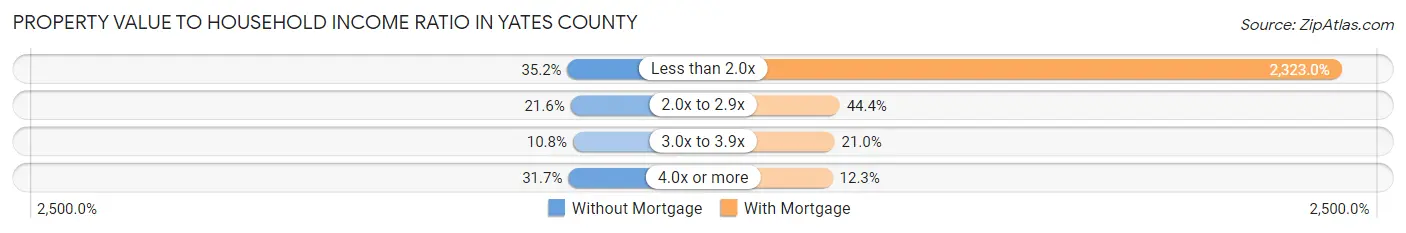
| Value-to-Income Ratio | Without Mortgage | With Mortgage |
| Less than 2.0x | 1,187 (35.2%) | 81,164 (2,323.0%) |
| 2.0x to 2.9x | 726 (21.6%) | 1,550 (44.4%) |
| 3.0x to 3.9x | 365 (10.8%) | 732 (20.9%) |
| 4.0x or more | 1,068 (31.7%) | 430 (12.3%) |
| Total | 3,368 (100.0%) | 3,494 (100.0%) |
Real Estate Taxes by Mortgage Status in Yates County
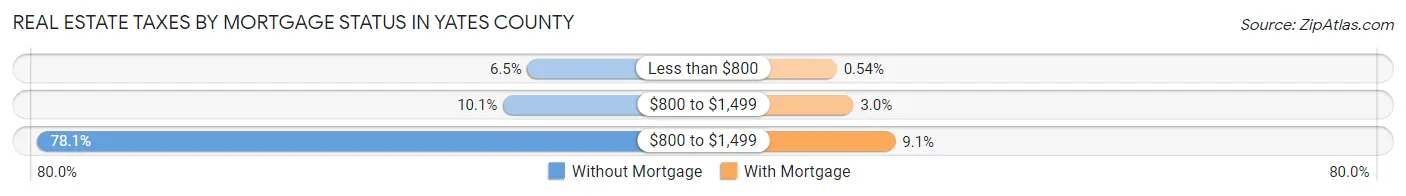
| Property Taxes | Without Mortgage | With Mortgage |
| Less than $800 | 219 (6.5%) | 19 (0.5%) |
| $800 to $1,499 | 339 (10.1%) | 104 (3.0%) |
| $800 to $1,499 | 2,630 (78.1%) | 318 (9.1%) |
| Total | 3,368 (100.0%) | 3,494 (100.0%) |
Health & Disability in Yates County
Health Insurance Coverage by Age in Yates County
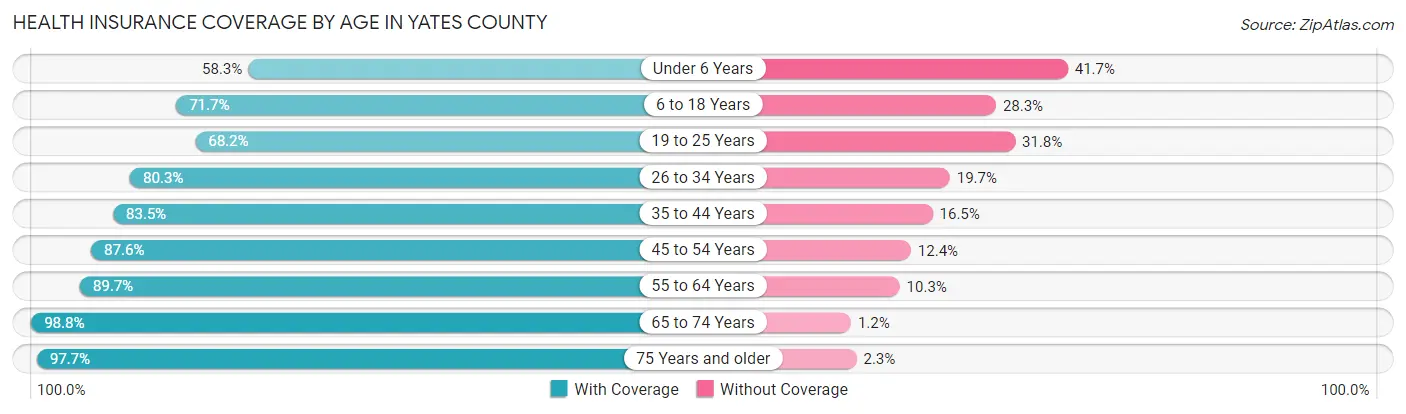
| Age Bracket | With Coverage | Without Coverage |
| Under 6 Years | 995 (58.3%) | 711 (41.7%) |
| 6 to 18 Years | 2,906 (71.7%) | 1,146 (28.3%) |
| 19 to 25 Years | 1,760 (68.2%) | 822 (31.8%) |
| 26 to 34 Years | 1,816 (80.3%) | 445 (19.7%) |
| 35 to 44 Years | 1,953 (83.5%) | 385 (16.5%) |
| 45 to 54 Years | 2,264 (87.6%) | 321 (12.4%) |
| 55 to 64 Years | 3,388 (89.7%) | 390 (10.3%) |
| 65 to 74 Years | 3,106 (98.8%) | 39 (1.2%) |
| 75 Years and older | 1,926 (97.7%) | 45 (2.3%) |
| Total | 20,114 (82.4%) | 4,304 (17.6%) |
Health Insurance Coverage by Citizenship Status in Yates County
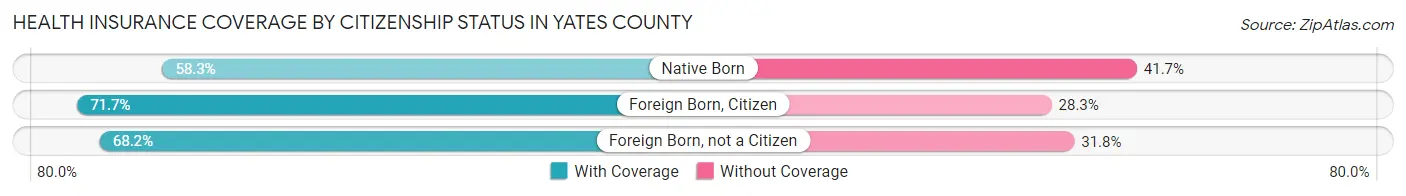
| Citizenship Status | With Coverage | Without Coverage |
| Native Born | 995 (58.3%) | 711 (41.7%) |
| Foreign Born, Citizen | 2,906 (71.7%) | 1,146 (28.3%) |
| Foreign Born, not a Citizen | 1,760 (68.2%) | 822 (31.8%) |
Health Insurance Coverage by Household Income in Yates County
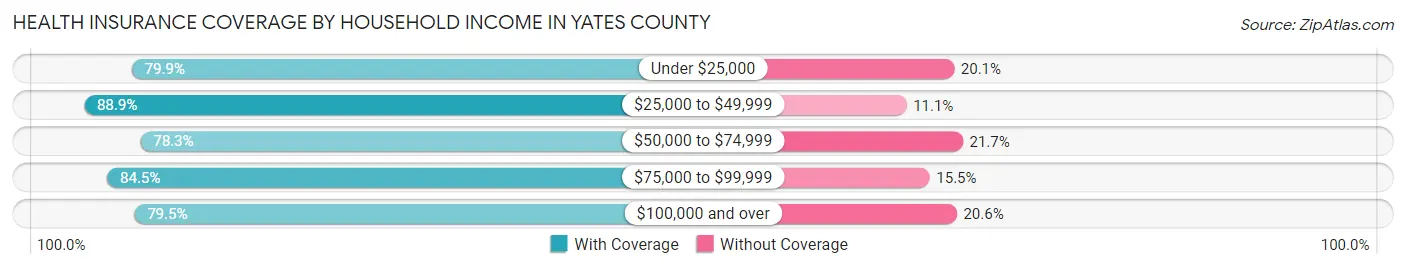
| Household Income | With Coverage | Without Coverage |
| Under $25,000 | 2,148 (79.9%) | 539 (20.1%) |
| $25,000 to $49,999 | 3,914 (88.9%) | 490 (11.1%) |
| $50,000 to $74,999 | 3,760 (78.3%) | 1,041 (21.7%) |
| $75,000 to $99,999 | 2,737 (84.5%) | 501 (15.5%) |
| $100,000 and over | 6,580 (79.4%) | 1,702 (20.5%) |
Public vs Private Health Insurance Coverage by Age in Yates County
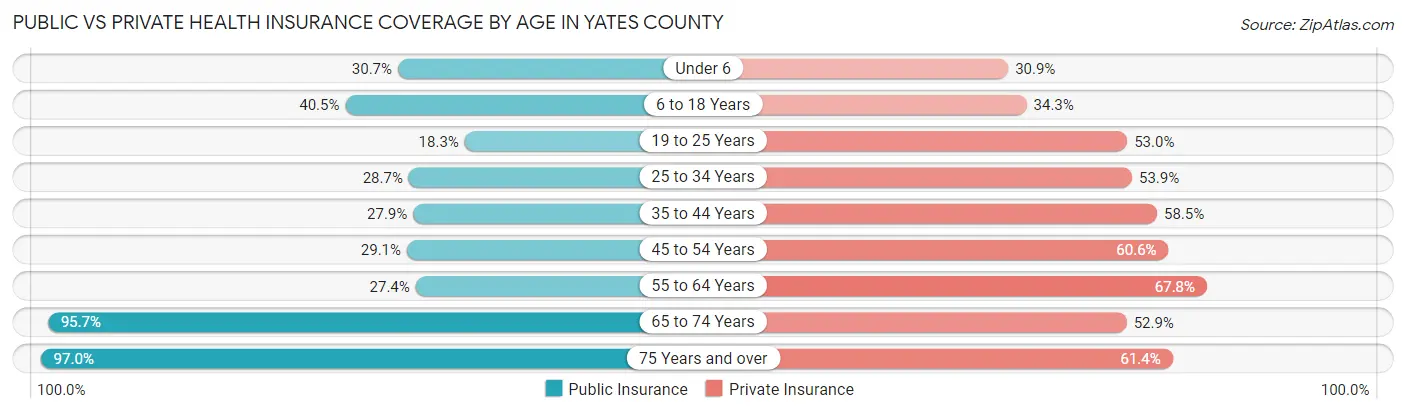
| Age Bracket | Public Insurance | Private Insurance |
| Under 6 | 524 (30.7%) | 527 (30.9%) |
| 6 to 18 Years | 1,640 (40.5%) | 1,390 (34.3%) |
| 19 to 25 Years | 473 (18.3%) | 1,368 (53.0%) |
| 25 to 34 Years | 649 (28.7%) | 1,218 (53.9%) |
| 35 to 44 Years | 652 (27.9%) | 1,368 (58.5%) |
| 45 to 54 Years | 751 (29.0%) | 1,567 (60.6%) |
| 55 to 64 Years | 1,036 (27.4%) | 2,560 (67.8%) |
| 65 to 74 Years | 3,010 (95.7%) | 1,663 (52.9%) |
| 75 Years and over | 1,912 (97.0%) | 1,210 (61.4%) |
| Total | 10,647 (43.6%) | 12,871 (52.7%) |
Disability Status by Sex by Age in Yates County
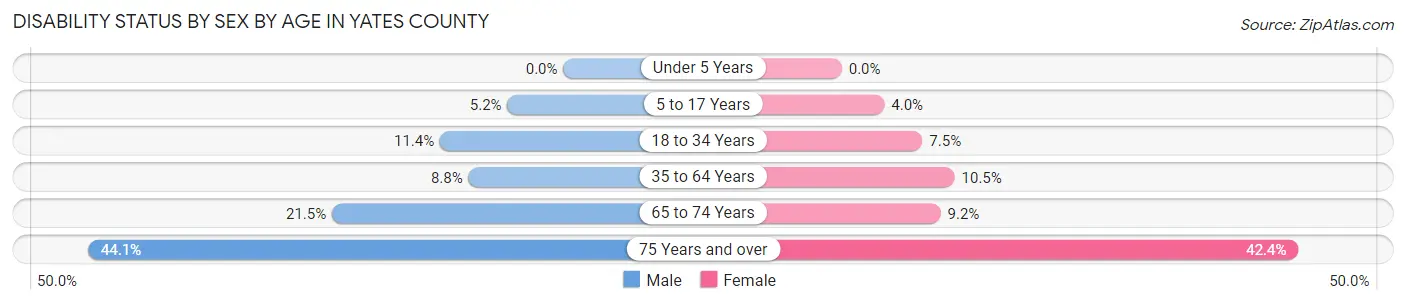
| Age Bracket | Male | Female |
| Under 5 Years | 0 (0.0%) | 0 (0.0%) |
| 5 to 17 Years | 100 (5.2%) | 80 (4.0%) |
| 18 to 34 Years | 290 (11.4%) | 197 (7.5%) |
| 35 to 64 Years | 373 (8.8%) | 467 (10.5%) |
| 65 to 74 Years | 338 (21.5%) | 144 (9.2%) |
| 75 Years and over | 405 (44.1%) | 446 (42.4%) |
Disability Class by Sex by Age in Yates County
Disability Class: Hearing Difficulty
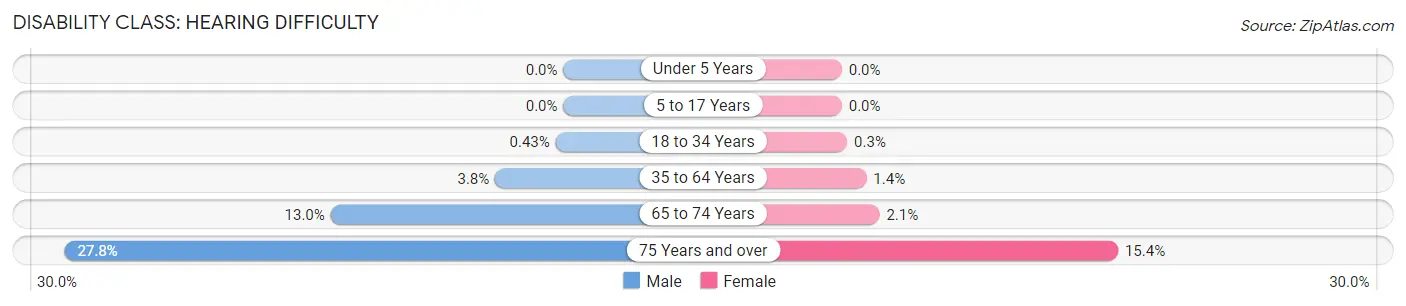
| Age Bracket | Male | Female |
| Under 5 Years | 0 (0.0%) | 0 (0.0%) |
| 5 to 17 Years | 0 (0.0%) | 0 (0.0%) |
| 18 to 34 Years | 11 (0.4%) | 8 (0.3%) |
| 35 to 64 Years | 161 (3.8%) | 61 (1.4%) |
| 65 to 74 Years | 204 (13.0%) | 33 (2.1%) |
| 75 Years and over | 255 (27.8%) | 162 (15.4%) |
Disability Class: Vision Difficulty
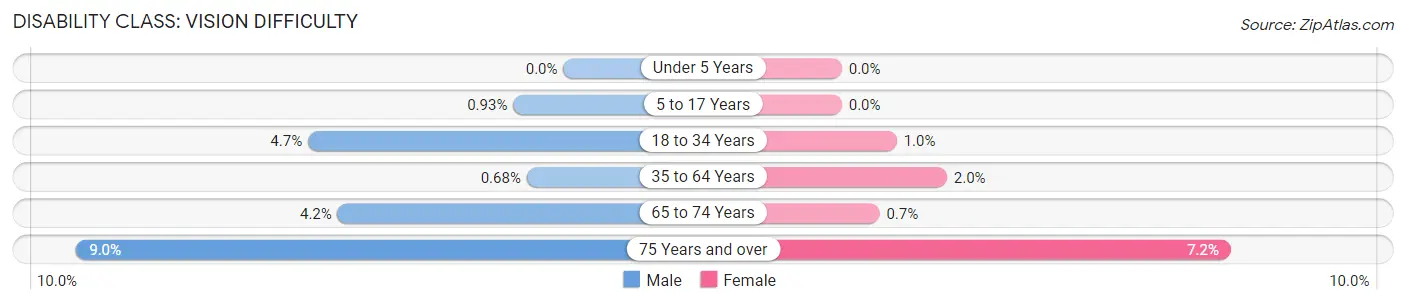
| Age Bracket | Male | Female |
| Under 5 Years | 0 (0.0%) | 0 (0.0%) |
| 5 to 17 Years | 18 (0.9%) | 0 (0.0%) |
| 18 to 34 Years | 120 (4.7%) | 27 (1.0%) |
| 35 to 64 Years | 29 (0.7%) | 87 (1.9%) |
| 65 to 74 Years | 66 (4.2%) | 11 (0.7%) |
| 75 Years and over | 83 (9.0%) | 76 (7.2%) |
Disability Class: Cognitive Difficulty
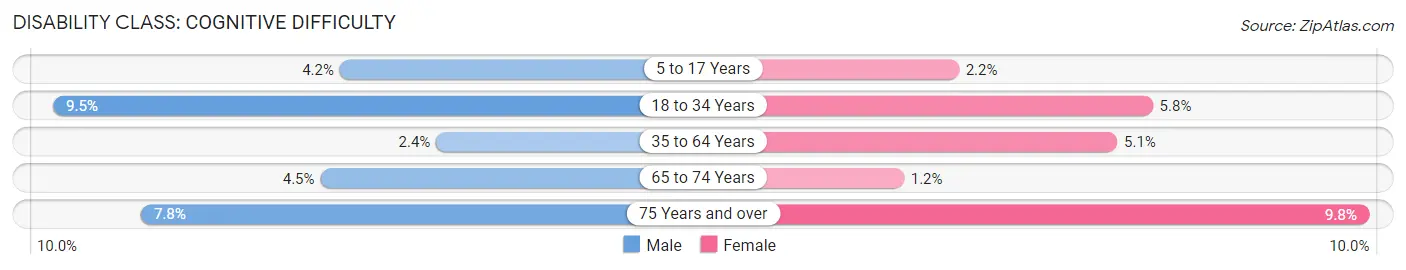
| Age Bracket | Male | Female |
| 5 to 17 Years | 80 (4.2%) | 44 (2.2%) |
| 18 to 34 Years | 240 (9.5%) | 152 (5.8%) |
| 35 to 64 Years | 100 (2.4%) | 228 (5.1%) |
| 65 to 74 Years | 71 (4.5%) | 18 (1.1%) |
| 75 Years and over | 72 (7.8%) | 103 (9.8%) |
Disability Class: Ambulatory Difficulty
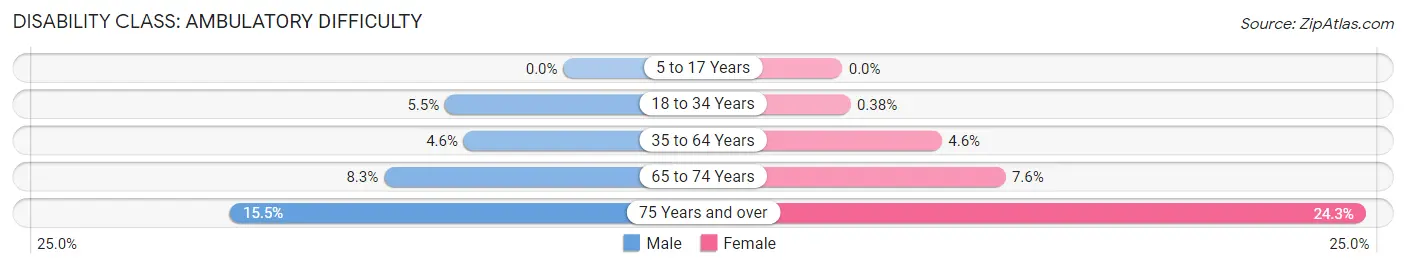
| Age Bracket | Male | Female |
| 5 to 17 Years | 0 (0.0%) | 0 (0.0%) |
| 18 to 34 Years | 139 (5.5%) | 10 (0.4%) |
| 35 to 64 Years | 196 (4.6%) | 206 (4.6%) |
| 65 to 74 Years | 131 (8.3%) | 119 (7.6%) |
| 75 Years and over | 142 (15.5%) | 256 (24.3%) |
Disability Class: Self-Care Difficulty
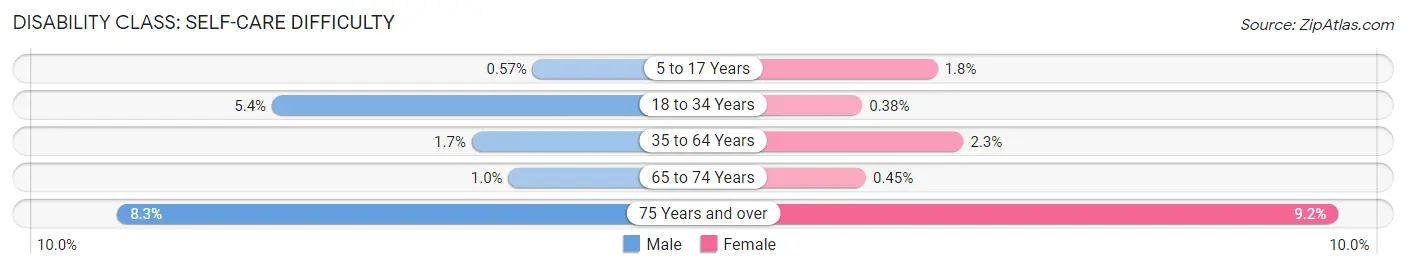
| Age Bracket | Male | Female |
| 5 to 17 Years | 11 (0.6%) | 36 (1.8%) |
| 18 to 34 Years | 137 (5.4%) | 10 (0.4%) |
| 35 to 64 Years | 72 (1.7%) | 101 (2.3%) |
| 65 to 74 Years | 16 (1.0%) | 7 (0.4%) |
| 75 Years and over | 76 (8.3%) | 97 (9.2%) |
Technology Access in Yates County
Computing Device Access in Yates County
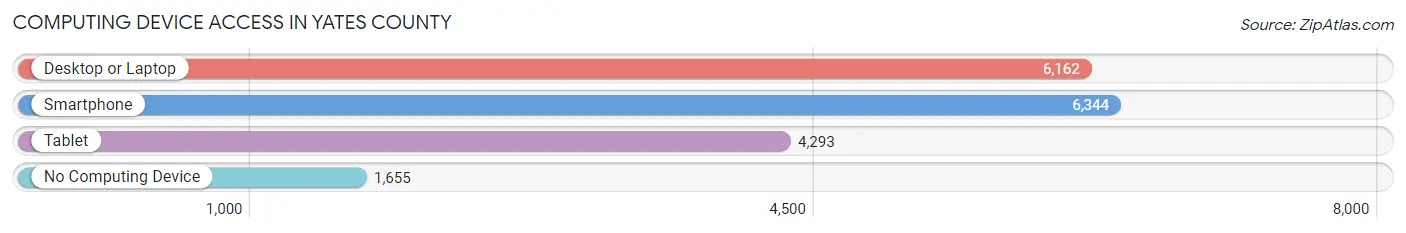
| Device Type | # Households | % Households |
| Desktop or Laptop | 6,162 | 69.4% |
| Smartphone | 6,344 | 71.4% |
| Tablet | 4,293 | 48.3% |
| No Computing Device | 1,655 | 18.6% |
| Total | 8,882 | 100.0% |
Internet Access in Yates County
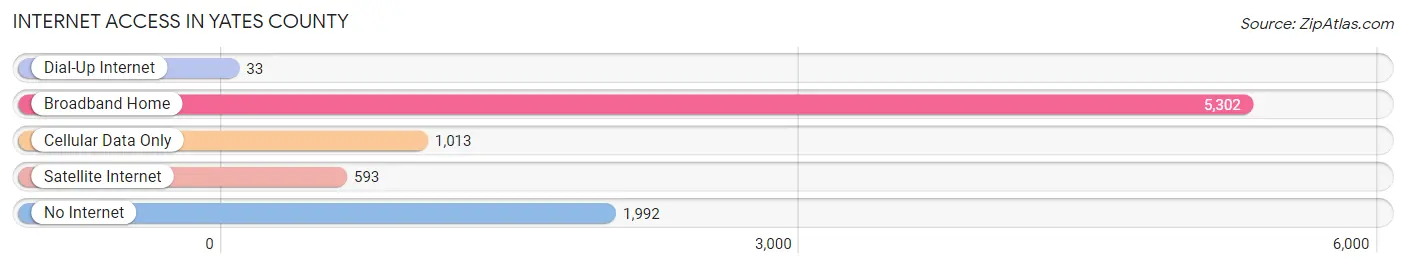
| Internet Type | # Households | % Households |
| Dial-Up Internet | 33 | 0.4% |
| Broadband Home | 5,302 | 59.7% |
| Cellular Data Only | 1,013 | 11.4% |
| Satellite Internet | 593 | 6.7% |
| No Internet | 1,992 | 22.4% |
| Total | 8,882 | 100.0% |
Yates County Summary
Yates County is located in the Finger Lakes region of New York State. It is bordered by Seneca, Schuyler, Steuben, and Ontario Counties. The county seat is Penn Yan. The county was established in 1823 and named after Joseph C. Yates, the Governor of New York from 1823 to 1824.
Geography
Yates County covers an area of 517 square miles and is located in the Finger Lakes region of New York State. The terrain is mostly rolling hills and valleys, with some flat areas in the northern part of the county. The highest point in the county is 1,945 feet above sea level, located in the town of Jerusalem. The county is drained by several creeks and rivers, including the Canandaigua Outlet, Keuka Lake Outlet, and Seneca River.
The climate of Yates County is generally humid continental, with cold winters and warm summers. The average annual temperature is around 48°F, and the average annual precipitation is around 40 inches.
Demographics
As of the 2010 census, Yates County had a population of 25,348. The population density was 49 people per square mile. The racial makeup of the county was 95.3% White, 1.3% African American, 0.3% Native American, 0.7% Asian, 0.1% Pacific Islander, 0.7% from other races, and 1.6% from two or more races. Hispanic or Latino of any race were 2.3% of the population.
The median income for a household in the county was $45,945, and the median income for a family was $54,945. The per capita income for the county was $22,945. About 8.3% of families and 11.2% of the population were below the poverty line, including 15.2% of those under age 18 and 7.2% of those age 65 or over.
Economy
Yates County’s economy is largely based on agriculture and tourism. The county is home to several wineries, and the Finger Lakes Wine Trail runs through the county. Agriculture is the main industry in the county, with dairy farming being the most important. Other agricultural products include apples, grapes, corn, and hay.
The county also has a growing manufacturing sector, with several companies located in the area. The largest employers in the county are the Finger Lakes Health System, the Penn Yan Central School District, and the Yates County government.
Conclusion
Yates County is located in the Finger Lakes region of New York State. It is bordered by Seneca, Schuyler, Steuben, and Ontario Counties. The county was established in 1823 and named after Joseph C. Yates, the Governor of New York from 1823 to 1824. As of the 2010 census, Yates County had a population of 25,348. The economy of the county is largely based on agriculture and tourism. The county is home to several wineries, and the Finger Lakes Wine Trail runs through the county. Agriculture is the main industry in the county, with dairy farming being the most important. The county also has a growing manufacturing sector, with several companies located in the area.
Common Questions
What is Per Capita Income in Yates County?
Per Capita income in Yates County is $32,291.
What is the Median Family Income in Yates County?
Median Family Income in Yates County is $79,139.
What is the Median Household income in Yates County?
Median Household Income in Yates County is $63,974.
What is Income or Wage Gap in Yates County?
Income or Wage Gap in Yates County is 26.7%.
Women in Yates County earn 73.3 cents for every dollar earned by a man.
What is Family Income Deficit in Yates County?
Family Income Deficit in Yates County is $11,928.
Families that are below poverty line in Yates County earn $11,928 less on average than the poverty threshold level.
What is Inequality or Gini Index in Yates County?
Inequality or Gini Index in Yates County is 0.45.
What is the Total Population of Yates County?
Total Population of Yates County is 24,713.
What is the Total Male Population of Yates County?
Total Male Population of Yates County is 12,105.
What is the Total Female Population of Yates County?
Total Female Population of Yates County is 12,608.
What is the Ratio of Males per 100 Females in Yates County?
There are 96.01 Males per 100 Females in Yates County.
What is the Ratio of Females per 100 Males in Yates County?
There are 104.16 Females per 100 Males in Yates County.
What is the Median Population Age in Yates County?
Median Population Age in Yates County is 41.7 Years.
What is the Average Family Size in Yates County
Average Family Size in Yates County is 3.3 People.
What is the Average Household Size in Yates County
Average Household Size in Yates County is 2.6 People.
How Large is the Labor Force in Yates County?
There are 11,192 People in the Labor Forcein in Yates County.
What is the Percentage of People in the Labor Force in Yates County?
56.3% of People are in the Labor Force in Yates County.
What is the Unemployment Rate in Yates County?
Unemployment Rate in Yates County is 3.2%.