Area Code 607 Map & Demographics
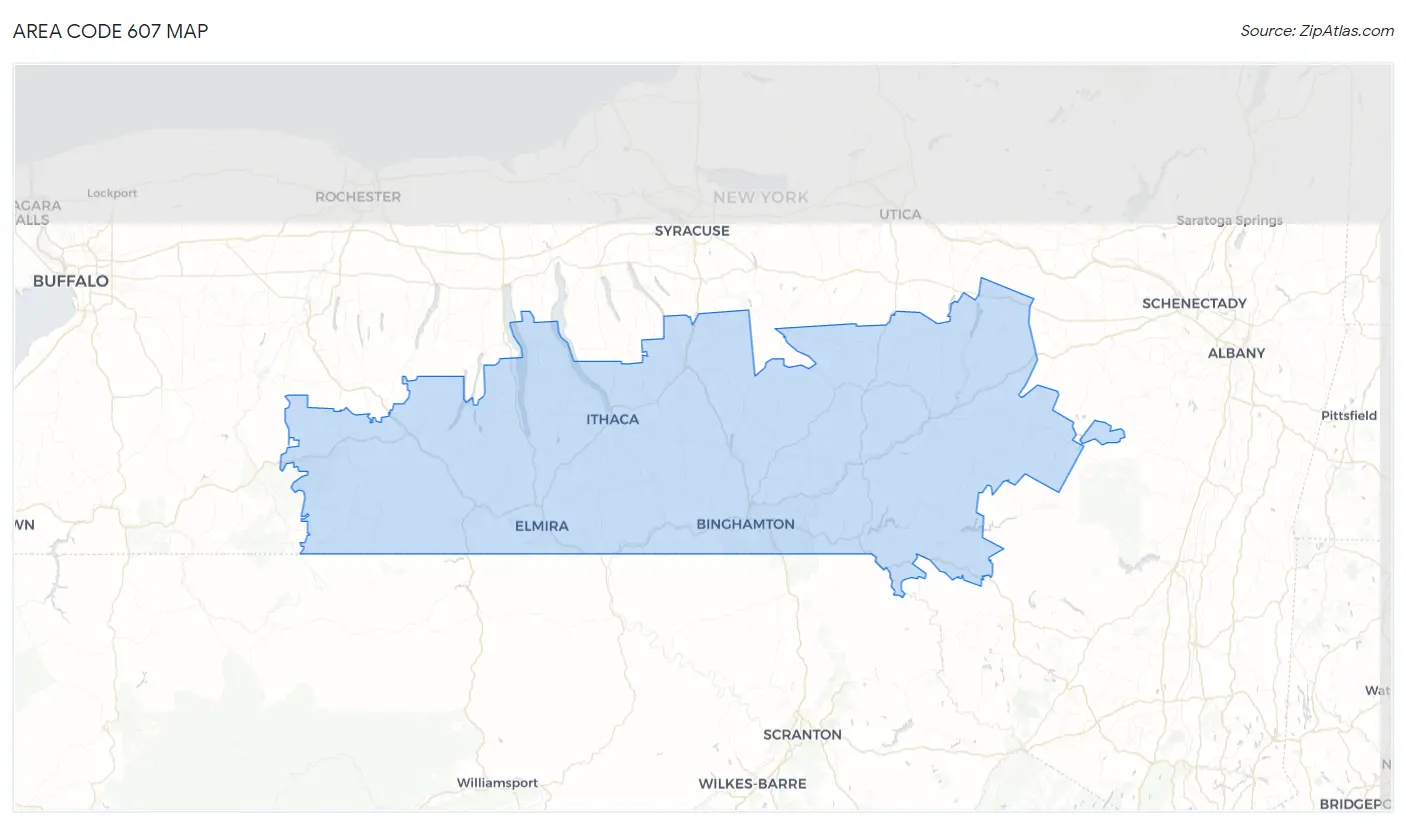
Area Code 607 Map
Area Code 607 Overview
$33,801
PER CAPITA INCOME
$81,509
AVG FAMILY INCOME
$65,440
AVG HOUSEHOLD INCOME
27.8%
WAGE / INCOME GAP [ % ]
72.2¢/ $1
WAGE / INCOME GAP [ $ ]
$10,543
FAMILY INCOME DEFICIT
63.94
INEQUALITY / GINI INDEX
716,219
TOTAL POPULATION
356,005
MALE POPULATION
360,214
FEMALE POPULATION
98.83
MALES / 100 FEMALES
101.18
FEMALES / 100 MALES
44.2
MEDIAN AGE
3.0
AVG FAMILY SIZE
2.4
AVG HOUSEHOLD SIZE
350,474
LABOR FORCE [ PEOPLE ]
58.4%
PERCENT IN LABOR FORCE
6.3%
UNEMPLOYMENT RATE
Income in Area Code 607
Income Overview in Area Code 607
Per Capita Income in Area Code 607 is $33,801, while median incomes of families and households are $81,509 and $65,440 respectively.
| Characteristic | Number | Measure |
| Per Capita Income | 716,219 | $33,801 |
| Median Family Income | 170,997 | $81,509 |
| Mean Family Income | 170,997 | $14,915,735 |
| Median Household Income | 293,285 | $65,440 |
| Mean Household Income | 293,285 | $12,883,590 |
| Income Deficit | 170,997 | $10,543 |
| Wage / Income Gap (%) | 716,219 | 27.80% |
| Wage / Income Gap ($) | 716,219 | 72.20¢ per $1 |
| Gini / Inequality Index | 716,219 | 63.94 |
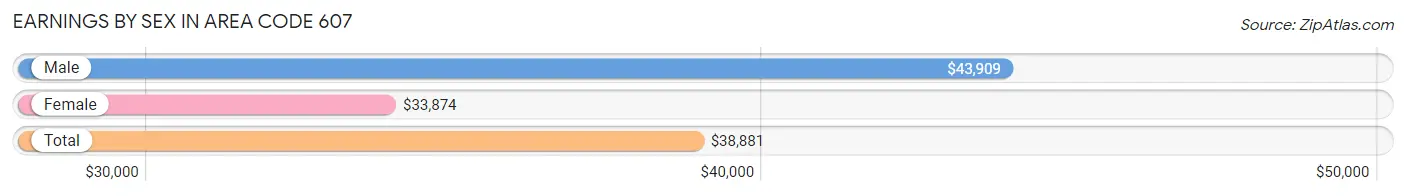
Earnings by Sex in Area Code 607
Average Earnings in Area Code 607 are $38,881, $43,909 for men and $33,874 for women, a difference of 22.9%.
| Sex | Number | Average Earnings |
| Male | 193,887 (51.9%) | $43,909 |
| Female | 179,982 (48.1%) | $33,874 |
| Total | 373,869 (100.0%) | $38,881 |
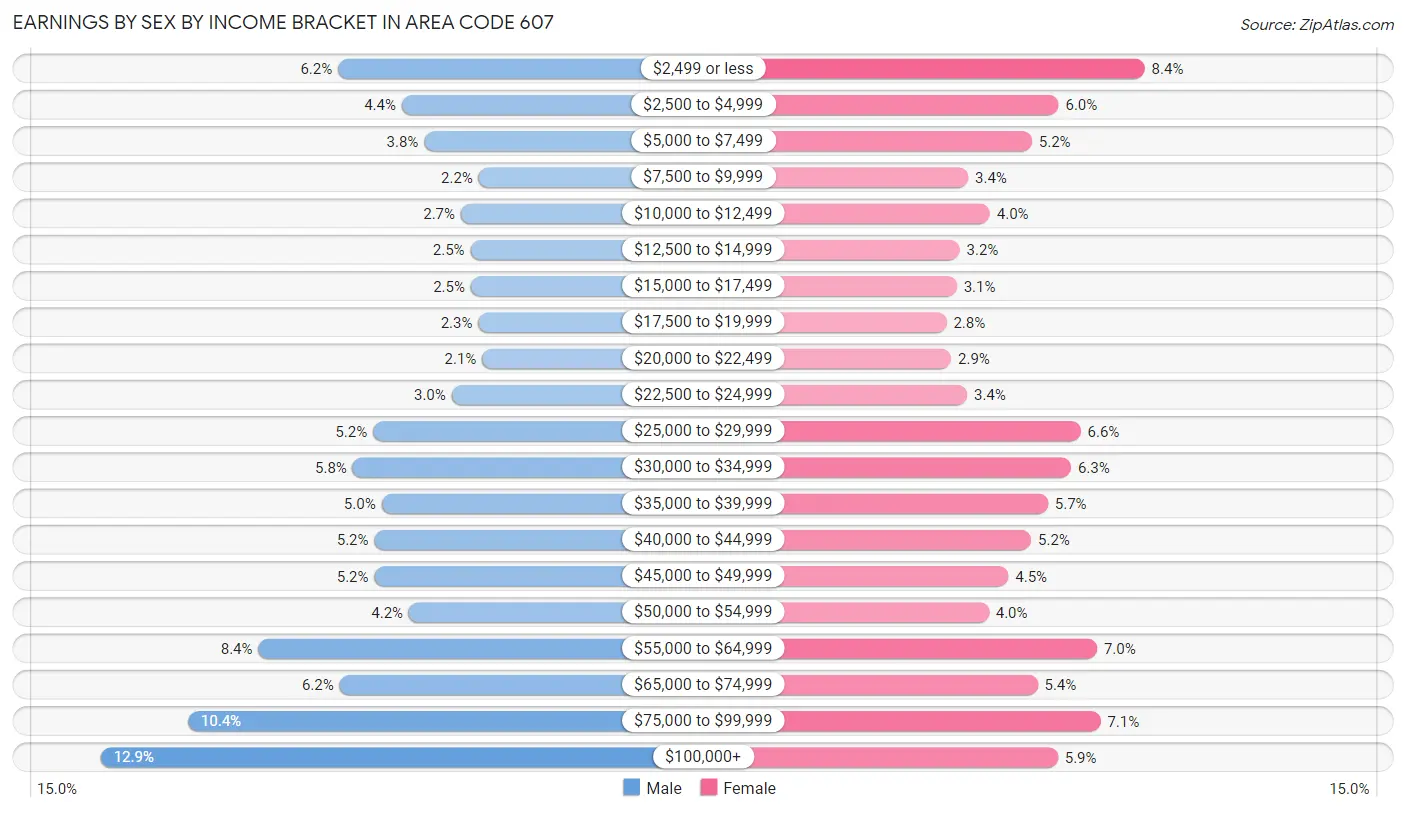
Earnings by Sex by Income Bracket in Area Code 607
The most common earnings brackets in Area Code 607 are $100,000+ for men (24,939 | 12.9%) and $2,499 or less for women (15,067 | 8.4%).
| Income | Male | Female |
| $2,499 or less | 11,997 (6.2%) | 15,067 (8.4%) |
| $2,500 to $4,999 | 8,529 (4.4%) | 10,704 (5.9%) |
| $5,000 to $7,499 | 7,310 (3.8%) | 9,359 (5.2%) |
| $7,500 to $9,999 | 4,346 (2.2%) | 6,131 (3.4%) |
| $10,000 to $12,499 | 5,322 (2.7%) | 7,228 (4.0%) |
| $12,500 to $14,999 | 4,797 (2.5%) | 5,699 (3.2%) |
| $15,000 to $17,499 | 4,767 (2.5%) | 5,570 (3.1%) |
| $17,500 to $19,999 | 4,362 (2.2%) | 5,046 (2.8%) |
| $20,000 to $22,499 | 4,140 (2.1%) | 5,282 (2.9%) |
| $22,500 to $24,999 | 5,812 (3.0%) | 6,080 (3.4%) |
| $25,000 to $29,999 | 10,095 (5.2%) | 11,821 (6.6%) |
| $30,000 to $34,999 | 11,211 (5.8%) | 11,345 (6.3%) |
| $35,000 to $39,999 | 9,637 (5.0%) | 10,164 (5.7%) |
| $40,000 to $44,999 | 10,021 (5.2%) | 9,329 (5.2%) |
| $45,000 to $49,999 | 10,023 (5.2%) | 8,171 (4.5%) |
| $50,000 to $54,999 | 8,148 (4.2%) | 7,188 (4.0%) |
| $55,000 to $64,999 | 16,335 (8.4%) | 12,658 (7.0%) |
| $65,000 to $74,999 | 11,922 (6.1%) | 9,641 (5.4%) |
| $75,000 to $99,999 | 20,174 (10.4%) | 12,834 (7.1%) |
| $100,000+ | 24,939 (12.9%) | 10,665 (5.9%) |
| Total | 193,887 (100.0%) | 179,982 (100.0%) |
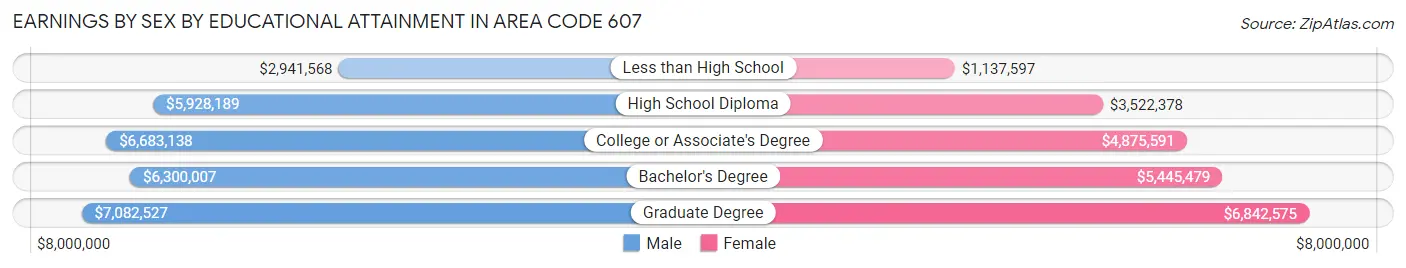
Earnings by Sex by Educational Attainment in Area Code 607
Average earnings in Area Code 607 are $7,423,198 for men and $5,621,129 for women, a difference of 24.3%. Men with an educational attainment of graduate degree enjoy the highest average annual earnings of $7,082,527, while those with less than high school education earn the least with $2,941,568. Women with an educational attainment of graduate degree earn the most with the average annual earnings of $6,842,575, while those with less than high school education have the smallest earnings of $1,137,597.
| Educational Attainment | Male Income | Female Income |
| Less than High School | $2,941,568 | $1,137,597 |
| High School Diploma | $5,928,189 | $3,522,378 |
| College or Associate's Degree | $6,683,138 | $4,875,591 |
| Bachelor's Degree | $6,300,007 | $5,445,479 |
| Graduate Degree | $7,082,527 | $6,842,575 |
| Total | $7,423,198 | $5,621,129 |
Family Income in Area Code 607
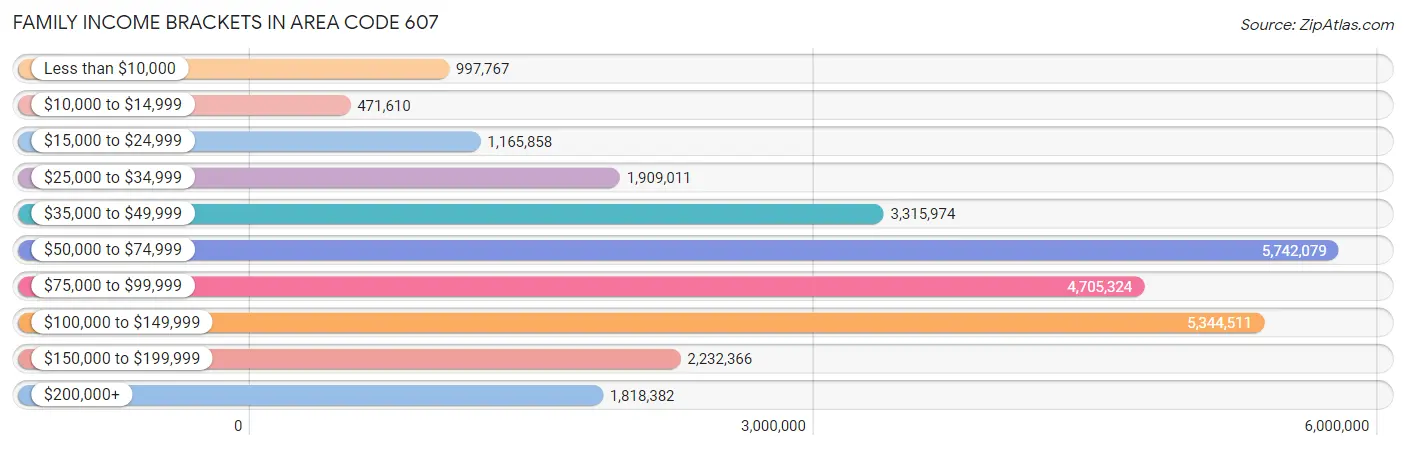
Family Income Brackets in Area Code 607
According to the Area Code 607 family income data, there are 5,742,079 families falling into the $50,000 to $74,999 income range, which is the most common income bracket and makes up 3,358.0% of all families. Conversely, the $10,000 to $14,999 income bracket is the least frequent group with only 471,610 families (275.8%) belonging to this category.
| Income Bracket | # Families | % Families |
| Less than $10,000 | 997,767 | 583.5% |
| $10,000 to $14,999 | 471,610 | 275.8% |
| $15,000 to $24,999 | 1,165,858 | 681.8% |
| $25,000 to $34,999 | 1,909,011 | 1,116.4% |
| $35,000 to $49,999 | 3,315,974 | 1,939.2% |
| $50,000 to $74,999 | 5,742,079 | 3,358.0% |
| $75,000 to $99,999 | 4,705,324 | 2,751.7% |
| $100,000 to $149,999 | 5,344,511 | 3,125.5% |
| $150,000 to $199,999 | 2,232,366 | 1,305.5% |
| $200,000+ | 1,818,382 | 1,063.4% |
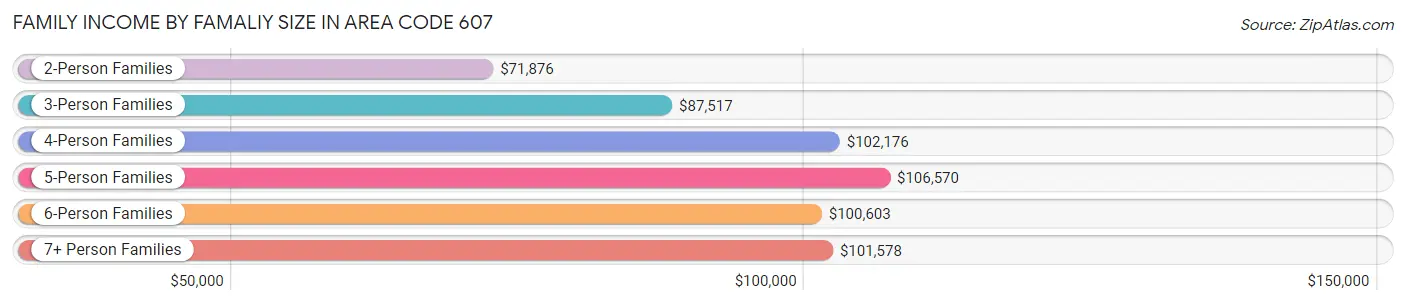
Family Income by Famaliy Size in Area Code 607
5-person families (11,125 | 6.5%) account for the highest median family income in Area Code 607 with $106,570 per family, while 2-person families (93,268 | 54.5%) have the highest median income of $35,938 per family member.
| Income Bracket | # Families | Median Income |
| 2-Person Families | 93,268 (54.5%) | $71,876 |
| 3-Person Families | 35,302 (20.6%) | $87,517 |
| 4-Person Families | 25,621 (15.0%) | $102,176 |
| 5-Person Families | 11,125 (6.5%) | $106,570 |
| 6-Person Families | 3,742 (2.2%) | $100,603 |
| 7+ Person Families | 1,939 (1.1%) | $101,578 |
| Total | 170,997 (100.0%) | $81,509 |
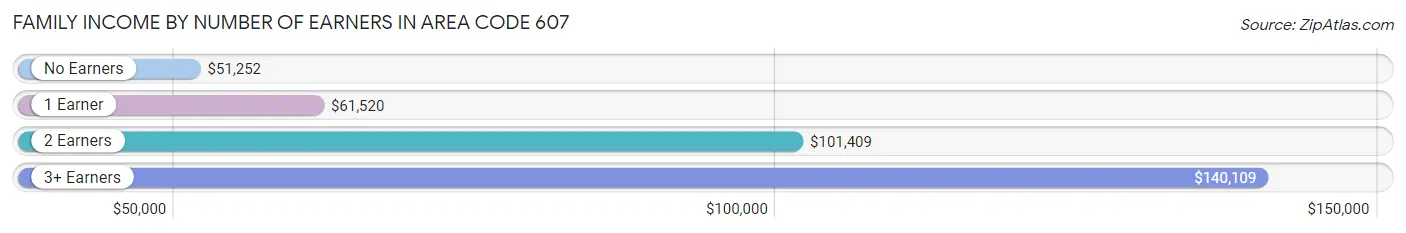
Family Income by Number of Earners in Area Code 607
The median family income in Area Code 607 is $81,509, with families comprising 3+ earners (15,919) having the highest median family income of $140,109, while families with no earners (31,788) have the lowest median family income of $51,252, accounting for 9.3% and 18.6% of families, respectively.
| Number of Earners | # Families | Median Income |
| No Earners | 31,788 (18.6%) | $51,252 |
| 1 Earner | 55,605 (32.5%) | $61,520 |
| 2 Earners | 67,685 (39.6%) | $101,409 |
| 3+ Earners | 15,919 (9.3%) | $140,109 |
| Total | 170,997 (100.0%) | $81,509 |
Household Income in Area Code 607
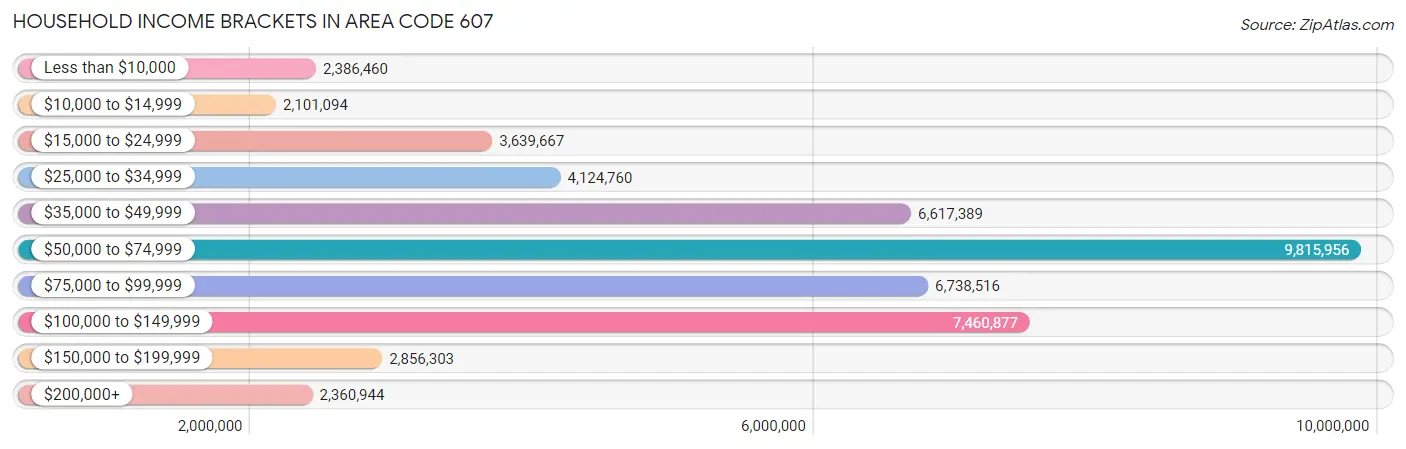
Household Income Brackets in Area Code 607
With 9,815,956 households falling in the category, the $50,000 to $74,999 income range is the most frequent in Area Code 607, accounting for 3,346.9% of all households. In contrast, only 2,101,094 households (716.4%) fall into the $10,000 to $14,999 income bracket, making it the least populous group.
| Income Bracket | # Households | % Households |
| Less than $10,000 | 2,386,460 | 813.7% |
| $10,000 to $14,999 | 2,101,094 | 716.4% |
| $15,000 to $24,999 | 3,639,667 | 1,241.0% |
| $25,000 to $34,999 | 4,124,760 | 1,406.4% |
| $35,000 to $49,999 | 6,617,389 | 2,256.3% |
| $50,000 to $74,999 | 9,815,956 | 3,346.9% |
| $75,000 to $99,999 | 6,738,516 | 2,297.6% |
| $100,000 to $149,999 | 7,460,877 | 2,543.9% |
| $150,000 to $199,999 | 2,856,303 | 973.9% |
| $200,000+ | 2,360,944 | 805.0% |
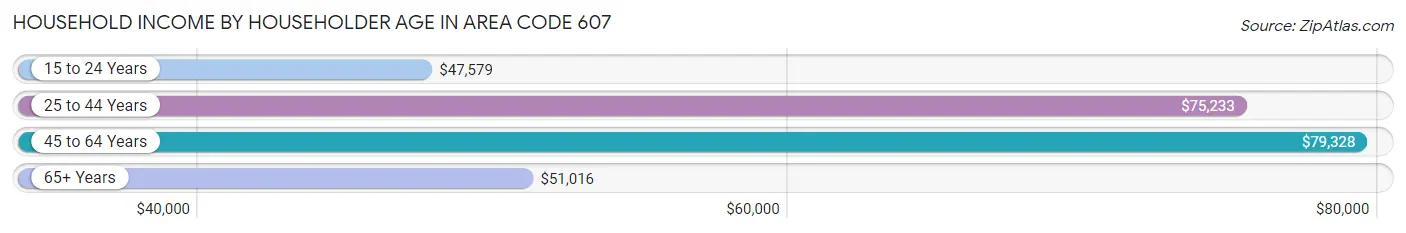
Household Income by Householder Age in Area Code 607
The median household income in Area Code 607 is $65,440, with the highest median household income of $79,328 found in the 45 to 64 years age bracket for the primary householder. A total of 106,577 households (36.3%) fall into this category. Meanwhile, the 15 to 24 years age bracket for the primary householder has the lowest median household income of $47,579, with 19,076 households (6.5%) in this group.
| Income Bracket | # Households | Median Income |
| 15 to 24 Years | 19,076 (6.5%) | $47,579 |
| 25 to 44 Years | 77,942 (26.6%) | $75,233 |
| 45 to 64 Years | 106,577 (36.3%) | $79,328 |
| 65+ Years | 89,690 (30.6%) | $51,016 |
| Total | 293,285 (100.0%) | $65,440 |
Poverty in Area Code 607
Income Below Poverty by Sex and Age in Area Code 607
With 14.1% poverty level for males and 16.6% for females among the residents of Area Code 607, 18 to 24 year old males and 18 to 24 year old females are the most vulnerable to poverty, with 11,312 males (30.9%) and 13,792 females (40.1%) in their respective age groups living below the poverty level.
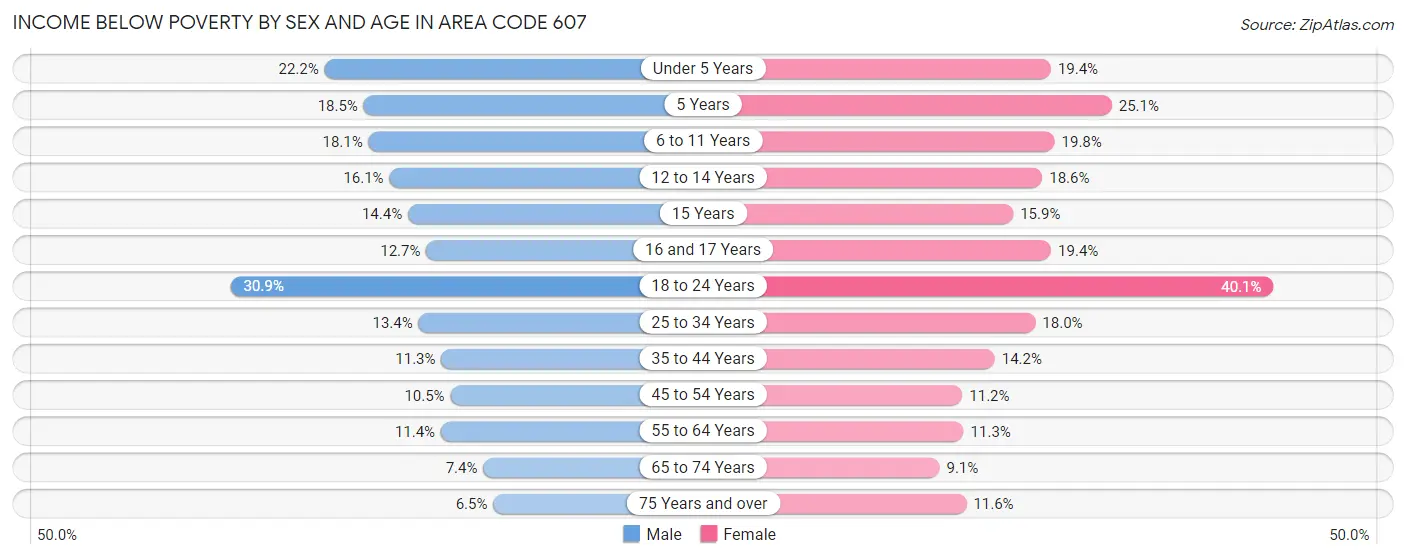
| Age Bracket | Male | Female |
| Under 5 Years | 3,684 (22.2%) | 3,094 (19.4%) |
| 5 Years | 645 (18.5%) | 796 (25.1%) |
| 6 to 11 Years | 4,000 (18.1%) | 3,963 (19.8%) |
| 12 to 14 Years | 1,945 (16.1%) | 2,168 (18.6%) |
| 15 Years | 569 (14.4%) | 627 (15.9%) |
| 16 and 17 Years | 996 (12.7%) | 1,481 (19.4%) |
| 18 to 24 Years | 11,312 (30.9%) | 13,792 (40.1%) |
| 25 to 34 Years | 5,429 (13.4%) | 6,935 (18.0%) |
| 35 to 44 Years | 4,298 (11.3%) | 5,464 (14.2%) |
| 45 to 54 Years | 4,229 (10.5%) | 4,537 (11.2%) |
| 55 to 64 Years | 5,667 (11.4%) | 5,703 (11.3%) |
| 65 to 74 Years | 2,866 (7.4%) | 3,679 (9.1%) |
| 75 Years and over | 1,536 (6.5%) | 3,789 (11.6%) |
| Total | 47,176 (14.1%) | 56,028 (16.6%) |
Income Above Poverty by Sex and Age in Area Code 607
According to the poverty statistics in Area Code 607, males aged 75 years and over and females aged 65 to 74 years are the age groups that are most secure financially, with 93.5% of males and 90.9% of females in these age groups living above the poverty line.
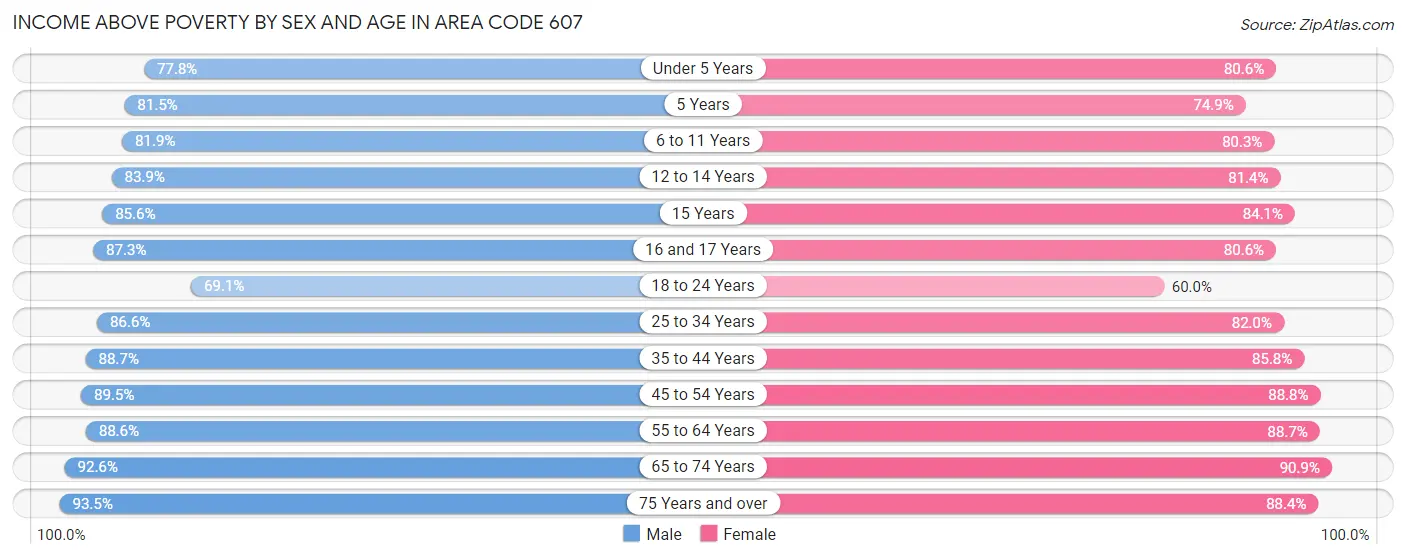
| Age Bracket | Male | Female |
| Under 5 Years | 12,940 (77.8%) | 12,850 (80.6%) |
| 5 Years | 2,835 (81.5%) | 2,380 (74.9%) |
| 6 to 11 Years | 18,122 (81.9%) | 16,102 (80.2%) |
| 12 to 14 Years | 10,109 (83.9%) | 9,481 (81.4%) |
| 15 Years | 3,377 (85.6%) | 3,315 (84.1%) |
| 16 and 17 Years | 6,832 (87.3%) | 6,141 (80.6%) |
| 18 to 24 Years | 25,303 (69.1%) | 20,649 (60.0%) |
| 25 to 34 Years | 34,978 (86.6%) | 31,649 (82.0%) |
| 35 to 44 Years | 33,675 (88.7%) | 33,009 (85.8%) |
| 45 to 54 Years | 36,142 (89.5%) | 36,004 (88.8%) |
| 55 to 64 Years | 44,227 (88.6%) | 44,737 (88.7%) |
| 65 to 74 Years | 35,713 (92.6%) | 36,905 (90.9%) |
| 75 Years and over | 22,109 (93.5%) | 28,955 (88.4%) |
| Total | 286,362 (85.9%) | 282,177 (83.4%) |
Income Below Poverty Among Married-Couple Families in Area Code 607
The poverty statistics for married-couple families in Area Code 607 show that 4.2% or 5,385 of the total 128,120 families live below the poverty line. Families with 5 or more children have the highest poverty rate of 40.8%, comprising of 428 families. On the other hand, families with no children have the lowest poverty rate of 2.8%, which includes 2,383 families.
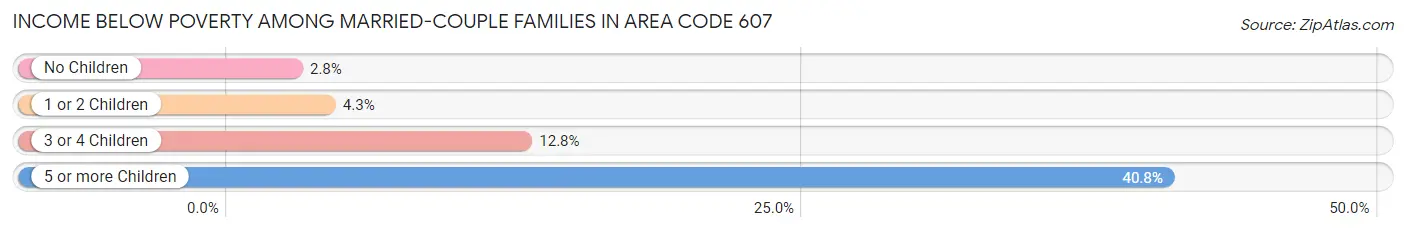
| Children | Above Poverty | Below Poverty |
| No Children | 81,780 (97.2%) | 2,383 (2.8%) |
| 1 or 2 Children | 32,737 (95.7%) | 1,458 (4.3%) |
| 3 or 4 Children | 7,596 (87.2%) | 1,116 (12.8%) |
| 5 or more Children | 622 (59.2%) | 428 (40.8%) |
| Total | 122,735 (95.8%) | 5,385 (4.2%) |
Income Below Poverty Among Single-Parent Households in Area Code 607
According to the poverty data in Area Code 607, 15.1% or 2,088 single-father households and 26.7% or 7,744 single-mother households are living below the poverty line. Among single-father households, those with 5 or more children have the highest poverty rate, with 24 households (34.8%) experiencing poverty. Likewise, among single-mother households, those with 5 or more children have the highest poverty rate, with 251 households (67.5%) falling below the poverty line.
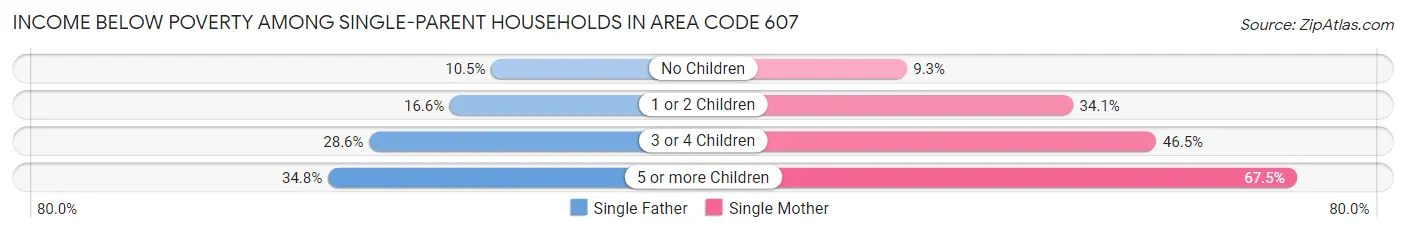
| Children | Single Father | Single Mother |
| No Children | 585 (10.5%) | 969 (9.3%) |
| 1 or 2 Children | 1,199 (16.6%) | 5,425 (34.1%) |
| 3 or 4 Children | 280 (28.6%) | 1,099 (46.5%) |
| 5 or more Children | 24 (34.8%) | 251 (67.5%) |
| Total | 2,088 (15.1%) | 7,744 (26.7%) |
Income Below Poverty Among Married-Couple vs Single-Parent Households in Area Code 607
The poverty data for Area Code 607 shows that 5,385 of the married-couple family households (4.2%) and 9,832 of the single-parent households (22.9%) are living below the poverty level. Within the married-couple family households, those with 5 or more children have the highest poverty rate, with 428 households (40.8%) falling below the poverty line. Among the single-parent households, those with 5 or more children have the highest poverty rate, with 275 household (62.4%) living below poverty.
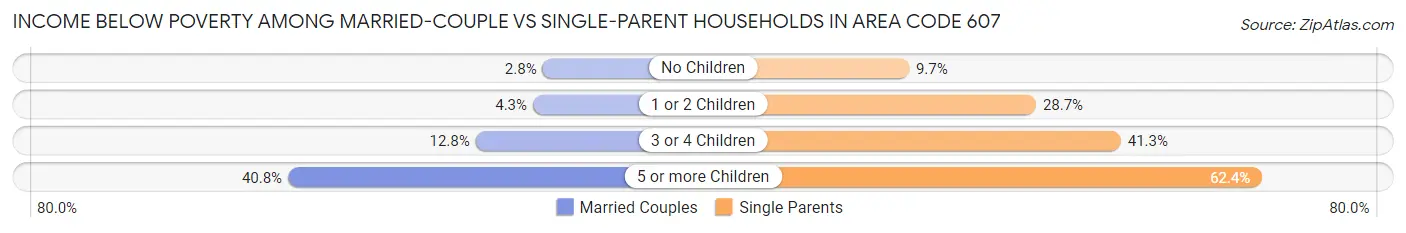
| Children | Married-Couple Families | Single-Parent Households |
| No Children | 2,383 (2.8%) | 1,554 (9.7%) |
| 1 or 2 Children | 1,458 (4.3%) | 6,624 (28.6%) |
| 3 or 4 Children | 1,116 (12.8%) | 1,379 (41.3%) |
| 5 or more Children | 428 (40.8%) | 275 (62.4%) |
| Total | 5,385 (4.2%) | 9,832 (22.9%) |
Race in Area Code 607
The most populous races in Area Code 607 are White / Caucasian (624,166 | 87.2%), Two or more Races (30,883 | 4.3%), and Hispanic or Latino (27,096 | 3.8%).
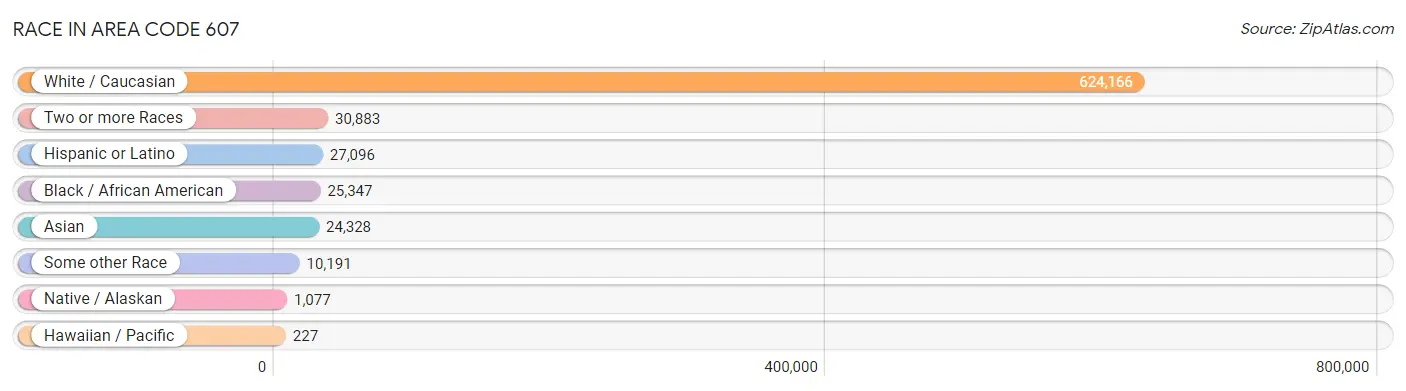
| Race | # Population | % Population |
| Asian | 24,328 | 3.4% |
| Black / African American | 25,347 | 3.5% |
| Hawaiian / Pacific | 227 | 0.0% |
| Hispanic or Latino | 27,096 | 3.8% |
| Native / Alaskan | 1,077 | 0.2% |
| White / Caucasian | 624,166 | 87.2% |
| Two or more Races | 30,883 | 4.3% |
| Some other Race | 10,191 | 1.4% |
| Total | 716,219 | 100.0% |
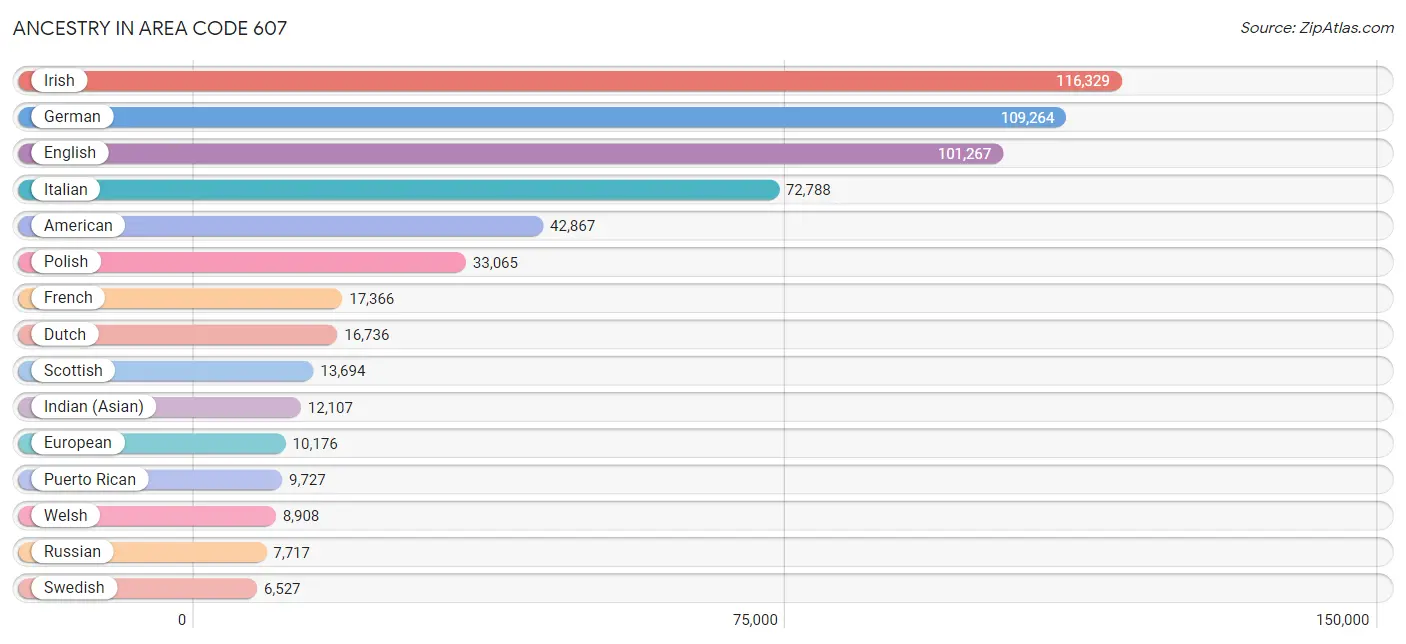
Ancestry in Area Code 607
The most populous ancestries reported in Area Code 607 are Irish (116,329 | 16.2%), German (109,264 | 15.3%), English (101,267 | 14.1%), Italian (72,788 | 10.2%), and American (42,867 | 6.0%), together accounting for 61.8% of all Area Code 607 residents.
| Ancestry | # Population | % Population |
| Afghan | 6 | 0.0% |
| African | 1,018 | 0.1% |
| Alaska Native | 23 | 0.0% |
| Albanian | 236 | 0.0% |
| Aleut | 5 | 0.0% |
| American | 42,867 | 6.0% |
| Apache | 159 | 0.0% |
| Arab | 3,862 | 0.5% |
| Argentinean | 241 | 0.0% |
| Armenian | 865 | 0.1% |
| Australian | 155 | 0.0% |
| Austrian | 1,909 | 0.3% |
| Barbadian | 113 | 0.0% |
| Basque | 25 | 0.0% |
| Belgian | 559 | 0.1% |
| Belizean | 37 | 0.0% |
| Bhutanese | 1,690 | 0.2% |
| Blackfeet | 426 | 0.1% |
| Bolivian | 56 | 0.0% |
| Brazilian | 382 | 0.1% |
| British | 4,283 | 0.6% |
| British West Indian | 189 | 0.0% |
| Bulgarian | 294 | 0.0% |
| Burmese | 2,429 | 0.3% |
| Cajun | 15 | 0.0% |
| Cambodian | 30 | 0.0% |
| Canadian | 1,783 | 0.3% |
| Cape Verdean | 24 | 0.0% |
| Carpatho Rusyn | 104 | 0.0% |
| Celtic | 52 | 0.0% |
| Central American | 1,436 | 0.2% |
| Central American Indian | 670 | 0.1% |
| Cherokee | 1,107 | 0.2% |
| Cheyenne | 4 | 0.0% |
| Chickasaw | 10 | 0.0% |
| Chilean | 257 | 0.0% |
| Chippewa | 79 | 0.0% |
| Choctaw | 86 | 0.0% |
| Colombian | 1,176 | 0.2% |
| Comanche | 14 | 0.0% |
| Costa Rican | 143 | 0.0% |
| Cree | 2 | 0.0% |
| Creek | 13 | 0.0% |
| Croatian | 557 | 0.1% |
| Crow | 6 | 0.0% |
| Cuban | 862 | 0.1% |
| Cypriot | 60 | 0.0% |
| Czech | 3,081 | 0.4% |
| Czechoslovakian | 1,569 | 0.2% |
| Danish | 1,855 | 0.3% |
| Delaware | 59 | 0.0% |
| Dominican | 2,027 | 0.3% |
| Dutch | 16,736 | 2.3% |
| Eastern European | 3,234 | 0.4% |
| Ecuadorian | 1,207 | 0.2% |
| Egyptian | 193 | 0.0% |
| English | 101,267 | 14.1% |
| Estonian | 78 | 0.0% |
| Ethiopian | 83 | 0.0% |
| European | 10,176 | 1.4% |
| Filipino | 358 | 0.1% |
| Finnish | 1,667 | 0.2% |
| French | 17,366 | 2.4% |
| French American Indian | 40 | 0.0% |
| French Canadian | 4,636 | 0.6% |
| German | 109,264 | 15.3% |
| German Russian | 36 | 0.0% |
| Ghanaian | 197 | 0.0% |
| Greek | 3,147 | 0.4% |
| Guamanian / Chamorro | 44 | 0.0% |
| Guatemalan | 464 | 0.1% |
| Guyanese | 396 | 0.1% |
| Haitian | 1,639 | 0.2% |
| Honduran | 320 | 0.0% |
| Hungarian | 4,334 | 0.6% |
| Icelander | 118 | 0.0% |
| Indian (Asian) | 12,107 | 1.7% |
| Indonesian | 385 | 0.1% |
| Iranian | 346 | 0.1% |
| Iraqi | 231 | 0.0% |
| Irish | 116,329 | 16.2% |
| Iroquois | 684 | 0.1% |
| Israeli | 408 | 0.1% |
| Italian | 72,788 | 10.2% |
| Jamaican | 1,362 | 0.2% |
| Japanese | 437 | 0.1% |
| Jordanian | 110 | 0.0% |
| Kenyan | 202 | 0.0% |
| Kiowa | 1 | 0.0% |
| Korean | 1,778 | 0.3% |
| Laotian | 50 | 0.0% |
| Latvian | 273 | 0.0% |
| Lebanese | 1,303 | 0.2% |
| Lithuanian | 2,555 | 0.4% |
| Lumbee | 8 | 0.0% |
| Luxembourger | 50 | 0.0% |
| Macedonian | 122 | 0.0% |
| Malaysian | 539 | 0.1% |
| Maltese | 75 | 0.0% |
| Mexican | 4,535 | 0.6% |
| Mexican American Indian | 253 | 0.0% |
| Mongolian | 48 | 0.0% |
| Moroccan | 75 | 0.0% |
| Native Hawaiian | 223 | 0.0% |
| Navajo | 131 | 0.0% |
| New Zealander | 49 | 0.0% |
| Nicaraguan | 71 | 0.0% |
| Nigerian | 405 | 0.1% |
| Northern European | 1,086 | 0.2% |
| Norwegian | 4,274 | 0.6% |
| Okinawan | 34 | 0.0% |
| Pakistani | 294 | 0.0% |
| Palestinian | 61 | 0.0% |
| Panamanian | 173 | 0.0% |
| Paraguayan | 16 | 0.0% |
| Pennsylvania German | 2,205 | 0.3% |
| Peruvian | 618 | 0.1% |
| Polish | 33,065 | 4.6% |
| Portuguese | 1,107 | 0.2% |
| Puerto Rican | 9,727 | 1.4% |
| Romanian | 870 | 0.1% |
| Russian | 7,717 | 1.1% |
| Salvadoran | 233 | 0.0% |
| Samoan | 64 | 0.0% |
| Scandinavian | 1,718 | 0.2% |
| Scotch-Irish | 4,913 | 0.7% |
| Scottish | 13,694 | 1.9% |
| Seminole | 9 | 0.0% |
| Senegalese | 6 | 0.0% |
| Serbian | 358 | 0.1% |
| Sierra Leonean | 11 | 0.0% |
| Sioux | 99 | 0.0% |
| Slavic | 610 | 0.1% |
| Slovak | 5,098 | 0.7% |
| Slovene | 346 | 0.1% |
| Somali | 16 | 0.0% |
| South African | 35 | 0.0% |
| South American | 3,716 | 0.5% |
| South American Indian | 74 | 0.0% |
| Spaniard | 928 | 0.1% |
| Spanish | 716 | 0.1% |
| Sri Lankan | 967 | 0.1% |
| Subsaharan African | 2,572 | 0.4% |
| Sudanese | 152 | 0.0% |
| Swedish | 6,527 | 0.9% |
| Swiss | 2,570 | 0.4% |
| Syrian | 635 | 0.1% |
| Taiwanese | 7 | 0.0% |
| Thai | 5,545 | 0.8% |
| Tlingit-Haida | 34 | 0.0% |
| Trinidadian and Tobagonian | 256 | 0.0% |
| Turkish | 862 | 0.1% |
| U.S. Virgin Islander | 19 | 0.0% |
| Ugandan | 14 | 0.0% |
| Ukrainian | 4,800 | 0.7% |
| Uruguayan | 3 | 0.0% |
| Ute | 4 | 0.0% |
| Venezuelan | 105 | 0.0% |
| Vietnamese | 352 | 0.1% |
| Welsh | 8,908 | 1.2% |
| West Indian | 200 | 0.0% |
| Yugoslavian | 849 | 0.1% |
| Zimbabwean | 35 | 0.0% | View All 163 Rows |
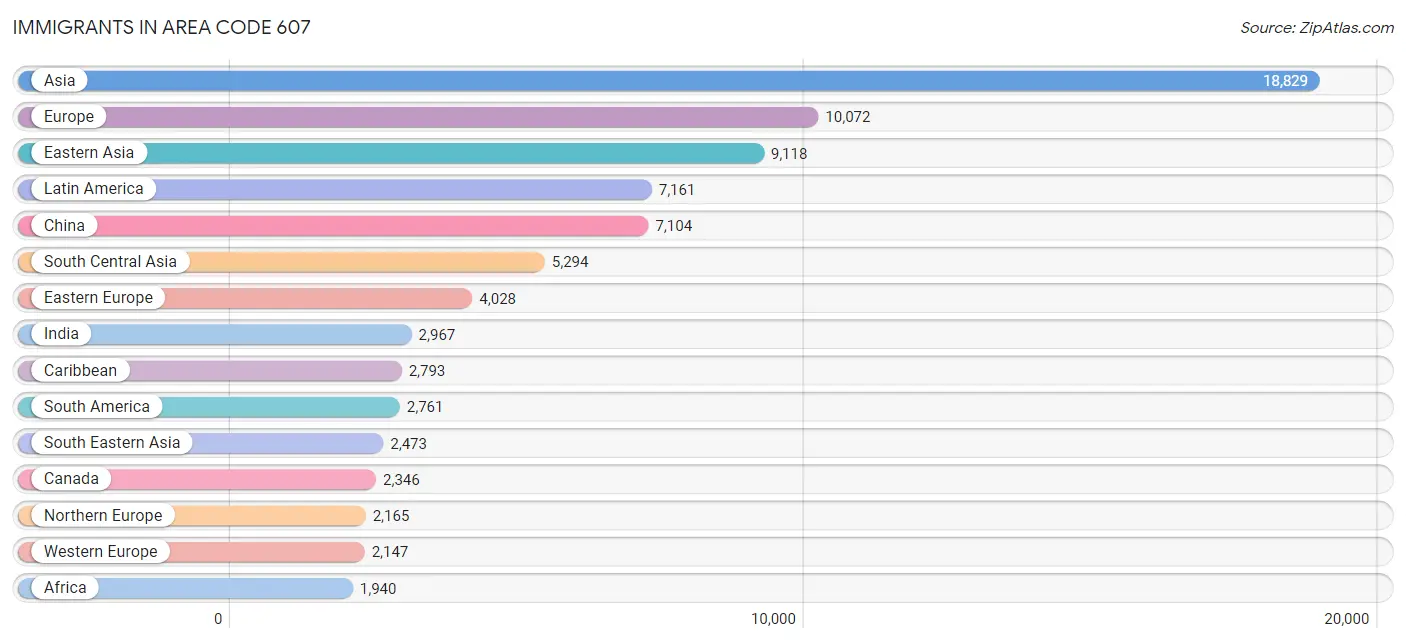
Immigrants in Area Code 607
The most numerous immigrant groups reported in Area Code 607 came from Asia (18,829 | 2.6%), Europe (10,072 | 1.4%), Eastern Asia (9,118 | 1.3%), Latin America (7,161 | 1.0%), and China (7,104 | 1.0%), together accounting for 7.3% of all Area Code 607 residents.
| Immigration Origin | # Population | % Population |
| Afghanistan | 31 | 0.0% |
| Africa | 1,940 | 0.3% |
| Albania | 19 | 0.0% |
| Argentina | 171 | 0.0% |
| Asia | 18,829 | 2.6% |
| Australia | 184 | 0.0% |
| Austria | 147 | 0.0% |
| Bangladesh | 581 | 0.1% |
| Barbados | 47 | 0.0% |
| Belarus | 183 | 0.0% |
| Belgium | 137 | 0.0% |
| Belize | 10 | 0.0% |
| Bolivia | 21 | 0.0% |
| Bosnia and Herzegovina | 423 | 0.1% |
| Brazil | 528 | 0.1% |
| Bulgaria | 199 | 0.0% |
| Cabo Verde | 5 | 0.0% |
| Cambodia | 195 | 0.0% |
| Cameroon | 6 | 0.0% |
| Canada | 2,346 | 0.3% |
| Caribbean | 2,793 | 0.4% |
| Central America | 1,607 | 0.2% |
| Chile | 35 | 0.0% |
| China | 7,104 | 1.0% |
| Colombia | 564 | 0.1% |
| Costa Rica | 90 | 0.0% |
| Croatia | 94 | 0.0% |
| Cuba | 177 | 0.0% |
| Czechoslovakia | 188 | 0.0% |
| Denmark | 99 | 0.0% |
| Dominica | 24 | 0.0% |
| Dominican Republic | 590 | 0.1% |
| Eastern Africa | 493 | 0.1% |
| Eastern Asia | 9,118 | 1.3% |
| Eastern Europe | 4,028 | 0.6% |
| Ecuador | 573 | 0.1% |
| Egypt | 179 | 0.0% |
| El Salvador | 121 | 0.0% |
| England | 682 | 0.1% |
| Ethiopia | 73 | 0.0% |
| Europe | 10,072 | 1.4% |
| France | 319 | 0.0% |
| Germany | 1,247 | 0.2% |
| Ghana | 161 | 0.0% |
| Greece | 499 | 0.1% |
| Grenada | 17 | 0.0% |
| Guatemala | 275 | 0.0% |
| Guyana | 379 | 0.1% |
| Haiti | 1,072 | 0.2% |
| Honduras | 122 | 0.0% |
| Hong Kong | 554 | 0.1% |
| Hungary | 103 | 0.0% |
| India | 2,967 | 0.4% |
| Indonesia | 62 | 0.0% |
| Iran | 264 | 0.0% |
| Iraq | 437 | 0.1% |
| Ireland | 209 | 0.0% |
| Israel | 233 | 0.0% |
| Italy | 985 | 0.1% |
| Jamaica | 617 | 0.1% |
| Japan | 403 | 0.1% |
| Jordan | 107 | 0.0% |
| Kazakhstan | 64 | 0.0% |
| Kenya | 204 | 0.0% |
| Korea | 1,611 | 0.2% |
| Kuwait | 46 | 0.0% |
| Laos | 233 | 0.0% |
| Latin America | 7,161 | 1.0% |
| Latvia | 18 | 0.0% |
| Lebanon | 140 | 0.0% |
| Liberia | 1 | 0.0% |
| Lithuania | 1 | 0.0% |
| Malaysia | 123 | 0.0% |
| Mexico | 930 | 0.1% |
| Middle Africa | 9 | 0.0% |
| Moldova | 124 | 0.0% |
| Morocco | 88 | 0.0% |
| Nepal | 166 | 0.0% |
| Netherlands | 217 | 0.0% |
| Nicaragua | 28 | 0.0% |
| Nigeria | 169 | 0.0% |
| North Macedonia | 33 | 0.0% |
| Northern Africa | 581 | 0.1% |
| Northern Europe | 2,165 | 0.3% |
| Norway | 65 | 0.0% |
| Oceania | 247 | 0.0% |
| Pakistan | 658 | 0.1% |
| Panama | 31 | 0.0% |
| Peru | 412 | 0.1% |
| Philippines | 687 | 0.1% |
| Poland | 364 | 0.1% |
| Portugal | 131 | 0.0% |
| Romania | 290 | 0.0% |
| Russia | 781 | 0.1% |
| Saudi Arabia | 95 | 0.0% |
| Scotland | 168 | 0.0% |
| Senegal | 8 | 0.0% |
| Serbia | 116 | 0.0% |
| Singapore | 43 | 0.0% |
| Somalia | 8 | 0.0% |
| South Africa | 211 | 0.0% |
| South America | 2,761 | 0.4% |
| South Central Asia | 5,294 | 0.7% |
| South Eastern Asia | 2,473 | 0.4% |
| Southern Europe | 1,715 | 0.2% |
| Spain | 83 | 0.0% |
| Sri Lanka | 262 | 0.0% |
| St. Vincent and the Grenadines | 8 | 0.0% |
| Sudan | 107 | 0.0% |
| Sweden | 44 | 0.0% |
| Switzerland | 63 | 0.0% |
| Syria | 9 | 0.0% |
| Taiwan | 414 | 0.1% |
| Thailand | 312 | 0.0% |
| Trinidad and Tobago | 166 | 0.0% |
| Turkey | 579 | 0.1% |
| Uganda | 9 | 0.0% |
| Ukraine | 763 | 0.1% |
| Uruguay | 4 | 0.0% |
| Uzbekistan | 222 | 0.0% |
| Venezuela | 58 | 0.0% |
| Vietnam | 607 | 0.1% |
| West Indies | 17 | 0.0% |
| Western Africa | 616 | 0.1% |
| Western Asia | 1,938 | 0.3% |
| Western Europe | 2,147 | 0.3% |
| Yemen | 58 | 0.0% |
| Zimbabwe | 14 | 0.0% | View All 128 Rows |
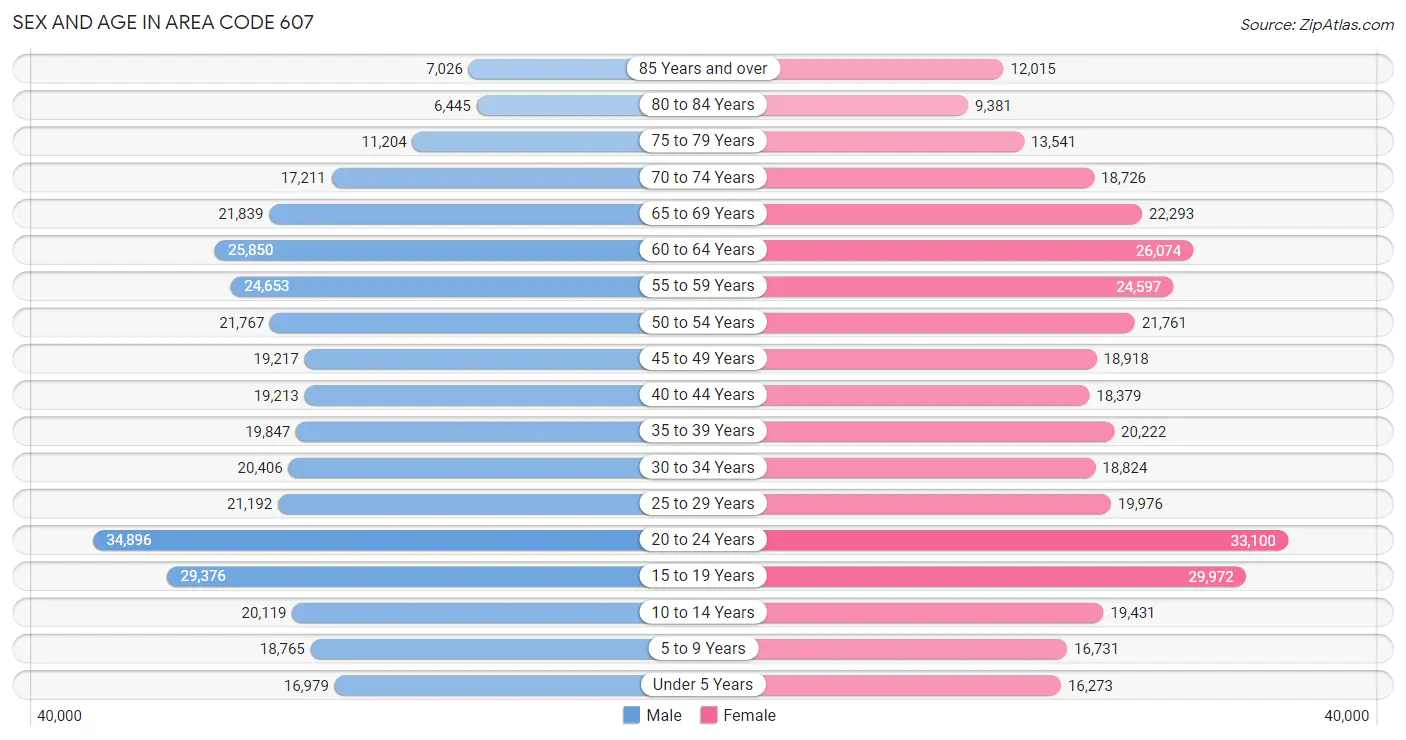
Sex and Age in Area Code 607
Sex and Age in Area Code 607
The most populous age groups in Area Code 607 are 20 to 24 Years (34,896 | 9.8%) for men and 20 to 24 Years (33,100 | 9.2%) for women.
| Age Bracket | Male | Female |
| Under 5 Years | 16,979 (4.8%) | 16,273 (4.5%) |
| 5 to 9 Years | 18,765 (5.3%) | 16,731 (4.6%) |
| 10 to 14 Years | 20,119 (5.7%) | 19,431 (5.4%) |
| 15 to 19 Years | 29,376 (8.3%) | 29,972 (8.3%) |
| 20 to 24 Years | 34,896 (9.8%) | 33,100 (9.2%) |
| 25 to 29 Years | 21,192 (5.9%) | 19,976 (5.6%) |
| 30 to 34 Years | 20,406 (5.7%) | 18,824 (5.2%) |
| 35 to 39 Years | 19,847 (5.6%) | 20,222 (5.6%) |
| 40 to 44 Years | 19,213 (5.4%) | 18,379 (5.1%) |
| 45 to 49 Years | 19,217 (5.4%) | 18,918 (5.2%) |
| 50 to 54 Years | 21,767 (6.1%) | 21,761 (6.0%) |
| 55 to 59 Years | 24,653 (6.9%) | 24,597 (6.8%) |
| 60 to 64 Years | 25,850 (7.3%) | 26,074 (7.2%) |
| 65 to 69 Years | 21,839 (6.1%) | 22,293 (6.2%) |
| 70 to 74 Years | 17,211 (4.8%) | 18,726 (5.2%) |
| 75 to 79 Years | 11,204 (3.2%) | 13,541 (3.8%) |
| 80 to 84 Years | 6,445 (1.8%) | 9,381 (2.6%) |
| 85 Years and over | 7,026 (2.0%) | 12,015 (3.3%) |
| Total | 356,005 (100.0%) | 360,214 (100.0%) |
Families and Households in Area Code 607
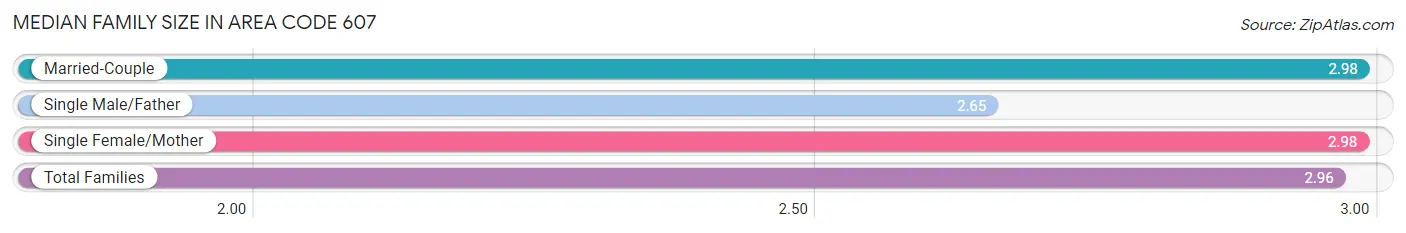
Median Family Size in Area Code 607
The median family size in Area Code 607 is 2.96 persons per family, with married-couple families (128,120 | 74.9%) accounting for the largest median family size of 2.98456 persons per family. On the other hand, single male/father families (13,862 | 8.1%) represent the smallest median family size with 2.65 persons per family.
| Family Type | # Families | Family Size |
| Married-Couple | 128,120 (74.9%) | 2.98 |
| Single Male/Father | 13,862 (8.1%) | 2.65 |
| Single Female/Mother | 29,015 (17.0%) | 2.98 |
| Total Families | 170,997 (100.0%) | 2.96 |
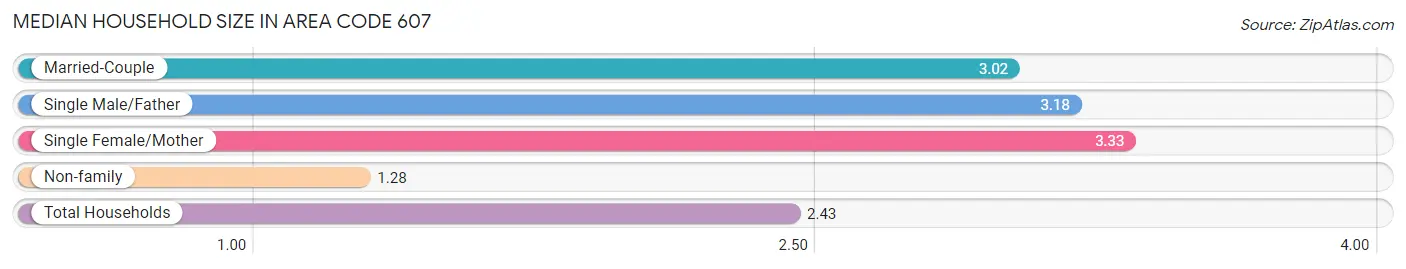
Median Household Size in Area Code 607
The median household size in Area Code 607 is 2.43 persons per household, with single female/mother households (29,015 | 9.9%) accounting for the largest median household size of 3.3294 persons per household. non-family households (122,288 | 41.7%) represent the smallest median household size with 1.28 persons per household.
| Household Type | # Households | Household Size |
| Married-Couple | 128,120 (43.7%) | 3.02 |
| Single Male/Father | 13,862 (4.7%) | 3.18 |
| Single Female/Mother | 29,015 (9.9%) | 3.33 |
| Non-family | 122,288 (41.7%) | 1.28 |
| Total Households | 293,285 (100.0%) | 2.43 |
Household Size by Marriage Status in Area Code 607
Out of a total of 293,285 households in Area Code 607, 170,997 (58.3%) are family households, while 122,288 (41.7%) are nonfamily households. The most numerous type of family households are 2-person households, comprising 85,563, and the most common type of nonfamily households are 1-person households, comprising 94,783.
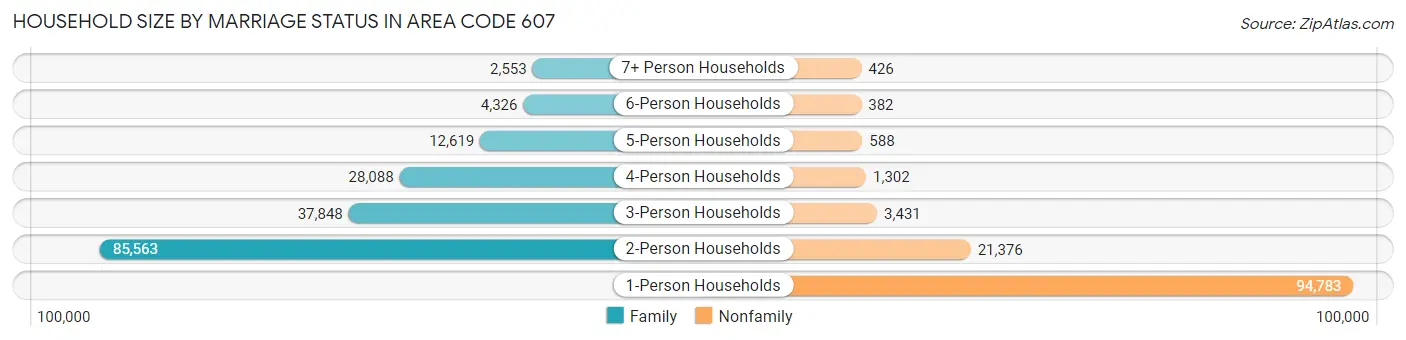
| Household Size | Family Households | Nonfamily Households |
| 1-Person Households | - | 94,783 (32.3%) |
| 2-Person Households | 85,563 (29.2%) | 21,376 (7.3%) |
| 3-Person Households | 37,848 (12.9%) | 3,431 (1.2%) |
| 4-Person Households | 28,088 (9.6%) | 1,302 (0.4%) |
| 5-Person Households | 12,619 (4.3%) | 588 (0.2%) |
| 6-Person Households | 4,326 (1.5%) | 382 (0.1%) |
| 7+ Person Households | 2,553 (0.9%) | 426 (0.2%) |
| Total | 170,997 (58.3%) | 122,288 (41.7%) |
Female Fertility in Area Code 607
Fertility by Age in Area Code 607
Average fertility rate in Area Code 607 is 61.3 births per 1,000 women. Women in the age bracket of 20 to 34 years have the highest fertility rate with 139.1 births per 1,000 women. Women in the age bracket of 20 to 34 years acount for 71.5% of all women with births.
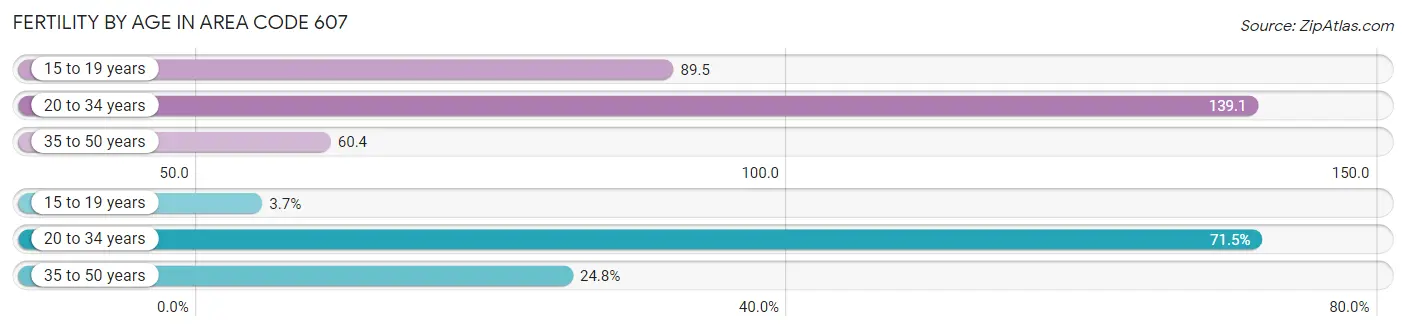
| Age Bracket | Women with Births | Births / 1,000 Women |
| 15 to 19 years | 273 (3.7%) | 89.5 |
| 20 to 34 years | 5,292 (71.5%) | 139.1 |
| 35 to 50 years | 1,832 (24.8%) | 60.4 |
| Total | 7,397 (100.0%) | 61.3 |
Fertility by Age by Marriage Status in Area Code 607
51.7% of women with births (7,397) in Area Code 607 are married. The highest percentage of unmarried women with births falls into 15 to 19 years age bracket with 100.0% of them unmarried at the time of birth, while the lowest percentage of unmarried women with births belong to 20 to 34 years age bracket with 55.8% of them unmarried.
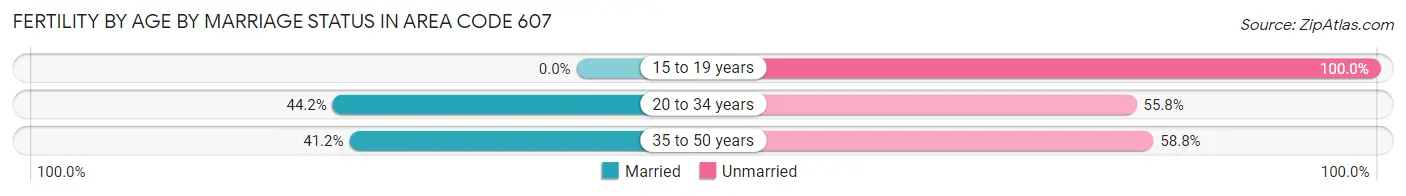
| Age Bracket | Married | Unmarried |
| 15 to 19 years | 0 (0.0%) | 273 (100.0%) |
| 20 to 34 years | 2,339 (44.2%) | 2,953 (55.8%) |
| 35 to 50 years | 754 (41.2%) | 1,078 (58.8%) |
| Total | 3,824 (51.7%) | 3,573 (48.3%) |
Fertility by Education in Area Code 607
Average fertility rate in Area Code 607 is 61.3 births per 1,000 women. Women with the education attainment of graduate degree have the highest fertility rate of 183.8 births per 1,000 women, while women with the education attainment of college or associate's degree have the lowest fertility at 79.3 births per 1,000 women. Women with the education attainment of college or associate's degree represent 34.2% of all women with births.
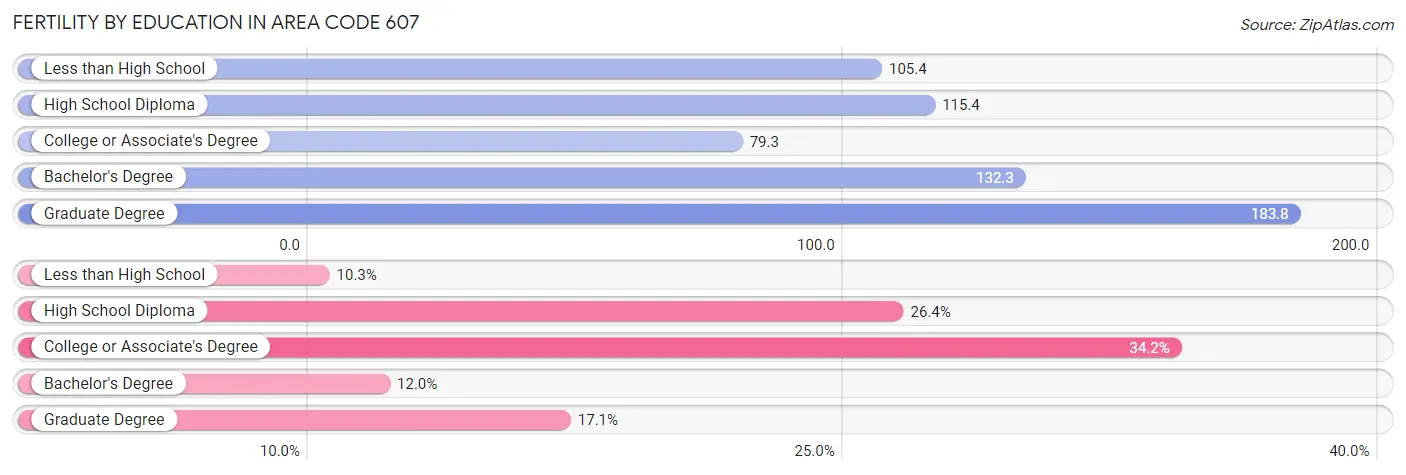
| Educational Attainment | Women with Births | Births / 1,000 Women |
| Less than High School | 761 (10.3%) | 105.4 |
| High School Diploma | 1,954 (26.4%) | 115.4 |
| College or Associate's Degree | 2,532 (34.2%) | 79.3 |
| Bachelor's Degree | 887 (12.0%) | 132.3 |
| Graduate Degree | 1,263 (17.1%) | 183.8 |
| Total | 7,397 (100.0%) | 61.3 |
Fertility by Education by Marriage Status in Area Code 607
48.3% of women with births in Area Code 607 are unmarried. Women with the educational attainment of graduate degree are most likely to be married with 36.4% of them married at childbirth, while women with the educational attainment of less than high school are least likely to be married with 82.8% of them unmarried at childbirth.
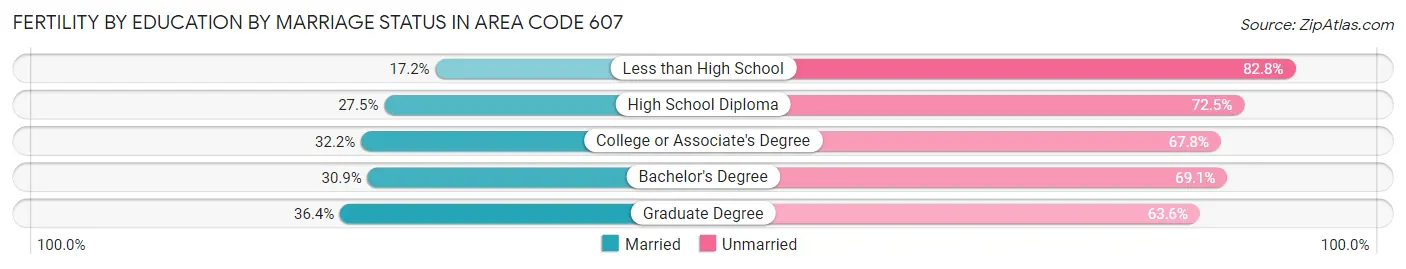
| Educational Attainment | Married | Unmarried |
| Less than High School | 131 (17.2%) | 630 (82.8%) |
| High School Diploma | 538 (27.5%) | 1,416 (72.5%) |
| College or Associate's Degree | 815 (32.2%) | 1,717 (67.8%) |
| Bachelor's Degree | 274 (30.9%) | 613 (69.1%) |
| Graduate Degree | 460 (36.4%) | 803 (63.6%) |
| Total | 3,824 (51.7%) | 3,573 (48.3%) |
Employment Characteristics in Area Code 607
Employment by Class of Employer in Area Code 607
Among the 316,964 employed individuals in Area Code 607, private company employees (177,957 | 56.1%), not-for-profit organizations (48,693 | 15.4%), and local government employees (32,564 | 10.3%) make up the most common classes of employment.
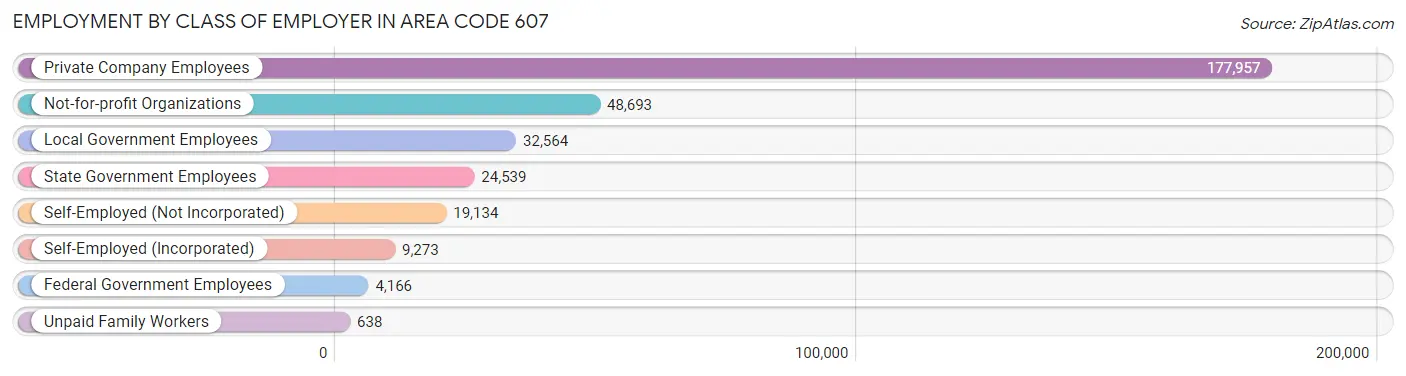
| Employer Class | # Employees | % Employees |
| Private Company Employees | 177,957 | 56.1% |
| Self-Employed (Incorporated) | 9,273 | 2.9% |
| Self-Employed (Not Incorporated) | 19,134 | 6.0% |
| Not-for-profit Organizations | 48,693 | 15.4% |
| Local Government Employees | 32,564 | 10.3% |
| State Government Employees | 24,539 | 7.7% |
| Federal Government Employees | 4,166 | 1.3% |
| Unpaid Family Workers | 638 | 0.2% |
| Total | 316,964 | 100.0% |
Employment Status by Age in Area Code 607
According to the labor force statistics for Area Code 607, out of the total population over 16 years of age (599,928), 58.4% or 350,478 individuals are in the labor force, with 6.3% or 22,220 of them unemployed. The age group with the highest labor force participation rate is 25 to 29 years, with 84.6% or 34,820 individuals in the labor force. Within the labor force, the 16 to 19 years age range has the highest percentage of unemployed individuals, with 2,132.1% or 452,751 of them being unemployed.
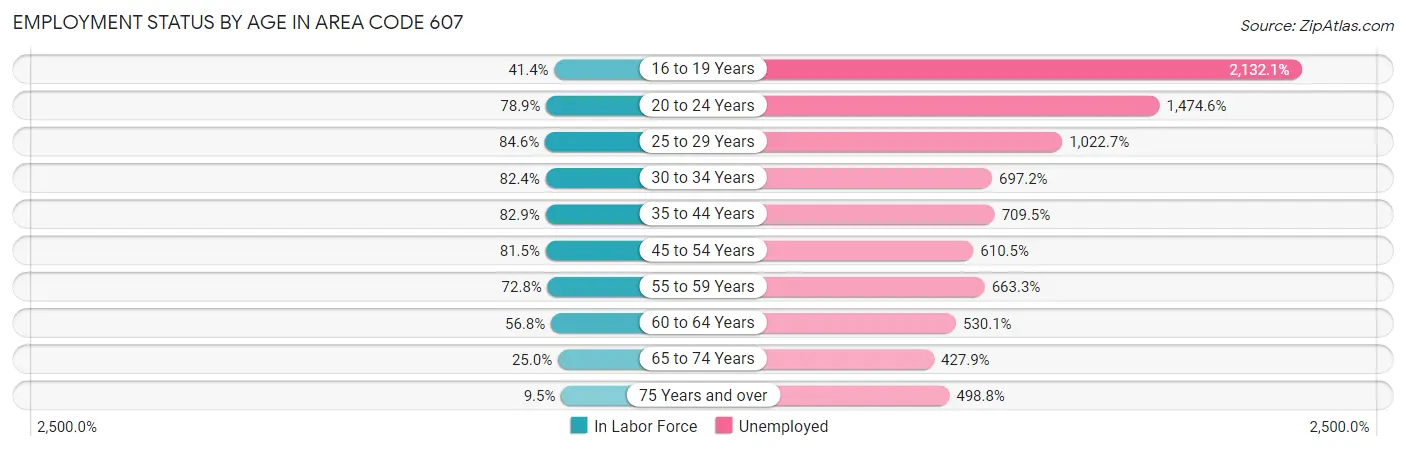
| Age Bracket | In Labor Force | Unemployed |
| 16 to 19 Years | 21,235 (41.3%) | 452,751 (2,132.1%) |
| 20 to 24 Years | 53,653 (78.9%) | 791,211 (1,474.6%) |
| 25 to 29 Years | 34,821 (84.6%) | 356,104 (1,022.7%) |
| 30 to 34 Years | 32,339 (82.4%) | 225,481 (697.2%) |
| 35 to 44 Years | 64,408 (82.9%) | 456,946 (709.5%) |
| 45 to 54 Years | 66,533 (81.5%) | 406,172 (610.5%) |
| 55 to 59 Years | 35,831 (72.8%) | 237,654 (663.3%) |
| 60 to 64 Years | 29,489 (56.8%) | 156,316 (530.1%) |
| 65 to 74 Years | 19,990 (25.0%) | 85,550 (427.9%) |
| 75 Years and over | 5,650 (9.5%) | 28,187 (498.8%) |
| Total | 350,474 (58.4%) | 22,230 (6.3%) |
Employment Status by Educational Attainment in Area Code 607
According to labor force statistics for Area Code 607, 75.8% of individuals (258,536) out of the total population between 25 and 64 years of age (340,896) are in the labor force, with 728.6% or 1,883,693 of them being unemployed. The group with the highest labor force participation rate are those with the educational attainment of bachelor's degree or higher, with 87.4% or 96,931 individuals in the labor force. Within the labor force, individuals with less than high school education have the highest percentage of unemployment, with 1,459.5% or 243,167 of them being unemployed.
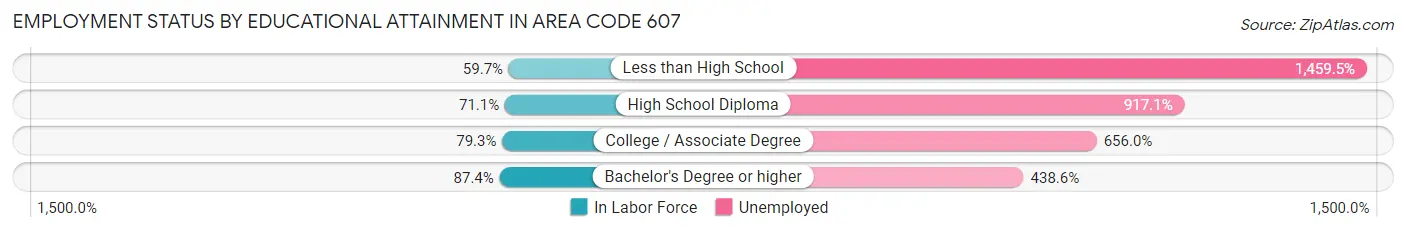
| Educational Attainment | In Labor Force | Unemployed |
| Less than High School | 16,661 (59.7%) | 407,113 (1,459.5%) |
| High School Diploma | 71,450 (71.1%) | 921,741 (917.1%) |
| College / Associate Degree | 80,521 (79.2%) | 666,522 (656.0%) |
| Bachelor's Degree or higher | 96,934 (87.4%) | 486,372 (438.6%) |
| Total | 258,538 (75.8%) | 2,483,768 (728.6%) |
Employment Occupations by Sex in Area Code 607
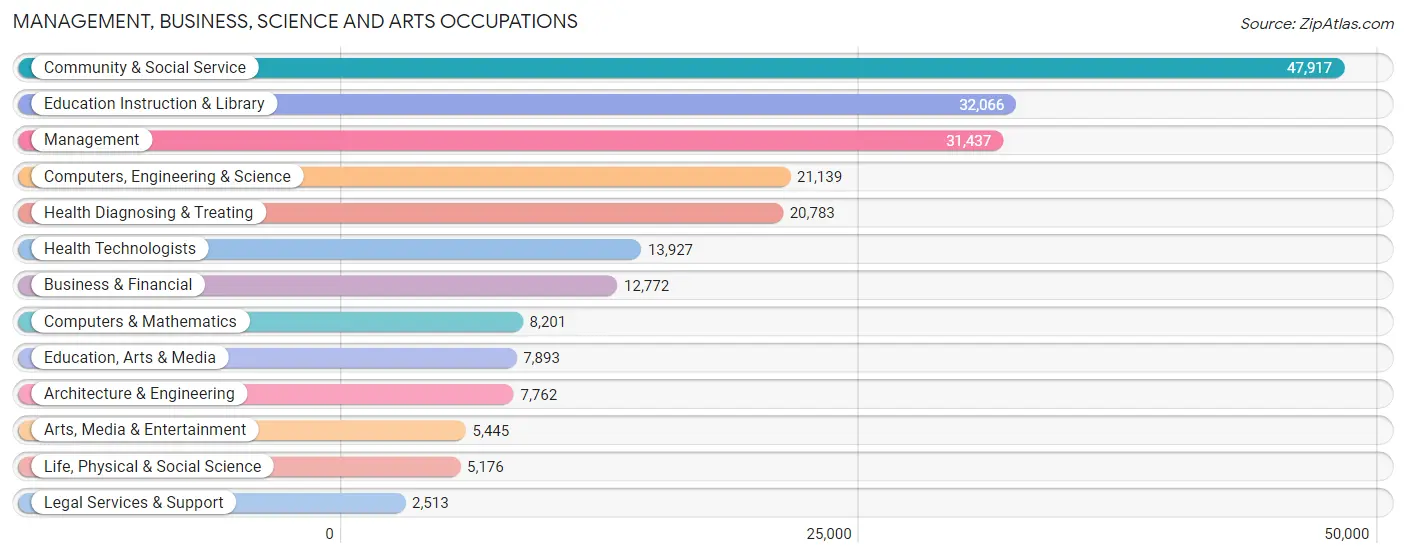
Management, Business, Science and Arts Occupations
The most common Management, Business, Science and Arts occupations in Area Code 607 are Community & Social Service (47,917 | 14.7%), Education Instruction & Library (32,066 | 9.9%), Management (31,437 | 9.7%), Computers, Engineering & Science (21,139 | 6.5%), and Health Diagnosing & Treating (20,783 | 6.4%).
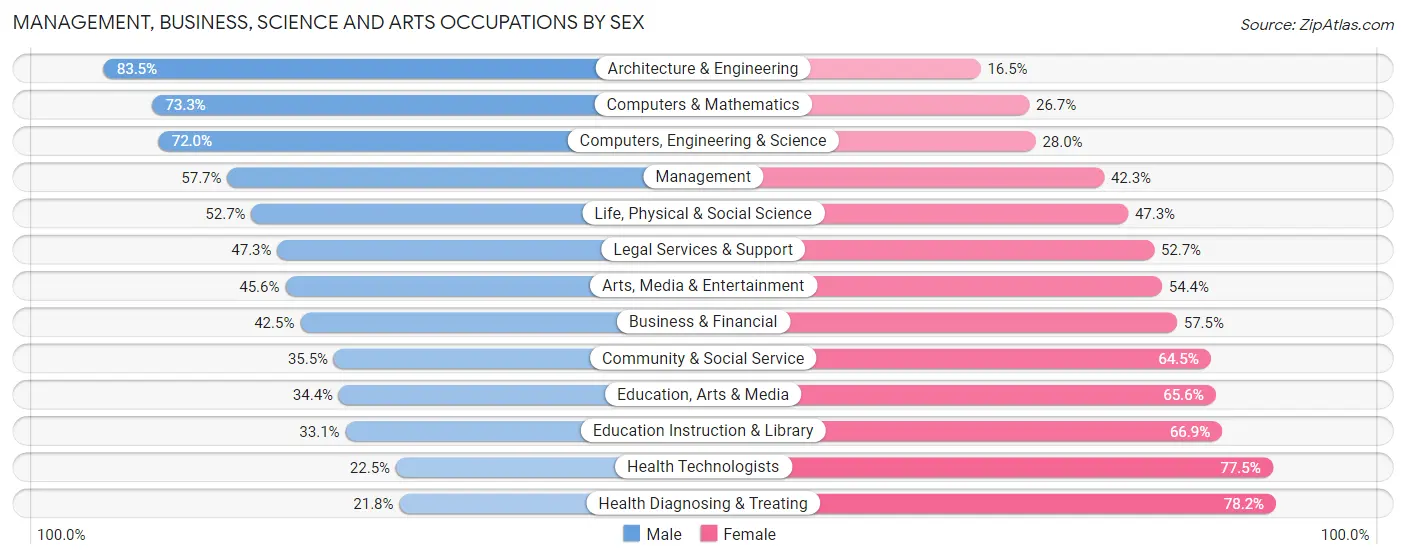
Management, Business, Science and Arts Occupations by Sex
Within the Management, Business, Science and Arts occupations in Area Code 607, the most male-oriented occupations are Architecture & Engineering (83.5%), Computers & Mathematics (73.3%), and Computers, Engineering & Science (72.0%), while the most female-oriented occupations are Health Diagnosing & Treating (78.2%), Health Technologists (77.5%), and Education Instruction & Library (66.9%).
| Occupation | Male | Female |
| Management | 18,140 (57.7%) | 13,297 (42.3%) |
| Business & Financial | 5,428 (42.5%) | 7,344 (57.5%) |
| Computers, Engineering & Science | 15,219 (72.0%) | 5,920 (28.0%) |
| Computers & Mathematics | 6,014 (73.3%) | 2,187 (26.7%) |
| Architecture & Engineering | 6,478 (83.5%) | 1,284 (16.5%) |
| Life, Physical & Social Science | 2,727 (52.7%) | 2,449 (47.3%) |
| Community & Social Service | 16,996 (35.5%) | 30,921 (64.5%) |
| Education, Arts & Media | 2,718 (34.4%) | 5,175 (65.6%) |
| Legal Services & Support | 1,188 (47.3%) | 1,325 (52.7%) |
| Education Instruction & Library | 10,606 (33.1%) | 21,460 (66.9%) |
| Arts, Media & Entertainment | 2,484 (45.6%) | 2,961 (54.4%) |
| Health Diagnosing & Treating | 4,536 (21.8%) | 16,247 (78.2%) |
| Health Technologists | 3,139 (22.5%) | 10,788 (77.5%) |
| Total (Category) | 60,319 (45.0%) | 73,729 (55.0%) |
| Total (Overall) | 168,246 (51.8%) | 156,550 (48.2%) |
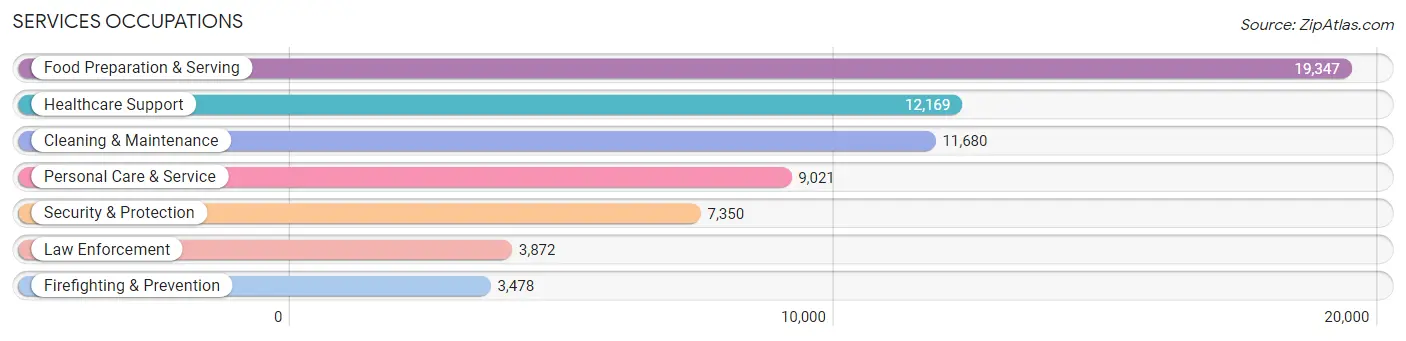
Services Occupations
The most common Services occupations in Area Code 607 are Food Preparation & Serving (19,347 | 6.0%), Healthcare Support (12,169 | 3.7%), Cleaning & Maintenance (11,680 | 3.6%), Personal Care & Service (9,021 | 2.8%), and Security & Protection (7,350 | 2.3%).
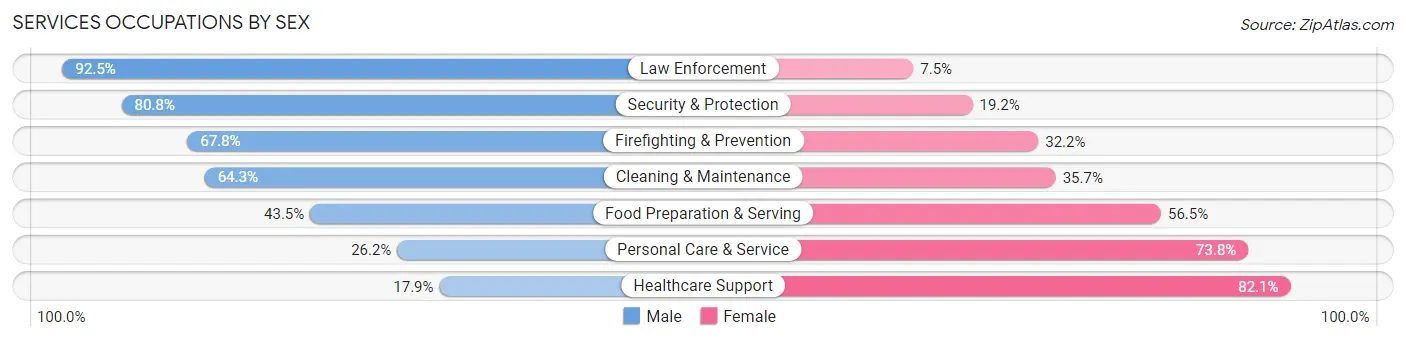
Services Occupations by Sex
Within the Services occupations in Area Code 607, the most male-oriented occupations are Law Enforcement (92.5%), Security & Protection (80.8%), and Firefighting & Prevention (67.8%), while the most female-oriented occupations are Healthcare Support (82.1%), Personal Care & Service (73.8%), and Food Preparation & Serving (56.5%).
| Occupation | Male | Female |
| Healthcare Support | 2,174 (17.9%) | 9,995 (82.1%) |
| Security & Protection | 5,939 (80.8%) | 1,411 (19.2%) |
| Firefighting & Prevention | 2,357 (67.8%) | 1,121 (32.2%) |
| Law Enforcement | 3,582 (92.5%) | 290 (7.5%) |
| Food Preparation & Serving | 8,409 (43.5%) | 10,938 (56.5%) |
| Cleaning & Maintenance | 7,512 (64.3%) | 4,168 (35.7%) |
| Personal Care & Service | 2,365 (26.2%) | 6,656 (73.8%) |
| Total (Category) | 26,399 (44.3%) | 33,168 (55.7%) |
| Total (Overall) | 168,246 (51.8%) | 156,550 (48.2%) |
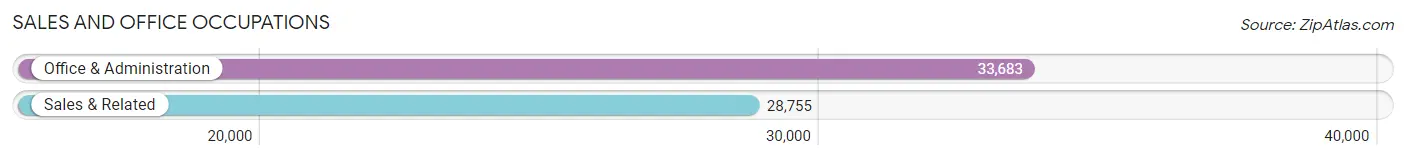
Sales and Office Occupations
The most common Sales and Office occupations in Area Code 607 are Office & Administration (33,683 | 10.4%), and Sales & Related (28,755 | 8.8%).
Sales and Office Occupations by Sex
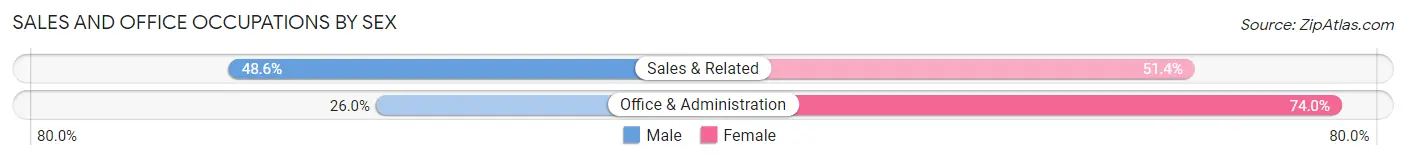
| Occupation | Male | Female |
| Sales & Related | 13,968 (48.6%) | 14,787 (51.4%) |
| Office & Administration | 8,744 (26.0%) | 24,939 (74.0%) |
| Total (Category) | 22,712 (36.4%) | 39,726 (63.6%) |
| Total (Overall) | 168,246 (51.8%) | 156,550 (48.2%) |
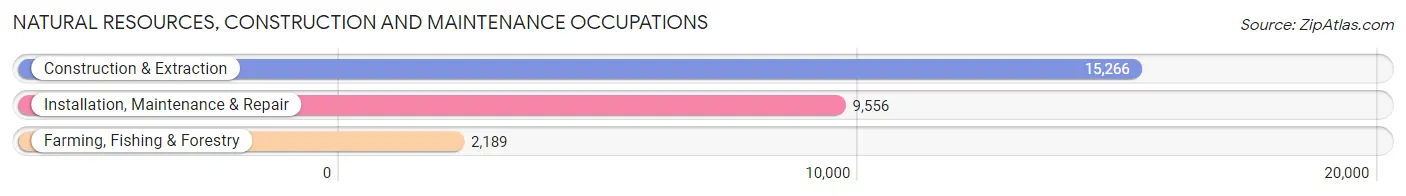
Natural Resources, Construction and Maintenance Occupations
The most common Natural Resources, Construction and Maintenance occupations in Area Code 607 are Construction & Extraction (15,266 | 4.7%), Installation, Maintenance & Repair (9,556 | 2.9%), and Farming, Fishing & Forestry (2,189 | 0.7%).
Natural Resources, Construction and Maintenance Occupations by Sex
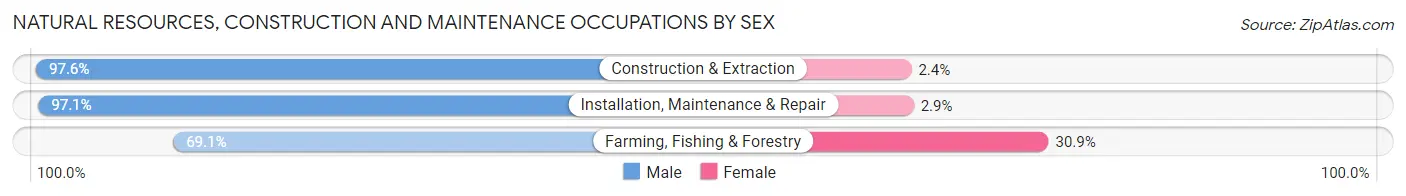
| Occupation | Male | Female |
| Farming, Fishing & Forestry | 1,512 (69.1%) | 677 (30.9%) |
| Construction & Extraction | 14,900 (97.6%) | 366 (2.4%) |
| Installation, Maintenance & Repair | 9,282 (97.1%) | 274 (2.9%) |
| Total (Category) | 25,694 (95.1%) | 1,317 (4.9%) |
| Total (Overall) | 168,246 (51.8%) | 156,550 (48.2%) |
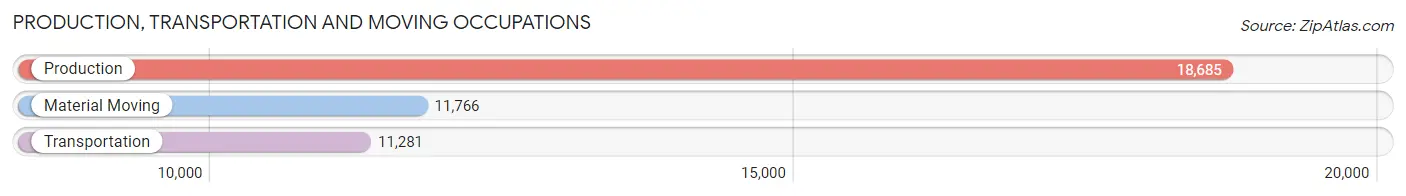
Production, Transportation and Moving Occupations
The most common Production, Transportation and Moving occupations in Area Code 607 are Production (18,685 | 5.8%), Material Moving (11,766 | 3.6%), and Transportation (11,281 | 3.5%).
Production, Transportation and Moving Occupations by Sex
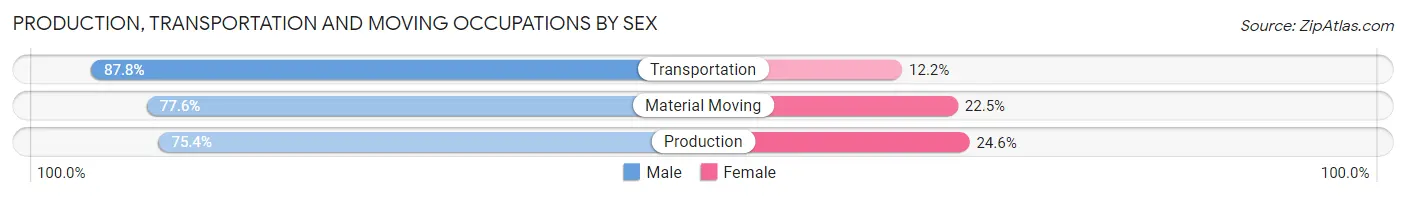
| Occupation | Male | Female |
| Production | 14,093 (75.4%) | 4,592 (24.6%) |
| Transportation | 9,904 (87.8%) | 1,377 (12.2%) |
| Material Moving | 9,125 (77.5%) | 2,641 (22.5%) |
| Total (Category) | 33,122 (79.4%) | 8,610 (20.6%) |
| Total (Overall) | 168,246 (51.8%) | 156,550 (48.2%) |
Employment Industries by Sex in Area Code 607
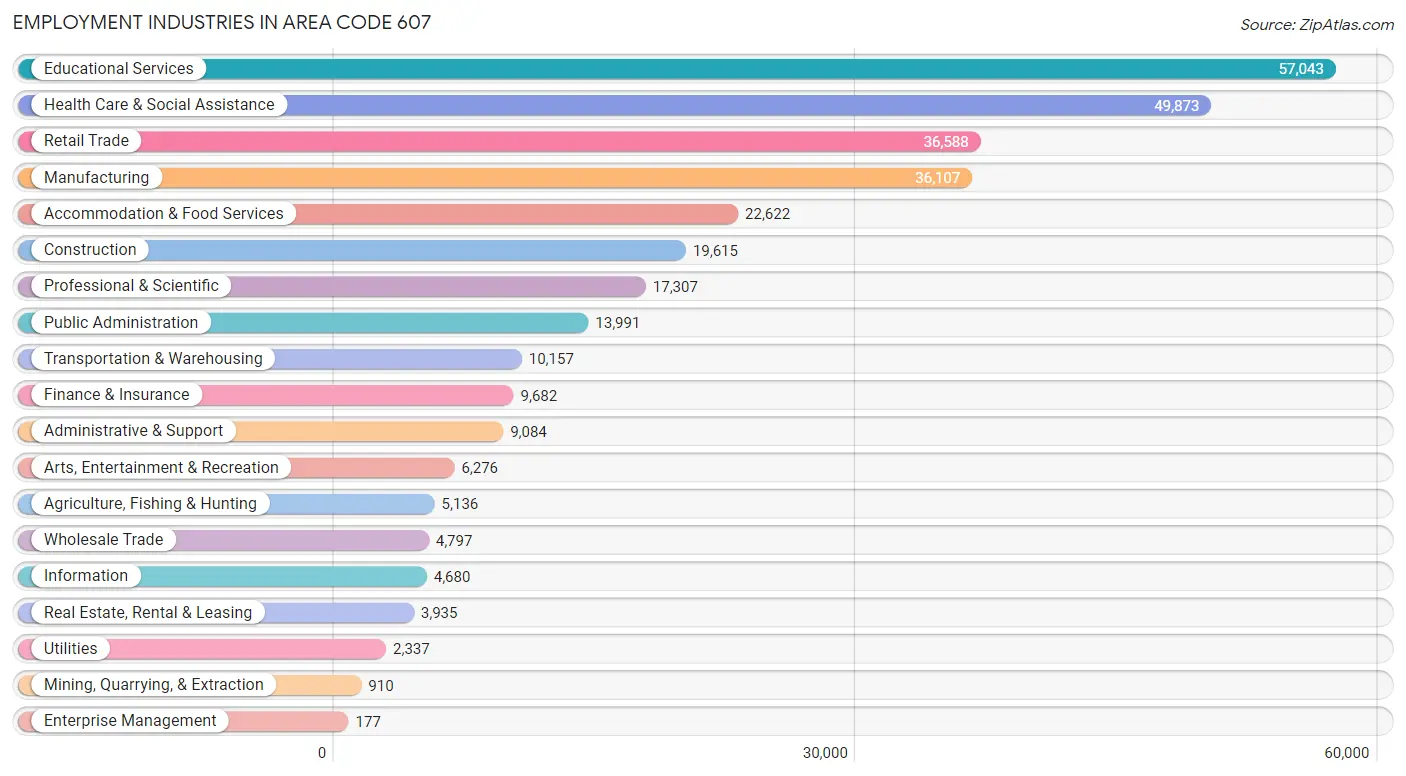
Employment Industries in Area Code 607
The major employment industries in Area Code 607 include Educational Services (57,043 | 17.6%), Health Care & Social Assistance (49,873 | 15.4%), Retail Trade (36,588 | 11.3%), Manufacturing (36,107 | 11.1%), and Accommodation & Food Services (22,622 | 7.0%).
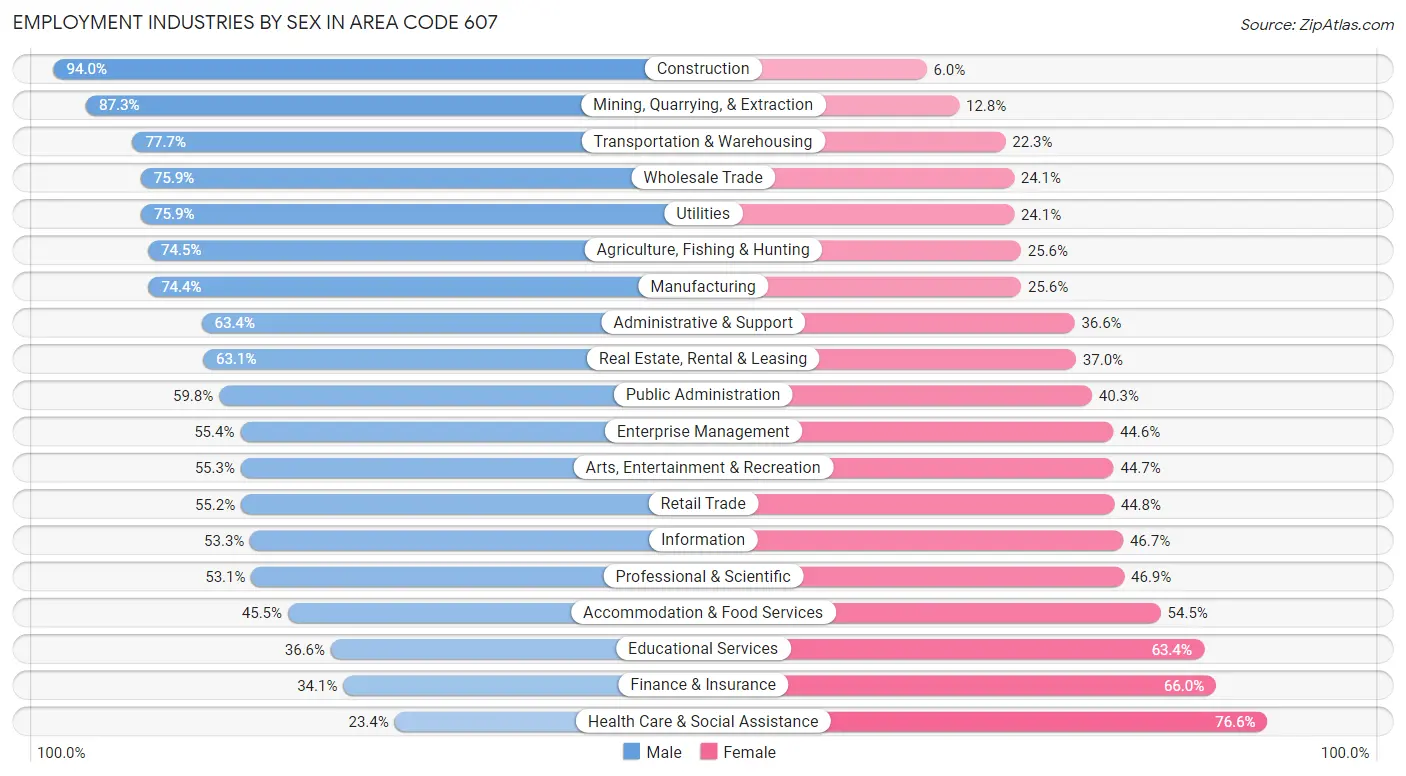
Employment Industries by Sex in Area Code 607
The Area Code 607 industries that see more men than women are Construction (94.0%), Mining, Quarrying, & Extraction (87.3%), and Transportation & Warehousing (77.7%), whereas the industries that tend to have a higher number of women are Health Care & Social Assistance (76.6%), Finance & Insurance (65.9%), and Educational Services (63.4%).
| Industry | Male | Female |
| Agriculture, Fishing & Hunting | 3,824 (74.5%) | 1,312 (25.6%) |
| Mining, Quarrying, & Extraction | 794 (87.3%) | 116 (12.8%) |
| Construction | 18,434 (94.0%) | 1,181 (6.0%) |
| Manufacturing | 26,869 (74.4%) | 9,238 (25.6%) |
| Wholesale Trade | 3,642 (75.9%) | 1,155 (24.1%) |
| Retail Trade | 20,200 (55.2%) | 16,388 (44.8%) |
| Transportation & Warehousing | 7,888 (77.7%) | 2,269 (22.3%) |
| Utilities | 1,773 (75.9%) | 564 (24.1%) |
| Information | 2,495 (53.3%) | 2,185 (46.7%) |
| Finance & Insurance | 3,297 (34.1%) | 6,385 (65.9%) |
| Real Estate, Rental & Leasing | 2,481 (63.0%) | 1,454 (36.9%) |
| Professional & Scientific | 9,186 (53.1%) | 8,121 (46.9%) |
| Enterprise Management | 98 (55.4%) | 79 (44.6%) |
| Administrative & Support | 5,756 (63.4%) | 3,328 (36.6%) |
| Educational Services | 20,881 (36.6%) | 36,162 (63.4%) |
| Health Care & Social Assistance | 11,682 (23.4%) | 38,191 (76.6%) |
| Arts, Entertainment & Recreation | 3,468 (55.3%) | 2,808 (44.7%) |
| Accommodation & Food Services | 10,296 (45.5%) | 12,326 (54.5%) |
| Public Administration | 8,359 (59.8%) | 5,632 (40.3%) |
| Total | 168,246 (51.8%) | 156,550 (48.2%) |
Education in Area Code 607
School Enrollment in Area Code 607
The most common levels of schooling among the 185,414 students in Area Code 607 are college / undergraduate (66,599 | 35.9%), middle school (31,050 | 16.8%), and high school (30,967 | 16.7%).
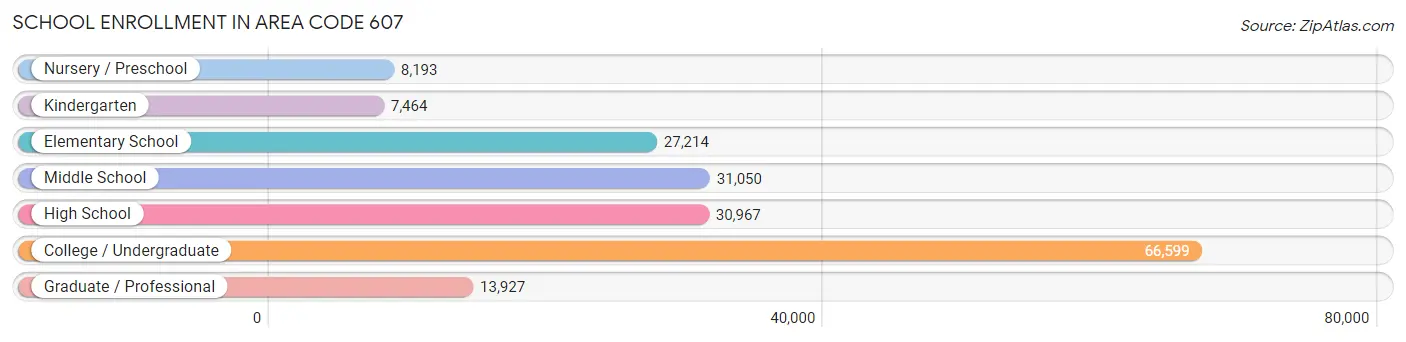
| School Level | # Students | % Students |
| Nursery / Preschool | 8,193 | 4.4% |
| Kindergarten | 7,464 | 4.0% |
| Elementary School | 27,214 | 14.7% |
| Middle School | 31,050 | 16.8% |
| High School | 30,967 | 16.7% |
| College / Undergraduate | 66,599 | 35.9% |
| Graduate / Professional | 13,927 | 7.5% |
| Total | 185,414 | 100.0% |
School Enrollment by Age by Funding Source in Area Code 607
Out of a total of 185,414 students who are enrolled in schools in Area Code 607, 44,833 (24.2%) attend a private institution, while the remaining 140,581 (75.8%) are enrolled in public schools. The age group of 25 to 34 year olds has the highest likelihood of being enrolled in private schools, with 4,376 (42.9% in the age bracket) enrolled. Conversely, the age group of 15 to 17 year olds has the lowest likelihood of being enrolled in a private school, with 20,981 (91.6% in the age bracket) attending a public institution.
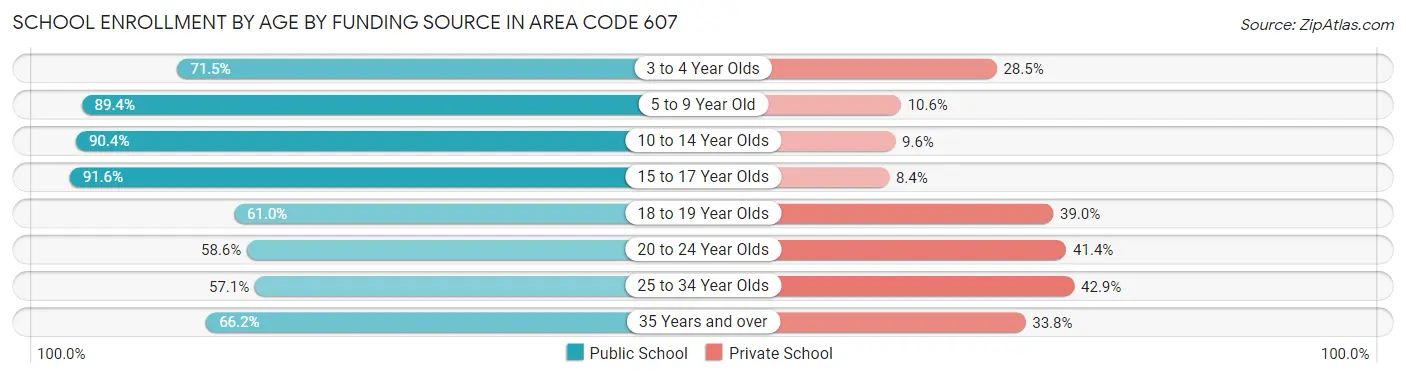
| Age Bracket | Public School | Private School |
| 3 to 4 Year Olds | 5,014 (71.5%) | 1,995 (28.5%) |
| 5 to 9 Year Old | 29,660 (89.4%) | 3,524 (10.6%) |
| 10 to 14 Year Olds | 34,693 (90.4%) | 3,675 (9.6%) |
| 15 to 17 Year Olds | 20,981 (91.6%) | 1,932 (8.4%) |
| 18 to 19 Year Olds | 18,271 (61.0%) | 11,683 (39.0%) |
| 20 to 24 Year Olds | 21,769 (58.6%) | 15,405 (41.4%) |
| 25 to 34 Year Olds | 5,820 (57.1%) | 4,376 (42.9%) |
| 35 Years and over | 4,378 (66.2%) | 2,238 (33.8%) |
| Total | 140,581 (75.8%) | 44,833 (24.2%) |
Educational Attainment by Field of Study in Area Code 607
Education (24,147 | 14.8%), business (18,402 | 11.3%), science & technology (15,692 | 9.6%), social sciences (13,563 | 8.3%), and bio, nature & agricultural (13,026 | 8.0%) are the most common fields of study among 162,889 individuals in Area Code 607 who have obtained a bachelor's degree or higher.
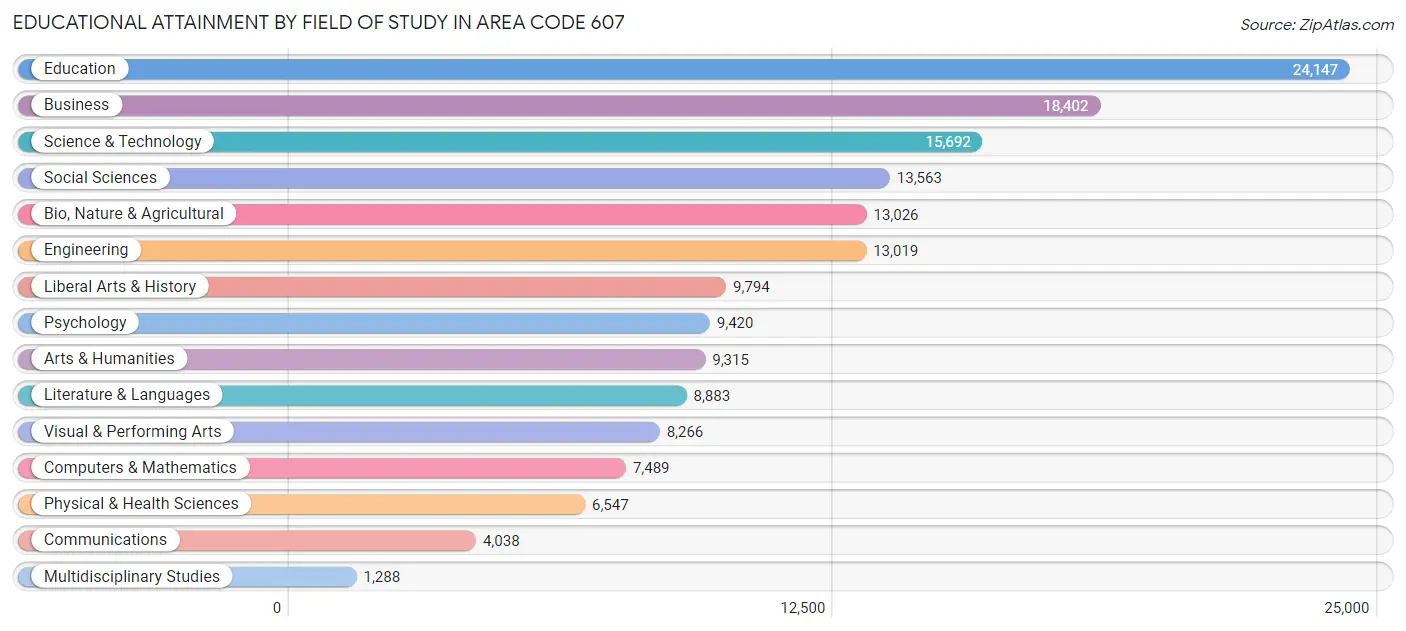
| Field of Study | # Graduates | % Graduates |
| Computers & Mathematics | 7,489 | 4.6% |
| Bio, Nature & Agricultural | 13,026 | 8.0% |
| Physical & Health Sciences | 6,547 | 4.0% |
| Psychology | 9,420 | 5.8% |
| Social Sciences | 13,563 | 8.3% |
| Engineering | 13,019 | 8.0% |
| Multidisciplinary Studies | 1,288 | 0.8% |
| Science & Technology | 15,692 | 9.6% |
| Business | 18,402 | 11.3% |
| Education | 24,147 | 14.8% |
| Literature & Languages | 8,883 | 5.4% |
| Liberal Arts & History | 9,794 | 6.0% |
| Visual & Performing Arts | 8,266 | 5.1% |
| Communications | 4,038 | 2.5% |
| Arts & Humanities | 9,315 | 5.7% |
| Total | 162,889 | 100.0% |
Transportation & Commute in Area Code 607
Vehicle Availability by Sex in Area Code 607
The most prevalent vehicle ownership categories in Area Code 607 are males with 2 vehicles (69,894, accounting for 43.2%) and females with 2 vehicles (62,339, making up 47.6%).
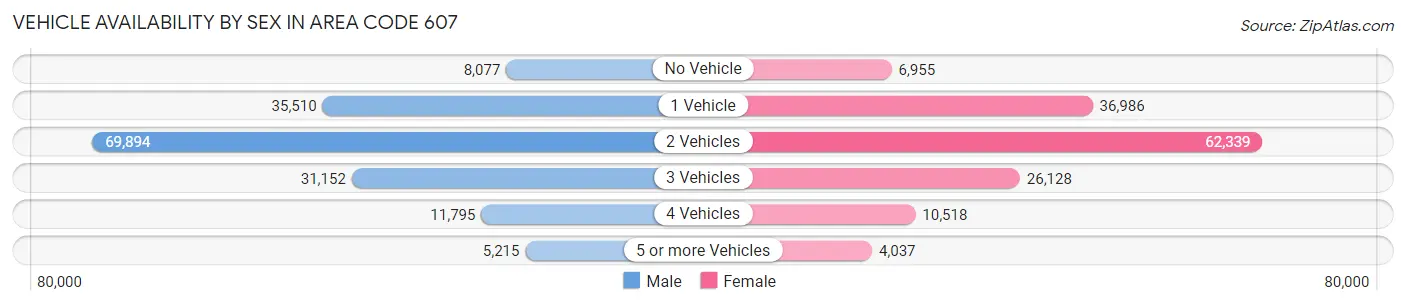
| Vehicles Available | Male | Female |
| No Vehicle | 8,077 (5.0%) | 6,955 (4.7%) |
| 1 Vehicle | 35,510 (22.0%) | 36,986 (25.2%) |
| 2 Vehicles | 69,894 (43.2%) | 62,339 (42.4%) |
| 3 Vehicles | 31,152 (19.3%) | 26,128 (17.8%) |
| 4 Vehicles | 11,795 (7.3%) | 10,518 (7.2%) |
| 5 or more Vehicles | 5,215 (3.2%) | 4,037 (2.8%) |
| Total | 161,643 (100.0%) | 146,963 (100.0%) |
Commute Time in Area Code 607
The most frequently occuring commute durations in Area Code 607 are 10 to 14 minutes (52,701 commuters, 18.2%), 15 to 19 minutes (50,677 commuters, 17.5%), and 5 to 9 minutes (43,982 commuters, 15.2%).
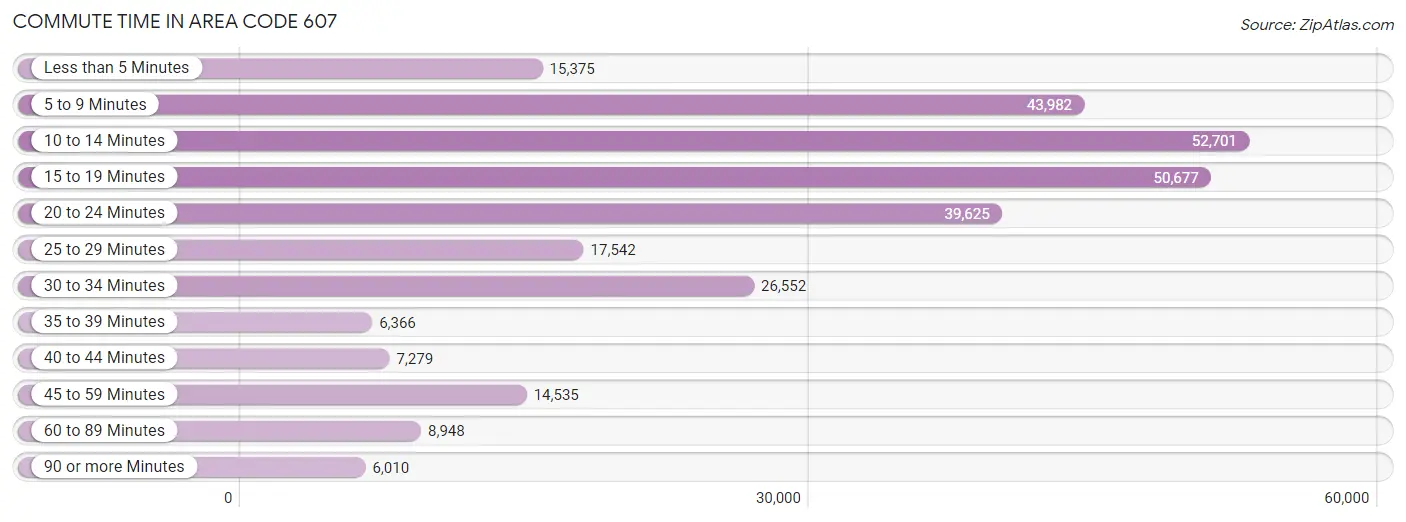
| Commute Time | # Commuters | % Commuters |
| Less than 5 Minutes | 15,375 | 5.3% |
| 5 to 9 Minutes | 43,982 | 15.2% |
| 10 to 14 Minutes | 52,701 | 18.2% |
| 15 to 19 Minutes | 50,677 | 17.5% |
| 20 to 24 Minutes | 39,625 | 13.7% |
| 25 to 29 Minutes | 17,542 | 6.1% |
| 30 to 34 Minutes | 26,552 | 9.2% |
| 35 to 39 Minutes | 6,366 | 2.2% |
| 40 to 44 Minutes | 7,279 | 2.5% |
| 45 to 59 Minutes | 14,535 | 5.0% |
| 60 to 89 Minutes | 8,948 | 3.1% |
| 90 or more Minutes | 6,010 | 2.1% |
Commute Time by Sex in Area Code 607
The most common commute times in Area Code 607 are 10 to 14 minutes (26,630 commuters, 17.6%) for males and 10 to 14 minutes (26,071 commuters, 18.8%) for females.
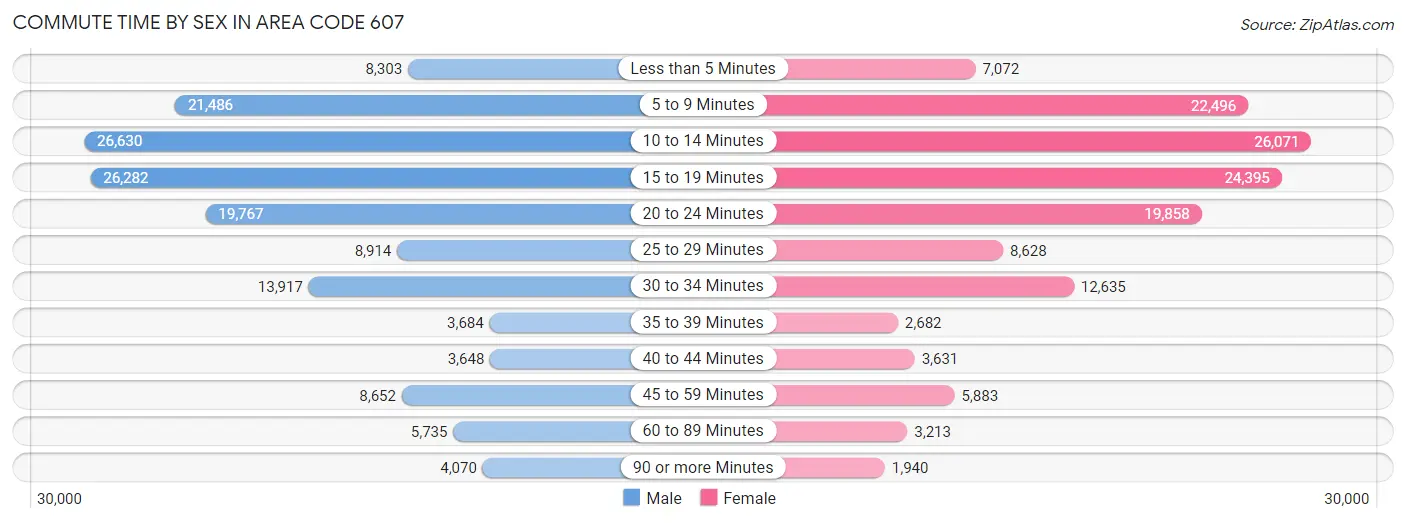
| Commute Time | Male | Female |
| Less than 5 Minutes | 8,303 (5.5%) | 7,072 (5.1%) |
| 5 to 9 Minutes | 21,486 (14.2%) | 22,496 (16.2%) |
| 10 to 14 Minutes | 26,630 (17.6%) | 26,071 (18.8%) |
| 15 to 19 Minutes | 26,282 (17.4%) | 24,395 (17.6%) |
| 20 to 24 Minutes | 19,767 (13.1%) | 19,858 (14.3%) |
| 25 to 29 Minutes | 8,914 (5.9%) | 8,628 (6.2%) |
| 30 to 34 Minutes | 13,917 (9.2%) | 12,635 (9.1%) |
| 35 to 39 Minutes | 3,684 (2.4%) | 2,682 (1.9%) |
| 40 to 44 Minutes | 3,648 (2.4%) | 3,631 (2.6%) |
| 45 to 59 Minutes | 8,652 (5.7%) | 5,883 (4.3%) |
| 60 to 89 Minutes | 5,735 (3.8%) | 3,213 (2.3%) |
| 90 or more Minutes | 4,070 (2.7%) | 1,940 (1.4%) |
Time of Departure to Work by Sex in Area Code 607
The most frequent times of departure to work in Area Code 607 are 7:30 AM to 7:59 AM (19,494, 12.9%) for males and 7:30 AM to 7:59 AM (23,706, 17.1%) for females.
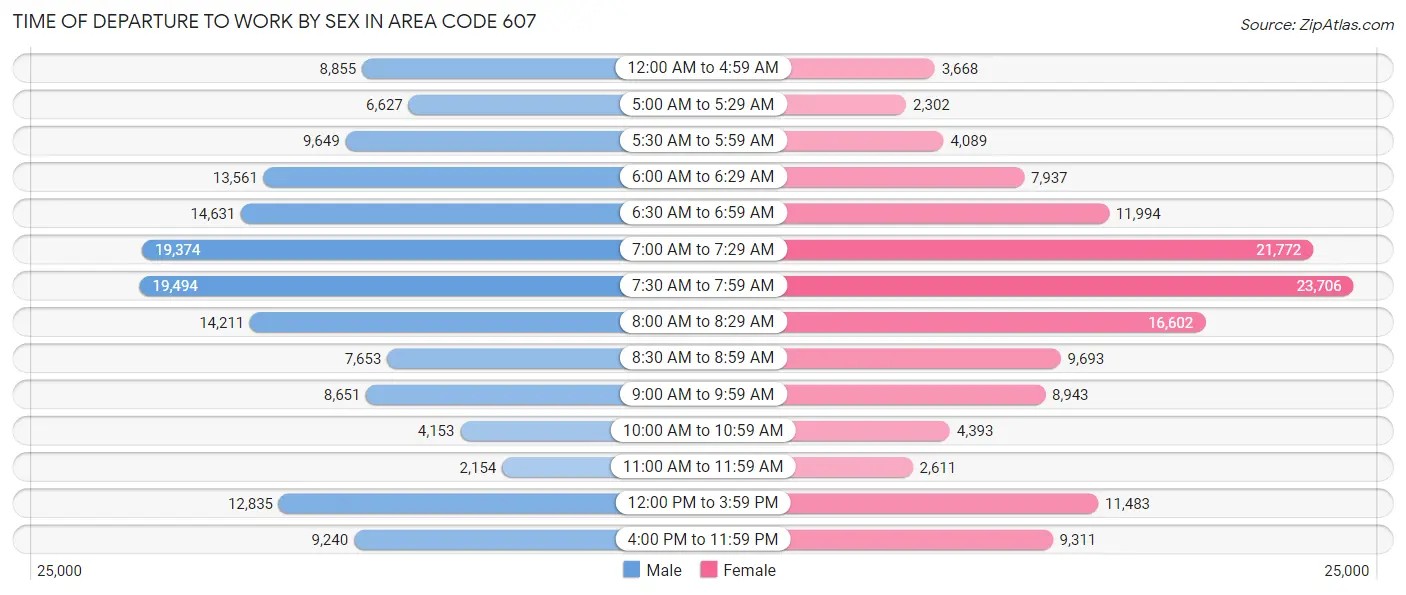
| Time of Departure | Male | Female |
| 12:00 AM to 4:59 AM | 8,855 (5.9%) | 3,668 (2.6%) |
| 5:00 AM to 5:29 AM | 6,627 (4.4%) | 2,302 (1.7%) |
| 5:30 AM to 5:59 AM | 9,649 (6.4%) | 4,089 (2.9%) |
| 6:00 AM to 6:29 AM | 13,561 (9.0%) | 7,937 (5.7%) |
| 6:30 AM to 6:59 AM | 14,631 (9.7%) | 11,994 (8.7%) |
| 7:00 AM to 7:29 AM | 19,374 (12.8%) | 21,772 (15.7%) |
| 7:30 AM to 7:59 AM | 19,494 (12.9%) | 23,706 (17.1%) |
| 8:00 AM to 8:29 AM | 14,211 (9.4%) | 16,602 (12.0%) |
| 8:30 AM to 8:59 AM | 7,653 (5.1%) | 9,693 (7.0%) |
| 9:00 AM to 9:59 AM | 8,651 (5.7%) | 8,943 (6.5%) |
| 10:00 AM to 10:59 AM | 4,153 (2.8%) | 4,393 (3.2%) |
| 11:00 AM to 11:59 AM | 2,154 (1.4%) | 2,611 (1.9%) |
| 12:00 PM to 3:59 PM | 12,835 (8.5%) | 11,483 (8.3%) |
| 4:00 PM to 11:59 PM | 9,240 (6.1%) | 9,311 (6.7%) |
| Total | 151,088 (100.0%) | 138,504 (100.0%) |
Housing Occupancy in Area Code 607
Occupancy by Ownership in Area Code 607
Of the total 293,285 dwellings in Area Code 607, owner-occupied units account for 198,847 (67.8%), while renter-occupied units make up 94,438 (32.2%).
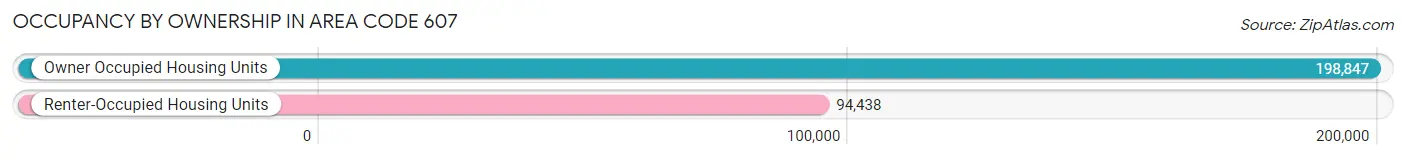
| Occupancy | # Housing Units | % Housing Units |
| Owner Occupied Housing Units | 198,847 | 67.8% |
| Renter-Occupied Housing Units | 94,438 | 32.2% |
| Total Occupied Housing Units | 293,285 | 100.0% |
Occupancy by Household Size in Area Code 607
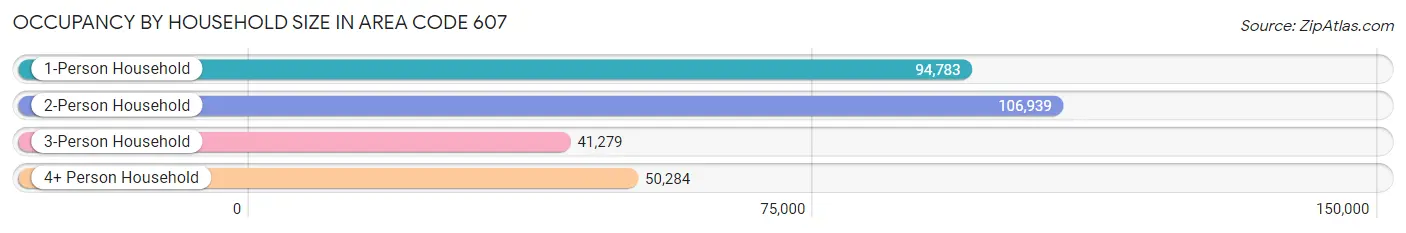
| Household Size | # Housing Units | % Housing Units |
| 1-Person Household | 94,783 | 32.3% |
| 2-Person Household | 106,939 | 36.5% |
| 3-Person Household | 41,279 | 14.1% |
| 4+ Person Household | 50,284 | 17.2% |
| Total Housing Units | 293,285 | 100.0% |
Occupancy by Ownership by Household Size in Area Code 607
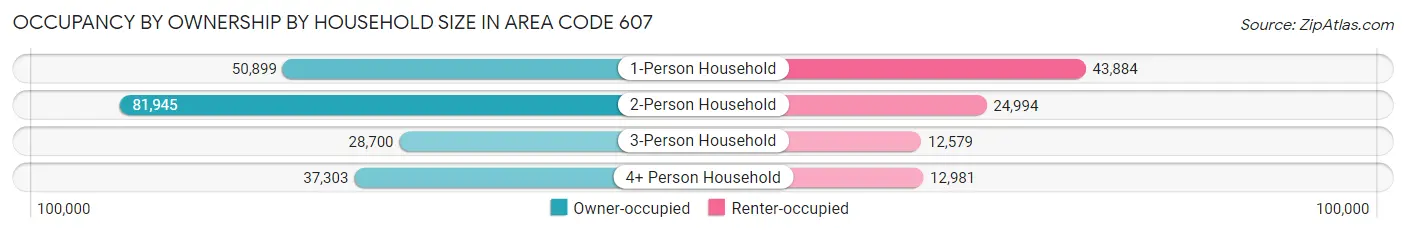
| Household Size | Owner-occupied | Renter-occupied |
| 1-Person Household | 50,899 (53.7%) | 43,884 (46.3%) |
| 2-Person Household | 81,945 (76.6%) | 24,994 (23.4%) |
| 3-Person Household | 28,700 (69.5%) | 12,579 (30.5%) |
| 4+ Person Household | 37,303 (74.2%) | 12,981 (25.8%) |
| Total Housing Units | 198,847 (67.8%) | 94,438 (32.2%) |
Occupancy by Educational Attainment in Area Code 607
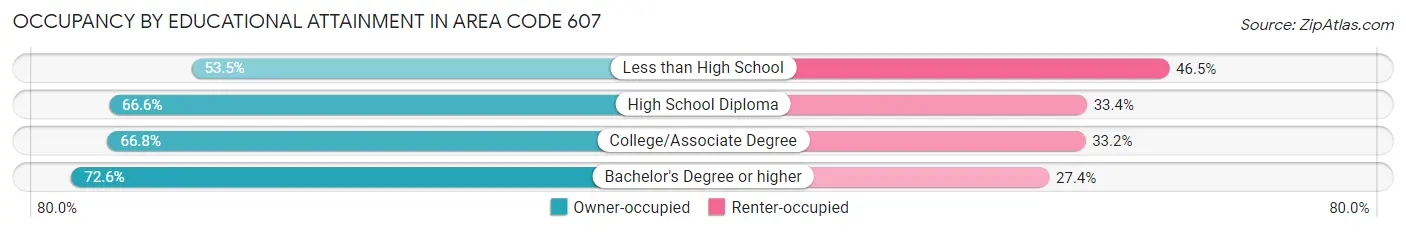
| Household Size | Owner-occupied | Renter-occupied |
| Less than High School | 10,467 (53.5%) | 9,088 (46.5%) |
| High School Diploma | 55,324 (66.6%) | 27,745 (33.4%) |
| College/Associate Degree | 61,793 (66.8%) | 30,663 (33.2%) |
| Bachelor's Degree or higher | 71,263 (72.6%) | 26,942 (27.4%) |
Occupancy by Age of Householder in Area Code 607
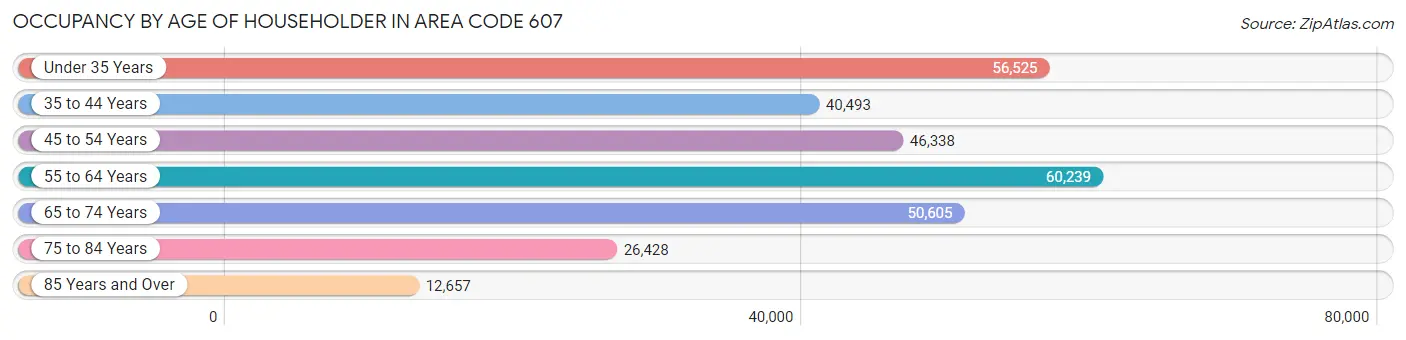
| Age Bracket | # Households | % Households |
| Under 35 Years | 56,525 | 19.3% |
| 35 to 44 Years | 40,493 | 13.8% |
| 45 to 54 Years | 46,338 | 15.8% |
| 55 to 64 Years | 60,239 | 20.5% |
| 65 to 74 Years | 50,605 | 17.2% |
| 75 to 84 Years | 26,428 | 9.0% |
| 85 Years and Over | 12,657 | 4.3% |
| Total | 293,285 | 100.0% |
Housing Finances in Area Code 607
Median Income by Occupancy in Area Code 607
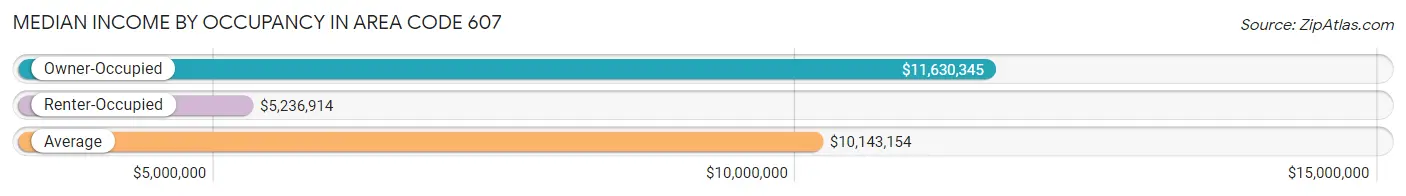
| Occupancy Type | # Households | Median Income |
| Owner-Occupied | 198,847 (67.8%) | $11,630,345 |
| Renter-Occupied | 94,438 (32.2%) | $5,236,914 |
| Average | 293,285 (100.0%) | $10,143,154 |
Occupancy by Householder Income Bracket in Area Code 607
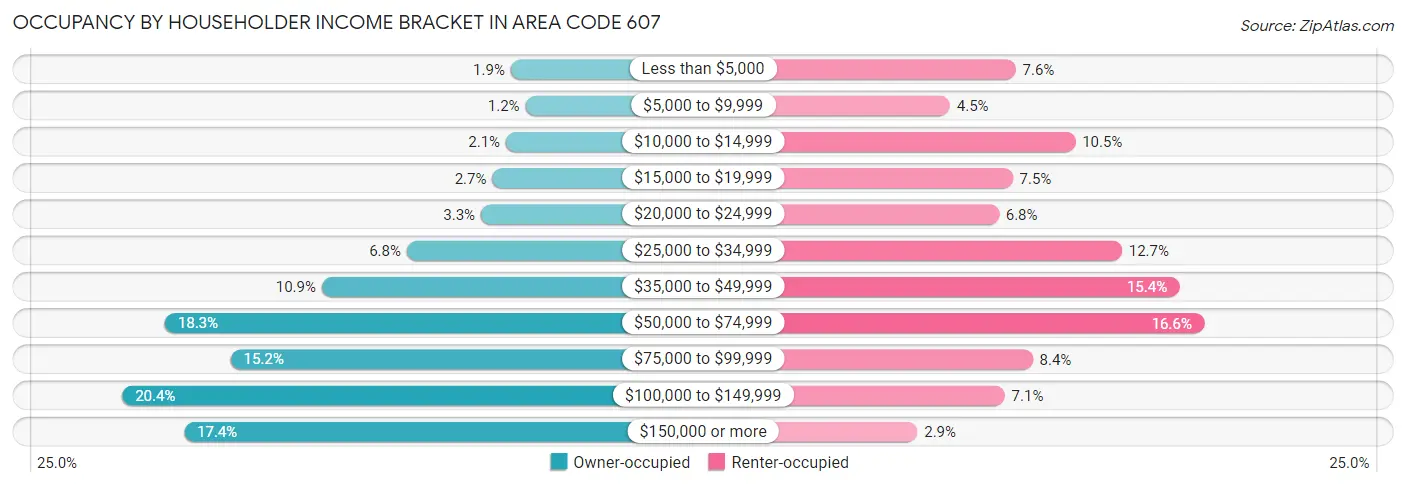
| Income Bracket | Owner-occupied | Renter-occupied |
| Less than $5,000 | 3,681 (1.8%) | 7,194 (7.6%) |
| $5,000 to $9,999 | 2,278 (1.1%) | 4,244 (4.5%) |
| $10,000 to $14,999 | 4,135 (2.1%) | 9,874 (10.5%) |
| $15,000 to $19,999 | 5,434 (2.7%) | 7,062 (7.5%) |
| $20,000 to $24,999 | 6,500 (3.3%) | 6,440 (6.8%) |
| $25,000 to $34,999 | 13,522 (6.8%) | 11,976 (12.7%) |
| $35,000 to $49,999 | 21,575 (10.8%) | 14,545 (15.4%) |
| $50,000 to $74,999 | 36,419 (18.3%) | 15,658 (16.6%) |
| $75,000 to $99,999 | 30,213 (15.2%) | 7,957 (8.4%) |
| $100,000 to $149,999 | 40,474 (20.3%) | 6,708 (7.1%) |
| $150,000 or more | 34,616 (17.4%) | 2,780 (2.9%) |
| Total | 198,847 (100.0%) | 94,438 (100.0%) |
Monthly Housing Cost Tiers in Area Code 607
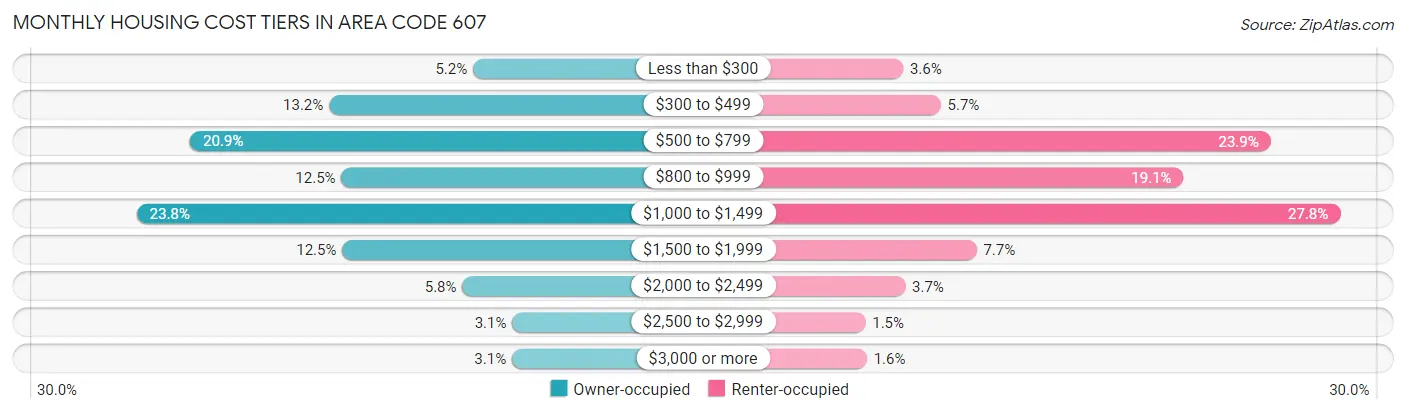
| Monthly Cost | Owner-occupied | Renter-occupied |
| Less than $300 | 10,407 (5.2%) | 3,421 (3.6%) |
| $300 to $499 | 26,211 (13.2%) | 5,383 (5.7%) |
| $500 to $799 | 41,476 (20.9%) | 22,588 (23.9%) |
| $800 to $999 | 24,849 (12.5%) | 18,047 (19.1%) |
| $1,000 to $1,499 | 47,336 (23.8%) | 26,212 (27.8%) |
| $1,500 to $1,999 | 24,766 (12.4%) | 7,253 (7.7%) |
| $2,000 to $2,499 | 11,579 (5.8%) | 3,531 (3.7%) |
| $2,500 to $2,999 | 6,089 (3.1%) | 1,453 (1.5%) |
| $3,000 or more | 6,134 (3.1%) | 1,529 (1.6%) |
| Total | 198,847 (100.0%) | 94,438 (100.0%) |
Physical Housing Characteristics in Area Code 607
Housing Structures in Area Code 607
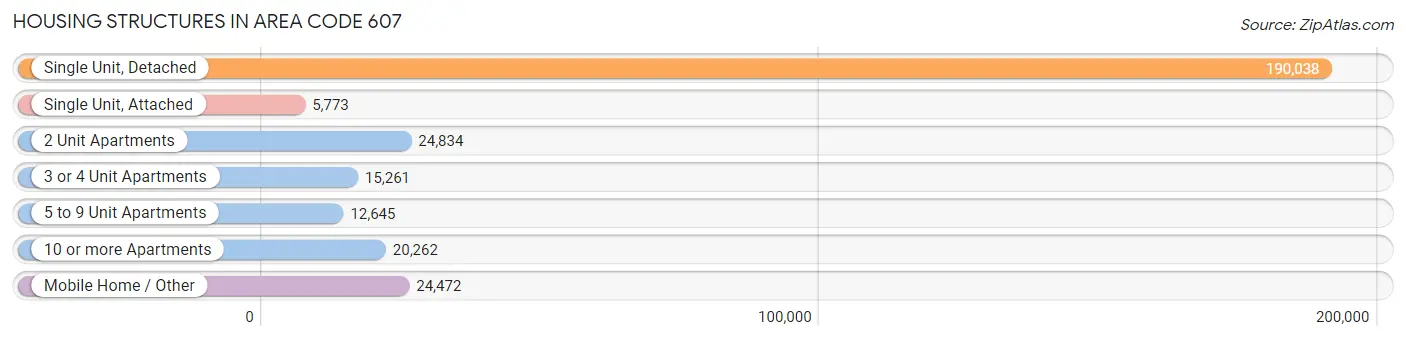
| Structure Type | # Housing Units | % Housing Units |
| Single Unit, Detached | 190,038 | 64.8% |
| Single Unit, Attached | 5,773 | 2.0% |
| 2 Unit Apartments | 24,834 | 8.5% |
| 3 or 4 Unit Apartments | 15,261 | 5.2% |
| 5 to 9 Unit Apartments | 12,645 | 4.3% |
| 10 or more Apartments | 20,262 | 6.9% |
| Mobile Home / Other | 24,472 | 8.3% |
| Total | 293,285 | 100.0% |
Housing Structures by Occupancy in Area Code 607
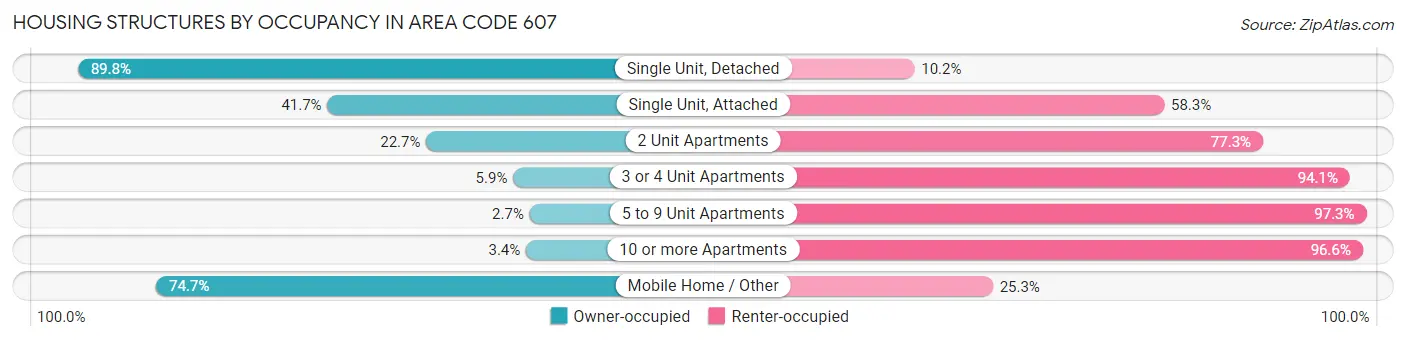
| Structure Type | Owner-occupied | Renter-occupied |
| Single Unit, Detached | 170,589 (89.8%) | 19,449 (10.2%) |
| Single Unit, Attached | 2,407 (41.7%) | 3,366 (58.3%) |
| 2 Unit Apartments | 5,628 (22.7%) | 19,206 (77.3%) |
| 3 or 4 Unit Apartments | 904 (5.9%) | 14,357 (94.1%) |
| 5 to 9 Unit Apartments | 347 (2.7%) | 12,298 (97.3%) |
| 10 or more Apartments | 696 (3.4%) | 19,566 (96.6%) |
| Mobile Home / Other | 18,276 (74.7%) | 6,196 (25.3%) |
| Total | 198,847 (67.8%) | 94,438 (32.2%) |
Housing Structures by Number of Rooms in Area Code 607
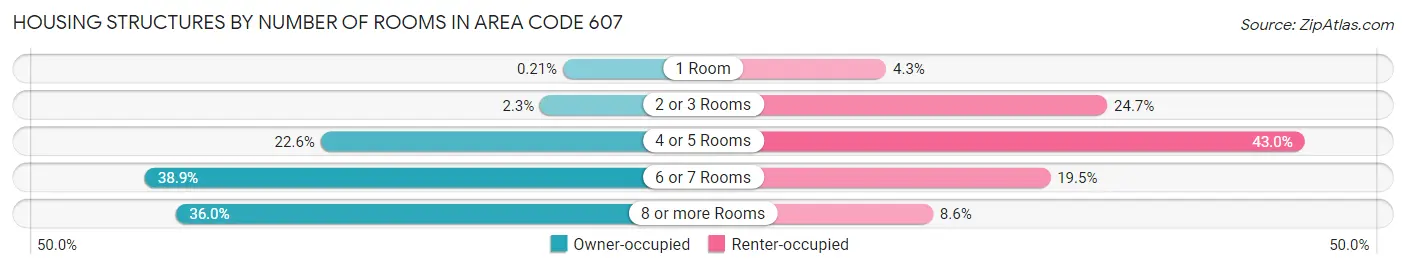
| Number of Rooms | Owner-occupied | Renter-occupied |
| 1 Room | 414 (0.2%) | 4,036 (4.3%) |
| 2 or 3 Rooms | 4,636 (2.3%) | 23,334 (24.7%) |
| 4 or 5 Rooms | 44,970 (22.6%) | 40,578 (43.0%) |
| 6 or 7 Rooms | 77,296 (38.9%) | 18,368 (19.5%) |
| 8 or more Rooms | 71,531 (36.0%) | 8,122 (8.6%) |
| Total | 198,847 (100.0%) | 94,438 (100.0%) |
Housing Structure by Heating Type in Area Code 607
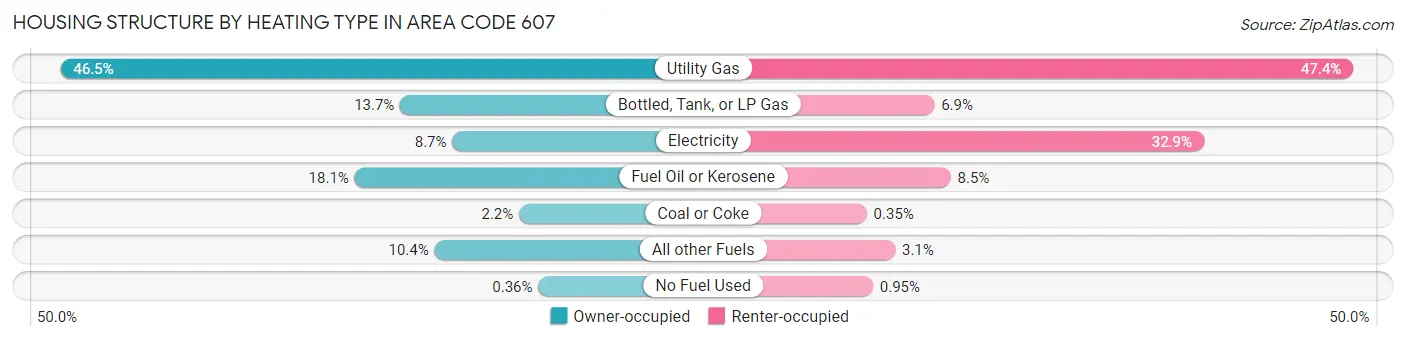
| Heating Type | Owner-occupied | Renter-occupied |
| Utility Gas | 92,548 (46.5%) | 44,720 (47.3%) |
| Bottled, Tank, or LP Gas | 27,265 (13.7%) | 6,499 (6.9%) |
| Electricity | 17,241 (8.7%) | 31,085 (32.9%) |
| Fuel Oil or Kerosene | 36,020 (18.1%) | 7,994 (8.5%) |
| Coal or Coke | 4,408 (2.2%) | 330 (0.4%) |
| All other Fuels | 20,659 (10.4%) | 2,916 (3.1%) |
| No Fuel Used | 706 (0.4%) | 894 (0.9%) |
| Total | 198,847 (100.0%) | 94,438 (100.0%) |
Household Vehicle Usage in Area Code 607
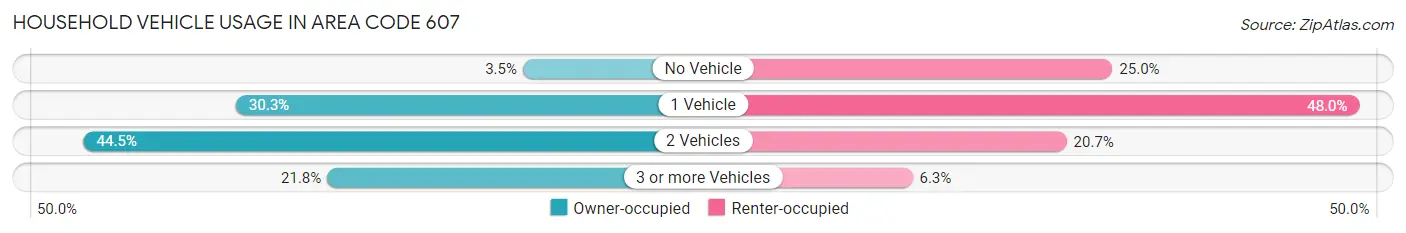
| Vehicles per Household | Owner-occupied | Renter-occupied |
| No Vehicle | 6,932 (3.5%) | 23,580 (25.0%) |
| 1 Vehicle | 60,194 (30.3%) | 45,352 (48.0%) |
| 2 Vehicles | 88,458 (44.5%) | 19,546 (20.7%) |
| 3 or more Vehicles | 43,263 (21.8%) | 5,960 (6.3%) |
| Total | 198,847 (100.0%) | 94,438 (100.0%) |
Real Estate & Mortgages in Area Code 607
Real Estate and Mortgage Overview in Area Code 607
| Characteristic | Without Mortgage | With Mortgage |
| Housing Units | 96,432 | 102,415 |
| Median Property Value | $18,238,100 | $24,171,299 |
| Median Household Income | $8,899,009 | $22,271 |
| Monthly Housing Costs | $85,021 | $5,848 |
| Real Estate Taxes | $426,452 | $2,737 |
Property Value by Mortgage Status in Area Code 607
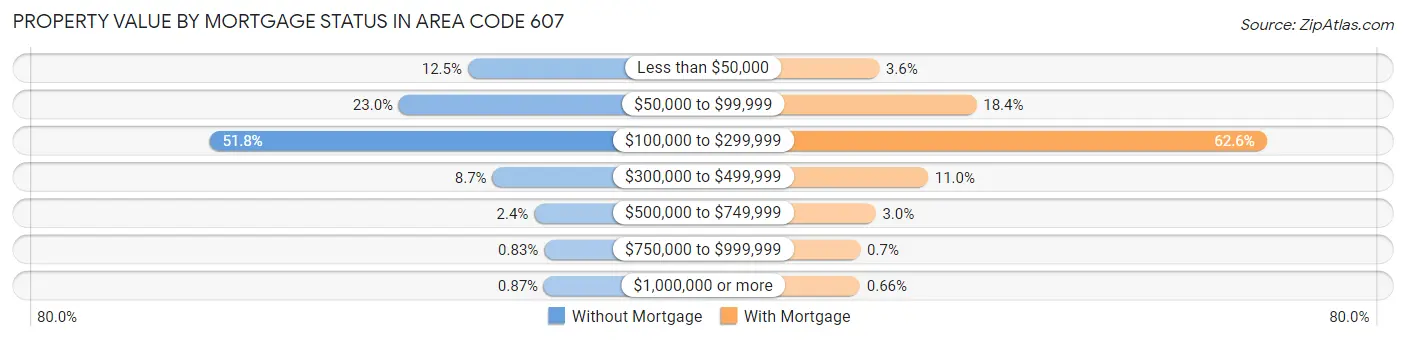
| Property Value | Without Mortgage | With Mortgage |
| Less than $50,000 | 12,019 (12.5%) | 3,644 (3.6%) |
| $50,000 to $99,999 | 22,137 (23.0%) | 18,849 (18.4%) |
| $100,000 to $299,999 | 49,976 (51.8%) | 64,154 (62.6%) |
| $300,000 to $499,999 | 8,401 (8.7%) | 11,276 (11.0%) |
| $500,000 to $749,999 | 2,262 (2.4%) | 3,099 (3.0%) |
| $750,000 to $999,999 | 801 (0.8%) | 713 (0.7%) |
| $1,000,000 or more | 836 (0.9%) | 680 (0.7%) |
| Total | 96,432 (100.0%) | 102,415 (100.0%) |
Household Income by Mortgage Status in Area Code 607
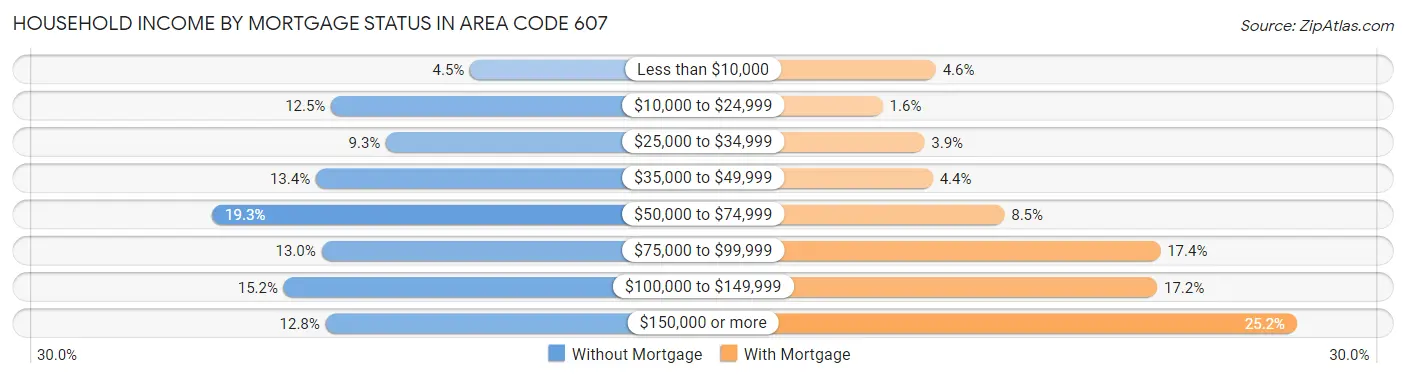
| Household Income | Without Mortgage | With Mortgage |
| Less than $10,000 | 4,376 (4.5%) | 4,688 (4.6%) |
| $10,000 to $24,999 | 12,039 (12.5%) | 1,583 (1.5%) |
| $25,000 to $34,999 | 9,005 (9.3%) | 4,030 (3.9%) |
| $35,000 to $49,999 | 12,869 (13.4%) | 4,517 (4.4%) |
| $50,000 to $74,999 | 18,591 (19.3%) | 8,706 (8.5%) |
| $75,000 to $99,999 | 12,562 (13.0%) | 17,828 (17.4%) |
| $100,000 to $149,999 | 14,645 (15.2%) | 17,651 (17.2%) |
| $150,000 or more | 12,345 (12.8%) | 25,829 (25.2%) |
| Total | 96,432 (100.0%) | 102,415 (100.0%) |
Property Value to Household Income Ratio in Area Code 607
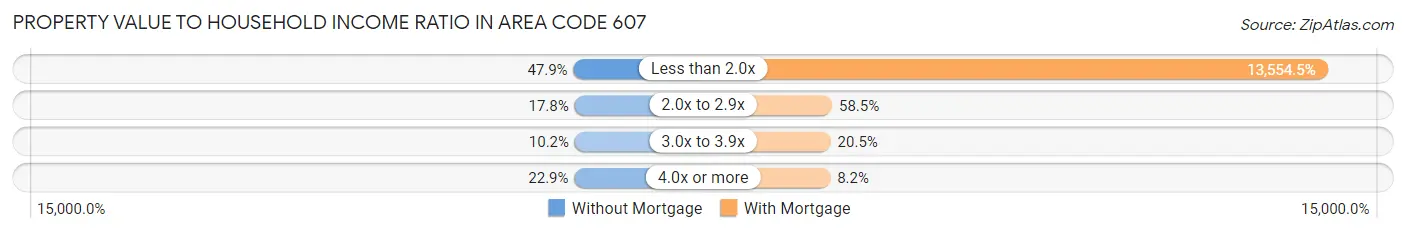
| Value-to-Income Ratio | Without Mortgage | With Mortgage |
| Less than 2.0x | 46,183 (47.9%) | 13,881,836 (13,554.5%) |
| 2.0x to 2.9x | 17,192 (17.8%) | 59,890 (58.5%) |
| 3.0x to 3.9x | 9,824 (10.2%) | 20,943 (20.4%) |
| 4.0x or more | 22,120 (22.9%) | 8,381 (8.2%) |
| Total | 96,432 (100.0%) | 102,415 (100.0%) |
Real Estate Taxes by Mortgage Status in Area Code 607
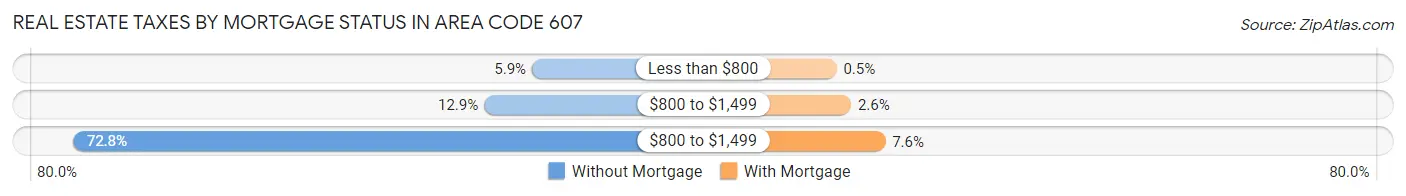
| Property Taxes | Without Mortgage | With Mortgage |
| Less than $800 | 5,658 (5.9%) | 512 (0.5%) |
| $800 to $1,499 | 12,413 (12.9%) | 2,681 (2.6%) |
| $800 to $1,499 | 70,216 (72.8%) | 7,802 (7.6%) |
| Total | 96,432 (100.0%) | 102,415 (100.0%) |
Health & Disability in Area Code 607
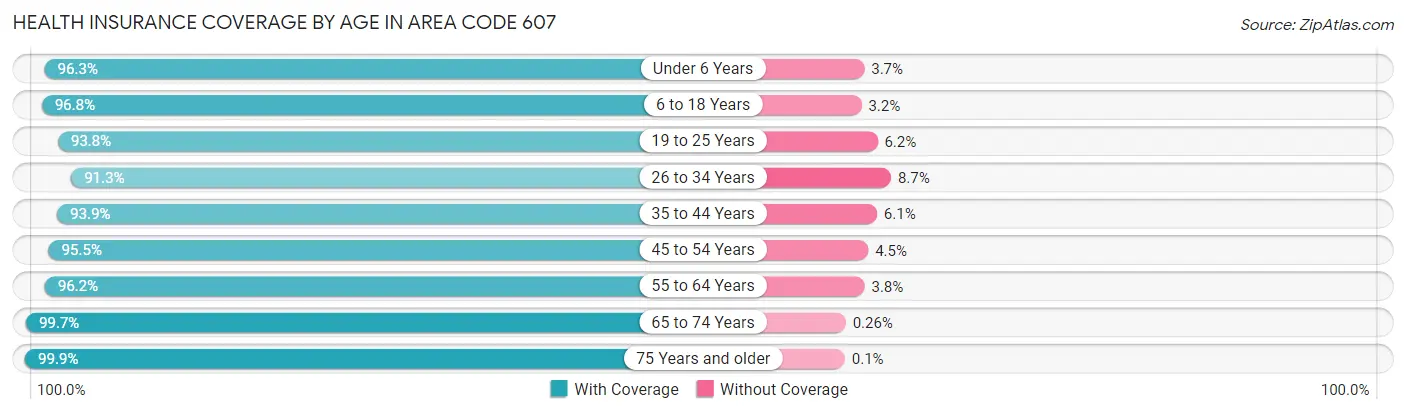
Health Insurance Coverage by Age in Area Code 607
| Age Bracket | With Coverage | Without Coverage |
| Under 6 Years | 38,608 (96.3%) | 1,497 (3.7%) |
| 6 to 18 Years | 105,307 (96.8%) | 3,486 (3.2%) |
| 19 to 25 Years | 88,103 (93.8%) | 5,812 (6.2%) |
| 26 to 34 Years | 64,858 (91.3%) | 6,182 (8.7%) |
| 35 to 44 Years | 71,735 (93.9%) | 4,642 (6.1%) |
| 45 to 54 Years | 77,169 (95.5%) | 3,604 (4.5%) |
| 55 to 64 Years | 96,522 (96.2%) | 3,797 (3.8%) |
| 65 to 74 Years | 78,954 (99.7%) | 209 (0.3%) |
| 75 Years and older | 56,332 (99.9%) | 57 (0.1%) |
| Total | 677,588 (95.9%) | 29,286 (4.1%) |
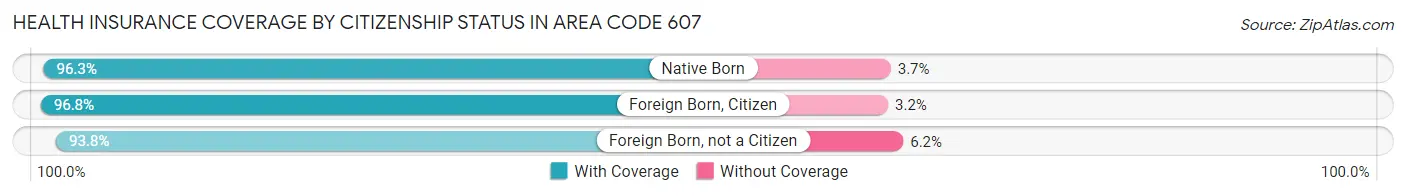
Health Insurance Coverage by Citizenship Status in Area Code 607
| Citizenship Status | With Coverage | Without Coverage |
| Native Born | 38,608 (96.3%) | 1,497 (3.7%) |
| Foreign Born, Citizen | 105,307 (96.8%) | 3,486 (3.2%) |
| Foreign Born, not a Citizen | 88,103 (93.8%) | 5,812 (6.2%) |
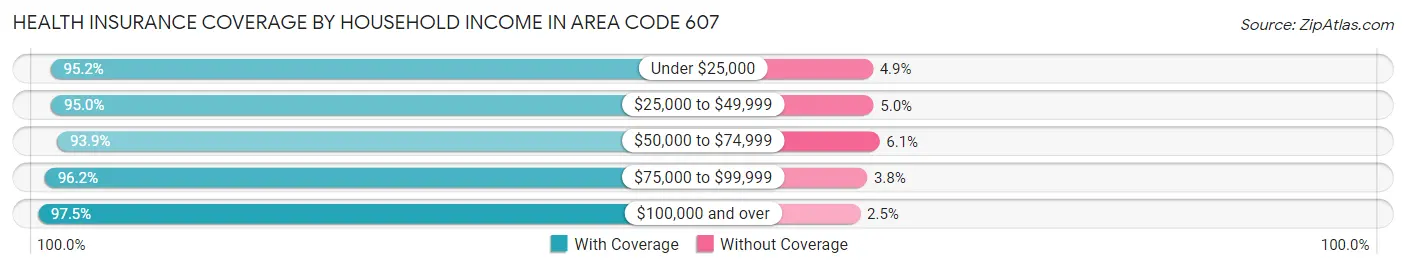
Health Insurance Coverage by Household Income in Area Code 607
| Household Income | With Coverage | Without Coverage |
| Under $25,000 | 86,491 (95.2%) | 4,405 (4.9%) |
| $25,000 to $49,999 | 114,498 (95.0%) | 5,991 (5.0%) |
| $50,000 to $74,999 | 110,917 (93.9%) | 7,210 (6.1%) |
| $75,000 to $99,999 | 92,318 (96.2%) | 3,624 (3.8%) |
| $100,000 and over | 237,890 (97.5%) | 6,070 (2.5%) |
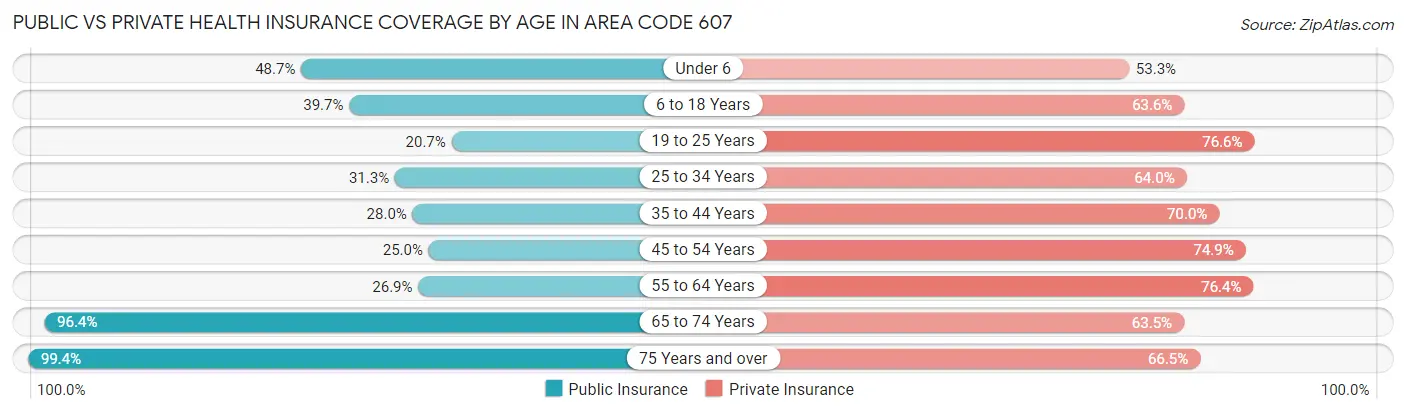
Public vs Private Health Insurance Coverage by Age in Area Code 607
| Age Bracket | Public Insurance | Private Insurance |
| Under 6 | 19,513 (48.6%) | 21,372 (53.3%) |
| 6 to 18 Years | 43,224 (39.7%) | 69,141 (63.5%) |
| 19 to 25 Years | 19,479 (20.7%) | 71,911 (76.6%) |
| 25 to 34 Years | 22,197 (31.2%) | 45,443 (64.0%) |
| 35 to 44 Years | 21,359 (28.0%) | 53,494 (70.0%) |
| 45 to 54 Years | 20,179 (25.0%) | 60,534 (74.9%) |
| 55 to 64 Years | 26,994 (26.9%) | 76,613 (76.4%) |
| 65 to 74 Years | 76,291 (96.4%) | 50,261 (63.5%) |
| 75 Years and over | 56,051 (99.4%) | 37,498 (66.5%) |
| Total | 305,287 (43.2%) | 486,267 (68.8%) |
Disability Status by Sex by Age in Area Code 607
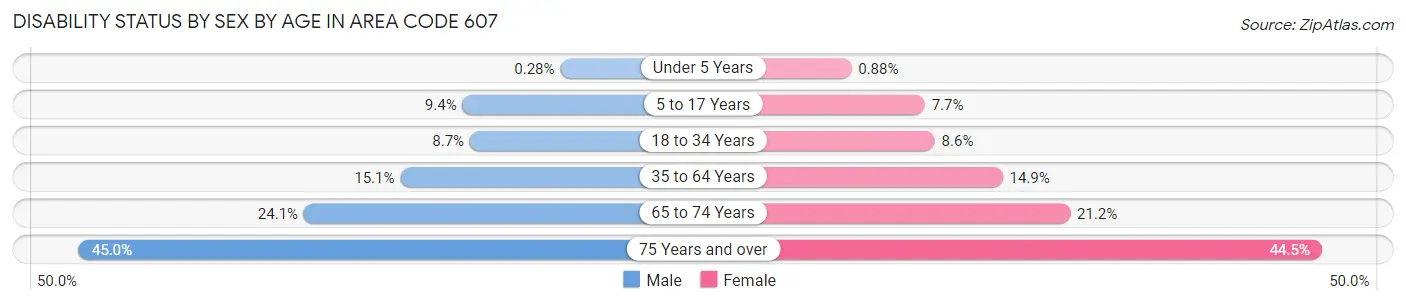
| Age Bracket | Male | Female |
| Under 5 Years | 47 (0.3%) | 143 (0.9%) |
| 5 to 17 Years | 4,743 (9.4%) | 3,693 (7.7%) |
| 18 to 34 Years | 7,992 (8.7%) | 7,740 (8.6%) |
| 35 to 64 Years | 19,365 (15.1%) | 19,325 (14.9%) |
| 65 to 74 Years | 9,291 (24.1%) | 8,598 (21.2%) |
| 75 Years and over | 10,630 (45.0%) | 14,585 (44.5%) |
Disability Class by Sex by Age in Area Code 607
Disability Class: Hearing Difficulty
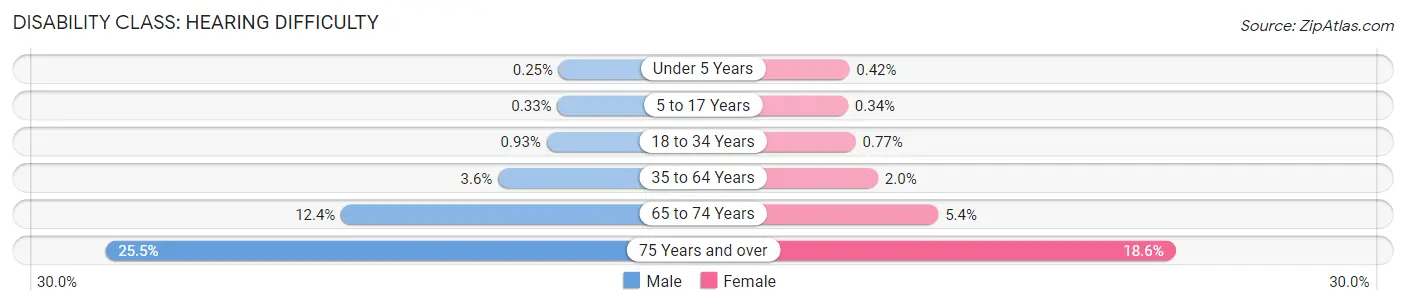
| Age Bracket | Male | Female |
| Under 5 Years | 43 (0.3%) | 69 (0.4%) |
| 5 to 17 Years | 168 (0.3%) | 162 (0.3%) |
| 18 to 34 Years | 861 (0.9%) | 687 (0.8%) |
| 35 to 64 Years | 4,644 (3.6%) | 2,605 (2.0%) |
| 65 to 74 Years | 4,773 (12.4%) | 2,179 (5.4%) |
| 75 Years and over | 6,032 (25.5%) | 6,084 (18.6%) |
Disability Class: Vision Difficulty
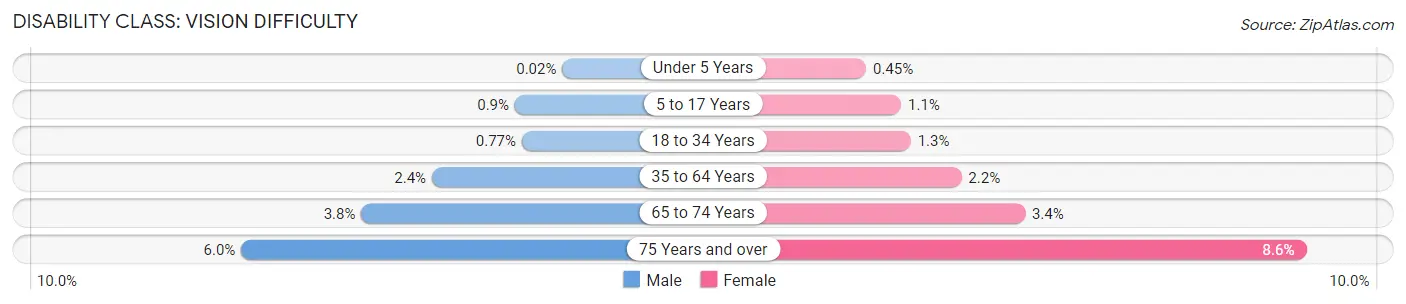
| Age Bracket | Male | Female |
| Under 5 Years | 4 (0.0%) | 74 (0.4%) |
| 5 to 17 Years | 455 (0.9%) | 527 (1.1%) |
| 18 to 34 Years | 714 (0.8%) | 1,151 (1.3%) |
| 35 to 64 Years | 3,122 (2.4%) | 2,869 (2.2%) |
| 65 to 74 Years | 1,448 (3.7%) | 1,378 (3.4%) |
| 75 Years and over | 1,415 (6.0%) | 2,823 (8.6%) |
Disability Class: Cognitive Difficulty
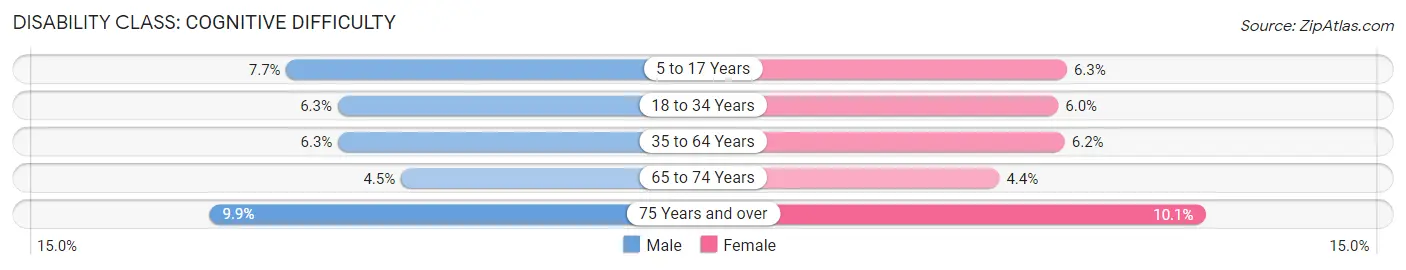
| Age Bracket | Male | Female |
| 5 to 17 Years | 3,908 (7.7%) | 3,005 (6.3%) |
| 18 to 34 Years | 5,790 (6.3%) | 5,410 (6.0%) |
| 35 to 64 Years | 8,020 (6.3%) | 8,044 (6.2%) |
| 65 to 74 Years | 1,742 (4.5%) | 1,781 (4.4%) |
| 75 Years and over | 2,329 (9.9%) | 3,315 (10.1%) |
Disability Class: Ambulatory Difficulty
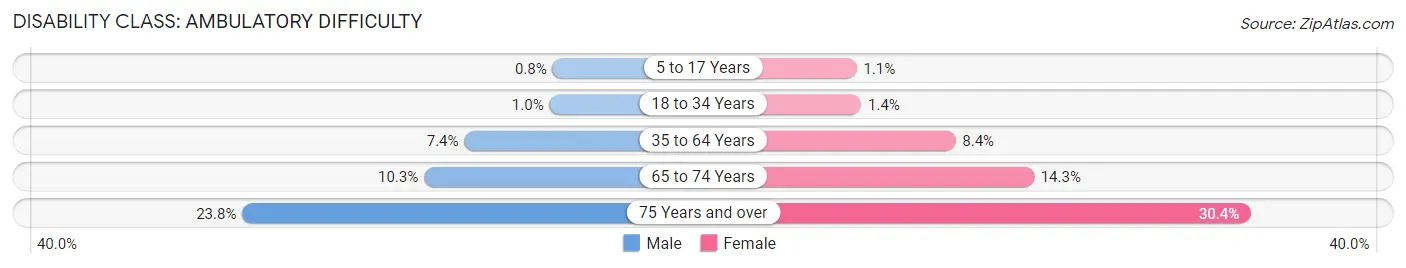
| Age Bracket | Male | Female |
| 5 to 17 Years | 405 (0.8%) | 523 (1.1%) |
| 18 to 34 Years | 951 (1.0%) | 1,288 (1.4%) |
| 35 to 64 Years | 9,403 (7.3%) | 10,912 (8.4%) |
| 65 to 74 Years | 3,989 (10.3%) | 5,783 (14.2%) |
| 75 Years and over | 5,638 (23.8%) | 9,946 (30.4%) |
Disability Class: Self-Care Difficulty
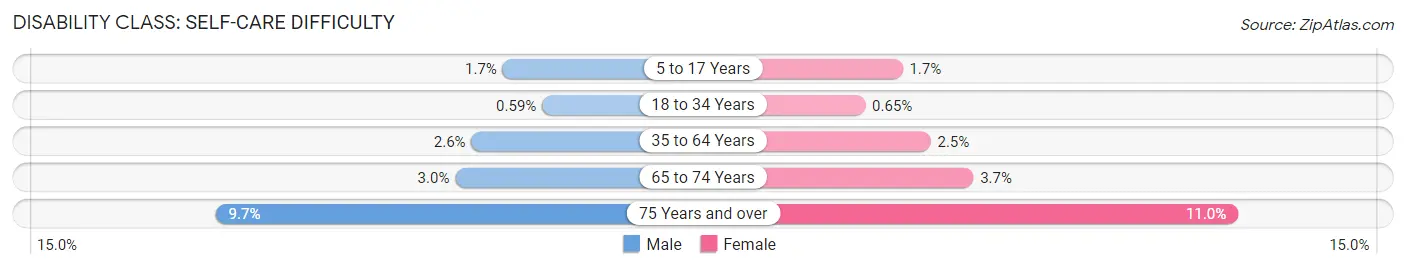
| Age Bracket | Male | Female |
| 5 to 17 Years | 855 (1.7%) | 810 (1.7%) |
| 18 to 34 Years | 548 (0.6%) | 585 (0.6%) |
| 35 to 64 Years | 3,271 (2.6%) | 3,194 (2.5%) |
| 65 to 74 Years | 1,160 (3.0%) | 1,486 (3.7%) |
| 75 Years and over | 2,288 (9.7%) | 3,612 (11.0%) |
Technology Access in Area Code 607
Computing Device Access in Area Code 607
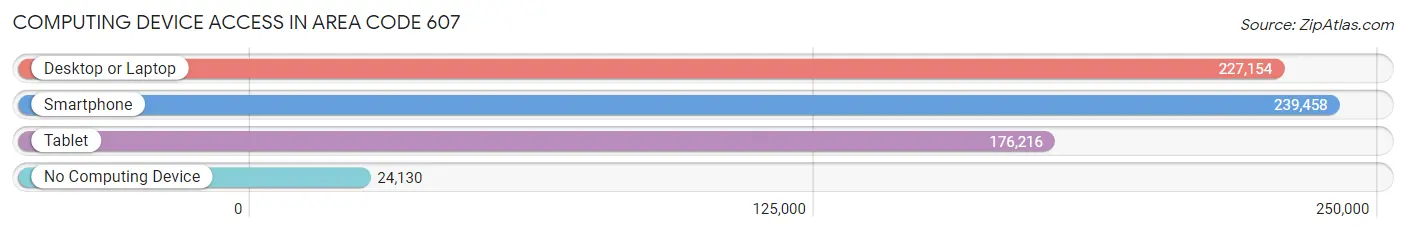
| Device Type | # Households | % Households |
| Desktop or Laptop | 227,154 | 77.4% |
| Smartphone | 239,458 | 81.7% |
| Tablet | 176,216 | 60.1% |
| No Computing Device | 24,130 | 8.2% |
| Total | 293,285 | 100.0% |
Internet Access in Area Code 607
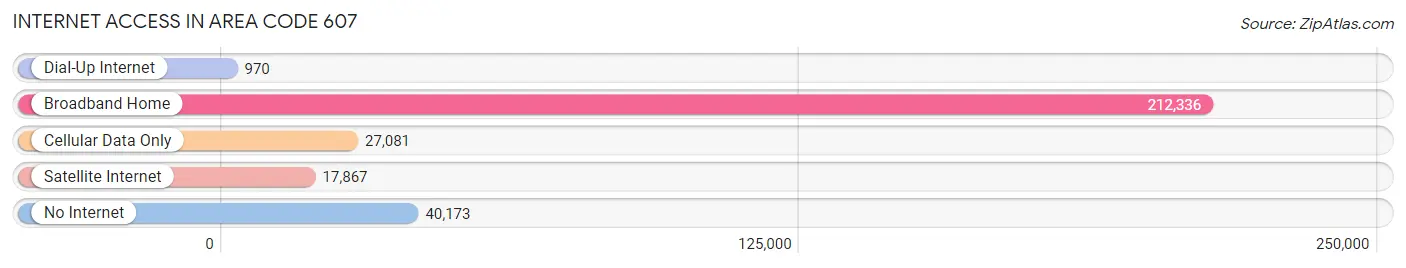
| Internet Type | # Households | % Households |
| Dial-Up Internet | 970 | 0.3% |
| Broadband Home | 212,336 | 72.4% |
| Cellular Data Only | 27,081 | 9.2% |
| Satellite Internet | 17,867 | 6.1% |
| No Internet | 40,173 | 13.7% |
| Total | 293,285 | 100.0% |
Area Code 607 Summary
Geography
Area code 607 is located in the state of New York. It covers the Southern Tier of New York, including the cities of Binghamton, Elmira, and Ithaca. It also covers the counties of Broome, Chemung, Chenango, Cortland, Schuyler, Steuben, Tioga, and Tompkins.
Social
Area code 607 is home to a diverse population of people from all walks of life. The area is known for its vibrant arts and culture scene, with many galleries, museums, and theaters. It is also home to a number of universities and colleges, including Cornell University, Ithaca College, and SUNY Binghamton.
Economics
Area code 607 is an economically diverse region. It is home to a number of large employers, including Corning Incorporated, Lockheed Martin, and Wegmans. It is also home to a number of small businesses, including restaurants, retail stores, and service providers.
Demographics
Area code 607 is home to a population of over 1.2 million people. The population is largely white, with a significant Hispanic and African American population. The median household income is around $50,000, and the median age is around 38 years old.
Common Questions
What is Per Capita Income in Area Code 607?
Per Capita income in Area Code 607 is $33,801.
What is the Median Family Income in Area Code 607?
Median Family Income in Area Code 607 is $81,509.
What is the Median Household income in Area Code 607?
Median Household Income in Area Code 607 is $65,440.
What is Income or Wage Gap in Area Code 607?
Income or Wage Gap in Area Code 607 is 27.8%.
Women in Area Code 607 earn 72.2 cents for every dollar earned by a man.
What is Family Income Deficit in Area Code 607?
Family Income Deficit in Area Code 607 is $10,543.
Families that are below poverty line in Area Code 607 earn $10,543 less on average than the poverty threshold level.
What is Inequality or Gini Index in Area Code 607?
Inequality or Gini Index in Area Code 607 is 63.94.
What is the Total Population of Area Code 607?
Total Population of Area Code 607 is 716,219.
What is the Total Male Population of Area Code 607?
Total Male Population of Area Code 607 is 356,005.
What is the Total Female Population of Area Code 607?
Total Female Population of Area Code 607 is 360,214.
What is the Ratio of Males per 100 Females in Area Code 607?
There are 98.83 Males per 100 Females in Area Code 607.
What is the Ratio of Females per 100 Males in Area Code 607?
There are 101.18 Females per 100 Males in Area Code 607.
What is the Median Population Age in Area Code 607?
Median Population Age in Area Code 607 is 44.2 Years.
What is the Average Family Size in Area Code 607
Average Family Size in Area Code 607 is 3.0 People.
What is the Average Household Size in Area Code 607
Average Household Size in Area Code 607 is 2.4 People.
How Large is the Labor Force in Area Code 607?
There are 350,474 People in the Labor Forcein in Area Code 607.
What is the Percentage of People in the Labor Force in Area Code 607?
58.4% of People are in the Labor Force in Area Code 607.
What is the Unemployment Rate in Area Code 607?
Unemployment Rate in Area Code 607 is 6.3%.