Area Code 315 Map & Demographics
Area Code 315 Map
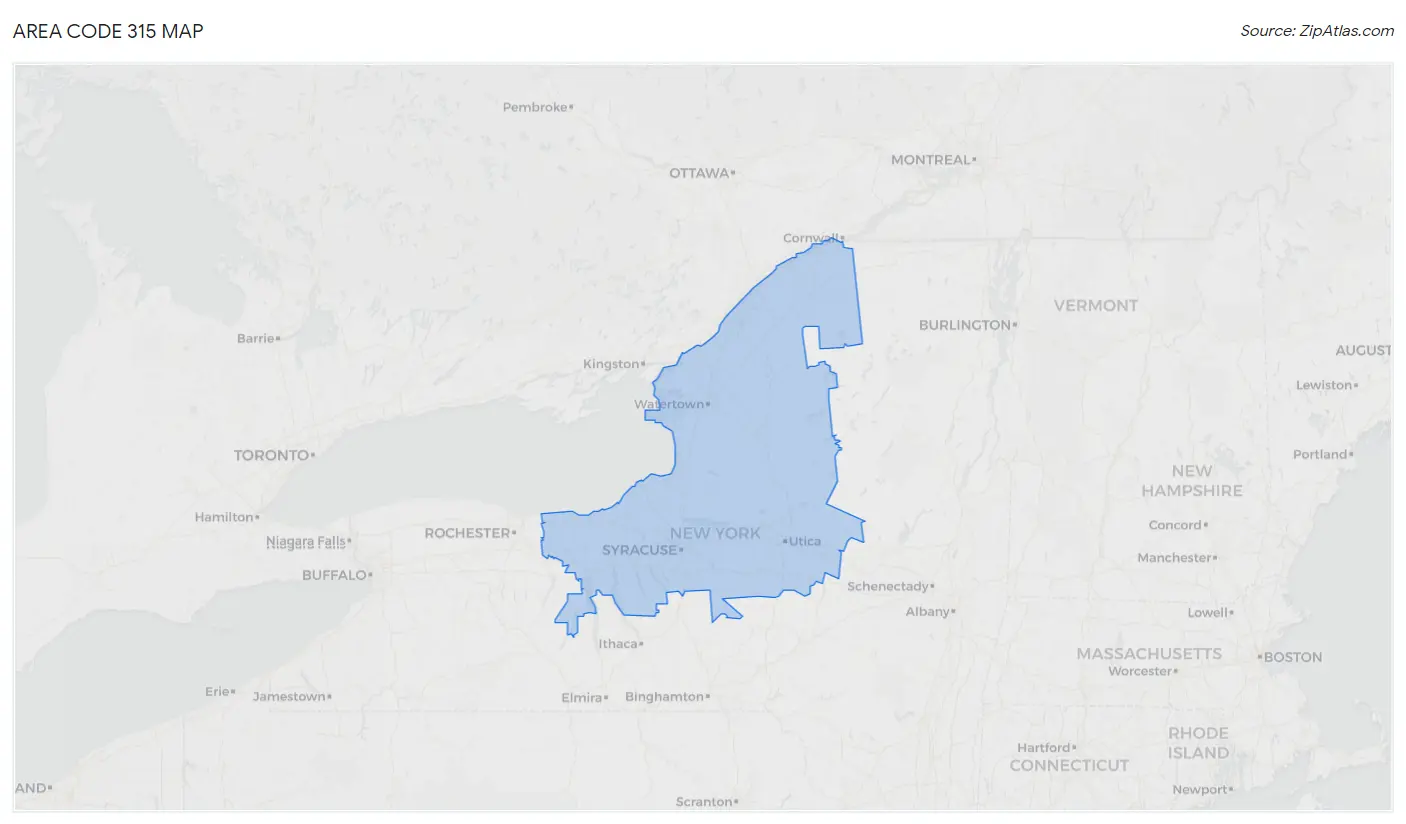
Area Code 315 Overview
$35,265
PER CAPITA INCOME
$84,209
AVG FAMILY INCOME
$70,631
AVG HOUSEHOLD INCOME
28.7%
WAGE / INCOME GAP [ % ]
71.3¢/ $1
WAGE / INCOME GAP [ $ ]
$11,119
FAMILY INCOME DEFICIT
114.34
INEQUALITY / GINI INDEX
1,446,659
TOTAL POPULATION
723,319
MALE POPULATION
723,340
FEMALE POPULATION
100.00
MALES / 100 FEMALES
100.00
FEMALES / 100 MALES
42.7
MEDIAN AGE
3.0
AVG FAMILY SIZE
2.5
AVG HOUSEHOLD SIZE
700,493
LABOR FORCE [ PEOPLE ]
59.5%
PERCENT IN LABOR FORCE
6.4%
UNEMPLOYMENT RATE
Income in Area Code 315
Income Overview in Area Code 315
Per Capita Income in Area Code 315 is $35,265, while median incomes of families and households are $84,209 and $70,631 respectively.
| Characteristic | Number | Measure |
| Per Capita Income | 1,446,659 | $35,265 |
| Median Family Income | 357,154 | $84,209 |
| Mean Family Income | 357,154 | $27,744,967 |
| Median Household Income | 579,467 | $70,631 |
| Mean Household Income | 579,467 | $24,529,085 |
| Income Deficit | 357,154 | $11,119 |
| Wage / Income Gap (%) | 1,446,659 | 28.67% |
| Wage / Income Gap ($) | 1,446,659 | 71.33¢ per $1 |
| Gini / Inequality Index | 1,446,659 | 114.34 |
Earnings by Sex in Area Code 315
Average Earnings in Area Code 315 are $40,054, $47,475 for men and $33,970 for women, a difference of 28.4%.
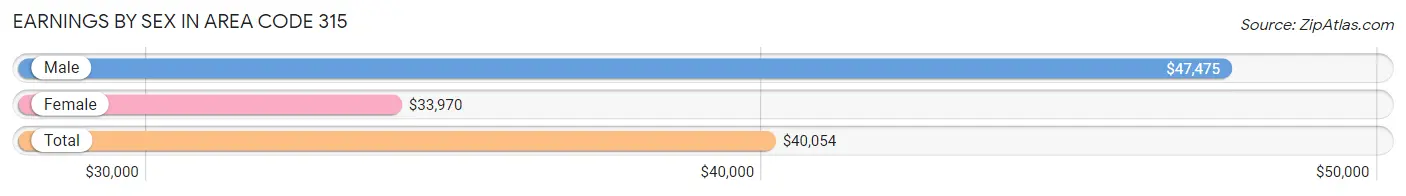
| Sex | Number | Average Earnings |
| Male | 394,641 (52.5%) | $47,475 |
| Female | 357,341 (47.5%) | $33,970 |
| Total | 751,982 (100.0%) | $40,054 |
Earnings by Sex by Income Bracket in Area Code 315
The most common earnings brackets in Area Code 315 are $100,000+ for men (53,353 | 13.5%) and $75,000 to $99,999 for women (30,666 | 8.6%).
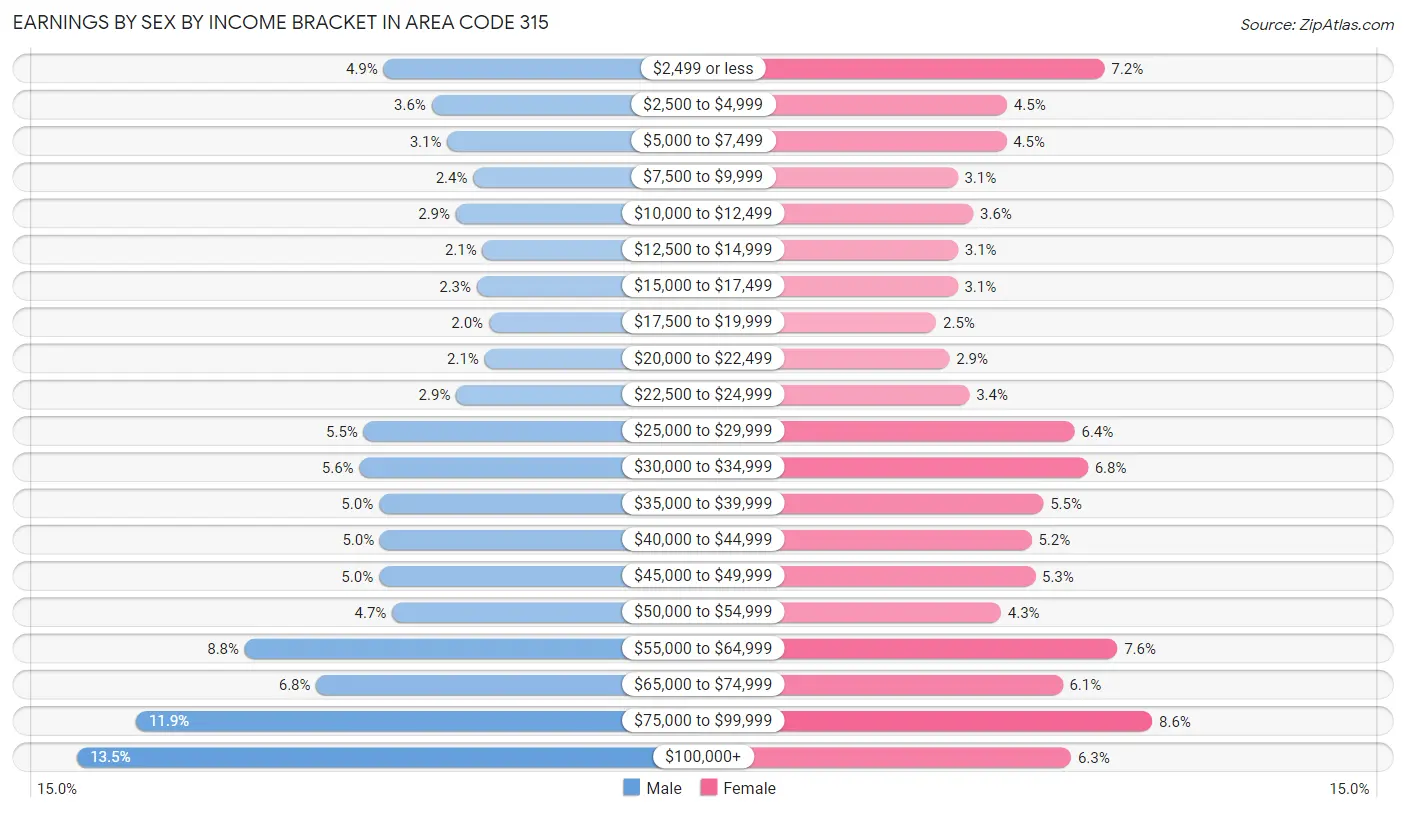
| Income | Male | Female |
| $2,499 or less | 19,393 (4.9%) | 25,886 (7.2%) |
| $2,500 to $4,999 | 14,032 (3.6%) | 16,082 (4.5%) |
| $5,000 to $7,499 | 12,306 (3.1%) | 16,023 (4.5%) |
| $7,500 to $9,999 | 9,446 (2.4%) | 11,126 (3.1%) |
| $10,000 to $12,499 | 11,368 (2.9%) | 12,687 (3.5%) |
| $12,500 to $14,999 | 8,390 (2.1%) | 11,149 (3.1%) |
| $15,000 to $17,499 | 9,033 (2.3%) | 11,123 (3.1%) |
| $17,500 to $19,999 | 7,689 (1.9%) | 8,967 (2.5%) |
| $20,000 to $22,499 | 8,151 (2.1%) | 10,293 (2.9%) |
| $22,500 to $24,999 | 11,339 (2.9%) | 12,296 (3.4%) |
| $25,000 to $29,999 | 21,597 (5.5%) | 22,868 (6.4%) |
| $30,000 to $34,999 | 22,061 (5.6%) | 24,209 (6.8%) |
| $35,000 to $39,999 | 19,909 (5.0%) | 19,711 (5.5%) |
| $40,000 to $44,999 | 19,766 (5.0%) | 18,537 (5.2%) |
| $45,000 to $49,999 | 19,906 (5.0%) | 18,896 (5.3%) |
| $50,000 to $54,999 | 18,433 (4.7%) | 15,487 (4.3%) |
| $55,000 to $64,999 | 34,775 (8.8%) | 27,149 (7.6%) |
| $65,000 to $74,999 | 26,832 (6.8%) | 21,670 (6.1%) |
| $75,000 to $99,999 | 46,862 (11.9%) | 30,666 (8.6%) |
| $100,000+ | 53,353 (13.5%) | 22,516 (6.3%) |
| Total | 394,641 (100.0%) | 357,341 (100.0%) |
Earnings by Sex by Educational Attainment in Area Code 315
Average earnings in Area Code 315 are $14,332,656 for men and $10,034,437 for women, a difference of 30.0%. Men with an educational attainment of graduate degree enjoy the highest average annual earnings of $13,416,505, while those with less than high school education earn the least with $5,365,654. Women with an educational attainment of graduate degree earn the most with the average annual earnings of $12,812,732, while those with less than high school education have the smallest earnings of $1,908,327.
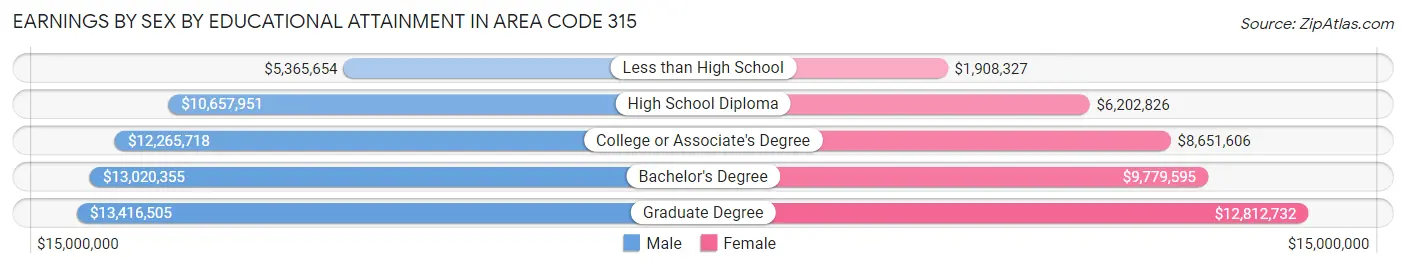
| Educational Attainment | Male Income | Female Income |
| Less than High School | $5,365,654 | $1,908,327 |
| High School Diploma | $10,657,951 | $6,202,826 |
| College or Associate's Degree | $12,265,718 | $8,651,606 |
| Bachelor's Degree | $13,020,355 | $9,779,595 |
| Graduate Degree | $13,416,505 | $12,812,732 |
| Total | $14,332,656 | $10,034,437 |
Family Income in Area Code 315
Family Income Brackets in Area Code 315
According to the Area Code 315 family income data, there are 23,509,662 families falling into the $100,000 to $149,999 income range, which is the most common income bracket and makes up 6,582.5% of all families. Conversely, the $10,000 to $14,999 income bracket is the least frequent group with only 1,568,978 families (439.3%) belonging to this category.
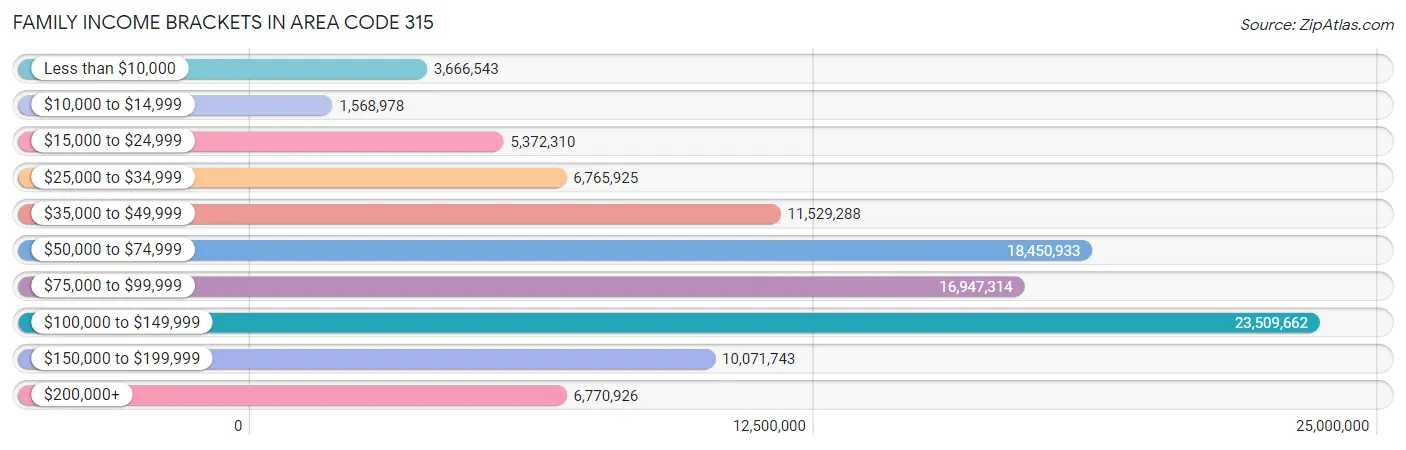
| Income Bracket | # Families | % Families |
| Less than $10,000 | 3,666,543 | 1,026.6% |
| $10,000 to $14,999 | 1,568,978 | 439.3% |
| $15,000 to $24,999 | 5,372,310 | 1,504.2% |
| $25,000 to $34,999 | 6,765,925 | 1,894.4% |
| $35,000 to $49,999 | 11,529,288 | 3,228.1% |
| $50,000 to $74,999 | 18,450,933 | 5,166.1% |
| $75,000 to $99,999 | 16,947,314 | 4,745.1% |
| $100,000 to $149,999 | 23,509,662 | 6,582.5% |
| $150,000 to $199,999 | 10,071,743 | 2,820.0% |
| $200,000+ | 6,770,926 | 1,895.8% |
Family Income by Famaliy Size in Area Code 315
5-person families (24,673 | 6.9%) account for the highest median family income in Area Code 315 with $112,310 per family, while 2-person families (182,139 | 51.0%) have the highest median income of $38,495 per family member.
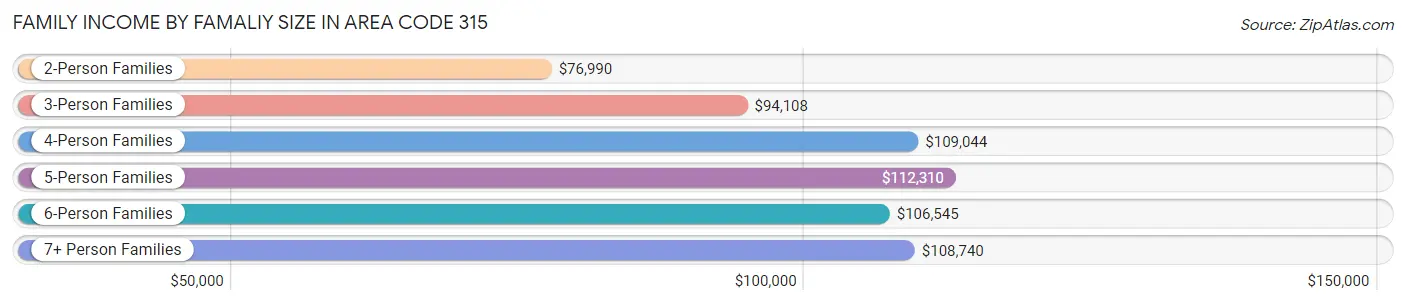
| Income Bracket | # Families | Median Income |
| 2-Person Families | 182,139 (51.0%) | $76,990 |
| 3-Person Families | 77,413 (21.7%) | $94,108 |
| 4-Person Families | 58,641 (16.4%) | $109,044 |
| 5-Person Families | 24,673 (6.9%) | $112,310 |
| 6-Person Families | 9,004 (2.5%) | $106,545 |
| 7+ Person Families | 5,284 (1.5%) | $108,740 |
| Total | 357,154 (100.0%) | $84,209 |
Family Income by Number of Earners in Area Code 315
The median family income in Area Code 315 is $84,209, with families comprising 3+ earners (36,485) having the highest median family income of $145,381, while families with no earners (62,674) have the lowest median family income of $54,362, accounting for 10.2% and 17.5% of families, respectively.
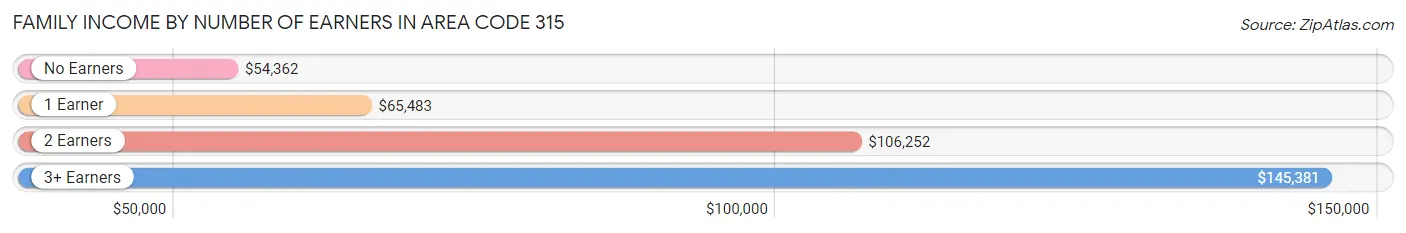
| Number of Earners | # Families | Median Income |
| No Earners | 62,674 (17.5%) | $54,362 |
| 1 Earner | 112,595 (31.5%) | $65,483 |
| 2 Earners | 145,400 (40.7%) | $106,252 |
| 3+ Earners | 36,485 (10.2%) | $145,381 |
| Total | 357,154 (100.0%) | $84,209 |
Household Income in Area Code 315
Household Income Brackets in Area Code 315
With 32,165,634 households falling in the category, the $100,000 to $149,999 income range is the most frequent in Area Code 315, accounting for 5,550.9% of all households. In contrast, only 5,694,422 households (982.7%) fall into the $10,000 to $14,999 income bracket, making it the least populous group.
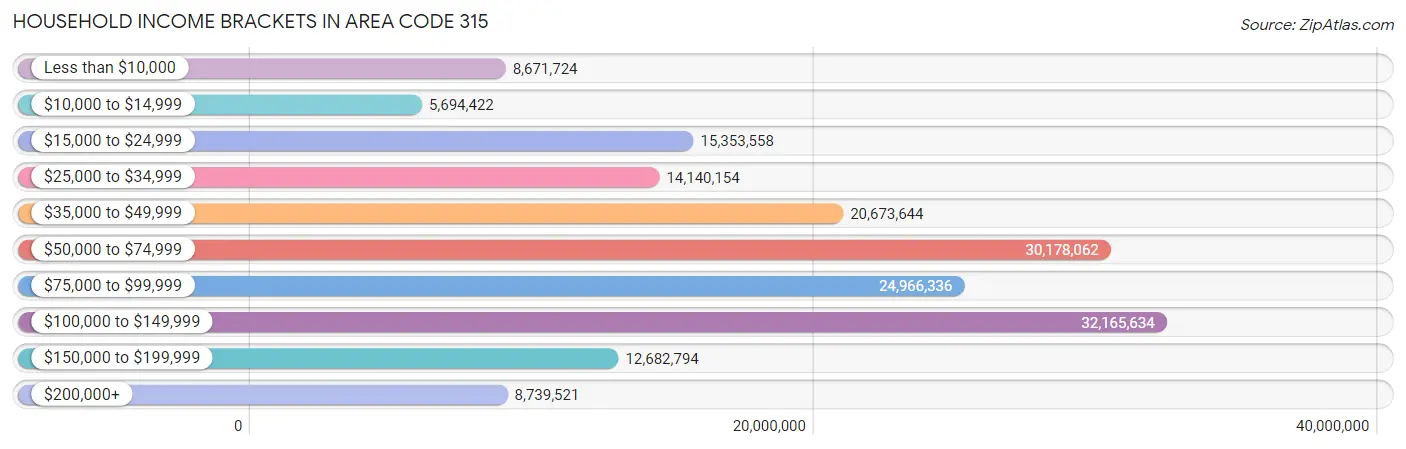
| Income Bracket | # Households | % Households |
| Less than $10,000 | 8,671,724 | 1,496.5% |
| $10,000 to $14,999 | 5,694,422 | 982.7% |
| $15,000 to $24,999 | 15,353,558 | 2,649.6% |
| $25,000 to $34,999 | 14,140,154 | 2,440.2% |
| $35,000 to $49,999 | 20,673,644 | 3,567.7% |
| $50,000 to $74,999 | 30,178,062 | 5,207.9% |
| $75,000 to $99,999 | 24,966,336 | 4,308.5% |
| $100,000 to $149,999 | 32,165,634 | 5,550.9% |
| $150,000 to $199,999 | 12,682,794 | 2,188.7% |
| $200,000+ | 8,739,521 | 1,508.2% |
Household Income by Householder Age in Area Code 315
The median household income in Area Code 315 is $70,631, with the highest median household income of $84,454 found in the 45 to 64 years age bracket for the primary householder. A total of 216,953 households (37.4%) fall into this category. Meanwhile, the 15 to 24 years age bracket for the primary householder has the lowest median household income of $48,806, with 22,359 households (3.9%) in this group.
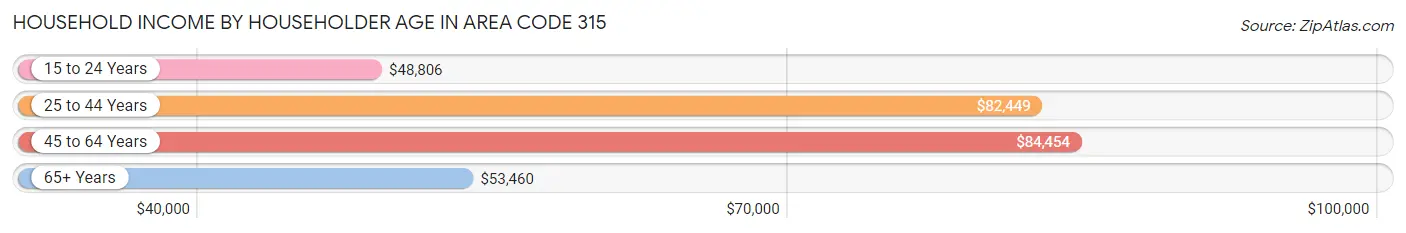
| Income Bracket | # Households | Median Income |
| 15 to 24 Years | 22,359 (3.9%) | $48,806 |
| 25 to 44 Years | 169,517 (29.2%) | $82,449 |
| 45 to 64 Years | 216,953 (37.4%) | $84,454 |
| 65+ Years | 170,638 (29.4%) | $53,460 |
| Total | 579,467 (100.0%) | $70,631 |
Poverty in Area Code 315
Income Below Poverty by Sex and Age in Area Code 315
With 12.8% poverty level for males and 14.9% for females among the residents of Area Code 315, under 5 year old males and 5 year old females are the most vulnerable to poverty, with 8,933 males (22.4%) and 1,642 females (22.4%) in their respective age groups living below the poverty level.
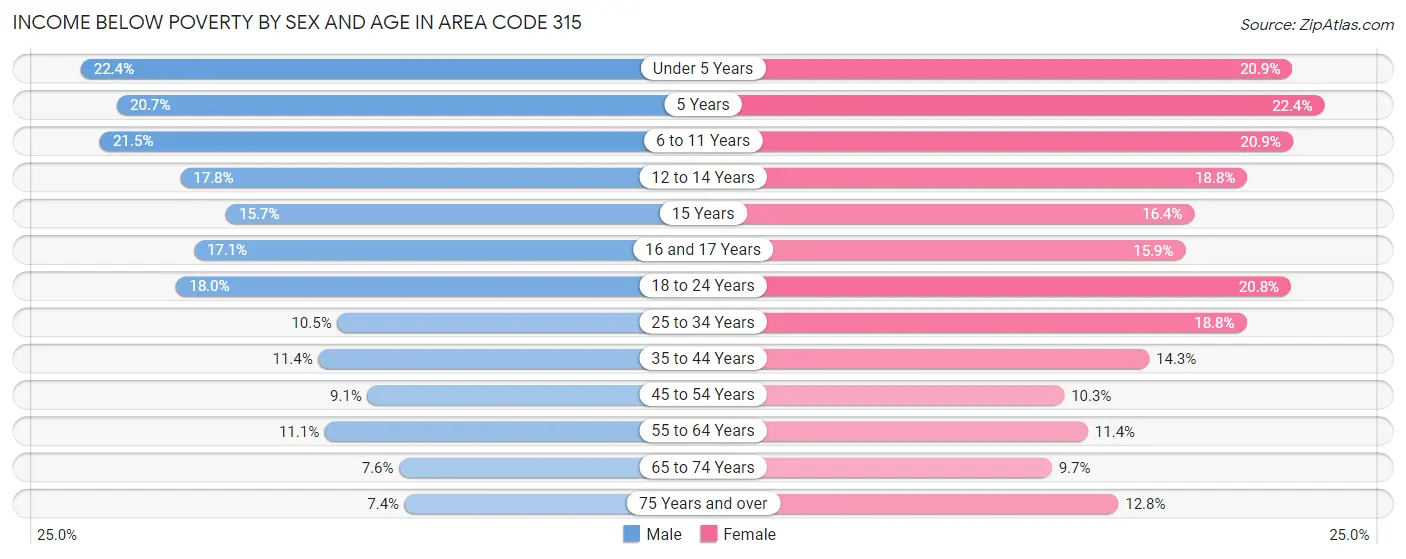
| Age Bracket | Male | Female |
| Under 5 Years | 8,933 (22.4%) | 8,014 (20.9%) |
| 5 Years | 1,754 (20.7%) | 1,642 (22.4%) |
| 6 to 11 Years | 10,906 (21.5%) | 10,147 (20.9%) |
| 12 to 14 Years | 4,678 (17.8%) | 4,659 (18.8%) |
| 15 Years | 1,472 (15.7%) | 1,493 (16.4%) |
| 16 and 17 Years | 2,961 (17.1%) | 2,616 (15.9%) |
| 18 to 24 Years | 10,502 (18.0%) | 11,228 (20.8%) |
| 25 to 34 Years | 9,380 (10.5%) | 16,347 (18.8%) |
| 35 to 44 Years | 9,249 (11.4%) | 11,520 (14.3%) |
| 45 to 54 Years | 7,698 (9.1%) | 8,869 (10.3%) |
| 55 to 64 Years | 11,183 (11.1%) | 11,762 (11.4%) |
| 65 to 74 Years | 5,607 (7.6%) | 7,631 (9.7%) |
| 75 Years and over | 3,210 (7.3%) | 7,807 (12.8%) |
| Total | 87,533 (12.8%) | 103,735 (14.9%) |
Income Above Poverty by Sex and Age in Area Code 315
According to the poverty statistics in Area Code 315, males aged 75 years and over and females aged 65 to 74 years are the age groups that are most secure financially, with 92.6% of males and 90.3% of females in these age groups living above the poverty line.
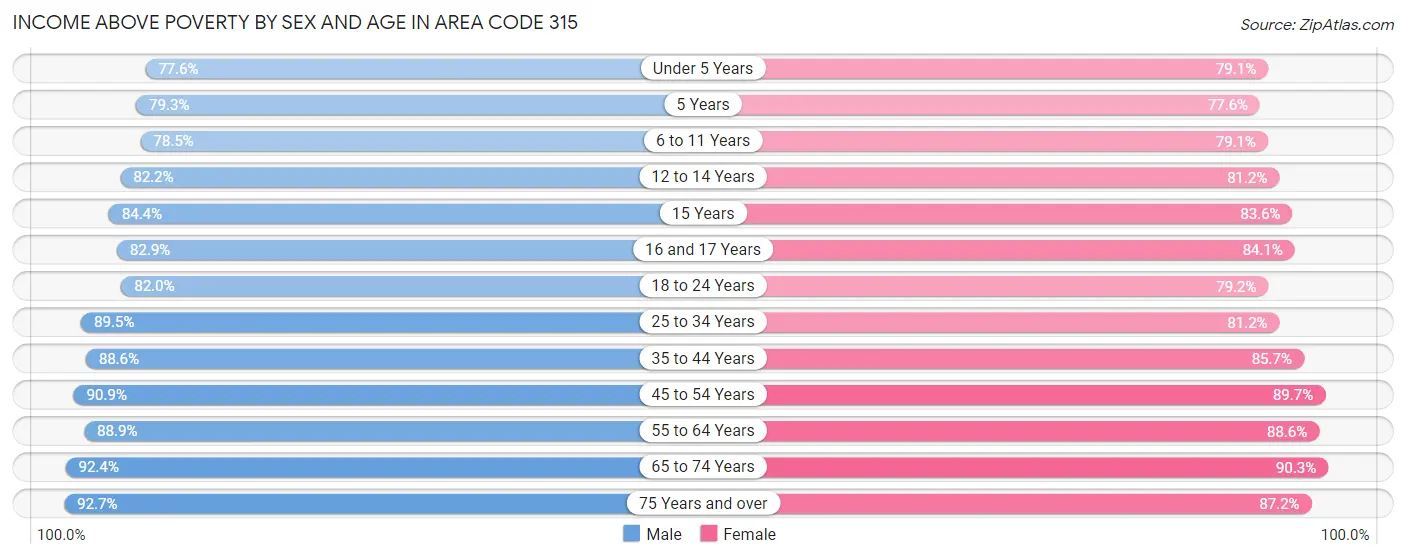
| Age Bracket | Male | Female |
| Under 5 Years | 30,970 (77.6%) | 30,335 (79.1%) |
| 5 Years | 6,716 (79.3%) | 5,692 (77.6%) |
| 6 to 11 Years | 39,815 (78.5%) | 38,351 (79.1%) |
| 12 to 14 Years | 21,643 (82.2%) | 20,113 (81.2%) |
| 15 Years | 7,936 (84.4%) | 7,632 (83.6%) |
| 16 and 17 Years | 14,311 (82.9%) | 13,791 (84.1%) |
| 18 to 24 Years | 47,977 (82.0%) | 42,654 (79.2%) |
| 25 to 34 Years | 80,161 (89.5%) | 70,750 (81.2%) |
| 35 to 44 Years | 72,149 (88.6%) | 69,262 (85.7%) |
| 45 to 54 Years | 77,043 (90.9%) | 77,105 (89.7%) |
| 55 to 64 Years | 89,885 (88.9%) | 91,253 (88.6%) |
| 65 to 74 Years | 68,110 (92.4%) | 70,702 (90.3%) |
| 75 Years and over | 40,463 (92.6%) | 53,041 (87.2%) |
| Total | 597,179 (87.2%) | 590,681 (85.1%) |
Income Below Poverty Among Married-Couple Families in Area Code 315
The poverty statistics for married-couple families in Area Code 315 show that 4.2% or 11,108 of the total 263,245 families live below the poverty line. Families with 5 or more children have the highest poverty rate of 23.5%, comprising of 643 families. On the other hand, families with no children have the lowest poverty rate of 3.1%, which includes 5,061 families.
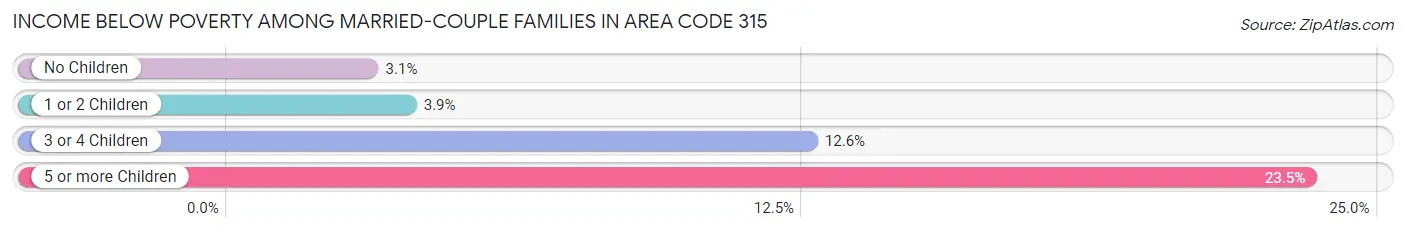
| Children | Above Poverty | Below Poverty |
| No Children | 160,302 (96.9%) | 5,061 (3.1%) |
| 1 or 2 Children | 72,718 (96.1%) | 2,946 (3.9%) |
| 3 or 4 Children | 17,022 (87.4%) | 2,458 (12.6%) |
| 5 or more Children | 2,095 (76.5%) | 643 (23.5%) |
| Total | 252,137 (95.8%) | 11,108 (4.2%) |
Income Below Poverty Among Single-Parent Households in Area Code 315
According to the poverty data in Area Code 315, 16.1% or 4,585 single-father households and 27.8% or 18,187 single-mother households are living below the poverty line. Among single-father households, those with 5 or more children have the highest poverty rate, with 117 households (41.5%) experiencing poverty. Likewise, among single-mother households, those with 5 or more children have the highest poverty rate, with 794 households (69.0%) falling below the poverty line.
| Children | Single Father | Single Mother |
| No Children | 749 (6.4%) | 2,503 (10.8%) |
| 1 or 2 Children | 2,803 (19.8%) | 10,755 (31.4%) |
| 3 or 4 Children | 916 (38.2%) | 4,135 (61.4%) |
| 5 or more Children | 117 (41.5%) | 794 (69.0%) |
| Total | 4,585 (16.1%) | 18,187 (27.8%) |
Income Below Poverty Among Married-Couple vs Single-Parent Households in Area Code 315
The poverty data for Area Code 315 shows that 11,108 of the married-couple family households (4.2%) and 22,772 of the single-parent households (24.2%) are living below the poverty level. Within the married-couple family households, those with 5 or more children have the highest poverty rate, with 643 households (23.5%) falling below the poverty line. Among the single-parent households, those with 5 or more children have the highest poverty rate, with 911 household (63.6%) living below poverty.
| Children | Married-Couple Families | Single-Parent Households |
| No Children | 5,061 (3.1%) | 3,252 (9.3%) |
| 1 or 2 Children | 2,946 (3.9%) | 13,558 (28.0%) |
| 3 or 4 Children | 2,458 (12.6%) | 5,051 (55.3%) |
| 5 or more Children | 643 (23.5%) | 911 (63.6%) |
| Total | 11,108 (4.2%) | 22,772 (24.2%) |
Race in Area Code 315
The most populous races in Area Code 315 are White / Caucasian (1,225,529 | 84.7%), Black / African American (86,193 | 6.0%), and Two or more Races (72,621 | 5.0%).
| Race | # Population | % Population |
| Asian | 36,009 | 2.5% |
| Black / African American | 86,193 | 6.0% |
| Hawaiian / Pacific | 802 | 0.1% |
| Hispanic or Latino | 70,817 | 4.9% |
| Native / Alaskan | 4,547 | 0.3% |
| White / Caucasian | 1,225,529 | 84.7% |
| Two or more Races | 72,621 | 5.0% |
| Some other Race | 20,958 | 1.5% |
| Total | 1,446,659 | 100.0% |
Ancestry in Area Code 315
The most populous ancestries reported in Area Code 315 are Irish (243,385 | 16.8%), German (215,971 | 14.9%), Italian (197,058 | 13.6%), English (171,162 | 11.8%), and Polish (82,997 | 5.7%), together accounting for 62.9% of all Area Code 315 residents.
| Ancestry | # Population | % Population |
| Afghan | 360 | 0.0% |
| African | 5,446 | 0.4% |
| Alaska Native | 36 | 0.0% |
| Albanian | 461 | 0.0% |
| Aleut | 10 | 0.0% |
| Alsatian | 60 | 0.0% |
| American | 80,842 | 5.6% |
| Apache | 70 | 0.0% |
| Arab | 11,324 | 0.8% |
| Argentinean | 315 | 0.0% |
| Armenian | 1,142 | 0.1% |
| Assyrian / Chaldean / Syriac | 50 | 0.0% |
| Australian | 125 | 0.0% |
| Austrian | 3,143 | 0.2% |
| Bahamian | 22 | 0.0% |
| Bangladeshi | 215 | 0.0% |
| Barbadian | 145 | 0.0% |
| Basque | 12 | 0.0% |
| Belgian | 778 | 0.1% |
| Belizean | 295 | 0.0% |
| Bhutanese | 1,618 | 0.1% |
| Blackfeet | 687 | 0.1% |
| Bolivian | 226 | 0.0% |
| Brazilian | 371 | 0.0% |
| British | 6,763 | 0.5% |
| British West Indian | 259 | 0.0% |
| Bulgarian | 159 | 0.0% |
| Burmese | 3,001 | 0.2% |
| Cajun | 31 | 0.0% |
| Cambodian | 12 | 0.0% |
| Canadian | 5,261 | 0.4% |
| Cape Verdean | 47 | 0.0% |
| Celtic | 402 | 0.0% |
| Central American | 4,194 | 0.3% |
| Central American Indian | 723 | 0.1% |
| Cherokee | 1,778 | 0.1% |
| Chickasaw | 6 | 0.0% |
| Chilean | 1,058 | 0.1% |
| Chinese | 73 | 0.0% |
| Chippewa | 90 | 0.0% |
| Choctaw | 50 | 0.0% |
| Colombian | 1,911 | 0.1% |
| Comanche | 42 | 0.0% |
| Costa Rican | 257 | 0.0% |
| Cree | 41 | 0.0% |
| Croatian | 760 | 0.1% |
| Crow | 43 | 0.0% |
| Cuban | 2,964 | 0.2% |
| Cypriot | 17 | 0.0% |
| Czech | 2,851 | 0.2% |
| Czechoslovakian | 881 | 0.1% |
| Danish | 3,207 | 0.2% |
| Delaware | 5 | 0.0% |
| Dominican | 6,674 | 0.5% |
| Dutch | 33,214 | 2.3% |
| Dutch West Indian | 27 | 0.0% |
| Eastern European | 3,780 | 0.3% |
| Ecuadorian | 1,870 | 0.1% |
| Egyptian | 703 | 0.1% |
| English | 171,162 | 11.8% |
| Estonian | 106 | 0.0% |
| Ethiopian | 591 | 0.0% |
| European | 18,053 | 1.3% |
| Fijian | 36 | 0.0% |
| Filipino | 251 | 0.0% |
| Finnish | 886 | 0.1% |
| French | 61,071 | 4.2% |
| French American Indian | 457 | 0.0% |
| French Canadian | 27,480 | 1.9% |
| German | 215,971 | 14.9% |
| German Russian | 9 | 0.0% |
| Ghanaian | 484 | 0.0% |
| Greek | 4,580 | 0.3% |
| Guamanian / Chamorro | 247 | 0.0% |
| Guatemalan | 1,332 | 0.1% |
| Guyanese | 567 | 0.0% |
| Haitian | 1,453 | 0.1% |
| Honduran | 532 | 0.0% |
| Hopi | 6 | 0.0% |
| Hungarian | 5,439 | 0.4% |
| Icelander | 42 | 0.0% |
| Indian (Asian) | 10,020 | 0.7% |
| Indonesian | 5,634 | 0.4% |
| Inupiat | 36 | 0.0% |
| Iranian | 350 | 0.0% |
| Iraqi | 605 | 0.0% |
| Irish | 243,385 | 16.8% |
| Iroquois | 4,717 | 0.3% |
| Israeli | 302 | 0.0% |
| Italian | 197,058 | 13.6% |
| Jamaican | 3,631 | 0.3% |
| Japanese | 1,684 | 0.1% |
| Jordanian | 195 | 0.0% |
| Kenyan | 741 | 0.1% |
| Kiowa | 24 | 0.0% |
| Korean | 4,159 | 0.3% |
| Laotian | 207 | 0.0% |
| Latvian | 312 | 0.0% |
| Lebanese | 4,676 | 0.3% |
| Liberian | 167 | 0.0% |
| Lithuanian | 2,372 | 0.2% |
| Lumbee | 20 | 0.0% |
| Luxembourger | 48 | 0.0% |
| Macedonian | 781 | 0.1% |
| Malaysian | 658 | 0.1% |
| Maltese | 45 | 0.0% |
| Mexican | 11,465 | 0.8% |
| Mexican American Indian | 118 | 0.0% |
| Mongolian | 55 | 0.0% |
| Moroccan | 100 | 0.0% |
| Native Hawaiian | 534 | 0.0% |
| Navajo | 241 | 0.0% |
| Nicaraguan | 252 | 0.0% |
| Nigerian | 1,098 | 0.1% |
| Northern European | 2,030 | 0.1% |
| Norwegian | 6,169 | 0.4% |
| Okinawan | 78 | 0.0% |
| Osage | 33 | 0.0% |
| Ottawa | 24 | 0.0% |
| Paiute | 2 | 0.0% |
| Pakistani | 1,779 | 0.1% |
| Palestinian | 963 | 0.1% |
| Panamanian | 767 | 0.1% |
| Paraguayan | 138 | 0.0% |
| Pennsylvania German | 3,642 | 0.3% |
| Peruvian | 611 | 0.0% |
| Pima | 4 | 0.0% |
| Polish | 82,997 | 5.7% |
| Portuguese | 1,960 | 0.1% |
| Potawatomi | 66 | 0.0% |
| Pueblo | 6 | 0.0% |
| Puerto Rican | 31,883 | 2.2% |
| Romanian | 1,199 | 0.1% |
| Russian | 8,649 | 0.6% |
| Salvadoran | 941 | 0.1% |
| Samoan | 199 | 0.0% |
| Scandinavian | 2,723 | 0.2% |
| Scotch-Irish | 8,145 | 0.6% |
| Scottish | 25,713 | 1.8% |
| Seminole | 32 | 0.0% |
| Senegalese | 4 | 0.0% |
| Serbian | 433 | 0.0% |
| Sierra Leonean | 42 | 0.0% |
| Sioux | 89 | 0.0% |
| Slavic | 705 | 0.1% |
| Slovak | 2,155 | 0.2% |
| Slovene | 588 | 0.0% |
| Somali | 1,608 | 0.1% |
| South African | 139 | 0.0% |
| South American | 6,643 | 0.5% |
| South American Indian | 70 | 0.0% |
| Spaniard | 1,292 | 0.1% |
| Spanish | 1,692 | 0.1% |
| Spanish American | 6 | 0.0% |
| Spanish American Indian | 4 | 0.0% |
| Sri Lankan | 3,683 | 0.3% |
| Subsaharan African | 11,457 | 0.8% |
| Sudanese | 301 | 0.0% |
| Swedish | 8,112 | 0.6% |
| Swiss | 7,126 | 0.5% |
| Syrian | 1,488 | 0.1% |
| Thai | 6,200 | 0.4% |
| Tongan | 58 | 0.0% |
| Trinidadian and Tobagonian | 371 | 0.0% |
| Turkish | 1,101 | 0.1% |
| U.S. Virgin Islander | 9 | 0.0% |
| Ukrainian | 13,948 | 1.0% |
| Uruguayan | 71 | 0.0% |
| Ute | 9 | 0.0% |
| Venezuelan | 363 | 0.0% |
| Vietnamese | 196 | 0.0% |
| Welsh | 15,565 | 1.1% |
| West Indian | 661 | 0.1% |
| Yaqui | 16 | 0.0% |
| Yugoslavian | 6,067 | 0.4% |
| Zimbabwean | 43 | 0.0% | View All 176 Rows |
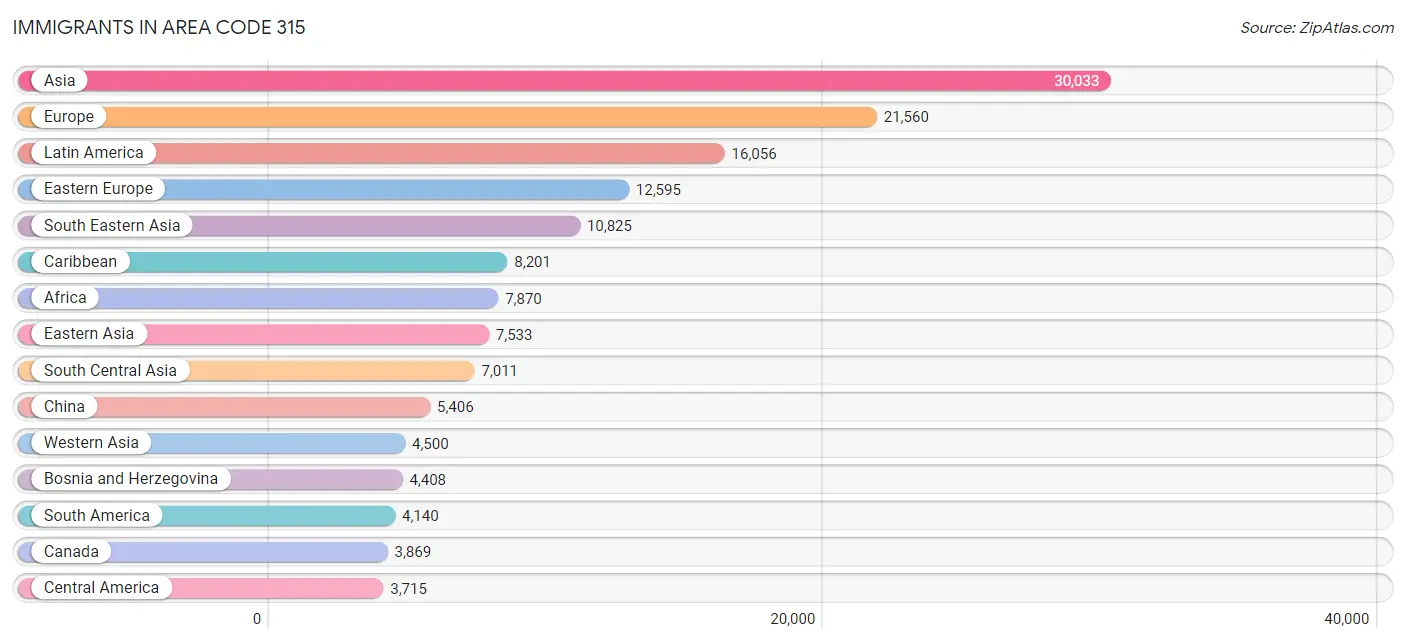
Immigrants in Area Code 315
The most numerous immigrant groups reported in Area Code 315 came from Asia (30,033 | 2.1%), Europe (21,560 | 1.5%), Latin America (16,056 | 1.1%), Eastern Europe (12,595 | 0.9%), and South Eastern Asia (10,825 | 0.7%), together accounting for 6.3% of all Area Code 315 residents.
| Immigration Origin | # Population | % Population |
| Afghanistan | 469 | 0.0% |
| Africa | 7,870 | 0.5% |
| Albania | 159 | 0.0% |
| Argentina | 283 | 0.0% |
| Armenia | 24 | 0.0% |
| Asia | 30,033 | 2.1% |
| Australia | 66 | 0.0% |
| Austria | 130 | 0.0% |
| Azores | 4 | 0.0% |
| Bahamas | 54 | 0.0% |
| Bangladesh | 444 | 0.0% |
| Barbados | 71 | 0.0% |
| Belarus | 824 | 0.1% |
| Belgium | 138 | 0.0% |
| Belize | 193 | 0.0% |
| Bolivia | 80 | 0.0% |
| Bosnia and Herzegovina | 4,408 | 0.3% |
| Brazil | 375 | 0.0% |
| Bulgaria | 81 | 0.0% |
| Cambodia | 573 | 0.0% |
| Cameroon | 80 | 0.0% |
| Canada | 3,869 | 0.3% |
| Caribbean | 8,201 | 0.6% |
| Central America | 3,715 | 0.3% |
| Chile | 188 | 0.0% |
| China | 5,406 | 0.4% |
| Colombia | 875 | 0.1% |
| Congo | 305 | 0.0% |
| Costa Rica | 132 | 0.0% |
| Croatia | 123 | 0.0% |
| Cuba | 1,248 | 0.1% |
| Czechoslovakia | 85 | 0.0% |
| Denmark | 24 | 0.0% |
| Dominica | 488 | 0.0% |
| Dominican Republic | 2,430 | 0.2% |
| Eastern Africa | 3,307 | 0.2% |
| Eastern Asia | 7,533 | 0.5% |
| Eastern Europe | 12,595 | 0.9% |
| Ecuador | 797 | 0.1% |
| Egypt | 368 | 0.0% |
| El Salvador | 254 | 0.0% |
| England | 714 | 0.1% |
| Eritrea | 185 | 0.0% |
| Ethiopia | 329 | 0.0% |
| Europe | 21,560 | 1.5% |
| France | 560 | 0.0% |
| Germany | 2,250 | 0.2% |
| Ghana | 633 | 0.0% |
| Greece | 653 | 0.1% |
| Grenada | 110 | 0.0% |
| Guatemala | 671 | 0.1% |
| Guyana | 741 | 0.1% |
| Haiti | 846 | 0.1% |
| Honduras | 334 | 0.0% |
| Hong Kong | 233 | 0.0% |
| Hungary | 182 | 0.0% |
| India | 3,263 | 0.2% |
| Indonesia | 166 | 0.0% |
| Iran | 326 | 0.0% |
| Iraq | 1,042 | 0.1% |
| Ireland | 260 | 0.0% |
| Israel | 302 | 0.0% |
| Italy | 2,323 | 0.2% |
| Jamaica | 2,246 | 0.2% |
| Japan | 420 | 0.0% |
| Jordan | 300 | 0.0% |
| Kazakhstan | 259 | 0.0% |
| Kenya | 947 | 0.1% |
| Korea | 1,696 | 0.1% |
| Kuwait | 15 | 0.0% |
| Laos | 250 | 0.0% |
| Latin America | 16,056 | 1.1% |
| Latvia | 23 | 0.0% |
| Lebanon | 267 | 0.0% |
| Liberia | 162 | 0.0% |
| Lithuania | 22 | 0.0% |
| Malaysia | 138 | 0.0% |
| Mexico | 1,802 | 0.1% |
| Micronesia | 84 | 0.0% |
| Middle Africa | 901 | 0.1% |
| Moldova | 31 | 0.0% |
| Morocco | 99 | 0.0% |
| Nepal | 599 | 0.0% |
| Netherlands | 298 | 0.0% |
| Nicaragua | 59 | 0.0% |
| Nigeria | 376 | 0.0% |
| North Macedonia | 380 | 0.0% |
| Northern Africa | 976 | 0.1% |
| Northern Europe | 1,958 | 0.1% |
| Norway | 57 | 0.0% |
| Oceania | 190 | 0.0% |
| Pakistan | 547 | 0.0% |
| Panama | 270 | 0.0% |
| Peru | 424 | 0.0% |
| Philippines | 1,783 | 0.1% |
| Poland | 1,461 | 0.1% |
| Portugal | 113 | 0.0% |
| Romania | 254 | 0.0% |
| Russia | 1,391 | 0.1% |
| Saudi Arabia | 17 | 0.0% |
| Scotland | 192 | 0.0% |
| Senegal | 140 | 0.0% |
| Serbia | 116 | 0.0% |
| Sierra Leone | 33 | 0.0% |
| Singapore | 43 | 0.0% |
| Somalia | 1,448 | 0.1% |
| South Africa | 181 | 0.0% |
| South America | 4,140 | 0.3% |
| South Central Asia | 7,011 | 0.5% |
| South Eastern Asia | 10,825 | 0.7% |
| Southern Europe | 3,384 | 0.2% |
| Spain | 295 | 0.0% |
| Sri Lanka | 134 | 0.0% |
| St. Vincent and the Grenadines | 48 | 0.0% |
| Sudan | 367 | 0.0% |
| Sweden | 109 | 0.0% |
| Switzerland | 140 | 0.0% |
| Syria | 577 | 0.0% |
| Taiwan | 370 | 0.0% |
| Thailand | 2,182 | 0.2% |
| Trinidad and Tobago | 523 | 0.0% |
| Turkey | 914 | 0.1% |
| Uganda | 5 | 0.0% |
| Ukraine | 2,666 | 0.2% |
| Uruguay | 85 | 0.0% |
| Uzbekistan | 216 | 0.0% |
| Venezuela | 265 | 0.0% |
| Vietnam | 2,633 | 0.2% |
| Western Africa | 1,781 | 0.1% |
| Western Asia | 4,500 | 0.3% |
| Western Europe | 3,555 | 0.3% |
| Yemen | 761 | 0.1% |
| Zaire | 345 | 0.0% |
| Zimbabwe | 91 | 0.0% | View All 134 Rows |
Sex and Age in Area Code 315
Sex and Age in Area Code 315
The most populous age groups in Area Code 315 are 20 to 24 Years (54,455 | 7.5%) for men and 60 to 64 Years (53,210 | 7.4%) for women.
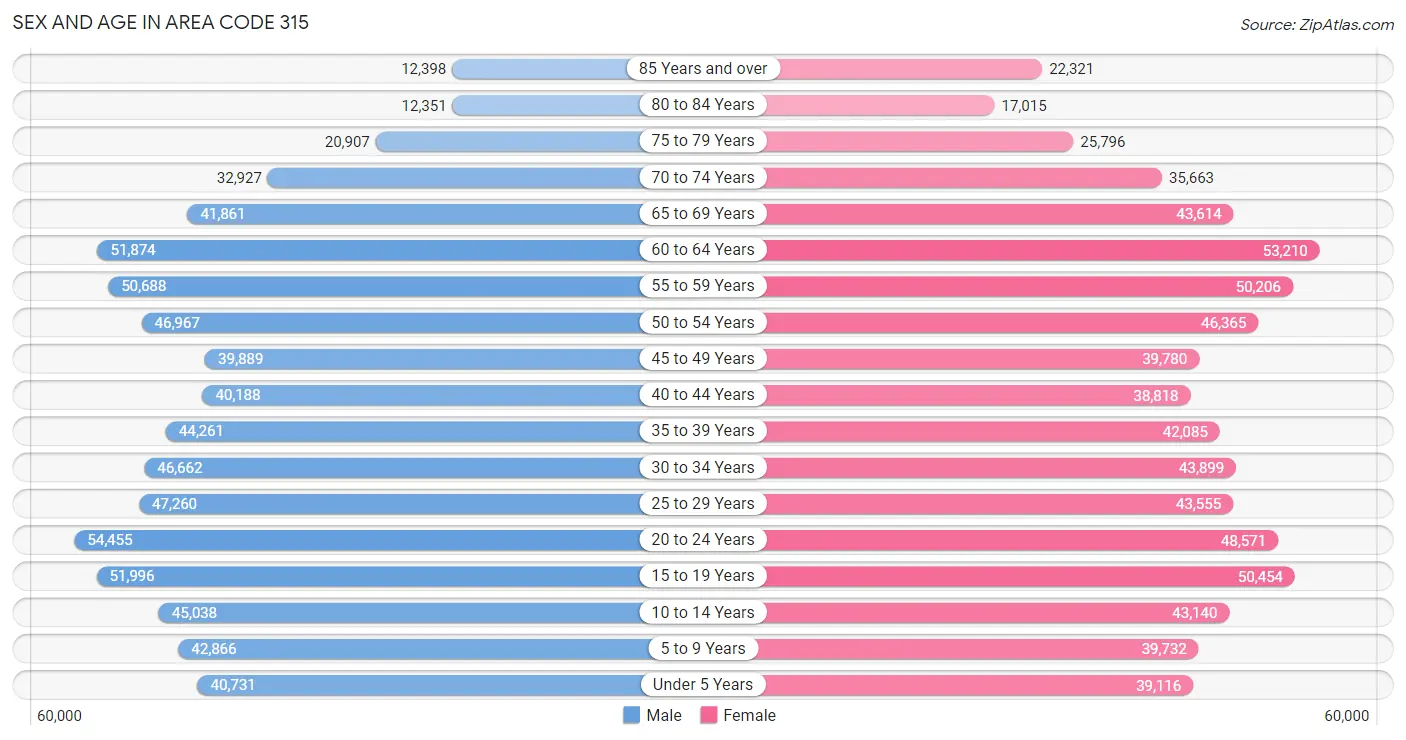
| Age Bracket | Male | Female |
| Under 5 Years | 40,731 (5.6%) | 39,116 (5.4%) |
| 5 to 9 Years | 42,866 (5.9%) | 39,732 (5.5%) |
| 10 to 14 Years | 45,038 (6.2%) | 43,140 (6.0%) |
| 15 to 19 Years | 51,996 (7.2%) | 50,454 (7.0%) |
| 20 to 24 Years | 54,455 (7.5%) | 48,571 (6.7%) |
| 25 to 29 Years | 47,260 (6.5%) | 43,555 (6.0%) |
| 30 to 34 Years | 46,662 (6.5%) | 43,899 (6.1%) |
| 35 to 39 Years | 44,261 (6.1%) | 42,085 (5.8%) |
| 40 to 44 Years | 40,188 (5.6%) | 38,818 (5.4%) |
| 45 to 49 Years | 39,889 (5.5%) | 39,780 (5.5%) |
| 50 to 54 Years | 46,967 (6.5%) | 46,365 (6.4%) |
| 55 to 59 Years | 50,688 (7.0%) | 50,206 (6.9%) |
| 60 to 64 Years | 51,874 (7.2%) | 53,210 (7.4%) |
| 65 to 69 Years | 41,861 (5.8%) | 43,614 (6.0%) |
| 70 to 74 Years | 32,927 (4.5%) | 35,663 (4.9%) |
| 75 to 79 Years | 20,907 (2.9%) | 25,796 (3.6%) |
| 80 to 84 Years | 12,351 (1.7%) | 17,015 (2.4%) |
| 85 Years and over | 12,398 (1.7%) | 22,321 (3.1%) |
| Total | 723,319 (100.0%) | 723,340 (100.0%) |
Families and Households in Area Code 315
Median Family Size in Area Code 315
The median family size in Area Code 315 is 3.02 persons per family, with married-couple families (263,245 | 73.7%) accounting for the largest median family size of 3.06286 persons per family. On the other hand, single female/mother families (65,391 | 18.3%) represent the smallest median family size with 2.83 persons per family.
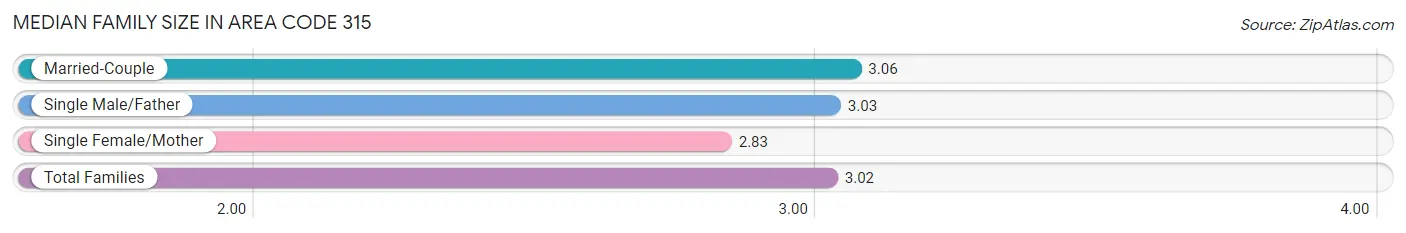
| Family Type | # Families | Family Size |
| Married-Couple | 263,245 (73.7%) | 3.06 |
| Single Male/Father | 28,518 (8.0%) | 3.03 |
| Single Female/Mother | 65,391 (18.3%) | 2.83 |
| Total Families | 357,154 (100.0%) | 3.02 |
Median Household Size in Area Code 315
The median household size in Area Code 315 is 2.51 persons per household, with single male/father households (28,518 | 4.9%) accounting for the largest median household size of 3.65254 persons per household. non-family households (222,313 | 38.4%) represent the smallest median household size with 1.26 persons per household.
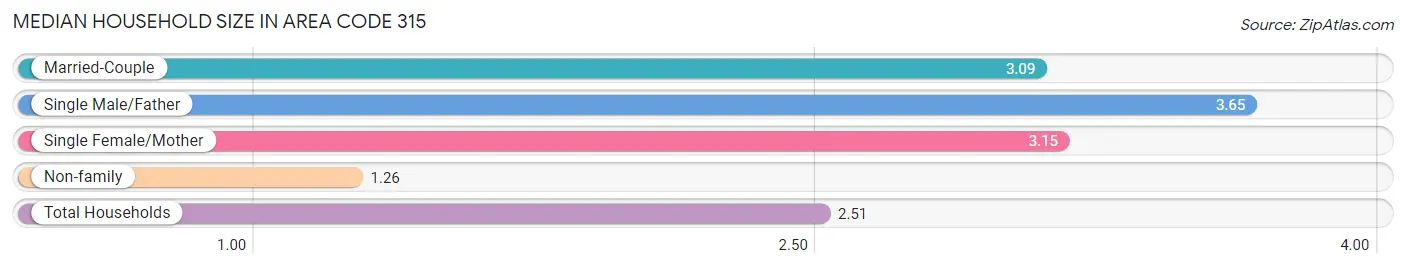
| Household Type | # Households | Household Size |
| Married-Couple | 263,245 (45.4%) | 3.09 |
| Single Male/Father | 28,518 (4.9%) | 3.65 |
| Single Female/Mother | 65,391 (11.3%) | 3.15 |
| Non-family | 222,313 (38.4%) | 1.26 |
| Total Households | 579,467 (100.0%) | 2.51 |
Household Size by Marriage Status in Area Code 315
Out of a total of 579,467 households in Area Code 315, 357,154 (61.6%) are family households, while 222,313 (38.4%) are nonfamily households. The most numerous type of family households are 2-person households, comprising 168,560, and the most common type of nonfamily households are 1-person households, comprising 179,321.
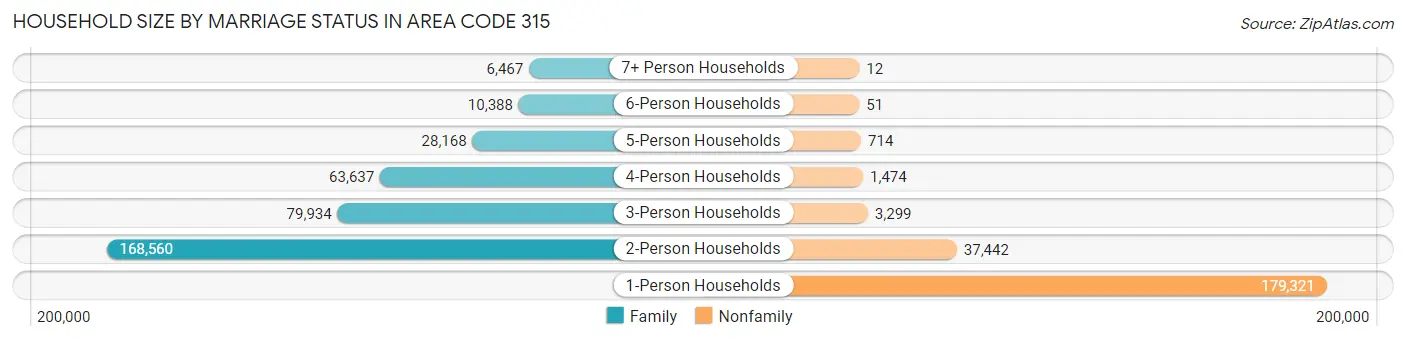
| Household Size | Family Households | Nonfamily Households |
| 1-Person Households | - | 179,321 (30.9%) |
| 2-Person Households | 168,560 (29.1%) | 37,442 (6.5%) |
| 3-Person Households | 79,934 (13.8%) | 3,299 (0.6%) |
| 4-Person Households | 63,637 (11.0%) | 1,474 (0.3%) |
| 5-Person Households | 28,168 (4.9%) | 714 (0.1%) |
| 6-Person Households | 10,388 (1.8%) | 51 (0.0%) |
| 7+ Person Households | 6,467 (1.1%) | 12 (0.0%) |
| Total | 357,154 (61.6%) | 222,313 (38.4%) |
Female Fertility in Area Code 315
Fertility by Age in Area Code 315
Average fertility rate in Area Code 315 is 84.3 births per 1,000 women. Women in the age bracket of 20 to 34 years have the highest fertility rate with 157.3 births per 1,000 women. Women in the age bracket of 20 to 34 years acount for 72.2% of all women with births.
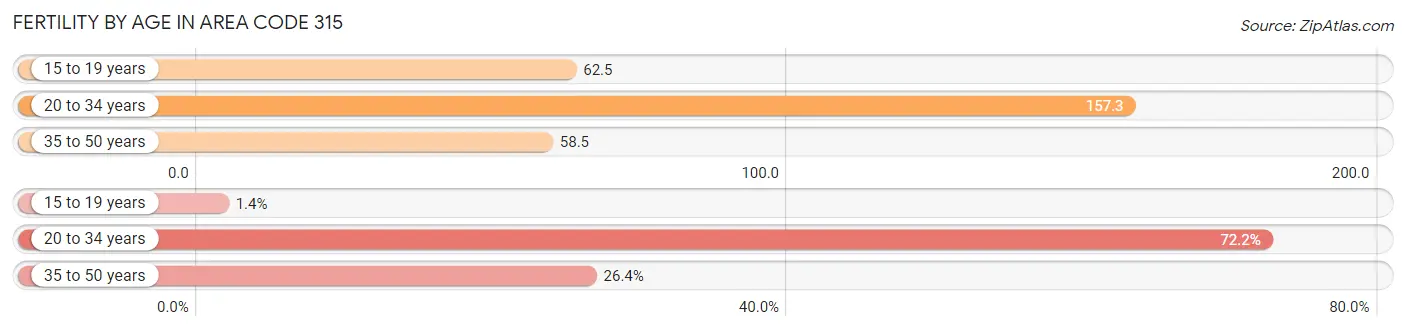
| Age Bracket | Women with Births | Births / 1,000 Women |
| 15 to 19 years | 261 (1.4%) | 62.5 |
| 20 to 34 years | 13,495 (72.2%) | 157.3 |
| 35 to 50 years | 4,926 (26.4%) | 58.5 |
| Total | 18,682 (100.0%) | 84.3 |
Fertility by Age by Marriage Status in Area Code 315
59.9% of women with births (18,682) in Area Code 315 are married. The highest percentage of unmarried women with births falls into 15 to 19 years age bracket with 94.6% of them unmarried at the time of birth, while the lowest percentage of unmarried women with births belong to 20 to 34 years age bracket with 46.1% of them unmarried.
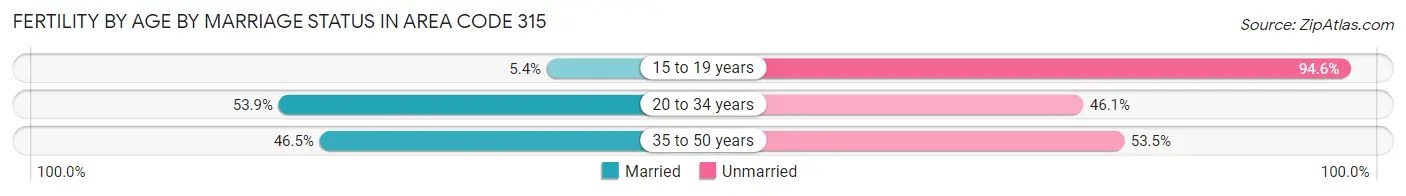
| Age Bracket | Married | Unmarried |
| 15 to 19 years | 14 (5.4%) | 247 (94.6%) |
| 20 to 34 years | 7,279 (53.9%) | 6,216 (46.1%) |
| 35 to 50 years | 2,292 (46.5%) | 2,634 (53.5%) |
| Total | 11,184 (59.9%) | 7,498 (40.1%) |
Fertility by Education in Area Code 315
Average fertility rate in Area Code 315 is 84.3 births per 1,000 women. Women with the education attainment of graduate degree have the highest fertility rate of 192.2 births per 1,000 women, while women with the education attainment of college or associate's degree have the lowest fertility at 88.3 births per 1,000 women. Women with the education attainment of college or associate's degree represent 29.0% of all women with births.
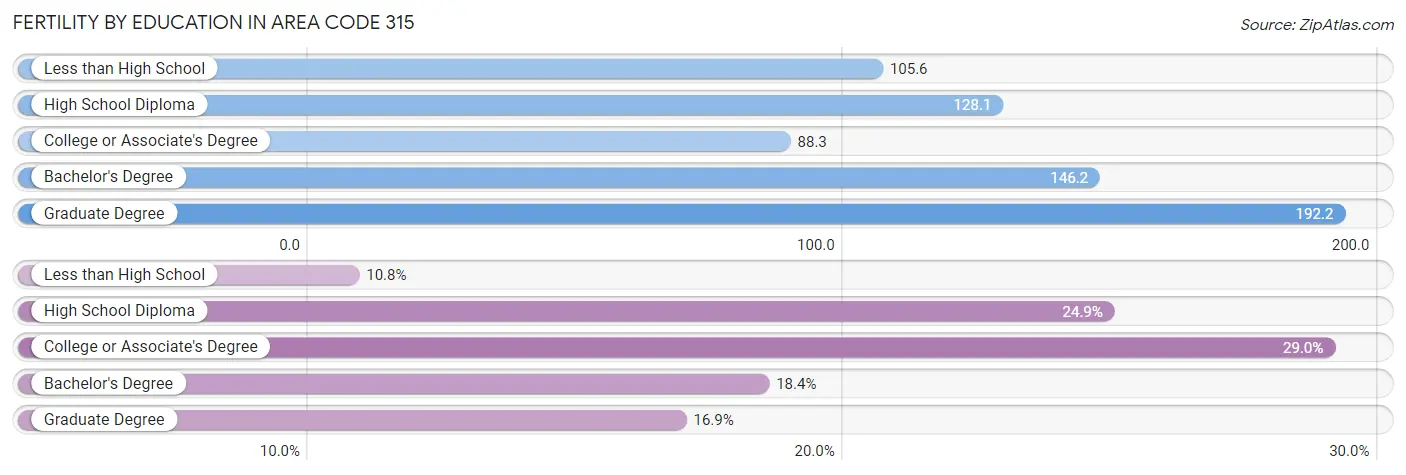
| Educational Attainment | Women with Births | Births / 1,000 Women |
| Less than High School | 2,008 (10.7%) | 105.6 |
| High School Diploma | 4,652 (24.9%) | 128.1 |
| College or Associate's Degree | 5,424 (29.0%) | 88.3 |
| Bachelor's Degree | 3,444 (18.4%) | 146.2 |
| Graduate Degree | 3,154 (16.9%) | 192.2 |
| Total | 18,682 (100.0%) | 84.3 |
Fertility by Education by Marriage Status in Area Code 315
40.1% of women with births in Area Code 315 are unmarried. Women with the educational attainment of graduate degree are most likely to be married with 51.6% of them married at childbirth, while women with the educational attainment of less than high school are least likely to be married with 79.7% of them unmarried at childbirth.
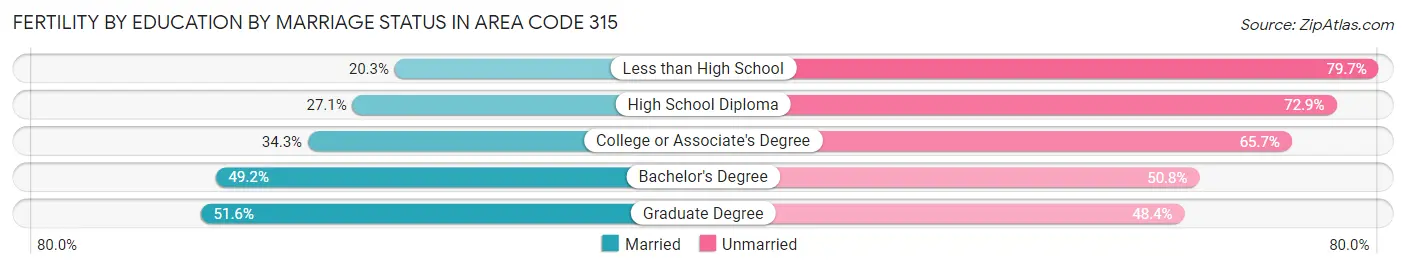
| Educational Attainment | Married | Unmarried |
| Less than High School | 408 (20.3%) | 1,600 (79.7%) |
| High School Diploma | 1,262 (27.1%) | 3,390 (72.9%) |
| College or Associate's Degree | 1,862 (34.3%) | 3,562 (65.7%) |
| Bachelor's Degree | 1,695 (49.2%) | 1,749 (50.8%) |
| Graduate Degree | 1,628 (51.6%) | 1,526 (48.4%) |
| Total | 11,184 (59.9%) | 7,498 (40.1%) |
Employment Characteristics in Area Code 315
Employment by Class of Employer in Area Code 315
Among the 654,712 employed individuals in Area Code 315, private company employees (386,864 | 59.1%), not-for-profit organizations (76,637 | 11.7%), and local government employees (61,935 | 9.5%) make up the most common classes of employment.
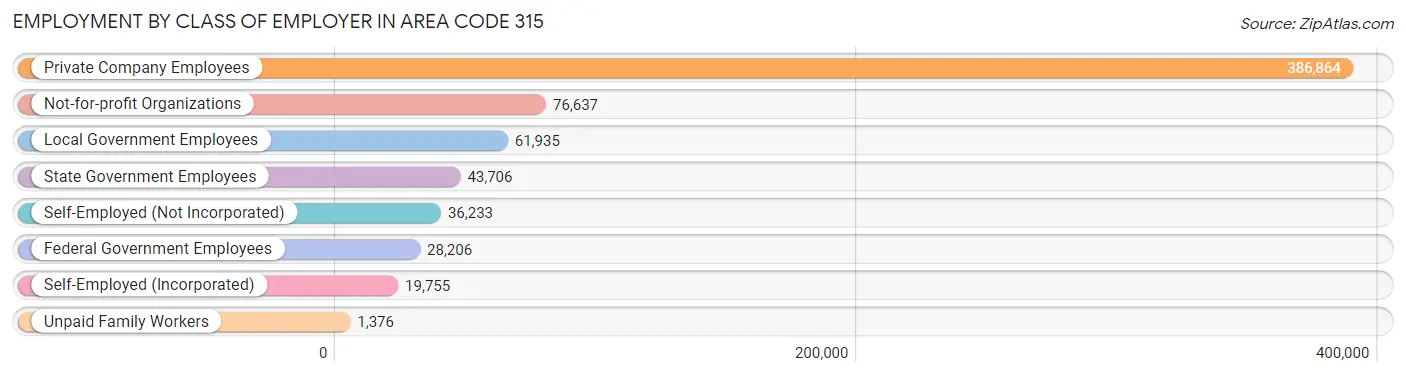
| Employer Class | # Employees | % Employees |
| Private Company Employees | 386,864 | 59.1% |
| Self-Employed (Incorporated) | 19,755 | 3.0% |
| Self-Employed (Not Incorporated) | 36,233 | 5.5% |
| Not-for-profit Organizations | 76,637 | 11.7% |
| Local Government Employees | 61,935 | 9.5% |
| State Government Employees | 43,706 | 6.7% |
| Federal Government Employees | 28,206 | 4.3% |
| Unpaid Family Workers | 1,376 | 0.2% |
| Total | 654,712 | 100.0% |
Employment Status by Age in Area Code 315
According to the labor force statistics for Area Code 315, out of the total population over 16 years of age (1,177,460), 59.5% or 700,471 individuals are in the labor force, with 6.4% or 44,970 of them unemployed. The age group with the highest labor force participation rate is 30 to 34 years, with 85.3% or 77,258 individuals in the labor force. Within the labor force, the 16 to 19 years age range has the highest percentage of unemployed individuals, with 4,120.2% or 1,483,890 of them being unemployed.
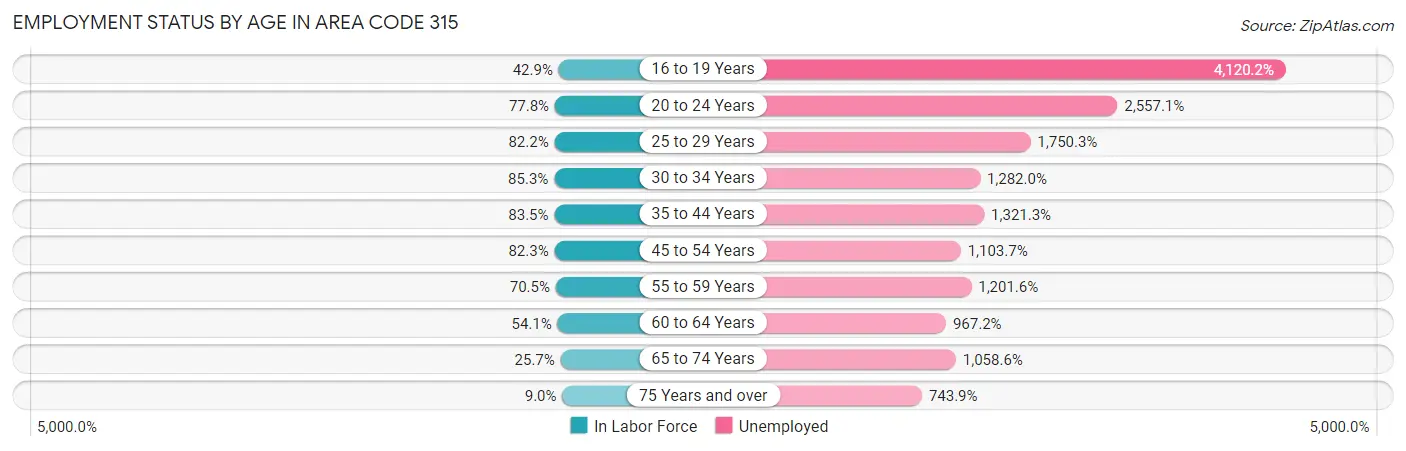
| Age Bracket | In Labor Force | Unemployed |
| 16 to 19 Years | 36,015 (42.9%) | 1,483,890 (4,120.2%) |
| 20 to 24 Years | 80,159 (77.8%) | 2,049,618 (2,557.1%) |
| 25 to 29 Years | 74,631 (82.2%) | 1,306,284 (1,750.3%) |
| 30 to 34 Years | 77,260 (85.3%) | 990,448 (1,282.0%) |
| 35 to 44 Years | 138,096 (83.5%) | 1,824,742 (1,321.3%) |
| 45 to 54 Years | 142,288 (82.3%) | 1,570,488 (1,103.7%) |
| 55 to 59 Years | 71,112 (70.5%) | 854,458 (1,201.6%) |
| 60 to 64 Years | 56,811 (54.1%) | 549,447 (967.2%) |
| 65 to 74 Years | 39,612 (25.7%) | 419,311 (1,058.6%) |
| 75 Years and over | 9,975 (9.0%) | 74,174 (743.9%) |
| Total | 700,493 (59.5%) | 44,943 (6.4%) |
Employment Status by Educational Attainment in Area Code 315
According to labor force statistics for Area Code 315, 75.8% of individuals (549,868) out of the total population between 25 and 64 years of age (725,707) are in the labor force, with 1,333.7% or 7,333,590 of them being unemployed. The group with the highest labor force participation rate are those with the educational attainment of bachelor's degree or higher, with 85.9% or 186,693 individuals in the labor force. Within the labor force, individuals with less than high school education have the highest percentage of unemployment, with 2,363.1% or 904,217 of them being unemployed.
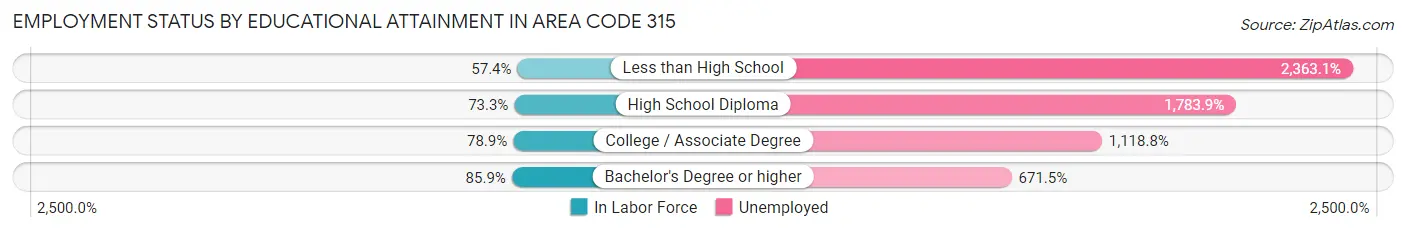
| Educational Attainment | In Labor Force | Unemployed |
| Less than High School | 38,263 (57.4%) | 1,574,746 (2,363.1%) |
| High School Diploma | 153,082 (73.3%) | 3,727,834 (1,783.9%) |
| College / Associate Degree | 183,770 (78.9%) | 2,604,399 (1,118.8%) |
| Bachelor's Degree or higher | 186,692 (85.9%) | 1,459,250 (671.5%) |
| Total | 549,862 (75.8%) | 9,678,754 (1,333.7%) |
Employment Occupations by Sex in Area Code 315
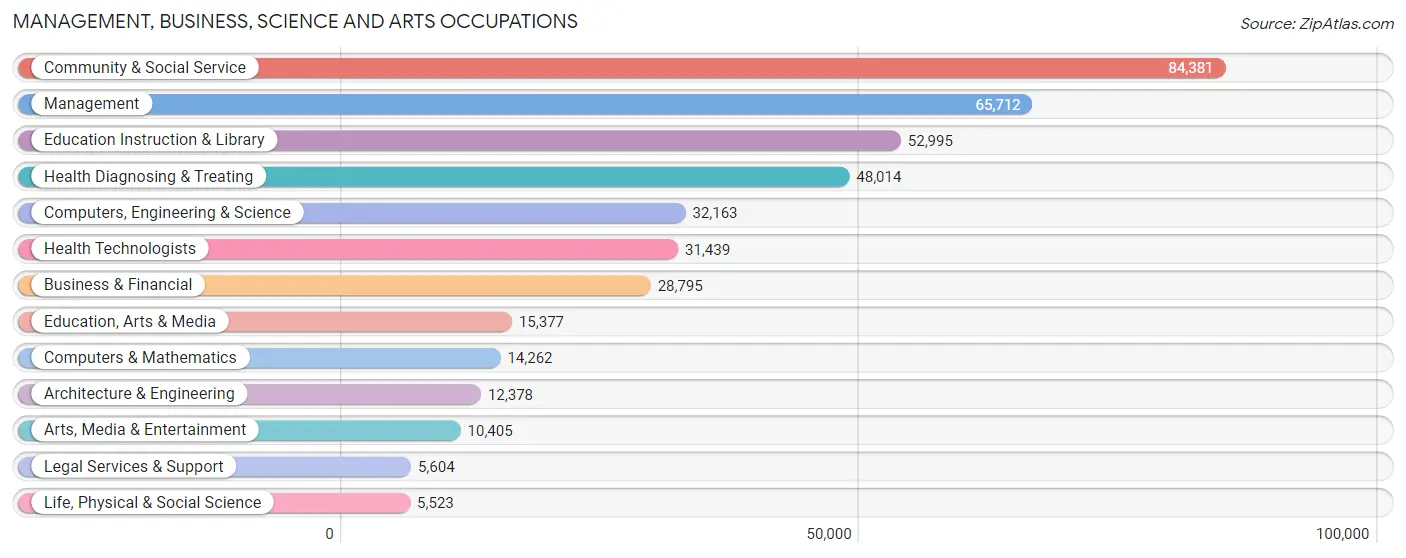
Management, Business, Science and Arts Occupations
The most common Management, Business, Science and Arts occupations in Area Code 315 are Community & Social Service (84,381 | 12.8%), Management (65,712 | 10.0%), Education Instruction & Library (52,995 | 8.1%), Health Diagnosing & Treating (48,014 | 7.3%), and Computers, Engineering & Science (32,163 | 4.9%).
Management, Business, Science and Arts Occupations by Sex
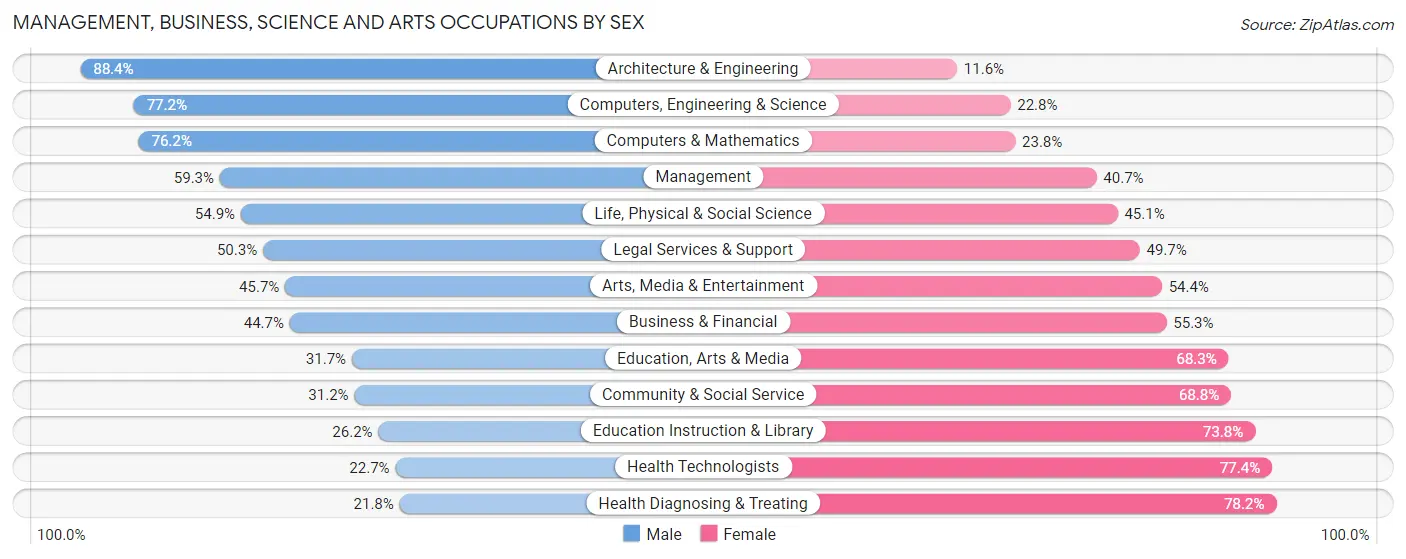
Within the Management, Business, Science and Arts occupations in Area Code 315, the most male-oriented occupations are Architecture & Engineering (88.4%), Computers, Engineering & Science (77.2%), and Computers & Mathematics (76.2%), while the most female-oriented occupations are Health Diagnosing & Treating (78.2%), Health Technologists (77.3%), and Education Instruction & Library (73.8%).
| Occupation | Male | Female |
| Management | 38,949 (59.3%) | 26,763 (40.7%) |
| Business & Financial | 12,867 (44.7%) | 15,928 (55.3%) |
| Computers, Engineering & Science | 24,841 (77.2%) | 7,322 (22.8%) |
| Computers & Mathematics | 10,872 (76.2%) | 3,390 (23.8%) |
| Architecture & Engineering | 10,938 (88.4%) | 1,440 (11.6%) |
| Life, Physical & Social Science | 3,031 (54.9%) | 2,492 (45.1%) |
| Community & Social Service | 26,325 (31.2%) | 58,056 (68.8%) |
| Education, Arts & Media | 4,877 (31.7%) | 10,500 (68.3%) |
| Legal Services & Support | 2,817 (50.3%) | 2,787 (49.7%) |
| Education Instruction & Library | 13,881 (26.2%) | 39,114 (73.8%) |
| Arts, Media & Entertainment | 4,750 (45.7%) | 5,655 (54.3%) |
| Health Diagnosing & Treating | 10,451 (21.8%) | 37,563 (78.2%) |
| Health Technologists | 7,120 (22.7%) | 24,319 (77.3%) |
| Total (Category) | 113,433 (43.8%) | 145,632 (56.2%) |
| Total (Overall) | 339,487 (51.7%) | 317,466 (48.3%) |
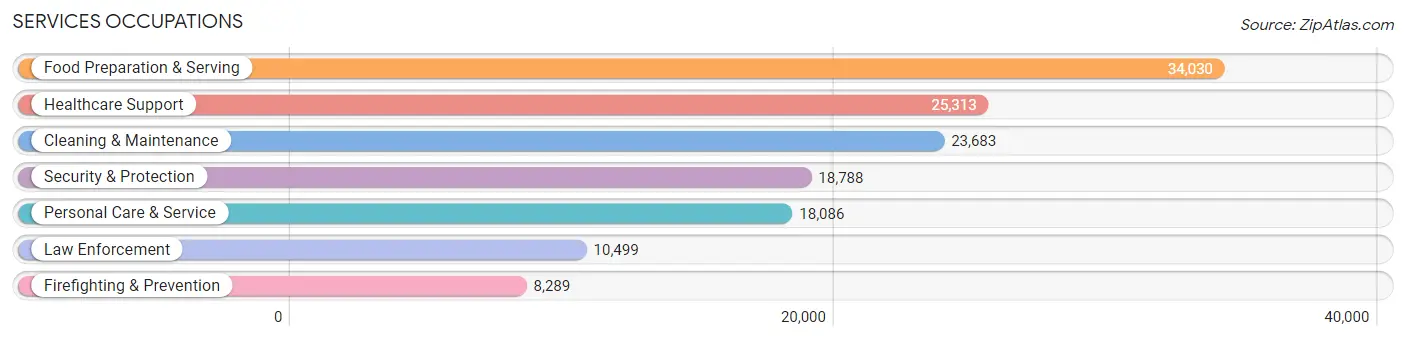
Services Occupations
The most common Services occupations in Area Code 315 are Food Preparation & Serving (34,030 | 5.2%), Healthcare Support (25,313 | 3.8%), Cleaning & Maintenance (23,683 | 3.6%), Security & Protection (18,788 | 2.9%), and Personal Care & Service (18,086 | 2.8%).
Services Occupations by Sex
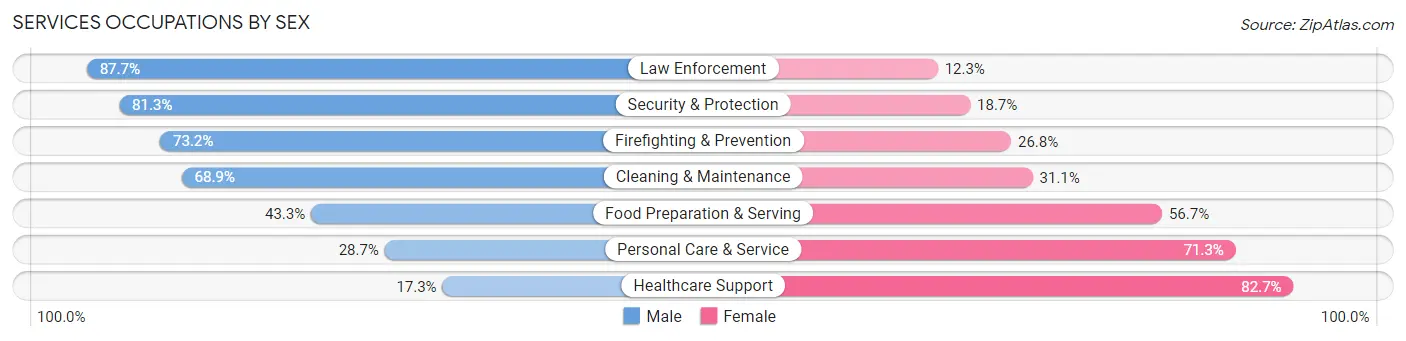
Within the Services occupations in Area Code 315, the most male-oriented occupations are Law Enforcement (87.7%), Security & Protection (81.3%), and Firefighting & Prevention (73.2%), while the most female-oriented occupations are Healthcare Support (82.7%), Personal Care & Service (71.3%), and Food Preparation & Serving (56.7%).
| Occupation | Male | Female |
| Healthcare Support | 4,370 (17.3%) | 20,943 (82.7%) |
| Security & Protection | 15,271 (81.3%) | 3,517 (18.7%) |
| Firefighting & Prevention | 6,064 (73.2%) | 2,225 (26.8%) |
| Law Enforcement | 9,207 (87.7%) | 1,292 (12.3%) |
| Food Preparation & Serving | 14,727 (43.3%) | 19,303 (56.7%) |
| Cleaning & Maintenance | 16,317 (68.9%) | 7,366 (31.1%) |
| Personal Care & Service | 5,189 (28.7%) | 12,897 (71.3%) |
| Total (Category) | 55,874 (46.6%) | 64,026 (53.4%) |
| Total (Overall) | 339,487 (51.7%) | 317,466 (48.3%) |
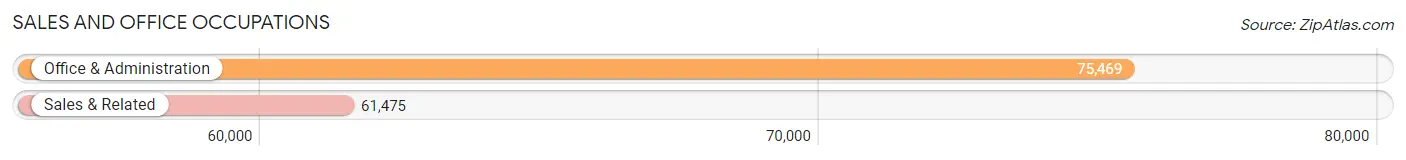
Sales and Office Occupations
The most common Sales and Office occupations in Area Code 315 are Office & Administration (75,469 | 11.5%), and Sales & Related (61,475 | 9.4%).
Sales and Office Occupations by Sex
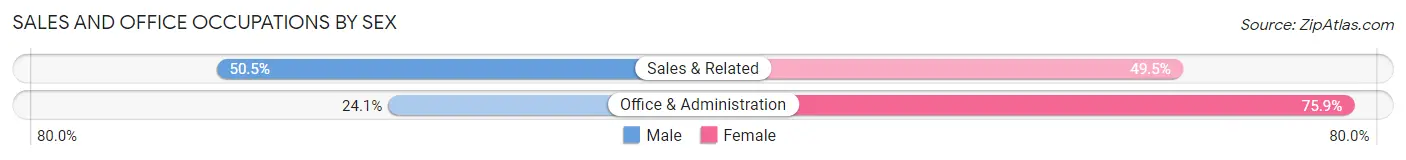
| Occupation | Male | Female |
| Sales & Related | 31,018 (50.5%) | 30,457 (49.5%) |
| Office & Administration | 18,173 (24.1%) | 57,296 (75.9%) |
| Total (Category) | 49,191 (35.9%) | 87,753 (64.1%) |
| Total (Overall) | 339,487 (51.7%) | 317,466 (48.3%) |
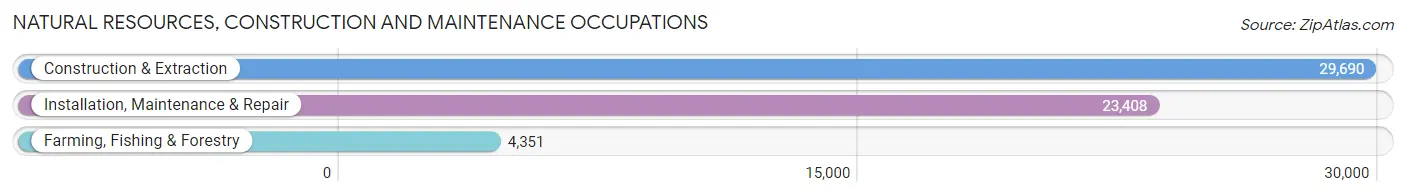
Natural Resources, Construction and Maintenance Occupations
The most common Natural Resources, Construction and Maintenance occupations in Area Code 315 are Construction & Extraction (29,690 | 4.5%), Installation, Maintenance & Repair (23,408 | 3.6%), and Farming, Fishing & Forestry (4,351 | 0.7%).
Natural Resources, Construction and Maintenance Occupations by Sex
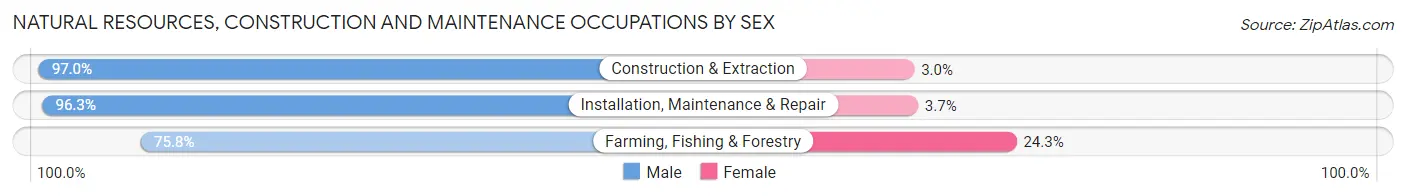
| Occupation | Male | Female |
| Farming, Fishing & Forestry | 3,296 (75.7%) | 1,055 (24.2%) |
| Construction & Extraction | 28,808 (97.0%) | 882 (3.0%) |
| Installation, Maintenance & Repair | 22,533 (96.3%) | 875 (3.7%) |
| Total (Category) | 54,637 (95.1%) | 2,812 (4.9%) |
| Total (Overall) | 339,487 (51.7%) | 317,466 (48.3%) |
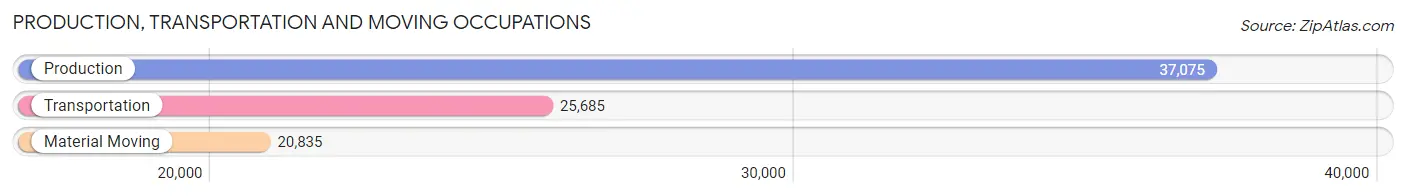
Production, Transportation and Moving Occupations
The most common Production, Transportation and Moving occupations in Area Code 315 are Production (37,075 | 5.6%), Transportation (25,685 | 3.9%), and Material Moving (20,835 | 3.2%).
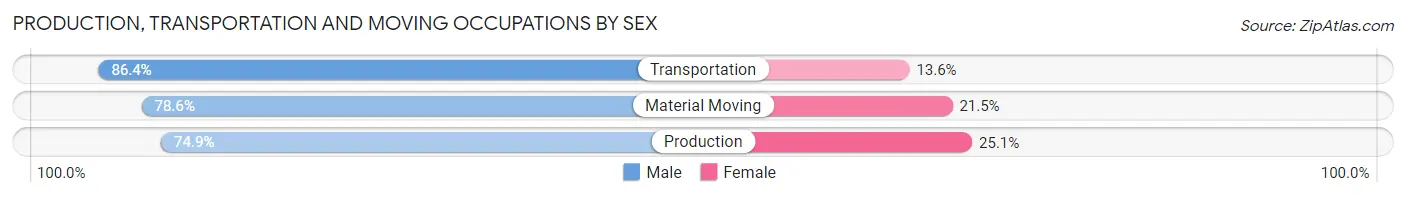
Production, Transportation and Moving Occupations by Sex
| Occupation | Male | Female |
| Production | 27,784 (74.9%) | 9,291 (25.1%) |
| Transportation | 22,203 (86.4%) | 3,482 (13.6%) |
| Material Moving | 16,365 (78.5%) | 4,470 (21.4%) |
| Total (Category) | 66,352 (79.4%) | 17,243 (20.6%) |
| Total (Overall) | 339,487 (51.7%) | 317,466 (48.3%) |
Employment Industries by Sex in Area Code 315
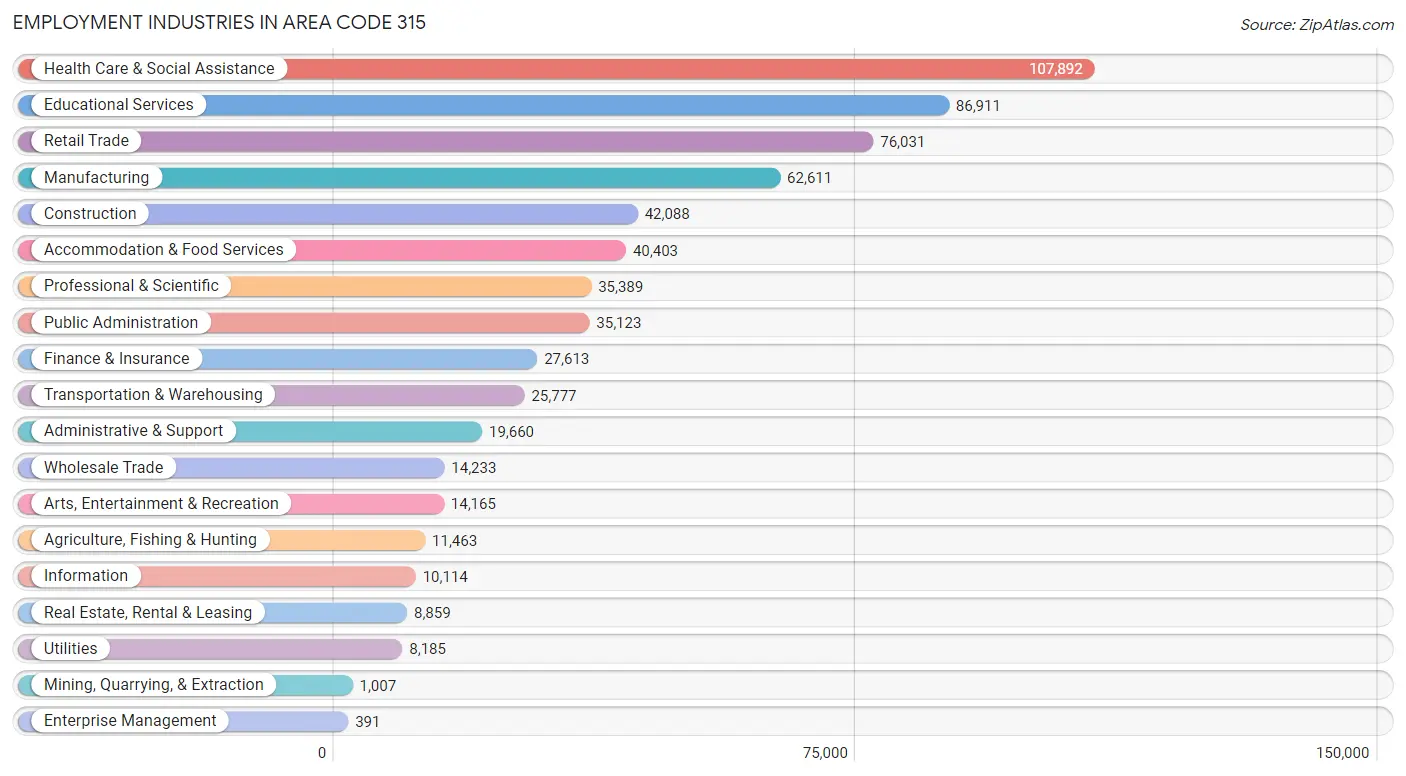
Employment Industries in Area Code 315
The major employment industries in Area Code 315 include Health Care & Social Assistance (107,892 | 16.4%), Educational Services (86,911 | 13.2%), Retail Trade (76,031 | 11.6%), Manufacturing (62,611 | 9.5%), and Construction (42,088 | 6.4%).
Employment Industries by Sex in Area Code 315
The Area Code 315 industries that see more men than women are Construction (90.8%), Mining, Quarrying, & Extraction (87.5%), and Agriculture, Fishing & Hunting (77.9%), whereas the industries that tend to have a higher number of women are Health Care & Social Assistance (76.9%), Educational Services (67.4%), and Finance & Insurance (64.4%).
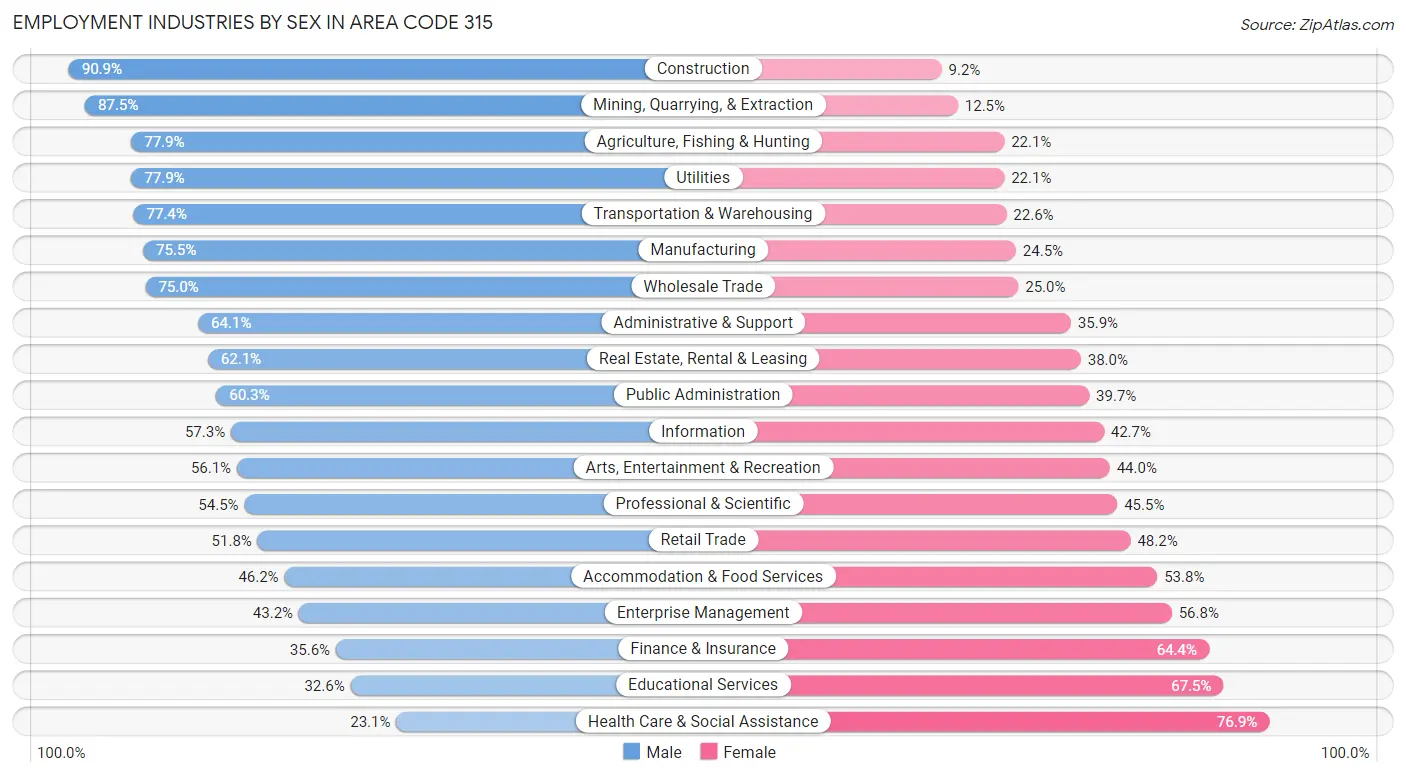
| Industry | Male | Female |
| Agriculture, Fishing & Hunting | 8,930 (77.9%) | 2,533 (22.1%) |
| Mining, Quarrying, & Extraction | 881 (87.5%) | 126 (12.5%) |
| Construction | 38,237 (90.8%) | 3,851 (9.1%) |
| Manufacturing | 47,259 (75.5%) | 15,352 (24.5%) |
| Wholesale Trade | 10,672 (75.0%) | 3,561 (25.0%) |
| Retail Trade | 39,351 (51.8%) | 36,680 (48.2%) |
| Transportation & Warehousing | 19,962 (77.4%) | 5,815 (22.6%) |
| Utilities | 6,375 (77.9%) | 1,810 (22.1%) |
| Information | 5,793 (57.3%) | 4,321 (42.7%) |
| Finance & Insurance | 9,819 (35.6%) | 17,794 (64.4%) |
| Real Estate, Rental & Leasing | 5,497 (62.1%) | 3,362 (38.0%) |
| Professional & Scientific | 19,288 (54.5%) | 16,101 (45.5%) |
| Enterprise Management | 169 (43.2%) | 222 (56.8%) |
| Administrative & Support | 12,600 (64.1%) | 7,060 (35.9%) |
| Educational Services | 28,292 (32.6%) | 58,619 (67.4%) |
| Health Care & Social Assistance | 24,882 (23.1%) | 83,010 (76.9%) |
| Arts, Entertainment & Recreation | 7,940 (56.0%) | 6,225 (44.0%) |
| Accommodation & Food Services | 18,673 (46.2%) | 21,730 (53.8%) |
| Public Administration | 21,182 (60.3%) | 13,941 (39.7%) |
| Total | 339,487 (51.7%) | 317,466 (48.3%) |
Education in Area Code 315
School Enrollment in Area Code 315
The most common levels of schooling among the 341,903 students in Area Code 315 are college / undergraduate (86,397 | 25.3%), middle school (68,983 | 20.2%), and high school (68,968 | 20.2%).
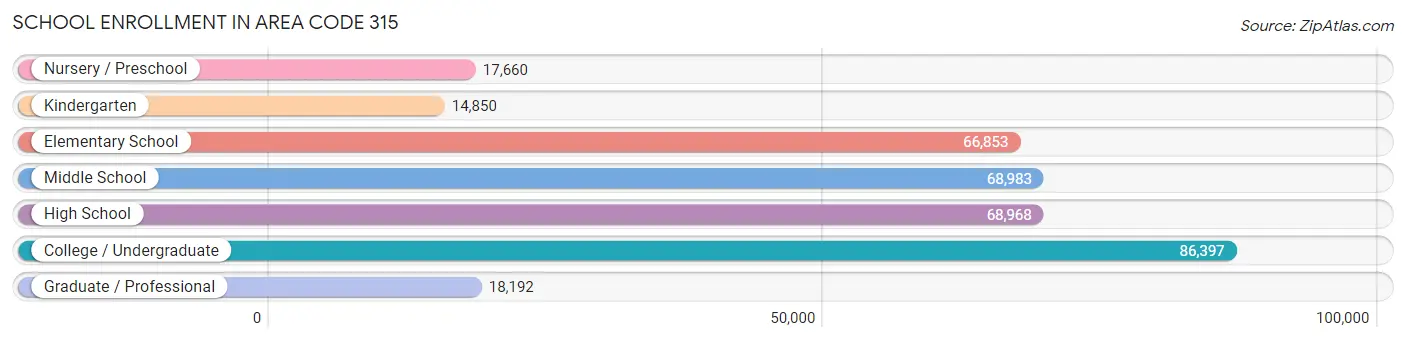
| School Level | # Students | % Students |
| Nursery / Preschool | 17,660 | 5.2% |
| Kindergarten | 14,850 | 4.3% |
| Elementary School | 66,853 | 19.6% |
| Middle School | 68,983 | 20.2% |
| High School | 68,968 | 20.2% |
| College / Undergraduate | 86,397 | 25.3% |
| Graduate / Professional | 18,192 | 5.3% |
| Total | 341,903 | 100.0% |
School Enrollment by Age by Funding Source in Area Code 315
Out of a total of 341,903 students who are enrolled in schools in Area Code 315, 71,846 (21.0%) attend a private institution, while the remaining 270,057 (79.0%) are enrolled in public schools. The age group of 20 to 24 year olds has the highest likelihood of being enrolled in private schools, with 20,631 (48.8% in the age bracket) enrolled. Conversely, the age group of 15 to 17 year olds has the lowest likelihood of being enrolled in a private school, with 46,632 (93.0% in the age bracket) attending a public institution.
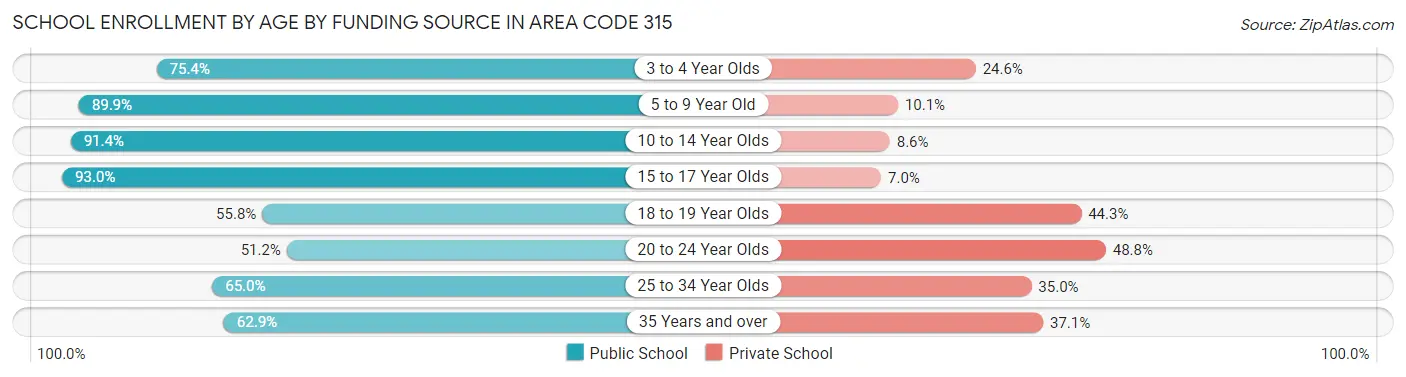
| Age Bracket | Public School | Private School |
| 3 to 4 Year Olds | 11,241 (75.4%) | 3,666 (24.6%) |
| 5 to 9 Year Old | 70,030 (89.9%) | 7,877 (10.1%) |
| 10 to 14 Year Olds | 78,306 (91.4%) | 7,355 (8.6%) |
| 15 to 17 Year Olds | 46,632 (93.0%) | 3,494 (7.0%) |
| 18 to 19 Year Olds | 21,885 (55.7%) | 17,371 (44.3%) |
| 20 to 24 Year Olds | 21,628 (51.2%) | 20,631 (48.8%) |
| 25 to 34 Year Olds | 11,242 (65.0%) | 6,046 (35.0%) |
| 35 Years and over | 9,115 (62.9%) | 5,384 (37.1%) |
| Total | 270,057 (79.0%) | 71,846 (21.0%) |
Educational Attainment by Field of Study in Area Code 315
Education (49,623 | 16.1%), business (46,316 | 15.0%), science & technology (34,258 | 11.1%), social sciences (23,538 | 7.6%), and bio, nature & agricultural (21,611 | 7.0%) are the most common fields of study among 308,073 individuals in Area Code 315 who have obtained a bachelor's degree or higher.
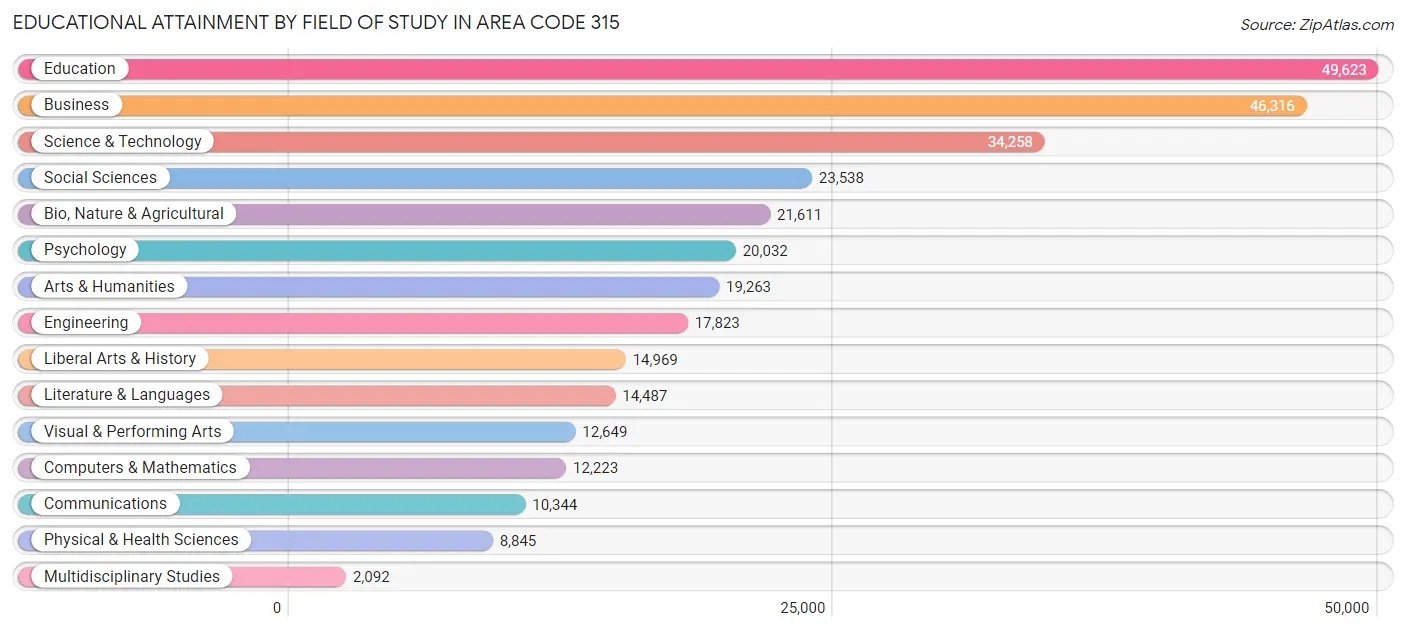
| Field of Study | # Graduates | % Graduates |
| Computers & Mathematics | 12,223 | 4.0% |
| Bio, Nature & Agricultural | 21,611 | 7.0% |
| Physical & Health Sciences | 8,845 | 2.9% |
| Psychology | 20,032 | 6.5% |
| Social Sciences | 23,538 | 7.6% |
| Engineering | 17,823 | 5.8% |
| Multidisciplinary Studies | 2,092 | 0.7% |
| Science & Technology | 34,258 | 11.1% |
| Business | 46,316 | 15.0% |
| Education | 49,623 | 16.1% |
| Literature & Languages | 14,487 | 4.7% |
| Liberal Arts & History | 14,969 | 4.9% |
| Visual & Performing Arts | 12,649 | 4.1% |
| Communications | 10,344 | 3.4% |
| Arts & Humanities | 19,263 | 6.2% |
| Total | 308,073 | 100.0% |
Transportation & Commute in Area Code 315
Vehicle Availability by Sex in Area Code 315
The most prevalent vehicle ownership categories in Area Code 315 are males with 2 vehicles (155,019, accounting for 45.9%) and females with 2 vehicles (133,044, making up 51.2%).
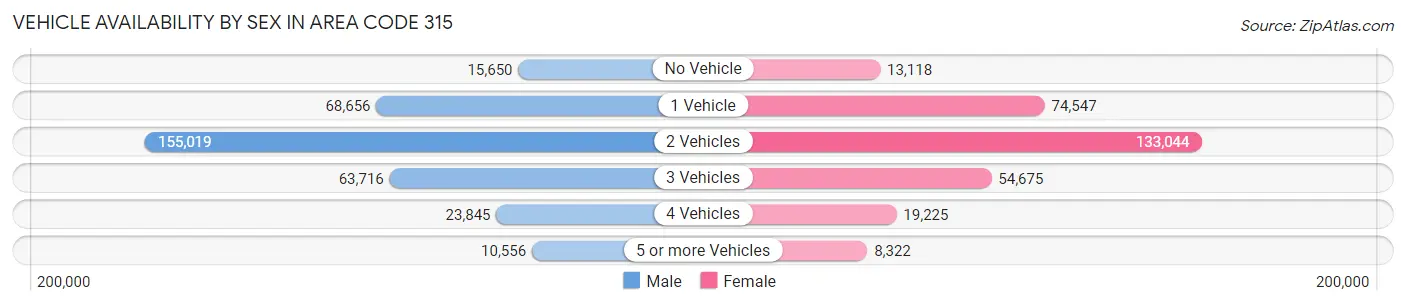
| Vehicles Available | Male | Female |
| No Vehicle | 15,650 (4.6%) | 13,118 (4.3%) |
| 1 Vehicle | 68,656 (20.3%) | 74,547 (24.6%) |
| 2 Vehicles | 155,019 (45.9%) | 133,044 (43.9%) |
| 3 Vehicles | 63,716 (18.9%) | 54,675 (18.0%) |
| 4 Vehicles | 23,845 (7.1%) | 19,225 (6.4%) |
| 5 or more Vehicles | 10,556 (3.1%) | 8,322 (2.8%) |
| Total | 337,442 (100.0%) | 302,931 (100.0%) |
Commute Time in Area Code 315
The most frequently occuring commute durations in Area Code 315 are 15 to 19 minutes (105,188 commuters, 17.5%), 10 to 14 minutes (99,936 commuters, 16.6%), and 20 to 24 minutes (87,673 commuters, 14.6%).
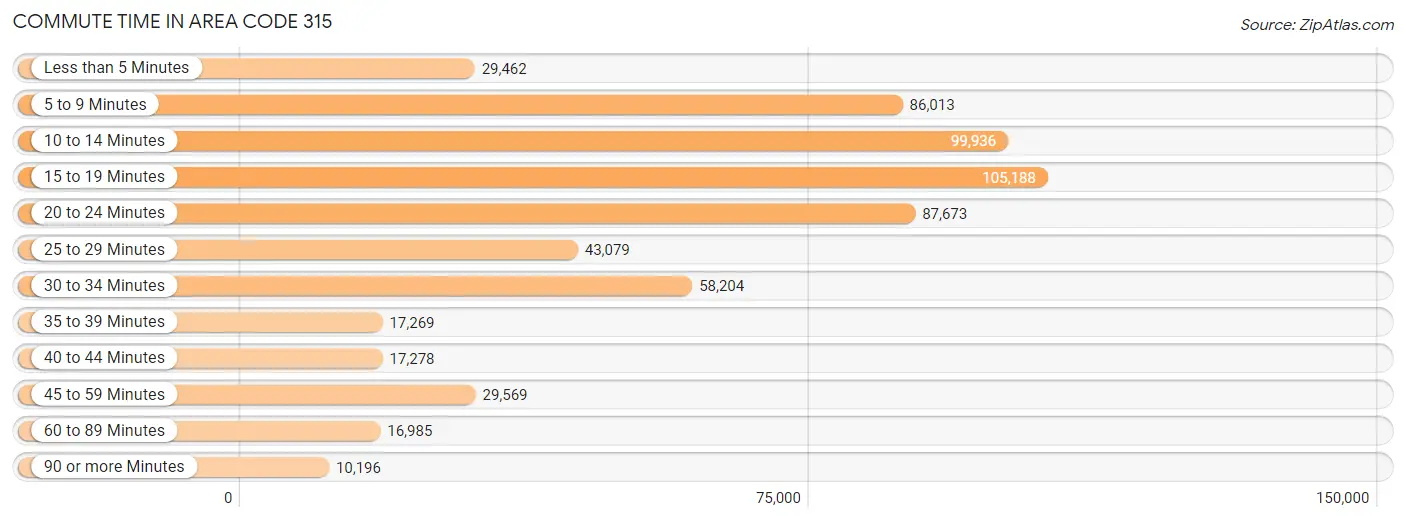
| Commute Time | # Commuters | % Commuters |
| Less than 5 Minutes | 29,462 | 4.9% |
| 5 to 9 Minutes | 86,013 | 14.3% |
| 10 to 14 Minutes | 99,936 | 16.6% |
| 15 to 19 Minutes | 105,188 | 17.5% |
| 20 to 24 Minutes | 87,673 | 14.6% |
| 25 to 29 Minutes | 43,079 | 7.2% |
| 30 to 34 Minutes | 58,204 | 9.7% |
| 35 to 39 Minutes | 17,269 | 2.9% |
| 40 to 44 Minutes | 17,278 | 2.9% |
| 45 to 59 Minutes | 29,569 | 4.9% |
| 60 to 89 Minutes | 16,985 | 2.8% |
| 90 or more Minutes | 10,196 | 1.7% |
Commute Time by Sex in Area Code 315
The most common commute times in Area Code 315 are 15 to 19 minutes (53,768 commuters, 16.8%) for males and 15 to 19 minutes (51,420 commuters, 18.3%) for females.
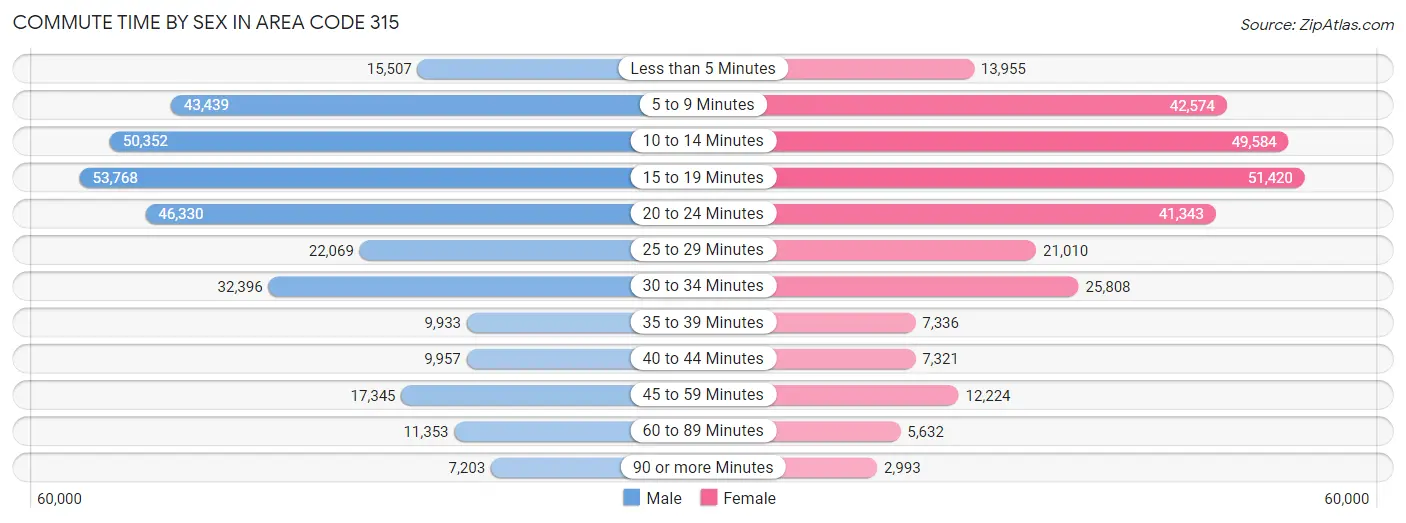
| Commute Time | Male | Female |
| Less than 5 Minutes | 15,507 (4.9%) | 13,955 (5.0%) |
| 5 to 9 Minutes | 43,439 (13.6%) | 42,574 (15.1%) |
| 10 to 14 Minutes | 50,352 (15.8%) | 49,584 (17.6%) |
| 15 to 19 Minutes | 53,768 (16.8%) | 51,420 (18.3%) |
| 20 to 24 Minutes | 46,330 (14.5%) | 41,343 (14.7%) |
| 25 to 29 Minutes | 22,069 (6.9%) | 21,010 (7.5%) |
| 30 to 34 Minutes | 32,396 (10.1%) | 25,808 (9.2%) |
| 35 to 39 Minutes | 9,933 (3.1%) | 7,336 (2.6%) |
| 40 to 44 Minutes | 9,957 (3.1%) | 7,321 (2.6%) |
| 45 to 59 Minutes | 17,345 (5.4%) | 12,224 (4.3%) |
| 60 to 89 Minutes | 11,353 (3.5%) | 5,632 (2.0%) |
| 90 or more Minutes | 7,203 (2.2%) | 2,993 (1.1%) |
Time of Departure to Work by Sex in Area Code 315
The most frequent times of departure to work in Area Code 315 are 7:00 AM to 7:29 AM (41,740, 13.1%) for males and 7:30 AM to 7:59 AM (46,879, 16.7%) for females.
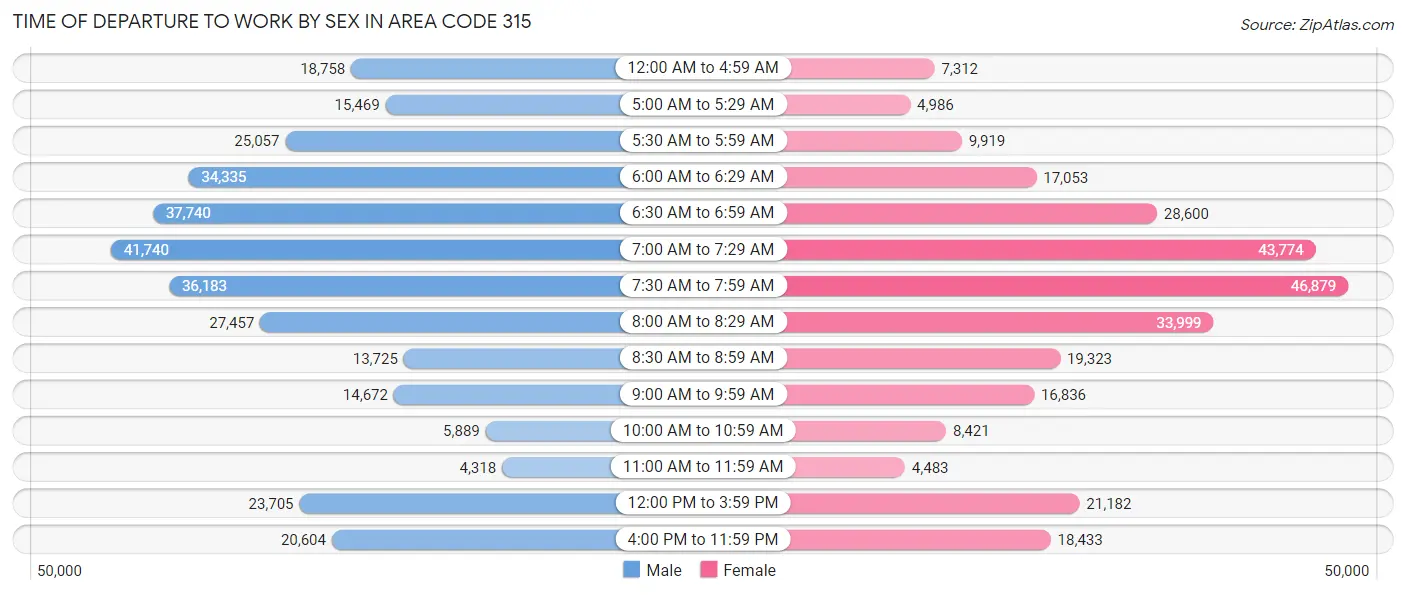
| Time of Departure | Male | Female |
| 12:00 AM to 4:59 AM | 18,758 (5.9%) | 7,312 (2.6%) |
| 5:00 AM to 5:29 AM | 15,469 (4.8%) | 4,986 (1.8%) |
| 5:30 AM to 5:59 AM | 25,057 (7.8%) | 9,919 (3.5%) |
| 6:00 AM to 6:29 AM | 34,335 (10.7%) | 17,053 (6.1%) |
| 6:30 AM to 6:59 AM | 37,740 (11.8%) | 28,600 (10.2%) |
| 7:00 AM to 7:29 AM | 41,740 (13.1%) | 43,774 (15.6%) |
| 7:30 AM to 7:59 AM | 36,183 (11.3%) | 46,879 (16.7%) |
| 8:00 AM to 8:29 AM | 27,457 (8.6%) | 33,999 (12.1%) |
| 8:30 AM to 8:59 AM | 13,725 (4.3%) | 19,323 (6.9%) |
| 9:00 AM to 9:59 AM | 14,672 (4.6%) | 16,836 (6.0%) |
| 10:00 AM to 10:59 AM | 5,889 (1.8%) | 8,421 (3.0%) |
| 11:00 AM to 11:59 AM | 4,318 (1.3%) | 4,483 (1.6%) |
| 12:00 PM to 3:59 PM | 23,705 (7.4%) | 21,182 (7.5%) |
| 4:00 PM to 11:59 PM | 20,604 (6.5%) | 18,433 (6.6%) |
| Total | 319,652 (100.0%) | 281,200 (100.0%) |
Housing Occupancy in Area Code 315
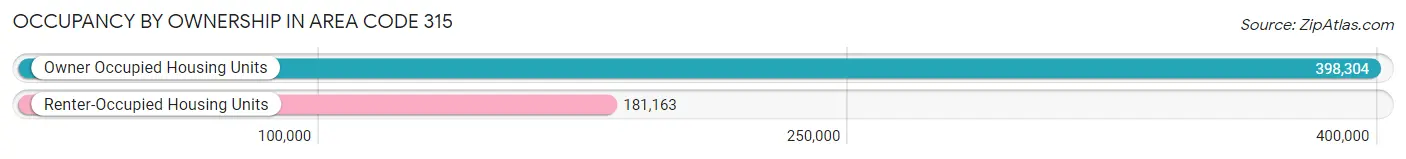
Occupancy by Ownership in Area Code 315
Of the total 579,467 dwellings in Area Code 315, owner-occupied units account for 398,304 (68.7%), while renter-occupied units make up 181,163 (31.3%).
| Occupancy | # Housing Units | % Housing Units |
| Owner Occupied Housing Units | 398,304 | 68.7% |
| Renter-Occupied Housing Units | 181,163 | 31.3% |
| Total Occupied Housing Units | 579,467 | 100.0% |
Occupancy by Household Size in Area Code 315
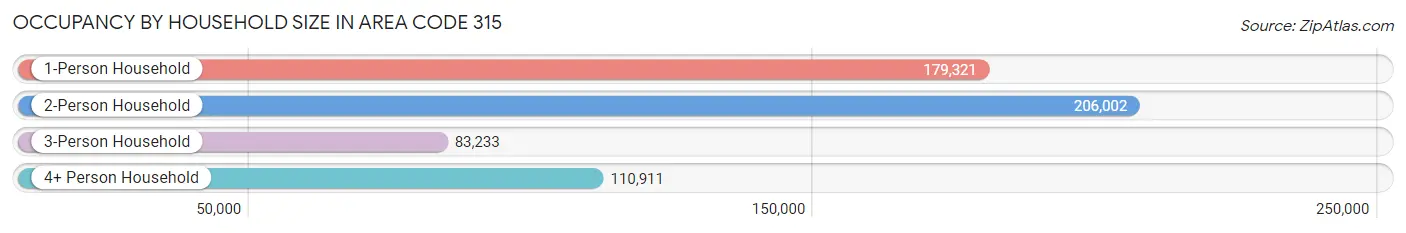
| Household Size | # Housing Units | % Housing Units |
| 1-Person Household | 179,321 | 30.9% |
| 2-Person Household | 206,002 | 35.5% |
| 3-Person Household | 83,233 | 14.4% |
| 4+ Person Household | 110,911 | 19.1% |
| Total Housing Units | 579,467 | 100.0% |
Occupancy by Ownership by Household Size in Area Code 315
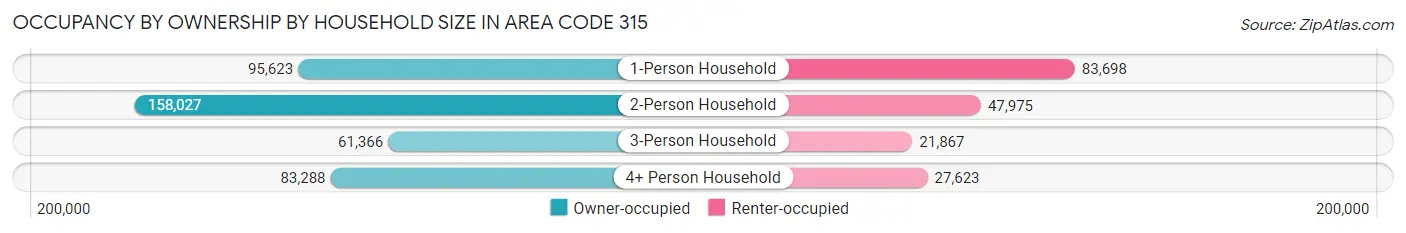
| Household Size | Owner-occupied | Renter-occupied |
| 1-Person Household | 95,623 (53.3%) | 83,698 (46.7%) |
| 2-Person Household | 158,027 (76.7%) | 47,975 (23.3%) |
| 3-Person Household | 61,366 (73.7%) | 21,867 (26.3%) |
| 4+ Person Household | 83,288 (75.1%) | 27,623 (24.9%) |
| Total Housing Units | 398,304 (68.7%) | 181,163 (31.3%) |
Occupancy by Educational Attainment in Area Code 315
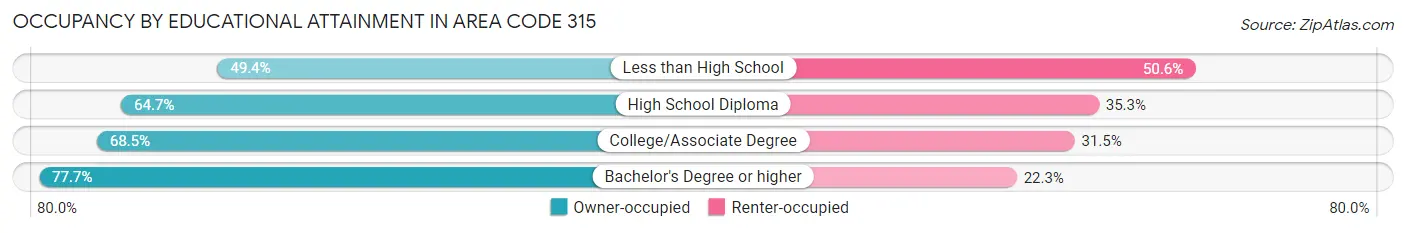
| Household Size | Owner-occupied | Renter-occupied |
| Less than High School | 22,907 (49.4%) | 23,447 (50.6%) |
| High School Diploma | 106,099 (64.7%) | 57,908 (35.3%) |
| College/Associate Degree | 131,112 (68.5%) | 60,173 (31.5%) |
| Bachelor's Degree or higher | 138,186 (77.7%) | 39,635 (22.3%) |
Occupancy by Age of Householder in Area Code 315
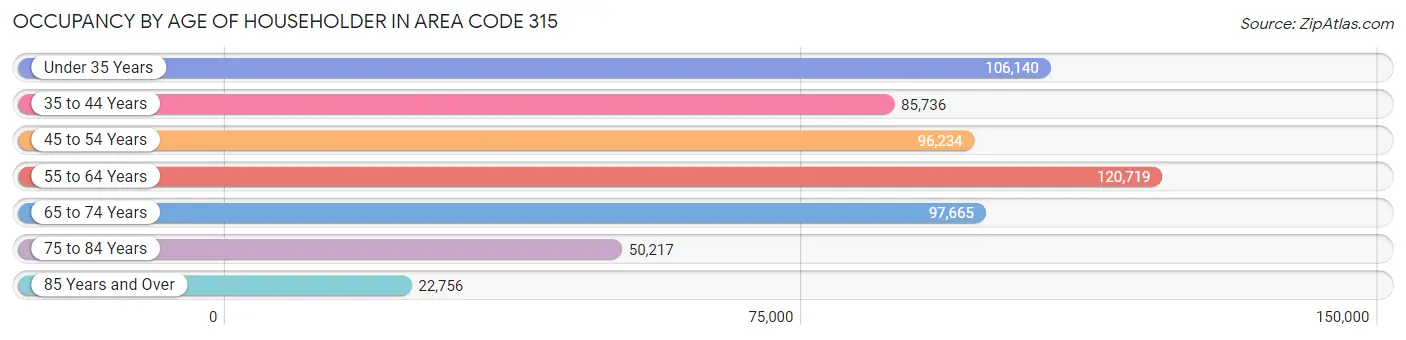
| Age Bracket | # Households | % Households |
| Under 35 Years | 106,140 | 18.3% |
| 35 to 44 Years | 85,736 | 14.8% |
| 45 to 54 Years | 96,234 | 16.6% |
| 55 to 64 Years | 120,719 | 20.8% |
| 65 to 74 Years | 97,665 | 16.9% |
| 75 to 84 Years | 50,217 | 8.7% |
| 85 Years and Over | 22,756 | 3.9% |
| Total | 579,467 | 100.0% |
Housing Finances in Area Code 315
Median Income by Occupancy in Area Code 315
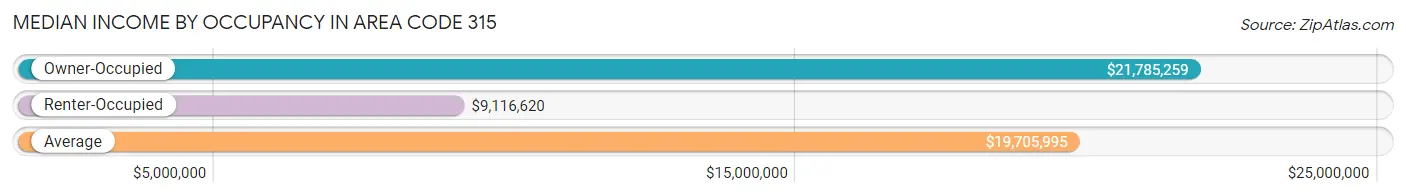
| Occupancy Type | # Households | Median Income |
| Owner-Occupied | 398,304 (68.7%) | $21,785,259 |
| Renter-Occupied | 181,163 (31.3%) | $9,116,620 |
| Average | 579,467 (100.0%) | $19,705,995 |
Occupancy by Householder Income Bracket in Area Code 315
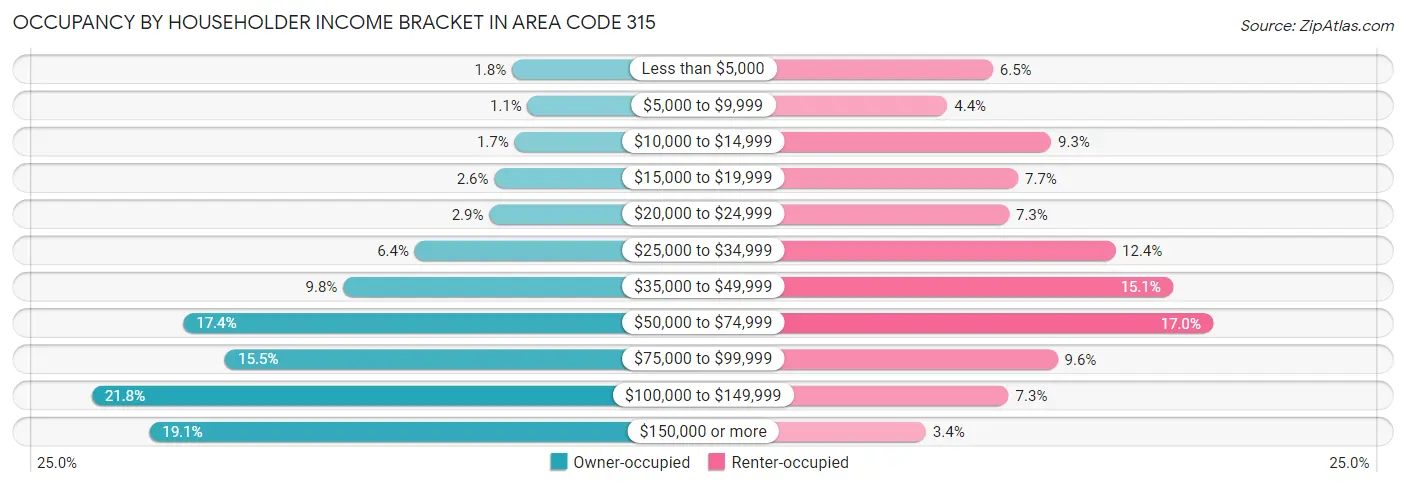
| Income Bracket | Owner-occupied | Renter-occupied |
| Less than $5,000 | 7,113 (1.8%) | 11,857 (6.5%) |
| $5,000 to $9,999 | 4,182 (1.1%) | 7,919 (4.4%) |
| $10,000 to $14,999 | 6,641 (1.7%) | 16,874 (9.3%) |
| $15,000 to $19,999 | 10,483 (2.6%) | 14,027 (7.7%) |
| $20,000 to $24,999 | 11,419 (2.9%) | 13,236 (7.3%) |
| $25,000 to $34,999 | 25,589 (6.4%) | 22,394 (12.4%) |
| $35,000 to $49,999 | 39,146 (9.8%) | 27,352 (15.1%) |
| $50,000 to $74,999 | 69,456 (17.4%) | 30,819 (17.0%) |
| $75,000 to $99,999 | 61,523 (15.4%) | 17,419 (9.6%) |
| $100,000 to $149,999 | 86,827 (21.8%) | 13,200 (7.3%) |
| $150,000 or more | 75,925 (19.1%) | 6,066 (3.4%) |
| Total | 398,304 (100.0%) | 181,163 (100.0%) |
Monthly Housing Cost Tiers in Area Code 315
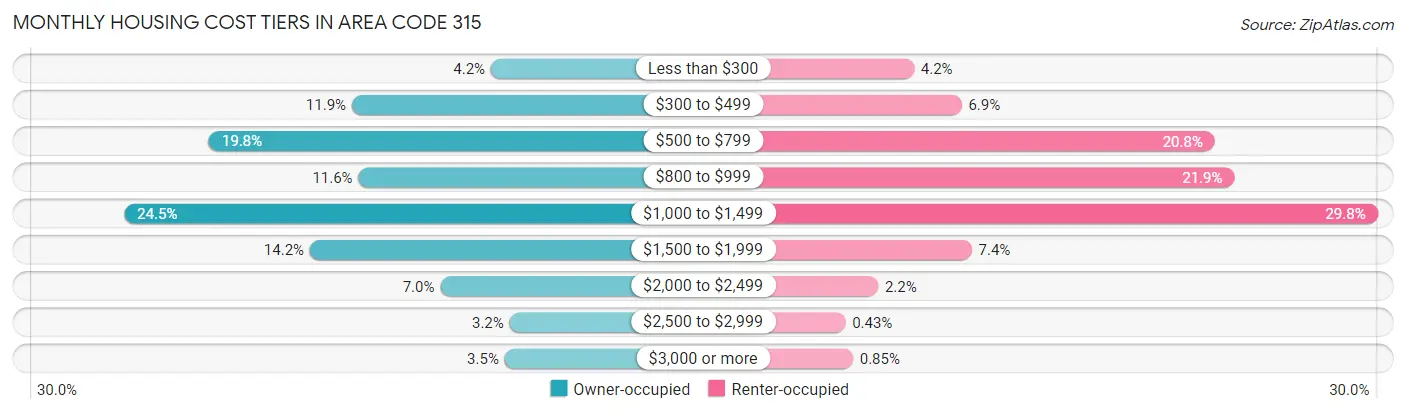
| Monthly Cost | Owner-occupied | Renter-occupied |
| Less than $300 | 16,870 (4.2%) | 7,650 (4.2%) |
| $300 to $499 | 47,472 (11.9%) | 12,402 (6.9%) |
| $500 to $799 | 78,925 (19.8%) | 37,761 (20.8%) |
| $800 to $999 | 46,058 (11.6%) | 39,707 (21.9%) |
| $1,000 to $1,499 | 97,580 (24.5%) | 54,043 (29.8%) |
| $1,500 to $1,999 | 56,731 (14.2%) | 13,422 (7.4%) |
| $2,000 to $2,499 | 28,021 (7.0%) | 4,051 (2.2%) |
| $2,500 to $2,999 | 12,770 (3.2%) | 784 (0.4%) |
| $3,000 or more | 13,877 (3.5%) | 1,544 (0.9%) |
| Total | 398,304 (100.0%) | 181,163 (100.0%) |
Physical Housing Characteristics in Area Code 315
Housing Structures in Area Code 315
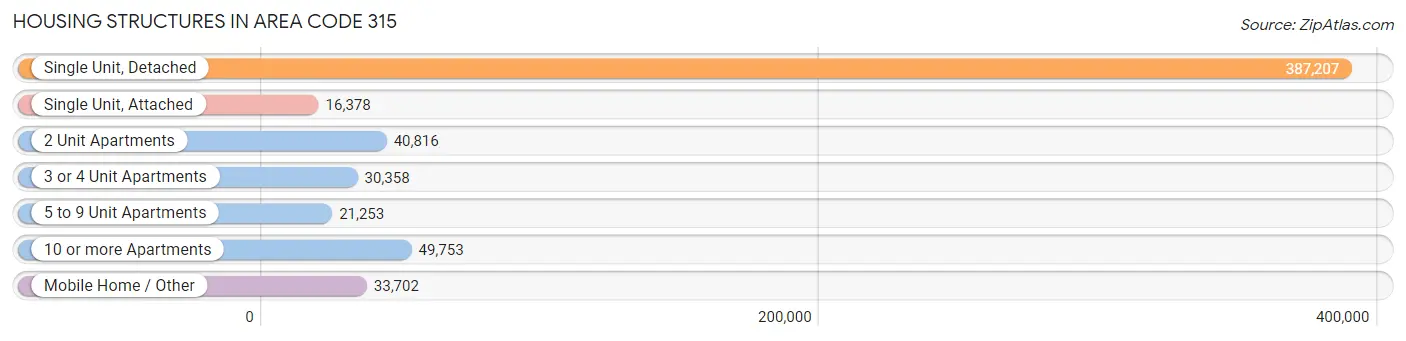
| Structure Type | # Housing Units | % Housing Units |
| Single Unit, Detached | 387,207 | 66.8% |
| Single Unit, Attached | 16,378 | 2.8% |
| 2 Unit Apartments | 40,816 | 7.0% |
| 3 or 4 Unit Apartments | 30,358 | 5.2% |
| 5 to 9 Unit Apartments | 21,253 | 3.7% |
| 10 or more Apartments | 49,753 | 8.6% |
| Mobile Home / Other | 33,702 | 5.8% |
| Total | 579,467 | 100.0% |
Housing Structures by Occupancy in Area Code 315
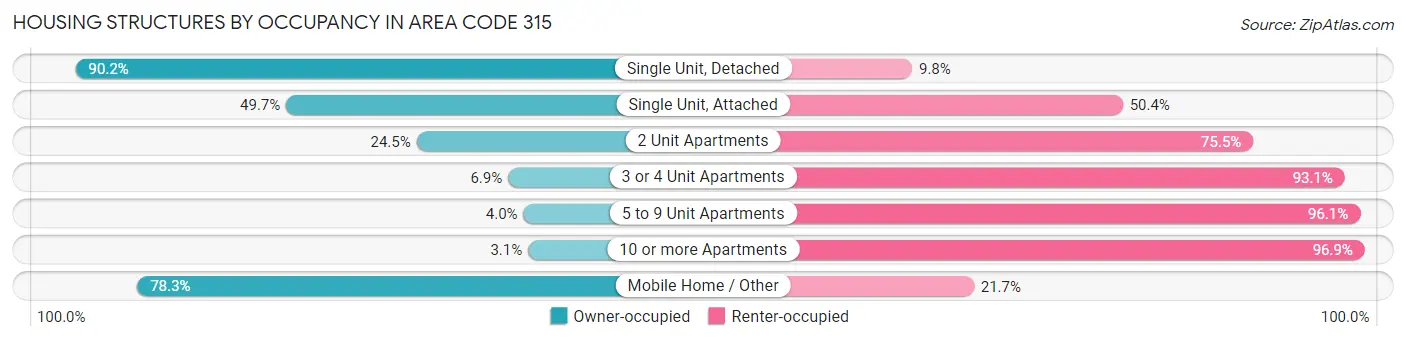
| Structure Type | Owner-occupied | Renter-occupied |
| Single Unit, Detached | 349,308 (90.2%) | 37,899 (9.8%) |
| Single Unit, Attached | 8,131 (49.6%) | 8,247 (50.3%) |
| 2 Unit Apartments | 10,011 (24.5%) | 30,805 (75.5%) |
| 3 or 4 Unit Apartments | 2,098 (6.9%) | 28,260 (93.1%) |
| 5 to 9 Unit Apartments | 840 (4.0%) | 20,413 (96.1%) |
| 10 or more Apartments | 1,524 (3.1%) | 48,229 (96.9%) |
| Mobile Home / Other | 26,392 (78.3%) | 7,310 (21.7%) |
| Total | 398,304 (68.7%) | 181,163 (31.3%) |
Housing Structures by Number of Rooms in Area Code 315
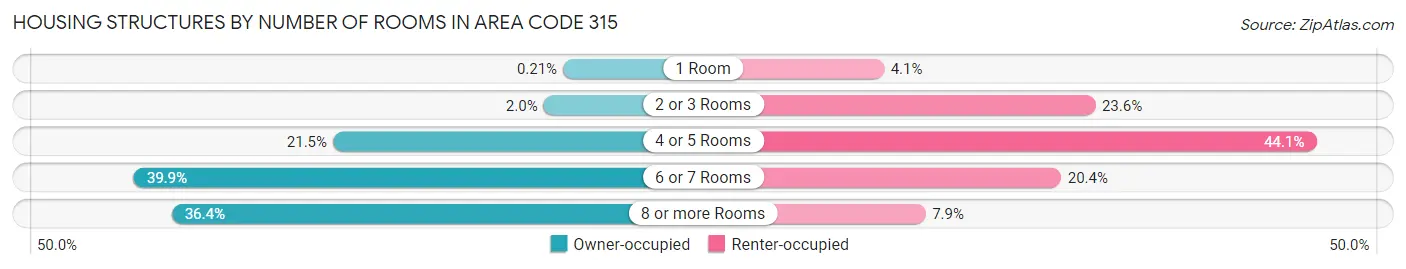
| Number of Rooms | Owner-occupied | Renter-occupied |
| 1 Room | 850 (0.2%) | 7,332 (4.1%) |
| 2 or 3 Rooms | 7,991 (2.0%) | 42,731 (23.6%) |
| 4 or 5 Rooms | 85,583 (21.5%) | 79,794 (44.1%) |
| 6 or 7 Rooms | 158,927 (39.9%) | 37,005 (20.4%) |
| 8 or more Rooms | 144,953 (36.4%) | 14,301 (7.9%) |
| Total | 398,304 (100.0%) | 181,163 (100.0%) |
Housing Structure by Heating Type in Area Code 315
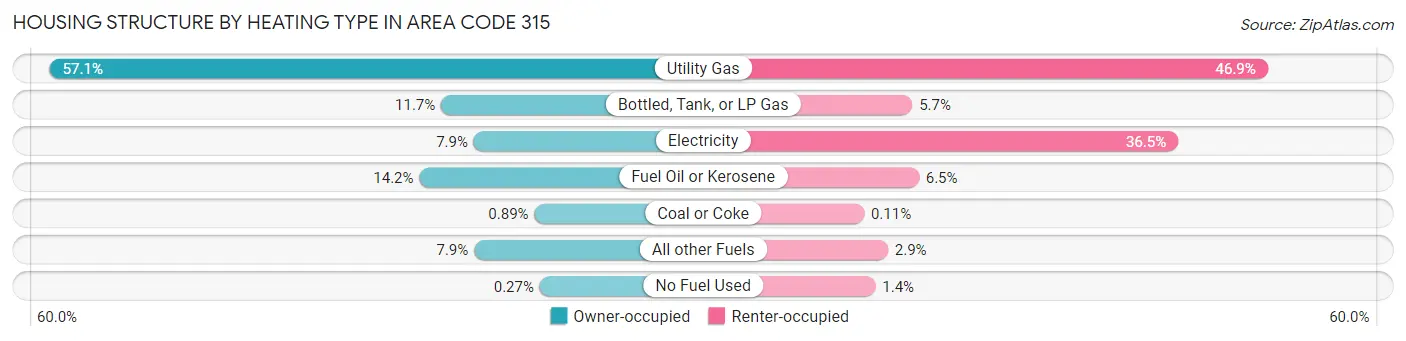
| Heating Type | Owner-occupied | Renter-occupied |
| Utility Gas | 227,387 (57.1%) | 84,971 (46.9%) |
| Bottled, Tank, or LP Gas | 46,660 (11.7%) | 10,324 (5.7%) |
| Electricity | 31,565 (7.9%) | 66,165 (36.5%) |
| Fuel Oil or Kerosene | 56,685 (14.2%) | 11,695 (6.5%) |
| Coal or Coke | 3,548 (0.9%) | 201 (0.1%) |
| All other Fuels | 31,380 (7.9%) | 5,216 (2.9%) |
| No Fuel Used | 1,079 (0.3%) | 2,591 (1.4%) |
| Total | 398,304 (100.0%) | 181,163 (100.0%) |
Household Vehicle Usage in Area Code 315
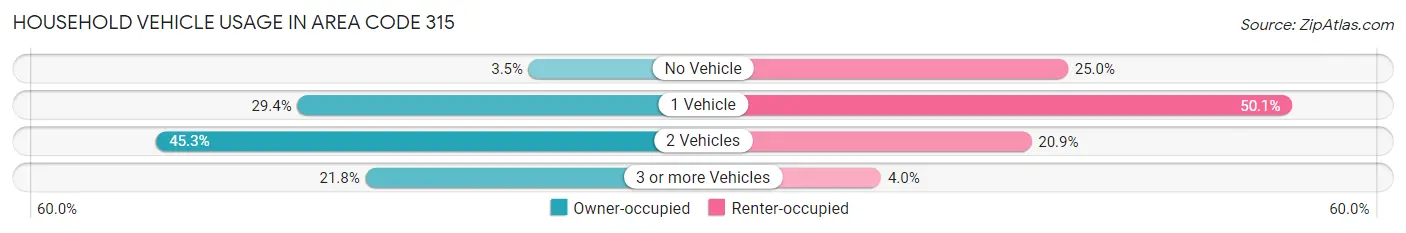
| Vehicles per Household | Owner-occupied | Renter-occupied |
| No Vehicle | 13,991 (3.5%) | 45,239 (25.0%) |
| 1 Vehicle | 117,223 (29.4%) | 90,786 (50.1%) |
| 2 Vehicles | 180,232 (45.3%) | 37,828 (20.9%) |
| 3 or more Vehicles | 86,858 (21.8%) | 7,310 (4.0%) |
| Total | 398,304 (100.0%) | 181,163 (100.0%) |
Real Estate & Mortgages in Area Code 315
Real Estate and Mortgage Overview in Area Code 315
| Characteristic | Without Mortgage | With Mortgage |
| Housing Units | 172,377 | 225,927 |
| Median Property Value | $36,943,000 | $43,483,500 |
| Median Household Income | $16,431,931 | $53,110 |
| Monthly Housing Costs | $159,387 | $13,435 |
| Real Estate Taxes | $762,042 | $6,677 |
Property Value by Mortgage Status in Area Code 315
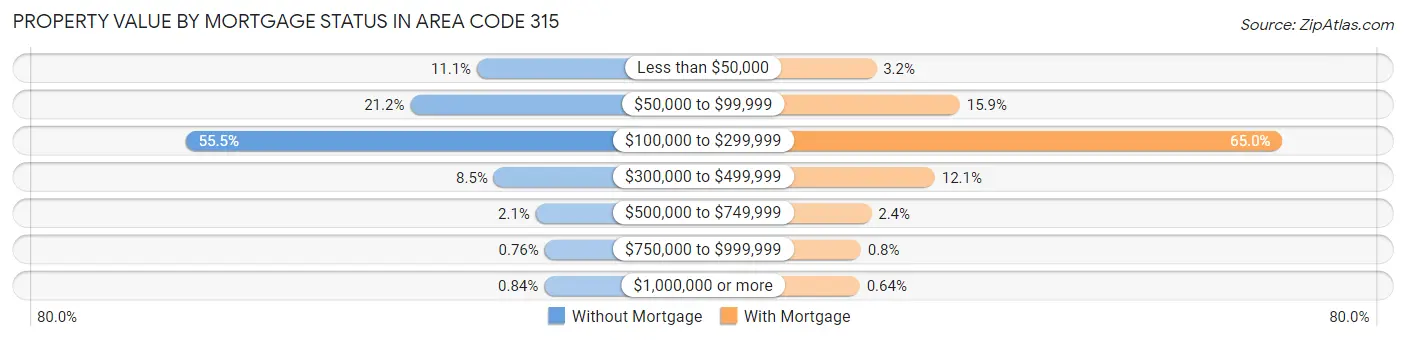
| Property Value | Without Mortgage | With Mortgage |
| Less than $50,000 | 19,082 (11.1%) | 7,119 (3.2%) |
| $50,000 to $99,999 | 36,618 (21.2%) | 35,900 (15.9%) |
| $100,000 to $299,999 | 95,607 (55.5%) | 146,951 (65.0%) |
| $300,000 to $499,999 | 14,666 (8.5%) | 27,288 (12.1%) |
| $500,000 to $749,999 | 3,647 (2.1%) | 5,425 (2.4%) |
| $750,000 to $999,999 | 1,303 (0.8%) | 1,808 (0.8%) |
| $1,000,000 or more | 1,454 (0.8%) | 1,436 (0.6%) |
| Total | 172,377 (100.0%) | 225,927 (100.0%) |
Household Income by Mortgage Status in Area Code 315
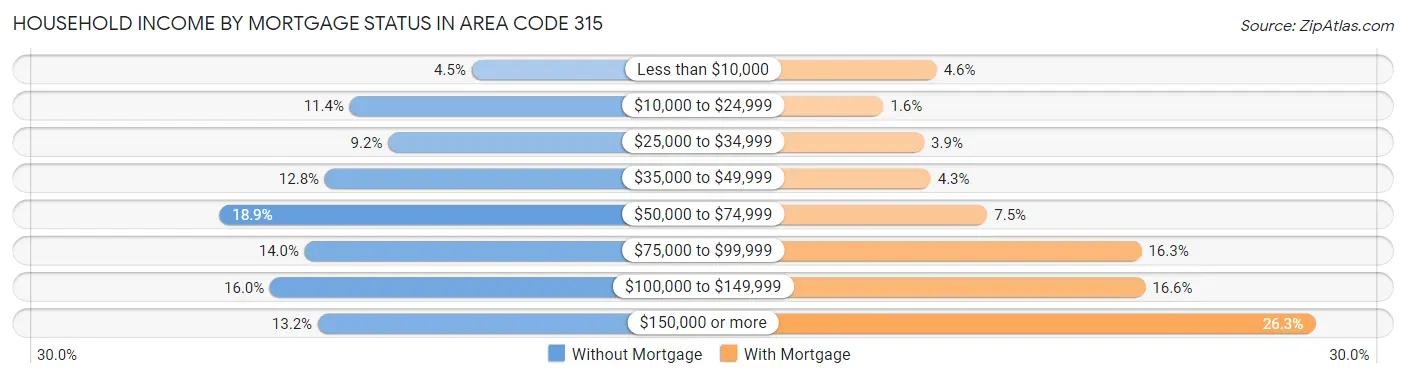
| Household Income | Without Mortgage | With Mortgage |
| Less than $10,000 | 7,669 (4.4%) | 10,479 (4.6%) |
| $10,000 to $24,999 | 19,693 (11.4%) | 3,626 (1.6%) |
| $25,000 to $34,999 | 15,885 (9.2%) | 8,850 (3.9%) |
| $35,000 to $49,999 | 22,140 (12.8%) | 9,704 (4.3%) |
| $50,000 to $74,999 | 32,536 (18.9%) | 17,006 (7.5%) |
| $75,000 to $99,999 | 24,117 (14.0%) | 36,920 (16.3%) |
| $100,000 to $149,999 | 27,522 (16.0%) | 37,406 (16.6%) |
| $150,000 or more | 22,815 (13.2%) | 59,305 (26.3%) |
| Total | 172,377 (100.0%) | 225,927 (100.0%) |
Property Value to Household Income Ratio in Area Code 315
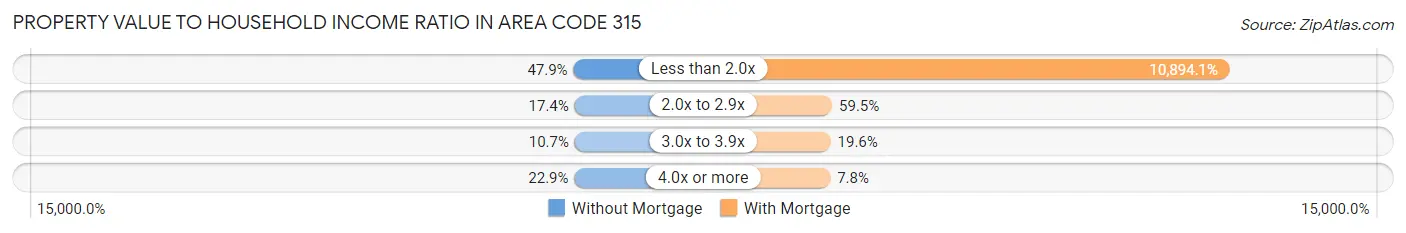
| Value-to-Income Ratio | Without Mortgage | With Mortgage |
| Less than 2.0x | 82,605 (47.9%) | 24,612,806 (10,894.1%) |
| 2.0x to 2.9x | 30,028 (17.4%) | 134,454 (59.5%) |
| 3.0x to 3.9x | 18,376 (10.7%) | 44,192 (19.6%) |
| 4.0x or more | 39,449 (22.9%) | 17,721 (7.8%) |
| Total | 172,377 (100.0%) | 225,927 (100.0%) |
Real Estate Taxes by Mortgage Status in Area Code 315
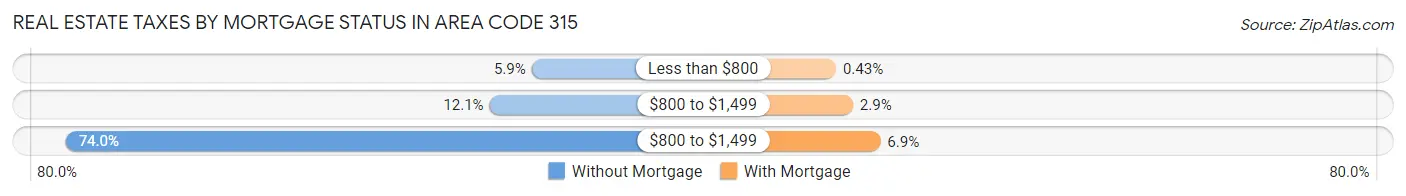
| Property Taxes | Without Mortgage | With Mortgage |
| Less than $800 | 10,199 (5.9%) | 977 (0.4%) |
| $800 to $1,499 | 20,828 (12.1%) | 6,549 (2.9%) |
| $800 to $1,499 | 127,536 (74.0%) | 15,636 (6.9%) |
| Total | 172,377 (100.0%) | 225,927 (100.0%) |
Health & Disability in Area Code 315
Health Insurance Coverage by Age in Area Code 315
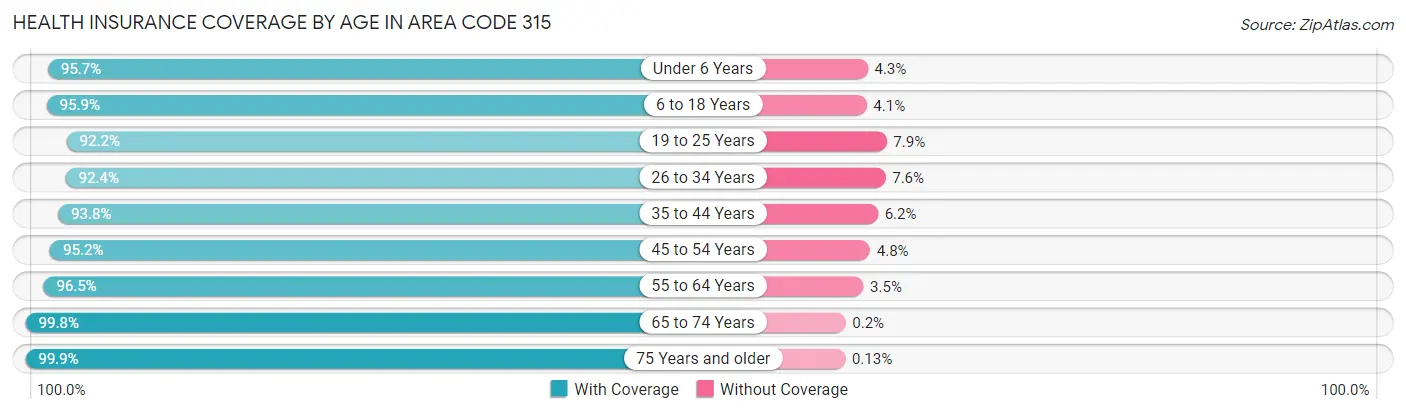
| Age Bracket | With Coverage | Without Coverage |
| Under 6 Years | 91,849 (95.7%) | 4,153 (4.3%) |
| 6 to 18 Years | 221,209 (95.9%) | 9,509 (4.1%) |
| 19 to 25 Years | 127,453 (92.1%) | 10,863 (7.9%) |
| 26 to 34 Years | 144,118 (92.4%) | 11,926 (7.6%) |
| 35 to 44 Years | 150,339 (93.8%) | 9,980 (6.2%) |
| 45 to 54 Years | 162,099 (95.2%) | 8,126 (4.8%) |
| 55 to 64 Years | 196,895 (96.5%) | 7,174 (3.5%) |
| 65 to 74 Years | 151,740 (99.8%) | 310 (0.2%) |
| 75 Years and older | 104,380 (99.9%) | 141 (0.1%) |
| Total | 1,350,082 (95.6%) | 62,182 (4.4%) |
Health Insurance Coverage by Citizenship Status in Area Code 315
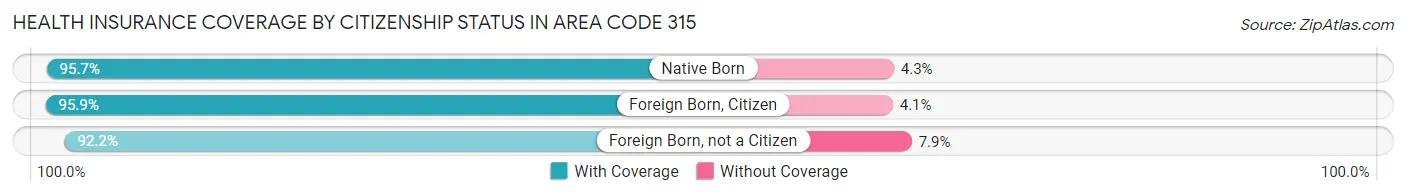
| Citizenship Status | With Coverage | Without Coverage |
| Native Born | 91,849 (95.7%) | 4,153 (4.3%) |
| Foreign Born, Citizen | 221,209 (95.9%) | 9,509 (4.1%) |
| Foreign Born, not a Citizen | 127,453 (92.1%) | 10,863 (7.9%) |
Health Insurance Coverage by Household Income in Area Code 315
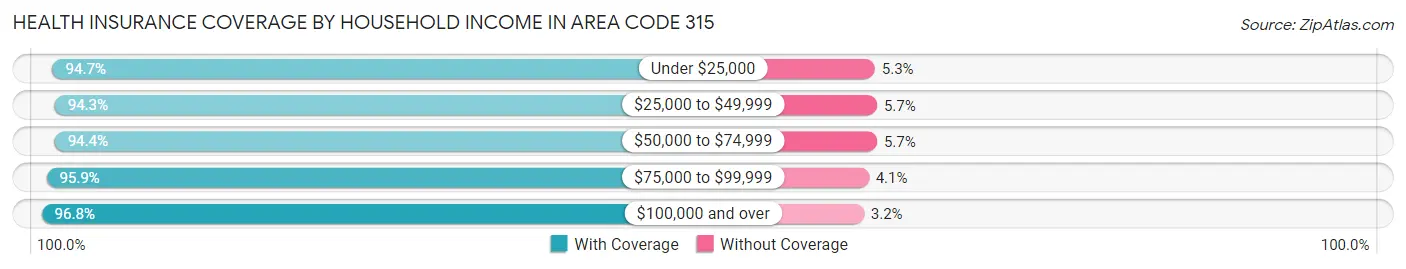
| Household Income | With Coverage | Without Coverage |
| Under $25,000 | 162,904 (94.7%) | 9,041 (5.3%) |
| $25,000 to $49,999 | 211,752 (94.3%) | 12,706 (5.7%) |
| $50,000 to $74,999 | 212,812 (94.4%) | 12,732 (5.7%) |
| $75,000 to $99,999 | 189,757 (95.9%) | 8,107 (4.1%) |
| $100,000 and over | 528,242 (96.8%) | 17,457 (3.2%) |
Public vs Private Health Insurance Coverage by Age in Area Code 315
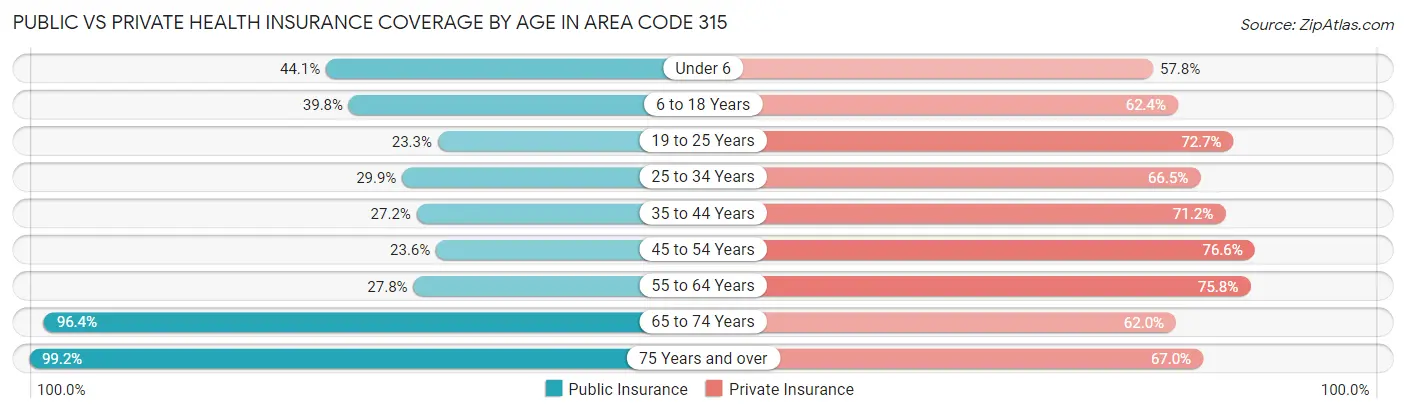
| Age Bracket | Public Insurance | Private Insurance |
| Under 6 | 42,292 (44.1%) | 55,460 (57.8%) |
| 6 to 18 Years | 91,844 (39.8%) | 143,878 (62.4%) |
| 19 to 25 Years | 32,240 (23.3%) | 100,535 (72.7%) |
| 25 to 34 Years | 46,679 (29.9%) | 103,784 (66.5%) |
| 35 to 44 Years | 43,651 (27.2%) | 114,073 (71.2%) |
| 45 to 54 Years | 40,212 (23.6%) | 130,432 (76.6%) |
| 55 to 64 Years | 56,800 (27.8%) | 154,625 (75.8%) |
| 65 to 74 Years | 146,616 (96.4%) | 94,285 (62.0%) |
| 75 Years and over | 103,677 (99.2%) | 70,063 (67.0%) |
| Total | 604,011 (42.8%) | 967,135 (68.5%) |
Disability Status by Sex by Age in Area Code 315
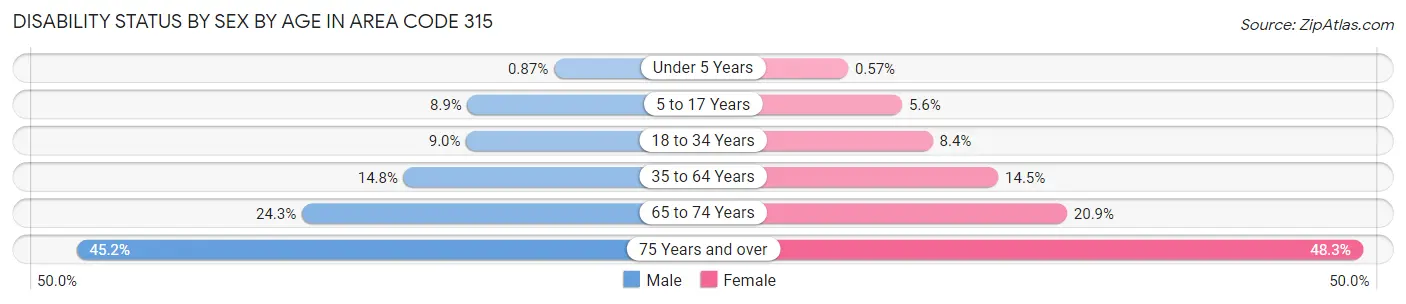
| Age Bracket | Male | Female |
| Under 5 Years | 356 (0.9%) | 224 (0.6%) |
| 5 to 17 Years | 10,177 (8.9%) | 6,077 (5.6%) |
| 18 to 34 Years | 14,289 (9.0%) | 13,420 (8.4%) |
| 35 to 64 Years | 39,259 (14.8%) | 39,123 (14.5%) |
| 65 to 74 Years | 17,878 (24.2%) | 16,367 (20.9%) |
| 75 Years and over | 19,728 (45.2%) | 29,406 (48.3%) |
Disability Class by Sex by Age in Area Code 315
Disability Class: Hearing Difficulty
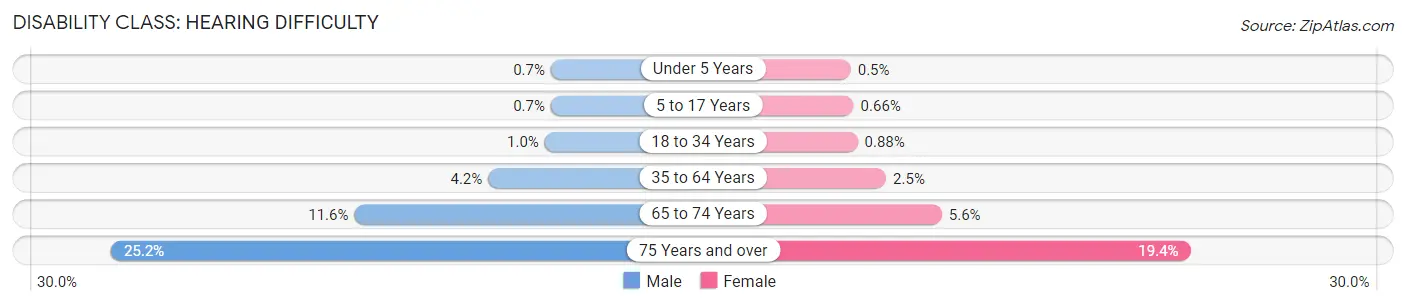
| Age Bracket | Male | Female |
| Under 5 Years | 287 (0.7%) | 197 (0.5%) |
| 5 to 17 Years | 801 (0.7%) | 722 (0.7%) |
| 18 to 34 Years | 1,651 (1.0%) | 1,399 (0.9%) |
| 35 to 64 Years | 11,099 (4.2%) | 6,664 (2.5%) |
| 65 to 74 Years | 8,583 (11.6%) | 4,364 (5.6%) |
| 75 Years and over | 11,003 (25.2%) | 11,809 (19.4%) |
Disability Class: Vision Difficulty
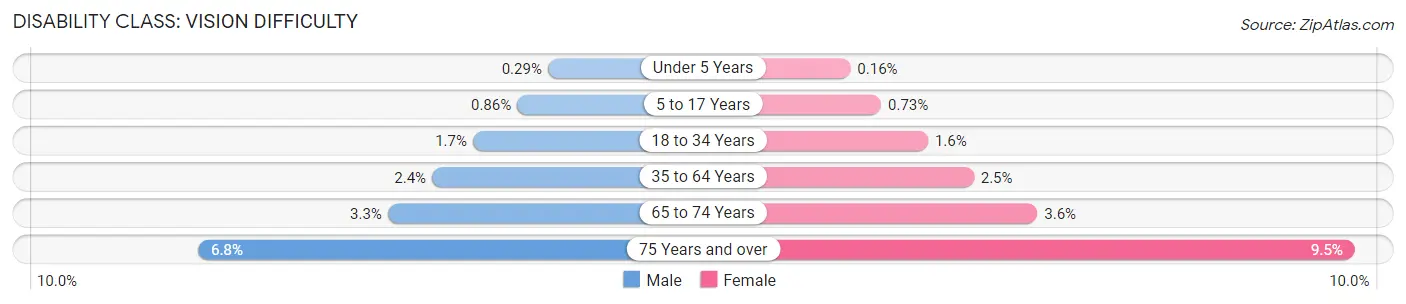
| Age Bracket | Male | Female |
| Under 5 Years | 119 (0.3%) | 63 (0.2%) |
| 5 to 17 Years | 981 (0.9%) | 791 (0.7%) |
| 18 to 34 Years | 2,672 (1.7%) | 2,552 (1.6%) |
| 35 to 64 Years | 6,455 (2.4%) | 6,608 (2.5%) |
| 65 to 74 Years | 2,402 (3.3%) | 2,842 (3.6%) |
| 75 Years and over | 2,959 (6.8%) | 5,790 (9.5%) |
Disability Class: Cognitive Difficulty
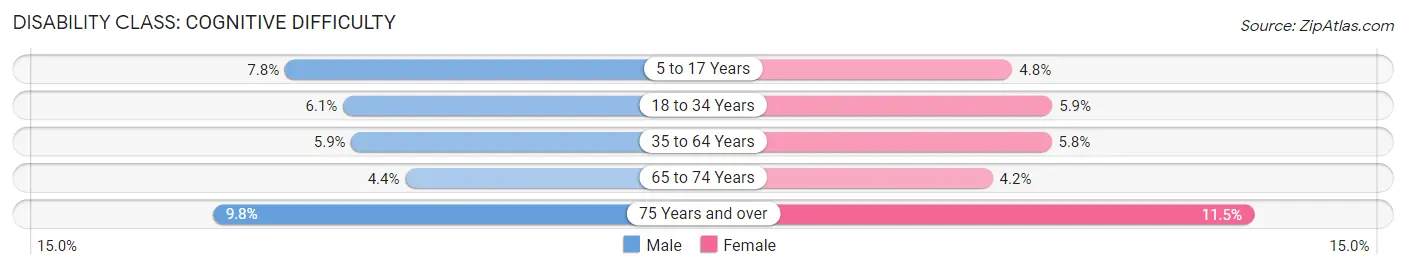
| Age Bracket | Male | Female |
| 5 to 17 Years | 8,886 (7.7%) | 5,166 (4.8%) |
| 18 to 34 Years | 9,736 (6.1%) | 9,320 (5.9%) |
| 35 to 64 Years | 15,648 (5.9%) | 15,752 (5.8%) |
| 65 to 74 Years | 3,243 (4.4%) | 3,290 (4.2%) |
| 75 Years and over | 4,262 (9.8%) | 6,977 (11.5%) |
Disability Class: Ambulatory Difficulty
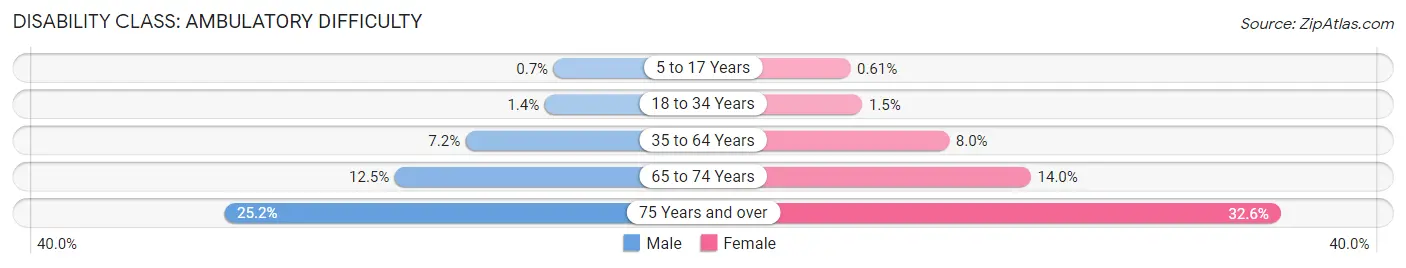
| Age Bracket | Male | Female |
| 5 to 17 Years | 800 (0.7%) | 663 (0.6%) |
| 18 to 34 Years | 2,161 (1.4%) | 2,385 (1.5%) |
| 35 to 64 Years | 19,159 (7.2%) | 21,441 (8.0%) |
| 65 to 74 Years | 9,208 (12.5%) | 10,980 (14.0%) |
| 75 Years and over | 10,996 (25.2%) | 19,823 (32.6%) |
Disability Class: Self-Care Difficulty
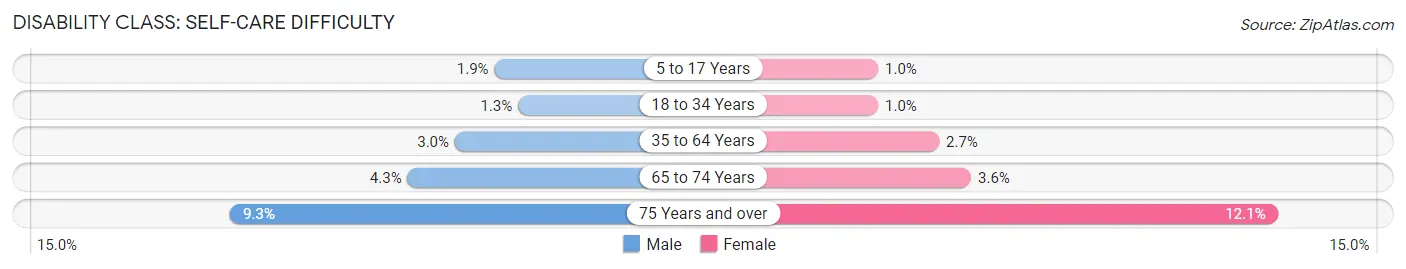
| Age Bracket | Male | Female |
| 5 to 17 Years | 2,200 (1.9%) | 1,099 (1.0%) |
| 18 to 34 Years | 2,008 (1.3%) | 1,601 (1.0%) |
| 35 to 64 Years | 7,998 (3.0%) | 7,301 (2.7%) |
| 65 to 74 Years | 3,203 (4.3%) | 2,819 (3.6%) |
| 75 Years and over | 4,051 (9.3%) | 7,382 (12.1%) |
Technology Access in Area Code 315
Computing Device Access in Area Code 315
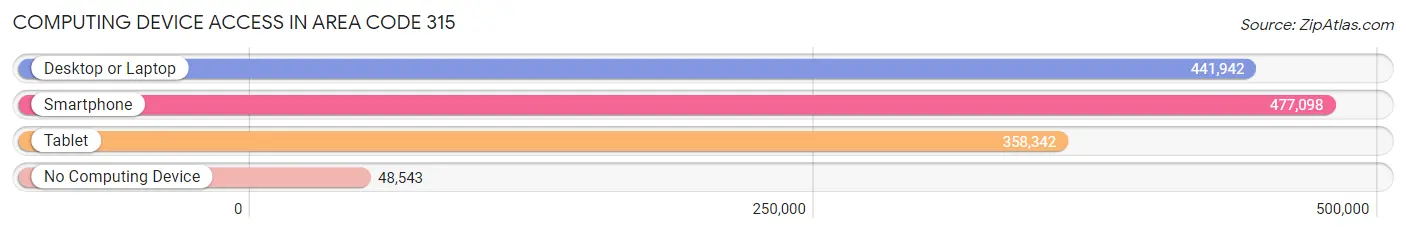
| Device Type | # Households | % Households |
| Desktop or Laptop | 441,942 | 76.3% |
| Smartphone | 477,098 | 82.3% |
| Tablet | 358,342 | 61.8% |
| No Computing Device | 48,543 | 8.4% |
| Total | 579,467 | 100.0% |
Internet Access in Area Code 315
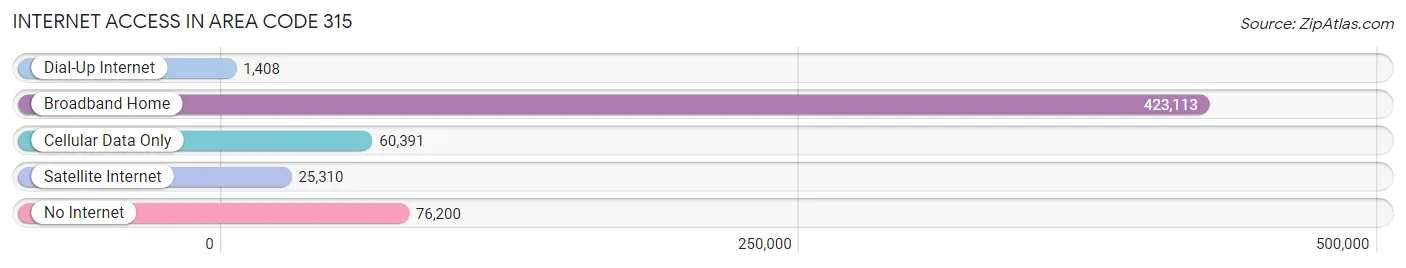
| Internet Type | # Households | % Households |
| Dial-Up Internet | 1,408 | 0.2% |
| Broadband Home | 423,113 | 73.0% |
| Cellular Data Only | 60,391 | 10.4% |
| Satellite Internet | 25,310 | 4.4% |
| No Internet | 76,200 | 13.2% |
| Total | 579,467 | 100.0% |
Area Code 315 Summary
Geography
Area code 315 is located in the state of New York and covers the Syracuse metropolitan area, as well as parts of Oswego, Oneida, and Madison counties. It is bordered by area codes 518 to the east, 607 to the west, and 716 to the south.
Social
Area code 315 is home to a diverse population of people from all walks of life. The area is known for its vibrant arts and culture scene, with a variety of museums, galleries, and performance venues. The area is also home to a number of universities and colleges, including Syracuse University, SUNY Oswego, and Le Moyne College.
Economics
Area code 315 is home to a number of major employers, including Syracuse University, SUNY Upstate Medical University, and Lockheed Martin. The area is also home to a number of small businesses, including restaurants, retail stores, and service providers.
Demographics
Area code 315 is home to a population of over 1.2 million people. The area is predominantly white, with a large African American population. The median household income is around $50,000, and the median age is around 38 years old.
Common Questions
What is Per Capita Income in Area Code 315?
Per Capita income in Area Code 315 is $35,265.
What is the Median Family Income in Area Code 315?
Median Family Income in Area Code 315 is $84,209.
What is the Median Household income in Area Code 315?
Median Household Income in Area Code 315 is $70,631.
What is Income or Wage Gap in Area Code 315?
Income or Wage Gap in Area Code 315 is 28.7%.
Women in Area Code 315 earn 71.3 cents for every dollar earned by a man.
What is Family Income Deficit in Area Code 315?
Family Income Deficit in Area Code 315 is $11,119.
Families that are below poverty line in Area Code 315 earn $11,119 less on average than the poverty threshold level.
What is Inequality or Gini Index in Area Code 315?
Inequality or Gini Index in Area Code 315 is 114.34.
What is the Total Population of Area Code 315?
Total Population of Area Code 315 is 1,446,659.
What is the Total Male Population of Area Code 315?
Total Male Population of Area Code 315 is 723,319.
What is the Total Female Population of Area Code 315?
Total Female Population of Area Code 315 is 723,340.
What is the Ratio of Males per 100 Females in Area Code 315?
There are 100.00 Males per 100 Females in Area Code 315.
What is the Ratio of Females per 100 Males in Area Code 315?
There are 100.00 Females per 100 Males in Area Code 315.
What is the Median Population Age in Area Code 315?
Median Population Age in Area Code 315 is 42.7 Years.
What is the Average Family Size in Area Code 315
Average Family Size in Area Code 315 is 3.0 People.
What is the Average Household Size in Area Code 315
Average Household Size in Area Code 315 is 2.5 People.
How Large is the Labor Force in Area Code 315?
There are 700,493 People in the Labor Forcein in Area Code 315.
What is the Percentage of People in the Labor Force in Area Code 315?
59.5% of People are in the Labor Force in Area Code 315.
What is the Unemployment Rate in Area Code 315?
Unemployment Rate in Area Code 315 is 6.4%.