Westchester County, NY Map & Demographics
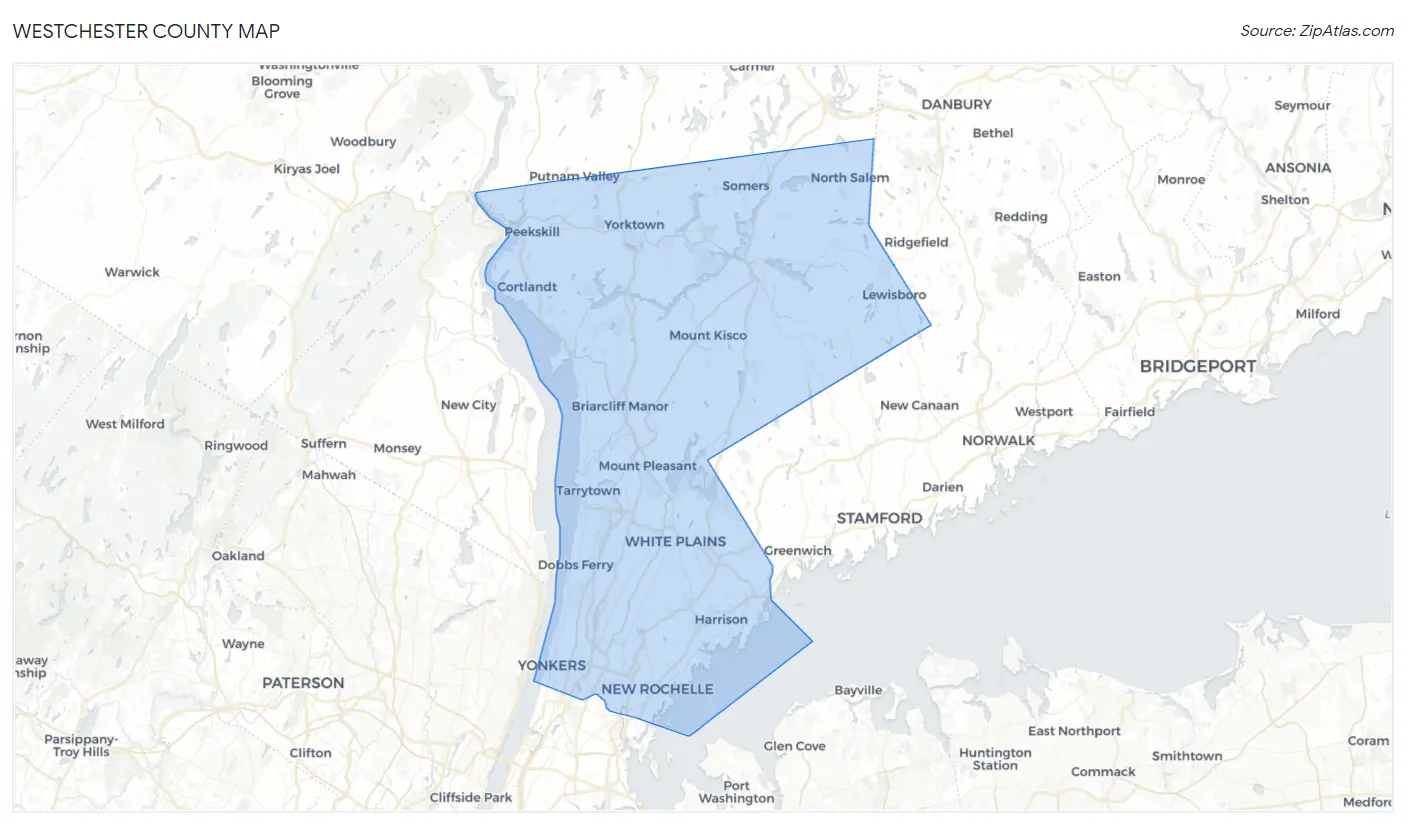
Westchester County Map
Westchester County Overview
$67,776
PER CAPITA INCOME
$147,091
AVG FAMILY INCOME
$114,651
AVG HOUSEHOLD INCOME
26.9%
WAGE / INCOME GAP [ % ]
73.1¢/ $1
WAGE / INCOME GAP [ $ ]
$11,252
FAMILY INCOME DEFICIT
0.53
INEQUALITY / GINI INDEX
997,904
TOTAL POPULATION
487,019
MALE POPULATION
510,885
FEMALE POPULATION
95.33
MALES / 100 FEMALES
104.90
FEMALES / 100 MALES
41.3
MEDIAN AGE
3.2
AVG FAMILY SIZE
2.6
AVG HOUSEHOLD SIZE
528,020
LABOR FORCE [ PEOPLE ]
65.2%
PERCENT IN LABOR FORCE
6.0%
UNEMPLOYMENT RATE
Income in Westchester County
Income Overview in Westchester County
Per Capita Income in Westchester County is $67,776, while median incomes of families and households are $147,091 and $114,651 respectively.
| Characteristic | Number | Measure |
| Per Capita Income | 997,904 | $67,776 |
| Median Family Income | 251,224 | $147,091 |
| Mean Family Income | 251,224 | $220,660 |
| Median Household Income | 367,740 | $114,651 |
| Mean Household Income | 367,740 | $180,479 |
| Income Deficit | 251,224 | $11,252 |
| Wage / Income Gap (%) | 997,904 | 26.86% |
| Wage / Income Gap ($) | 997,904 | 73.14¢ per $1 |
| Gini / Inequality Index | 997,904 | 0.53 |
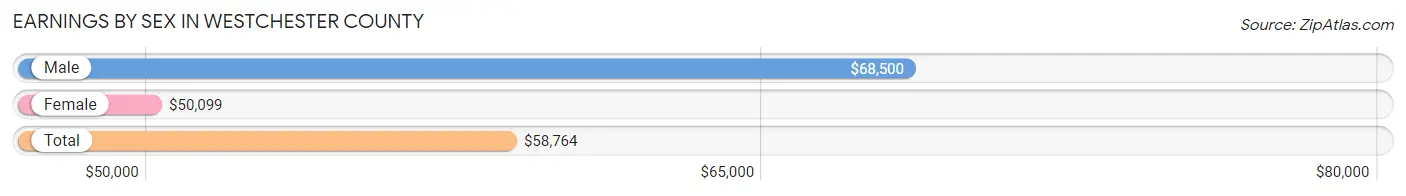
Earnings by Sex in Westchester County
Average Earnings in Westchester County are $58,764, $68,500 for men and $50,099 for women, a difference of 26.9%.
| Sex | Number | Average Earnings |
| Male | 286,823 (52.2%) | $68,500 |
| Female | 262,737 (47.8%) | $50,099 |
| Total | 549,560 (100.0%) | $58,764 |
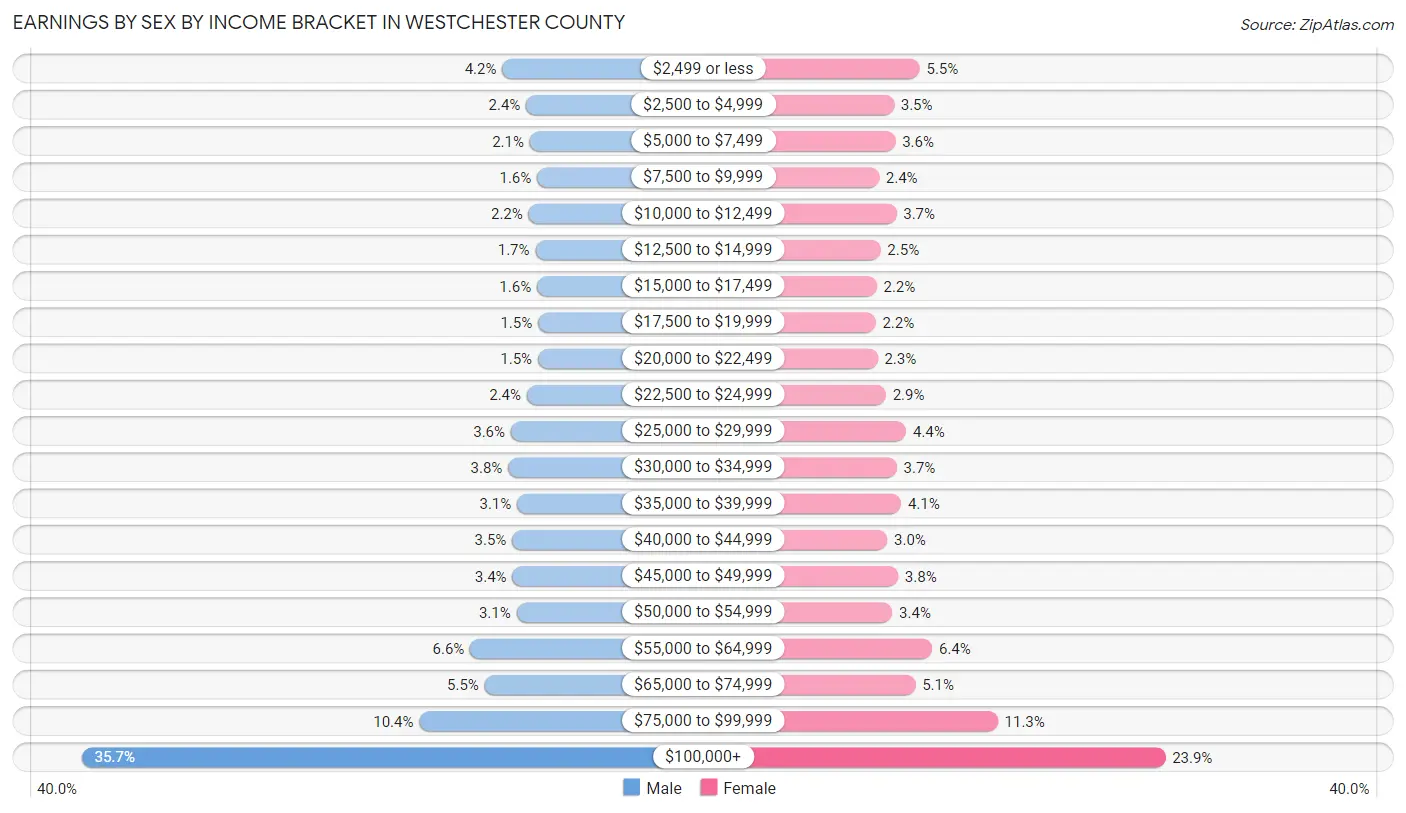
Earnings by Sex by Income Bracket in Westchester County
The most common earnings brackets in Westchester County are $100,000+ for men (102,472 | 35.7%) and $100,000+ for women (62,695 | 23.9%).
| Income | Male | Female |
| $2,499 or less | 12,041 (4.2%) | 14,315 (5.4%) |
| $2,500 to $4,999 | 6,903 (2.4%) | 9,253 (3.5%) |
| $5,000 to $7,499 | 6,132 (2.1%) | 9,531 (3.6%) |
| $7,500 to $9,999 | 4,547 (1.6%) | 6,299 (2.4%) |
| $10,000 to $12,499 | 6,383 (2.2%) | 9,755 (3.7%) |
| $12,500 to $14,999 | 4,926 (1.7%) | 6,633 (2.5%) |
| $15,000 to $17,499 | 4,583 (1.6%) | 5,859 (2.2%) |
| $17,500 to $19,999 | 4,348 (1.5%) | 5,653 (2.1%) |
| $20,000 to $22,499 | 4,395 (1.5%) | 6,040 (2.3%) |
| $22,500 to $24,999 | 6,777 (2.4%) | 7,676 (2.9%) |
| $25,000 to $29,999 | 10,201 (3.6%) | 11,671 (4.4%) |
| $30,000 to $34,999 | 10,780 (3.8%) | 9,812 (3.7%) |
| $35,000 to $39,999 | 8,860 (3.1%) | 10,675 (4.1%) |
| $40,000 to $44,999 | 9,933 (3.5%) | 7,940 (3.0%) |
| $45,000 to $49,999 | 9,859 (3.4%) | 10,055 (3.8%) |
| $50,000 to $54,999 | 8,990 (3.1%) | 8,928 (3.4%) |
| $55,000 to $64,999 | 18,960 (6.6%) | 16,776 (6.4%) |
| $65,000 to $74,999 | 15,841 (5.5%) | 13,487 (5.1%) |
| $75,000 to $99,999 | 29,892 (10.4%) | 29,684 (11.3%) |
| $100,000+ | 102,472 (35.7%) | 62,695 (23.9%) |
| Total | 286,823 (100.0%) | 262,737 (100.0%) |
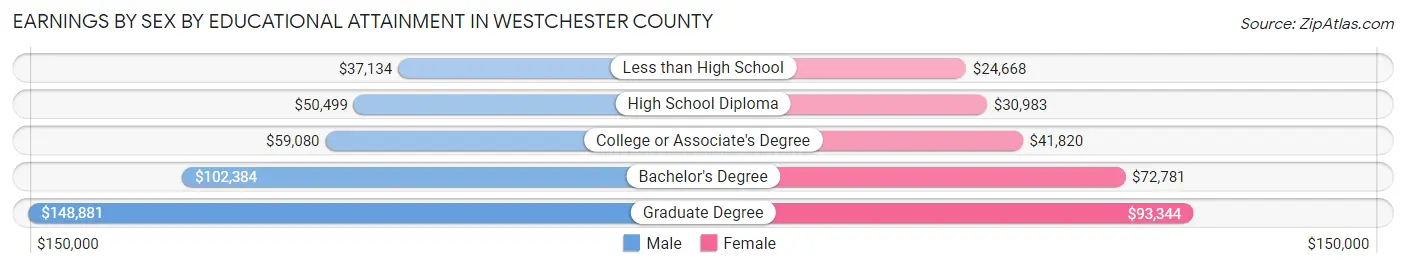
Earnings by Sex by Educational Attainment in Westchester County
Average earnings in Westchester County are $78,562 for men and $58,664 for women, a difference of 25.3%. Men with an educational attainment of graduate degree enjoy the highest average annual earnings of $148,881, while those with less than high school education earn the least with $37,134. Women with an educational attainment of graduate degree earn the most with the average annual earnings of $93,344, while those with less than high school education have the smallest earnings of $24,668.
| Educational Attainment | Male Income | Female Income |
| Less than High School | $37,134 | $24,668 |
| High School Diploma | $50,499 | $30,983 |
| College or Associate's Degree | $59,080 | $41,820 |
| Bachelor's Degree | $102,384 | $72,781 |
| Graduate Degree | $148,881 | $93,344 |
| Total | $78,562 | $58,664 |
Family Income in Westchester County
Family Income Brackets in Westchester County
According to the Westchester County family income data, there are 92,199 families falling into the $200,000+ income range, which is the most common income bracket and makes up 36.7% of all families. Conversely, the $10,000 to $14,999 income bracket is the least frequent group with only 3,015 families (1.2%) belonging to this category.
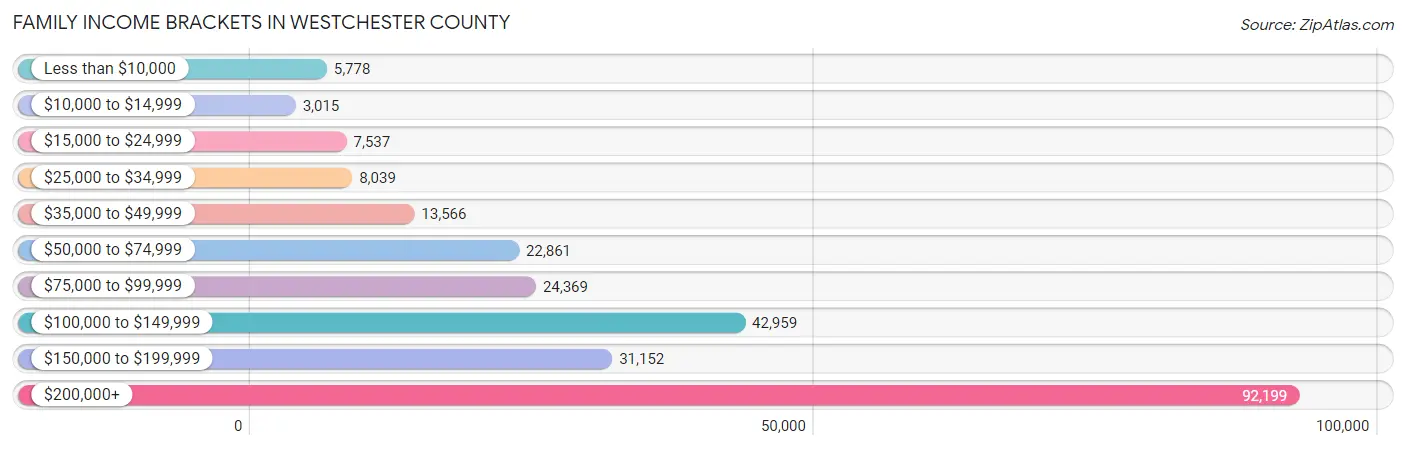
| Income Bracket | # Families | % Families |
| Less than $10,000 | 5,778 | 2.3% |
| $10,000 to $14,999 | 3,015 | 1.2% |
| $15,000 to $24,999 | 7,537 | 3.0% |
| $25,000 to $34,999 | 8,039 | 3.2% |
| $35,000 to $49,999 | 13,566 | 5.4% |
| $50,000 to $74,999 | 22,861 | 9.1% |
| $75,000 to $99,999 | 24,369 | 9.7% |
| $100,000 to $149,999 | 42,959 | 17.1% |
| $150,000 to $199,999 | 31,152 | 12.4% |
| $200,000+ | 92,199 | 36.7% |
Family Income by Famaliy Size in Westchester County
7+ person families (2,986 | 1.2%) account for the highest median family income in Westchester County with $201,813 per family, while 2-person families (100,024 | 39.8%) have the highest median income of $58,503 per family member.
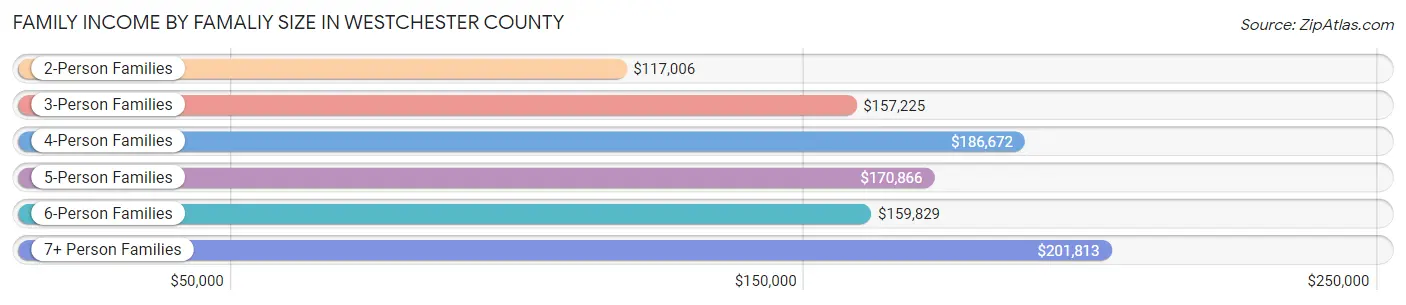
| Income Bracket | # Families | Median Income |
| 2-Person Families | 100,024 (39.8%) | $117,006 |
| 3-Person Families | 61,890 (24.6%) | $157,225 |
| 4-Person Families | 55,733 (22.2%) | $186,672 |
| 5-Person Families | 22,831 (9.1%) | $170,866 |
| 6-Person Families | 7,760 (3.1%) | $159,829 |
| 7+ Person Families | 2,986 (1.2%) | $201,813 |
| Total | 251,224 (100.0%) | $147,091 |
Family Income by Number of Earners in Westchester County
The median family income in Westchester County is $147,091, with families comprising 3+ earners (38,493) having the highest median family income of $205,557, while families with no earners (27,418) have the lowest median family income of $60,442, accounting for 15.3% and 10.9% of families, respectively.
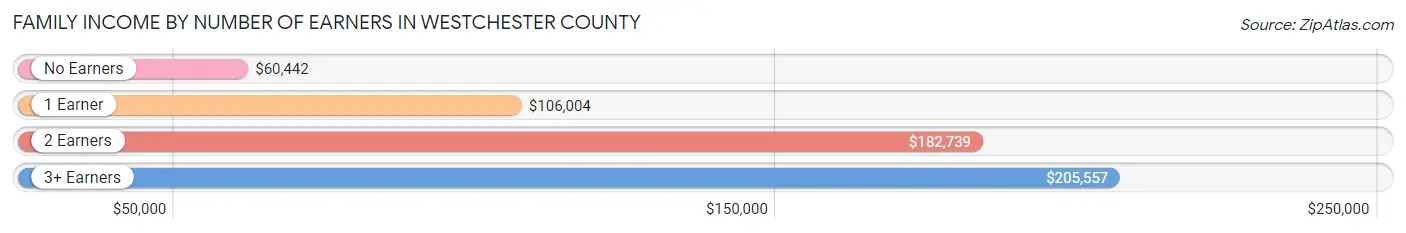
| Number of Earners | # Families | Median Income |
| No Earners | 27,418 (10.9%) | $60,442 |
| 1 Earner | 71,508 (28.5%) | $106,004 |
| 2 Earners | 113,805 (45.3%) | $182,739 |
| 3+ Earners | 38,493 (15.3%) | $205,557 |
| Total | 251,224 (100.0%) | $147,091 |
Household Income in Westchester County
Household Income Brackets in Westchester County
With 103,335 households falling in the category, the $200,000+ income range is the most frequent in Westchester County, accounting for 28.1% of all households. In contrast, only 10,664 households (2.9%) fall into the $10,000 to $14,999 income bracket, making it the least populous group.
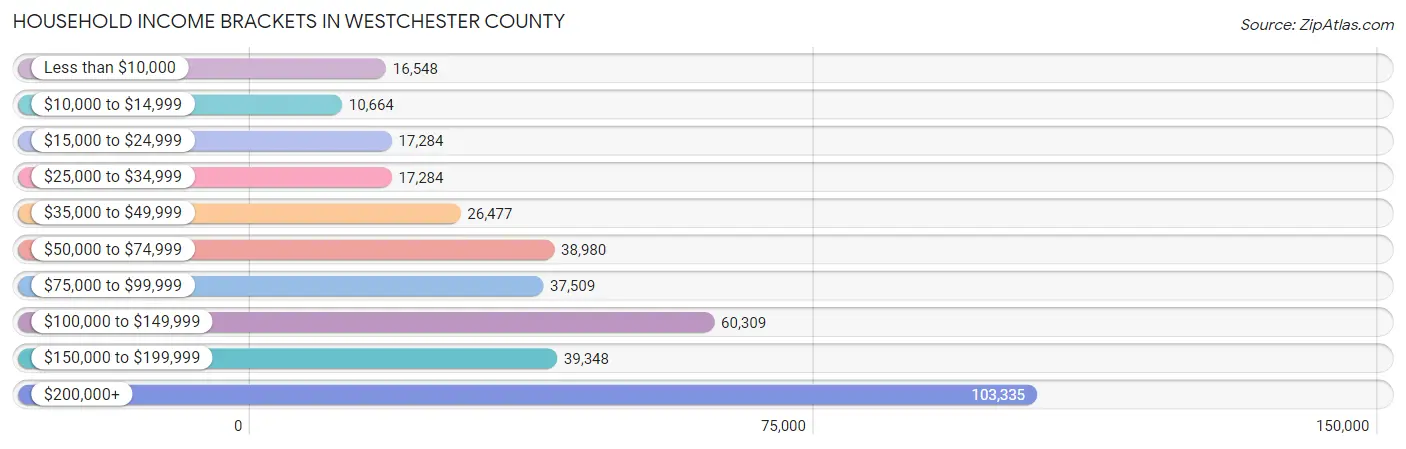
| Income Bracket | # Households | % Households |
| Less than $10,000 | 16,548 | 4.5% |
| $10,000 to $14,999 | 10,664 | 2.9% |
| $15,000 to $24,999 | 17,284 | 4.7% |
| $25,000 to $34,999 | 17,284 | 4.7% |
| $35,000 to $49,999 | 26,477 | 7.2% |
| $50,000 to $74,999 | 38,980 | 10.6% |
| $75,000 to $99,999 | 37,509 | 10.2% |
| $100,000 to $149,999 | 60,309 | 16.4% |
| $150,000 to $199,999 | 39,348 | 10.7% |
| $200,000+ | 103,335 | 28.1% |
Household Income by Householder Age in Westchester County
The median household income in Westchester County is $114,651, with the highest median household income of $139,620 found in the 45 to 64 years age bracket for the primary householder. A total of 154,035 households (41.9%) fall into this category. Meanwhile, the 15 to 24 years age bracket for the primary householder has the lowest median household income of $53,059, with 4,655 households (1.3%) in this group.
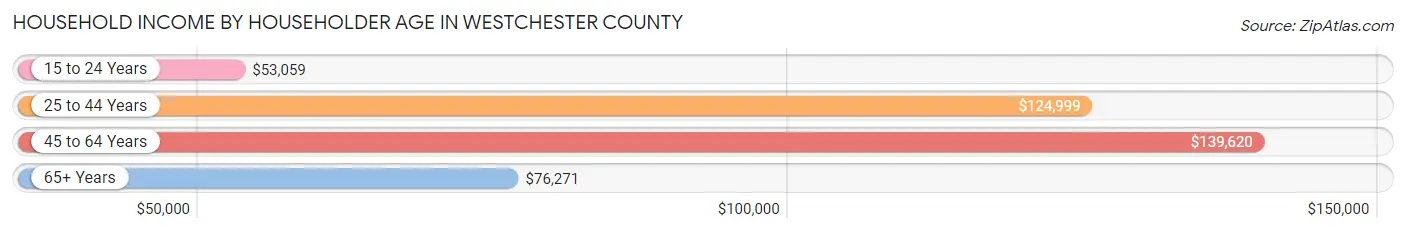
| Income Bracket | # Households | Median Income |
| 15 to 24 Years | 4,655 (1.3%) | $53,059 |
| 25 to 44 Years | 101,277 (27.5%) | $124,999 |
| 45 to 64 Years | 154,035 (41.9%) | $139,620 |
| 65+ Years | 107,773 (29.3%) | $76,271 |
| Total | 367,740 (100.0%) | $114,651 |
Poverty in Westchester County
Income Below Poverty by Sex and Age in Westchester County
With 7.3% poverty level for males and 9.7% for females among the residents of Westchester County, 15 year old males and 18 to 24 year old females are the most vulnerable to poverty, with 886 males (13.6%) and 5,533 females (14.0%) in their respective age groups living below the poverty level.
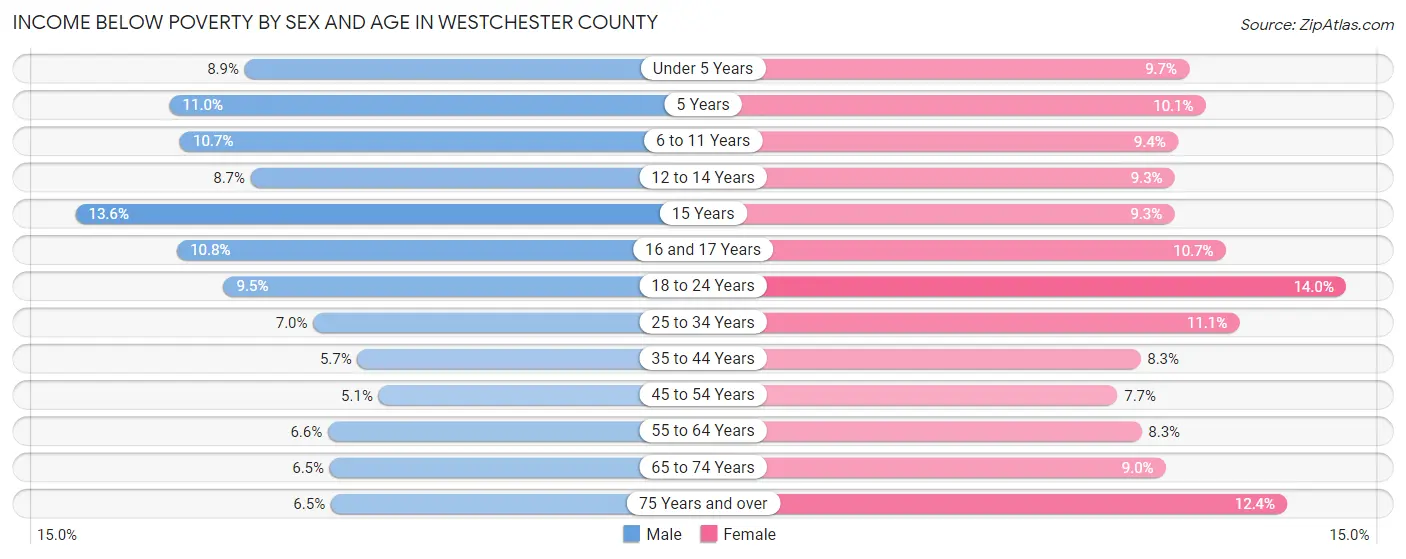
| Age Bracket | Male | Female |
| Under 5 Years | 2,386 (8.9%) | 2,448 (9.7%) |
| 5 Years | 559 (11.0%) | 510 (10.1%) |
| 6 to 11 Years | 3,972 (10.7%) | 3,174 (9.3%) |
| 12 to 14 Years | 1,701 (8.7%) | 1,738 (9.3%) |
| 15 Years | 886 (13.6%) | 635 (9.2%) |
| 16 and 17 Years | 1,479 (10.7%) | 1,324 (10.7%) |
| 18 to 24 Years | 3,805 (9.5%) | 5,533 (14.0%) |
| 25 to 34 Years | 3,978 (7.0%) | 6,189 (11.1%) |
| 35 to 44 Years | 3,651 (5.7%) | 5,378 (8.3%) |
| 45 to 54 Years | 3,497 (5.1%) | 5,412 (7.7%) |
| 55 to 64 Years | 4,348 (6.6%) | 5,846 (8.3%) |
| 65 to 74 Years | 2,842 (6.5%) | 4,583 (9.0%) |
| 75 Years and over | 1,877 (6.5%) | 5,661 (12.4%) |
| Total | 34,981 (7.3%) | 48,431 (9.7%) |
Income Above Poverty by Sex and Age in Westchester County
According to the poverty statistics in Westchester County, males aged 45 to 54 years and females aged 45 to 54 years are the age groups that are most secure financially, with 94.9% of males and 92.3% of females in these age groups living above the poverty line.
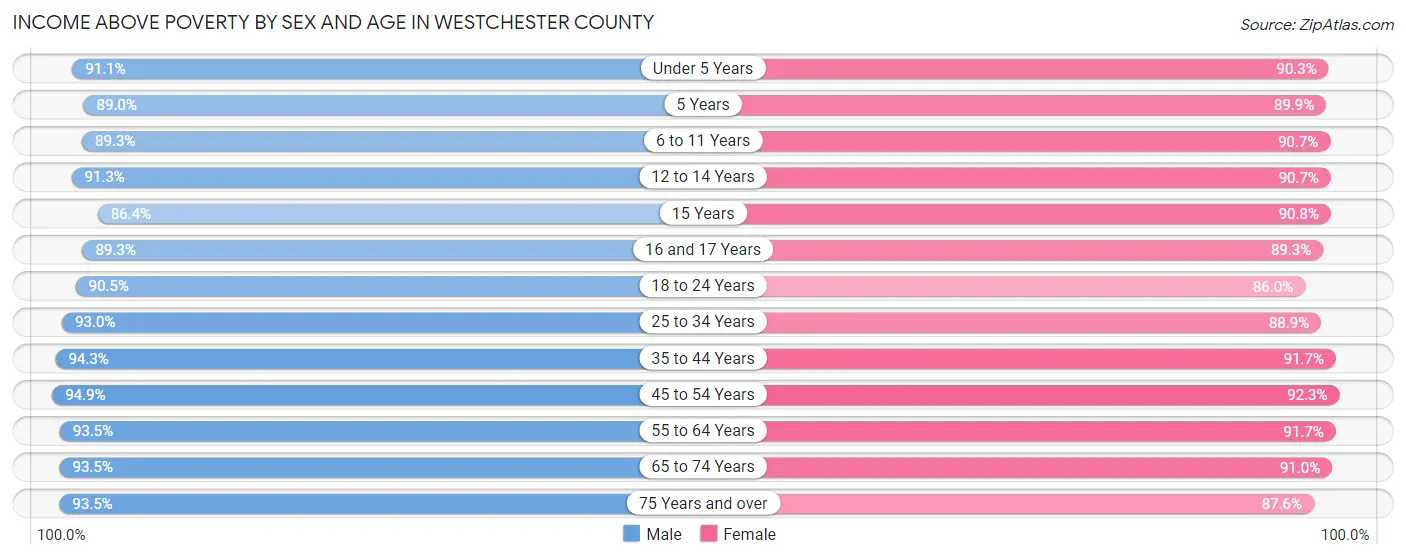
| Age Bracket | Male | Female |
| Under 5 Years | 24,527 (91.1%) | 22,895 (90.3%) |
| 5 Years | 4,541 (89.0%) | 4,531 (89.9%) |
| 6 to 11 Years | 33,264 (89.3%) | 30,780 (90.6%) |
| 12 to 14 Years | 17,850 (91.3%) | 17,034 (90.7%) |
| 15 Years | 5,638 (86.4%) | 6,229 (90.7%) |
| 16 and 17 Years | 12,285 (89.2%) | 11,072 (89.3%) |
| 18 to 24 Years | 36,436 (90.5%) | 33,914 (86.0%) |
| 25 to 34 Years | 53,145 (93.0%) | 49,769 (88.9%) |
| 35 to 44 Years | 60,049 (94.3%) | 59,349 (91.7%) |
| 45 to 54 Years | 64,596 (94.9%) | 65,110 (92.3%) |
| 55 to 64 Years | 62,012 (93.4%) | 64,287 (91.7%) |
| 65 to 74 Years | 40,878 (93.5%) | 46,292 (91.0%) |
| 75 Years and over | 27,133 (93.5%) | 40,042 (87.6%) |
| Total | 442,354 (92.7%) | 451,304 (90.3%) |
Income Below Poverty Among Married-Couple Families in Westchester County
The poverty statistics for married-couple families in Westchester County show that 2.9% or 5,416 of the total 189,542 families live below the poverty line. Families with 5 or more children have the highest poverty rate of 17.8%, comprising of 53 families. On the other hand, families with no children have the lowest poverty rate of 2.5%, which includes 2,498 families.
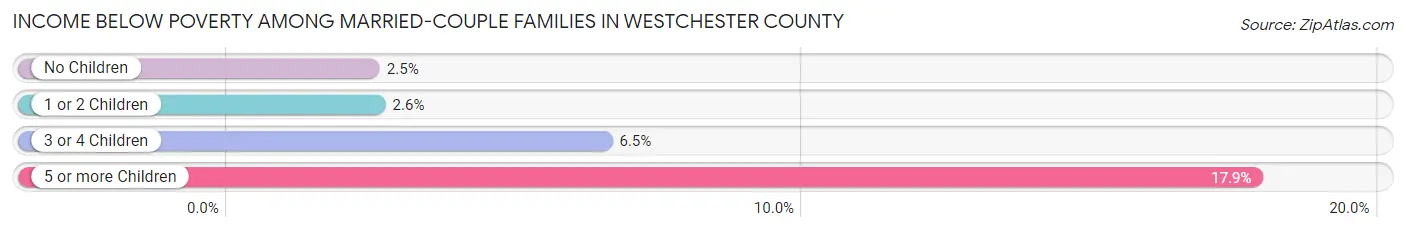
| Children | Above Poverty | Below Poverty |
| No Children | 98,699 (97.5%) | 2,498 (2.5%) |
| 1 or 2 Children | 70,971 (97.4%) | 1,874 (2.6%) |
| 3 or 4 Children | 14,212 (93.5%) | 991 (6.5%) |
| 5 or more Children | 244 (82.2%) | 53 (17.8%) |
| Total | 184,126 (97.1%) | 5,416 (2.9%) |
Income Below Poverty Among Single-Parent Households in Westchester County
According to the poverty data in Westchester County, 8.6% or 1,358 single-father households and 16.5% or 7,560 single-mother households are living below the poverty line. Among single-father households, those with 3 or 4 children have the highest poverty rate, with 106 households (22.3%) experiencing poverty. Likewise, among single-mother households, those with 3 or 4 children have the highest poverty rate, with 1,138 households (53.6%) falling below the poverty line.
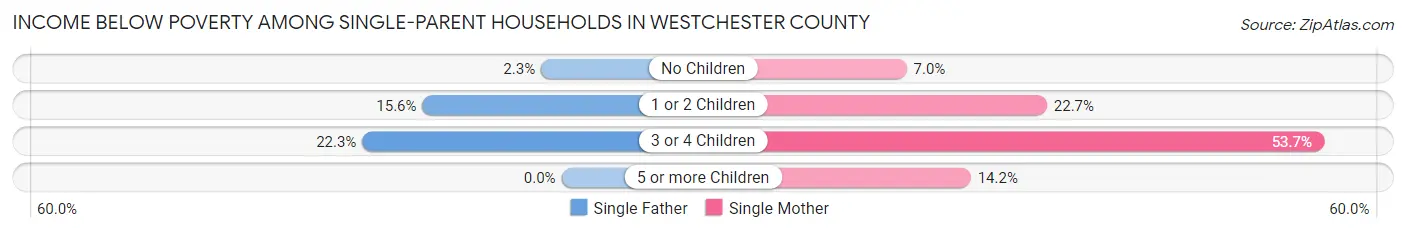
| Children | Single Father | Single Mother |
| No Children | 198 (2.3%) | 1,562 (7.0%) |
| 1 or 2 Children | 1,054 (15.5%) | 4,837 (22.7%) |
| 3 or 4 Children | 106 (22.3%) | 1,138 (53.6%) |
| 5 or more Children | 0 (0.0%) | 23 (14.2%) |
| Total | 1,358 (8.6%) | 7,560 (16.5%) |
Income Below Poverty Among Married-Couple vs Single-Parent Households in Westchester County
The poverty data for Westchester County shows that 5,416 of the married-couple family households (2.9%) and 8,918 of the single-parent households (14.5%) are living below the poverty level. Within the married-couple family households, those with 5 or more children have the highest poverty rate, with 53 households (17.8%) falling below the poverty line. Among the single-parent households, those with 3 or 4 children have the highest poverty rate, with 1,244 household (47.9%) living below poverty.
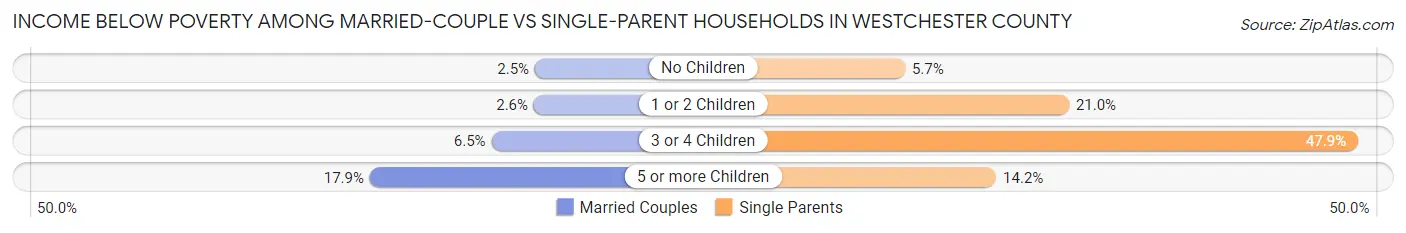
| Children | Married-Couple Families | Single-Parent Households |
| No Children | 2,498 (2.5%) | 1,760 (5.7%) |
| 1 or 2 Children | 1,874 (2.6%) | 5,891 (21.0%) |
| 3 or 4 Children | 991 (6.5%) | 1,244 (47.9%) |
| 5 or more Children | 53 (17.8%) | 23 (14.2%) |
| Total | 5,416 (2.9%) | 8,918 (14.5%) |
Race in Westchester County
The most populous races in Westchester County are White / Caucasian (571,908 | 57.3%), Hispanic or Latino (257,189 | 25.8%), and Black / African American (145,484 | 14.6%).
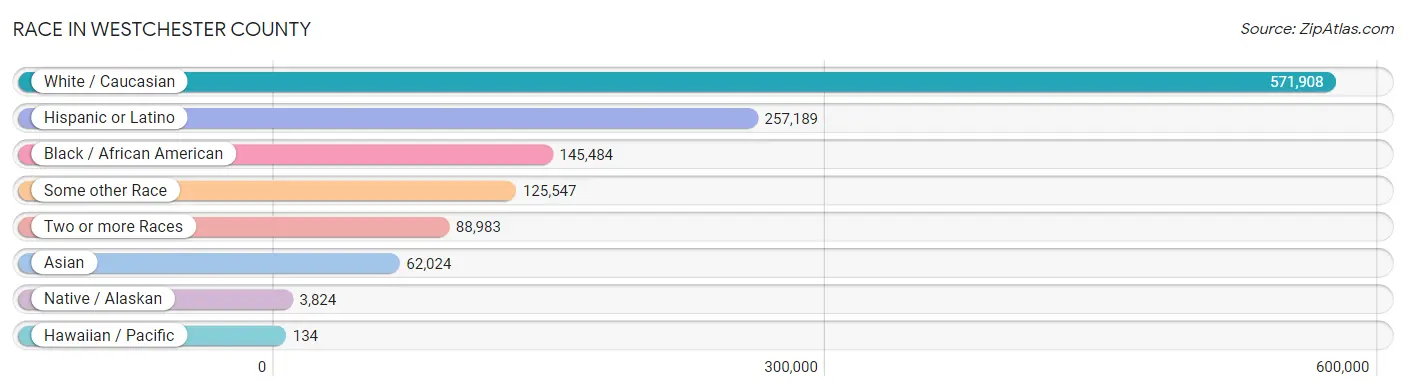
| Race | # Population | % Population |
| Asian | 62,024 | 6.2% |
| Black / African American | 145,484 | 14.6% |
| Hawaiian / Pacific | 134 | 0.0% |
| Hispanic or Latino | 257,189 | 25.8% |
| Native / Alaskan | 3,824 | 0.4% |
| White / Caucasian | 571,908 | 57.3% |
| Two or more Races | 88,983 | 8.9% |
| Some other Race | 125,547 | 12.6% |
| Total | 997,904 | 100.0% |
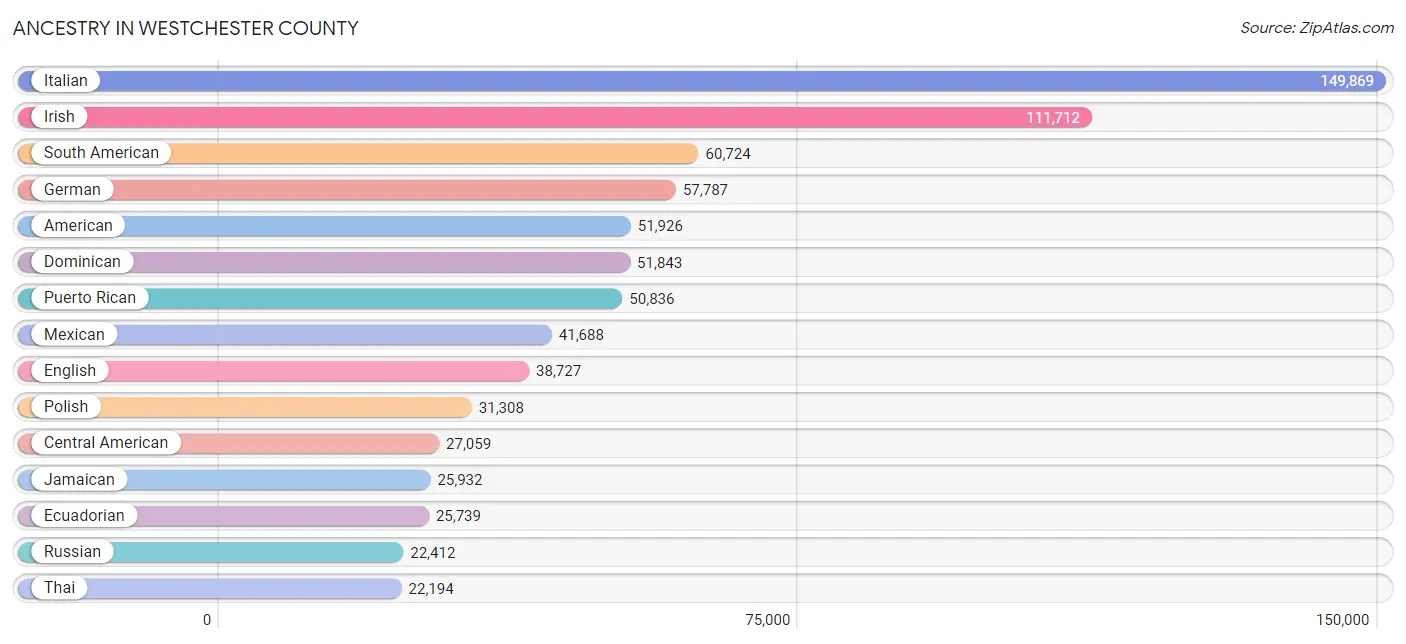
Ancestry in Westchester County
The most populous ancestries reported in Westchester County are Italian (149,869 | 15.0%), Irish (111,712 | 11.2%), South American (60,724 | 6.1%), German (57,787 | 5.8%), and American (51,926 | 5.2%), together accounting for 43.3% of all Westchester County residents.
| Ancestry | # Population | % Population |
| Afghan | 142 | 0.0% |
| African | 7,431 | 0.7% |
| Albanian | 7,491 | 0.7% |
| Alsatian | 79 | 0.0% |
| American | 51,926 | 5.2% |
| Apache | 141 | 0.0% |
| Arab | 8,965 | 0.9% |
| Argentinean | 2,631 | 0.3% |
| Armenian | 1,507 | 0.2% |
| Assyrian / Chaldean / Syriac | 270 | 0.0% |
| Australian | 581 | 0.1% |
| Austrian | 4,538 | 0.4% |
| Bahamian | 132 | 0.0% |
| Bangladeshi | 22 | 0.0% |
| Barbadian | 1,008 | 0.1% |
| Basque | 155 | 0.0% |
| Belgian | 653 | 0.1% |
| Belizean | 139 | 0.0% |
| Bermudan | 100 | 0.0% |
| Bhutanese | 6,802 | 0.7% |
| Blackfeet | 189 | 0.0% |
| Bolivian | 1,092 | 0.1% |
| Brazilian | 5,334 | 0.5% |
| British | 5,382 | 0.5% |
| British West Indian | 2,519 | 0.3% |
| Bulgarian | 623 | 0.1% |
| Burmese | 8,163 | 0.8% |
| Cajun | 11 | 0.0% |
| Canadian | 2,066 | 0.2% |
| Cape Verdean | 276 | 0.0% |
| Celtic | 128 | 0.0% |
| Central American | 27,059 | 2.7% |
| Central American Indian | 2,227 | 0.2% |
| Cherokee | 674 | 0.1% |
| Chickasaw | 33 | 0.0% |
| Chilean | 2,098 | 0.2% |
| Chippewa | 93 | 0.0% |
| Choctaw | 17 | 0.0% |
| Colombian | 14,519 | 1.5% |
| Costa Rican | 467 | 0.1% |
| Croatian | 1,792 | 0.2% |
| Cuban | 8,093 | 0.8% |
| Cypriot | 121 | 0.0% |
| Czech | 2,393 | 0.2% |
| Czechoslovakian | 641 | 0.1% |
| Danish | 1,341 | 0.1% |
| Delaware | 41 | 0.0% |
| Dominican | 51,843 | 5.2% |
| Dutch | 4,587 | 0.5% |
| Dutch West Indian | 73 | 0.0% |
| Eastern European | 14,161 | 1.4% |
| Ecuadorian | 25,739 | 2.6% |
| Egyptian | 1,125 | 0.1% |
| English | 38,727 | 3.9% |
| Estonian | 309 | 0.0% |
| Ethiopian | 1,037 | 0.1% |
| European | 14,132 | 1.4% |
| Filipino | 1,293 | 0.1% |
| Finnish | 744 | 0.1% |
| French | 11,031 | 1.1% |
| French American Indian | 70 | 0.0% |
| French Canadian | 2,418 | 0.2% |
| German | 57,787 | 5.8% |
| Ghanaian | 2,517 | 0.3% |
| Greek | 7,109 | 0.7% |
| Guamanian / Chamorro | 132 | 0.0% |
| Guatemalan | 14,327 | 1.4% |
| Guyanese | 2,009 | 0.2% |
| Haitian | 5,468 | 0.5% |
| Honduran | 3,497 | 0.4% |
| Hopi | 21 | 0.0% |
| Hungarian | 5,916 | 0.6% |
| Icelander | 44 | 0.0% |
| Indian (Asian) | 16,019 | 1.6% |
| Indonesian | 48 | 0.0% |
| Inupiat | 78 | 0.0% |
| Iranian | 1,291 | 0.1% |
| Iraqi | 54 | 0.0% |
| Irish | 111,712 | 11.2% |
| Iroquois | 525 | 0.1% |
| Israeli | 1,222 | 0.1% |
| Italian | 149,869 | 15.0% |
| Jamaican | 25,932 | 2.6% |
| Japanese | 151 | 0.0% |
| Jordanian | 1,548 | 0.2% |
| Kenyan | 397 | 0.0% |
| Korean | 10,690 | 1.1% |
| Laotian | 109 | 0.0% |
| Latvian | 256 | 0.0% |
| Lebanese | 1,847 | 0.2% |
| Liberian | 55 | 0.0% |
| Lithuanian | 2,031 | 0.2% |
| Lumbee | 7 | 0.0% |
| Macedonian | 753 | 0.1% |
| Malaysian | 21 | 0.0% |
| Maltese | 242 | 0.0% |
| Mexican | 41,688 | 4.2% |
| Mexican American Indian | 1,081 | 0.1% |
| Mongolian | 41 | 0.0% |
| Moroccan | 716 | 0.1% |
| Native Hawaiian | 176 | 0.0% |
| Navajo | 20 | 0.0% |
| New Zealander | 78 | 0.0% |
| Nicaraguan | 837 | 0.1% |
| Nigerian | 2,104 | 0.2% |
| Northern European | 1,031 | 0.1% |
| Norwegian | 4,384 | 0.4% |
| Okinawan | 214 | 0.0% |
| Pakistani | 997 | 0.1% |
| Palestinian | 478 | 0.1% |
| Panamanian | 2,265 | 0.2% |
| Paraguayan | 1,020 | 0.1% |
| Pennsylvania German | 76 | 0.0% |
| Peruvian | 10,448 | 1.1% |
| Polish | 31,308 | 3.1% |
| Portuguese | 8,634 | 0.9% |
| Potawatomi | 69 | 0.0% |
| Pueblo | 6 | 0.0% |
| Puerto Rican | 50,836 | 5.1% |
| Romanian | 3,408 | 0.3% |
| Russian | 22,412 | 2.2% |
| Salvadoran | 5,603 | 0.6% |
| Samoan | 125 | 0.0% |
| Scandinavian | 797 | 0.1% |
| Scotch-Irish | 2,862 | 0.3% |
| Scottish | 7,273 | 0.7% |
| Seminole | 63 | 0.0% |
| Senegalese | 47 | 0.0% |
| Serbian | 742 | 0.1% |
| Sierra Leonean | 228 | 0.0% |
| Sioux | 20 | 0.0% |
| Slavic | 357 | 0.0% |
| Slovak | 2,405 | 0.2% |
| Slovene | 247 | 0.0% |
| Somali | 23 | 0.0% |
| South African | 629 | 0.1% |
| South American | 60,724 | 6.1% |
| South American Indian | 1,089 | 0.1% |
| Soviet Union | 15 | 0.0% |
| Spaniard | 3,658 | 0.4% |
| Spanish | 2,474 | 0.3% |
| Spanish American | 22 | 0.0% |
| Spanish American Indian | 43 | 0.0% |
| Sri Lankan | 999 | 0.1% |
| Subsaharan African | 15,603 | 1.6% |
| Sudanese | 42 | 0.0% |
| Swedish | 4,128 | 0.4% |
| Swiss | 1,431 | 0.1% |
| Syrian | 495 | 0.1% |
| Thai | 22,194 | 2.2% |
| Tlingit-Haida | 30 | 0.0% |
| Trinidadian and Tobagonian | 1,554 | 0.2% |
| Turkish | 1,013 | 0.1% |
| U.S. Virgin Islander | 47 | 0.0% |
| Ugandan | 91 | 0.0% |
| Ukrainian | 6,715 | 0.7% |
| Uruguayan | 1,304 | 0.1% |
| Venezuelan | 1,585 | 0.2% |
| Vietnamese | 354 | 0.0% |
| Welsh | 1,536 | 0.2% |
| West Indian | 4,123 | 0.4% |
| Yugoslavian | 333 | 0.0% |
| Zimbabwean | 73 | 0.0% | View All 163 Rows |
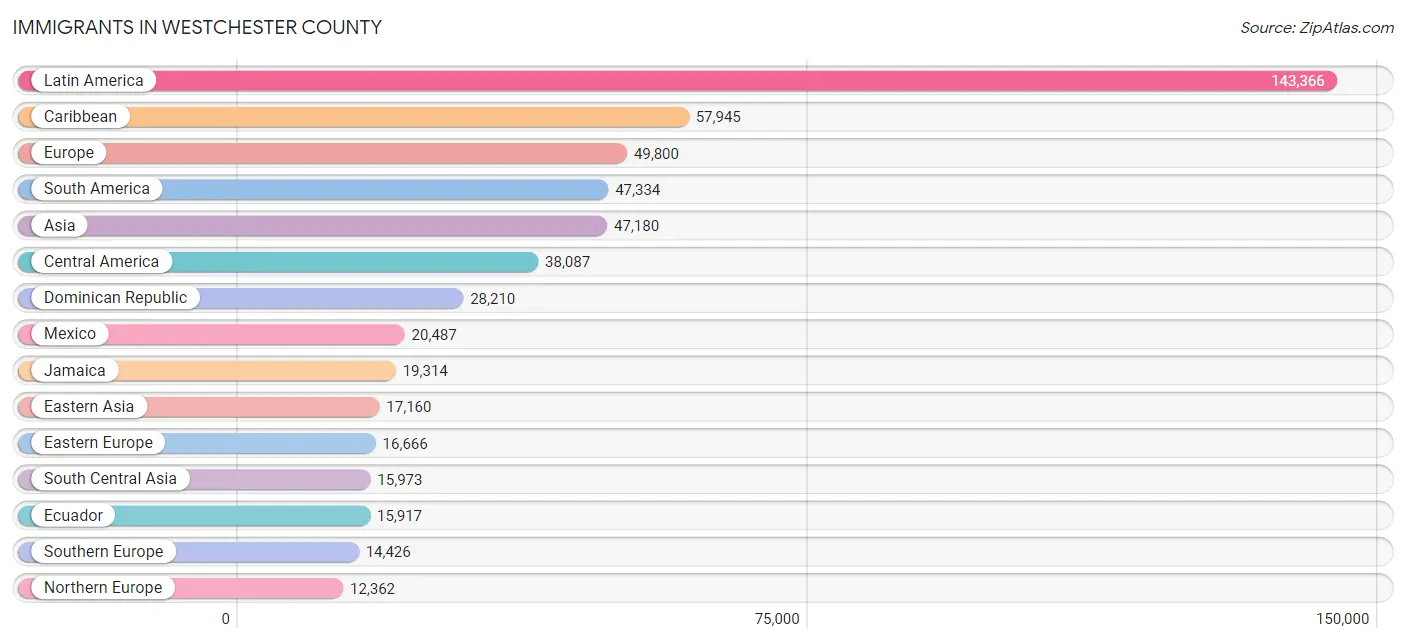
Immigrants in Westchester County
The most numerous immigrant groups reported in Westchester County came from Latin America (143,366 | 14.4%), Caribbean (57,945 | 5.8%), Europe (49,800 | 5.0%), South America (47,334 | 4.7%), and Asia (47,180 | 4.7%), together accounting for 34.6% of all Westchester County residents.
| Immigration Origin | # Population | % Population |
| Afghanistan | 152 | 0.0% |
| Africa | 10,858 | 1.1% |
| Albania | 2,661 | 0.3% |
| Argentina | 1,813 | 0.2% |
| Armenia | 76 | 0.0% |
| Asia | 47,180 | 4.7% |
| Australia | 765 | 0.1% |
| Austria | 248 | 0.0% |
| Bahamas | 53 | 0.0% |
| Bangladesh | 669 | 0.1% |
| Barbados | 598 | 0.1% |
| Belarus | 273 | 0.0% |
| Belgium | 280 | 0.0% |
| Belize | 173 | 0.0% |
| Bolivia | 578 | 0.1% |
| Bosnia and Herzegovina | 74 | 0.0% |
| Brazil | 5,761 | 0.6% |
| Bulgaria | 520 | 0.1% |
| Cabo Verde | 54 | 0.0% |
| Cambodia | 65 | 0.0% |
| Cameroon | 302 | 0.0% |
| Canada | 3,016 | 0.3% |
| Caribbean | 57,945 | 5.8% |
| Central America | 38,087 | 3.8% |
| Chile | 1,332 | 0.1% |
| China | 8,641 | 0.9% |
| Colombia | 9,250 | 0.9% |
| Costa Rica | 328 | 0.0% |
| Croatia | 664 | 0.1% |
| Cuba | 2,046 | 0.2% |
| Czechoslovakia | 752 | 0.1% |
| Denmark | 221 | 0.0% |
| Dominica | 439 | 0.0% |
| Dominican Republic | 28,210 | 2.8% |
| Eastern Africa | 1,702 | 0.2% |
| Eastern Asia | 17,160 | 1.7% |
| Eastern Europe | 16,666 | 1.7% |
| Ecuador | 15,917 | 1.6% |
| Egypt | 507 | 0.1% |
| El Salvador | 3,483 | 0.4% |
| England | 2,099 | 0.2% |
| Eritrea | 3 | 0.0% |
| Ethiopia | 403 | 0.0% |
| Europe | 49,800 | 5.0% |
| France | 1,940 | 0.2% |
| Germany | 2,994 | 0.3% |
| Ghana | 3,141 | 0.3% |
| Greece | 1,280 | 0.1% |
| Grenada | 145 | 0.0% |
| Guatemala | 9,725 | 1.0% |
| Guyana | 2,287 | 0.2% |
| Haiti | 3,121 | 0.3% |
| Honduras | 2,342 | 0.2% |
| Hong Kong | 841 | 0.1% |
| Hungary | 513 | 0.1% |
| India | 11,290 | 1.1% |
| Indonesia | 82 | 0.0% |
| Iran | 1,089 | 0.1% |
| Iraq | 26 | 0.0% |
| Ireland | 4,827 | 0.5% |
| Israel | 1,119 | 0.1% |
| Italy | 9,198 | 0.9% |
| Jamaica | 19,314 | 1.9% |
| Japan | 4,174 | 0.4% |
| Jordan | 1,332 | 0.1% |
| Kazakhstan | 39 | 0.0% |
| Kenya | 494 | 0.1% |
| Korea | 4,345 | 0.4% |
| Kuwait | 103 | 0.0% |
| Laos | 60 | 0.0% |
| Latin America | 143,366 | 14.4% |
| Latvia | 137 | 0.0% |
| Lebanon | 373 | 0.0% |
| Liberia | 120 | 0.0% |
| Lithuania | 41 | 0.0% |
| Malaysia | 146 | 0.0% |
| Mexico | 20,487 | 2.1% |
| Middle Africa | 597 | 0.1% |
| Moldova | 32 | 0.0% |
| Morocco | 421 | 0.0% |
| Nepal | 369 | 0.0% |
| Netherlands | 267 | 0.0% |
| Nicaragua | 597 | 0.1% |
| Nigeria | 1,774 | 0.2% |
| North Macedonia | 86 | 0.0% |
| Northern Africa | 1,220 | 0.1% |
| Northern Europe | 12,362 | 1.2% |
| Norway | 303 | 0.0% |
| Oceania | 940 | 0.1% |
| Pakistan | 1,781 | 0.2% |
| Panama | 952 | 0.1% |
| Peru | 7,056 | 0.7% |
| Philippines | 6,641 | 0.7% |
| Poland | 3,110 | 0.3% |
| Portugal | 3,201 | 0.3% |
| Romania | 1,354 | 0.1% |
| Russia | 2,054 | 0.2% |
| Saudi Arabia | 126 | 0.0% |
| Scotland | 774 | 0.1% |
| Senegal | 62 | 0.0% |
| Serbia | 329 | 0.0% |
| Sierra Leone | 345 | 0.0% |
| Singapore | 80 | 0.0% |
| South Africa | 987 | 0.1% |
| South America | 47,334 | 4.7% |
| South Central Asia | 15,973 | 1.6% |
| South Eastern Asia | 8,395 | 0.8% |
| Southern Europe | 14,426 | 1.5% |
| Spain | 659 | 0.1% |
| Sri Lanka | 299 | 0.0% |
| St. Vincent and the Grenadines | 169 | 0.0% |
| Sudan | 29 | 0.0% |
| Sweden | 385 | 0.0% |
| Switzerland | 386 | 0.0% |
| Syria | 119 | 0.0% |
| Taiwan | 1,465 | 0.2% |
| Thailand | 652 | 0.1% |
| Trinidad and Tobago | 1,738 | 0.2% |
| Turkey | 516 | 0.1% |
| Uganda | 100 | 0.0% |
| Ukraine | 1,430 | 0.1% |
| Uruguay | 1,170 | 0.1% |
| Uzbekistan | 215 | 0.0% |
| Venezuela | 1,397 | 0.1% |
| Vietnam | 594 | 0.1% |
| West Indies | 292 | 0.0% |
| Western Africa | 6,123 | 0.6% |
| Western Asia | 5,490 | 0.5% |
| Western Europe | 6,115 | 0.6% |
| Yemen | 677 | 0.1% |
| Zaire | 213 | 0.0% |
| Zimbabwe | 303 | 0.0% | View All 132 Rows |
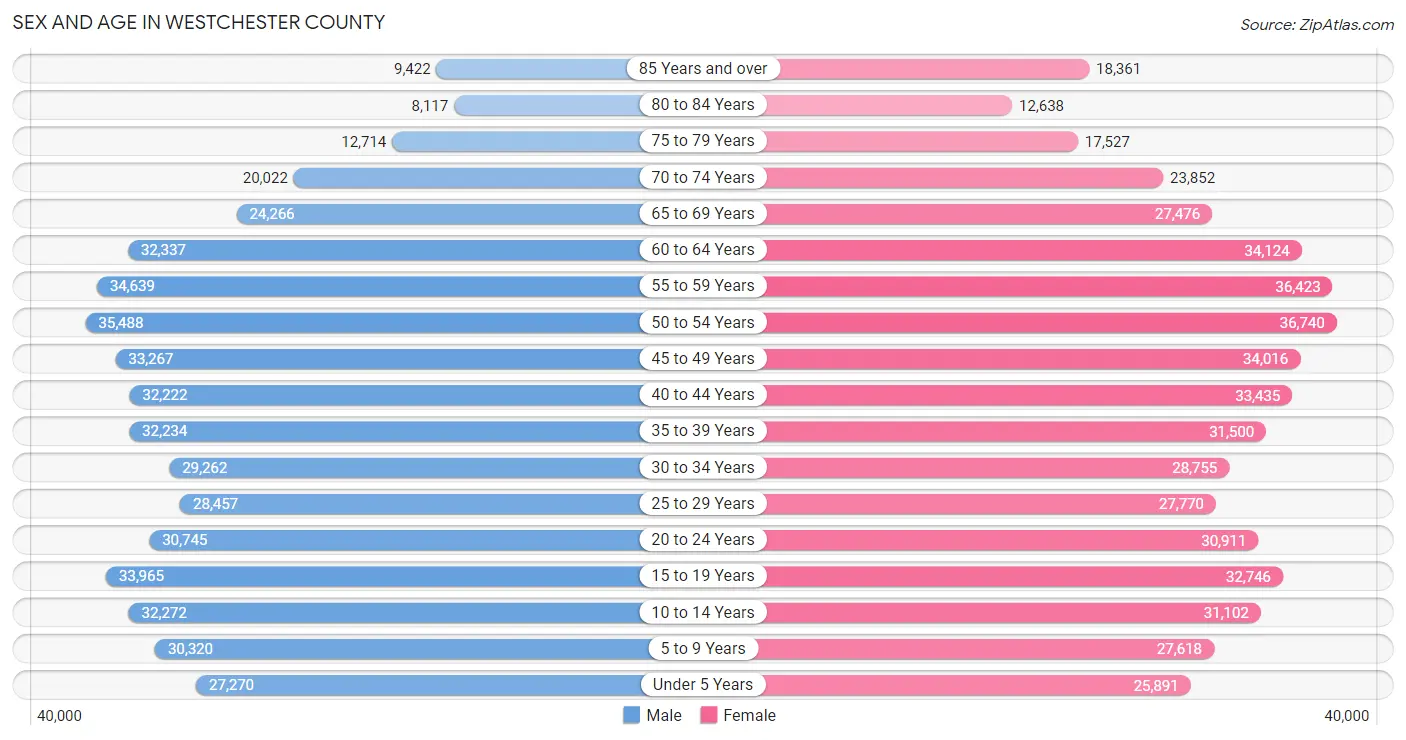
Sex and Age in Westchester County
Sex and Age in Westchester County
The most populous age groups in Westchester County are 50 to 54 Years (35,488 | 7.3%) for men and 50 to 54 Years (36,740 | 7.2%) for women.
| Age Bracket | Male | Female |
| Under 5 Years | 27,270 (5.6%) | 25,891 (5.1%) |
| 5 to 9 Years | 30,320 (6.2%) | 27,618 (5.4%) |
| 10 to 14 Years | 32,272 (6.6%) | 31,102 (6.1%) |
| 15 to 19 Years | 33,965 (7.0%) | 32,746 (6.4%) |
| 20 to 24 Years | 30,745 (6.3%) | 30,911 (6.0%) |
| 25 to 29 Years | 28,457 (5.8%) | 27,770 (5.4%) |
| 30 to 34 Years | 29,262 (6.0%) | 28,755 (5.6%) |
| 35 to 39 Years | 32,234 (6.6%) | 31,500 (6.2%) |
| 40 to 44 Years | 32,222 (6.6%) | 33,435 (6.5%) |
| 45 to 49 Years | 33,267 (6.8%) | 34,016 (6.7%) |
| 50 to 54 Years | 35,488 (7.3%) | 36,740 (7.2%) |
| 55 to 59 Years | 34,639 (7.1%) | 36,423 (7.1%) |
| 60 to 64 Years | 32,337 (6.6%) | 34,124 (6.7%) |
| 65 to 69 Years | 24,266 (5.0%) | 27,476 (5.4%) |
| 70 to 74 Years | 20,022 (4.1%) | 23,852 (4.7%) |
| 75 to 79 Years | 12,714 (2.6%) | 17,527 (3.4%) |
| 80 to 84 Years | 8,117 (1.7%) | 12,638 (2.5%) |
| 85 Years and over | 9,422 (1.9%) | 18,361 (3.6%) |
| Total | 487,019 (100.0%) | 510,885 (100.0%) |
Families and Households in Westchester County
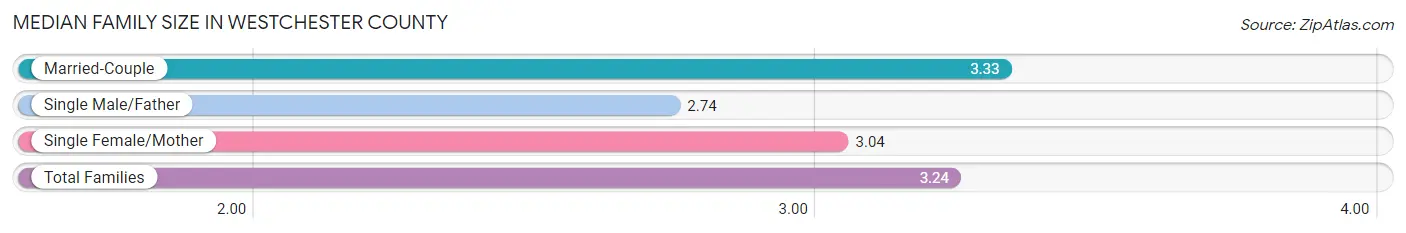
Median Family Size in Westchester County
The median family size in Westchester County is 3.24 persons per family, with married-couple families (189,542 | 75.4%) accounting for the largest median family size of 3.33 persons per family. On the other hand, single male/father families (15,891 | 6.3%) represent the smallest median family size with 2.74 persons per family.
| Family Type | # Families | Family Size |
| Married-Couple | 189,542 (75.4%) | 3.33 |
| Single Male/Father | 15,891 (6.3%) | 2.74 |
| Single Female/Mother | 45,791 (18.2%) | 3.04 |
| Total Families | 251,224 (100.0%) | 3.24 |
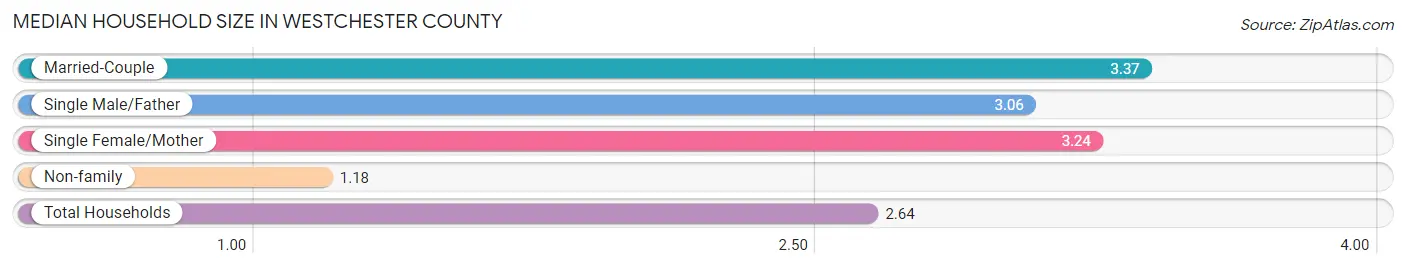
Median Household Size in Westchester County
The median household size in Westchester County is 2.64 persons per household, with married-couple households (189,542 | 51.5%) accounting for the largest median household size of 3.37 persons per household. non-family households (116,516 | 31.7%) represent the smallest median household size with 1.18 persons per household.
| Household Type | # Households | Household Size |
| Married-Couple | 189,542 (51.5%) | 3.37 |
| Single Male/Father | 15,891 (4.3%) | 3.06 |
| Single Female/Mother | 45,791 (12.4%) | 3.24 |
| Non-family | 116,516 (31.7%) | 1.18 |
| Total Households | 367,740 (100.0%) | 2.64 |
Household Size by Marriage Status in Westchester County
Out of a total of 367,740 households in Westchester County, 251,224 (68.3%) are family households, while 116,516 (31.7%) are nonfamily households. The most numerous type of family households are 2-person households, comprising 93,667, and the most common type of nonfamily households are 1-person households, comprising 99,327.
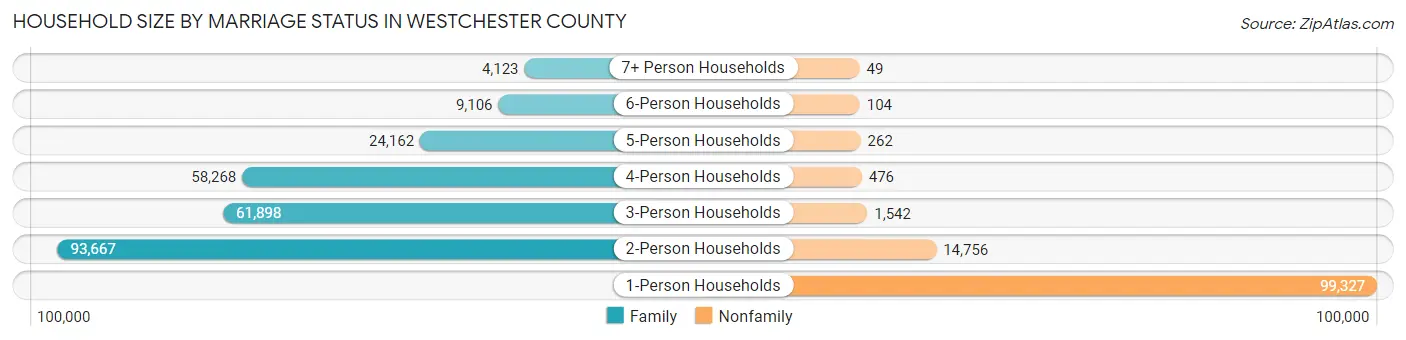
| Household Size | Family Households | Nonfamily Households |
| 1-Person Households | - | 99,327 (27.0%) |
| 2-Person Households | 93,667 (25.5%) | 14,756 (4.0%) |
| 3-Person Households | 61,898 (16.8%) | 1,542 (0.4%) |
| 4-Person Households | 58,268 (15.8%) | 476 (0.1%) |
| 5-Person Households | 24,162 (6.6%) | 262 (0.1%) |
| 6-Person Households | 9,106 (2.5%) | 104 (0.0%) |
| 7+ Person Households | 4,123 (1.1%) | 49 (0.0%) |
| Total | 251,224 (68.3%) | 116,516 (31.7%) |
Female Fertility in Westchester County
Fertility by Age in Westchester County
Average fertility rate in Westchester County is 43.0 births per 1,000 women. Women in the age bracket of 20 to 34 years have the highest fertility rate with 59.0 births per 1,000 women. Women in the age bracket of 20 to 34 years acount for 52.7% of all women with births.
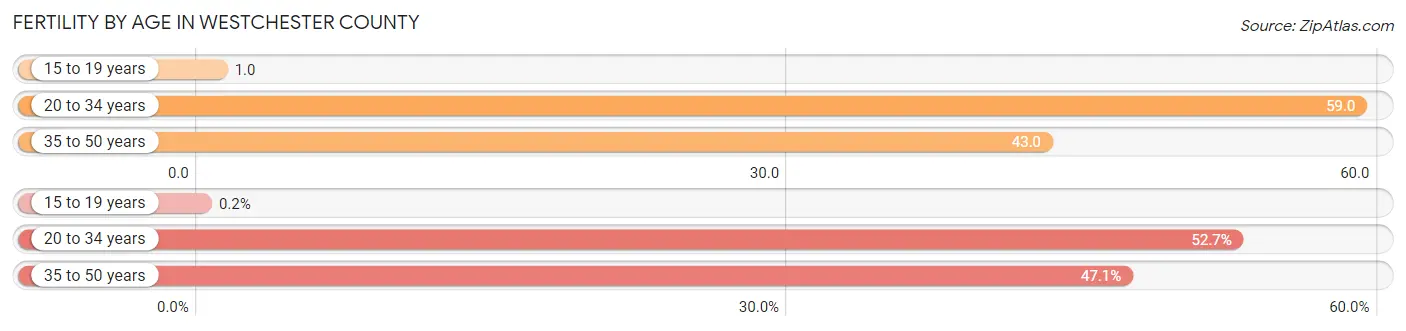
| Age Bracket | Women with Births | Births / 1,000 Women |
| 15 to 19 years | 20 (0.2%) | 1.0 |
| 20 to 34 years | 5,146 (52.7%) | 59.0 |
| 35 to 50 years | 4,596 (47.1%) | 43.0 |
| Total | 9,762 (100.0%) | 43.0 |
Fertility by Age by Marriage Status in Westchester County
80.1% of women with births (9,762) in Westchester County are married. The highest percentage of unmarried women with births falls into 15 to 19 years age bracket with 100.0% of them unmarried at the time of birth, while the lowest percentage of unmarried women with births belong to 35 to 50 years age bracket with 13.5% of them unmarried.
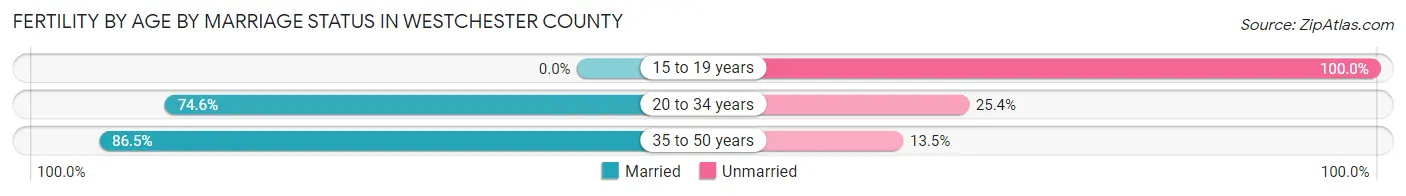
| Age Bracket | Married | Unmarried |
| 15 to 19 years | 0 (0.0%) | 20 (100.0%) |
| 20 to 34 years | 3,839 (74.6%) | 1,307 (25.4%) |
| 35 to 50 years | 3,976 (86.5%) | 620 (13.5%) |
| Total | 7,819 (80.1%) | 1,943 (19.9%) |
Fertility by Education in Westchester County
Average fertility rate in Westchester County is 43.0 births per 1,000 women. Women with the education attainment of graduate degree have the highest fertility rate of 64.0 births per 1,000 women, while women with the education attainment of high school diploma have the lowest fertility at 26.0 births per 1,000 women. Women with the education attainment of graduate degree represent 33.6% of all women with births.
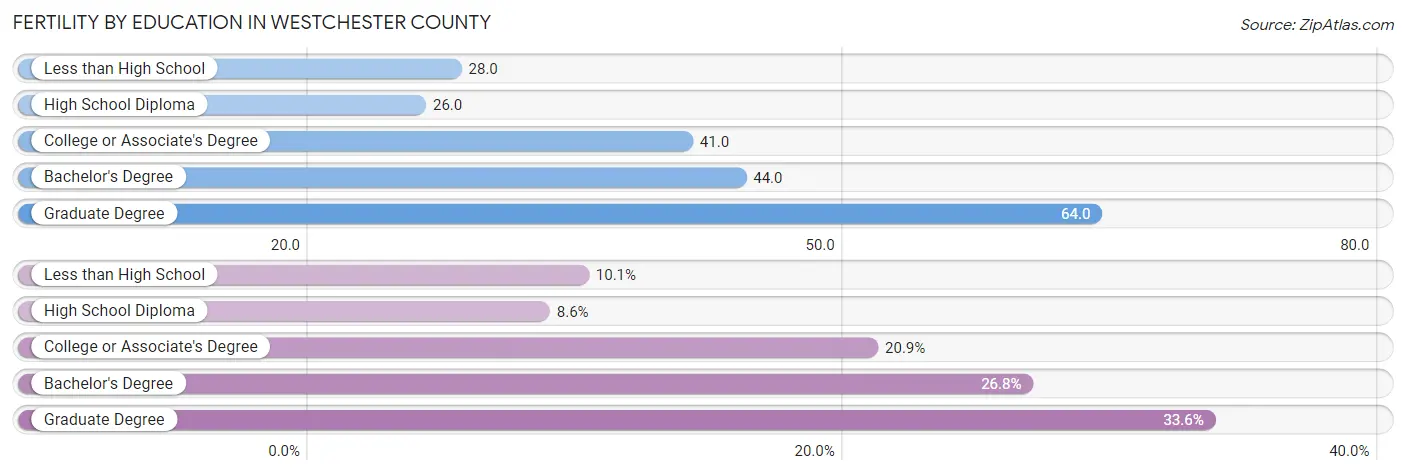
| Educational Attainment | Women with Births | Births / 1,000 Women |
| Less than High School | 986 (10.1%) | 28.0 |
| High School Diploma | 843 (8.6%) | 26.0 |
| College or Associate's Degree | 2,044 (20.9%) | 41.0 |
| Bachelor's Degree | 2,611 (26.8%) | 44.0 |
| Graduate Degree | 3,278 (33.6%) | 64.0 |
| Total | 9,762 (100.0%) | 43.0 |
Fertility by Education by Marriage Status in Westchester County
19.9% of women with births in Westchester County are unmarried. Women with the educational attainment of bachelor's degree are most likely to be married with 94.3% of them married at childbirth, while women with the educational attainment of college or associate's degree are least likely to be married with 39.2% of them unmarried at childbirth.
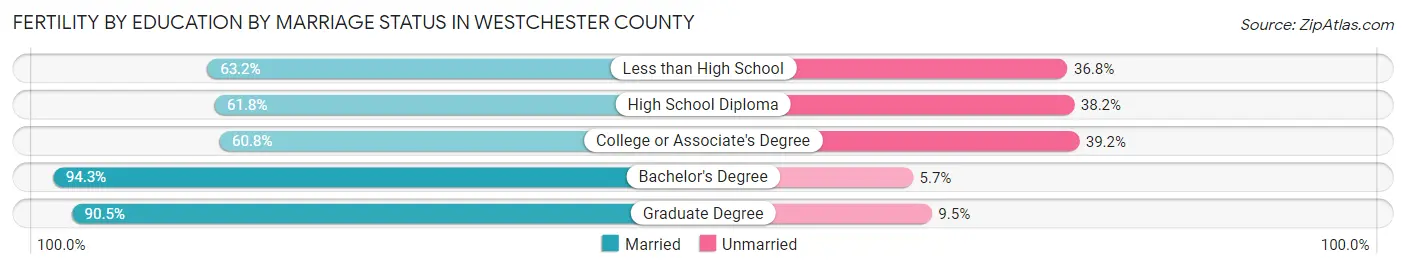
| Educational Attainment | Married | Unmarried |
| Less than High School | 623 (63.2%) | 363 (36.8%) |
| High School Diploma | 521 (61.8%) | 322 (38.2%) |
| College or Associate's Degree | 1,243 (60.8%) | 801 (39.2%) |
| Bachelor's Degree | 2,462 (94.3%) | 149 (5.7%) |
| Graduate Degree | 2,967 (90.5%) | 311 (9.5%) |
| Total | 7,819 (80.1%) | 1,943 (19.9%) |
Employment Characteristics in Westchester County
Employment by Class of Employer in Westchester County
Among the 485,163 employed individuals in Westchester County, private company employees (296,814 | 61.2%), not-for-profit organizations (59,497 | 12.3%), and local government employees (52,268 | 10.8%) make up the most common classes of employment.
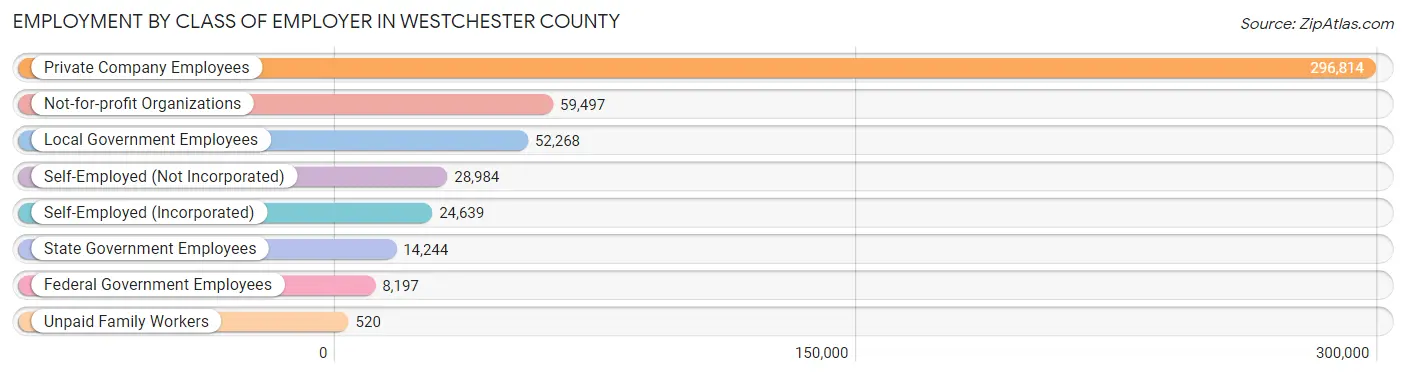
| Employer Class | # Employees | % Employees |
| Private Company Employees | 296,814 | 61.2% |
| Self-Employed (Incorporated) | 24,639 | 5.1% |
| Self-Employed (Not Incorporated) | 28,984 | 6.0% |
| Not-for-profit Organizations | 59,497 | 12.3% |
| Local Government Employees | 52,268 | 10.8% |
| State Government Employees | 14,244 | 2.9% |
| Federal Government Employees | 8,197 | 1.7% |
| Unpaid Family Workers | 520 | 0.1% |
| Total | 485,163 | 100.0% |
Employment Status by Age in Westchester County
According to the labor force statistics for Westchester County, out of the total population over 16 years of age (809,847), 65.2% or 528,020 individuals are in the labor force, with 6.0% or 31,681 of them unemployed. The age group with the highest labor force participation rate is 30 to 34 years, with 87.9% or 50,997 individuals in the labor force. Within the labor force, the 16 to 19 years age range has the highest percentage of unemployed individuals, with 19.3% or 2,779 of them being unemployed.
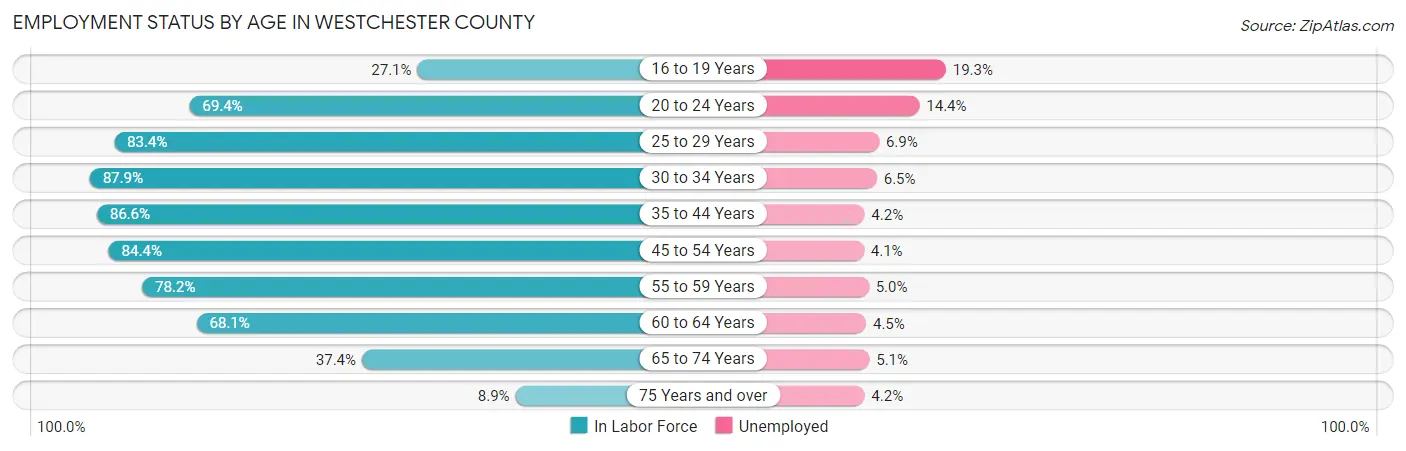
| Age Bracket | In Labor Force | Unemployed |
| 16 to 19 Years | 14,397 (27.1%) | 2,779 (19.3%) |
| 20 to 24 Years | 42,789 (69.4%) | 6,162 (14.4%) |
| 25 to 29 Years | 46,893 (83.4%) | 3,236 (6.9%) |
| 30 to 34 Years | 50,997 (87.9%) | 3,315 (6.5%) |
| 35 to 44 Years | 112,053 (86.6%) | 4,706 (4.2%) |
| 45 to 54 Years | 117,747 (84.4%) | 4,828 (4.1%) |
| 55 to 59 Years | 55,570 (78.2%) | 2,778 (5.0%) |
| 60 to 64 Years | 45,260 (68.1%) | 2,037 (4.5%) |
| 65 to 74 Years | 35,760 (37.4%) | 1,824 (5.1%) |
| 75 Years and over | 7,011 (8.9%) | 294 (4.2%) |
| Total | 528,020 (65.2%) | 31,681 (6.0%) |
Employment Status by Educational Attainment in Westchester County
According to labor force statistics for Westchester County, 82.3% of individuals (428,511) out of the total population between 25 and 64 years of age (520,669) are in the labor force, with 4.9% or 20,997 of them being unemployed. The group with the highest labor force participation rate are those with the educational attainment of bachelor's degree or higher, with 87.7% or 248,512 individuals in the labor force. Within the labor force, individuals with less than high school education have the highest percentage of unemployment, with 7.0% or 2,370 of them being unemployed.
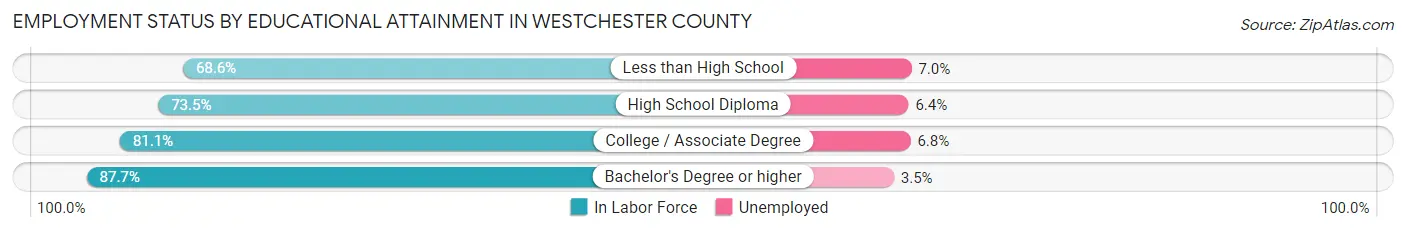
| Educational Attainment | In Labor Force | Unemployed |
| Less than High School | 33,857 (68.6%) | 3,455 (7.0%) |
| High School Diploma | 61,365 (73.5%) | 5,343 (6.4%) |
| College / Associate Degree | 84,716 (81.1%) | 7,103 (6.8%) |
| Bachelor's Degree or higher | 248,512 (87.7%) | 9,918 (3.5%) |
| Total | 428,511 (82.3%) | 25,513 (4.9%) |
Employment Occupations by Sex in Westchester County
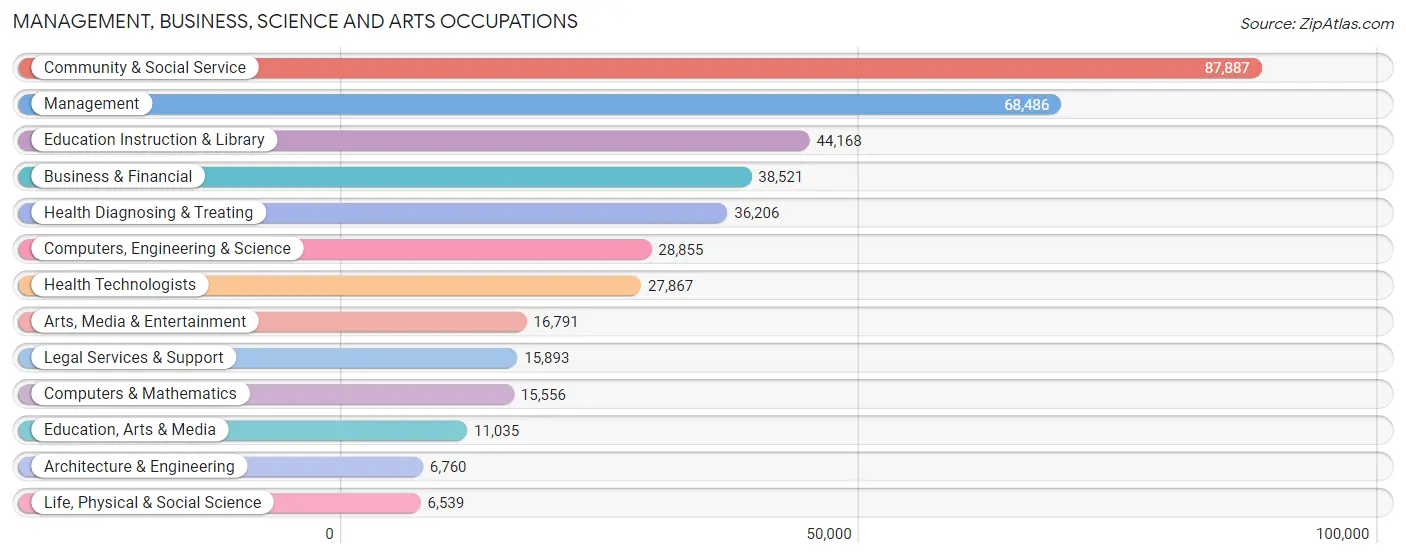
Management, Business, Science and Arts Occupations
The most common Management, Business, Science and Arts occupations in Westchester County are Community & Social Service (87,887 | 17.7%), Management (68,486 | 13.8%), Education Instruction & Library (44,168 | 8.9%), Business & Financial (38,521 | 7.8%), and Health Diagnosing & Treating (36,206 | 7.3%).
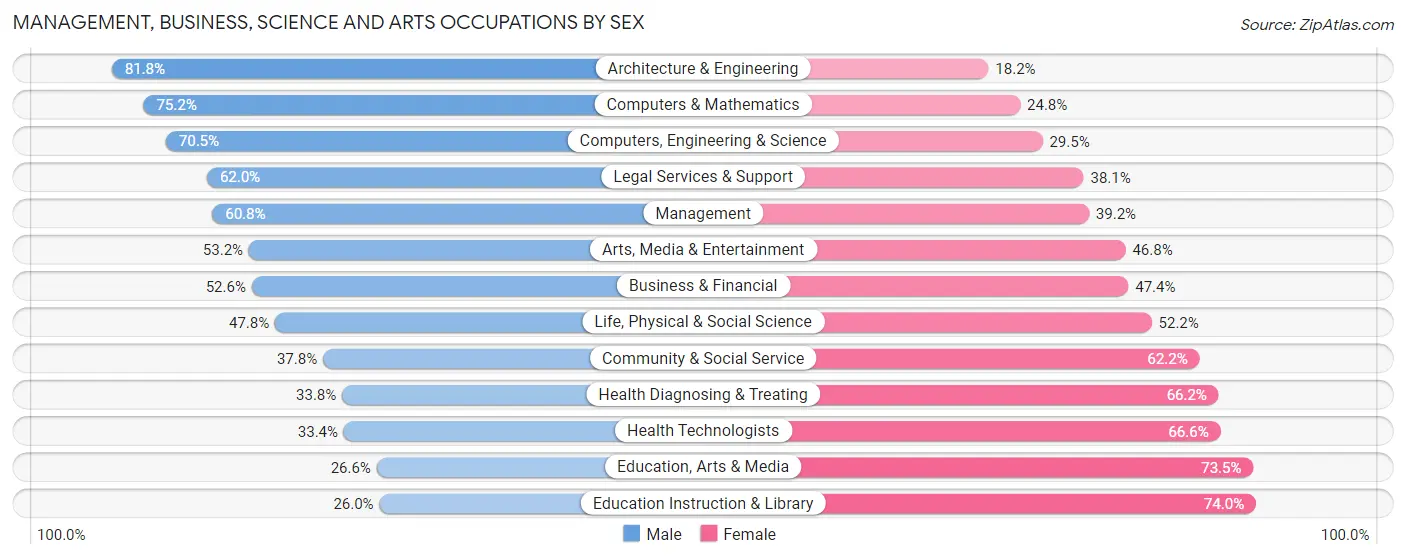
Management, Business, Science and Arts Occupations by Sex
Within the Management, Business, Science and Arts occupations in Westchester County, the most male-oriented occupations are Architecture & Engineering (81.8%), Computers & Mathematics (75.2%), and Computers, Engineering & Science (70.5%), while the most female-oriented occupations are Education Instruction & Library (74.0%), Education, Arts & Media (73.5%), and Health Technologists (66.6%).
| Occupation | Male | Female |
| Management | 41,666 (60.8%) | 26,820 (39.2%) |
| Business & Financial | 20,271 (52.6%) | 18,250 (47.4%) |
| Computers, Engineering & Science | 20,349 (70.5%) | 8,506 (29.5%) |
| Computers & Mathematics | 11,696 (75.2%) | 3,860 (24.8%) |
| Architecture & Engineering | 5,530 (81.8%) | 1,230 (18.2%) |
| Life, Physical & Social Science | 3,123 (47.8%) | 3,416 (52.2%) |
| Community & Social Service | 33,185 (37.8%) | 54,702 (62.2%) |
| Education, Arts & Media | 2,930 (26.6%) | 8,105 (73.5%) |
| Legal Services & Support | 9,846 (62.0%) | 6,047 (38.1%) |
| Education Instruction & Library | 11,475 (26.0%) | 32,693 (74.0%) |
| Arts, Media & Entertainment | 8,934 (53.2%) | 7,857 (46.8%) |
| Health Diagnosing & Treating | 12,228 (33.8%) | 23,978 (66.2%) |
| Health Technologists | 9,308 (33.4%) | 18,559 (66.6%) |
| Total (Category) | 127,699 (49.1%) | 132,256 (50.9%) |
| Total (Overall) | 259,330 (52.3%) | 236,834 (47.7%) |
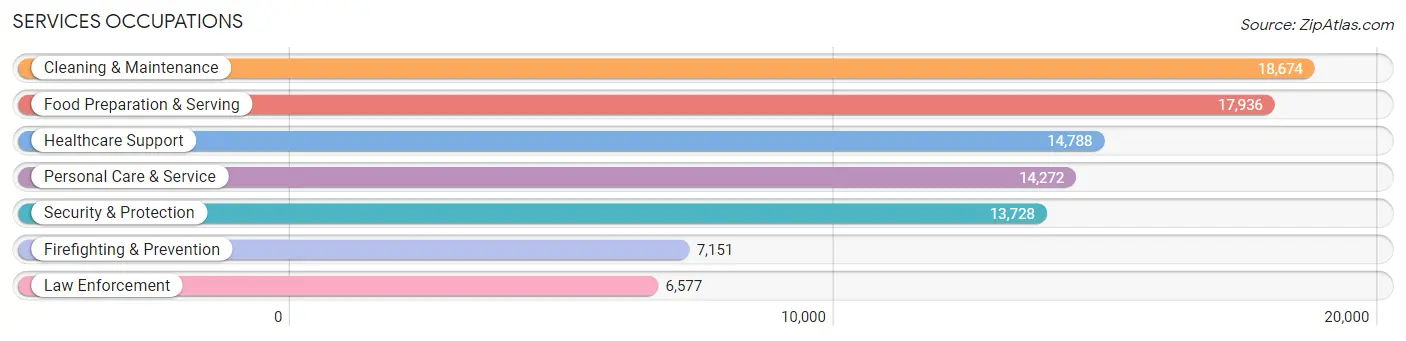
Services Occupations
The most common Services occupations in Westchester County are Cleaning & Maintenance (18,674 | 3.8%), Food Preparation & Serving (17,936 | 3.6%), Healthcare Support (14,788 | 3.0%), Personal Care & Service (14,272 | 2.9%), and Security & Protection (13,728 | 2.8%).
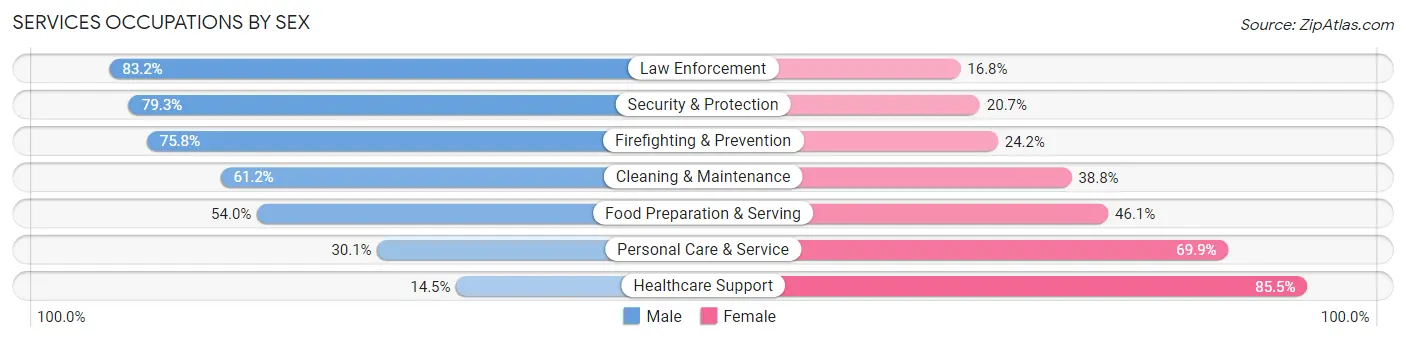
Services Occupations by Sex
Within the Services occupations in Westchester County, the most male-oriented occupations are Law Enforcement (83.2%), Security & Protection (79.3%), and Firefighting & Prevention (75.8%), while the most female-oriented occupations are Healthcare Support (85.5%), Personal Care & Service (69.9%), and Food Preparation & Serving (46.1%).
| Occupation | Male | Female |
| Healthcare Support | 2,144 (14.5%) | 12,644 (85.5%) |
| Security & Protection | 10,892 (79.3%) | 2,836 (20.7%) |
| Firefighting & Prevention | 5,420 (75.8%) | 1,731 (24.2%) |
| Law Enforcement | 5,472 (83.2%) | 1,105 (16.8%) |
| Food Preparation & Serving | 9,676 (53.9%) | 8,260 (46.1%) |
| Cleaning & Maintenance | 11,431 (61.2%) | 7,243 (38.8%) |
| Personal Care & Service | 4,300 (30.1%) | 9,972 (69.9%) |
| Total (Category) | 38,443 (48.4%) | 40,955 (51.6%) |
| Total (Overall) | 259,330 (52.3%) | 236,834 (47.7%) |
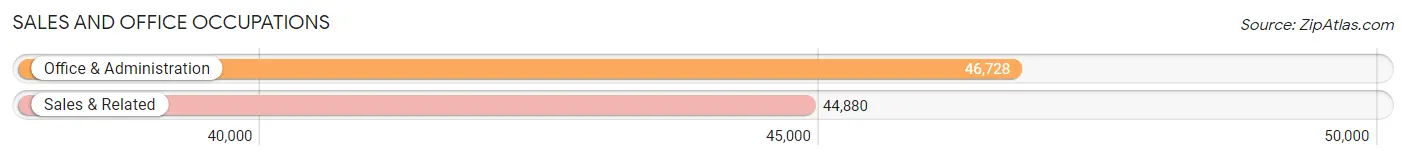
Sales and Office Occupations
The most common Sales and Office occupations in Westchester County are Office & Administration (46,728 | 9.4%), and Sales & Related (44,880 | 9.0%).
Sales and Office Occupations by Sex
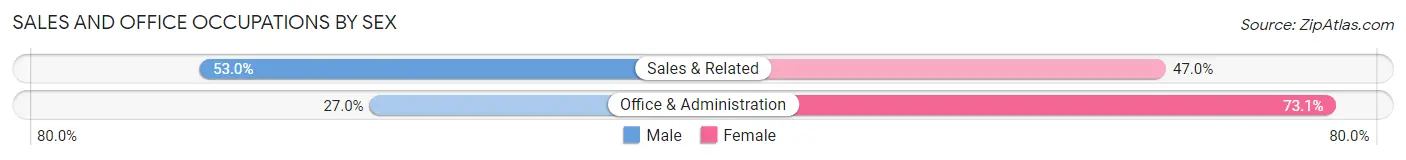
| Occupation | Male | Female |
| Sales & Related | 23,787 (53.0%) | 21,093 (47.0%) |
| Office & Administration | 12,593 (27.0%) | 34,135 (73.1%) |
| Total (Category) | 36,380 (39.7%) | 55,228 (60.3%) |
| Total (Overall) | 259,330 (52.3%) | 236,834 (47.7%) |
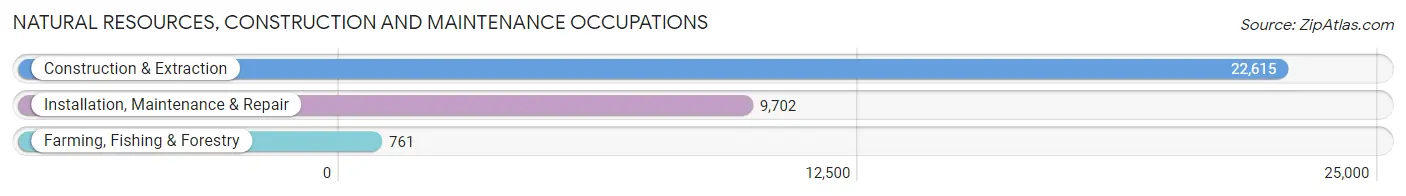
Natural Resources, Construction and Maintenance Occupations
The most common Natural Resources, Construction and Maintenance occupations in Westchester County are Construction & Extraction (22,615 | 4.6%), Installation, Maintenance & Repair (9,702 | 2.0%), and Farming, Fishing & Forestry (761 | 0.2%).
Natural Resources, Construction and Maintenance Occupations by Sex
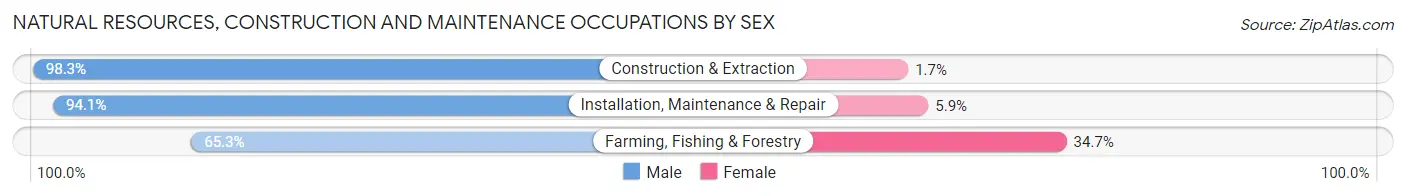
| Occupation | Male | Female |
| Farming, Fishing & Forestry | 497 (65.3%) | 264 (34.7%) |
| Construction & Extraction | 22,223 (98.3%) | 392 (1.7%) |
| Installation, Maintenance & Repair | 9,128 (94.1%) | 574 (5.9%) |
| Total (Category) | 31,848 (96.3%) | 1,230 (3.7%) |
| Total (Overall) | 259,330 (52.3%) | 236,834 (47.7%) |
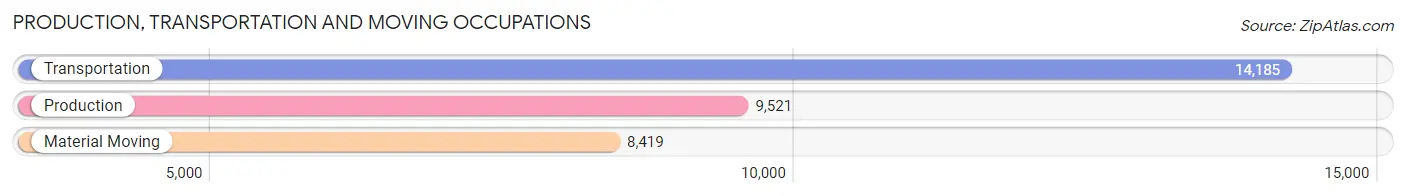
Production, Transportation and Moving Occupations
The most common Production, Transportation and Moving occupations in Westchester County are Transportation (14,185 | 2.9%), Production (9,521 | 1.9%), and Material Moving (8,419 | 1.7%).
Production, Transportation and Moving Occupations by Sex
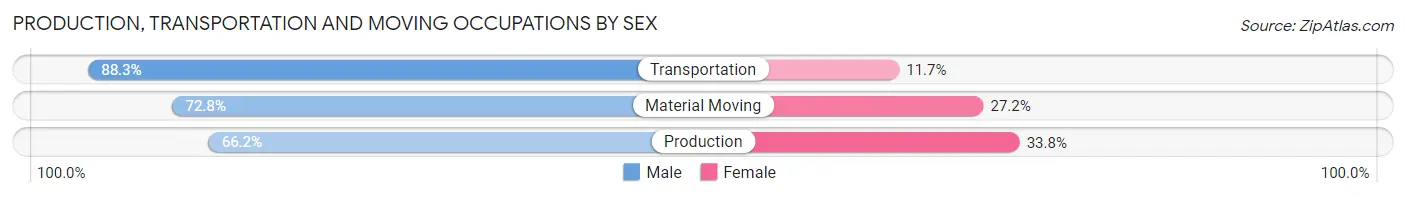
| Occupation | Male | Female |
| Production | 6,303 (66.2%) | 3,218 (33.8%) |
| Transportation | 12,525 (88.3%) | 1,660 (11.7%) |
| Material Moving | 6,132 (72.8%) | 2,287 (27.2%) |
| Total (Category) | 24,960 (77.7%) | 7,165 (22.3%) |
| Total (Overall) | 259,330 (52.3%) | 236,834 (47.7%) |
Employment Industries by Sex in Westchester County
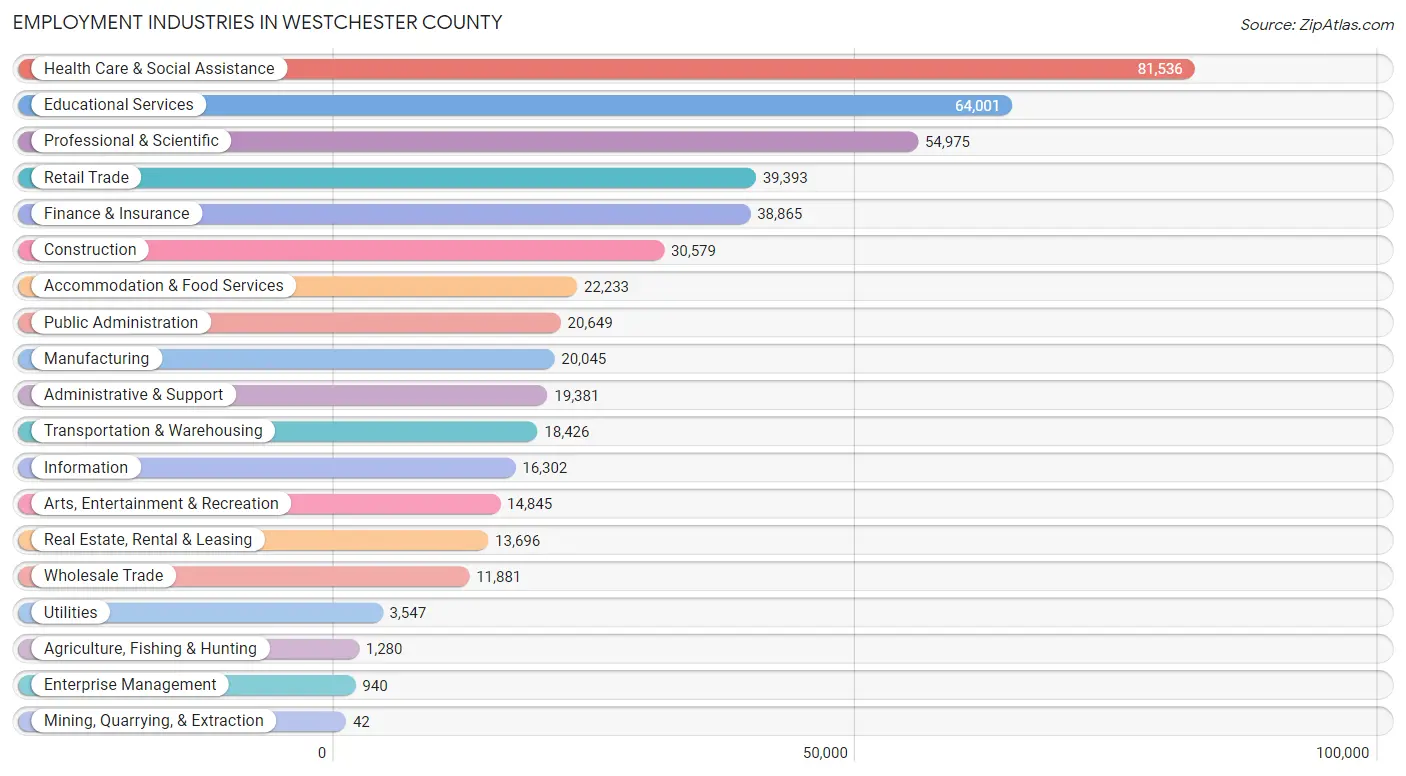
Employment Industries in Westchester County
The major employment industries in Westchester County include Health Care & Social Assistance (81,536 | 16.4%), Educational Services (64,001 | 12.9%), Professional & Scientific (54,975 | 11.1%), Retail Trade (39,393 | 7.9%), and Finance & Insurance (38,865 | 7.8%).
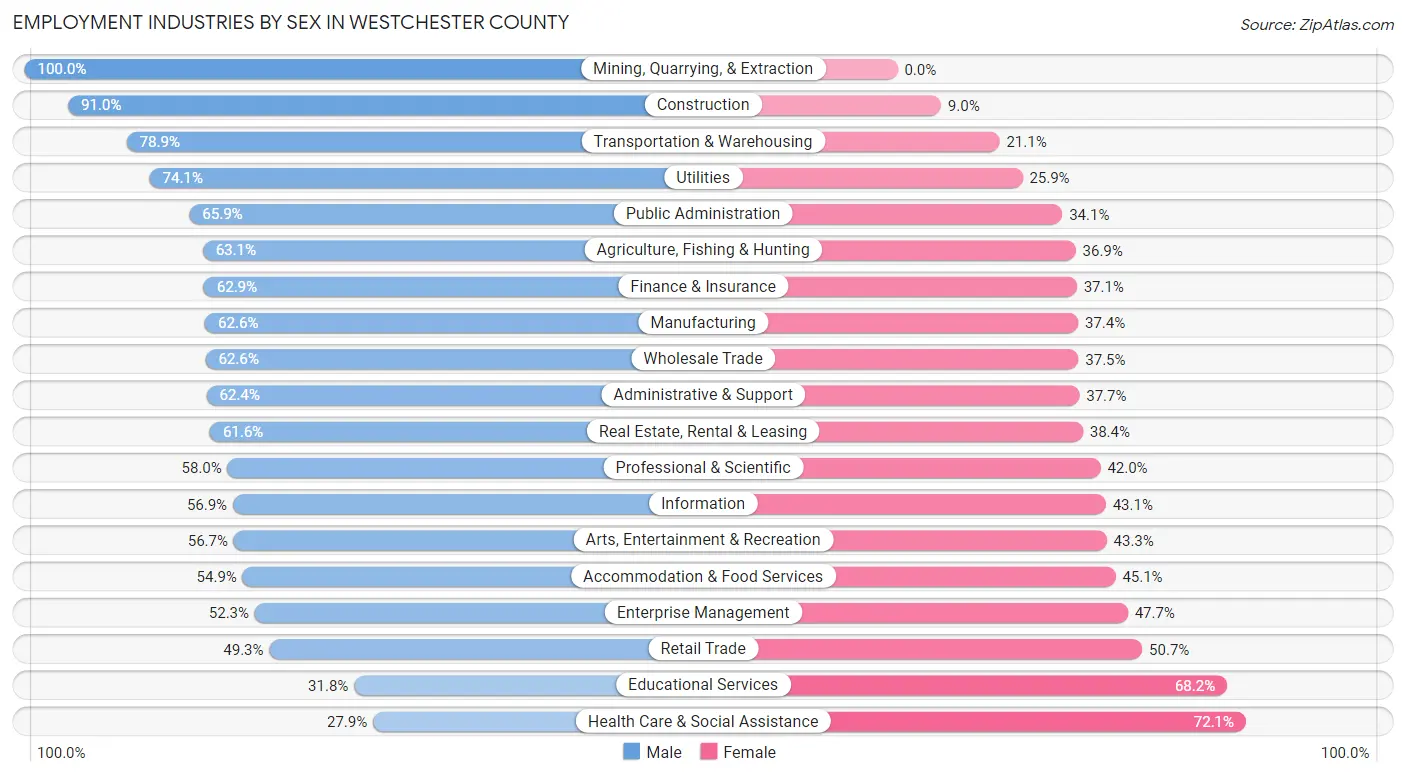
Employment Industries by Sex in Westchester County
The Westchester County industries that see more men than women are Mining, Quarrying, & Extraction (100.0%), Construction (91.0%), and Transportation & Warehousing (78.9%), whereas the industries that tend to have a higher number of women are Health Care & Social Assistance (72.1%), Educational Services (68.2%), and Retail Trade (50.7%).
| Industry | Male | Female |
| Agriculture, Fishing & Hunting | 808 (63.1%) | 472 (36.9%) |
| Mining, Quarrying, & Extraction | 42 (100.0%) | 0 (0.0%) |
| Construction | 27,828 (91.0%) | 2,751 (9.0%) |
| Manufacturing | 12,552 (62.6%) | 7,493 (37.4%) |
| Wholesale Trade | 7,432 (62.5%) | 4,449 (37.4%) |
| Retail Trade | 19,438 (49.3%) | 19,955 (50.7%) |
| Transportation & Warehousing | 14,532 (78.9%) | 3,894 (21.1%) |
| Utilities | 2,629 (74.1%) | 918 (25.9%) |
| Information | 9,272 (56.9%) | 7,030 (43.1%) |
| Finance & Insurance | 24,444 (62.9%) | 14,421 (37.1%) |
| Real Estate, Rental & Leasing | 8,441 (61.6%) | 5,255 (38.4%) |
| Professional & Scientific | 31,875 (58.0%) | 23,100 (42.0%) |
| Enterprise Management | 492 (52.3%) | 448 (47.7%) |
| Administrative & Support | 12,085 (62.4%) | 7,296 (37.7%) |
| Educational Services | 20,348 (31.8%) | 43,653 (68.2%) |
| Health Care & Social Assistance | 22,733 (27.9%) | 58,803 (72.1%) |
| Arts, Entertainment & Recreation | 8,417 (56.7%) | 6,428 (43.3%) |
| Accommodation & Food Services | 12,199 (54.9%) | 10,034 (45.1%) |
| Public Administration | 13,603 (65.9%) | 7,046 (34.1%) |
| Total | 259,330 (52.3%) | 236,834 (47.7%) |
Education in Westchester County
School Enrollment in Westchester County
The most common levels of schooling among the 248,290 students in Westchester County are high school (55,764 | 22.5%), college / undergraduate (51,157 | 20.6%), and middle school (49,260 | 19.8%).
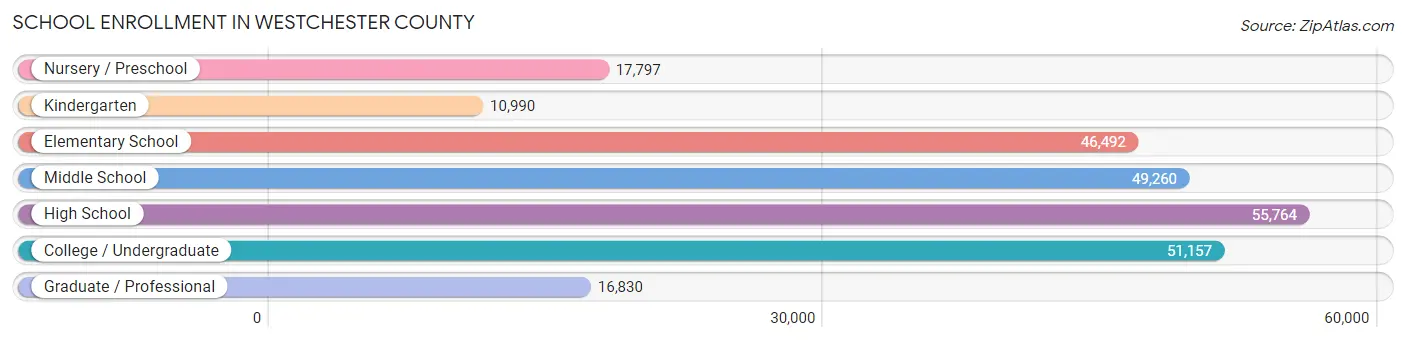
| School Level | # Students | % Students |
| Nursery / Preschool | 17,797 | 7.2% |
| Kindergarten | 10,990 | 4.4% |
| Elementary School | 46,492 | 18.7% |
| Middle School | 49,260 | 19.8% |
| High School | 55,764 | 22.5% |
| College / Undergraduate | 51,157 | 20.6% |
| Graduate / Professional | 16,830 | 6.8% |
| Total | 248,290 | 100.0% |
School Enrollment by Age by Funding Source in Westchester County
Out of a total of 248,290 students who are enrolled in schools in Westchester County, 68,280 (27.5%) attend a private institution, while the remaining 180,010 (72.5%) are enrolled in public schools. The age group of 3 to 4 year olds has the highest likelihood of being enrolled in private schools, with 9,104 (58.2% in the age bracket) enrolled. Conversely, the age group of 5 to 9 year old has the lowest likelihood of being enrolled in a private school, with 48,609 (86.5% in the age bracket) attending a public institution.
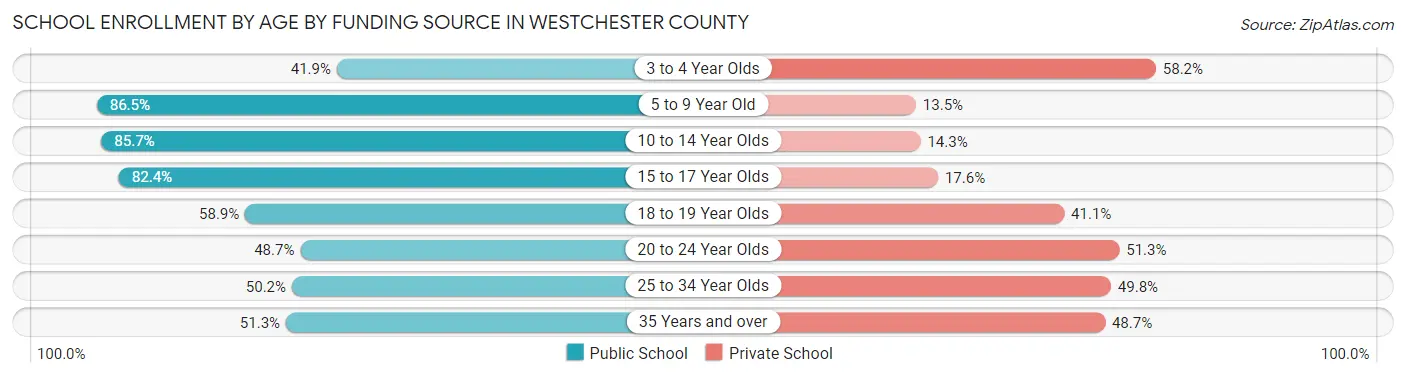
| Age Bracket | Public School | Private School |
| 3 to 4 Year Olds | 6,551 (41.8%) | 9,104 (58.2%) |
| 5 to 9 Year Old | 48,609 (86.5%) | 7,561 (13.5%) |
| 10 to 14 Year Olds | 52,914 (85.7%) | 8,835 (14.3%) |
| 15 to 17 Year Olds | 32,460 (82.4%) | 6,917 (17.6%) |
| 18 to 19 Year Olds | 13,539 (58.9%) | 9,435 (41.1%) |
| 20 to 24 Year Olds | 13,759 (48.7%) | 14,515 (51.3%) |
| 25 to 34 Year Olds | 6,285 (50.2%) | 6,230 (49.8%) |
| 35 Years and over | 5,942 (51.3%) | 5,634 (48.7%) |
| Total | 180,010 (72.5%) | 68,280 (27.5%) |
Educational Attainment by Field of Study in Westchester County
Business (75,975 | 19.5%), social sciences (47,755 | 12.3%), education (32,139 | 8.3%), science & technology (30,289 | 7.8%), and literature & languages (26,836 | 6.9%) are the most common fields of study among 388,946 individuals in Westchester County who have obtained a bachelor's degree or higher.
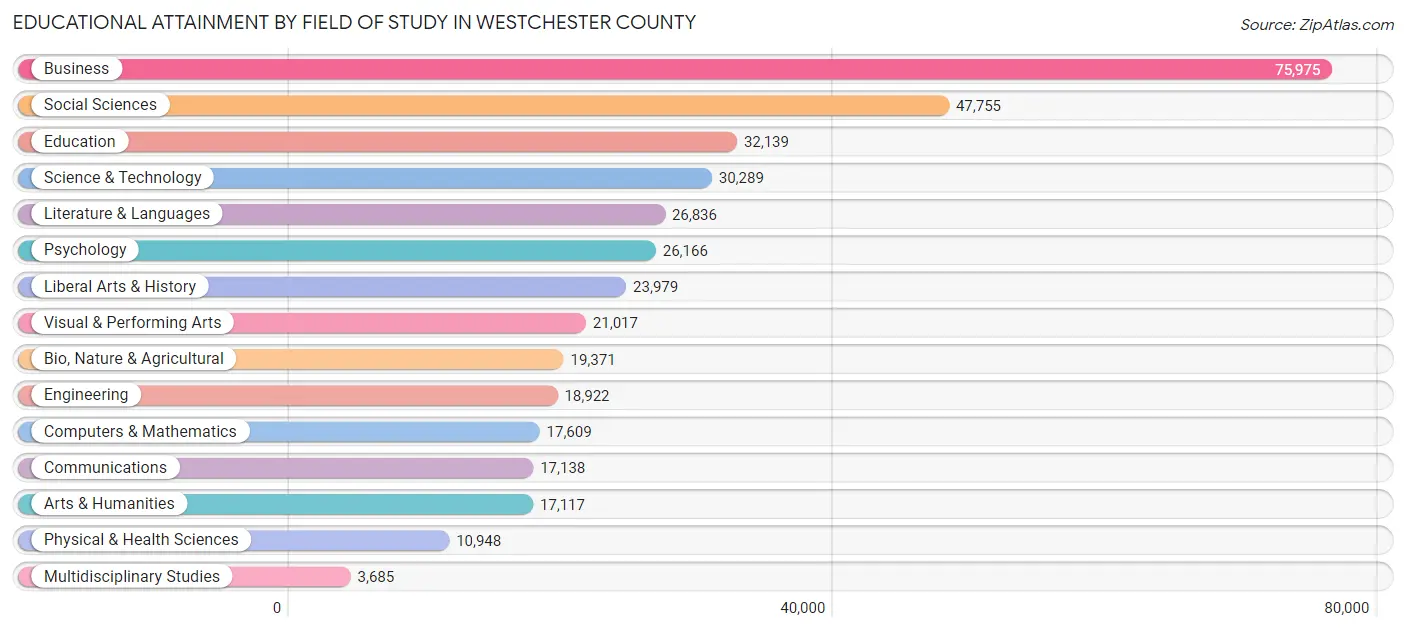
| Field of Study | # Graduates | % Graduates |
| Computers & Mathematics | 17,609 | 4.5% |
| Bio, Nature & Agricultural | 19,371 | 5.0% |
| Physical & Health Sciences | 10,948 | 2.8% |
| Psychology | 26,166 | 6.7% |
| Social Sciences | 47,755 | 12.3% |
| Engineering | 18,922 | 4.9% |
| Multidisciplinary Studies | 3,685 | 0.9% |
| Science & Technology | 30,289 | 7.8% |
| Business | 75,975 | 19.5% |
| Education | 32,139 | 8.3% |
| Literature & Languages | 26,836 | 6.9% |
| Liberal Arts & History | 23,979 | 6.2% |
| Visual & Performing Arts | 21,017 | 5.4% |
| Communications | 17,138 | 4.4% |
| Arts & Humanities | 17,117 | 4.4% |
| Total | 388,946 | 100.0% |
Transportation & Commute in Westchester County
Vehicle Availability by Sex in Westchester County
The most prevalent vehicle ownership categories in Westchester County are males with 2 vehicles (103,212, accounting for 40.8%) and females with 2 vehicles (85,999, making up 45.4%).

| Vehicles Available | Male | Female |
| No Vehicle | 17,956 (7.1%) | 19,906 (8.7%) |
| 1 Vehicle | 61,105 (24.2%) | 64,440 (28.3%) |
| 2 Vehicles | 103,212 (40.8%) | 85,999 (37.8%) |
| 3 Vehicles | 46,379 (18.3%) | 37,417 (16.5%) |
| 4 Vehicles | 17,419 (6.9%) | 13,990 (6.1%) |
| 5 or more Vehicles | 6,864 (2.7%) | 5,690 (2.5%) |
| Total | 252,935 (100.0%) | 227,442 (100.0%) |
Commute Time in Westchester County
The most frequently occuring commute durations in Westchester County are 60 to 89 minutes (59,968 commuters, 14.6%), 30 to 34 minutes (50,500 commuters, 12.3%), and 15 to 19 minutes (50,113 commuters, 12.2%).
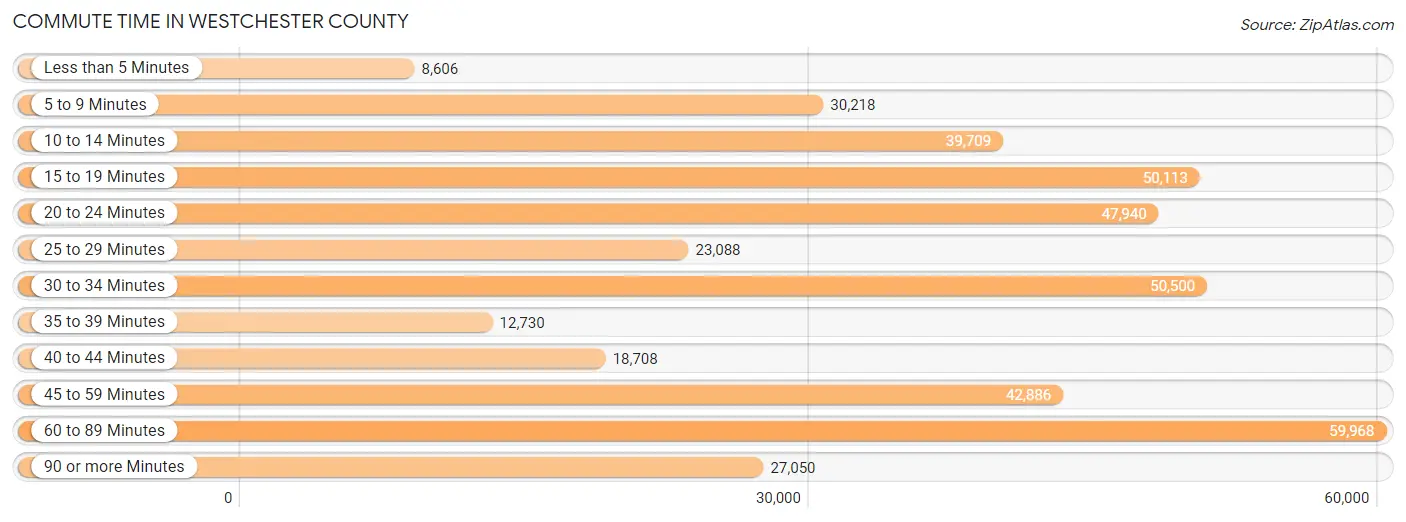
| Commute Time | # Commuters | % Commuters |
| Less than 5 Minutes | 8,606 | 2.1% |
| 5 to 9 Minutes | 30,218 | 7.3% |
| 10 to 14 Minutes | 39,709 | 9.7% |
| 15 to 19 Minutes | 50,113 | 12.2% |
| 20 to 24 Minutes | 47,940 | 11.7% |
| 25 to 29 Minutes | 23,088 | 5.6% |
| 30 to 34 Minutes | 50,500 | 12.3% |
| 35 to 39 Minutes | 12,730 | 3.1% |
| 40 to 44 Minutes | 18,708 | 4.5% |
| 45 to 59 Minutes | 42,886 | 10.4% |
| 60 to 89 Minutes | 59,968 | 14.6% |
| 90 or more Minutes | 27,050 | 6.6% |
Commute Time by Sex in Westchester County
The most common commute times in Westchester County are 60 to 89 minutes (35,865 commuters, 16.4%) for males and 15 to 19 minutes (25,982 commuters, 13.4%) for females.
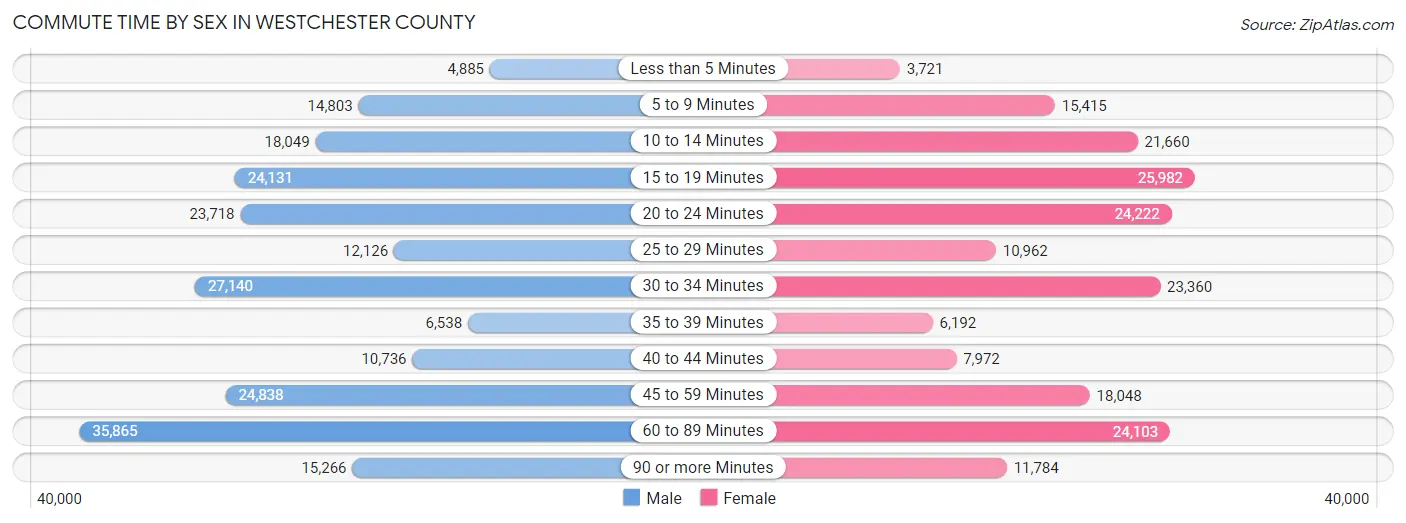
| Commute Time | Male | Female |
| Less than 5 Minutes | 4,885 (2.2%) | 3,721 (1.9%) |
| 5 to 9 Minutes | 14,803 (6.8%) | 15,415 (8.0%) |
| 10 to 14 Minutes | 18,049 (8.3%) | 21,660 (11.2%) |
| 15 to 19 Minutes | 24,131 (11.1%) | 25,982 (13.4%) |
| 20 to 24 Minutes | 23,718 (10.9%) | 24,222 (12.5%) |
| 25 to 29 Minutes | 12,126 (5.6%) | 10,962 (5.7%) |
| 30 to 34 Minutes | 27,140 (12.4%) | 23,360 (12.1%) |
| 35 to 39 Minutes | 6,538 (3.0%) | 6,192 (3.2%) |
| 40 to 44 Minutes | 10,736 (4.9%) | 7,972 (4.1%) |
| 45 to 59 Minutes | 24,838 (11.4%) | 18,048 (9.3%) |
| 60 to 89 Minutes | 35,865 (16.4%) | 24,103 (12.5%) |
| 90 or more Minutes | 15,266 (7.0%) | 11,784 (6.1%) |
Time of Departure to Work by Sex in Westchester County
The most frequent times of departure to work in Westchester County are 7:00 AM to 7:29 AM (34,999, 16.1%) for males and 8:00 AM to 8:29 AM (32,391, 16.8%) for females.
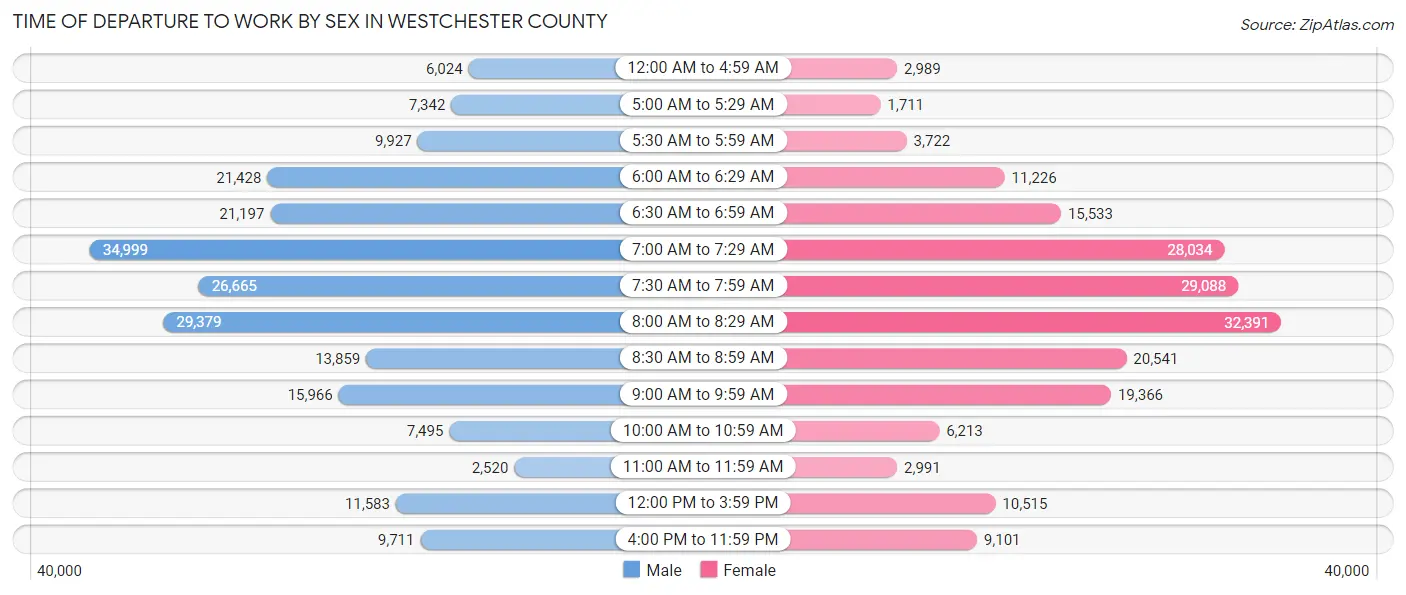
| Time of Departure | Male | Female |
| 12:00 AM to 4:59 AM | 6,024 (2.8%) | 2,989 (1.5%) |
| 5:00 AM to 5:29 AM | 7,342 (3.4%) | 1,711 (0.9%) |
| 5:30 AM to 5:59 AM | 9,927 (4.5%) | 3,722 (1.9%) |
| 6:00 AM to 6:29 AM | 21,428 (9.8%) | 11,226 (5.8%) |
| 6:30 AM to 6:59 AM | 21,197 (9.7%) | 15,533 (8.0%) |
| 7:00 AM to 7:29 AM | 34,999 (16.1%) | 28,034 (14.5%) |
| 7:30 AM to 7:59 AM | 26,665 (12.2%) | 29,088 (15.0%) |
| 8:00 AM to 8:29 AM | 29,379 (13.5%) | 32,391 (16.8%) |
| 8:30 AM to 8:59 AM | 13,859 (6.4%) | 20,541 (10.6%) |
| 9:00 AM to 9:59 AM | 15,966 (7.3%) | 19,366 (10.0%) |
| 10:00 AM to 10:59 AM | 7,495 (3.4%) | 6,213 (3.2%) |
| 11:00 AM to 11:59 AM | 2,520 (1.2%) | 2,991 (1.5%) |
| 12:00 PM to 3:59 PM | 11,583 (5.3%) | 10,515 (5.4%) |
| 4:00 PM to 11:59 PM | 9,711 (4.4%) | 9,101 (4.7%) |
| Total | 218,095 (100.0%) | 193,421 (100.0%) |
Housing Occupancy in Westchester County
Occupancy by Ownership in Westchester County
Of the total 367,740 dwellings in Westchester County, owner-occupied units account for 229,004 (62.3%), while renter-occupied units make up 138,736 (37.7%).
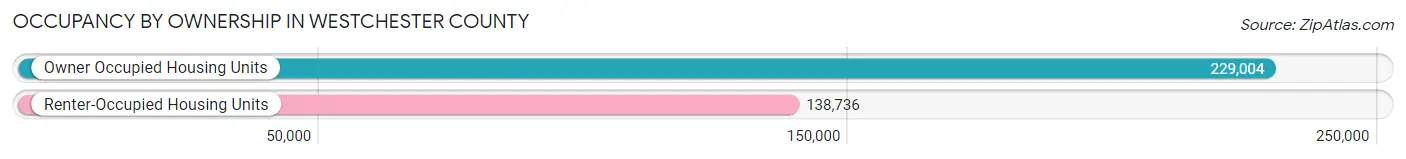
| Occupancy | # Housing Units | % Housing Units |
| Owner Occupied Housing Units | 229,004 | 62.3% |
| Renter-Occupied Housing Units | 138,736 | 37.7% |
| Total Occupied Housing Units | 367,740 | 100.0% |
Occupancy by Household Size in Westchester County
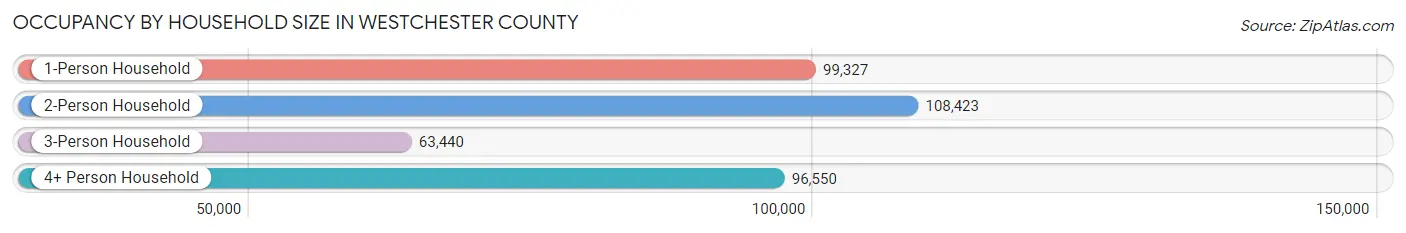
| Household Size | # Housing Units | % Housing Units |
| 1-Person Household | 99,327 | 27.0% |
| 2-Person Household | 108,423 | 29.5% |
| 3-Person Household | 63,440 | 17.2% |
| 4+ Person Household | 96,550 | 26.3% |
| Total Housing Units | 367,740 | 100.0% |
Occupancy by Ownership by Household Size in Westchester County
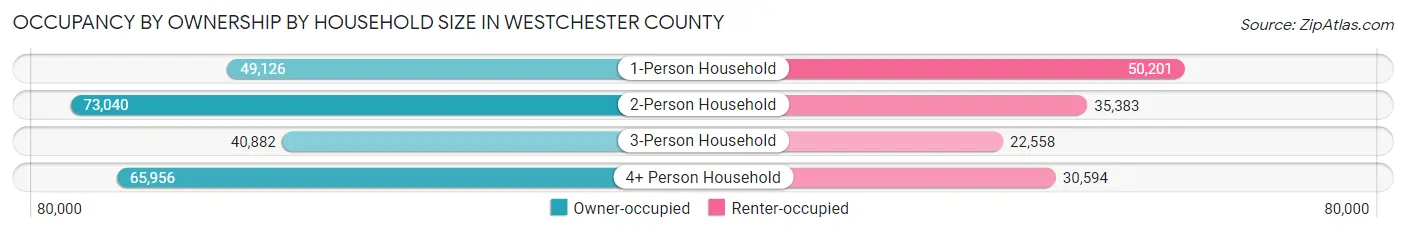
| Household Size | Owner-occupied | Renter-occupied |
| 1-Person Household | 49,126 (49.5%) | 50,201 (50.5%) |
| 2-Person Household | 73,040 (67.4%) | 35,383 (32.6%) |
| 3-Person Household | 40,882 (64.4%) | 22,558 (35.6%) |
| 4+ Person Household | 65,956 (68.3%) | 30,594 (31.7%) |
| Total Housing Units | 229,004 (62.3%) | 138,736 (37.7%) |
Occupancy by Educational Attainment in Westchester County
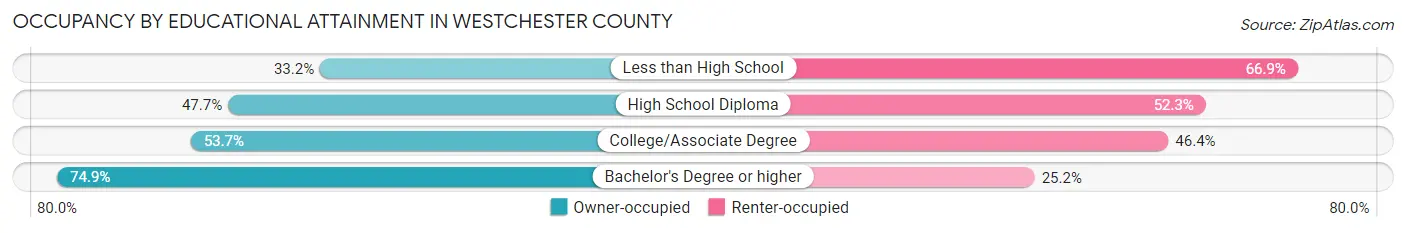
| Household Size | Owner-occupied | Renter-occupied |
| Less than High School | 11,441 (33.2%) | 23,073 (66.8%) |
| High School Diploma | 28,812 (47.7%) | 31,545 (52.3%) |
| College/Associate Degree | 39,216 (53.6%) | 33,879 (46.4%) |
| Bachelor's Degree or higher | 149,535 (74.9%) | 50,239 (25.2%) |
Occupancy by Age of Householder in Westchester County
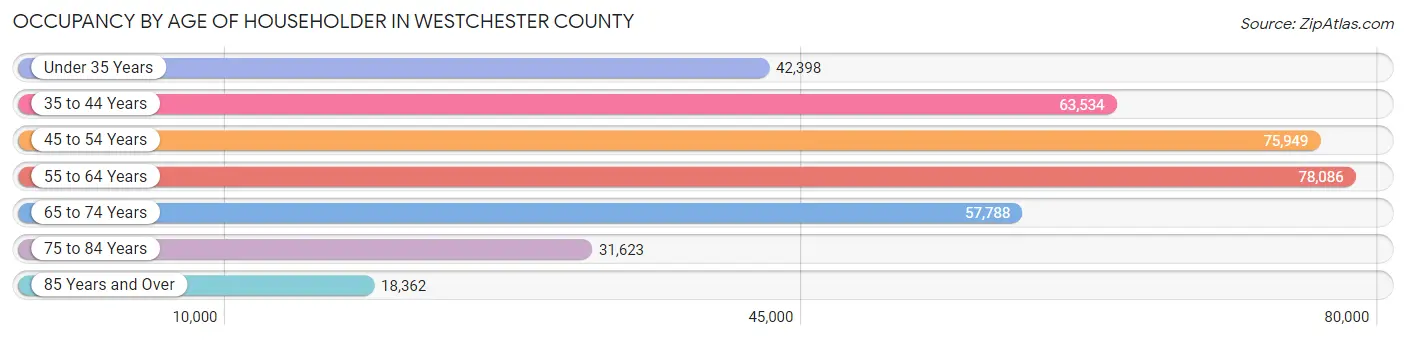
| Age Bracket | # Households | % Households |
| Under 35 Years | 42,398 | 11.5% |
| 35 to 44 Years | 63,534 | 17.3% |
| 45 to 54 Years | 75,949 | 20.6% |
| 55 to 64 Years | 78,086 | 21.2% |
| 65 to 74 Years | 57,788 | 15.7% |
| 75 to 84 Years | 31,623 | 8.6% |
| 85 Years and Over | 18,362 | 5.0% |
| Total | 367,740 | 100.0% |
Housing Finances in Westchester County
Median Income by Occupancy in Westchester County
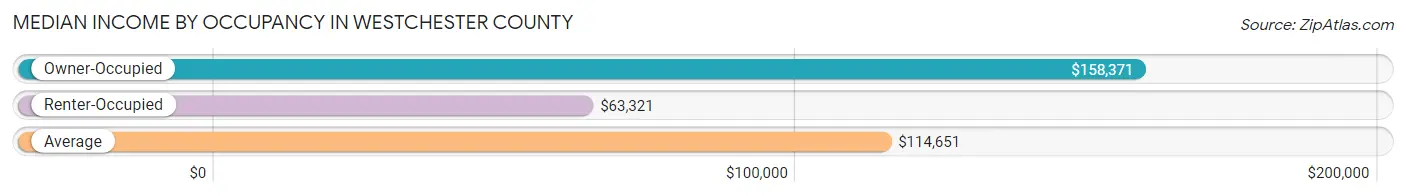
| Occupancy Type | # Households | Median Income |
| Owner-Occupied | 229,004 (62.3%) | $158,371 |
| Renter-Occupied | 138,736 (37.7%) | $63,321 |
| Average | 367,740 (100.0%) | $114,651 |
Occupancy by Householder Income Bracket in Westchester County
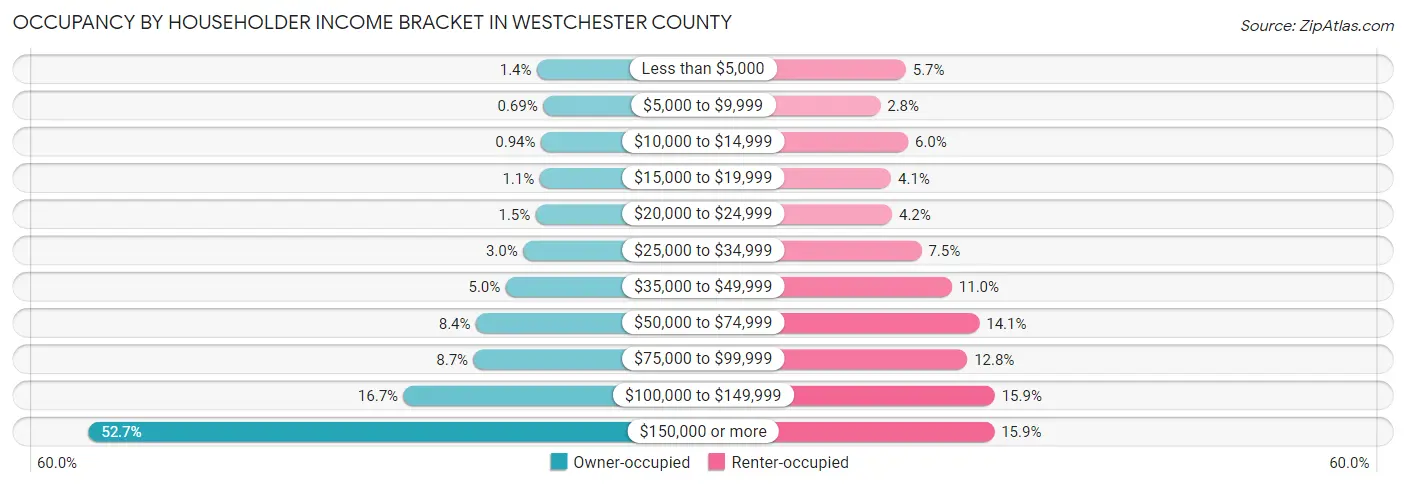
| Income Bracket | Owner-occupied | Renter-occupied |
| Less than $5,000 | 3,198 (1.4%) | 7,963 (5.7%) |
| $5,000 to $9,999 | 1,582 (0.7%) | 3,921 (2.8%) |
| $10,000 to $14,999 | 2,157 (0.9%) | 8,329 (6.0%) |
| $15,000 to $19,999 | 2,496 (1.1%) | 5,631 (4.1%) |
| $20,000 to $24,999 | 3,524 (1.5%) | 5,786 (4.2%) |
| $25,000 to $34,999 | 6,817 (3.0%) | 10,443 (7.5%) |
| $35,000 to $49,999 | 11,375 (5.0%) | 15,274 (11.0%) |
| $50,000 to $74,999 | 19,173 (8.4%) | 19,624 (14.1%) |
| $75,000 to $99,999 | 19,808 (8.6%) | 17,696 (12.8%) |
| $100,000 to $149,999 | 38,135 (16.7%) | 22,075 (15.9%) |
| $150,000 or more | 120,739 (52.7%) | 21,994 (15.9%) |
| Total | 229,004 (100.0%) | 138,736 (100.0%) |
Monthly Housing Cost Tiers in Westchester County
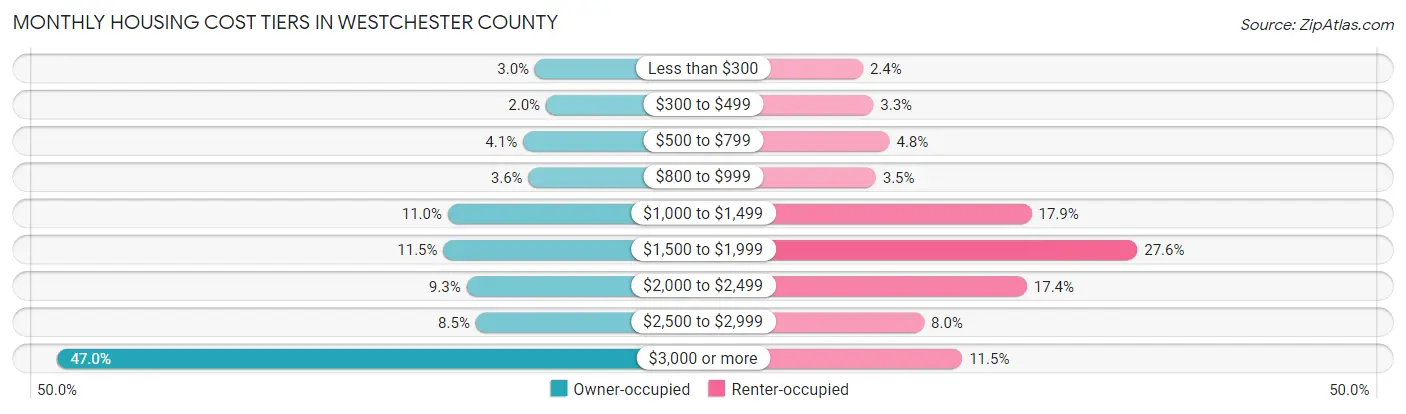
| Monthly Cost | Owner-occupied | Renter-occupied |
| Less than $300 | 6,915 (3.0%) | 3,267 (2.4%) |
| $300 to $499 | 4,600 (2.0%) | 4,597 (3.3%) |
| $500 to $799 | 9,426 (4.1%) | 6,661 (4.8%) |
| $800 to $999 | 8,286 (3.6%) | 4,900 (3.5%) |
| $1,000 to $1,499 | 25,275 (11.0%) | 24,796 (17.9%) |
| $1,500 to $1,999 | 26,213 (11.5%) | 38,304 (27.6%) |
| $2,000 to $2,499 | 21,332 (9.3%) | 24,200 (17.4%) |
| $2,500 to $2,999 | 19,405 (8.5%) | 11,076 (8.0%) |
| $3,000 or more | 107,552 (47.0%) | 15,942 (11.5%) |
| Total | 229,004 (100.0%) | 138,736 (100.0%) |
Physical Housing Characteristics in Westchester County
Housing Structures in Westchester County
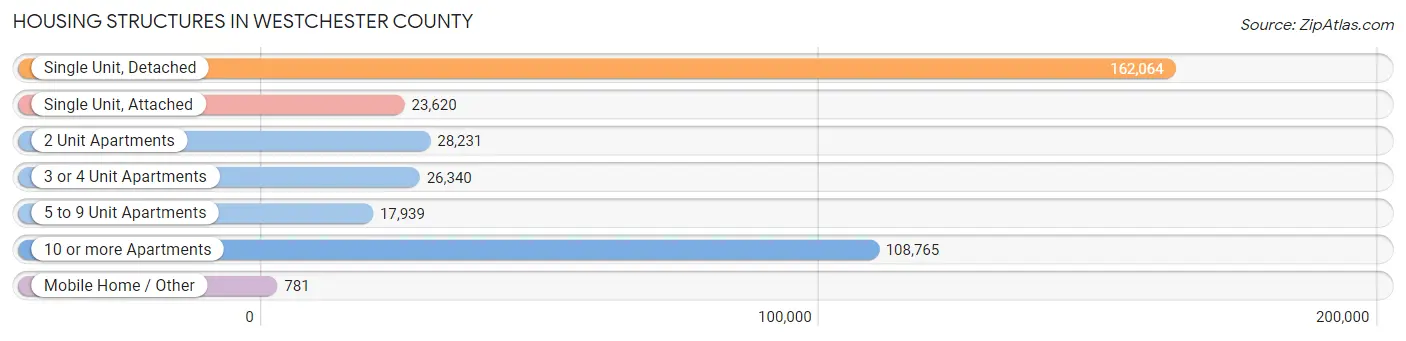
| Structure Type | # Housing Units | % Housing Units |
| Single Unit, Detached | 162,064 | 44.1% |
| Single Unit, Attached | 23,620 | 6.4% |
| 2 Unit Apartments | 28,231 | 7.7% |
| 3 or 4 Unit Apartments | 26,340 | 7.2% |
| 5 to 9 Unit Apartments | 17,939 | 4.9% |
| 10 or more Apartments | 108,765 | 29.6% |
| Mobile Home / Other | 781 | 0.2% |
| Total | 367,740 | 100.0% |
Housing Structures by Occupancy in Westchester County
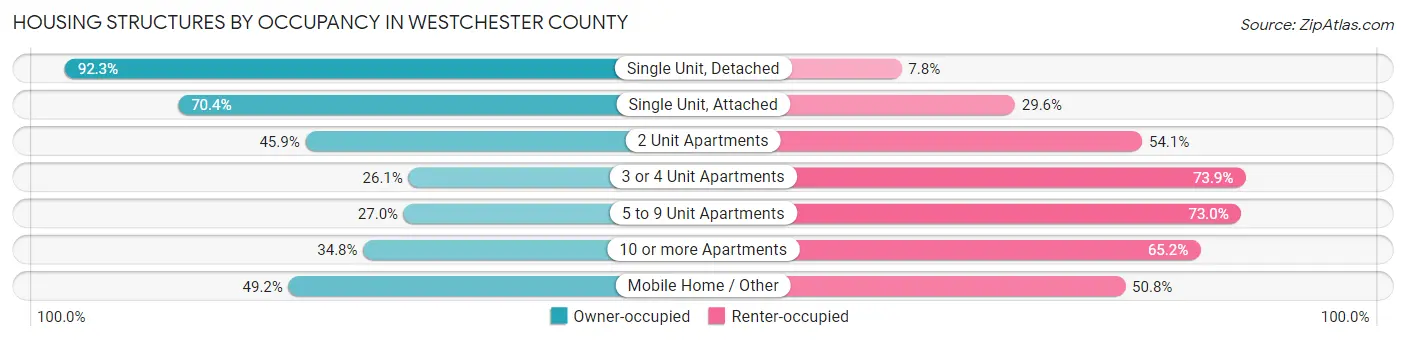
| Structure Type | Owner-occupied | Renter-occupied |
| Single Unit, Detached | 149,500 (92.2%) | 12,564 (7.7%) |
| Single Unit, Attached | 16,632 (70.4%) | 6,988 (29.6%) |
| 2 Unit Apartments | 12,964 (45.9%) | 15,267 (54.1%) |
| 3 or 4 Unit Apartments | 6,863 (26.1%) | 19,477 (73.9%) |
| 5 to 9 Unit Apartments | 4,838 (27.0%) | 13,101 (73.0%) |
| 10 or more Apartments | 37,823 (34.8%) | 70,942 (65.2%) |
| Mobile Home / Other | 384 (49.2%) | 397 (50.8%) |
| Total | 229,004 (62.3%) | 138,736 (37.7%) |
Housing Structures by Number of Rooms in Westchester County

| Number of Rooms | Owner-occupied | Renter-occupied |
| 1 Room | 1,542 (0.7%) | 10,245 (7.4%) |
| 2 or 3 Rooms | 18,783 (8.2%) | 46,038 (33.2%) |
| 4 or 5 Rooms | 53,489 (23.4%) | 61,823 (44.6%) |
| 6 or 7 Rooms | 67,083 (29.3%) | 15,717 (11.3%) |
| 8 or more Rooms | 88,107 (38.5%) | 4,913 (3.5%) |
| Total | 229,004 (100.0%) | 138,736 (100.0%) |
Housing Structure by Heating Type in Westchester County
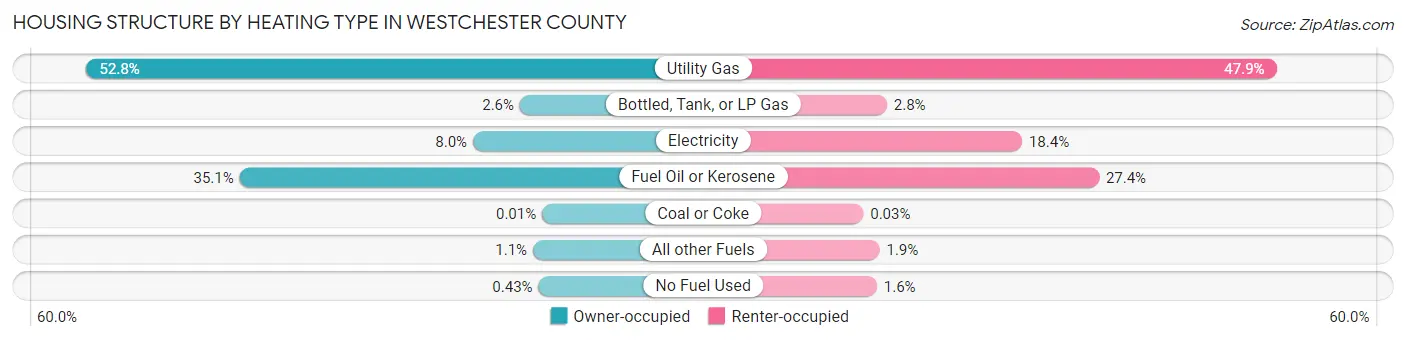
| Heating Type | Owner-occupied | Renter-occupied |
| Utility Gas | 120,974 (52.8%) | 66,486 (47.9%) |
| Bottled, Tank, or LP Gas | 5,919 (2.6%) | 3,824 (2.8%) |
| Electricity | 18,358 (8.0%) | 25,566 (18.4%) |
| Fuel Oil or Kerosene | 80,333 (35.1%) | 37,951 (27.4%) |
| Coal or Coke | 15 (0.0%) | 42 (0.0%) |
| All other Fuels | 2,421 (1.1%) | 2,647 (1.9%) |
| No Fuel Used | 984 (0.4%) | 2,220 (1.6%) |
| Total | 229,004 (100.0%) | 138,736 (100.0%) |
Household Vehicle Usage in Westchester County
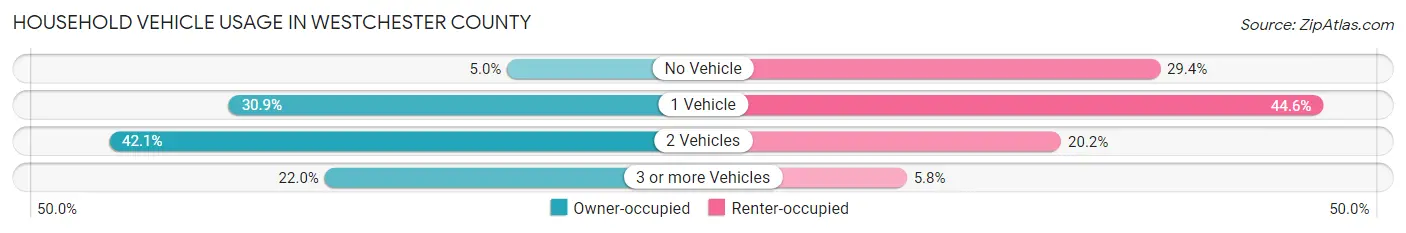
| Vehicles per Household | Owner-occupied | Renter-occupied |
| No Vehicle | 11,345 (5.0%) | 40,804 (29.4%) |
| 1 Vehicle | 70,865 (30.9%) | 61,937 (44.6%) |
| 2 Vehicles | 96,438 (42.1%) | 27,991 (20.2%) |
| 3 or more Vehicles | 50,356 (22.0%) | 8,004 (5.8%) |
| Total | 229,004 (100.0%) | 138,736 (100.0%) |
Real Estate & Mortgages in Westchester County
Real Estate and Mortgage Overview in Westchester County
| Characteristic | Without Mortgage | With Mortgage |
| Housing Units | 86,412 | 142,592 |
| Median Property Value | $575,400 | $643,700 |
| Median Household Income | $112,902 | $86,899 |
| Monthly Housing Costs | $1,501 | $97,149 |
| Real Estate Taxes | $10,001 | $9,352 |
Property Value by Mortgage Status in Westchester County
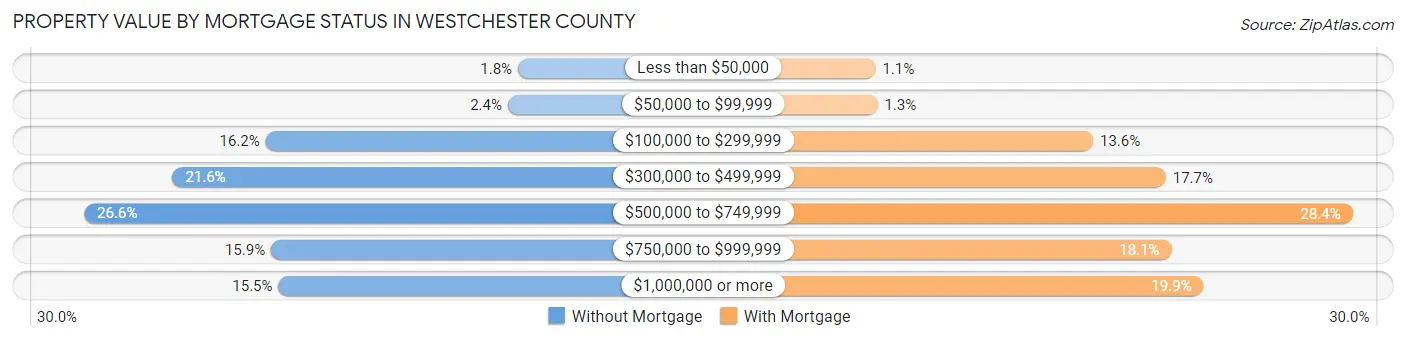
| Property Value | Without Mortgage | With Mortgage |
| Less than $50,000 | 1,568 (1.8%) | 1,624 (1.1%) |
| $50,000 to $99,999 | 2,064 (2.4%) | 1,776 (1.3%) |
| $100,000 to $299,999 | 14,022 (16.2%) | 19,352 (13.6%) |
| $300,000 to $499,999 | 18,619 (21.5%) | 25,277 (17.7%) |
| $500,000 to $749,999 | 22,983 (26.6%) | 40,489 (28.4%) |
| $750,000 to $999,999 | 13,758 (15.9%) | 25,733 (18.0%) |
| $1,000,000 or more | 13,398 (15.5%) | 28,341 (19.9%) |
| Total | 86,412 (100.0%) | 142,592 (100.0%) |
Household Income by Mortgage Status in Westchester County
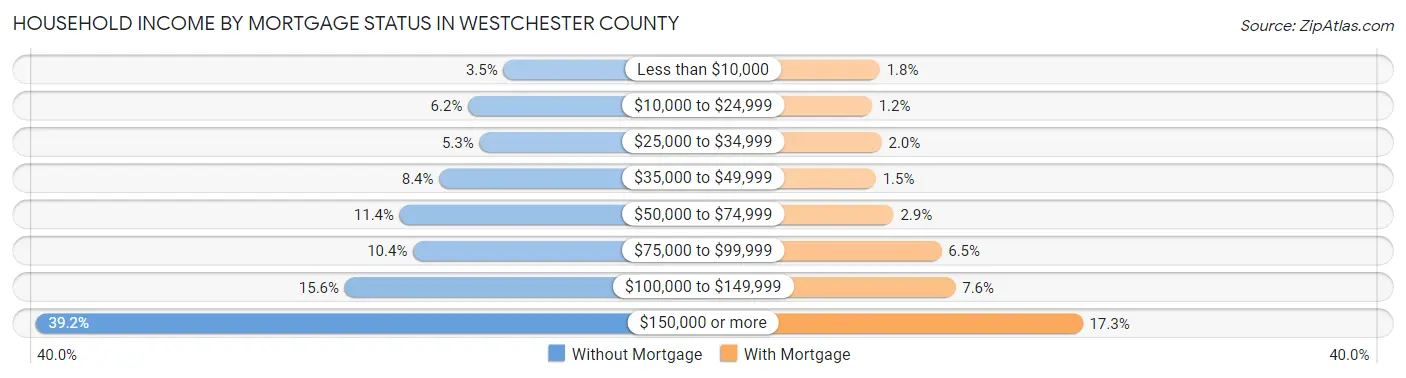
| Household Income | Without Mortgage | With Mortgage |
| Less than $10,000 | 3,029 (3.5%) | 2,620 (1.8%) |
| $10,000 to $24,999 | 5,357 (6.2%) | 1,751 (1.2%) |
| $25,000 to $34,999 | 4,616 (5.3%) | 2,820 (2.0%) |
| $35,000 to $49,999 | 7,258 (8.4%) | 2,201 (1.5%) |
| $50,000 to $74,999 | 9,858 (11.4%) | 4,117 (2.9%) |
| $75,000 to $99,999 | 8,977 (10.4%) | 9,315 (6.5%) |
| $100,000 to $149,999 | 13,477 (15.6%) | 10,831 (7.6%) |
| $150,000 or more | 33,840 (39.2%) | 24,658 (17.3%) |
| Total | 86,412 (100.0%) | 142,592 (100.0%) |
Property Value to Household Income Ratio in Westchester County
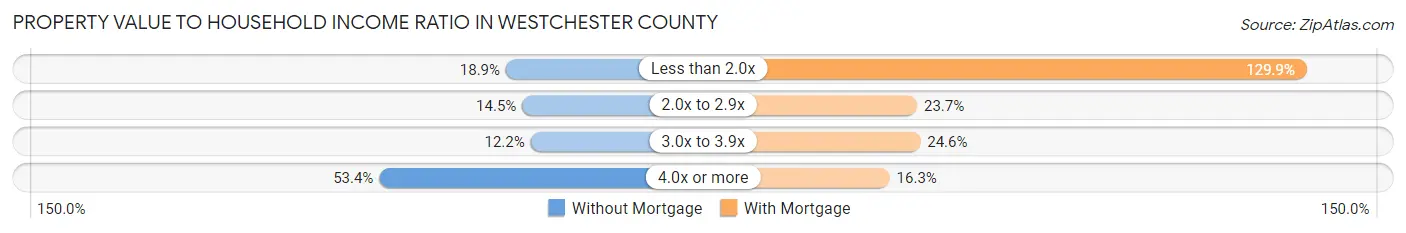
| Value-to-Income Ratio | Without Mortgage | With Mortgage |
| Less than 2.0x | 16,333 (18.9%) | 185,226 (129.9%) |
| 2.0x to 2.9x | 12,491 (14.5%) | 33,834 (23.7%) |
| 3.0x to 3.9x | 10,526 (12.2%) | 35,102 (24.6%) |
| 4.0x or more | 46,141 (53.4%) | 23,200 (16.3%) |
| Total | 86,412 (100.0%) | 142,592 (100.0%) |
Real Estate Taxes by Mortgage Status in Westchester County
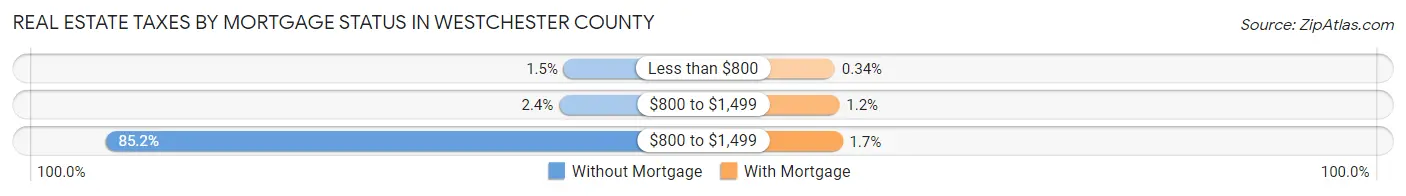
| Property Taxes | Without Mortgage | With Mortgage |
| Less than $800 | 1,314 (1.5%) | 482 (0.3%) |
| $800 to $1,499 | 2,044 (2.4%) | 1,644 (1.1%) |
| $800 to $1,499 | 73,634 (85.2%) | 2,456 (1.7%) |
| Total | 86,412 (100.0%) | 142,592 (100.0%) |
Health & Disability in Westchester County
Health Insurance Coverage by Age in Westchester County
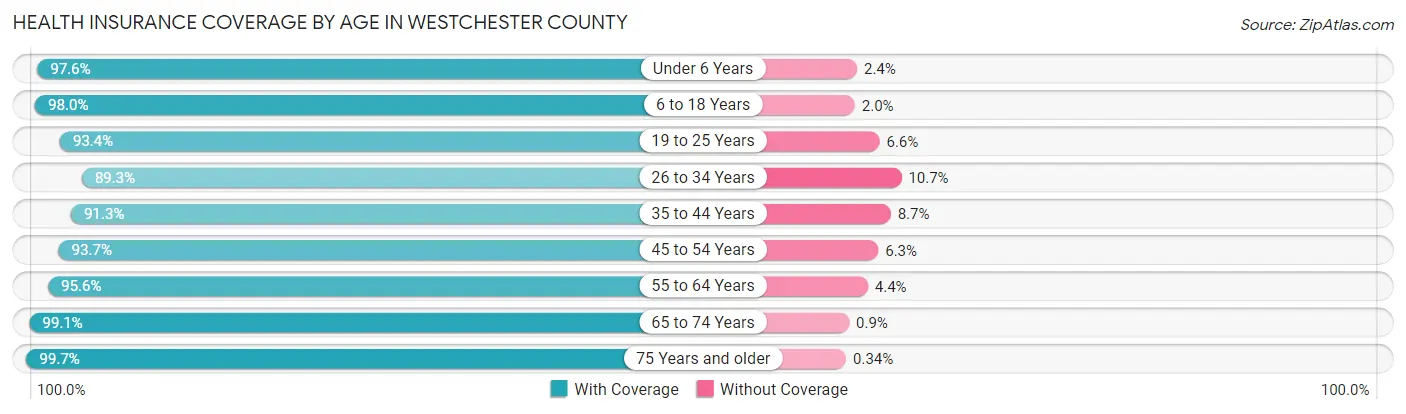
| Age Bracket | With Coverage | Without Coverage |
| Under 6 Years | 61,972 (97.6%) | 1,510 (2.4%) |
| 6 to 18 Years | 161,007 (98.0%) | 3,234 (2.0%) |
| 19 to 25 Years | 79,775 (93.4%) | 5,614 (6.6%) |
| 26 to 34 Years | 90,849 (89.3%) | 10,845 (10.7%) |
| 35 to 44 Years | 117,118 (91.3%) | 11,103 (8.7%) |
| 45 to 54 Years | 129,817 (93.7%) | 8,781 (6.3%) |
| 55 to 64 Years | 130,502 (95.6%) | 5,991 (4.4%) |
| 65 to 74 Years | 93,742 (99.1%) | 853 (0.9%) |
| 75 Years and older | 74,458 (99.7%) | 255 (0.3%) |
| Total | 939,240 (95.1%) | 48,186 (4.9%) |
Health Insurance Coverage by Citizenship Status in Westchester County
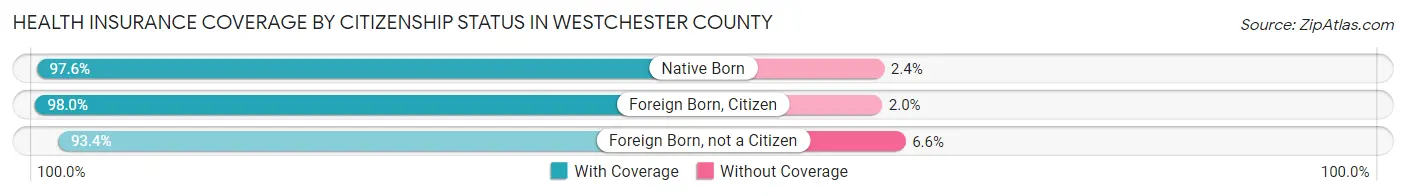
| Citizenship Status | With Coverage | Without Coverage |
| Native Born | 61,972 (97.6%) | 1,510 (2.4%) |
| Foreign Born, Citizen | 161,007 (98.0%) | 3,234 (2.0%) |
| Foreign Born, not a Citizen | 79,775 (93.4%) | 5,614 (6.6%) |
Health Insurance Coverage by Household Income in Westchester County
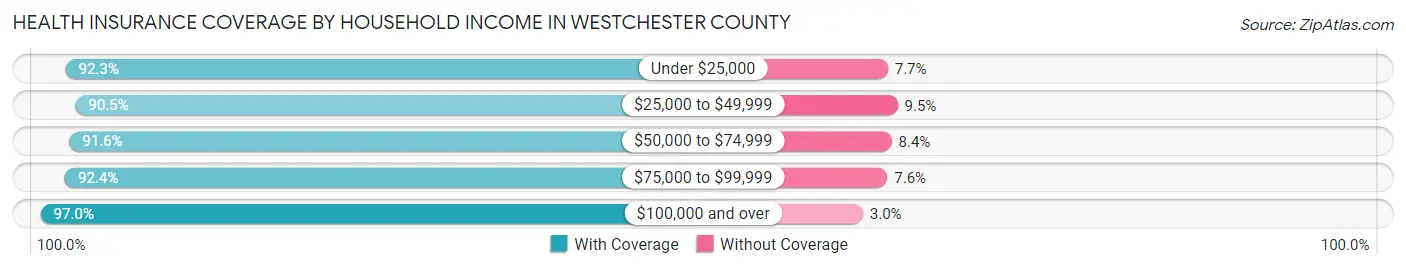
| Household Income | With Coverage | Without Coverage |
| Under $25,000 | 68,481 (92.3%) | 5,699 (7.7%) |
| $25,000 to $49,999 | 80,672 (90.5%) | 8,490 (9.5%) |
| $50,000 to $74,999 | 81,750 (91.6%) | 7,488 (8.4%) |
| $75,000 to $99,999 | 84,332 (92.4%) | 6,930 (7.6%) |
| $100,000 and over | 609,606 (97.0%) | 18,919 (3.0%) |
Public vs Private Health Insurance Coverage by Age in Westchester County
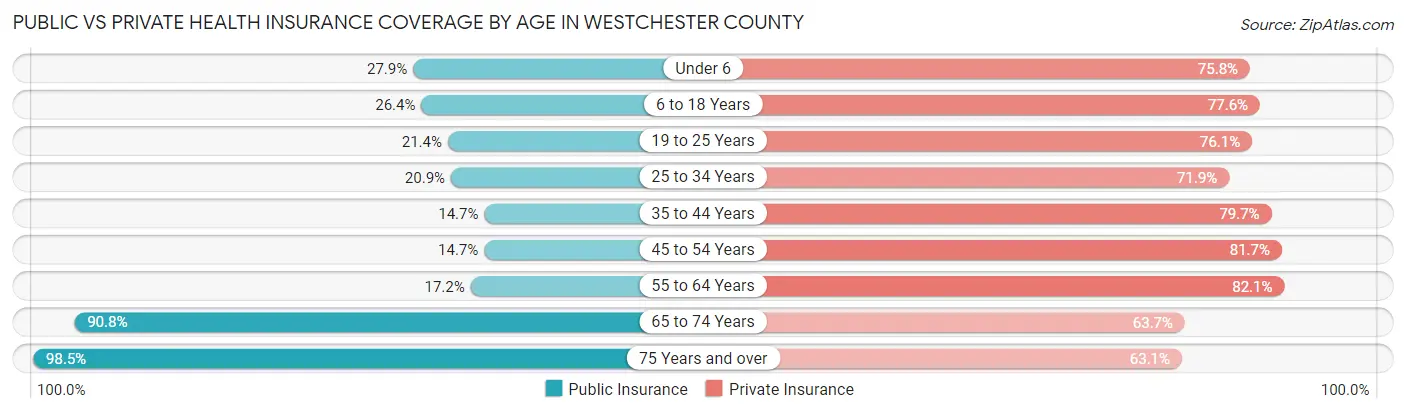
| Age Bracket | Public Insurance | Private Insurance |
| Under 6 | 17,710 (27.9%) | 48,088 (75.7%) |
| 6 to 18 Years | 43,313 (26.4%) | 127,470 (77.6%) |
| 19 to 25 Years | 18,305 (21.4%) | 65,014 (76.1%) |
| 25 to 34 Years | 21,223 (20.9%) | 73,105 (71.9%) |
| 35 to 44 Years | 18,820 (14.7%) | 102,246 (79.7%) |
| 45 to 54 Years | 20,389 (14.7%) | 113,197 (81.7%) |
| 55 to 64 Years | 23,524 (17.2%) | 112,106 (82.1%) |
| 65 to 74 Years | 85,877 (90.8%) | 60,225 (63.7%) |
| 75 Years and over | 73,555 (98.5%) | 47,154 (63.1%) |
| Total | 322,716 (32.7%) | 748,605 (75.8%) |
Disability Status by Sex by Age in Westchester County
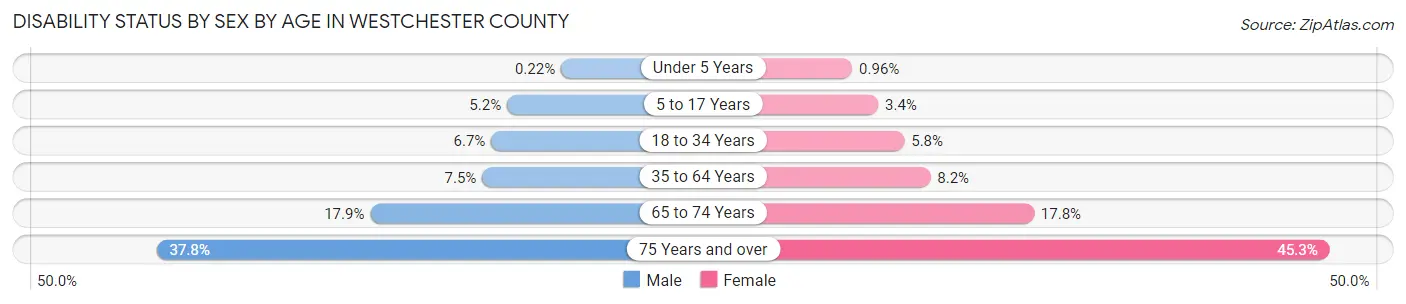
| Age Bracket | Male | Female |
| Under 5 Years | 61 (0.2%) | 248 (1.0%) |
| 5 to 17 Years | 4,324 (5.2%) | 2,628 (3.4%) |
| 18 to 34 Years | 6,752 (6.7%) | 5,809 (5.8%) |
| 35 to 64 Years | 14,898 (7.5%) | 16,879 (8.2%) |
| 65 to 74 Years | 7,833 (17.9%) | 9,070 (17.8%) |
| 75 Years and over | 10,952 (37.8%) | 20,683 (45.3%) |
Disability Class by Sex by Age in Westchester County
Disability Class: Hearing Difficulty
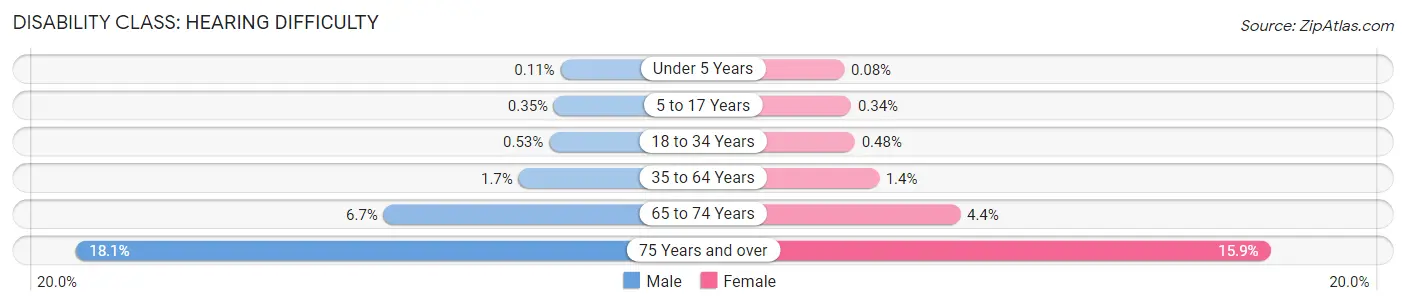
| Age Bracket | Male | Female |
| Under 5 Years | 29 (0.1%) | 22 (0.1%) |
| 5 to 17 Years | 287 (0.4%) | 269 (0.3%) |
| 18 to 34 Years | 534 (0.5%) | 483 (0.5%) |
| 35 to 64 Years | 3,286 (1.7%) | 2,810 (1.4%) |
| 65 to 74 Years | 2,917 (6.7%) | 2,234 (4.4%) |
| 75 Years and over | 5,246 (18.1%) | 7,272 (15.9%) |
Disability Class: Vision Difficulty
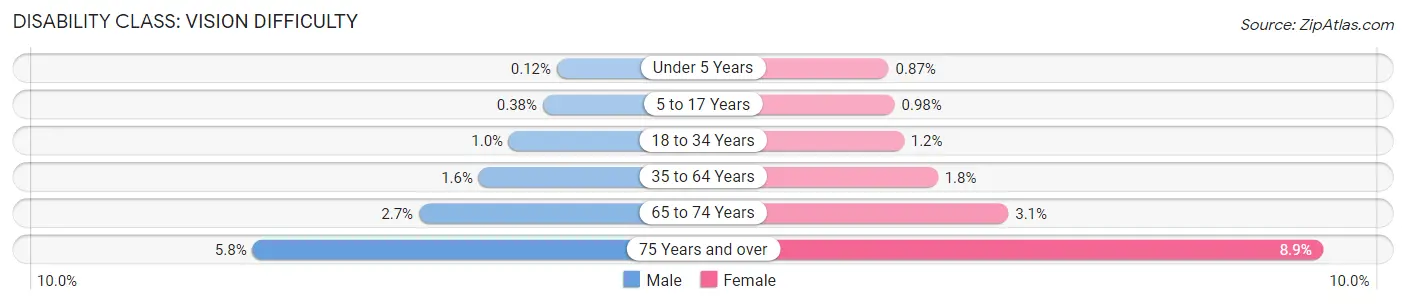
| Age Bracket | Male | Female |
| Under 5 Years | 32 (0.1%) | 226 (0.9%) |
| 5 to 17 Years | 310 (0.4%) | 766 (1.0%) |
| 18 to 34 Years | 1,021 (1.0%) | 1,156 (1.1%) |
| 35 to 64 Years | 3,106 (1.6%) | 3,646 (1.8%) |
| 65 to 74 Years | 1,172 (2.7%) | 1,570 (3.1%) |
| 75 Years and over | 1,675 (5.8%) | 4,088 (8.9%) |
Disability Class: Cognitive Difficulty
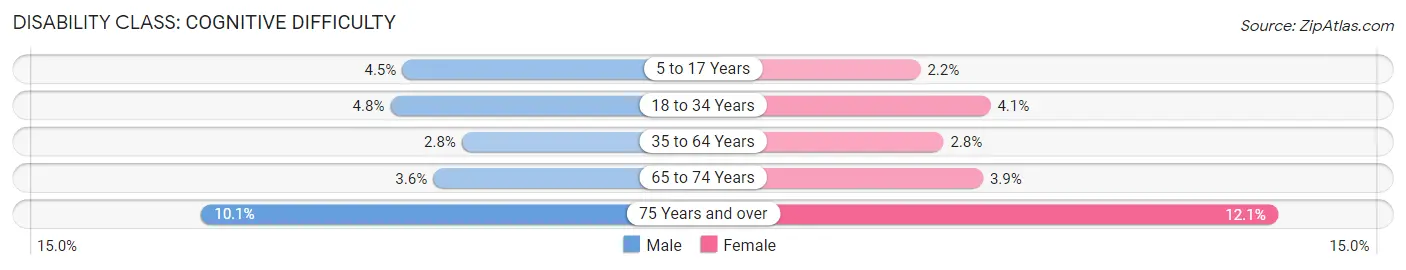
| Age Bracket | Male | Female |
| 5 to 17 Years | 3,707 (4.5%) | 1,711 (2.2%) |
| 18 to 34 Years | 4,855 (4.8%) | 4,154 (4.1%) |
| 35 to 64 Years | 5,601 (2.8%) | 5,813 (2.8%) |
| 65 to 74 Years | 1,585 (3.6%) | 1,998 (3.9%) |
| 75 Years and over | 2,924 (10.1%) | 5,544 (12.1%) |
Disability Class: Ambulatory Difficulty
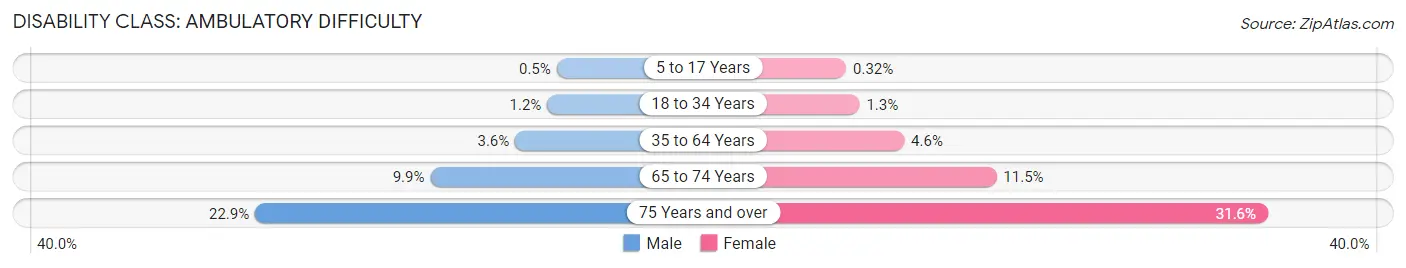
| Age Bracket | Male | Female |
| 5 to 17 Years | 410 (0.5%) | 248 (0.3%) |
| 18 to 34 Years | 1,207 (1.2%) | 1,310 (1.3%) |
| 35 to 64 Years | 7,095 (3.6%) | 9,517 (4.6%) |
| 65 to 74 Years | 4,319 (9.9%) | 5,838 (11.5%) |
| 75 Years and over | 6,639 (22.9%) | 14,457 (31.6%) |
Disability Class: Self-Care Difficulty
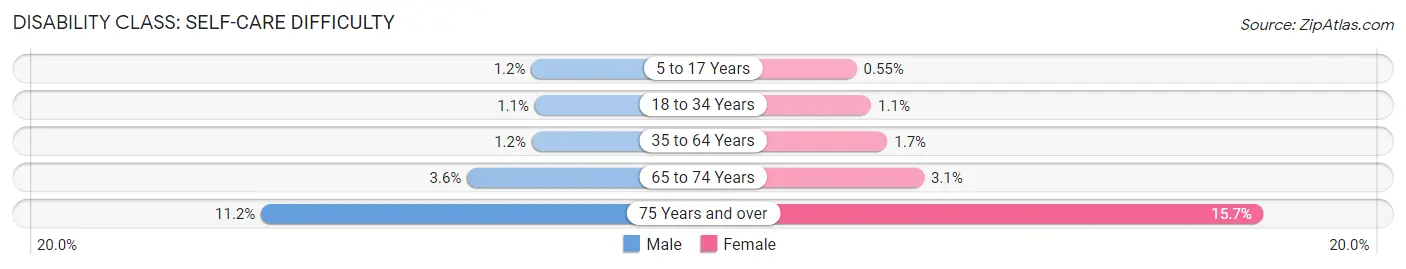
| Age Bracket | Male | Female |
| 5 to 17 Years | 982 (1.2%) | 429 (0.5%) |
| 18 to 34 Years | 1,069 (1.1%) | 1,097 (1.1%) |
| 35 to 64 Years | 2,312 (1.2%) | 3,469 (1.7%) |
| 65 to 74 Years | 1,559 (3.6%) | 1,550 (3.0%) |
| 75 Years and over | 3,256 (11.2%) | 7,155 (15.7%) |
Technology Access in Westchester County
Computing Device Access in Westchester County
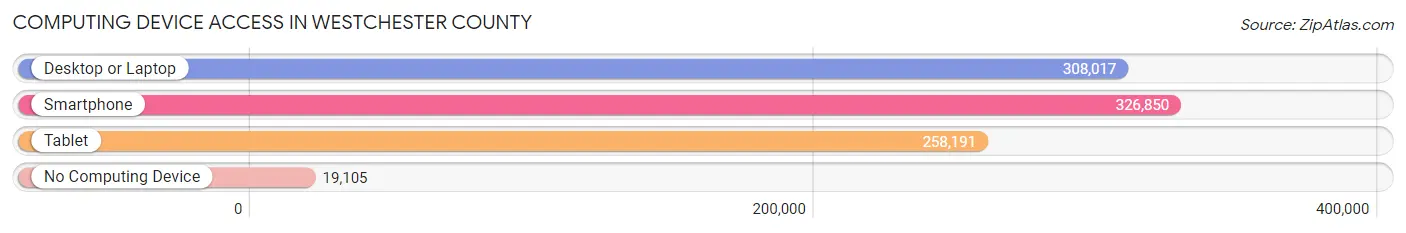
| Device Type | # Households | % Households |
| Desktop or Laptop | 308,017 | 83.8% |
| Smartphone | 326,850 | 88.9% |
| Tablet | 258,191 | 70.2% |
| No Computing Device | 19,105 | 5.2% |
| Total | 367,740 | 100.0% |
Internet Access in Westchester County
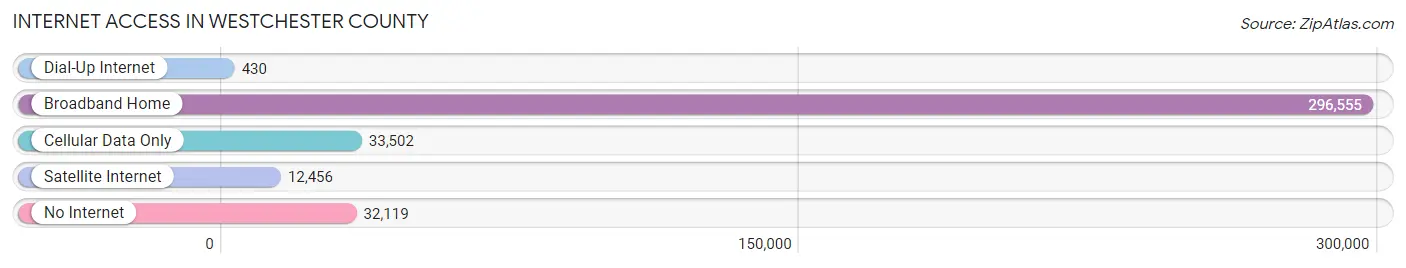
| Internet Type | # Households | % Households |
| Dial-Up Internet | 430 | 0.1% |
| Broadband Home | 296,555 | 80.6% |
| Cellular Data Only | 33,502 | 9.1% |
| Satellite Internet | 12,456 | 3.4% |
| No Internet | 32,119 | 8.7% |
| Total | 367,740 | 100.0% |
Westchester County Summary
Westchester County, NY is a county located in the southeastern portion of the state of New York. It is the second most populous county in the state, with a population of 974,542 as of the 2010 census. The county seat is White Plains, and the largest city is Yonkers. Westchester County is bordered by Putnam County to the north, Fairfield County, Connecticut to the east, Long Island Sound to the south, and Rockland County to the west.
History
Westchester County was established in 1683, when the Province of New York was divided into twelve counties. It was named after the city of Chester in England. The county was originally part of the Dutch colony of New Netherland, and was later part of the Province of New York. During the American Revolution, Westchester County was a major center of military activity. The Battle of White Plains was fought in the county in 1776, and the Battle of Stony Point was fought in 1779.
Geography
Westchester County covers an area of 500 square miles, and is located in the southeastern portion of the state of New York. It is bordered by Putnam County to the north, Fairfield County, Connecticut to the east, Long Island Sound to the south, and Rockland County to the west. The county is divided into six towns, and twenty-four cities and villages. The terrain of the county is mostly hilly, with the Hudson River forming its western border. The highest point in the county is the summit of South Mountain, at 1,340 feet above sea level.
Economy
Westchester County has a diverse economy, with a mix of industries including manufacturing, finance, healthcare, and retail. The county is home to several major corporations, including IBM, PepsiCo, and MasterCard. The county is also home to several major universities, including Pace University, Manhattanville College, and Iona College.
Westchester County is a major tourist destination, with attractions such as the Hudson River Museum, the Bronx Zoo, and the New York Botanical Garden. The county is also home to several major sports teams, including the New York Yankees, the New York Mets, and the New York Rangers.
Demographics
As of the 2010 census, Westchester County had a population of 974,542. The racial makeup of the county was 68.2% White, 17.3% African American, 8.4% Hispanic or Latino, and 6.1% Asian. The median household income was $83,856, and the median family income was $99,717. The per capita income was $41,845.
Westchester County is home to a large and diverse population. The county is home to several major religious groups, including Roman Catholics, Jews, and Muslims. The county is also home to a large immigrant population, with the largest groups being from the Dominican Republic, India, and China.
Common Questions
What is Per Capita Income in Westchester County?
Per Capita income in Westchester County is $67,776.
What is the Median Family Income in Westchester County?
Median Family Income in Westchester County is $147,091.
What is the Median Household income in Westchester County?
Median Household Income in Westchester County is $114,651.
What is Income or Wage Gap in Westchester County?
Income or Wage Gap in Westchester County is 26.9%.
Women in Westchester County earn 73.1 cents for every dollar earned by a man.
What is Family Income Deficit in Westchester County?
Family Income Deficit in Westchester County is $11,252.
Families that are below poverty line in Westchester County earn $11,252 less on average than the poverty threshold level.
What is Inequality or Gini Index in Westchester County?
Inequality or Gini Index in Westchester County is 0.53.
What is the Total Population of Westchester County?
Total Population of Westchester County is 997,904.
What is the Total Male Population of Westchester County?
Total Male Population of Westchester County is 487,019.
What is the Total Female Population of Westchester County?
Total Female Population of Westchester County is 510,885.
What is the Ratio of Males per 100 Females in Westchester County?
There are 95.33 Males per 100 Females in Westchester County.
What is the Ratio of Females per 100 Males in Westchester County?
There are 104.90 Females per 100 Males in Westchester County.
What is the Median Population Age in Westchester County?
Median Population Age in Westchester County is 41.3 Years.
What is the Average Family Size in Westchester County
Average Family Size in Westchester County is 3.2 People.
What is the Average Household Size in Westchester County
Average Household Size in Westchester County is 2.6 People.
How Large is the Labor Force in Westchester County?
There are 528,020 People in the Labor Forcein in Westchester County.
What is the Percentage of People in the Labor Force in Westchester County?
65.2% of People are in the Labor Force in Westchester County.
What is the Unemployment Rate in Westchester County?
Unemployment Rate in Westchester County is 6.0%.