Suffolk County, NY Map & Demographics
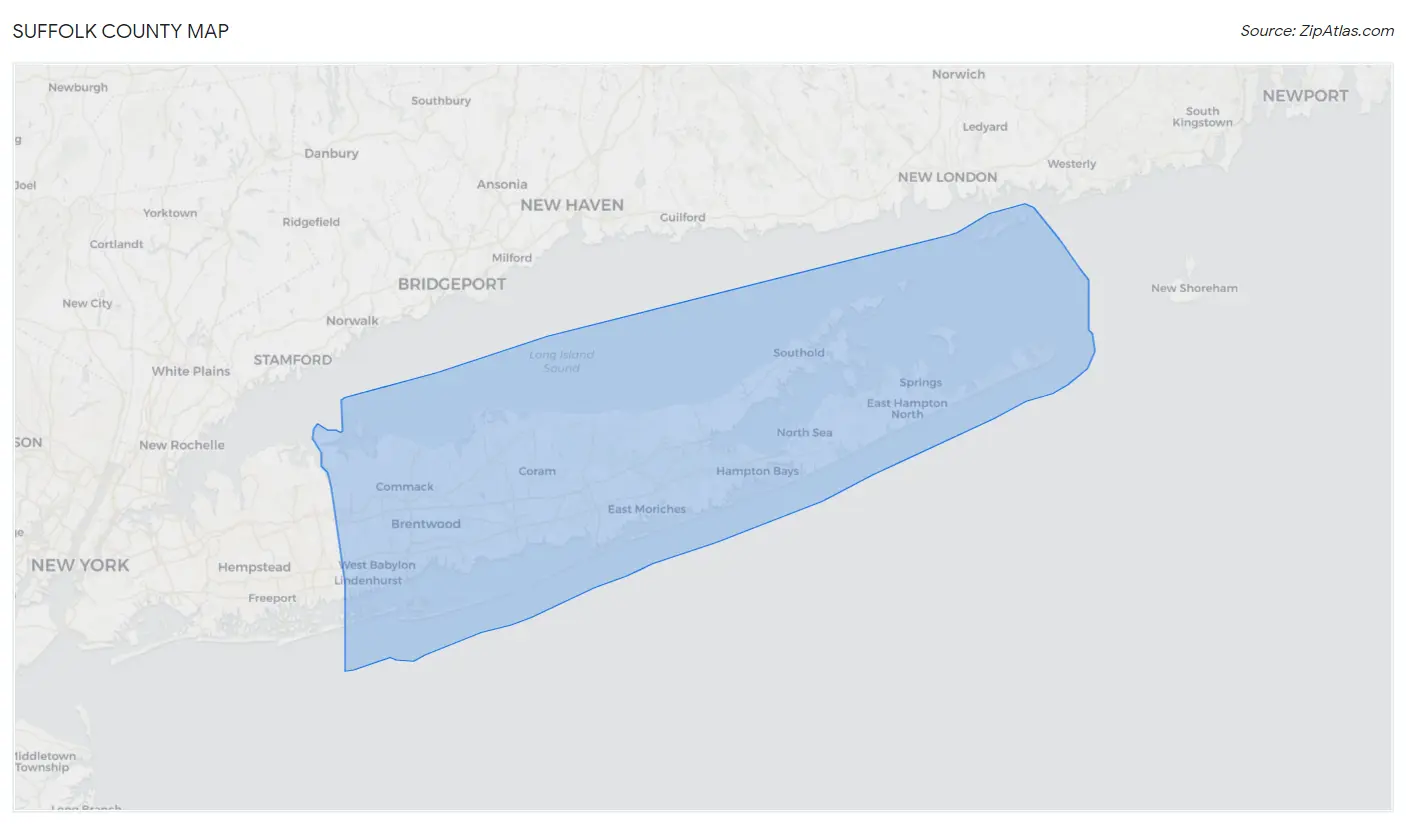
Suffolk County Map
Suffolk County Overview
$54,127
PER CAPITA INCOME
$141,671
AVG FAMILY INCOME
$122,498
AVG HOUSEHOLD INCOME
28.9%
WAGE / INCOME GAP [ % ]
71.1¢/ $1
WAGE / INCOME GAP [ $ ]
$11,166
FAMILY INCOME DEFICIT
0.44
INEQUALITY / GINI INDEX
1,524,486
TOTAL POPULATION
756,707
MALE POPULATION
767,779
FEMALE POPULATION
98.56
MALES / 100 FEMALES
101.46
FEMALES / 100 MALES
41.7
MEDIAN AGE
3.4
AVG FAMILY SIZE
2.9
AVG HOUSEHOLD SIZE
821,962
LABOR FORCE [ PEOPLE ]
65.8%
PERCENT IN LABOR FORCE
4.8%
UNEMPLOYMENT RATE
Income in Suffolk County
Income Overview in Suffolk County
Per Capita Income in Suffolk County is $54,127, while median incomes of families and households are $141,671 and $122,498 respectively.
| Characteristic | Number | Measure |
| Per Capita Income | 1,524,486 | $54,127 |
| Median Family Income | 370,459 | $141,671 |
| Mean Family Income | 370,459 | $176,775 |
| Median Household Income | 510,686 | $122,498 |
| Mean Household Income | 510,686 | $156,189 |
| Income Deficit | 370,459 | $11,166 |
| Wage / Income Gap (%) | 1,524,486 | 28.90% |
| Wage / Income Gap ($) | 1,524,486 | 71.10¢ per $1 |
| Gini / Inequality Index | 1,524,486 | 0.44 |
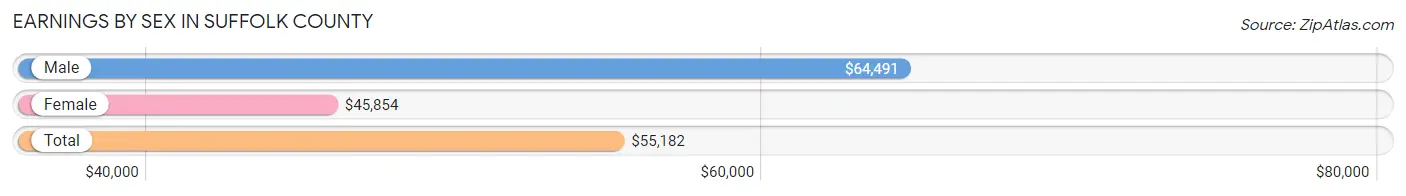
Earnings by Sex in Suffolk County
Average Earnings in Suffolk County are $55,182, $64,491 for men and $45,854 for women, a difference of 28.9%.
| Sex | Number | Average Earnings |
| Male | 447,856 (52.8%) | $64,491 |
| Female | 400,088 (47.2%) | $45,854 |
| Total | 847,944 (100.0%) | $55,182 |
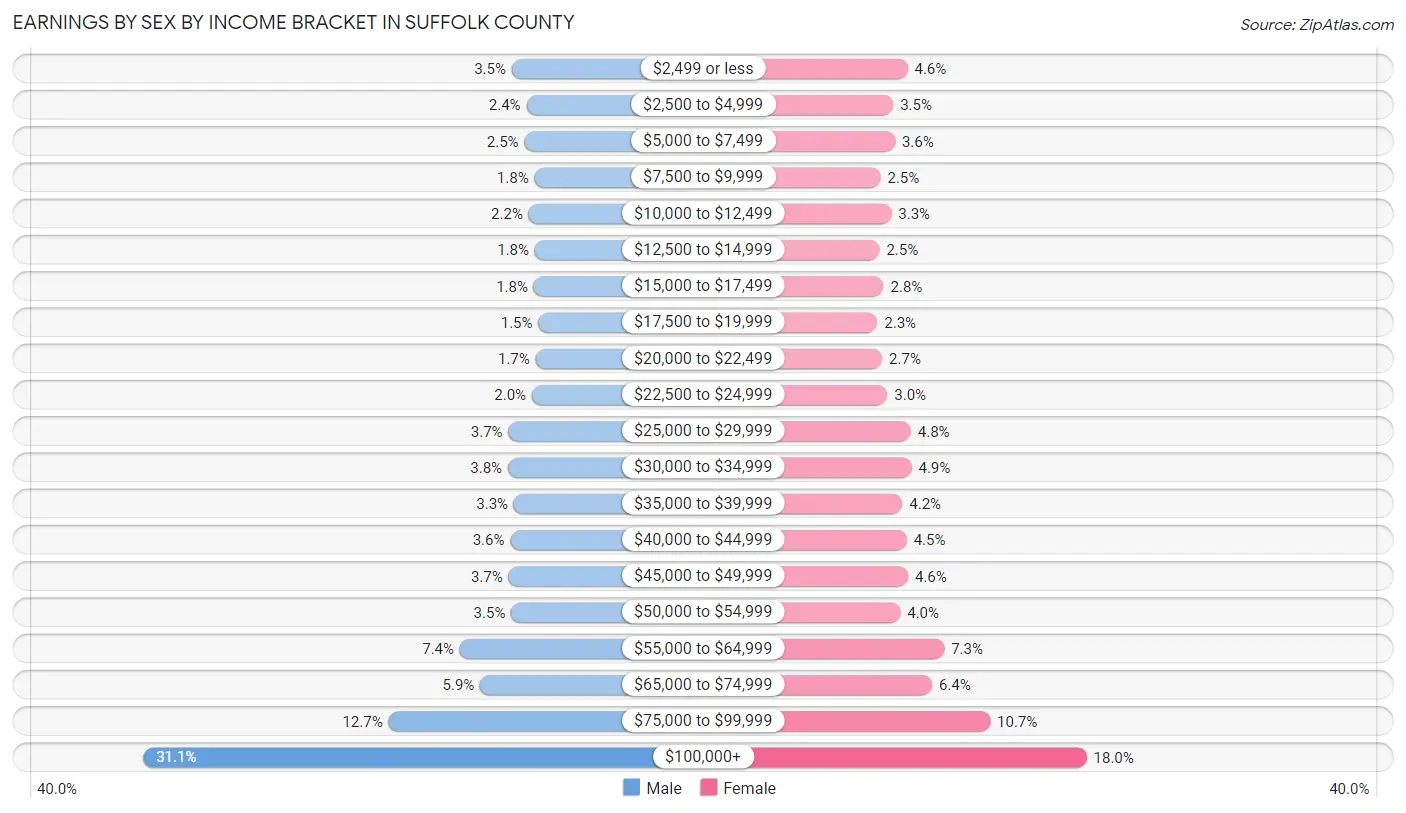
Earnings by Sex by Income Bracket in Suffolk County
The most common earnings brackets in Suffolk County are $100,000+ for men (139,325 | 31.1%) and $100,000+ for women (71,876 | 18.0%).
| Income | Male | Female |
| $2,499 or less | 15,614 (3.5%) | 18,213 (4.5%) |
| $2,500 to $4,999 | 10,693 (2.4%) | 13,911 (3.5%) |
| $5,000 to $7,499 | 11,396 (2.5%) | 14,434 (3.6%) |
| $7,500 to $9,999 | 8,024 (1.8%) | 10,132 (2.5%) |
| $10,000 to $12,499 | 9,935 (2.2%) | 13,381 (3.3%) |
| $12,500 to $14,999 | 7,899 (1.8%) | 9,804 (2.5%) |
| $15,000 to $17,499 | 8,223 (1.8%) | 11,026 (2.8%) |
| $17,500 to $19,999 | 6,735 (1.5%) | 9,159 (2.3%) |
| $20,000 to $22,499 | 7,645 (1.7%) | 10,603 (2.6%) |
| $22,500 to $24,999 | 8,856 (2.0%) | 12,182 (3.0%) |
| $25,000 to $29,999 | 16,766 (3.7%) | 19,219 (4.8%) |
| $30,000 to $34,999 | 16,944 (3.8%) | 19,406 (4.9%) |
| $35,000 to $39,999 | 14,901 (3.3%) | 16,643 (4.2%) |
| $40,000 to $44,999 | 16,104 (3.6%) | 17,958 (4.5%) |
| $45,000 to $49,999 | 16,708 (3.7%) | 18,358 (4.6%) |
| $50,000 to $54,999 | 15,792 (3.5%) | 16,042 (4.0%) |
| $55,000 to $64,999 | 33,064 (7.4%) | 29,198 (7.3%) |
| $65,000 to $74,999 | 26,223 (5.9%) | 25,577 (6.4%) |
| $75,000 to $99,999 | 57,009 (12.7%) | 42,966 (10.7%) |
| $100,000+ | 139,325 (31.1%) | 71,876 (18.0%) |
| Total | 447,856 (100.0%) | 400,088 (100.0%) |
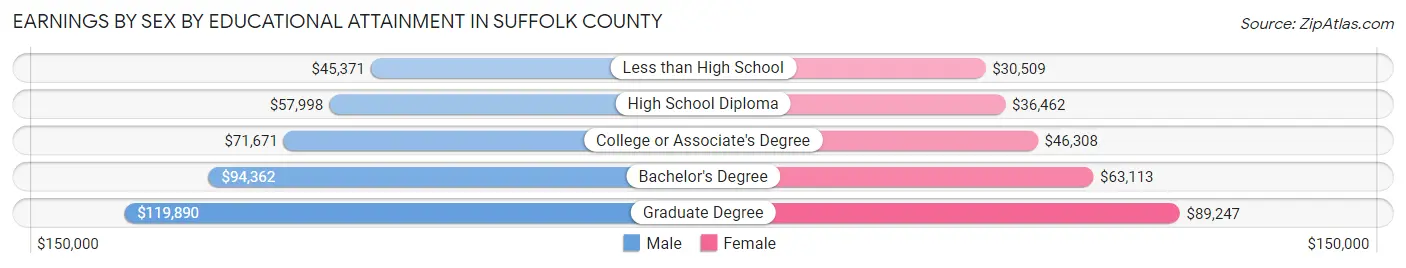
Earnings by Sex by Educational Attainment in Suffolk County
Average earnings in Suffolk County are $75,165 for men and $53,709 for women, a difference of 28.5%. Men with an educational attainment of graduate degree enjoy the highest average annual earnings of $119,890, while those with less than high school education earn the least with $45,371. Women with an educational attainment of graduate degree earn the most with the average annual earnings of $89,247, while those with less than high school education have the smallest earnings of $30,509.
| Educational Attainment | Male Income | Female Income |
| Less than High School | $45,371 | $30,509 |
| High School Diploma | $57,998 | $36,462 |
| College or Associate's Degree | $71,671 | $46,308 |
| Bachelor's Degree | $94,362 | $63,113 |
| Graduate Degree | $119,890 | $89,247 |
| Total | $75,165 | $53,709 |
Family Income in Suffolk County
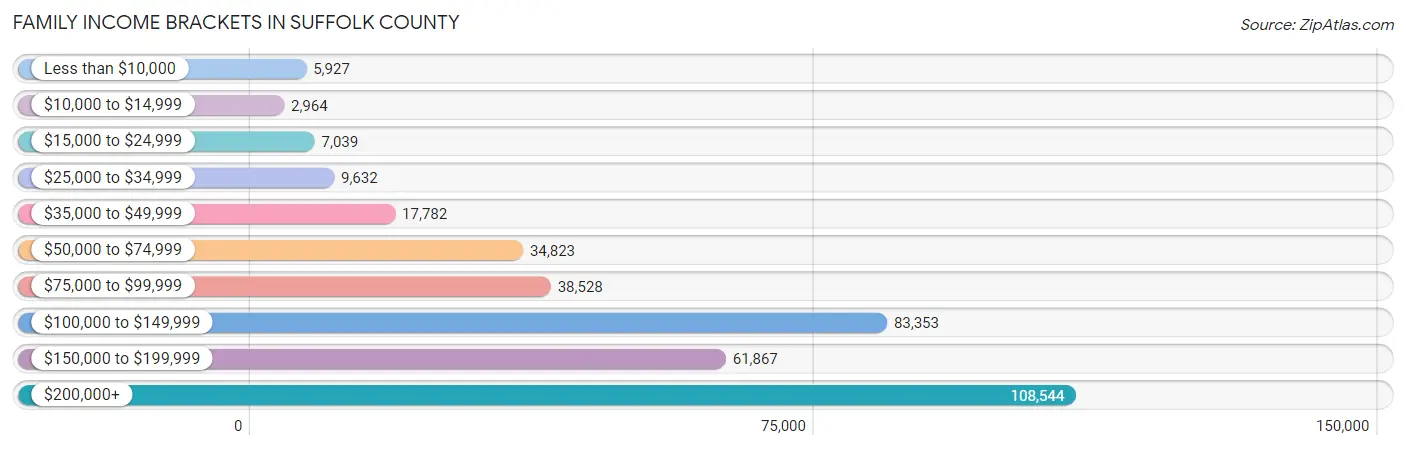
Family Income Brackets in Suffolk County
According to the Suffolk County family income data, there are 108,544 families falling into the $200,000+ income range, which is the most common income bracket and makes up 29.3% of all families. Conversely, the $10,000 to $14,999 income bracket is the least frequent group with only 2,964 families (0.8%) belonging to this category.
| Income Bracket | # Families | % Families |
| Less than $10,000 | 5,927 | 1.6% |
| $10,000 to $14,999 | 2,964 | 0.8% |
| $15,000 to $24,999 | 7,039 | 1.9% |
| $25,000 to $34,999 | 9,632 | 2.6% |
| $35,000 to $49,999 | 17,782 | 4.8% |
| $50,000 to $74,999 | 34,823 | 9.4% |
| $75,000 to $99,999 | 38,528 | 10.4% |
| $100,000 to $149,999 | 83,353 | 22.5% |
| $150,000 to $199,999 | 61,867 | 16.7% |
| $200,000+ | 108,544 | 29.3% |
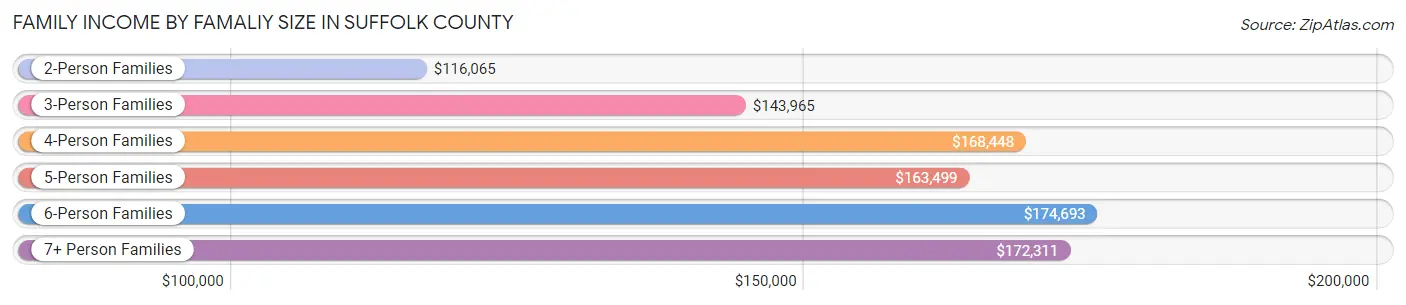
Family Income by Famaliy Size in Suffolk County
6-person families (12,991 | 3.5%) account for the highest median family income in Suffolk County with $174,693 per family, while 2-person families (144,065 | 38.9%) have the highest median income of $58,032 per family member.
| Income Bracket | # Families | Median Income |
| 2-Person Families | 144,065 (38.9%) | $116,065 |
| 3-Person Families | 88,258 (23.8%) | $143,965 |
| 4-Person Families | 81,067 (21.9%) | $168,448 |
| 5-Person Families | 35,526 (9.6%) | $163,499 |
| 6-Person Families | 12,991 (3.5%) | $174,693 |
| 7+ Person Families | 8,552 (2.3%) | $172,311 |
| Total | 370,459 (100.0%) | $141,671 |
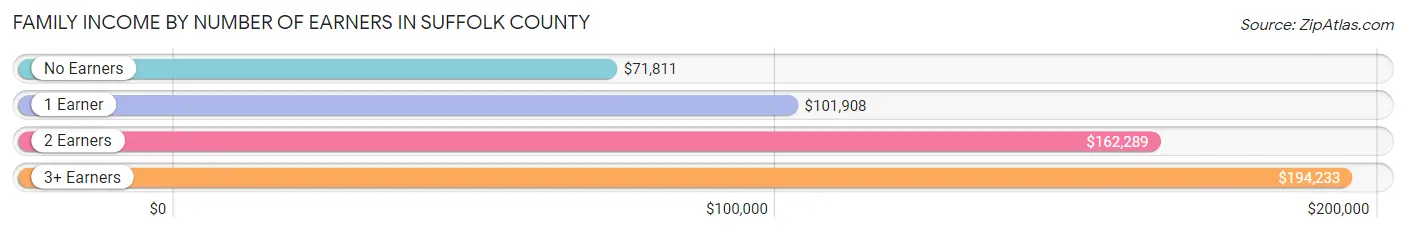
Family Income by Number of Earners in Suffolk County
The median family income in Suffolk County is $141,671, with families comprising 3+ earners (73,086) having the highest median family income of $194,233, while families with no earners (45,706) have the lowest median family income of $71,811, accounting for 19.7% and 12.3% of families, respectively.
| Number of Earners | # Families | Median Income |
| No Earners | 45,706 (12.3%) | $71,811 |
| 1 Earner | 93,386 (25.2%) | $101,908 |
| 2 Earners | 158,281 (42.7%) | $162,289 |
| 3+ Earners | 73,086 (19.7%) | $194,233 |
| Total | 370,459 (100.0%) | $141,671 |
Household Income in Suffolk County
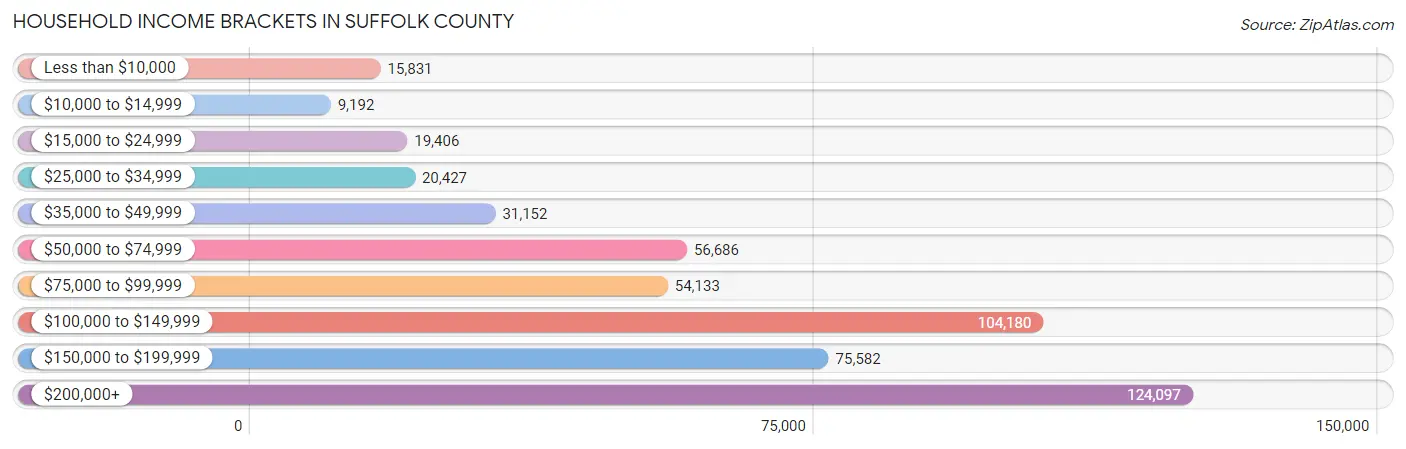
Household Income Brackets in Suffolk County
With 124,097 households falling in the category, the $200,000+ income range is the most frequent in Suffolk County, accounting for 24.3% of all households. In contrast, only 9,192 households (1.8%) fall into the $10,000 to $14,999 income bracket, making it the least populous group.
| Income Bracket | # Households | % Households |
| Less than $10,000 | 15,831 | 3.1% |
| $10,000 to $14,999 | 9,192 | 1.8% |
| $15,000 to $24,999 | 19,406 | 3.8% |
| $25,000 to $34,999 | 20,427 | 4.0% |
| $35,000 to $49,999 | 31,152 | 6.1% |
| $50,000 to $74,999 | 56,686 | 11.1% |
| $75,000 to $99,999 | 54,133 | 10.6% |
| $100,000 to $149,999 | 104,180 | 20.4% |
| $150,000 to $199,999 | 75,582 | 14.8% |
| $200,000+ | 124,097 | 24.3% |
Household Income by Householder Age in Suffolk County
The median household income in Suffolk County is $122,498, with the highest median household income of $146,512 found in the 45 to 64 years age bracket for the primary householder. A total of 228,078 households (44.7%) fall into this category. Meanwhile, the 15 to 24 years age bracket for the primary householder has the lowest median household income of $54,969, with 5,529 households (1.1%) in this group.
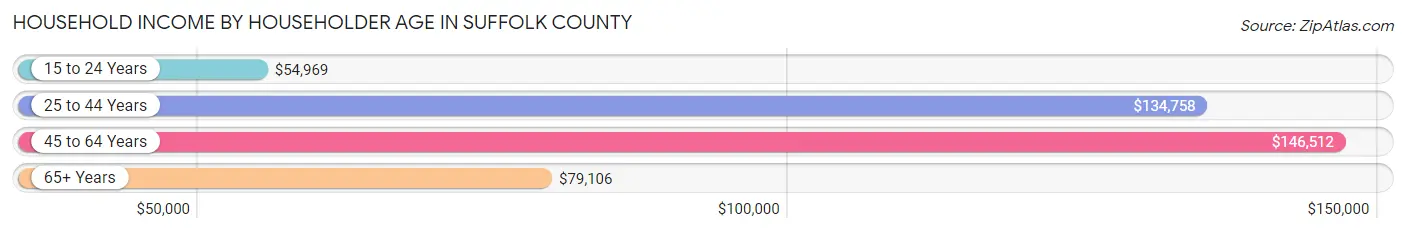
| Income Bracket | # Households | Median Income |
| 15 to 24 Years | 5,529 (1.1%) | $54,969 |
| 25 to 44 Years | 122,453 (24.0%) | $134,758 |
| 45 to 64 Years | 228,078 (44.7%) | $146,512 |
| 65+ Years | 154,626 (30.3%) | $79,106 |
| Total | 510,686 (100.0%) | $122,498 |
Poverty in Suffolk County
Income Below Poverty by Sex and Age in Suffolk County
With 5.6% poverty level for males and 7.3% for females among the residents of Suffolk County, 16 and 17 year old males and 75 year old and over females are the most vulnerable to poverty, with 1,706 males (8.1%) and 6,623 females (10.2%) in their respective age groups living below the poverty level.
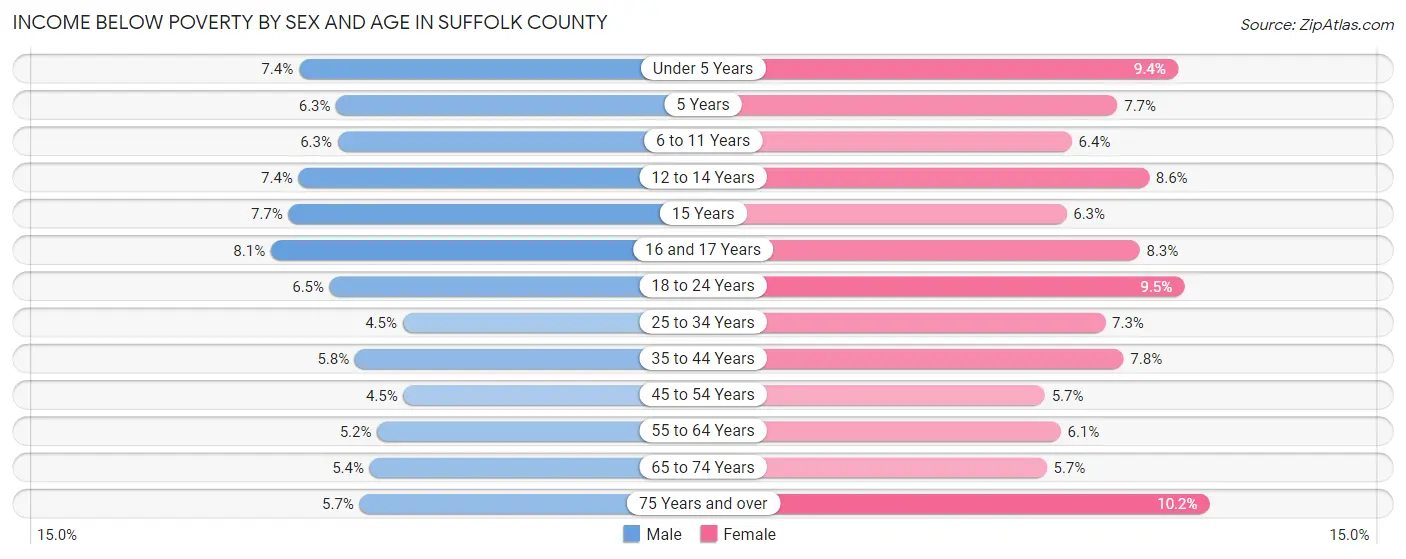
| Age Bracket | Male | Female |
| Under 5 Years | 2,887 (7.4%) | 3,509 (9.3%) |
| 5 Years | 458 (6.3%) | 553 (7.7%) |
| 6 to 11 Years | 3,233 (6.3%) | 3,062 (6.4%) |
| 12 to 14 Years | 2,173 (7.4%) | 2,444 (8.6%) |
| 15 Years | 765 (7.6%) | 565 (6.2%) |
| 16 and 17 Years | 1,706 (8.1%) | 1,668 (8.3%) |
| 18 to 24 Years | 4,395 (6.5%) | 6,087 (9.5%) |
| 25 to 34 Years | 4,176 (4.5%) | 6,475 (7.3%) |
| 35 to 44 Years | 5,302 (5.8%) | 6,941 (7.8%) |
| 45 to 54 Years | 4,741 (4.4%) | 6,016 (5.7%) |
| 55 to 64 Years | 5,831 (5.2%) | 6,922 (6.1%) |
| 65 to 74 Years | 3,798 (5.4%) | 4,471 (5.7%) |
| 75 Years and over | 2,506 (5.7%) | 6,623 (10.2%) |
| Total | 41,971 (5.6%) | 55,336 (7.3%) |
Income Above Poverty by Sex and Age in Suffolk County
According to the poverty statistics in Suffolk County, males aged 45 to 54 years and females aged 45 to 54 years are the age groups that are most secure financially, with 95.6% of males and 94.4% of females in these age groups living above the poverty line.
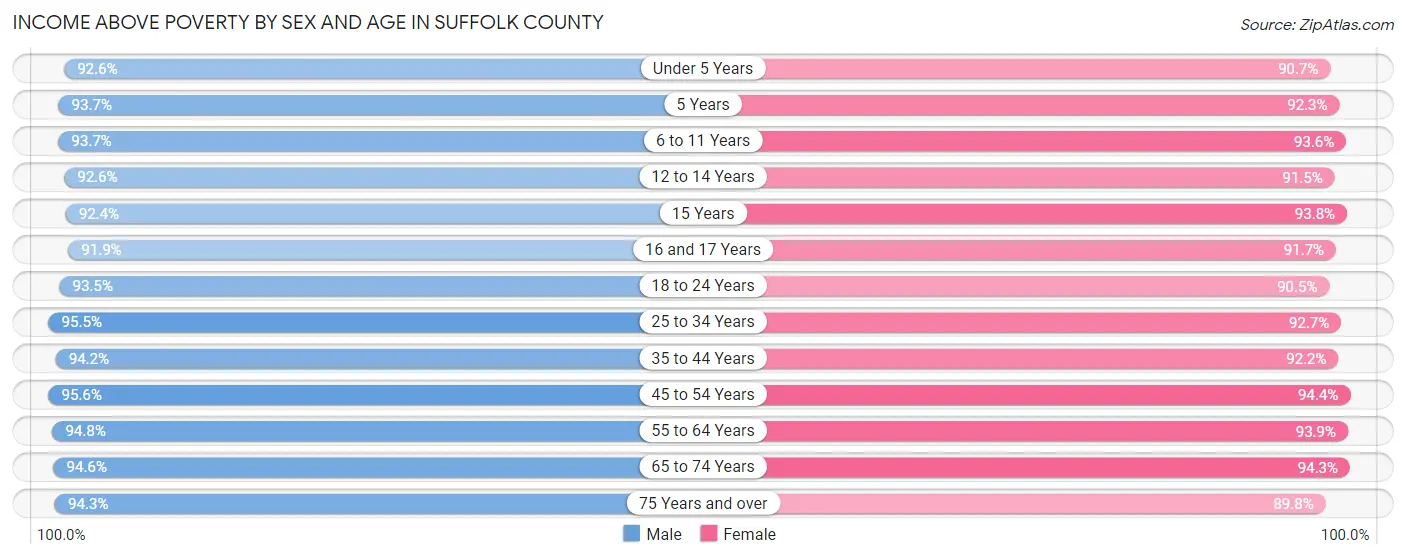
| Age Bracket | Male | Female |
| Under 5 Years | 36,364 (92.6%) | 34,028 (90.6%) |
| 5 Years | 6,792 (93.7%) | 6,659 (92.3%) |
| 6 to 11 Years | 48,219 (93.7%) | 44,760 (93.6%) |
| 12 to 14 Years | 27,313 (92.6%) | 26,131 (91.4%) |
| 15 Years | 9,240 (92.3%) | 8,479 (93.8%) |
| 16 and 17 Years | 19,246 (91.9%) | 18,444 (91.7%) |
| 18 to 24 Years | 63,187 (93.5%) | 57,764 (90.5%) |
| 25 to 34 Years | 89,172 (95.5%) | 81,808 (92.7%) |
| 35 to 44 Years | 86,188 (94.2%) | 81,536 (92.2%) |
| 45 to 54 Years | 101,709 (95.6%) | 100,388 (94.4%) |
| 55 to 64 Years | 106,810 (94.8%) | 106,751 (93.9%) |
| 65 to 74 Years | 66,664 (94.6%) | 73,904 (94.3%) |
| 75 Years and over | 41,659 (94.3%) | 58,100 (89.8%) |
| Total | 702,563 (94.4%) | 698,752 (92.7%) |
Income Below Poverty Among Married-Couple Families in Suffolk County
The poverty statistics for married-couple families in Suffolk County show that 2.4% or 6,945 of the total 288,384 families live below the poverty line. Families with 5 or more children have the highest poverty rate of 6.6%, comprising of 69 families. On the other hand, families with no children have the lowest poverty rate of 1.9%, which includes 3,234 families.
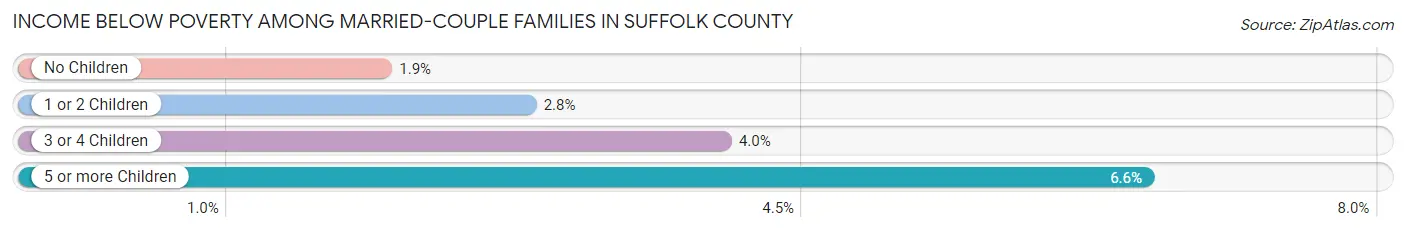
| Children | Above Poverty | Below Poverty |
| No Children | 163,533 (98.1%) | 3,234 (1.9%) |
| 1 or 2 Children | 97,165 (97.2%) | 2,816 (2.8%) |
| 3 or 4 Children | 19,762 (96.0%) | 826 (4.0%) |
| 5 or more Children | 979 (93.4%) | 69 (6.6%) |
| Total | 281,439 (97.6%) | 6,945 (2.4%) |
Income Below Poverty Among Single-Parent Households in Suffolk County
According to the poverty data in Suffolk County, 6.1% or 1,582 single-father households and 12.3% or 6,877 single-mother households are living below the poverty line. Among single-father households, those with 1 or 2 children have the highest poverty rate, with 986 households (10.2%) experiencing poverty. Likewise, among single-mother households, those with 5 or more children have the highest poverty rate, with 125 households (33.7%) falling below the poverty line.
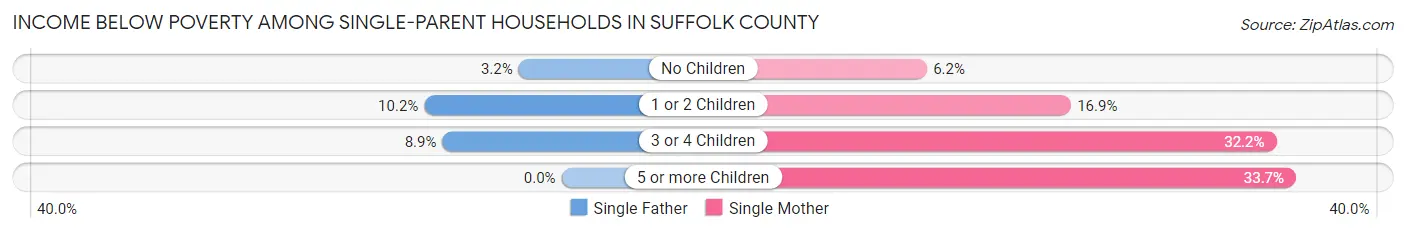
| Children | Single Father | Single Mother |
| No Children | 481 (3.2%) | 1,857 (6.1%) |
| 1 or 2 Children | 986 (10.2%) | 3,663 (16.9%) |
| 3 or 4 Children | 115 (8.9%) | 1,232 (32.2%) |
| 5 or more Children | 0 (0.0%) | 125 (33.7%) |
| Total | 1,582 (6.1%) | 6,877 (12.3%) |
Income Below Poverty Among Married-Couple vs Single-Parent Households in Suffolk County
The poverty data for Suffolk County shows that 6,945 of the married-couple family households (2.4%) and 8,459 of the single-parent households (10.3%) are living below the poverty level. Within the married-couple family households, those with 5 or more children have the highest poverty rate, with 69 households (6.6%) falling below the poverty line. Among the single-parent households, those with 5 or more children have the highest poverty rate, with 125 household (29.0%) living below poverty.
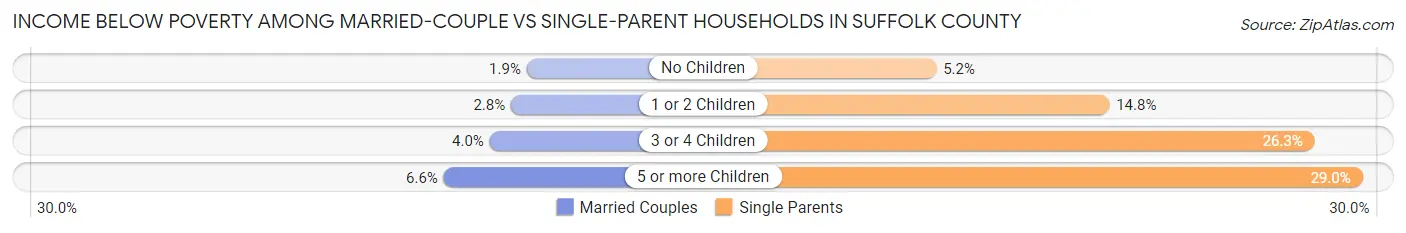
| Children | Married-Couple Families | Single-Parent Households |
| No Children | 3,234 (1.9%) | 2,338 (5.2%) |
| 1 or 2 Children | 2,816 (2.8%) | 4,649 (14.8%) |
| 3 or 4 Children | 826 (4.0%) | 1,347 (26.3%) |
| 5 or more Children | 69 (6.6%) | 125 (29.0%) |
| Total | 6,945 (2.4%) | 8,459 (10.3%) |
Race in Suffolk County
The most populous races in Suffolk County are White / Caucasian (1,111,855 | 72.9%), Hispanic or Latino (313,371 | 20.6%), and Two or more Races (121,432 | 8.0%).
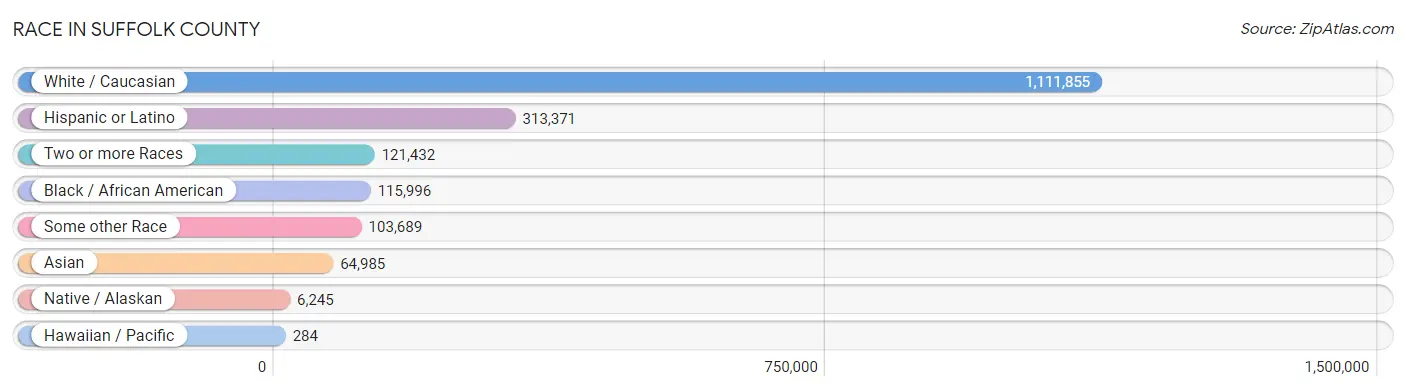
| Race | # Population | % Population |
| Asian | 64,985 | 4.3% |
| Black / African American | 115,996 | 7.6% |
| Hawaiian / Pacific | 284 | 0.0% |
| Hispanic or Latino | 313,371 | 20.6% |
| Native / Alaskan | 6,245 | 0.4% |
| White / Caucasian | 1,111,855 | 72.9% |
| Two or more Races | 121,432 | 8.0% |
| Some other Race | 103,689 | 6.8% |
| Total | 1,524,486 | 100.0% |
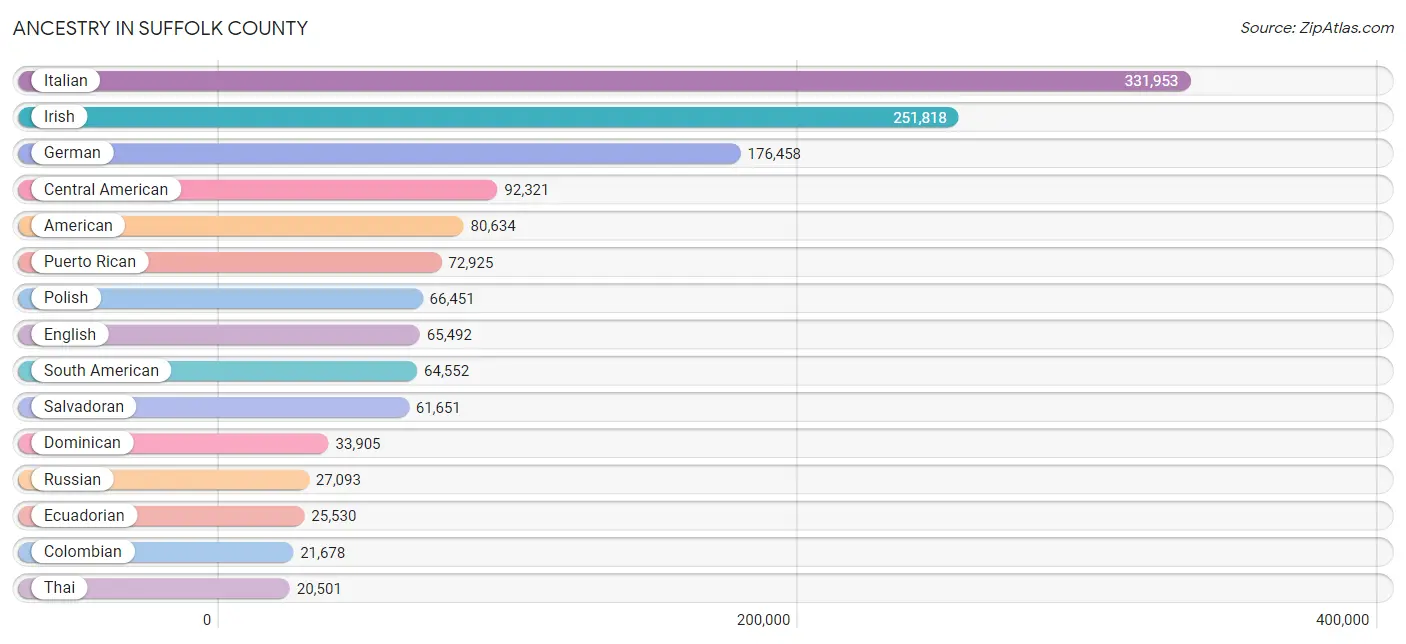
Ancestry in Suffolk County
The most populous ancestries reported in Suffolk County are Italian (331,953 | 21.8%), Irish (251,818 | 16.5%), German (176,458 | 11.6%), Central American (92,321 | 6.1%), and American (80,634 | 5.3%), together accounting for 61.2% of all Suffolk County residents.
| Ancestry | # Population | % Population |
| Afghan | 878 | 0.1% |
| African | 4,154 | 0.3% |
| Albanian | 1,482 | 0.1% |
| Aleut | 13 | 0.0% |
| Alsatian | 56 | 0.0% |
| American | 80,634 | 5.3% |
| Apache | 54 | 0.0% |
| Arab | 6,361 | 0.4% |
| Argentinean | 2,349 | 0.2% |
| Armenian | 2,296 | 0.2% |
| Australian | 350 | 0.0% |
| Austrian | 6,437 | 0.4% |
| Bahamian | 139 | 0.0% |
| Bangladeshi | 10 | 0.0% |
| Barbadian | 558 | 0.0% |
| Basque | 101 | 0.0% |
| Belgian | 889 | 0.1% |
| Belizean | 583 | 0.0% |
| Bermudan | 78 | 0.0% |
| Bhutanese | 1,755 | 0.1% |
| Blackfeet | 247 | 0.0% |
| Bolivian | 600 | 0.0% |
| Brazilian | 2,043 | 0.1% |
| British | 3,614 | 0.2% |
| British West Indian | 952 | 0.1% |
| Bulgarian | 111 | 0.0% |
| Burmese | 6,182 | 0.4% |
| Cambodian | 12 | 0.0% |
| Canadian | 1,888 | 0.1% |
| Cape Verdean | 37 | 0.0% |
| Celtic | 295 | 0.0% |
| Central American | 92,321 | 6.1% |
| Central American Indian | 2,924 | 0.2% |
| Cherokee | 911 | 0.1% |
| Chickasaw | 18 | 0.0% |
| Chilean | 2,184 | 0.1% |
| Chinese | 2 | 0.0% |
| Chippewa | 35 | 0.0% |
| Choctaw | 104 | 0.0% |
| Colombian | 21,678 | 1.4% |
| Costa Rican | 2,579 | 0.2% |
| Cree | 27 | 0.0% |
| Creek | 17 | 0.0% |
| Croatian | 2,902 | 0.2% |
| Cuban | 5,675 | 0.4% |
| Cypriot | 313 | 0.0% |
| Czech | 4,740 | 0.3% |
| Czechoslovakian | 1,704 | 0.1% |
| Danish | 3,320 | 0.2% |
| Delaware | 240 | 0.0% |
| Dominican | 33,905 | 2.2% |
| Dutch | 8,028 | 0.5% |
| Dutch West Indian | 22 | 0.0% |
| Eastern European | 10,068 | 0.7% |
| Ecuadorian | 25,530 | 1.7% |
| Egyptian | 1,846 | 0.1% |
| English | 65,492 | 4.3% |
| Estonian | 155 | 0.0% |
| Ethiopian | 119 | 0.0% |
| European | 14,076 | 0.9% |
| Filipino | 642 | 0.0% |
| Finnish | 1,598 | 0.1% |
| French | 16,989 | 1.1% |
| French American Indian | 160 | 0.0% |
| French Canadian | 3,978 | 0.3% |
| German | 176,458 | 11.6% |
| German Russian | 20 | 0.0% |
| Ghanaian | 1,426 | 0.1% |
| Greek | 19,879 | 1.3% |
| Guamanian / Chamorro | 160 | 0.0% |
| Guatemalan | 11,857 | 0.8% |
| Guyanese | 3,939 | 0.3% |
| Haitian | 12,547 | 0.8% |
| Honduran | 12,745 | 0.8% |
| Houma | 11 | 0.0% |
| Hungarian | 7,360 | 0.5% |
| Icelander | 123 | 0.0% |
| Indian (Asian) | 19,342 | 1.3% |
| Indonesian | 240 | 0.0% |
| Inupiat | 46 | 0.0% |
| Iranian | 1,050 | 0.1% |
| Iraqi | 198 | 0.0% |
| Irish | 251,818 | 16.5% |
| Iroquois | 395 | 0.0% |
| Israeli | 953 | 0.1% |
| Italian | 331,953 | 21.8% |
| Jamaican | 10,685 | 0.7% |
| Japanese | 17 | 0.0% |
| Jordanian | 798 | 0.1% |
| Kenyan | 18 | 0.0% |
| Korean | 8,851 | 0.6% |
| Laotian | 516 | 0.0% |
| Latvian | 624 | 0.0% |
| Lebanese | 1,294 | 0.1% |
| Lithuanian | 4,882 | 0.3% |
| Lumbee | 20 | 0.0% |
| Luxembourger | 30 | 0.0% |
| Macedonian | 43 | 0.0% |
| Malaysian | 165 | 0.0% |
| Maltese | 1,735 | 0.1% |
| Marshallese | 4 | 0.0% |
| Mexican | 18,984 | 1.3% |
| Mexican American Indian | 1,735 | 0.1% |
| Mongolian | 185 | 0.0% |
| Moroccan | 446 | 0.0% |
| Native Hawaiian | 244 | 0.0% |
| Navajo | 407 | 0.0% |
| New Zealander | 9 | 0.0% |
| Nicaraguan | 1,120 | 0.1% |
| Nigerian | 2,079 | 0.1% |
| Northern European | 1,320 | 0.1% |
| Norwegian | 10,900 | 0.7% |
| Okinawan | 150 | 0.0% |
| Osage | 2 | 0.0% |
| Pakistani | 559 | 0.0% |
| Palestinian | 297 | 0.0% |
| Panamanian | 1,377 | 0.1% |
| Paraguayan | 512 | 0.0% |
| Pennsylvania German | 29 | 0.0% |
| Peruvian | 9,897 | 0.6% |
| Polish | 66,451 | 4.4% |
| Portuguese | 5,184 | 0.3% |
| Pueblo | 19 | 0.0% |
| Puerto Rican | 72,925 | 4.8% |
| Puget Sound Salish | 5 | 0.0% |
| Romanian | 2,574 | 0.2% |
| Russian | 27,093 | 1.8% |
| Salvadoran | 61,651 | 4.0% |
| Samoan | 89 | 0.0% |
| Scandinavian | 1,896 | 0.1% |
| Scotch-Irish | 3,613 | 0.2% |
| Scottish | 11,697 | 0.8% |
| Seminole | 188 | 0.0% |
| Senegalese | 9 | 0.0% |
| Serbian | 307 | 0.0% |
| Sioux | 123 | 0.0% |
| Slavic | 454 | 0.0% |
| Slovak | 1,272 | 0.1% |
| Slovene | 240 | 0.0% |
| South African | 209 | 0.0% |
| South American | 64,552 | 4.2% |
| South American Indian | 580 | 0.0% |
| Soviet Union | 37 | 0.0% |
| Spaniard | 7,119 | 0.5% |
| Spanish | 3,660 | 0.2% |
| Spanish American | 111 | 0.0% |
| Spanish American Indian | 17 | 0.0% |
| Sri Lankan | 1,624 | 0.1% |
| Subsaharan African | 8,470 | 0.6% |
| Sudanese | 18 | 0.0% |
| Swedish | 7,890 | 0.5% |
| Swiss | 2,105 | 0.1% |
| Syrian | 803 | 0.1% |
| Taiwanese | 10 | 0.0% |
| Thai | 20,501 | 1.3% |
| Tlingit-Haida | 13 | 0.0% |
| Tongan | 20 | 0.0% |
| Trinidadian and Tobagonian | 4,052 | 0.3% |
| Turkish | 6,093 | 0.4% |
| U.S. Virgin Islander | 21 | 0.0% |
| Ugandan | 84 | 0.0% |
| Ukrainian | 7,875 | 0.5% |
| Uruguayan | 557 | 0.0% |
| Venezuelan | 992 | 0.1% |
| Vietnamese | 2,912 | 0.2% |
| Welsh | 3,216 | 0.2% |
| West Indian | 2,600 | 0.2% |
| Yaqui | 25 | 0.0% |
| Yugoslavian | 738 | 0.1% |
| Zimbabwean | 27 | 0.0% | View All 170 Rows |
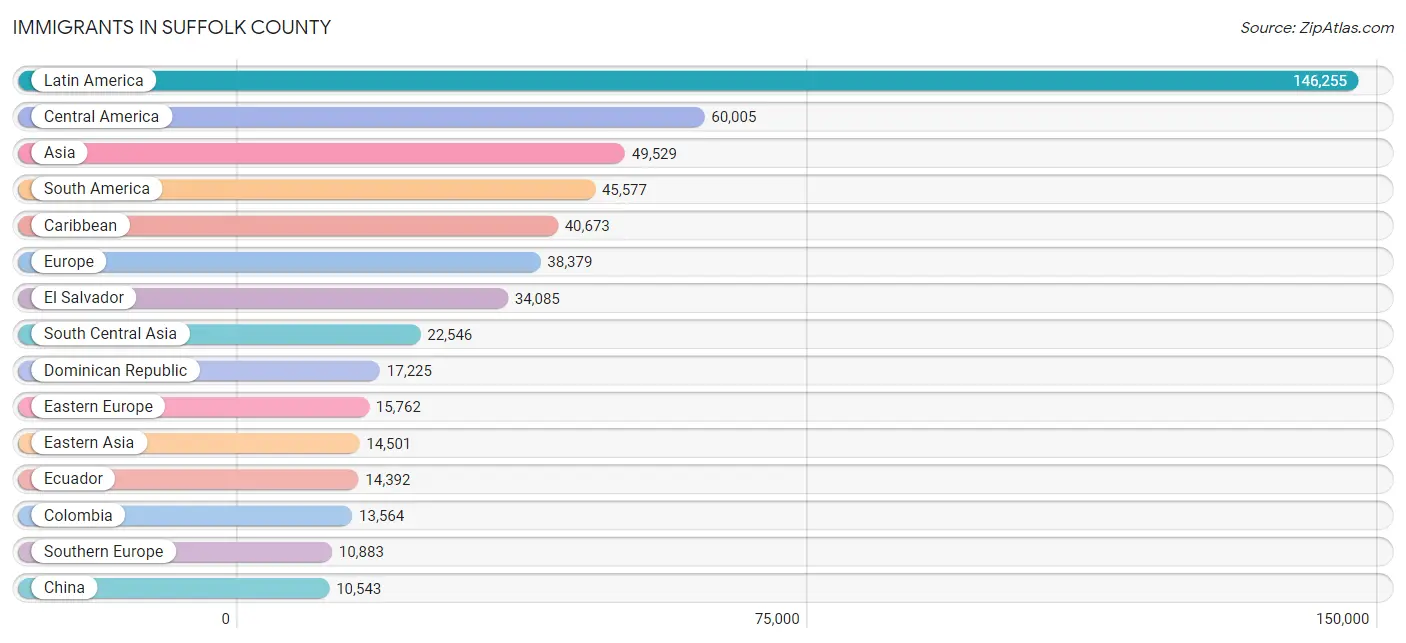
Immigrants in Suffolk County
The most numerous immigrant groups reported in Suffolk County came from Latin America (146,255 | 9.6%), Central America (60,005 | 3.9%), Asia (49,529 | 3.3%), South America (45,577 | 3.0%), and Caribbean (40,673 | 2.7%), together accounting for 22.4% of all Suffolk County residents.
| Immigration Origin | # Population | % Population |
| Afghanistan | 668 | 0.0% |
| Africa | 6,928 | 0.4% |
| Albania | 326 | 0.0% |
| Argentina | 1,732 | 0.1% |
| Armenia | 92 | 0.0% |
| Asia | 49,529 | 3.3% |
| Australia | 289 | 0.0% |
| Austria | 256 | 0.0% |
| Bahamas | 12 | 0.0% |
| Bangladesh | 3,159 | 0.2% |
| Barbados | 354 | 0.0% |
| Belarus | 220 | 0.0% |
| Belgium | 164 | 0.0% |
| Belize | 273 | 0.0% |
| Bolivia | 472 | 0.0% |
| Bosnia and Herzegovina | 97 | 0.0% |
| Brazil | 1,881 | 0.1% |
| Bulgaria | 177 | 0.0% |
| Cambodia | 17 | 0.0% |
| Cameroon | 79 | 0.0% |
| Canada | 2,070 | 0.1% |
| Caribbean | 40,673 | 2.7% |
| Central America | 60,005 | 3.9% |
| Chile | 1,114 | 0.1% |
| China | 10,543 | 0.7% |
| Colombia | 13,564 | 0.9% |
| Congo | 10 | 0.0% |
| Costa Rica | 1,387 | 0.1% |
| Croatia | 453 | 0.0% |
| Cuba | 1,608 | 0.1% |
| Czechoslovakia | 548 | 0.0% |
| Denmark | 95 | 0.0% |
| Dominica | 96 | 0.0% |
| Dominican Republic | 17,225 | 1.1% |
| Eastern Africa | 828 | 0.1% |
| Eastern Asia | 14,501 | 0.9% |
| Eastern Europe | 15,762 | 1.0% |
| Ecuador | 14,392 | 0.9% |
| Egypt | 1,268 | 0.1% |
| El Salvador | 34,085 | 2.2% |
| England | 1,564 | 0.1% |
| Ethiopia | 62 | 0.0% |
| Europe | 38,379 | 2.5% |
| Fiji | 15 | 0.0% |
| France | 1,032 | 0.1% |
| Germany | 3,292 | 0.2% |
| Ghana | 1,251 | 0.1% |
| Greece | 2,215 | 0.2% |
| Grenada | 335 | 0.0% |
| Guatemala | 7,152 | 0.5% |
| Guyana | 3,505 | 0.2% |
| Haiti | 8,852 | 0.6% |
| Honduras | 8,618 | 0.6% |
| Hong Kong | 921 | 0.1% |
| Hungary | 238 | 0.0% |
| India | 9,351 | 0.6% |
| Indonesia | 435 | 0.0% |
| Iran | 700 | 0.1% |
| Iraq | 109 | 0.0% |
| Ireland | 1,944 | 0.1% |
| Israel | 738 | 0.1% |
| Italy | 5,640 | 0.4% |
| Jamaica | 7,771 | 0.5% |
| Japan | 368 | 0.0% |
| Jordan | 217 | 0.0% |
| Kazakhstan | 117 | 0.0% |
| Kenya | 54 | 0.0% |
| Korea | 3,590 | 0.2% |
| Kuwait | 78 | 0.0% |
| Laos | 51 | 0.0% |
| Latin America | 146,255 | 9.6% |
| Latvia | 166 | 0.0% |
| Lebanon | 329 | 0.0% |
| Liberia | 46 | 0.0% |
| Lithuania | 312 | 0.0% |
| Malaysia | 196 | 0.0% |
| Mexico | 7,299 | 0.5% |
| Middle Africa | 272 | 0.0% |
| Moldova | 132 | 0.0% |
| Morocco | 415 | 0.0% |
| Nepal | 443 | 0.0% |
| Netherlands | 291 | 0.0% |
| Nicaragua | 547 | 0.0% |
| Nigeria | 1,394 | 0.1% |
| North Macedonia | 79 | 0.0% |
| Northern Africa | 1,992 | 0.1% |
| Northern Europe | 6,346 | 0.4% |
| Norway | 140 | 0.0% |
| Oceania | 335 | 0.0% |
| Pakistan | 7,608 | 0.5% |
| Panama | 567 | 0.0% |
| Peru | 7,164 | 0.5% |
| Philippines | 3,769 | 0.3% |
| Poland | 7,294 | 0.5% |
| Portugal | 1,667 | 0.1% |
| Romania | 853 | 0.1% |
| Russia | 2,064 | 0.1% |
| Saudi Arabia | 255 | 0.0% |
| Scotland | 602 | 0.0% |
| Senegal | 165 | 0.0% |
| Serbia | 285 | 0.0% |
| Singapore | 165 | 0.0% |
| South Africa | 549 | 0.0% |
| South America | 45,577 | 3.0% |
| South Central Asia | 22,546 | 1.5% |
| South Eastern Asia | 5,983 | 0.4% |
| Southern Europe | 10,883 | 0.7% |
| Spain | 1,142 | 0.1% |
| Sri Lanka | 273 | 0.0% |
| St. Vincent and the Grenadines | 172 | 0.0% |
| Sudan | 46 | 0.0% |
| Sweden | 176 | 0.0% |
| Switzerland | 207 | 0.0% |
| Syria | 42 | 0.0% |
| Taiwan | 873 | 0.1% |
| Thailand | 155 | 0.0% |
| Trinidad and Tobago | 3,410 | 0.2% |
| Turkey | 3,954 | 0.3% |
| Uganda | 91 | 0.0% |
| Ukraine | 1,955 | 0.1% |
| Uruguay | 443 | 0.0% |
| Uzbekistan | 190 | 0.0% |
| Venezuela | 803 | 0.1% |
| Vietnam | 979 | 0.1% |
| West Indies | 272 | 0.0% |
| Western Africa | 3,034 | 0.2% |
| Western Asia | 6,394 | 0.4% |
| Western Europe | 5,265 | 0.4% |
| Yemen | 41 | 0.0% |
| Zaire | 139 | 0.0% |
| Zimbabwe | 21 | 0.0% | View All 131 Rows |
Sex and Age in Suffolk County
Sex and Age in Suffolk County
The most populous age groups in Suffolk County are 55 to 59 Years (60,060 | 7.9%) for men and 55 to 59 Years (58,558 | 7.6%) for women.

| Age Bracket | Male | Female |
| Under 5 Years | 40,395 (5.3%) | 39,110 (5.1%) |
| 5 to 9 Years | 41,864 (5.5%) | 39,729 (5.2%) |
| 10 to 14 Years | 48,508 (6.4%) | 46,593 (6.1%) |
| 15 to 19 Years | 51,970 (6.9%) | 48,851 (6.4%) |
| 20 to 24 Years | 51,386 (6.8%) | 48,976 (6.4%) |
| 25 to 29 Years | 48,720 (6.4%) | 45,551 (5.9%) |
| 30 to 34 Years | 45,602 (6.0%) | 42,954 (5.6%) |
| 35 to 39 Years | 45,960 (6.1%) | 44,295 (5.8%) |
| 40 to 44 Years | 46,005 (6.1%) | 44,313 (5.8%) |
| 45 to 49 Years | 49,671 (6.6%) | 49,267 (6.4%) |
| 50 to 54 Years | 57,149 (7.5%) | 57,257 (7.5%) |
| 55 to 59 Years | 60,060 (7.9%) | 58,558 (7.6%) |
| 60 to 64 Years | 52,977 (7.0%) | 55,383 (7.2%) |
| 65 to 69 Years | 39,032 (5.2%) | 41,520 (5.4%) |
| 70 to 74 Years | 31,937 (4.2%) | 37,623 (4.9%) |
| 75 to 79 Years | 20,903 (2.8%) | 27,191 (3.5%) |
| 80 to 84 Years | 12,810 (1.7%) | 17,570 (2.3%) |
| 85 Years and over | 11,758 (1.5%) | 23,038 (3.0%) |
| Total | 756,707 (100.0%) | 767,779 (100.0%) |
Families and Households in Suffolk County
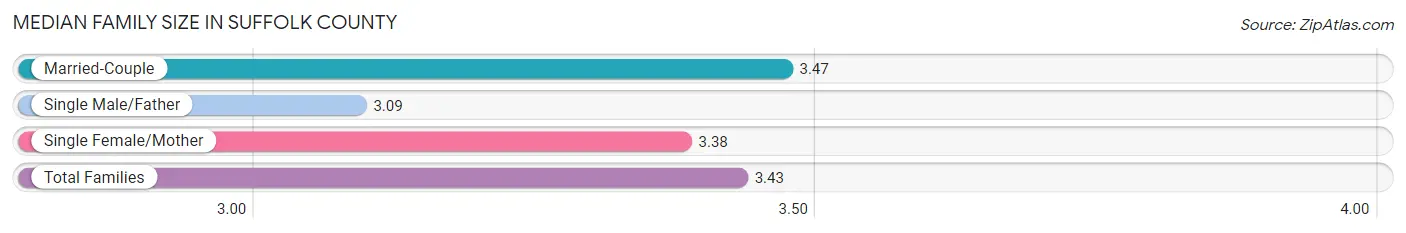
Median Family Size in Suffolk County
The median family size in Suffolk County is 3.43 persons per family, with married-couple families (288,384 | 77.8%) accounting for the largest median family size of 3.47 persons per family. On the other hand, single male/father families (26,006 | 7.0%) represent the smallest median family size with 3.09 persons per family.
| Family Type | # Families | Family Size |
| Married-Couple | 288,384 (77.8%) | 3.47 |
| Single Male/Father | 26,006 (7.0%) | 3.09 |
| Single Female/Mother | 56,069 (15.1%) | 3.38 |
| Total Families | 370,459 (100.0%) | 3.43 |
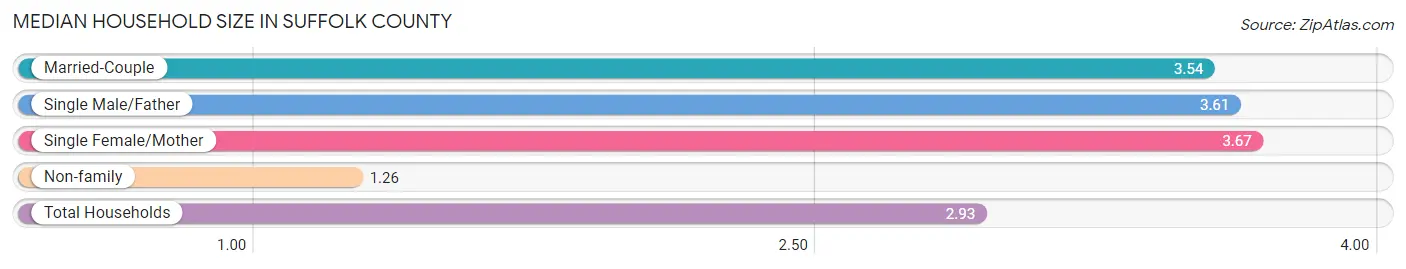
Median Household Size in Suffolk County
The median household size in Suffolk County is 2.93 persons per household, with single female/mother households (56,069 | 11.0%) accounting for the largest median household size of 3.67 persons per household. non-family households (140,227 | 27.5%) represent the smallest median household size with 1.26 persons per household.
| Household Type | # Households | Household Size |
| Married-Couple | 288,384 (56.5%) | 3.54 |
| Single Male/Father | 26,006 (5.1%) | 3.61 |
| Single Female/Mother | 56,069 (11.0%) | 3.67 |
| Non-family | 140,227 (27.5%) | 1.26 |
| Total Households | 510,686 (100.0%) | 2.93 |
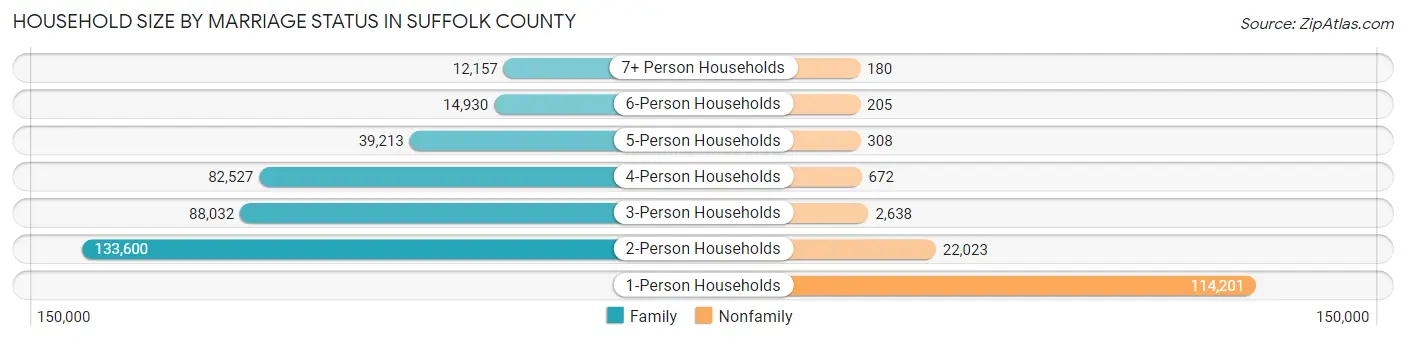
Household Size by Marriage Status in Suffolk County
Out of a total of 510,686 households in Suffolk County, 370,459 (72.5%) are family households, while 140,227 (27.5%) are nonfamily households. The most numerous type of family households are 2-person households, comprising 133,600, and the most common type of nonfamily households are 1-person households, comprising 114,201.
| Household Size | Family Households | Nonfamily Households |
| 1-Person Households | - | 114,201 (22.4%) |
| 2-Person Households | 133,600 (26.2%) | 22,023 (4.3%) |
| 3-Person Households | 88,032 (17.2%) | 2,638 (0.5%) |
| 4-Person Households | 82,527 (16.2%) | 672 (0.1%) |
| 5-Person Households | 39,213 (7.7%) | 308 (0.1%) |
| 6-Person Households | 14,930 (2.9%) | 205 (0.0%) |
| 7+ Person Households | 12,157 (2.4%) | 180 (0.0%) |
| Total | 370,459 (72.5%) | 140,227 (27.5%) |
Female Fertility in Suffolk County
Fertility by Age in Suffolk County
Average fertility rate in Suffolk County is 49.0 births per 1,000 women. Women in the age bracket of 20 to 34 years have the highest fertility rate with 74.0 births per 1,000 women. Women in the age bracket of 20 to 34 years acount for 61.9% of all women with births.
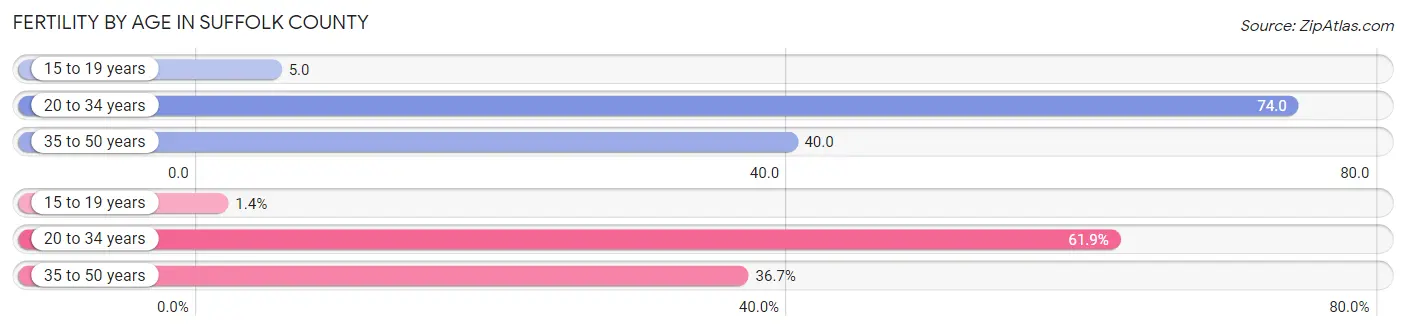
| Age Bracket | Women with Births | Births / 1,000 Women |
| 15 to 19 years | 226 (1.4%) | 5.0 |
| 20 to 34 years | 10,174 (61.9%) | 74.0 |
| 35 to 50 years | 6,027 (36.7%) | 40.0 |
| Total | 16,427 (100.0%) | 49.0 |
Fertility by Age by Marriage Status in Suffolk County
73.0% of women with births (16,427) in Suffolk County are married. The highest percentage of unmarried women with births falls into 15 to 19 years age bracket with 83.2% of them unmarried at the time of birth, while the lowest percentage of unmarried women with births belong to 35 to 50 years age bracket with 17.6% of them unmarried.
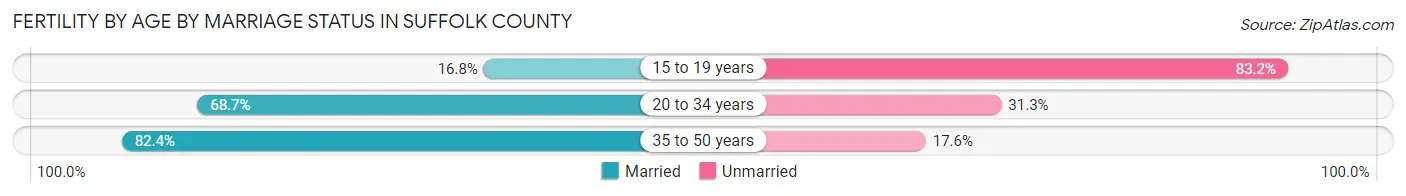
| Age Bracket | Married | Unmarried |
| 15 to 19 years | 38 (16.8%) | 188 (83.2%) |
| 20 to 34 years | 6,990 (68.7%) | 3,184 (31.3%) |
| 35 to 50 years | 4,966 (82.4%) | 1,061 (17.6%) |
| Total | 11,992 (73.0%) | 4,435 (27.0%) |
Fertility by Education in Suffolk County
Average fertility rate in Suffolk County is 49.0 births per 1,000 women. Women with the education attainment of graduate degree have the highest fertility rate of 76.0 births per 1,000 women, while women with the education attainment of less than high school have the lowest fertility at 19.0 births per 1,000 women. Women with the education attainment of college or associate's degree represent 26.7% of all women with births.
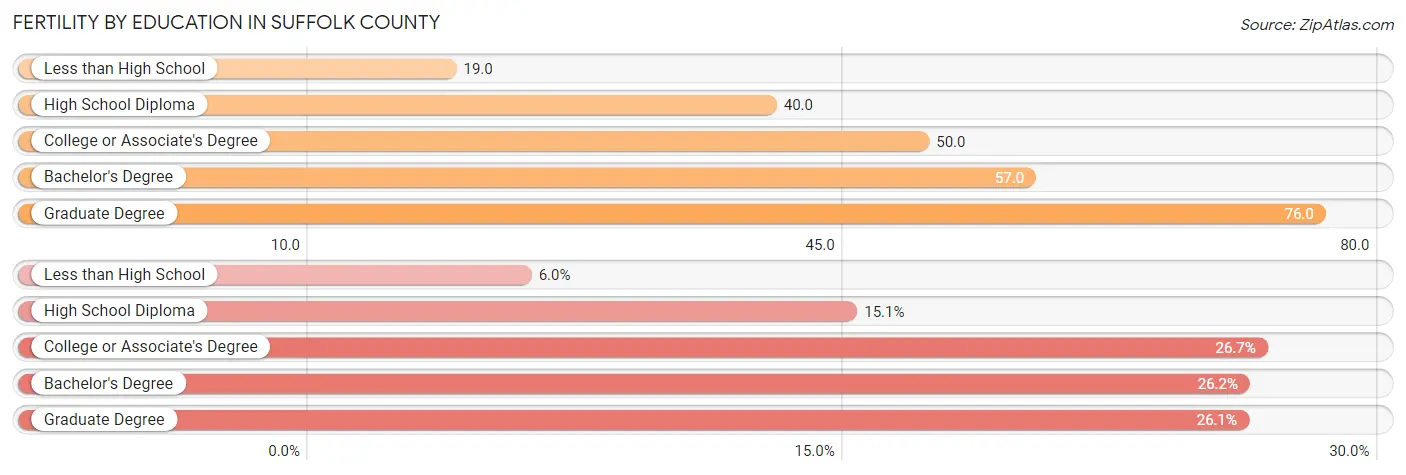
| Educational Attainment | Women with Births | Births / 1,000 Women |
| Less than High School | 981 (6.0%) | 19.0 |
| High School Diploma | 2,483 (15.1%) | 40.0 |
| College or Associate's Degree | 4,377 (26.7%) | 50.0 |
| Bachelor's Degree | 4,295 (26.2%) | 57.0 |
| Graduate Degree | 4,291 (26.1%) | 76.0 |
| Total | 16,427 (100.0%) | 49.0 |
Fertility by Education by Marriage Status in Suffolk County
27.0% of women with births in Suffolk County are unmarried. Women with the educational attainment of graduate degree are most likely to be married with 89.7% of them married at childbirth, while women with the educational attainment of less than high school are least likely to be married with 47.9% of them unmarried at childbirth.
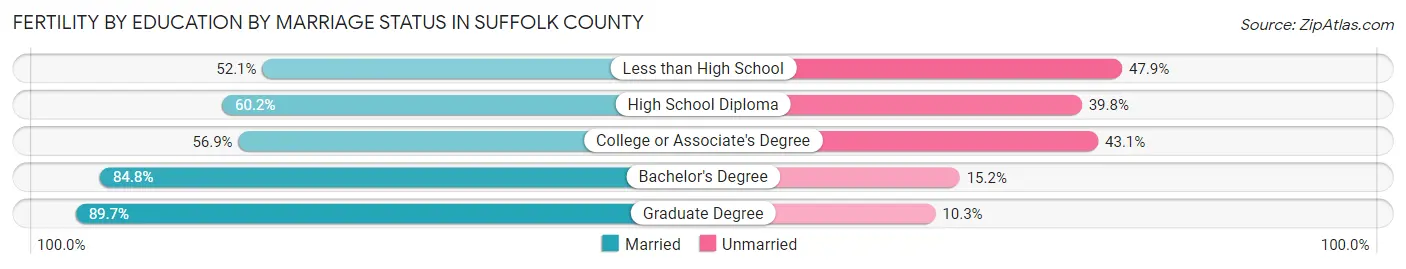
| Educational Attainment | Married | Unmarried |
| Less than High School | 511 (52.1%) | 470 (47.9%) |
| High School Diploma | 1,495 (60.2%) | 988 (39.8%) |
| College or Associate's Degree | 2,491 (56.9%) | 1,886 (43.1%) |
| Bachelor's Degree | 3,642 (84.8%) | 653 (15.2%) |
| Graduate Degree | 3,849 (89.7%) | 442 (10.3%) |
| Total | 11,992 (73.0%) | 4,435 (27.0%) |
Employment Characteristics in Suffolk County
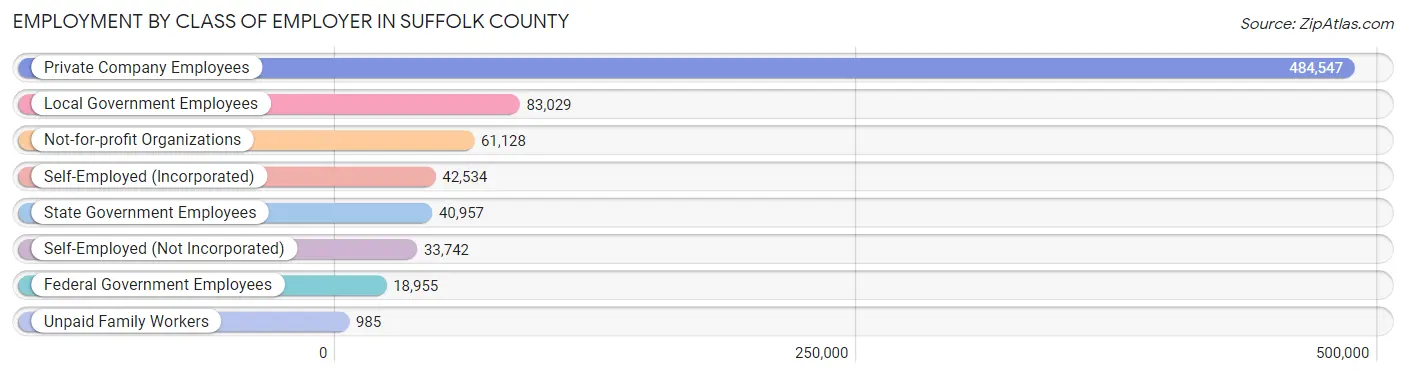
Employment by Class of Employer in Suffolk County
Among the 765,877 employed individuals in Suffolk County, private company employees (484,547 | 63.3%), local government employees (83,029 | 10.8%), and not-for-profit organizations (61,128 | 8.0%) make up the most common classes of employment.
| Employer Class | # Employees | % Employees |
| Private Company Employees | 484,547 | 63.3% |
| Self-Employed (Incorporated) | 42,534 | 5.6% |
| Self-Employed (Not Incorporated) | 33,742 | 4.4% |
| Not-for-profit Organizations | 61,128 | 8.0% |
| Local Government Employees | 83,029 | 10.8% |
| State Government Employees | 40,957 | 5.3% |
| Federal Government Employees | 18,955 | 2.5% |
| Unpaid Family Workers | 985 | 0.1% |
| Total | 765,877 | 100.0% |
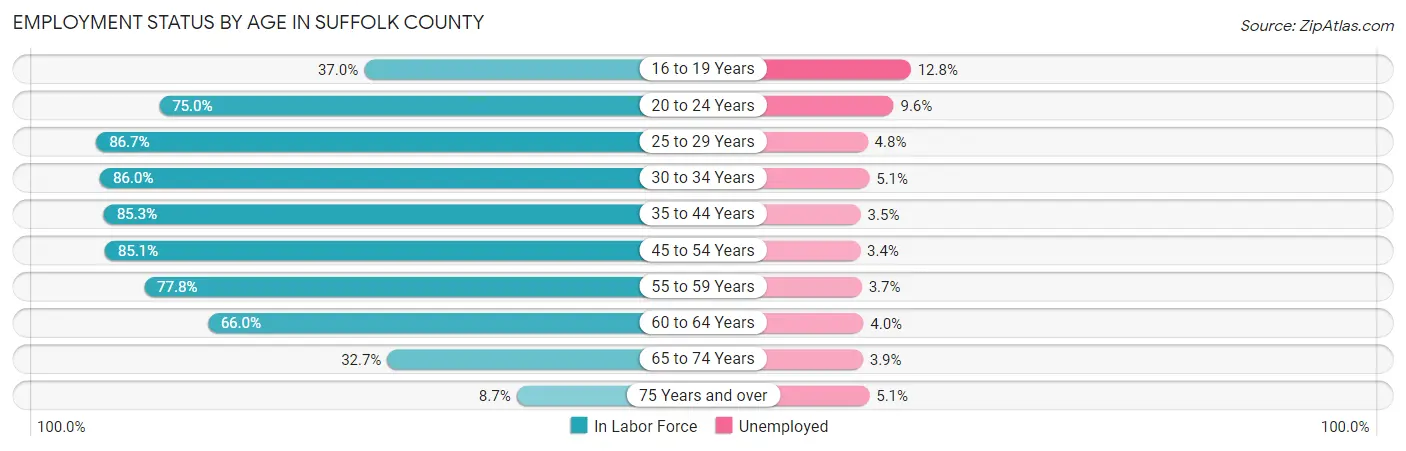
Employment Status by Age in Suffolk County
According to the labor force statistics for Suffolk County, out of the total population over 16 years of age (1,249,182), 65.8% or 821,962 individuals are in the labor force, with 4.8% or 39,454 of them unemployed. The age group with the highest labor force participation rate is 25 to 29 years, with 86.7% or 81,733 individuals in the labor force. Within the labor force, the 16 to 19 years age range has the highest percentage of unemployed individuals, with 12.8% or 3,870 of them being unemployed.
| Age Bracket | In Labor Force | Unemployed |
| 16 to 19 Years | 30,235 (37.0%) | 3,870 (12.8%) |
| 20 to 24 Years | 75,272 (75.0%) | 7,226 (9.6%) |
| 25 to 29 Years | 81,733 (86.7%) | 3,923 (4.8%) |
| 30 to 34 Years | 76,158 (86.0%) | 3,884 (5.1%) |
| 35 to 44 Years | 154,029 (85.3%) | 5,391 (3.5%) |
| 45 to 54 Years | 181,556 (85.1%) | 6,173 (3.4%) |
| 55 to 59 Years | 92,285 (77.8%) | 3,415 (3.7%) |
| 60 to 64 Years | 71,518 (66.0%) | 2,861 (4.0%) |
| 65 to 74 Years | 49,087 (32.7%) | 1,914 (3.9%) |
| 75 Years and over | 9,854 (8.7%) | 503 (5.1%) |
| Total | 821,962 (65.8%) | 39,454 (4.8%) |
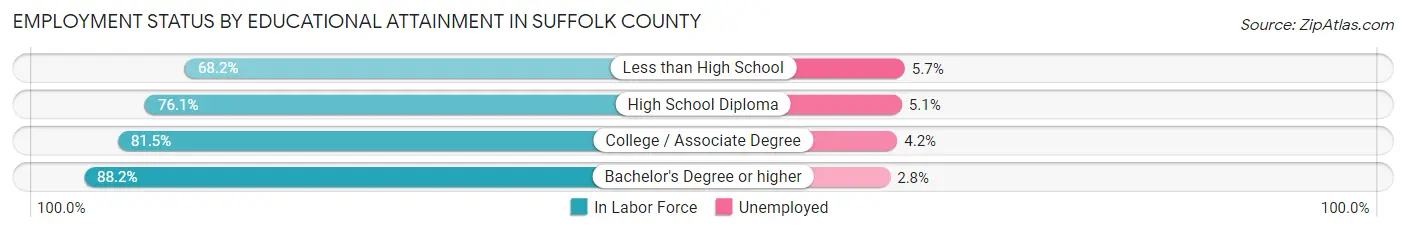
Employment Status by Educational Attainment in Suffolk County
According to labor force statistics for Suffolk County, 81.8% of individuals (657,445) out of the total population between 25 and 64 years of age (803,722) are in the labor force, with 3.9% or 25,640 of them being unemployed. The group with the highest labor force participation rate are those with the educational attainment of bachelor's degree or higher, with 88.2% or 291,582 individuals in the labor force. Within the labor force, individuals with less than high school education have the highest percentage of unemployment, with 5.7% or 2,858 of them being unemployed.
| Educational Attainment | In Labor Force | Unemployed |
| Less than High School | 50,144 (68.2%) | 4,191 (5.7%) |
| High School Diploma | 140,645 (76.1%) | 9,426 (5.1%) |
| College / Associate Degree | 175,053 (81.5%) | 9,021 (4.2%) |
| Bachelor's Degree or higher | 291,582 (88.2%) | 9,257 (2.8%) |
| Total | 657,445 (81.8%) | 31,345 (3.9%) |
Employment Occupations by Sex in Suffolk County
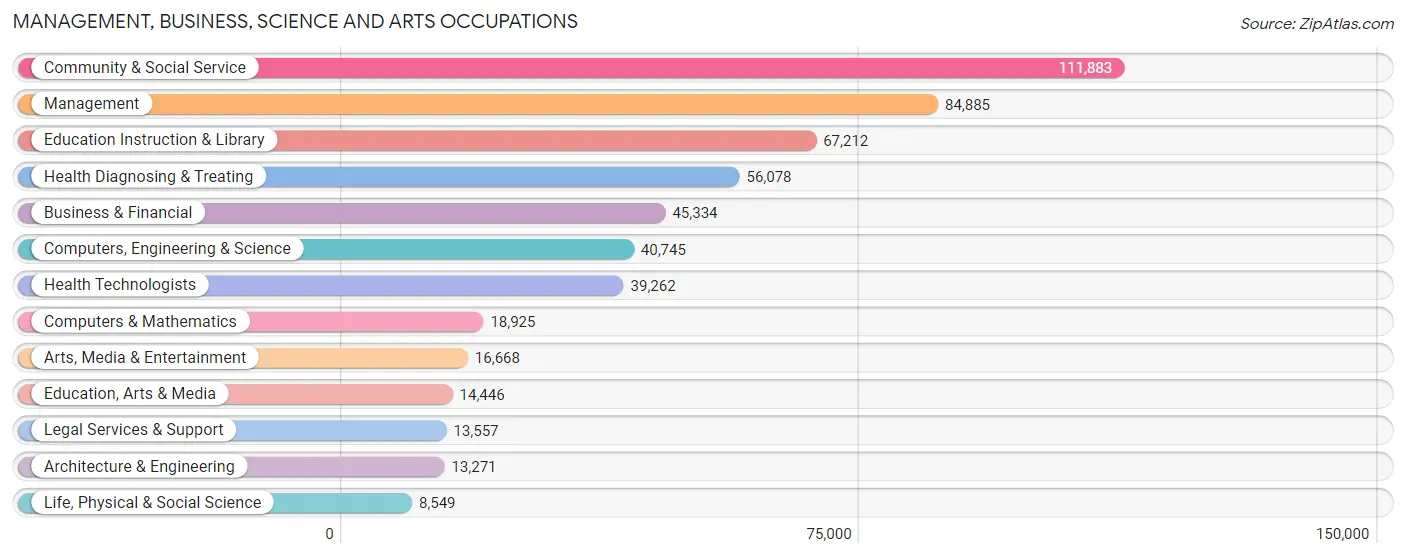
Management, Business, Science and Arts Occupations
The most common Management, Business, Science and Arts occupations in Suffolk County are Community & Social Service (111,883 | 14.3%), Management (84,885 | 10.9%), Education Instruction & Library (67,212 | 8.6%), Health Diagnosing & Treating (56,078 | 7.2%), and Business & Financial (45,334 | 5.8%).
Management, Business, Science and Arts Occupations by Sex
Within the Management, Business, Science and Arts occupations in Suffolk County, the most male-oriented occupations are Architecture & Engineering (87.2%), Computers & Mathematics (76.4%), and Computers, Engineering & Science (73.7%), while the most female-oriented occupations are Education Instruction & Library (74.8%), Education, Arts & Media (72.2%), and Health Diagnosing & Treating (71.5%).
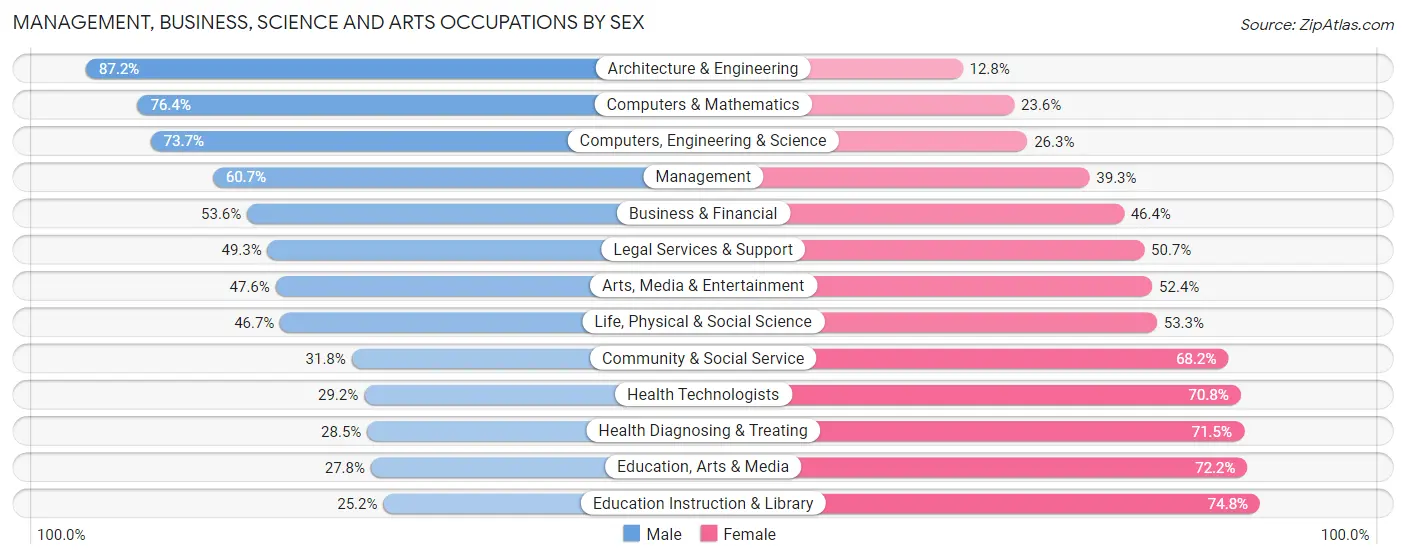
| Occupation | Male | Female |
| Management | 51,559 (60.7%) | 33,326 (39.3%) |
| Business & Financial | 24,291 (53.6%) | 21,043 (46.4%) |
| Computers, Engineering & Science | 30,030 (73.7%) | 10,715 (26.3%) |
| Computers & Mathematics | 14,467 (76.4%) | 4,458 (23.6%) |
| Architecture & Engineering | 11,572 (87.2%) | 1,699 (12.8%) |
| Life, Physical & Social Science | 3,991 (46.7%) | 4,558 (53.3%) |
| Community & Social Service | 35,561 (31.8%) | 76,322 (68.2%) |
| Education, Arts & Media | 4,014 (27.8%) | 10,432 (72.2%) |
| Legal Services & Support | 6,686 (49.3%) | 6,871 (50.7%) |
| Education Instruction & Library | 16,920 (25.2%) | 50,292 (74.8%) |
| Arts, Media & Entertainment | 7,941 (47.6%) | 8,727 (52.4%) |
| Health Diagnosing & Treating | 16,003 (28.5%) | 40,075 (71.5%) |
| Health Technologists | 11,459 (29.2%) | 27,803 (70.8%) |
| Total (Category) | 157,444 (46.5%) | 181,481 (53.5%) |
| Total (Overall) | 414,387 (53.0%) | 367,431 (47.0%) |
Services Occupations
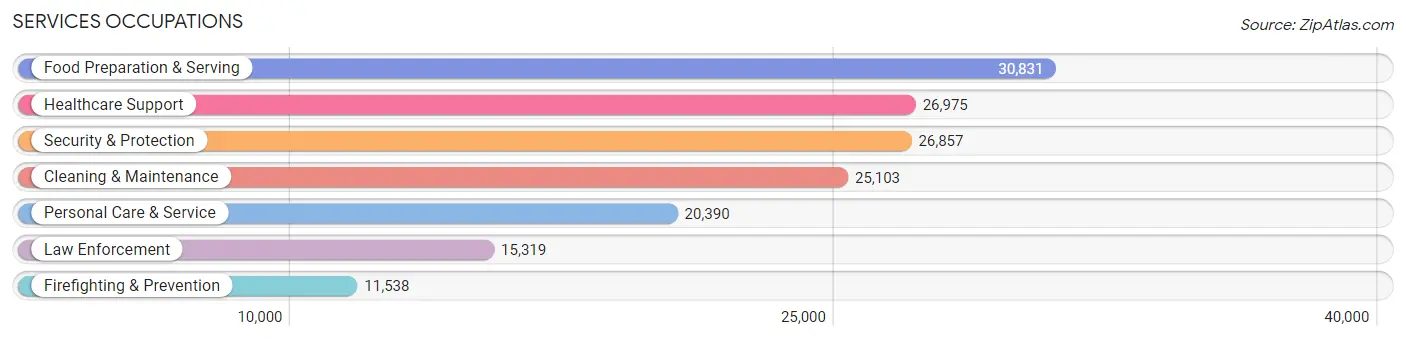
The most common Services occupations in Suffolk County are Food Preparation & Serving (30,831 | 3.9%), Healthcare Support (26,975 | 3.5%), Security & Protection (26,857 | 3.4%), Cleaning & Maintenance (25,103 | 3.2%), and Personal Care & Service (20,390 | 2.6%).
Services Occupations by Sex
Within the Services occupations in Suffolk County, the most male-oriented occupations are Law Enforcement (84.7%), Security & Protection (80.5%), and Firefighting & Prevention (74.8%), while the most female-oriented occupations are Healthcare Support (80.4%), Personal Care & Service (72.1%), and Food Preparation & Serving (52.6%).
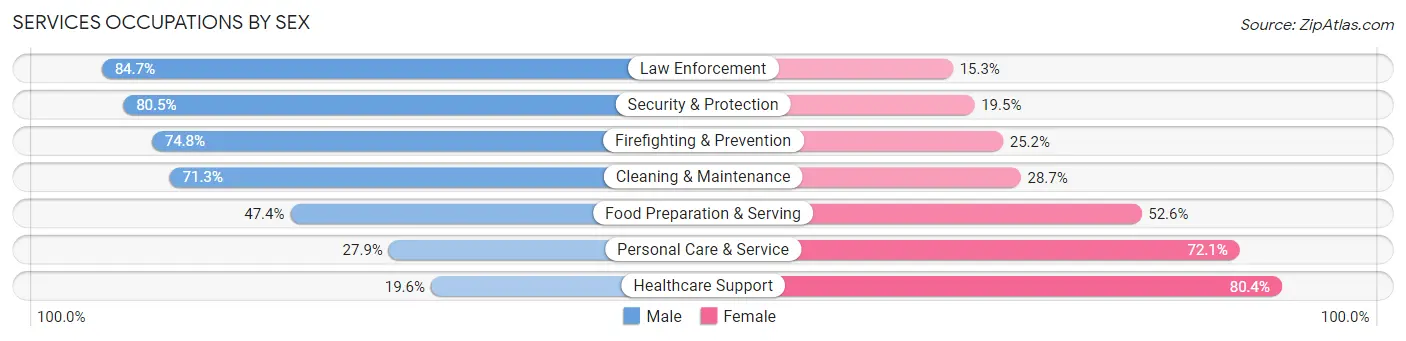
| Occupation | Male | Female |
| Healthcare Support | 5,277 (19.6%) | 21,698 (80.4%) |
| Security & Protection | 21,609 (80.5%) | 5,248 (19.5%) |
| Firefighting & Prevention | 8,631 (74.8%) | 2,907 (25.2%) |
| Law Enforcement | 12,978 (84.7%) | 2,341 (15.3%) |
| Food Preparation & Serving | 14,608 (47.4%) | 16,223 (52.6%) |
| Cleaning & Maintenance | 17,893 (71.3%) | 7,210 (28.7%) |
| Personal Care & Service | 5,690 (27.9%) | 14,700 (72.1%) |
| Total (Category) | 65,077 (50.0%) | 65,079 (50.0%) |
| Total (Overall) | 414,387 (53.0%) | 367,431 (47.0%) |
Sales and Office Occupations
The most common Sales and Office occupations in Suffolk County are Office & Administration (91,902 | 11.7%), and Sales & Related (79,608 | 10.2%).

Sales and Office Occupations by Sex
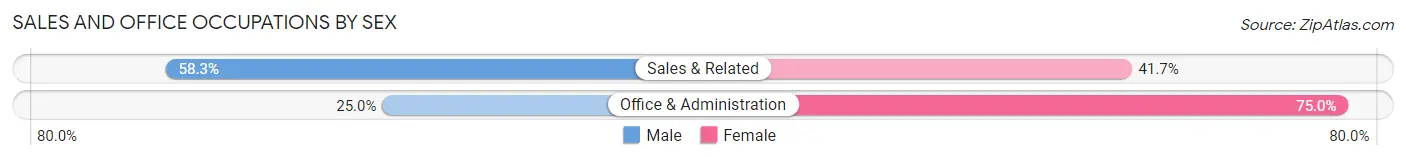
| Occupation | Male | Female |
| Sales & Related | 46,413 (58.3%) | 33,195 (41.7%) |
| Office & Administration | 22,947 (25.0%) | 68,955 (75.0%) |
| Total (Category) | 69,360 (40.4%) | 102,150 (59.6%) |
| Total (Overall) | 414,387 (53.0%) | 367,431 (47.0%) |
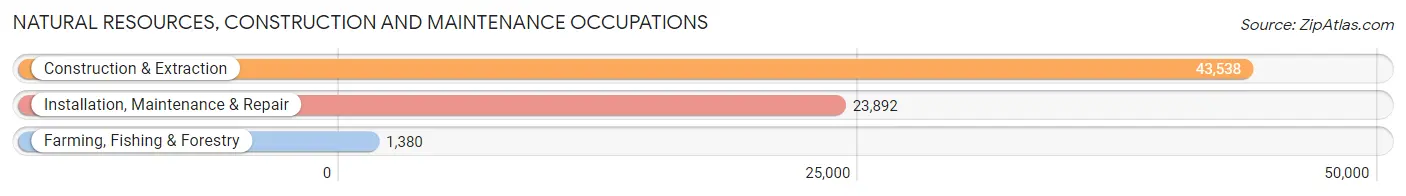
Natural Resources, Construction and Maintenance Occupations
The most common Natural Resources, Construction and Maintenance occupations in Suffolk County are Construction & Extraction (43,538 | 5.6%), Installation, Maintenance & Repair (23,892 | 3.1%), and Farming, Fishing & Forestry (1,380 | 0.2%).
Natural Resources, Construction and Maintenance Occupations by Sex
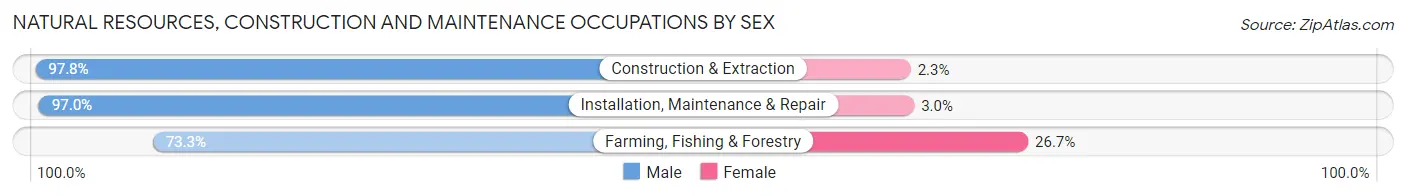
| Occupation | Male | Female |
| Farming, Fishing & Forestry | 1,012 (73.3%) | 368 (26.7%) |
| Construction & Extraction | 42,559 (97.8%) | 979 (2.2%) |
| Installation, Maintenance & Repair | 23,179 (97.0%) | 713 (3.0%) |
| Total (Category) | 66,750 (97.0%) | 2,060 (3.0%) |
| Total (Overall) | 414,387 (53.0%) | 367,431 (47.0%) |
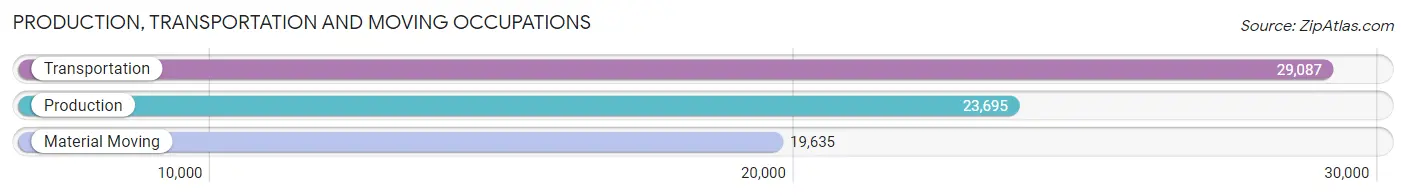
Production, Transportation and Moving Occupations
The most common Production, Transportation and Moving occupations in Suffolk County are Transportation (29,087 | 3.7%), Production (23,695 | 3.0%), and Material Moving (19,635 | 2.5%).
Production, Transportation and Moving Occupations by Sex
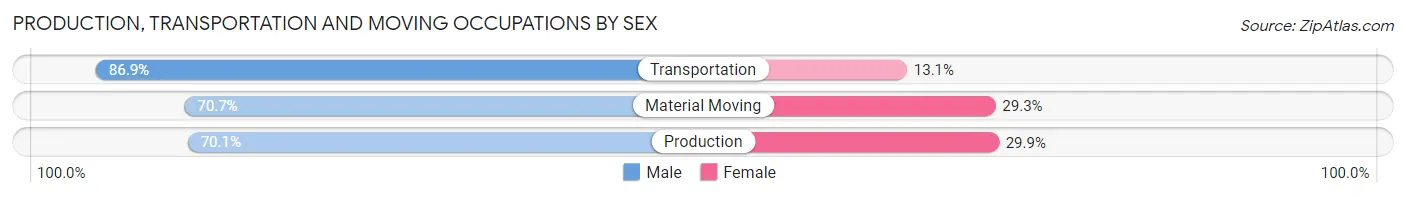
| Occupation | Male | Female |
| Production | 16,600 (70.1%) | 7,095 (29.9%) |
| Transportation | 25,279 (86.9%) | 3,808 (13.1%) |
| Material Moving | 13,877 (70.7%) | 5,758 (29.3%) |
| Total (Category) | 55,756 (77.0%) | 16,661 (23.0%) |
| Total (Overall) | 414,387 (53.0%) | 367,431 (47.0%) |
Employment Industries by Sex in Suffolk County
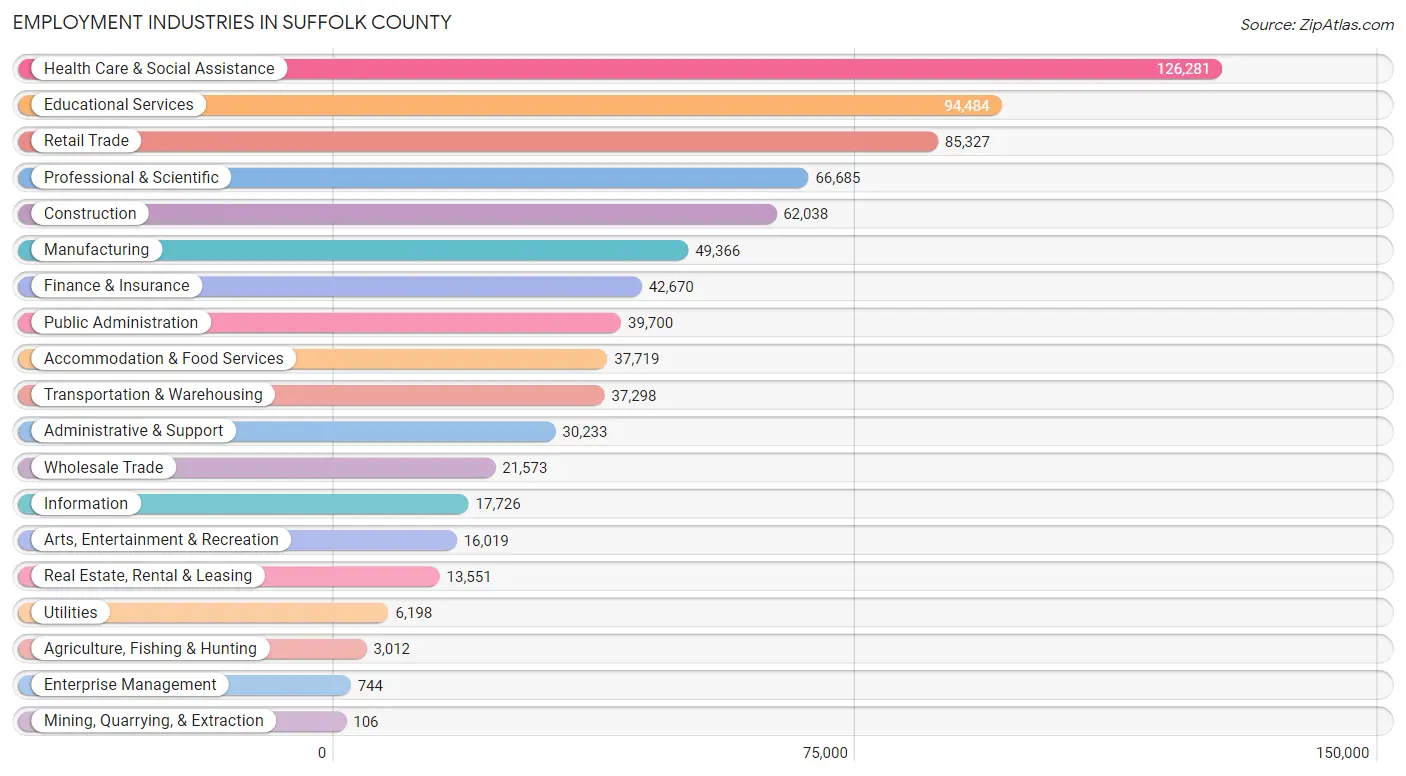
Employment Industries in Suffolk County
The major employment industries in Suffolk County include Health Care & Social Assistance (126,281 | 16.2%), Educational Services (94,484 | 12.1%), Retail Trade (85,327 | 10.9%), Professional & Scientific (66,685 | 8.5%), and Construction (62,038 | 7.9%).
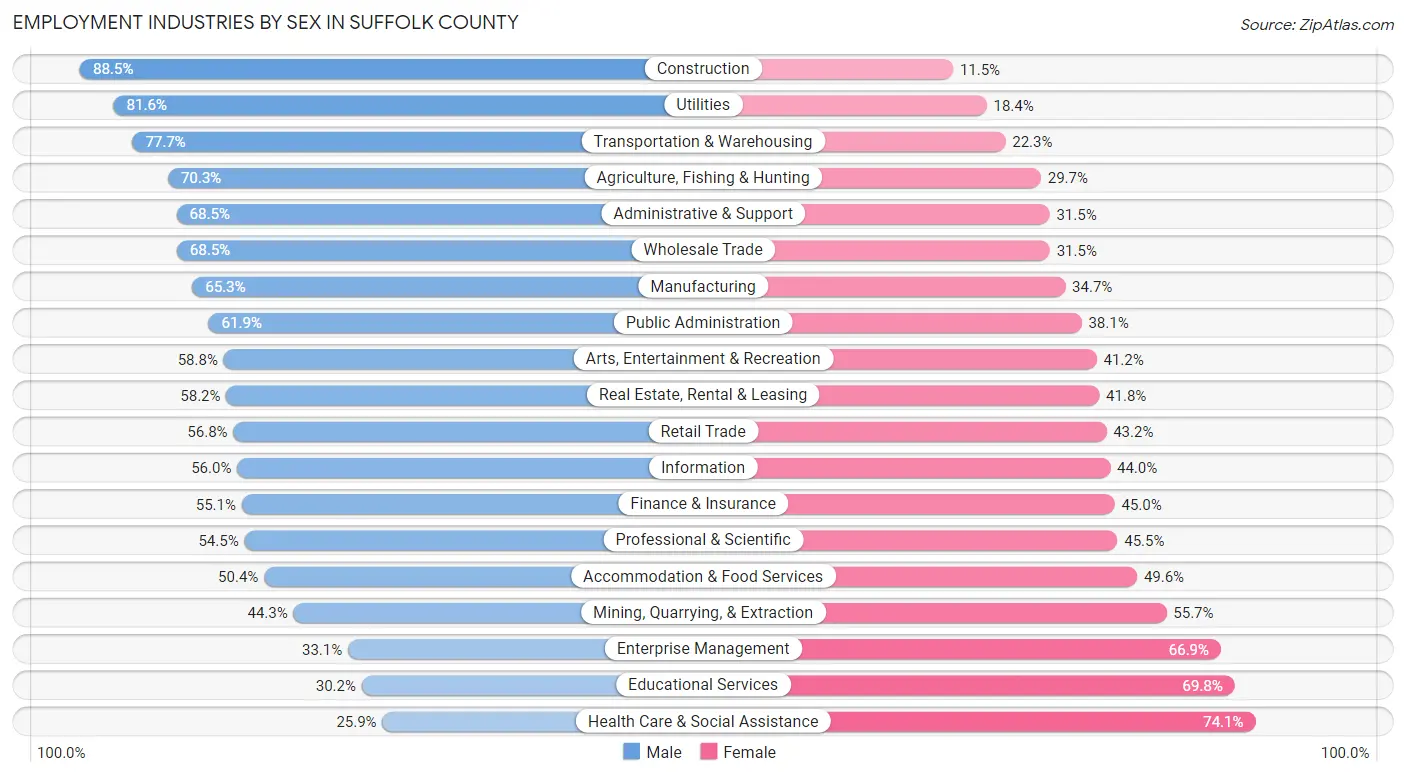
Employment Industries by Sex in Suffolk County
The Suffolk County industries that see more men than women are Construction (88.5%), Utilities (81.6%), and Transportation & Warehousing (77.7%), whereas the industries that tend to have a higher number of women are Health Care & Social Assistance (74.1%), Educational Services (69.8%), and Enterprise Management (66.9%).
| Industry | Male | Female |
| Agriculture, Fishing & Hunting | 2,118 (70.3%) | 894 (29.7%) |
| Mining, Quarrying, & Extraction | 47 (44.3%) | 59 (55.7%) |
| Construction | 54,910 (88.5%) | 7,128 (11.5%) |
| Manufacturing | 32,224 (65.3%) | 17,142 (34.7%) |
| Wholesale Trade | 14,770 (68.5%) | 6,803 (31.5%) |
| Retail Trade | 48,450 (56.8%) | 36,877 (43.2%) |
| Transportation & Warehousing | 28,969 (77.7%) | 8,329 (22.3%) |
| Utilities | 5,055 (81.6%) | 1,143 (18.4%) |
| Information | 9,924 (56.0%) | 7,802 (44.0%) |
| Finance & Insurance | 23,491 (55.0%) | 19,179 (45.0%) |
| Real Estate, Rental & Leasing | 7,892 (58.2%) | 5,659 (41.8%) |
| Professional & Scientific | 36,335 (54.5%) | 30,350 (45.5%) |
| Enterprise Management | 246 (33.1%) | 498 (66.9%) |
| Administrative & Support | 20,715 (68.5%) | 9,518 (31.5%) |
| Educational Services | 28,538 (30.2%) | 65,946 (69.8%) |
| Health Care & Social Assistance | 32,740 (25.9%) | 93,541 (74.1%) |
| Arts, Entertainment & Recreation | 9,416 (58.8%) | 6,603 (41.2%) |
| Accommodation & Food Services | 19,018 (50.4%) | 18,701 (49.6%) |
| Public Administration | 24,574 (61.9%) | 15,126 (38.1%) |
| Total | 414,387 (53.0%) | 367,431 (47.0%) |
Education in Suffolk County
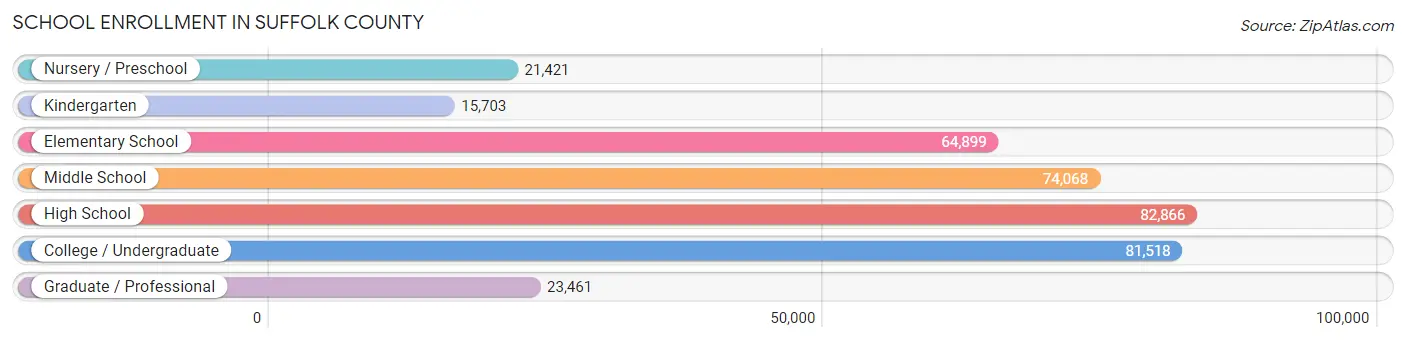
School Enrollment in Suffolk County
The most common levels of schooling among the 363,936 students in Suffolk County are high school (82,866 | 22.8%), college / undergraduate (81,518 | 22.4%), and middle school (74,068 | 20.3%).
| School Level | # Students | % Students |
| Nursery / Preschool | 21,421 | 5.9% |
| Kindergarten | 15,703 | 4.3% |
| Elementary School | 64,899 | 17.8% |
| Middle School | 74,068 | 20.3% |
| High School | 82,866 | 22.8% |
| College / Undergraduate | 81,518 | 22.4% |
| Graduate / Professional | 23,461 | 6.5% |
| Total | 363,936 | 100.0% |
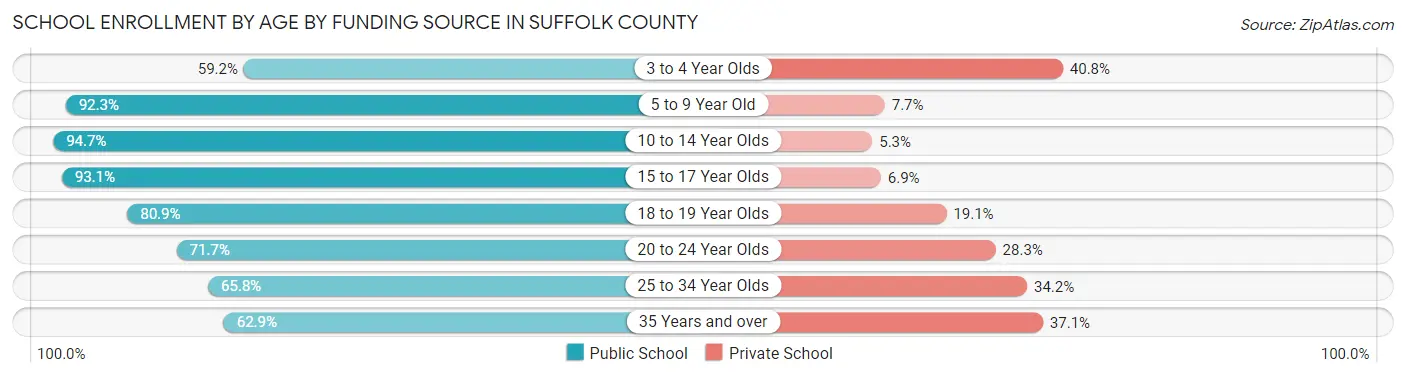
School Enrollment by Age by Funding Source in Suffolk County
Out of a total of 363,936 students who are enrolled in schools in Suffolk County, 55,318 (15.2%) attend a private institution, while the remaining 308,618 (84.8%) are enrolled in public schools. The age group of 3 to 4 year olds has the highest likelihood of being enrolled in private schools, with 7,699 (40.8% in the age bracket) enrolled. Conversely, the age group of 10 to 14 year olds has the lowest likelihood of being enrolled in a private school, with 87,865 (94.7% in the age bracket) attending a public institution.
| Age Bracket | Public School | Private School |
| 3 to 4 Year Olds | 11,158 (59.2%) | 7,699 (40.8%) |
| 5 to 9 Year Old | 72,627 (92.3%) | 6,022 (7.7%) |
| 10 to 14 Year Olds | 87,865 (94.7%) | 4,950 (5.3%) |
| 15 to 17 Year Olds | 54,141 (93.1%) | 4,031 (6.9%) |
| 18 to 19 Year Olds | 26,265 (80.9%) | 6,219 (19.1%) |
| 20 to 24 Year Olds | 32,338 (71.7%) | 12,772 (28.3%) |
| 25 to 34 Year Olds | 13,207 (65.8%) | 6,852 (34.2%) |
| 35 Years and over | 11,188 (62.9%) | 6,602 (37.1%) |
| Total | 308,618 (84.8%) | 55,318 (15.2%) |
Educational Attainment by Field of Study in Suffolk County
Business (89,203 | 20.0%), education (62,906 | 14.1%), science & technology (47,677 | 10.7%), social sciences (36,396 | 8.2%), and psychology (26,010 | 5.8%) are the most common fields of study among 445,350 individuals in Suffolk County who have obtained a bachelor's degree or higher.
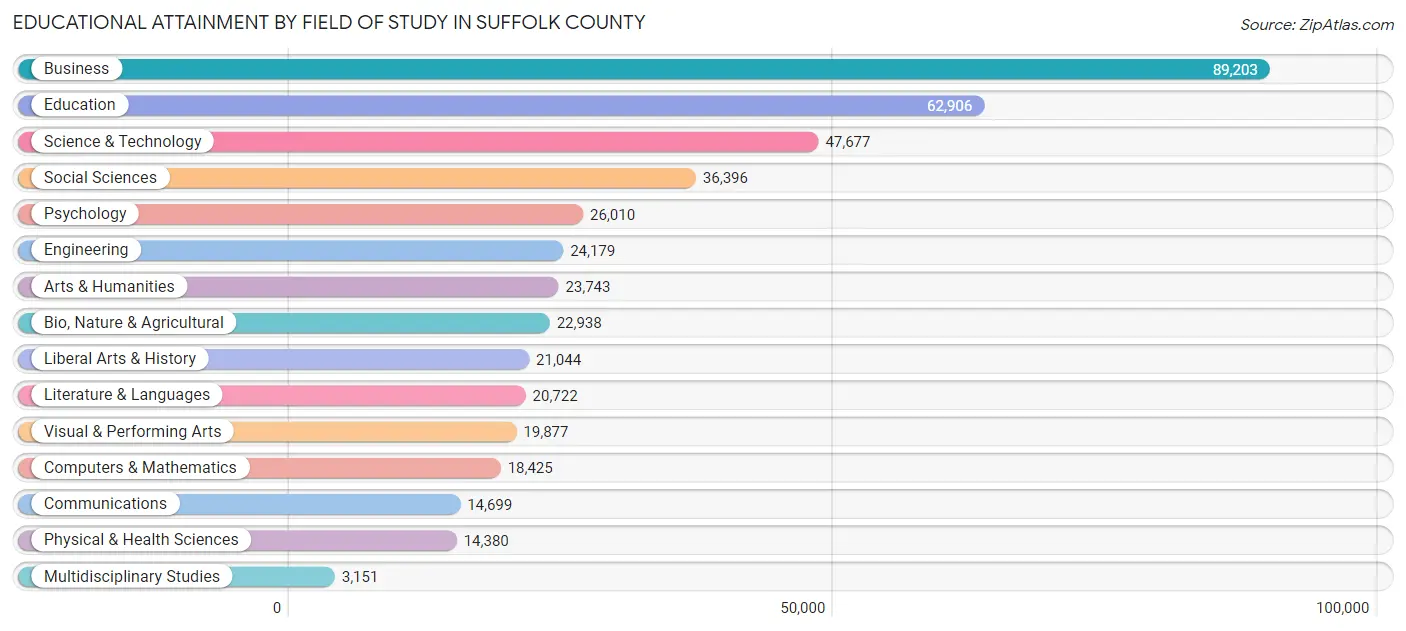
| Field of Study | # Graduates | % Graduates |
| Computers & Mathematics | 18,425 | 4.1% |
| Bio, Nature & Agricultural | 22,938 | 5.1% |
| Physical & Health Sciences | 14,380 | 3.2% |
| Psychology | 26,010 | 5.8% |
| Social Sciences | 36,396 | 8.2% |
| Engineering | 24,179 | 5.4% |
| Multidisciplinary Studies | 3,151 | 0.7% |
| Science & Technology | 47,677 | 10.7% |
| Business | 89,203 | 20.0% |
| Education | 62,906 | 14.1% |
| Literature & Languages | 20,722 | 4.6% |
| Liberal Arts & History | 21,044 | 4.7% |
| Visual & Performing Arts | 19,877 | 4.5% |
| Communications | 14,699 | 3.3% |
| Arts & Humanities | 23,743 | 5.3% |
| Total | 445,350 | 100.0% |
Transportation & Commute in Suffolk County
Vehicle Availability by Sex in Suffolk County
The most prevalent vehicle ownership categories in Suffolk County are males with 2 vehicles (153,983, accounting for 38.0%) and females with 2 vehicles (132,304, making up 43.2%).
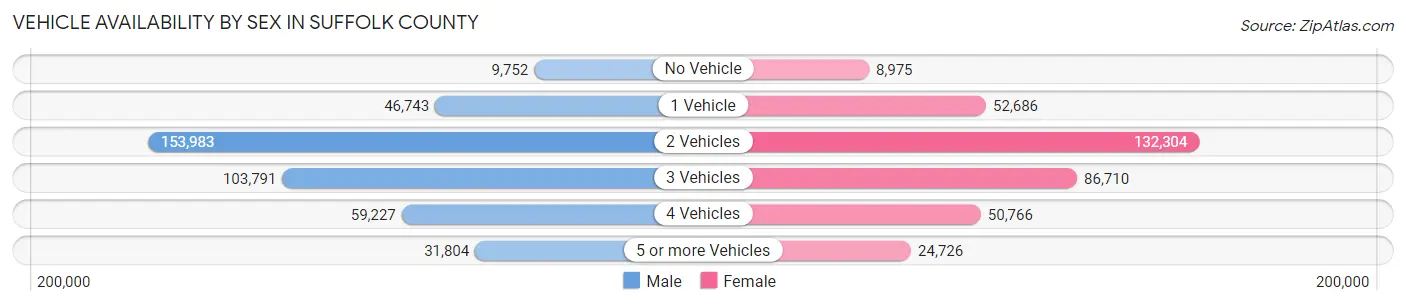
| Vehicles Available | Male | Female |
| No Vehicle | 9,752 (2.4%) | 8,975 (2.5%) |
| 1 Vehicle | 46,743 (11.5%) | 52,686 (14.8%) |
| 2 Vehicles | 153,983 (38.0%) | 132,304 (37.1%) |
| 3 Vehicles | 103,791 (25.6%) | 86,710 (24.3%) |
| 4 Vehicles | 59,227 (14.6%) | 50,766 (14.2%) |
| 5 or more Vehicles | 31,804 (7.9%) | 24,726 (6.9%) |
| Total | 405,300 (100.0%) | 356,167 (100.0%) |
Commute Time in Suffolk County
The most frequently occuring commute durations in Suffolk County are 30 to 34 minutes (104,509 commuters, 15.1%), 20 to 24 minutes (91,923 commuters, 13.3%), and 15 to 19 minutes (91,422 commuters, 13.2%).
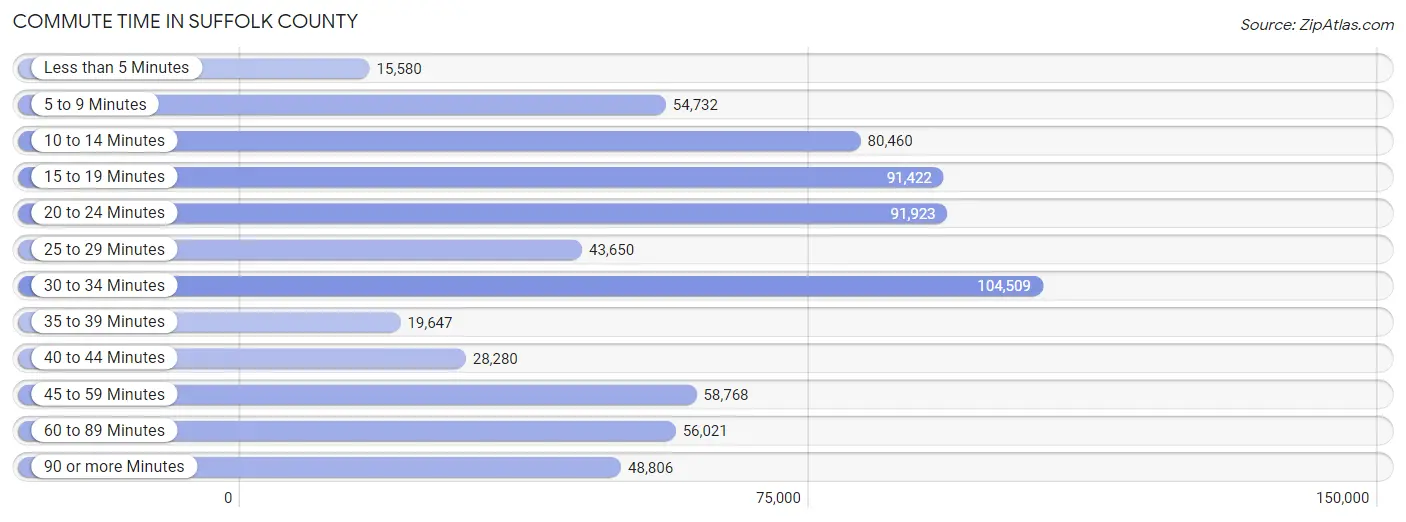
| Commute Time | # Commuters | % Commuters |
| Less than 5 Minutes | 15,580 | 2.2% |
| 5 to 9 Minutes | 54,732 | 7.9% |
| 10 to 14 Minutes | 80,460 | 11.6% |
| 15 to 19 Minutes | 91,422 | 13.2% |
| 20 to 24 Minutes | 91,923 | 13.3% |
| 25 to 29 Minutes | 43,650 | 6.3% |
| 30 to 34 Minutes | 104,509 | 15.1% |
| 35 to 39 Minutes | 19,647 | 2.8% |
| 40 to 44 Minutes | 28,280 | 4.1% |
| 45 to 59 Minutes | 58,768 | 8.5% |
| 60 to 89 Minutes | 56,021 | 8.1% |
| 90 or more Minutes | 48,806 | 7.0% |
Commute Time by Sex in Suffolk County
The most common commute times in Suffolk County are 30 to 34 minutes (57,120 commuters, 15.3%) for males and 30 to 34 minutes (47,389 commuters, 14.7%) for females.
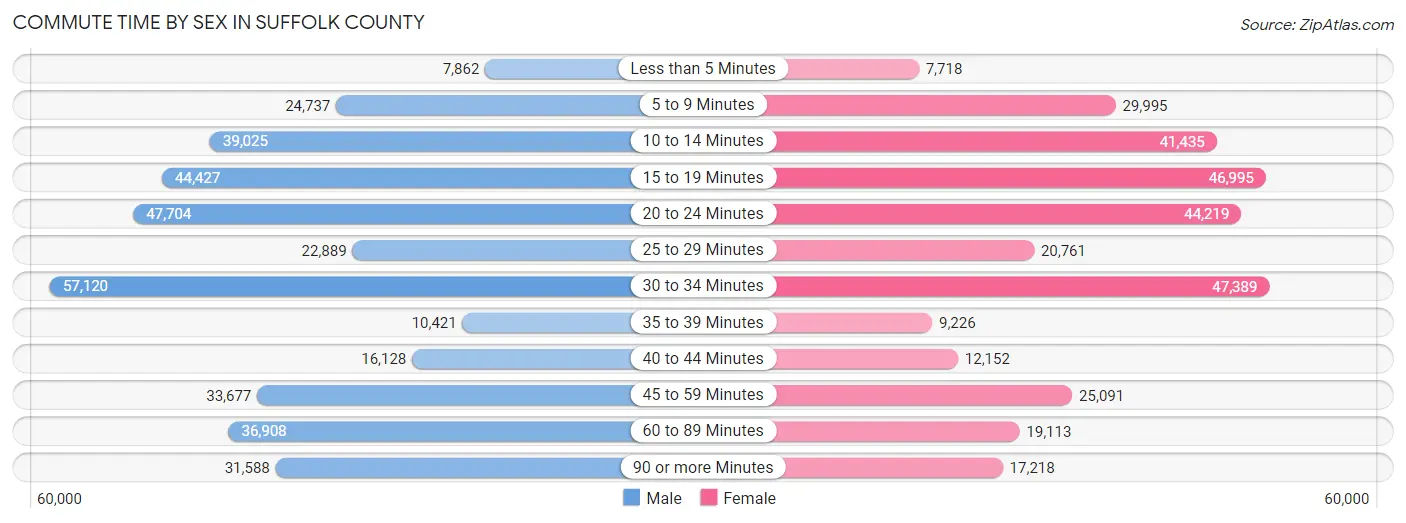
| Commute Time | Male | Female |
| Less than 5 Minutes | 7,862 (2.1%) | 7,718 (2.4%) |
| 5 to 9 Minutes | 24,737 (6.6%) | 29,995 (9.3%) |
| 10 to 14 Minutes | 39,025 (10.5%) | 41,435 (12.9%) |
| 15 to 19 Minutes | 44,427 (11.9%) | 46,995 (14.6%) |
| 20 to 24 Minutes | 47,704 (12.8%) | 44,219 (13.8%) |
| 25 to 29 Minutes | 22,889 (6.1%) | 20,761 (6.5%) |
| 30 to 34 Minutes | 57,120 (15.3%) | 47,389 (14.7%) |
| 35 to 39 Minutes | 10,421 (2.8%) | 9,226 (2.9%) |
| 40 to 44 Minutes | 16,128 (4.3%) | 12,152 (3.8%) |
| 45 to 59 Minutes | 33,677 (9.0%) | 25,091 (7.8%) |
| 60 to 89 Minutes | 36,908 (9.9%) | 19,113 (5.9%) |
| 90 or more Minutes | 31,588 (8.5%) | 17,218 (5.4%) |
Time of Departure to Work by Sex in Suffolk County
The most frequent times of departure to work in Suffolk County are 7:00 AM to 7:29 AM (53,402, 14.3%) for males and 8:00 AM to 8:29 AM (55,721, 17.3%) for females.
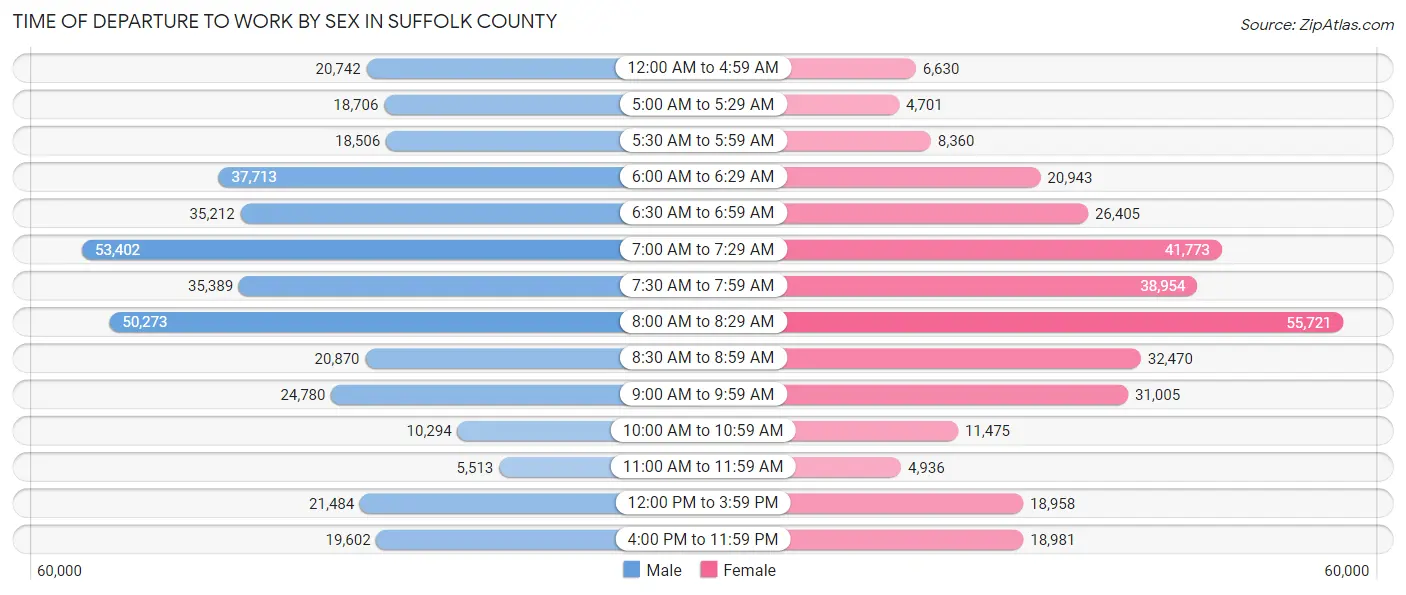
| Time of Departure | Male | Female |
| 12:00 AM to 4:59 AM | 20,742 (5.6%) | 6,630 (2.1%) |
| 5:00 AM to 5:29 AM | 18,706 (5.0%) | 4,701 (1.5%) |
| 5:30 AM to 5:59 AM | 18,506 (5.0%) | 8,360 (2.6%) |
| 6:00 AM to 6:29 AM | 37,713 (10.1%) | 20,943 (6.5%) |
| 6:30 AM to 6:59 AM | 35,212 (9.5%) | 26,405 (8.2%) |
| 7:00 AM to 7:29 AM | 53,402 (14.3%) | 41,773 (13.0%) |
| 7:30 AM to 7:59 AM | 35,389 (9.5%) | 38,954 (12.1%) |
| 8:00 AM to 8:29 AM | 50,273 (13.5%) | 55,721 (17.3%) |
| 8:30 AM to 8:59 AM | 20,870 (5.6%) | 32,470 (10.1%) |
| 9:00 AM to 9:59 AM | 24,780 (6.7%) | 31,005 (9.7%) |
| 10:00 AM to 10:59 AM | 10,294 (2.8%) | 11,475 (3.6%) |
| 11:00 AM to 11:59 AM | 5,513 (1.5%) | 4,936 (1.5%) |
| 12:00 PM to 3:59 PM | 21,484 (5.8%) | 18,958 (5.9%) |
| 4:00 PM to 11:59 PM | 19,602 (5.3%) | 18,981 (5.9%) |
| Total | 372,486 (100.0%) | 321,312 (100.0%) |
Housing Occupancy in Suffolk County
Occupancy by Ownership in Suffolk County
Of the total 510,686 dwellings in Suffolk County, owner-occupied units account for 417,769 (81.8%), while renter-occupied units make up 92,917 (18.2%).
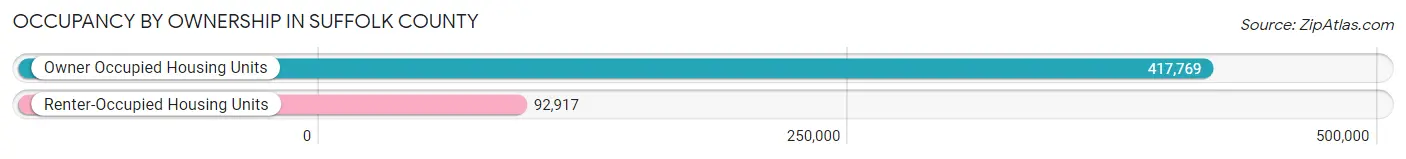
| Occupancy | # Housing Units | % Housing Units |
| Owner Occupied Housing Units | 417,769 | 81.8% |
| Renter-Occupied Housing Units | 92,917 | 18.2% |
| Total Occupied Housing Units | 510,686 | 100.0% |
Occupancy by Household Size in Suffolk County
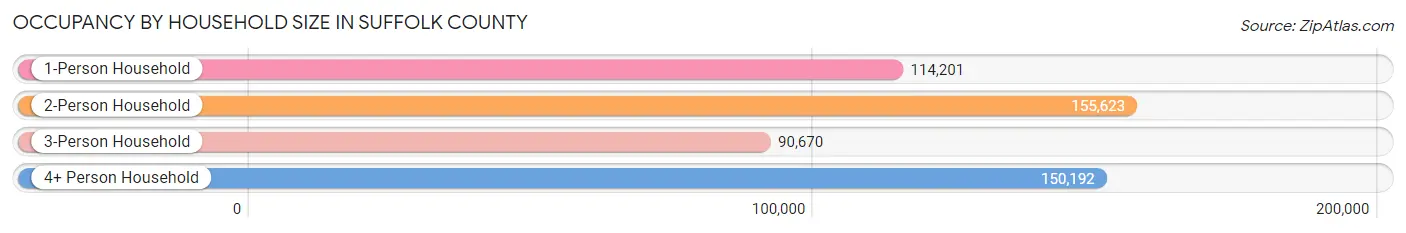
| Household Size | # Housing Units | % Housing Units |
| 1-Person Household | 114,201 | 22.4% |
| 2-Person Household | 155,623 | 30.5% |
| 3-Person Household | 90,670 | 17.7% |
| 4+ Person Household | 150,192 | 29.4% |
| Total Housing Units | 510,686 | 100.0% |
Occupancy by Ownership by Household Size in Suffolk County
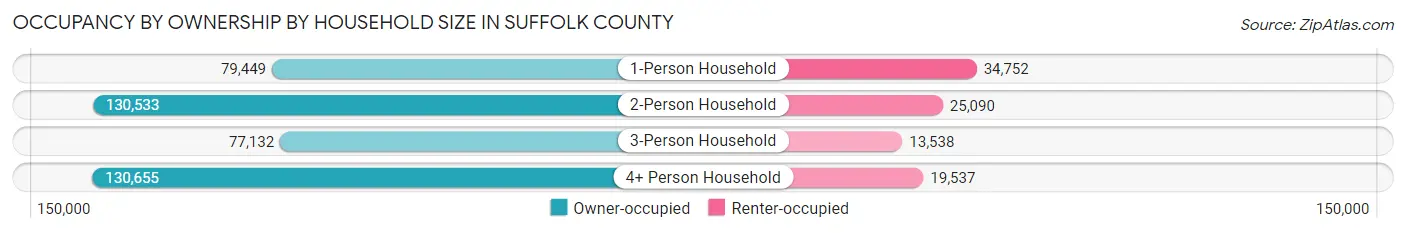
| Household Size | Owner-occupied | Renter-occupied |
| 1-Person Household | 79,449 (69.6%) | 34,752 (30.4%) |
| 2-Person Household | 130,533 (83.9%) | 25,090 (16.1%) |
| 3-Person Household | 77,132 (85.1%) | 13,538 (14.9%) |
| 4+ Person Household | 130,655 (87.0%) | 19,537 (13.0%) |
| Total Housing Units | 417,769 (81.8%) | 92,917 (18.2%) |
Occupancy by Educational Attainment in Suffolk County

| Household Size | Owner-occupied | Renter-occupied |
| Less than High School | 24,703 (66.9%) | 12,197 (33.1%) |
| High School Diploma | 88,703 (76.3%) | 27,619 (23.7%) |
| College/Associate Degree | 115,211 (81.8%) | 25,691 (18.2%) |
| Bachelor's Degree or higher | 189,152 (87.3%) | 27,410 (12.7%) |
Occupancy by Age of Householder in Suffolk County
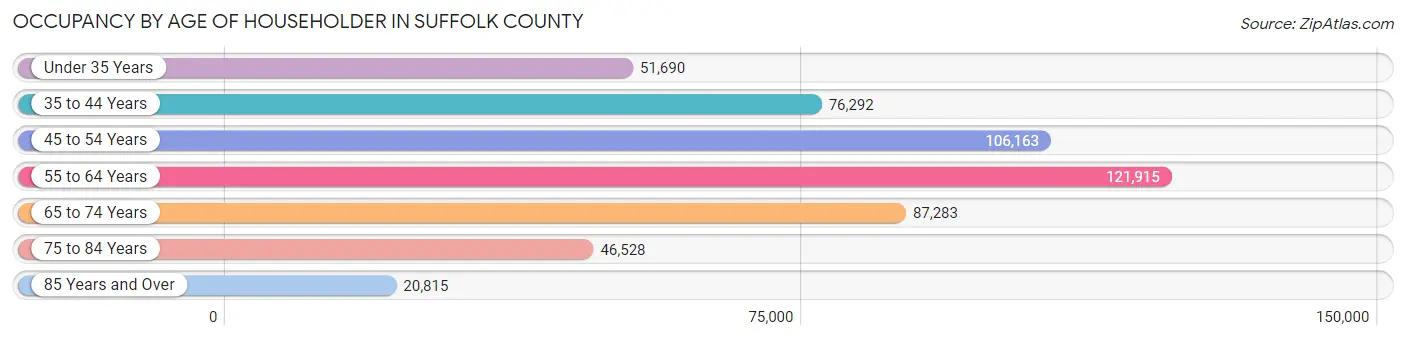
| Age Bracket | # Households | % Households |
| Under 35 Years | 51,690 | 10.1% |
| 35 to 44 Years | 76,292 | 14.9% |
| 45 to 54 Years | 106,163 | 20.8% |
| 55 to 64 Years | 121,915 | 23.9% |
| 65 to 74 Years | 87,283 | 17.1% |
| 75 to 84 Years | 46,528 | 9.1% |
| 85 Years and Over | 20,815 | 4.1% |
| Total | 510,686 | 100.0% |
Housing Finances in Suffolk County
Median Income by Occupancy in Suffolk County
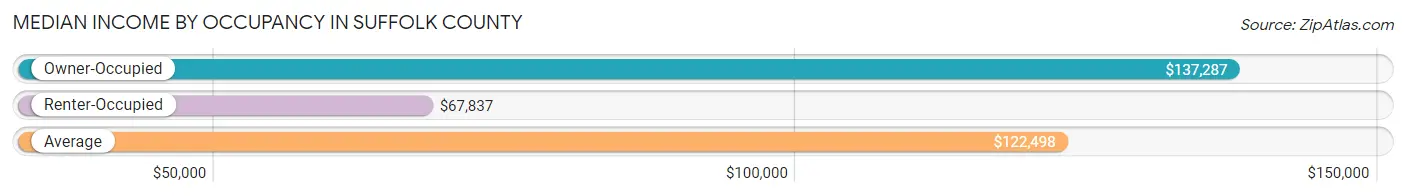
| Occupancy Type | # Households | Median Income |
| Owner-Occupied | 417,769 (81.8%) | $137,287 |
| Renter-Occupied | 92,917 (18.2%) | $67,837 |
| Average | 510,686 (100.0%) | $122,498 |
Occupancy by Householder Income Bracket in Suffolk County
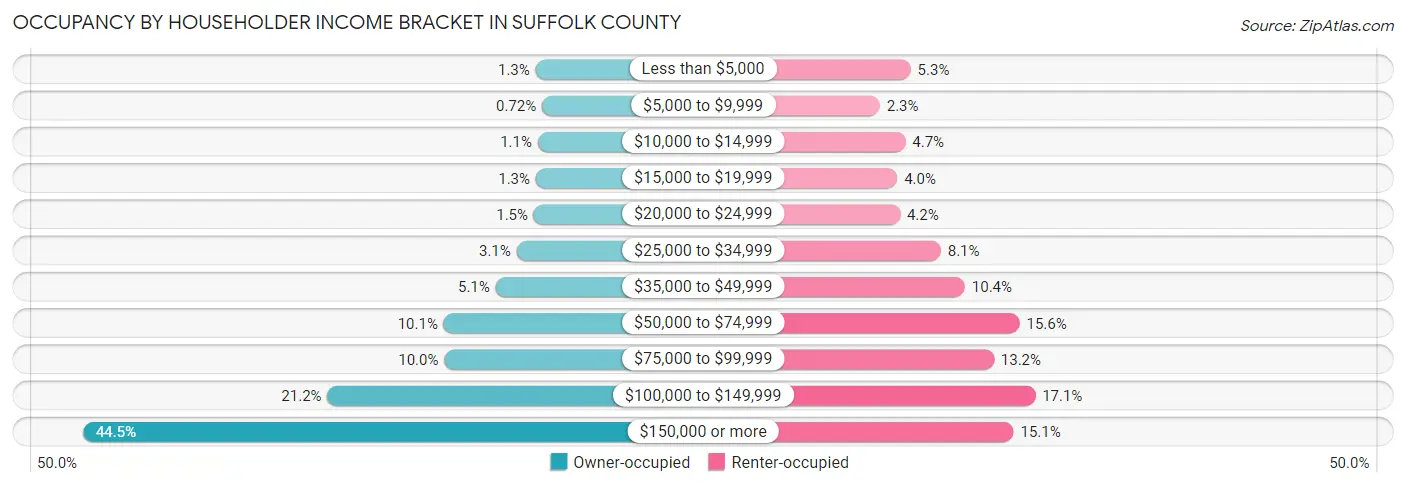
| Income Bracket | Owner-occupied | Renter-occupied |
| Less than $5,000 | 5,564 (1.3%) | 4,881 (5.2%) |
| $5,000 to $9,999 | 2,998 (0.7%) | 2,145 (2.3%) |
| $10,000 to $14,999 | 4,664 (1.1%) | 4,408 (4.7%) |
| $15,000 to $19,999 | 5,479 (1.3%) | 3,691 (4.0%) |
| $20,000 to $24,999 | 6,273 (1.5%) | 3,933 (4.2%) |
| $25,000 to $34,999 | 13,134 (3.1%) | 7,547 (8.1%) |
| $35,000 to $49,999 | 21,478 (5.1%) | 9,677 (10.4%) |
| $50,000 to $74,999 | 42,117 (10.1%) | 14,518 (15.6%) |
| $75,000 to $99,999 | 41,922 (10.0%) | 12,239 (13.2%) |
| $100,000 to $149,999 | 88,384 (21.2%) | 15,897 (17.1%) |
| $150,000 or more | 185,756 (44.5%) | 13,981 (15.0%) |
| Total | 417,769 (100.0%) | 92,917 (100.0%) |
Monthly Housing Cost Tiers in Suffolk County
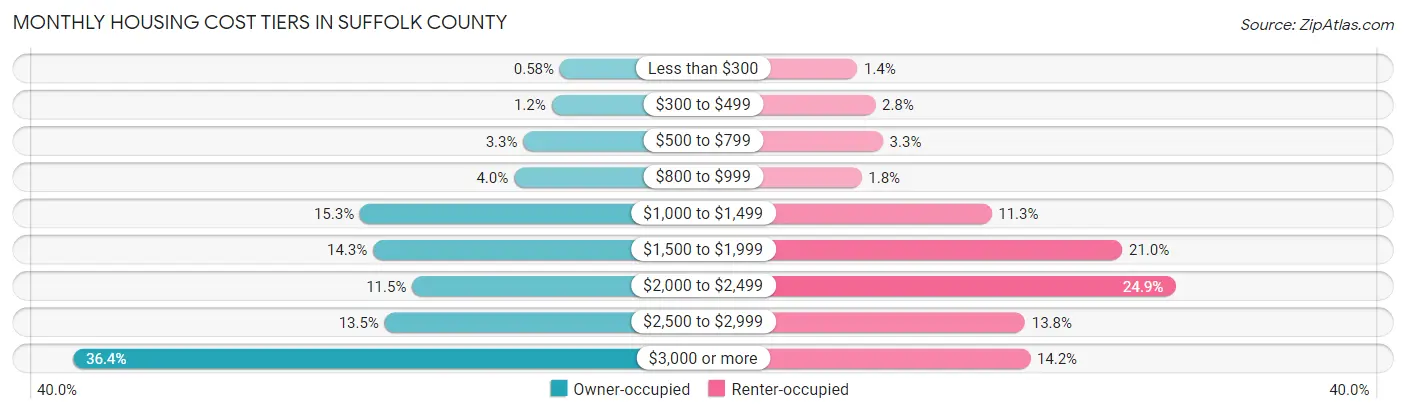
| Monthly Cost | Owner-occupied | Renter-occupied |
| Less than $300 | 2,440 (0.6%) | 1,337 (1.4%) |
| $300 to $499 | 4,962 (1.2%) | 2,576 (2.8%) |
| $500 to $799 | 13,659 (3.3%) | 3,095 (3.3%) |
| $800 to $999 | 16,493 (4.0%) | 1,637 (1.8%) |
| $1,000 to $1,499 | 63,899 (15.3%) | 10,526 (11.3%) |
| $1,500 to $1,999 | 59,928 (14.3%) | 19,471 (21.0%) |
| $2,000 to $2,499 | 47,847 (11.5%) | 23,105 (24.9%) |
| $2,500 to $2,999 | 56,330 (13.5%) | 12,820 (13.8%) |
| $3,000 or more | 152,211 (36.4%) | 13,177 (14.2%) |
| Total | 417,769 (100.0%) | 92,917 (100.0%) |
Physical Housing Characteristics in Suffolk County
Housing Structures in Suffolk County
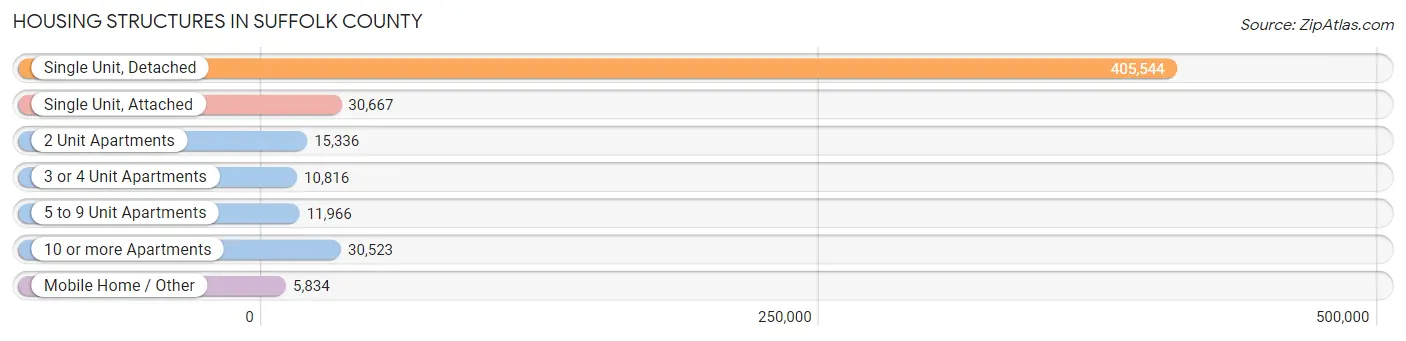
| Structure Type | # Housing Units | % Housing Units |
| Single Unit, Detached | 405,544 | 79.4% |
| Single Unit, Attached | 30,667 | 6.0% |
| 2 Unit Apartments | 15,336 | 3.0% |
| 3 or 4 Unit Apartments | 10,816 | 2.1% |
| 5 to 9 Unit Apartments | 11,966 | 2.3% |
| 10 or more Apartments | 30,523 | 6.0% |
| Mobile Home / Other | 5,834 | 1.1% |
| Total | 510,686 | 100.0% |
Housing Structures by Occupancy in Suffolk County
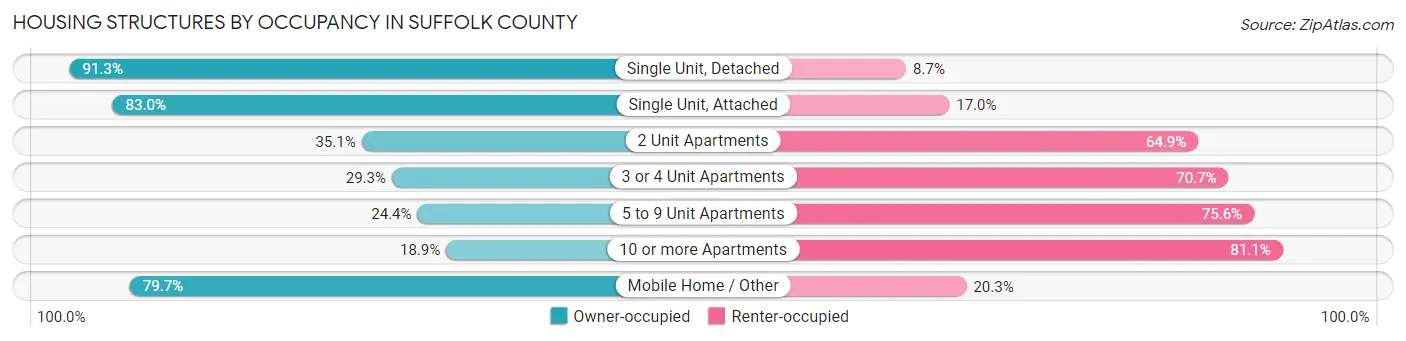
| Structure Type | Owner-occupied | Renter-occupied |
| Single Unit, Detached | 370,419 (91.3%) | 35,125 (8.7%) |
| Single Unit, Attached | 25,466 (83.0%) | 5,201 (17.0%) |
| 2 Unit Apartments | 5,389 (35.1%) | 9,947 (64.9%) |
| 3 or 4 Unit Apartments | 3,169 (29.3%) | 7,647 (70.7%) |
| 5 to 9 Unit Apartments | 2,917 (24.4%) | 9,049 (75.6%) |
| 10 or more Apartments | 5,758 (18.9%) | 24,765 (81.1%) |
| Mobile Home / Other | 4,651 (79.7%) | 1,183 (20.3%) |
| Total | 417,769 (81.8%) | 92,917 (18.2%) |
Housing Structures by Number of Rooms in Suffolk County
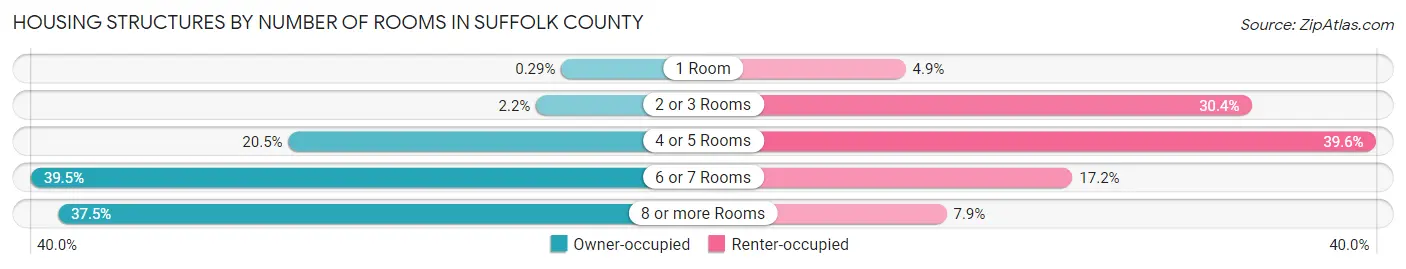
| Number of Rooms | Owner-occupied | Renter-occupied |
| 1 Room | 1,219 (0.3%) | 4,514 (4.9%) |
| 2 or 3 Rooms | 8,983 (2.1%) | 28,277 (30.4%) |
| 4 or 5 Rooms | 85,576 (20.5%) | 36,813 (39.6%) |
| 6 or 7 Rooms | 165,192 (39.5%) | 15,980 (17.2%) |
| 8 or more Rooms | 156,799 (37.5%) | 7,333 (7.9%) |
| Total | 417,769 (100.0%) | 92,917 (100.0%) |
Housing Structure by Heating Type in Suffolk County
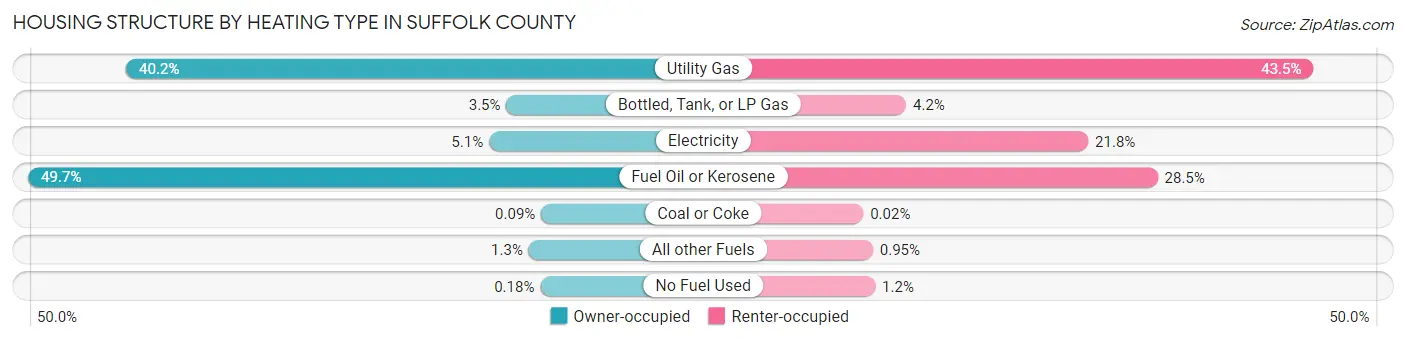
| Heating Type | Owner-occupied | Renter-occupied |
| Utility Gas | 167,904 (40.2%) | 40,415 (43.5%) |
| Bottled, Tank, or LP Gas | 14,431 (3.5%) | 3,862 (4.2%) |
| Electricity | 21,432 (5.1%) | 20,211 (21.7%) |
| Fuel Oil or Kerosene | 207,485 (49.7%) | 26,443 (28.5%) |
| Coal or Coke | 384 (0.1%) | 20 (0.0%) |
| All other Fuels | 5,369 (1.3%) | 879 (0.9%) |
| No Fuel Used | 764 (0.2%) | 1,087 (1.2%) |
| Total | 417,769 (100.0%) | 92,917 (100.0%) |
Household Vehicle Usage in Suffolk County
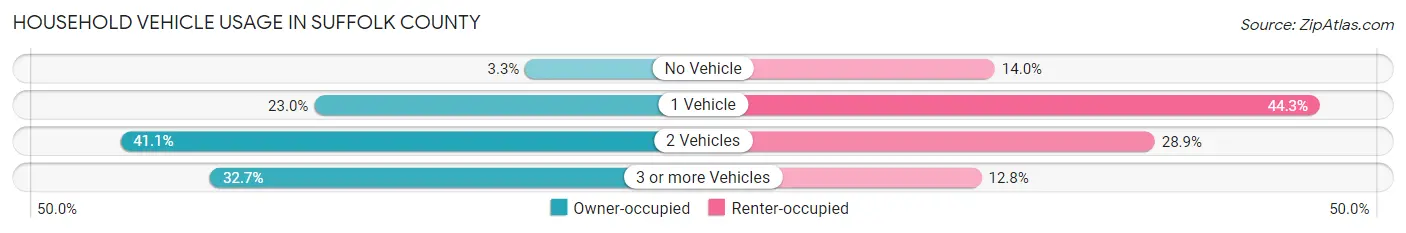
| Vehicles per Household | Owner-occupied | Renter-occupied |
| No Vehicle | 13,669 (3.3%) | 13,005 (14.0%) |
| 1 Vehicle | 95,962 (23.0%) | 41,187 (44.3%) |
| 2 Vehicles | 171,557 (41.1%) | 26,879 (28.9%) |
| 3 or more Vehicles | 136,581 (32.7%) | 11,846 (12.8%) |
| Total | 417,769 (100.0%) | 92,917 (100.0%) |
Real Estate & Mortgages in Suffolk County
Real Estate and Mortgage Overview in Suffolk County
| Characteristic | Without Mortgage | With Mortgage |
| Housing Units | 153,873 | 263,896 |
| Median Property Value | $488,900 | $491,800 |
| Median Household Income | $101,966 | $135,398 |
| Monthly Housing Costs | $1,397 | $146,919 |
| Real Estate Taxes | $10,001 | $3,707 |
Property Value by Mortgage Status in Suffolk County
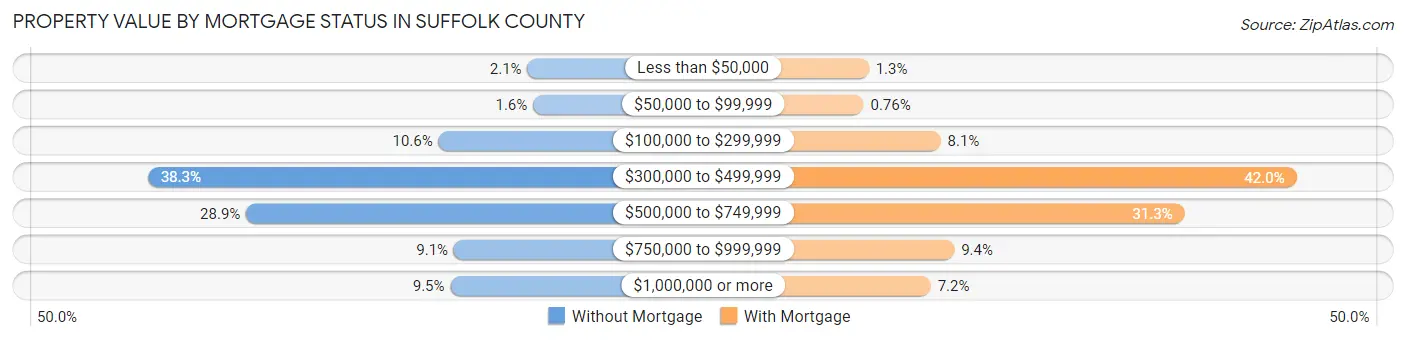
| Property Value | Without Mortgage | With Mortgage |
| Less than $50,000 | 3,247 (2.1%) | 3,295 (1.3%) |
| $50,000 to $99,999 | 2,422 (1.6%) | 2,007 (0.8%) |
| $100,000 to $299,999 | 16,283 (10.6%) | 21,370 (8.1%) |
| $300,000 to $499,999 | 58,885 (38.3%) | 110,821 (42.0%) |
| $500,000 to $749,999 | 44,475 (28.9%) | 82,709 (31.3%) |
| $750,000 to $999,999 | 14,021 (9.1%) | 24,804 (9.4%) |
| $1,000,000 or more | 14,540 (9.5%) | 18,890 (7.2%) |
| Total | 153,873 (100.0%) | 263,896 (100.0%) |
Household Income by Mortgage Status in Suffolk County
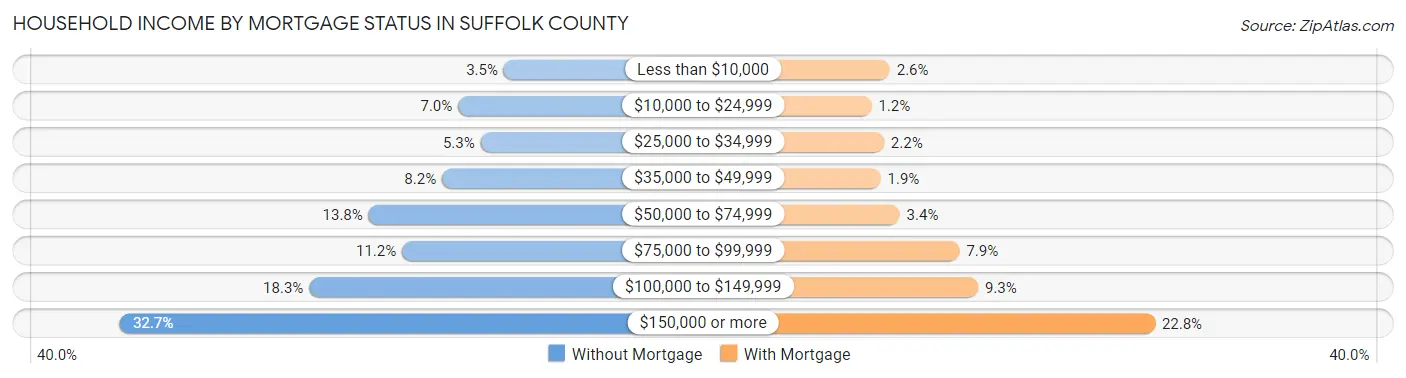
| Household Income | Without Mortgage | With Mortgage |
| Less than $10,000 | 5,368 (3.5%) | 6,887 (2.6%) |
| $10,000 to $24,999 | 10,725 (7.0%) | 3,194 (1.2%) |
| $25,000 to $34,999 | 8,100 (5.3%) | 5,691 (2.2%) |
| $35,000 to $49,999 | 12,611 (8.2%) | 5,034 (1.9%) |
| $50,000 to $74,999 | 21,212 (13.8%) | 8,867 (3.4%) |
| $75,000 to $99,999 | 17,302 (11.2%) | 20,905 (7.9%) |
| $100,000 to $149,999 | 28,197 (18.3%) | 24,620 (9.3%) |
| $150,000 or more | 50,358 (32.7%) | 60,187 (22.8%) |
| Total | 153,873 (100.0%) | 263,896 (100.0%) |
Property Value to Household Income Ratio in Suffolk County
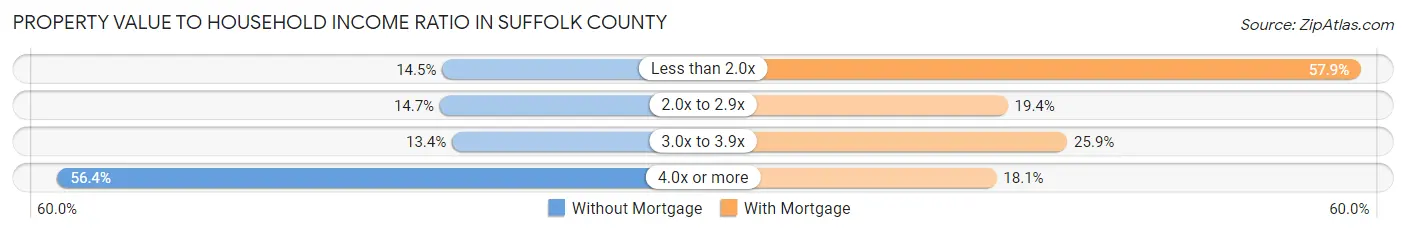
| Value-to-Income Ratio | Without Mortgage | With Mortgage |
| Less than 2.0x | 22,301 (14.5%) | 152,714 (57.9%) |
| 2.0x to 2.9x | 22,675 (14.7%) | 51,098 (19.4%) |
| 3.0x to 3.9x | 20,646 (13.4%) | 68,206 (25.9%) |
| 4.0x or more | 86,780 (56.4%) | 47,871 (18.1%) |
| Total | 153,873 (100.0%) | 263,896 (100.0%) |
Real Estate Taxes by Mortgage Status in Suffolk County
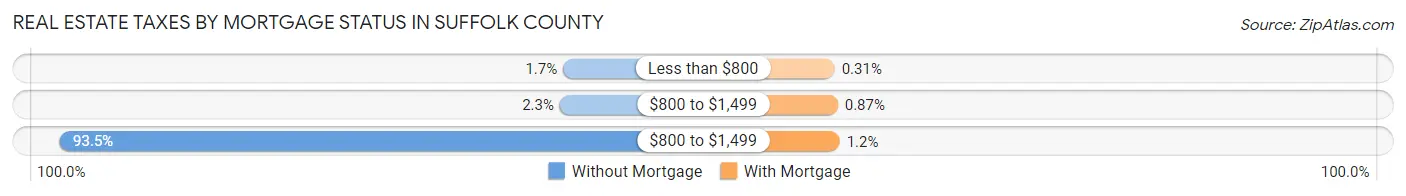
| Property Taxes | Without Mortgage | With Mortgage |
| Less than $800 | 2,544 (1.7%) | 831 (0.3%) |
| $800 to $1,499 | 3,455 (2.2%) | 2,289 (0.9%) |
| $800 to $1,499 | 143,926 (93.5%) | 3,208 (1.2%) |
| Total | 153,873 (100.0%) | 263,896 (100.0%) |
Health & Disability in Suffolk County
Health Insurance Coverage by Age in Suffolk County
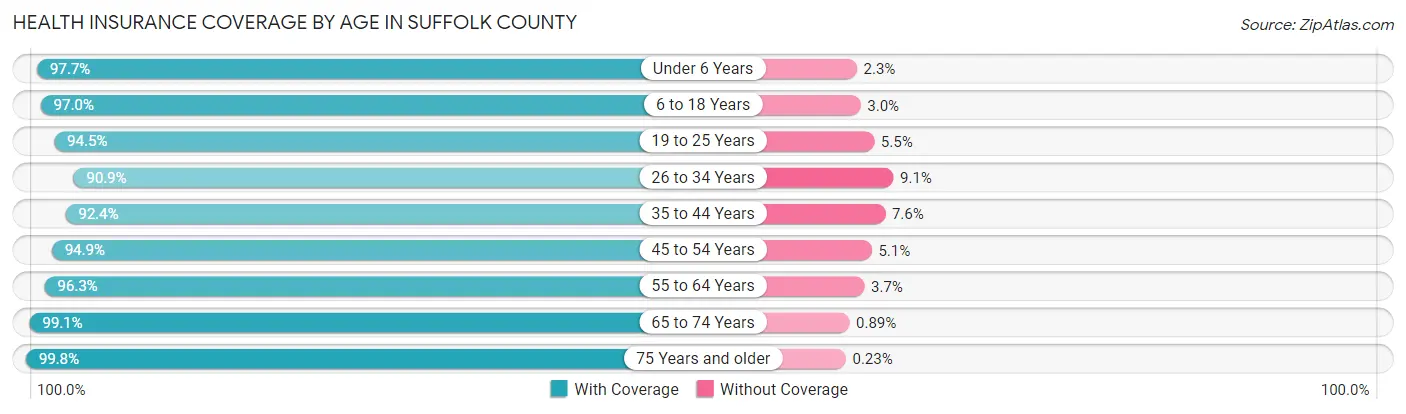
| Age Bracket | With Coverage | Without Coverage |
| Under 6 Years | 92,281 (97.7%) | 2,171 (2.3%) |
| 6 to 18 Years | 235,753 (97.0%) | 7,258 (3.0%) |
| 19 to 25 Years | 131,081 (94.5%) | 7,655 (5.5%) |
| 26 to 34 Years | 147,347 (90.9%) | 14,748 (9.1%) |
| 35 to 44 Years | 166,164 (92.4%) | 13,648 (7.6%) |
| 45 to 54 Years | 202,020 (94.9%) | 10,763 (5.1%) |
| 55 to 64 Years | 217,860 (96.3%) | 8,365 (3.7%) |
| 65 to 74 Years | 147,516 (99.1%) | 1,321 (0.9%) |
| 75 Years and older | 108,636 (99.8%) | 252 (0.2%) |
| Total | 1,448,658 (95.6%) | 66,181 (4.4%) |
Health Insurance Coverage by Citizenship Status in Suffolk County
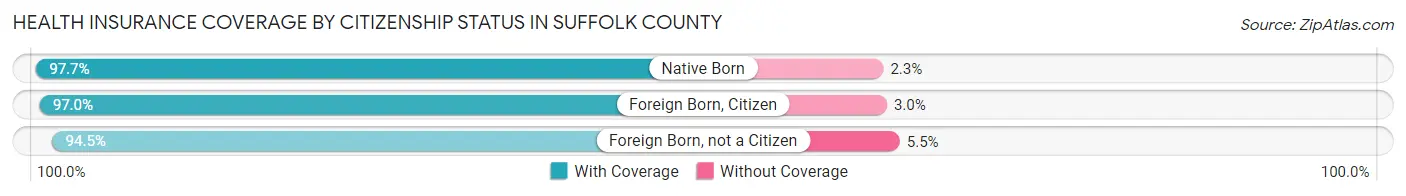
| Citizenship Status | With Coverage | Without Coverage |
| Native Born | 92,281 (97.7%) | 2,171 (2.3%) |
| Foreign Born, Citizen | 235,753 (97.0%) | 7,258 (3.0%) |
| Foreign Born, not a Citizen | 131,081 (94.5%) | 7,655 (5.5%) |
Health Insurance Coverage by Household Income in Suffolk County
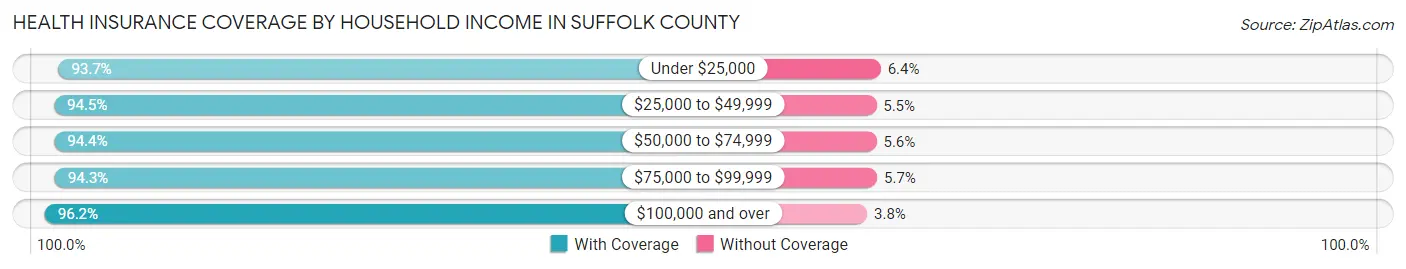
| Household Income | With Coverage | Without Coverage |
| Under $25,000 | 70,888 (93.6%) | 4,805 (6.4%) |
| $25,000 to $49,999 | 97,551 (94.5%) | 5,701 (5.5%) |
| $50,000 to $74,999 | 123,736 (94.4%) | 7,296 (5.6%) |
| $75,000 to $99,999 | 133,196 (94.3%) | 8,024 (5.7%) |
| $100,000 and over | 1,004,802 (96.2%) | 39,697 (3.8%) |
Public vs Private Health Insurance Coverage by Age in Suffolk County
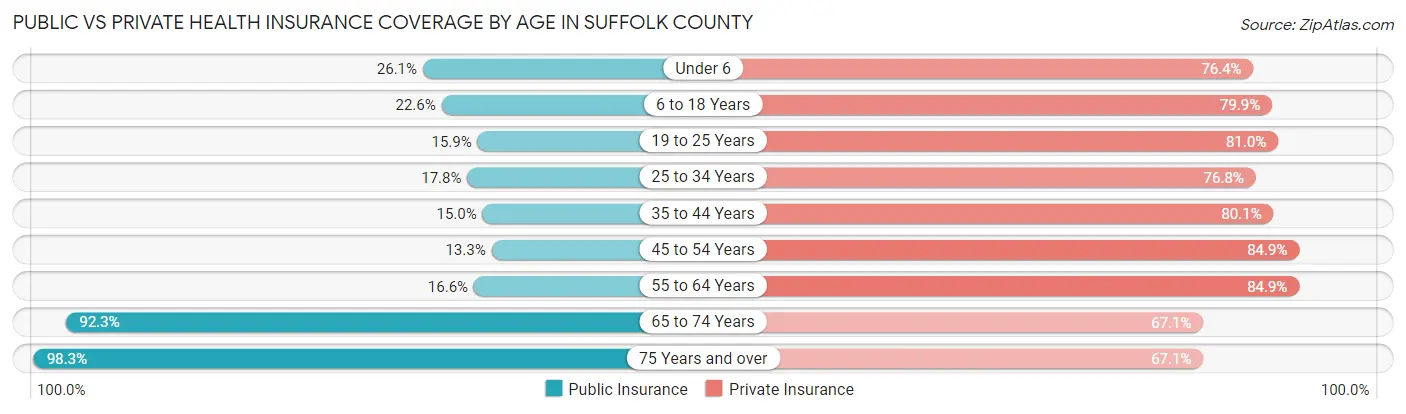
| Age Bracket | Public Insurance | Private Insurance |
| Under 6 | 24,629 (26.1%) | 72,165 (76.4%) |
| 6 to 18 Years | 54,952 (22.6%) | 194,046 (79.8%) |
| 19 to 25 Years | 22,087 (15.9%) | 112,366 (81.0%) |
| 25 to 34 Years | 28,907 (17.8%) | 124,513 (76.8%) |
| 35 to 44 Years | 26,967 (15.0%) | 144,061 (80.1%) |
| 45 to 54 Years | 28,391 (13.3%) | 180,655 (84.9%) |
| 55 to 64 Years | 37,553 (16.6%) | 192,035 (84.9%) |
| 65 to 74 Years | 137,303 (92.2%) | 99,873 (67.1%) |
| 75 Years and over | 107,041 (98.3%) | 73,037 (67.1%) |
| Total | 467,830 (30.9%) | 1,192,751 (78.7%) |
Disability Status by Sex by Age in Suffolk County
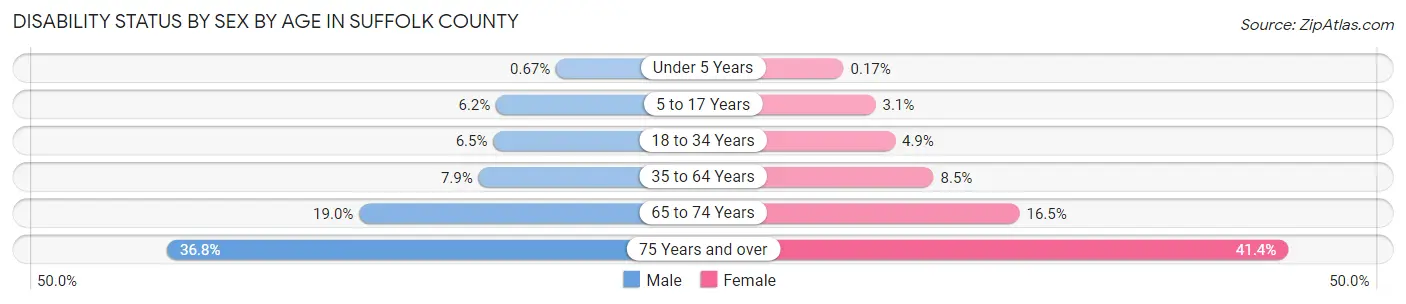
| Age Bracket | Male | Female |
| Under 5 Years | 272 (0.7%) | 68 (0.2%) |
| 5 to 17 Years | 7,575 (6.2%) | 3,611 (3.1%) |
| 18 to 34 Years | 10,741 (6.5%) | 7,741 (4.9%) |
| 35 to 64 Years | 24,439 (7.9%) | 26,293 (8.5%) |
| 65 to 74 Years | 13,352 (19.0%) | 12,928 (16.5%) |
| 75 Years and over | 16,243 (36.8%) | 26,808 (41.4%) |
Disability Class by Sex by Age in Suffolk County
Disability Class: Hearing Difficulty
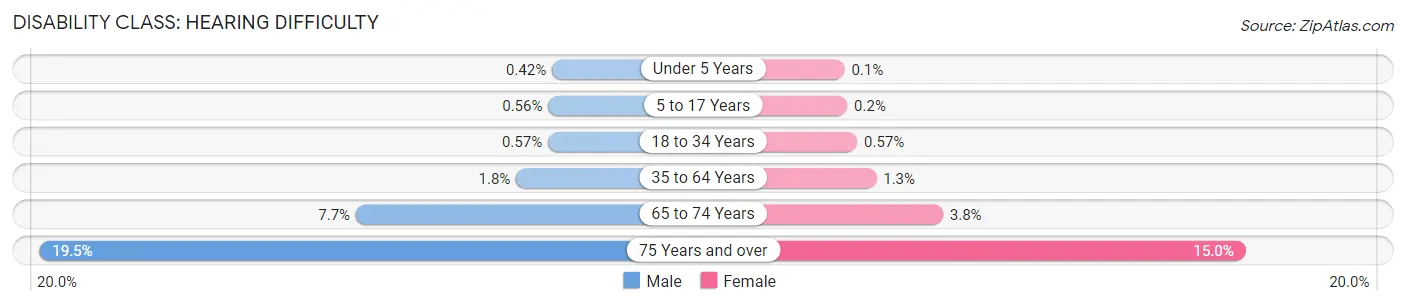
| Age Bracket | Male | Female |
| Under 5 Years | 169 (0.4%) | 38 (0.1%) |
| 5 to 17 Years | 676 (0.6%) | 236 (0.2%) |
| 18 to 34 Years | 934 (0.6%) | 887 (0.6%) |
| 35 to 64 Years | 5,426 (1.8%) | 3,939 (1.3%) |
| 65 to 74 Years | 5,427 (7.7%) | 2,938 (3.7%) |
| 75 Years and over | 8,589 (19.5%) | 9,705 (15.0%) |
Disability Class: Vision Difficulty
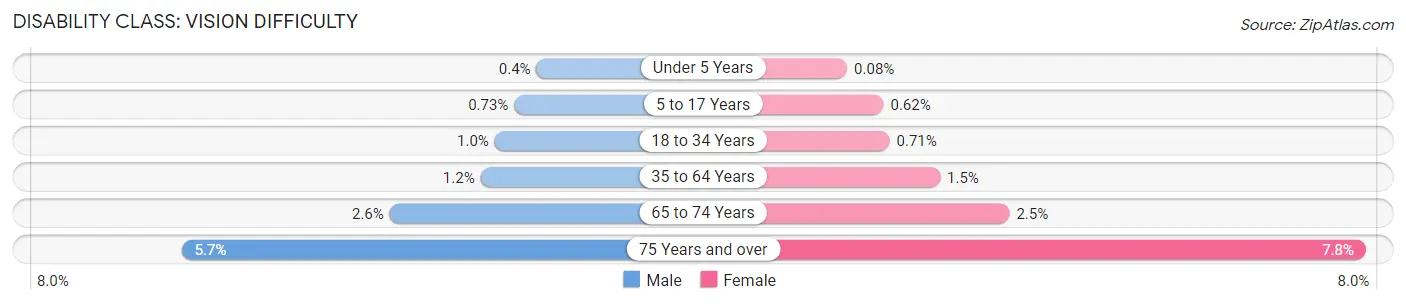
| Age Bracket | Male | Female |
| Under 5 Years | 160 (0.4%) | 30 (0.1%) |
| 5 to 17 Years | 882 (0.7%) | 712 (0.6%) |
| 18 to 34 Years | 1,684 (1.0%) | 1,109 (0.7%) |
| 35 to 64 Years | 3,821 (1.2%) | 4,509 (1.5%) |
| 65 to 74 Years | 1,817 (2.6%) | 1,955 (2.5%) |
| 75 Years and over | 2,502 (5.7%) | 5,036 (7.8%) |
Disability Class: Cognitive Difficulty
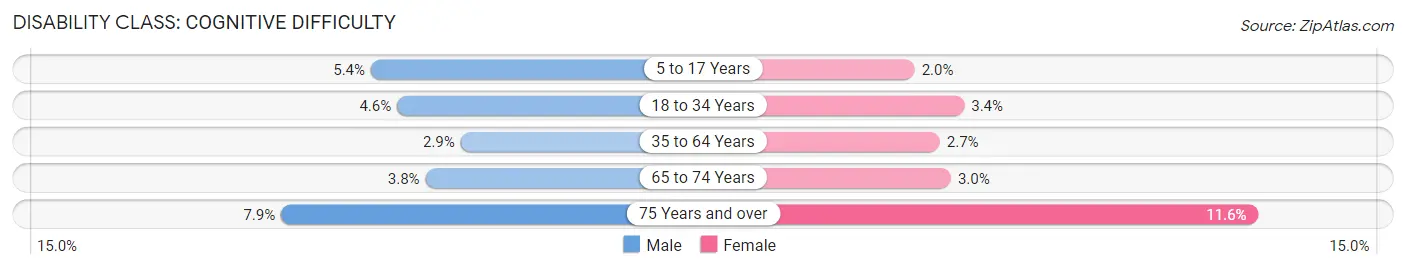
| Age Bracket | Male | Female |
| 5 to 17 Years | 6,504 (5.4%) | 2,341 (2.0%) |
| 18 to 34 Years | 7,651 (4.6%) | 5,335 (3.4%) |
| 35 to 64 Years | 8,871 (2.9%) | 8,411 (2.7%) |
| 65 to 74 Years | 2,709 (3.8%) | 2,379 (3.0%) |
| 75 Years and over | 3,472 (7.9%) | 7,508 (11.6%) |
Disability Class: Ambulatory Difficulty
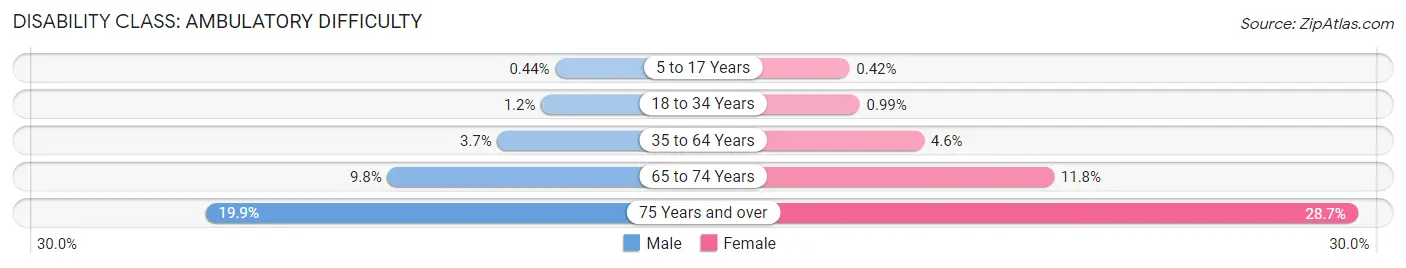
| Age Bracket | Male | Female |
| 5 to 17 Years | 536 (0.4%) | 481 (0.4%) |
| 18 to 34 Years | 2,037 (1.2%) | 1,557 (1.0%) |
| 35 to 64 Years | 11,367 (3.7%) | 14,112 (4.6%) |
| 65 to 74 Years | 6,896 (9.8%) | 9,258 (11.8%) |
| 75 Years and over | 8,797 (19.9%) | 18,586 (28.7%) |
Disability Class: Self-Care Difficulty
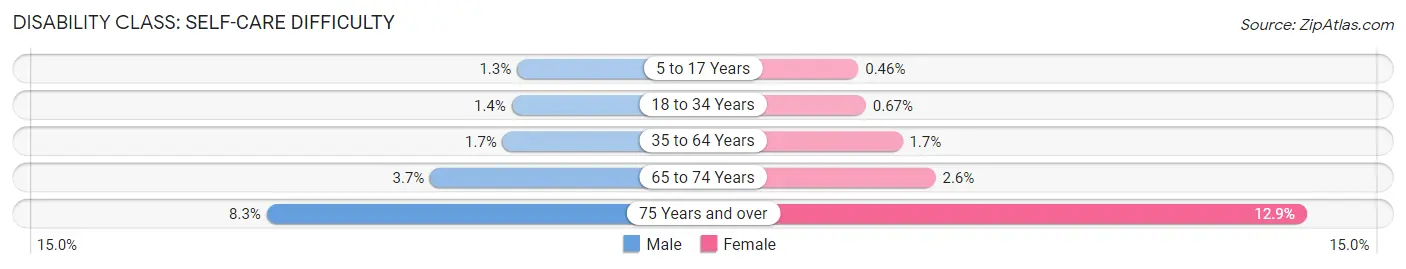
| Age Bracket | Male | Female |
| 5 to 17 Years | 1,567 (1.3%) | 530 (0.5%) |
| 18 to 34 Years | 2,373 (1.4%) | 1,049 (0.7%) |
| 35 to 64 Years | 5,252 (1.7%) | 5,210 (1.7%) |
| 65 to 74 Years | 2,617 (3.7%) | 2,043 (2.6%) |
| 75 Years and over | 3,648 (8.3%) | 8,377 (12.9%) |
Technology Access in Suffolk County
Computing Device Access in Suffolk County
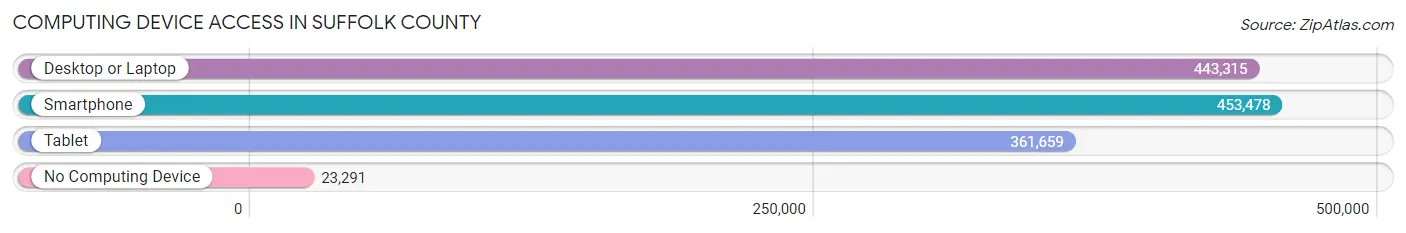
| Device Type | # Households | % Households |
| Desktop or Laptop | 443,315 | 86.8% |
| Smartphone | 453,478 | 88.8% |
| Tablet | 361,659 | 70.8% |
| No Computing Device | 23,291 | 4.6% |
| Total | 510,686 | 100.0% |
Internet Access in Suffolk County
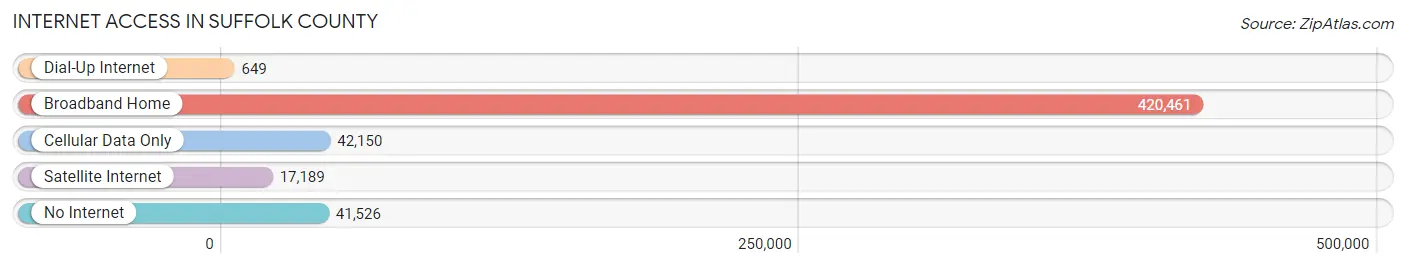
| Internet Type | # Households | % Households |
| Dial-Up Internet | 649 | 0.1% |
| Broadband Home | 420,461 | 82.3% |
| Cellular Data Only | 42,150 | 8.3% |
| Satellite Internet | 17,189 | 3.4% |
| No Internet | 41,526 | 8.1% |
| Total | 510,686 | 100.0% |
Suffolk County Summary
Suffolk County is located in the southeastern part of New York State, on the eastern end of Long Island. It is the easternmost county in the state and is bordered by Nassau County to the west, the Atlantic Ocean to the south, and the Long Island Sound to the north. Suffolk County is the fourth most populous county in New York State, with an estimated population of 1,493,350 in 2019.
Geography
Suffolk County covers an area of 912 square miles, making it the largest county in New York State. It is divided into ten towns, each of which is further divided into villages and hamlets. The towns are Babylon, Brookhaven, East Hampton, Huntington, Islip, Riverhead, Shelter Island, Smithtown, Southampton, and Southold. The county is home to several large bodies of water, including the Great South Bay, the Peconic Bay, and the Shinnecock Bay. The county also contains several barrier islands, including Fire Island and Gardiners Island.
The terrain of Suffolk County is mostly flat, with some rolling hills in the northern part of the county. The highest point in the county is Jayne's Hill, located in the town of Southold, which has an elevation of 400 feet. The county is home to several state parks, including Montauk Point State Park, Sunken Meadow State Park, and Wildwood State Park.
Economy
Suffolk County has a diverse economy, with a mix of industries including agriculture, manufacturing, tourism, and technology. Agriculture is a major industry in the county, with crops such as potatoes, onions, and corn being grown in the area. The county is also home to several wineries, which produce wines from local grapes.
Manufacturing is another major industry in the county, with products such as electronics, medical equipment, and aircraft components being produced in the area. The county is also home to several technology companies, including CA Technologies, Canon USA, and Northrop Grumman.
Tourism is a major industry in Suffolk County, with the county being home to several popular beaches, including Jones Beach State Park and Robert Moses State Park. The county is also home to several popular attractions, including the Long Island Aquarium and the Montauk Point Lighthouse.
Demographics
As of 2019, Suffolk County had an estimated population of 1,493,350, making it the fourth most populous county in New York State. The population is composed of a mix of races and ethnicities, with the largest group being non-Hispanic whites, who make up 63.3% of the population. Other major racial and ethnic groups include Hispanics (17.2%), African Americans (9.2%), and Asians (7.2%).
The median household income in Suffolk County is $93,845, which is higher than the national median of $61,937. The county also has a higher than average poverty rate, with 11.2% of the population living below the poverty line.
Conclusion
Suffolk County is located in the southeastern part of New York State, on the eastern end of Long Island. It is the fourth most populous county in the state, with an estimated population of 1,493,350 in 2019. The county has a diverse economy, with a mix of industries including agriculture, manufacturing, tourism, and technology. The population is composed of a mix of races and ethnicities, with the largest group being non-Hispanic whites. The median household income in Suffolk County is $93,845, which is higher than the national median.
Common Questions
What is Per Capita Income in Suffolk County?
Per Capita income in Suffolk County is $54,127.
What is the Median Family Income in Suffolk County?
Median Family Income in Suffolk County is $141,671.
What is the Median Household income in Suffolk County?
Median Household Income in Suffolk County is $122,498.
What is Income or Wage Gap in Suffolk County?
Income or Wage Gap in Suffolk County is 28.9%.
Women in Suffolk County earn 71.1 cents for every dollar earned by a man.
What is Family Income Deficit in Suffolk County?
Family Income Deficit in Suffolk County is $11,166.
Families that are below poverty line in Suffolk County earn $11,166 less on average than the poverty threshold level.
What is Inequality or Gini Index in Suffolk County?
Inequality or Gini Index in Suffolk County is 0.44.
What is the Total Population of Suffolk County?
Total Population of Suffolk County is 1,524,486.
What is the Total Male Population of Suffolk County?
Total Male Population of Suffolk County is 756,707.
What is the Total Female Population of Suffolk County?
Total Female Population of Suffolk County is 767,779.
What is the Ratio of Males per 100 Females in Suffolk County?
There are 98.56 Males per 100 Females in Suffolk County.
What is the Ratio of Females per 100 Males in Suffolk County?
There are 101.46 Females per 100 Males in Suffolk County.
What is the Median Population Age in Suffolk County?
Median Population Age in Suffolk County is 41.7 Years.
What is the Average Family Size in Suffolk County
Average Family Size in Suffolk County is 3.4 People.
What is the Average Household Size in Suffolk County
Average Household Size in Suffolk County is 2.9 People.
How Large is the Labor Force in Suffolk County?
There are 821,962 People in the Labor Forcein in Suffolk County.
What is the Percentage of People in the Labor Force in Suffolk County?
65.8% of People are in the Labor Force in Suffolk County.
What is the Unemployment Rate in Suffolk County?
Unemployment Rate in Suffolk County is 4.8%.