St. Lawrence County, NY Map & Demographics
St. Lawrence County Map
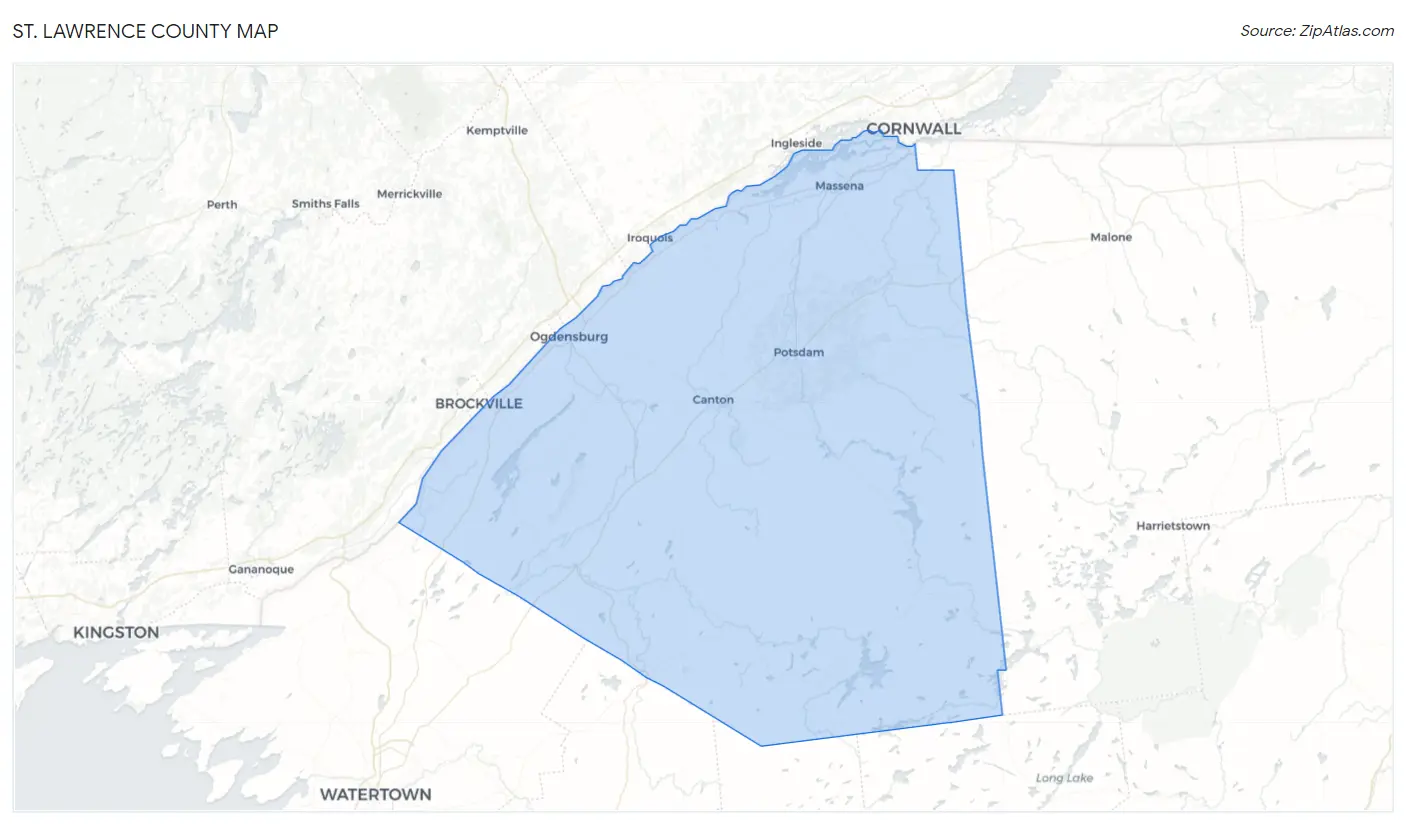
St. Lawrence County Overview
$29,827
PER CAPITA INCOME
$75,033
AVG FAMILY INCOME
$58,339
AVG HOUSEHOLD INCOME
24.9%
WAGE / INCOME GAP [ % ]
75.1¢/ $1
WAGE / INCOME GAP [ $ ]
$11,457
FAMILY INCOME DEFICIT
0.45
INEQUALITY / GINI INDEX
108,670
TOTAL POPULATION
55,702
MALE POPULATION
52,968
FEMALE POPULATION
105.16
MALES / 100 FEMALES
95.09
FEMALES / 100 MALES
38.8
MEDIAN AGE
3.0
AVG FAMILY SIZE
2.4
AVG HOUSEHOLD SIZE
47,751
LABOR FORCE [ PEOPLE ]
53.2%
PERCENT IN LABOR FORCE
6.3%
UNEMPLOYMENT RATE
Income in St. Lawrence County
Income Overview in St. Lawrence County
Per Capita Income in St. Lawrence County is $29,827, while median incomes of families and households are $75,033 and $58,339 respectively.
| Characteristic | Number | Measure |
| Per Capita Income | 108,670 | $29,827 |
| Median Family Income | 25,084 | $75,033 |
| Mean Family Income | 25,084 | $92,067 |
| Median Household Income | 41,399 | $58,339 |
| Mean Household Income | 41,399 | $75,136 |
| Income Deficit | 25,084 | $11,457 |
| Wage / Income Gap (%) | 108,670 | 24.86% |
| Wage / Income Gap ($) | 108,670 | 75.14¢ per $1 |
| Gini / Inequality Index | 108,670 | 0.45 |
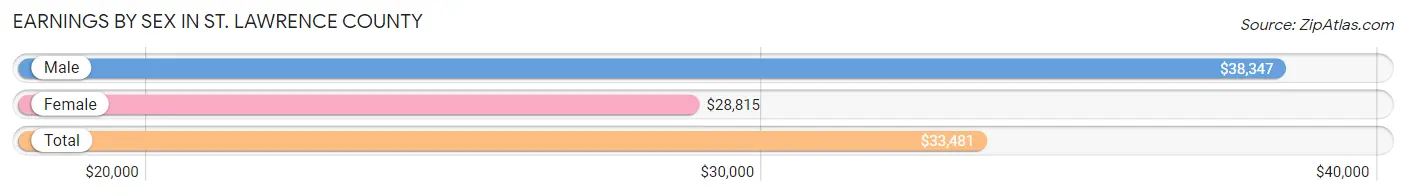
Earnings by Sex in St. Lawrence County
Average Earnings in St. Lawrence County are $33,481, $38,347 for men and $28,815 for women, a difference of 24.9%.
| Sex | Number | Average Earnings |
| Male | 28,388 (53.3%) | $38,347 |
| Female | 24,849 (46.7%) | $28,815 |
| Total | 53,237 (100.0%) | $33,481 |
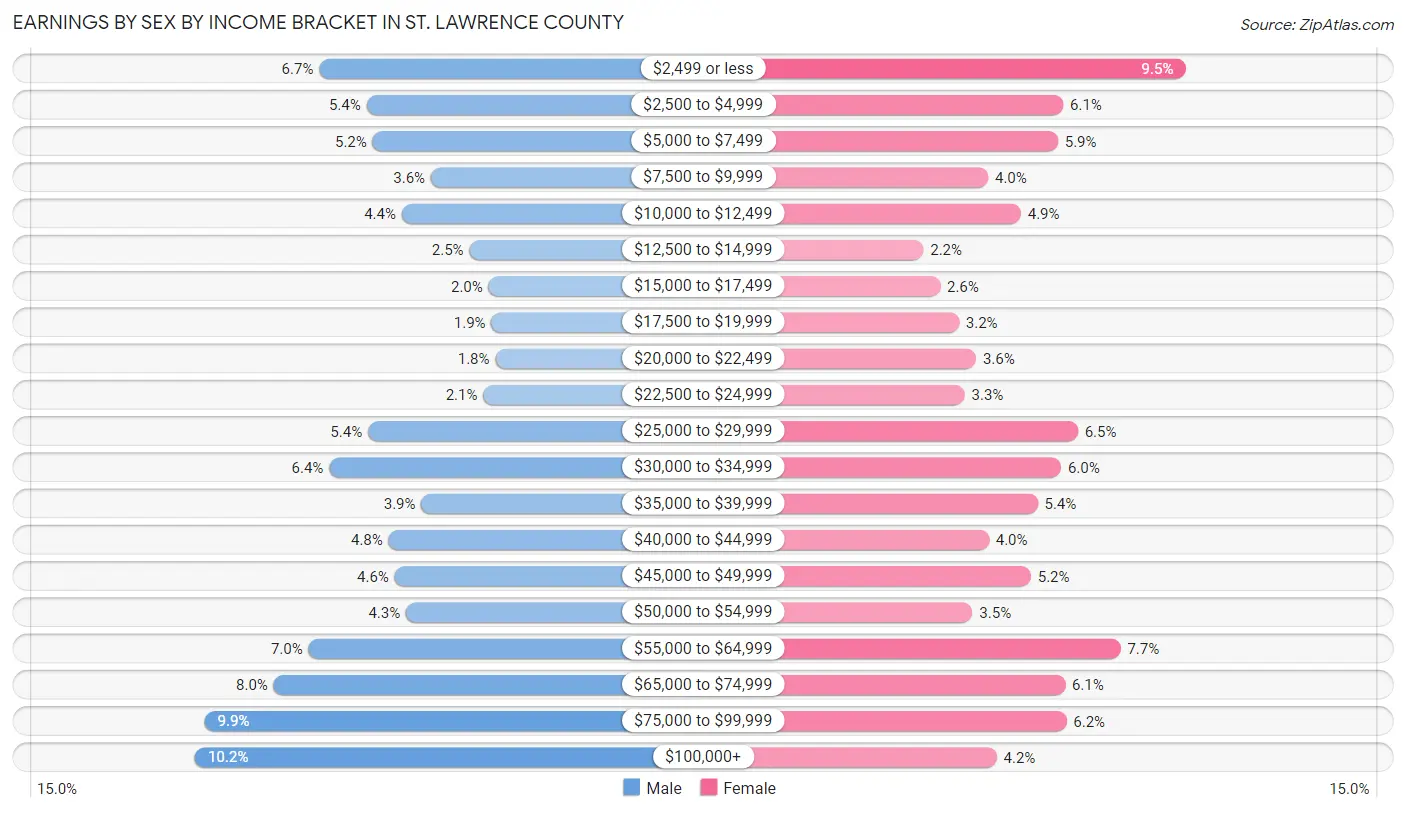
Earnings by Sex by Income Bracket in St. Lawrence County
The most common earnings brackets in St. Lawrence County are $100,000+ for men (2,897 | 10.2%) and $2,499 or less for women (2,362 | 9.5%).
| Income | Male | Female |
| $2,499 or less | 1,908 (6.7%) | 2,362 (9.5%) |
| $2,500 to $4,999 | 1,529 (5.4%) | 1,510 (6.1%) |
| $5,000 to $7,499 | 1,481 (5.2%) | 1,474 (5.9%) |
| $7,500 to $9,999 | 1,017 (3.6%) | 987 (4.0%) |
| $10,000 to $12,499 | 1,249 (4.4%) | 1,214 (4.9%) |
| $12,500 to $14,999 | 711 (2.5%) | 535 (2.1%) |
| $15,000 to $17,499 | 556 (2.0%) | 652 (2.6%) |
| $17,500 to $19,999 | 534 (1.9%) | 783 (3.2%) |
| $20,000 to $22,499 | 503 (1.8%) | 902 (3.6%) |
| $22,500 to $24,999 | 599 (2.1%) | 822 (3.3%) |
| $25,000 to $29,999 | 1,519 (5.3%) | 1,613 (6.5%) |
| $30,000 to $34,999 | 1,829 (6.4%) | 1,497 (6.0%) |
| $35,000 to $39,999 | 1,093 (3.8%) | 1,332 (5.4%) |
| $40,000 to $44,999 | 1,353 (4.8%) | 991 (4.0%) |
| $45,000 to $49,999 | 1,306 (4.6%) | 1,284 (5.2%) |
| $50,000 to $54,999 | 1,216 (4.3%) | 876 (3.5%) |
| $55,000 to $64,999 | 1,994 (7.0%) | 1,910 (7.7%) |
| $65,000 to $74,999 | 2,272 (8.0%) | 1,524 (6.1%) |
| $75,000 to $99,999 | 2,822 (9.9%) | 1,534 (6.2%) |
| $100,000+ | 2,897 (10.2%) | 1,047 (4.2%) |
| Total | 28,388 (100.0%) | 24,849 (100.0%) |
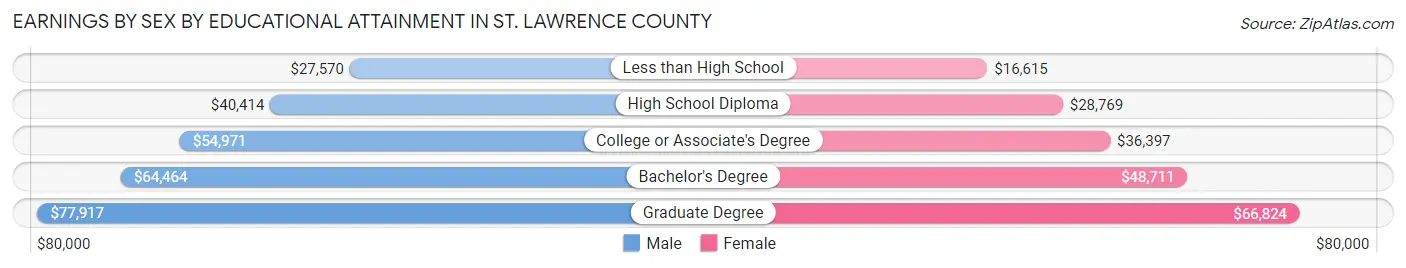
Earnings by Sex by Educational Attainment in St. Lawrence County
Average earnings in St. Lawrence County are $50,272 for men and $37,959 for women, a difference of 24.5%. Men with an educational attainment of graduate degree enjoy the highest average annual earnings of $77,917, while those with less than high school education earn the least with $27,570. Women with an educational attainment of graduate degree earn the most with the average annual earnings of $66,824, while those with less than high school education have the smallest earnings of $16,615.
| Educational Attainment | Male Income | Female Income |
| Less than High School | $27,570 | $16,615 |
| High School Diploma | $40,414 | $28,769 |
| College or Associate's Degree | $54,971 | $36,397 |
| Bachelor's Degree | $64,464 | $48,711 |
| Graduate Degree | $77,917 | $66,824 |
| Total | $50,272 | $37,959 |
Family Income in St. Lawrence County
Family Income Brackets in St. Lawrence County
According to the St. Lawrence County family income data, there are 5,418 families falling into the $100,000 to $149,999 income range, which is the most common income bracket and makes up 21.6% of all families. Conversely, the $10,000 to $14,999 income bracket is the least frequent group with only 727 families (2.9%) belonging to this category.
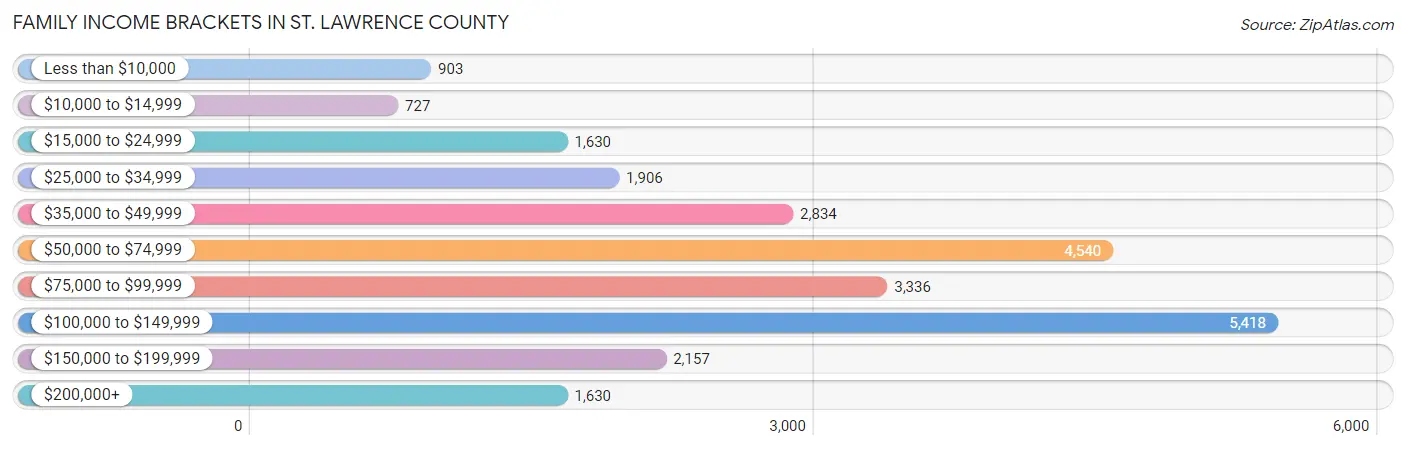
| Income Bracket | # Families | % Families |
| Less than $10,000 | 903 | 3.6% |
| $10,000 to $14,999 | 727 | 2.9% |
| $15,000 to $24,999 | 1,630 | 6.5% |
| $25,000 to $34,999 | 1,906 | 7.6% |
| $35,000 to $49,999 | 2,834 | 11.3% |
| $50,000 to $74,999 | 4,540 | 18.1% |
| $75,000 to $99,999 | 3,336 | 13.3% |
| $100,000 to $149,999 | 5,418 | 21.6% |
| $150,000 to $199,999 | 2,157 | 8.6% |
| $200,000+ | 1,630 | 6.5% |
Family Income by Famaliy Size in St. Lawrence County
7+ person families (640 | 2.5%) account for the highest median family income in St. Lawrence County with $110,500 per family, while 2-person families (13,304 | 53.0%) have the highest median income of $33,368 per family member.
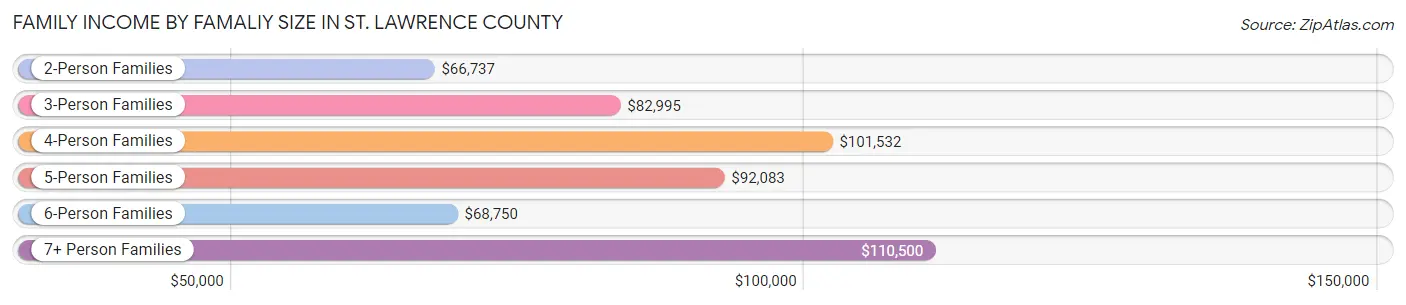
| Income Bracket | # Families | Median Income |
| 2-Person Families | 13,304 (53.0%) | $66,737 |
| 3-Person Families | 4,969 (19.8%) | $82,995 |
| 4-Person Families | 3,595 (14.3%) | $101,532 |
| 5-Person Families | 1,851 (7.4%) | $92,083 |
| 6-Person Families | 725 (2.9%) | $68,750 |
| 7+ Person Families | 640 (2.5%) | $110,500 |
| Total | 25,084 (100.0%) | $75,033 |
Family Income by Number of Earners in St. Lawrence County
The median family income in St. Lawrence County is $75,033, with families comprising 3+ earners (2,103) having the highest median family income of $142,264, while families with no earners (5,400) have the lowest median family income of $47,337, accounting for 8.4% and 21.5% of families, respectively.
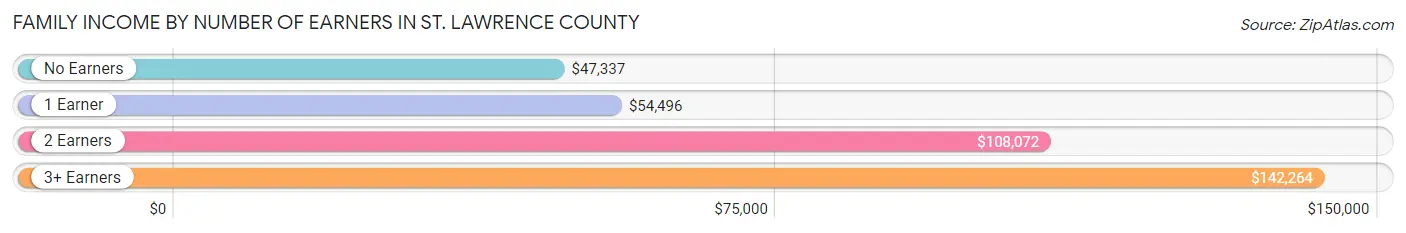
| Number of Earners | # Families | Median Income |
| No Earners | 5,400 (21.5%) | $47,337 |
| 1 Earner | 8,478 (33.8%) | $54,496 |
| 2 Earners | 9,103 (36.3%) | $108,072 |
| 3+ Earners | 2,103 (8.4%) | $142,264 |
| Total | 25,084 (100.0%) | $75,033 |
Household Income in St. Lawrence County
Household Income Brackets in St. Lawrence County
With 7,286 households falling in the category, the $50,000 to $74,999 income range is the most frequent in St. Lawrence County, accounting for 17.6% of all households. In contrast, only 1,863 households (4.5%) fall into the $200,000+ income bracket, making it the least populous group.
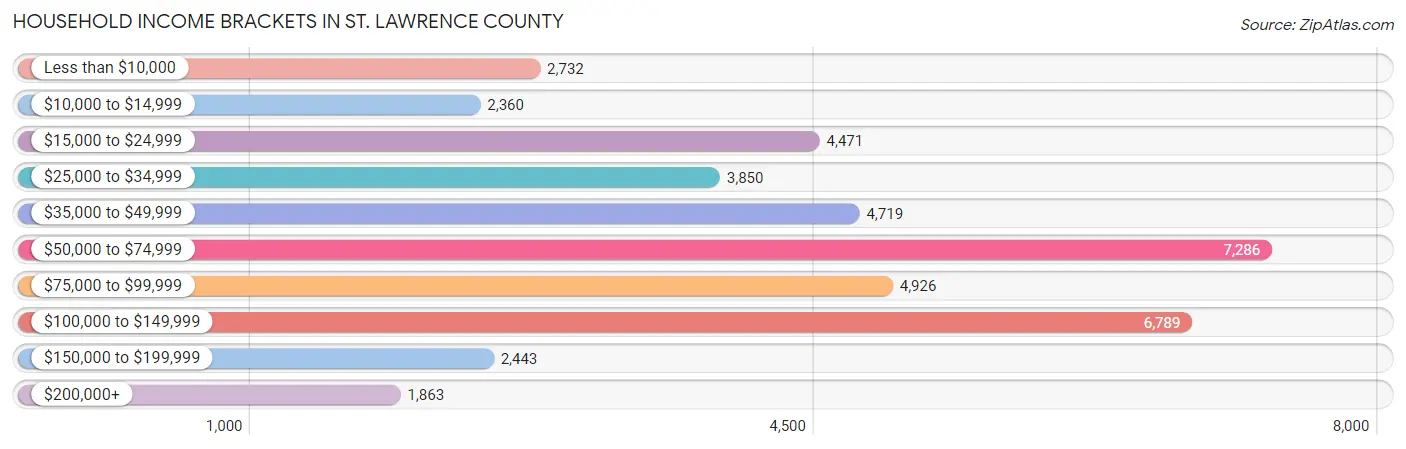
| Income Bracket | # Households | % Households |
| Less than $10,000 | 2,732 | 6.6% |
| $10,000 to $14,999 | 2,360 | 5.7% |
| $15,000 to $24,999 | 4,471 | 10.8% |
| $25,000 to $34,999 | 3,850 | 9.3% |
| $35,000 to $49,999 | 4,719 | 11.4% |
| $50,000 to $74,999 | 7,286 | 17.6% |
| $75,000 to $99,999 | 4,926 | 11.9% |
| $100,000 to $149,999 | 6,789 | 16.4% |
| $150,000 to $199,999 | 2,443 | 5.9% |
| $200,000+ | 1,863 | 4.5% |
Household Income by Householder Age in St. Lawrence County
The median household income in St. Lawrence County is $58,339, with the highest median household income of $71,586 found in the 25 to 44 years age bracket for the primary householder. A total of 11,249 households (27.2%) fall into this category. Meanwhile, the 15 to 24 years age bracket for the primary householder has the lowest median household income of $24,148, with 1,743 households (4.2%) in this group.
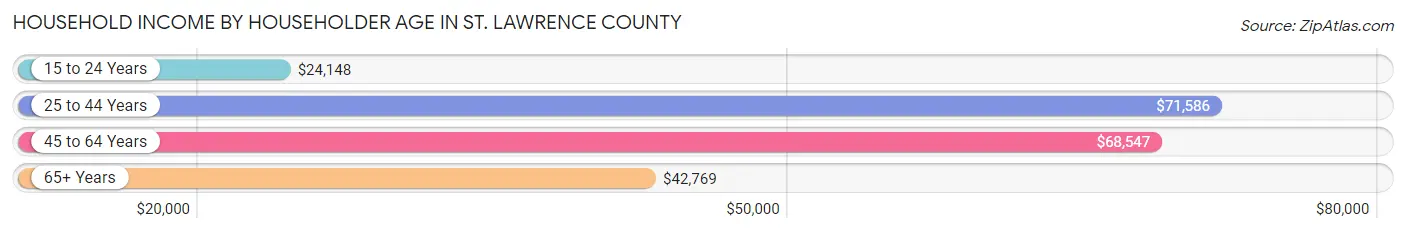
| Income Bracket | # Households | Median Income |
| 15 to 24 Years | 1,743 (4.2%) | $24,148 |
| 25 to 44 Years | 11,249 (27.2%) | $71,586 |
| 45 to 64 Years | 15,680 (37.9%) | $68,547 |
| 65+ Years | 12,727 (30.7%) | $42,769 |
| Total | 41,399 (100.0%) | $58,339 |
Poverty in St. Lawrence County
Income Below Poverty by Sex and Age in St. Lawrence County
With 16.9% poverty level for males and 17.2% for females among the residents of St. Lawrence County, under 5 year old males and 18 to 24 year old females are the most vulnerable to poverty, with 783 males (31.2%) and 1,098 females (28.8%) in their respective age groups living below the poverty level.
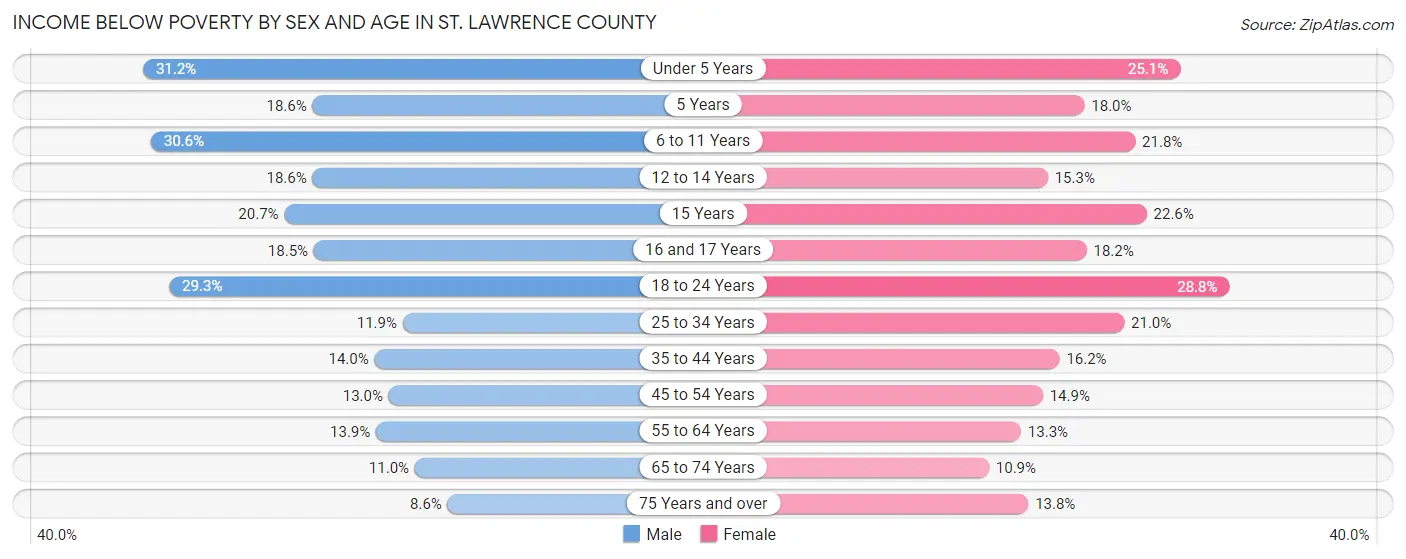
| Age Bracket | Male | Female |
| Under 5 Years | 783 (31.2%) | 612 (25.1%) |
| 5 Years | 119 (18.6%) | 78 (18.0%) |
| 6 to 11 Years | 1,123 (30.6%) | 725 (21.8%) |
| 12 to 14 Years | 359 (18.6%) | 288 (15.3%) |
| 15 Years | 122 (20.7%) | 129 (22.6%) |
| 16 and 17 Years | 246 (18.5%) | 235 (18.2%) |
| 18 to 24 Years | 1,313 (29.3%) | 1,098 (28.8%) |
| 25 to 34 Years | 696 (11.9%) | 1,165 (21.0%) |
| 35 to 44 Years | 788 (14.0%) | 911 (16.2%) |
| 45 to 54 Years | 808 (13.0%) | 921 (14.9%) |
| 55 to 64 Years | 1,037 (13.9%) | 998 (13.3%) |
| 65 to 74 Years | 626 (11.0%) | 632 (10.9%) |
| 75 Years and over | 279 (8.6%) | 583 (13.8%) |
| Total | 8,299 (16.9%) | 8,375 (17.2%) |
Income Above Poverty by Sex and Age in St. Lawrence County
According to the poverty statistics in St. Lawrence County, males aged 75 years and over and females aged 65 to 74 years are the age groups that are most secure financially, with 91.4% of males and 89.1% of females in these age groups living above the poverty line.
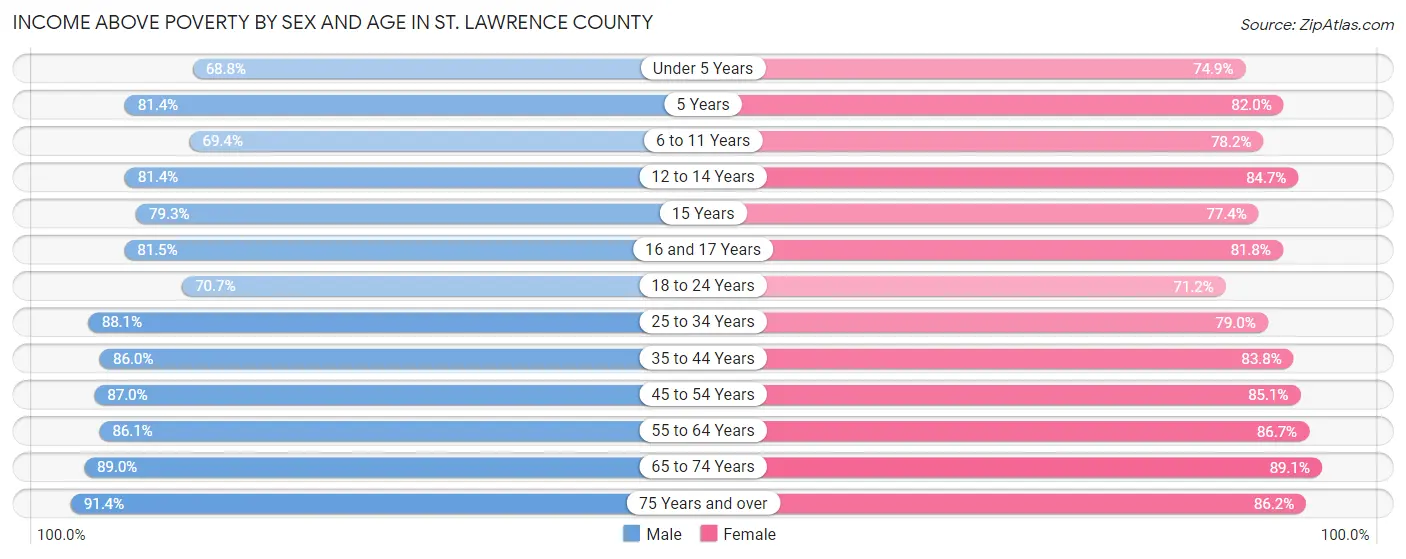
| Age Bracket | Male | Female |
| Under 5 Years | 1,726 (68.8%) | 1,825 (74.9%) |
| 5 Years | 520 (81.4%) | 355 (82.0%) |
| 6 to 11 Years | 2,543 (69.4%) | 2,603 (78.2%) |
| 12 to 14 Years | 1,569 (81.4%) | 1,596 (84.7%) |
| 15 Years | 467 (79.3%) | 441 (77.4%) |
| 16 and 17 Years | 1,082 (81.5%) | 1,058 (81.8%) |
| 18 to 24 Years | 3,173 (70.7%) | 2,718 (71.2%) |
| 25 to 34 Years | 5,144 (88.1%) | 4,394 (79.0%) |
| 35 to 44 Years | 4,833 (86.0%) | 4,725 (83.8%) |
| 45 to 54 Years | 5,425 (87.0%) | 5,250 (85.1%) |
| 55 to 64 Years | 6,424 (86.1%) | 6,503 (86.7%) |
| 65 to 74 Years | 5,054 (89.0%) | 5,155 (89.1%) |
| 75 Years and over | 2,969 (91.4%) | 3,629 (86.2%) |
| Total | 40,929 (83.1%) | 40,252 (82.8%) |
Income Below Poverty Among Married-Couple Families in St. Lawrence County
The poverty statistics for married-couple families in St. Lawrence County show that 6.7% or 1,272 of the total 19,063 families live below the poverty line. Families with 5 or more children have the highest poverty rate of 29.9%, comprising of 138 families. On the other hand, families with no children have the lowest poverty rate of 4.6%, which includes 548 families.
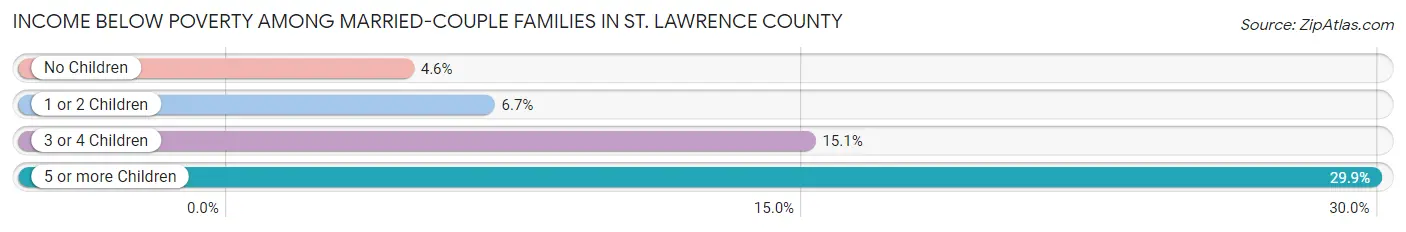
| Children | Above Poverty | Below Poverty |
| No Children | 11,400 (95.4%) | 548 (4.6%) |
| 1 or 2 Children | 4,648 (93.3%) | 334 (6.7%) |
| 3 or 4 Children | 1,419 (84.9%) | 252 (15.1%) |
| 5 or more Children | 324 (70.1%) | 138 (29.9%) |
| Total | 17,791 (93.3%) | 1,272 (6.7%) |
Income Below Poverty Among Single-Parent Households in St. Lawrence County
According to the poverty data in St. Lawrence County, 19.9% or 372 single-father households and 31.0% or 1,289 single-mother households are living below the poverty line. Among single-father households, those with 5 or more children have the highest poverty rate, with 14 households (50.0%) experiencing poverty. Likewise, among single-mother households, those with 5 or more children have the highest poverty rate, with 30 households (81.1%) falling below the poverty line.
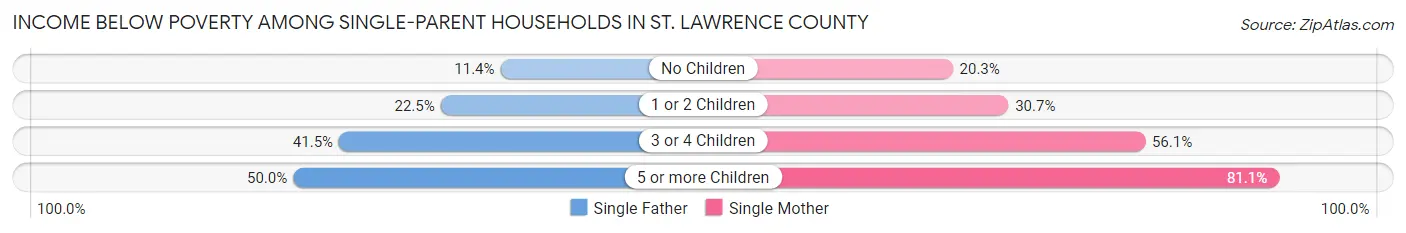
| Children | Single Father | Single Mother |
| No Children | 89 (11.4%) | 279 (20.3%) |
| 1 or 2 Children | 201 (22.5%) | 673 (30.6%) |
| 3 or 4 Children | 68 (41.5%) | 307 (56.1%) |
| 5 or more Children | 14 (50.0%) | 30 (81.1%) |
| Total | 372 (19.9%) | 1,289 (31.0%) |
Income Below Poverty Among Married-Couple vs Single-Parent Households in St. Lawrence County
The poverty data for St. Lawrence County shows that 1,272 of the married-couple family households (6.7%) and 1,661 of the single-parent households (27.6%) are living below the poverty level. Within the married-couple family households, those with 5 or more children have the highest poverty rate, with 138 households (29.9%) falling below the poverty line. Among the single-parent households, those with 5 or more children have the highest poverty rate, with 44 household (67.7%) living below poverty.
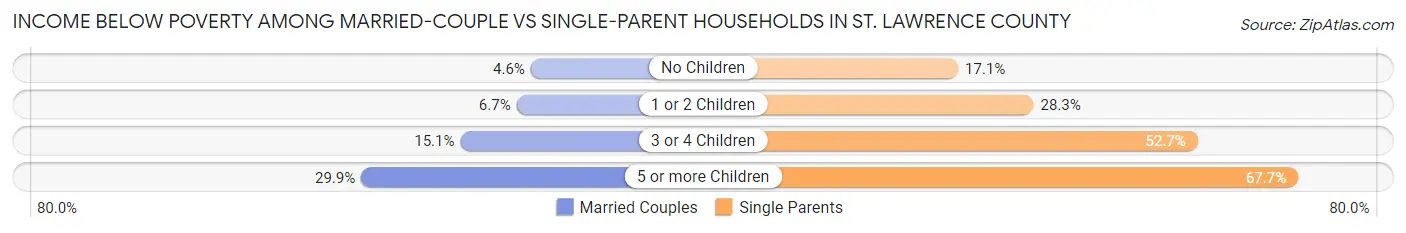
| Children | Married-Couple Families | Single-Parent Households |
| No Children | 548 (4.6%) | 368 (17.1%) |
| 1 or 2 Children | 334 (6.7%) | 874 (28.3%) |
| 3 or 4 Children | 252 (15.1%) | 375 (52.7%) |
| 5 or more Children | 138 (29.9%) | 44 (67.7%) |
| Total | 1,272 (6.7%) | 1,661 (27.6%) |
Race in St. Lawrence County
The most populous races in St. Lawrence County are White / Caucasian (100,370 | 92.4%), Two or more Races (3,297 | 3.0%), and Hispanic or Latino (2,577 | 2.4%).
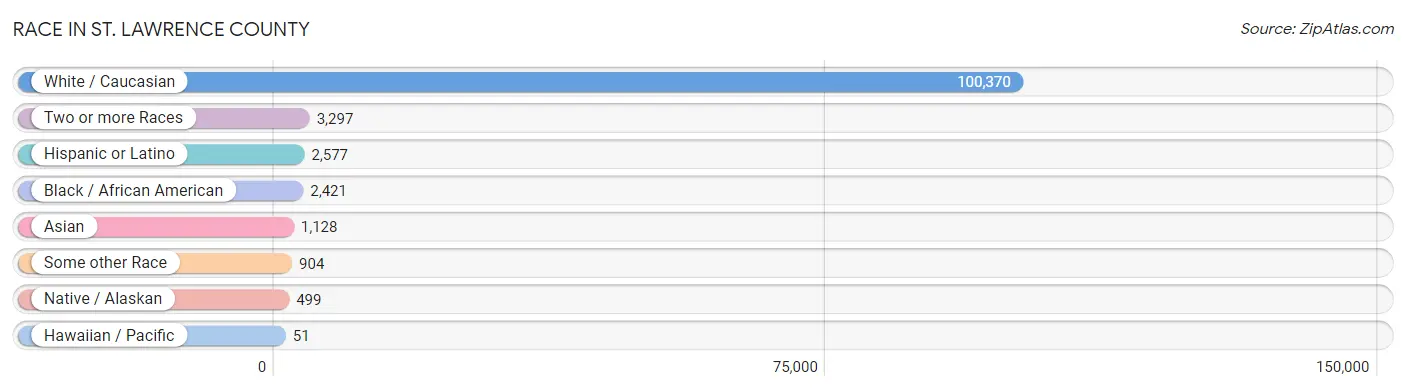
| Race | # Population | % Population |
| Asian | 1,128 | 1.0% |
| Black / African American | 2,421 | 2.2% |
| Hawaiian / Pacific | 51 | 0.1% |
| Hispanic or Latino | 2,577 | 2.4% |
| Native / Alaskan | 499 | 0.5% |
| White / Caucasian | 100,370 | 92.4% |
| Two or more Races | 3,297 | 3.0% |
| Some other Race | 904 | 0.8% |
| Total | 108,670 | 100.0% |
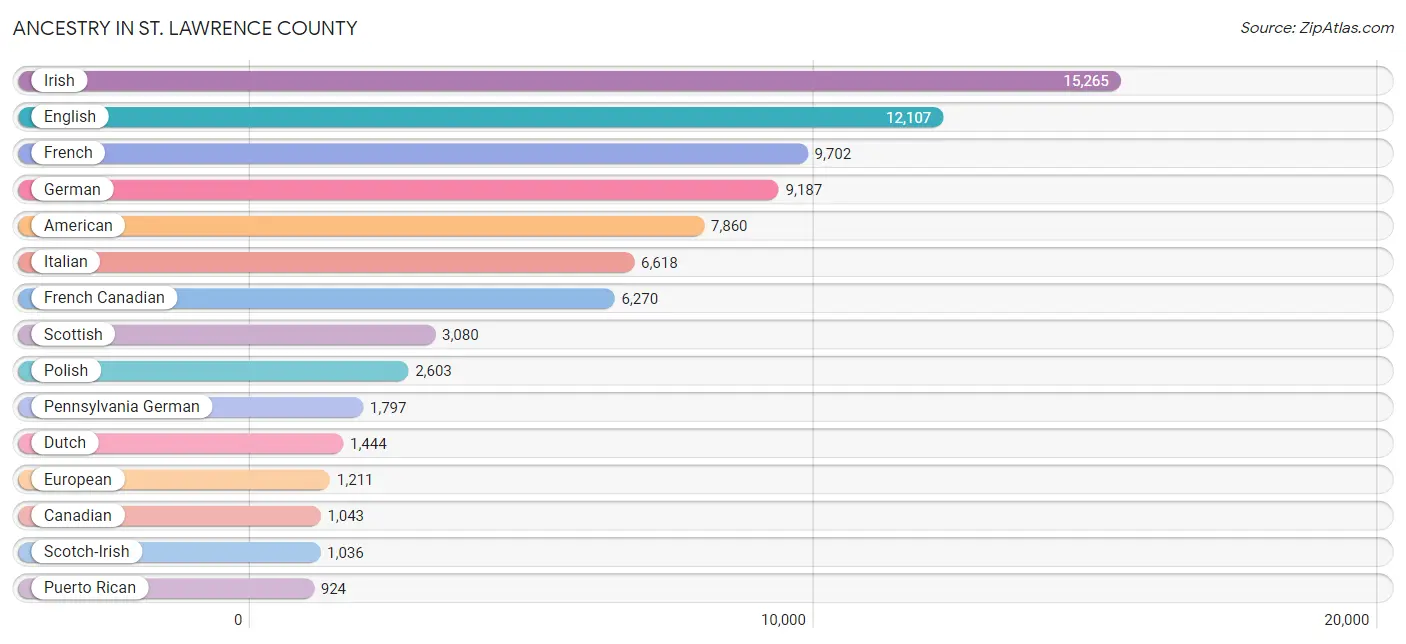
Ancestry in St. Lawrence County
The most populous ancestries reported in St. Lawrence County are Irish (15,265 | 14.1%), English (12,107 | 11.1%), French (9,702 | 8.9%), German (9,187 | 8.5%), and American (7,860 | 7.2%), together accounting for 49.8% of all St. Lawrence County residents.
| Ancestry | # Population | % Population |
| African | 110 | 0.1% |
| Albanian | 1 | 0.0% |
| Alsatian | 4 | 0.0% |
| American | 7,860 | 7.2% |
| Arab | 250 | 0.2% |
| Argentinean | 19 | 0.0% |
| Armenian | 271 | 0.3% |
| Australian | 11 | 0.0% |
| Austrian | 87 | 0.1% |
| Bahamian | 7 | 0.0% |
| Belgian | 39 | 0.0% |
| Belizean | 8 | 0.0% |
| Bhutanese | 62 | 0.1% |
| Blackfeet | 111 | 0.1% |
| Bolivian | 2 | 0.0% |
| Brazilian | 21 | 0.0% |
| British | 551 | 0.5% |
| British West Indian | 15 | 0.0% |
| Bulgarian | 32 | 0.0% |
| Burmese | 117 | 0.1% |
| Canadian | 1,043 | 1.0% |
| Cape Verdean | 20 | 0.0% |
| Celtic | 14 | 0.0% |
| Central American | 169 | 0.2% |
| Central American Indian | 11 | 0.0% |
| Cherokee | 97 | 0.1% |
| Chilean | 15 | 0.0% |
| Chinese | 3 | 0.0% |
| Chippewa | 4 | 0.0% |
| Choctaw | 6 | 0.0% |
| Colombian | 96 | 0.1% |
| Comanche | 1 | 0.0% |
| Costa Rican | 67 | 0.1% |
| Croatian | 148 | 0.1% |
| Crow | 17 | 0.0% |
| Cuban | 43 | 0.0% |
| Cypriot | 14 | 0.0% |
| Czech | 110 | 0.1% |
| Czechoslovakian | 32 | 0.0% |
| Danish | 49 | 0.1% |
| Dominican | 356 | 0.3% |
| Dutch | 1,444 | 1.3% |
| Eastern European | 530 | 0.5% |
| Ecuadorian | 44 | 0.0% |
| Egyptian | 30 | 0.0% |
| English | 12,107 | 11.1% |
| Estonian | 70 | 0.1% |
| Ethiopian | 43 | 0.0% |
| European | 1,211 | 1.1% |
| Filipino | 25 | 0.0% |
| Finnish | 52 | 0.1% |
| French | 9,702 | 8.9% |
| French American Indian | 186 | 0.2% |
| French Canadian | 6,270 | 5.8% |
| German | 9,187 | 8.5% |
| Ghanaian | 25 | 0.0% |
| Greek | 227 | 0.2% |
| Guatemalan | 42 | 0.0% |
| Guyanese | 10 | 0.0% |
| Haitian | 115 | 0.1% |
| Honduran | 18 | 0.0% |
| Hopi | 4 | 0.0% |
| Hungarian | 677 | 0.6% |
| Indian (Asian) | 452 | 0.4% |
| Indonesian | 21 | 0.0% |
| Iranian | 52 | 0.1% |
| Iraqi | 5 | 0.0% |
| Irish | 15,265 | 14.1% |
| Iroquois | 542 | 0.5% |
| Israeli | 32 | 0.0% |
| Italian | 6,618 | 6.1% |
| Jamaican | 176 | 0.2% |
| Jordanian | 3 | 0.0% |
| Kenyan | 5 | 0.0% |
| Korean | 348 | 0.3% |
| Laotian | 18 | 0.0% |
| Lebanese | 66 | 0.1% |
| Lithuanian | 165 | 0.2% |
| Lumbee | 15 | 0.0% |
| Mexican | 465 | 0.4% |
| Mexican American Indian | 3 | 0.0% |
| Mongolian | 11 | 0.0% |
| Native Hawaiian | 52 | 0.1% |
| Navajo | 26 | 0.0% |
| Nigerian | 21 | 0.0% |
| Northern European | 253 | 0.2% |
| Norwegian | 226 | 0.2% |
| Ottawa | 24 | 0.0% |
| Pakistani | 26 | 0.0% |
| Palestinian | 1 | 0.0% |
| Panamanian | 28 | 0.0% |
| Paraguayan | 10 | 0.0% |
| Pennsylvania German | 1,797 | 1.7% |
| Peruvian | 39 | 0.0% |
| Pima | 4 | 0.0% |
| Polish | 2,603 | 2.4% |
| Portuguese | 219 | 0.2% |
| Puerto Rican | 924 | 0.9% |
| Romanian | 165 | 0.2% |
| Russian | 357 | 0.3% |
| Salvadoran | 14 | 0.0% |
| Scandinavian | 263 | 0.2% |
| Scotch-Irish | 1,036 | 0.9% |
| Scottish | 3,080 | 2.8% |
| Senegalese | 4 | 0.0% |
| Serbian | 28 | 0.0% |
| Slavic | 16 | 0.0% |
| Slovak | 121 | 0.1% |
| Slovene | 20 | 0.0% |
| South American | 235 | 0.2% |
| Spaniard | 54 | 0.1% |
| Spanish | 78 | 0.1% |
| Spanish American | 6 | 0.0% |
| Sri Lankan | 79 | 0.1% |
| Subsaharan African | 257 | 0.2% |
| Swedish | 634 | 0.6% |
| Swiss | 351 | 0.3% |
| Syrian | 142 | 0.1% |
| Thai | 251 | 0.2% |
| Turkish | 104 | 0.1% |
| Ukrainian | 284 | 0.3% |
| Venezuelan | 2 | 0.0% |
| Vietnamese | 45 | 0.0% |
| Welsh | 523 | 0.5% |
| West Indian | 38 | 0.0% |
| Yugoslavian | 27 | 0.0% |
| Zimbabwean | 8 | 0.0% | View All 127 Rows |
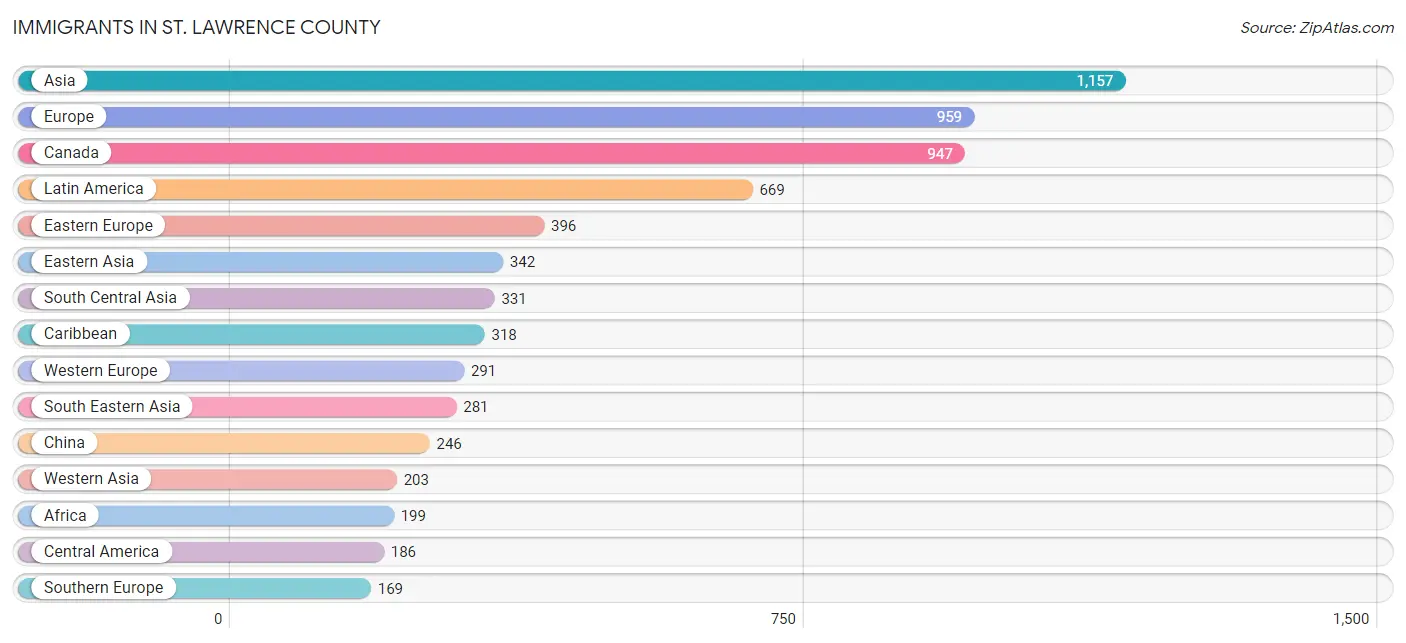
Immigrants in St. Lawrence County
The most numerous immigrant groups reported in St. Lawrence County came from Asia (1,157 | 1.1%), Europe (959 | 0.9%), Canada (947 | 0.9%), Latin America (669 | 0.6%), and Eastern Europe (396 | 0.4%), together accounting for 3.8% of all St. Lawrence County residents.
| Immigration Origin | # Population | % Population |
| Africa | 199 | 0.2% |
| Argentina | 34 | 0.0% |
| Armenia | 7 | 0.0% |
| Asia | 1,157 | 1.1% |
| Australia | 3 | 0.0% |
| Austria | 4 | 0.0% |
| Bahamas | 7 | 0.0% |
| Bangladesh | 54 | 0.1% |
| Barbados | 1 | 0.0% |
| Belgium | 5 | 0.0% |
| Belize | 8 | 0.0% |
| Brazil | 16 | 0.0% |
| Bulgaria | 32 | 0.0% |
| Cameroon | 32 | 0.0% |
| Canada | 947 | 0.9% |
| Caribbean | 318 | 0.3% |
| Central America | 186 | 0.2% |
| Chile | 15 | 0.0% |
| China | 246 | 0.2% |
| Colombia | 56 | 0.1% |
| Costa Rica | 48 | 0.0% |
| Cuba | 23 | 0.0% |
| Czechoslovakia | 23 | 0.0% |
| Dominican Republic | 36 | 0.0% |
| Eastern Africa | 49 | 0.1% |
| Eastern Asia | 342 | 0.3% |
| Eastern Europe | 396 | 0.4% |
| Ecuador | 11 | 0.0% |
| Egypt | 49 | 0.1% |
| El Salvador | 9 | 0.0% |
| England | 10 | 0.0% |
| Ethiopia | 43 | 0.0% |
| Europe | 959 | 0.9% |
| France | 80 | 0.1% |
| Germany | 142 | 0.1% |
| Ghana | 1 | 0.0% |
| Greece | 9 | 0.0% |
| Guatemala | 25 | 0.0% |
| Guyana | 22 | 0.0% |
| Haiti | 116 | 0.1% |
| Honduras | 7 | 0.0% |
| Hong Kong | 15 | 0.0% |
| Hungary | 50 | 0.1% |
| India | 84 | 0.1% |
| Indonesia | 1 | 0.0% |
| Iran | 33 | 0.0% |
| Iraq | 30 | 0.0% |
| Ireland | 17 | 0.0% |
| Israel | 1 | 0.0% |
| Italy | 160 | 0.2% |
| Jamaica | 127 | 0.1% |
| Japan | 23 | 0.0% |
| Jordan | 3 | 0.0% |
| Kenya | 5 | 0.0% |
| Korea | 73 | 0.1% |
| Latin America | 669 | 0.6% |
| Liberia | 6 | 0.0% |
| Lithuania | 1 | 0.0% |
| Malaysia | 8 | 0.0% |
| Mexico | 61 | 0.1% |
| Middle Africa | 48 | 0.0% |
| Moldova | 16 | 0.0% |
| Nepal | 63 | 0.1% |
| Netherlands | 27 | 0.0% |
| Nigeria | 21 | 0.0% |
| Northern Africa | 60 | 0.1% |
| Northern Europe | 103 | 0.1% |
| Oceania | 13 | 0.0% |
| Pakistan | 30 | 0.0% |
| Panama | 28 | 0.0% |
| Peru | 8 | 0.0% |
| Philippines | 162 | 0.2% |
| Poland | 19 | 0.0% |
| Romania | 68 | 0.1% |
| Russia | 93 | 0.1% |
| Scotland | 27 | 0.0% |
| Serbia | 10 | 0.0% |
| South America | 165 | 0.2% |
| South Central Asia | 331 | 0.3% |
| South Eastern Asia | 281 | 0.3% |
| Southern Europe | 169 | 0.2% |
| Sri Lanka | 50 | 0.1% |
| Switzerland | 33 | 0.0% |
| Syria | 34 | 0.0% |
| Taiwan | 21 | 0.0% |
| Thailand | 20 | 0.0% |
| Trinidad and Tobago | 2 | 0.0% |
| Turkey | 61 | 0.1% |
| Ukraine | 81 | 0.1% |
| Uruguay | 3 | 0.0% |
| Vietnam | 69 | 0.1% |
| Western Africa | 28 | 0.0% |
| Western Asia | 203 | 0.2% |
| Western Europe | 291 | 0.3% | View All 94 Rows |
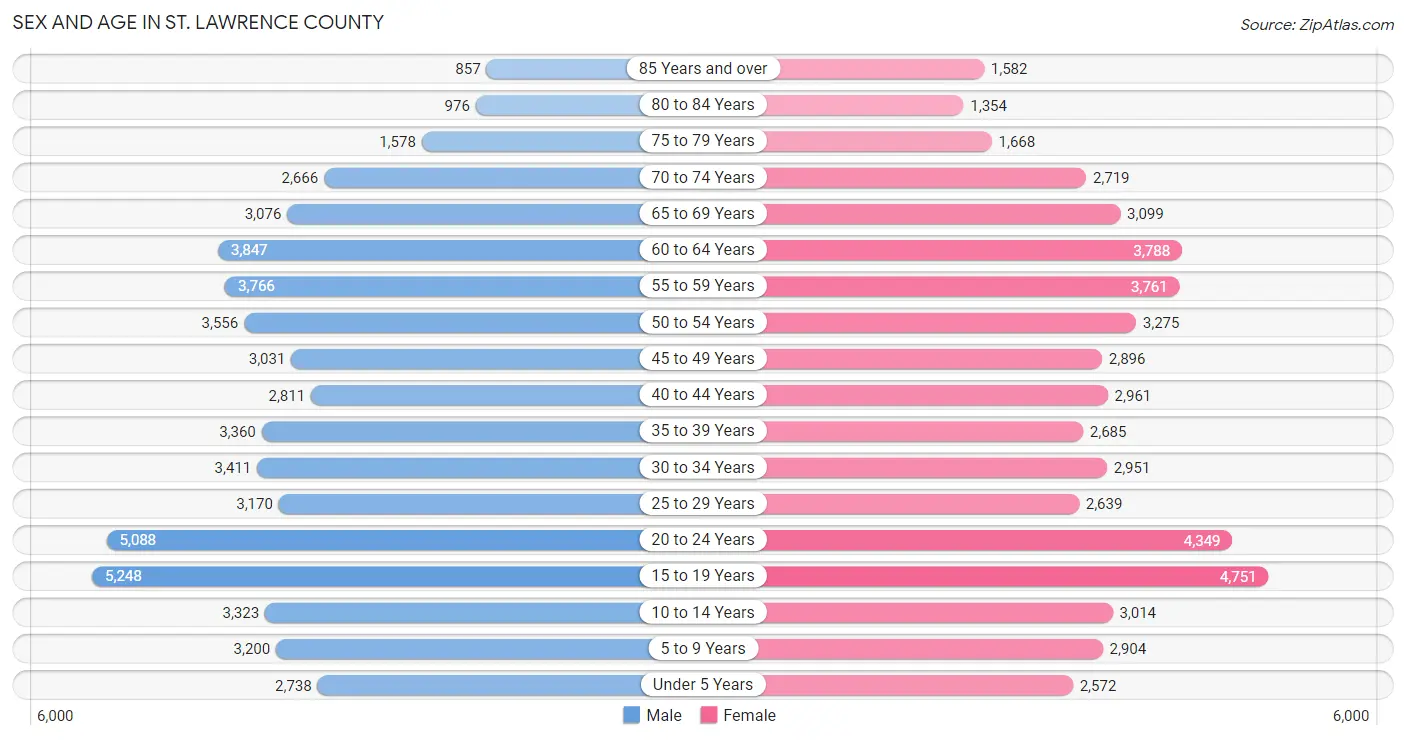
Sex and Age in St. Lawrence County
Sex and Age in St. Lawrence County
The most populous age groups in St. Lawrence County are 15 to 19 Years (5,248 | 9.4%) for men and 15 to 19 Years (4,751 | 9.0%) for women.
| Age Bracket | Male | Female |
| Under 5 Years | 2,738 (4.9%) | 2,572 (4.9%) |
| 5 to 9 Years | 3,200 (5.7%) | 2,904 (5.5%) |
| 10 to 14 Years | 3,323 (6.0%) | 3,014 (5.7%) |
| 15 to 19 Years | 5,248 (9.4%) | 4,751 (9.0%) |
| 20 to 24 Years | 5,088 (9.1%) | 4,349 (8.2%) |
| 25 to 29 Years | 3,170 (5.7%) | 2,639 (5.0%) |
| 30 to 34 Years | 3,411 (6.1%) | 2,951 (5.6%) |
| 35 to 39 Years | 3,360 (6.0%) | 2,685 (5.1%) |
| 40 to 44 Years | 2,811 (5.1%) | 2,961 (5.6%) |
| 45 to 49 Years | 3,031 (5.4%) | 2,896 (5.5%) |
| 50 to 54 Years | 3,556 (6.4%) | 3,275 (6.2%) |
| 55 to 59 Years | 3,766 (6.8%) | 3,761 (7.1%) |
| 60 to 64 Years | 3,847 (6.9%) | 3,788 (7.1%) |
| 65 to 69 Years | 3,076 (5.5%) | 3,099 (5.9%) |
| 70 to 74 Years | 2,666 (4.8%) | 2,719 (5.1%) |
| 75 to 79 Years | 1,578 (2.8%) | 1,668 (3.2%) |
| 80 to 84 Years | 976 (1.8%) | 1,354 (2.6%) |
| 85 Years and over | 857 (1.5%) | 1,582 (3.0%) |
| Total | 55,702 (100.0%) | 52,968 (100.0%) |
Families and Households in St. Lawrence County
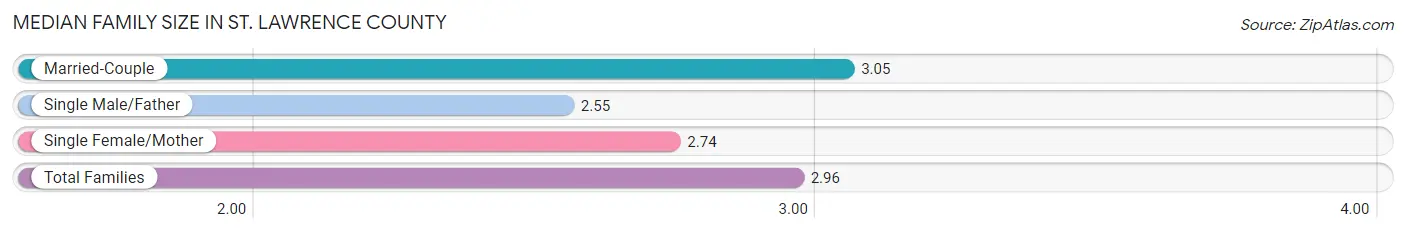
Median Family Size in St. Lawrence County
The median family size in St. Lawrence County is 2.96 persons per family, with married-couple families (19,063 | 76.0%) accounting for the largest median family size of 3.05 persons per family. On the other hand, single male/father families (1,866 | 7.4%) represent the smallest median family size with 2.55 persons per family.
| Family Type | # Families | Family Size |
| Married-Couple | 19,063 (76.0%) | 3.05 |
| Single Male/Father | 1,866 (7.4%) | 2.55 |
| Single Female/Mother | 4,155 (16.6%) | 2.74 |
| Total Families | 25,084 (100.0%) | 2.96 |
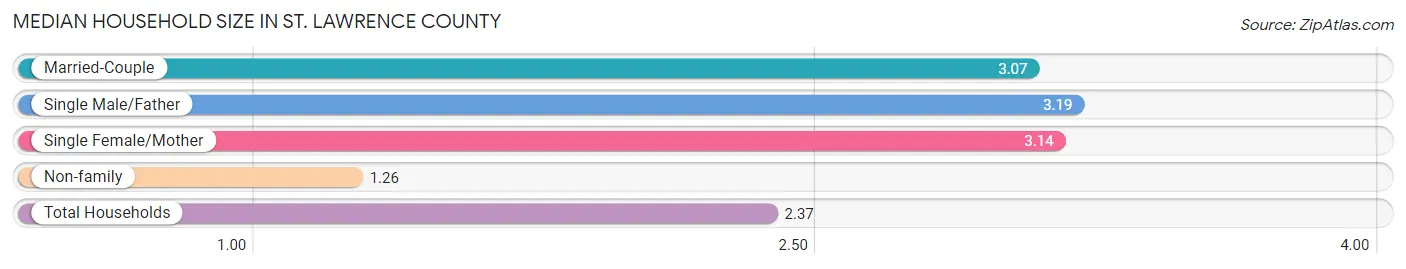
Median Household Size in St. Lawrence County
The median household size in St. Lawrence County is 2.37 persons per household, with single male/father households (1,866 | 4.5%) accounting for the largest median household size of 3.19 persons per household. non-family households (16,315 | 39.4%) represent the smallest median household size with 1.26 persons per household.
| Household Type | # Households | Household Size |
| Married-Couple | 19,063 (46.1%) | 3.07 |
| Single Male/Father | 1,866 (4.5%) | 3.19 |
| Single Female/Mother | 4,155 (10.0%) | 3.14 |
| Non-family | 16,315 (39.4%) | 1.26 |
| Total Households | 41,399 (100.0%) | 2.37 |
Household Size by Marriage Status in St. Lawrence County
Out of a total of 41,399 households in St. Lawrence County, 25,084 (60.6%) are family households, while 16,315 (39.4%) are nonfamily households. The most numerous type of family households are 2-person households, comprising 12,279, and the most common type of nonfamily households are 1-person households, comprising 13,282.
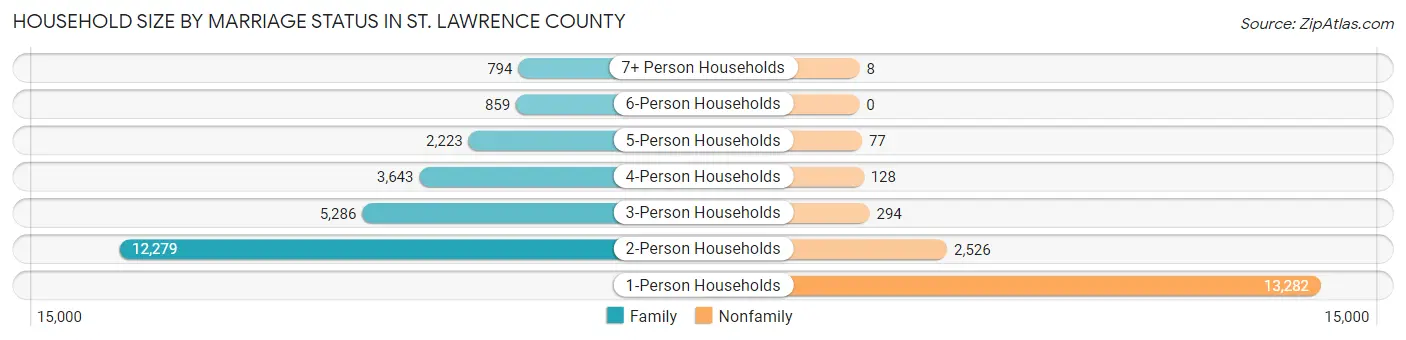
| Household Size | Family Households | Nonfamily Households |
| 1-Person Households | - | 13,282 (32.1%) |
| 2-Person Households | 12,279 (29.7%) | 2,526 (6.1%) |
| 3-Person Households | 5,286 (12.8%) | 294 (0.7%) |
| 4-Person Households | 3,643 (8.8%) | 128 (0.3%) |
| 5-Person Households | 2,223 (5.4%) | 77 (0.2%) |
| 6-Person Households | 859 (2.1%) | 0 (0.0%) |
| 7+ Person Households | 794 (1.9%) | 8 (0.0%) |
| Total | 25,084 (60.6%) | 16,315 (39.4%) |
Female Fertility in St. Lawrence County
Fertility by Age in St. Lawrence County
Average fertility rate in St. Lawrence County is 55.0 births per 1,000 women. Women in the age bracket of 20 to 34 years have the highest fertility rate with 95.0 births per 1,000 women. Women in the age bracket of 20 to 34 years acount for 72.0% of all women with births.
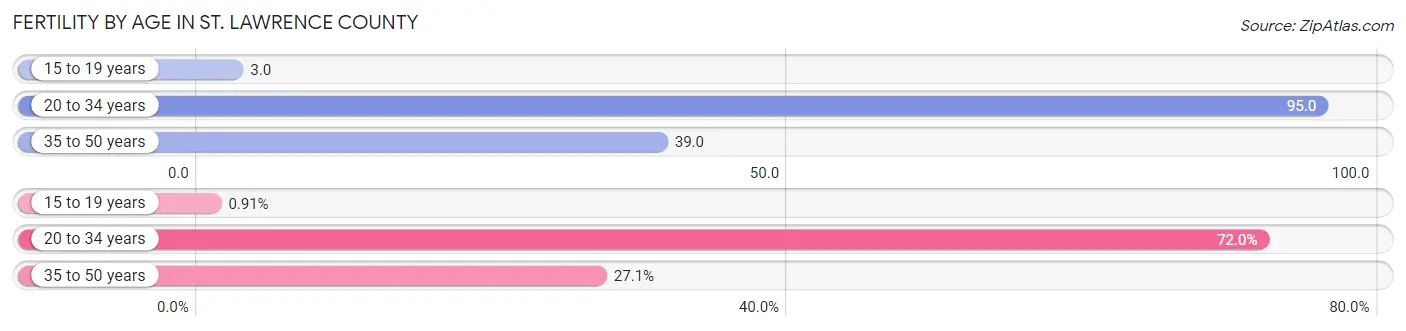
| Age Bracket | Women with Births | Births / 1,000 Women |
| 15 to 19 years | 12 (0.9%) | 3.0 |
| 20 to 34 years | 947 (72.0%) | 95.0 |
| 35 to 50 years | 356 (27.1%) | 39.0 |
| Total | 1,315 (100.0%) | 55.0 |
Fertility by Age by Marriage Status in St. Lawrence County
67.1% of women with births (1,315) in St. Lawrence County are married. The highest percentage of unmarried women with births falls into 15 to 19 years age bracket with 100.0% of them unmarried at the time of birth, while the lowest percentage of unmarried women with births belong to 35 to 50 years age bracket with 16.3% of them unmarried.
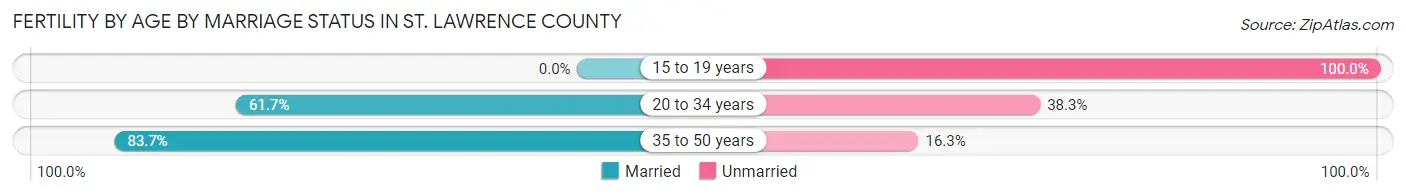
| Age Bracket | Married | Unmarried |
| 15 to 19 years | 0 (0.0%) | 12 (100.0%) |
| 20 to 34 years | 584 (61.7%) | 363 (38.3%) |
| 35 to 50 years | 298 (83.7%) | 58 (16.3%) |
| Total | 882 (67.1%) | 433 (32.9%) |
Fertility by Education in St. Lawrence County
Average fertility rate in St. Lawrence County is 55.0 births per 1,000 women. Women with the education attainment of bachelor's degree have the highest fertility rate of 89.0 births per 1,000 women, while women with the education attainment of graduate degree have the lowest fertility at 26.0 births per 1,000 women. Women with the education attainment of college or associate's degree represent 31.5% of all women with births.
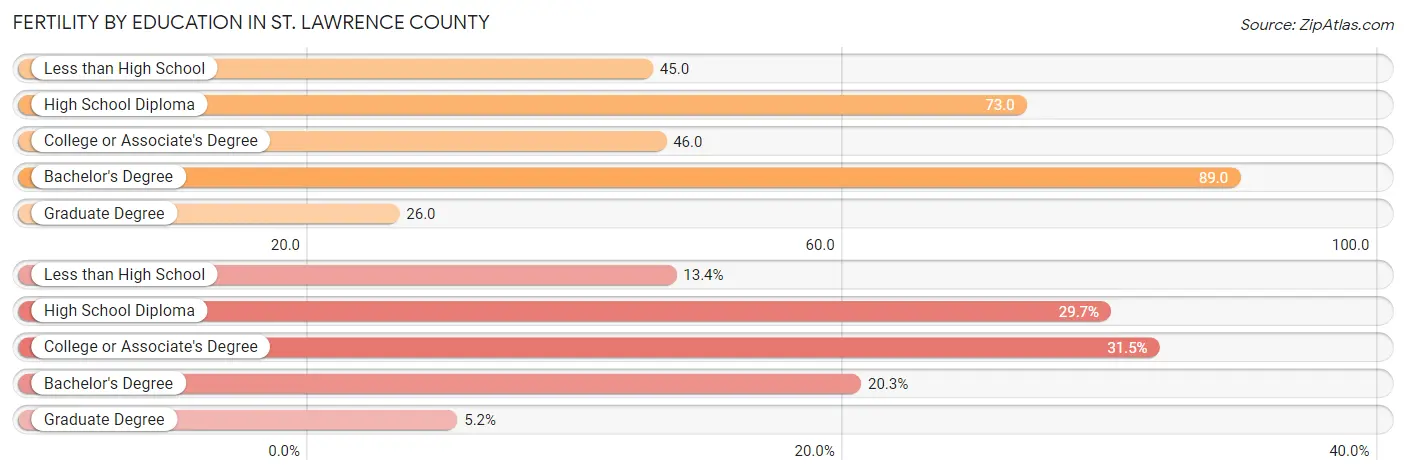
| Educational Attainment | Women with Births | Births / 1,000 Women |
| Less than High School | 176 (13.4%) | 45.0 |
| High School Diploma | 390 (29.7%) | 73.0 |
| College or Associate's Degree | 414 (31.5%) | 46.0 |
| Bachelor's Degree | 267 (20.3%) | 89.0 |
| Graduate Degree | 68 (5.2%) | 26.0 |
| Total | 1,315 (100.0%) | 55.0 |
Fertility by Education by Marriage Status in St. Lawrence County
32.9% of women with births in St. Lawrence County are unmarried. Women with the educational attainment of bachelor's degree are most likely to be married with 91.0% of them married at childbirth, while women with the educational attainment of high school diploma are least likely to be married with 52.0% of them unmarried at childbirth.
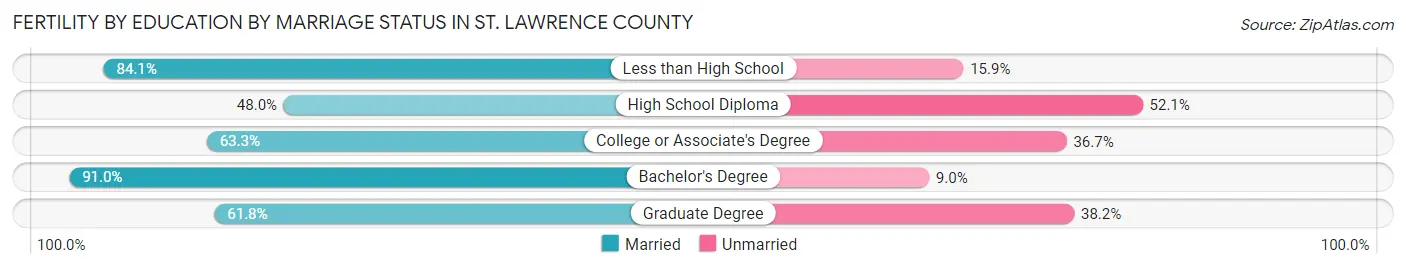
| Educational Attainment | Married | Unmarried |
| Less than High School | 148 (84.1%) | 28 (15.9%) |
| High School Diploma | 187 (47.9%) | 203 (52.0%) |
| College or Associate's Degree | 262 (63.3%) | 152 (36.7%) |
| Bachelor's Degree | 243 (91.0%) | 24 (9.0%) |
| Graduate Degree | 42 (61.8%) | 26 (38.2%) |
| Total | 882 (67.1%) | 433 (32.9%) |
Employment Characteristics in St. Lawrence County
Employment by Class of Employer in St. Lawrence County
Among the 43,767 employed individuals in St. Lawrence County, private company employees (21,558 | 49.3%), not-for-profit organizations (5,898 | 13.5%), and state government employees (5,220 | 11.9%) make up the most common classes of employment.
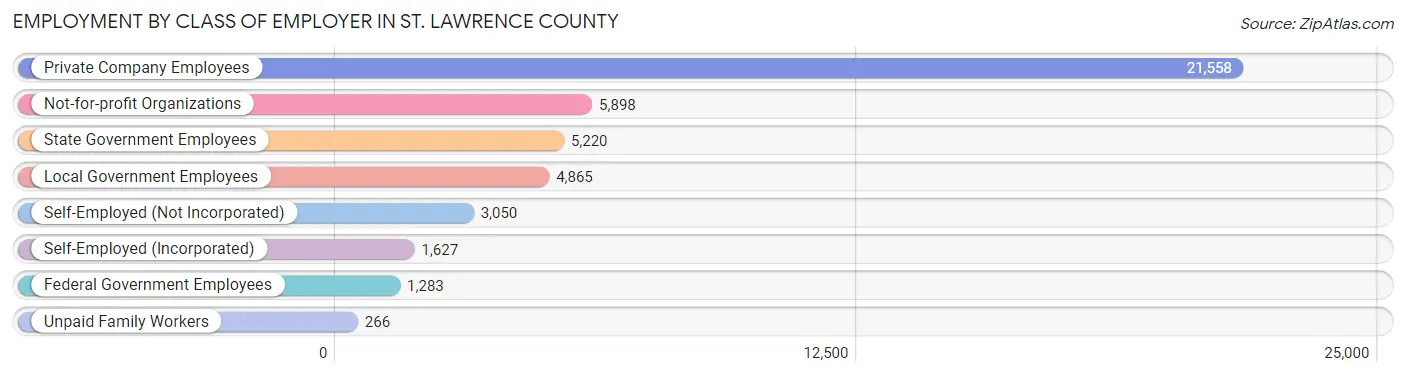
| Employer Class | # Employees | % Employees |
| Private Company Employees | 21,558 | 49.3% |
| Self-Employed (Incorporated) | 1,627 | 3.7% |
| Self-Employed (Not Incorporated) | 3,050 | 7.0% |
| Not-for-profit Organizations | 5,898 | 13.5% |
| Local Government Employees | 4,865 | 11.1% |
| State Government Employees | 5,220 | 11.9% |
| Federal Government Employees | 1,283 | 2.9% |
| Unpaid Family Workers | 266 | 0.6% |
| Total | 43,767 | 100.0% |
Employment Status by Age in St. Lawrence County
According to the labor force statistics for St. Lawrence County, out of the total population over 16 years of age (89,757), 53.2% or 47,751 individuals are in the labor force, with 6.3% or 3,008 of them unemployed. The age group with the highest labor force participation rate is 30 to 34 years, with 80.3% or 5,109 individuals in the labor force. Within the labor force, the 16 to 19 years age range has the highest percentage of unemployed individuals, with 11.5% or 360 of them being unemployed.
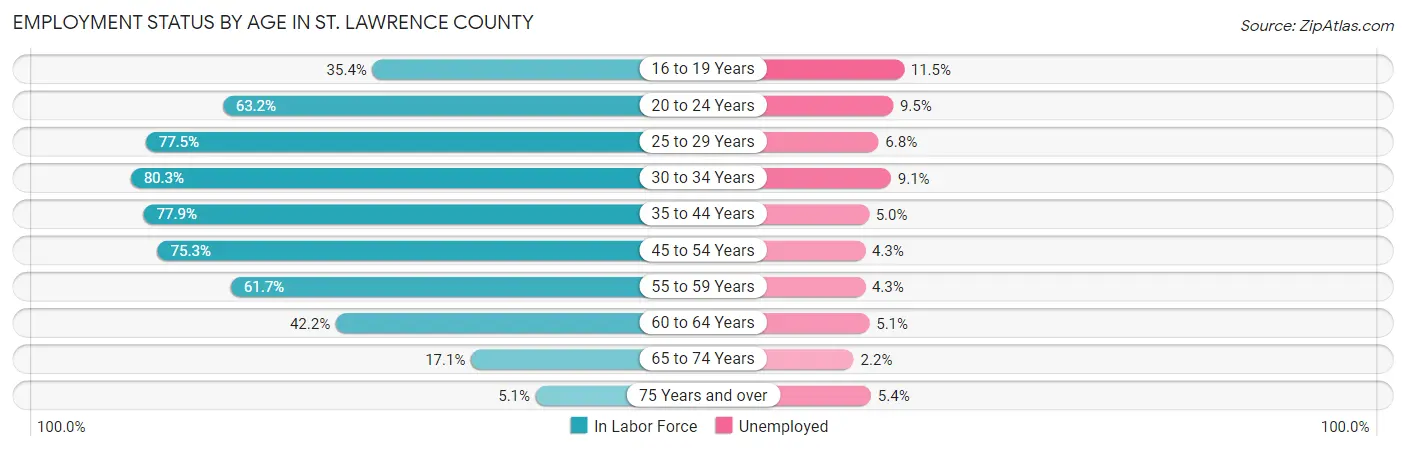
| Age Bracket | In Labor Force | Unemployed |
| 16 to 19 Years | 3,128 (35.4%) | 360 (11.5%) |
| 20 to 24 Years | 5,964 (63.2%) | 567 (9.5%) |
| 25 to 29 Years | 4,502 (77.5%) | 306 (6.8%) |
| 30 to 34 Years | 5,109 (80.3%) | 465 (9.1%) |
| 35 to 44 Years | 9,205 (77.9%) | 460 (5.0%) |
| 45 to 54 Years | 9,607 (75.3%) | 413 (4.3%) |
| 55 to 59 Years | 4,644 (61.7%) | 200 (4.3%) |
| 60 to 64 Years | 3,222 (42.2%) | 164 (5.1%) |
| 65 to 74 Years | 1,977 (17.1%) | 43 (2.2%) |
| 75 Years and over | 409 (5.1%) | 22 (5.4%) |
| Total | 47,751 (53.2%) | 3,008 (6.3%) |
Employment Status by Educational Attainment in St. Lawrence County
According to labor force statistics for St. Lawrence County, 69.9% of individuals (36,284) out of the total population between 25 and 64 years of age (51,908) are in the labor force, with 5.5% or 1,996 of them being unemployed. The group with the highest labor force participation rate are those with the educational attainment of bachelor's degree or higher, with 83.2% or 10,875 individuals in the labor force. Within the labor force, individuals with less than high school education have the highest percentage of unemployment, with 15.0% or 328 of them being unemployed.
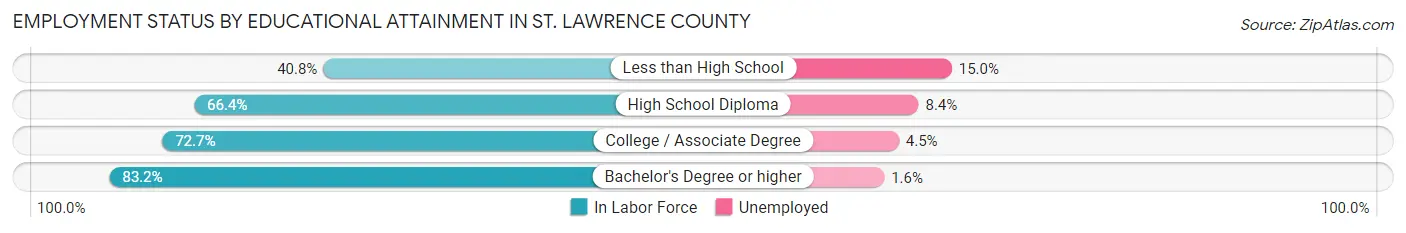
| Educational Attainment | In Labor Force | Unemployed |
| Less than High School | 2,190 (40.8%) | 805 (15.0%) |
| High School Diploma | 11,473 (66.4%) | 1,451 (8.4%) |
| College / Associate Degree | 11,770 (72.7%) | 729 (4.5%) |
| Bachelor's Degree or higher | 10,875 (83.2%) | 209 (1.6%) |
| Total | 36,284 (69.9%) | 2,855 (5.5%) |
Employment Occupations by Sex in St. Lawrence County
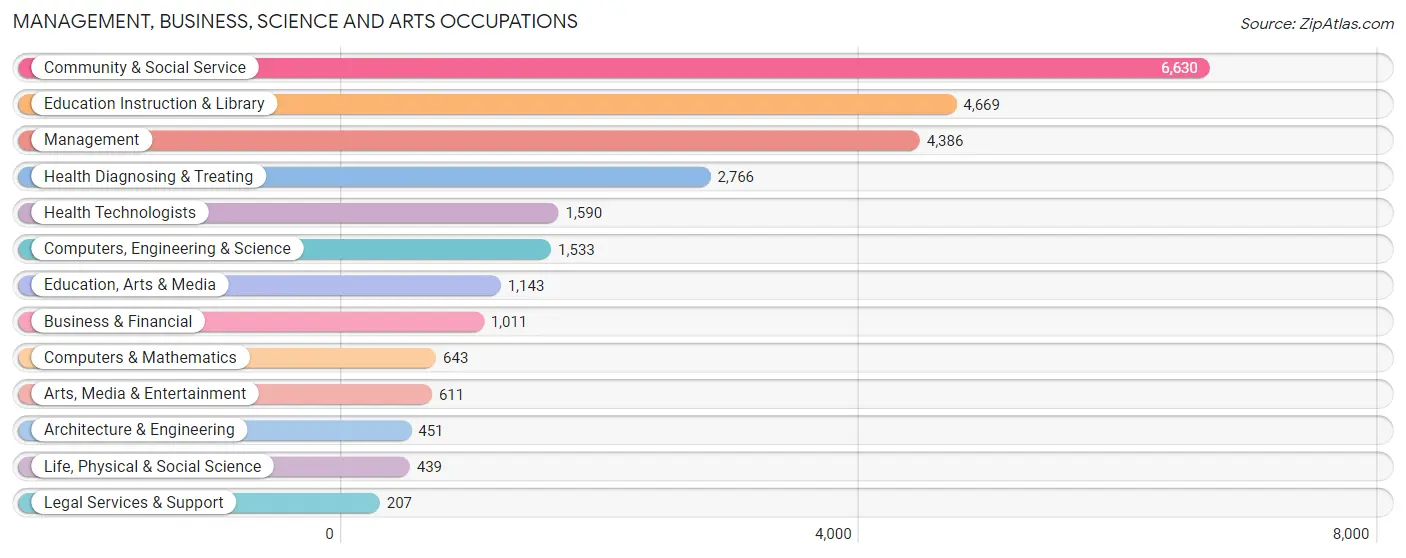
Management, Business, Science and Arts Occupations
The most common Management, Business, Science and Arts occupations in St. Lawrence County are Community & Social Service (6,630 | 14.8%), Education Instruction & Library (4,669 | 10.4%), Management (4,386 | 9.8%), Health Diagnosing & Treating (2,766 | 6.2%), and Health Technologists (1,590 | 3.5%).
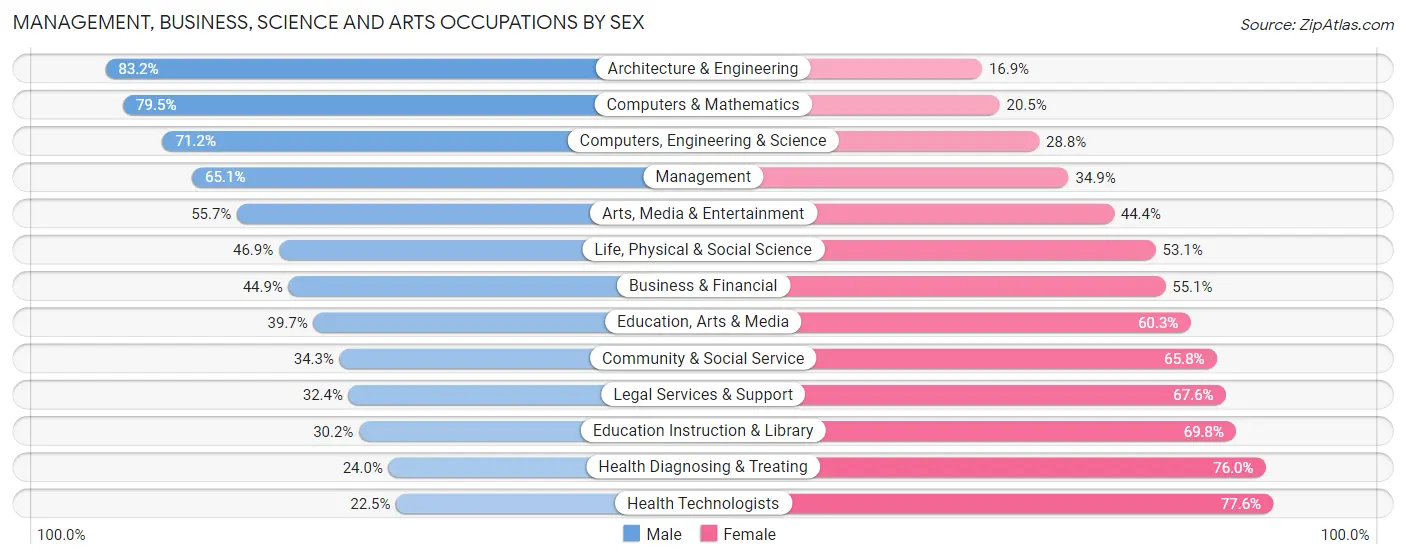
Management, Business, Science and Arts Occupations by Sex
Within the Management, Business, Science and Arts occupations in St. Lawrence County, the most male-oriented occupations are Architecture & Engineering (83.2%), Computers & Mathematics (79.5%), and Computers, Engineering & Science (71.2%), while the most female-oriented occupations are Health Technologists (77.5%), Health Diagnosing & Treating (76.0%), and Education Instruction & Library (69.8%).
| Occupation | Male | Female |
| Management | 2,854 (65.1%) | 1,532 (34.9%) |
| Business & Financial | 454 (44.9%) | 557 (55.1%) |
| Computers, Engineering & Science | 1,092 (71.2%) | 441 (28.8%) |
| Computers & Mathematics | 511 (79.5%) | 132 (20.5%) |
| Architecture & Engineering | 375 (83.2%) | 76 (16.9%) |
| Life, Physical & Social Science | 206 (46.9%) | 233 (53.1%) |
| Community & Social Service | 2,271 (34.3%) | 4,359 (65.7%) |
| Education, Arts & Media | 454 (39.7%) | 689 (60.3%) |
| Legal Services & Support | 67 (32.4%) | 140 (67.6%) |
| Education Instruction & Library | 1,410 (30.2%) | 3,259 (69.8%) |
| Arts, Media & Entertainment | 340 (55.6%) | 271 (44.4%) |
| Health Diagnosing & Treating | 665 (24.0%) | 2,101 (76.0%) |
| Health Technologists | 357 (22.5%) | 1,233 (77.5%) |
| Total (Category) | 7,336 (44.9%) | 8,990 (55.1%) |
| Total (Overall) | 23,634 (52.8%) | 21,108 (47.2%) |
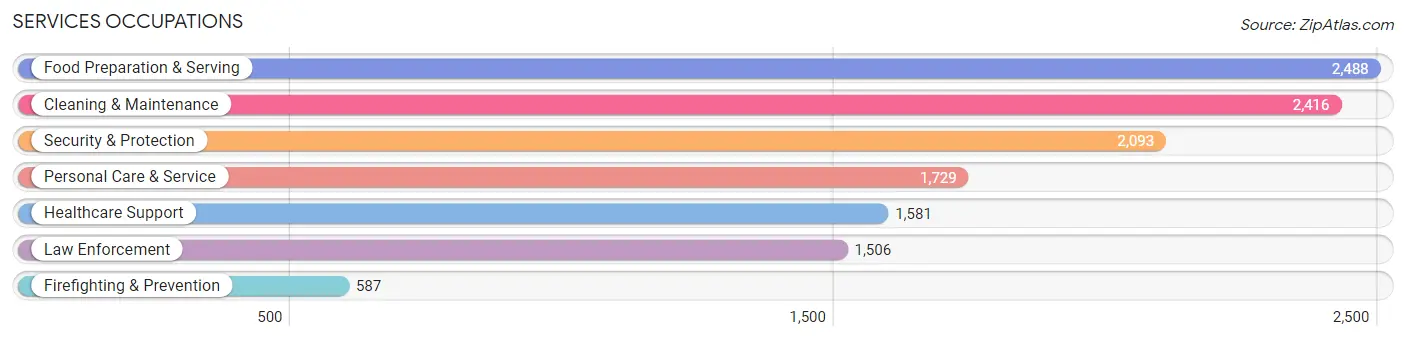
Services Occupations
The most common Services occupations in St. Lawrence County are Food Preparation & Serving (2,488 | 5.6%), Cleaning & Maintenance (2,416 | 5.4%), Security & Protection (2,093 | 4.7%), Personal Care & Service (1,729 | 3.9%), and Healthcare Support (1,581 | 3.5%).
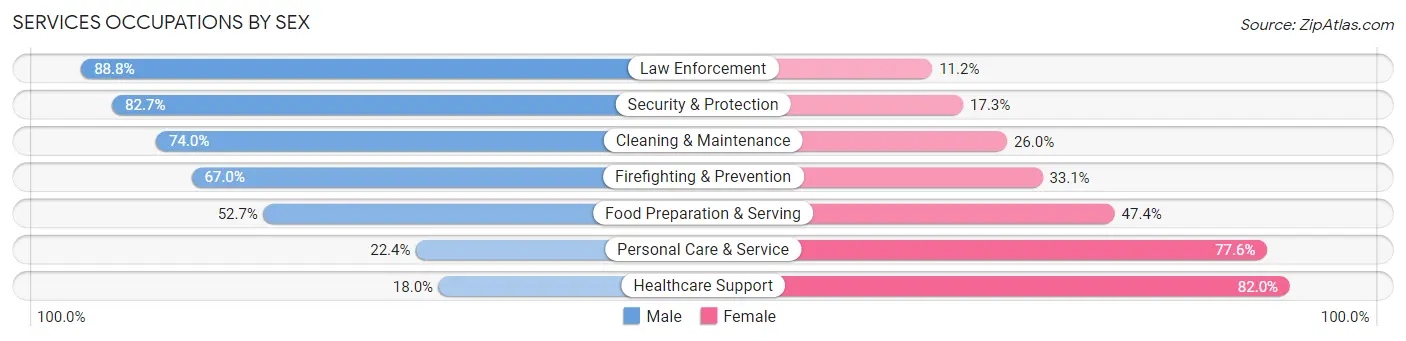
Services Occupations by Sex
Within the Services occupations in St. Lawrence County, the most male-oriented occupations are Law Enforcement (88.8%), Security & Protection (82.7%), and Cleaning & Maintenance (74.0%), while the most female-oriented occupations are Healthcare Support (82.0%), Personal Care & Service (77.6%), and Food Preparation & Serving (47.3%).
| Occupation | Male | Female |
| Healthcare Support | 284 (18.0%) | 1,297 (82.0%) |
| Security & Protection | 1,730 (82.7%) | 363 (17.3%) |
| Firefighting & Prevention | 393 (66.9%) | 194 (33.1%) |
| Law Enforcement | 1,337 (88.8%) | 169 (11.2%) |
| Food Preparation & Serving | 1,310 (52.6%) | 1,178 (47.3%) |
| Cleaning & Maintenance | 1,787 (74.0%) | 629 (26.0%) |
| Personal Care & Service | 388 (22.4%) | 1,341 (77.6%) |
| Total (Category) | 5,499 (53.3%) | 4,808 (46.7%) |
| Total (Overall) | 23,634 (52.8%) | 21,108 (47.2%) |
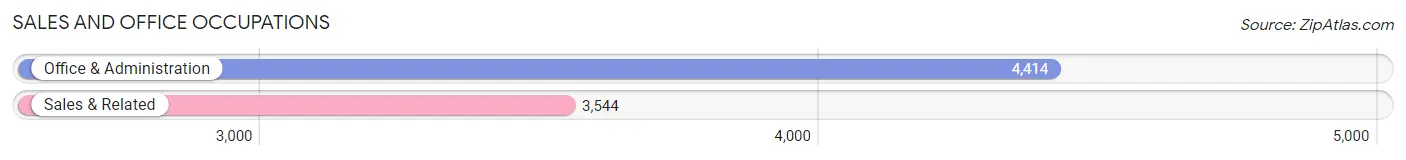
Sales and Office Occupations
The most common Sales and Office occupations in St. Lawrence County are Office & Administration (4,414 | 9.9%), and Sales & Related (3,544 | 7.9%).
Sales and Office Occupations by Sex
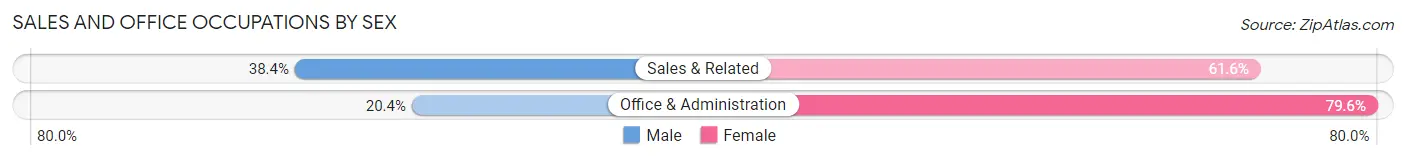
| Occupation | Male | Female |
| Sales & Related | 1,362 (38.4%) | 2,182 (61.6%) |
| Office & Administration | 902 (20.4%) | 3,512 (79.6%) |
| Total (Category) | 2,264 (28.4%) | 5,694 (71.6%) |
| Total (Overall) | 23,634 (52.8%) | 21,108 (47.2%) |
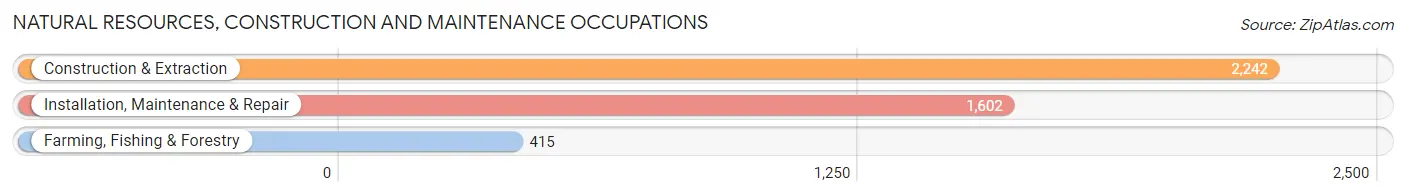
Natural Resources, Construction and Maintenance Occupations
The most common Natural Resources, Construction and Maintenance occupations in St. Lawrence County are Construction & Extraction (2,242 | 5.0%), Installation, Maintenance & Repair (1,602 | 3.6%), and Farming, Fishing & Forestry (415 | 0.9%).
Natural Resources, Construction and Maintenance Occupations by Sex
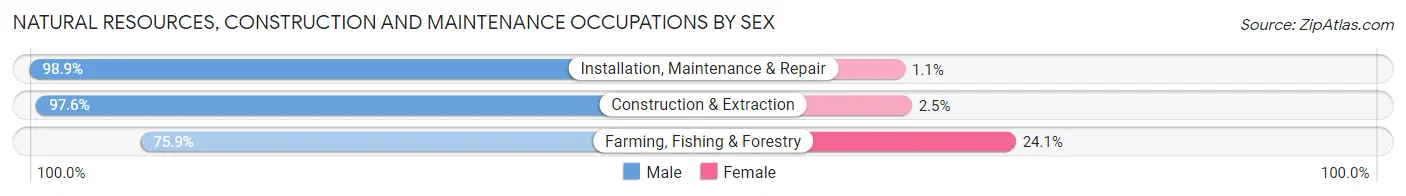
| Occupation | Male | Female |
| Farming, Fishing & Forestry | 315 (75.9%) | 100 (24.1%) |
| Construction & Extraction | 2,187 (97.6%) | 55 (2.5%) |
| Installation, Maintenance & Repair | 1,585 (98.9%) | 17 (1.1%) |
| Total (Category) | 4,087 (96.0%) | 172 (4.0%) |
| Total (Overall) | 23,634 (52.8%) | 21,108 (47.2%) |
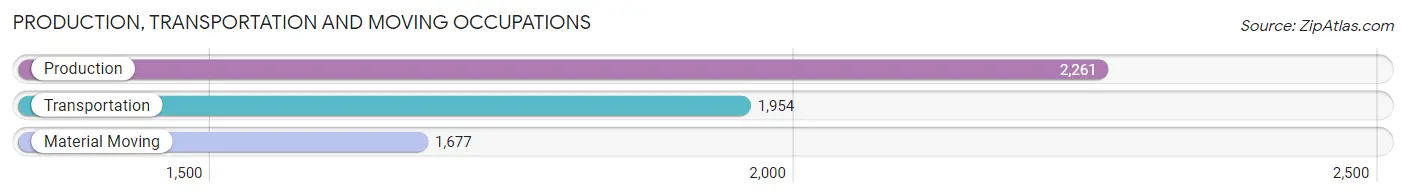
Production, Transportation and Moving Occupations
The most common Production, Transportation and Moving occupations in St. Lawrence County are Production (2,261 | 5.1%), Transportation (1,954 | 4.4%), and Material Moving (1,677 | 3.7%).
Production, Transportation and Moving Occupations by Sex
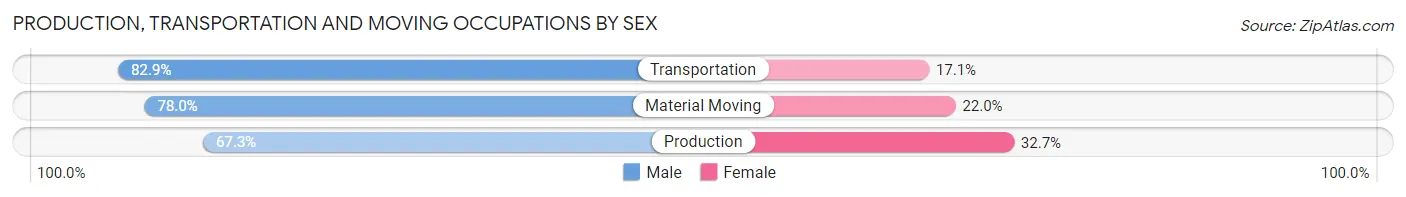
| Occupation | Male | Female |
| Production | 1,521 (67.3%) | 740 (32.7%) |
| Transportation | 1,619 (82.9%) | 335 (17.1%) |
| Material Moving | 1,308 (78.0%) | 369 (22.0%) |
| Total (Category) | 4,448 (75.5%) | 1,444 (24.5%) |
| Total (Overall) | 23,634 (52.8%) | 21,108 (47.2%) |
Employment Industries by Sex in St. Lawrence County
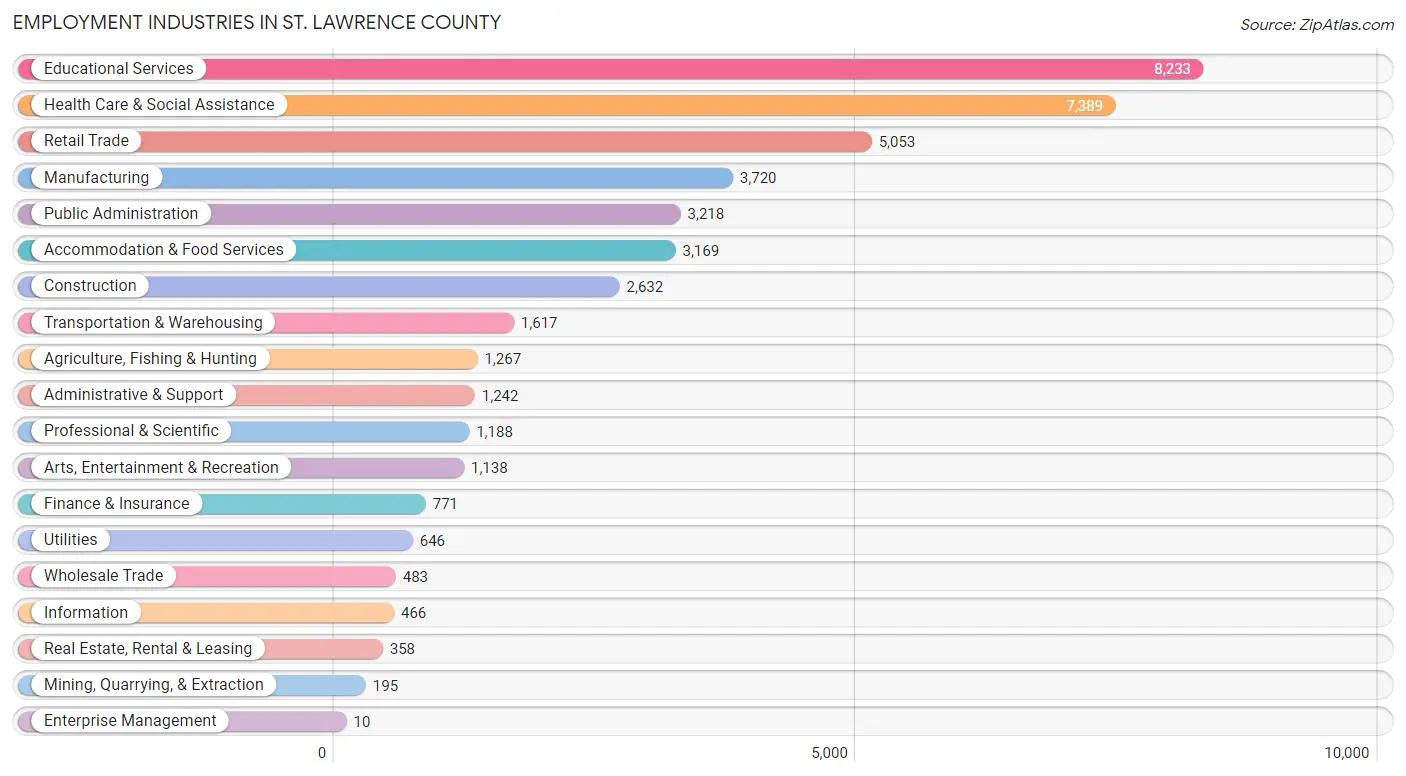
Employment Industries in St. Lawrence County
The major employment industries in St. Lawrence County include Educational Services (8,233 | 18.4%), Health Care & Social Assistance (7,389 | 16.5%), Retail Trade (5,053 | 11.3%), Manufacturing (3,720 | 8.3%), and Public Administration (3,218 | 7.2%).
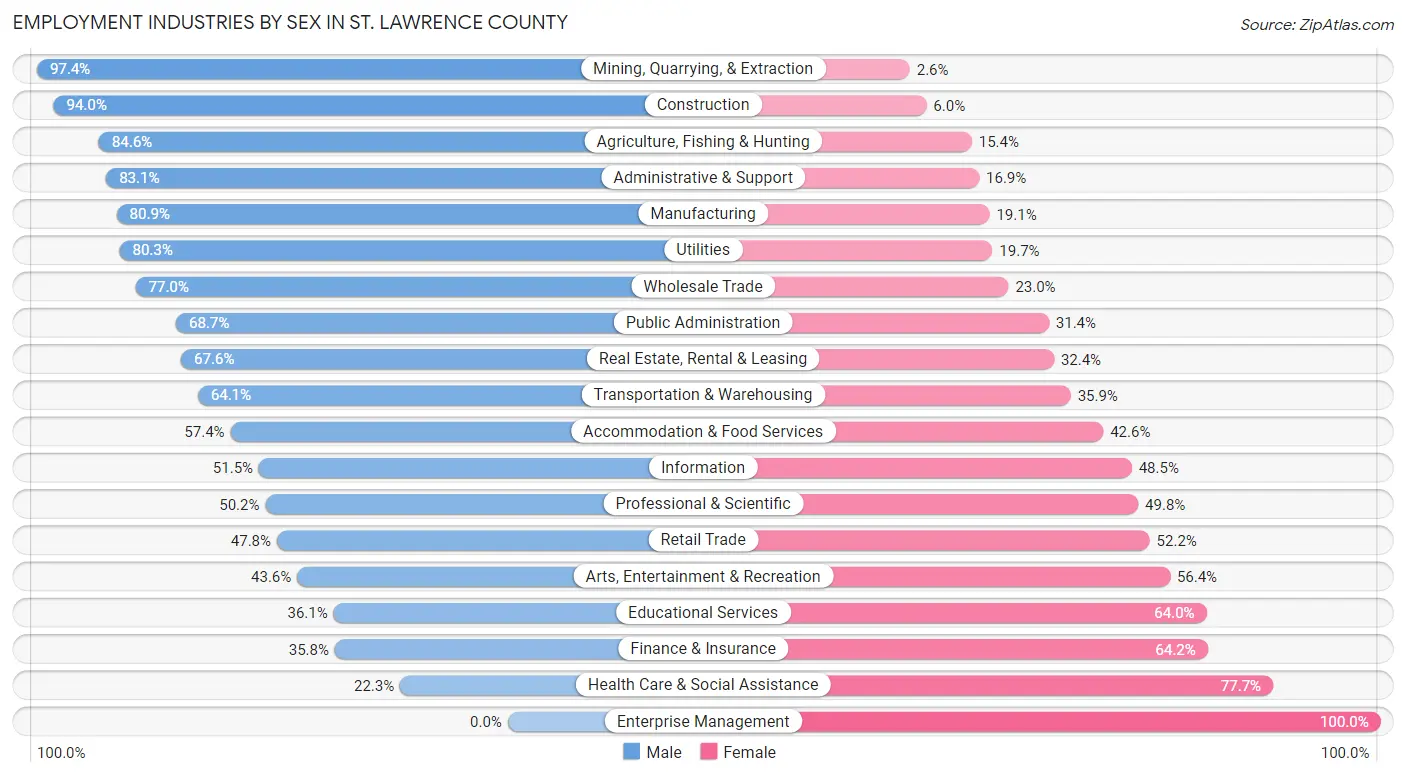
Employment Industries by Sex in St. Lawrence County
The St. Lawrence County industries that see more men than women are Mining, Quarrying, & Extraction (97.4%), Construction (94.0%), and Agriculture, Fishing & Hunting (84.6%), whereas the industries that tend to have a higher number of women are Enterprise Management (100.0%), Health Care & Social Assistance (77.7%), and Finance & Insurance (64.2%).
| Industry | Male | Female |
| Agriculture, Fishing & Hunting | 1,072 (84.6%) | 195 (15.4%) |
| Mining, Quarrying, & Extraction | 190 (97.4%) | 5 (2.6%) |
| Construction | 2,474 (94.0%) | 158 (6.0%) |
| Manufacturing | 3,011 (80.9%) | 709 (19.1%) |
| Wholesale Trade | 372 (77.0%) | 111 (23.0%) |
| Retail Trade | 2,415 (47.8%) | 2,638 (52.2%) |
| Transportation & Warehousing | 1,037 (64.1%) | 580 (35.9%) |
| Utilities | 519 (80.3%) | 127 (19.7%) |
| Information | 240 (51.5%) | 226 (48.5%) |
| Finance & Insurance | 276 (35.8%) | 495 (64.2%) |
| Real Estate, Rental & Leasing | 242 (67.6%) | 116 (32.4%) |
| Professional & Scientific | 596 (50.2%) | 592 (49.8%) |
| Enterprise Management | 0 (0.0%) | 10 (100.0%) |
| Administrative & Support | 1,032 (83.1%) | 210 (16.9%) |
| Educational Services | 2,968 (36.0%) | 5,265 (63.9%) |
| Health Care & Social Assistance | 1,647 (22.3%) | 5,742 (77.7%) |
| Arts, Entertainment & Recreation | 496 (43.6%) | 642 (56.4%) |
| Accommodation & Food Services | 1,819 (57.4%) | 1,350 (42.6%) |
| Public Administration | 2,209 (68.6%) | 1,009 (31.4%) |
| Total | 23,634 (52.8%) | 21,108 (47.2%) |
Education in St. Lawrence County
School Enrollment in St. Lawrence County
The most common levels of schooling among the 28,531 students in St. Lawrence County are college / undergraduate (10,727 | 37.6%), elementary school (4,881 | 17.1%), and high school (4,701 | 16.5%).
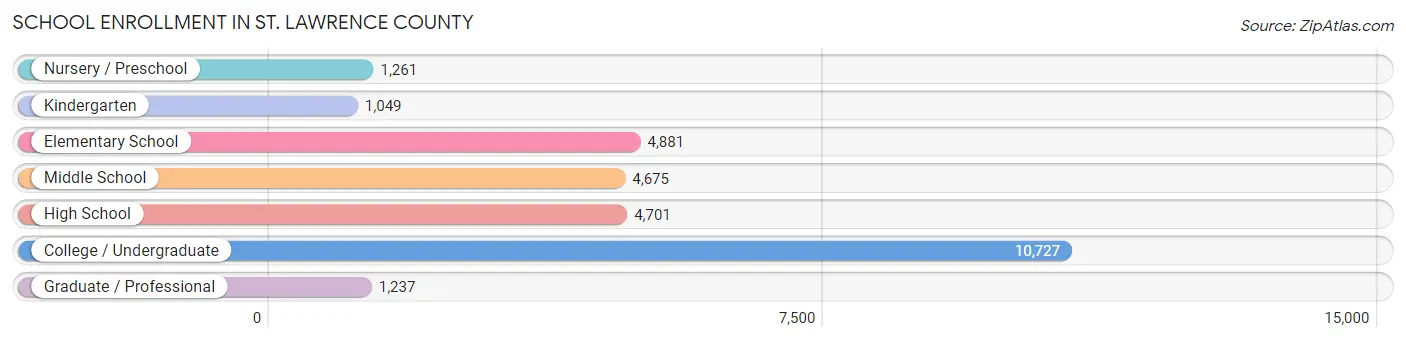
| School Level | # Students | % Students |
| Nursery / Preschool | 1,261 | 4.4% |
| Kindergarten | 1,049 | 3.7% |
| Elementary School | 4,881 | 17.1% |
| Middle School | 4,675 | 16.4% |
| High School | 4,701 | 16.5% |
| College / Undergraduate | 10,727 | 37.6% |
| Graduate / Professional | 1,237 | 4.3% |
| Total | 28,531 | 100.0% |
School Enrollment by Age by Funding Source in St. Lawrence County
Out of a total of 28,531 students who are enrolled in schools in St. Lawrence County, 8,360 (29.3%) attend a private institution, while the remaining 20,171 (70.7%) are enrolled in public schools. The age group of 20 to 24 year olds has the highest likelihood of being enrolled in private schools, with 3,122 (57.9% in the age bracket) enrolled. Conversely, the age group of 15 to 17 year olds has the lowest likelihood of being enrolled in a private school, with 3,181 (91.9% in the age bracket) attending a public institution.
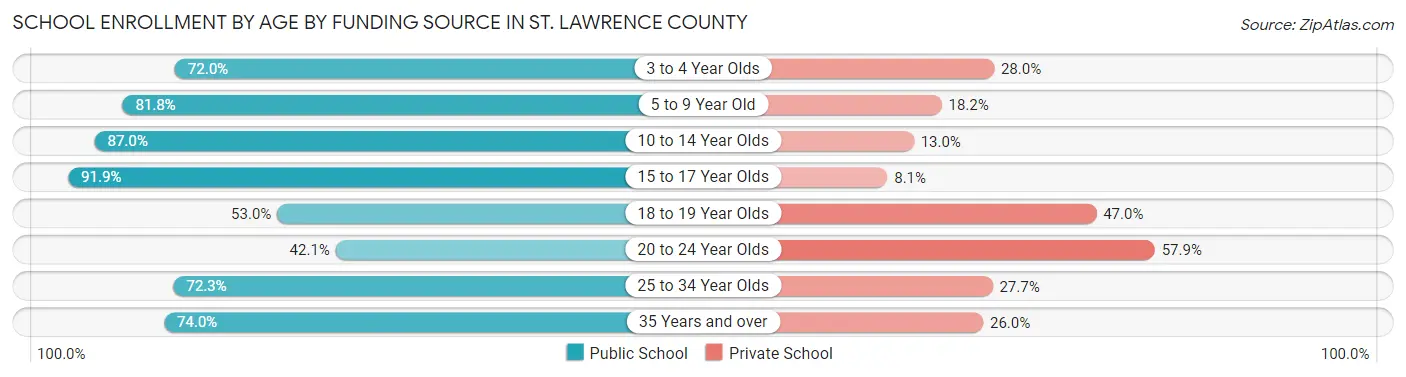
| Age Bracket | Public School | Private School |
| 3 to 4 Year Olds | 733 (72.0%) | 285 (28.0%) |
| 5 to 9 Year Old | 4,656 (81.8%) | 1,038 (18.2%) |
| 10 to 14 Year Olds | 5,130 (87.0%) | 769 (13.0%) |
| 15 to 17 Year Olds | 3,181 (91.9%) | 281 (8.1%) |
| 18 to 19 Year Olds | 2,565 (53.0%) | 2,278 (47.0%) |
| 20 to 24 Year Olds | 2,266 (42.1%) | 3,122 (57.9%) |
| 25 to 34 Year Olds | 897 (72.3%) | 344 (27.7%) |
| 35 Years and over | 730 (74.0%) | 256 (26.0%) |
| Total | 20,171 (70.7%) | 8,360 (29.3%) |
Educational Attainment by Field of Study in St. Lawrence County
Education (3,573 | 19.3%), business (2,014 | 10.9%), social sciences (1,714 | 9.3%), science & technology (1,645 | 8.9%), and psychology (1,234 | 6.7%) are the most common fields of study among 18,489 individuals in St. Lawrence County who have obtained a bachelor's degree or higher.
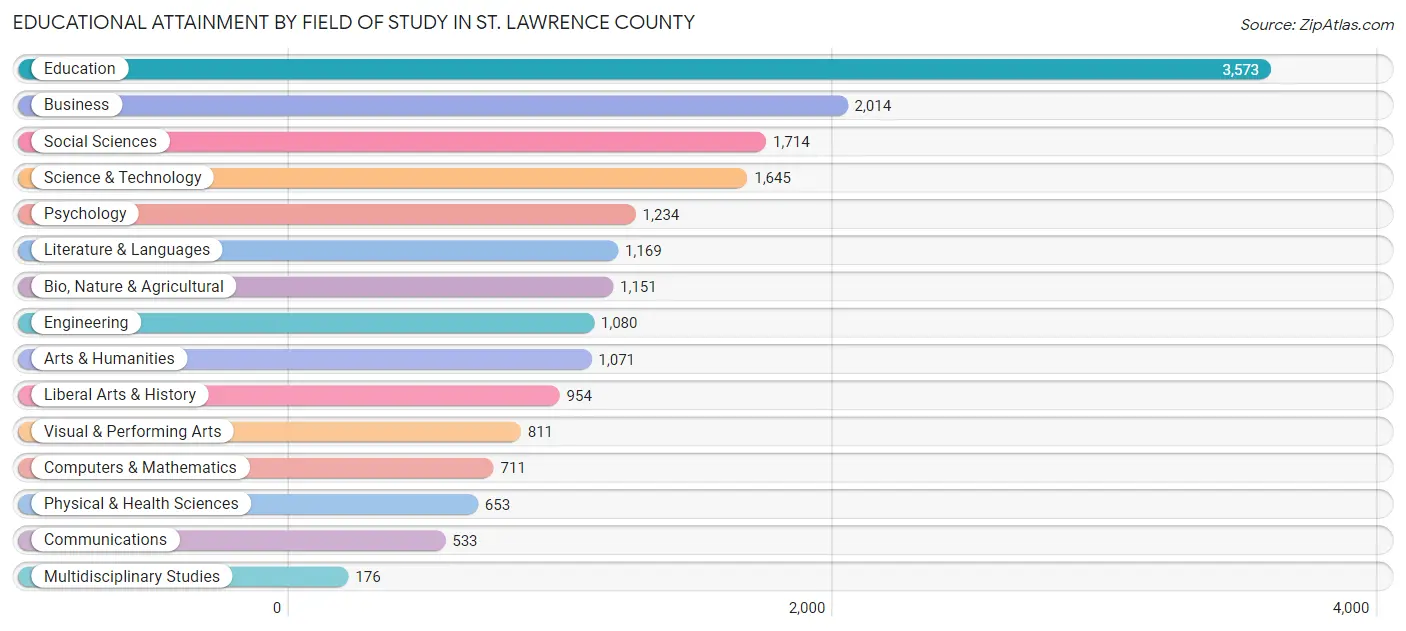
| Field of Study | # Graduates | % Graduates |
| Computers & Mathematics | 711 | 3.8% |
| Bio, Nature & Agricultural | 1,151 | 6.2% |
| Physical & Health Sciences | 653 | 3.5% |
| Psychology | 1,234 | 6.7% |
| Social Sciences | 1,714 | 9.3% |
| Engineering | 1,080 | 5.8% |
| Multidisciplinary Studies | 176 | 0.9% |
| Science & Technology | 1,645 | 8.9% |
| Business | 2,014 | 10.9% |
| Education | 3,573 | 19.3% |
| Literature & Languages | 1,169 | 6.3% |
| Liberal Arts & History | 954 | 5.2% |
| Visual & Performing Arts | 811 | 4.4% |
| Communications | 533 | 2.9% |
| Arts & Humanities | 1,071 | 5.8% |
| Total | 18,489 | 100.0% |
Transportation & Commute in St. Lawrence County
Vehicle Availability by Sex in St. Lawrence County
The most prevalent vehicle ownership categories in St. Lawrence County are males with 2 vehicles (9,984, accounting for 45.2%) and females with 2 vehicles (8,464, making up 51.8%).
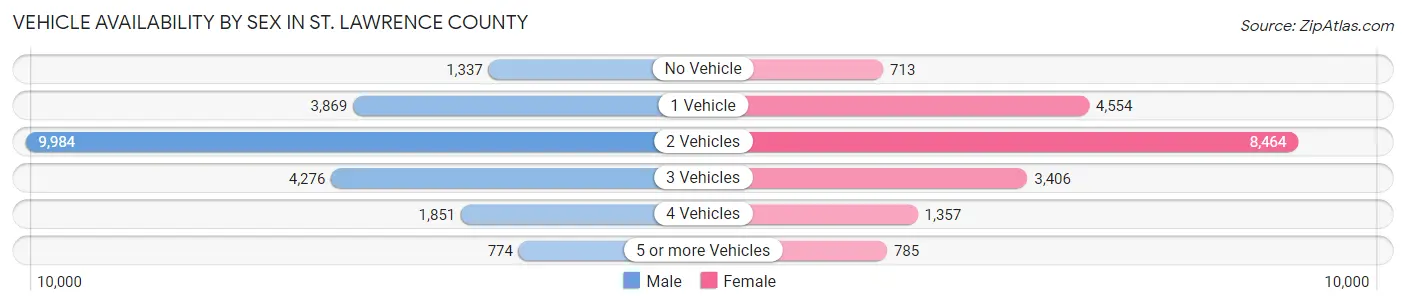
| Vehicles Available | Male | Female |
| No Vehicle | 1,337 (6.0%) | 713 (3.7%) |
| 1 Vehicle | 3,869 (17.5%) | 4,554 (23.6%) |
| 2 Vehicles | 9,984 (45.2%) | 8,464 (43.9%) |
| 3 Vehicles | 4,276 (19.4%) | 3,406 (17.7%) |
| 4 Vehicles | 1,851 (8.4%) | 1,357 (7.0%) |
| 5 or more Vehicles | 774 (3.5%) | 785 (4.1%) |
| Total | 22,091 (100.0%) | 19,279 (100.0%) |
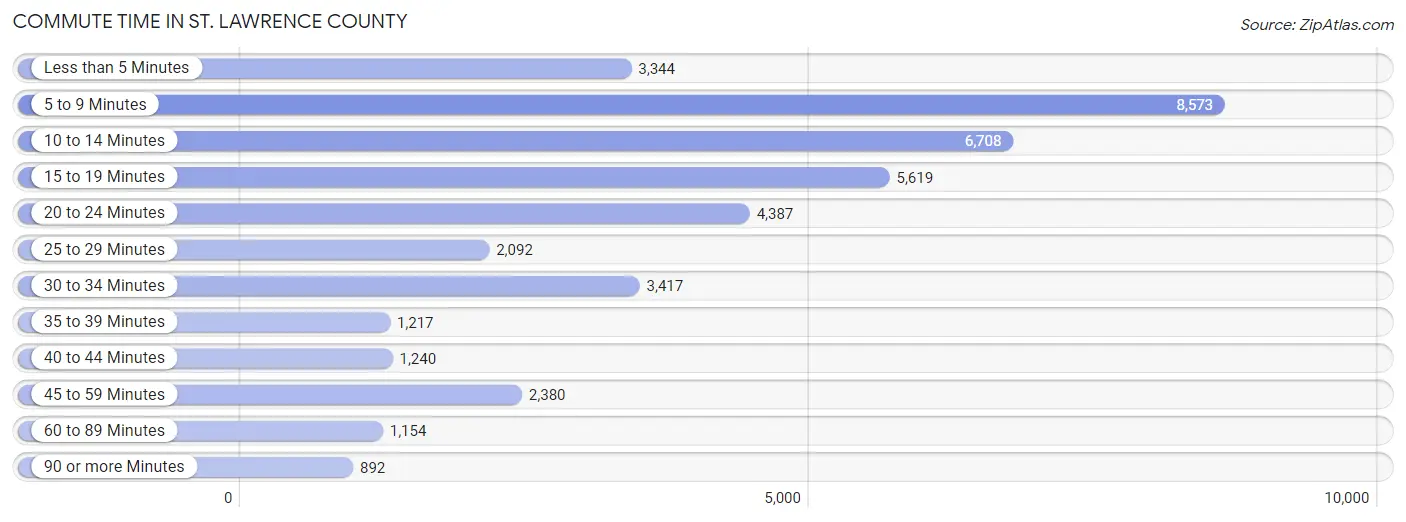
Commute Time in St. Lawrence County
The most frequently occuring commute durations in St. Lawrence County are 5 to 9 minutes (8,573 commuters, 20.9%), 10 to 14 minutes (6,708 commuters, 16.4%), and 15 to 19 minutes (5,619 commuters, 13.7%).
| Commute Time | # Commuters | % Commuters |
| Less than 5 Minutes | 3,344 | 8.2% |
| 5 to 9 Minutes | 8,573 | 20.9% |
| 10 to 14 Minutes | 6,708 | 16.4% |
| 15 to 19 Minutes | 5,619 | 13.7% |
| 20 to 24 Minutes | 4,387 | 10.7% |
| 25 to 29 Minutes | 2,092 | 5.1% |
| 30 to 34 Minutes | 3,417 | 8.3% |
| 35 to 39 Minutes | 1,217 | 3.0% |
| 40 to 44 Minutes | 1,240 | 3.0% |
| 45 to 59 Minutes | 2,380 | 5.8% |
| 60 to 89 Minutes | 1,154 | 2.8% |
| 90 or more Minutes | 892 | 2.2% |
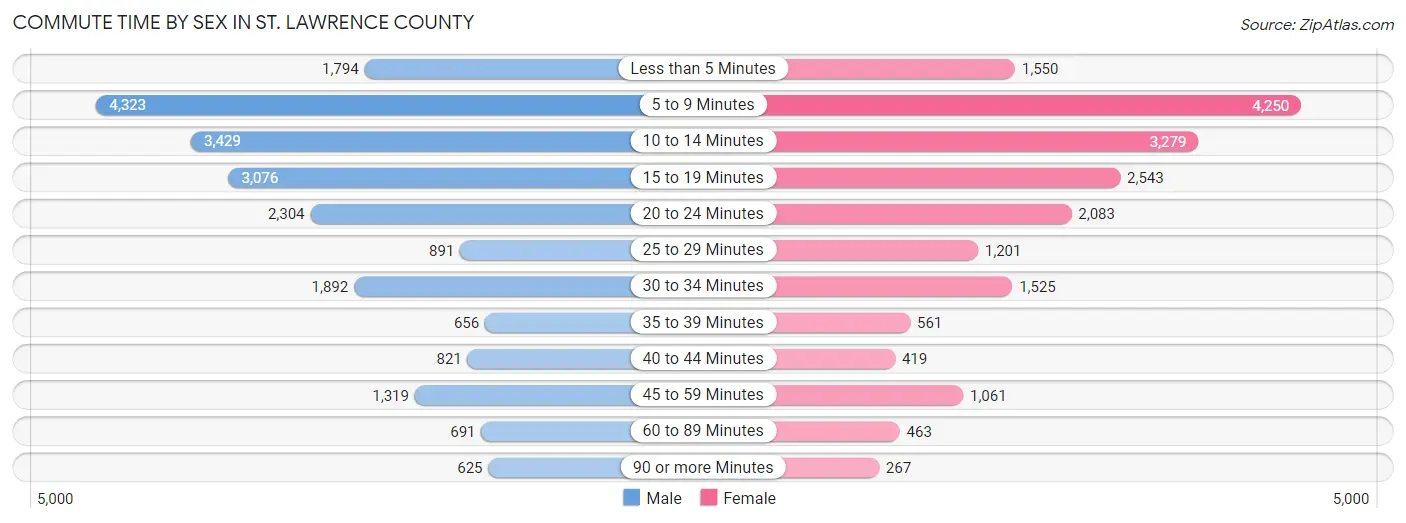
Commute Time by Sex in St. Lawrence County
The most common commute times in St. Lawrence County are 5 to 9 minutes (4,323 commuters, 19.8%) for males and 5 to 9 minutes (4,250 commuters, 22.1%) for females.
| Commute Time | Male | Female |
| Less than 5 Minutes | 1,794 (8.2%) | 1,550 (8.1%) |
| 5 to 9 Minutes | 4,323 (19.8%) | 4,250 (22.1%) |
| 10 to 14 Minutes | 3,429 (15.7%) | 3,279 (17.1%) |
| 15 to 19 Minutes | 3,076 (14.1%) | 2,543 (13.2%) |
| 20 to 24 Minutes | 2,304 (10.6%) | 2,083 (10.8%) |
| 25 to 29 Minutes | 891 (4.1%) | 1,201 (6.2%) |
| 30 to 34 Minutes | 1,892 (8.7%) | 1,525 (7.9%) |
| 35 to 39 Minutes | 656 (3.0%) | 561 (2.9%) |
| 40 to 44 Minutes | 821 (3.8%) | 419 (2.2%) |
| 45 to 59 Minutes | 1,319 (6.0%) | 1,061 (5.5%) |
| 60 to 89 Minutes | 691 (3.2%) | 463 (2.4%) |
| 90 or more Minutes | 625 (2.9%) | 267 (1.4%) |
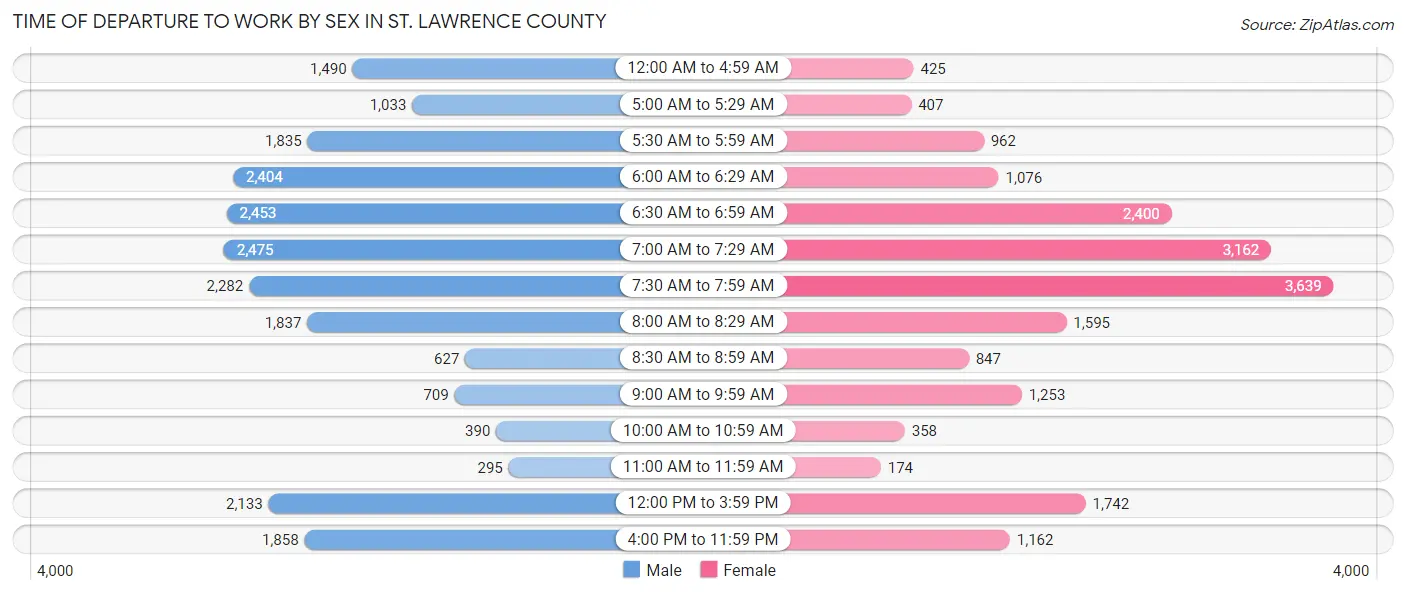
Time of Departure to Work by Sex in St. Lawrence County
The most frequent times of departure to work in St. Lawrence County are 7:00 AM to 7:29 AM (2,475, 11.3%) for males and 7:30 AM to 7:59 AM (3,639, 19.0%) for females.
| Time of Departure | Male | Female |
| 12:00 AM to 4:59 AM | 1,490 (6.8%) | 425 (2.2%) |
| 5:00 AM to 5:29 AM | 1,033 (4.7%) | 407 (2.1%) |
| 5:30 AM to 5:59 AM | 1,835 (8.4%) | 962 (5.0%) |
| 6:00 AM to 6:29 AM | 2,404 (11.0%) | 1,076 (5.6%) |
| 6:30 AM to 6:59 AM | 2,453 (11.2%) | 2,400 (12.5%) |
| 7:00 AM to 7:29 AM | 2,475 (11.3%) | 3,162 (16.5%) |
| 7:30 AM to 7:59 AM | 2,282 (10.5%) | 3,639 (19.0%) |
| 8:00 AM to 8:29 AM | 1,837 (8.4%) | 1,595 (8.3%) |
| 8:30 AM to 8:59 AM | 627 (2.9%) | 847 (4.4%) |
| 9:00 AM to 9:59 AM | 709 (3.3%) | 1,253 (6.5%) |
| 10:00 AM to 10:59 AM | 390 (1.8%) | 358 (1.9%) |
| 11:00 AM to 11:59 AM | 295 (1.3%) | 174 (0.9%) |
| 12:00 PM to 3:59 PM | 2,133 (9.8%) | 1,742 (9.1%) |
| 4:00 PM to 11:59 PM | 1,858 (8.5%) | 1,162 (6.0%) |
| Total | 21,821 (100.0%) | 19,202 (100.0%) |
Housing Occupancy in St. Lawrence County
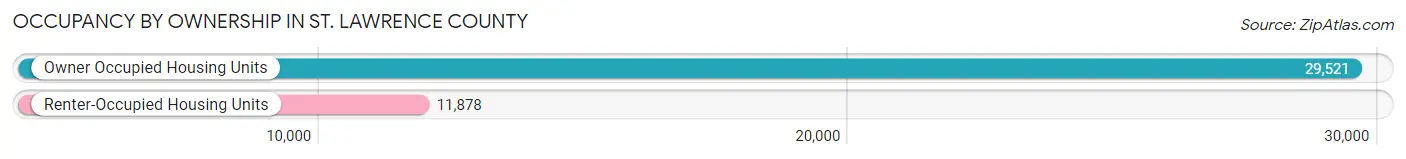
Occupancy by Ownership in St. Lawrence County
Of the total 41,399 dwellings in St. Lawrence County, owner-occupied units account for 29,521 (71.3%), while renter-occupied units make up 11,878 (28.7%).
| Occupancy | # Housing Units | % Housing Units |
| Owner Occupied Housing Units | 29,521 | 71.3% |
| Renter-Occupied Housing Units | 11,878 | 28.7% |
| Total Occupied Housing Units | 41,399 | 100.0% |
Occupancy by Household Size in St. Lawrence County
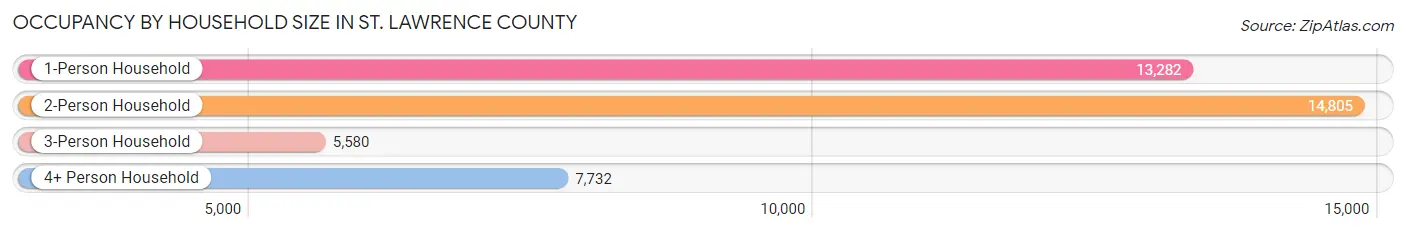
| Household Size | # Housing Units | % Housing Units |
| 1-Person Household | 13,282 | 32.1% |
| 2-Person Household | 14,805 | 35.8% |
| 3-Person Household | 5,580 | 13.5% |
| 4+ Person Household | 7,732 | 18.7% |
| Total Housing Units | 41,399 | 100.0% |
Occupancy by Ownership by Household Size in St. Lawrence County
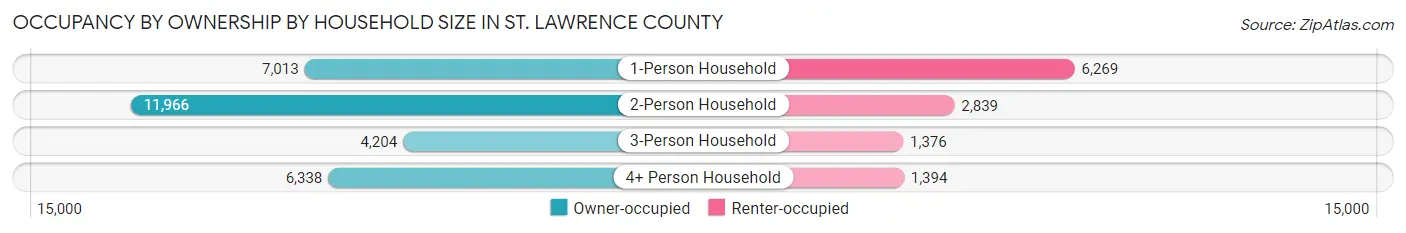
| Household Size | Owner-occupied | Renter-occupied |
| 1-Person Household | 7,013 (52.8%) | 6,269 (47.2%) |
| 2-Person Household | 11,966 (80.8%) | 2,839 (19.2%) |
| 3-Person Household | 4,204 (75.3%) | 1,376 (24.7%) |
| 4+ Person Household | 6,338 (82.0%) | 1,394 (18.0%) |
| Total Housing Units | 29,521 (71.3%) | 11,878 (28.7%) |
Occupancy by Educational Attainment in St. Lawrence County
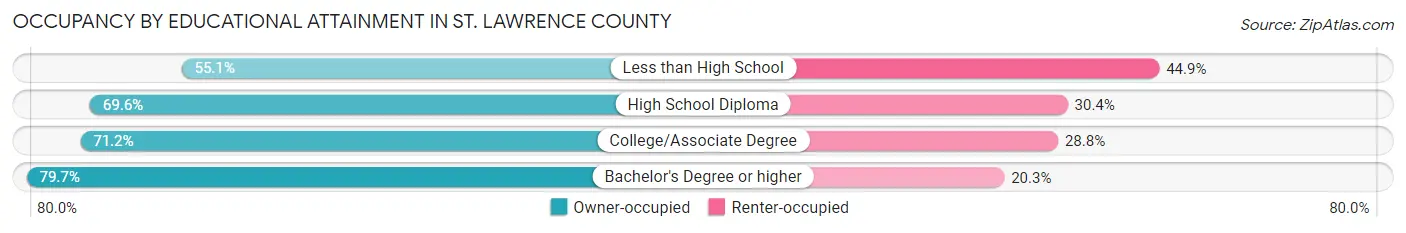
| Household Size | Owner-occupied | Renter-occupied |
| Less than High School | 2,059 (55.1%) | 1,678 (44.9%) |
| High School Diploma | 9,674 (69.6%) | 4,218 (30.4%) |
| College/Associate Degree | 9,629 (71.2%) | 3,902 (28.8%) |
| Bachelor's Degree or higher | 8,159 (79.7%) | 2,080 (20.3%) |
Occupancy by Age of Householder in St. Lawrence County
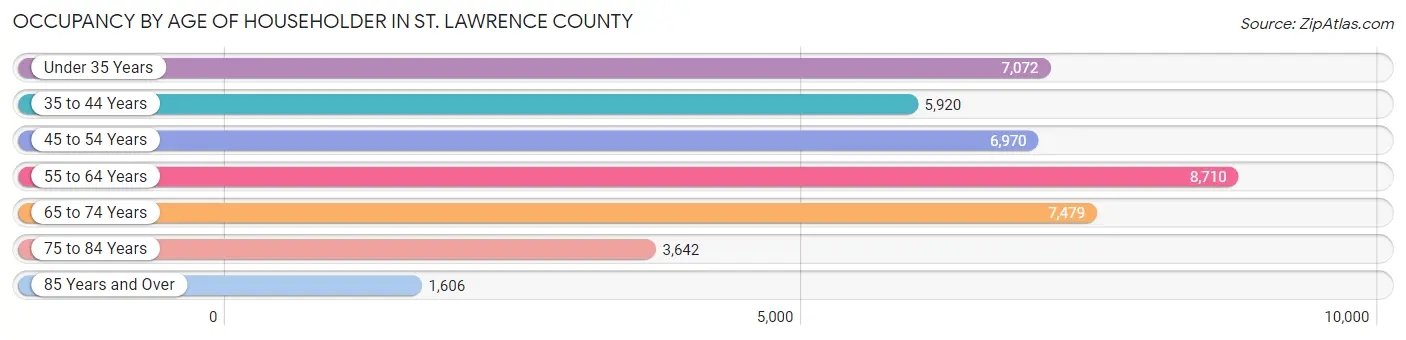
| Age Bracket | # Households | % Households |
| Under 35 Years | 7,072 | 17.1% |
| 35 to 44 Years | 5,920 | 14.3% |
| 45 to 54 Years | 6,970 | 16.8% |
| 55 to 64 Years | 8,710 | 21.0% |
| 65 to 74 Years | 7,479 | 18.1% |
| 75 to 84 Years | 3,642 | 8.8% |
| 85 Years and Over | 1,606 | 3.9% |
| Total | 41,399 | 100.0% |
Housing Finances in St. Lawrence County
Median Income by Occupancy in St. Lawrence County
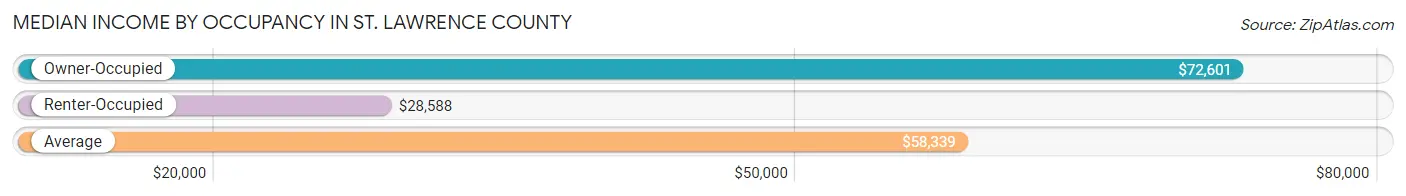
| Occupancy Type | # Households | Median Income |
| Owner-Occupied | 29,521 (71.3%) | $72,601 |
| Renter-Occupied | 11,878 (28.7%) | $28,588 |
| Average | 41,399 (100.0%) | $58,339 |
Occupancy by Householder Income Bracket in St. Lawrence County
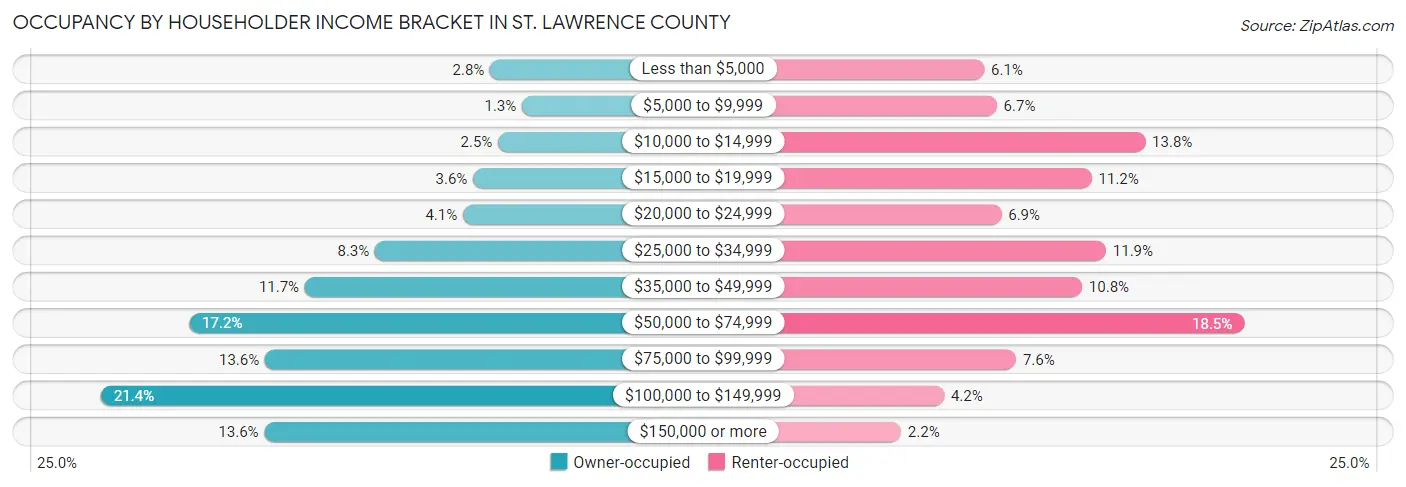
| Income Bracket | Owner-occupied | Renter-occupied |
| Less than $5,000 | 835 (2.8%) | 727 (6.1%) |
| $5,000 to $9,999 | 388 (1.3%) | 798 (6.7%) |
| $10,000 to $14,999 | 724 (2.5%) | 1,638 (13.8%) |
| $15,000 to $19,999 | 1,075 (3.6%) | 1,335 (11.2%) |
| $20,000 to $24,999 | 1,217 (4.1%) | 824 (6.9%) |
| $25,000 to $34,999 | 2,453 (8.3%) | 1,416 (11.9%) |
| $35,000 to $49,999 | 3,440 (11.7%) | 1,280 (10.8%) |
| $50,000 to $74,999 | 5,070 (17.2%) | 2,197 (18.5%) |
| $75,000 to $99,999 | 4,001 (13.6%) | 907 (7.6%) |
| $100,000 to $149,999 | 6,309 (21.4%) | 500 (4.2%) |
| $150,000 or more | 4,009 (13.6%) | 256 (2.2%) |
| Total | 29,521 (100.0%) | 11,878 (100.0%) |
Monthly Housing Cost Tiers in St. Lawrence County
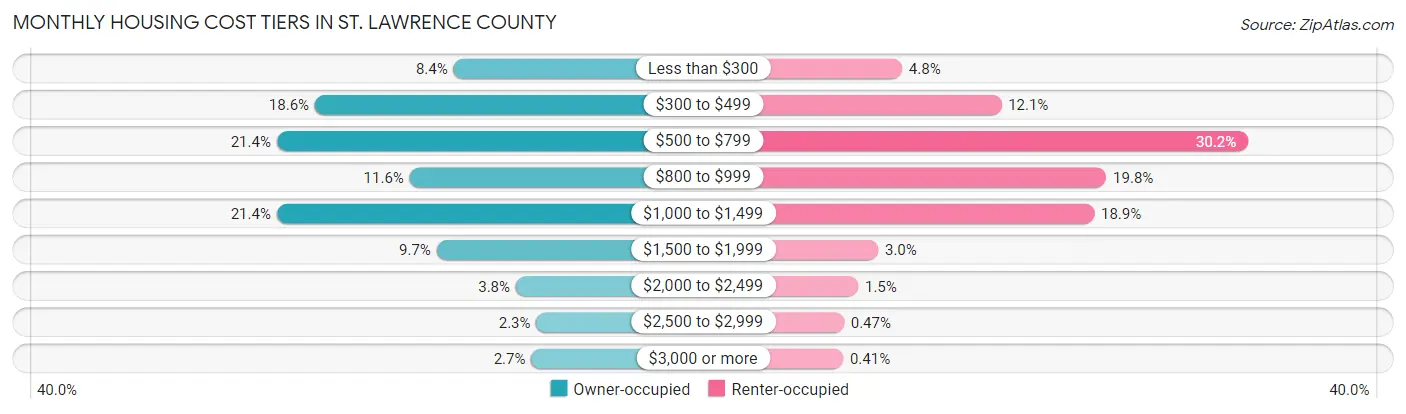
| Monthly Cost | Owner-occupied | Renter-occupied |
| Less than $300 | 2,484 (8.4%) | 564 (4.8%) |
| $300 to $499 | 5,498 (18.6%) | 1,432 (12.1%) |
| $500 to $799 | 6,325 (21.4%) | 3,592 (30.2%) |
| $800 to $999 | 3,435 (11.6%) | 2,351 (19.8%) |
| $1,000 to $1,499 | 6,327 (21.4%) | 2,245 (18.9%) |
| $1,500 to $1,999 | 2,848 (9.7%) | 355 (3.0%) |
| $2,000 to $2,499 | 1,129 (3.8%) | 180 (1.5%) |
| $2,500 to $2,999 | 683 (2.3%) | 56 (0.5%) |
| $3,000 or more | 792 (2.7%) | 49 (0.4%) |
| Total | 29,521 (100.0%) | 11,878 (100.0%) |
Physical Housing Characteristics in St. Lawrence County
Housing Structures in St. Lawrence County
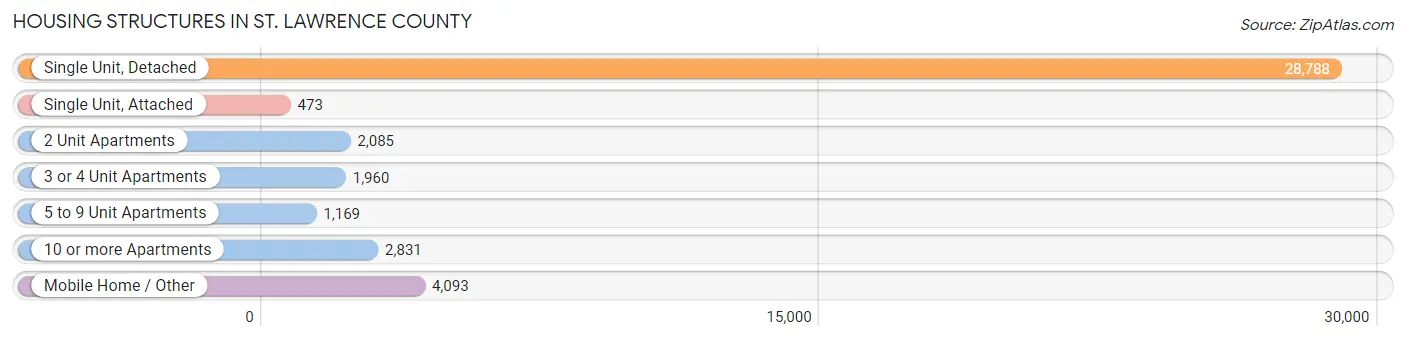
| Structure Type | # Housing Units | % Housing Units |
| Single Unit, Detached | 28,788 | 69.5% |
| Single Unit, Attached | 473 | 1.1% |
| 2 Unit Apartments | 2,085 | 5.0% |
| 3 or 4 Unit Apartments | 1,960 | 4.7% |
| 5 to 9 Unit Apartments | 1,169 | 2.8% |
| 10 or more Apartments | 2,831 | 6.8% |
| Mobile Home / Other | 4,093 | 9.9% |
| Total | 41,399 | 100.0% |
Housing Structures by Occupancy in St. Lawrence County
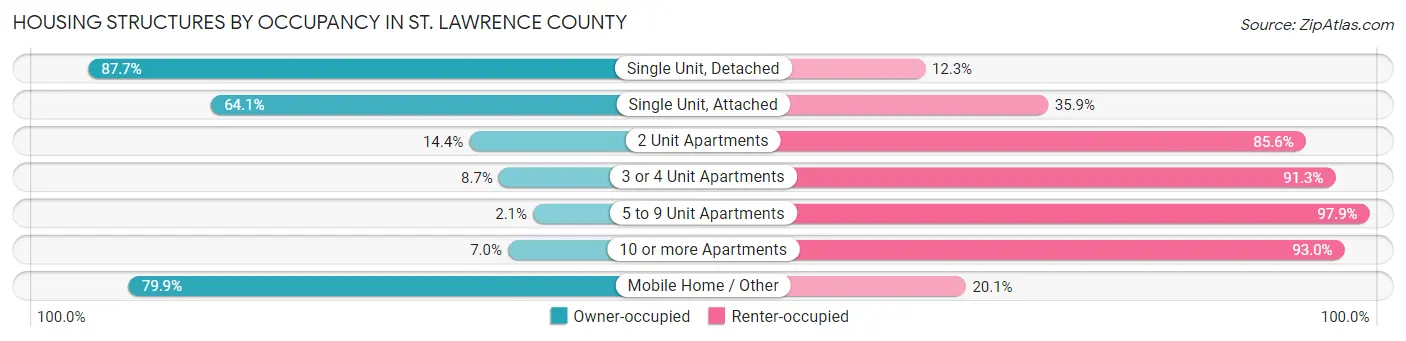
| Structure Type | Owner-occupied | Renter-occupied |
| Single Unit, Detached | 25,253 (87.7%) | 3,535 (12.3%) |
| Single Unit, Attached | 303 (64.1%) | 170 (35.9%) |
| 2 Unit Apartments | 301 (14.4%) | 1,784 (85.6%) |
| 3 or 4 Unit Apartments | 171 (8.7%) | 1,789 (91.3%) |
| 5 to 9 Unit Apartments | 25 (2.1%) | 1,144 (97.9%) |
| 10 or more Apartments | 197 (7.0%) | 2,634 (93.0%) |
| Mobile Home / Other | 3,271 (79.9%) | 822 (20.1%) |
| Total | 29,521 (71.3%) | 11,878 (28.7%) |
Housing Structures by Number of Rooms in St. Lawrence County
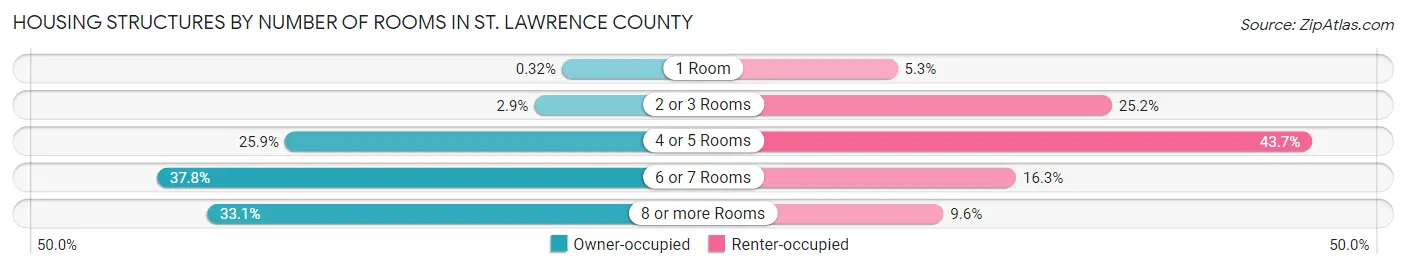
| Number of Rooms | Owner-occupied | Renter-occupied |
| 1 Room | 94 (0.3%) | 633 (5.3%) |
| 2 or 3 Rooms | 846 (2.9%) | 2,987 (25.2%) |
| 4 or 5 Rooms | 7,654 (25.9%) | 5,186 (43.7%) |
| 6 or 7 Rooms | 11,151 (37.8%) | 1,935 (16.3%) |
| 8 or more Rooms | 9,776 (33.1%) | 1,137 (9.6%) |
| Total | 29,521 (100.0%) | 11,878 (100.0%) |
Housing Structure by Heating Type in St. Lawrence County
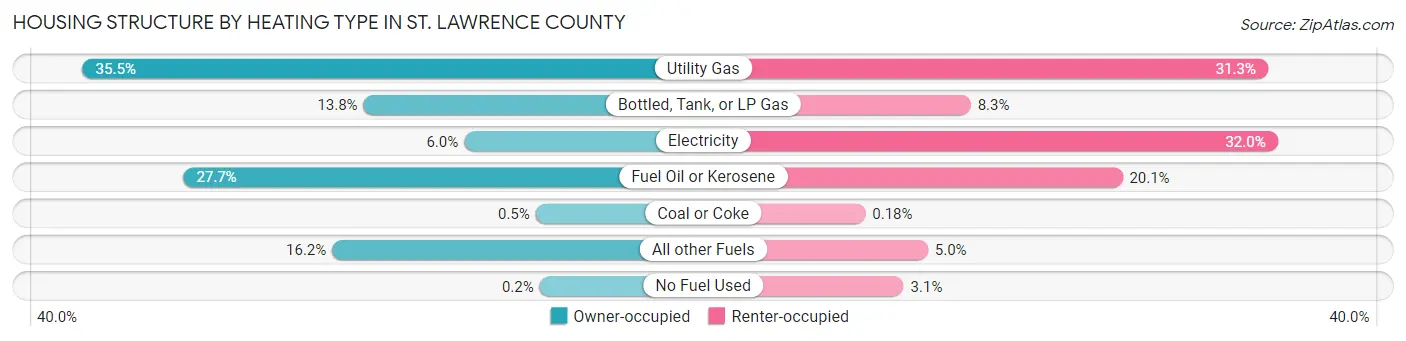
| Heating Type | Owner-occupied | Renter-occupied |
| Utility Gas | 10,482 (35.5%) | 3,716 (31.3%) |
| Bottled, Tank, or LP Gas | 4,078 (13.8%) | 988 (8.3%) |
| Electricity | 1,781 (6.0%) | 3,804 (32.0%) |
| Fuel Oil or Kerosene | 8,182 (27.7%) | 2,381 (20.1%) |
| Coal or Coke | 147 (0.5%) | 21 (0.2%) |
| All other Fuels | 4,792 (16.2%) | 595 (5.0%) |
| No Fuel Used | 59 (0.2%) | 373 (3.1%) |
| Total | 29,521 (100.0%) | 11,878 (100.0%) |
Household Vehicle Usage in St. Lawrence County
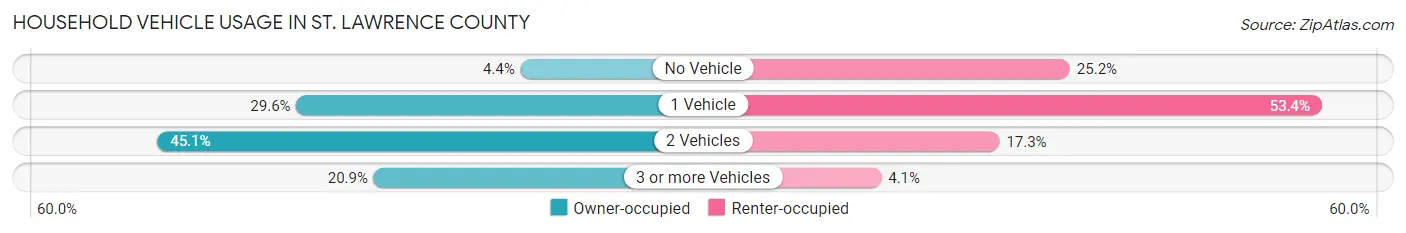
| Vehicles per Household | Owner-occupied | Renter-occupied |
| No Vehicle | 1,312 (4.4%) | 2,993 (25.2%) |
| 1 Vehicle | 8,722 (29.5%) | 6,345 (53.4%) |
| 2 Vehicles | 13,323 (45.1%) | 2,056 (17.3%) |
| 3 or more Vehicles | 6,164 (20.9%) | 484 (4.1%) |
| Total | 29,521 (100.0%) | 11,878 (100.0%) |
Real Estate & Mortgages in St. Lawrence County
Real Estate and Mortgage Overview in St. Lawrence County
| Characteristic | Without Mortgage | With Mortgage |
| Housing Units | 15,115 | 14,406 |
| Median Property Value | $100,600 | $129,600 |
| Median Household Income | $55,246 | $2,775 |
| Monthly Housing Costs | $494 | $791 |
| Real Estate Taxes | $2,178 | $315 |
Property Value by Mortgage Status in St. Lawrence County
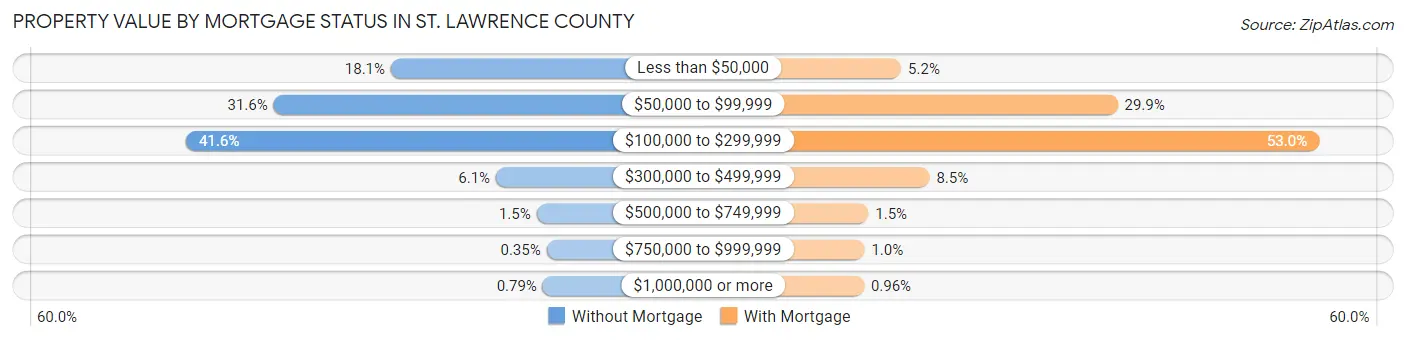
| Property Value | Without Mortgage | With Mortgage |
| Less than $50,000 | 2,742 (18.1%) | 751 (5.2%) |
| $50,000 to $99,999 | 4,769 (31.6%) | 4,313 (29.9%) |
| $100,000 to $299,999 | 6,280 (41.5%) | 7,629 (53.0%) |
| $300,000 to $499,999 | 927 (6.1%) | 1,217 (8.5%) |
| $500,000 to $749,999 | 225 (1.5%) | 210 (1.5%) |
| $750,000 to $999,999 | 53 (0.4%) | 147 (1.0%) |
| $1,000,000 or more | 119 (0.8%) | 139 (1.0%) |
| Total | 15,115 (100.0%) | 14,406 (100.0%) |
Household Income by Mortgage Status in St. Lawrence County
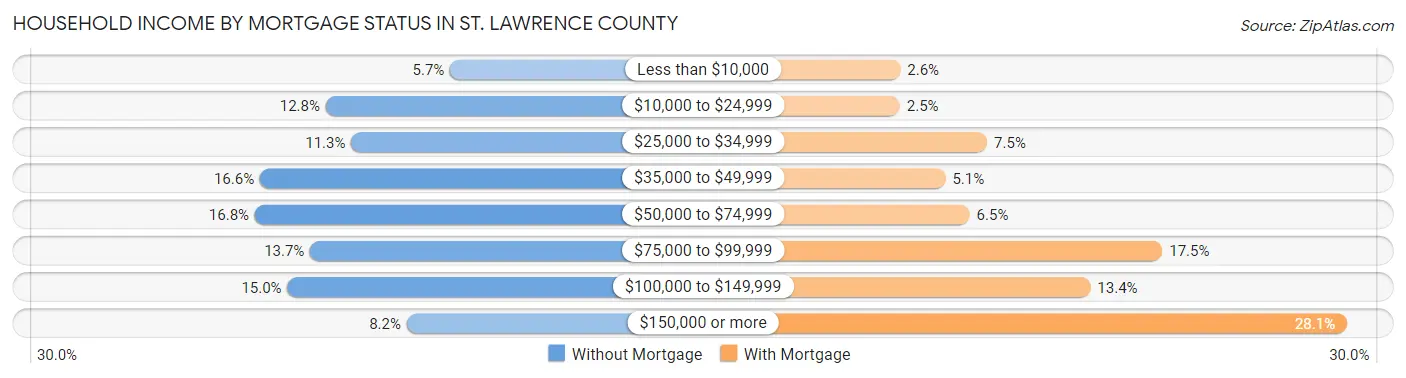
| Household Income | Without Mortgage | With Mortgage |
| Less than $10,000 | 858 (5.7%) | 369 (2.6%) |
| $10,000 to $24,999 | 1,933 (12.8%) | 365 (2.5%) |
| $25,000 to $34,999 | 1,712 (11.3%) | 1,083 (7.5%) |
| $35,000 to $49,999 | 2,501 (16.6%) | 741 (5.1%) |
| $50,000 to $74,999 | 2,545 (16.8%) | 939 (6.5%) |
| $75,000 to $99,999 | 2,068 (13.7%) | 2,525 (17.5%) |
| $100,000 to $149,999 | 2,264 (15.0%) | 1,933 (13.4%) |
| $150,000 or more | 1,234 (8.2%) | 4,045 (28.1%) |
| Total | 15,115 (100.0%) | 14,406 (100.0%) |
Property Value to Household Income Ratio in St. Lawrence County
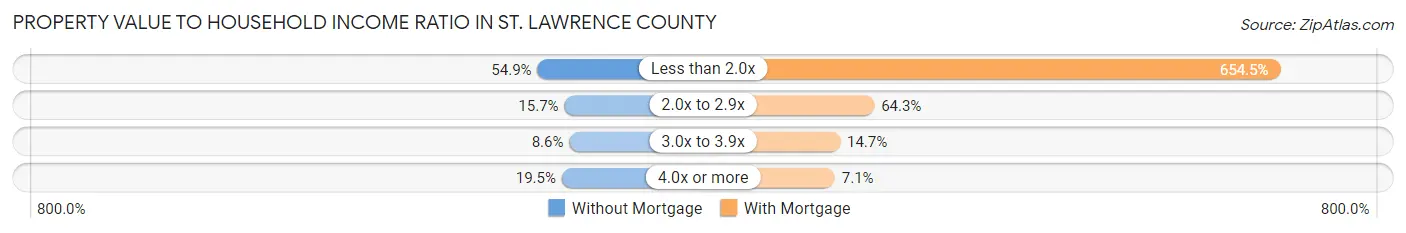
| Value-to-Income Ratio | Without Mortgage | With Mortgage |
| Less than 2.0x | 8,302 (54.9%) | 94,292 (654.5%) |
| 2.0x to 2.9x | 2,373 (15.7%) | 9,264 (64.3%) |
| 3.0x to 3.9x | 1,296 (8.6%) | 2,112 (14.7%) |
| 4.0x or more | 2,950 (19.5%) | 1,023 (7.1%) |
| Total | 15,115 (100.0%) | 14,406 (100.0%) |
Real Estate Taxes by Mortgage Status in St. Lawrence County
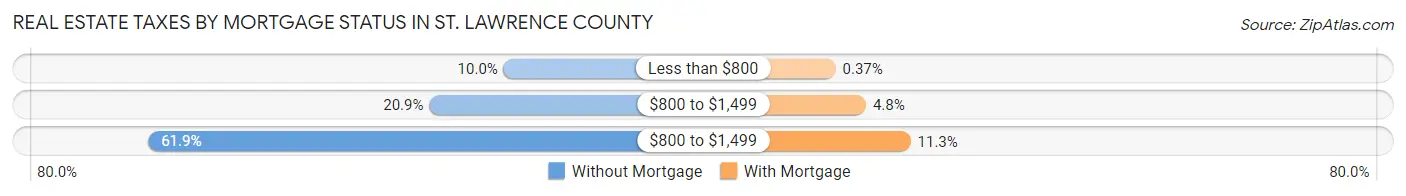
| Property Taxes | Without Mortgage | With Mortgage |
| Less than $800 | 1,511 (10.0%) | 54 (0.4%) |
| $800 to $1,499 | 3,155 (20.9%) | 693 (4.8%) |
| $800 to $1,499 | 9,361 (61.9%) | 1,632 (11.3%) |
| Total | 15,115 (100.0%) | 14,406 (100.0%) |
Health & Disability in St. Lawrence County
Health Insurance Coverage by Age in St. Lawrence County
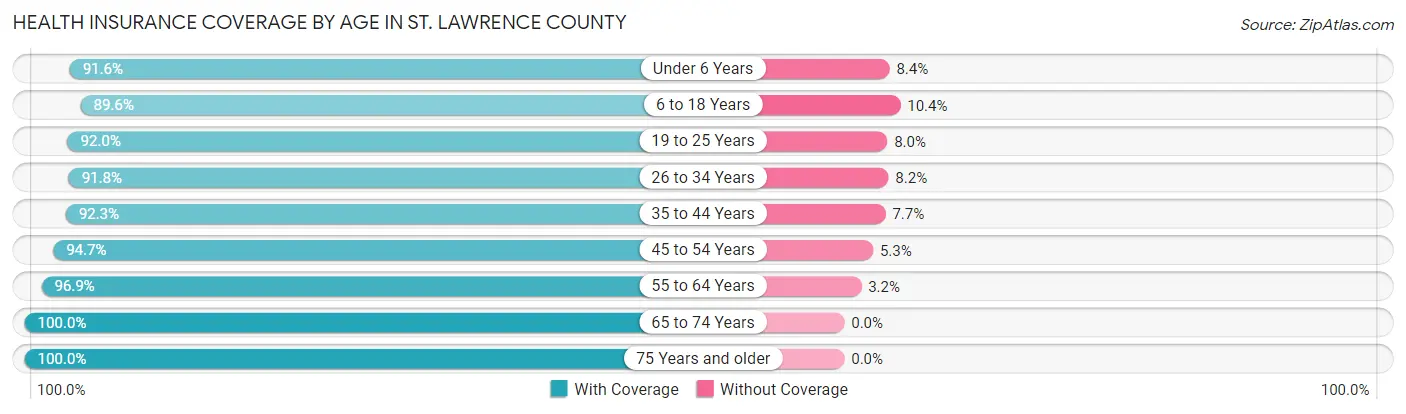
| Age Bracket | With Coverage | Without Coverage |
| Under 6 Years | 5,907 (91.6%) | 543 (8.4%) |
| 6 to 18 Years | 16,025 (89.6%) | 1,868 (10.4%) |
| 19 to 25 Years | 12,633 (92.0%) | 1,098 (8.0%) |
| 26 to 34 Years | 9,439 (91.8%) | 847 (8.2%) |
| 35 to 44 Years | 10,379 (92.3%) | 863 (7.7%) |
| 45 to 54 Years | 11,742 (94.7%) | 662 (5.3%) |
| 55 to 64 Years | 14,490 (96.9%) | 472 (3.2%) |
| 65 to 74 Years | 11,467 (100.0%) | 0 (0.0%) |
| 75 Years and older | 7,460 (100.0%) | 0 (0.0%) |
| Total | 99,542 (94.0%) | 6,353 (6.0%) |
Health Insurance Coverage by Citizenship Status in St. Lawrence County
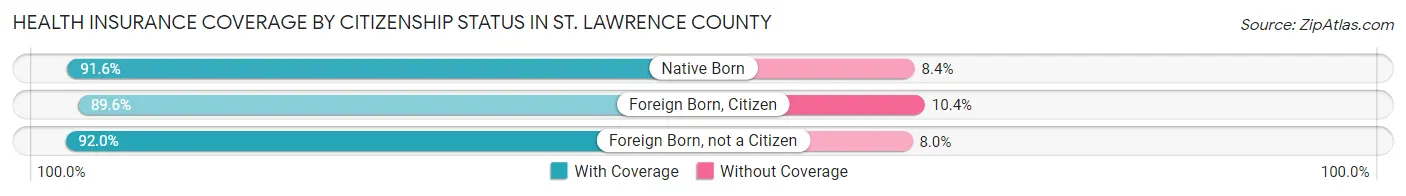
| Citizenship Status | With Coverage | Without Coverage |
| Native Born | 5,907 (91.6%) | 543 (8.4%) |
| Foreign Born, Citizen | 16,025 (89.6%) | 1,868 (10.4%) |
| Foreign Born, not a Citizen | 12,633 (92.0%) | 1,098 (8.0%) |
Health Insurance Coverage by Household Income in St. Lawrence County
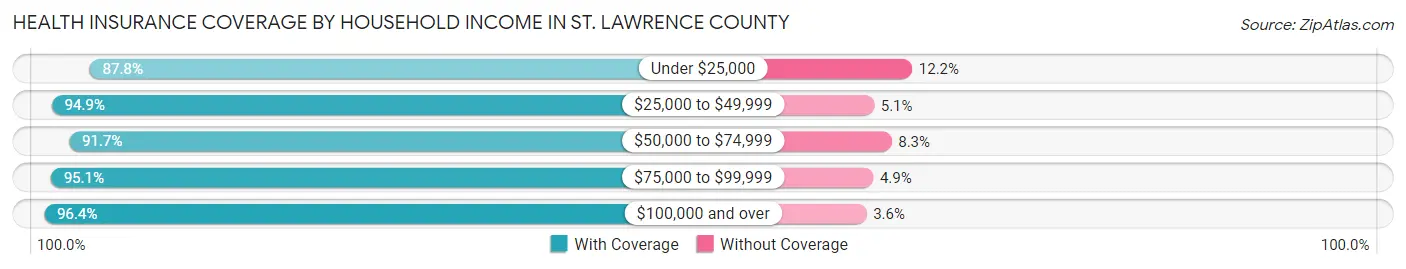
| Household Income | With Coverage | Without Coverage |
| Under $25,000 | 13,567 (87.8%) | 1,883 (12.2%) |
| $25,000 to $49,999 | 16,758 (94.9%) | 894 (5.1%) |
| $50,000 to $74,999 | 16,035 (91.7%) | 1,458 (8.3%) |
| $75,000 to $99,999 | 11,754 (95.1%) | 606 (4.9%) |
| $100,000 and over | 33,854 (96.4%) | 1,279 (3.6%) |
Public vs Private Health Insurance Coverage by Age in St. Lawrence County
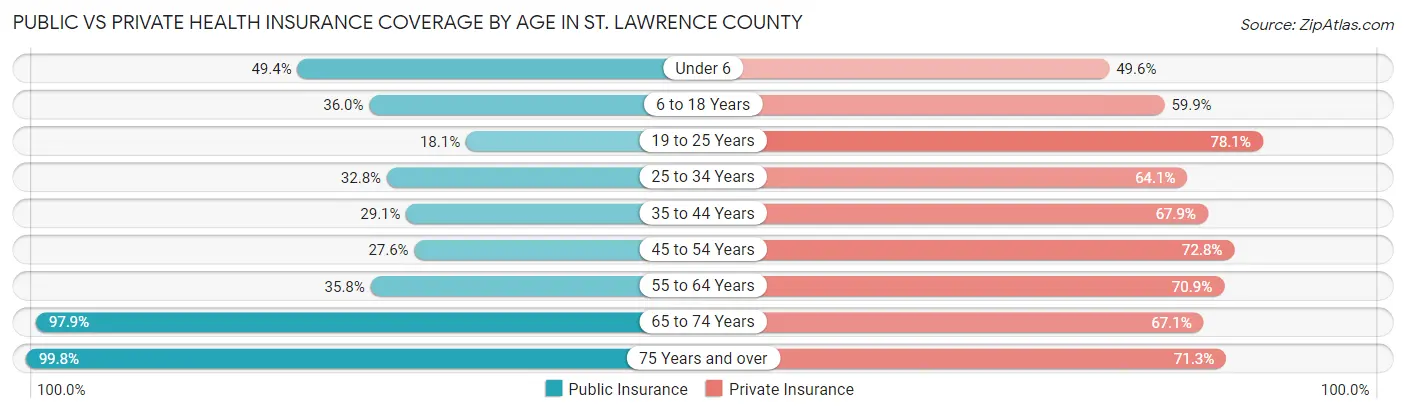
| Age Bracket | Public Insurance | Private Insurance |
| Under 6 | 3,183 (49.3%) | 3,202 (49.6%) |
| 6 to 18 Years | 6,445 (36.0%) | 10,716 (59.9%) |
| 19 to 25 Years | 2,481 (18.1%) | 10,724 (78.1%) |
| 25 to 34 Years | 3,369 (32.8%) | 6,594 (64.1%) |
| 35 to 44 Years | 3,276 (29.1%) | 7,635 (67.9%) |
| 45 to 54 Years | 3,428 (27.6%) | 9,033 (72.8%) |
| 55 to 64 Years | 5,354 (35.8%) | 10,613 (70.9%) |
| 65 to 74 Years | 11,226 (97.9%) | 7,698 (67.1%) |
| 75 Years and over | 7,444 (99.8%) | 5,321 (71.3%) |
| Total | 46,206 (43.6%) | 71,536 (67.5%) |
Disability Status by Sex by Age in St. Lawrence County
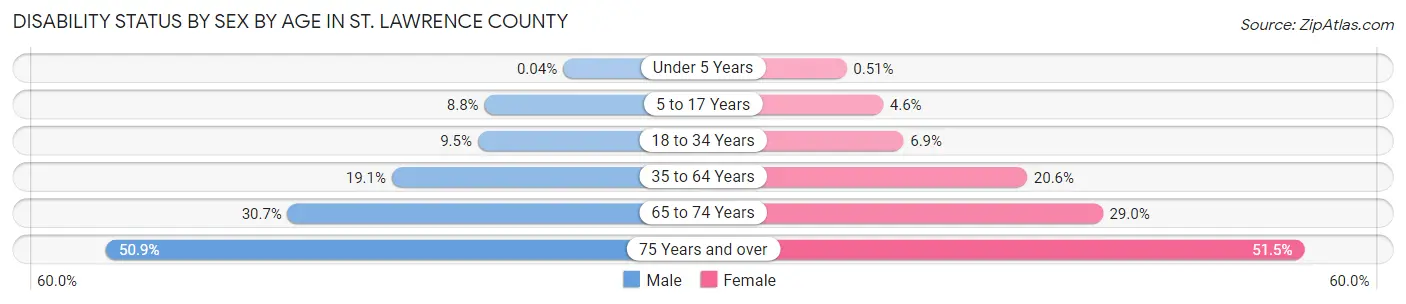
| Age Bracket | Male | Female |
| Under 5 Years | 1 (0.0%) | 13 (0.5%) |
| 5 to 17 Years | 745 (8.8%) | 360 (4.6%) |
| 18 to 34 Years | 1,333 (9.5%) | 870 (6.9%) |
| 35 to 64 Years | 3,689 (19.1%) | 3,979 (20.6%) |
| 65 to 74 Years | 1,744 (30.7%) | 1,680 (29.0%) |
| 75 Years and over | 1,654 (50.9%) | 2,169 (51.5%) |
Disability Class by Sex by Age in St. Lawrence County
Disability Class: Hearing Difficulty
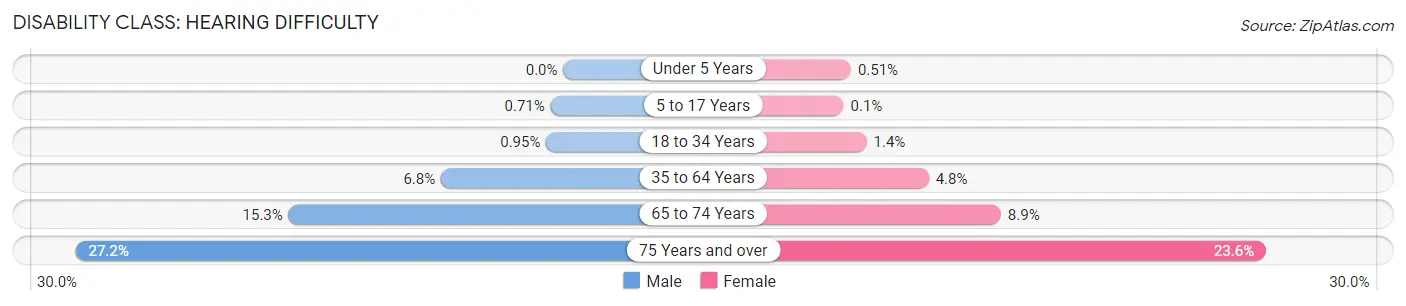
| Age Bracket | Male | Female |
| Under 5 Years | 0 (0.0%) | 13 (0.5%) |
| 5 to 17 Years | 60 (0.7%) | 8 (0.1%) |
| 18 to 34 Years | 133 (0.9%) | 175 (1.4%) |
| 35 to 64 Years | 1,315 (6.8%) | 934 (4.8%) |
| 65 to 74 Years | 869 (15.3%) | 513 (8.9%) |
| 75 Years and over | 882 (27.2%) | 995 (23.6%) |
Disability Class: Vision Difficulty
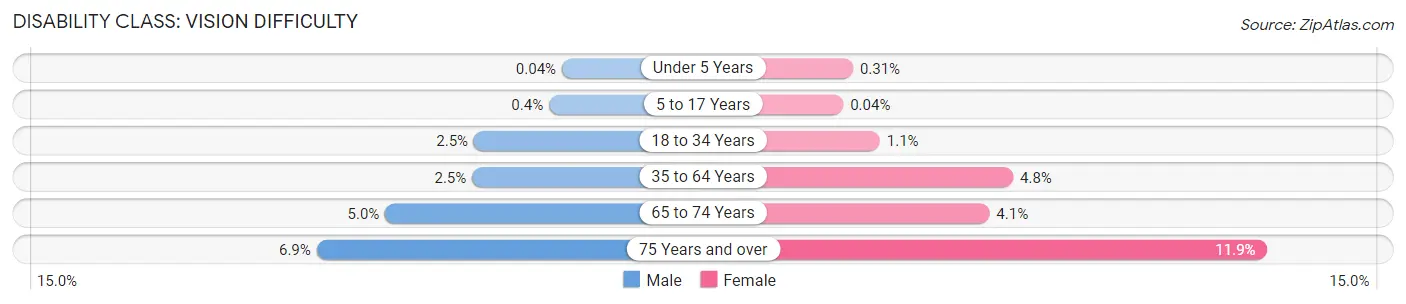
| Age Bracket | Male | Female |
| Under 5 Years | 1 (0.0%) | 8 (0.3%) |
| 5 to 17 Years | 34 (0.4%) | 3 (0.0%) |
| 18 to 34 Years | 349 (2.5%) | 135 (1.1%) |
| 35 to 64 Years | 490 (2.5%) | 921 (4.8%) |
| 65 to 74 Years | 282 (5.0%) | 238 (4.1%) |
| 75 Years and over | 223 (6.9%) | 499 (11.8%) |
Disability Class: Cognitive Difficulty
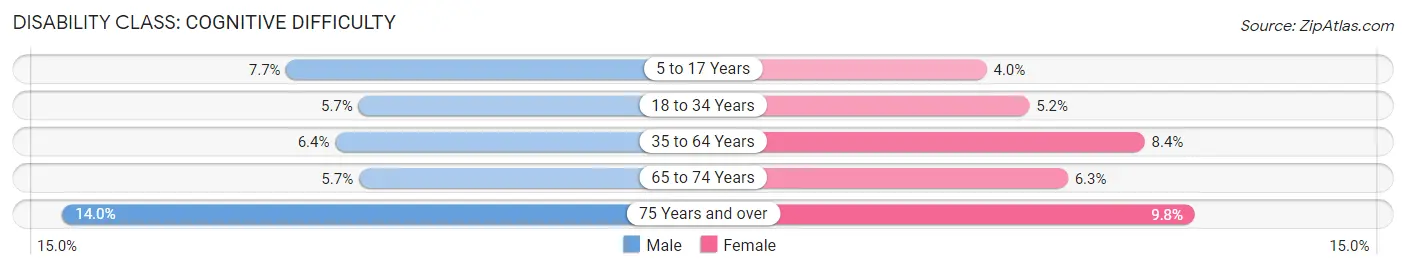
| Age Bracket | Male | Female |
| 5 to 17 Years | 654 (7.7%) | 317 (4.0%) |
| 18 to 34 Years | 798 (5.7%) | 664 (5.2%) |
| 35 to 64 Years | 1,225 (6.4%) | 1,627 (8.4%) |
| 65 to 74 Years | 323 (5.7%) | 364 (6.3%) |
| 75 Years and over | 453 (14.0%) | 414 (9.8%) |
Disability Class: Ambulatory Difficulty
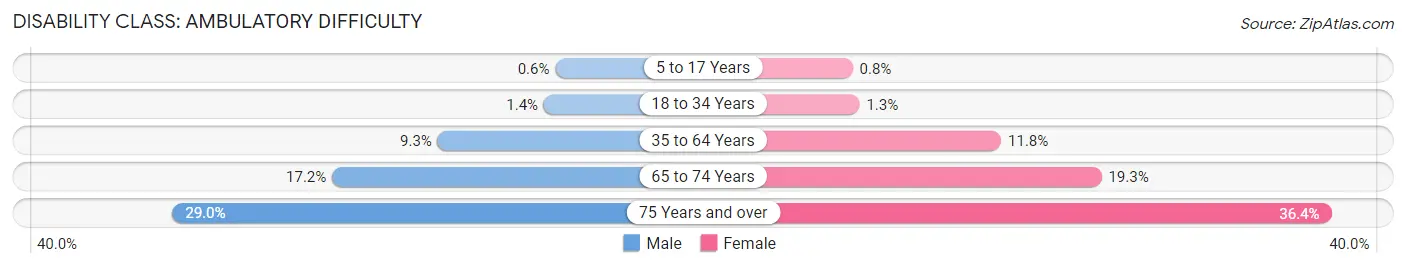
| Age Bracket | Male | Female |
| 5 to 17 Years | 51 (0.6%) | 63 (0.8%) |
| 18 to 34 Years | 201 (1.4%) | 167 (1.3%) |
| 35 to 64 Years | 1,801 (9.3%) | 2,283 (11.8%) |
| 65 to 74 Years | 975 (17.2%) | 1,116 (19.3%) |
| 75 Years and over | 943 (29.0%) | 1,531 (36.3%) |
Disability Class: Self-Care Difficulty
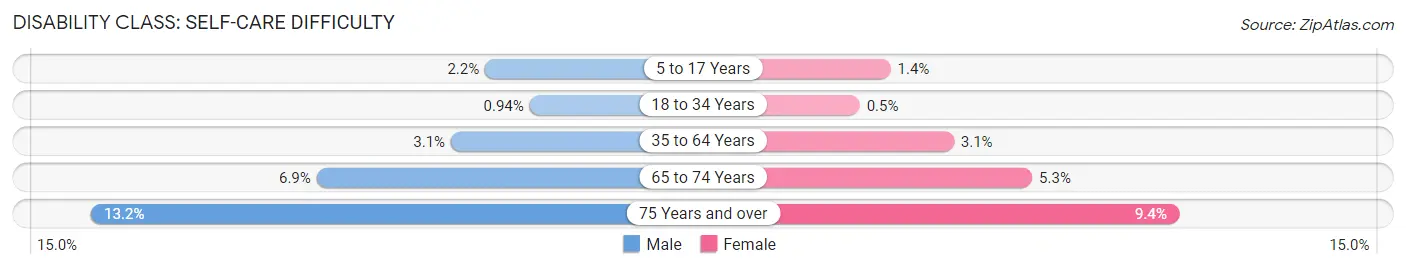
| Age Bracket | Male | Female |
| 5 to 17 Years | 185 (2.2%) | 107 (1.4%) |
| 18 to 34 Years | 131 (0.9%) | 64 (0.5%) |
| 35 to 64 Years | 604 (3.1%) | 603 (3.1%) |
| 65 to 74 Years | 390 (6.9%) | 307 (5.3%) |
| 75 Years and over | 427 (13.2%) | 395 (9.4%) |
Technology Access in St. Lawrence County
Computing Device Access in St. Lawrence County
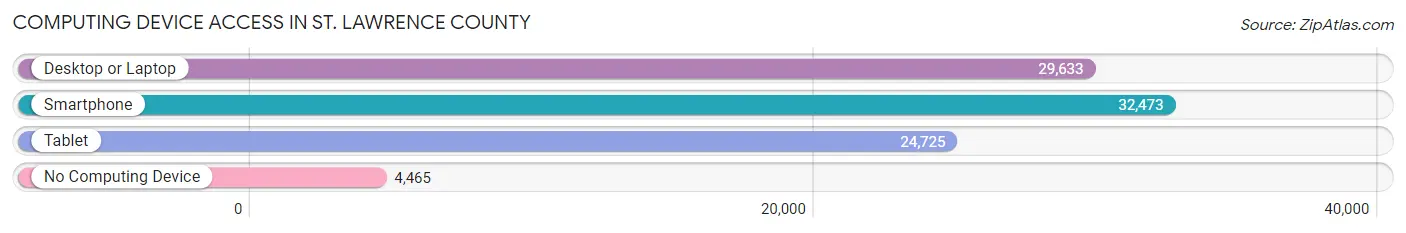
| Device Type | # Households | % Households |
| Desktop or Laptop | 29,633 | 71.6% |
| Smartphone | 32,473 | 78.4% |
| Tablet | 24,725 | 59.7% |
| No Computing Device | 4,465 | 10.8% |
| Total | 41,399 | 100.0% |
Internet Access in St. Lawrence County
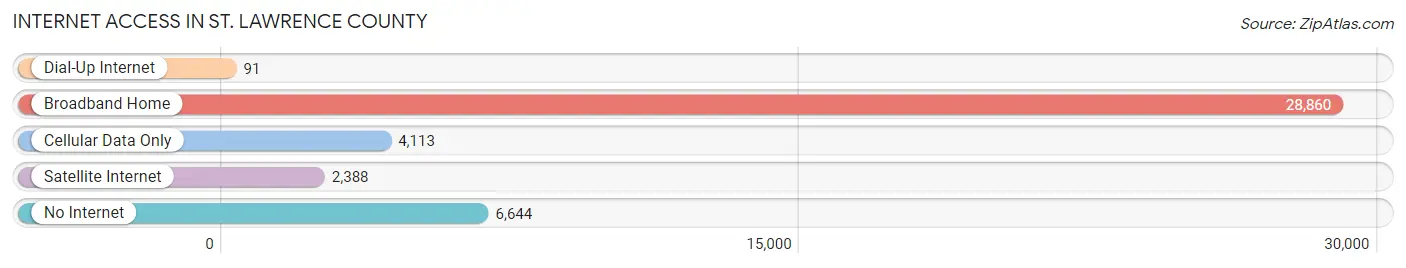
| Internet Type | # Households | % Households |
| Dial-Up Internet | 91 | 0.2% |
| Broadband Home | 28,860 | 69.7% |
| Cellular Data Only | 4,113 | 9.9% |
| Satellite Internet | 2,388 | 5.8% |
| No Internet | 6,644 | 16.1% |
| Total | 41,399 | 100.0% |
St. Lawrence County Summary
St. Lawrence County is a county located in the U.S. state of New York. As of the 2010 census, the population was 111,944. The county seat is Canton. The county is named for the Saint Lawrence River, which in turn was named for the Christian saint Lawrence of Rome, on whose Feast day the river was discovered by French explorer Jacques Cartier.
History
St. Lawrence County was formed in 1802 from parts of Clinton and Franklin counties. It was named after the Saint Lawrence River, which was named for the Christian saint Lawrence of Rome. The first European settlers in the area were French-speaking Canadians who arrived in the late 17th century. The area was part of the British Province of Quebec until 1783, when it became part of the United States after the American Revolution.
The county was part of the Military Tract of 1789, which was set aside to compensate soldiers of the American Revolution. The first county seat was Ogdensburg, which was established in 1802. The county was divided into towns in 1802, and the first town was formed in 1805.
Geography
St. Lawrence County is located in the northeastern part of New York State, in the St. Lawrence River Valley. It is bordered by Canada to the north, Franklin County to the west, Jefferson County to the south, and Lewis County to the east. The county has a total area of 2,821 square miles, of which 2,717 square miles is land and 104 square miles is water.
The county is located in the Adirondack Mountains region of New York State. The highest point in the county is Mount Arab, which has an elevation of 3,890 feet. The county also contains several rivers, including the Oswegatchie, Raquette, and St. Regis.
Economy
St. Lawrence County has a diverse economy, with a mix of manufacturing, agriculture, and tourism. The county is home to several large employers, including St. Lawrence University, Clarkson University, and the New York Air National Guard.
Agriculture is an important part of the county's economy, with dairy farming being the most common type of farming. The county is also home to several wineries and breweries, as well as several apple orchards.
Tourism is also an important part of the county's economy, with visitors coming to the area to enjoy the Adirondack Mountains, the St. Lawrence River, and the many outdoor activities available in the area.
Demographics
As of the 2010 census, there were 111,944 people, 43,902 households, and 28,845 families living in the county. The population density was 41.3 people per square mile. The racial makeup of the county was 94.2% White, 2.2% Black or African American, 0.7% Native American, 0.7% Asian, 0.1% Pacific Islander, 0.7% from other races, and 1.5% from two or more races. Hispanic or Latino of any race were 2.3% of the population.
The median income for a household in the county was $41,945, and the median income for a family was $51,919. The per capita income for the county was $20,945. About 11.2% of families and 15.7% of the population were below the poverty line, including 22.2% of those under age 18 and 8.2% of those age 65 or over.
St. Lawrence County is a rural county with a population that is largely white and of European descent. The county is home to several colleges and universities, as well as a number of tourist attractions, making it a popular destination for visitors. The county has a diverse economy, with a mix of manufacturing, agriculture, and tourism.
Common Questions
What is Per Capita Income in St. Lawrence County?
Per Capita income in St. Lawrence County is $29,827.
What is the Median Family Income in St. Lawrence County?
Median Family Income in St. Lawrence County is $75,033.
What is the Median Household income in St. Lawrence County?
Median Household Income in St. Lawrence County is $58,339.
What is Income or Wage Gap in St. Lawrence County?
Income or Wage Gap in St. Lawrence County is 24.9%.
Women in St. Lawrence County earn 75.1 cents for every dollar earned by a man.
What is Family Income Deficit in St. Lawrence County?
Family Income Deficit in St. Lawrence County is $11,457.
Families that are below poverty line in St. Lawrence County earn $11,457 less on average than the poverty threshold level.
What is Inequality or Gini Index in St. Lawrence County?
Inequality or Gini Index in St. Lawrence County is 0.45.
What is the Total Population of St. Lawrence County?
Total Population of St. Lawrence County is 108,670.
What is the Total Male Population of St. Lawrence County?
Total Male Population of St. Lawrence County is 55,702.
What is the Total Female Population of St. Lawrence County?
Total Female Population of St. Lawrence County is 52,968.
What is the Ratio of Males per 100 Females in St. Lawrence County?
There are 105.16 Males per 100 Females in St. Lawrence County.
What is the Ratio of Females per 100 Males in St. Lawrence County?
There are 95.09 Females per 100 Males in St. Lawrence County.
What is the Median Population Age in St. Lawrence County?
Median Population Age in St. Lawrence County is 38.8 Years.
What is the Average Family Size in St. Lawrence County
Average Family Size in St. Lawrence County is 3.0 People.
What is the Average Household Size in St. Lawrence County
Average Household Size in St. Lawrence County is 2.4 People.
How Large is the Labor Force in St. Lawrence County?
There are 47,751 People in the Labor Forcein in St. Lawrence County.
What is the Percentage of People in the Labor Force in St. Lawrence County?
53.2% of People are in the Labor Force in St. Lawrence County.
What is the Unemployment Rate in St. Lawrence County?
Unemployment Rate in St. Lawrence County is 6.3%.